kotak mf booklet
TRANSCRIPT
FUNDS IN FOCUS
MARCH 2018

TH
EPAG
EH
AS
BEEN
LEFT
INTEN
TIO
NALLY
BLAN
K

EQUITY FUNDS: 1
HYBRID FUNDS: 12
THEMATIC FUNDS 17
DEBT FUNDS 20
. . . . . . . . . . . . . . . . . . . . . . . . . . . . . . . . . . . . . . . . . . . . . . . . . . . . . . . . . . . . . . . . . . . . .
. . . . . . . . . . . . . . . . . . . . . . . . . . . . . . . . . . . . . . . . . . . . . . . . . . . . . . . . . . . . . . . . . . .
. . . . . . . . . . . . . . . . . . . . . . . . . . . . . . . . . . . . . . . . . . . . . . . . . . . . . . . . . . . . . . . . . .
. . . . . . . . . . . . . . . . . . . . . . . . . . . . . . . . . . . . . . . . . . . . . . . . . . . . . . . . . . . . . . . . . . . . . .
Kotak Classic Equity Fund 2
Kotak Tax Saver Fund 4
. . . . . . . . . . . . . . . . . . . . . . . . . . . . . . . . . . . . . . . . . . . . . . . . . . . . . . . . . . . .
. . . . . . . . . . . . . . . . . . . . . . . . . . . . . . . . . . . . . . . . . . . . . . . . . . . . . . . . . . . . . . .
Kotak Select Focus Fund 6
Kotak Opportunities Fund 8
Kotak Emerging Equity Fund 10
Kotak Balance Fund 13
Kotak Equity Savings Fund 15
Kotak Infrastructure & Economic Reform Fund 18
Kotak Low Duration Fund 21
Kotak Income Opportunities Fund 23
Kotak Medium Term Fund 25
Kotak Bond Short Term Fund 27
. . . . . . . . . . . . . . . . . . . . . . . . . . . . . . . . . . . . . . . . . . . . . . . . . . . . . . . . . . . . .
. . . . . . . . . . . . . . . . . . . . . . . . . . . . . . . . . . . . . . . . . . . . . . . . . . . . . . . . . . . .
. . . . . . . . . . . . . . . . . . . . . . . . . . . . . . . . . . . . . . . . . . . . . . . . . . . . . . . . .
. . . . . . . . . . . . . . . . . . . . . . . . . . . . . . . . . . . . . . . . . . . . . . . . . . . . . . . . . . . . . . . .
. . . . . . . . . . . . . . . . . . . . . . . . . . . . . . . . . . . . . . . . . . . . . . . . . . . . . . . . . .
. . . . . . . . . . . . . . . . . . . . . . . . . . . . . . . . . . . . . . . . . .
. . . . . . . . . . . . . . . . . . . . . . . . . . . . . . . . . . . . . . . . . . . . . . . . . . . . . . . . . . .
. . . . . . . . . . . . . . . . . . . . . . . . . . . . . . . . . . . . . . . . . . . . . . . . . . . .
. . . . . . . . . . . . . . . . . . . . . . . . . . . . . . . . . . . . . . . . . . . . . . . . . . . . . . . . . . .
. . . . . . . . . . . . . . . . . . . . . . . . . . . . . . . . . . . . . . . . . . . . . . . . . . . . . . . .
MARCH
2018

EQUITY FUNDS
About Kotak Classic Equity
�
�
�
Kotak Classic Equity is an open - ended equity growth scheme. The investment objective of the scheme is to
generate capital appreciation from a diversified portfolio of equity and equity related securities.
An open-ended diversified equity scheme with a focus on large caps.
Market capitalization bias:(a) Largecap focused with normal allocation between 70%-90% and (b) Midcap
allocation between 10%-30%.
Portfolio Action
• The fund has an overweight position in Media, Metals, Infrastructure and Consumers while it is underweight inPharma, BFSI and Auto.
• The conservative stance of the portfolio had benefitted the fund in the early part of FY17 as markets punished valuestocks more than the quality stocks. The tilt from then has slowly changed as metal stocks, which represent the valueset, found their way into the portfolio. We continue to believe that metals offer the maximum potential for positiveearnings surprise in addition to the deleveraging story going ahead. The fund also had sizeable position in IT whichwas slightly increased during the month.
• The lack of exposure to corporate lenders and PSU banks hurt the fund in the month of November as the governmentwent for recapitalisation of PSU Banks but has over the longer period benefitted the fund.
Kotak Classic Equity
Scheme Facts
Structure
Launch Date
Benchmark
Min. Initial Inv.
Additional Inv.
Standard Deviation^
Beta^
Sharpe^
Month end AUM* (as on 31st Mar )
Monthly Average AUM*
NAV (as on 28th Mar 2018)
2018
An Open Ended Equity Growth Scheme
296.75 crs
213.25 crs
Dividend 19.2430
Direct Dividend 21.1920
Growth 47.2070
Direct Growth 50.4600
27th July 2005
Nifty 100 TRI
5000
1000 & in multiples of 1
12.88%
0.93
0.28
*Source: MFI Explorer.
^ as on 28th Mar, 2018. Source: ValueResearch.
`
`
`
`
`
`
`
`
`
Portfolio Turnover
62.21%
Market Cap %$
Load Structure
Large cap 76.60
Midcap 12.87
Small cap 1.47
Cash 9.06
$The given market cap data is on the basis of newSEBI circular on scheme rationalisation whereinStocks are categorised as per given AMFI list.
Source: MFI Explorer. Market definition used ismarket capitalisation of the 100th largest scrip (onthe bases of market capitalisation) is the cutoff todetermine the large cap and midcap segment.
NilEntry Load:
Exit Load:
I) For redemptions / switch outs (including SIP/STP)within 1 year from the date of allotment of units,irrespective of the amount of investment:1%
ii) For redemptions / switch outs (including SIP/STP)after 1 year from the date of allotment of units,irrespective of the amount of investment: NIL
Any exit load charged (net off Service Tax, if any) shallbe credited back to the respective Scheme. Unitsissued on reinvestment of dividends shall not besubject to entry and exit load.
2
31 March, 2018st
Top 10 Sectors as on 31st Mar, 2018
Sector % Weight Underweight / Previous Changeoverweight
against (Portfolio % from previousbenchmark Weight) month
Month in portfolioPortfolio Benchmark
(Nifty 100)
Financial Services
Consumer Goods
Information Technology
Energy
Cash & Cash Equivalent
Automobile
Others
Construction
Metals
Pharma
20.32 32.96 -12.64 21.55 -1.23
14.00 12.68 1.31 12.94 1.05
12.88 10.89 1.99 10.19 2.69
9.36 13.36 -3.99 14.50 -5.14
9.12 0.00 9.12 6.76 2.36
8.07 9.92 -1.84 8.29 -0.21
7.59 0.00 7.59 3.61 3.97
5.15 3.70 1.45 2.61 2.54
4.53 4.76 -0.23 6.73 -2.20
3.09 4.12 -1.03 3.33 -0.24
Equity Market Brief
• GST – landmark reform is now implemented, and over the last few months, the government has introduced further
changes to help the smaller firms navigate GST better. While there might be some near-term issues in implementing,
the longer term benefits are transformative. Most listed players will benefit, as they form the organised part of the
economy, especially once the e-way bill is introduced in totality.
• After a prolonged period of under-delivery of Corporate Earnings, earnings are starting to improve across a broad
spectrum of sectors.
• India to benefit from such reforms which encourages formalisation of the economy in the medium-to-long-term,
significant flow from physical to financial savings to further provide stability to markets.
• Volatility across global equities is on lower side. Global events – Fed hiking, trade wars, geopolitical events like the
flare-up between US and North Korea to add to near-term volatility. In India as well, as we approach general elections,
markets are likely to turn more volatile.
• Time in the market more important than timing the market – after a long period of lower volatility, markets volatility
may move up.

Kotak Classic Equity31 March, 2018st
About Kotak Mutual Fund
Kotak Mahindra Asset Management
Company Limited (KMAMC) is a wholly
owned subsidiary of Kotak Mahindra Bank
Limited (KMBL). KMBL has over two decades
of experience in financial services. KMBL has a
market capitalization of 1995.45 bn (as on
31st March, 2018). KMAMC is the Asset
Manager for Kotak Mahindra Mutual Fund
(KMMF). It started operations in December
1998. KMMF offers schemes catering to
investors with varying risk - return profiles and
was the first fund house in the country to
launch a dedicated gilt scheme. KMAMC
manages assets worth 1,16,175.581cr as on
31st March, 2018.
`
`
* The numbers are converted using the Rupee-
USD reference rate published by the Reserve
Bank of India as on the respective dates.
To know more
Call : 1800-222-626 (Toll Free), Mumbai61152100, Delhi 66306900 / 02, Chennai28221333 / 45038171, Kolkata 64509802 /03, Pune 64013395 / 96, Ahmedabad26779888, Bangalore 66128050 / 51,Hyderabad 66178140 / 41.
Visit - assetmanagement.kotak.com
Email - [email protected]
Disclaimer
Kotak Classic EquityInvestment Objective:
Mutual Fund investments are subject to marketrisks, read all scheme related documentscarefully. Scheme Information Document (SID)and Statement of Additional Information (SAI)available on mutualfund.kotak.com
is an open - ended equitygrowth scheme. Togenerate capital appreciation from a diversifiedportfolio of equity and equity related securities.
Kotak Classic Equity* Performance (%) as on 28th March, 2018
Different plans have different expense structure. The performance details provided herein are of regular plan.
^Past performance may or may not be sustained in future.*All payouts during the period have been reinvested in the units of thescheme at the then prevailing NAV. Returns > = 1 year: CAGR (Compounded Annualised Growth Rate). N.A stands for data notavailable. Note: Point to Point (PTP) Returns in INR shows the value of 10,000/- investment made at inception. Source: ICRA MFIExplorer. # Name of Scheme Benchmark. ## Name of Additional Benchmark. Please refer page no. 29 for top 3 and bottom 3schemes managed by Mr.
`
Deepak Gupta.
*TRI – Total Return Index
With effect from 1st February 2018, we are comparing the performances of the funds with the total return variant of the benchmarkinstead of the price return variant.
Date SchemeReturns of 10000 in the
Scheme ( ) Benchmark# ( ) Benchmark ## ( )
Nifty 100 Nifty 50 Current Value of Standard Investment
(%) ^ # (%)* ## (%)* Additional
`
` `
Kotak Classic Equity Fund
Since Inception 13.02 14.20 13.71 47,207 53,836 50,992
Last 1 Year 16.42 12.22 11.76 11,642 11,222 11,176
Last 3 Years 9.39 8.62 7.38 13,083 12,810 12,378
Last 5 Years 15.54 14.97 13.63 20,598 20,091 18,954
Scheme Inception date is 27/07/2005. Mr. Deepak Gupta has been managing the fund since 01/01/2017.
TRI TRI
`
3
This product is suitable for investors who are seeking*:
• Long term capital growth
• Investment in portfolio of predominantly equity &equity related securities
* Investors should consult their financial advisors if in doubtabout whether the product is suitable for them.
Investors understand that their principal willbe at moderately high risk
Riskometer
M
oderately Moderate
Low
Hig
h
Low
High
LOW HIGH
Moderately
Mar-23-18 23.714 4.78
Jul-28-17 23.433 0.70
Jul-15-16 19.692 0.50
Jul-25-14 18.227 1.00
Jan-23-14 19.202 4.30
Jul-31-12 15.413 1.00
Nov-20-15 18.540 0.50
Dividend History
Date CUM DividendNAV
Dividend( per unit)`
Top 10 Companies as on 31st Mar, 2018
Maruti Suzuki India Limited Auto 5.44%
Larsen And Toubro Ltd. Construction Project 5.12%
Hindustan Unilever Ltd. Consumer Non Durables 4.97%
HDFC Bank Ltd. Banks 4.94%
Reliance Industries Ltd. Petroleum Products 4.84%
Tata Consultancy Services Ltd. Software 4.33%
Tech Mahindra Ltd. Software 3.31%
Bajaj Finance Limited Finance 3.00%
Titan Company Ltd. Consumer Durables 2.47%
Infosys Ltd. Software 2.35%

About Kotak Tax Saver
�
�
�
�
The investment objective of Kotak Tax Saver is to generate long term capital appreciation from a diversified
portfolio of equity and equity related securities and enable investors to avail the income tax rebate, as
permitted from time to time.
The scheme thus offers a dual benefit of growth and tax savings.
The scheme although open ended, has a three year lock-in.
The portfolio is generally diversified across sectors and market capitalization segments.
Portfolio Action
• The key overweight sectors in the portfolio are – Cement, Oil&Gas and Capital Goods.
• The underweight sectors are – IT and Auto. We are following stock specific approach in these sectors.
• Telecom sector continues to see headwinds, wherein the portfolio has no exposure.
• Large cap allocation in the portfolio is about 54%.
Kotak Tax Saver31 March, 2018st
Scheme Facts
Structure
Launch Date
Benchmark
Min. Initial Inv.
Additional Inv.
Standard Deviation^
Beta^
Sharpe^
Month end AUM* (as on 31st Mar )
NAV (as on 28th Mar 2018)
2018
An Open -Ended Equity Linked SavingScheme
Dividend 18.4820
Dividend Direct 21.5850
Growth 39.8260
Growth Direct 42.6150
23 November 2005
Nifty 500 TRI
500
500 & in multiples of 500
14.48%
1.01
0.19
31.25%
*Source: MFI Explorer.
^ as on 28th Mar, 2018. Source: ValueResearch.
`
` `
717.91 crs
`
`
708.33 crs
rd
Monthly Average AUM*
Portfolio Turnover
`
`
`
`
Market Cap %$
Load Structure
Large cap 54.22
Midcap 26.57
Small cap 16.63
Cash 2.57$The given market cap data is on the basis of newSEBI circular on scheme rationalisation whereinStocks are categorised as per given AMFI list.
Source: KPAX (internal system). Market definitionused is market capitalisation of the 100th largestscrip (on the bases of market capitalisation) is thecutoff to determine the large cap and midcapsegment.
NilEntry Load:
Exit Load: Exit Load is not applicable for Kotak TaxSaver Scheme. (applicable for all plans)
Units issued on reinvestment of dividends shall notbe subject to exit load (applicable for all plans)
4
Top 10 Sectors as on 31st Mar, 2018
Sector % Weight Underweight / Previous Changeoverweight
against (Portfolio % from previousbenchmark Weight) month
Month in portfolioPortfolio Benchmark
(Nifty 500)
Financial Services
Energy
Consumer Goods
Construction
Cement & Cement Products
Industrial Manufacturing
Information Technology
Metals
Pharma
Services
27.33 30.74 -3.41 28.42 -1.10
15.59 11.69 3.90 16.36 -0.78
10.82 12.82 -2.00 10.59 0.23
6.99 4.51 2.48 7.01 -0.02
6.45 2.26 4.20 6.65 -0.20
5.81 2.79 3.02 5.95 -0.14
3.57 9.65 -6.08 3.24 0.32
3.34 4.13 -0.79 3.50 -0.16
2.87 4.62 -1.75 3.04 -0.17
2.87 2.61 0.26 3.08 -0.21
Equity Market Brief
• GST – landmark reform is now implemented, and over the last few months, the government has introduced further
changes to help the smaller firms navigate GST better. While there might be some near-term issues in implementing,
the longer term benefits are transformative. Most listed players will benefit, as they form the organised part of the
economy, especially once the e-way bill is introduced in totality.
• After a prolonged period of under-delivery of Corporate Earnings, earnings are starting to improve across a broad
spectrum of sectors.
• India to benefit from such reforms which encourages formalisation of the economy in the medium-to-long-term,
significant flow from physical to financial savings to further provide stability to markets.
• Volatility across global equities is on lower side. Global events – Fed hiking, trade wars, geopolitical events like the
flare-up between US and North Korea to add to near-term volatility. In India as well, as we approach general elections,
markets are likely to turn more volatile.
• Time in the market more important than timing the market – after a long period of lower volatility, markets volatility
may move up.

Kotak Tax Saver
About Kotak Mutual Fund
Kotak Mahindra Asset Management
Company Limited (KMAMC) is a wholly
owned subsidiary of Kotak Mahindra Bank
Limited (KMBL). KMBL has over two decades
of experience in financial services. KMBL has a
market capitalization of 1995.45 bn (as on
31st March, 2018). KMAMC is the Asset
Manager for Kotak Mahindra Mutual Fund
(KMMF). It started operations in December
1998. KMMF offers schemes catering to
investors with varying risk - return profiles and
was the first fund house in the country to
launch a dedicated gilt scheme. KMAMC
manages assets worth 1,16,175.581cr as on
31st March, 2018.
`
`
* The numbers are converted using the Rupee-
USD reference rate published by the Reserve
Bank of India as on the respective dates.
To know more
Call : 1800-222-626 (Toll Free), Mumbai61152100, Delhi 66306900 / 02, Chennai28221333 / 45038171, Kolkata 64509802 /03, Pune 64013395 / 96, Ahmedabad26779888, Bangalore 66128050 / 51,Hyderabad 66178140 / 41.
Visit - assetmanagement.kotak.com
Email - [email protected]
Disclaimer
Kotak Tax SaverInvestment
Objective:
is an open-ended equityl inked savings scheme.
To generate long-term capitalappreciation from a diversified portfolio ofequity and equity related securities and enableinvestors to avail the income tax rebate, aspermitted from time to time. The amountinvested in the scheme shall be subject to alock-in of 3 years irrespective of whether theinvestments would be eligible for tax benefitor not. The above does not constitute andadvice or a representation. Investors arerequested to seek professional advice in thisregard. Kotak Mahindra Bank Limited is notliable or responsible for any loss or short fallresulting from the operations of the scheme.
Mutual Fund investments are subject tomarket risks, read all scheme relateddocuments carefully. Scheme InformationDocument (SID) and Statement ofAdditional Information (SAI) available onmutualfund.kotak.com
5
Kotak Tax Saver* Performance (%) as on , 201828th March
Different plans have different expense structure. The performance details provided herein are of regular plan.
^Past performance may or may not be sustained in future.*All payouts during the period have been reinvested in the units of thescheme at the then prevailing NAV. Returns > = 1 year: CAGR (Compounded Annualised Growth Rate). N.A stands for data notavailable. Note: Point to Point (PTP) Returns in INR shows the value of 10,000/- investment made at inception. Source: ICRA MFIExplorer. # Name of Scheme Benchmark. ## Name of Additional Benchmark. Please refer page no. 29 for other schemes managed byMr.
`
Harsha Upadhyay.
*TRI – Total Return Index
With effect from 1st February 2018, we are comparing the performances of the funds with the total return variant of the benchmarkinstead of the price return variant.
Date SchemeReturns TRI of 10000 in the
Scheme ( ) Benchmark# ( ) Benchmark ## ( )
Nifty 500 Nifty 50 Current Value of Standard InvestmentTRI
(%) ^ # (%)* ## (%)* Additional
`
` `
Since Inception 11.84 13.13 12.97 39,826 45,900 45,075
Last 1 Year 6.25 12.87 11.76 10,625 11,287 11,176
Last 3 Years 8.26 9.83 7.38 12,684 13,240 12,378
Last 5 Years 16.89 16.31 13.63 21,831 21,292 18,954
Scheme Inception date is 23/11/2005. Mr. Harsha Upadhyaya has been managing the fund since 25/08/2015.
Kotak Tax Saver
`
This product is suitable for investors who are seeking*:
• long term capital growth with a 3 year lock in
• Investment in portfolio of predominantly equity &equity related securities.
* Investors should consult their financial advisors if in doubtabout whether the product is suitable for them.
Investors understand that their principal willbe at moderately high risk
Riskometer
M
oderately Moderate
Low
Hig
h
Low
High
LOW HIGH
Moderately
Mar-23-18 18.583 0.38Dec-29-17 20.848 0.40Jun-29-17 22.144 0.40Mar-29-17 19.432 0.75Jan-27-17 18.889 0.72
Jan-21-16 16.113 0.70Dec-30-14 17.542 0.10Nov-28-14 18.180 0.50
Mar-22-16 16.266 0.65
Dividend History
Date CUM DividendNAV
Dividend( per unit)`
31 March, 2018st
Top 10 Companies as on 31st Mar, 2018
HDFC Bank Ltd. Banks 6.31%
Reliance Industries Ltd. Petroleum Products 5.09%
Larsen And Toubro Ltd. Construction Project 4.47%
HDFC Ltd. Finance 3.81%
Infosys Ltd. Software 3.55%
IndusInd Bank Ltd. Banks 3.50%
GlaxoSmithkline Consumer Healthcare Ltd Consumer Non Durables 3.40%
ICICI Bank Ltd. Banks 3.23%
Shree Cement Ltd. Cement 2.71%
SKF India Ltd Industrial Products 2.45%
About Kotak Select Focus
�
�
�
�
The investment objective of Kotak Select Focus scheme is to generate long term capital appreciation from a
portfolio of equity and equity related securities, generally focused on select few sectors.
The scheme endeavors to identify sectors that are likely to do well over the medium term and takes focus
exposures to the same.
There is no restriction on which type of sectors the scheme can take exposure to and the portfolio will be
generally diversified at the stock level across market capitalization.
The scheme is well positioned to capture various themes that are in flavour in a focused manner.
Portfolio Action
• The portfolio continues to have a pro-cyclical tilt.
• Domestic businesses with operating leverage continue dominate the portfolio as compared to export/ globalbusinesses due to better earnings trajectory.
• The top overweight sectors in the fund are Cement, Financials and Capital Goods.
• We believe that Government’s focus on reviving consumption and spending on infrastructure will create positivedemand scenario for our portfolio companies in medium term.
• Recent budget proposals are positive for Insurance companies that are significant part of the portfolio.
• The key underweight sectors are IT and FMCG.
• Utilities and Telecom sectors are the major exclusions from the fund.
• Allocation to large cap segment accounts for about 3/4th of the total corpus.
Kotak Select Focus
Scheme Facts
Structure
Month end AUM* (as on 31st Mar )
NAV (as on 28th Mar 2018)
Launch Date
Benchmark
Min. Initial Inv.
Additional Inv.
Standard Deviation^
Beta^
Sharpe^
2018
An Open Ended Equity Scheme
crs
17,652.73 crs
Dividend 22.6910
Direct Dividend 24.0460
Growth 31.8170
Direct Growth 33.4770
11 September 2009
Nifty 200 TRI
5000 & in multiple of 1 for purchase andfor 0.01 for switches
1000 & in multiples of 1
13.63%
0.97
0.43
14.81%
*Source: MFI Explorer.
^ as on 28th Mar, 2018. Source: ValueResearch.
`
`
`
` `
`
th
`
17,853.35
`
`
`
`
Monthly Average AUM*
Portfolio Turn over
Market Cap %
Load Structure
$
Large cap 76.51
Midcap 14.51
Small cap 3.08
Cash 5.91$The given market cap data is on the basis of newSEBI circular on scheme rationalisation whereinStocks are categorised as per given AMFI list.
Source: KPAX (internal system). Market definitionused is market capitalisation of the 100th largestscrip (on the bases of market capitalisation) is thecutoff to determine the large cap and midcapsegment.
NilEntry Load:
Exit Load:
I) For redemptions / switch outs (including SIP/STP)within 1 year from the date of allotment of units,irrespective of the amount of investment:1%
ii) For redemptions / switch outs (including SIP/STP)after 1 year from the date of allotment of units,irrespective of the amount of investment: NIL
iii) Any exit load charged (net off Service Tax, if any)shall be credited back to the respective Scheme.(applicable for all plans)
iv) Units issued on reinvestment of dividends shall notbe subject to exit load (applicable for all plans)
6
Top Sectors as on 31st Mar, 2018
Sector % Weight Underweight / Previous Changeoverweight
against (Portfolio % from previousbenchmark Weight) month
Month in portfolioPortfolio Benchmark
(Nifty 200)
Financial Services
Energy
Automobile
Consumer Goods
Cement & Cement Products
Cash & Cash Equivalent
Construction
Information Technology
35.19 32.45 2.74 34.93 0.26
13.58 12.57 1.01 14.49 -0.90
9.92 9.41 0.51 10.02 -0.10
7.22 12.43 -5.21 7.20 0.02
6.96 2.21 4.75 7.27 -0.30
5.91 0.00 5.91 6.64 -0.74
5.89 3.99 1.90 5.88 0.01
3.31 10.12 -6.82 2.62 0.69
31 March, 2018st
• GST – landmark reform is now implemented, and over the last few months, the government has introduced further
changes to help the smaller firms navigate GST better. While there might be some near-term issues in implementing,
the longer term benefits are transformative. Most listed players will benefit, as they form the organised part of the
economy, especially once the e-way bill is introduced in totality.
• After a prolonged period of under-delivery of Corporate Earnings, earnings are starting to improve across a broad
spectrum of sectors.
• India to benefit from such reforms which encourages formalisation of the economy in the medium-to-long-term,
significant flow from physical to financial savings to further provide stability to markets.
• Volatility across global equities is on lower side. Global events – Fed hiking, trade wars, geopolitical events like the
flare-up between US and North Korea to add to near-term volatility. In India as well, as we approach general elections,
markets are likely to turn more volatile.
• Time in the market more important than timing the market – after a long period of lower volatility, markets volatility
may move up.
Equity Market Brief

Kotak Select Focus31 March, 2018st
About Kotak Mutual Fund
Kotak Mahindra Asset Management
Company Limited (KMAMC) is a wholly
owned subsidiary of Kotak Mahindra Bank
Limited (KMBL). KMBL has over two decades
of experience in financial services. KMBL has a
market capitalization of 1995.45 bn (as on
31st March, 2018). KMAMC is the Asset
Manager for Kotak Mahindra Mutual Fund
(KMMF). It started operations in December
1998. KMMF offers schemes catering to
investors with varying risk - return profiles and
was the first fund house in the country to
launch a dedicated gilt scheme. KMAMC
manages assets worth 1,16,175.581cr as on
31st March, 2018.
`
`
* The numbers are converted using the Rupee-
USD reference rate published by the Reserve
Bank of India as on the respective dates.
To know more
Ccall : 1800-222-626 (Toll Free), Mumbai61152100, Delhi 66306900 / 02, Chennai28221333 / 45038171, Kolkata 64509802 /03, Pune 64013395 / 96, Ahmedabad26779888, Bangalore 66128050 / 51,Hyderabad 66178140 / 41.
Visit - assetmanagement.kotak.com
Email - [email protected]
Disclaimer
Kotak Select Focus FundInvestment Objective:
is an open-endedequity scheme. Theinvestment objective of the scheme is togenerate long-term capital appreciation froma portfolio of equity and equity relatedsecurities, generally focused on a few selectedsectors.
Mutual Fund investments are subject tomarket risks, read all scheme relateddocuments carefully. Scheme InformationDocument (SID) and Statement ofAdditional Information (SAI) available onmutualfund.kotak.com
7
Kotak Select Focus* Performance (%) as on 28th March, 2018
Different plans have different expense structure. The performance details provided herein are of regular plan.
^Past performance may or may not be sustained in future.*All payouts during the period have been reinvested in the units of thescheme at the then prevailing NAV. Returns > = 1 year: CAGR (Compounded Annualised Growth Rate). N.A stands for data notavailable. Note: Point to Point (PTP) Returns in INR shows the value of 10,000/- investment made at inception. Source: ICRA MFIExplorer. # Name of Scheme Benchmark. ## Name of Additional Benchmark. Please refer page no. 29 for schemes managed by Mr.Harsha Upadhyaya.
`
*TRI – Total Return Index
With effect from 1st February 2018, we are comparing the performances of the funds with the total return variant of the benchmarkinstead of the price return variant.
Date SchemeReturns TRI of 10000 in the
Scheme ( ) Benchmark#( ) Benchmark ## ( )
Nifty 200 Nifty 50 Current Value of Standard Investment
(%) ^ #(%)* ## (%)* Additional
`
` `
Since Inception 14.50 11.08 10.33 31,817 24,547 23,166
Last 1 Year 10.70 12.42 11.76 11,070 11,242 11,176
Last 3 Years 11.76 9.09 7.38 13,949 12,974 12,378
Last 5 Years 21.16 15.56 13.63 26,118 20,613 18,954
Scheme Inception date is 11/09/2009. Mr. Harsha Upadhyaya has been managing the fund since 04/08/2012.
Kotak Select Focus Fund
TRI
`
This product is suitable for investors who are seeking*:
• Long term capital growth
• Investment in portfolio of predominantly equity &equity related securities generally focussed on a fewselected sectors.
* Investors should consult their financial advisors if in doubtabout whether the product is suitable for them.
Investors understand that their principal willbe at moderately high risk
Riskometer
M
oderately Moderate
Low
Hig
h
Low
High
LOW HIGH
Moderately
Sep-27-17 23.592 1.50
Sep-30-16 21.349 1.25
Sep-26-14 17.791 1.00
Oct-15-10 12.850 1.25
Oct-12-15 19.739 1.00
Dividend History
Date CUM DividendNAV
Dividend( per unit)`
Top 10 Companies as on 31st Mar, 2018
HDFC Bank Ltd. Banks 7.40%
Larsen And Toubro Ltd. Construction Project 5.51%
Reliance Industries Ltd. Petroleum Products 4.94%
HDFC Ltd. Finance 4.81%
ICICI Bank Ltd. Banks 3.90%
IndusInd Bank Ltd. Banks 3.30%
Infosys Ltd. Software 3.30%
Hero MotoCorp Ltd. Auto 3.27%
Maruti Suzuki India Limited Auto 2.98%
State Bank Of India Banks 2.87%

About Kotak Opportunities
�
�
�
Kotak Opportunities looks for opportunities across sectors based on performance and potential of companies
within the sectors.
The fund manager has the flexibility to invest in a mix of large and mid cap stocks from various sectors.
The allocation between large caps & midcaps would broadly depend on the choice of sectors, business
environment & valuations.
Portfolio Action
• The portfolio continues to have a tilt towards pro-cyclicals that have operating leverage.
• The top overweight sectors are – Cement, Oil&Gas and Industrials.
• Partial profit booking was carried out in Oil&Gas sector during the month. However, the sector continues to have an
overweight exposure.
• Telecom sector continues to see headwinds, wherein the portfolio has no exposure.
• Key underweight sectors are IT, Auto and Pharma.
• Large, mid and small cap exposures are 53%, 33% and 11% respectively.
Kotak Opportunities31 March, 2018st
Scheme Facts
Structure
Launch Date
Benchmark
Min. Initial Inv.
Additional Inv.
Standard Deviation^
Beta^
Sharpe^
Month end AUM* (as on 31st Mar )
NAV (as on 28th Mar 2018)
2018
An Open Ended Equity Growth Scheme
2,356.05 crs
2,352.87 crs
Dividend 25.6530
Dividend Direct 27.3940
Growth 111.3650
Growth Direct 117.6140
9 September 2004
Nifty 500 TRI
5000
1000 & in multiples of 1
13.98%
0.98
0.34
32.07%
*Source: MFI Explorer.
^ as on 28th Mar, 2018. Source: ValueResearch.
`
`
`
`
`
`
`
th
`
`
Monthly Average AUM*
Portfolio Turn over
Market Cap %$
Load Structure
Large cap 53.11
Midcap 33.28
Small cap 11.51
Cash 2.10
$The given market cap data is on the basis of newSEBI circular on scheme rationalisation whereinStocks are categorised as per given AMFI list.
Source: KPAX (internal system). Market definitionused is market capitalisation of the 100th largestscrip (on the bases of market capitalisation) is thecutoff to determine the large cap and midcapsegment.
NilEntry Load:Exit Load:
I) For redemptions / switch outs (including SIP/STP) within1 year from the date of allotment of units, irrespective ofthe amount of investment:1%
ii) For redemptions / switch outs (including SIP/STP) after1 year from the date of allotment of units, irrespective ofthe amount of investment: NIL
iii) Any exit load charged (net off Service Tax, if any) shallbe credited back to the respective Scheme. (applicablefor all plans)
iv) Units issued on reinvestment of dividends shall not besubject to exit load (applicable for all plans)
8
Top 10 Sectors as on 31st Mar, 2018
Sector % Weight Underweight / Previous Changeoverweight
against (Portfolio % from previousbenchmark Weight) month
Month in portfolioPortfolio Benchmark
(Nifty 500)
Financial Services
Energy
Consumer Goods
Cement & Cement Products
Industrial Manufacturing
Construction
Fertilisers & Pesticides
Automobile
Information Technology
Services
28.96 30.74 -1.78 29.01 -0.05
14.67 11.69 2.98 15.27 -0.60
13.15 12.82 0.33 12.87 0.28
6.69 2.26 4.43 6.83 -0.14
6.19 2.79 3.40 5.74 0.45
5.15 4.51 0.65 5.10 0.05
4.01 0.96 3.05 4.01 0.00
3.95 8.87 -4.92 3.93 0.03
2.65 9.65 -7.00 2.68 -0.03
2.58 2.61 -0.03 2.64 -0.06
Equity Market Brief
• GST – landmark reform is now implemented, and over the last few months, the government has introduced further
changes to help the smaller firms navigate GST better. While there might be some near-term issues in implementing,
the longer term benefits are transformative. Most listed players will benefit, as they form the organised part of the
economy, especially once the e-way bill is introduced in totality.
• After a prolonged period of under-delivery of Corporate Earnings, earnings are starting to improve across a broad
spectrum of sectors.
• India to benefit from such reforms which encourages formalisation of the economy in the medium-to-long-term,
significant flow from physical to financial savings to further provide stability to markets.
• Volatility across global equities is on lower side. Global events – Fed hiking, trade wars, geopolitical events like the
flare-up between US and North Korea to add to near-term volatility. In India as well, as we approach general elections,
markets are likely to turn more volatile.
• Time in the market more important than timing the market – after a long period of lower volatility, markets volatility
may move up.
Kotak Opportunities
About Kotak Mutual Fund
Kotak Mahindra Asset Management
Company Limited (KMAMC) is a wholly
owned subsidiary of Kotak Mahindra Bank
Limited (KMBL). KMBL has over two decades
of experience in financial services. KMBL has a
market capitalization of 1995.45 bn (as on
31st March, 2018). KMAMC is the Asset
Manager for Kotak Mahindra Mutual Fund
(KMMF). It started operations in December
1998. KMMF offers schemes catering to
investors with varying risk - return profiles and
was the first fund house in the country to
launch a dedicated gilt scheme. KMAMC
manages assets worth 1,16,175.581cr as on
31st March, 2018.
* The numbers are converted using the Rupee-
USD reference rate published by the Reserve
Bank of India as on the respective dates.
`
`
To know more
Call : 1800-222-626 (Toll Free), Mumbai61152100, Delhi 66306900 / 02, Chennai28221333 / 45038171, Kolkata 64509802 /03, Pune 64013395 / 96, Ahmedabad26779888, Bangalore 66128050 / 51,Hyderabad 66178140 / 41.
Visit - assetmanagement.kotak.com
Email - [email protected]
Disclaimer
Kotak OpportunitiesInvestment
Objective:
is an open-endedequity growth scheme.
To generate capital appreciationfrom a diversified portfolio of equity & equityrelated instruments
Mutual Fund investments are subject tomarket risks, read all scheme relateddocuments carefully. Scheme InformationDocument (SID) and Statement ofAdditional Information (SAI) available onmutualfund.kotak.com
9
Feb-27-18 27.3670 0.83
Nov-28-17 28.7004 0.85
Aug-29-17 27.9190 0.85
May-29-17 27.748 0.85
Feb-28-17 26.279 0.50
Nov-22-16 24.246 0.80
Aug-25-14 21.411 1.00
Nov-11-11 13.682 0.50
May-28-10 14.625 1.00
Sept-8-09 14.733 1.50
Mar-14-08 16.975 2.00
Jan-25-08 27.090 6.00
Sept-28-07 24.293 3.00
Sept-27-06 17.745 1.50
Mar-21-06 21.783 4.50
Aug-28-15 24.388 1.60
Dividend History
Date CUM DividendNAV
Dividend( per unit)`
Kotak Opportunities* Performance (%) as on 28th March, 2018
Different plans have different expense structure. The performance details provided herein are of regular plan.
^Past performance may or may not be sustained in future.*All payouts during the period have been reinvested in the units of thescheme at the then prevailing NAV. Returns > = 1 year: CAGR (Compounded Annualised Growth Rate). N.A stands for data notavailable. Note: Point to Point (PTP) Returns in INR shows the value of 10,000/- investment made at inception. Source: ICRA MFIExplorer. # Name of Scheme Benchmark. ## Name of Additional Benchmark. Please refer page no. 29 for other schemes managed byMr. Harsha Upadhyaya.
`
*TRI – Total Return Index
With effect from 1st February 2018, we are comparing the performances of the funds with the total return variant of the benchmarkinstead of the price return variant.
Date SchemeReturns TRI of 10000 in the
Scheme ( ) Benchmark# ( ) Benchmark ## ( )
Nifty 500 Nifty 50 Current Value of Standard Investment
(%) ^ # (%)* ## (%)* Additional
`
` `
Since Inception 19.46 16.10 15.76 111,365 75,659 72,691
Last 1 Year 9.25 12.87 11.76 10,925 11,287 11,176
Last 3 Years 10.46 9.83 7.38 13,470 13,240 12,378
Last 5 Years 19.26 16.31 13.63 24,141 21,292 18,954
Scheme Inception date is 09/09/2004. Mr. Harsha Upadhyaya has been managing the fund since 04/08/2012.
Kotak Opportunities
TRI
`
This product is suitable for investors who are seeking*:
• Long term capital growth
• Investment in portfolio of predominantly equity &equity related securities
* Investors should consult their financial advisors if in doubtabout whether the product is suitable for them.
Investors understand that their principal willbe at moderately high risk
Riskometer
M
oderately Moderate
Low
Hig
h
Low
High
LOW HIGH
Moderately
31 March, 2018st
Top 10 Companies as on 31st Mar, 2018
HDFC Bank Ltd. Banks 6.00%
Reliance Industries Ltd. Petroleum Products 4.31%
Larsen And Toubro Ltd. Construction Project 3.89%
HDFC Ltd. Finance 3.87%
Gujarat State Petronet Ltd. Gas 3.06%
ICICI Bank Ltd. Banks 2.95%
Coromandel International Ltd. Fertilisers 2.84%
Bharat Financial Inclusion Limited Finance 2.79%
Infosys Ltd. Software 2.64%
ITC Ltd. Consumer Non Durables 2.28%
About Kotak Emerging Equity
�
�
�
The investment objective of Kotak Emerging Equity is to generate long-term capital appreciation from a
portfolio of equity and equity related securities, by investing predominantly in mid and small cap companies.
These companies are either at their nascent or developing stage and are under researched.
Although relatively volatile in the short run, small and mid cap companies have the potential to deliver higher
growth in the long term.
Portfolio Action
�
�
�
�
�
�
The portfolio continues to be pro-cyclical and tilted towards economic recovery. As a result we continue to beOverweight on sectors such as Financials, cement, Industrial Manufacturing, speciality chemicals & consumerdiscretionary.
We believe that this year would be a stock picker’s year. Last year 90% of the BSE 500 stocks gave positive return whichis not going to be repeated in our view. Ground indicators are suggesting strong pick as seen from CV sales, dieselconsumption, bank credit growth, airlines passenger growth, order book of infra/capital good companies, strongcement volumes growth, steel prices rising to 9year high and capacity utilisation at 84%. However would strongearnings lead to better market performance?
In the short term we believe the GST implementation could be a disruptor for B2C businesses. However from amedium term perspective post GST implementation, we anticipate that the organized players would becomestronger as unorganized sector would find it tough to do business in the changed environment and cede market shareto more organized players and portfolio is well positioned in those sectors where there is a large portion ofunorganized players. The portfolio is well positioned to ride on this theme from a medium term perspective.
In the IT and pharma sector we continue to have stock specific approach and continue to have UW stance on both thesectors.
During the month the broader allocation remains largely unchanged with marginal reduction in Industrials andmarginal increase in cement and chemicals.
We expect Kotak Emerging Equity as a portfolio should deliver 30% and 22% earnings growth in FY19E & FY20Ebased on current set of stocks and the portfolio is trading at a P/E 20x and 16.5x for FY19E and FY20E.
Kotak Emerging Equity
Scheme Facts
Structure
Month end AUM* (as on 31st Mar 2018)
NAV (as on 2018)28th Mar
Launch Date
Benchmark
Min. Initial Inv.
Additional Inv.
Standard Deviation^
Beta^
Sharpe^
An Open - Ended Equity Growth Scheme
Dividend 23.9260
Direct Dividend 27.5440
Growth 38.9920
Direct Growth 41.3780
30th March 2007
S&P BSE
5000
1000 & in multiples of 1
15.03%
0.86
0.59
32.70%
*Source: MFI Explorer.
^ as on , 2018. Source: ValueResearch.
`
`
` `
3,005.06 crs
`2,997.20 crs
Mid Small Cap TRI
Monthly Average AUM*
Portfolio Turnover
`
`
`
`
28th Mar
Market Cap %
Load Structure
$
Source: Value Research definition.
Large cap 11.94
Midcap 53.82
Small cap 31.83
Cash 2.41
The given market cap data is on the basis ofnew SEBI circular on scheme rationalisationwherein Stocks are categorised as per givenAMFI list.
$
NilEntry Load:
Exit Load:
I) For redemptions / switch outs (including SIP/STP)within 1 year from the date of allotment of units,irrespective of the amount of investment:1%
ii) For redemptions / switch outs (including SIP/STP)after 1 year from the date of allotment of units,irrespective of the amount of investment: NIL
Any exit load charged (net off Service Tax, if any) shallbe credited back to the respective Scheme. Unitsissued on reinvestment of dividends shall not besubject to entry and exit load.
10
31 March, 2018st
Top 10 Sectors as on 31st Mar, 2018
Sector % Weight Underweight / Previous Changeoverweight
against (Portfolio % from previousbenchmark Weight) month
Month in portfolioPortfolio Benchmark
Financial Services
Industrial Manufacturing
Consumer Goods
Pharma
Chemicals
Automobile
Services
Construction
Cement & Cement Products
Textiles
21.11 18.70 2.41 21.11 0.00
19.68 10.38 9.30 20.20 -0.52
15.92 13.82 2.11 15.88 0.05
5.95 7.75 -1.80 5.75 0.19
5.58 3.45 2.12 5.34 0.24
4.57 7.09 -2.53 4.61 -0.05
4.15 7.31 -3.16 4.34 -0.20
4.12 6.31 -2.19 4.06 0.06
2.90 2.74 0.16 2.74 0.16
2.64 2.73 -0.08 2.71 -0.07
S&P BSE MidSmall Cap Index
Equity Market Brief
• GST – landmark reform is now implemented, and over the last few months, the government has introduced further
changes to help the smaller firms navigate GST better. While there might be some near-term issues in implementing,
the longer term benefits are transformative. Most listed players will benefit, as they form the organised part of the
economy, especially once the e-way bill is introduced in totality.
• After a prolonged period of under-delivery of Corporate Earnings, earnings are starting to improve across a broad
spectrum of sectors.
• India to benefit from such reforms which encourages formalisation of the economy in the medium-to-long-term,
significant flow from physical to financial savings to further provide stability to markets.
• Volatility across global equities is on lower side. Global events – Fed hiking, trade wars, geopolitical events like the
flare-up between US and North Korea to add to near-term volatility. In India as well, as we approach general elections,
markets are likely to turn more volatile.
• Time in the market more important than timing the market – after a long period of lower volatility, markets volatility
may move up.
Kotak Emerging Equity
About Kotak Mutual Fund
Kotak Mahindra Asset Management
Company Limited (KMAMC) is a wholly
owned subsidiary of Kotak Mahindra Bank
Limited (KMBL). KMBL has over two decades
of experience in financial services. KMBL has a
market capitalization of 1995.45 bn (as on
31st March, 2018). KMAMC is the Asset
Manager for Kotak Mahindra Mutual Fund
(KMMF). It started operations in December
1998. KMMF offers schemes catering to
investors with varying risk - return profiles and
was the first fund house in the country to
launch a dedicated gilt scheme. KMAMC
manages assets worth 1,16,175.581cr as on
31st March, 2018.
`
`
* The numbers are converted using the Rupee-
USD reference rate published by the Reserve
Bank of India as on the respective dates.
To know more
Call : 1800-222-626 (Toll Free), Mumbai61152100, Delhi 66306900 / 02, Chennai28221333 / 45038171, Kolkata 64509802 /03, Pune 64013395 / 96, Ahmedabad26779888, Bangalore 66128050 / 51,Hyderabad 66178140 / 41.
Visit - assetmanagement.kotak.com
Email - [email protected]
Disclaimer
Kotak Emerging EquityInvestment
Objective:
Scheme is an open-ended equity growth scheme.
The investment objective of thescheme is to generate long-term capitalappreciation from a portfolio of equity andequity related securities, by investingpredominantly in mid and small capcompanies.
Mutual Fund investments are subject tomarket risks, read all scheme relateddocuments carefully. Scheme InformationDocument (SID) and Statement ofAdditional Information (SAI) available onmutualfund.kotak.com
11
Kotak Emerging Equity*Performance (%) as on 28th March 2018,
Different plans have different expense structure. The performance details provided herein are of regular plan.
^Past performance may or may not be sustained in future.*All payouts during the period have been reinvested in the units of thescheme at the then prevailing NAV. Returns > = 1 year: CAGR (Compounded Annualised Growth Rate). N.A stands for data notavailable. Note: Point to Point (PTP) Returns in INR shows the value of 10,000/- investment made at inception. Source: ICRA MFIExplorer. # Name of Scheme Benchmark. ## Name of Additional Benchmark. Please refer page no. 29 for other schemes managed byMr. Pankaj Tibrewal.
`
*TRI – Total Return Index
With effect from 1st February 2018, we are comparing the performances of the funds with the total return variant of the benchmarkinstead of the price return variant.
31 March, 2018st
Since Inception 13.16 13.46 10.54 38,992 40,137 30,104
Last 1 Year 11.01 16.75 11.76 11,101 11,675 11,176
Last 3 Years 14.86 15.99 7.38 15,140 15,592 12,378
Last 5 Years 26.57 22.73 13.63 32,504 27,858 18,954
Date SchemeReturns Mid Small TRI of 10000 in the
Scheme ( ) Benchmark# ( ) Benchmark ## ( )
S&P BSE Nifty 50 Current Value of Standard Investment
(%) ^ ## (%)* Additional
`
`
Index # (%)* ` `
Cap TRI
Scheme Inception date is 30/03/2007. Mr. Pankaj Tibrewal has been managing the fund since 27/05/2010.
Kotak Emerging Equity Fund
This product is suitable for investors who are seeking*:
• Long term capital growth
• Investment in equity & equity related securitiespredominantly in mid & small cap companies
* Investors should consult their financial advisors if in doubtabout whether the product is suitable for them.
Investors understand that their principal willbe at moderately high risk
Riskometer
M
oderately Moderate
Low
Hig
h
Low
High
LOW HIGH
Moderately
Mar-23-18 26.153 2.67
May-26-17 26.010 1.59
Apr-28-15 21.499 2.10
May-02-14 13.073 0.50
May-02-13 11.491 0.50
Apr-29-11 10.573 0.75
May-27-16 21.196 1.30
Dividend History
Date CUM DividendNAV
Dividend( per unit)`
Top 10 Companies as on 31st Mar, 2018
IndusInd Bank Ltd. Banks 3.99%
Schaeffler India Ltd Industrial Products 3.38%
Atul Ltd. Chemicals 3.09%
The Ramco Cements Ltd Cement 2.90%
RBL Bank Ltd Banks 2.81%
Bata India Ltd. Consumer Durables 2.73%
Supreme Industries Limited Industrial Products 2.51%
Solar Industries India Limited Chemicals 2.48%
Finolex Cables Ltd. Industrial Products 2.39%
Shriram City Union Finance Ltd. Finance 2.31%
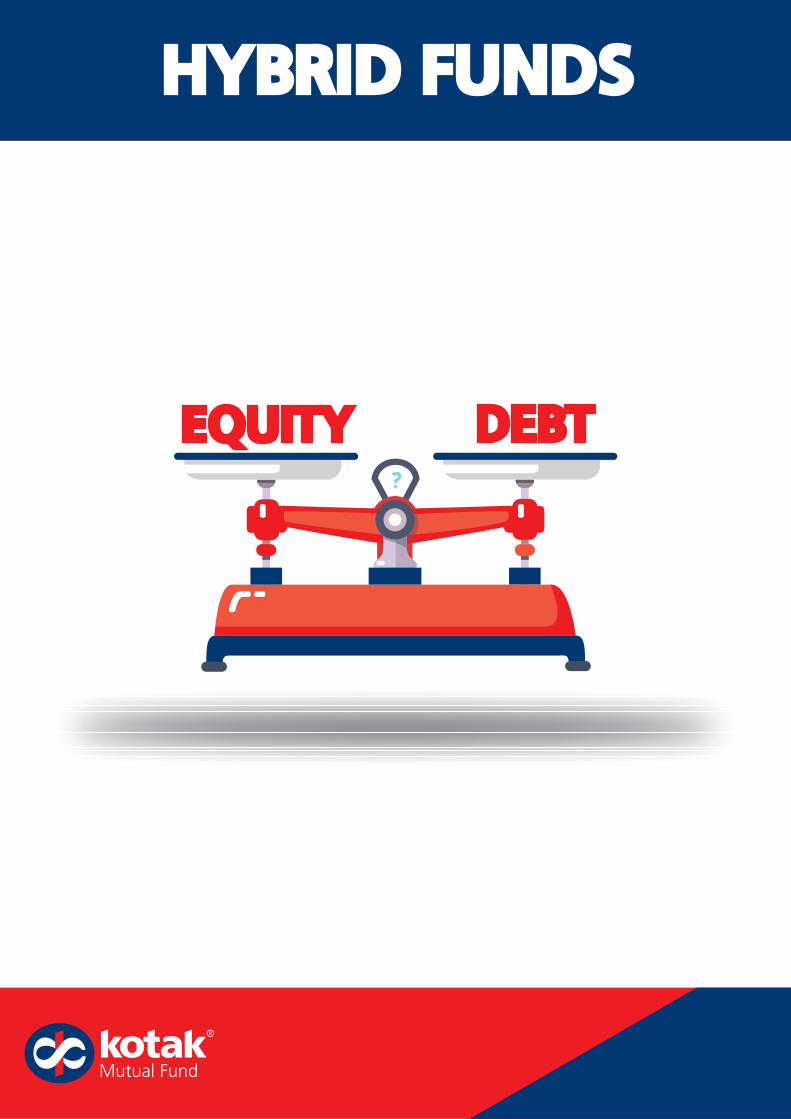
HYBRID FUNDS
EQUITY DEBT
About Kotak Balance
� The investment objective of Kotak Balance is to achieve growth by investing in equity and equity related instruments, balanced
with income generation by investing in debt and money market instruments.
The scheme thus provides capital appreciation potential of equities as well as stable returns of debt.�
Portfolio Action
Equity
Debt:
�
�
�
�
�
�
�
�
�
�
�
�
The portfolio continues to be pro-cyclical and tilted towards economic recovery. As a result we continue to be overweight onsectors such as cement, capital goods & engineering, auto ancillary, media and consumer discretionary.
In the IT and pharma sector we continue to have stock specific approach. The fund continues the underweight stance onconsumer staples, IT and Pharma.
During the months we marginally increased weightage to financials (private sector banks), capital goods, pipe sector,construction and consumer discretionary sector.
In the short term we believe the GST implementation could be a disruptor for B2C businesses. However from a medium termperspective post GST implementation, we anticipate that the organized players would become stronger as unorganized sectorwould find it tough to do business in the changed environment and cede market share to more organized players and portfoliois well positioned in those sectors where there is a large portion of unorganized players.
The current largecap (above 20,000 crs market cap): midcap ratio remains at 65:35 in the fund.
We expect equity portion of Kotak balance fund to deliver 31% and 26% earnings growth in FY19E & FY20E based oncurrent set of stocks and the portfolio is trading at a P/E 20x and 16x for FY19E and FY20E.
As on 31 Mar 2018, ~46% of the debt part of the scheme portfolio comprised of government securities (central as well asstate). The remaining 54% was held in the form of Money market securities, corporate bonds and cash.
In the last week of March 2018, the government announced a reduction in its gross borrowings for FY19 and also slashed itsH1FY19 borrowing to ~47% of the annual target. In addition to this, the RBI at its first bi-monthly policy meeting for FY19, onApril 5th 2018, chose to maintain rates and took a dovish stance. These events combined, caused the sovereign yields to rallyfrom a recent high of 7.80% to as low as 7.10%.
One may presume that reduction of borrowing in an election year may mean that the Government is positive on GSTcollection. Further, the government has changed its pattern of borrowing for FY19. The supply pattern of bonds has shiftedfrom the 10-14 year bucket to the 1-9 year bucket. This is expected to cause some flattening of the sovereign curve in the 3 –12 year bucket.
We expect the headline inflation to peak by June. Monsoons, MSP and crude prices will be the key determinants for H2FY19headline inflation.
Further, ‘Prompt & Corrective Action’ (PCA) category public sector banks recalling their Basel-III compliant Additional Tier Iperpetual bonds, there is going to be a great demand for high yielding assets and especially for the outstanding bankperpetual bonds.
In light of market development, going forward, we will look to run aggressive accrual allocation and would be low on durationas it is causing unwanted volatility in the portfolio. We will look to increase duration as and when there are clear signs ofinflation peaking and a simultaneous peak in yields. We expect this to happen in the next quarter or so. We will be on thelookout for high yielding assets and create an optimal portfolio mix.
Kotak Balance31 March, 2018st
Scheme Facts
Structure
Launch Date
Benchmark
Min. Initial Inv.
Additional Inv.
Standard Deviation^
Beta^
Sharpe^
Month end AUM* (as on 31st Mar )
NAV (as on 28th Mar 2018)
2018
An Open- Ended Balanced Scheme
2,167.03 crs
2,190.37 crs
25 November 1999
Crisil - Aggressive Index
5000
1000 & in multiples of 1
10.69%
1.15
0.23
33.96%
*Source: Value Research.
^ as on 28th Mar, 2018. Source: ValueResearch.
`
`
`
Dividend 16.1500
Direct Dividend 17.5700
Growth 23.8050
Direct Growth 25.3880
th
`
`
Monthly Average AUM*
Portfolio Turn over
`
`
`
`
Hybrid 35+65
Load Structure
Entry Load:
Exit Load:
Nil
I) For redemptions / switch outs (including SIP/STP)within 1 year from the date of allotment of units,irrespective of the amount of investment:1%
ii) For redemptions / switch outs (including SIP/STP)after 1 year from the date of allotment of units,irrespective of the amount of investment: NIL
iii) Any exit load charged (net off Service Tax, if any)shall be credited back to the respective Scheme.(applicable for all plans)
iv) Units issued on reinvestment of dividends shall notbe subject to exit load (applicable for all plans)
13
Top 10 Sectors as on 31st Mar, 2018
Equity Market Brief
• GST – landmark reform is now implemented, and over the last few months, the government has introduced further changes tohelp the smaller firms navigate GST better. While there might be some near-term issues in implementing, the longer termbenefits are transformative. Most listed players will benefit, as they form the organised part of the economy, especially oncethe e-way bill is introduced in totality.
• After a prolonged period of under-delivery of Corporate Earnings, earnings are starting to improve across a broad spectrum ofsectors.
• India to benefit from such reforms which encourages formalisation of the economy in the medium-to-long-term, significantflow from physical to financial savings to further provide stability to markets.
• Volatility across global equities is on lower side. Global events – Fed hiking, trade wars, geopolitical events like the flare-upbetween US and North Korea to add to near-term volatility. In India as well, as we approach general elections, markets arelikely to turn more volatile.
• Time in the market more important than timing the market – after a long period of lower volatility, markets volatility may moveup.
18.1615.18
10.176.94
5.485.35
4.964.16
3.343.13
23.13
Debentures and BondsBanks
Government Dated SecuritiesAuto
Consumer Non DurablesCementFinance
Industrial ProductsChemicalsSoftware
Others

Kotak Balance31 March, 2018st
About Kotak Mutual Fund
* The numbers are converted using the Rupee-
USD reference rate published by the Reserve
Bank of India as on the respective dates.
Kotak Mahindra Asset Management
Company Limited (KMAMC) is a wholly
owned subsidiary of Kotak Mahindra Bank
Limited (KMBL). KMBL has over two decades
of experience in financial services. KMBL has a
market capitalization of 1995.45 bn (as on
31st March, 2018). KMAMC is the Asset
Manager for Kotak Mahindra Mutual Fund
(KMMF). It started operations in December
1998. KMMF offers schemes catering to
investors with varying risk - return profiles and
was the first fund house in the country to
launch a dedicated gilt scheme. KMAMC
manages assets worth 1,16,175.581cr as on
31st March, 2018.
`
`
To know more
Call : 1800-222-626 (Toll Free), Mumbai61152100, Delhi 66306900 / 02, Chennai28221333 / 45038171, Kolkata 64509802 /03, Pune 64013395 / 96, Ahmedabad26779888, Bangalore 66128050 / 51,Hyderabad 66178140 / 41.
Visit - assetmanagement.kotak.com
Email - [email protected]
Disclaimer
Kotak BalanceInvestment Objective:
Mutual Fund investments are subject tomarket risks, read all scheme relateddocuments carefully. Scheme InformationDocument (SID) and Statement ofAdditional Information (SAI) available onmutualfund.kotak.com
is an open-ended balancedscheme. To achievegrowth by investing in equity & equity relatedinstruments, balanced with incomegeneration by investing in debt & moneymarket instruments.
14
Kotak Balance* Performance (%) as on , 201828th March
Different plans have different expense structure. The performance details provided herein are of regular plan.
^Past performance may or may not be sustained in future.*All payouts during the period have been reinvested in the units of thescheme at the then prevailing NAV. Returns > = 1 year: CAGR (Compounded Annualised Growth Rate). N.A stands for data notavailable. Note: Point to Point (PTP) Returns in INR shows the value of 10,000/- investment made at inception. Source: ICRA MFIExplorer. # Name of Scheme Benchmark. ## Name of Additional Benchmark.Please refer page no. 29 for top 3 and bottom 3schemes managed by & Mr. Abhishek Bisen.
*TRI – Total Return Index
With effect from 1st February 2018, we are comparing the performances of the funds with the total return variant of the benchmarkinstead of the price return variant
*The debt component of the index is TRI since inception. For equity component of the index, as TRI data is not available sinceinception of the scheme, benchmark performance is calculated using composite CAGR of S&P BSE 200 PRI values series is used till31st July 2006 and TRI values is used since 1st Aug 2006.
`
Pankaj Tibrewal
^The existing benchmark “CRISIL Balanced Fund” has been renamed as “CRISIL Hybrid 35+65 - Aggressive Index” as percommunication received from CRISIL.
This product is suitable for investors who are seeking*:
• Long term capital growth
• Investment in equity & equity related securitiesbalanced with income generation by investing indebt & money market instruments
* Investors should consult their financial advisors if in doubtabout whether the product is suitable for them.
Investors understand that their principal willbe at moderately high risk
Riskometer
M
oderately Moderate
Low
Hig
h
Low
High
LOW HIGH
Moderately
Mar-26-18 16.2295 0.14Feb-26-18 16.8210 0.14Jan-25-18 17.6320 0.14Dec-26-17 17.4978 0.14Nov-27-17 17.1870 0.14Oct-25-17 16.8647 0.11Sep-25-17 16.4830 0.11Aug-28-17 16.6866 0.11Jul-25-17 17.1274 0.12Jun-27-17 16.7970 0.11May-25-17 16.8061 0.11Apr-25-17 16.9880 0.11Mar-27-17 16.4515 0.11Feb-27-17 16.3220 0.11Jan-25-17 16.0710 0.11Dec-26-16 14.9970 0.10Dec-01-16 15.6912 0.11Oct-25-16 16.4100 0.08Sep-26-16 16.2900 0.08Aug-25-16 16.0150 0.08July-25-16 15.8590 0.08June-27-16 15.0860 0.08May-25-16 14.7180 0.07Apr-25-16 14.7740 0.07Mar-29-16 14.2410 0.07
Dividend History
Date CUM DividendNAV
Dividend( per unit)`
Top 10 Companies as on 31st Mar, 2018
Date SchemeReturns
#( ) Benchmark##( )
CRISIL Nifty50 CurrentValueof Standard Investment
` `
Since Inception 14.67 NA 12.91 123,244 NA 92,837
Last 1 Year 6.27 9.96 11.76 10,627 10,996 11,176
Last 3 Years 8.39 9.12 7.38 12,728 12,987 12,378
Last 5 Years 12.77 13.46 13.63 18,245 18,810 18,954
Scheme Inception date is 25/11/1999. Mr. Abhishek Bisen has been managing the fund since 15/04/2008. Mr. Pankaj Tibrewalhas been managing the fund since 25/08/2015.
Kotak Balance
Hybrid35 +65 TRI of 10000 in the
AggressiveIndex Scheme( ) Benchmark#(%)^
`
(%)^ ##(%)* Additional`
Bank of India CRISIL A+ 5.06%
7.17% Central Government SOV 4.77%
Allahabad Bank BRICKWORK BWR A- 3.53%
United Bank Of India CRISIL AA- 3.43%
6.68% Central Government SOV 3.37%
HDFC Bank Ltd. Banks 3.27%
Shree Cement Ltd. Cement 2.35%
State Bank Of India Banks 2.18%
U P Power Corporation Ltd CRISIL A+(SO) 1.99%
Schaeffler India Ltd Industrial Products 1.95%

About Kotak Equity Savings Fund
�
�
�
�
�
It is an open-ended equity scheme which aims to generate income from cash- futures arbitrage positions and
at the same time allows you to participate in the equity market growth moderately.
-Aims to provide income from arbitrage opportunities in cash & derivatives segment of the equity
market
- Potential for growth in the long term through moderate exposure in directional equity
(15%25% of net assets)
- - The unhedged equity portion has to be maintained in a small range (15%-
25%), hence the fund manager has to sell in a rising equity market and buy more in a falling equity market to
adopt a constant mix approach.
- The Fund is treated similar to equity funds for tax purposes .*
* Please consult your tax adviser with respect to the specific tax implications.
Benefits of Kotak Equity Savings Fund
Income
Growth Potential
Constant Mix Approach
Tax efficiency
:
Portfolio Action
Directional Equity:
Arbitrage:
Debt:
• The directional equity was around 24.85%.
• On the directional equity side, we have been running a conservative portfolio with a max exposure in mid cap stocksbeing 20-25% at any point in time. Remaining 75-80% of the directional equity continues to be in large cap stocks.
• We have been overweight on sectors like metals and consumers. The major underweight sectors are Cap Goodsand Auto.
• The exposure to metals and Technology has been increased gradually whereas the underweight in Pharmacontinues. Amongst the defensives, utilities carries the maximum overweight.
• The arbitrage portion continues to be managed in the same way we manage our arbitrage fund. In months, whenthe arbitrage opportunities provide better returns than the debt papers, we deploy more money into arbitragetrades.
• The benefit is that in months when the arbitrage returns are sub optimal, we can deploy a lower amount in arbitrageand still maintain the 'equity' taxation status. Stocks like HDFC Bank, IDFC, Maruti, Reliance Industries, etc haveyielded returns which are higher than the average of the entire arbitrage universe.
• We have done some merger arbitrage trades viz. CMC-TCS and Shasun-Strides in the past. The blended annualizedreturns were upwards of 14% in these trades. Recently, we have done merger arbitrage trades in Geometric-HCLTech and Cairn-Vedanta which have an expected return potential of more than 16% annualized. During thedivestment issue of CPSE ETF, we subscribed to the ETFs (at 5% discount) and shorted the futures of individualconstituents to bag more than 5% gain within a month. After one month, we exited this trade. So, a riskless profitof absolute 5% was made within a month in this trade.
• We have been managing the debt portion in a very conservative manner till now.
• The term deposits which are to be placed with the exchange for taking exposure in derivatives generally have atenure of 1 year.
• On the debt side, we prefer to play accrual as compared to duration. A bulk of exposure on the debt side is intopapers with a residual maturity (or time to put option) of 2-3 years. A significant portion is also invested into ourown Liquid Fund. The benefit of investing in Liquid is that in case the arbitrage spreads expand, we can easily movethe money from liquid into arbitrage trades without worrying about the levels where the debt yields are quoting atthat point in time.
Kotak Equity Savings Fund
Scheme Facts
Structure
Month end AUM* (as on 31st Mar )
NAV (as on 28th Mar 2018)
2018
Launch Date
Benchmark
Min. Initial Inv.
Additional Inv.
Standard Deviation^
Beta^
Sharpe^
An Open Ended Equity Scheme
crs
13 October 2014
75% of Nifty 50 Arbitrage Index &25% in Nifty 50 TRI (w.e.f. Nov 01, 2016)
5000
1000 & in multiples of 1
3.37%
0.94
0.32
109.01%
*Source: MFI Explorer.
^as on 28th Mar, 2018. Source: ValueResearch.
`1,864.09
`
` `
` `
1,838.81 crs
Direct Growth 13.5139
Growth 13.1966
Quarterly Dividend 11.0074
Direct Quarterly Dividend 11.1013
Monthly Dividend 11.1474
Direct Monthly Dividend 11.3996
& in multiples of 1
th
Monthly Average AUM*
Portfolio Turnover
`
`
`
`
`
`
Load Structure
Entry Load:
Exit Load:
Nil
i) For redemption / switch out ofupto 10% of the initial investment amount(limit) purchased or switched in within 1 yearfrom the date of allotment: Nil.
ii) If units redeemed or switched out are inexcess of the limit within 1 year from the dateof allotment: 1%.
iii) If units are redeemed or switched out on orafter 1 year from the date of allotment: Nil.
Any exit load charged (net off Service Tax, ifany) shall be credited back to the respectiveScheme. Units issued on reinvestment ofdividends shall not be subject to entry and exitload.
31 March, 2018st
Equity Market Brief
• GST – landmark reform is now implemented, and over the last few months, the government has introduced further
changes to help the smaller firms navigate GST better. While there might be some near-term issues in implementing,
the longer term benefits are transformative. Most listed players will benefit, as they form the organised part of the
economy, especially once the e-way bill is introduced in totality.
• After a prolonged period of under-delivery of Corporate Earnings, earnings are starting to improve across a broad
spectrum of sectors.
• India to benefit from such reforms which encourages formalisation of the economy in the medium-to-long-term,
significant flow from physical to financial savings to further provide stability to markets.
• Volatility across global equities is on lower side. Global events – Fed hiking, trade wars, geopolitical events like the
flare-up between US and North Korea to add to near-term volatility. In India as well, as we approach general elections,
markets are likely to turn more volatile.
Time in the market more important than timing the market – after a long period of lower volatility, markets volatility
may move up.
•
15

Kotak Equity Savings Fund31 March, 2018st
About Kotak Mutual Fund
Kotak Mahindra Asset Management
Company Limited (KMAMC) is a wholly
owned subsidiary of Kotak Mahindra Bank
Limited (KMBL). KMBL has over two decades
of experience in financial services. KMBL has a
market capitalization of 1995.45 bn (as on
31st March, 2018). KMAMC is the Asset
Manager for Kotak Mahindra Mutual Fund
(KMMF). It started operations in December
1998. KMMF offers schemes catering to
investors with varying risk - return profiles and
was the first fund house in the country to
launch a dedicated gilt scheme. KMAMC
manages assets worth 1,16,175.581cr as on
31st March, 2018.
`
`
* The numbers are converted using the Rupee-
USD reference rate published by the Reserve
Bank of India as on the respective dates.
To know more
Call : 1800-222-626 (Toll Free), Mumbai61152100, Delhi 66306900 / 02, Chennai28221333 / 45038171, Kolkata 64509802 /03, Pune 64013395 / 96, Ahmedabad26779888, Bangalore 66128050 / 51,Hyderabad 66178140 / 41.
Visit - assetmanagement.kotak.com
Email - [email protected]
Disclaimer
Kotak Equity Savings Fund
Mutual Fund investments are subject tomarket risks, read all scheme relateddocuments carefully. Scheme InformationDocument (SID) and Statement ofAdditional Information (SAI) available onmutualfund.kotak.com
, an Open endedequity scheme. Investment objective: of thescheme is to generate capital appreciation andincome by predominantly investing inarbitrage opportunities in the cash andderivatives segment of the equity market, andenhance returns with a moderate exposure inequity & equity related instruments.There is noassurance or guarantee that the investmentobjective of the scheme will be achieved.
16
Mar-12-18 11.2418 0.0389Feb-12-18 11.3290 0.0500Jan-12-18 11.4330 0.0500Dec-12-17 11.3254 0.0473Oct-13-17 11.2550 0.0518Oct-12-17 11.3021 0.0497Sep-12-17 11.3260 0.0600Aug-14-17 11.4110 0.0583Jul-12-17 11.1373 0.0500Jun-12-17 11.0760 0.0500May-12-17 10.9370 0.0500Apr-12-17 10.9100 0.0500Mar-14-17 10.7883 0.0500Feb-13-17 10.8090 0.0500Jan-12-17 10.6718 0.0500
Mar-20-18 11.1604 0.1789Dec-20-17 11.4149 0.1803Sep-20-17 11.3680 0.1750Jun-20-17 11.1180 0.1500Mar-20-17 10.8961 0.1500
Quaterly Dividend Option
Dividend History
Date CUM DividendNAV
Dividend( per unit)`
This product is suitable for investors who are seeking*:
• Income from arbitrage opportunities in the equitymarket & long term capital growth
• Investment predominantly in arbitrage opportunitiesin the cash & derivatives segment of the equitymarket and equity & equity related securities
* Investors should consult their financial advisors if in doubtabout whether the product is suitable for them.Investors understand that their principal will
be at moderately high risk
Riskometer
M
oderately Moderate
Low
Hig
h
Low
High
LOW HIGH
Moderately
Kotak Equity Savings Fund * Performance (%) as on 28th March, 2018
The scheme has been in existence for less than 5 years
Different plans have different expense structure. The performance details provided herein are of regular plan.
^Past performance may or may not be sustained in future.*All payouts during the period have been reinvested in the units of thescheme at the then prevailing NAV. Returns > = 1 year: CAGR (Compounded Annualised Growth Rate). N.A stands for data notavailable. Note: Point to Point (PTP) Returns in INR shows the value of 10,000/- investment made at inception. Source: ICRA MFIExplorer. # Name of Scheme Benchmark. ## Name of Additional Benchmark.Please refer page no. 29 - 30 for top 3 and bottom 3schemes managed by Mr. Deepak Gupta & Mr. Abhishek Bisen.
`
Portfolio Detail % of Net assets
Unhedged Position 24.74
Cash Futures Arbitrage 35.08
Debt Instruments* 32.44
Cash and Cash equivalent and Net Current Asset 7.74
Total 100.00
*Debt Instruments includes redeemable preference shares
*TRI – Total Return Index
With effect from 1st February 2018, we are comparing the performances of the funds with the total return variant of the benchmarkinstead of the price return variant.
Date SchemeReturns of 10000 in the
Scheme ( ) Benchmark# ( ) Benchmark ## ( )
75%50 TRI
##
Nifty Current Value of Standard Investment
(%) ^ (%)* Additional# (%)*
`
`
` `
Scheme Inception date is 13/10/2014. Mr. Deepak Gupta has been managing the fund since 13/10/2014. Mr. Abhishek Bisenhas been managing the fund since 13/10/2014.
Kotak Equity Savings Fund
Nifty 50Arbitrage Index
25% Nifty 50 TRI
Since Inception 8.35 7.00 8.77 13,197 12,634 13,372
Last 1 Year 8.31 6.26 11.76 10,831 10,626 11,176
Last 3 Years 7.47 6.26 7.38 12,406 11,994 12,378

THEMATIC FUND
Kotak Infrastructure & Economic Reform Fund(formerly known as “PineBridge Infrastructure & EconomicReform Fund)
31 March, 2018st
Scheme Facts
Structure
Launch Date
Benchmark
Min. Initial Inv.
Additional Inv.
Standard Deviation^
Beta^
Sharpe^
Month end AUM* (as on 31st Mar )
NAV (as on 28th Mar 2018)
2018
An Open Ended Equity Scheme
crs
crs
Growth Direct 22.7730
Dividend Direct 22.5140
Standard Dividend 19.3880
Standard Growth 21.2800
27 February 2008
S&P BSE 100 TRI
1000 & in multiples of 1
15.54%
0.97
0.33
35.85%
*Source: MFI Explorer.
^ as on 28th Mar, 2018. Source: ValueResearch.
`
`
`
`
483.31
471.70
th
5000 & in multiples of 1`
`
Monthly Average AUM*
Portfolio Turn over
`
`
`
`
Load Structure
Entry Load:
Exit Load:
Nil
I) For redemptions / switch outs (including SIP/STP)within 1 year from the date of allotment of units,irrespective of the amount of investment – 1%;
ii) For redemptions / switch outs (including SIP/STP)after 1 year from the date of allotment of units,irrespective of the amount of investment – NIL;
iii) Any exit load charged (net off Service Tax, if any)shall be credited back to the Scheme;
iv) Units issued on reinvestment of dividends shall notbe subject to entry and exit load. (applicable for allplans)
18
About Kotak Infrastructure & Economic Reform Fund
�
�
The investment objective of the Scheme is to generate long-term capital appreciation from a diversified
portfolio of predominantly (at least 65%) equity and equity-related securities of companies involved in
economic development of India as a result of potential investments in infrastructure and unfolding economic
reforms.
There is no assurance that the investment objective of the Scheme will be achieved.
Portfolio Action
• We believe investment cycle revival in India will be led by spending by government and this has been articulated well inthe government budget, while private developers following public investments with a lag.
• Given that the two biggest costs in an infrastructure project – commodities and interest rates have come down,incremental project ordering will improve.
• While investment cycle is gradually improving with revival in government capex, housing and private sector capex areyet to see meaningful traction.
• We continue to remain significantly invested in the “flow” of infrastructure theme (i.e companies that benefit fromspending by various entities towards infrastructure creation) rather than “stock” or asset owners in the portfolio.
• We continue to invest along a range of these sectors to play overall improvement in investment cycle.
• We believe well managed companies in capital goods, cement, logistics, utilities and EPC companies will be largebeneficiaries with developers still reeling under regulatory uncertainties and/or large debt servicing.
• During the month, we added to our exposure to companies benefitting from government spending in construction,mining sectors.
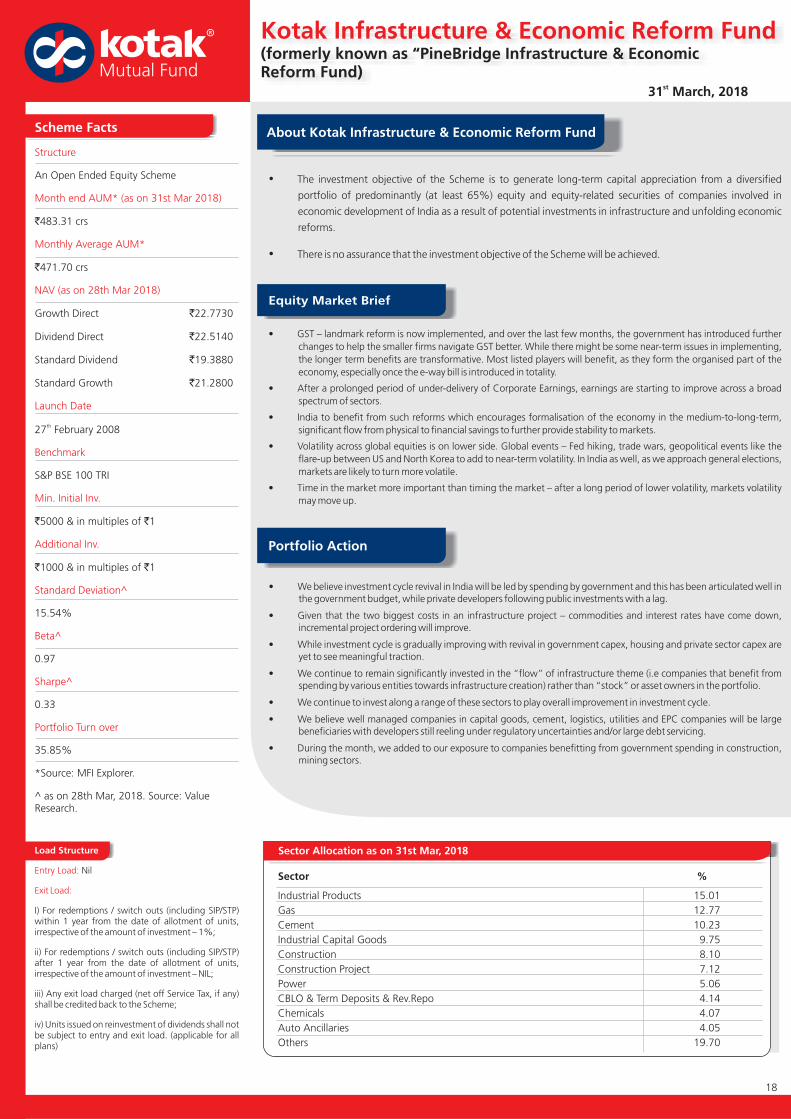
Sector Allocation as on 31st Mar, 2018
Industrial Products 15.01
Gas 12.77
Cement 10.23
Industrial Capital Goods 9.75
Construction 8.10
Construction Project 7.12
Power 5.06
CBLO & Term Deposits & Rev.Repo 4.14
Chemicals 4.07
Auto Ancillaries 4.05
Others 19.70
Equity Market Brief
• GST – landmark reform is now implemented, and over the last few months, the government has introduced further
changes to help the smaller firms navigate GST better. While there might be some near-term issues in implementing,
the longer term benefits are transformative. Most listed players will benefit, as they form the organised part of the
economy, especially once the e-way bill is introduced in totality.
• After a prolonged period of under-delivery of Corporate Earnings, earnings are starting to improve across a broad
spectrum of sectors.
• India to benefit from such reforms which encourages formalisation of the economy in the medium-to-long-term,
significant flow from physical to financial savings to further provide stability to markets.
• Volatility across global equities is on lower side. Global events – Fed hiking, trade wars, geopolitical events like the
flare-up between US and North Korea to add to near-term volatility. In India as well, as we approach general elections,
markets are likely to turn more volatile.
• Time in the market more important than timing the market – after a long period of lower volatility, markets volatility
may move up.
Sector %

About Kotak Mutual Fund
Kotak Mahindra Asset Management
Company Limited (KMAMC) is a wholly
owned subsidiary of Kotak Mahindra Bank
Limited (KMBL). KMBL has over two decades
of experience in financial services. KMBL has a
market capitalization of 1995.45 bn (as on
31st March, 2018). KMAMC is the Asset
Manager for Kotak Mahindra Mutual Fund
(KMMF). It started operations in December
1998. KMMF offers schemes catering to
investors with varying risk - return profiles and
was the first fund house in the country to
launch a dedicated gilt scheme. KMAMC
manages assets worth 1,16,175.581cr as on
31st March, 2018.
`
`
* The numbers are converted using the
Rupee- USD reference rate published by the
Reserve Bank of India as on the respective
dates.
To know more
Call : 1800-222-626 (Toll Free), Mumbai61152100, Delhi 66306900 / 02, Chennai28221333 / 45038171, Kolkata 64509802 /03, Pune 64013395 / 96, Ahmedabad26779888, Bangalore 66128050 / 51,Hyderabad 66178140 / 41.
Visit - assetmanagement.kotak.com
Email - [email protected]
Disclaimer
Kotak Infrastructure & Economic ReformFund
investment objective:
Mutual Fund investments are subject tomarket risks, read all scheme relateddocuments carefully. Scheme InformationDocument (SID) and Statement ofAdditional Information (SAI) available onmutualfund.kotak.com
investment objective of the Scheme is togenerate long-term capital appreciation froma diversified portfolio of predominantly (atleast 65%) equity and equity-related securitiesof companies involved in economicdevelopment of India as a result of potentialinvestments in infrastructure and unfoldingeconomic reforms. There is no assurance thatthe of the Schemewill be achieved.
19
Kotak Infrastructure & Economic Reform Fund(formerly known as “PineBridge Infrastructure & EconomicReform Fund)
Kotak Infrastructure & Economic Reform FundPerformance (%) as on 28th March, 2018
Date SchemeReturns TRI of 10000 in the
Scheme ( )Benchmark# ( ) Benchmark ## ( )
S&P BSE Nifty 50 Current Value of Standard Investment
(%) ^ # (%)* ## (%)* Additional
`
` `
Since Inception 7.77 8.25 8.08 21,280 22,265 21,908
Last 1 Year 10.15 12.12 11.76 11,015 11,212 11,176
Last 3 Years 10.72 8.39 7.38 13,565 12,730 12,378
Last 5 Years 21.78 14.73 13.63 26,798 19,884 18,954
Scheme Inception date is 25/02/2008. Mr. Harish Krishnan has been managing the fund since 01/02/2015.
Kotak Infrastructure & Economic Reform Fund
100 TRI
`
This product is suitable for investors who are seeking*:
• Long term capital growth
• Long term capital appreciation by investing in equityand equity related instruments of companiescontributing to infrastructure and economicdevelopment of India
* Investors should consult their financial advisors if in doubtabout whether the product is suitable for them.Investors understand that their principal will
be at high risk
Riskometer
M
oderately Moderate
Low
Hig
h
Low
High
LOW HIGH
Moderately
Feb-28-2018 20.5820 0.63
Feb-23-2017 17.5640 0.50
June-23-2015 15.2601 0.50
Dividend History
Date CUM DividendNAV
Dividend( per unit)`
31 March, 2018st
Top 10 Holdings as on 31st Mar, 2018
Different plans have different expense structure. The performance details provided herein are of regular plan.
^Past performance may or may not be sustained in future.*All payouts during the period have been reinvested in the units of the scheme at thethen prevailing NAV. Returns > = 1 year: CAGR (Compounded Annualised Growth Rate). N.A stands for data not available. Note: Point to Point(PTP) Returns in INR shows the value of 10,000/- investment made at inception. Source: ICRA MFI Explorer. # Name of Scheme Benchmark. ##Name of Additional Benchmark. Please refer page no. 29 for other schemes managed by Mr. Harish Krishnan.
*TRI – Total Return Index
With effect from 1st February 2018, we are comparing the performances of the funds with the total return variant of the benchmark instead ofthe price return variant.
Shree Cement Ltd. Cement 4.04%
Larsen And Toubro Ltd. Construction Project 3.66%
Indraprastha Gas Ltd. Gas 3.64%
Ultratech Cement Ltd. Cement 3.23%
GAIL (India) Ltd. Gas 3.17%
Solar Industries India Limited Chemicals 3.10%
GE Power India Limited Industrial Capital Goods 3.07%
National Thermal Power Corporation Limited Power 2.98%
Schaeffler India Ltd Industrial Products 2.88%
Thermax Ltd. Industrial Capital Goods 2.82%

DEBT FUND

7
Kotak Low Duration Fund(formerly known as “PineBridge India Short Term Fund”)
31 March, 2018st
Scheme Facts
Structure
Launch Date
Benchmark
Min. Initial Inv.
Additional Inv.
Standard Deviation^
YTM
Portfolio Modified Duration
Month end AUM* (as on 31st Mar )
NAV (as on 28th Mar )
2018
2018
Average Maturity
An Open Ended Debt Scheme
Growth Direct 2189.4665
N/A
Monthly Dividend Direct 1059.7669
Weekly Dividend Direct 1201.6018
Regular Growth 2121.7330
Monthly Dividend 1023.1467
Weekly Dividend 1016.7244
6th March, 2008
Crisil Liquid Fund Index
8.29%
1.03 years
*Source: MFI Explorer.
^ as on 28th Mar, 2018. Source: ValueResearch.
`
` `
` `
5,179.26 crs
`5,492.51 crs
`
`
`
`
`
`
Growth
Regular
Regular
5000 & in multiples of 1
1000 & in multiples of 1
0.65%
1.22 years
Monthly Average AUM*
Load Structure
Entry Load:
Exit Load:
Nil
Nil
Any exit load charged (net off Service Tax, ifany) shall be credited back to the Scheme;
Note - Units issued on reinvestment ofdividends shall not be subject to entry and exitload.
About Kotak Low Duration Plan
�
�
The primary objective of the Scheme is to generate income through investment primarily in low duration debt &
money market securities.
There is no assurance or guarantee that the investment objective of the scheme will be achieved.
Portfolio Action
• Given the above outlook we intend to maintain the average maturity at the higher end of the indicated band.
• The focus is to enhance the portfolio yield while maintaining the liquidity and maturity of the portfolio in theindicated band.
• We intend to maintain the modified duration in the range of 0.75 – 1.00 in April 2018.
21
Asset Allocation as on , 201831st Mar
Debentures and Bonds 97.28%
Commercial Paper (CP)/Certificate of Deposits (CD) 4.06%
CBLO & Term Deposits & Rev.Repo 1.51%
Net Current Assets -2.85%
Debt Market Outlook
• Towards the end of March, the government took strong measures to arrest the rise in bond yields. It announced areduction in the gross borrowing by INR 50000 cr and slashed the H1FY19 borrowing program to ~47% of the annualtarget. This fueled a significant rally in the bond yields and the benchmark 10-yr gilt closed the year at 7.39% from itsprevious high of 7.80%.
• The government changed its pattern of borrowing, reducing the overall maturity of bonds supply from 10-14 yearbucket to 1-9 year bucket. We expect some flattening of the sovereign curve in the 3-12 yr space.
• Given that next year is an election year, reduced borrowing is a bold move on the government’s part. Perhaps, thegovt. is positive on GST collection.
• We expect the headline inflation to peak by June; post which monsoon, MSP and crude prices will play keydeterminants for H2FY19 headline inflation.
• PSU banks, classified as PCA, are recalling their perpetual bond issuances and this is likely to create a great demand forhigh yielding assets and particularly for the remaining outstanding bank perpetual bonds.
• The RBI’s Monetary Policy Committee (MPC) had its first bi-monthly policy meet this week. With a dovish stance andunchanged rates, the bond market saw a further rally in sovereign yields with yields rallying to the 7.10% mark post-policy. We expect a long pause in interest rates by the RBI.
Top 10 Companies as on 31st Mar, 2018
Particulars 31 Mar 2018
Avg. Maturity (in yrs) 1.22 1.21
Duration 1.03 1.02
Yield (in %) 8.29 9.18
28 Feb 2018
Vedanta Ltd. CRISIL AA 8.12%
U P Power Corporation Ltd FITCH IND AA(SO) 7.44%
Bank Of Baroda CARE AA 6.89%
Dewan Housing Finance Corporation Ltd. CARE AAA 6.27%
S D Corporation Private Ltd. CARE AA+(SO) 6.09%
Nirma Ltd. CRISIL AA 5.90%
Karelides Traders Private Ltd. ICRA AA-(SO) 4.94%
Manappuram Finance Ltd. ICRA AA- 4.86%
Reliance Jio Infocomm Ltd. CRISIL AAA 4.78%
Sarvoday Advisory Services Pvt. Ltd. BRICKWORK BWR A(SO) 3.92%
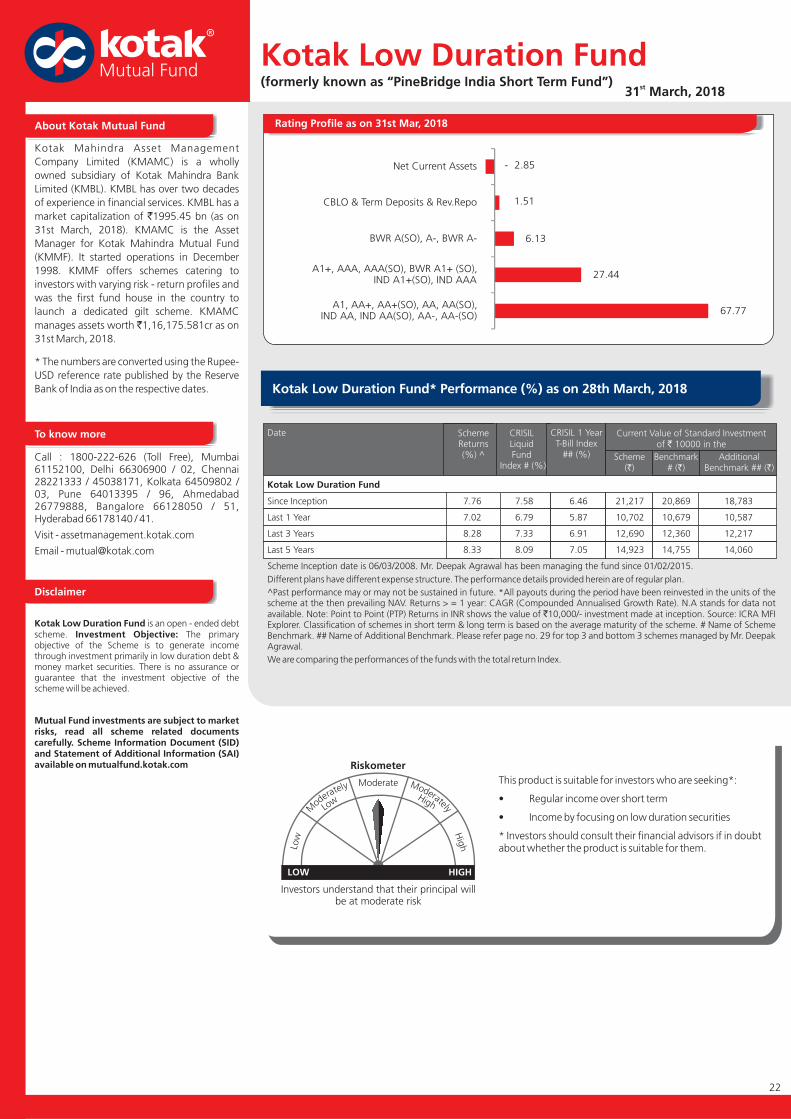
About Kotak Mutual Fund
Kotak Mahindra Asset Management
Company Limited (KMAMC) is a wholly
owned subsidiary of Kotak Mahindra Bank
Limited (KMBL). KMBL has over two decades
of experience in financial services. KMBL has a
market capitalization of 1995.45 bn (as on
31st March, 2018). KMAMC is the Asset
Manager for Kotak Mahindra Mutual Fund
(KMMF). It started operations in December
1998. KMMF offers schemes catering to
investors with varying risk - return profiles and
was the first fund house in the country to
launch a dedicated gilt scheme. KMAMC
manages assets worth 1,16,175.581cr as on
31st March, 2018.
`
`
* The numbers are converted using the Rupee-
USD reference rate published by the Reserve
Bank of India as on the respective dates.
To know more
Call : 1800-222-626 (Toll Free), Mumbai61152100, Delhi 66306900 / 02, Chennai28221333 / 45038171, Kolkata 64509802 /03, Pune 64013395 / 96, Ahmedabad26779888, Bangalore 66128050 / 51,Hyderabad 66178140 / 41.
Visit - assetmanagement.kotak.com
Email - [email protected]
Disclaimer
Kotak Low Duration FundInvestment Objective:
is an open - ended debtscheme. The primaryobjective of the Scheme is to generate incomethrough investment primarily in low duration debt &money market securities. There is no assurance orguarantee that the investment objective of thescheme will be achieved.
Mutual Fund investments are subject to marketrisks, read all scheme related documentscarefully. Scheme Information Document (SID)and Statement of Additional Information (SAI)available on mutualfund.kotak.com
22
Kotak Low Duration Fund* Performance (%) as on , 201828th March
Rating Profile as on 31st Mar, 2018
Different plans have different expense structure. The performance details provided herein are of regular plan.
^Past performance may or may not be sustained in future. *All payouts during the period have been reinvested in the units of thescheme at the then prevailing NAV. Returns > = 1 year: CAGR (Compounded Annualised Growth Rate). N.A stands for data notavailable. Note: Point to Point (PTP) Returns in INR shows the value of 10,000/- investment made at inception. Source: ICRA MFIExplorer. Classification of schemes in short term & long term is based on the average maturity of the scheme. # Name of SchemeBenchmark. ## Name of Additional Benchmark. Please refer page no. 29 for top 3 and bottom 3 schemes managed by Mr. DeepakAgrawal.
`
We are comparing the performances of the funds with the total return Index.
Since Inception 7.76 7.58 6.46 21,217 20,869 18,783
Last 1 Year 7.02 6.79 5.87 10,702 10,679 10,587
Last 3 Years 8.28 7.33 6.91 12,690 12,360 12,217
Last 5 Years 8.33 8.09 7.05 14,923 14,755 14,060
Scheme Inception date is 06/03/2008. Mr. Deepak Agrawal has been managing the fund since 01/02/2015.
Kotak Low Duration Fund
Current Value of Standard Investmentof 10000 in the`
CRISIL 1 YearT-Bill Index
## (%)
CRISILLiquidFund
Index # (%)
SchemeReturns(%) ^
Date
Scheme( )`
Benchmark# ( )`
AdditionalBenchmark ## ( )`
Kotak Low Duration Fund(formerly known as )“PineBridge India Short Term Fund”
31 March, 2018st
This product is suitable for investors who are seeking*:
• Regular income over short term
• Income by focusing on low duration securities
* Investors should consult their financial advisors if in doubtabout whether the product is suitable for them.
Investors understand that their principal willbe at moderate risk
Riskometer
M
oderately Moderate
Low
Hig
h
Low
High
LOW HIGH
Moderately
67.77
27.44
6.13
1.51
- 2.85
A1, AA+, AA+(SO), AA, AA(SO),IND AA, IND AA(SO), AA-, AA-(SO)
A1+, AAA, AAA(SO), BWR A1+ (SO),IND A1+(SO), IND AAA
BWR A(SO), A-, BWR A-
CBLO & Term Deposits & Rev.Repo
Net Current Assets
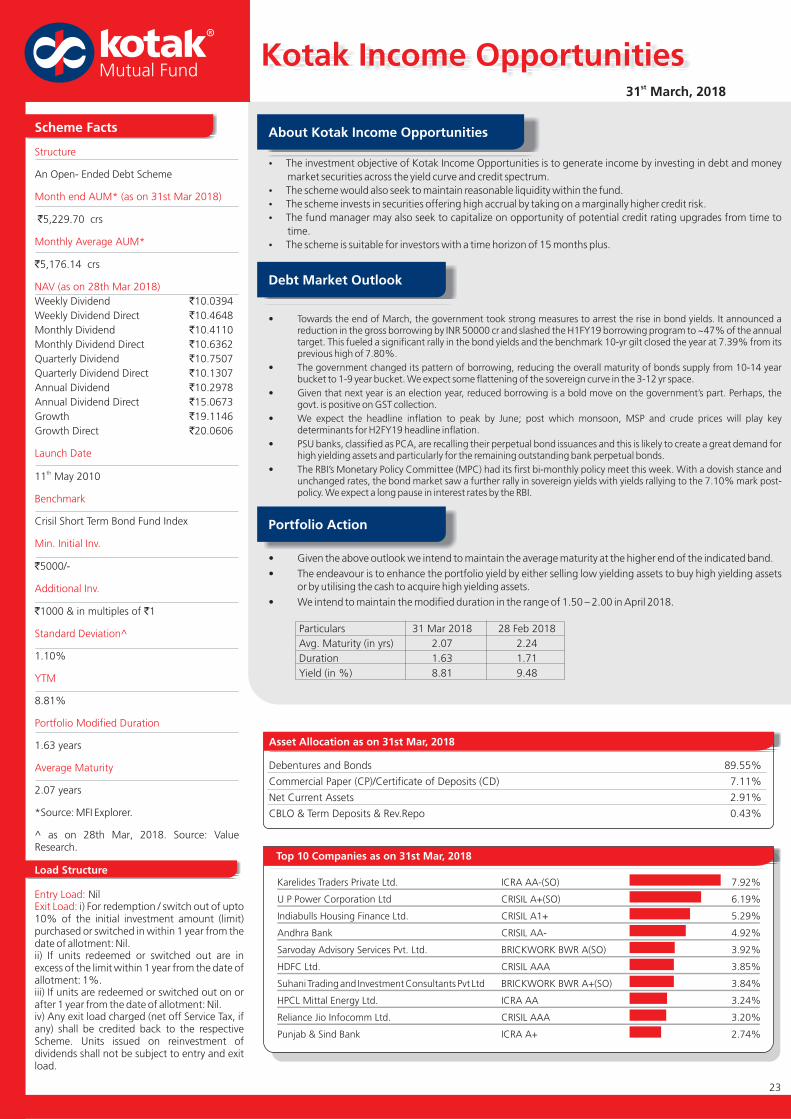
Kotak Income Opportunities31 March, 2018st
Scheme Facts
Structure
Benchmark
Min. Initial Inv.
Additional Inv.
Standard Deviation^
YTM
Portfolio Modified Duration
Month end AUM* (as on 31st Mar )
NAV (as on 2018)
2018
28th Mar
Launch Date
Average Maturity
An Open- Ended Debt Scheme
Weekly Dividend 10.0394
Weekly Dividend Direct 10.4648
Monthly Dividend 10.4110
Monthly Dividend Direct 10.6362
Quarterly Dividend 10.7507
Quarterly Dividend Direct 10.1307
Annual Dividend 10.2978
Annual Dividend Direct 15.0673
Growth 19.1146
Growth Direct 20.0606
Crisil Short Term Bond Fund Index
5000/-
1.10%
8.81%
1.63 years
*Source: MFI Explorer.
^ as on , 2018. Source: ValueResearch.
`
`
5,229.70 crs
`
` `
5,176.14 crs
`
`
`
`
`
`
`
`
`
`
11 May 2010
1000 & in multiples of 1
2.07 years
th
Monthly Average AUM*
28th Mar
Load Structure
Entry Load:Exit Load:
Nil) For redemption / switch out of upto
10% of the initial investment amount (limit)purchased or switched in within 1 year from thedate of allotment: Nil.ii) If units redeemed or switched out are inexcess of the limit within 1 year from the date ofallotment: 1%.iii) If units are redeemed or switched out on orafter 1 year from the date of allotment: Nil.iv) Any exit load charged (net off Service Tax, ifany) shall be credited back to the respectiveScheme. Units issued on reinvestment ofdividends shall not be subject to entry and exitload.
i
About Kotak Income Opportunities
�
�
�
�
�
The investment objective of Kotak Income Opportunities is to generate income by investing in debt and money
market securities across the yield curve and credit spectrum.
The scheme would also seek to maintain reasonable liquidity within the fund.
The scheme invests in securities offering high accrual by taking on a marginally higher credit risk.
The fund manager may also seek to capitalize on opportunity of potential credit rating upgrades from time to
time.
The scheme is suitable for investors with a time horizon of 15 months plus.
Portfolio Action
• Given the above outlook we intend to maintain the average maturity at the higher end of the indicated band.
• The endeavour is to enhance the portfolio yield by either selling low yielding assets to buy high yielding assetsor by utilising the cash to acquire high yielding assets.
• We intend to maintain the modified duration in the range of 1.50 – 2.00 in April 2018.
23
Asset Allocation as on 31st Mar, 2018
Debentures and Bonds 89.55%
Commercial Paper (CP)/Certificate of Deposits (CD) 7.11%
Net Current Assets 2.91%
CBLO & Term Deposits & Rev.Repo 0.43%
Debt Market Outlook
Top 10 Companies as on 31st Mar, 2018
• Towards the end of March, the government took strong measures to arrest the rise in bond yields. It announced areduction in the gross borrowing by INR 50000 cr and slashed the H1FY19 borrowing program to ~47% of the annualtarget. This fueled a significant rally in the bond yields and the benchmark 10-yr gilt closed the year at 7.39% from itsprevious high of 7.80%.
• The government changed its pattern of borrowing, reducing the overall maturity of bonds supply from 10-14 yearbucket to 1-9 year bucket. We expect some flattening of the sovereign curve in the 3-12 yr space.
• Given that next year is an election year, reduced borrowing is a bold move on the government’s part. Perhaps, thegovt. is positive on GST collection.
• We expect the headline inflation to peak by June; post which monsoon, MSP and crude prices will play keydeterminants for H2FY19 headline inflation.
• PSU banks, classified as PCA, are recalling their perpetual bond issuances and this is likely to create a great demand forhigh yielding assets and particularly for the remaining outstanding bank perpetual bonds.
• The RBI’s Monetary Policy Committee (MPC) had its first bi-monthly policy meet this week. With a dovish stance andunchanged rates, the bond market saw a further rally in sovereign yields with yields rallying to the 7.10% mark post-policy. We expect a long pause in interest rates by the RBI.
Particulars 31 Mar 2018
Avg. Maturity (in yrs) 2.07 2.24
Duration 1.63 1.71
Yield (in %) 8.81 9.48
28 Feb 2018
Karelides Traders Private Ltd. ICRA AA-(SO) 7.92%
U P Power Corporation Ltd CRISIL A+(SO) 6.19%
Indiabulls Housing Finance Ltd. CRISIL A1+ 5.29%
Andhra Bank CRISIL AA- 4.92%
Sarvoday Advisory Services Pvt. Ltd. BRICKWORK BWR A(SO) 3.92%
HDFC Ltd. CRISIL AAA 3.85%
Suhani Trading and Investment Consultants Pvt Ltd BRICKWORK BWR A+(SO) 3.84%
HPCL Mittal Energy Ltd. ICRA AA 3.24%
Reliance Jio Infocomm Ltd. CRISIL AAA 3.20%
Punjab & Sind Bank ICRA A+ 2.74%

31 March, 2018st
About Kotak Mutual Fund
Kotak Mahindra Asset Management
Company Limited (KMAMC) is a wholly
owned subsidiary of Kotak Mahindra Bank
Limited (KMBL). KMBL has over two decades
of experience in financial services. KMBL has a
market capitalization of 1995.45 bn (as on
31st March, 2018). KMAMC is the Asset
Manager for Kotak Mahindra Mutual Fund
(KMMF). It started operations in December
1998. KMMF offers schemes catering to
investors with varying risk - return profiles and
was the first fund house in the country to
launch a dedicated gilt scheme. KMAMC
manages assets worth 1,16,175.581cr as on
31st March, 2018.
`
`
* The numbers are converted using the Rupee-
USD reference rate published by the Reserve
Bank of India as on the respective dates.
To know more
Call : 1800-222-626 (Toll Free), Mumbai61152100, Delhi 66306900 / 02, Chennai28221333 / 45038171, Kolkata 64509802 /03, Pune 64013395 / 96, Ahmedabad26779888, Bangalore 66128050 / 51,Hyderabad 66178140 / 41.
Visit - assetmanagement.kotak.comEmail - [email protected]
Disclaimer
Kotak Income Opportunities is an open-endeddebt scheme. Investment Objective: The investmentobjective of the scheme is to generate income byinvesting in debt /and money market securities acrossthe yield curve and credit spectrum. The schemewould also seek to maintain reasonable liquiditywithin the fund. There is no assurance that orguarantee that the investment objective of thescheme will be achieved.
Mutual Fund investments are subject to marketrisks, read all scheme related documentscarefully. Scheme Information Document (SID)and Statement of Additional Information (SAI)available on mutualfund.kotak.com
24
Kotak Income Opportunities Fund - Growth *Performance (%) as on , 201828th March
Rating Profile as on 31st Mar, 2018
Different plans have different expense structure. The performance details provided herein are of regular plan.
^Past performance may or may not be sustained in future. *All payouts during the period have been reinvested in the units of thescheme at the then prevailing NAV. Returns > = 1 year: CAGR (Compounded Annualised Growth Rate). N.A stands for data notavailable. Note: Point to Point (PTP) Returns in INR shows the value of 10,000/- investment made at inception. Source: ICRA MFIExplorer. Classification of schemes in short term & long term is based on the average maturity of the scheme. # Name of SchemeBenchmark. ## Name of Additional Benchmark. Please refer page no. 29 for top 3 and bottom 3 schemes managed by Mr. DeepakAgrawal.
`
We are comparing the performances of the funds with the total return Index.
Since Inception 8.56 8.17 6.77 19,115 18,577 16,757
Last 1 Year 6.52 6.11 5.87 10,652 10,611 10,587
Last 3 Years 8.55 7.90 6.91 12,786 12,558 12,217
Last 5 Years 8.82 8.56 7.05 15,264 15,082 14,060
Scheme Inception date is 11/05/2010. Mr. Deepak Agrawal has been managing the fund since 12/04/2010.
Kotak Income Opportunities Fund - Growth
Current Value of Standard Investmentof 10000 in the`
CRISIL 1Year T-Bill
Index## (%)
Crisil ShortTerm
Bond FundIndex # (%)
SchemeReturns(%) ^
Date
Scheme( )`
Benchmark# ( )`
AdditionalBenchmark ## ( )`
Kotak Income Opportunities
This product is suitable for investors who are seeking*:
• Income over a medium term horizon
• Investment in debt & money market securities
* Investors should consult their financial advisors if in doubtabout whether the product is suitable for them.
Investors understand that their principal willbe at moderately low risk
Riskometer
M
oderately Moderate
Low
Hig
h
Low
High
LOW HIGH
Moderately
52.51
22.07
21.12
2.91
0.96
0.43
A1, AA+, AA+(SO), AA, AA(SO), BWR AA, IND AA, IND AA(SO),AA-, AA-(SO), BWR AA-, BWR AA-(SO), IND AA-
A+, A+(SO), BWR A+, BWR A+(SO),BWR A(SO), A-, BWR A-
A1+, AAA
Net Current Assets
Unrated
CBLO & Term Deposits & Rev.Repo

Kotak Medium Term Fund31 March, 2018st
Scheme Facts
Structure
Launch Date
Benchmark
Min. Initial Inv.
Additional Inv.
Standard Deviation^
YTM
Portfolio Modified Duration
Month end AUM* (as on 31st Mar )
NAV (as on 28th Mar 2018)
2018
Average Maturity
An Open Ended Debt Scheme
Quarterly Dividend 10.6098
Quarterly Dividend Direct 10.6196
Annual Dividend 10.5306
Annual Dividend Direct 15.0172
Growth 14.4250
Growth Direct 14.9809
21st March, 2014
CRISIL Composite Bond Fund Index
8.70%
2.12 years
*Source: MFI Explorer.
^ as on 28th Mar, 2018. Source: ValueResearch.
`
` `
` `
crs4,857.78
`4,809.52 crs
`
`
`
`
`
`
5000 & in multiples of 1
1000 & in multiples of 1
1.51%
2.74 years
Monthly Average AUM*
Load Structure
Entry Load:
Exit Load:
Nil
i) For redemption / switch out ofupto 15% of the initial investment amount(limit) purchased or switched in within 18months from the date of allotment: Nil.
ii) If units redeemed or switched out are inexcess of the limit within 18 months from thedate of allotment: 2%.
iii) If units are redeemed or switched out on orafter 18 months from the date of allotment:Nil.
iv) Any exit load charged (net off Service Tax ifany) shall be credited back to the respectiveScheme. Units issued on reinvestment ofdividends shall not be subject to entry and exitload.
Top 10 Companies as on 31st Mar, 2018
Asset Allocation as on 31st Mar, 2018
Debentures and Bonds 93.21%
Commercial Paper (CP)/Certificate of Deposits (CD) 3.22%
Net Current Assets 2.24%
CBLO & Term Deposits & Rev.Repo 1.02%
Government Dated Securities 0.31%
About Kotak Medium Term Plan
�
�
�
�
�
Kotak Medium Term Fund, an open-ended debt scheme.
The investment objective of the scheme is to generate regular income and capital appreciation by investing in a
portfolio of medium term debt and money market instruments.
The fund has an average maturity floor of around 3 years and a ceiling of around 7 years.
As a result, the fund occupies a mid-segment space between the long duration and the short duration bonds.
Likewise, the fund's merits also tend to be a balance of the long term and the short term bond funds.
The fund operates largely on a Hold-Till-Maturity (HTM) strategy.
Portfolio Action
• Given the above outlook we intend to maintain the average maturity at the higher end of the indicated band.
• The endeavour is to enhance the portfolio yield by either selling low yield assets or buying high yielding assetsby utilising the cash.
• We intend to maintain a modified duration in the range of 2.00 – 2.50 in April 2018.
Debt Market Outlook
• Towards the end of March, the government took strong measures to arrest the rise in bond yields. It announced areduction in the gross borrowing by INR 50000 cr and slashed the H1FY19 borrowing program to ~47% of the annualtarget. This fueled a significant rally in the bond yields and the benchmark 10-yr gilt closed the year at 7.39% from itsprevious high of 7.80%.
• The government changed its pattern of borrowing, reducing the overall maturity of bonds supply from 10-14 yearbucket to 1-9 year bucket. We expect some flattening of the sovereign curve in the 3-12 yr space.
• Given that next year is an election year, reduced borrowing is a bold move on the government’s part. Perhaps, thegovt. is positive on GST collection.
• We expect the headline inflation to peak by June; post which monsoon, MSP and crude prices will play keydeterminants for H2FY19 headline inflation.
• PSU banks, classified as PCA, are recalling their perpetual bond issuances and this is likely to create a great demand forhigh yielding assets and particularly for the remaining outstanding bank perpetual bonds.
• The RBI’s Monetary Policy Committee (MPC) had its first bi-monthly policy meet this week. With a dovish stance andunchanged rates, the bond market saw a further rally in sovereign yields with yields rallying to the 7.10% mark post-policy. We expect a long pause in interest rates by the RBI.
Particulars 31 Mar 2018
Avg. Maturity (in yrs) 2.74 2.96
Duration 2.12 2.22
Yield (in %) 8.70 9.75
28 Feb 2018
Karelides Traders Private Ltd. ICRA AA-(SO) 6.74%
U P Power Corporation Ltd FITCH IND AA(SO) 4.96%
Reliance Jio Infocomm Ltd. CRISIL AAA 4.85%
Punjab & Sind Bank ICRA A+ 3.79%
Nuvoco Vistas Corporation Ltd. CRISIL AA 3.54%
U P Power Corporation Ltd CRISIL A+(SO) 3.52%
PNB Housing Finance Ltd. CARE AAA 3.41%
HPCL Mittal Energy Ltd. ICRA AA 3.11%
Adani Infra (India) Limited. BRICKWORK BWR AA-(SO) 3.09%
Edelweiss Commodities Services Ltd. ICRA AA 2.90%
25

26
About Kotak Mutual Fund
Kotak Mahindra Asset Management
Company Limited (KMAMC) is a wholly
owned subsidiary of Kotak Mahindra Bank
Limited (KMBL). KMBL has over two decades
of experience in financial services. KMBL has a
market capitalization of 1995.45 bn (as on
31st March, 2018). KMAMC is the Asset
Manager for Kotak Mahindra Mutual Fund
(KMMF). It started operations in December
1998. KMMF offers schemes catering to
investors with varying risk - return profiles and
was the first fund house in the country to
launch a dedicated gilt scheme. KMAMC
manages assets worth 1,16,175.581cr as on
31st March, 2018.
`
`
* The numbers are converted using the Rupee-
USD reference rate published by the Reserve
Bank of India as on the respective dates.
To know more
Call : 1800-222-626 (Toll Free), Mumbai61152100, Delhi 66306900 / 02, Chennai28221333 / 45038171, Kolkata 64509802 /03, Pune 64013395 / 96, Ahmedabad26779888, Bangalore 66128050 / 51,Hyderabad 66178140 / 41.
Visit - assetmanagement.kotak.com
Email - [email protected]
Disclaimer
Kotak Medium Term Fund an open-endeddebt scheme investment objective: of thescheme is to generate regular income andcapital appreciation by investing in a portfolioof medium term debt and money marketinstruments. There is no assurance orguarantee that the investment objective of thescheme will be achieved.
Mutual Fund investments are subject to marketrisks, read all scheme related documentscarefully. Scheme Information Document (SID)and Statement of Additional Information (SAI)available on mutualfund.kotak.com
Kotak Medium Term Fund *Performance (%) as on , 201828th March
Different plans have different expense structure. The performance details provided herein are of regular plan.
^Past performance may or may not be sustained in future. *All payouts during the period have been reinvested in the units of thescheme at the then prevailing NAV. Returns > = 1 year: CAGR (Compounded Annualised Growth Rate). N.A stands for data notavailable. Note: Point to Point (PTP) Returns in INR shows the value of 10,000/- investment made at inception. Source: ICRA MFIExplorer. Classification of schemes in short term & long term is based on the average maturity of the scheme. # Name of SchemeBenchmark. ## Name of Additional Benchmark. Please refer page no. 29 for top 3 and bottom 3 schemes managed by Mr. DeepakAgrawal.
`
We are comparing the performances of the funds with the total return Index.
Rating Profile as on 31st Mar, 2018
Kotak Medium Term Fund
Current Value of Standard Investmentof 10000 in the`
CRISIL 10 YRGilt Index## (%)
CRISILCompositeBond FundIndex # (%)
SchemeReturns(%) ^
Date
Scheme( )`
Benchmark# ( )`
AdditionalBenchmark ## ( )`
Kotak Medium Term Fund
This product is suitable for investors who are seeking*:
• Income over a medium term investment horizon
• Investment in debt, government securities & moneymarket instruments with a portfolio weightedaverage maturity between 3-7 years
* Investors should consult their financial advisors if in doubtabout whether the product is suitable for them.
Investors understand that their principal willbe at moderate risk
Riskometer
M
oderately Moderate
Low
Hig
h
Low
High
LOW HIGH
Moderately
31 March, 2018st
Since Inception 9.54 9.75 8.35 14,425 14,535 13,804
Last 1 Year 6.55 5.06 -0.42 10,655 10,506 9,958
Last 3 Years 8.71 8.12 6.36 12,843 12,632 12,029
Scheme Inception date is 21/03/2014. Mr. Deepak Agrawal has been managing the fund since 22/06/2015.
The scheme has been in existence for less than 5 years.
58.89
23.30
13.52
2.24
1.03
1.02
AA+, AA+(SO), AA, AA(SO), BWR AA, IND AA, IND AA(SO),AA-, AA-(SO), BWR AA-, BWR AA-(SO), IND AA-
A1+, AAA, AAA(SO), IND AAA, SOV
A+, A+(SO), BWR A+(SO), A-, BWR A-
Net Current Assets
Unrated
CBLO & Term Deposits & Rev.Repo

Kotak Bond Short Term31 March, 2018st
Scheme Facts
Structure
Launch Date
Benchmark
Min. Initial Inv.
Additional Inv.
Standard Deviation^
YTM
Portfolio Modified Duration
Average Maturity
Month end AUM* (as on 31st Mar 2018)
NAV (as on 28th Mar 2018)
An Open Ended Debt Scheme
8,934.80 crs
9,236.67 crs
Dividend 10.1846
Dividend Direct 10.6567
Half Yearly Dividend 11.8228
Half Yearly Dividend Direct 11.9597
Growth 32.4212
Growth Direct 33.6593
2nd May, 2002
Crisil Short - Term Bond Fund Index
(a) Dividend Re-investment & Growth -5000 & above (b) Dividend Payout (Monthly
Dividend) - 50,000& above
1000 & in multiples of 1
1.10%
7.71%
1.37 years
1.59 years
*Source: MFI Explorer.
^ as on 28th Mar, 2018. Source: ValueResearch.
`
`
`
`
` `
`
`
`
`
`
`
Monthly Average AUM*
Load Structure
Entry Load:
Exit Load:
Nil
Nil
About Kotak Bond Short Term
�
�
The investment objective of Kotak Bond Short Term is to provide reasonable returns and high level of liquidity by
investing in debt and money market instruments of different maturities so as to spread the risk across different
kind of issuers in the debt market.
The scheme is suitable for investors who may generally want to position themselves at the shorter end of the yield
curve with a time horizon of 6 months and more.
Portfolio Action
• Given the above outlook we intend to maintain the average maturity at the higher end of the indicated band.
• We believe that short term assets (1-3 yr assets) are at the best point on the yield curve and are poised to deliver
good returns. We shall be incorporating an appropriate mix of these assets in our portfolio.
• We intend to maintain the modified duration in the range of 1.30 – 2.00 in April 2018.
Asset Allocation as on 31st Mar, 2018
Debentures and Bonds 82.23%
Government Dated Securities 9.22%
Commercial Paper (CP)/Certificate of Deposits (CD) 4.36%
Net Current Assets 3.62%
CBLO & Term Deposits & Rev.Repo 0.57%
Debt Market Outlook
• Towards the end of March, the government took strong measures to arrest the rise in bond yields. It announced areduction in the gross borrowing by INR 50000 cr and slashed the H1FY19 borrowing program to ~47% of the annualtarget. This fueled a significant rally in the bond yields and the benchmark 10-yr gilt closed the year at 7.39% from itsprevious high of 7.80%.
• The government changed its pattern of borrowing, reducing the overall maturity of bonds supply from 10-14 yearbucket to 1-9 year bucket. We expect some flattening of the sovereign curve in the 3-12 yr space.
• Given that next year is an election year, reduced borrowing is a bold move on the government’s part. Perhaps, thegovt. is positive on GST collection.
• We expect the headline inflation to peak by June; post which monsoon, MSP and crude prices will play keydeterminants for H2FY19 headline inflation.
• PSU banks, classified as PCA, are recalling their perpetual bond issuances and this is likely to create a great demand forhigh yielding assets and particularly for the remaining outstanding bank perpetual bonds.
• The RBI’s Monetary Policy Committee (MPC) had its first bi-monthly policy meet this week. With a dovish stance andunchanged rates, the bond market saw a further rally in sovereign yields with yields rallying to the 7.10% mark post-policy. We expect a long pause in interest rates by the RBI.
Particulars 31 Mar 2018
Avg. Maturity (in yrs) 1.59 1.66
Duration 1.37 1.43
Yield (in %) 7.71 8.06
28 Feb 2018
27

31 March, 2018st
About Kotak Mutual Fund
Kotak Mahindra Asset Management
Company Limited (KMAMC) is a wholly
owned subsidiary of Kotak Mahindra Bank
Limited (KMBL). KMBL has over two decades
of experience in financial services. KMBL has a
market capitalization of 1995.45 bn (as on
31st March, 2018). KMAMC is the Asset
Manager for Kotak Mahindra Mutual Fund
(KMMF). It started operations in December
1998. KMMF offers schemes catering to
investors with varying risk - return profiles and
was the first fund house in the country to
launch a dedicated gilt scheme. KMAMC
manages assets worth 1,16,175.581cr as on
31st March, 2018.
`
`
* The numbers are converted using the Rupee-
USD reference rate published by the Reserve
Bank of India as on the respective dates.
To know more
Call : 1800-222-626 (Toll Free), Mumbai61152100, Delhi 66306900 / 02, Chennai28221333 / 45038171, Kolkata 64509802 /03, Pune 64013395 / 96, Ahmedabad26779888, Bangalore 66128050 / 51,Hyderabad 66178140 / 41.
Visit - assetmanagement.kotak.com
Email - [email protected]
Disclaimer
Kotak Bond Short Term is
Investment Objective:
an open-ended debt
scheme. The investment
objective of the Scheme is to provide reasonable
returns and high level of liquidity by investing in debt
instruments such as bonds, debentures and
Government securities; and money market instrume
nts such as treasury bills,commercial papers,
certificates of deposit, including repos in permitted
securities of different maturities, so as to spread the
risk across different kinds of issuers in the debt
markets. The Schememay invest in the call
money/termmoney market in terms of RBI guidelines
in this respect. To reduce the risk of the portfolio, the
Scheme may also use various derivative and hedging
products from time to time, in the manner permitted
by SEBI.Subject to the maximum amount permitted
from time to time, the Scheme may invest in offshore
securities in the manner allowed by SEBI/RBI,
provided such investments are in conformity with the
investment objective of the Scheme and the
prevailing guidelines and Regulations.There is no
assurance that the investment objective of the
Scheme will be realised.
Mutual Fund investments are subject to market
risks, read all scheme related documents
carefully. Scheme Information Document (SID)
and Statement of Additional Information (SAI)
available on mutualfund.kotak.com
Kotak Bond Short Term
Kotak Bond Short Term* Performance (%) as on 28th March, 2018
Different plans have different expense structure. The performance details provided herein are of regular plan.
^Past performance may or may not be sustained in future. *All payouts during the period have been reinvested in the units of thescheme at the then prevailing NAV. Returns > = 1 year: CAGR (Compounded Annualised Growth Rate). N.A stands for data notavailable. Note: Point to Point (PTP) Returns in INR shows the value of 10,000/- investment made at inception. Source: ICRA MFIExplorer. Classification of schemes in short term & long term is based on the average maturity of the scheme. # Name of SchemeBenchmark. ## Name of Additional Benchmark. Please refer page no. 29 for top 3 and bottom 3 schemes managed by Mr. DeepakAgrawal.
`
We are comparing the performances of the funds with the total return Index.
Since Inception 7.67 7.22 5.98 32,421 30,314 25,197
Last 1 Year 5.48 6.11 5.87 10,548 10,611 10,587
Last 3 Years 7.50 7.90 6.91 12,419 12,558 12,217
Last 5 Years 7.94 8.56 7.05 14,659 15,082 14,060
Scheme Inception date is 02/05/2002. Mr. Deepak Agrawal has been managing the fund since 11/07/2007.
Kotak Bond Short Term - Growth
Current Value of Standard Investmentof 10000 in the`
CRISIL 1Year
T-Bill Index## (%)
Crisil ShortTerm BondFund Index
(%)#
SchemeReturns(%) ^
Date
Scheme( )`
Benchmark# ( )`
AdditionalBenchmark ## ( )`
This product is suitable for investors who are seeking*:
• Income over a medium term horizon
• Investment in debt & money market securities
* Investors should consult their financial advisors if in doubtabout whether the product is suitable for them.
Investors understand that their principal willbe at moderately low risk
Riskometer
M
oderately Moderate
Low
Hig
h
Low
High
LOW HIGH
ModeratelyRating Profile as on 31st Mar, 2018
Top 10 Companies as on 31st Mar, 2018
Mahindra & Mahindra Financial Services Ltd. FITCH IND AAA 8.74%
HDFC Ltd. CRISIL AAA 7.70%
Nabha Power Ltd. ICRA AAA 7.58%
ONGC Manglore Petrochemicals Ltd. FITCH IND AAA 6.53%
Power Finance Corporation Ltd. CRISIL AAA 5.93%
Reliance Jio Infocomm Ltd. CRISIL AAA 5.92%
LIC Housing Finance Ltd. CRISIL AAA 5.46%
Rural Electrification Corporation Ltd. CRISIL AAA 4.59%
Kotak Mahindra Prime Ltd. CRISIL AAA 4.12%
8.21% State Government SOV 3.54%
95.81
3.62
0.57
A1+, AAA, AAA(SO), IND AAA, SOV
Net Current Assets
CBLO & Term Deposits & Rev.Repo
28
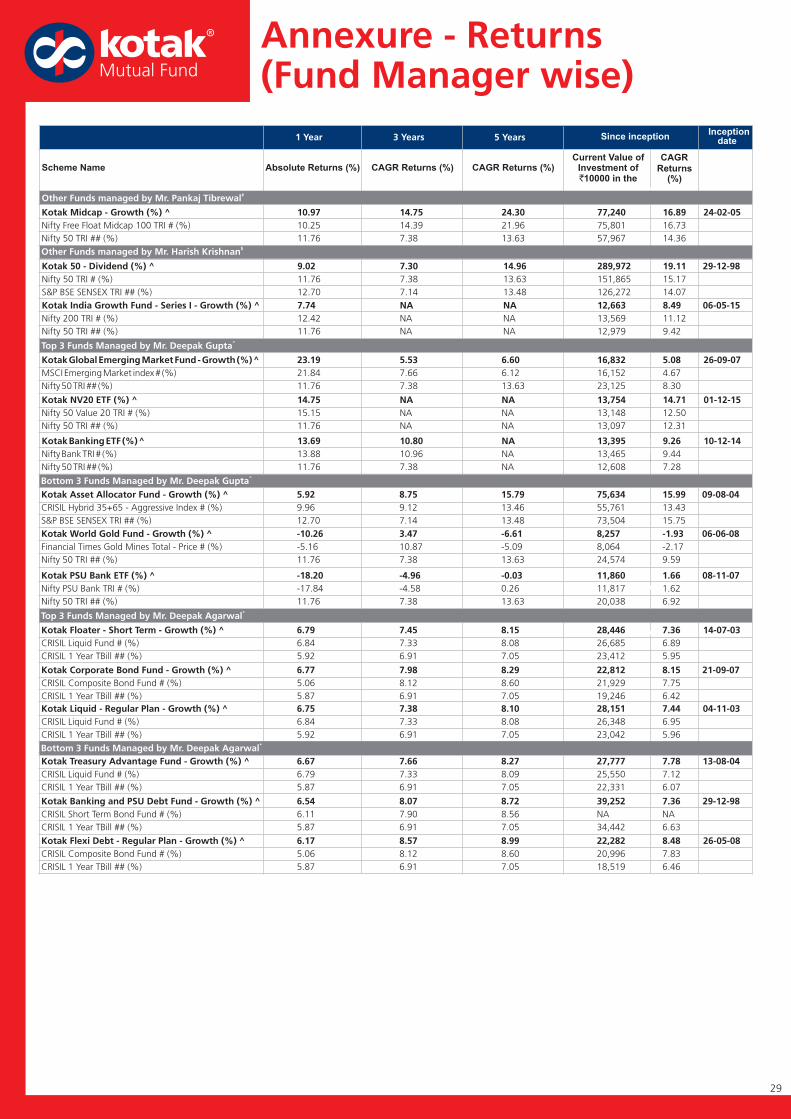
29
Current Value ofInvestment of
10000 in the`
Other Mr. Pankaj Tibrewal#Funds managed by
Other Funds managed by Mr. Harish Krishnan$
Annexure - Returns(Fund Manager wise)
1 Year 3 Years 5 Years
Scheme Name Absolute Returns (%) CAGR Returns (%) CAGR Returns (%)
Inceptiondate
Since inception
CAGR
Returns(%)
Top 3 Funds Managed by Mr. Deepak Agarwal*
Top 3 Funds Managed by Mr. Deepak Gupta^
Bottom 3 Funds Managed by Mr. Deepak Gupta^
Bottom 3 Funds Managed by Mr. Deepak Agarwal*
Kotak Midcap - Growth (%) ^ 10.97 14.75 24.30 77,240 16.89 24-02-05
Nifty Free Float Midcap 100 TRI # (%) 10.25 14.39 21.96 75,801 16.73
Nifty 50 TRI ## (%) 11.76 7.38 13.63 57,967 14.36
Kotak 50 - Dividend (%) ^ 9.02 7.30 14.96 289,972 19.11 29-12-98
Nifty 50 TRI # (%) 11.76 7.38 13.63 151,865 15.17
S&P BSE SENSEX TRI ## (%) 12.70 7.14 13.48 126,272 14.07
Kotak India Growth Fund - Series I - Growth (%) ^ 7.74 NA NA 12,663 8.49 06-05-15
Nifty 200 TRI # (%) 12.42 NA NA 13,569 11.12
Nifty 50 TRI ## (%) 11.76 NA NA 12,979 9.42
KotakGlobal EmergingMarket Fund-Growth (%)^ 23.19 5.53 6.60 16,832 5.08 26-09-07
MSCIEmergingMarket index# (%) 21.84 7.66 6.12 16,152 4.67
Nifty50 TRI ## (%) 11.76 7.38 13.63 23,125 8.30
Kotak NV20 ETF (%) ^ 14.75 NA NA 13,754 14.71 01-12-15
Nifty 50 Value 20 TRI # (%) 15.15 NA NA 13,148 12.50
Nifty 50 TRI ## (%) 11.76 NA NA 13,097 12.31
Kotak BankingETF (%)^ 13.69 10.80 NA 13,395 9.26 10-12-14
NiftyBank TRI# (%) 13.88 10.96 NA 13,465 9.44
Nifty50 TRI## (%) 11.76 7.38 NA 12,608 7.28
Kotak World Gold Fund - Growth (%) ^ -10.26 3.47 -6.61 8,257 -1.93 06-06-08
Financial Times Gold Mines Total - Price # (%) -5.16 10.87 -5.09 8,064 -2.17
Nifty 50 TRI ## (%) 11.76 7.38 13.63 24,574 9.59
Kotak Asset Allocator Fund - Growth (%) ^ 5.92 8.75 15.79 75,634 15.99 09-08-04
CRISIL Hybrid 35+65 - Aggressive Index # (%) 9.96 9.12 13.46 55,761 13.43
S&P BSE SENSEX TRI ## (%) 12.70 7.14 13.48 73,504 15.75
Kotak PSU Bank ETF (%) ^ -18.20 -4.96 -0.03 11,860 1.66 08-11-07
Nifty PSU Bank TRI # (%) -17.84 -4.58 0.26 11,817 1.62
Nifty 50 TRI ## (%) 11.76 7.38 13.63 20,038 6.92
Kotak Floater - Short Term - Growth (%) ^ 6.79 7.45 8.15 28,446 7.36 14-07-03
CRISIL Liquid Fund # (%) 6.84 7.33 8.08 26,685 6.89
CRISIL 1 Year TBill ## (%) 5.92 6.91 7.05 23,412 5.95
Kotak Corporate Bond Fund - Growth (%) ^ 6.77 7.98 8.29 22,812 8.15 21-09-07
CRISIL Composite Bond Fund # (%) 5.06 8.12 8.60 21,929 7.75
CRISIL 1 Year TBill ## (%) 5.87 6.91 7.05 19,246 6.42
Kotak Liquid - Regular Plan - Growth (%) ^ 6.75 7.38 8.10 28,151 7.44 04-11-03
CRISIL Liquid Fund # (%) 6.84 7.33 8.08 26,348 6.95
CRISIL 1 Year TBill ## (%) 5.92 6.91 7.05 23,042 5.96
Kotak Treasury Advantage Fund - Growth (%) ^ 6.67 7.66 8.27 27,777 7.78 13-08-04
CRISIL Liquid Fund # (%) 6.79 7.33 8.09 25,550 7.12
CRISIL 1 Year TBill ## (%) 5.87 6.91 7.05 22,331 6.07
Kotak Banking and PSU Debt Fund - Growth (%) ^ 6.54 8.07 8.72 39,252 7.36 29-12-98
CRISIL Short Term Bond Fund # (%) 6.11 7.90 8.56 NA NA
CRISIL 1 Year TBill ## (%) 5.87 6.91 7.05 34,442 6.63
Kotak Flexi Debt - Regular Plan - Growth (%) ^ 6.17 8.57 8.99 22,282 8.48 26-05-08
CRISIL Composite Bond Fund # (%) 5.06 8.12 8.60 20,996 7.83
CRISIL 1 Year TBill ## (%) 5.87 6.91 7.05 18,519 6.46
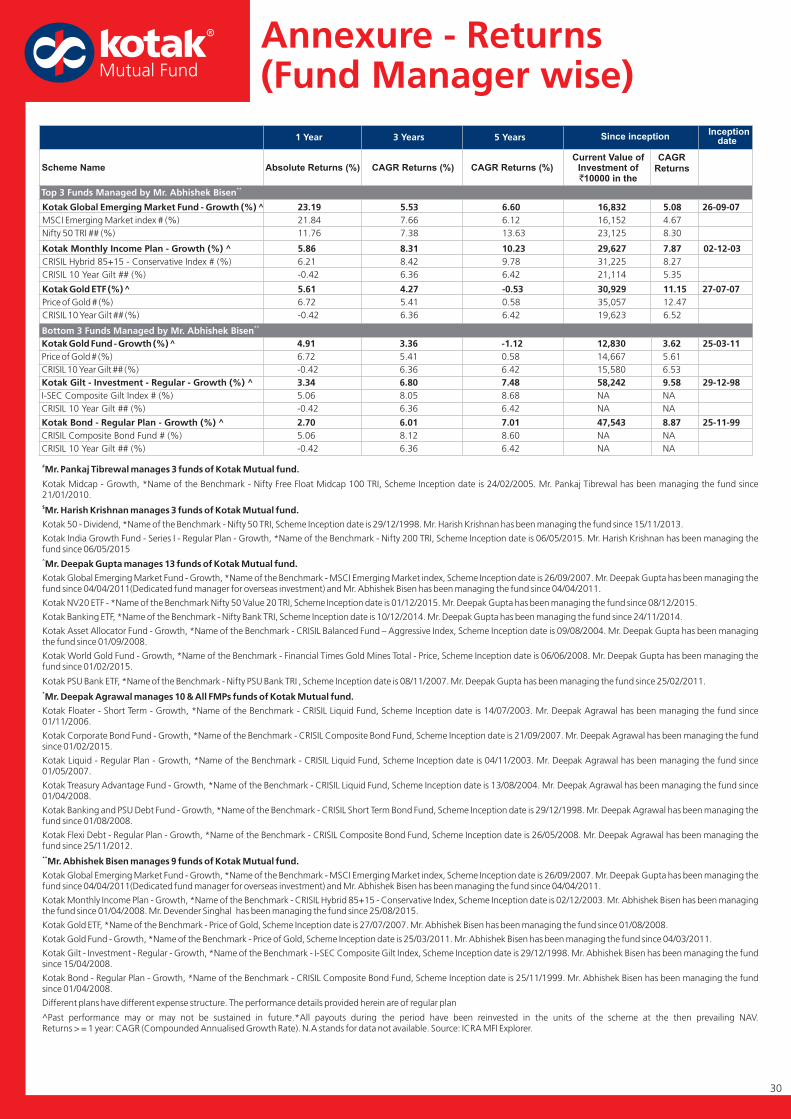
30
Top 3 Funds Managed by Mr. Abhishek Bisen**
Current Value ofInvestment of
10000 in the`
Annexure - Returns(Fund Manager wise)
Scheme Name Absolute Returns (%) CAGR Returns (%) CAGR Returns (%)
Inceptiondate
Since inception
CAGR
Returns
Bottom 3 Funds Managed by Mr. Abhishek Bisen**
1 Year 3 Years 5 Years
Kotak Global Emerging Market Fund - Growth (%) ^ 23.19 5.53 6.60 16,832 5.08 26-09-07
MSCI Emerging Market index # (%) 21.84 7.66 6.12 16,152 4.67
Nifty 50 TRI ## (%) 11.76 7.38 13.63 23,125 8.30
Kotak Monthly Income Plan - Growth (%) ^ 5.86 8.31 10.23 29,627 7.87 02-12-03
CRISIL Hybrid 85+15 - Conservative Index # (%) 6.21 8.42 9.78 31,225 8.27
CRISIL 10 Year Gilt ## (%) -0.42 6.36 6.42 21,114 5.35
KotakGold ETF (%)^ 5.61 4.27 -0.53 30,929 11.15 27-07-07
Priceof Gold# (%) 6.72 5.41 0.58 35,057 12.47
CRISIL10YearGilt ## (%) -0.42 6.36 6.42 19,623 6.52
Kotak Gilt - Investment - Regular - Growth (%) ^ 3.34 6.80 7.48 58,242 9.58 29-12-98
I-SEC Composite Gilt Index # (%) 5.06 8.05 8.68 NA NA
CRISIL 10 Year Gilt ## (%) -0.42 6.36 6.42 NA NA
Kotak Bond - Regular Plan - Growth (%) ^ 2.70 6.01 7.01 47,543 8.87 25-11-99
CRISIL Composite Bond Fund # (%) 5.06 8.12 8.60 NA NA
CRISIL 10 Year Gilt ## (%) -0.42 6.36 6.42 NA NA
Kotak GoldFund -Growth (%) ^ 4.91 3.36 -1.12 12,830 3.62 25-03-11
Priceof Gold# (%) 6.72 5.41 0.58 14,667 5.61
CRISIL10 YearGilt ## (%) -0.42 6.36 6.42 15,580 6.53
#
$
^
*
**
Mr. Pankaj Tibrewal manages 3 funds of Kotak Mutual fund.
Mr. Harish Krishnan manages 3 funds of Kotak Mutual fund.
Mr. Deepak Gupta manages 13 funds of Kotak Mutual fund.
Mr. Deepak Agrawal manages 10 & All FMPs funds of Kotak Mutual fund.
Mr. Abhishek Bisen manages 9 funds of Kotak Mutual fund.
Kotak Midcap - Growth, *Name of the Benchmark - Nifty Free Float Midcap 100 TRI, Scheme Inception date is 24/02/2005. Mr. Pankaj Tibrewal has been managing the fund since21/01/2010.
Kotak India Growth Fund - Series I - Regular Plan - Growth, *Name of the Benchmark - Nifty 200 TRI, Scheme Inception date is 06/05/2015. Mr. Harish Krishnan has been managing thefund since 06/05/2015
Kotak Global Emerging Market Fund - Growth, *Name of the Benchmark - MSCI Emerging Market index, Scheme Inception date is 26/09/2007. Mr. Deepak Gupta has been managing thefund since 04/04/2011(Dedicated fund manager for overseas investment) and Mr. Abhishek Bisen has been managing the fund since 04/04/2011.
Kotak NV20 ETF - *Name of the Benchmark Nifty 50 Value 20 TRI, Scheme Inception date is 01/12/2015. Mr. Deepak Gupta has been managing the fund since 08/12/2015.
Kotak Banking ETF, *Name of the Benchmark - Nifty Bank TRI, Scheme Inception date is 10/12/2014. Mr. Deepak Gupta has been managing the fund since 24/11/2014.
Kotak Asset Allocator Fund - Growth, *Name of the Benchmark - CRISIL Balanced Fund – Aggressive Index, Scheme Inception date is 09/08/2004. Mr. Deepak Gupta has been managingthe fund since 01/09/2008.
Kotak World Gold Fund - Growth, *Name of the Benchmark - Financial Times Gold Mines Total - Price, Scheme Inception date is 06/06/2008. Mr. Deepak Gupta has been managing thefund since 01/02/2015.
Kotak Global Emerging Market Fund - Growth, *Name of the Benchmark - MSCI Emerging Market index, Scheme Inception date is 26/09/2007. Mr. Deepak Gupta has been managing thefund since 04/04/2011(Dedicated fund manager for overseas investment) and Mr. Abhishek Bisen has been managing the fund since 04/04/2011.
Kotak Monthly Income Plan - Growth, *Name of the Benchmark - CRISIL Hybrid 85+15 - Conservative Index, Scheme Inception date is 02/12/2003. Mr. Abhishek Bisen has been managingthe fund since 01/04/2008. Mr. Devender Singhal has been managing the fund since 25/08/2015.
Kotak Gilt - Investment - Regular - Growth, *Name of the Benchmark - I-SEC Composite Gilt Index, Scheme Inception date is 29/12/1998. Mr. Abhishek Bisen has been managing the fundsince 15/04/2008.
Different plans have different expense structure. The performance details provided herein are of regular plan
^Past performance may or may not be sustained in future.*All payouts during the period have been reinvested in the units of the scheme at the then prevailing NAV.Returns > = 1 year: CAGR (Compounded Annualised Growth Rate). N.A stands for data not available. Source: ICRA MFI Explorer.
Kotak 50 - Dividend, *Name of the Benchmark - Nifty 50 TRI, Scheme Inception date is 29/12/1998. Mr. Harish Krishnan has been managing the fund since 15/11/2013.
Kotak PSU Bank ETF, *Name of the Benchmark - Nifty PSU Bank TRI , Scheme Inception date is 08/11/2007. Mr. Deepak Gupta has been managing the fund since 25/02/2011.
Kotak Floater - Short Term - Growth, *Name of the Benchmark - CRISIL Liquid Fund, Scheme Inception date is 14/07/2003. Mr. Deepak Agrawal has been managing the fund since01/11/2006.
Kotak Corporate Bond Fund - Growth, *Name of the Benchmark - CRISIL Composite Bond Fund, Scheme Inception date is 21/09/2007. Mr. Deepak Agrawal has been managing the fundsince 01/02/2015.
Kotak Liquid - Regular Plan - Growth, *Name of the Benchmark - CRISIL Liquid Fund, Scheme Inception date is 04/11/2003. Mr. Deepak Agrawal has been managing the fund since01/05/2007.
Kotak Treasury Advantage Fund - Growth, *Name of the Benchmark - CRISIL Liquid Fund, Scheme Inception date is 13/08/2004. Mr. Deepak Agrawal has been managing the fund since01/04/2008.
Kotak Banking and PSU Debt Fund - Growth, *Name of the Benchmark - CRISIL Short Term Bond Fund, Scheme Inception date is 29/12/1998. Mr. Deepak Agrawal has been managing thefund since 01/08/2008.
Kotak Flexi Debt - Regular Plan - Growth, *Name of the Benchmark - CRISIL Composite Bond Fund, Scheme Inception date is 26/05/2008. Mr. Deepak Agrawal has been managing thefund since 25/11/2012.
Kotak Gold ETF, *Name of the Benchmark - Price of Gold, Scheme Inception date is 27/07/2007. Mr. Abhishek Bisen has been managing the fund since 01/08/2008.
Kotak Gold Fund - Growth, *Name of the Benchmark - Price of Gold, Scheme Inception date is 25/03/2011. Mr. Abhishek Bisen has been managing the fund since 04/03/2011.
Kotak Bond - Regular Plan - Growth, *Name of the Benchmark - CRISIL Composite Bond Fund, Scheme Inception date is 25/11/1999. Mr. Abhishek Bisen has been managing the fundsince 01/04/2008.

TH
EPAG
EH
AS
BEEN
LEFT
INTEN
TIO
NALLY
BLAN
K