korean growth policy - brookings · pdf filerudiger dornbusch massachusetts institute of...
TRANSCRIPT

RUDIGER DORNBUSCH Massachusetts Institute of Technology
YUNG CHUL PARK Korea University
Korean Growth Policy
KOREA CONTINUES to be in the limelight as one of a handful of developing countries that have adjusted successfully to both the oil shocks of the 1970s and the debt shock of the early 1980s. Generally credited with the success is Korea's superior economic policy. In fact, Korea now serves as a model for the export-oriented strategy of development that multi- lateral institutions are urging on countries of Africa and Latin America. This paper reviews the role of policy in Korea's success thus far and investigates the current challenges facing government policymakers, in particular the emergence of a massive current account surplus. I
We have benefited from the comments of our discussants and members of the Brookings Panel. We would like to acknowledge especially the research support and advice we have received from Won-Am Park, Sung-Hee Jwa, and Choong-Soo Kim of the Korea Development Institute. This paper was prepared while Yung Chul Park was with the Korea Development Institute.
1. The Korean experience has led to a sizable recent literature of which the following are among the more important: Bijan B. Aghevli and Jorge Marquez-Ruarte, "A Case of Successful Adjustment: Korea's Experience During 1980-84," Occasional Paper 39 (International Monetary Fund, August 1985); S. Arndt, "Policy Adjustments Under Balance of Payments Equilibrium For the Republic of Korea" (American Enterprise Institute, March 1986); Bela Balassa and John Williamson, Adjusting to Success: Balance of Payments Policy in the East Asian NICs, Policy Analyses in International Economics 17 (Washington, D.C.: Institute for International Economics, June 1987); Robert Baldwin, "U.S. and Foreign Competition in the Developing Countries of the Asian Pacific Rim," Working Paper 2208 (National Bureau of Economic Research, April 1987); Thorkil Casse, The Non-Conventional Approach to Stability: The Case of South Korea: An Analysis of Macroeconomic Policy (Copenhagen: Center for Development Research, 1985); Susan Collins and A. W. Park, "Korean Macroeconomics and Debt" (National Bureau of Economic Research and Harvard University, 1987); Vittorio Corbo and Sang Woo Nam, "Korea's Macroeconomic Prospects and Major Policy Issues for the Next Decade,"
389

390 Brookings Papers on Economic Activity, 2:1987
Two broad questions about Korea's experience are particularly interesting.
-What explains the Korean adjustment success and growth perfor- mance? Have particular policies especially contributed to this success?
-Does Korea today have a structural external surplus? And should policy respond?
At a time when the world's developing countries, especially those in Latin America, are economically stagnant and debt-laden, Korea enjoys high growth, relatively low inflation, and a relatively equal distribution of income. It is the only major debtor that has overcome the debt problem and has done so with a vengeance: debt is being paid off, and the trade surplus is so large that it invites trade frictions.
Since 1968, the Korean nonfactor current account has shown an upward trend, interrupted only by the oil shocks of 1973 and 1979. Over the past five years the external balance has been steadily improving and in 1986-87 there was a sizable surplus. That surplus reflects a strong trade performance. Korea is making itself felt in the area of manufactures, competing with other industrial countries in the U.S. market.
Korea's success raises questions not only about how it might be transported to other developing countries but about how Korea affects and is affected by the industrialized countries, especially the United States. What, for example, are the effects of dollar-yen exchange rate movements without a corresponding movement in the dollar-won rate?
Report DRD276 (World Bank, 1987); World Bank, "The Recent Macroeconomic Evolution of the Republic of Korea: An Overview," Report DRD208 (World Bank, February 1987); Charles R. Frank, Kwang Suk Kim, and Larry E. Westphal, Foreign Trade Regimes and Economic Development: South Korea (Columbia University Press, 1975); Wontack Hong, Trade, Distortions and Employment Growth in Korea (Seoul: Korea Development Institute, 1979); Anne 0. Krueger, "The Importance of Economic Policy in Development: Contrasts Between Korea and Turkey," Working Paper 2195 (National Bureau of Economic Research, March 1987); Edward S. Mason and others, The Economic and Social Modernization of the Republic of Korea (Harvard University Press, 1980); Yung Chul Park, "Foreign Debt, Balance of Payments, and Growth Prospects: The Case of the Republic of Korea, 1965-1988," World Development, vol. 14 (August 1986), pp. 1019-58; Tibor Scitovsky, "Economic Development in Taiwan and South Korea: 1965-1981," in Lawrence J. Lau, ed., Models ofDevelopment:A Comparative Study ofEconomic Growth in South Korea and Taiwan (San Francisco: ICS Press and World Bank, 1986), pp. 135- 95; World Bank, Korea: Development in a Global Context (Washington, D.C.: World Bank, 1986); World Bank, Korea: Managing the Industrial Transition (Washington, D.C.: World Bank, 1987).

Rudiger Dornbusch and Yung Chul Park 391
If a won appreciation benefits primarily Japan and Taiwan, which as a result become more competitive in the U.S. market, should the United States seek more specifically targeted policy concessions from Korea, such as import liberalization in areas of particular interest to U.S. exporters? How much of the present Korean surplus is due to U.S. overspending and will vanish with budget correction, and how much, if any, should be eliminated by policy action? How much pressure for adjustments in their bilateral balance with the United States can Korea and other newly industrialized countries (NICs) expect? Will Korea follow policies and performance of Japan, steadily gaining share in world markets while maintaining the home market substantially closed?
This paper cannot answer all these questions. But it will set out answers to the two main questions about Korea's experience raised above and, in doing so, lay the groundwork for answering the wider range of questions one can ask about successful NICs concerning their role in the world economy in the coming years.
The paper falls broadly into three parts. The first part reviews Korean growth history and the structure of the economy. The second part offers explanations for Korea's superior performance. A central point is that Korean wages are exceptionally low by international standards, given the skill level of the labor force, and hence provide continuing scope for trade success. Finally, we argue that Korea may well tend toward a structural surplus. But we also argue that dramatic government action to eliminate the surplus would be premature. Uncertainties about the world economy, about domestic labor market developments, and about the forthcoming U.S. budget adjustments point to the possibility of a significant decline in the Korean current account surplus. Given that possibility and the obvious difficulty of reversing real appreciation or expansion once it has occurred, we conclude that policy initiatives should be limited to selective import liberalization. But we do see room for a major trade initiative in the direction of free trade with the United States.
A Review of Long-Term Performance
During the past thirty-five years Korean gross national product has increased more than sevenfold. Although the country remains poor by
392 Brookings Papers on Economic Activity, 2:1987
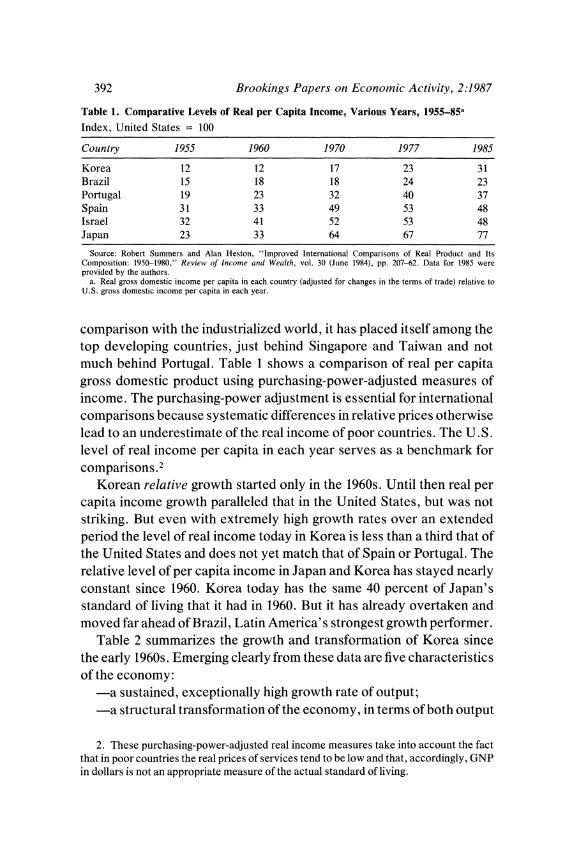
Table 1. Comparative Levels of Real per Capita Income, Various Years, 1955-85a
Index, United States = 100
Country 1955 1960 1970 1977 1985
Korea 12 12 17 23 31 Brazil 15 18 18 24 23 Portugal 19 23 32 40 37 Spain 31 33 49 53 48 Israel 32 41 52 53 48 Japan 23 33 64 67 77
Source: Robert Summers and Alan Heston, "Improved International Comparisons of Real Product and Its Composition: 1950-1980," Review of Income atid Wealth, vol. 30 (June 1984), pp. 207-62. Data for 1985 were provided by the authors.
a. Real gross domestic income per capita in each country (adjusted for changes in the terms of trade) relative to U.S. gross domestic income per capita in each year.
comparison with the industrialized world, it has placed itself among the top developing countries, just behind Singapore and Taiwan and not much behind Portugal. Table 1 shows a comparison of real per capita gross domestic product using purchasing-power-adjusted measures of income. The purchasing-power adjustment is essential for international comparisons because systematic differences in relative prices otherwise lead to an underestimate of the real income of poor countries. The U.S. level of real income per capita in each year serves as a benchmark for comparisons.2
Korean relative growth started only in the 1960s. Until then real per capita income growth paralleled that in the United States, but was not striking. But even with extremely high growth rates over an extended period the level of real income today in Korea is less than a third that of the United States and does not yet match that of Spain or Portugal. The relative level of per capita income in Japan and Korea has stayed nearly constant since 1960. Korea today has the same 40 percent of Japan's standard of living that it had in 1960. But it has already overtaken and moved far ahead of Brazil, Latin America's strongest growth performer.
Table 2 summarizes the growth and transformation of Korea since the early 1960s. Emerging clearly from these data are five characteristics of the economy:
a sustained, exceptionally high growth rate of output; a structural transformation of the economy, in terms of both output
2. These purchasing-power-adjusted real income measures take into account the fact that in poor countries the real prices of services tend to be low and that, accordingly, GNP in dollars is not an appropriate measure of the actual standard of living.

Rudiger Dornbusch and Yung Chul Park 393
Table 2. Macroeconomic and Structural Patterns, Korea, Various Periods, 1963-86
Percent
Measure 1963-73 1974-80 1981-86
Annual inflation ratea 16.6 21.9 6.0
Annual real GNP growth rate 9.7 7.2 8.7 Manufacturing product 19.7 14.1 10.0
Share in GNP Agricultureb 35.2 20.9 15.6 Manufacturingc 15.7 28.0 33.1 Other 49.1 51.1 5i.3
Share in employment Agricultureb 54.5 41.2 28.6 Manufacturingc 12.6 21.5 23.5 Other 32.8 37.2 47.9
Exports as share of GNP 14.5 30.6 38.6 Taxes as share of GNP 11.8 16.8 19.2 Investment as share of GNP 22.0 30.4 30.2 Foreign saving as share of GNP 8.3 7.2 4.3
Source: Bank of Korea, Econiomic Statistics Yearbook, various issues. a. GDP deflator. b. Includes forestry and fishing. c. Includes mining.
and employment, with a substantial decline in agriculture, a rise in manufacturing, and a growing importance of trade;
-a significant increase in public sector resources; -a sustained high rate of investment; and -large, but declining, external financing. A striking characteristic of the Korean economy is the growing share
of exports in GNP and the changing composition of its trade. Table 3
shows that in little more than twenty years Korea moved from being a commodity exporter to being a net importer of commodities and an exporter of manufactures.
The reorientation of the economy toward trade is equally apparent in import penetration and export ratios. In manufacturing, the ratio of exports to total production increased during 1970-83 from 11 percent to 21 percent, while the import content of the m-anufacturing sector rose from 17.3 percent to 22.2 percent. The ratio of imports to domestic production in the manufacturing sector has declined over the past fifteen years from almost 20 percent to only 15 percent.3
3. The import ratio is defined as the ratio of imported intermediate goods to domestic production. The data come from Bank of Korea, Input-Ouitput Tables, various issues.

394 Brookings Papers on Economic Activity, 2:1987
Table 3. Composition of Exports and Imports, Korea, 1962, 1970, 1985
Percent of total
1962 1970 1985
Indiustry Exports Imports Exports Imports Exports Imports
Commodities and processed foodsa 75.6 33.7 21.5 37.3 5.1 17.5 Mineral fuelsb 5.0 7.3 1.0 6.9 3.1 23.6 Chemicalsc 1.8 22.4 1.4 8.3 3.1 9.0 Manufactured goodsd 17.6 36.6 76.1 47.6 88.7 49.9
Machinery and transport equipment 2.6 16.5 7.4 29.7 37.6 34.2
Source: Bank of Korea, Economic Planning Board (EPB), Maijor Statistics of Korean Economy,, various issues. Numbers may not add to totals because of rounding.
a. Standard industrial trade classification (SITC) 0-2 and 4. b. SITC 3. c. SITC 5. d. SITC 6-9.
Finally, scarcely less remarkable than Korea's transformation is that it took place under conditions of relatively modest inflation. In the past twenty years inflation averaged 9 percent a year and reached a maximum of 30 percent. The inflation was comparable to that of the United Kingdom or Italy, very remote from the Latin American experience of inflation rates of 100 percent, as in Mexico, or the 1,000 percent plus of Brazil or Argentina. Moreover, for the past few years inflation has been less than 3 percent.
Explaining Successful Growth and Transformation
Economists and policymakers seeking to apply the lessons of Korea's success to poorly performing countries in Latin America should note that the recipe is definitely not simply "hands off, give free reign to market forces." Government intervention has been intense, and restric- tions on trade and capital flows are the rule. Thus if any general description is appropriate, it is that the government has for the most part run a tight ship, sailing very close to the wind. In the appendix we review the main phases of Korean economic history and the directions of policy since the 1950s. In this section we identify policies that have spurred high growth.
BROAD EXPLANATIONS FOR KOREA S GROWTH
In identifying the differences or similarities between Korea and developing countries in Latin America, a summary comes easily. Korea's

Rudiger Dornbusch and Yung Chul Park 395
Table 4. Macroeconomic Performance, Korea and LDCs, Selected Periods, 1967-85 Percent per year
Middle Latin Measure Africa Asia Eu,opea East America Korea
Inflation 1967-76 8.5 9.4 9.0 8.7 24.5 7.2 1977-85 17.2 7.9 25.1 14.1 77.6 11.1
Real GDP growth 1967-76 5.0 5.2 6.0 9.3 5.9 10.3 1977-85 1.9 6.5 3.1 0.7 2.6 6.4
Sources: International Monetary Fund, World Economic Ouitlook, various issues, and EPB, Major Statistics of Korean Econo,ny, various issues. Averages of country growth rates are weighted by the average U.S. dollar value of GDPs over the preceding three years.
a. Developing countries in Europe, that is, Southern Europe including Portugal, Spain, Greece, and Yugoslavia.
labor force is better trained and works harder. Its people save more and borrow wisely. Policies are perhaps as activist but not grossly mis- directed. Budget deficits are moderate, and the real exchange rate rarely gets overvalued. The differences add up to a performance strikingly better than that of Latin America, though not that of other South East Asian countries, as table 4 shows.
Korea has not been without macroeconomic difficulties. In 1980-81, in the aftermath of the second oil shock, inflation increased sharply, output declined, and the external balance was in disarray. Korea is also a major LDC debtor. But, unlike the less successful countries, Korea never allowed these problems to get far out of hand, or for long. Adjustment invariably came rapidly, before economic agents became accustomed and adjusted to instability and inflation.
Economists have tried to come up with a generalized recipe for growth that might explain why some countries prosper in spite of adversity while others do not. In an authoritative review of what is known about growth successes, Dervis and Petri compare a group of seven high- growth countries (Taiwan, Korea, Brazil, Thailand, Portugal, Greece, and Yugoslavia) with a group of thirteen less successful cases, ranging from Turkey down to the Ivory Coast. For the period 1965-85 the more successful group shows annual per capita growth of 5.0 percent, as against only 2.5 percent for the less successful group. Dervis and Petri conclude that no single explanation sets winners apart from the rest. They note:
Countries that grew rapidly throughout the past two decades have had to excel in several dimensions. Early on, high rates of investment and favorable domestic
396 Brookings Papers on Economic Activity, 2:1987
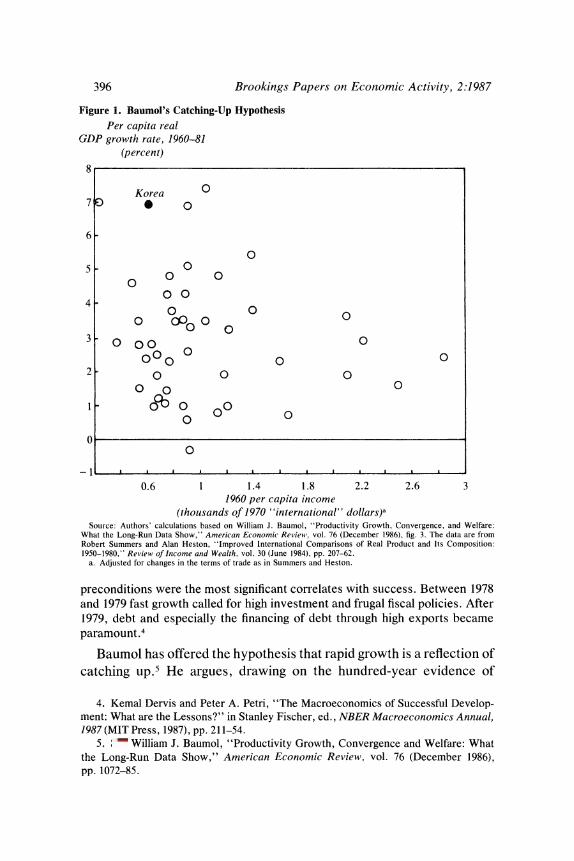
Figure 1. Baumol's Catching-Up Hypothesis Per capita real
GDP growth rate, 1960-81 (percent)
8
Korea ? 7 .)
6-
0 5 0 0
o 0 0 0 4OO 4 - 0 00 0 c00 o 0
3 000 0
000 0 0 2 -o o0
0 0 0
1 gco 0? 0 00
G 0
0.6 1 1.4 1.8 2.2 2.6 3 1960 per capita income
(thousands of 1970 "international" dollars)a Source: Authors' calculations based on William J. Baumol, "Productivity Growth, Convergence, and Welfare:
What the Long-Run Data Show," American Economic Reviewt', vol. 76 (December 1986), fig. 3. The data are from Robert Summers and Alan Heston, "Improved International Comparisons of Real Product and Its Composition: 1950-1980," Review of Income and Wealth, vol. 30 (June 1984), pp. 207-62.
a. Adjusted for changes in the terms of trade as in Summers and Heston.
preconditions were the most significant correlates with success. Between 1978 and 1979 fast growth called for high investment and frugal fiscal policies. After 1979, debt and especially the financing of debt through high exports became paramount.4
Baumol has offered the hypothesis that rapid growth is a reflection of catching up.' He argues, drawing on the hundred-year evidence of
4. Kemal Dervis and Peter A. Petri, "The Macroeconomics of Successful Develop- ment: What are the Lessons?" in Stanley Fischer, ed., NBER Macroeconomics Annual, 1987 (MIT Press, 1987), pp. 211-54.
5. See William J. Baumol, "Productivity Growth, Convergence and Welfare: What the Long-Run Data Show," American Econonmic Review, vol. 76 (December 1986), pp. 1072-85.

Rudiger Dornbusch and Yung Chul Park 397
Table 5. Sources of Economic Growth in Korea, 1963-82 Percent per year
Measure 1963-72 1972-82
Real GDP 8.2 8.0 Total factor input 4.2 5.6
Labor 3.1 3.5 Capital 1.1 2.1
Output per unit of input 4.0 2.4
Sources: Korea Development Institute, Quarterly Economic Review (Seoul: KDI, 1986), p. 33; and K. S. Kim and J. K. Park, Souirces of Economic Growth in Korea: 1963-1982 (Seoul: KDI, 1985), pp. 61-62.
industrial countries, that there is a tendency toward convergence: the countries with the lowest levels of productivity have the highest rates of growth. An essential ingredient for their high growth is the ability to take advantage of existing knowledge and technology. Since that process is subject to diminishing returns, convergence ultimately sets in and the catching-up countries slow to the common rate of long-term growth of the most advanced countries.
Figure 1 shows per capita income in 1960 and income growth during 1960-81 for a group of middle-income countries ranging from Lesotho to Greece, Portugal, and Spain. Although Korea supports the Baumol hypothesis, the entire sample does not.
Absent a single broad explanation for growth, we turn to look more closely at the individual building blocks of Korea's success. As a preliminary, we briefly review Denison-style growth accounting for Korea. Table 5 reports estimates of the sources of growth in Korea between 1963 and 1982. More than half the growth rate of output is explained by increases in factor inputs, labor and capital. Slightly less than half is due to growth of total factor productivity, which depends mainly on scale economies and advances in knowledge.
In our view, the cornerstone of Korean growth is a highly trained and productive labor force whose wages are low by international standards. Korea's labor force is a precondition for the high rates of investment and capacity expansion that make the export expansion possible.
THE LABOR FORCE AND WAGES
The broadest, vaguest explanation for Korea's success draws atten- tion to the people, the extent of their work effort, their education, and the distribution of income among them.

398 Brookings Papers on Economic Activity, 2:1987
Table 6. Hours of Work in Manufacturing,1960-85
Hours per week
United P'eriod Korea Greece Mexico Japan States Germany
1960-69 55.5a 43.9 45.9 45.4 40.6 44.0 1970-79 51.8 42.9 45.6 41.1 40.1 42.1 1980-85 53.8 39.1 46.1 41.2 40.0 40.9
Source: International Labor Office, Yearbook of Labor Statistics, various issues. a. Average for 1963-69.
Table 6 shows weekly work hours in Korea and a number of other countries. The simple fact is that Koreans work longer. The Korean work week, which has actually increased since the 1970s, is 35 percent longer than that in industrialized countries and 17 percent longer than that in Mexico. The extent of work effort is described by Hong in the following terms: "Even nowadays, a typical Korean white collar worker leaves home before 7 o'clock in the morning and leaves his office after 8 o'clock in the evening every day. . .. He usually works late on Saturday afternoons and, if something goes wrong, has to go to work on Sunday. " 6
During the several decades of Japanese occupation before World War II, Korean citizens suffered from a poor educational system. In response, they placed an enormous value on education in the reconstruc- tion period following independence and the Korean War. The commit- ment to education has, if anything, increased over the years. The average education level of employed males was 7.2 years in 1960, 9.3 years in 1970, and 10.3 years in 1980.7 Table 7 shows an international comparison of enrollment levels in secondary schools and higher education. In 1960 Korea already exceeded by a substantial margin the average for upper- middle-income countries. By 1983 the country was well on the way to educational standards of industrial countries.
6. See Wontack Hong, "Export-Oriented Growth of Korea: A Possible Path to Advanced Economy," Seminar Paper 382 (Institute for International Economics, Stock- holm University, 1984).
7. These data refer to male employees in the nonagricultural sector. The corresponding numbers for the entire labor force are 4.2, 6.4, and 8.0. The data come from K. S. Kim and J. K. Park, Sources of Economic Growth in Korea: 1963-1982 (Seoul: Korea Development Institute, 1985), p. 18.

Rudiger Dornbusch and Yung Chul Park 399
Table 7. Educational Enrollment Levels, 1960 and 1983
Secondary school Higher education (percent of (percent of age group) age group)
Countuy 1960 1983 1960 1983
Middle-income countries Lower 10 40 3 12 Upper 20 55 4 14
Industrial countries 64 85 16 37 Korea 27 89 5 24
Source: World Bank, World Develop,nenit Report, 1983 and 1986 (World Bank, 1983 and 1986).
Until recently, labor unrest and union activity have not been major issues in Korea. Cultural characteristics may contribute to peaceful labor relations, and politics, certainly, has left little room for organized labor and even less for union militancy. But government policy has also helped bring about a relative equality in income distribution that may have helped avoid labor problems.
Improvements in Korean income distribution since 1965, shown in table 8, are the result of strong growth in employment, and hence declining unemployment. Exactly how income distribution has influ- enced growth, other than by promoting social stability, is open to discussion. But it would certainly shape the domestic market firms face, it may influence saving behavior, must influence politics, and may have important implications for the ease with which the government can shift economic policies.
Rapid economic growth is often accompanied by a deterioration in
Table 8. Income Distribution, Korea, Various Years, 1965-85 Percent
Item 1965 1970 1980 1985
Rural households Income share of bottom 40 percent 22.6 21.2 17.5 19.7 Income share of top 20 percent 38.0 38.6 42.2 38.7 Percent below poverty linea 10.0 3.4 11.2 7.5
Urban households Income share of bottom 40 percent 14.1 18.9 15.3 16.7 Income share of top 20 percent 47.0 43.0 46.9 45.6 Percent below poverty linea 17.9 7.0 15.1 7.8
Source: Korea Development Institute. a. Poverty line defined as one-third of average household income.

400 Brookings Papers on Economic Activity, 2:1987
Table 9. Income Distribution Comparison
Percent
Hong Population Koreaa Brazilb Mexicoc Thailandd Konge Hungary' Spaing
Income share of bottom 40 percent 16.9 7.0 9.9 15.2 16.2 20.5 19.4
Income share of top 20 percent 45.3 66.6 57.7 49.8 47.0 35.8 40.0
Source: World Bank, World Developmenit Report, 1986. a. 1976. b. 1972. c. 1977. d. 1975-76. e. 1980. f. 1982. g. 1980-81.
income distribution due to shortages of skilled and educated labor. Korea experienced these shortages to some extent in the 1970s, but the expansion of education since the 1950s may have helped contain adverse consequences for growth.
Income distribution in Korea is similar to that in other East Asian NICs and in developed countries. It is extraordinarily different from that in Latin America, as table 9 shows.
A final dimension that is much harder to quantify is entrepreneurship. Korea has rapidly built up large, Japanese-style production and trading conglomerates. But Korean growth and export success also has de- pended on massive gambles, especially in the late 1970s. The outward- looking strategy would not have succeeded without Korea's dynamic and highly trained entrepreneurs, yet another legacy of Korea's com- mitment to education.8
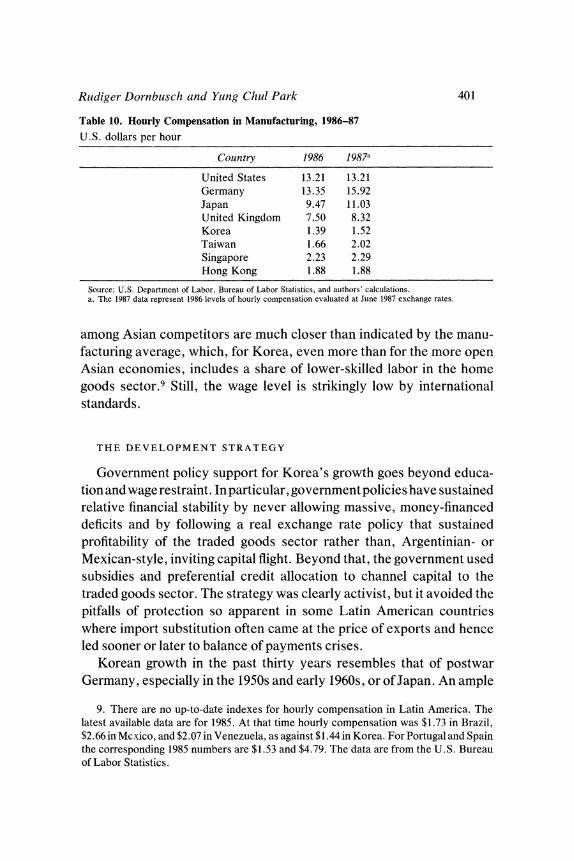
The punch line in this discussion of the labor force appears in table 10. As that comparison of hourly compensation in major industrialized countries and in Korea, Taiwan, and Singapore shows, Korea's dollar wage is the lowest of all. The data in that table must be somewhat qualified, however, because wages differ significantly from one industry to another. In some export-sector industries, wages in 1986 were significantly higher than those shown in the table and much closer to the corresponding wages in Taiwan. For example, in 1986 in the iron and steel sector the Korean wage was $2.17, as against $2.29 in Taiwan; in motor vehicles and equipment manufactures the Korean wage was $2.12, compared with $2.21 for Taiwan. Thus in the traded goods sector, wages
8. See Noel F. McGinn and others, Education and Development in Korea (Harvard University Press, 1980).
Rudiger Dornbusch and Yang Chul Park 401
Table 10. Hourly Compensation in Manufacturing, 1986-87
U.S. dollars per hour
Country 1986 1987a
United States 13.21 13.21 Germany 13.35 15.92 Japan 9.47 11.03 United Kingdom 7.50 8.32 Korea 1.39 1.52 Taiwan 1.66 2.02 Singapore 2.23 2.29 Hong Kong 1.88 1.88
Source: U.S. Department of Labor, Bureau of Labor Statistics, and authors' calculations. a. The 1987 data represent 1986 levels of hourly compensation evaluated at June 1987 exchange rates.
among Asian competitors are much closer than indicated by the manu- facturing average, which, for Korea, even more than for the more open Asian economies, includes a share of lower-skilled labor in the home goods sector.9 Still, the wage level is strikingly low by international standards.
THE DEVELOPMENT STRATEGY
Government policy support for Korea's growth goes beyond educa- tion and wage restraint. In particular, government policies have sustained relative financial stability by never allowing massive, money-financed deficits and by following a real exchange rate policy that sustained profitability of the traded goods sector rather than, Argentinian- or Mexican-style, inviting capital flight. Beyond that, the government used subsidies and preferential credit allocation to channel capital to the traded goods sector. The strategy was clearly activist, but it avoided the pitfalls of protection so apparent in some Latin American countries where import substitution often came at the price of exports and hence led sooner or later to balance of payments crises.
Korean growth in the past thirty years resembles that of postwar Germany, especially in the 1950s and early 1960s, or of Japan. An ample
9. There are no up-to-date indexes for hourly compensation in Latin America. The latest available data are for 1985. At that time hourly compensation was $1.73 in Brazil, $2.66 in Mexico, and $2.07 in Venezuela, as against $1.44 in Korea. For Portugal and Spain the corresponding 1985 numbers are $1.53 and $4.79. The data are from the U.S. Bureau of Labor Statistics.

402 Brookings Papers on Economic Activity, 2:1987
supply of labor, first from agriculture and subsequently through migrant workers, put steady pressure on wages, and policy, too, discouraged extravagant wage settlements. As a result, wages that were low relative to productivity translated into profitability, high investment, and sus- tained growth. 10 Low relative wages and high investment assured pro- ductivity growth and hence steady, high growth of real wages, as shown for Germany and Japan in table 11.11
Despite the broad similarities in the wage-productivity relationship of Germany and Japan, policies in the two countries were not quite the same. Both successfully pursued wage restraint, a "realistic" exchange rate policy, and, as we will see below, a current account surplus. But Germany relied more on import liberalization, both unilaterally and in the context of the Common Market, while Japan never opened up in manufacturing. Japan's growth lasted through the 1960s and into the early 1970s. In Germany, real wage demands and a strong emphasis on consumption in the mid- 1960s marked the end of the high-growth phase.
Today Korea stands roughly in the same position relative to the United States in which Japan stood in 1960. The standard of living is one-third that of the United States, and the level of hourly compensation is about one-tenth. Like Japan in the 1950s and 1960s, South East Asia, and Korea in particular, practices wage restraint, high saving, and high investment. The strategy delivers highgrowthrates of realwages because productivity growth invariably runs slightly ahead of wage increases at the competitive margin.
We consider next how exchange rate policy and subsidy and credit policies helped reinforce this growth strategy.
Outward-Oriented Growth. Japan has developed with a nearly con- stant ratio of exports to GNP. In Korea, by contrast, the export-GNP ratio increased from less than 6 percent in the early 1960s to around 40 percent in the 1980s. Korea's German-style "outward-oriented" strat- egy is the characteristic of its development most commonly singled out as the key to success. Rather than pushing inefficient import substitution for its small domestic market, Korea has opted for outward-oriented
10. Herbert Giersch, "Arbeit, Lohn und Produktivitat," Weltwirtschaftliches Archiv, vol. 119, no. 1 (1983), pp. 1-18, has discussed extensively this paradigm for the case of Germany.
11. By comparison the average annual growth rate of unit labor costs in the United States during 1950-65 was 1.9 percent.

Rudiger Dornbusch and Yaing Chul Park 403
Table 11. Growth in Manufacturing in Germany and Japan, 1950-65
Percent per year
Dollar unit Real Countiy Productivity Emnployment labor cost wagesa Investmentb
Germany 7.0 3.3 2.8 7.2 22.8 Japan 7.2 5.7 1.4 5.7 26.8
Source: U.S. Department of Labor, Bureau of Labor Statistics. a. Hourly compensation deflated by the CPI. b. Gross fixed capital formation as a fraction of GNP; Japan, 1952-64, Germany, 1950-64.
growth. Except in 1979-81, government policy has avoided an overval- ued exchange rate. By standing in the way of a strong union movement, the government sanctioned the market pressure on wages generated by the rural-to-urban labor migration. Wages thus rose slowly despite strong productivity growth in manufacturing. Growth in employment and continuing profitability of the export sector rather than much faster growth in manufacturing real wages were the result. Industrial policy and protection combined to yield an incentive structure that favored an export-oriented industrialization.
Korea's policies clearly do not represent a laissez-faire approach: intervention in the form of trade restrictions, subsidies, and credit allocation is pervasive.12 Intervention has also been used in Latin America, but with mixed results. In the 1930s Latin America developed import substitution as a response to the Great Depression. As Angus Maddison documents, the import-substitution strategy was initially successful: Latin America grew, whereas industrial countries stag- nated.13 But following World War II further import substitution ran into
12. See Anne 0. Krueger, The Developmental Role of the Foreign Sector and Aid (Harvard University Press, 1979); Krueger, "Export-led Industrial Growth Reconsid- ered," in Wontack Hong and Lawrence B. Krause, eds., Trade and Growth of the AdvancedDeveloping Countries in the Pacific Basin (Seoul: Korea Development Institute, 1981), pp. 3-27; Krueger, Trade and Employment in Developing Countries: Synthesis and Conclusions (University of Chicago Press, 1983); Krueger, "The Importance of Economic Policy in Development"; Deepak Lal, "Ideology and Industrialization in India and East Asia," Report DRD218 (World Bank, January 1986); Deepak Lal and Sarath Rajapatirama, "Foreign Trade Regimes and Economic Growth in Developing Countries," Report DRD 217 (World Bank, September 1986); and Wontack Hong, "Export-Oriented Growth in Korea," for discussions of the outward-oriented model as applied in Korea.
13. See Angus Maddison, Two Crises: Latin America and Asia: 1929-1938 and 1973- 1983 (Paris: Organization for Economic Cooperation and Development, 1985).

404 Brookings Papers on Economic Activity, 2:1987
the limitations of overly small domestic markets. Moreover, increasingly pervasive import protection soon became an impediment to exports. Slow growth, overvalued exchange rates, and inefficient industries were the legacy of that policy everywhere except Brazil. Perhaps because of its larger domestic market, Brazil successfully used protection to build up a highly efficient industrial structure. Brazil also, unlike other Latin American countries, avoided the external bottlenecks that arise from implicit taxes on exports. Exchange rate and tax policies strongly supported exports and thus avoided recurrent payments crises with their adverse macroeconomic effects on confidence, inflation, and recession.
The Korean strategy is much the same, with pervasive protection of an infant-industry kind going hand in hand with favorable treatment of the export sector through tax incentives and credit. The economy thus maintains a constant active contact with the world economy on both the import and export side. Korea goes further in its outward orientation by allowing firms to take advantage of intermediate goods imports to enhance their export competitiveness.
Such an outward-oriented strategy is supported by the efficiency advantage of freer trade over a restrictive trade regime. Export promo- tion is more closely related to free trade than is import substitution. In addition, the effects of enlarged trade on saving and investment, and on technology and firms' behavior, and the possibility of structural change coming from opening industries to world markets all add to the argument for export promotion.14 However, while the high positive correlation between export performance and economic growth is an accepted fact in development economics, recent studies fail to confirm that the former causes the latter. 15
14. See W. M. Corden, "The Effects of Trade on the Rate of Growth," in Jagdish N. Bhagwati and others, eds., Trade, the Balance of Payments and Growth: Papers in International Economics in Honor of Charles P. Kindleberger (Amsterdam: North- Holland, 1971), pp. 117-43; Krueger, "Export-led Industrial Growth Reconsidered"; and Hong, " Export-Oriented Growth of Korea."
15. Bela Balassa, "Exports and Economic Growth: Further Evidence," Journal of Development Economics, vol. 5 (June 1978), pp. 181-89; Corden, "The Effects of Trade on the Rate of Growth"; A. F. Darrat, "Are Exports an Engine of Growth? Another Look at the Evidence," Applied Economics, vol. 19 (February 1987), pp. 277-83; Hong, Trade, Distortions and Employmnent Growth in Korea; Wontack Hong, "Import Restriction and Import Liberalization in Export-Oriented Developing Economy" (Korea Development Institute, 1986); Hong, " Export-Oriented Growth and Trade Patterns of Korea," in Colin
Rudiger Dornbusch and Yung Chul Park 405
The chief difference between the Korean strategy of outward-oriented growth and the failed import-substitution policies in Latin America in the 1950s is that in Latin America protection was too comprehensive, and too little attention was paid to the possibility of exporting manufac- tures to complement import substitution. The policy became inefficient in part because high value added sectors (at world prices) were sacrificed, but perhaps even more because the export sector atrophied. The Latin economies were therefore more crisis prone, and their macroeconomic performance worsened.
In Korea, an industrialization strategy that began as pure import substitution, with aid financing the trade gap, expanded to include export promotion. By around 1960, Korea had virtually exhausted the possibil- ity of rapid growth through import substitution of nondurable consumer goods and intermediate inputs. Additional import substitution of ma- chinery, consumer durables, and their intermediate inputs was rejected because the domestic market was too small and the capital requirements of such ventures too large, especially given the chronic shortage of foreign exchanges.
The rationale for protecting infant industries is that industries of high growth potential but subject to externality stemming from market imperfection, economies of scale, or capital market imperfection deserve encouragement, preferably by production subsidies but, second best, by protection. That argument provides the underlying logic as much for import substitution as for export promotion. Korea has operated on both fronts. It has used tariffs and licensing to create a sheltered market for the development of infants. And as these industries have developed, Korea has turned them toward the world market by subsidies, credit, and exchange rate policy. The credit system has channeled financial resources at subsidized rates to preferred activities. The tax system has provided an exemption from import duties for export content (often
I. Bradford and William H. Branson, eds., Trade and Structural Change in Pacific Asia (University of Chicago Press, 1986), pp. 273-305; Woo S. Jung and Peyton J. Marshall, "Exports, Growth and Causality in Developing Countries," Journal of Development Economics, vol. 18 (May-June 1985), pp. 1-12; Rostam M. Kavoussi, "Export Expansion and Economic Growth: Further Empirical Evidence," Journal of Development Econom- ics, vol. 14 (January-February 1984), pp. 241-50; Michael Michaely, "Exports and Growth: An Empirical Investigation," Journal of Development Economics, vol. 4 (March 1977), pp. 49-53.

406 Brookings Papers on Economic Activity, 2:1987
amounting to much more than a drawback), favorable tax rates on profits and incomes, and direct cash subsidies. The implicit subsidy, from all sources, per dollar export is shown in table 12. The table separates net export subsidies and gross; the latter include exemptions from indirect taxes and tariffs.
The combined effect of the tax system and the credit system is difficult to estimate, in part because various activities even within a given sector are treated differently. In a system with preferential credit allocation, at least as important as the rate of interest is where the credit goes. Because the export sector receives a major share of available official credit, the subsidy data in table 12 are surely underestimated.
As an economy becomes more industrialized and more advanced, conflicts between import substitution and an active export sector in- crease. Exporters often require access to lower-cost or higher-quality inputs of intermediate goods than the home market can yet deliver. In that situation, protection must be flexible. Korea moved in that direction in the early 1980s when it opened its markets to certain imports crucial to the export sector, while continuing to protect infant industries.
Exchange Rate Policy. A policy of export-led growth would in most circumstances include a wage in dollars that, in combination with technology, capacity, and productivity, would make a country highly competitive. At first sight it might appear that wage and exchange rate policies in Korea did not in fact combine to produce this result. Figure 2 shows Korean unit labor costs in dollars relative to an average of U.S. and Japanese dollar unit labor costs. The index nearly doubled between 1973 and 1979, and the real depreciation of the won in the early 1980s rolled back only a small part of the increase. The sharp increase in Korean relative unit labor costs during 1973-79 might suggest that competitiveness must have suffered, but the trade performance indicates no such thing.
The explanation is that Korean hourly compensation in manufacturing remains even today extraordinarily low by comparison with that in industrialized countries. In a considerable range of activities, productiv- ity differentials may now be negligible. The existing wage differential thus represents an open invitation for industrial expansion and export expansion. As new industries open up, implementing foreign technology and drawing on the world capital market for financial resources to finance capital expansion, a rise in the average relative unit labor cost is

Rudiger Dornbusch and Yung Chul Park 407
Table 12. Export Subsidies, Korea, 1961-80
Percentage subsidy per dollar foreign exchange
Subsidy 1961-69 1970-79 1980
Gross 25.3 22.2 21.3 Net 12.8 3.3 3.3
Sources: Larry E. Westphal and Kwang-Suk Kim, "Korea," in Bela Balassa, ed., Development Strategies in Semi-Induistrial Economies (Washington, D.C.: World Bank, 1982), pp. 212-79; C. H. Nam, "Trade, Industrial Policies and the Structure of Protection in Korea," in Wontack Hong and Lawrence B. Krause, eds., Trade and Growth of the Advanced Developing Countries in the Pacific Basin (Seoul: Korea Development Institute, 1981), pp. 168-89; and Kwang-Suk Kim, "The Timing and Sequencing of a Trade Liberalization Policy-The Case of Korea" (Seoul: Korea Development Institute, 1986).
warranted. Policy has pushed industries into ranges of increasing value added rather than pulling labor out of such industries as, say, textiles or rubber footwear. Thus if labor is being reallocated toward production of cars and electronics, away from low value added activities, export competitiveness survives even with rising unit labor costs.
This point can be developed in terms of a Ricardian model of export of technology, as shown in figure 3.16 The model determines for a two- country world the equilibrium relative wage and the geographic pattern of specialization. Let w/w* be the wage of the poor country relative to the rich one and let A(z) = a*(z)la(z) represent the relative unit labor requirement of commodity z in the rich country relative to that in the poor country. Along the vertical axis we measure the relative wage w/w* and the relative unit labor requirements, a*(z)la(z). Along the horizontal axis we align the range of goods, z, with the poor country relatively more efficient in the production of commodities nearer the origin.
Geographic specialization is determined by relative unit labor costs. The home country will produce all those goods for which unit labor costs are less than the unit labor cost of the same good produced abroad. Thus for a particular good z, production will be at home if wa(z) < w*a*(z).
16. R. Dornbusch, S. Fischer, and P. A. Samuelson, "Comparative Advantage, Trade, and Payments in a Ricardian Model with a Continuum of Goods," American Economic Review, vol. 67 (December 1977), pp. 823-39; Paul Krugman, "A Model of Innovation, Technology Transfer and the World Distribution of Income," Journal of Political Econ- omy, vol. 87 (April 1979), pp. 253-66; Krugman, "Technology Gaps, Technology Trans- fers, and the Changing Character of U.S. Trade" (MIT, 1982); Krugman, "A Technology Gap Model of International Trade" (MIT, 1982); and Susan M. Collins, "Technical Progress in a Three-Country Ricardian Model with a Continuum of Goods," Journal of International Economics, vol. 19 (August 1985), pp. 170-79.

408 Br-ookings Papers on Economic Activity, 2:1987
Figure 2. Relative Unit Labor Costs, Korea, 1964-86a
Index, 1980 = 100
110
100 -
90
80
70-
60 -
50 1965 1970 1975 1980 1985
Source: U.S. Department of Labor, Bureau of Labor Statistics. a. Korean manufactturing unit labor costs in dollars relative to an average of U.S. and Japanese unit labor costs.
For a given relative wage, w/w*, we thus obtain the competitive margin between production at home and abroad. But the relative wage is endogenous and is determined by demand and relative levels of spending. Demand conditions are shown by the schedule OB, along which demand for domestically produced goods is equal to the full-employment supply. An increase in the range of goods produced by the home country (moving along the horizontal axis to the right) creates an excess demand for labor and hence leads to an increase in the equilibrium relative wage. Point E represents the general equilibrium where goods markets clear and production occurs in the lowest-cost location. The home country pro- duces goods in the range Ozo, and the foreign country, the range of products to the right of zo.
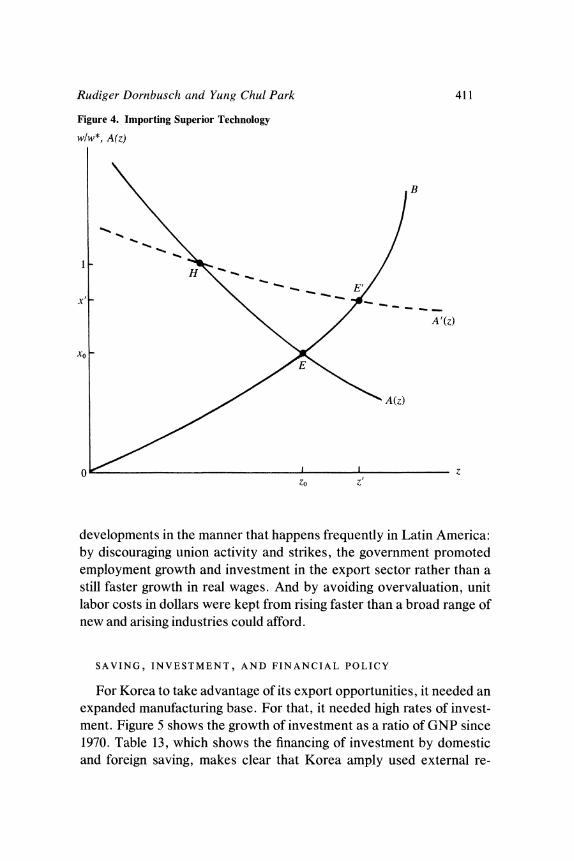
We now use this framework to ask what happens to relative wages and to trade patterns when superior foreign technology is introduced in the poor country. At point H in figure 4, w/w* = 1; at the initial equilibrium at point E, wlw* < 1, and the foreign country has superior technology for goods that the poor country is already producing. As this

Rudiger Dornbusch and Yung Chul Park 409
Figure 3. The Ricardian Model
wlw*, A(z)
B
(w/w*)o l ___ _ _ _
I A(z)
G Zo
technology is imported, the poor country's relative unit labor require- ment declines and the A(z) schedule rotates upward. The improved technology reduces labor costs in the export industry and allows the poor country to expand the range of goods it can competitively produce. But the attempt to expand the export sector inevitably creates an excess demand for labor and hence leads to a rise in the relative wage. A new trade equilibrium results at point E' with an increase in the relative wage from xo to x' and an expansion from zo to z' in the range of goods produced in the poor country.
Now consider what the import of superior technology does to unit labor costs. For marginal industries the relative unit labor cost of the poor country declines. This is true, for example, near point E'. But it is not necessarily true for the average. For activities to the left of point H there is no change in technology and a rise in the average relative wage.

410 Brookings Papers on Economic Activity, 2.]1987
Hence it is quite possible in this model that a country shows a rise in its relative unit labor cost and yet shows a gain in competitiveness and hence an expansion in the range of goods produced. 17
Indeed, the larger the gain in relative unit labor costs, the larger the loss to the rich country from its export of technology. The reason is that traditional export industries that have not benefited from the transfer of technology now pay higher wages. As Korea, for example, moves into cars and computers as a result of productivity gains, other tradable sectors experience increased costs and hence charge higher prices. In a multicountry context Korea is a middle-income country, whose gain in productivity has spillover effects on poorer countries who now gain in competitiveness in the middle-income country's traditional export sec- tors. 18
There are several other ways in which a NIC can become more export competitive and yet show a rise in the relative unit labor cost. Each complements the technology-transfer explanation. One obvious possi- bility is reduced-cost access to imported intermediate goods. Here the tax incentives and credit subsidies already discussed clearly play a role. Another possibility is to become a supplier of intermediate goods in more advanced countries. The final possibility is to move in Japan's tracks, picking up industries that in Japan have become overly costly.
The explanations drawn from Ricardian trade theory are particularly suitable for Korea because they highlight productivity growth, which has played such a central role in Korea's growing export competitive- ness. But to what extent are these results the outcome of market forces and to what extent do they depend on policies? Since the early 1970s Korea has experienced both a rising share of exports in GDP and an increasing share in world manufactures exports. From 1973 to 1985 Korea's manufactures exports increased in volume terms at an annual average rate of 14.6 percent, while its share in the manufactures exports of developing countries rose from 11 percent to 18.5 percent.19 Wage and exchange rate policy did not stand in the way of these market
17. When there is a nontraded manufacturing sector without productivity growth, the presumption that the average relative unit labor cost rises is further strengthened.
18. See Collins, "Technical Progress," for a model that develops these effects in a three-country setting.
19. See United Nations, General Agreement on Tariffs and Trade, International Trade 1985-86 (GATT, 1986), p. 16.
Rudiger Dornbusch and Yung Chul Park 411
Figure 4. Importing Superior Technology
wlw*, A(z)
B
\ / ~~~~~~~~A'(z)
/ \ ~~~~~~A(z)
0L I z
1-%~~~~~~~~z
developments in the manner that happens frequently in Latin America: by discouraging union activity and strikes, the government promoted employment growth and investment in the export sector rather than a still faster growth in real wages. And by avoiding overvaluation, unit labor costs in dollars were kept from rising faster than a broad range of new and arising industries could afford.
SAVING, INVESTMENT, AND FINANCIAL POLICY
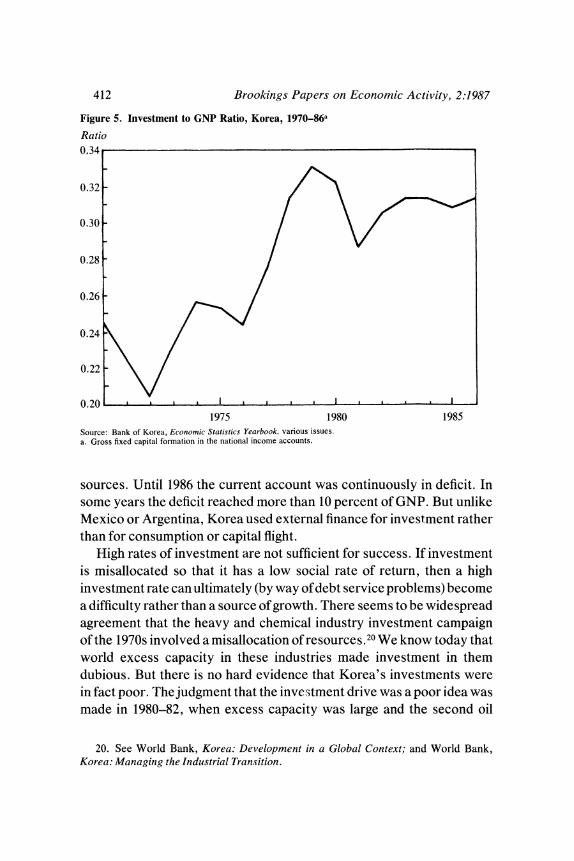
For Korea to take advantage of its export opportunities, it needed an expanded manufacturing base. For that, it needed high rates of invest- ment. Figure 5 shows the growth of investment as a ratio of GNP since 1970. Table 13, which shows the financing of investment by domestic and foreign saving, makes clear that Korea amply used external re-
412 Brookings Papers on Economic Activity, 2:1987
Figure 5. Investment to GNP Ratio, Korea, 1970-86a
Ratio 0.34
0.32 -
0.30 -
0.28
0.26 -
0.24
0.22
0.20 1975 1980 1985
Source: Bank of Korea, Economic Statistics Yearbook, various issues. a. Gross fixed capital formation in the national income accounts.
sources. Until 1986 the current account was continuously in deficit. In some years the deficit reached more than 10 percent of GNP. But unlike Mexico or Argentina, Korea used external finance for investment rather than for consumption or capital flight.
High rates of investment are not sufficient for success. If investment is misallocated so that it has a low social rate of return, then a high investment rate can ultimately (by way of debt service problems) become a difficulty rather than a source of growth. There seems to be widespread agreement that the heavy and chemical industry investment campaign of the 1970s involved a misallocation of resources.20 We know today that world excess capacity in these industries made investment in them dubious. But there is no hard evidence that Korea's investments were in fact poor. The judgment that the investment drive was a poor idea was made in 1980-82, when excess capacity was large and the second oil
20. See World Bank, Korea: Development in a Global Context; and World Bank, Korea: Managing the Industrial Transition.

Rudiger Dornbusch and Yung Chul Park 413
Table 13. Korean Saving and Investment, 1960-86
Percent of GNP
Gross National saving domestic Foreign
Period investment Total Business Personal savinga
1960-69 18.2 8.9 b b 9.1 1970-79 27.6 20.5 8.5c 10.5c 6.8
1979 36.0 26.5 8.8 11.2 8.9 1980 32.1 20.8 8.8 6.6 11.5
1981 30.3 20.5 8.2 6.7 9.8 1982 28.6 20.9 8.0 6.8 7.0 1983 29.9 25.3 10.5 7.6 4.7 1984 31.9 27.9 11.0 9.9 4.0 1985 31.1 28.6 11.1 10.6 3.1
1986 30.2 32.8 n.a. n.a. - 2.8
Source: EPB, Major Statistics of Korean Economy, various issues. n.a. Not available. a. Equals gross domestic investment minus total national saving. The identity may not be exact because the
statistical discrepancy is omitted. b. Average private saving for 1960-69 was 7.4 percent of GNP. c. Average for 1975-79.
shock hurt the chemical industry in particular. Today it is apparent that many of these industries have gained in export share. The automobile industry is a case in point. In any event, the investment portfolio was sufficiently well chosen that real wages increased and exports expanded enough to pay interest and even principal on the external resources that helped finance the investment.
Improved technology has come with high investment levels. Tech- nological development naturally begins with the importation of advanced foreign technology, and proceeds through the development of domestic variants of this imported technology, and eventually to technological self-reliance. As successive five-year economic development plans unfolded, Korea came to recognize that technology was an essential ingredient in enabling industry to produce for the world market. The government thus made a major effort to digest, adopt, and adapt foreign technology.21 One of the pillars of Korea's science and technology
21. See Larry E. Westphal and Kwang Suk Kim, "Korean Industrial Competence: Where It Came From," in Bela Balassa, ed., Development Strategies in Semi-Industrial- ized Economies (Johns Hopkins University Press, 1982), pp. 212-79; and H. S. Choi, "Science and Technology Policies for Industrial Development," in Industrialization and Development Strategies (Korea Development Institute, 1986).
414 Brookings Papers on Economic Activity, 2:1987
development policy was refining the ability to identify appropriate foreign technology, properly select, and then adapt it.
The Budget and Financial Stability. The chief contrast between Korea and Latin America lies no doubt in the budget and in financial markets. In Korea budget and financial market policies helped keep inflation in check and avoided capital flight during the early 1980s, a period of high inflation and large budget deficits worldwide. Despite the oil and commodity supply shocks of the late 1970s and the real deprecia- tion of 1979, inflation never quite reached 30 percent-certainly not an extreme level, again by Latin American standards. The unified budget deficit, although swinging widely, never reached 5 percent of GNP and never stayed very high for more than two years in a row. Figure 6 shows the behavior of the deficit from 1970 to 1986, and figure 7 shows the steady postwar expansion in taxation-that is one source of Korea's fiscal stability.
Because of that stability, Korea has suffered no major buildup of domestic debt. Nor has the budget deficit at any point become large enough to necessitate rapid money creation. This latter point is brought out by a simple model of money-financed budget deficits.22 Suppose that the budget deficit is a fraction g of real output and that it is entirely financed by base money creation. Suppose further that the base money velocity is a linear function of the rate of inflation. Under these assump- tions we can derive a simple relation between the deficit ratio, the growth rate of money, and the rate of inflation:23
(1) F = g (a + ow),
where Vj is the growth rate of money, cx is a constant in the velocity equation, and 0 represents the responsiveness of velocity to the rate of inflation, wT. Next we use the steady-state relationship between inflation, money growth, and the growth rate of real income:
(2) s = > - ay,
22. This model follows Robert A. Mundell, Monetary Theory: Inflation, Interest and Growth in the World Economy (Pacific Palisades, California: Goodyear Publishing Com- pany, 1971).
23. Deficit finance implies that MIP = g Y, where M is the nominal money expansion and Ythe level of output. This can be rewritten as pL(M/P) = g Yor p. = g Y/(M/P). Assuming monetary equilibrium and using the velocity equation Y/(M/P) = a + OI, we obtain equation 1 in the text.

Rudieer Dornbusch and Yung Chul Park 415
Figure 6. Unified Budget Deficit, Korea, 1970-86
Percent of GNP
5.0
4.5
4.0-
3.5-
3.0-
2.5-
2.0-
1.5 f
1.0
0.5 B .? L- 0 b 11 L
1975 1980 1985 Source: Bank of Korea, Economic Planning Board, Major Statistics of Korean Economy, various issues.
where a is the income elasticity of money demand and y is the growth rate of real income. Combining these two relations yields an equation for the rate of inflation:
(3) IT = (ag - cy)/(1 - Og).
Three points emerge from this simple equation. First, the budget deficit influences the inflation rate in a highly nonlinear fashion. The added inflation from an extra 1 percent deficit is greater the higher the deficit. Second, the higher the growth rate of real output, and the higher the income elasticity of money demand, the lower the rate of inflation. Third, the intercept of the velocity equation, a, influences the inflation impact of a given deficit. Other things equal, the availability of substitutes for domestic money, such as dollar deposits, a possibility of external asset holdings, or financial liberalization that reduces bank deposits and hence reserves, tends to raise velocity and hence the inflation impact of a given deficit ratio.
Each of these points is relevant to a comparison between the Korean and Latin American economies. In Korea the deficit never reached

416 Brookings Papers on Economic Activity, 2:1987
Figure 7. Taxes as a Percentage of GNP, Korea, 1953-86
Percent of GNP
20
18-
16 -
14
12
10
8-
6
41 1 1 I-
1955 1960 1965 1970 1975 1980 1985 Source: Bank of Korea, National Accounts, various issues.
exceptionally high levels and certainly not for long. Growth has been high and financial liberalization, until recently, moderate. Dollarization never occurred. As a result the inflation rate never reached Latin American ranges, and because it did not, pressure for financial liberali- zation (which in turn increases inflation unless there is deficit correction) was never strong.
The revenue from base money creation, or seignorage, is well ex- plained in Korea by two determinants: inflation and growth. To explore this relation we ran a regression of the ratio of base money creation to nominal GDP on inflation and growth. The results, using ordinary least squares with annual data for the period 1970-86, were as follows:
Seignorage= -1.38 + 0.23 Growth + 0.065 Inflation, GDP (-1.75) (3.87) (2.16)
R2 = 0.45; Durbin-Watson = 2.0,
with t-statistics in parentheses. Over the sample period on average the government derived 1.35 percent of GDP in revenue from base money creation. During the 1970s the revenue reached 2.2 percent of GDP and

Rudiger Dornbusch and Yung Chuil Park 417
thus financed the major part of the budget deficit. If seignorage is considered just another tax, the government financed the major part of outlays in one form or another by taxation rather than by borrowing. The rising share of outright taxes in GDP in the 1970s reduced budget deficits and made it possible to shift to lower rates of inflation.
Together with the shift to lower inflation the government also started financing deficits increasingly by domestic debt rather than by money creation. The domestic public debt ratio, which ranged between 3 and 4 percent of GDP in the 1970s, has started rising moderately, although it is still far below 10 percent of GDP. With levels of real interest rates in excess of 10 percent a year, a larger debt burden would easily become a problem by itself, as has been the case in Brazil or in Mexico. In Korea the small size of the debt makes this issue unimportant.
Just as Korea's domestic debt was small, so was its external public sector debt (not, though, publicly guaranteed debt).24 As a consequence the world interest rate shocks of the early 1980s and the real depreciation did not have a direct impact on the budget via the debt channel. By contrast, Latin America, where much if not most of the debt was directly in the public sector, suffered a major budget deterioration, sharply increased deficit finance, and inflation.
Financial Repression. Financial repression helped finance budget deficits in a relatively noninflationary way, as already mentioned, by keeping money substitutes out of reach. But it supported financial stability and growth in other important ways.25 With Korea's domestic financial market underdeveloped and market information not readily available, the Korean government stepped in, exerting far-reaching influence through ownership of financial intermediaries and control of access to foreign capital.
By controlling capital outflows and thus forestalling capital flight in moments of economic and political uncertainty, such as 1980-81, the
24. By the IMF definition (line 89a.h of International Financial Statistics), the external public debt in 1985 had reached 9.7 percent of GDP. Total Korean external debt amounts to more than 40 percent of GDP.
25. See especially David C. Cole and Yung Chul Park, Financial Development in Korea, 1945-1978 (Harvard University Press, 1983); Park, "Financial Repression, Lib- eralization, and Development in Developing Countries" (Korea University, 1985); and Y. J. Cho and David Cole, "The Role of the Financial Sector in Korea's Structural Adjustment" (Korea Development Institute, 1986).
418 Brookings Papers on Economic Activity, 2:1987
government has avoided the extra real depreciation required to generate the foreign exchange that finances capital flight. Avoiding real deprecia- tion is tantamount to avoiding major inflationary shocks, a lesson learned painfully in Mexico and Argentina, where capital flight forced major exchange depreciation.
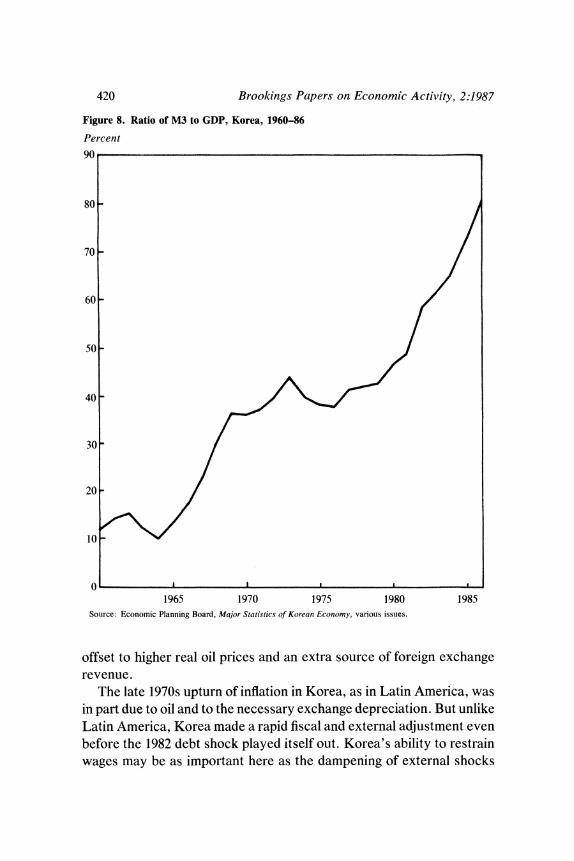
The government's financial repression has also mobilized resources for investment in targeted areas. By paying depositors low real interest rates and by controlling capital outflows, the government implicitly taxed depositors, then channeled the proceeds to favored sectors for invest- ment. Although Korea is often cited as an example of successful financial liberalization with high and positive real interest rates mobilizing finan- cial resources for investment and growth, table 14 shows that real rates have not been high, except in 1965-69, in the immediate aftermath of financial reform .26 Moreover, even lapses into small negative real interest rates did not interfere with a steady increase in the ratio of M3 to GDP, as shown in figure 8.
The relationship between saving and interest rates remains unresolved in Korea, just as everywhere else. Some authors have argued that high real interest rates caused the saving spurt and that the financial reform in 1965 spurred the expansion in intermediation in the latter half of the 1960s.27 Others, however, show that Korea's saving responds little to interest rates.28 Overall, the Korean experience suggests that there is no need for high positive real interest rates to mobilize saving through the
26. See A. Lanyi and R. Saracoglu, "Interest Rate Policies in Developing Countries," Occasional Paper 22 (International Monetary Fund, October 1983); Vicente Galbis, "Financial Intermediation and Economic Growth in Less-Developed Countries: A Theo- retical Approach," Journal of Development Studies, vol. 13 (January 1977), pp. 58-72; Ronald McKinnon, "Financial Repression and the Liberalisation Problem within Less Developed Countries," in Sven Grassman and Erik Lundberg, eds., The WorldEconomic Order: Past and Prospects (St. Martin's Press, 1982); Ronald McKinnon and Donald J. Mathieson, "How To Manage a Repressed Economy," Princeton Essays in International Finance, 145 (Princeton University, 1981); and Mathieson, "Financial Reform and Stabilization Policy in a Developing Economy, " Journal ofDevelopment Economics, vol. 7 (September 1980), pp. 359-95.
27. See John Gurley, Hugh Patrick, and Edward Shaw, "The Financial Structure in Korea" (Stanford University, 1967); and Ronald I. McKinnon, ed., Money and Finance in Economic Growth and Development: Essays in Honor of Edward Shaw (New York: Marcel Dekker, 1976).
28. See, for example, Alberto Giovannini, "The Interest Elasticity of Savings in Developing Countries: The Existing Evidence," World Development, vol. 11 (July 1983),

Rudiger Dornbusch and Yung Chul Park 419
Table 14. Real Interest Rates, Korea, 1960-86
Percent
Export sector Period Curb marketa Depositsa loansb
1960-64 31.1 - 6.7 n.a. 1965-69 44.4 26.9 n.a. 1970-74 28.2 -0.2 - 16.3 1975-79 24.0 -4.5 - 12.5
1980 16.3 -2.4 - 10.3 1981 14.0 3.8 -0.4 1982 23.4 4.2 4.7 1983 22.4 1.3 6.1 1984 22.5 5.3 6.2 1985 21.5 5.8 5.9
1986 20.8 7.7 7.7
Source: EPB, Major Statistics ofKorean Econo,tny, various issues; IMF, Governmienit Statistics Yearbook, various issues; and World Bank, Korea, vol. 22 (Washington, D.C.: World Bank, 1987).
n.a. Not available. a. Nominal interest rate less consumer price inflation. b. Nominal interest rate less inflation of the GNP deflator.
financial system; as long as large negative real interest rates are avoided, the real interest rate is relatively insignificant.
FAVORABLE WORLD ECONOMIC ENVIRONMENT
The final element in Korea's success was the world economic envi- ronment. Korea's exposure to world economic influences differs little from that of Taiwan, Singapore, or Hong Kong, all of which have the same trade structure, importing oil and commodities and exporting manufactures. But it differs significantly from that of Latin American countries, such as Brazil or Argentina, that are net commodity exporters. That difference became crucially important in the late 1970s and early 1980s, because real oil prices moved up and commodity prices moved down. As a result, Brazil had a much larger terms-of-trade deterioration than did Korea. Opportunities in the Middle East for construction projects, of which Korea took significant advantage, were an additional
pp. 601-07; S. van Wijnbergen, "Macro-economic Effects of Changes in Bank Interest Rates: Simulation Results for South Korea," Journal ofDevelopmnent Economics, vol. 18 (August 1985), pp. 541-54.
420 Brookings Papers on Economic Activity, 2:1987
Figure 8. Ratio of M3 to GDP, Korea, 1960-86
Percent
90
80 -
70 -
60-
50-
40-
30-
20 -
10 _
0 I I . *
1965 1970 1975 1980 1985 Source: Economic Planning Board, Major Statistics of Korean Economy, various issues.
offset to higher real oil prices and an extra source of foreign exchange revenue.
The late 1970s upturn of inflation in Korea, as in Latin America, was in part due to oil and to the necessary exchange depreciation. But unlike Latin America, Korea made a rapid fiscal and external adjustment even before the 1982 debt shock played itself out. Korea's ability to restrain wages may be as important here as the dampening of external shocks

Rudiger Dornbusch and Yung Chul Park 421
through its particular trade structure. Wage restraint and the large share of trade in GNP imply that real exchange rates could be moved at a lower inflation cost and with a more significant macroeconomic impact.29
Another difference between Latin America and Korea may be the latter's response to interest rate shocks. Since much of Korea's external debt is private, the debt shock affected primarily firms rather than the government budget. As a consequence, the risk of an inflationary budget deficit did not arise, and the downward pressure on real wages at the firm level was much stronger.
Market access, especially to the United States, has been an important advantage for Korean export-led growth. But other Asian NICs and Latin America have the same opportunity. One might think that prox- imity to the large Japanese market would have been an advantage. But, just as has the United States, Korea has found that market substantially closed.
We now turn to the policy questions. What is a structural surplus, does Korea have one, should it be corrected, and what is the best way to do so?
Does Korea Have a Structural External Surplus?
In 1986, Korea had its first current account surplus, amounting to some 3 percent of GDP. Before that, as figure 9 shows, the only time in the past quarter century that Korea had come even close to balance was in 1976-77. Otherwise, consistently large external deficits were the rule.30 Has that pattern now been reversed, and is a history of surpluses in the making? Certainly it appears that since the late 1970s there has been a steady move toward surplus, with the surplus actually material- izing in 1986.
If the surplus were to prove transitory, there would be nojustification for policy changes to trim it. But if it proves persistent, there may be a
29. See Frederick Jaspersen, "Adjustment Experience and Growth Prospects of the Semi-Industrialized Economies," Working Paper 477 (World Bank, 1981); and Jaspersen, "Adjusting to External Shocks: The Newly Industrialized Developing Economies in 1974- 76 and 1979-81" (World Bank, 1981), for an accounting framework that evaluates external shocks and policy responses.
30. We assume the 1987 current account surplus to be 4 percent of GDP.

422 Brookings Papers on Economic Activity, 2:1987
Figure 9. Korean External Balance, 1954-86a
Percent of GDP
6.0
4.0
2.0 Nonfactor current accountb/
0.0 Current account
A ~I}
-2.0 l
-4.0 I
-6.0
- 8.0
-12.CL - I IJ
1955 1960 1965 1970 1975 1980 1985
Source: International Monetary Fund, International Financial Statistics, various issues. a. Computed as percent of GDP and as a three-year centered moving average. The 1987 current account surplus
is assumed to be 4 percent of GDP, and the 1987 nonfactor current account surplus is assumed to be 7 percent of GDP.
b. The current account less net factor payments abroad.
policy issue. At least it is worth asking what the costs and benefits of a long-term surplus would be. And, to the extent that the surplus is the result of deliberate policies, it is appropriate to ask whether these policies are justified on a cost-benefit analysis of the surplus. Hence the need for a closer look at what a structural surplus is and whether Korea has one.
STRUCTURAL SURPLUSES
There is no accepted definition of a structural surplus in the external balance. But a pragmatic one will do. A structural surplus is one that can
Rudiger Dornbusch and Yung Chul Park 423
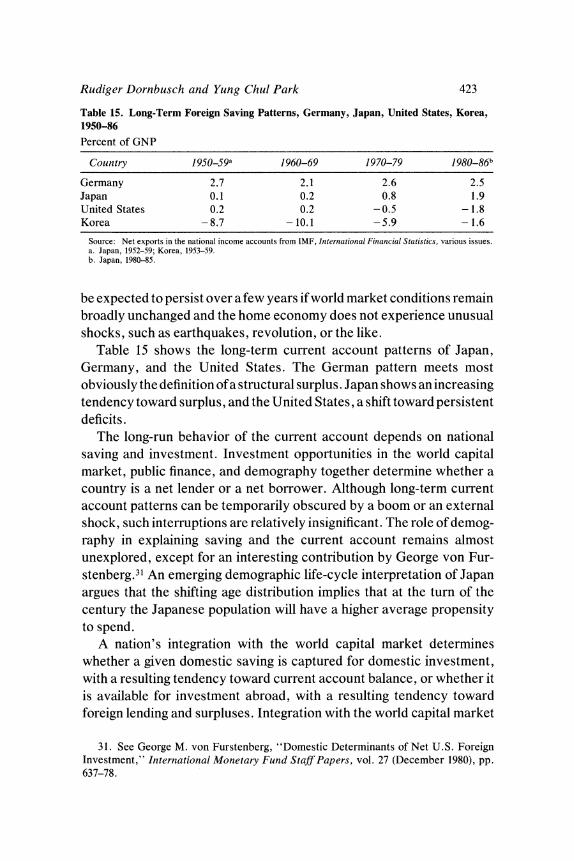
Table 15. Long-Term Foreign Saving Patterns, Germany, Japan, United States, Korea, 1950-86
Percent of GNP
Country 1950_59a 1960-69 1970-79 1980-86b
Germany 2.7 2.1 2.6 2.5 Japan 0.1 0.2 0.8 1.9 United States 0.2 0.2 -0.5 -1.8 Korea - 8.7 - 10.1 -5.9 - 1.6
Source: Net exports in the national income accounts from IMF, International Finantcial Statistics, various issues. a. Japan, 1952-59; Korea, 1953-59. b. Japan, 1980-85.
be expected to persist over a few years if world market conditions remain broadly unchanged and the home economy does not experience unusual shocks, such as earthquakes, revolution, or the like.
Table 15 shows the long-term current account patterns of Japan, Germany, and the United States. The German pattern meets most obviously the definition of a structural surplus . Japan shows an increasing tendency toward surplus, and the United States, a shift toward persistent deficits.
The long-run behavior of the current account depends on national saving and investment. Investment opportuinities in the world capital market, public finance, and demography together determine whether a country is a net lender or a net borrower. Although long-term current account patterns can be temporarily obscured by a boom or an external shock, such interruptions are relatively insignificant. The role of demog- raphy in explaining saving and the current account remains almost unexplored, except for an interesting contribution by George von Fur- stenberg.31 An emerging demographic life-cycle interpretation of Japan argues that the shifting age distribution implies that at the turn of the century the Japanese population will have a higher average propensity to spend.
A nation's integration with the world capital market determines whether a given domestic saving is captured for domestic investment, with a resulting tendency toward current account balance, or whether it is available for investment abroad, with a resulting tendency toward foreign lending and surpluses. Integration with the world capital market
31. See George M. von Furstenberg, "Domestic Determinants of Net U.S. Foreign Investment," International Monetary Fund Staff Papers, vol. 27 (December 1980), pp. 637-78.
424 Brookings Papers on Economic Activity, 2:1987
will tend to create structural deficits when investment opportunities are ample at home (say, because labor is abundant) and can be financed in the world capital market.
Absence of Ricardian equivalence also has a bearing on the external balance. Long-term swings in the government budget will affect con- sumption spending and investment and hence influence the national saving-investment balance. A swing toward budget deficits, U.S. style, leads to external deficits, while a surplus policy leads to external surpluses. The same phenomenon may apply at the level of firms by way of undistributed earnings that are used for foreign direct investment. In countries such as Germany, where firms retain earnings and use them to invest abroad, stockholders may not spend fully the capital gains and, as a result, the current account will show a surplus. Thus a foreign investment motive, in the absence of Ricardian equivalence, may well engender persistent current account surpluses. The tendency will be stronger the more firms rely on undistributed earnings and the more they rely on direct ownership of external investments as a means to exploit their monopolistic market positions. In a sense, then, these current account surpluses reflect imperfections of goods and assets markets.
The saving-investment interpretation of the external balance can also be applied to the question of how openness to trade affects the trade balance and hence the current account. Would Japan, with more open markets, have a smaller current account surplus? Not necessarily. Germany is a relatively open economy whose current account has consistently shown a surplus. An opening by Japan would certainly increase imports and thus free resources, which could be used either for production of extra exports or for increased domestic absorption. How the adjustment would occur depends among other things on fiscal policy and public sector spending reactions. If a tax on saving were to finance an expansion in public sector infrastructure investment, the surplus might vanish. But if there were no fiscal response, the long-run current account might not change much, and increased imports would be offset by higher exports.
THE KOREAN CASE
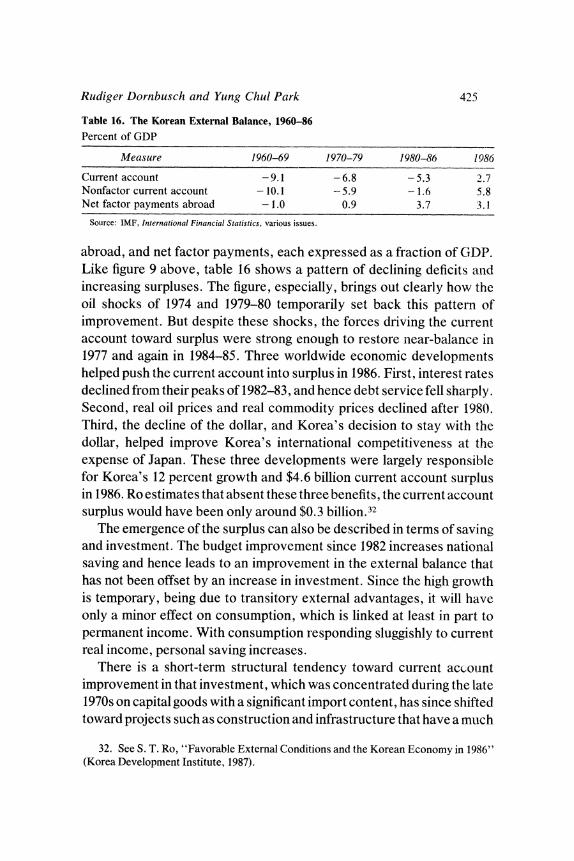
Does Korea have a structural surplus? Table 16 shows the Korean current account, the current account excluding net factor payments
Rudiger Dornbusch and Yung Chul Park 425
Table 16. The Korean External Balance, 1960-86 Percent of GDP
Measure 1960-69 1970-79 1980-86 1986
Current account -9.1 -6.8 - 5.3 2.7 Nonfactor current account - 10.1 - 5.9 - 1.6 5.8 Net factor payments abroad - 1.0 0.9 3.7 3.1
Source: IMF, International Financial Statistics, various issues.
abroad, and net factor payments, each expressed as a fraction of GDP. Like figure 9 above, table 16 shows a pattern of declining deficits anid increasing surpluses. The figure, especially, brings out clearly how the oil shocks of 1974 and 1979-80 temporarily set back this pattern of improvement. But despite these shocks, the forces driving the current account toward surplus were strong enough to restore near-balance in 1977 and again in 1984-85. Three worldwide economic developments helped push the current account into surplus in 1986. First, interest rates declined from their peaks of 1982-83, and hence debt service fell sharply. Second, real oil prices and real commodity prices declined after 1980. Third, the decline of the dollar, and Korea's decision to stay with the dollar, helped improve Korea's international competitiveness at the expense of Japan. These three developments were largely responsible for Korea's 12 percent growth and $4.6 billion current account surplus in 1986. Ro estimates that absent these three benefits, the current account surplus would have been only around $0.3 billion.32
The emergence of the surplus can also be described in terms of saving and investment. The budget improvement since 1982 increases national saving and hence leads to an improvement in the external balance that has not been offset by an increase in investment. Since the high growth is temporary, being due to transitory external advantages, it will have only a minor effect on consumption, which is linked at least in part to permanent income. With consumption responding sluggishly to current real income, personal saving increases.
There is a short-term structural tendency toward current account improvement in that investment, which was concentrated during the late 1970s on capital goods with a significant import content, has since shifted toward projects such as construction and infrastructure that have a much
32. See S. T. Ro, "Favorable External Conditions and the Korean Economy in 1986" (Korea Development Institute, 1987).

426 Brookings Papers on Economic Activity, 2:1987
lower import content. But only in a context of unused resources would an expenditure-switching toward home goods lead to a long-term in- crease in output and national saving. With full employment, the excess demand for resources in the home goods sector will bring about a real appreciation that leads to a reduction of exports and an increase in imports. To the extent that the current account surplus reflects at least in part the shift in investment, the real appreciation process may already be under way, and one significant component of the surplus may thus be merely transitory.
But one reason to think that Korea may be heading toward a structural surplus is that Korean firms may take the view that potential trade conflicts make it relatively unprofitable to locate all new capacity in Korea and may invest directly in target markets such as Europe or the United States. As a result, domestic investment would decline without an offsetting fall in saving, and the current account would show a tendency toward surplus. The National Pension System that will go into effect in 1988 may be regarded as a forced saving device. But its impact on national saving is estimated to be small.33
We conclude that Korea is likely to have a structural balance in the external account, perhaps a small surplus. The size is difficult to judge, and some of the present surplus is likely to be transitory. After all, the national saving rate in 1986 reached the highest level ever, and even if the trend in saving is upward, part of that saving is surely transitory. The next question is whether the structural surplus calls for corrective policy. In considering that issue we emphasize that one must look at the overall current account, not at bilateral trade balances, the aggregate trade balance, or even the current account excluding factor payments.
Policy Responses to the Structural Surplus
There are two opposing schools of thought about external balances of developing debtor countries. One, that export-led growth and reduc- tions in debt burdens are desirable strategies, has been argued forcefully by Corbo and Nam.34 The other, that East Asian NICs' current account
33. See J. S. Min, "The Master National Plan and its Socioeconomic Effects," Research Monograph 8605 (Korea Development Institute, 1986).
34. See Corbo and Nam, "Korea's Macroeconomic Prospects."
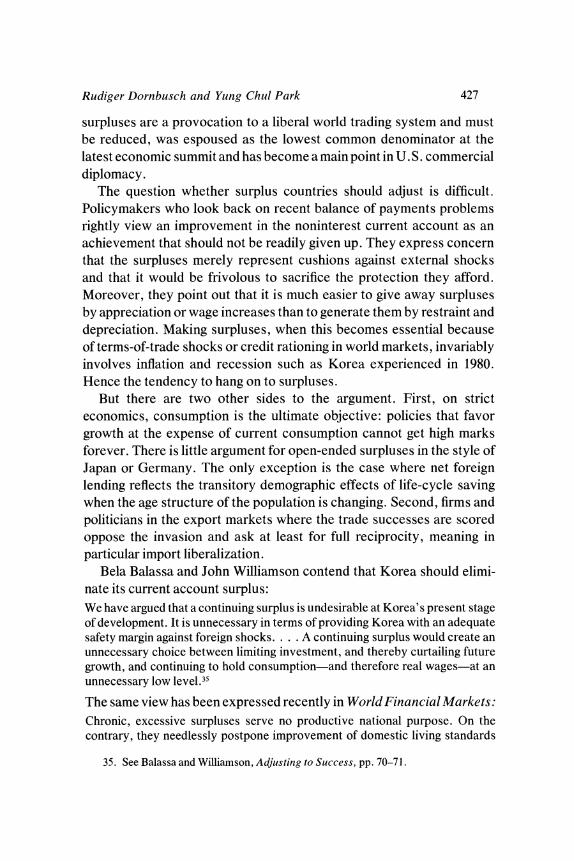
Rudiger Dornbusch and Yung Chul Park 427
surpluses are a provocation to a liberal world trading system and must be reduced, was espoused as the lowest common denominator at the latest economic summit and has become a main point in U.S. commercial diplomacy.
The question whether surplus countries should adjust is difficult. Policymakers who look back on recent balance of payments problems rightly view an improvement in the noninterest current account as an achievement that should not be readily given up. They express concern that the surpluses merely represent cushions against external shocks and that it would be frivolous to sacrifice the protection they afford. Moreover, they point out that it is much easier to give away surpluses by appreciation or wage increases than to generate them by restraint and depreciation. Making surpluses, when this becomes essential because of terms-of-trade shocks or credit rationing in world markets, invariably involves inflation and recession such as Korea experienced in 1980. Hence the tendency to hang on to surpluses.
But there are two other sides to the argument. First, on strict economics, consumption is the ultimate objective: policies that favor growth at the expense of current consumption cannot get high marks forever. There is little argument for open-ended surpluses in the style of Japan or Germany. The only exception is the case where net foreign lending reflects the transitory demographic effects of life-cycle saving when the age structure of the population is changing. Second, firms and politicians in the export markets where the trade successes are scored oppose the invasion and ask at least for full reciprocity, meaning in particular import liberalization.
Bela Balassa and John Williamson contend that Korea should elimi- nate its current account surplus: We have argued that a continuing surplus is undesirable at Korea's present stage of development. It is unnecessary in terms of providing Korea with an adequate safety margin against foreign shocks.... A continuing surplus would create an unnecessary choice between limiting investment, and thereby curtailing future growth, and continuing to hold consumption-and therefore real wages-at an unnecessary low level.35
The same view has been expressed recently in World Financial Markets: Chronic, excessive surpluses serve no productive national purpose. On the contrary, they needlessly postpone improvement of domestic living standards
35. See Balassa and Williamson, Adjusting to Success, pp. 70-71.

428 Brookings Papers on Economic Activity, 2:1987
and, by aggravating international trade frictions, jeopardize continued access to foreign markets. Specifically, [Taiwan and Korea] would be well advised-in their own self-interest-to adopt fiscal policies that expand domestic demand; allow significant currency appreciation to boost purchasing power and actual living standards; move rapidly toward import regimes with minimal restrictions and uniformly low tariffs of 10% or less; lift exchange controls that block private- sector lending and investment overseas; and firee their banking systems and capital markets from crippling regulation.36
These policy suggestions are a by-product of a search for a solution to the U.S. trade problem, given the unwillingness of Congress and the President to agree on U.S. fiscal policy and the unwillingness of Europe and Japan to expand. Only a few years ago Korea was urged in the direction of policy adjustments that would enable it to service the external debt and to be dropped from the list of problem debtors. One way to interpret the new attitude is that Korea overshot the target.
Two questions need to be asked at this stage. One is whether an adjustment in policies should be pursued to trim the external surplus; the other, what particular policy should best be used.
THE DOUBTFUL CASE FOR UNILATERAL SURPLUS REDUCTION
The strongest argument in favor of surplus reduction is political. The United States is experiencing extraordinary trade deficits. Since 1980 the U.S. manufacturing trade balance with developing countries has shifted by more than $50 billion. Part of these deficits has as a counterpart the surpluses of East Asian NICs, including Korea, as table 17 shows. The surpluses may be the outcome of adjustments to the debt crisis or of superior trade performance. But one way or another they are a political problem. To avoid costly U.S. trade restrictions Korea should take measures to cut down the bilateral surplus.
A more sophisticated version of this argument would emphasize that Korea, by staying with the dollar rather than the yen, undermines U.S. exchange rate adjustment. As Japan becomes less competitive in the course of yen appreciation, Korea picks up the business without much of an improvement in the U.S. external balance. Again, for Korea to
36. See Morgan Guaranty Trust Company, World Financial Markets (January 1987), p. 11.
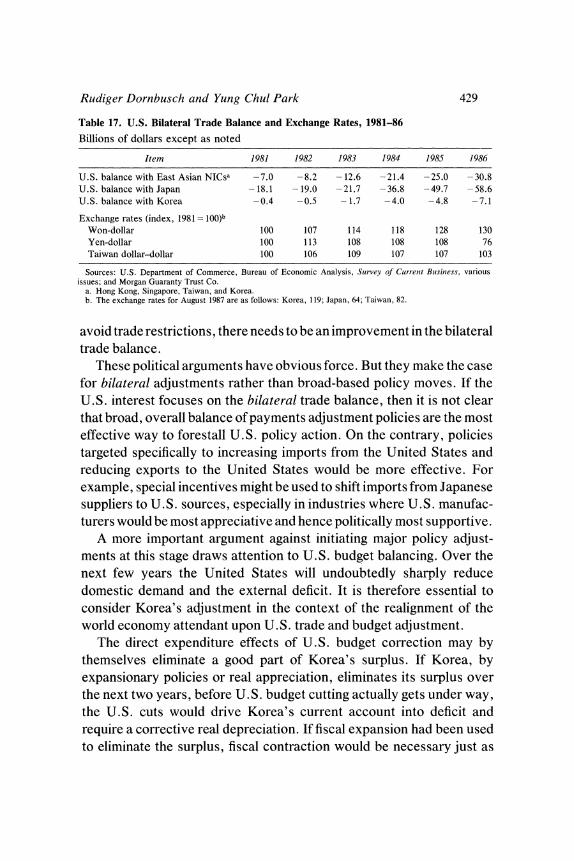
Rudiger Dornbusch and Yung Chul Park 429
Table 17. U.S. Bilateral Trade Balance and Exchange Rates, 1981-86
Billions of dollars except as noted
Item 1981 1982 1983 1984 1985 1986
U.S. balance with East Asian NICsa -7.0 -8.2 -12.6 -21.4 -25.0 -30.8 U.S. balance with Japan - 18.1 - 19.0 -21.7 - 36.8 - 49.7 - 58.6 U.S. balance with Korea -0.4 -0.5 - 1.7 -4.0 -4.8 -7.1
Exchange rates (index, 1981 = 10O)b
Won-dollar 100 107 114 118 128 130 Yen-dollar 100 113 108 108 108 76 Taiwan dollar-dollar 100 106 109 107 107 103
Sources: U.S. Department of Commerce, Bureau of Economic Analysis, Survey of Current Blisitness, various issues; and Morgan Guaranty Trust Co.
a. Hong Kong, Singapore, Taiwan, and Korea. b. The exchange rates for August 1987 are as follows: Korea, 119; Japan, 64; Taiwan, 82.
avoid trade restrictions, there needs to be an improvement in the bilateral trade balance.
These political arguments have obvious force. But they make the case for bilateral adjustments rather than broad-based policy moves. If the U.S. interest focuses on the bilateral trade balance, then it is not clear that broad, overall balance of payments adjustment policies are the most effective way to forestall U.S. policy action. On the contrary, policies targeted specifically to increasing imports from the United States and reducing exports to the United States would be more effective. For example, special incentives might be used to shift imports from Japanese suppliers to U.S. sources, especially in industries where U.S. manufac- turers would be most appreciative and hence politically most supportive.
A more important argument against initiating major policy adjust- ments at this stage draws attention to U.S. budget balancing. Over the next few years the United States will undoubtedly sharply reduce domestic demand and the external deficit. It is therefore essential to consider Korea's adjustment in the context of the realignment of the world economy attendant upon U.S. trade and budget adjustment.
The direct expenditure effects of U.S. budget correction may by themselves eliminate a good part of Korea's surplus. If Korea, by expansionary policies or real appreciation, eliminates its surplus over the next two years, before U.S. budget cutting actually gets under way, the U.S. cuts would drive Korea's current account into deficit and require a corrective real depreciation. If fiscal expansion had been used to eliminate the surplus, fiscal contraction would be necessary just as
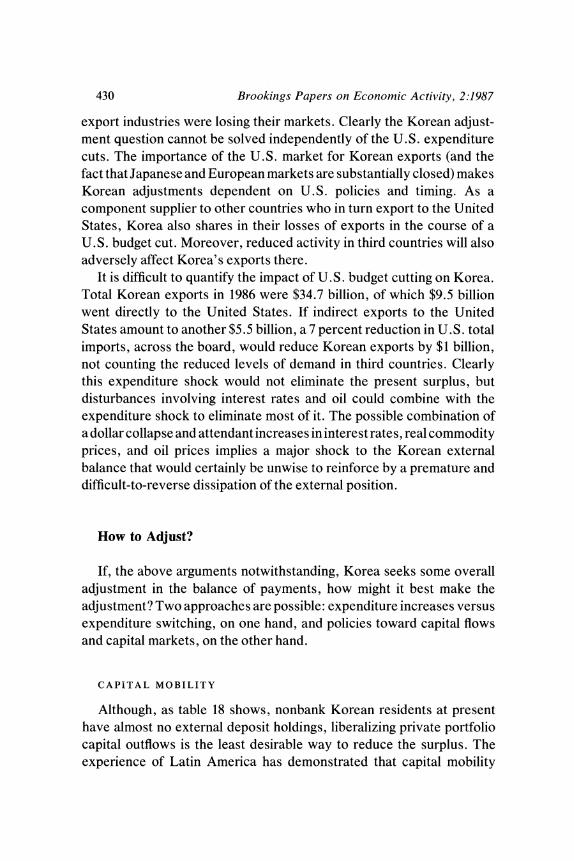
430 Brookings Papers on Economic Activity, 2:1987
export industries were losing their markets. Clearly the Korean adjust- ment question cannot be solved independently of the U.S. expenditure cuts. The importance of the U.S. market for Korean exports (and the fact that Japanese and European markets are substantially closed) makes Korean adjustments dependent on U.S. policies and timing. As a component supplier to other countries who in turn export to the United States, Korea also shares in their losses of exports in the course of a U.S. budget cut. Moreover, reduced activity in third countries will also adversely affect Korea's exports there.
It is difficult to quantify the impact of U.S. budget cutting on Korea. Total Korean exports in 1986 were $34.7 billion, of which $9.5 billion went directly to the United States. If indirect exports to the United States amount to another $5.5 billion, a 7 percent reduction in U.S. total imports, across the board, would reduce Korean exports by $1 billion, not counting the reduced levels of demand in third countries. Clearly this expenditure shock would not eliminate the present surplus, but disturbances involving interest rates and oil could combine with the expenditure shock to eliminate most of it. The possible combination of a dollar collapse and attendant increases in interest rates, real commodity prices, and oil prices implies a major shock to the Korean external balance that would certainly be unwise to reinforce by a premature and difficult-to-reverse dissipation of the external position.
How to Adjust?
If, the above arguments notwithstanding, Korea seeks some overall adjustment in the balance of payments, how might it best make the adjustment? Two approaches are possible: expenditure increases versus expenditure switching, on one hand, and policies toward capital flows and capital markets, on the other hand.
CAPITAL MOBILITY
Although, as table 18 shows, nonbank Korean residents at present have almost no external deposit holdings, liberalizing private portfolio capital outflows is the least desirable way to reduce the surplus. The experience of Latin America has demonstrated that capital mobility

Rudiger Dornbusch and Yung Chul Park 431
Table 18. Cross-Border Bank Deposits of Nonbanks by Residence of Depositor, Various Years, 1981-86
Billions of U.S. dollars except as noted
Dollars per capita
Countty 1981 1983 1985 1986 (1986)
Argentina 6.4 7.9 8.5 8.5 274 Brazil 3.5 8.1 9.8 11.7 86 Mexico 9.4 12.7 16.1 15.8 199 Venezuela 15.6 10.9 14.0 12.8 720
Korea 0.3 0.3 0.7 0.7 17 Italy 12.0 10.6 10.9 11.3 189 France 12.7 11.8 11.0 13.5 244 Japan 1.9 2.0 4.4 7.3 60
Source: IMF, International Financial Statistics, various issues. End-of-year figures for each year.
readily undermines exchange stability and emphasizes finance at the expense of productive activity. Of course, these developments do not occur independently of poor budget performance and adverse shocks. But the case for the social benefits of hot money mobility remains doubtful.37
Moreover, liberalizing capital outflows would not seem to be the right policy if the concern is with an excessive current account surplus. If capital were to leave in response to a removal of capital controls, the consequence might be balance of payments difficulties and a tendency for real depreciation. There are better ways than private capital flows to use the capital account to offset a current account surplus. Debt can be repaid or, better yet, the current account can be used to finance productive Korean direct investment abroad.
Debt reduction is of interest because Korea, as shown in table 19, is a major debtor and hence remains vulnerable to interest rate shocks or to credit rationing. The group of countries experiencing recent debt rescheduling problems had a debt-GNP ratio in 1986 of 54.8 percent and a ratio of debt service to exports of 37.6 percent. Countries without debt-
37. See John T. Cuddington, "Capital Flight: Estimates, Issues and Explanations," Princeton Studies in International Finance, 58 (Princeton University, 1986); and Rudiger Dornbusch, "External Debt, Budget Deficits and Disequilibrium Exchange Rates," in Gordon W. Smith and John T. Cuddington, International Debt and the Developing Countries (Washington, D.C.: World Bank, 1985), reprinted as "Overborrowing: Three Case Studies," in Dornbusch, Dollars, Debts, and Deficits (MIT Press, 1987), pp. 97-130.

432 Brookings Papers on Economic Activity, 2:1987
Table 19. Korea's External Debt, 1970, 1982, 1986
Percent except as noted
Debt measure 1970 1982 1986
External debt (billions of dollars) 2.3 37.1 44.5 Debt-GNP ratio 27.8 52.4 46.8 Debt service-GNP ratio 3.3 8.4 10.1 Debt service-export ratioa 18.5 20.6 22.9
Source: Estimates for 1970 from Yung Chul Park, "Korea's Experience with External Debt Management," in Gordon W. Smith and John T. Cuddington, eds., International Debt anid the Developinig Countries (Washington, D.C.: World Bank, 1985), pp. 289-328; estimates for 1982 and 1986 from Korean Ministry of Finance.
a. Exports of goods and services.
rescheduling difficulties, by contrast, showed for these two indicators ratios of 32.5 percent and 17.2 percent, respectively. Korea sits squarely between the two groups, looking better than other major debtors and not as good as those countries without debt-service problems. These data suggest that Korea might do well to pay off part of the debt.
Indebtedness cannot be neglected as an issue. Since Korea's debt is predominantly short-term, it is entirely possible that although interest can be paid, rescheduling the principal might turn out to be a problem. As World Financial Markets worried out loud only a few years ago, "Korea is vulnerable to a deterioration in the climate for LDC lending and to the phenomenon of 'regionalization'-thus, Korea's access to credit could be crimped by difficulties in such neighboring countries as the Philippines."38 Needless to say, political developments in Korea, whether domestic or in relation to North Korea, or a turn in the world oil and interest rate picture could change Korean creditworthiness rapidly. All the experiences of problem debtors, and indeed the Korean experience as recently as 1980-82, indicate that external finance can dry up rapidly.
What of letting private capital in? That would not contribute to solving the overall balance of payments problem except by increasing the upward pressure on the real exchange rate. The Chilean miracle ended in 1978- 80, when an excess of private capital led to real appreciation and a massive deterioration in the current account that ultimately brought inflation, unemployment, and a breakdown of the financial system.
The overriding characteristic of private capital flows, without much exaggeration, is that capital tends to come when it is unnecessary and
38. Morgan Guaranty, World Financial Markets (March 1984), p. 6.

Rudiger Dornbusch and Yung Chul Park 433
leave when it is least convenient. As a result it tends to increase the variability of real exchange rates and introduces avoidable macroeco- nomic instability. One cannot escape the impression that Korea, under the impact of abundant external capital, might lose its competitive exchange rate, overborrow, and ultimately become once again a problem debtor. Korea's investment rate is more than 30 percent of GNP. There is little to suggest that capital imports are necessary because capital is in short supply.
FISCAL EXPANSION
The argument for fiscal expansion as a means of correcting the external surplus is also difficult to make. It is true that the deficit is relatively small and certainly far from dangerous. Government indebtedness is relatively small, and deficit finance has not been inflationary in the recent past. Thus the budget can certainly afford expansion. But it seems a very roundabout way of reducing the current account surplus. Even though the economy is open as judged by the ratio of trade to GNP, the import content of consumption is relatively small, only twenty-three cents per dollar of imports. It would thus take a considerable tax cut to have a significant trade impact. To be more cost effective, budget action might concentrate on investment in areas where the import content is much higher. But one likely target of investment, construction, does not have high import content and another, equipment, could further expand the export sector or promote import substitution, which, as the current account surplus suggests, may already be overdone.
One fiscal action that should probably be undertaken independent of the external balance is a relaxation of programs of forced saving, which have served their purposes in mobilizing saving and as balance of payments adjustment policies. Welfare gains can obviously be reaped, and the lack of an external constraint makes such a move more timely.
REAL WAGE INCREASES OR REAL APPRECIATION
Korea is involved in two major trading relationships. On one hand, it is positioned in a trade relation with the United States and Japan: it is an alternative supplier in the U.S. market and a supplier of intermediate goods to Japan, which in turn exports finished goods. Changes in the
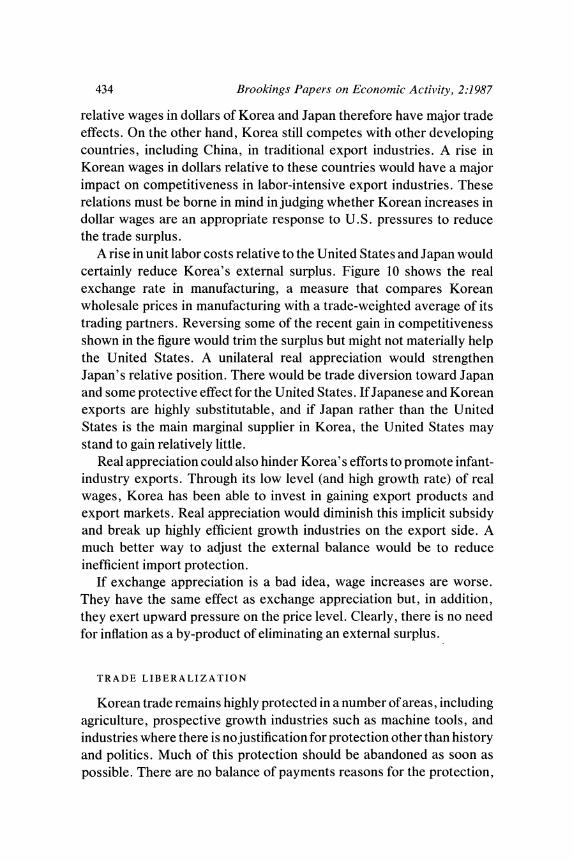
434 Brookings Papers on Economic Activity, 2:1987
relative wages in dollars of Korea and Japan therefore have major trade effects. On the other hand, Korea still competes with other developing countries, including China, in traditional export industries. A rise in Korean wages in dollars relative to these countries would have a major impact on competitiveness in labor-intensive export industries. These relations must be borne in mind in judging whether Korean increases in dollar wages are an appropriate response to U.S. pressures to reduce the trade surplus.
A rise in unit labor costs relative to the United States and Japan would certainly reduce Korea's external surplus. Figure 10 shows the real exchange rate in manufacturing, a measure that compares Korean wholesale prices in manufacturing with a trade-weighted average of its trading partners. Reversing some of the recent gain in competitiveness shown in the figure would trim the surplus but might not materially help the United States. A unilateral real appreciation would strengthen Japan's relative position. There would be trade diversion toward Japan and some protective effect for the United States. If Japanese and Korean exports are highly substitutable, and if Japan rather than the United States is the main marginal supplier in Korea, the United States may stand to gain relatively little.
Real appreciation could also hinder Korea's efforts to promote infant- industry exports. Through its low level (and high growth rate) of real wages, Korea has been able to invest in gaining export products and export markets. Real appreciation would diminish this implicit subsidy and break up highly efficient growth industries on the export side. A much better way to adjust the external balance would be to reduce inefficient import protection.
If exchange appreciation is a bad idea, wage increases are worse. They have the same effect as exchange appreciation but, in addition, they exert upward pressure on the price level. Clearly, there is no need for inflation as a by-product of eliminating an external surplus.
TRADE LIBERALIZATION
Korean trade remains highly protected in a number of areas, including agriculture, prospective growth industries such as machine tools, and industries where there is no justification for protection other than history and politics. Much of this protection should be abandoned as soon as possible. There are no balance of payments reasons for the protection,
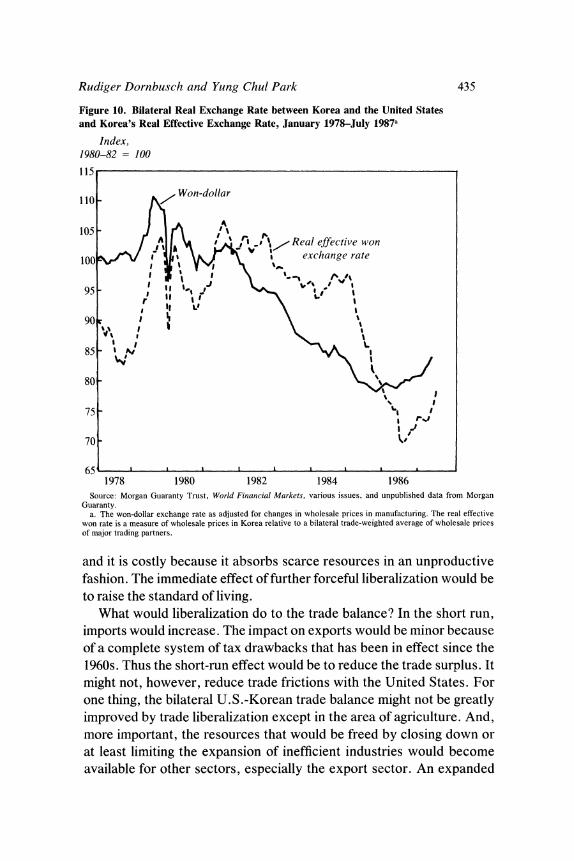
Rudiger Dornbusch and Yung Chul Park 435
Figure 10. Bilateral Real Exchange Rate between Korea and the United States and Korea's Real Effective Exchange Rate, January 1978-July 1987a
Index, 1980-82= 100
115 .,
fv .s\~,, Real effective won
100 ~ ~ ~ ~ ~ ~ ~ a exchange rate
95 5 I rr L o
90 ,'
85 - "i;
80-
75 -1
70 -k
65 , , 1978 1980 1982 1984 1986
Source: Morgan Guaranty Trust, World Financial Markets, various issues, and unpublished data from Morgan Guaranty.
a. The won-dollar exchange rate as adjusted for changes in wholesale prices in manufacturing. The real effective won rate is a measure of wholesale prices in Korea relative to a bilateral trade-weighted average of wholesale prices of major trading partners.
and it is costly because it absorbs scarce resources in an unproductive fashion. The immediate effect of further forceful liberalization would be to raise the standard of living.
What would liberalization do to the trade balance? In the short run, imports would increase. The impact on exports would be minor because of a complete system of tax drawbacks that has been in effect since the 1960s. Thus the short-run effect would be to reduce the trade surplus. It might not, however, reduce trade frictions with the United States. For one thing, the bilateral U.S.-Korean trade balance might not be greatly improved by trade liberalization except in the area of agriculture. And, more important, the resources that would be freed by closing down or at least limiting the expansion of inefficient industries would become available for other sectors, especially the export sector. An expanded
436 Brookings Papers on Economic Activity, 2:1987
export sector would mean a gain in real income, but it could also mean an increase in trade conflicts: the collective voice of threatened U.S. import-competing industries is always louder than that of successful U.S. exporters.
Liberalization does not mean that protection should be dropped altogether. The Korean experience has amply demonstrated that infant- industry protection pays. Protecting new industrial candidates such as machine tools may draw objections from abroad, but it is altogether justified on dynamic efficiency grounds.
CLOUDS ON THE HORIZON
The discussion so far has assumed that Korea has a structural and growing external surplus. But that judgment may be premature. In 1977 Korea's external balance was tending toward balance and a structural surplus. That process was interrupted by the oil and debt shocks and by domestic instability in 1980-81. Since then the surplus has again been built up. Butjust as the events of 1979-83 overstated the Korean external balance problems, the surplus today may look better than it really is because of favorable external developments that cannot be expected to last.
Already, rising oil and commodity prices are lowering Korea's real income and worsening the external balance. Commodity prices in dollars have risen 22 percent over the past year, while the price of oil has risen 35 percent. The LIBOR rate has risen nearly a full percentage point since the end of 1986. All these developments influence the external balance with a lag and help temper a strong performance in manufacturing trade. Moreover, in the course of a further dollar decline, these devel- opments are certain to worsen further Korea's external balance.
A crude estimate of the direct balance of payments effects of a 10 percent rise in oil and commodity prices and a 100-basis-point increase in the LIBOR rate is $1.1 billion. It does not take much to curtail sharply the current account surplus.
An even more significant development is labor unrest and wage pressure in the home economy. Wage policy has traditionally been a mainstay of Korea's trade performance. The timely restraint of excessive wage increases in the face of the external shocks has helped achieve rapid and efficient adjustment. Recently, however, labor relations have
Rudiger Dornbusch and Yung Chul Park 437
been changing rapidly and suddenly. With almost all major exporting firms already involved in labor disputes in one form or another, the unrest is spreading to medium-sized and small firms that supply com- ponents to exporting firms. While it is not clear where the unrest will end, it is certain that the estimated wage increases of only 8 percent now have to be revised upward to 20 percent. Therefore, the 1985-86 gain in competitiveness, already dampened by the 10 percent won appreciation, will be mostly lost.
The loss in competitiveness from labor market developments com- bines with rising interest rates and oil and commodity prices to change substantially the outlook for Korea's external balance. The large surplus of 1986 and early 1987 may not hold up for long, a prospect that is disconcerting because of prospective U.S. budget adjustment that will also worsen Korea's trade balance. In view of these uncertainties, major changes in policy to eliminate rapidly the external surplus would be ill- considered at this time.
Concluding Remarks
Korea's superior growth during the past twenty-five years was a result not of any single policy, but of different policies applied at different times. When surplus labor and high unemployment prevailed, the government opted for support of labor-intensive industries and pushed education programs on a massive scale. When the competitive edge in these industries began to be threatened, support switched to heavy and chemical industries. When excessive government intervention and mis- allocation became apparent, the government relaxed some of its control over the economy.
Government clearly played the leading role in the structural adjust- ment. During the early stages of industrialization, exports were singled out with subsidies, credit, and an attractive real exchange rate. When the situation called for more capital-intensive and technology-intensive industrialization, import restrictions were provided to generate profit- ability for infant industries. Monopolies and oligopolies were created to give the infants time and scale economies, and tax and credit facilities helped reinforce the momentum. In the 1980s, when the economy had become too complex for central management, the government yielded

438 Brookings Papers on Economic Activity, 2:1987
much of the control. Trade and capital markets are now being increasingly liberalized. But that does not mean there is no longer an industrial policy. Now the emphasis is on supporting research and development and encouraging small and medium-sized firms.
Confronted with a large external surplus, Korea must find a policy response. Aggressive measures such as appreciation, wage increases, capital account liberalization, and fiscal expansion are not in order. Beyond measures to reduce inefficient protection, any major balance of payments action should await the final outcome of the present labor disputes and the U.S. budget deficit reduction. Each is likely to reduce Korea's surplus exports significantly, and the world macroeconomic developments in interest rates, oil, and commodities may reinforce that result. When the U. S . expenditure cuts do occur it would, of course, be entirely inappropriate to deny them by an offsetting real depreciation.
These policy conclusions are uncomfortable because, their common sense notwithstanding, U.S. policymakers somehow believe that the trade problem can be solved without budget action. They do not recognize that if the U.S. trade deficit were to vanish, the U. S. economy would be pushed far beyond full employment, and investment would be crowded out.
U.S. policymakers are insisting on Korean adjustment. With NICs more and more competing with U.S. firms in a wide range of products, that insistence will only increase. What is the proper policy response? For an export-oriented, poor economy like Korea, the major asset in its growth policy is access to the U.S. market. The proper policy response to current and prospective trade pressures is to assure market access even at a stiff price in terms of adjustment costs. Unfortunately, Korea has relatively little influence over U. S. general trade policy. Under these circumstances, a plausible initiative would have to be bilateral. It is increasingly apparent that the existing commercial relations treaty, which dates from the 1940s, is in need of an overhaul. Korea might profitably seek a new arrangement with the United States that includes two emphases, one, a Bilateral Investment Treaty and the other, a Bilateral Free Trade Area.
The advantage of the policy is to assure preferential and permanent access to a very substantial market. It is not without adjustment costs for Korea. But these costs fall far short of those that would be imposed if the U.S. market actually closed in the way that Europe now is increasingly closing herself to external competitors.

Rudiger Dornbusch and Yung Chul Park 439
APPENDIX
The Main Stages of Recent Economic History
KOREAN ECONOMIC HISTORY since the 1950s can be divided into four periods defined by different policy objectives. They are, respectively, the reconstruction of the economy after the Korean War, the outward- looking development of the 1960s, the industrialization campaign of the 1970s centered on heavy and chemical industry, and the liberalization period of the 1980s. We briefly review each in turn. Table A-I details the main economic indicators from 1970 to 1986.
Reconstruction: 1953-61
After the Korean War the country faced the economic instability characteristic of a poor country, namely, rampant inflation and a scarcity of basic consumption goods. Lacking both experience and an efficient administrative structure, policymakers turned to short-term relief mea- sures rather than long-term economic planning.
Industrial policy focused on import substitution of nondurable con- sumer and intermediate goods. But a small domestic market and high capital requirements limited the potential of these policies. In addition, Korea had a national saving rate of only 5 percent, much too low to finance reconstruction. Foreign aid provided much of the necessary finance. GNP growth averaged 3.7 percent, while per capita income in this period grew at a rate of only 0.7 percent. Even though progress was slow, the 1950s laid the groundwork for growth by expanding educational facilities at all levels and creating a manufacturing base needed to launch an export-promotion strategy. Land redistribution improved income distribution.
Outward-Looking Strategy: 1962-71
The First Five-Year Economic Development Plan altered basic goals and economic strategy, switching the focus of the Korean economy from

0 0
~~~~i ri- - rir3
<i 2 AtE~ o??? b3XtO 00 N Ne 00
^ =nW~~~~~~~~~~~~~~~e
'? ^ H ? N N N ?? > o ? > m~~~~~~~~~~~~~~~~~~~~> ?N^RE-
-j zs > ,>^^^^tXmbX
en 0
0 r l O ON O N N 0 000 O E
e S e C- O CN O - - - O C 0 O O O 0
X~~~~~~r 'I N CN - 4 O en 00 It'Cm m W) 00 - O- Y=
t) t 0 t~~~a o o o oo - o m r- r- W) E
w~~~~~~~~~~~~~~~~~~~~~~~~~~~4 . 0
~~~~~~~~~~~~~~~~~~
l S e X X & < o N ? ? ~O 0 C1 en m tN t- "o CN ? t- =Y
~~~~~~~~~ II~~~~~~~~~~~~~~~~~~~~~
Ei
~~ oo~~~o ~~~~~~~~~~~~- ~ ~ ~ ~ ~ ~ ~ ~ ~ ~ ~ ~ ~ ~ ~ ~ ~ ~ ~ ~ ~ ~ ~ ~ ~ ~~~~~~~- Ot aN 4 "o o " O N "o ) 't CAN t- t o =t o
- 0
Q~~~~~~~~~~~~~~~~~~e C, en - ) en en oo eon Om?.cS0;Dv
0
o X Q .tt**ooXXXXo=t 06 06 06 0
0
.~~~~~~~~~~~r en 0 C1 en W) 00 W) CN m Oooo ooN 'I O= !< ; X, < t ?
^o-moo tbo o o r10'3 r,<0 o 6 o ioo o 6 6 6 oot -6 " A o
0 o
00
"o en O W) 00 '< r- 00 "o ,s CN 't 't a O'
t-.CN 000 6 r - qj ~ ~ ~ ~ ~ ~
- U r- b 00 0 0 b ooo 0 oo oo 00 oo o >
Cu~~~~~~~~~~~~~~~~~~~~~

Rudiger Dornbuslch and Yung Chul Park 441
import substitution to export promotion. This outward-looking devel- opment strategy was designed to utilize the nation's comparative advan- tage in labor-intensive manufactured goods. It aimed to create the economic base for industrialization and self-sustained growth.
Korea's only resource was an abundant labor force that was well- educated and diligent, partly due to the influence of Confucianism. The government exploited this comparative advantage by fostering exports of labor-intensive goods.
To make Korean goods more price competitive in international markets, the won was devalued by almost 100 percent, and a unitary managed (floating) exchange system was instituted in 1965. The govern- ment also began to provide a variety of tax exemptions, tariff rebates on materials imported for export production, easy credit for export com- panies, reduced rates on public utilities for exporters, simplified customis procedures, and accelerated depreciation allowances for exporters.
Financing beyond the scale of foreign aid was needed to implement this export-based strategy. Several measures were adopted to raise the necessary funds, including government guarantees for qualified foreign loans to private Korean companies. Real deposit interest rates were increased to raise the low national saving rate and thus help close the saving gap. The saving rate in fact increased from 3.2 percent in 1965 to 14.5 percent in 1971, although it is not clear whether this increase was caused by higher interest rates. To control resource allocation the government repossessed a major portion of equity shares of nationwide commercial banks in 1961 and thereafter exercised tight control over the lending activities of these institutions.39 To control capital allocation, the government confiscated a major portion of equity shares of national banks.
During the first five-year plan period (1962-66), exports quadrupled, while imports less than doubled. During the second five-year plan period (1967-71), exports grew more than fourfold while imports little more than tripled. Fueled by the growth in exports, the economy maintained a high GNP growth rate, averaging 8.7 percent during the two periods, and per capita growth averaged 6.9 percent, considerably higher than the 0.7 percent of the reconstruction period.
39. The banks had been denationalized in the late 1950s.

442 Brookings Papers on Economic Activity, 2:1987
Heavy and Chemical Industrialization: 1972-79
In the 1970s, Korea faced political and economic changes that convinced policymakers to promote heavy and chemical industries. Politically, the United States announced that it wanted to reduce its defense commitments to Korea, prompting the Korean government to build up defense-related heavy industries. Economically, the first oil crisis showed Korea's vulnerability to external shocks. Growing protec- tionism after the decline of the Bretton-Woods system and high prices for imported grain also forced Korea to reassess its development strategy. Furthermore, because other developing countries with cheaper labor began to enter labor-intensive industries, Korean products were losing their price competitiveness. Given these external changes, poli- cymakers began to modify their strategy by promoting import-substitu- tion industries, particularly heavy and chemical industries, and by increasing the output of the rural sector.
The biggest obstacle to the heavy and chemical industrialization drive was the huge capital requirement of these industries. Public employee pension funds were used to mobilize resources for the investment drive, and a substantial amount of private saving was directed toward these sectors by the National Investment Fund. These funds were then channeled, often at negative real interest rates, into heavy and chemical projects such as shipbuilding, automobiles, steel products, nonferrous metals, and petrochemicals. Moreover, banks were urged to make additional loans available, again at artificially low interest rates.
Since these industries enjoyed scale economies and since the domestic economy was small, the government granted monopolistic production to certain companies. A number of firms financed by the government rapidly became very large, challenging multinationals in size and often becoming multinationals themselves.
Another area of concern was the agricultural sector. Because of the higher productivity in the manufacturing sector, the income differences between rural residents and urbanites became acute. The government sought to help agriculture by investments and loans and by a costly grain price support system that financed the discrepancy between high pro- ducer prices and the lower price paid by consumers. These measures helped narrow the income gap.

Rudiger Dornbusch and Yung Chul Park 443
While these policies contributed to the average 9.7 percent annual real GNP growth rate between 1972 and 1979, they had side effects: excessive investment in heavy industries, underdevelopment of light industries, lack of competition due to government controls, overreliance on external markets, and high inflation. Between 1972 and 1979, inflation averaged 18 percent as opposed to only 12 percent between 1962 and 1971.
Liberalization: 1980-Present
The problems of the heavy and chemical industrialization drive gave rise to a reorientation of policies to emphasize inflation fighting, liberal- ization, and a shift in emphasis away from the heavy and chemical industry. Inflation reduction was to be achieved by control of the money supply. A freeze on new projects in the overexpanded heavy and chemical industry and the allocation of credit toward light industries and small firms would shift resources. Finally, selective import liberalization would initiate an opening of the economy to enhance competition.
The second oil crisis, political instability, and possibly the shift in policies caused the economy to experience a sharp decline in output in 1980. The fall of GNP by 4.8 percent in that year was the first and only economic contraction in modern Korean history.
Since 1981 policies have kept inflation low. Monetary control and a sharp shift in the budget, combined with favorable external shocks in 1985-86, helped achieve that result. The government budget deficit as a ratio of GNP dropped from 4.7 percent in 1981 to just 1 percent in 1985. In addition, wage increases were restrained. A Fair Trade Act was initiated to reduce monopolistic practices, and import liberalization got under way, as did liberalization of the financial sector. Manufacturers had previously been shielded from international competition through import barriers. But a growing trade surplus invited pressure from the United States to move ahead with liberalization. A number of markets were in fact opened, raising the import liberalization ratio from 68 percent in 1979 to 92 percent in 1986. Tariff rates were reduced from 39 percent in 1978 to only 20 percent in 1986.40 Also, foreign investment regulations began to be relaxed.
40. General Agreement on Tariffs and Trade, International Trade 1985-86.

444 Brookings Papers on Economic Activity, 2:1987
The period since 1981, world recession and high interest rates not- withstanding, has been very successful. Growth rates averaged 8.4 percent, and, with the help of favorable external price shocks, inflation has been practically eliminated. But 1986 brought not only 12.5 percent growth, but also a new challenge. For the first time in the modern Korean history, the saving rate exceeded the investment ratio, and hence the current account balance turned from a chronic deficit to a $5 billion surplus.

Comments and Discussion
Susan M. Collins: Rudiger Dornbusch and Yung Chul Park have provided a useful and stimulating paper. They discuss both the role of policy in South Korea's impressive economic development and the appropriate policy responses to Korea's current "problem": large external surpluses. The paper reaches two conclusions, both of which I found convincing. First, it casts wages, investment, and government intervention in the lead roles in Korea's "growth policy," with macro- economic policies as the supporting actors. Second, it argues against moves to cut Korea's overall current account surplus, concluding that U.S. protectionism is better dealt with through bilateral Korea-U.S. trade arrangements.
While I agree with the thrust of the paper, I think that there is an important omission in the theme and the conclusions because so little emphasis is placed on the role of saving. In contrast to the recent U.S. experience, the trend in Korean saving has been a rapid increase, and this increase has been one of the keys to Korea's success.
The authors can claim that mention of saving "is in there." And it is (see table 13), along with a wealth of other interesting facts and figures. But in synthesizing the many pieces, the first half of the paper gives surprisingly little attention to integrating the intertemporal issues of saving, current account imbalance, and external borrowing into the discussion of wages and productivity-even though external surplus is the focus of the second half of the paper.
In the same vein, the authors use the Ricardian trade model to illustrate their points about wages and labor productivity. This is fine, but it only tells part of Korea's story. At the end of my comments, I would like to show that it is not difficult to extend the model to two periods so as to incorporate intertemporal issues, and to give additional analytic content. I will summarize the main arguments in the paper as I go along.
445
446 Brookings Papers on Economic Activity, 2:1987
The authors describe Korea's growth strategy as having four inter- related components: labor, investment, productivity, and wages. The hard-working and well-educated work force, together with high rates of investment, led to rapidly growing labor productivity. Nominal wage restraint plus productivity growth enabled Korea to achieve the enviable combination of increased competitiveness and real wage gains.
They argue that these four components were supported by sensible macroeconomic policies and active interventionism. Taxes have risen relative to income, providing noninflationary finance for government expenditures. Fiscal deficits and monetary growth have both been moderate. With the exception of a few years in the late 1970s, the government maintained competitive exchange rates.
The analysis also provides a convincing counterargument to the view that market liberalization is a necessary prerequisite for growth. Until recently, the government maintained pervasive trade restrictions and subsidies as well as control over the allocation of domestic and foreign credit. Korea shows clearly that government intervention can work well if done properly. I agree with the authors that these are some of the most important lessons that Korea has to teach about successful growth policy.
Is this a new development strategy? The authors provocatively argue that Korean growth policy combines elements from Germany, Japan, and Brazil, and that, in fact, there is little we have not seen before. Like Germany and Japan, Korea has low wages with high investment and productivity growth. As in Japan, there has been active government intervention through credit markets. Like Brazil, Korea combines protection of infant industries with subsidization of exports.
Although the discussion of the similarities is interesting, the paper does not pull together some of the most important lessons from Korea precisely because too little attention is paid to the differences. The authors do mention that neither Japan nor Germany ran current account deficits or accumulated external debts during industrialization. In addi- tion, exports remained a relatively constant fraction of income in both countries. Korea's experience is strikingly different, and this warrants further attention, especially because other developing countries are more likely to resemble Korea.
Both Germany and Japan began their industrializations with high fixed investment rates, 18.7 percent in Germany in 1951 and 19.8 percent in Japan in 1955. Some of the investment was financed by foreign aid.

Rudiger Dornbusch and Yung Chul Park 447
However, both countries, and especially Japan, began with high domes- tic saving rates.
In contrast, Korea was faced with declining aid flows in the early years of industrialization. Domestic saving was less than 6 percent of GDP in 1963. A major component of Korea's first five-year plan was to mobilize foreign borrowing so as to finance investment. The government instituted a successful system of exchange guarantees to stimulate foreign borrowing.
After an initial rise, investment rates remained a relatively constant share of income in both Germany and Japan (23-26 percent and 29-30 percent, respectively). Korea began with a relatively low investment rate (13 percent during the first five-year plan, 1962-66), which has increased with each successive plan, to 32 percent during 1984-86. But despite a dramatic rise in domestic saving, Korea accumulated a $12.8 billion current account deficit over 1965-79.
In this context, Korea's export orientation looks very different from Germany's. In Germany, the ratio of exports to income remained at about 20 percent throughout the industrialization. In Japan, the ratio remained constant at 11 percent. However, no problem emerged because these countries did not need to repay external debts.
Two major parts of Korea's success are that investment was effec- tively channeled into rapidly growing exports, which rose from 9 percent of income in 1965 to 37 percent in 1980, and that domestic saving has risen more quickly than investment. Korea's saving performance emerges as one of the keys to Korea's success. Without the saving, the continued investment and productivity gains would not have been possible. The issue is critical but receives little attention in the paper.
There are a number of unusual aspects of Korean saving. Unlike many other debtor countries where current account deficits have been reduced by slashing investment, current account improvement in Korea comes as saving rises. Investment is never cut but consistently exceeds the target from the five-year plans, even during crisis years such as 1980- 81. (The planned investment rates were 25.9 percent and 26 percent, while the actual rates were 32 percent and 30 percent.)
Furthermore, most of the movements in Korean saving come from the household sector, and not from the government or corporate sectors. Current account deficits (for example, after each of the oil shocks) have been associated with plunges in household saving. The 1986-87 surplus seems largely attributable to high household saving.

448 Brookings Papers on Economic Activity, 2:1987
The authors attribute the surplus to an improvement in the budget as well as to increased private saving. However, I can find little support for this claim in the data. Most of the budget improvement occurred much earlier: the deficit was reduced from more than 4 percent of output in 1982 to 1.6 percent in 1983, mainly through the privatization of some public enterprises. In fact, there was a slight deterioration in the budget between 1985 and 1986, the first year of current account surplus.
The movements in Korean household saving are well explained by a simple framework that distinguishes between permanent and transitory (disposable) income.1 Estimates for the marginal propensities to save are 0.12 and 0.45, respectively. This saving function implies that the ratio of saving to income will rise with income and that upward (downward)jumps in the saving rate will be associated with unexpectedly high (low) income growth.
The analysis of saving provides a strong reason to believe that much of Korea's current account surplus is transitory, arising from very high growth rates (12.5 percent in 1986). Not all of the data required for a careful sectoral decomposition of 1986 saving are available. However, a rough calculation attributes about 23 percent of the 1986 surplus to temporarily high income growth rates.2
Finally, I will end my comments by sketching an analytic framework that seems particularly appropriate for Korea. The accepted facts are that Korea borrowed heavily to invest in the first stage of industrializa- tion. Investment has paid off through rapid labor productivity growth, making Korea competitive in an expanding range of products and enabling her to begin repaying the external debts. Wages have remained relatively low throughout.
1. See Susan M. Collins and W. A. Park, "External Debt and Macroeconomic Performance in Korea" (Harvard University and National Bureau of Economic Research, 1987), for further discussion of this empirical saving equation.
2. To calculate this figure, I assumed that 4 percent of the 12.5 percent real growth in 1986 was perceived as transitory. (The average growth rate over 1981-86 was 8.7 percent.) The ratio of household disposable to total income was assumed to be 72 percent (the 1982- 85 average). Finally, the ratio of 1985 to 1986 income is 89 percent. Thus, the transitory component of 1986 disposable income as a share of 1986 GDP was approximately 0.26 (0.04 x 0.72 x 0.89 = 0.26). Multiplying by the marginal propensity to save out of transitory income (0.45) gives an estimate of 1.15 percent as the household saving attributable to transitory income growth as a share of GDP. The figure is about 23 percent of the $4.6 billion current account surplus in 1986.
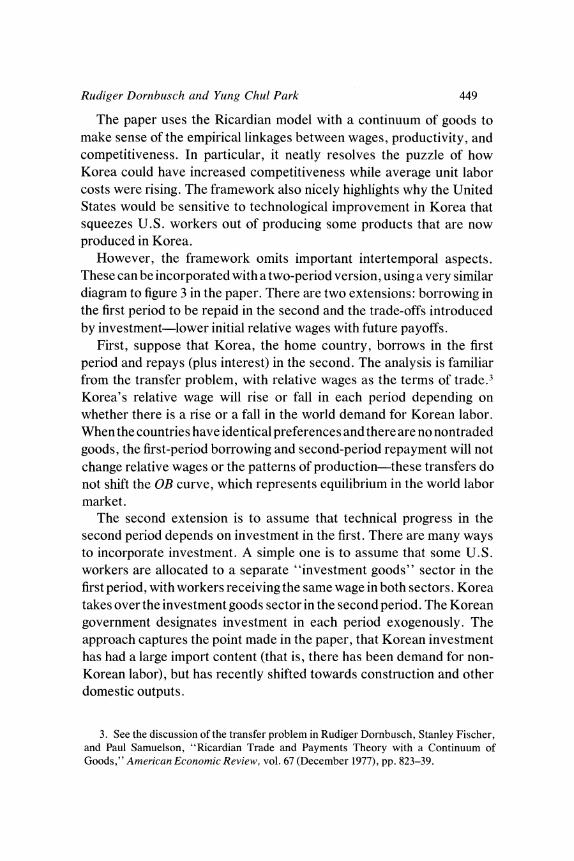
Rudiger Dornbusch and Yung Chul Park 449
The paper uses the Ricardian model with a continuum of goods to make sense of the empirical linkages between wages, productivity, and competitiveness. In particular, it neatly resolves the puzzle of how Korea could have increased competitiveness while average unit labor costs were rising. The framework also nicely highlights why the United States would be sensitive to technological improvement in Korea that squeezes U.S. workers out of producing some products that are now produced in Korea.
However, the framework omits important intertemporal aspects. These can be incorporated with a two-period version, using a very similar diagram to figure 3 in the paper. There are two extensions: borrowing in the first period to be repaid in the second and the trade-offs introduced by investment-lower initial relative wages with future payoffs.
First, suppose that Korea, the home country, borrows in the first period and repays (plus interest) in the second. The analysis is familiar from the transfer problem, with relative wages as the terms of trade.3 Korea's relative wage will rise or fall in each period depending on whether there is a rise or a fall in the world demand for Korean labor. When the countries have identical preferences and there are no nontraded goods, the first-period borrowing and second-period repayment will not change relative wages or the patterns of production-these transfers do not shift the OB curve, which represents equilibrium in the world labor market.
The second extension is to assume that technical progress in the second period depends on investment in the first. There are many ways to incorporate investment. A simple one is to assume that some U.S. workers are allocated to a separate "investment goods" sector in the first period, with workers receiving the same wage in both sectors. Korea takes over the investment goods sector in the second period. The Korean government designates investment in each period exogenously. The approach captures the point made in the paper, that Korean investment has had a large import content (that is, there has been demand for non- Korean labor), but has recently shifted towards construction and other domestic outputs.
3. See the discussion of the transfer problem in Rudiger Dornbusch, Stanley Fischer, and Paul Samuelson, "Ricardian Trade and Payments Theory with a Continuum of Goods," American Economic Review, vol. 67 (December 1977), pp. 823-39.
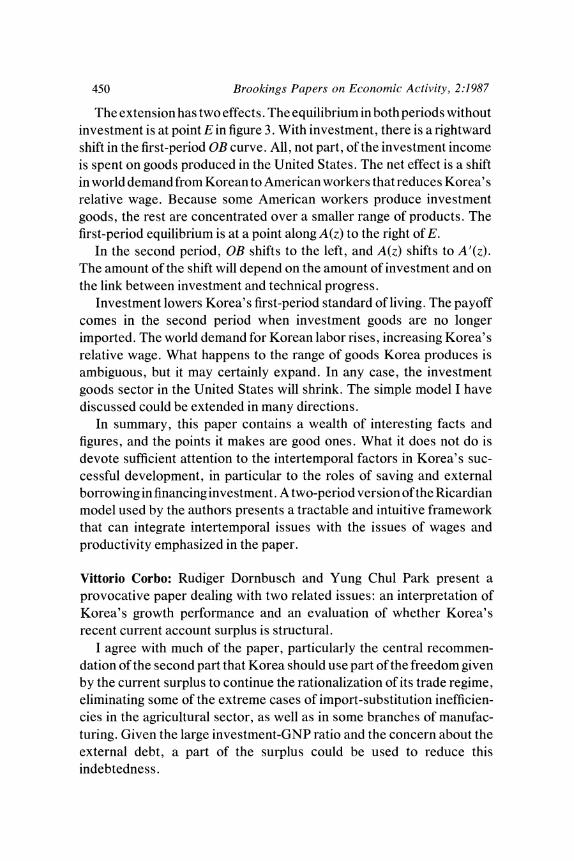
450 Brookings Papers on Economic Activity, 2:1987
The extension has two effects. The equilibrium in both periods without investment is at point E in figure 3. With investment, there is a rightward shift in the first-period OB curve. All, not part, of the investment income is spent on goods produced in the United States. The net effect is a shift in world demand from Korean to American workers that reduces Korea's relative wage. Because some American workers produce investment goods, the rest are concentrated over a smaller range of products. The first-period equilibrium is at a point along A(z) to the right of E.
In the second period, OB shifts to the left, and A(z) shifts to A'(z). The amount of the shift will depend on the amount of investment and on the link between investment and technical progress.
Investment lowers Korea's first-period standard of living. The payoff comes in the second period when investment goods are no longer imported. The world demand for Korean labor rises, increasing Korea's relative wage. What happens to the range of goods Korea produces is ambiguous, but it may certainly expand. In any case, the investment goods sector in the United States will shrink. The simple model I have discussed could be extended in many directions.
In summary, this paper contains a wealth of interesting facts and figures, and the points it makes are good ones. What it does not do is devote sufficient attention to the intertemporal factors in Korea's suc- cessful development, in particular to the roles of saving and external borrowing in financing investment. A two-period version of the Ricardian model used by the authors presents a tractable and intuitive framework that can integrate intertemporal issues with the issues of wages and productivity emphasized in the paper.
Vittorio Corbo: Rudiger Dornbusch and Yung Chul Park present a provocative paper dealing with two related issues: an interpretation of Korea's growth performance and an evaluation of whether Korea's recent current account surplus is structural.
I agree with much of the paper, particularly the central recommen- dation of the second part that Korea should use part of the freedom given by the current surplus to continue the rationalization of its trade regime, eliminating some of the extreme cases of import-substitution inefficien- cies in the agricultural sector, as well as in some branches of manufac- turing. Given the large investment-GNP ratio and the concern about the external debt, a part of the surplus could be used to reduce this indebtedness.

Rudiger Dornbusch and Yang Chlil Park 451
I am going to concentrate my remaining comments on points where I have some disagreement with the authors. Dornbusch and Park single out four factors that account for Korea' s growth:
-The labor force is better educated and works harder than those in most developing countries. Hourly wages are lower than those in newly industrialized countries like Taiwan and Singapore.
-People save and borrow wisely, and policies are active, but not grossly misdirected.
-Budget deficits are moderate, and the real effective exchange rate rarely gets out of line.
-The outward-oriented growth strategy has been more conducive to growth than the typical import-substitution model of the Latin American countries.
The first two of these arguments are not convincing. The labor forces of Argentina and Uruguay are better educated than the Korean one, and hourly wages are lower in Argentina and Uruguay than in Korea. On the second point, as the authors themselves recognize, the high saving can be explained by standard macroeconomic variables, such as current income, the growth of income, inflation, and, sometimes, real interest rates. All these characteristics are the result of what may be the most important factors that differentiate Korea from most of Latin American countries: low inflation, a stable real exchange rate, and an outward- oriented trade strategy. The stable macroframework and the export- expansion bias of policies (and the avoidance of the extreme import- substitution bias typical of Latin American countries) have contributed much to the favorable performance of the Korean economy.
In Korea, growth has not been as smooth as indicated in the paper. Indeed, during the period of 1973-80, which is mentioned only briefly in the paper, Korea moved away from the successful policies of the 1960s. The performance of this period shows clearly the importance of a stable macroframework and the avoidance of an extreme import-substitution bias in economic policies.
During 1973-80, Korea adjusted its development strategy, embarking on an enormous investment effort in the heavy and chemical industries, with the aim of strengthening the country's industrial structure. Large- scale investment projects in these industries were encouraged through special tax incentives, preferential credit allocation, and negative real interest rates in a system dominated by widespread credit rationing. On the. mrn.rnecnnnromir, qidie the. rPreqqionnrv effect of the, shqrn dron in
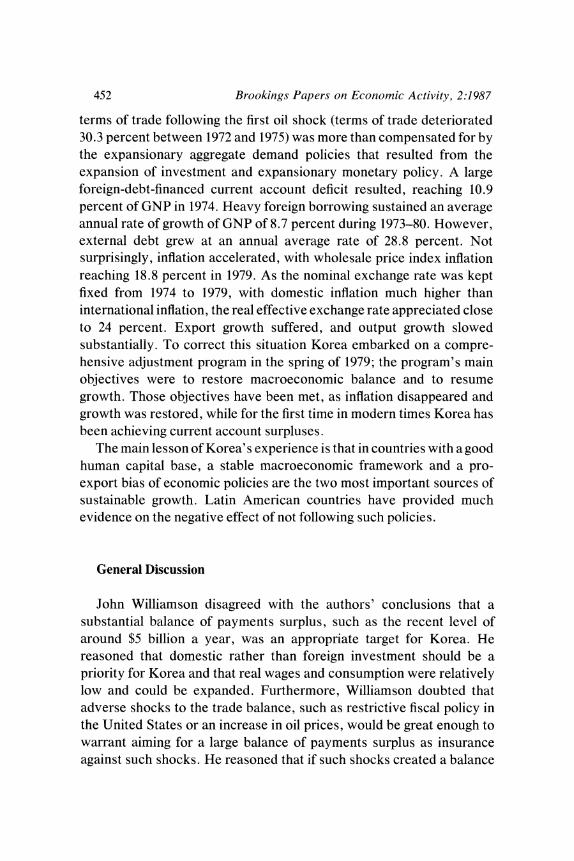
452 Brookings Papers otn Economic Activity, 2:1987
terms of trade following the first oil shock (terms of trade deteriorated 30.3 percent between 1972 and 1975) was more than compensated for by the expansionary aggregate demand policies that resulted from the expansion of investment and expansionary monetary policy. A large foreign-debt-financed current account deficit resulted, reaching 10.9 percent of GNP in 1974. Heavy foreign borrowing sustained an average annual rate of growth of GNP of 8.7 percent during 1973-80. However, external debt grew at an annual average rate of 28.8 percent. Not surprisingly, inflation accelerated, with wholesale price index inflation reaching 18.8 percent in 1979. As the nominal exchange rate was kept fixed from 1974 to 1979, with domestic inflation much higher than international inflation, the real effective exchange rate appreciated close to 24 percent. Export growth suffered, and output growth slowed substantially. To correct this situation Korea embarked on a compre- hensive adjustment program in the spring of 1979; the program's main objectives were to restore macroeconomic balance and to resume growth. Those objectives have been met, as inflation disappeared and growth was restored, while for the first time in modern times Korea has been achieving current account surpluses.
The main lesson of Korea's experience is that in countries with a good human capital base, a stable macroeconomic framework and a pro- export bias of economic policies are the two most important sources of sustainable growth. Latin American countries have provided much evidence on the negative effect of not following such policies.
General Discussion
John Williamson disagreed with the authors' conclusions that a substantial balance of payments surplus, such as the recent level of around $5 billion a year, was an appropriate target for Korea. He reasoned that domestic rather than foreign investment should be a priority for Korea and that real wages and consumption were relatively low and could be expanded. Furthermore, Williamson doubted that adverse shocks to the trade balance, such as restrictive fiscal policy in the United States or an increase in oil prices, would be great enough to warrant aiming for a large balance of payments surplus as insurance against such shocks. He reasoned that if such shocks created a balance

Rudiger Dornbusch and Yung Chul Park 453
of payments deficit, Korea could rely upon international borrowing because it has reestablished its creditworthiness, and its debt-export ratio is in an acceptable range. Williamson also disagreed with the authors' presumption that global coordination can be dismissed for a smaller country like Korea whereas it is relevant for a larger country like Japan. Indeed, he argued that a country like Korea may be more vulnerable to retaliation and sanctions if its external balance is seen as out of line. Overall, he concluded that the goal for Korea should be a current account balance.
A number of participants addressed the issue of how to reduce the current account surplus, assuming, with Williamson, that such a reduc- tion is desirable. Stanley Fischer questioned the authors' prescription for establishing a bilateral free trade area between Korea and the United States, noting that Israel now regards its open trade with the United States as disadvantageous. With legal barriers removed, the United States has been able to assure its access to Israeli markets, while Israel has continued to encounter significant barriers in U.S. markets. Fischer concluded that Korea might lose more than it gained from a similar agreement. Williamson reasoned that trade liberalization would be a good way to reduce the surplus, and further recommended that Korea bring about a real appreciation of the won. In doing so, he favored a nominal appreciation of the won as opposed to a rise in nominal wages because a large nominal wage increase could increase wage demands in the future even if they were not warranted by international competitive- ness. Williamson argued further that expenditures should be increased either through fiscal policy or by introducing consumer credit to stimulate consumption.
Robert Gordon found the role of investment in promoting growth in Korea unclear from the data the authors presented. The investment- GDP ratio increased dramatically after 1973, but the growth rate of real GDP declined from 10.3 percent in the decade before 1976 to 6.4 percent in the subsequent decade. Dornbusch replied that this inconsistency may be due, in part, to revisions of the national income accounts that were made for 1970 onward, and that comparisons were also somewhat sensitive to the end point years that were used. In analyzing the sources of growth, a slower though still substantial rate of productivity growth accounts for the slowdown in GDP growth between 1963-72 and 1972- 82 shown in table 5.

454 Brookings Papers on Economic Activity, 2:1987
William Branson suggested that more attention be paid to the policy change that occurred at the end of the 1970s and the subsequent problems that arose. During the 1970s, Korea followed a policy of credit subsidy for export-oriented or heavy industries, with the result that the nonsub- sidized industries had to borrow at higher rates. When this policy was relaxed, many firms in the previously favored sectors went bankrupt due to overcapitalization while many firms in the other sectors reduced employment in order to increase capital intensity. Both sectors, Branson concluded, experienced problems once the credit-constraint system was removed. Dornbusch responded that many of the problems in this period, in industries such as chemicals, resulted from the oil crisis rather than from the development policy. Stanley Fischer observed that the data in the paper on income distribution did not include an analysis of the profit share. He reasoned that a more complete analysis of income distribution would assign profits to the incomes of individuals and might alter the inferences shown in the paper.