korea: medium and long-term economic prospects joseph e. stiglitz columbia university, new york may...
TRANSCRIPT
KOREA: MEDIUM AND LONG-TERM ECONOMIC PROSPECTS
Joseph E. StiglitzColumbia University, New York
May 19, 2004
Economic Performance Since 1997
Impressive and fast recovery. GDP grew at an average of 7% per year during 1998-2003
Recovery and growth performance of other crisis countries have been much slower
Similarities (among the crisis countries) in shape and trend shows the level of regional and global integration – differences are due to differences in underlying macroeconomic and institutional structures
Human capital – more educated workforce and improved labor productivity
Gross government debt is about 22% of GDP – far less than the OECD average of 74%
Gradually reducing reliance on manufacturing – becoming a knowledge-based service economy. Share of the service sector increased substantially
Reforms are slow but in the right direction
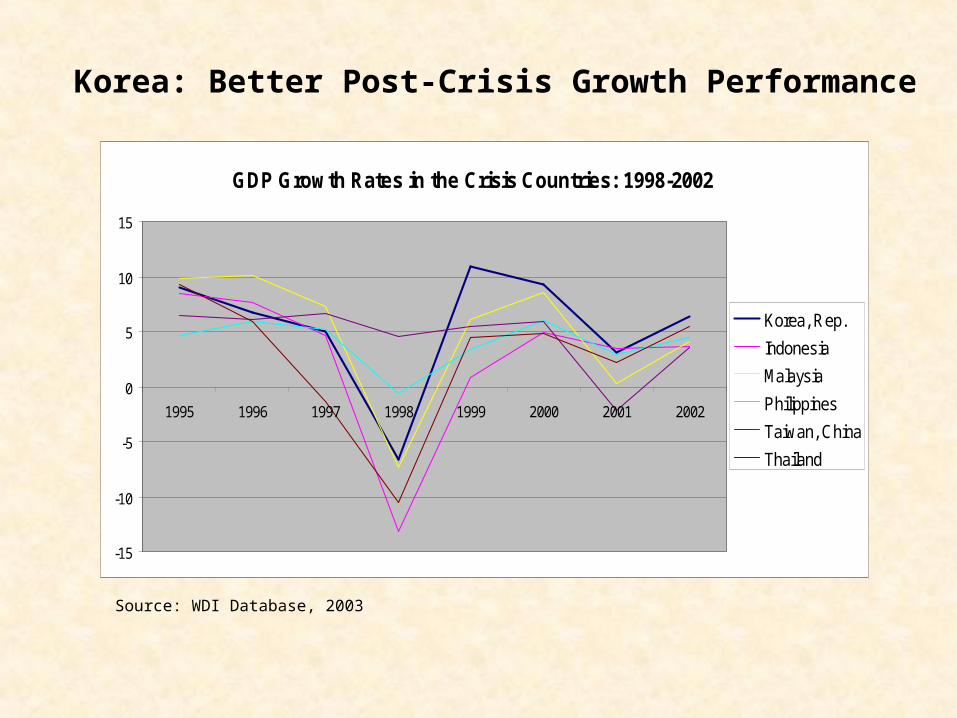
GDP Growth Rates in the Crisis Countries: 1998-2002
-15
-10
-5
0
5
10
15
1995 1996 1997 1998 1999 2000 2001 2002
Korea, Rep.
Indonesia
Malaysia
Philippines
Taiwan, China
Thailand
Korea: Better Post-Crisis Growth Performance
Source: WDI Database, 2003
Investment in Building Human Capital
Education is the largest line-item in the central government budget – 24.4% of the total in 2003
Korea is only behind Canada, Ireland and Japan in terms of the percentage of population with tertiary education – 40% of all Koreans have a university degree
Among the OECD countries, Korea ranks number one in terms of students enrolled in higher education – 53% of 20-year old Koreans are in college compared to 34% for the US and 15% for Germany
Korea also ranks at the top in terms of college graduates with degrees in engineering and applied science. 27.2% of all college graduates in Korea obtain degrees in engineering
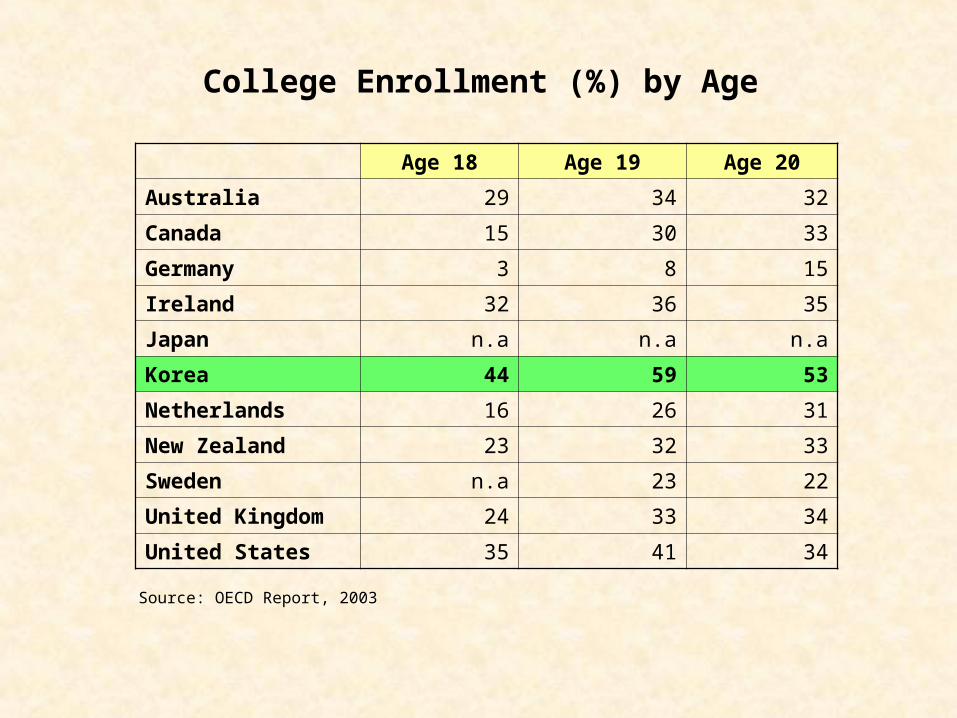
College Enrollment (%) by Age
Age 18 Age 19 Age 20
Australia 29 34 32
Canada 15 30 33
Germany 3 8 15
Ireland 32 36 35
Japan n.a n.a n.a
Korea 44 59 53
Netherlands 16 26 31
New Zealand 23 32 33
Sweden n.a 23 22
United Kingdom 24 33 34
United States 35 41 34
Source: OECD Report, 2003
Investment in Research and Development
Between 1991 and 2001, Korea’s R&D expenditure (as % of GDP) grew by 4.83% per year
During the same period, Japan and the US increased R&D expenditure by 1.19% and .41% annually
Korea’s share (as % of GDP) of R&D expenditure is one of the highest among the OECD countries (only after Sweden, Finland, Iceland and Japan)
76.01% of Korean R&D expenditure is borne by business enterprises. Comparable figure for other countries are lower
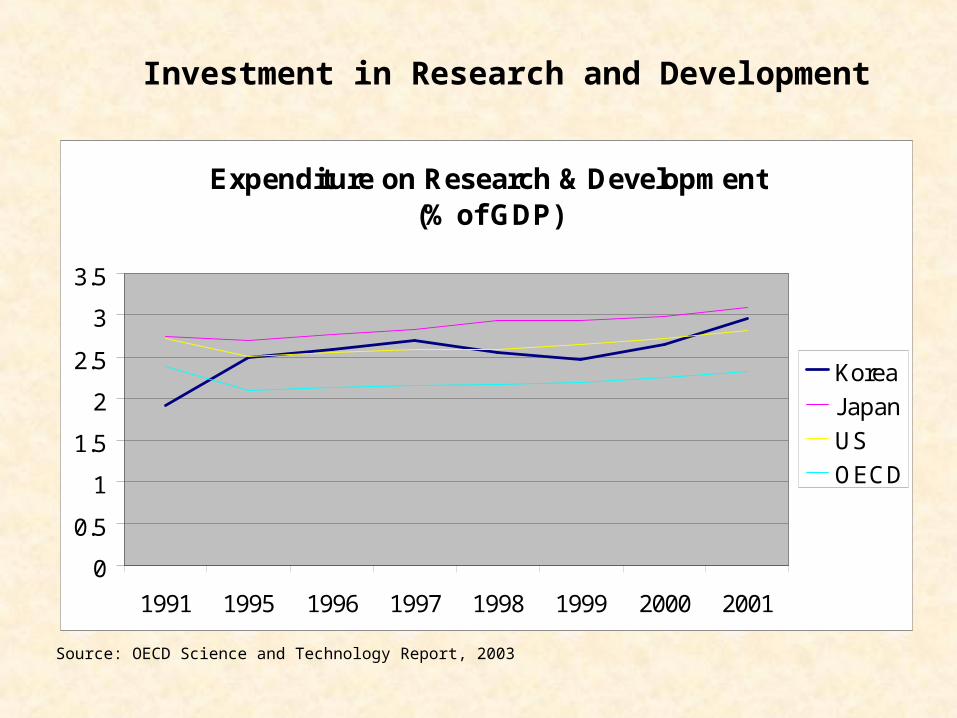
Expenditure on Research & Development (% of GDP)
0
0.5
1
1.5
2
2.5
3
3.5
1991 1995 1996 1997 1998 1999 2000 2001
Korea
Japan
US
OECD
Investment in Research and Development
Source: OECD Science and Technology Report, 2003
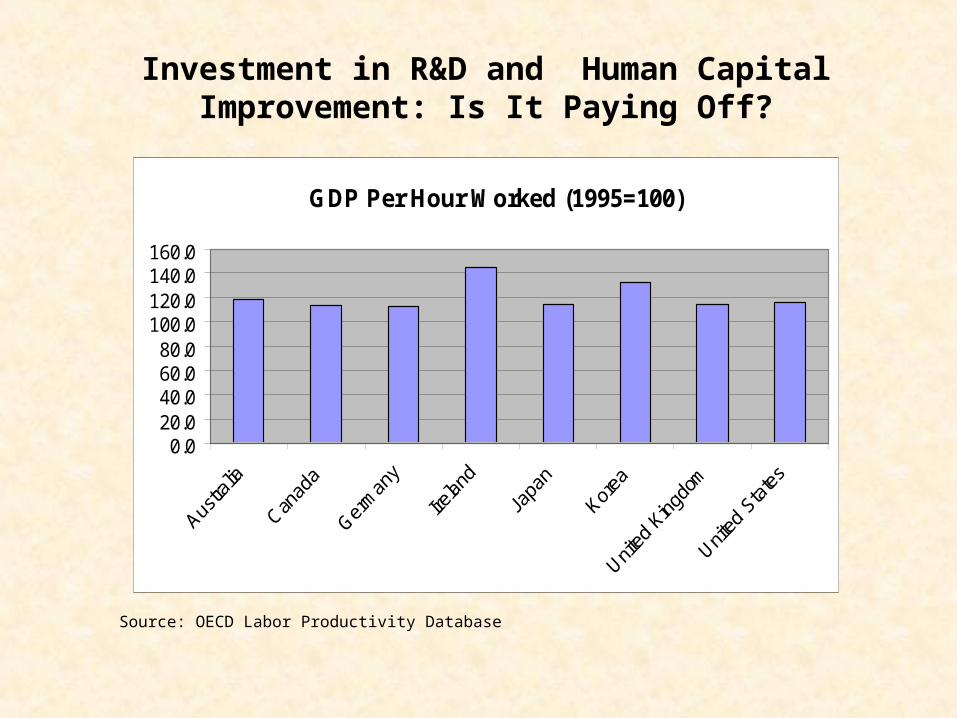
Investment in R&D and Human Capital Improvement: Is It Paying Off?
Yes!
Labor productivity grew by 5.1% per year during 1990-95 (highest among the OECD countries) and by 4.0% during 1995-2002 (second after Ireland)
Labor productivity in Japan and the United States grew by 2% during 1995-2002
In 2002, Korea registered a GDP per hour worked as $132 (1995=100) – Ranked only after Ireland
Number of patent applications increased at an annual rate of 24.6% during 1991-2001 – the highest rate for any country of the world
Investment in R&D and Human Capital Improvement: Is It Paying Off?
GDP Per Hour Worked (1995=100)
0.020.040.060.080.0
100.0120.0140.0160.0
Source: OECD Labor Productivity Database
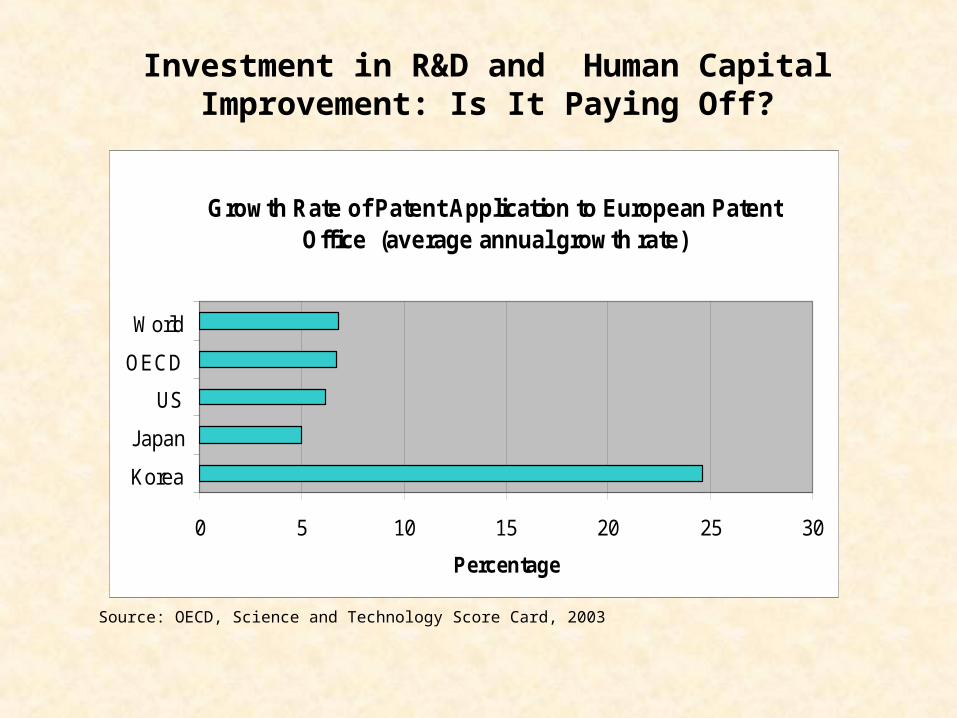
Investment in R&D and Human Capital Improvement: Is It Paying Off?
Growth Rate of Patent Application to European Patent Office (average annual growth rate)
0 5 10 15 20 25 30
Korea
Japan
US
OECD
World
Percentage
Source: OECD, Science and Technology Score Card, 2003
Is it Paying Off? Korea on Its Way to Become a High-tech Service Sector Economy…
Service sector value-added, as percentage of GDP, increased from 50.60% in 1995 to 55.10% in 2002 – a large sectoral transformation in a relatively short period of time
Service sector export grew at an annual rate of 5.8% during 1990-2001 and at 6.7% during 1995-2001. During these two periods, US service sector export grew by .5% and -.1% respectively
Labor force participation in service sector grew even faster – between 1995 and 2002, number of people employed in the service sector increased by 14.94%
Is It All Good News Then? Not really!!
Falling gross savings rate – diminishing investment
Falling share of export and deteriorating terms of trade
Not enough FDI or bond market participation to compensate for falling savings rate – lack of institutional investors and lack of confidence in market process
Industry ‘concentration ratios’ (in terms of market share) – are still high - Poorly performing corporate sector and still difficult ‘bankruptcy’ process
Under-performing banking sector – banks are yet to learn to live in a world without ‘Government Guarantees’
Weak regulatory environment – lack of adequate monitoring, supervision and inadequate ‘competition’ policy
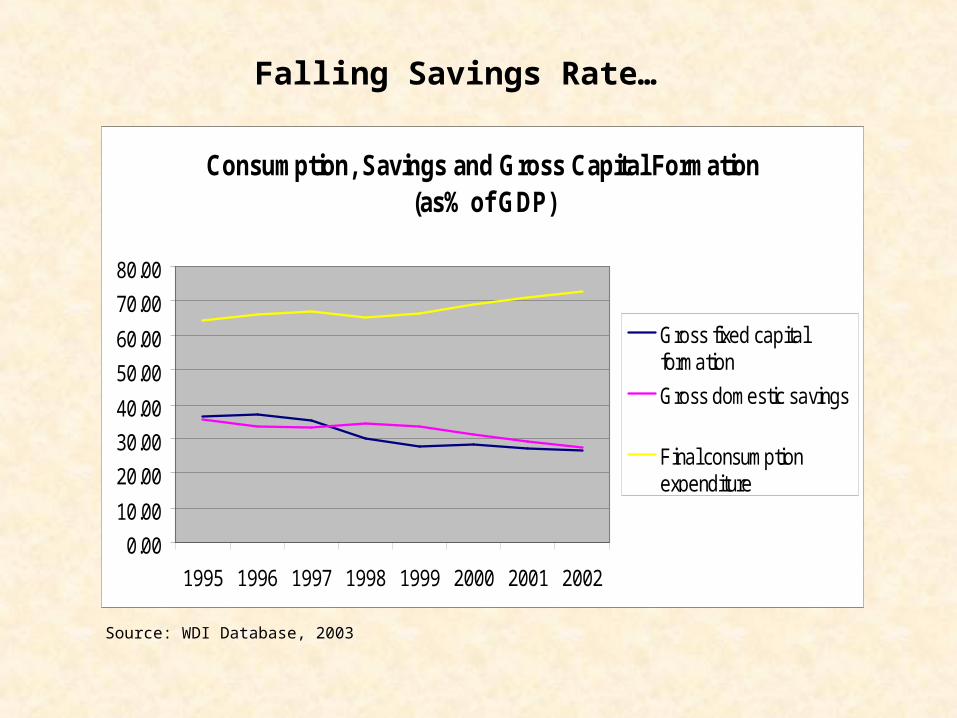
Falling Savings Rate…
Consumption, Savings and Gross Capital Formation (as% of GDP)
0.00
10.00
20.00
30.00
40.00
50.00
60.00
70.00
80.00
1995 1996 1997 1998 1999 2000 2001 2002
Gross fixed capitalformation
Gross domestic savings
Final consumptionexpenditure
Source: WDI Database, 2003
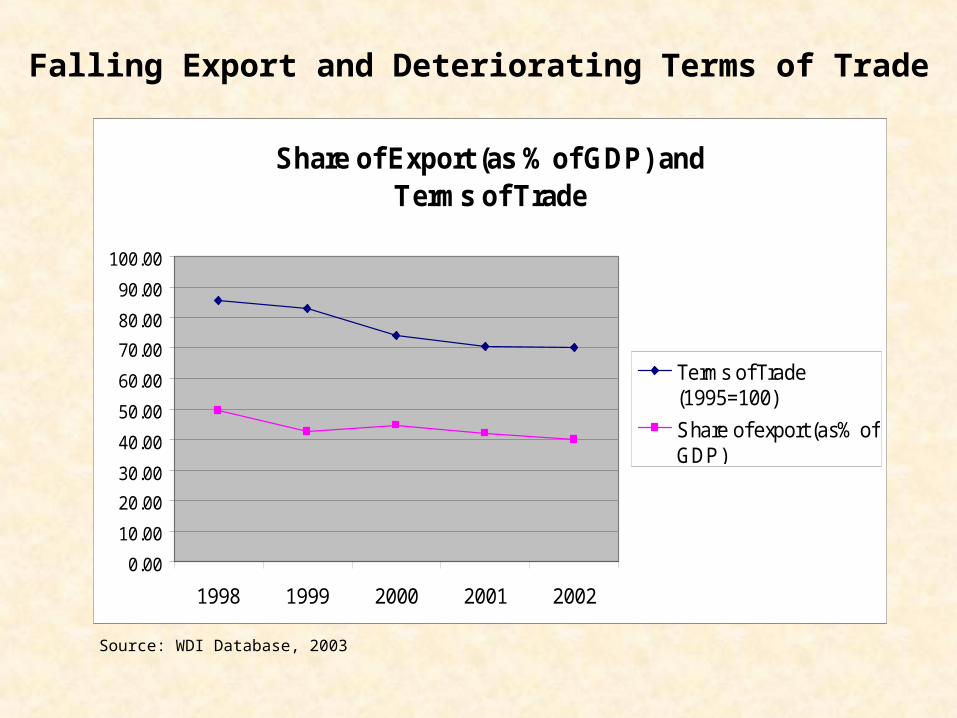
Falling Export and Deteriorating Terms of Trade
Share of Export (as % of GDP) and Terms of Trade
0.00
10.00
20.00
30.00
40.00
50.00
60.00
70.00
80.00
90.00
100.00
1998 1999 2000 2001 2002
Terms of Trade(1995=100)
Share of export (as% ofGDP)
Source: WDI Database, 2003
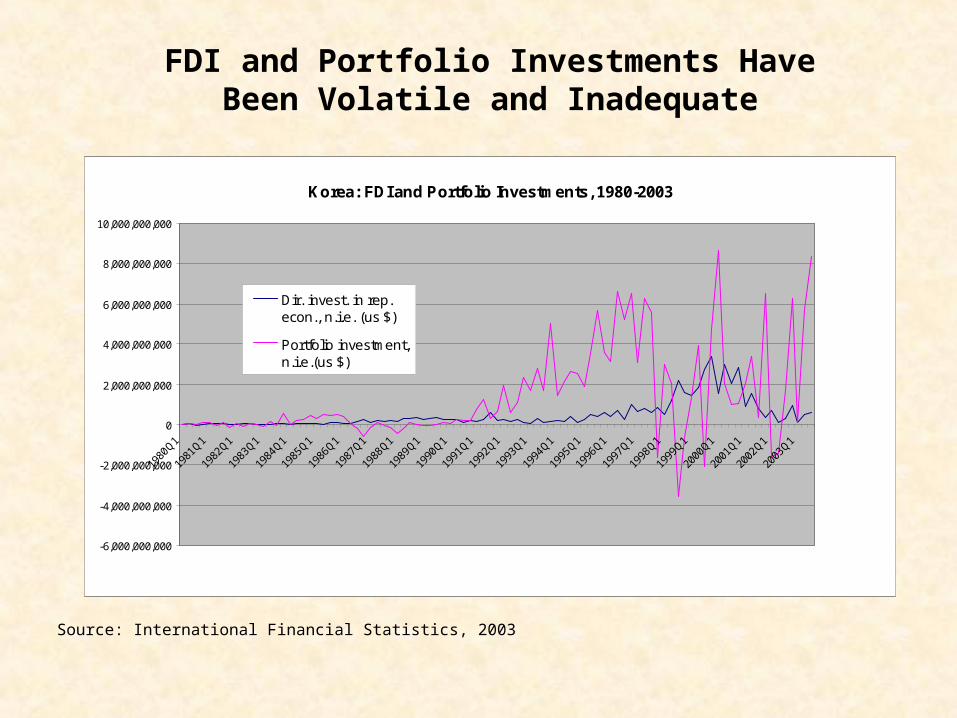
FDI and Portfolio Investments Have Been Volatile and Inadequate
Korea: FDI and Portfolio Investments, 1980-2003
-6,000,000,000
-4,000,000,000
-2,000,000,000
0
2,000,000,000
4,000,000,000
6,000,000,000
8,000,000,000
10,000,000,000
1980
Q1
1981
Q1
1982
Q1
1983
Q1
1984
Q1
1985
Q1
1986
Q1
1987
Q1
1988
Q1
1989
Q1
1990
Q1
1991
Q1
1992
Q1
1993
Q1
1994
Q1
1995
Q1
1996
Q1
1997
Q1
1998
Q1
1999
Q1
2000
Q1
2001
Q1
2002
Q1
2003
Q1
Dir. invest. in rep.econ., n.i.e. (us $)
Portfolio investment,n.i.e.(us $)
Source: International Financial Statistics, 2003
Lack of Institutional Investors and Outside Monitoring
Non-bank institutional investors hold a relatively small share of the financial assets
In 2001, Korean Pension Funds held only 4.15% of the total financial assets. Comparable figures for the U.S. and Japan are 32.98% and 19.50% respectively
Corporate bond’s share in the total bond market declined from 38.4% in 1997 to 27.0% in 2002
Foreigners hold only .11% of all outstanding Korean bonds – very low foreign participation by OECD standard
However, Share of guaranteed bonds has been steadily falling since 1997
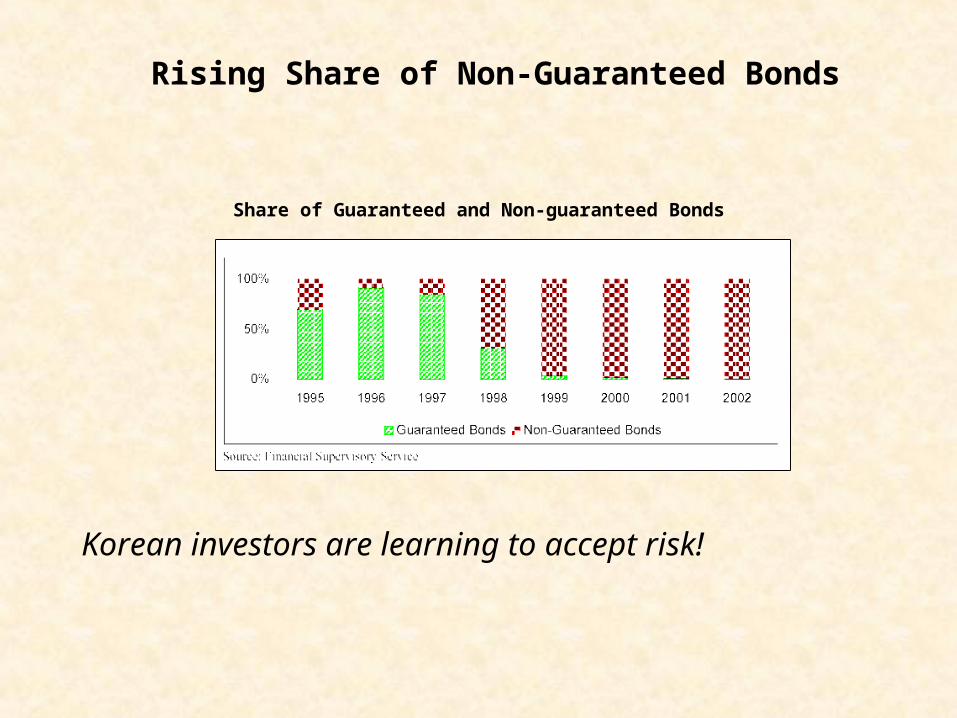
Rising Share of Non-Guaranteed Bonds
Share of Guaranteed and Non-guaranteed Bonds
Korean investors are learning to accept risk!
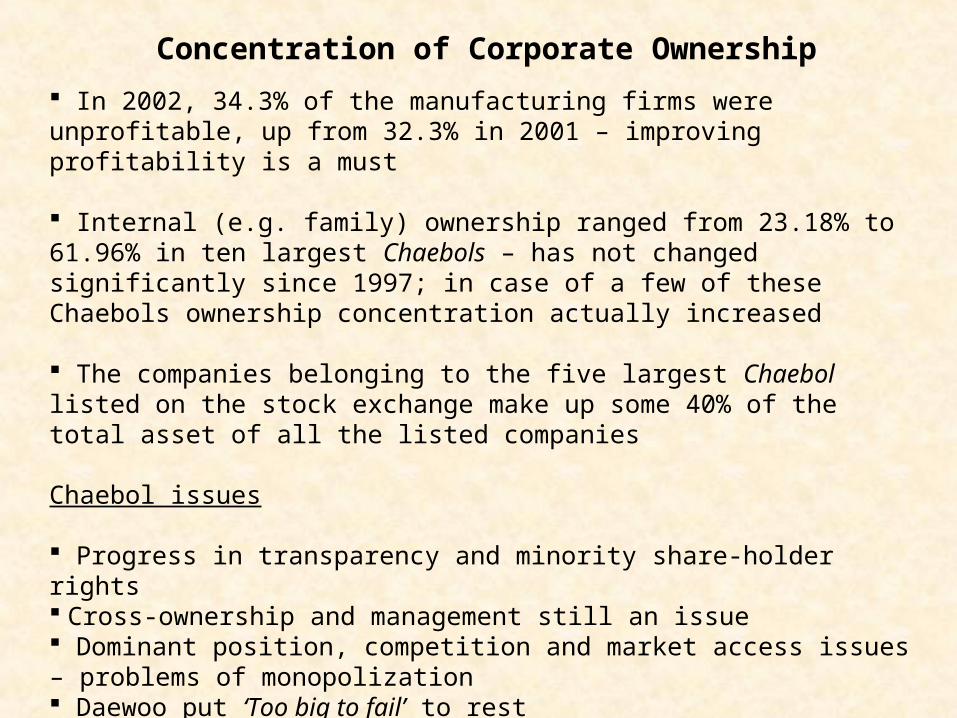
Concentration of Corporate Ownership
In 2002, 34.3% of the manufacturing firms were unprofitable, up from 32.3% in 2001 – improving profitability is a must
Internal (e.g. family) ownership ranged from 23.18% to 61.96% in ten largest Chaebols – has not changed significantly since 1997; in case of a few of these Chaebols ownership concentration actually increased
The companies belonging to the five largest Chaebol listed on the stock exchange make up some 40% of the total asset of all the listed companies
Chaebol issues
Progress in transparency and minority share-holder rights Cross-ownership and management still an issue Dominant position, competition and market access issues – problems of monopolization Daewoo put ‘Too big to fail’ to rest
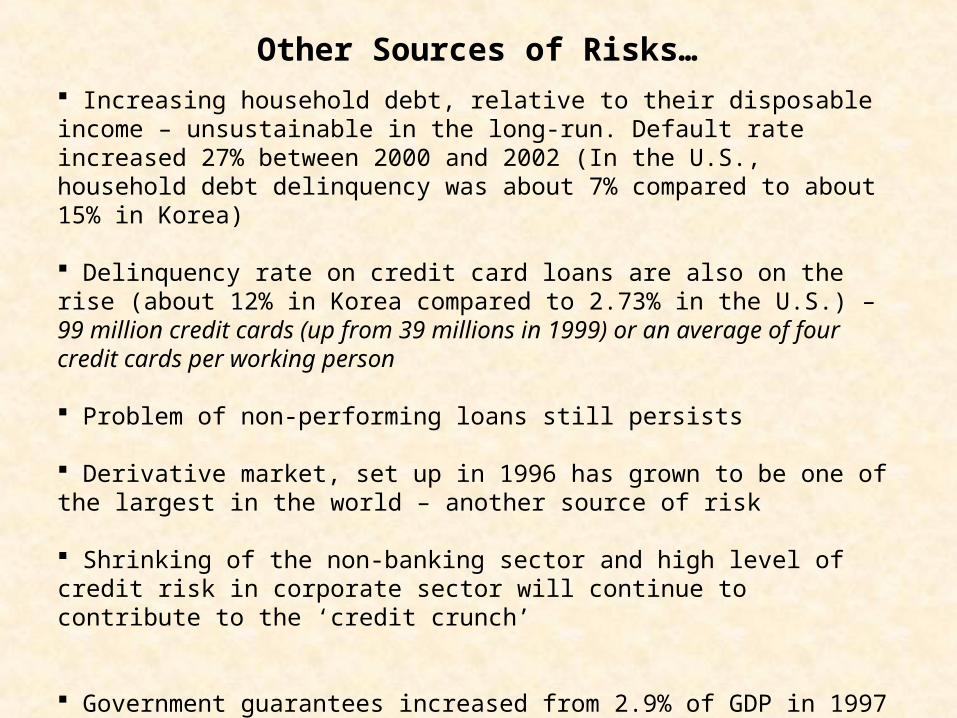
Other Sources of Risks… Increasing household debt, relative to their disposable income – unsustainable in the long-run. Default rate increased 27% between 2000 and 2002 (In the U.S., household debt delinquency was about 7% compared to about 15% in Korea)
Delinquency rate on credit card loans are also on the rise (about 12% in Korea compared to 2.73% in the U.S.) – 99 million credit cards (up from 39 millions in 1999) or an average of four credit cards per working person
Problem of non-performing loans still persists
Derivative market, set up in 1996 has grown to be one of the largest in the world – another source of risk
Shrinking of the non-banking sector and high level of credit risk in corporate sector will continue to contribute to the ‘credit crunch’
Government guarantees increased from 2.9% of GDP in 1997 to 19.6% in 2001 – another potential risk
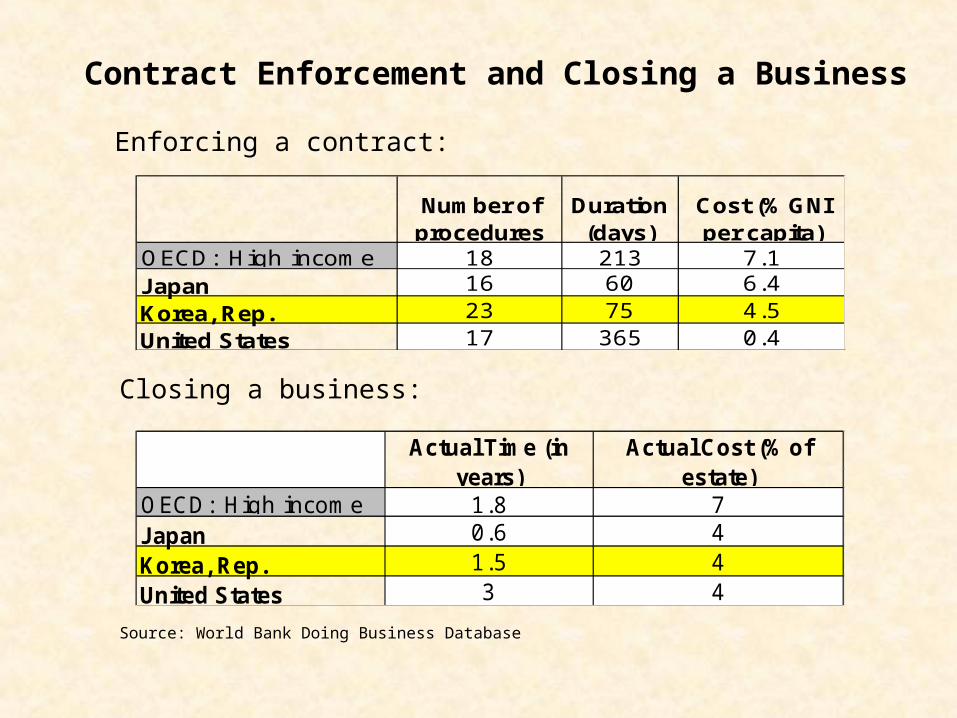
Contract Enforcement and Closing a Business
OECD: High income 18 213 7.1Japan 16 60 6.4Korea, Rep. 23 75 4.5United States 17 365 0.4
Number of procedures
Duration (days)
Cost (% GNI per capita)
Enforcing a contract:
Closing a business:
OECD: High income 1.8 7Japan 0.6 4Korea, Rep. 1.5 4United States 3 4
Actual Time (in years)
Actual Cost (% of estate)
Source: World Bank Doing Business Database
Concluding Remarks
Korea has made significant progress in human capital development and is well positioned to become a ‘knowledge-based’ economy
Scope for further improvement in corporate governance, transparency minority shareholder rights, market access and competition issues
More effective bankruptcy laws and prudential regulations
Learn to take risk without explicit and implicit government guarantees
Fast growth of the derivative market exposes Korean investors to a new kind of risk – a more comprehensive regulatory framework is needed for the derivative market
Concluding Remarks
By some estimates and by OECD standards, Korea’s Total Factor Productivity is low (historically, Korea’s annual TFP growth rate averaged .10, compared to .58 for Japan, .71 for Taiwan and .53 for the U.S.*)
Further growth is unlikely to come from enhancing labor productivity or from capital accumulation. Future growth will be from increasing Total Factor Productivity (TFP) through improving corporate governance, minority shareholders’ rights and competition
By some estimates, improving institutional efficiency will increase TFP from 1.6% to 2.0% per year
With higher TFP, Korea can expect to be the economic bridge between ‘fast-growing’ China and ‘slowly-recovering’ Japan
*Baier and Dwyer (2002) How Important Are Capital and Total Factor Productivity for Economic Growth?