kom 2002 elkom tel · tel kom t elkom group annual report 2002 tel kom te lkom group annual report...
TRANSCRIPT

Telkomwww.telkom.co.za
TelkomGroup Annual Report2002
Telkom
Telkom G
roup A
nnual Rep
ort 20
02
Telkom AR Covers 26370 8/20/02 15:53 Page 1

This Annual Report does not constitute an offer of securities for sale in the United States. Securities may not be offered or sold in the UnitedStates absent registration or an exemption from registration under the United States Securities Act of 1933, as amended. Any public offeringof shares to be made in the United States must be made by means of a prospectus that will be available from Telkom SA Limited (Telkom)or the Government of South Africa and will contain detailed information about Telkom and its management as well as its financial statements.
Disclosure regarding forward-looking statements
Many of the statements included in this Annual Report, including the description of our plans, strategies, capital expenditures, anticipatedcost savings and financing plans are forward-looking statements. You can generally identify forward-looking statements by the useof terminology such as “may”, “will”, “expect”, “intend”, “plan”, “estimate”, “anticipate”, “believe” or similar phrases. Our actual futureperformance could differ materially from these forward-looking statements.
These forward-looking statements involve a number of risks and uncertainties. Important factors that could cause actual results to differmaterially from our expectations include, but are not limited to, our ability and the ability of Vodacom Group (Proprietary) Limited (Vodacom)to successfully compete with new entrants in the South African fixed-line and mobile markets; our ability to minimise customer non-payments,theft and vandalism; future growth in the South African economy generally as well as the South African fixed-line and mobilecommunications markets; Vodacom’s ability to expand internationally; Vodacom’s ability to manage growth; the actual or perceived healthrisks relating to mobile handsets; our ability to attract and retain key personnel; our significant indebtness; rapid changes in technologies;future regulatory developments; the political, social, economic and operational risks relating to South Africa; the cost of compliance withlabour laws and our ability to manage labour relations; fluctuations in the value of the currency against foreign currencies and South Africanexchange control restrictions as well as other matters not yet known to us or not currently considered material by us. We caution you not toplace undue reliance on these forward-looking statements. There are risks that may be difficult for us to achieve the outcomes predicted inour forward-looking statements. All written and oral forward-looking statements attributable to us and persons acting on our behalf arequalified in their entirety by these cautionary statements.
G R A P H I C O R 2 6 3 7 0
US securities legend
Profile 1
Operational highlights 2
Financial highlights 3
Chairman’s statement 16
Group structure 20
Chief Executive Officer’s review 22
Executive management team 30
Contents
Board of Directors 34
Chief Financial Officer’s review 36
Segment review – Wireline 38
Segment review – Wireless 43
Corporate governance 46
Corporate social responsibility 50
Group annual financial statements 53
Telkom
Our vision is to be a world-class communicationsgroup
Group Annual Report 2002
Company SecretaryVincent MashaleTel: +27 12 311 [email protected]
Investor RelationsBelinda WilliamsTel: +27 12 311 [email protected]
Corporate CommunicationAmanda SingletonTel: +27 12 311 [email protected]
Government and RegulatoryVictor MocheTel: +27 12 311 [email protected]
Customer call centre10219
Business call centre10217
Websitewww.telkom.co.za
Company registration number1991/005476/06
Head officeTelkom Towers North152 Proes StreetPretoria0002South AfricaPrivate Bag X881, Pretoria 0001, South AfricaTel: +27 12 311 7000
AuditorsErnst & YoungWanderers Office Park52 Corlett DriveIllovo2000PO Box 2322, Johannesburg, 2000Tel: +27 11 772 3000Fax: +27 11 772 4000
KMMT Incorporated1226 Schoeman StreetHatfield0083PO Box 11265, Hatfield, 0028Tel: +27 12 431 1300Fax: +27 12 431 1301
Legal advisorsWerksmans 155 – 5th StreetSandownSandton2196South Africa Tel: +27 11 535 8000
Administration
Telkom AR Covers 26370 8/20/02 15:53 Page 2

Telkom Group Annual Report 2002 1Telkom Group Annual Report 2002 1
We are South Africa’sleading integratedcommunications groupWe provide wireline and wireless services throughout South Africa and
increasingly into other African countries.
Telkom is the incumbent fixed-line operator in South Africa and held the
exclusive licence to provide public switched telecommunication services
until May 2002. Our 50% shareholding in Vodacom makes us Africa’s leading
provider of wireless services.
We are committed to becoming a world-class communications group
and delivering sustainable shareholder value by focusing on our key
strategic objectives:
• Growing and defending core markets• Exploiting convergence opportunities• Driving operational and capital efficiencies• Improving the customer experience• Investing in our people

Telkom Group Annual Report 20022
Operational highlights
2002 707 881
2001 479 935
47% increasefixed-line prepaid
2002 467 518
2001 374 062
25% increaseISDN channels
2002 6 862 976
2001 5 212 242
32% increasemobile subscribers
%for the year ended 31 March 2002 2001 change
Total fixed-line access lines 4 924 458 4 961 743 (1)
Fixed-line postpaid 3 553 660 3 929 633 (10)
Fixed-line prepaid 707 881 479 935 47
ISDN channels 467 518 374 062 25
Payphones 195 399 178 113 10
Mobile subscribers1 6 862 976 5 212 242 32
Mobile contract subscribers 1 137 782 1 087 388 5
Mobile prepaid subscribers 5 725 194 4 124 854 39
Fixed-line employees 39 444 43 758 (10)
Mobile employees1 4 353 4 272 2
Revenue per fixed-line (ZAR) 5 547 5 233 6
Fixed lines per employee 125 113 11Mobile subscribers per employee1 1 577 1 220 29
1100% of Vodacom Group
Telkom Group Annual Report 2002 3
Financial highlights
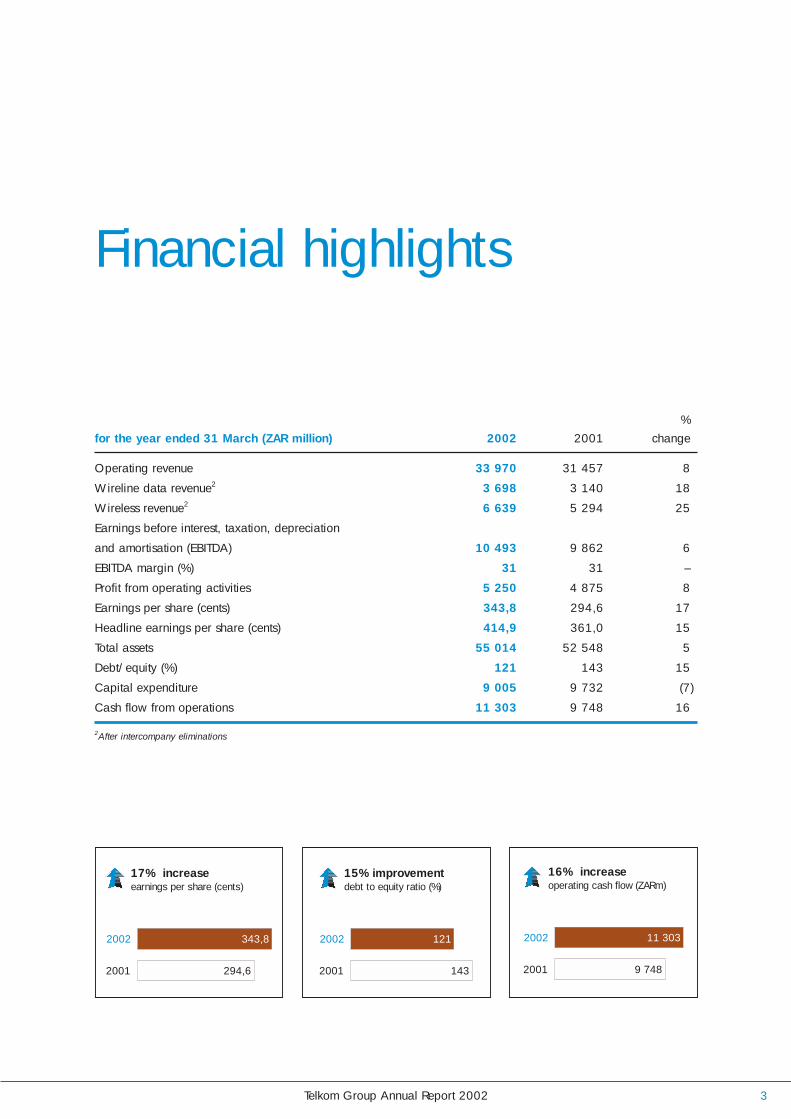
2002 343,8
2001 294,6
17% increaseearnings per share (cents)
2002 121
2001 143
15% improvementdebt to equity ratio (%)
2002 11 303
2001 9 748
16% increaseoperating cash flow (ZARm)
Operating revenue 33 970 31 457 8
Wireline data revenue2 3 698 3 140 18
Wireless revenue2 6 639 5 294 25
Earnings before interest, taxation, depreciation
and amortisation (EBITDA) 10 493 9 862 6
EBITDA margin (%) 31 31 –
Profit from operating activities 5 250 4 875 8
Earnings per share (cents) 343,8 294,6 17
Headline earnings per share (cents) 414,9 361,0 15
Total assets 55 014 52 548 5
Debt/equity (%) 121 143 15
Capital expenditure 9 005 9 732 (7)
Cash flow from operations 11 303 9 748 16
2After intercompany eliminations
%for the year ended 31 March (ZAR million) 2002 2001 change
Telkom Group Annual Report 2002
1> Integrated communications
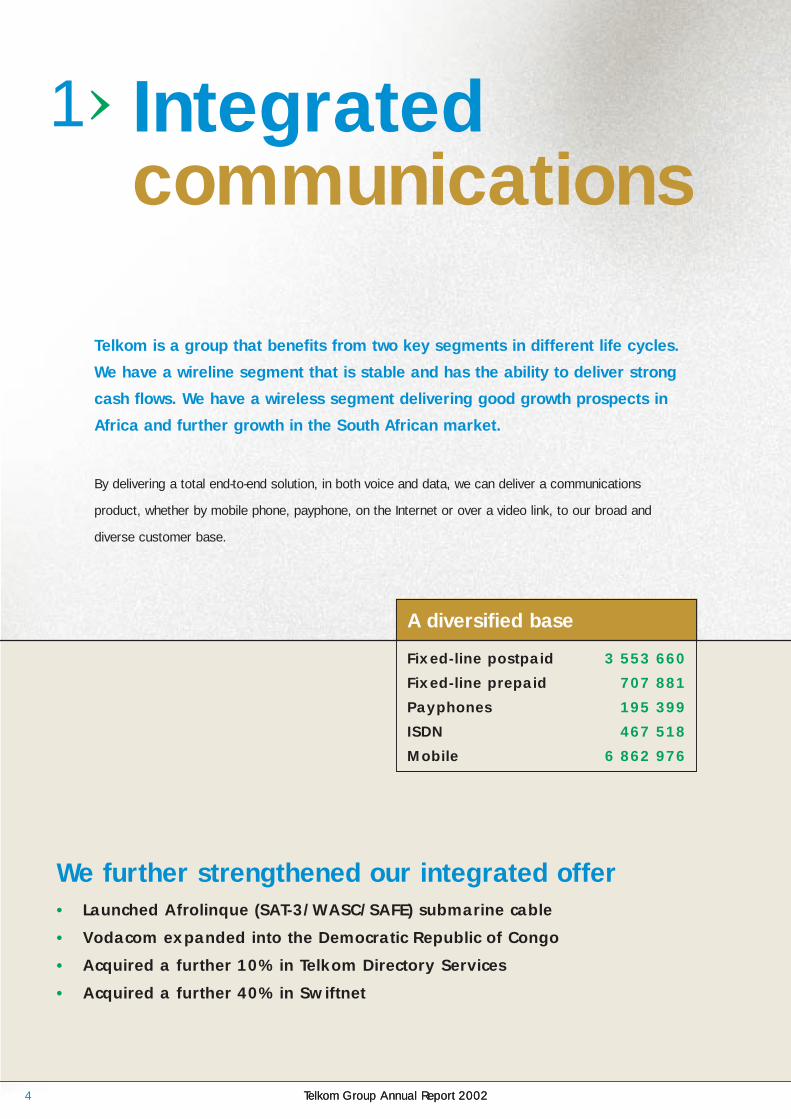
Telkom is a group that benefits from two key segments in different life cycles.
We have a wireline segment that is stable and has the ability to deliver strong
cash flows. We have a wireless segment delivering good growth prospects in
Africa and further growth in the South African market.
By delivering a total end-to-end solution, in both voice and data, we can deliver a communications
product, whether by mobile phone, payphone, on the Internet or over a video link, to our broad and
diverse customer base.
• Launched Afrolinque (SAT-3/WASC/SAFE) submarine cable
• Vodacom expanded into the Democratic Republic of Congo
• Acquired a further 10% in Telkom Directory Services
• Acquired a further 40% in Swiftnet
We further strengthened our integrated offer
Telkom Group Annual Report 20024
A diversified base
Fixed-line postpaid 3 553 660
Fixed-line prepaid 707 881
Payphones 195 399
ISDN 467 518
Mobile 6 862 976

Telkom Group Annual Report 2002 5Telkom Group Annual Report 2002

2> Stretching ourreach
We have created world-class communications networks with best technologies,
exciting in their potential and reliable in their application. We can deliver value-
added products and services within reach of the majority of South Africans and
increasingly, the rest of Africa.
• 4,9 million fixed-line subscribers and 6,6 million mobile subscribers in South Africa
• Network now 99,8% digital compared to 74% in 1997
• 195 ATM switches
• 5 050 mobile base stations in South Africa
• 94% mobile access provided to the South African population
Our networks provide the platform for growth
Telkom Group Annual Report 20026
Growth in lines
Fixed-line postpaid (10%)
Fixed-line prepaid 47%
Payphones 10%
ISDN 25%
Mobile 32%
Our investment in the networks is delivering strong growth in our customer base and will facilitate the rapid
delivery of convergence products and services.

Telkom Group Annual Report 2002 7

3> Improving the customer experience
We understand that a long-term customer relationship is far more sustainable
than simply delivering a product.
• Average time to answer a fixed-line call in our call centres has improvedfrom 119 seconds in 2000 to 22 seconds in 2002
• Improved availability of coin payphones from 88% in 1998 to 95% in 2002
• Launch of various new products, MyRing, RingBack and 4U (mobile persecond billing)
• First communications group in the world to provide fixed-line prepaid
Mobile contract churn(%)
Telkom Group Annual Report 20028
2002 15
2001 19
Average residential installation(days)
2002 8
2001 18
Average business installation(days)
2002 5
2001 11
Our stated intention of improving the customer experience is realised through continuous product
development, improving the customer interface, increasing access to services and a drive for
uncompromising reliability.

Telkom Group Annual Report 2002 9
4> Strength throughmulti-skilling
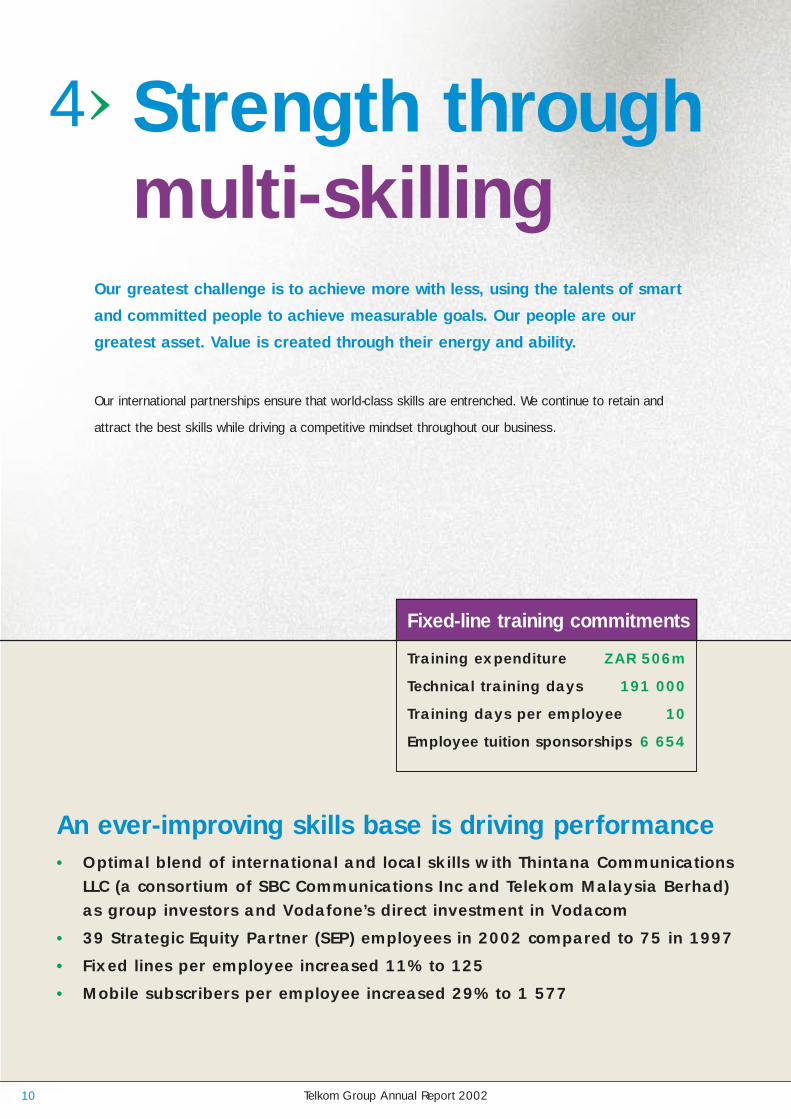
Our international partnerships ensure that world-class skills are entrenched. We continue to retain and
attract the best skills while driving a competitive mindset throughout our business.
Our greatest challenge is to achieve more with less, using the talents of smart
and committed people to achieve measurable goals. Our people are our
greatest asset. Value is created through their energy and ability.
Training expenditure ZAR 506m
Technical training days 191 000
Training days per employee 10
Employee tuition sponsorships 6 654
• Optimal blend of international and local skills with Thintana CommunicationsLLC (a consortium of SBC Communications Inc and Telekom Malaysia Berhad)as group investors and Vodafone’s direct investment in Vodacom
• 39 Strategic Equity Partner (SEP) employees in 2002 compared to 75 in 1997
• Fixed lines per employee increased 11% to 125
• Mobile subscribers per employee increased 29% to 1 577
An ever-improving skills base is driving performance
Telkom Group Annual Report 200210
Fixed-line training commitments

Telkom Group Annual Report 2002 11

5> Measuring upto the mark
We are driving our business in a strategic direction that is based on delivering
optimal financial returns.
Applying the most stringent measures, we are focused on driving operational and capital efficiencies
throughout our operations.
• Successfully reduced group capital expenditure through refocusing our investment criteria on high-return areas
• Established Operational Support Systems (OSS) division
• SAP/R3 implementation launched in April 2002 to drive greater operationalefficiencies
• Continued optimisation of staff numbers with a 10% reduction in fixed-lineheadcount
Telkom Group Annual Report 200212
Group capex as a % of revenues
2002 27%
2001 31%
Mobile revenue peremployee (ZAR 000)2
2002 3 719
2001 3 105
Fixed-line revenue peremployee (ZAR 000)1
2002 693
2001 5931Fixed-line employees only 2100% Vodacom revenues and employees

Telkom Group Annual Report 2002 13

6> In touch with our base
As a South African corporate citizen we are committed to the upliftment of the
communities in which we work.
BEE contributions
Fixed-line BEE spend ZAR 4,6bn
Mobile BEE spend ZAR 0,4bn
Black staff fixed-line 56%
Black staff mobile 63%
• Increased fixed-line Black Economic Empowerment (BEE) procurementspend from R58 million in 1997 to R4,6 billion in 2002
• Telkom and Vodacom Foundations spent R33 million in 2002
• Partnerships with rural entrepreneurs with self-containedpayphone units
• Vodacom’s community service network expanded to 27 884 payphone units
Our investments in South Africa include:
Telkom Group Annual Report 200214
Telkom strives to be a catalyst for change, both as a business and as a corporate citizen. We recognise
our responsibility to our country and we strive to create wealth for all our stakeholders.

Telkom Group Annual Report 2002 15

Chairman’s statementEric Molobi
“May 2002 saw the end of Telkom’s exclusivity period
and we now face, with the imminent introduction of a
second national operator and the licensing of Sentech,
an increasingly competitive landscape. I believe the
liberalisation of the South African market, through the
introduction of facilities-based competition will be very
positive for the country, as it will encourage foreign direct
investment, create jobs and result in improvements in
teledensity, thus meeting many of the Government’s primary
objectives for the communications sector.”
The year under review was defined by significant change in the communicationslandscape. In 2001, we saw the introduction of a third mobile operator and the amendment to South African telecommunications legislation. In 2002 we will seethe introduction of competition into the fixed-line voice market.
The economic backdrop remained challenging. In 2001, our currency suffered asignificant devaluation, GDP growth was below expectations and unemployment athigh levels. During the first quarter of this calendar year, we saw a strengthening ofour currency, reflecting a return of investor confidence in the South African economy.
Telkom as a major participant in the South African economy, is not immune to theeconomic difficulties of the country. However, the business in many ways, has neverbeen stronger due to strategic and operational changes that were driven throughoutthe Group over the past 5 years.
Telkom Group Annual Report 200216

Telkom Group Annual Report 2002 17
The results
The Group’s financial results for the year indicate that Telkom is well positioned toboth operate in a liberalised market and be judged against its international peersas it prepares for an Initial Public Offering.
Group operating cash flow grew 16% to R11,3 billion. Earnings per share grew17% to 343,8 cents. While we maintained our EBITDA (earnings before interest,taxation, depreciation and amortisation) margin at 31%, there is strong evidence ofimproved capital and operational efficiencies across the Group.
Unlike some of our international peers, Telkom has maintained its investment gradecredit rating with international credit rating agencies Moody’s and Standard &Poor’s. This reflects a view that within the next few years the Group will reduce itsdebt and strengthen its balance sheet.
Regulatory environment
The past twelve months represented a defining year in the development of boththe South African communications sector and Telkom. The introduction ofcompetition was facilitated by the Telecommunications Amendment Act, which waspromulgated in November 2001. Government is committed to a managedliberalisation process, with an emphasis on facilities-based competition. WhilstGovernment recognises the need to balance a healthy competitive landscape withimproved public telephony services, its prime objective is to increase accessibilityand affordability. To this end, Telkom has rolled out 2,8 million fixed lines andVodacom has connected 6 million mobile subscribers over the past 5 years, resultingin an increase in overall teledensity in South Africa from 12% in 1997 to anestimated 36% in 2002.
The end of Telkom’s fixed-line exclusivity period on 7 May 2002 paves the wayfor the introduction of fixed-line competition. There is no doubt that the newcompetitive landscape will provide a major boost to the South Africancommunications market.
Telkom has been criticised for trying to “hang on” to its monopoly. The truth is, wewelcome competition. We are looking forward to competing on a level playing fieldwhere we are not expected to subsidise our competitors and where all players willhave a proportionate share of socio-economic commitments, including investment ininfrastructure to further broaden public access to communications.
In the same spirit, we also welcome the new regulatory process. Within the processour priority is to ensure that we can operate effectively as a business in a sustainablecommunications sector.
Initial Public Offering (IPO)
The changes that were implemented across the business have prepared the Groupfor increased competition, and to meet additional obligations it may have as a

Telkom Group Annual Report 200218
publicly-listed company. Government remains committed to the process ofprivatisation and the IPO of Telkom.
Empowerment and social responsibility
Telkom strives to be a catalyst for change, both as a business and a corporatecitizen. We are a powerful organisation and with that power comes responsibilityto the broader community. Telkom is committed to increasing its Black EconomicEmpowerment (BEE) procurement spend. Our Group procurement spend on BEEincreased to approximately R5 billion in 2002 from R4 billion in 2001.
The Telkom and Vodacom Foundations continue to contribute to the transformation ofdisadvantaged communities through sustainable social development programmes.The Telkom Foundation committed R100 million over a 5-year period, while ourStrategic Equity Partner (SEP), Thintana Communications LLC (a joint venture betweenSBC Communications Inc and Telekom Malaysia Berhad), committed an additionalR120 million over the same period. During 2002, the Telkom and VodacomFoundations contributed R33 million towards various social initiatives.
Since 1998 Telkom and Thintana have sponsored 70 students at the MalaysianMultimedia University at a total cost of R5,5 million. The future of our country lies inthe education of our people and therefore education remains the key focus of ourexternal social investment programmes.
Relationships with organised labour
We continue to develop long-term relationships with both our unions:Communication Workers Union (CWU) and the Alliance of Telkom Unions (ATU).In February 2002 we concluded a landmark deal with CWU, signing the JobSecurity and Retrenchment Framework Agreement. This provides us with guidelinesfor managing staff optimisation while ensuring a long-term, mutually workablerelationship with the union and our employees.
Board changes
During the year under review Advocate Dikgang Moseneke resigned as Chairmanof the Board in order to pursue his career on the bench. Dikgang’s contribution wasinvaluable and much of what Telkom has achieved during the past 7 years can beattributed to his leadership, enthusiasm and keen business sense. With Dikgang’sdeparture, I was appointed Chairman on a one-year contract. I have decided not torenew my contract when it expires on 31 July 2002.
Telkom has delivered very good results for the current year and the association withthe SEP, especially in transferring skills and transforming the Company, has addedsignificant value.
Two further changes to the Telkom Board took place after year-end. Effective from12 July 2002, Shawn McKenzie takes over as Chief Operating Officer (COO) fromTom Barry, who will retire after an outstanding career spanning more than 35 yearsin communications with 4 of these as Telkom’s COO.
Chairman’s statement

Telkom Group Annual Report 2002 19
Shawn McKenzie, who is currently a President of SBC Communications Inc, hasbeen with SBC for 23 years in various roles, which include Network Operations andRegulatory Affairs.
Shan Manickam also retires after 5 years as the Group’s Chief Strategic Officer. Thiswas preceded by 28 years with Telekom Malaysia. Chian Khai Tan takes over asChief Strategic Officer from 27 June 2002. Chian Khai Tan is currently Senior VicePresident for Consumer and Business at Telekom Malaysia and has worked forTelekom Malaysia for 29 years.
Shawn McKenzie and Chian Khai Tan will serve on Telkom’s Board of Directors inthe Thintana positions vacated by their predecessors.
Acknowledgements
Given the significant market changes that confronted Telkom over the past year,I would like to express my admiration and appreciation for the efforts of the Telkommanagement team. Our CEO, Sizwe Nxasana, in particular, has shown exceptionalleadership qualities and has effectively managed the sensitive task of balancing thedemands of a new regulatory process with the need to deliver value to shareholders.Telkom’s progress towards achieving its strategic objectives was made possible bythe passion and dedication of all our employees.
I would also like to thank Thintana for their continued contribution to Telkom’stransformation these past 5 years. Their technological expertise and experience ofbest-practice business and marketing processes, and the associated knowledgetransfer between Thintana and Telkom, enhanced our initiatives immeasurably.
Prospects
We anticipate challenging market conditions through to 2003, with moderateeconomic growth and a changing regulatory environment. Nevertheless, withTelkom’s world-class technology platform, the improved competitive culture and afocus on delivering efficiencies, we are well positioned to profitably service thecommunications needs of our nation.
Eric MolobiNon-executive Chairman

Telkom Group Annual Report 200220
Group structure
Vodacom Group(Pty) Ltd
Swiftnet(Pty) Ltd
Telkom DirectoryServices(Pty) Ltd
Intekom(Pty) Ltd
Q-Trunk(Pty) Ltd
50% 100%64,9% 100% 100%
Telkom SA Ltd
Group operational structure
Wireline
Wireless
Fixed-line
Directories
Mobile
Wireless data
Segment Business line Legal entity
Telkom

Telkom Group Annual Report 2002 21
Shareholders
Vodacom Group (Proprietary) Limited
Telkom shareholding: 50% (2001: 50%)Vodacom is a leading mobile communications company providing a GSM (GlobalSystem for Mobile Communications) service to almost 7 million customers in SouthAfrica, Tanzania, Lesotho and the Democratic Republic of Congo. Vodacom is SouthAfrica’s leading cellular network with an estimated 60% market share. Vodacomprovides coverage to 94% of the South African population and 60% of thegeographical area of South Africa.
Telkom Directory Services (Proprietary) Limited
Telkom shareholding: 64,9% (2001: 54,9%)Telkom Directory Services (TDS) was formed on 1 September 1997, as a result of a jointventure between Telkom SA Limited and Maister Directories’ directory businesses. TDSprovides complete Yellow and White page directory services, an electronic directoryservice, 10118 “The Talking Yellow Pages”, and an on-line web directory service.
Swiftnet (Proprietary) Limited
Telkom shareholding: 100% (2001: 60%)Swiftnet started in 1994 as a Telkom initiative and trades under the name FastNetWireless Service. FastNet is a wireless network providing asynchronous wireless accesson Telkom’s X.25 network, Saponet-P, to its customer base. Services include retail creditcard and cheque terminal verification, telemetry, security and fleet mobility.
Subsidiaries and joint venture
Government: 67%
The Government of South Africa is the majority shareholder in Telkom SA Limited.
Thintana Communications LLC: 30%
Thintana is a consortium consisting of SBC Communications Inc (SBC Communications)and Telekom Malaysia Berhad (Telekom Malaysia), operating through a USA limitedliability company, Thintana Communications LLC, which is registered in the state ofDelaware in the United States of America. SBC Communications and Telekom Malaysiahold 60% and 40% respectively of the 30% investment in Telkom.
Ucingo Investments (Proprietary) Limited: 3%
Ucingo Investments is a broad-based investment company representing more than20 empowerment groups from all 9 provinces of South Africa.

Chief Executive Officer’s reviewSizwe Nxasana
I strongly believe that the imminent introduction of competition in our fixed-linebusiness will be good for Telkom. In particular, it has focused our minds on creatinga better business, motivated us to adopt the right business approach to strengthenour investment proposition and positioned us for real future growth.
For the year ended March 2002 the Group delivered robust results. Thisperformance was achieved against a difficult background of balancing the lastleg of our fixed-line licence obligations with positioning Telkom for both increasedcompetition and the Initial Public 0ffering (IPO). We have now completed our fixed-line licence obligations, set out in the 1997 agreement with Government,demonstrating our ability to deliver on commitments. We largely met our line rolloutobligations missing our 2,7 million target, excluding payphones, by only16 448 lines. However, we successfully met our underserviced line and payphonetargets. We met all our service targets, except for the residential faults rate.
We have now successfully shifted our focus from fulfilling licence obligations tostrategic and operational initiatives based on margin improvement and earningsgrowth. This will allow us to optimally allocate capital to enhance our offerings tocustomers and facilitate increased returns to our shareholders.
Telkom Group Annual Report 200222
“As we look back on the past 12 months, it is clear that
the changes we continue to implement are resulting in a
well-positioned, integrated communications group that is
ready to be measured against its global peers, both as
a world-class provider of communications products and
services and as an investment that can deliver real value
to its shareholders. This success has been underpinned
by our focus on the Group’s strategic objectives which
include growing and defending our core markets,
expanding our convergence business, achieving greater
customer satisfaction and improving corporate
performance.”
Telkom Group Annual Report 2002 23
As an integrated group we benefit from two key segments in different lifecycles. Wehave a wireline segment that is stable and has the ability to deliver strong cash flowsand a wireless segment delivering good growth prospects in Africa and furthergrowth in the South African market.
We now offer a full range of products and services across voice and data, fixed andmobile, and have completed a substantial capital investment programme in ournetworks, incorporating the world’s best technologies. Our customer service isconsistently improving both in terms of service levels and product delivery. We haveinvested in the right skills and have developed a performance driven culture acrossour leadership team and into our workforce with new measures to drive higherproductivity. We now have all the fundamentals in place to operate successfully ina liberalised market.
More than just a telephone company
For many years it was sufficient to supply customers with just telephones, either intheir homes, their offices or in public places. However, the revolution that has takenplace in the communications sector over the past decade brought with it increaseddemands for more advanced communications solutions. Exciting technologies suchas mobile phones and the Internet have been developed, and we were able todeliver these technologies to our customers.
With the introduction of mobile communications in South Africa eight years ago,Telkom invested in a joint venture with Vodafone Plc and the Rembrandt Group tocreate Vodacom, which is now South Africa’s leading supplier of mobilecommunications services. Vodacom expanded its African operations by investing ina new venture with a 51% interest in a GSM licence in the Democratic Republic ofCongo in December 2001, and successfully launched operations in May 2002.Vodacom now operates in South Africa, Lesotho, Tanzania and the DemocraticRepublic of Congo. Wireless services continue to be an important part of theGroup’s strategy and now represent 20% of revenues.
We continue to focus on expanding our wireline data offerings, as it is a key driverof growth in our wireline segment. Through our strategic partnerships we are nowbetter positioned to offer a total solution in network management and relatedservices, with one of the most comprehensive service level agreements in the SouthAfrican data market.
The establishment of Telkom Business Integration Services (TBIS) in September 2001,and the integration of Intekom, South Africa’s third-largest Internet Service Providerinto TBIS, consolidated the Group’s Internet and e-business operations into a singleportfolio. The TBIS portfolio of services includes hosting, security, LAN services,Internet access and e-commerce. These services are fully supported by our new datacentre in Centurion.
International connectivity remains a key growth area through our strategy to becomethe connectivity hub for Africa. We have invested in upgrading our links withneighbouring countries Namibia, Zimbabwe, Swaziland, Lesotho, Mozambiqueand Botswana. Our international connectivity strategy is strengthened through our

Telkom Group Annual Report 200224
Chief Executive Officer’s review
US$85 million (13%) asset investment in Afrolinque, the SAT-3/WASC/SAFEsubmarine cable, which represents a technological breakthrough of greatsignificance to the continent as it offers faster, more efficient trading channelsbetween Africa and international markets.
We have deployed an extensive Voice over Internet Protocol (VoIP) network, andlaunched a regional clearinghouse to serve as a hub for voice traffic on theAfrican continent.
In October 2001, we purchased an additional 10% in Telkom Directory Services(TDS) for R160,3 million, increasing our shareholding to 64,9%. In May 2001, wepurchased an additional 40% in Swiftnet for R22 million, increasing ourshareholding to 100%. Swiftnet provides wireless transmission links largely for retailpoint-of-sale terminals.
Our network – world-class and delivering value
The Group’s capital investment of R48 billion over the past five years has allowed us toconnect a significantly greater number of customers. In 2002, we invested R9,0 billionprimarily in our fixed and mobile networks and operational support systems, whichresulted in further enhancements to our networks’ capability. Digitisation of the fixed-linenetwork today stands at 99,8% compared to 74% in 1997.
The wide-ranging enhancements in our network’s capacity and functionalitycombined with our ability to deliver new and innovative value-added products andservices to our customers, has resulted in good growth during the year in our totalsubscriber base, including: • a 10% increase in payphones to 195 399;• a 25% increase in ISDN channels to 467 518;• a 28% increase in South African mobile subscribers to 6 556 820; and • a 193% increase in other African mobile subscribers to 306 156.
While we connected 2,8 million fixed lines over the past 5 years to meet our licencerollout obligations, our net line growth over the licence period was 665 819. Thisresulted in a total of 4,9 million fixed lines including payphones andISDN, at 31 March 2002. Our net fixed-line growth over the five-year period wasdisappointing. While we succeeded in connecting millions of customers, wewere adversely impacted by a high rate of disconnections. Disconnectionscan be attributed to the poor domestic economic climate coupled with thephenomenal growth in mobile subscribers over the five-year period. Fixed-lineteledensity currently stands at 11% and fixed-line household penetration at anestimated 31%.
Recognising that prepaid services and payphones are key solutions to addressaccessibility and affordability, we have successfully offered prepaid services to bothour mobile and fixed-line customers. In 1998, we were the first communicationscompany in the world to provide prepaid services on a fixed-line network and currentlywe have 707 881 prepaid subscribers. Vodacom has successfully grown SouthAfrican mobile prepaid subscribers from 76 763 in 1997 to 5,4 million in 2002.
24
Fixed-line teledensity(per 100 inhabitants)
1997
10,1
1999
11,8
2000
12,8
2001
11,5
2002
11,4
1998
10,8
Mobile teledensity(per 100 inhabitants)
1997
2,3
1999
7,1
2000
12,1
2001
19,3
2002
24,9
1998
4,0

Telkom Group Annual Report 2002 25
We remain committed to increasing universal access to telephony services in SouthAfrica and our continued deployment of payphones has allowed us to achievethis. In July 2001 we launched containerised semi-public fixed-line telephones and500 containers have been introduced to date. These containers bring telephony andelectronic services to rural and urban communities.
The strength and quality of our networks are critical to both our wireless and wirelineconvergence strategies and our investment has resulted in unequalled networks inSouthern Africa. A significant portion of our capital expenditure was allocated to thefuture network, one that will deliver converged voice, data and video.
Telkom is adopting an evolutionary approach towards a Next Generation Network,using the Packet Mode Architecture-model to maximise existing infrastructure whileadding new functionality. By utilising Packet Mode Architecture (PMA), InternetProtocol (IP), Asynchronous Transfer Mode (ATM) and the wider bandwidth madepossible by Asymmetric Digital Subscriber Line (ADSL) technology, Telkom is able tooffer customers a fully converged Next Generation Network.
Future developments in the mobile network will focus on enhancing revenuesfrom customers through the deployment of data services, which will be facilitatedthrough the rollout of General Packet Radio Services (GPRS). Vodacom is currentlyawaiting the issuance of the 1 800 MHz spectrum that will allow for the capacity todeploy GPRS.
We are servicing the customer better than ever
Our strategy of relentlessly improving service delivery continues. This year sawadditional improvements in our fixed-line installation and fault repair times. Wecontinue to improve our customer interfaces and have made further improvements inour call centre response times.
Much of our success in improving customer satisfaction statistics began with amarket segmentation process we started 5 years ago. The diverse nature of ourmarket demanded a more focused set of strategies for each segment which haveallowed us to deliver prepaid and value-added services in the consumer market andtailor-made data solutions for the corporate market.
“One cannot take a payphone into a rural community without priorconsultation. Before you present rural communities with a valueproposition, one has to understand exactly how communications willenhance their lifestyle. We have learned that consultation leads tocooperation and ultimately to co-responsibility. This reduces vandalismand thus increases the usage of payphones and returns on investment.”
Mike MlenganaManaging Executive: Public Services
Telkom Group Annual Report 200226
We continued to refine our customer segmentation process. Whereas we initiallyconcentrated on corporate customers, we have now extended this process tobusiness customers.
During the year we also continued to focus on improving our distribution channels.We strengthened our relationships with strategic partners in our payphone businessand facilitated the relocation of payphones into high traffic areas. The launch ofvirtual vouchers improved our distribution of fixed-line prepaid considerably. In ourmobile business, we have moved closer to understanding our customer base andhave focused strongly on improving our customer retentions. This is evidenced in ourcontract churn reducing to 15% in 2002 (2001: 19%).
An ever-improving skills base is driving performance
Recognising that a skilled, knowledgeable workforce is key to gaining acompetitive advantage, we have been consolidating our skills base through anunprecedented training and development drive. In 2002 the number of trainingdays in the fixed-line business amounted to 388 397, an increase of 10%from 2001. This amounts to 9,8 training days per employee, an increase of21% from 2001. Training spend for 2002 amounted to R506 million, or R12 836 perfixed-line employee.
We continued to strengthen and transform the Group’s leadership team. Wesuccessfully transferred South Africans into top management positions previouslyheld by Thintana. Nombulelo Moholi was appointed Chief Sales andMarketing Officer and Reuben September was appointed Chief Technical Officer.In our mobile business, Andrew Mthembu was promoted to Deputy CEO of theVodacom Group.
We attracted some key individuals from outside the Group, Essa Govender as GroupExecutive for Procurement, Oupa Magashula as Group Executive for Human Resourcesand Thami Magazi as Managing Executive of Consumer Markets. In May 2002,Charlotte Mokoena joined as Group Executive of the Centre for Learning and ThaboSeopa as Managing Director of Telkom Directory Services.
SBC Communications and Telekom Malaysia’s shareholding in Telkom throughThintana, as well as Vodafone’s direct investment in Vodacom, continue to benefit
Chief Executive Officer’s review
“Everything we do, whether it’s customer care training fortechnical staff, setting ourselves more stringent service qualitytargets or finding ways to streamline our processes, is done withone goal in mind: Better service to our customers.”
Nombulelo MoholiChief Sales and Marketing Officer
Telkom Group Annual Report 2002 27
the Group. We have seen the successful transfer of skills from Thintana over the 5-year period with the number of foreign employees declining from 75 in 1997to 39 at 31 March 2002. Skills transfer continues in accordance with the StrategicServices Agreement.
Our proactive approach to equity in the workplace has enabled us to make furtherprogress this year in establishing a representative workforce. 56% of the fixed-lineworkforce, 63% of the mobile workforce and 80% of Telkom’s Group and ManagingExecutives (excluding Strategic Equity Partner employees) are black.
Our focus on people development is also key to achieving the level of transformationthat is needed to succeed in a competitive market. It is crucial that each and everyemployee learns to think and act differently. Therefore we have initiated, and arebusy implementing, a company-wide internal culture change initiative known as theCompetitive Mindset. This culture change initiative has its basis in our core values,which are focused on an increasingly performance-driven culture.
And our performance shows it is working
Despite the fact that we had to fulfill certain licence obligations in our fixed-line business,we also focused on developing value-added products and services to drive margingrowth. We continued to maximise efficiencies and drive costs out of the business, at thesame time improving current service levels. A key focus area is increasing revenueintensity through value-added services, particularly in our data business.
We maintained the group operating margin at 15% and will continue to focuson driving operational and capital efficiencies to maximise free cash flows. Ouremployee optimisation programme in our fixed-line business continues. Duringthe year we successfully reduced our fixed-line employee numbers by10% to 39 444 resulting in an 11% increase in fixed lines per employee to 125. Inour mobile business, we have also achieved greater efficiencies as indicated by the29% increase in mobile subscribers per employee to 1 577.
The investment in Operations Support Systems (OSS) in our fixed-line business is apriority as we prepare for competition and drive greater operational efficiencies,flexibility and speed to meet new market demand. While we experienced an initial
“The fact that we managed to significantly reduce staff numberswithout losing productivity, tells me our people have the skills, the attitude and the competitive instinct to make this Groupexceptional.”
Oupa Magashula Group Executive: Human Resources

Telkom Group Annual Report 200228
setback in 2001 with the termination of the Telcordia contract, we are now on trackwith a strong internal project management team.
We are beginning to realise benefits from our improved capital allocation process,which ensures that our capital is allocated to areas that will produce maximumreturn. This has resulted in a 15% reduction in capital expenditure in our wirelinesegment this year. Overall group capital expenditure has reduced from 31% ofrevenues in 2001 to 27% in 2002. Going forward we intend to continue to reduceour capital expenditure and invest in capital that will result in an internal returngreater than our cost of capital.
Regulatory environment
During the past 12 months we have worked through a challenging regulatoryperiod. We hope that our detailed local knowledge and the international experienceof our Strategic Equity Partner, Thintana, has enabled us to contribute meaningfullyto the development of legislation and regulations. We are optimistic that regulationswill be developed to support the principles contained in the legislation promulgatedby the Telecommunications Amendment Act in 2001, and the objectives oftelecommunications policy in South Africa.
Government’s objective of managed liberalisation has resulted in the licensing ofSentech with both an international carrier-of-carrier and multimedia licence on6 May 2002. On 20 December 2001 the Government issued an Invitation to Apply(ITA) for the 19% black economic empowerment stake in the Second NationalOperator (SNO). The issuing of the ITA for the 51% strategic equity stake in theSNO followed on 24 May 2002.
While we acknowledge the progress both Government and ICASA (the IndependentCommunications Authority of South Africa) have made in facilitating theliberalisation process, regulations still need to provide greater clarity on issuessuch as:• the interpretation and implementation of the multimedia licence granted to
Sentech;• the manner of and cost recovery for the implementation of carrier pre-selection;• the requirements and definitions for facilities leasing/sharing; and• interconnection guidelines.
Chief Executive Officer’s review
“The fact that we continuously strive to build a solid, ongoingrelationship with the Regulator enables us to engage inconstructive debate to find ways of establishing a matureregulatory environment that will benefit the industry as a whole.”
Victor MocheGroup Executive: Government and Regulatory Relations

Telkom Group Annual Report 2002 29
Telkom made further progress during the year in its efforts to rebalance tariffs.Telkom’s tariff rebalancing is a process mandated by Government. Initiated in 1997,the process aims to align the tariffs that consumers pay for specific services with thecosts incurred in providing them.
In November 2001, Telkom successfully negotiated new interconnection agreementswith the three mobile operators. Telkom’s fixed-line business was previouslyadversely affected by an unfair interconnection agreement that remainedunchanged since 1994. The renegotiation of the interconnection regime hasallowed Telkom’s fixed-line business to negotiate separate agreements with themobile operators for both interconnection and facilities leasing.
We renegotiated the interconnection agreement with the mobile operators in goodfaith that the Regulatory Authority would accede to our appeal to remove the fixed-to-mobile revenues from the basket of tariff services. Unfortunately, this has not yettranspired with the result that the negotiated benefits have not materialised. We willcontinue to pursue this matter with the Regulatory Authority.
Telkom’s future in the context of increased competition
Telkom is ready to operate in a more competitive environment. Many of theinitiatives already discussed represent Telkom’s strategy for positioning the Group tosucceed in an increased competitive landscape.
As an integrated communications group, we are confident of our ability to compete.We can now deploy advanced technologies through our state-of-the-art network toservice the specific needs of our diverse customer base. We can provide improvedcustomer service through multi-skilling our people and creating a truly competitivemindset throughout our workforce. We can compete through the quality of ourservice and prove to our customers that we have what it takes to be theircommunications provider of choice. We remain focused on our strategy to reducecosts and achieve greater efficiencies to drive higher returns for shareholders.
Sizwe NxasanaChief Executive Officer
Telkom Group Annual Report 200230
Executive management team
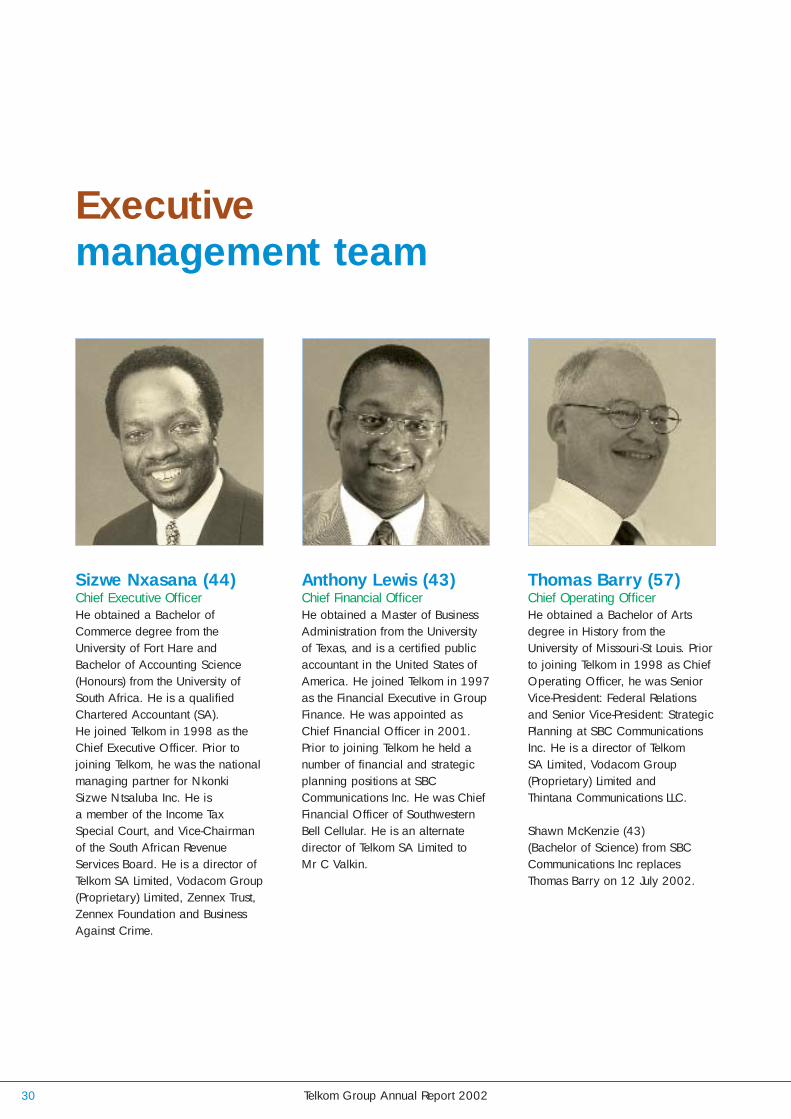
Anthony Lewis (43)Chief Financial OfficerHe obtained a Master of BusinessAdministration from the Universityof Texas, and is a certified publicaccountant in the United States ofAmerica. He joined Telkom in 1997as the Financial Executive in GroupFinance. He was appointed asChief Financial Officer in 2001.Prior to joining Telkom he held anumber of financial and strategicplanning positions at SBCCommunications Inc. He was ChiefFinancial Officer of SouthwesternBell Cellular. He is an alternatedirector of Telkom SA Limited toMr C Valkin.
Sizwe Nxasana (44)Chief Executive OfficerHe obtained a Bachelor ofCommerce degree from theUniversity of Fort Hare andBachelor of Accounting Science(Honours) from the University ofSouth Africa. He is a qualifiedChartered Accountant (SA).He joined Telkom in 1998 as theChief Executive Officer. Prior tojoining Telkom, he was the nationalmanaging partner for NkonkiSizwe Ntsaluba Inc. He isa member of the Income TaxSpecial Court, and Vice-Chairmanof the South African RevenueServices Board. He is a director ofTelkom SA Limited, Vodacom Group(Proprietary) Limited, Zennex Trust,Zennex Foundation and BusinessAgainst Crime.
Thomas Barry (57)Chief Operating OfficerHe obtained a Bachelor of Artsdegree in History from theUniversity of Missouri-St Louis. Priorto joining Telkom in 1998 as ChiefOperating Officer, he was SeniorVice-President: Federal Relationsand Senior Vice-President: StrategicPlanning at SBC CommunicationsInc. He is a director of TelkomSA Limited, Vodacom Group(Proprietary) Limited andThintana Communications LLC.
Shawn McKenzie (43) (Bachelor of Science) from SBCCommunications Inc replacesThomas Barry on 12 July 2002.

Telkom Group Annual Report 2002 31
Reuben September (44)Chief Technical OfficerHe obtained a Bachelor of Science(Electrical and ElectronicEngineering) degree from theUniversity of Cape Town. He joinedTelkom in 1977. He was appointedas Chief Technical Officer in May2002. Prior to his appointment asChief Technical Officer Reuben wasthe Managing Executive:Technology and Network Services.He has also worked in variousengineering and commercialpositions in Telkom. He isregistered as a ProfessionalEngineer with the EngineeringCouncil of South Africa (ECSA).
Nombulelo Moholi (42)Chief Sales and Marketing OfficerShe obtained a Bachelor of Science(Electrical and ElectronicEngineering) degree from theUniversity of Cape Town. Shejoined Telkom in 1994 as theGeneral Manager of the PayphoneBusiness, and moved on to becomeGroup Executive: Regulatory Affairsand later Managing Executive:International and Special Markets.She was appointed as the ChiefSales and Marketing Officer inApril 2002. Prior to joining Telkomshe worked for GEC and Siemens.She is the Chairman of the SouthAfrican Bureau of Standards(SABS), and a director of TelkomDirectory Services (Proprietary)Limited.
Shanmugan Manickam (57)Chief Strategic OfficerHe obtained a Bachelor of Electronics (Honours) from the University of Canterbury, New Zealand, and MS Engineering –Economics System and MS Engineering Management from Stanford University. He joined Telkom in 1997 as the Chief Strategic Officer. Prior to joining Telkom, he was the Vice President, CorporateStrategy at Telekom Malaysia and held various positions with theTelecommunications Department ofMalaysia. He is a director of Telkom SA Limited.
Chian Khai Tan (51) (Bachelor ofEngineering (Honours)) from TelekomMalaysia Berhad replaces Shanmugan Manickam as Chief Strategic Officer on 27 June 2002.
Telkom Group Annual Report 200232
Thami Magazi (45)Managing Executive: Consumer MarketsMaster of Business Administration Bachelor of Science (Business Administration) Joined Telkom in 2001
Godfrey Ntoele (41)Managing Executive: Business MarketsBachelor of Arts (Law) Joined Telkom in 1997
Mike Mlengana (42)Managing Executive: Public ServicesMaster of Arts (International Economics and Development Economics)Bachelor of Arts (Honours)Joined Telkom in 1995
Wally Beelders (42)Managing Executive: International and SpecialMarketsMaster Diploma in Technology Joined Telkom in 1977
Motlatsi Nzeku (41)Managing Executive: Customer ServicesBachelor of Science (Mathematics and Physics),Bachelor of Engineering Joined Telkom in 1994
Victor Moche (55)Group Executive: Regulatory and GovernmentRelationsMaster of Arts (Journalism) Joined Telkom in 1996
Kenneth Raley (48)Managing Executive: Network OperationsBachelor of Science (Business and Biology)Joined Telkom in 1997Strategic Equity Partner employee from SBC Communications Inc
Theo Hess (44)Managing Executive: Access Network Operations Management Advanced ProgrammeNational Certificate for Technicians National Diploma in Business Human Resource ManagementJoined Telkom in 1976
Bashier Sallie (34)Managing Executive: Data and Special ServicesManagement Advancement ProgrammeJoined Telkom in 1986
Johan Mare (47)Managing Executive: Operations Support SystemsNational Diploma in Technology – Telecommunications National Diploma in TechnologyJoined Telkom in 1972
Melvin McArthur Jr (41)Managing Executive: Information TechnologyMaster of Business Administration, Bachelor of Arts (Computer Science) Joined Telkom in 2001 Strategic Equity Partner employee from SBC Communications Inc
Randall Seidl (45)Managing Executive: Corporate and Global MarketsBachelor of Science (Business Administration andAgricultural Business)Joined Telkom in 1997Strategic Equity Partner employee from SBC Communications Inc
Executive management team continued

Telkom Group Annual Report 2002 33
Oupa Magashula (40)Group Executive: Human ResourcesBachelor of Science (Chemistry)Joined Telkom in 2001
Mandla Ngcobo (42)Group Executive: Legal ServicesMaster of LawsBachelor of Jurisprudence Bachelor of LawsJoined Telkom in 1998
Amanda Singleton (40)Group Executive: Corporate CommunicationBachelor of Arts (Communications) Joined Telkom in 1987
Martin Kerckhoff (37)Group Executive: Corporate Development and Initial Public OfferingMaster of Law (International Law)Joined Telkom in 1997Strategic Equity Partner employee from SBC Communications Inc
Essa Govender (45)Group Executive: ProcurementBachelor of CommercePurchasing Management DiplomaJoined Telkom in 2001
Kaushik Patel (39)Deputy Chief Financial OfficerBachelor of Accounting Science (Honours), CA (SA)Joined Telkom in 2000
Joseph Rajaratnam (61)Group Executive: Centre for LearningDiploma in Technical EngineeringJoined Telkom in 1997Strategic Equity Partner employee from Telekom Malaysia BerhadReplaced in May 2002 by Charlotte Mokoena (37)(Bachelor of Arts (Honours) Human ResourcesDevelopment, Bachelor of Social Sciences)
Nkhetheleng Vokwana (40)Chief Executive Officer: Telkom FoundationBachelor of EducationMaster of Science Joined Telkom in 1997
Alan Knott-Craig (50)Chief Executive Officer: Vodacom GroupBachelor of Science (Electrical Engineering)Master of Business LeadershipJoined Vodacom in 1993
Andrew Mthembu (46)Deputy Chief Executive Officer: Vodacom GroupBachelor of Science (Chemistry and Biology)Bachelor of Science (Civil Engineering)Master of Science (Construction Management)Joined Vodacom in 1998
Thabo Seopa (36)Managing Director: Telkom Directory ServicesBachelor of Accounting Higher diploma in Tax LawJoined Telkom Directory Services in 2002
Nicolaas Hall (40)Managing Director: SwiftnetBachelor of Commerce (Accounting)Master of Business Administration Joined Swiftnet in 1994
Telkom Group Annual Report 200234
Board of Directors
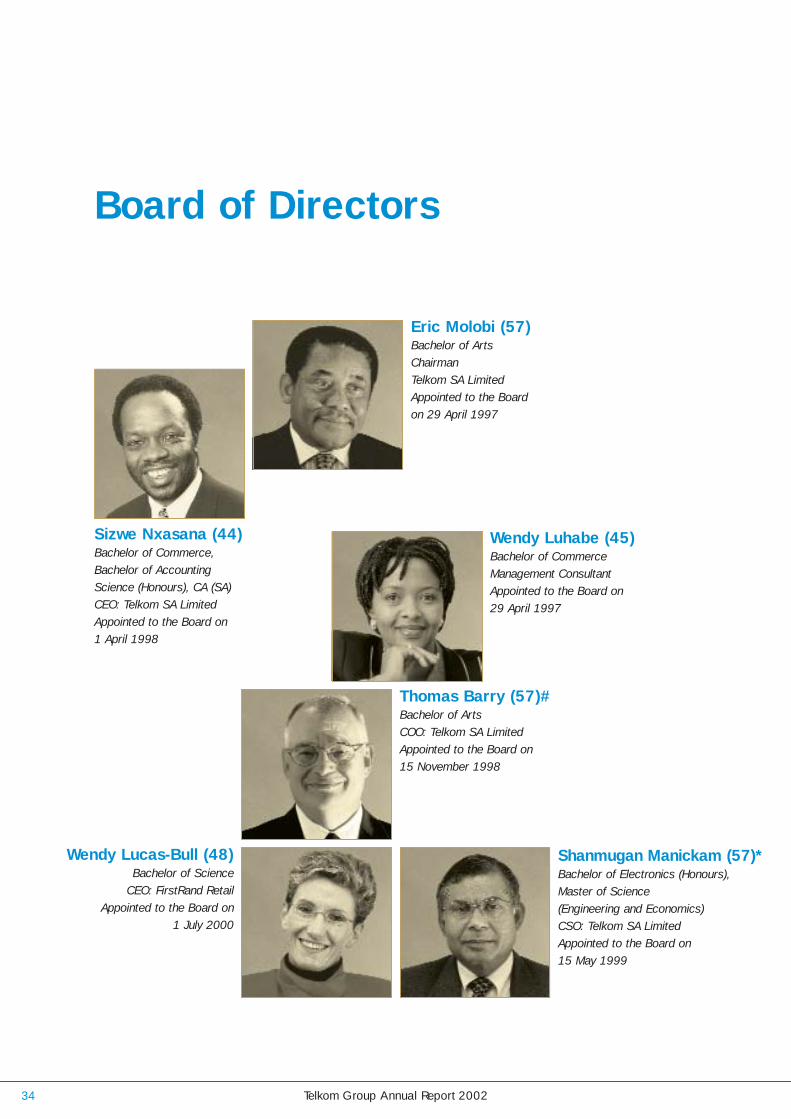
Eric Molobi (57) Bachelor of ArtsChairman Telkom SA LimitedAppointed to the Boardon 29 April 1997
Sizwe Nxasana (44) Bachelor of Commerce,Bachelor of AccountingScience (Honours), CA (SA)CEO: Telkom SA LimitedAppointed to the Board on1 April 1998
Wendy Luhabe (45) Bachelor of Commerce Management ConsultantAppointed to the Board on29 April 1997
Thomas Barry (57)#Bachelor of ArtsCOO: Telkom SA LimitedAppointed to the Board on15 November 1998
Wendy Lucas-Bull (48) Bachelor of Science
CEO: FirstRand RetailAppointed to the Board on
1 July 2000
Shanmugan Manickam (57)*Bachelor of Electronics (Honours),Master of Science (Engineering and Economics)CSO: Telkom SA LimitedAppointed to the Board on 15 May 1999

Telkom Group Annual Report 2002 35
Richard Menell (46)Bachelor of Arts (Honours),Master of Science (NaturalSciences), Master of Arts(Geology) (Mineral Explorationand Management)CEO: Anglovaal Mining LimitedAppointed to the Board on1 July 2000
Colin Smith (45)President: South AfricanCommunications UnionAppointed to the Boardon 29 April 1997
Drew Roy (55)#Advanced ManagementProgrammePresident: SBCCommunications Inc,International OperationsAppointed to the Board on15 September 2000
# American* Malaysian+ Zimbabwean
Charles Valkin (68) Bachelor of Commerce,Bachelor of Law,Higher Diploma in TaxationAttorneyAppointed to the Board on 29 April 1997
Diliza Mji (49)Bachelor of Medicine,
Bachelor of SurgeryFellow of the College
of Surgeons (SA)Surgeon
Appointed to the Board on 1 July 2000
Tan Sri Dato’ Ir.Muhammad RadziMansor (60)*Diploma: ElectricalEngineering, Master ofScience (TechnologicalEconomics)Chairman: Telekom MalaysiaAppointed to the Board on 23 October 1999
Peter Moyo (40)+Bachelor of Accounting Science(Honours), CA (SA), HigherDiploma in TaxationDeputy Managing Director: Old Mutual Life Assurance CoAppointed to the Board on 19 September 2001
Tlhalefang Sekano (43)Executive Chairperson:Communication WorkersInvestment CompanyAppointed to the Board on 19 September 2001

“The Group has delivered strong results for the year.
Our continual focus on increasing cash flows and driving
greater capital and operational efficiencies has allowed
us to deliver solid earnings per share growth of 17%.
Telkom’s results confirm that the Group is a sound
business with good prospects as evidenced by our
stable credit rating.”
Telkom Group Annual Report 200236
Chief Financial Officer’s reviewAnthony Lewis
Operating cash flow growth of 16% to R11,3 billion
The Group is committed to maximising cash flow from operations. This has beenachieved through a 6% growth in earnings before interest, taxation, depreciation andamortisation (EBITDA) to R10,5 billion and further improvements to our working capitalmanagement driven by improved debtors management and a reduction in inventories.Net cash from operating activities was R8,7 billion, which largely covered cashrequirements for capital expenditure of R8,8 billion.
Earnings per share growth of 17% to 343,8 cents
Group earnings per share grew by 17% to 343,8 cents (2001: 294,6 cents) andheadline earnings per share grew by 15% to 414,9 cents (2001: 361,0 cents). Whileoperating profits grew 8%, the lower than the prior year increase in finance chargesof 1% and the lower effective taxation rate of 29% (2001: 30%) contributed to the17% growth in earnings per share.
Operating margin maintained at 15%
We maintained our group operating margin at 15%. Group operating expenditureincreased 9% to R23,5 billion (2001: R21,6 billion). The increase in operatingexpenditure during 2002 was impacted by the significant asset impairment losses ofR445 million (2001: R234 million), bad debts of R965 million (2001: R671 million)and retrenchment costs of R373 million (2001: R132 million) in the wireline segment.
Group staff costs increased 8% to R7,2 billion (2001: R6,6 billion). However, ifretrenchment costs are excluded, group staff costs increased by only 5%. Group staffcosts, including retrenchment costs, represent 21% (2001: 21%) of group revenues.

Telkom Group Annual Report 2002 37
The impact of adopting AC133
The adoption of AC133, Financial Instruments: Measurement and Recognition requiresfair value adjustments in respect of financial instruments of R1,7 billion to be recognisedthrough the income statement, as Telkom does not apply hedge accounting in terms ofthe statement. Such fair value adjustments are to be considered together with foreignexchange losses now recognised in the income statement of R1,1 billion in accordancewith AC112. The impact of adopting AC133 is R468 million. The ongoing impact ofadopting AC133 will be material if there are significant fluctuations in the currency giventhe volume of hedging instruments utilised into by the Group in respect of foreign debtand foreign purchases. The impact could cause fluctuations in future earnings.
Revenue growth of 8% to R34,0 billion
Group revenues for 2002 were R34,0 billion (2001: R31,5 billion), representing an8% increase on the previous year. We experienced moderate revenue growth in ourwireline segment of 4% to R27,3 billion (2001: R26,2 billion) after intercompanyeliminations. Our wireless segment remains a key growth driver; delivering revenuegrowth of 25% to R6,6 billion (2001: R5,3 billion) after intercompany eliminations.During the year we changed the accounting treatment for network fraud. Network fraudof R174 million (2001: R274 million) was previously included in operating expenditureand is now offset against revenues for both 2002 and 2001.
Capital expenditure reduced to 27% of group revenues
Group capital expenditure decreased by 7% to R9,0 billion (2001: R9,7 billion) dueto the 15% reduction in our wireline segment’s capital expenditure to R6,9 billion (2001: R8,1 billion). We completed an extensive capital programme in our wirelinesegment over the past five years to modernise and digitalise our fixed-line network whiledelivering on most of our licence obligations. Future capital expenditure in our wirelinesegment will be driven solely by investment criteria that deliver maximum returns. Thegroup capital budget authorised for 2003 is R7,5 billion (2002: R11,0 billion).
Stable investment grade credit rating
We are committed to maintaining our investment grade debt rating. We have embarkedon a debt refinancing process to better align our funding with our financing requirements.We successfully refinanced foreign loans with domestic funds ahead of the currencydevaluation, resulting in a reduction of our foreign debt exposure from 38% to23% of outstanding debt. Short-term debt now represents 8% of total outstanding debtdown from 22% in the prior year. Net interest-bearing debt for the Group wasR21,1 billion (2001: R21,2 billion) and gearing stands at 121% (2001: 143%).Moody’s and Standard & Poor’s maintained our investment grade credit rating, with astable outlook.
Anthony LewisChief Financial Officer
Telkom Group Annual Report 200238
Segment reviewWireline
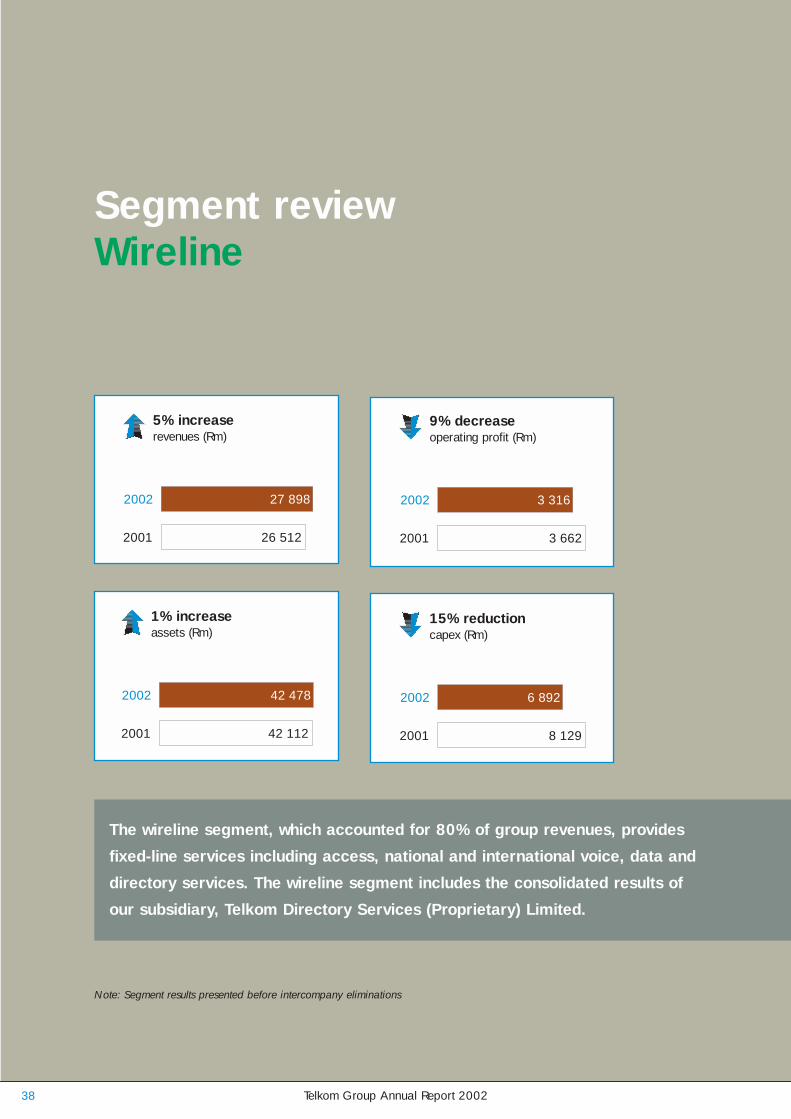
2002 27 898
2001 26 512
5% increaserevenues (Rm)
2002 42 478
2001 42 112
1% increaseassets (Rm)
2002 3 316
2001 3 662
9% decreaseoperating profit (Rm)
2002 6 892
2001 8 129
15% reductioncapex (Rm)
The wireline segment, which accounted for 80% of group revenues, provides
fixed-line services including access, national and international voice, data and
directory services. The wireline segment includes the consolidated results of
our subsidiary, Telkom Directory Services (Proprietary) Limited.
Note: Segment results presented before intercompany eliminations

Telkom Group Annual Report 2002 39
A mature fixed-line voice market
In 2002 revenues from our wireline segment grew by 5% to R27,9 billion (before inter-company eliminations). The underlying developments within our wireline segmentwere mixed. Despite a slowdown in the fixed-line voice market, we have seen stronggrowth in data leased lines, prepaid and payphone services.
Within our wireline segment, fixed-line access revenues grew by 5% as a result ofincreased connection and rental charges. Despite the overall average tariff increaseof between 5% and 6%, fixed-line traffic revenues grew 3% as a result of thenegative growth in net access lines and declining voice volumes. Directoriesrevenues grew 13% with the delivery of 7,8 million directories in 2002 (2001: 7,6 million).
Fixed access lines decreased by 1% in 2002 resulting in total access lines of4 924 458 at 31 March 2002. We continued to see a strong migration of ourpostpaid subscriber base to our fixed-line prepaid, ISDN and mobile offerings. The10% decrease in postpaid subscribers was offset by a 47% increase in fixed-lineprepaid to 707 881, a 25% increase in ISDN channels to 467 518, and a 10% increase in payphone units to 195 399.
Driving greater revenue intensity
We continue to focus on selling higher-quality and higher-value services to customersand have increased revenue per fixed-line by 6% in 2002. We are constantlydeveloping innovative, value-added products to enhance the customer experience.The TalkPlus portfolio of value-added fixed voice services available to the residentialand small-office-home-office (SOHO) market was further expanded during theyear with the launch of MyRing and RingBack. TalkPlus penetration has increasedfrom 24% in March 2001 to 32% in March 2002. Our prepaid service wasalso enhanced with the addition of the value-added products Call Answerand MultiPin in May 2001. Electronic PrePaidFone vouchers were introduced inMarch 2001. The 1023 directory service was enhanced with the introduction of1023 AutoComplete in December 2001, allowing customers to automaticallyconnect to a requested number.
Data – the growth engine in fixed-line
Revenues from our data business grew 18% to R3,9 billion (2001: R3,3 billion),contributing 14% to wireline revenues. An increase in leased lines, increased demandfor high bandwidth solutions and the growth in our managed network services drovethe solid revenue growth. The number of leased lines has increased by 16% to over87 000. The need for higher bandwidth data circuits continues to increase demandfor Diginet Plus and Megaline services.
We continued to expand our managed data network services, by adding55 customers and 1 877 sites during the year. We now have 169 customers and6 511 sites under management. Our portfolio of data managed services wasexpanded in October 2001 with the launch of VIPLink, an Internet Protocol wide-
Total access lines (m)
1998
4,65
1999
5,08
2000
5,49
2001
4,96
2002
4,92
Fixed-line postpaid lines (m)
19984,
521999
4,77
2000
4,67
2001
3,93
2002
3,55
Fixed-line prepaid lines
1998NA
1999NA
2000
380
955
2001
479
935
2002
707
881
Payphone units
1998
127
272
1999
153
476
2000
173
064
2001
178
113
2002
195
399
NA – not available
Telkom Group Annual Report 200240
Segment review – Wireline
area-network solution and VIPDial, a telecommuting solution. Our strategicrelationships with companies such as Cisco and Sun Microsystems underpin ourintegrated value-added data service offerings.
We saw a promising initial growth in our TBIS (Telkom Business Integration Services)service offerings, largely driven by our hosting and Internet access services. OurInternet subscriber base grew 31% to 48 811.
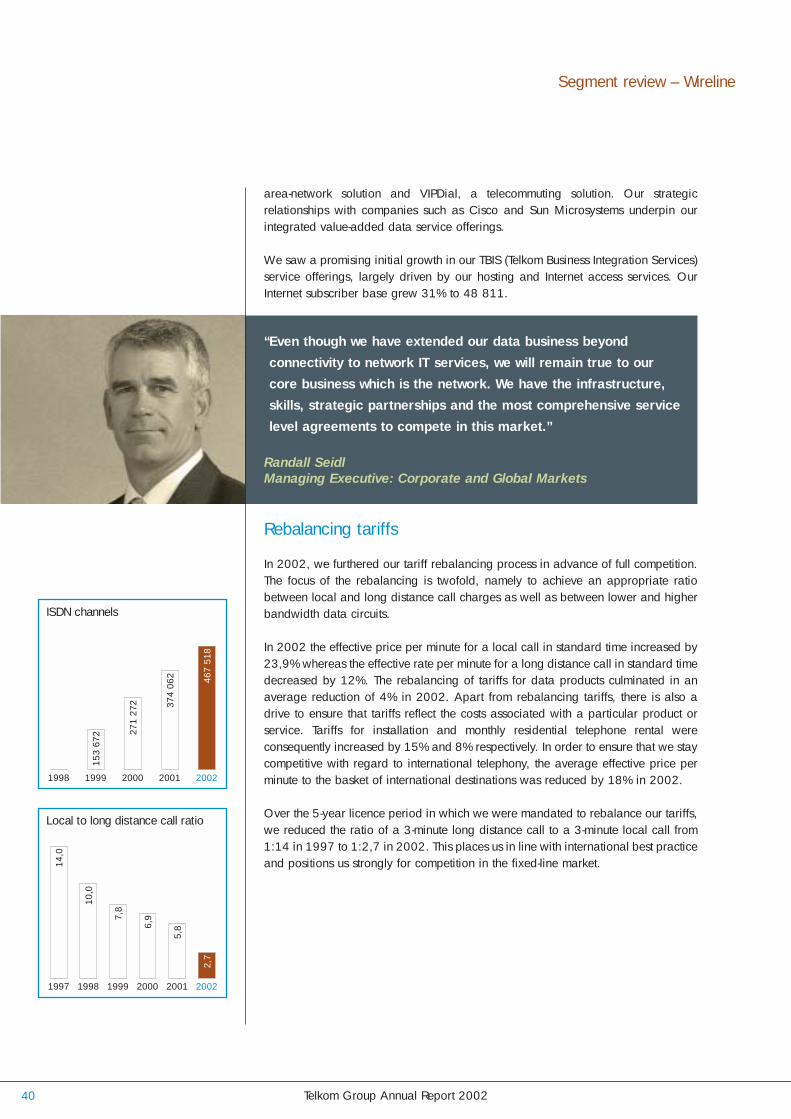
Rebalancing tariffs
In 2002, we furthered our tariff rebalancing process in advance of full competition.The focus of the rebalancing is twofold, namely to achieve an appropriate ratiobetween local and long distance call charges as well as between lower and higherbandwidth data circuits.
In 2002 the effective price per minute for a local call in standard time increased by23,9% whereas the effective rate per minute for a long distance call in standard timedecreased by 12%. The rebalancing of tariffs for data products culminated in anaverage reduction of 4% in 2002. Apart from rebalancing tariffs, there is also adrive to ensure that tariffs reflect the costs associated with a particular product orservice. Tariffs for installation and monthly residential telephone rental wereconsequently increased by 15% and 8% respectively. In order to ensure that we staycompetitive with regard to international telephony, the average effective price perminute to the basket of international destinations was reduced by 18% in 2002.
Over the 5-year licence period in which we were mandated to rebalance our tariffs,we reduced the ratio of a 3-minute long distance call to a 3-minute local call from1:14 in 1997 to 1:2,7 in 2002. This places us in line with international best practiceand positions us strongly for competition in the fixed-line market.
“Even though we have extended our data business beyondconnectivity to network IT services, we will remain true to ourcore business which is the network. We have the infrastructure,skills, strategic partnerships and the most comprehensive servicelevel agreements to compete in this market.”
Randall SeidlManaging Executive: Corporate and Global Markets
ISDN channels
1998 1999
153
672
2000
271
272
2001
374
062
2002
467
518
Local to long distance call ratio
1997
14,0
1999
7,8
2000
6,9
2001
5,8
2002
2,7
1998
10,0
Telkom Group Annual Report 2002 41
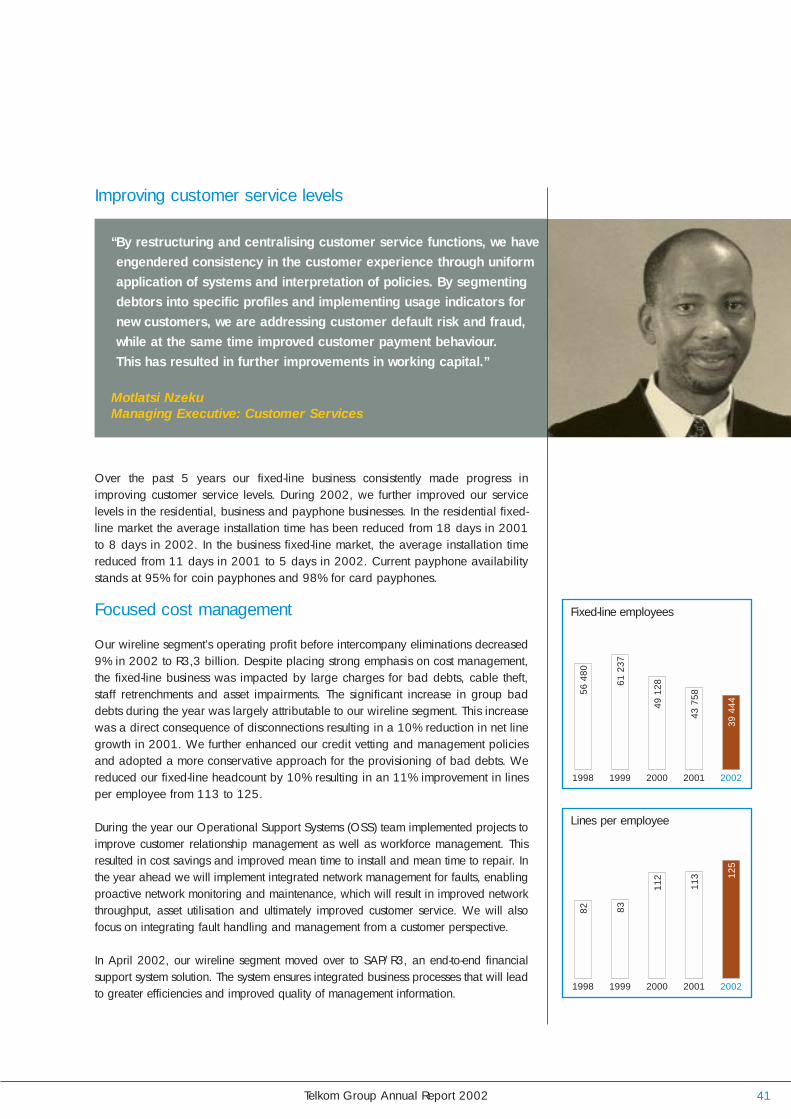
Improving customer service levels
Over the past 5 years our fixed-line business consistently made progress inimproving customer service levels. During 2002, we further improved our servicelevels in the residential, business and payphone businesses. In the residential fixed-line market the average installation time has been reduced from 18 days in 2001to 8 days in 2002. In the business fixed-line market, the average installation timereduced from 11 days in 2001 to 5 days in 2002. Current payphone availabilitystands at 95% for coin payphones and 98% for card payphones.
Focused cost management
Our wireline segment’s operating profit before intercompany eliminations decreased9% in 2002 to R3,3 billion. Despite placing strong emphasis on cost management,the fixed-line business was impacted by large charges for bad debts, cable theft,staff retrenchments and asset impairments. The significant increase in group baddebts during the year was largely attributable to our wireline segment. This increasewas a direct consequence of disconnections resulting in a 10% reduction in net linegrowth in 2001. We further enhanced our credit vetting and management policiesand adopted a more conservative approach for the provisioning of bad debts. Wereduced our fixed-line headcount by 10% resulting in an 11% improvement in linesper employee from 113 to 125.
During the year our Operational Support Systems (OSS) team implemented projects toimprove customer relationship management as well as workforce management. Thisresulted in cost savings and improved mean time to install and mean time to repair. Inthe year ahead we will implement integrated network management for faults, enablingproactive network monitoring and maintenance, which will result in improved networkthroughput, asset utilisation and ultimately improved customer service. We will alsofocus on integrating fault handling and management from a customer perspective.
In April 2002, our wireline segment moved over to SAP/R3, an end-to-end financialsupport system solution. The system ensures integrated business processes that will leadto greater efficiencies and improved quality of management information.
“By restructuring and centralising customer service functions, we haveengendered consistency in the customer experience through uniformapplication of systems and interpretation of policies. By segmentingdebtors into specific profiles and implementing usage indicators fornew customers, we are addressing customer default risk and fraud,while at the same time improved customer payment behaviour. This has resulted in further improvements in working capital.”
Motlatsi NzekuManaging Executive: Customer Services
Fixed-line employees
1998
56 4
80
1999
61 2
37
2000
49 1
28
2001
43 7
58
2002
39 4
44
Lines per employee
1998
82
1999
83
2000
112
2001
113
2002
125

Telkom Group Annual Report 200242
Combating cable theft and network fraud
We continue to face the challenge of eliminating both cable theft and network fraud.The impact of network fraud, including subscription and clip-on fraud, has successfullybeen reduced to R174 million (2001: R274 million) as a result of enhanced systemsand proactive management. In 2002 we changed the manner in which we accountfor cable theft to include all direct costs. The new method of recording cable thefttogether with the increase in the number of theft incidents resulted in an increase toR249 million (2001: R131 million). Although the number of incidents increasedduring the year, the number of customers affected decreased as we effectively focusedon high-traffic routes and improved cable alarm monitoring to minimise revenue loss.
Decline in capital expenditure and change in structure
As we reach the end of our licence obligations, we have changed our capital spendingdecision process to ensure that adequate returns on investment are achieved. We arefocused on reducing capital expenditure in our wireline segment without impacting servicelevels. This year we started the process by reducing our capital spend to R6,9 billion,25% of revenues, from R8,1 billion in 2001, 31% of revenues.
During 2002 we further expanded our network capacity and continued the modernisationof the fixed-line network. We increased the number of digital exchanges to 4 083 (2001:3 894). Telkom has digitised 653 switches since 1998 and digitisation of the fixed-linenetwork today stands at 99,8% compared to 74% in 1997. There are now 195 (2001:129) Asynchronous Transfer Mode (ATM) switches connecting customers. Our fixed-linenetwork is fully managed from a single, centralised point, the National NetworkOperations Centre (NNOC).
Future capital expenditure will focus to a greater extent on improvements in operationssupport systems and maintaining the technological competence of our network.
“The past year was characterised by the balance we achievedbetween capital spend and service levels. Despite capitalcutbacks, service levels still improved. This is encouraging as itwill become more and more important to drive the cost out ofthe business without sacrificing quality.”
Ken Raley Managing Executive: Network Operations
Segment review – Wireline
ATM switches
1998
0
1999
45
2000
116
2001
129
2002
195
Exchange units
1998 1999
3 51
2
2000
3 69
7
2001
3 89
4
2002
4 08
3
3 01
9

Telkom Group Annual Report 2002 43
Segment reviewWireless
2002 8 170
2001 6 693
22% increaserevenues (Rm)
2002 1 984
2001 1 324
50% increaseoperating profit (Rm)
2002 7 778
2001 5 722
36% increaseassets (Rm)
2002 2 113
2001 1 603
32% increasecapex (Rm)
The wireless segment, which accounted for 20% (2001: 17%) of group
revenues, includes the results of Vodacom Group (Proprietary) Limited and
Swiftnet (Proprietary) Limited. We account for the 50% joint venture interest
in Vodacom under this segment using proportional consolidation.
Note: Segment results presented before intercompany eliminations
Telkom Group Annual Report 200244
Segment review – Wireless
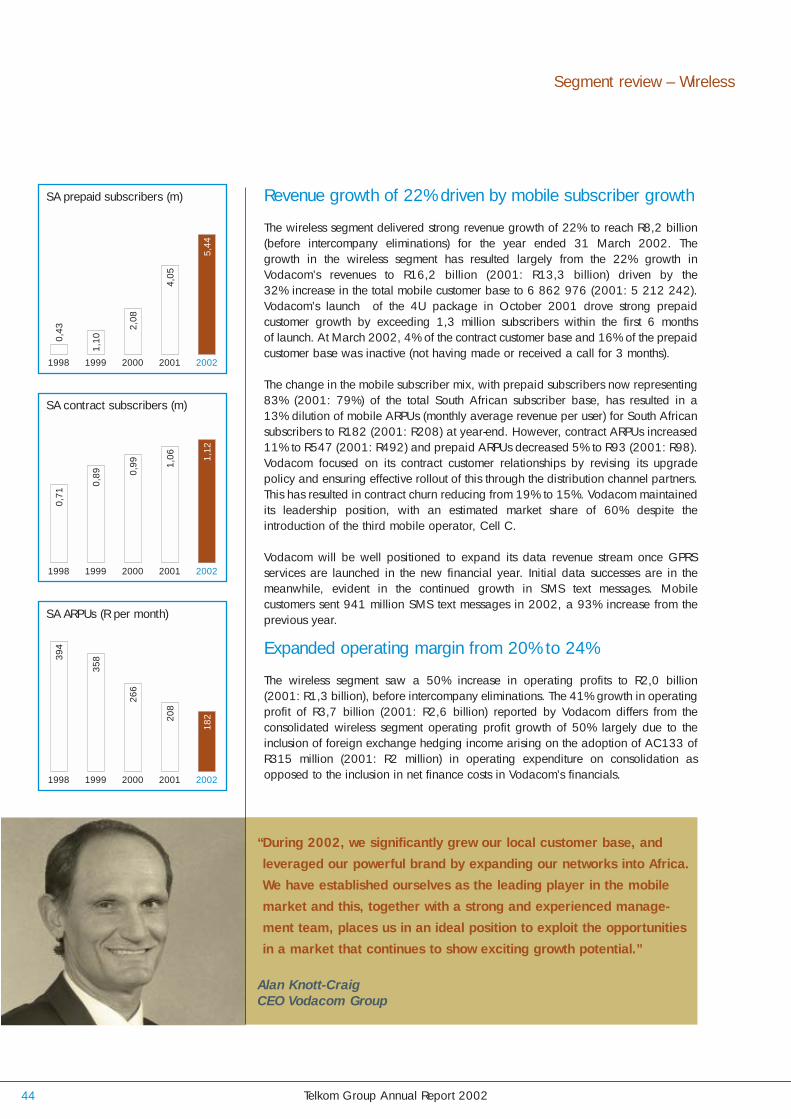
Revenue growth of 22% driven by mobile subscriber growth
The wireless segment delivered strong revenue growth of 22% to reach R8,2 billion(before intercompany eliminations) for the year ended 31 March 2002. Thegrowth in the wireless segment has resulted largely from the 22% growth inVodacom’s revenues to R16,2 billion (2001: R13,3 billion) driven by the32% increase in the total mobile customer base to 6 862 976 (2001: 5 212 242).Vodacom’s launch of the 4U package in October 2001 drove strong prepaidcustomer growth by exceeding 1,3 million subscribers within the first 6 monthsof launch. At March 2002, 4% of the contract customer base and 16% of the prepaidcustomer base was inactive (not having made or received a call for 3 months).
The change in the mobile subscriber mix, with prepaid subscribers now representing83% (2001: 79%) of the total South African subscriber base, has resulted in a13% dilution of mobile ARPUs (monthly average revenue per user) for South Africansubscribers to R182 (2001: R208) at year-end. However, contract ARPUs increased11% to R547 (2001: R492) and prepaid ARPUs decreased 5% to R93 (2001: R98).Vodacom focused on its contract customer relationships by revising its upgradepolicy and ensuring effective rollout of this through the distribution channel partners.This has resulted in contract churn reducing from 19% to 15%. Vodacom maintainedits leadership position, with an estimated market share of 60% despite theintroduction of the third mobile operator, Cell C.
Vodacom will be well positioned to expand its data revenue stream once GPRSservices are launched in the new financial year. Initial data successes are in themeanwhile, evident in the continued growth in SMS text messages. Mobilecustomers sent 941 million SMS text messages in 2002, a 93% increase from theprevious year.
Expanded operating margin from 20% to 24%
The wireless segment saw a 50% increase in operating profits to R2,0 billion(2001: R1,3 billion), before intercompany eliminations. The 41% growth in operatingprofit of R3,7 billion (2001: R2,6 billion) reported by Vodacom differs from theconsolidated wireless segment operating profit growth of 50% largely due to theinclusion of foreign exchange hedging income arising on the adoption of AC133 ofR315 million (2001: R2 million) in operating expenditure on consolidation asopposed to the inclusion in net finance costs in Vodacom’s financials.
SA prepaid subscribers (m)
1998 1999
1,10
2000
2,08
2001
4,05
2002
5,44
0,43
SA contract subscribers (m)
1998 1999
0,89
2000
0,99
2001
1,06
2002
1,12
0,71
SA ARPUs (R per month)
1998 1999
358
2000
266
2001
208
2002
182
394
“During 2002, we significantly grew our local customer base, andleveraged our powerful brand by expanding our networks into Africa.We have established ourselves as the leading player in the mobilemarket and this, together with a strong and experienced manage-ment team, places us in an ideal position to exploit the opportunitiesin a market that continues to show exciting growth potential.”
Alan Knott-CraigCEO Vodacom Group

Telkom Group Annual Report 2002 45
While Vodacom defended its market leadership position in South Africa and continuedto add customers to its network, it also ensured that further market penetration wasachieved at an acceptable margin. Despite expansion into Africa, administrative costshave successfully been contained. Vodacom has improved its efficiencies as evidencedby a 29% increase in subscribers per employee to 1 577 (2001:1 220).
As part of a longer term strategy, Vodacom refocused its activities to concentrateon its core businesses. This was assisted by the disposal of the investments in thesubsidiaries, Vodacom Sport and Entertainment (Proprietary) Limited and Film Fun(Holdings) (Proprietary) Limited, trading as Teljoy, and the 40% equity interest inVodacom World Online (Proprietary) Limited.
African expansion
Expanding our wireless segment further into Africa was facilitated by the VodacomBoard approval for the creation of a new company, Vodacom International.Vodacom’s future growth is supported by a strong balance sheet and it has adopteda conservative approach to its expansion strategy into Africa. Recourse to the SouthAfrican operations is limited where possible through the use of project finance.
During the year Vodacom Lesotho introduced prepaid services to prepare for theintroduction of the second mobile operator. Lesotho subscribers grew 153% to56 549. Vodacom Tanzania continued to aggressively grow market share, ending theyear with an estimated 56%. Tanzania subscribers grew 178% to 228 491. ARPUsfrom Tanzania and Lesotho were US$31 and R144 respectively. The new operationsin the Democratic Republic of Congo (DRC) were launched in May 2002. Africanoperations currently contribute 1,6% to Vodacom’s operating profit and Vodacom’sinternational subscriber base now represents 4,5% of the total subscriber base.
Capital expansion in South Africa and Africa
The wireless segment’s capital expenditure for the year increased by 32% toR2,1 billion, driven by the 33% increase in Vodacom’s capital expenditure toR4,2 billion (2001: R3,1 billion). The increase results from a 28% growth in theSouth African mobile subscriber base, and the initial build-out requirements for start-up operations in Tanzania and the Democratic Republic of Congo.
In July 2001, Vodacom signed a national roaming agreement allowing the third mobileoperator, Cell C, to have access to national coverage at its launch of services. Due tothe continued delays in the issuing of 1 800 MHz spectrum, 900 MHz spectrum has,at a cost, been used to effectively service both Vodacom and Cell C’s customer bases.
Other African mobile subscribers
2002
306
156
2001
104
383
Teledensity (per 100 inhabitants)
Lesotho
1,53
DRC
0,29
Mozambique
0,84
1,03
0,04 0,
44
Fixed-line teledensityMobile teledensity
“We carefully balance the risk of investing in Africa with stringentinvestment criteria. We look for a dollar-based IRR of more than20% over the licence period, 51% interest in an internationallicence, operating profit after one year, a licence period exceedingten years and adequate spectrum must be made available.”
Andrew Mthembu Deputy CEO Vodacom Group
Population (m)
Lesotho
2,2
DRC
52,5
Mozambique
20,2

Telkom Group Annual Report 200246
Corporate governance
Governance statements
The Board of Directors and senior management of the Group are committed toensure that the affairs of the Group are conducted with integrity and in accordancewith the Code of Corporate Practices and Conduct. Monitoring the Group’scompliance with this approach forms part of the mandate of the Audit Committee.
Governance structures
The Board of DirectorsThe Board of Directors comprises 3 executive and 11 non-executive directors. Thenon-executive directors have a wide range of skills and commercial experience thatenables them to bring independent judgement to the Board’s deliberations anddecisions. An orientation programme exists for the benefit of new appointees to theBoard of Directors.
The roles of Chairman and Chief Executive Officer do not rest in the same person.The Chairman is a non-executive director appointed by the majority shareholder.The Board appoints the Chief Executive Officer on a renewable 3-year contract.
In accordance with the Shareholders’ Agreement, the Strategic Equity Partnersappoint 5 directors to the Board, which include 3 non-executive directors. TheGovernment nominates the remainder of the non-executive directors, 2 of whomrepresent organised labour. The Board of Directors maintains full and effective controlover the Group and meets at least quarterly every year. The Board has established anumber of standing committees that operate within the written terms of reference.
Company Secretary The Company Secretary is required to ensure that minutes of all shareholder,director and various committee meetings are properly recorded and distributed interms of section 242 of the Companies Act.
Directors have access to the services of the Company Secretary, who is responsiblefor ensuring that Board procedures are followed. All directors are entitled to seekindependent professional advice about the affairs of the Group at the Group’s cost.
Operating CommitteeVoting membersMr S E Nxasana (Chairman)Mr T M BarryMs N T MoholiMr S ManickamMr R J September

Telkom Group Annual Report 2002 47
Non-voting membersMr A J LewisMr G N V MagushulaMr B M C NgcoboMr K P Patel
In terms of the Shareholders’ Agreement, the Board of Directors has irrevocablydelegated to the Operating Committee exclusive powers and authority primarily forthe following:• The implementation of an approved business plan and annual budget, as well as
the training programme;• The implementation of Telkom’s obligations under its licences; and• The review, preparation and recommendation to the Board for its approval of
business plans, annual budgets and training programmes or any amendments thereto.
The Operating Committee consists of the Chief Executive Officer, the ChiefOperating Officer, the Chief Strategic Officer, the Chief Technical Officer and aGovernment appointee, as ex-officio voting members. The Chief Executive Officer isthe chairman of the Operating Committee.
Decisions at meetings of the Operating Committee are taken by a majority vote ofthe voting members. In the event of an equality of votes, a nominee of the StrategicEquity Partner has a casting vote.
Human Resources Review and Remuneration CommitteeVoting membersMr E Molobi (Chairman)Mr S E NxasanaMr T M BarryTan Sri Dato’ Ir. Md. Radzi MansorMs W Y N LuhabeNon-voting membersMr J Rajaratnam
The Human Resources Review and Remuneration Committee consist of a majority ofnon-executive directors. The Chairman of the Board chairs the Committee. TheCommittee’s specific terms of reference include direct authority for, or considerationof and recommendation to the Board on matters relating to, inter alia, general staffpolicy, remuneration, bonuses, directors’ remuneration and fees, service contractsand Group pension and retirement fund benefits.
Audit CommitteeVoting membersMr M P Moyo (Chairman)Mr D A Roy (alternate Mr C L Valkin)Ms W E Lucas-BullNon-voting membersMr A J LewisMr V Magan

Telkom Group Annual Report 200248
The Audit Committee consists of 3 non-executive directors, the Head of Internal Auditand the Chief Financial Officer. A non-executive director chairs the Committee.
The Audit Committee meets quarterly or as required and functions under the powersand authority delegated to it by the Board to:• Review internal audits;• Review the draft interim and annual financial statements;• Review external audit reports;• Review independence of external auditors;• Review and recommend changes to the statutory audit;• Monitor internal control systems; and• Monitor compliance with the Code of Corporate Governance and the Group’s
Code of Ethics.
Code of Ethics
The Group has implemented a Code of Ethics that complies with the highest standardsof integrity, behaviour and ethics in dealing with all its stakeholders, including theGroup’s directors, managers, employees, customers, suppliers, investors, shareholders,and society at large.
Directors and staff are expected to observe their ethical obligations in such a wayas to carry on business only through fair commercial competitive practices.
Worker participation
The Group employs a variety of participative structures on issues, which affectemployees directly. The structures are designed to achieve good employer/employee relations through the effective sharing of relevant information. Throughthese participative structures the Group enjoys prompt identification and resolutionof issues.
These structures embrace goals relating to values, productivity, training and retraining.
Employment equity
The Group has developed an employment equity policy, which has been approvedby the Board of Directors and distributed to employees.
The essence of the policy is to implement a fair and reasonable employment equityprogramme based on moral decency, sound business practice and principles ofeconomic common sense.
The broad objectives are to:• Create an environment in which the best person can be employed for the job
regardless of gender, creed, colour or race through achieving a state of balancein which the question of race will no longer be an issue;
Corporate governance

Telkom Group Annual Report 2002 49
• Create within the Group a balanced profile of employees that reflects thecomposition of the broad South African society;
• Correct racial and social imbalances of the past; and• Provide for the Group’s present and future requirements for skilled staff.
Risk management
The Board of Directors is responsible for the total risk management process within theGroup. Management is accountable to the Board and has established a system ofinternal control to manage significant group risks. The management of riskencompasses all significant business risks, including operational risk. The Board hasapproved the level of acceptable risk. Issues and circumstances that could give rise tomaterial adverse reputation impacts, are also considered to be unacceptable risk.
Internal Audit
The Internal Audit department performs various activities, independently and underthe guidance of the Audit Committee that ultimately result in an examination andevaluation of the adequacy and effectiveness of the internal control environment. Itsobjective is to assist executive, senior and line management in meeting their businessobjectives through an examination of the activities, an assessment of the riskinvolved and an evaluation of the adequacy and effectiveness of the processes,systems and controls to manage these risks. Material or significant controlweaknesses, together with planned management remedial action, are reported tothe Audit Committee. Internal Audit has direct access to the Chief Executive Officerand the Chairperson of the Audit Committee.
The Audit Committee, which meets quarterly, is therefore satisfied that the internalcontrol systems are adequate for the financial year ending 31 March 2002.
Internal control
The directors believe the Group’s system of internal control provides reasonableassurance that assets are safeguarded, transactions are authorised and recordedproperly and that material errors and irregularities, are either detected orprevented timeously. Having reviewed its effectiveness, the directors are not awareof any significant weakness or deficiency in the Group’s system of internal financialcontrols.
The Public Finance Management Act (PFMA)
In October 2001, Telkom was granted exemption for a 3-year period from certainprovisions of the Public Finance Management Act (Act of 1999), for which Telkomhad applied in terms of section 92.

Telkom Group Annual Report 200250
Our Foundations
During 2002 the Group invested R33 million on various social projects through theTelkom and Vodacom Foundations.
The Telkom Foundation was established in 1998, with a 5-year budget ofR100 million. Its primary objective is to contribute to the transformation ofdisadvantaged communities through sustainable development programmes.Recognising that South Africa’s skills shortage is critical in technology-relatedfields, the Foundation has focused primarily on mathematics, science andtechnology education. Flagship projects include the provision of Internet connectionstogether with hardware, software and training to more than 1 000 schools.
The Vodacom Foundation was established in 1999, with priority investment areas ineducation, health and safety and security. Much of the Foundation’s activity hasinvolved the forging of strong partnerships with communities targeted for upliftment.Flagship examples of recent Vodacom Foundation projects include the overhaul ofthe Alexandra Police Station and Wynberg Magistrate’s Court, as well as theconstruction of a school, clinic, teachers’ facility and créche in rural Eastern Cape.
Our international shareholder, Thintana, also committed in excess of R120 millionover a five-year period for improving the quality of life of South African citizens andbringing future generations into a knowledge-based society.
Corporate social responsibility
“A good business is one which strikes the right balance betweenwhat it owes society and what it expects from it. A responsiblecorporate citizen knows community involvement is not separatefrom the business of earning profits, but an integral part of it.Guided by these beliefs, Telkom will continue to help create amore affluent society.”
Nkhetheleng VokwanaCEO Telkom Foundation

Telkom Group Annual Report 2002 51
Centres of Excellence
Telkom’s Centres of Excellence are a collaboration between Telkom, thecommunications industry and academia to promote research in communicationstechnology and to provide facilities that encourage young scientists and engineersto pursue their interests in South Africa. Since launching in 1997, the programmehas built local telecommunications and information technology skills which areyielding substantial benefits for the universities and technikons involved and helpingTelkom to solve technical problems and reduce costs. There are currently 12 centres,located at tertiary institutions around the country.
Centre for Learning
The Centre for Learning assists employees to achieve a synthesis of business, serviceexcellence and technical skills, based on business demands. Over the last 5 years,the Centre for Learning delivered more than 3,3 million days of training to Telkomemployees. Almost half a million days were dedicated to adult basic education andtraining, enabling employees to increase their literacy, numeracy and problem-solving skills. The Centre also awarded 234 scholarships and bursaries to Telkomemployees in 2002. The Telkom School of Accounting programme provides trainingto financial staff. At the end of March 2002, 15 participants had completedprogrammes ranging from associate accounting technician to chartered accountant.
Economic empowerment
The Group’s Black Economic Empowerment programme is a deliberate, proactiveand ongoing process to ensure constructive participation by all designated groupsin the mainstream of the country’s economy. Accordingly, implementing economicempowerment in the Group has been largely through procuring goods and servicesfrom previously disadvantaged groups. Economic empowerment is a businessimperative for the Group. In 2002, the Group’s procurement spend on economicempowerment was approximately R5 billion.
Safety, health and environmental management
The health and safety of our employees, combined with the environment in whichthey operate, is essential to our commitment to providing excellent customer service.The Group is committed to continuously maintaining a healthy, safe and secureworking environment that, at a minimum, complies with the relevant safety andenvironmental regulations.
The inception of environmental management systems in 1997 in both our mobileand fixed-line businesses has led to a number of significant achievements inestablishing a sustainable environmental practice. This includes the design andimplementation of initiatives such as environmentally-friendly procurement practices,waste recycling, camouflaged cellular base stations and the establishment of anational environmental corrective action plan.

Telkom Group Annual Report 200252
Sponsorships
The Group continues to support both art and sports development in South Africathrough its numerous sponsorship programmes.
Telkom is a founder sponsor of Proudly South African, an organisation establishedto create jobs, increase demand for South African products and services, andencourage companies to improve their quality and competitiveness. Telkom’sinvolvement in the Old Mutual Telkom National Choir Festival entrenches theGroup’s commitment to the growth and development of arts and culture in SouthAfrica. Thirty-five charities benefited in 2001 from Telkom’s sponsorship of theCharity Cup soccer match. The Telkom Learn-to-Swim programme enabledapproximately 12 000 children to acquire basic swimming skills and learn aboutwater safety. Telkom sponsors 2 Pro Range golf academies and is a subsponsor ofthe Vodacom Caddy Foundation and the Nedbank Ladies Professional Golf Tour.
Vodacom is one of South Africa’s most enthusiastic sport sponsors as it recognisesthe important role sport plays in reconciliation and nation building. Vodacomsponsors both Kaizer Chiefs and Orlando Pirates, the two most successful SouthAfrican soccer clubs. Vodacom endeavours to always build a developmentalcomponent to its sponsorship programmes as evidenced by the Vodacom CaddieFoundation in golf, Dream League in motor racing and Vodacom Cup in rugby.Vodacom sponsored the biggest incentive programme for South African Olympicathletes participating in the Sydney 2000 Olympic Games.
Corporate social responsibility

Telkom Group Annual Report 2002 53
Directors’ responsibility statement 54
Report of independent auditors 55
Directors’ report 56
Company Secretary’s certificate 61
Significant accounting policies 62
Income statement 66
Balance sheet 67
Statement of changes in equity 68
Contents
Cash flow statement 69
Notes to the financial statements 70
Annexure A – Interest-bearing debt 100
Annexure B – Investment in joint venture 103
Annexure C – Other investments 104
US Securities legend IBC
Administration IBC
Group annual financial statementsfor the year ended 31 March 2002
Telkom Group Annual Report 200254
Directors’ responsibilities relating to the annualfinancial statementsThe directors are responsible for the preparation of the annual financial statements of the Group. The directors arealso responsible for maintaining a sound system of internal control to safeguard shareholders’ investments and theGroup’s assets.
In presenting the accompanying financial statements, South African Statements of Generally Accepted AccountingPractice have been followed and applicable accounting policies have been used incorporating prudent judgementsand estimates.
The external auditors are responsible for independently auditing and reporting on the annual financial statements.
In order for the directors to discharge their responsibilities, management continues to develop and maintain a systemof internal control aimed at reducing the risk of error or loss in a cost-effective manner.
The internal controls include a risk-based system of internal auditing and administrative controls designed to providereasonable but not absolute assurance that assets are safeguarded and that transactions are executed and recordedin accordance with generally accepted business practices and the Group’s policies and procedures.
The directors, primarily through the Audit Committee, which mainly consists of non-executive directors, meetperiodically with the external and internal auditors, as well as executive management to evaluate matters concerningaccounting policies, internal control, auditing and financial reporting.
The directors are of the opinion, based on the information and explanations given by management and internal audit,that the internal accounting controls are adequate, so that the financial records may be relied on for preparing thefinancial statements and maintaining accountability for assets and liabilities.
The directors are satisfied that the Group has adequate resources to continue in operational existence for theforeseeable future. Accordingly, Telkom SA Limited continues to adopt the going-concern basis in preparing theannual financial statements.
Against this background the directors of the Company accept responsibility for the annual financial statements, whichwere approved by the Board of Directors on 27 June 2001 and are signed on their behalf by:
Eric Molobi Sizwe NxasanaChairman Chief Executive Officer
Pretoria27 June 2002
Telkom Group Annual Report 2002 55
Report of independent auditorsWe have audited the Group’s annual financial statements of Telkom SA Limited set out on pages 56 to 104 for theyear ended 31 March 2002. These annual financial statements are the responsibility of the Company’s directors.Our responsibility is to express an opinion on these annual financial statements based on our audit.
ScopeWe conducted our audit in accordance with statements of South African Auditing Standards. Those standards requirethat we plan and perform the audit to obtain reasonable assurance that the annual financial statements are free ofmaterial misstatements. An audit includes:• examining, on a test basis, evidence supporting amounts and disclosures in the annual financial statements;• assessing the accounting principles used and significant estimates made by management; and • evaluating the overall annual financial statements’ presentation.
We believe that our audit provides a reasonable basis for our opinion.
Audit opinionIn our opinion, the Group’s annual financial statements fairly present, in all material respects, the financial positionof the Group as at 31 March 2002 and the results of its operations and cash flows for the year then ended inaccordance with South African Statements of Generally Accepted Accounting Practice and in the manner requiredby the Companies Act in South Africa.
Ernst & Young KMMT IncorporatedRegistered Accountants and Auditors Registered Accountants and AuditorsChartered Accountants SA Chartered Accountants SA
Pretoria27 June 2002

Telkom Group Annual Report 200256
The directors have pleasure in submitting their report together with the Group audited annual financial statements forthe year ended 31 March 2002.
Business activities and performanceTelkom SA Limited (“the Company”), incorporated in South Africa, is an integrated communications groupwith wireline and wireless services in South Africa and other African countries. Telkom is the incumbent fixed-lineoperator in South Africa and held the exclusive licence to provide public switched telecommunication services until7 May 2002. Telkom is also the leading provider of mobile services through its 50% shareholding in the VodacomGroup (Proprietary) Limited.
ZAR million 2002 2001 %
Operating revenue 33 970 31 457 8Operating profit before interest, tax, depreciation and amortisation 10 493 9 862 6Cash flow from operations 11 303 9 748 16Earnings per share (cents) 343,8 294,6 17Headline earnings per share (cents) 414,9 361,0 15
Share capitalThere was no change to the authorised and issued share capital of the Group and the Company during the yearended 31 March 2002.
Number Nominal ValueOrdinary shares of shares value (ZAR) (ZARm)
Authorised 1 000 000 000 10 10 000Issued 557 031 819 10 5 570
Of the total shares in issue:• 67% held by the Government of the Republic of South Africa;• 30% held by a consortium consisting of SBC Communications Inc and Telekom Malaysia Berhad, operating through
a USA limited liability company Thintana Communications LLC, registered in the State of Delaware, USA; and • 3% held by Ucingo Investments (Proprietary) Limited, a black empowerment company.
Borrowing powersIn terms of the articles of association, the Group has unlimited borrowing powers. At 31 March 2002, the Group’snet borrowings totalled R21,1 billion (2001: R21,2 billion).
Directors’ report

Telkom Group Annual Report 2002 57
Capital commitmentsZAR million 2003 2002
Authorised 7 491 11 028Commitments against authorised capital expenditure 957 1 311Authorised capital expenditure not yet committed 6 534 9 717
Capital commitments are to be funded primarily by internally generated funds.
Acquisitions and disposalsOn 16 May 2001 Telkom SA Limited made a further R22 million investment in Swiftnet (Proprietary) Limited,increasing its shareholding from 60% to 100%.
On 11 October 2001 Telkom SA Limited acquired a further R160 million investment in Telkom Directory Services(Proprietary) Limited, increasing its shareholding from 54,9% to 64,9%.
The Group further acquired through its joint venture company, Vodacom, a 51% interest in a company holding aGSM licence to operate in the Democratic Republic of Congo.
The refocusing of the Group on core business activities also saw the disposal of Vodacom’s subsidiaries, VodacomSport and Entertainment (Proprietary) Limited and Film Fun (Holdings) (Proprietary) Limited, and a 40% equityinvestment in Vodacom World Online (Proprietary) Limited.
Subsidiaries and joint venturesThe Group has the following interests in unlisted South African based companies:• 50% interest in Vodacom Group (Proprietary) Limited, a company that operates one of three South African licensed
cellular telephone networks and also acts as a service provider;• 100% interest in Q-Trunk (Proprietary) Limited, a company that was a provider of radio-trunking services;• 100% interest in Swiftnet (Proprietary) Limited, a company that provides wireless data applications and solutions;• 100% interest in Intekom (Proprietary) Limited, a company that was an Internet Service Provider; and• 64,9% interest in Telkom Directory Services (Proprietary) Limited, a company that provides advertising through the
production of telephone directories, including compilation and distribution.

Telkom Group Annual Report 200258
Directors’ report
The operations of Q-Trunk (Proprietary) Limited and Intekom (Proprietary) Limited were incorporated into theCompany during the year.
Indebtedness Percentage held Shares at cost to Telkom
2002 2001 2002 2001 2002 2001
% % ZAR ZAR ZARm ZARm
Vodacom Group (Pty) Ltd 50,0 50,0 50 50 460 460Telkom Directory Services (Pty) Ltd 64,9 54,9 166 778 557 6 468 000 5 –Swiftnet (Pty) Ltd 100,0 60,0 70 382 609 48 000 000 56 63Intekom (Pty) Ltd 100,0 100,0 10 001 000 10 001 000 29 82Q-Trunk (Pty) Ltd 100,0 100,0 10 001 000 10 001 000 49 96
All the companies detailed above are incorporated in South Africa.
The Company’s interest in aggregate profits earned by the joint venture and subsidiary companies amounted toR1 324 million (2001: R729 million) after taxation and aggregate losses of subsidiary companies amountedto R9 million (2001: R36 million).
DividendsNo dividends were declared or paid to shareholders during the current or prior year.
Events subsequent to balance sheet dateThere were no significant events after balance sheet date and the date of this report.
DirectorateThe following are details of changes in the composition of the Board of Directors from the beginning of the accountingperiod to the date of this report.
Appointments ResignationsMs S V Zilwa (13 June 2001) Ms S V Zilwa (3 August 2001)Mr M P Moyo* (19 September 2001) Adv E D Moseneke (31 July 2001)Mr T A Sekano (19 September 2001)Dato Md K A Rahman# (15 January 2002) (Alternate to Tan Sri Dato’ Ir. Md. Radzi Mansor)
* Zimbabwean# Malaysian

Telkom Group Annual Report 2002 59
Directors’ emolumentsThe following emoluments were paid to directors during the year under review and represent directors’ fees for non-executive directors and salaries for executive directors:
ZAR million 2002 2001
Executive directors 2,4 2,2
– As director – –– Other services 2,4 2,2
Non-executive directors 0,7 0,6
– As director 0,6 0,5– Other services 0,1 0,1
Directors’ interestsMr E Molobi, the Chairman of the Board of Directors of the Group, has the following interests as the Chief ExecutiveOfficer for Kagiso Trust Investments (Proprietary) Limited:• A 25% holding by Kagiso Trust Investments (Proprietary) Limited in BUA Telecoms, a company that is a vendor to
the Group• A 25% holding by Kagiso Trust Investments (Proprietary) Limited in debis Fleet Management (Proprietary) Limited,
a fleet management company to whom the Group has outsourced its vehicle fleet• A 50,1% holding by Kagiso Trust Investments (Proprietary) Limited in Kagiso Treasury Services (Proprietary) Limited,
who manages the Group’s Treasury function
Annual General MeetingThe Annual General Meeting to receive the annual report will be held on 16 October 2002 in Pretoria.
AuditorsErnst & Young and KMMT Inc. have expressed their willingness to continue in office and resolutions, proposing theirreappointment and authorising the Board to set their remuneration, will be submitted at the Annual General Meeting.
Telkom Group Annual Report 200260
Directors’ report
The following served as directors of the Company at its financial year-end:Mr E Molobi (Chairman)Mr S E Nxasana (Chief Executive Officer)Mr T M Barry (Chief Operating Officer)*Tan Sri Dato’ Ir. Md Radzi Mansor#
(Alternate Dato’ Md Khir Abdul Rahman)#
Ms W Y N LuhabeMs W E Lucas-BullMr S Manickam (Chief Strategic Officer)#
(Alternate J M Rajaratnam)Mr C L Valkin (Alternate A J Lewis)Mr C B C SmithDr D MjiMr D A Roy* (Alternate M D Kerckhoff)Mr R P MenellMr M P Moyo†
Mr T A Sekano
* American# Malaysian† Zimbabwean
Company SecretaryMr V V Mashale is the Company Secretary.
Company Secretary’s business address and registered officeTelkom Towers North152 Proes StreetPretoria0002South Africa
Postal addressPrivate Bag X881Pretoria0001South Africa
Special resolutionsNo special resolutions were passed during the year under review.
Telkom Group Annual Report 2002 61
Declaration by the Company Secretary in terms of Section 268G(D) of the Companies Act:
The Company has lodged with the Registrar of Companies all such returns as are required of a public company interms of the Companies Act, and all such returns are true, correct and up to date.
V V MashaleCompany Secretary
Pretoria27 June 2002
Company Secretary’s certificate

Telkom Group Annual Report 200262
Basis of preparationThe financial statements are prepared on the historical cost basis, as adjusted by the valuation of certain financialinstruments to fair value. The accounting policies of the Group are in conformity with South African Statements ofGenerally Accepted Accounting Practice. They are consistent with the previous year, apart from the adoption ofAC116, Employee Benefits and AC133, Financial Instruments: Recognition and Measurement. Where necessary,comparatives have been adjusted to be consistent with current year presentation.
Basis of consolidationThe consolidated financial statements (the Group) include those of Telkom SA Limited (the Company), its subsidiariesand joint ventures. Joint ventures are accounted for by the proportionate consolidation method. Intragrouptransactions are eliminated on consolidation. Business combinations are accounted for using the purchase method ofaccounting. On acquisition of a subsidiary or joint venture, any excess of the purchase price over the fair value ofthe net assets is recognised as goodwill. Minority interests are calculated on the fair value of assets and liabilities.
Intangible assetsIntangible assets, including goodwill, are stated at cost and amortised on a straight-line basis over the anticipatedperiod of benefit. Amortisation commences when the asset is available for use.
The expected useful lives assigned to intangible assets are:Years
Licences 5 to 20Goodwill 3 to 5Trademarks, copyrights and other 3 to 5
Property, plant and equipmentFreehold land is stated at cost and is not depreciated.
Property, plant and equipment is stated at historical cost less accumulated depreciation. Depreciation is charged fromthe date of commissioning on a straight-line basis over the estimated useful life. Under construction representssoftware, network and support equipment and includes all direct expenditure but excludes abnormal wastage.
The expected useful lives assigned to property, plant and equipment are:Years
Buildings 40 to 50Network equipment– Cables 10 to 28– Switching 5 to 15– Transmission 15– Other 2 to 15Support equipment 5 to 10Furniture and office equipment 3 to 10Data processing equipment and software 3 to 5Other 5 to 10
Borrowing costsFinancing costs directly associated with the construction or acquisition of qualifying assets are capitalised at interestrates relating to loans specifically raised for that purpose, or at the weighted average borrowing rate where thegeneral pool of group borrowings was utilised. Other borrowing costs are expensed as incurred.
Significant accounting policies
Telkom Group Annual Report 2002 63
InventoriesInventories are stated at the lower of cost (determined on a weighted average basis), or estimated net realisable value.
Impairment of assetsThe Group regularly reviews its assets and financial instruments for impairment. Impairment occurs when the carryingvalue exceeds the estimated recoverable amount.
Financial instrumentsRecognitionAll financial instruments are initially recognised at cost, including transaction costs, on the trade date. Gains andlosses arising on changes in fair value of these instruments are recognised in income in the period they occur, exceptfor those classified as “available for sale” which are taken directly to equity.
Subsequent to initial recognition, financial assets classified as “available for sale” are measured at fair value andthose classified as “held to maturity” at amortised cost. Receivables, loans, interest-bearing borrowings and otherfinancial liabilities are measured at amortised cost where a maturity date exists, or at cost if no maturity date exists.Amortised cost is calculated on the effective interest rate method.
Fair value adjustments on unlisted investments are made if the value can be determined in terms of the statement.
DerecognitionOn derecognition of a financial asset or liability, the difference between the consideration and the carrying amounton the trade date is included in income.
Trade and other receivablesTrade receivables are recognised and carried at original invoice amount less an allowance for uncollectibles. Anestimate for doubtful debts is made when collection of the full amount is not probable. Bad debts are written offas incurred.
Bills of exchange and promissory notes held to maturity are measured at amortised cost using the effective interestrate method. Those that do not have a fixed maturity are carried at the fair value of the consideration given.
Derivative financial instrumentsAll derivative financial instruments are measured at fair value subsequent to initial recognition with gainsand losses taken to income. The fair value of forward exchange contracts is calculated by reference tocurrent forward exchange rates for contracts with similar maturity profiles. The fair values of interest rateswap contracts are determined as the difference in the present value of the future net interest cash flows. The fair valueof currency swaps is determined with reference to the present value of expected future cash flows. The Group doesnot apply hedge accounting as specified in AC133 but fully hedges all foreign exchange exposures.
Sale and buyback transactionsSecurities sold under sale and buyback agreements are carried at amortised cost. Associated finance charges aretaken to income.
Securities purchased under sale and buyback agreements are not recognised in the financial statements anda receivable is raised for the consideration provided. The receivable is carried at fair value with adjustments takento income.

Telkom Group Annual Report 200264
Bridge liquidity transactionsBonds issued where Telkom is a buyer and seller of last resort are carried at amortised cost. The Group does notactively trade in bonds.
Foreign currenciesTransactions denominated in foreign currencies are translated at the rate of exchange at the transaction date.Monetary items denominated in foreign currencies are translated at the rate of exchange at the balance sheet date.Realised and unrealised profits and losses on foreign exchange are included in operating costs.
Assets and liabilities of foreign entities are translated at the foreign exchange rates ruling at the balance sheet date.Income, expenditure and cash flow items are translated at the actual foreign exchange rate or average foreignexchange rates for the period. Exchange differences on consolidation are classified as part of the foreign currencytranslation reserve, until disposal of the investment. Any fair value adjustments arising on the acquisition of a foreignentity are recorded in the Group and translated at the foreign exchange rates on transaction date.
Deferred taxationDeferred taxation is accounted for using the balance sheet liability method at current rates in respect of temporarydifferences.
Employee benefitsShort-term employee benefitsThe cost of all short-term employee benefits is recognised during the period employees render services.
Leave benefitsHoliday leave is accumulated over the period the leave accrues and is subject to a cap. Sick leave is accumulatedon days accrued.
Post-employment benefitsThe Group provides defined benefit and defined contribution plans for the benefit of employees. These plans arefunded by the employees and the Group, taking into account recommendations of the independent actuaries. Thepost-retirement medical liability is unfunded.
Defined contribution plansThe Group’s funding of the defined contribution plans is charged to the income statement in the same period as therelated service is provided.
Defined benefit plansThe Group provides defined benefit plans for pension, medical aid costs, and telephone rebates to qualifyingemployees. The Group’s net obligation in respect of defined benefits is calculated separately for each plan byestimating the amount of future benefits earned in return for services rendered.
The amount recognised in the balance sheet represents the present value of the defined benefit obligation as adjustedfor unrecognised actuarial gains and losses, unrecognised past service costs, reduced by the fair value of plan assets.The amount of any surplus recognised is limited to unrecognised actuarial losses and past service costs plus thepresent value of available refunds and reductions in future contributions to the plan. To the extent that there isuncertainty as to the entitlement to the surplus, no asset is recognised.
Significant accounting policies
Telkom Group Annual Report 2002 65
Actuarial gains and losses are recognised as income or expense when the cumulative unrecognised gains and lossesfor each individual plan exceed 10% of the greater of the present value of the Group’s obligation or the fair valueof plan assets. These gains or losses are amortised on a straight-line basis over 10 years.
Past service costs are recognised immediately to the extent that the benefits are vested; otherwise, they are recognisedon a straight-line basis over the average period the benefits become vested.
Termination benefitsTermination benefits are payable when employment is terminated before the normal retirement age or when anemployee accepts voluntary redundancy in exchange for benefits.
ProvisionsProvisions are recognised where the Group has a present obligation from a past event and an outflow of resourcesis expected.
RevenueRevenue for services, excluding value-added tax, is stated at fair value.
Revenue from usage and network access is recognised as services are provided. Revenue from the sale of equipmentis recognised when the customer accepts delivery.
Revenue that is billed in advance is recorded in the balance sheet as deferred income until the service is rendered.
Dividends from investments are recognised on the date that the dividend is declared. Interest is recognised on a timeproportion basis taking into account the principal amount outstanding and the effective rate.
LeasesOperating lease payments are recognised as an expense in the income statement on a straight-line basis over thelease term.
Assets acquired in terms of finance leases are capitalised at the lower of fair value or the present value of theminimum lease payments at inception of the lease and depreciated over the lesser of the useful life of the asset or thelease term. Lease finance costs are allocated to income over the term of the lease using the effective interest ratemethod.
Segmental reportingThe Group is managed in 2 segments: wireline and wireless. The basis of segment reporting is representative of theGroup’s internal reporting structure. The Group’s 2 segments operate mainly in South Africa and are not analysedby geographical areas.
The wireline segment provides fixed-line services including access, local, national and international voice services,data services and directory services.
The wireless segment provides mobile telephony services including the sale of mobile equipment and wireless dataapplication services.

Telkom Group Annual Report 200266
for the year ended 31 March 2002
ZAR million Notes 2002 2001
Operating revenue 1 33 970 31 457Operating expenses 2 23 477 21 595
Operating profit before interest, tax, depreciation and amortisation 10 493 9 862Depreciation and amortisation 3 5 243 4 987
Profit from operating activities 5 250 4 875Investment income 4 580 617
Profit before finance charges 5 830 5 492Finance charges 5 3 066 3 041
Profit before tax 2 764 2 451Taxation 6 792 742
Profit after tax 1 972 1 709Minority interests 57 68
Net profit for the year 1 915 1 641
Earnings per share (cents) 7 343,8 294,6Headline earnings per share (cents) 7 414,9 361,0
Income statement

Telkom Group Annual Report 2002 67
at 31 March 2002
ZAR million Notes 2002 2001
AssetsNon-current assets 43 689 39 832
Property, plant and equipment 8 41 104 37 696Intangible assets 9 602 360Investments 10 1 130 806Deferred taxation 11 853 970
Current assets 11 325 12 716
Inventories 12 624 861Trade and other receivables 13 5 758 5 840Income tax receivable 14 1 400 1 294Other financial assets 15 2 819 2 920Cash and cash equivalents 16 724 1 801
Total assets 55 014 52 548
Equity and liabilitiesCapital and reserves 17 398 14 797
Share capital and premium 17 8 293 8 293Share issue expenses (44) –Non-distributable reserves 18 138 –Distributable reserves 19 9 011 6 504
Minority interests 336 118Non-current liabilities 26 849 27 899
Interest-bearing debt 20 23 818 24 960Deferred taxation 11 430 95Provisions 21 2 601 2 844
Current liabilities 10 431 9 734
Trade and other payables 22 7 538 6 193Deferred income 680 868Income tax payable 189 499Provisions 21 1 236 1 240Credit facilities 16 788 934
Total equity and liabilities 55 014 52 548
Balance sheet
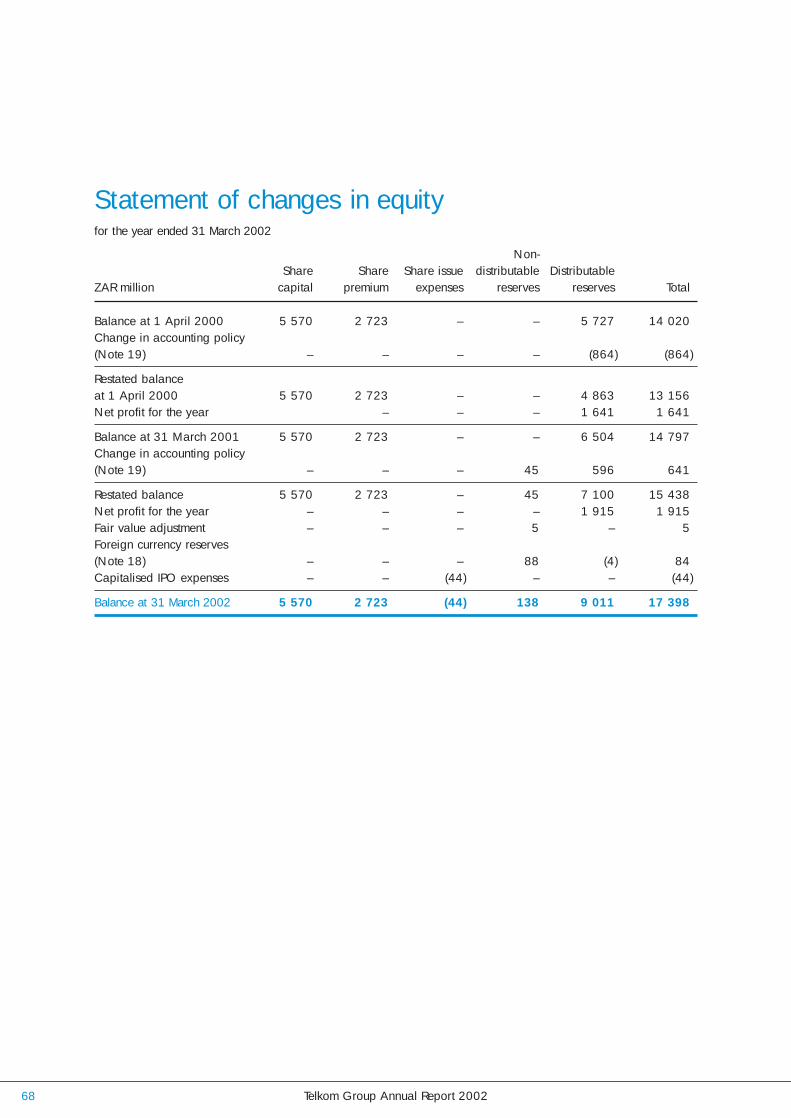
Telkom Group Annual Report 200268
for the year ended 31 March 2002
Non-Share Share Share issue distributable Distributable
ZAR million capital premium expenses reserves reserves Total
Balance at 1 April 2000 5 570 2 723 – – 5 727 14 020Change in accounting policy (Note 19) – – – – (864) (864)
Restated balance at 1 April 2000 5 570 2 723 – – 4 863 13 156Net profit for the year – – – 1 641 1 641
Balance at 31 March 2001 5 570 2 723 – – 6 504 14 797Change in accounting policy (Note 19) – – – 45 596 641
Restated balance 5 570 2 723 – 45 7 100 15 438Net profit for the year – – – – 1 915 1 915Fair value adjustment – – – 5 – 5Foreign currency reserves (Note 18) – – – 88 (4) 84Capitalised IPO expenses – – (44) – – (44)
Balance at 31 March 2002 5 570 2 723 (44) 138 9 011 17 398
Statement of changes in equity

Telkom Group Annual Report 2002 69
for the year ended 31 March 2002
ZAR million Notes 2002 2001
Operating activities 8 736 7 976
Cash receipts from customers 33 468 30 759Cash paid to suppliers and employees (22 165) (21 011)
Cash generated from operations 27 11 303 9 748Income from investments 477 617Finance charges paid 28 (2 133) (2 066)Taxation paid 29 (911) (323)
Investing activities (9 376) (9 835)
Proceeds on disposal of property, plant and equipment 60 138Proceeds on disposal of subsidiaries and joint ventures 30 12 –Additions to property, plant and equipment (8 763) (9 732)Intangible assets acquired (189) (1)Proceeds on disposal of other investments – 11Additions to other investments (269) (260)Purchase of minority shareholders’ interests (183) –Repayment of loan from joint ventures – 66Investment in joint ventures – (57)Capitalised IPO expenses (44) –
Financing activities (291) 1 498
Loans raised 14 580 9 787Loans repaid (15 736) (7 666)Decrease/(increase) in interest-bearing investments 865 (623)
Net decrease in cash and cash equivalents (931) (361)Cash and cash equivalents at beginning of the year 867 1 228
Cash and cash equivalents at end of the year 16 (64) 867
Cash flow statement

Telkom Group Annual Report 200270
for the year ended 31 March 2002
ZAR million 2002 2001
1.Revenue 34 550 32 074
Operating revenue 33 970 31 457
Wireline 27 331 26 163Wireless 6 639 5 294
Investment income (Note 4) 580 617
2.Operating expenses 23 477 21 595
Included in operating expenses are:
Auditors’ remuneration 26 27
Audit fees 15 13Other 11 14
Consultancy services (Note 32) 382 275
Employee costs 7 170 6 625
Salaries, wages and benefits 5 982 5 661Pension and retirement fund 81 128
Interest cost 119 128Curtailment gain (38) –
Pension and retirement contribution 505 468Post-retirement medical aid 228 (27)
Current service cost 14 50Interest cost 224 348Actuarial gain (5) (16)Settlement loss/(gain) 11 (86)Curtailment gain (16) (323)
Medical aid contribution 379 383
Sick leave and telephone rebates (5) 12
Current service (gain)/cost (15) 3Interest cost 10 9
Foreign exchange losses 1 112 93
Fair value adjustments on derivative instruments (1 729) –
Notes to the financial statements
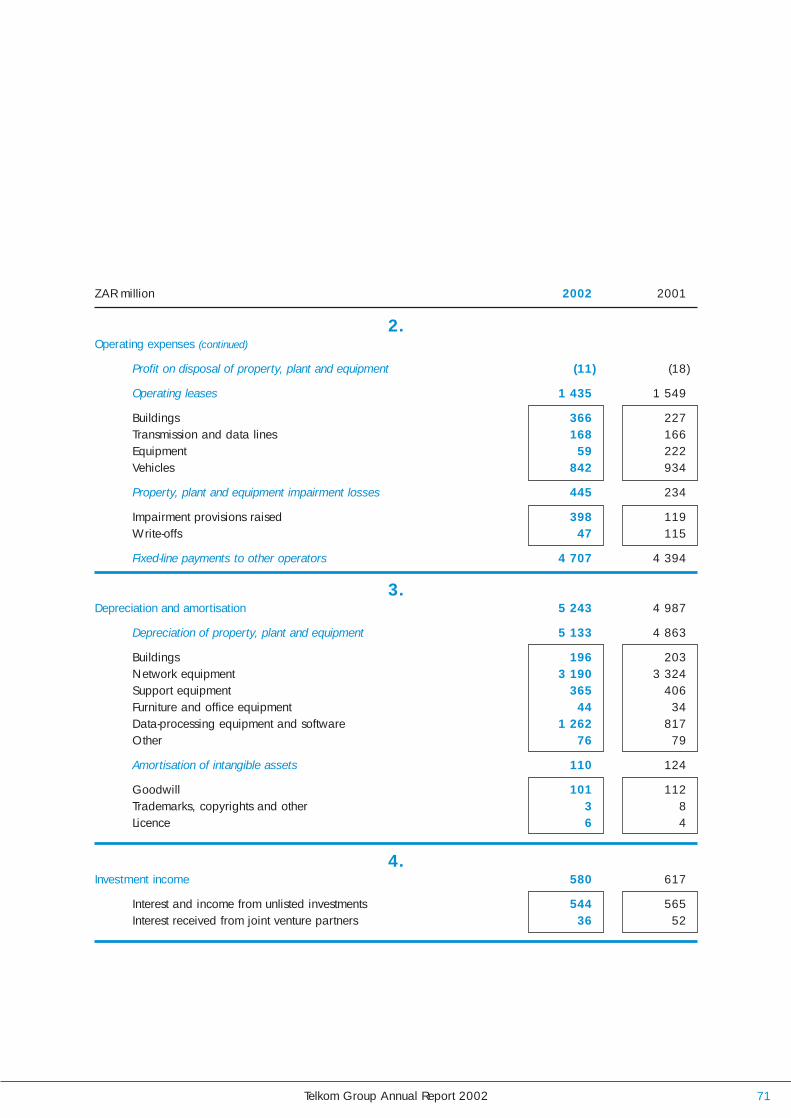
Telkom Group Annual Report 2002 71
ZAR million 2002 2001
2.Operating expenses (continued)
Profit on disposal of property, plant and equipment (11) (18)
Operating leases 1 435 1 549
Buildings 366 227Transmission and data lines 168 166Equipment 59 222Vehicles 842 934
Property, plant and equipment impairment losses 445 234
Impairment provisions raised 398 119Write-offs 47 115
Fixed-line payments to other operators 4 707 4 394
3.Depreciation and amortisation 5 243 4 987
Depreciation of property, plant and equipment 5 133 4 863
Buildings 196 203Network equipment 3 190 3 324Support equipment 365 406Furniture and office equipment 44 34Data-processing equipment and software 1 262 817Other 76 79
Amortisation of intangible assets 110 124
Goodwill 101 112Trademarks, copyrights and other 3 8Licence 6 4
4.Investment income 580 617
Interest and income from unlisted investments 544 565Interest received from joint venture partners 36 52
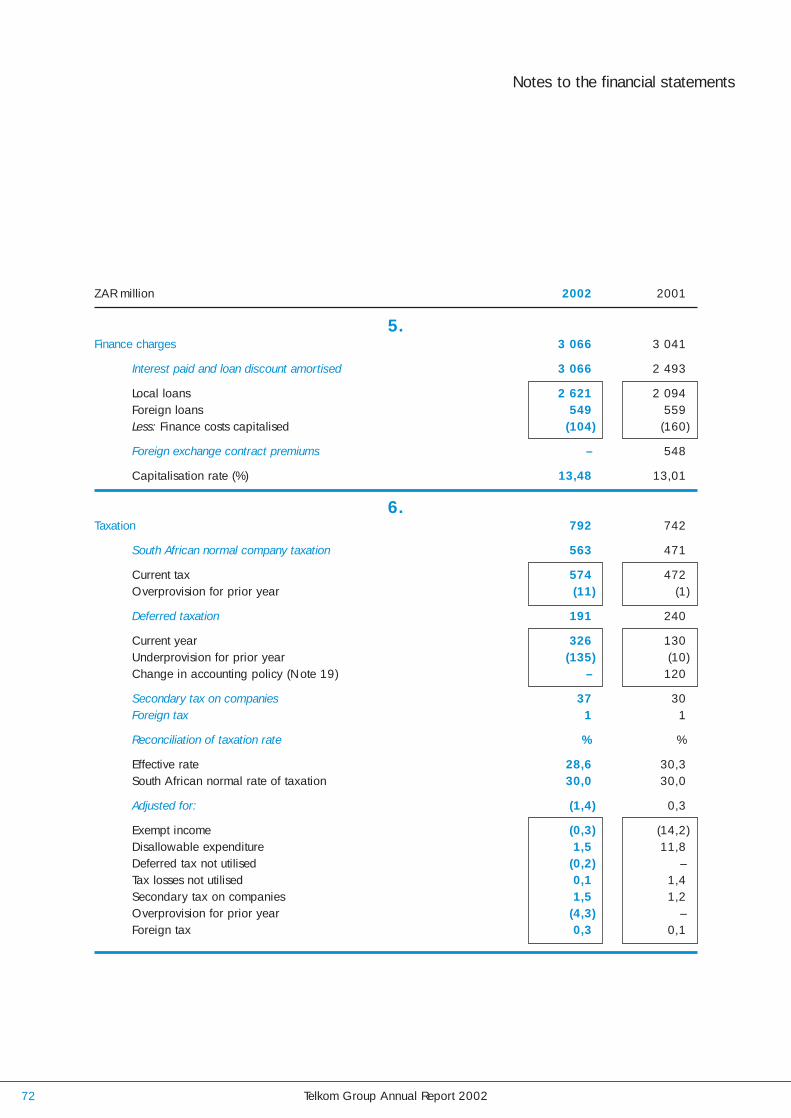
Telkom Group Annual Report 200272
ZAR million 2002 2001
5.Finance charges 3 066 3 041
Interest paid and loan discount amortised 3 066 2 493
Local loans 2 621 2 094Foreign loans 549 559Less: Finance costs capitalised (104) (160)
Foreign exchange contract premiums – 548
Capitalisation rate (%) 13,48 13,01
6.Taxation 792 742
South African normal company taxation 563 471
Current tax 574 472Overprovision for prior year (11) (1)
Deferred taxation 191 240
Current year 326 130Underprovision for prior year (135) (10)Change in accounting policy (Note 19) – 120
Secondary tax on companies 37 30Foreign tax 1 1
Reconciliation of taxation rate % %
Effective rate 28,6 30,3South African normal rate of taxation 30,0 30,0
Adjusted for: (1,4) 0,3
Exempt income (0,3) (14,2)Disallowable expenditure 1,5 11,8Deferred tax not utilised (0,2) –Tax losses not utilised 0,1 1,4Secondary tax on companies 1,5 1,2Overprovision for prior year (4,3) –Foreign tax 0,3 0,1
Notes to the financial statements

Telkom Group Annual Report 2002 73
ZAR million 2002 2001
7.Earnings per share
The calculation of earnings per share is based on earnings of R1 915 million (2001: R1 641 million) and ordinary shares issued of 557 031 819(2001: 557 031 819)
The calculation of headline earnings per share is based on headline earnings of R2 311 million(2001: R2 011 million) and 557 031 819 (2001: 557 031 819) ordinary shares issued.
Reconciliation between earnings and headline earnings:
Earnings as reported 1 915 1 641Adjustments:
Profit on disposal of property, plant and equipment (11) (18)Property, plant and equipment impairment losses 445 234Investment impairment losses – 107Goodwill amortisation 101 112Tax and outside shareholder effects (139) (65)
Headline earnings 2 311 2 011
Earnings per share (cents) 343,8 294,6Headline earnings per share (cents) 414,9 361,0

Telkom Group Annual Report 200274
8.Property, plant and equipment
2002 2001Accumulated Carrying Accumulated Carrying
Cost depreciation value Cost depreciation value
Land and buildings 3 926 846 3 080 3 454 652 2 802Network equipment 49 923 20 066 29 857 46 059 19 240 26 819Support equipment 3 090 1 634 1 456 2 874 1 432 1 442Furniture and office equipment 392 167 225 333 125 208Data processingequipment and software 7 218 3 677 3 541 6 513 2 867 3 646
Under construction 2 700 – 2 700 2 527 – 2 527Other 496 251 245 556 304 252
67 745 26 641 41 104 62 316 24 620 37 696
The carrying amounts of property, plant and equipment can be reconciled as follows:Foreign
Carrying currency Carryingvalue at Business trans- value
beginning combi- lation Impair- Dis- Depre- at end of year Additions nations reserve ment posals ciation of year
2002Land and buildings 2 802 475 – – – (1) (196) 3 080Network equipment 26 819 6 200 – 65 (12) (25) (3 190) 29 857Support equipment 1 442 379 – – – – (365) 1 456Furniture and office equipment 208 67 (2) – – (4) (44) 225Data processing equipment and software 3 646 1 391 (6) – (219) (9) (1 262) 3 541
Under construction 2 527 387 – – (214) – – 2 700Other 252 106 (28) 1 – (10) (76) 245
37 696 9 005 (36) 66 (445) (49) (5 133) 41 104
Notes to the financial statements
ZAR million
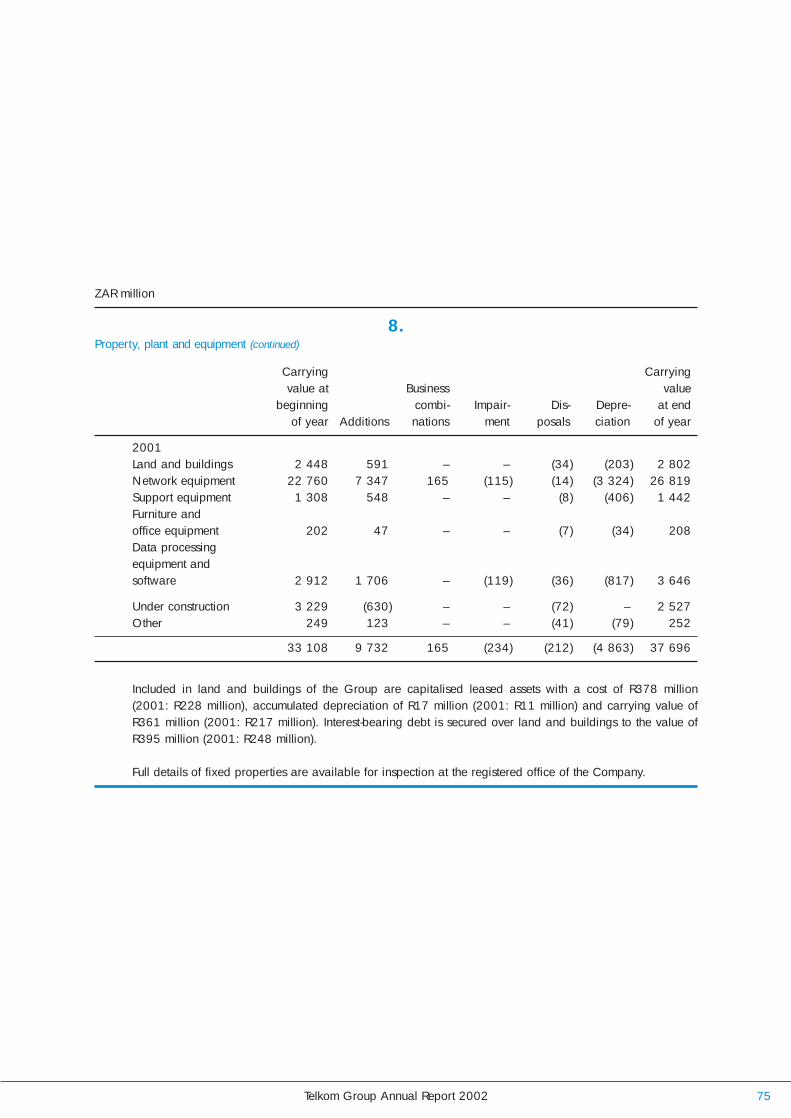
Telkom Group Annual Report 2002 75
8.Property, plant and equipment (continued)
Carrying Carryingvalue at Business value
beginning combi- Impair- Dis- Depre- at end of year Additions nations ment posals ciation of year
2001Land and buildings 2 448 591 – – (34) (203) 2 802Network equipment 22 760 7 347 165 (115) (14) (3 324) 26 819Support equipment 1 308 548 – – (8) (406) 1 442Furniture and office equipment 202 47 – – (7) (34) 208Data processing equipment and software 2 912 1 706 – (119) (36) (817) 3 646
Under construction 3 229 (630) – – (72) – 2 527Other 249 123 – – (41) (79) 252
33 108 9 732 165 (234) (212) (4 863) 37 696
Included in land and buildings of the Group are capitalised leased assets with a cost of R378 million(2001: R228 million), accumulated depreciation of R17 million (2001: R11 million) and carrying value ofR361 million (2001: R217 million). Interest-bearing debt is secured over land and buildings to the value ofR395 million (2001: R248 million).
Full details of fixed properties are available for inspection at the registered office of the Company.
ZAR million

Telkom Group Annual Report 200276
ZAR million
9.Intangible assets
2002 2001Accumulated Carrying Accumulated Carrying
Cost amortisation value Cost amortisation value
Goodwill 709 257 452 472 163 309Trademarks, copyrights and other 30 15 15 30 12 18Licences 165 30 135 55 22 33
904 302 602 557 197 360
The carrying amounts of intangible assets can be reconciled as follows:Carrying Foreign Carryingvalue at Business currency value
beginning combi- translation Amort- at endof year Additions nations reserve isation of year
2002Goodwill 309 96 134 14 (101) 452Trademarks, copyrights and other 18 – – – (3) 15Licences 33 93 – 15 (6) 135
360 189 134 29 (110) 602
Carrying Carryingvalue at Business value
beginning combi- Amort- at endof year Additions nations isation of year
2001Goodwill 312 – 109 (112) 309Trademarks, copyrights and other 26 – – (8) 18Licences 34 1 2 (4) 33
372 1 111 (124) 360
Notes to the financial statements
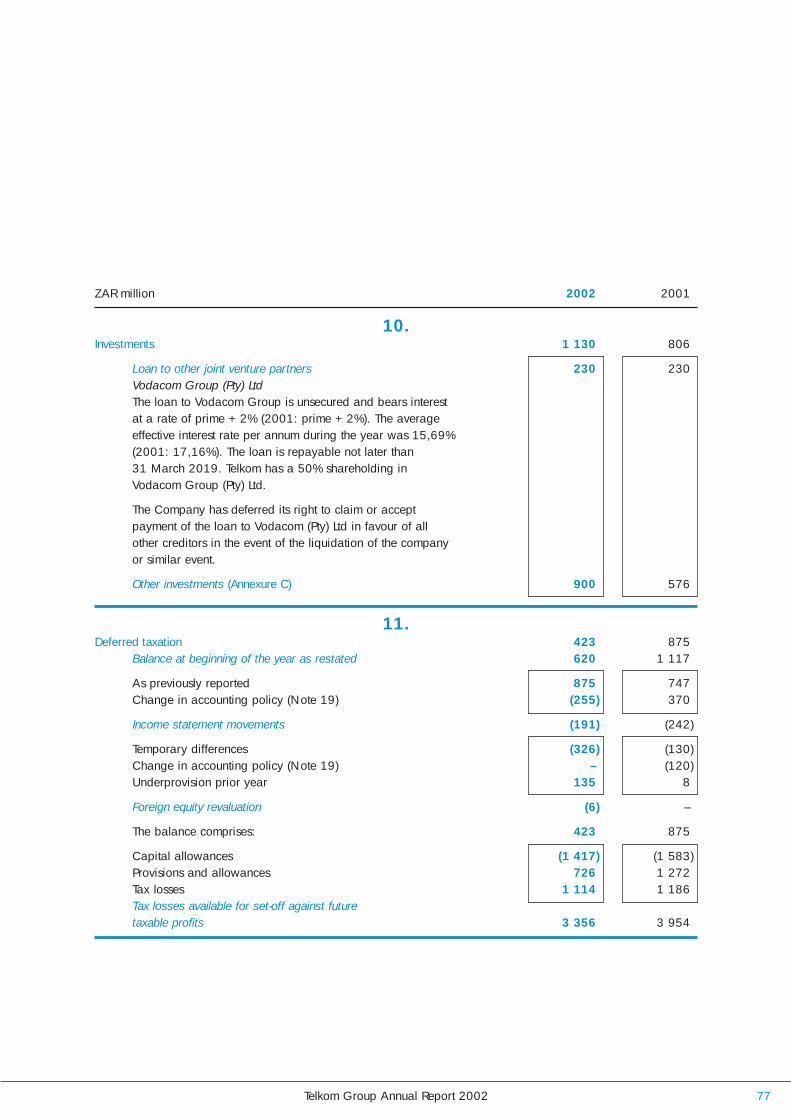
Telkom Group Annual Report 2002 77
ZAR million 2002 2001
10.Investments 1 130 806
Loan to other joint venture partners 230 230Vodacom Group (Pty) LtdThe loan to Vodacom Group is unsecured and bears interest at a rate of prime + 2% (2001: prime + 2%). The average effective interest rate per annum during the year was 15,69% (2001: 17,16%). The loan is repayable not later than 31 March 2019. Telkom has a 50% shareholding in Vodacom Group (Pty) Ltd.
The Company has deferred its right to claim or accept payment of the loan to Vodacom (Pty) Ltd in favour of all other creditors in the event of the liquidation of the company or similar event.
Other investments (Annexure C) 900 576
11.Deferred taxation 423 875
Balance at beginning of the year as restated 620 1 117
As previously reported 875 747Change in accounting policy (Note 19) (255) 370
Income statement movements (191) (242)
Temporary differences (326) (130)Change in accounting policy (Note 19) – (120)Underprovision prior year 135 8
Foreign equity revaluation (6) –
The balance comprises: 423 875
Capital allowances (1 417) (1 583)Provisions and allowances 726 1 272Tax losses 1 114 1 186Tax losses available for set-off against future taxable profits 3 356 3 954
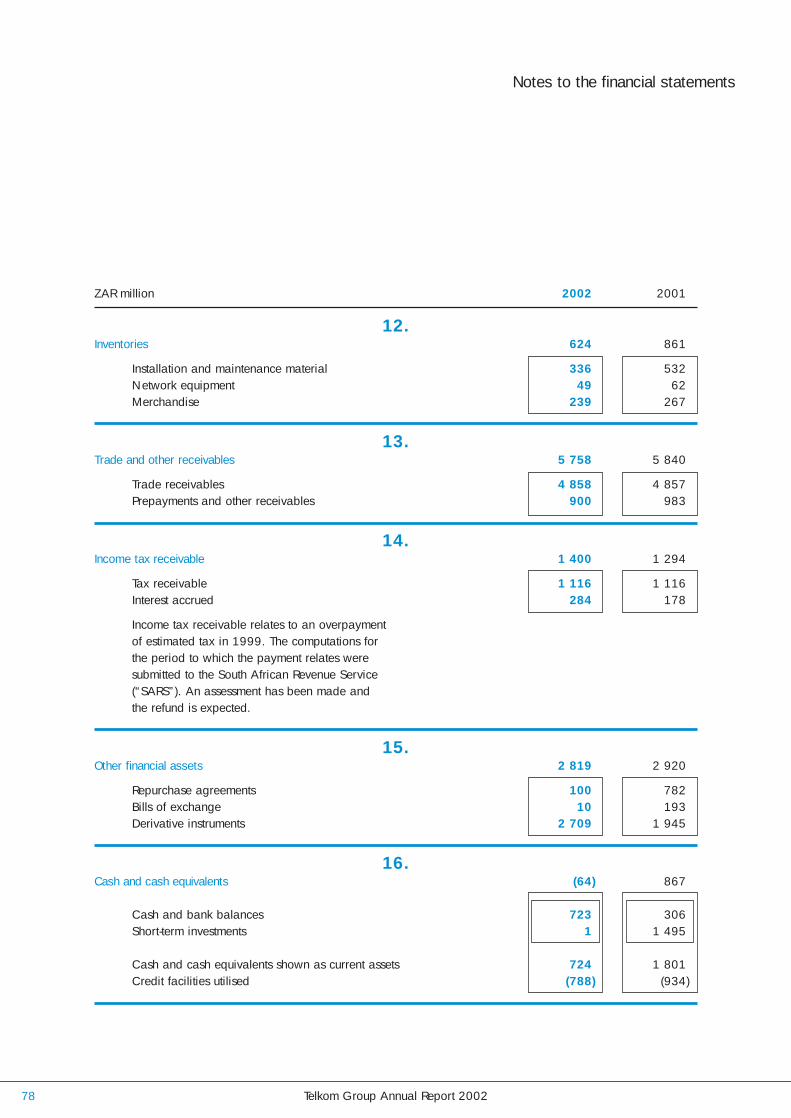
Telkom Group Annual Report 200278
ZAR million 2002 2001
12.Inventories 624 861
Installation and maintenance material 336 532Network equipment 49 62Merchandise 239 267
13.Trade and other receivables 5 758 5 840
Trade receivables 4 858 4 857Prepayments and other receivables 900 983
14.Income tax receivable 1 400 1 294
Tax receivable 1 116 1 116Interest accrued 284 178
Income tax receivable relates to an overpayment of estimated tax in 1999. The computations for the period to which the payment relates were submitted to the South African Revenue Service (“SARS”). An assessment has been made and the refund is expected.
15.Other financial assets 2 819 2 920
Repurchase agreements 100 782Bills of exchange 10 193Derivative instruments 2 709 1 945
16.Cash and cash equivalents (64) 867
Cash and bank balances 723 306Short-term investments 1 1 495
Cash and cash equivalents shown as current assets 724 1 801Credit facilities utilised (788) (934)
Notes to the financial statements
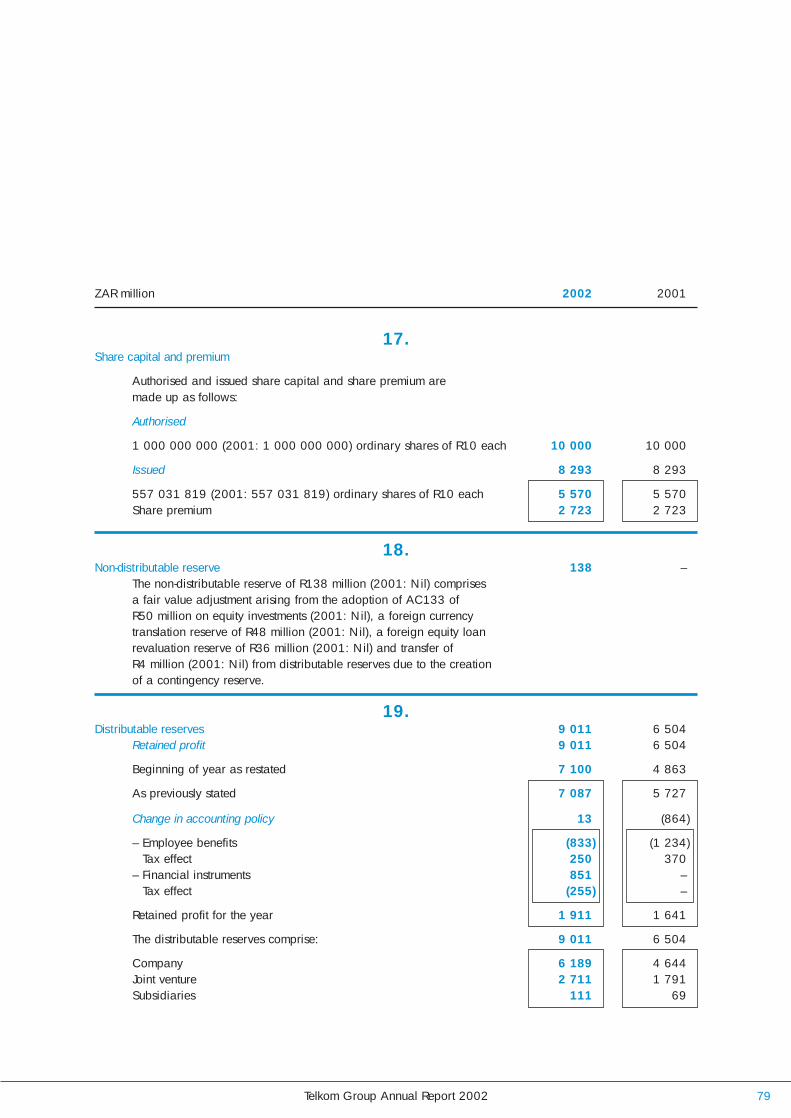
Telkom Group Annual Report 2002 79
ZAR million 2002 2001
17.Share capital and premium
Authorised and issued share capital and share premium are made up as follows:
Authorised
1 000 000 000 (2001: 1 000 000 000) ordinary shares of R10 each 10 000 10 000
Issued 8 293 8 293
557 031 819 (2001: 557 031 819) ordinary shares of R10 each 5 570 5 570Share premium 2 723 2 723
18.Non-distributable reserve 138 –
The non-distributable reserve of R138 million (2001: Nil) comprises a fair value adjustment arising from the adoption of AC133 of R50 million on equity investments (2001: Nil), a foreign currency translation reserve of R48 million (2001: Nil), a foreign equity loan revaluation reserve of R36 million (2001: Nil) and transfer of R4 million (2001: Nil) from distributable reserves due to the creation of a contingency reserve.
19.Distributable reserves 9 011 6 504
Retained profit 9 011 6 504
Beginning of year as restated 7 100 4 863
As previously stated 7 087 5 727
Change in accounting policy 13 (864)
– Employee benefits (833) (1 234)Tax effect 250 370
– Financial instruments 851 –Tax effect (255) –
Retained profit for the year 1 911 1 641
The distributable reserves comprise: 9 011 6 504
Company 6 189 4 644Joint venture 2 711 1 791Subsidiaries 111 69

Telkom Group Annual Report 200280
ZAR million 2002 2001
19.Distributable reserves (continued)
Changes in accounting policy
Employee benefitsDuring the year the Group adopted AC116, Employee Benefits. Accordingly distributable reserves and comparative amounts of the prior year have been adjusted.
(Decrease)/increase in net profit for the yearGross (217) 401Taxation 65 (120)
Net (152) 281
Decrease in retained earningsGross (833) (1 234)Taxation 250 370
Net (583) (864)
Financial instrumentsOn 1 April 2001 the Group early adopted AC133, Financial Instruments: Recognition and Measurement. In accordance with AC133, adjustments have been made to reserves on the date of adoption, while comparative amounts have not been restated.
Increase in net profitGross 468Taxation (140)
Net 328
Increase in retained earningsGross 851Taxation (255)
Net 596
Notes to the financial statements

Telkom Group Annual Report 2002 81
ZAR million 2002 2001
20.Interest-bearing debt
Interest-bearing debt (Annexure A) 23 818 24 960
Gross interest-bearing debt 28 320 29 988Discount on debt instruments issued (4 502) (5 028)
Interest-bearing debt consists of:
Long-term debt 22 280 19 469
Locally registered debt instruments 14 947 11 292
Nominal value 18 874 15 509Discount (3 927) (4 217)
Foreign debt 5 495 6 259
Debt 5 495 6 218Accrued forward-cover costs – 41
Loan from other joint venture partners 230 230
Commercial paper bills 1 218 1 118
Nominal value 1 766 1 826Discount (548) (708)
Finance lease agreements 390 248
Other debt – 322
Revolving debt 1 538 5 491
Locally registered debt instruments at nominal value 200 –
Foreign debt 39 3 300
Debt 39 2 896Accrued forward-cover costs – 404
Commercial paper bills 1 278 1 770
Nominal value 1 305 1 874Discount (27) (104)
Other debt 21 421
The above debt is of a revolving nature and is therefore not disclosed as current liabilities.
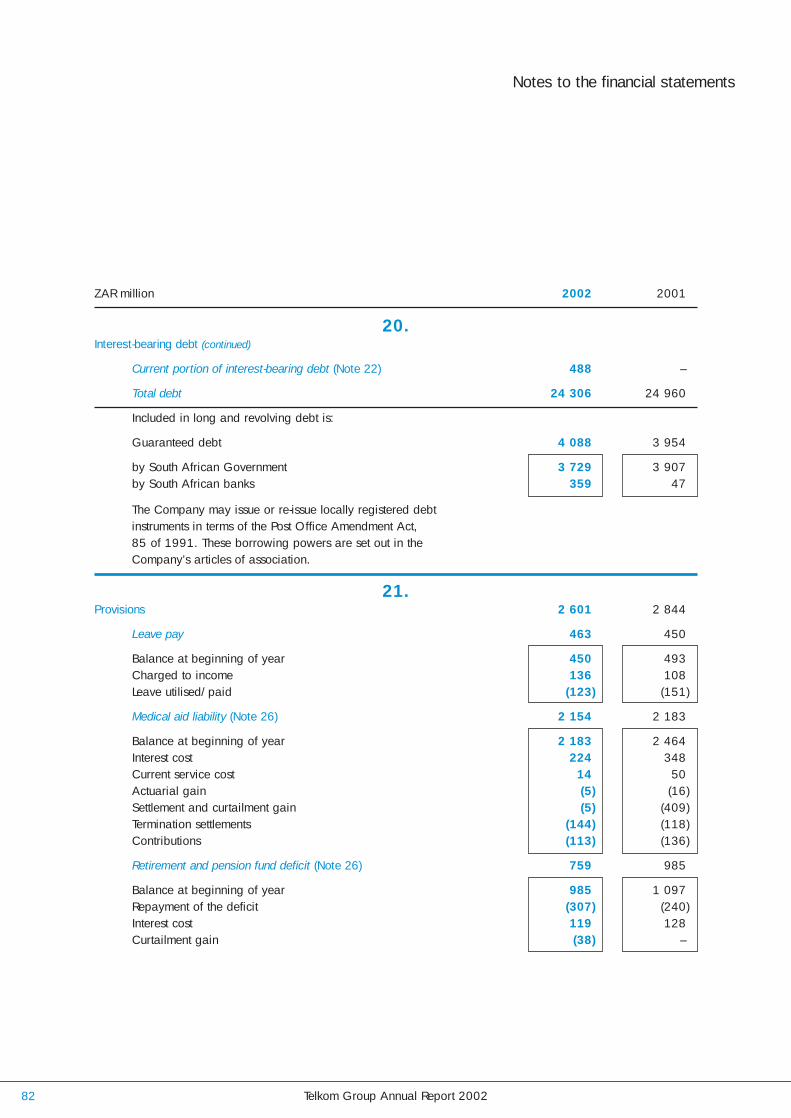
Telkom Group Annual Report 200282
ZAR million 2002 2001
20.Interest-bearing debt (continued)
Current portion of interest-bearing debt (Note 22) 488 –
Total debt 24 306 24 960
Included in long and revolving debt is:
Guaranteed debt 4 088 3 954
by South African Government 3 729 3 907by South African banks 359 47
The Company may issue or re-issue locally registered debt instruments in terms of the Post Office Amendment Act, 85 of 1991. These borrowing powers are set out in the Company’s articles of association.
21.Provisions 2 601 2 844
Leave pay 463 450
Balance at beginning of year 450 493Charged to income 136 108Leave utilised/paid (123) (151)
Medical aid liability (Note 26) 2 154 2 183
Balance at beginning of year 2 183 2 464Interest cost 224 348Current service cost 14 50Actuarial gain (5) (16)Settlement and curtailment gain (5) (409)Termination settlements (144) (118)Contributions (113) (136)
Retirement and pension fund deficit (Note 26) 759 985
Balance at beginning of year 985 1 097Repayment of the deficit (307) (240)Interest cost 119 128Curtailment gain (38) –
Notes to the financial statements

Telkom Group Annual Report 2002 83
ZAR million 2002 2001
21.Provisions (continued)
Sick leave 315 332
Balance at beginning of year 332 330Net charge to income (17) 2
Telephone rebates 146 134
Balance at beginning of year 134 124Interest cost 10 9Current service cost 2 1
Short-term portion (1 236) (1 240)
Leave pay (463) (450)Medical benefits (200) (200)Retirement and pension fund deficit (258) (258)Sick leave (315) (332)
Leave pay benefitsIn terms of the Group’s policy, employees are entitled to accumulate vested leave benefits not taken within a leave cycle. This is reviewed annually and is in accordance with legislation.
Sick leaveSick leave provision is determined in accordance with the Group’s policy. This takes into account the possibility of production loss for the Group, due to the inability of an employee to render services for an extended period due to illness.
22.Trade and other payables 7 538 6 193
Trade payables 4 884 3 375Finance cost accrued 1 126 578Deferred exchange gains – 894Current portion of interest-bearing debt 488 –Other 1 040 1 346
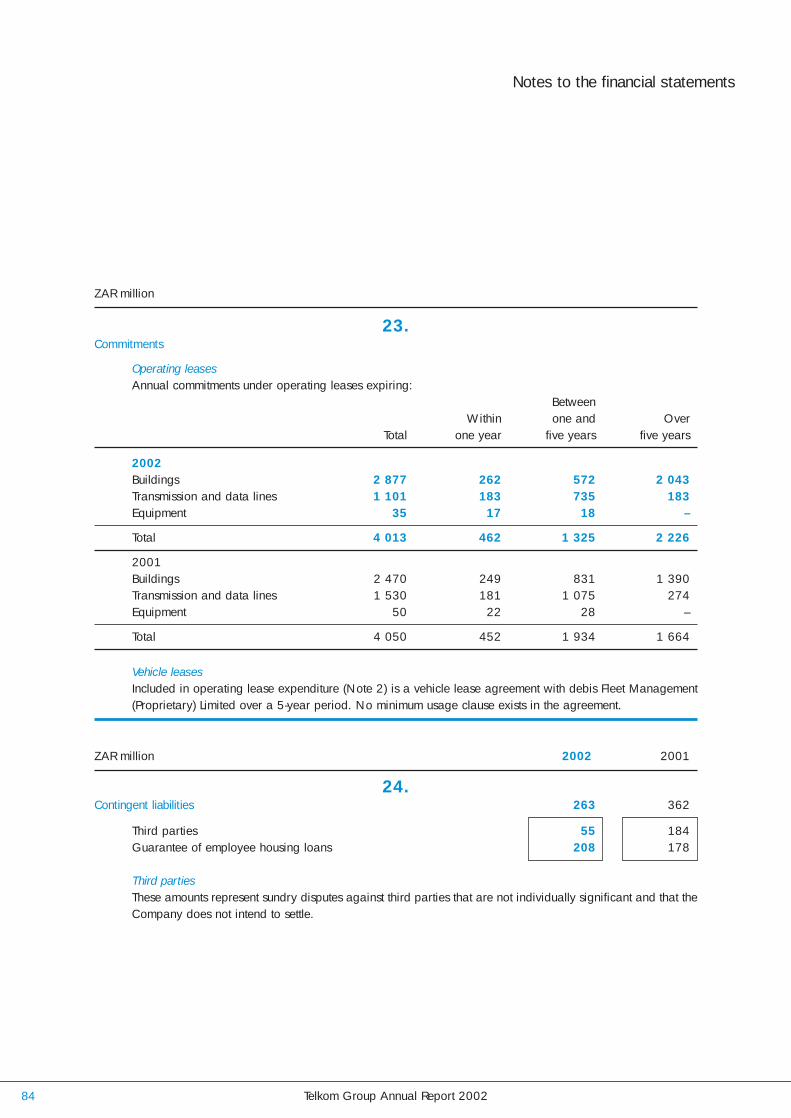
Telkom Group Annual Report 200284
ZAR million
23.Commitments
Operating leases Annual commitments under operating leases expiring:
BetweenWithin one and Over
Total one year five years five years
2002Buildings 2 877 262 572 2 043Transmission and data lines 1 101 183 735 183Equipment 35 17 18 –
Total 4 013 462 1 325 2 226
2001Buildings 2 470 249 831 1 390Transmission and data lines 1 530 181 1 075 274Equipment 50 22 28 –
Total 4 050 452 1 934 1 664
Vehicle leasesIncluded in operating lease expenditure (Note 2) is a vehicle lease agreement with debis Fleet Management(Proprietary) Limited over a 5-year period. No minimum usage clause exists in the agreement.
24.Contingent liabilities 263 362
Third parties 55 184Guarantee of employee housing loans 208 178
Third partiesThese amounts represent sundry disputes against third parties that are not individually significant and that theCompany does not intend to settle.
Notes to the financial statements
ZAR million 2002 2001

Telkom Group Annual Report 2002 85
24.Contingent liabilities (continued)
Guarantee of employee housing loansTelkom guarantees to settle a certain portion of employees’ housing loans. The amount guaranteed differsdepending on factors such as employment period and salary rates. When an employee leaves theemployment of the Group, any housing debt guaranteed by Telkom is settled before any payment can bemade to the employee.
Supplier disputeThere is a dispute for services rendered from a supplier that has not been recognised as it is not probable thatan outflow of resources will occur. The dispute is currently in the process of litigation and amounts toapproximately R1,5 billion. All legal costs related to this matter have been provided for. The Company haslodged a counterclaim of approximately R5,7 billion.
25.Financial instruments and financial risk management
Exposure to continuously changing market conditions has highlighted the importance of financial riskmanagement as an element of control for the Group. Treasury policies, risk limits and control procedures arecontinuously monitored by the Board of Directors.
The Group holds or issues financial instruments to finance its operations, for the temporary investment of short-term funds and to manage currency and interest rate risks. In addition, financial instruments like tradereceivables and payables arise directly from the Group’s operations.
The Group finances its operations primarily by a mixture of issued share capital, retained profit, and long-term and short-term loans. The Group uses derivative financial instruments to manage its exposure to marketrisks from changes in interest and foreign exchange rates. The Group does not speculate in derivativeinstruments.
Interest rate risk managementInterest rate risk arises from the repricing of the Group’s forward cover and floating rate debt as well as newborrowings and refinancing.
The Group’s policy is to manage interest cost through the utilisation of a mix of fixed and variable rate debt.In order to manage this mix in a cost-efficient manner, the Group makes use of interest rate derivativesas approved in terms of Group policy. Fixed rate debt represents approximately 92% (2001: 72%) of thetotal consolidated debt, after taking the instruments listed below into consideration. The debt profile of mainlyfixed rate debt has been maintained to limit the Group’s exposure to interest rate increases given the size ofthe Group’s debt portfolio. All financial instruments that reprice within one year are deemed to be floatingrate debt.
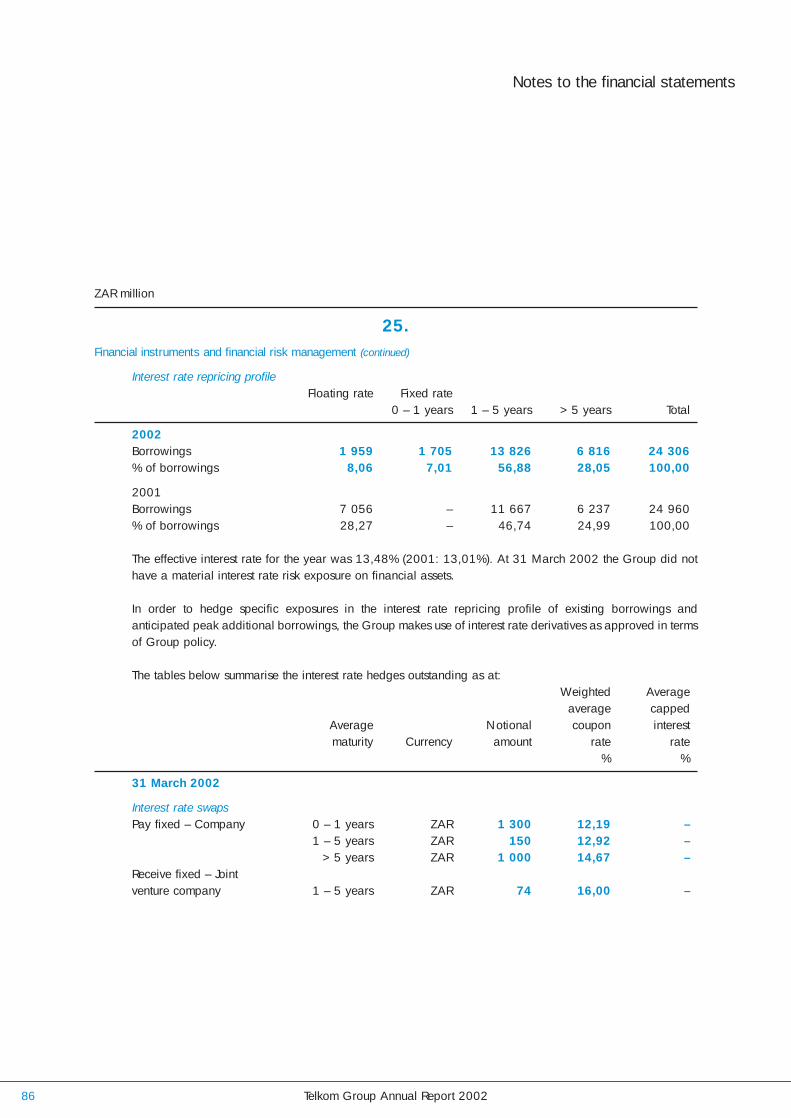
Telkom Group Annual Report 200286
25.Financial instruments and financial risk management (continued)
Interest rate repricing profileFloating rate Fixed rate
0 – 1 years 1 – 5 years > 5 years Total
2002Borrowings 1 959 1 705 13 826 6 816 24 306% of borrowings 8,06 7,01 56,88 28,05 100,00
2001Borrowings 7 056 – 11 667 6 237 24 960% of borrowings 28,27 – 46,74 24,99 100,00
The effective interest rate for the year was 13,48% (2001: 13,01%). At 31 March 2002 the Group did not have a material interest rate risk exposure on financial assets.
In order to hedge specific exposures in the interest rate repricing profile of existing borrowings andanticipated peak additional borrowings, the Group makes use of interest rate derivatives as approved in termsof Group policy.
The tables below summarise the interest rate hedges outstanding as at:Weighted Average
average cappedAverage Notional coupon interestmaturity Currency amount rate rate
% %
31 March 2002
Interest rate swapsPay fixed – Company 0 – 1 years ZAR 1 300 12,19 –
1 – 5 years ZAR 150 12,92 –> 5 years ZAR 1 000 14,67 –
Receive fixed – Joint venture company 1 – 5 years ZAR 74 16,00 –
Notes to the financial statements
ZAR million
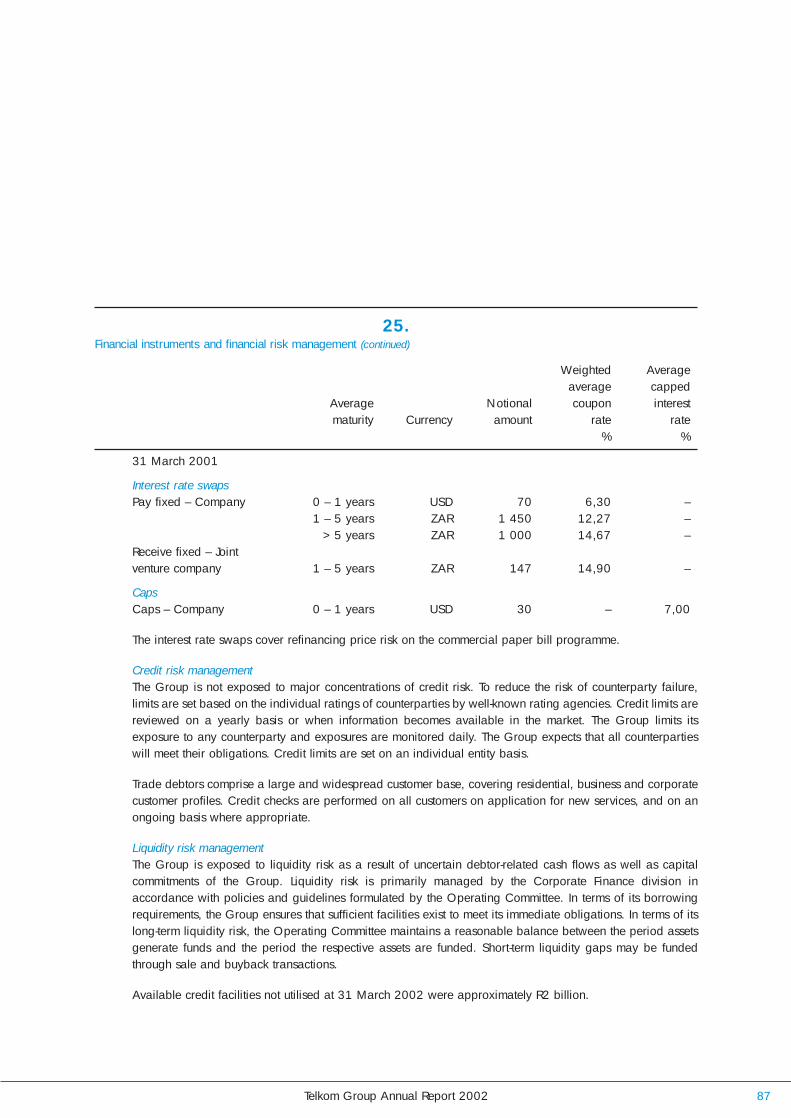
Telkom Group Annual Report 2002 87
25.Financial instruments and financial risk management (continued)
Weighted Averageaverage capped
Average Notional coupon interestmaturity Currency amount rate rate
% %
31 March 2001
Interest rate swapsPay fixed – Company 0 – 1 years USD 70 6,30 –
1 – 5 years ZAR 1 450 12,27 –> 5 years ZAR 1 000 14,67 –
Receive fixed – Joint venture company 1 – 5 years ZAR 147 14,90 –
CapsCaps – Company 0 – 1 years USD 30 – 7,00
The interest rate swaps cover refinancing price risk on the commercial paper bill programme.
Credit risk managementThe Group is not exposed to major concentrations of credit risk. To reduce the risk of counterparty failure,limits are set based on the individual ratings of counterparties by well-known rating agencies. Credit limits arereviewed on a yearly basis or when information becomes available in the market. The Group limits itsexposure to any counterparty and exposures are monitored daily. The Group expects that all counterpartieswill meet their obligations. Credit limits are set on an individual entity basis.
Trade debtors comprise a large and widespread customer base, covering residential, business and corporatecustomer profiles. Credit checks are performed on all customers on application for new services, and on anongoing basis where appropriate.
Liquidity risk managementThe Group is exposed to liquidity risk as a result of uncertain debtor-related cash flows as well as capitalcommitments of the Group. Liquidity risk is primarily managed by the Corporate Finance division inaccordance with policies and guidelines formulated by the Operating Committee. In terms of its borrowingrequirements, the Group ensures that sufficient facilities exist to meet its immediate obligations. In terms of itslong-term liquidity risk, the Operating Committee maintains a reasonable balance between the period assetsgenerate funds and the period the respective assets are funded. Short-term liquidity gaps may be fundedthrough sale and buyback transactions.
Available credit facilities not utilised at 31 March 2002 were approximately R2 billion.

Telkom Group Annual Report 200288
25.Financial instruments and financial risk management (continued)
Foreign currency exchange rate risk managementThe Group manages its foreign currency exchange rate risk by hedging all identifiable exposures via variousfinancial instruments suitable to the Group’s risk exposure.
Cross-currency swaps and forward exchange contracts have been entered into to reduce the foreign currencyexposure on the Group’s operations and liabilities. The Group also enters into forward foreign exchangecontracts to hedge interest expense and purchase and sale commitments denominated in foreign currencies(principally US Dollar and Euro). The purpose of the Group’s foreign currency hedging activities is to protectthe Group from the risk that the eventual net flows will be adversely affected by changes in exchange rates.
Foreign currency debt is translated at the year-end exchange rates:
Liabilities
Fixed rate Floating Interest-free TotalCurrency ZARm ZARm ZARm ZARm
2002ZAR 18 349 782 11 895 31 026USD – 42 351 393EUR 3 998 1 135 675 5 808Other – – 53 53
22 347 1 959 12 974 37 280
Fixed rate Floating Interest-free TotalCurrency ZARm ZARm ZARm ZARm
2001ZAR 14 711 1 064 11 862 27 637USD 16 5 351 379 5 746EUR 3 177 557 411 4 145Other – 84 21 105
17 904 7 056 12 673 37 633
AssetsThere is no material foreign currency exposure for assets.
Forward exchange contractsThe following contracts relate to specific items on the balance sheet or foreign commitments not yet due.Foreign commitments not yet due consist of capital expenditure ordered but not yet received and future interestpayments and loans denominated in foreign currency.
Notes to the financial statements
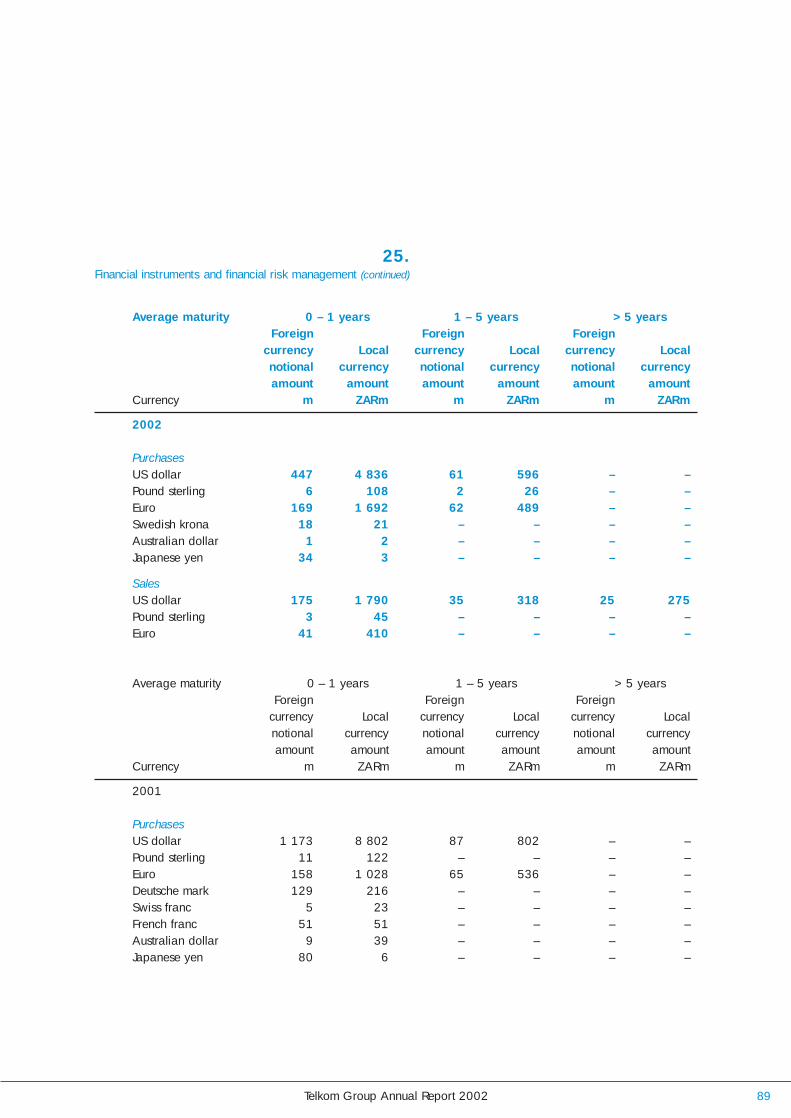
Telkom Group Annual Report 2002 89
25.Financial instruments and financial risk management (continued)
Average maturity 0 – 1 years 1 – 5 years > 5 yearsForeign Foreign Foreign
currency Local currency Local currency Localnotional currency notional currency notional currencyamount amount amount amount amount amount
Currency m ZARm m ZARm m ZARm
2002
Purchases US dollar 447 4 836 61 596 – –Pound sterling 6 108 2 26 – –Euro 169 1 692 62 489 – –Swedish krona 18 21 – – – –Australian dollar 1 2 – – – –Japanese yen 34 3 – – – –
SalesUS dollar 175 1 790 35 318 25 275Pound sterling 3 45 – – – –Euro 41 410 – – – –
Average maturity 0 – 1 years 1 – 5 years > 5 yearsForeign Foreign Foreign
currency Local currency Local currency Localnotional currency notional currency notional currencyamount amount amount amount amount amount
Currency m ZARm m ZARm m ZARm
2001
PurchasesUS dollar 1 173 8 802 87 802 – –Pound sterling 11 122 – – – –Euro 158 1 028 65 536 – –Deutsche mark 129 216 – – – –Swiss franc 5 23 – – – –French franc 51 51 – – – –Australian dollar 9 39 – – – –Japanese yen 80 6 – – – –

Telkom Group Annual Report 200290
25.Financial instruments and financial risk management (continued)
Average maturity 0 – 1 years 1 – 5 years > 5 yearsForeign Foreign Foreign
currency Local currency Local currency Localnotional currency notional currency notional currencyamount amount amount amount amount amount
Currency m ZAR m ZARm m ZARm
2001SalesUS dollar 295 2 300 35 307 34 364Pound sterling 2 28 – – – –Euro 62 390 – – – –Deutsche mark 13 41 – – – –French franc 43 47 – – – –Australian dollar 8 32 – – – –
Swaps Average maturity Receive Pay
2002Currency swap 0 – 1 years 220m USD 1 400m ZARCurrency swap 0 – 1 years 1 990m ZAR 220m USDCurrency swap 2 – 5 years 450m EUR 2 807m ZAR
2001Currency swap 2 – 5 years 220m USD 1 400m ZARCurrency swap 2 – 5 years 450m EUR 2 807m ZAR
Fair values of financial instrumentsThe estimated fair values as at 31 March 2002, have been determined using available market informationand appropriate valuation methods as outlined below.
2002 2001Carrying amount Fair value Carrying amount Fair value
ZARm ZARm ZARm ZARm
AssetsCash and cash equivalents 724 724 1 801 1 801Trade and other receivables 5 758 5 758 5 840 5 840Repurchase agreements 110 110 975 975Investments 1 130 1 130 806 806
Notes to the financial statements
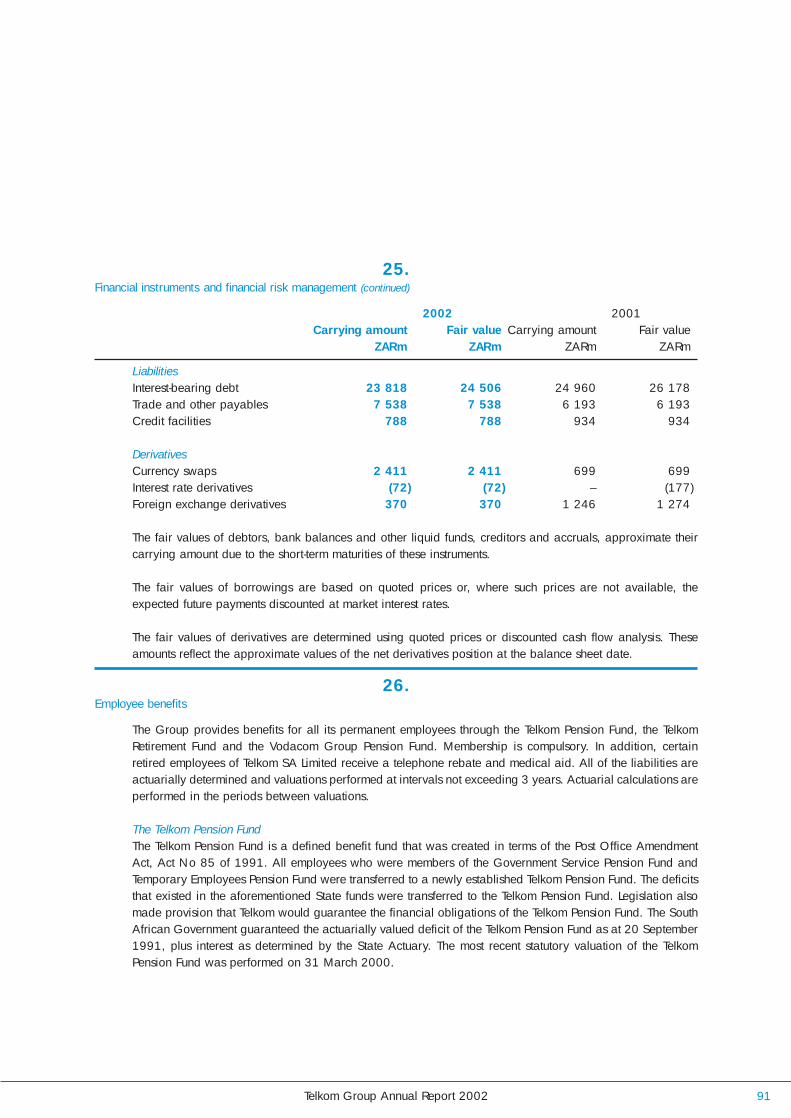
Telkom Group Annual Report 2002 91
25.Financial instruments and financial risk management (continued)
2002 2001Carrying amount Fair value Carrying amount Fair value
ZARm ZARm ZARm ZARm
LiabilitiesInterest-bearing debt 23 818 24 506 24 960 26 178Trade and other payables 7 538 7 538 6 193 6 193Credit facilities 788 788 934 934
DerivativesCurrency swaps 2 411 2 411 699 699Interest rate derivatives (72) (72) – (177)Foreign exchange derivatives 370 370 1 246 1 274
The fair values of debtors, bank balances and other liquid funds, creditors and accruals, approximate theircarrying amount due to the short-term maturities of these instruments.
The fair values of borrowings are based on quoted prices or, where such prices are not available, theexpected future payments discounted at market interest rates.
The fair values of derivatives are determined using quoted prices or discounted cash flow analysis. Theseamounts reflect the approximate values of the net derivatives position at the balance sheet date.
26.Employee benefits
The Group provides benefits for all its permanent employees through the Telkom Pension Fund, the TelkomRetirement Fund and the Vodacom Group Pension Fund. Membership is compulsory. In addition, certainretired employees of Telkom SA Limited receive a telephone rebate and medical aid. All of the liabilities areactuarially determined and valuations performed at intervals not exceeding 3 years. Actuarial calculations areperformed in the periods between valuations.
The Telkom Pension FundThe Telkom Pension Fund is a defined benefit fund that was created in terms of the Post Office AmendmentAct, Act No 85 of 1991. All employees who were members of the Government Service Pension Fund andTemporary Employees Pension Fund were transferred to a newly established Telkom Pension Fund. The deficitsthat existed in the aforementioned State funds were transferred to the Telkom Pension Fund. Legislation alsomade provision that Telkom would guarantee the financial obligations of the Telkom Pension Fund. The SouthAfrican Government guaranteed the actuarially valued deficit of the Telkom Pension Fund as at 20 September1991, plus interest as determined by the State Actuary. The most recent statutory valuation of the TelkomPension Fund was performed on 31 March 2000.

Telkom Group Annual Report 200292
26.Employee benefits (continued)
With effect from 1 July 1995, the Telkom Pension Fund was closed to new members. The funded status of theTelkom Pension Fund is disclosed below.
ZAR million 2002 2001
Telkom Pension FundDeficit (originated in terms of the legislation)
Present value of the obligation 167 197Fair value of the assets (150) (157)
Actuarial calculation – deficit 17 40
Principal actuarial assumptions were as follows:
ROI for post-retirement investment portfolios (%) 13,0 12,5Discount rate (%) 15,0 15,0Expected return on plan assets (%) 10,0 10,0Salary inflation rate (%) 7,5 7,5
Funding level:Actuarial calculation (%) 91,0 88,3
The number of employees registered under the Telkom Pension Fund Plan 448 537
The Telkom Retirement FundThe Telkom Retirement Fund was established on 1 July 1995 as a defined contribution plan. Existingemployees were given the option to either remain in the Telkom Pension Fund or to be transferred to the TelkomRetirement Fund. All pensioners of the Telkom Pension Fund and employees who retired after 1 July 1995 weretransferred to the Telkom Retirement Fund. At the same time the proportionate share of the deficit relating tothe transferring employees and pensioners was transferred to the Telkom Retirement Fund. Upon the transferthe Government ceased to guarantee the deficit in the Telkom Retirement Fund. Subsequent to 1 July 1995further transfers of existing employees occurred.
The Telkom Retirement Fund is governed by the Pension Funds Act, Act No 24 of 1956. In terms ofsection 37A of this Act, the pension benefits payable to the pensioners cannot be reduced.
Notes to the financial statements

Telkom Group Annual Report 2002 93
26.Employee benefits (continued)
The Telkom Retirement Fund is a defined contribution fund with regards to in-service members and a definedbenefit fund with regards to pensioners. The most recent statutory actuarial valuation of the Telkom RetirementFund was performed on 31 March 2000.
The funded status of the Telkom Retirement Fund is discussed below.
ZAR million 2002 2001
Telkom Retirement FundDeficit (originated on transfer from Telkom Pension Fund on 1 July 1995 and transfers thereafter)
Actuarial calculation 742 945
The number of in-service employees registered under the Telkom Retirement Fund 38 927 43 202
Company contributions (Note 2)
Telkom Retirement FundPensionersPresent value of the funded obligation 3 055 2 586Fair value of the plan asset (3 805) (2 979)
Funded status (750) (393)Unrecognised net actuarial gain 460 223
Unrecognised surplus (290) (170)
The surplus is not recognised due to the uncertainty regarding the legal status of surpluses in South Africa.
Included in the fair value of plan assets at fair value are:
Office buildings occupied by Telkom 111 111Telkom bonds 63 7
Principal actuarial assumptions were as follows:
Discount rate (%) 12,2 12,5Expected return on plan assets (%) 14,0 14,0Pension increase allowance (%) 5,9 6,1
The number of pensioners registered under the Telkom Retirement Fund 13 963 12 301

Telkom Group Annual Report 200294
26.Employee benefits (continued)
Vodacom Group Pension FundAll eligible employees of the jointly controlled entity and its wholly owned subsidiaries are members of theVodacom Group Pension Fund, a defined contribution pension scheme administered by Absa Consultants andActuaries (Proprietary) Limited. The Group’s share of the contribution to the pension fund amounted toR16 million (2001: R21 million). There were 4 353 (2001: 4 272) employees of Vodacom at 31 March2002. The fund is governed by the Pension Funds Act of 1956.
Medical benefitsTelkom SA Limited makes certain contributions to medical aid funds in respect of current and retiredemployees. The scheme is a defined benefit plan. The expense in respect of current employees’ medical aidis disclosed in Note 2. The amounts due in respect of post-retirement medical benefits to current and retiredemployees have been actuarially determined and provided for as set out in Note 21. The Group hasterminated future post-retirement medical benefits in respect of employees joining after 1 July 2000.
There are 3 major categories of members entitled to the post-retirement medical aid: pensioners who retiredbefore 1994 (“Pre 94”); those who retired after 1994 (“Post 94”); and the in-service members. The post94 and the in-service members’ liability is subject to a rand cap, which increases annually with the averagesalary increase.
Eligible employees must be employed by Telkom until retirement age to qualify for the post-retirement medicalaid. The most recent valuation of the benefit was performed as at 31 March 2001.
The Company has allocated certain investments to provide for this liability as set out in Annexure C.
Telephone rebatesTelkom SA Limited provides telephone rebates to its pensioners. The most recent valuation was performed inJanuary 2000.
Eligible employees must be employed by Telkom until retirement age to qualify for the telephone rebates. The
Notes to the financial statements
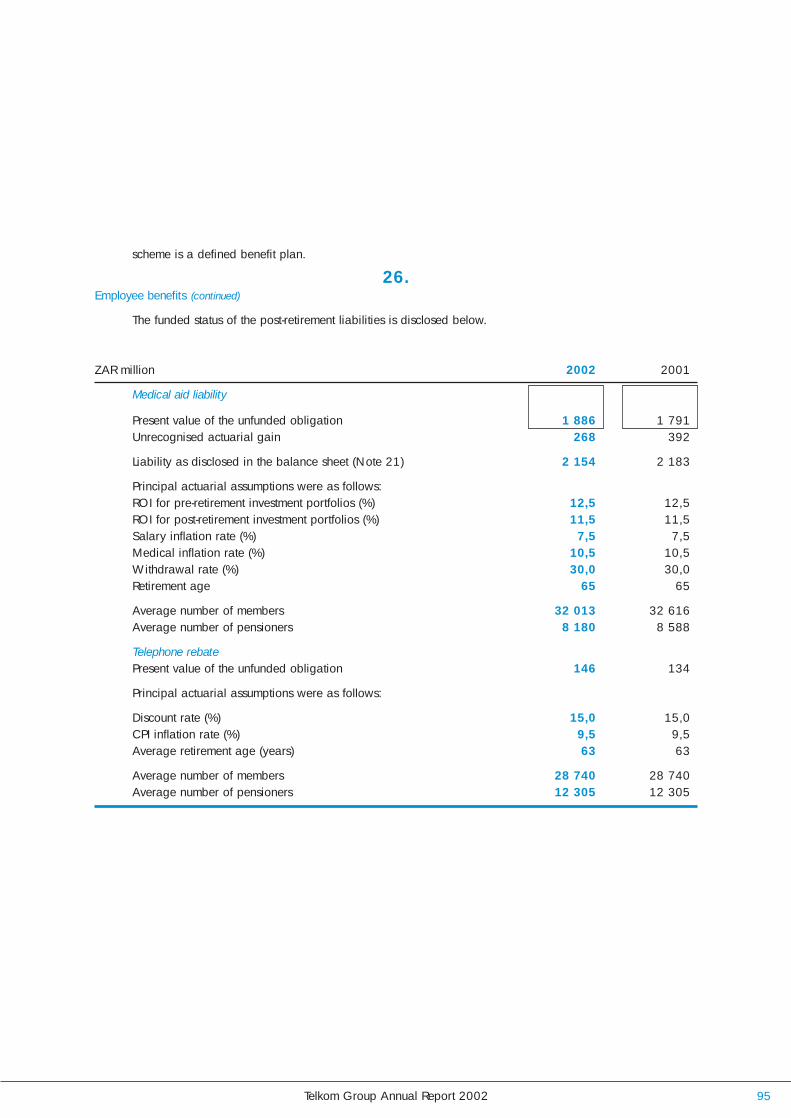
Telkom Group Annual Report 2002 95
scheme is a defined benefit plan.
26.Employee benefits (continued)
The funded status of the post-retirement liabilities is disclosed below.
ZAR million 2002 2001
Medical aid liability
Present value of the unfunded obligation 1 886 1 791Unrecognised actuarial gain 268 392
Liability as disclosed in the balance sheet (Note 21) 2 154 2 183
Principal actuarial assumptions were as follows:ROI for pre-retirement investment portfolios (%) 12,5 12,5ROI for post-retirement investment portfolios (%) 11,5 11,5Salary inflation rate (%) 7,5 7,5Medical inflation rate (%) 10,5 10,5Withdrawal rate (%) 30,0 30,0Retirement age 65 65
Average number of members 32 013 32 616Average number of pensioners 8 180 8 588
Telephone rebatePresent value of the unfunded obligation 146 134
Principal actuarial assumptions were as follows:
Discount rate (%) 15,0 15,0CPI inflation rate (%) 9,5 9,5Average retirement age (years) 63 63
Average number of members 28 740 28 740Average number of pensioners 12 305 12 305

Telkom Group Annual Report 200296
ZAR million 2002 2001
27.Reconciliation of operating profit to cash generated from operations 11 303 9 748
Operating profit before interest, tax, depreciation and amortisation 10 493 9 862Non-cash items 393 (67)
(Decrease)/increase in provisions (55) (291)Profit on disposal of property, plant and equipment (11) (18)Write-off of property, plant and equipment 47 115Impairment of property, plant and equipment 398 119Fair value adjustment (1 729) –(Decrease)/increase in provision for impairment of investment in subsidiaries – 8Unrealised exchange gain 1 743 –
Decrease in working capital 417 (47)
Inventories 294 384Accounts receivable 425 (698)Accounts payable (302) 267
28.Finance charges paid 2 133 2 066
Finance charges per income statement 3 066 3 041Movements in interest accruals (625) (216)Cost of forward exchange contracts amortised 355 (160)Net discount amortised (663) (591)Other non-cash flow items – (8)
29.Taxation paid 911 323
Net asset at beginning of year (795) (799)Liability of joint venture acquired – 3Interest accrual on tax receivable (106) (178)Current taxation 564 472Secondary tax on companies 37 30Net asset at end of year 1 211 795
Notes to the financial statements
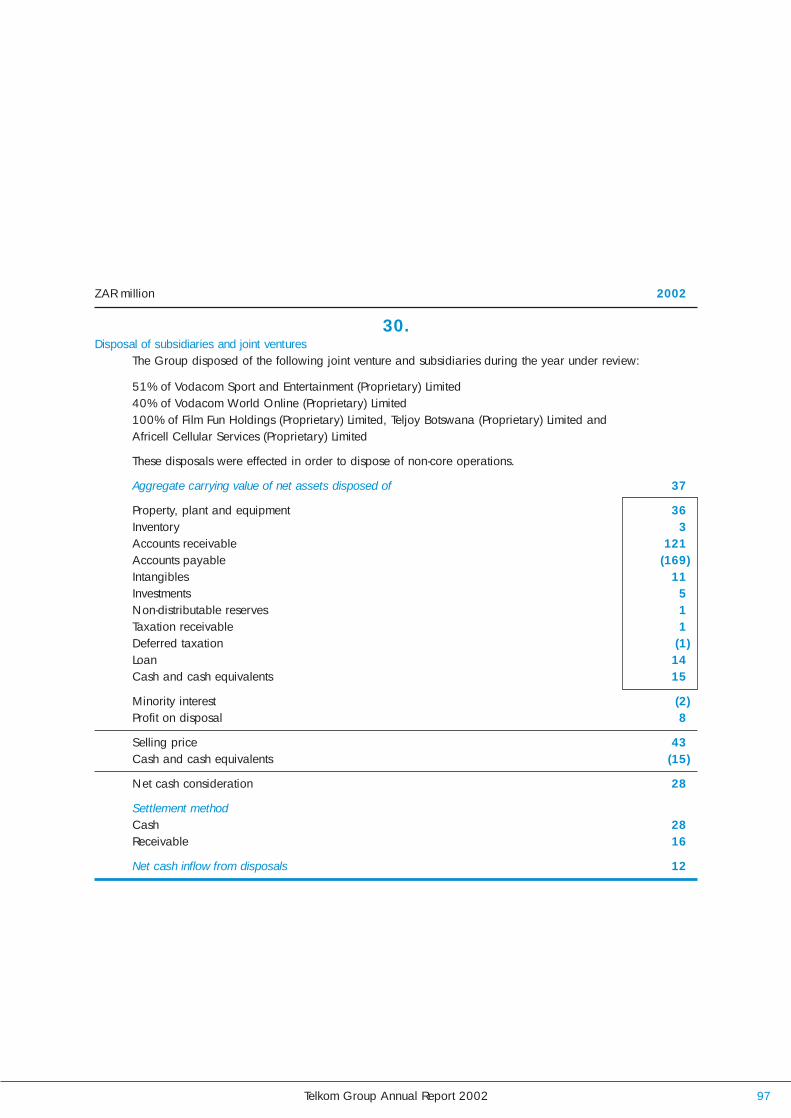
Telkom Group Annual Report 2002 97
ZAR million 2002
30.Disposal of subsidiaries and joint ventures
The Group disposed of the following joint venture and subsidiaries during the year under review:
51% of Vodacom Sport and Entertainment (Proprietary) Limited40% of Vodacom World Online (Proprietary) Limited100% of Film Fun Holdings (Proprietary) Limited, Teljoy Botswana (Proprietary) Limited and Africell Cellular Services (Proprietary) Limited
These disposals were effected in order to dispose of non-core operations.
Aggregate carrying value of net assets disposed of 37
Property, plant and equipment 36Inventory 3Accounts receivable 121Accounts payable (169)Intangibles 11Investments 5Non-distributable reserves 1Taxation receivable 1Deferred taxation (1)Loan 14Cash and cash equivalents 15
Minority interest (2)Profit on disposal 8
Selling price 43Cash and cash equivalents (15)
Net cash consideration 28
Settlement methodCash 28Receivable 16
Net cash inflow from disposals 12

Telkom Group Annual Report 200298
31.Segment information
The intercompany transactions are reflected as net and are thus eliminated against segment results.
ZAR million 2002 2001
Consolidated segment operating revenue 33 970 31 457Wireline 27 898 26 512
To external customers 27 331 26 163Intercompany 567 349
Wireless 8 170 6 693
To external customers 6 639 5 294Intercompany 1 531 1 399
Elimination (2 098) (1 748)
Consolidated segment operating profit 5 250 4 875
Wireline 3 316 3 662Wireless 1 984 1 324Elimination (50) (111)
Consolidated segment assets 49 665 47 528
Wireline 42 478 42 112Wireless 7 778 5 722Elimination (591) (306)
Investments 1 130 806Financial assets 2 819 2 920Tax assets 1 400 1 294
Total assets 55 014 52 548
Consolidated segment liabilities 13 273 12 174
Wireline 10 192 10 246Wireless 3 822 2 234Elimination (741) (306)
Interest-bearing debt 23 818 24 960Tax liabilities 189 499
Total liabilities 37 280 37 633
Notes to the financial statements

Telkom Group Annual Report 2002 99
31.Segment information (continued)
ZAR million 2002 2001
Other segment informationCapital expenditure for property, plant and equipment 9 005 9 732
Wireline 6 892 8 129Wireless 2 113 1 603
Capital expenditure for intangible assets – Wireless 189 1
Depreciation and amortisation 5 243 4 987
Wireline 4 175 4 144Wireless 1 068 843
Impairme.nt loss/asset write-offs – Wireline 445 234
32.Related parties
Related party transactions are concluded on an arm’s length basis.2002 2001
(Sales)/ Amounts (Sales)/ AmountsPurchases (owed)/owing Purchases (owed)/owing
With shareholdersThintana Communications LLC management fee included in consultancy services 219 – 260 –

Telkom Group Annual Report 2002100
2002 2001
Nominal Book Nominal Book
ZAR million value value value value
Interest-bearing debt 23 818 24 960Local loans – Group 18 284 15 401Company 17 664 14 721Joint venture company 620 680
Local loans – Company 17 664 14 721Local Telkom debt instruments 19 074 15 147 15 509 11 292
Name, maturity, rate p.a.TK01, 2008, 10% 4 594 3 552 4 829 3 666TL08, 2004, 13% 3 500 3 272 3 500 3 191TL03, 2003, 10,75% 5 000 4 985 2 700 2 669TL06, 2006, 10,5% 1 500 1 481 – –TL20, 2020, 6% 2 500 1 119 2 500 1 104PP01, 2002, 12,5% 200 200 200 196PP02, 2010, Zero coupon 430 132 430 115PP03, 2010, Zero coupon 1 350 406 1 350 351
Telkom switching certificates2008, 10,20% to 15,94% – 120
Repurchase agreements revolving 21 421
Commercial paper bills2002 – 2005, 10,09% to 15,13% 3 071 2 496 3 699 2 888
Annexure A Interest-bearing debt

Telkom Group Annual Report 2002 101
2002 2001
Nominal Book Nominal Book
ZAR million value value value value
Local loans – Joint venture company 620 680
Finance leases 390 248The finance leases are secured by various land and buildings with a book value of R361 million (2001: R222 million). These amounts are repayable between periods of 5 and 13 years. Interest rates vary from 13,76% to 14,69%.
Long-term loans – 202R100 million unsecured loan from Commerzbank AG, bearing interest at a fixed rate of 13,7% NACQ (nominal amount compounded quarterly) and repayable on 17 March 2003. Included in trade and other payables (Note 22).
R100 million unsecured loan from Credit Agricole Indosuez., bearing interest at 14,0% NACQ and repayable on 17 March 2003. Included in trade and other payables (Note 22).
R2 million shareholder loan from Sekha-Metsi Consortium Limited. The loan is unsecured, interest-free and no repayment terms have been set. Converted to equity in 2002 and included in minority interests.
Loan from other joint venture partners2002 – 2019, prime + 2% 230 230
Foreign loans – Group 5 534 9 559
Company 5 534 9 545Joint venture company – 14
Foreign loans – Company 5 534 9 545Direct loans 5 534 9 545
US dollar, 2002 – 2003 (USD) 4 42 596 5 3683,83%
Euro, 2002 – 2025 (EUR) 514 5 133 519 3 7860,10% – 7,125%
South African rand – 2009 (ZAR) 359 359 359 35910,56%
Loans denominated in other currencies – 32
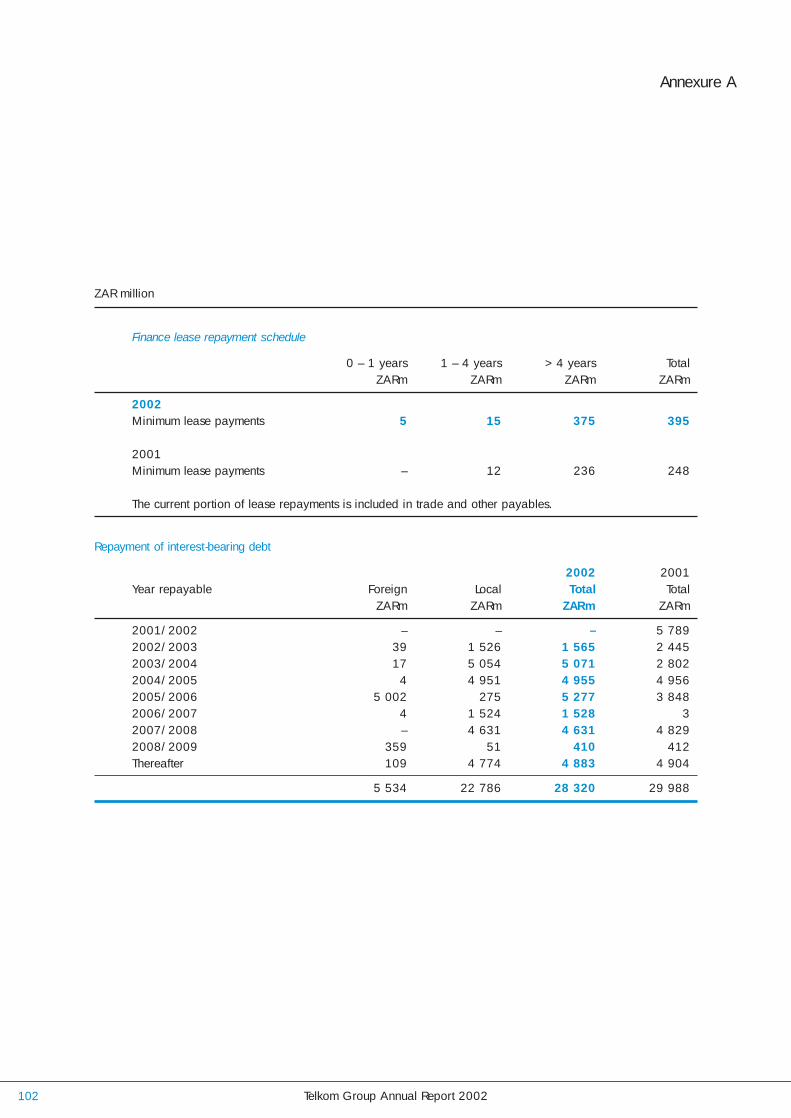
Telkom Group Annual Report 2002102
ZAR million
Finance lease repayment schedule
0 – 1 years 1 – 4 years > 4 years TotalZARm ZARm ZARm ZARm
2002Minimum lease payments 5 15 375 395
2001Minimum lease payments – 12 236 248
The current portion of lease repayments is included in trade and other payables.
Repayment of interest-bearing debt
2002 2001Year repayable Foreign Local Total Total
ZARm ZARm ZARm ZARm
2001/2002 – – – 5 7892002/2003 39 1 526 1 565 2 4452003/2004 17 5 054 5 071 2 8022004/2005 4 4 951 4 955 4 9562005/2006 5 002 275 5 277 3 8482006/2007 4 1 524 1 528 32007/2008 – 4 631 4 631 4 8292008/2009 359 51 410 412Thereafter 109 4 774 4 883 4 904
5 534 22 786 28 320 29 988
Annexure A

Telkom Group Annual Report 2002 103
ZAR million 2002 2001
Investment in joint venture – Vodacom Group (Proprietary) Limited
The Group’s proportionate share of assets and liabilities is as follows:
Total assets 7 878 6 181
Non-current assets 5 734 4 404Current assets 2 144 1 777
Total liabilities (7 418) (5 721)
Reserves (2 799) (1 858)Minority interests (209) 3Non-current liabilities (933) (764)Current liabilities (3 477) (3 102)
Share of equity 460 460
Loans to joint venture 460 460
The Group’s proportionate share of revenue and expense is as follows:Revenue 8 093 6 632Net operating expenses (6 248) (5 325)
Profit before net financing charges 1 845 1 307Net financing charges (50) (223)
Net income before taxation 1 795 1 084Taxation (614) (408)
Share of profit after taxation 1 181 676
The Group’s proportionate share of cash flowCash flow from operating activities 1 877 1 963Cash flow from investing activities (2 549) (1 584)Cash flow from financing activities 613 (519)
Net decrease in cash and cash equivalents (59) (140)Effect of exchange rate on cash and cash equivalents 63 –Cash and cash equivalents at beginning of year (398) (258)
Cash and cash equivalents at end of year (394) (398)
Annexure BInvestment in joint venture
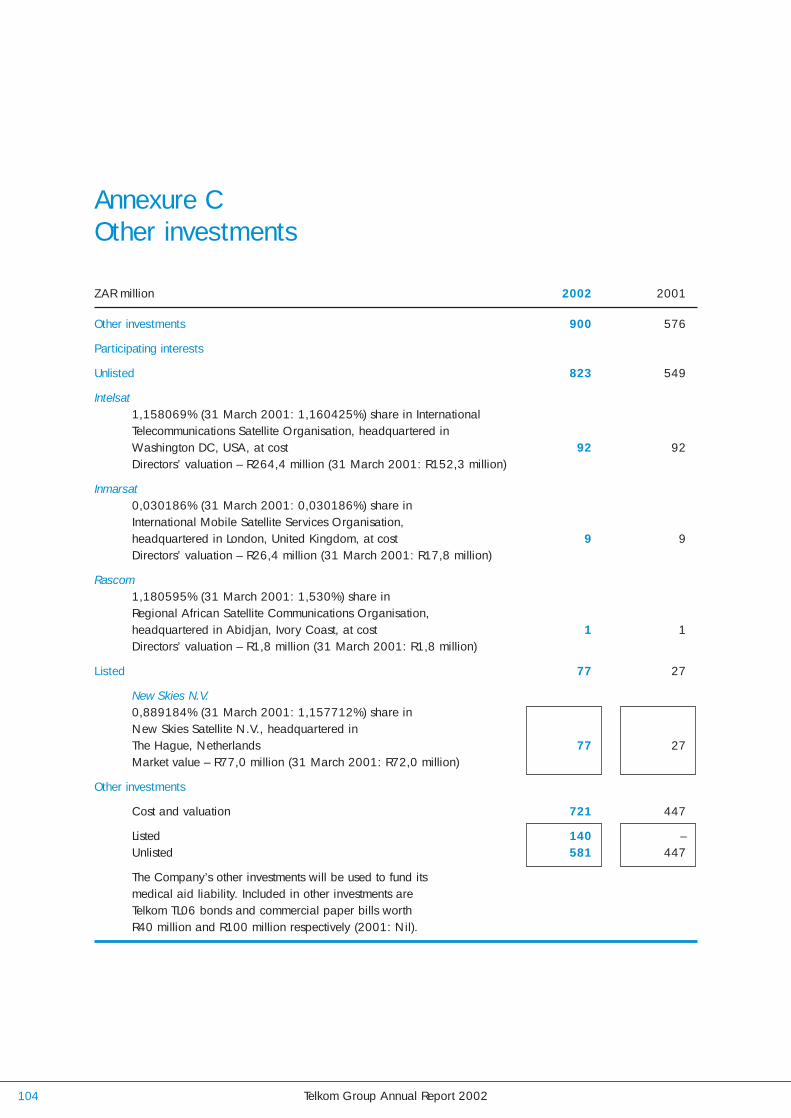
Telkom Group Annual Report 2002104
ZAR million 2002 2001
Other investments 900 576
Participating interests
Unlisted 823 549
Intelsat1,158069% (31 March 2001: 1,160425%) share in International Telecommunications Satellite Organisation, headquartered in Washington DC, USA, at cost 92 92Directors’ valuation – R264,4 million (31 March 2001: R152,3 million)
Inmarsat0,030186% (31 March 2001: 0,030186%) share in International Mobile Satellite Services Organisation, headquartered in London, United Kingdom, at cost 9 9Directors’ valuation – R26,4 million (31 March 2001: R17,8 million)
Rascom1,180595% (31 March 2001: 1,530%) share in Regional African Satellite Communications Organisation, headquartered in Abidjan, Ivory Coast, at cost 1 1Directors’ valuation – R1,8 million (31 March 2001: R1,8 million)
Listed 77 27
New Skies N.V.0,889184% (31 March 2001: 1,157712%) share in New Skies Satellite N.V., headquartered in The Hague, Netherlands 77 27Market value – R77,0 million (31 March 2001: R72,0 million)
Other investments
Cost and valuation 721 447
Listed 140 –Unlisted 581 447
The Company’s other investments will be used to fund its medical aid liability. Included in other investments are Telkom TL06 bonds and commercial paper bills worth R40 million and R100 million respectively (2001: Nil).
Annexure COther investments

This Annual Report does not constitute an offer of securities for sale in the United States. Securities may not be offered or sold in the UnitedStates absent registration or an exemption from registration under the United States Securities Act of 1933, as amended. Any public offeringof shares to be made in the United States must be made by means of a prospectus that will be available from Telkom SA Limited (Telkom)or the Government of South Africa and will contain detailed information about Telkom and its management as well as its financial statements.
Disclosure regarding forward-looking statements
Many of the statements included in this Annual Report, including the description of our plans, strategies, capital expenditures, anticipatedcost savings and financing plans are forward-looking statements. You can generally identify forward-looking statements by the useof terminology such as “may”, “will”, “expect”, “intend”, “plan”, “estimate”, “anticipate”, “believe” or similar phrases. Our actual futureperformance could differ materially from these forward-looking statements.
These forward-looking statements involve a number of risks and uncertainties. Important factors that could cause actual results to differmaterially from our expectations include, but are not limited to, our ability and the ability of Vodacom Group (Proprietary) Limited (Vodacom)to successfully compete with new entrants in the South African fixed-line and mobile markets; our ability to minimise customer non-payments,theft and vandalism; future growth in the South African economy generally as well as the South African fixed-line and mobilecommunications markets; Vodacom’s ability to expand internationally; Vodacom’s ability to manage growth; the actual or perceived healthrisks relating to mobile handsets; our ability to attract and retain key personnel; our significant indebtness; rapid changes in technologies;future regulatory developments; the political, social, economic and operational risks relating to South Africa; the cost of compliance withlabour laws and our ability to manage labour relations; fluctuations in the value of the currency against foreign currencies and South Africanexchange control restrictions as well as other matters not yet known to us or not currently considered material by us. We caution you not toplace undue reliance on these forward-looking statements. There are risks that may be difficult for us to achieve the outcomes predicted inour forward-looking statements. All written and oral forward-looking statements attributable to us and persons acting on our behalf arequalified in their entirety by these cautionary statements.
G R A P H I C O R 2 6 3 7 0
US securities legend
Profile 1
Operational highlights 2
Financial highlights 3
Chairman’s statement 16
Group structure 20
Chief Executive Officer’s review 22
Executive management team 30
Contents
Board of Directors 34
Chief Financial Officer’s review 36
Segment review – Wireline 38
Segment review – Wireless 43
Corporate governance 46
Corporate social responsibility 50
Group annual financial statements 53
Telkom
Our vision is to be a world-class communicationsgroup
Group Annual Report 2002
Company SecretaryVincent MashaleTel: +27 12 311 [email protected]
Investor RelationsBelinda WilliamsTel: +27 12 311 [email protected]
Corporate CommunicationAmanda SingletonTel: +27 12 311 [email protected]
Government and RegulatoryVictor MocheTel: +27 12 311 [email protected]
Customer call centre10219
Business call centre10217
Websitewww.telkom.co.za
Company registration number1991/005476/06
Head officeTelkom Towers North152 Proes StreetPretoria0002South AfricaPrivate Bag X881, Pretoria 0001, South AfricaTel: +27 12 311 7000
AuditorsErnst & YoungWanderers Office Park52 Corlett DriveIllovo2000PO Box 2322, Johannesburg, 2000Tel: +27 11 772 3000Fax: +27 11 772 4000
KMMT Incorporated1226 Schoeman StreetHatfield0083PO Box 11265, Hatfield, 0028Tel: +27 12 431 1300Fax: +27 12 431 1301
Legal advisorsWerksmans 155 – 5th StreetSandownSandton2196South Africa Tel: +27 11 535 8000
Administration
Telkom AR Covers 26370 8/20/02 15:53 Page 2

Telkomwww.telkom.co.za
TelkomGroup Annual Report2002
Telkom
Telkom G
roup A
nnual Rep
ort 20
02
Telkom AR Covers 26370 8/20/02 15:53 Page 1