koen voorend - erasmus university thesis repository · pdf filespecialization: economics of...
TRANSCRIPT

~>iss Institute of Social Studies
Graduate School of Development Studies
WHICH INSTITUTIONS DETERMINE GROWTH? A Small Step towards more Practical Policy Advice
A Research Paper presented by:
KOEN VOOREND THE NETHERLANDS
In Partial Fulfilment of the Requirements for Obtaining the Degree of:
Master of Arts in Development Studies Specialization:
ECONOMICS OF DEVELOPMENT
Members of the Examining Committee: Prof. Dr. Mansoob Murshed
Dr. Arjun Bedi
The Hague, December 2006

This document represents part of the author's study programme while at the Institute of Social Studies; the views stated therein are those of the author and not necessarily those of the Institute.
Research papers and theses are not made available for outside circulation by the Institute.
Enquiries:
Postal Address: Institute of Social Studies P.O. Box 29776 2502 l T The Hague The Netherlands
Telephone: +31-70-4260 460 Telefax: +31-70-4260 799
email: [email protected]
Location: Kortenaerkade 12 2518 AX The Hague The Netherlands

Acknowledgements
This ISS year has been like reading my favourite book. I enjoyed every second of it, and now that the book has come to its final pages, I feel sad that it is over. But also grateful for this unique experience! And like every good book, the end has come way too fast! There are some people that have made this year even more unforgettable, and have helped me with this paper. I would like to thank them here.
Rob Vos, for introducing me to the ISS. Unforgettable! Mansoob Murshed, thanks for your supervision and valuable input. Arjun Bedi, thank you for your invaluable comments and the casual talks. Robert Sparrow, not just to fulfil my promise, thanks for outreg and the beers we had in Ireland! Admasu Shiferaw, thanks for being a living stata-help function! Dawood Mamoon, thanks for sharing your ideas, and Leandro Sormo for the stata crash-course! Howard Nicholas, thanks for keeping me sharp and critical. The rest of the ISS teaching staff, for doing such a great job and helping to make the ISS the unique place it is!
This year would not have been the same without all my friends at ISS. Some deserve a mention: Nkululeko (A beer is a beer) and Felix (prof), thanks for the smiles that made me remember where my childhood lies, and where a part of my heart will always be. Hang (Hangipangi), thanks for the special 'RP' meetings, during which we discussed everything but RP! A special thank you to my two friends of the 'Three of ECD', with whom I discussed much more than economics. Aikaterini (Aikate) and Chiara (Chiaretta), thank you for the talks, the laughs, the beers, the cries, the statachats, and all the amazing moments we shared in Holland, China and Ireland. And for your friendship.
Rene (One Love), great to know that I have a brother on the other side of the world. You have made this year especially great, and I cherish the moments at Buitenom. Thanks for your (morning) discussions, your critical comments and your smile. Yoshi (fabata-no-miya) thanks for having me in 'your home' every dayl Thanks both for your friendshipl
Ariana (Aripari), I don't know how to thank you for this year. I hope you will feature in the next book I read. Thanks for your friendship and love. I will miss you all so much!
Finally, thanks again to my parents, Henk and Joke, and my two great sisters, Muk and Mirte. Without you this year wouldn't have been possible. I love you.
And now the book has come to an end.
Koen
i


Abstract
Institutions are hot! The international development community has adopted this buzzword
in its discourses and policies. There is ample literature pointing to the importance of
institutions for economic development, and this paper is not to deny this irrefutable fact. In
fact, this paper provides evidence that institutions impact economic performance through
human capital, rather than directly. However, it questions the relevance of the empirical
literature for policymakers, and tries to take the next step by asking which institutions are
important to income and/or growth, by categorizing them into economic, political, legal and
social institutions. The analysis teaches .us that it is difficult to answer this question, but not
because research would not be able to do so technically. Rather, the measures for institutions
that are currently available are ambiguous outcome measures that all capture similar
information and hardly contain any policy information. Disaggregating indices and using
straightforward measures of institutional quality, which actually capture a norm instead of an
outcome, can provide a small step towards more practical policy advice.
ii


Table of Con tents
AclaJowledgements ........................................ , .................................................... ............. i
Abstract ......................................................................................................................... .. ii
Table of Contents ...................................................... ................................................... iii
Abbreriaaons ................................................................................................................ vi
Chapter 1- Introduction ................................................................................................ 1
1.1. Defining institutions ................................................................................................................ 2
1.2. Approach and limits ................................................................................................................ 3
1.3. Main findings in a nutshell ..................................................................................................... 4
1.4. Structure of the study .............................................................................................................. 4
Chapter2-A dive in the literature ..................................•.•........................................... 5
2.1. Institutions for growth ............................................................................................................ 5
2.2. Growth for institutions ........................................................................................................... 8
2.3. A panel discussion ................................................................................................................. 10
2.4. Institutional reality: a dead end? .......................................................................................... 11
Chapter 3 - Methodology- and Data Analysis .............................................................. 14
3.1. Theory ..................................................................................................................................... 14
3.2. Exploring the data ................................................................................................................. 15
3.2.1. Institutions ......................................................................................................................... 16
3.2.2. World Bank Doing Business .............................................................................................. 17
3.2.3. CategoriiJng institutions ...................................................................................................... 20
3.2.4. Institutional representatives: two options ............................................................................... 23
3.2.5. Trade ................................................................................................................................. 23
3.3. Methodology ........................................................................................................................... 25
3.3.1. Baseline R.egression ............................................................................................................. 25
3.3.2. Instruments ......................................................................................................................... 25
3.3.3. uvel versus growth ............................................................................................................. 26
3.3.4. Adding capitals .................................................................................................................. 27
3.3.5. Instrumental juggling ............................................................................................ : .............. 27
3.3.6. Panel Data ......................................................................................................................... 28
ill

Chapter 4 - WlJich institutions determine growth? .................................................... 31
4.1. Institutions .............................................................................................................................. 31
4.1.1. uvel and Growth ............................................................................................................... 31
4.1.2. WE: index or disaggregate? ................................................................................................ 33
4.2. Institutional circus ................................................................................................................. 35
4.2.1. The two options ................................................................................................................... 35
.4.2.2. Tricky outcomes .................................................................................................................. 36
4.3. Ranking institutions ............................................................................................................... 38
4.4. Hutnan and physical capital .................................................................................................. 40
4.4.1. Capital controls .................................................................................................................. 40
4.4.2. So human capital qfter all? ................................................................................................. 42
4.5. Panel ........................................................................................................................................ 44
4.5.1. Pooled, random and fixed .................................................................................................... 44
4.2. GMM ................................................................................................................................... 47
Chapter 5 - Conclusions .............................................................................................. 48
5.1. "What the paper found ........................................................................................................... 48
5 2 Takin f . .. kin 'th . . . ~ 50 . . g care 0 ltlsl1tul1ons or ta g care W1 ltlsl1tul1ons ............................................ .
References .................................................................................................................... 52
Appendices .................................................................................................................. 57
Appendix 1 : Variables, definition and source: .......................................................................... 57
Appendix 2: Pair wise correlations between income and institutions ................................... 59
Appendix 3: Determining which institutions - Correlation Matrix Institutions ................. 61
Appendix 4: Baseline exploratory regressions .......................................................................... 62
Appendix 5: World Bank Doing Business: Indices versus subcomponents ........................ 66
Appendix 6: Regressing hutnan capital on institutions ........................................................... 70
iv

Figure:
Figuxe 1: Forms of Institutions ............................................................... 3
Boxes:
Box 1: Kaufinann and Polity IV indicators ................................ : ................. 16
Box 2: The 10 WBDB indicators ............................................................. 18
Tables:
Table 1: WBDB - Correlation Matrix ........................................................ 19
Table 2: Exploratory Regressions: Institutions without controlling for capital. ......... 32
Table 3: Two options of institutional combinations ........................................ 35
Table 4: Including four institutions in the regression ....................................... 37
Table 5: Ranking of institutions ............................................................... 38
Table 6: Ranking the Kaufinann data ......................................................... 39
Table 7: Exploratory Regressions: Institutions while controlling for capital ............. 41
Table 8: Regressing human capital on institutions ........................................... 43
Table 9: Panel data results ...................................................................... 46
v


Abbreviadons
AB AC AJR BHT ECOWAS EL EPA FE FR GDP GMM IMP IV OECD OLS PMG RE R&D RR RST SMR WB WBDB 2SLS
Arellano and Bond Alcala and Ciccone Acemoglu, Johnson and Robinson Bond, Hoeffler and Temple Economic Community of West African States Easterly and Lev:ine Economic Partnership Agreement Fixed Effects Frankel and Romer Gross Domestic Product . Generalized Method of Moments International Monetary Fund Instrumental Variable (technique) Organisation for Economic Co-operation and Development Ordinary Least Squares Pooled Mean Group Random Effects Research and Development Rodriguez and Rodrik. Rodrik., Subramanian and Trebbi Settler Mortality Rate World Bank World Bank Doing Business Two Staged Least Squares
vi


Institutions form the incentive stmcture of a society and the political and economic institution~
in consequence, are the underjying determinants if economic peiformance.
Douglas North (1993)1
Chapter 1- Introduction
The international development community has come to focus more and more on
institutions, as were it the panacea to the development question. The quality of institutions is
said to be vital to economic growth, and an array of studies has proven this theoretically and
empirically.
However, there are two knotty issues. The first is about the definition and measures of
institutions. The most commonly adopted definition of 'institutions' is given by North
(1981) who defines them as "a set of rules, compliance procedures, and moral and ethical
behavioural norms designed to constrain the behavior of individuals in the interests of
maximizing the wealth or utility of principles" (North 1981, pp. 201-202). This definition is
grand, as it comprises almost everything a society is built up of. But this definition is not
easily translated to an empirical estimation, or to policy.
Many studies, including this one, use indicators such as Polity IV's 'Polity Score' or
Kaufinann et al.'s (2005) 'Rule of LaW'. However, these indicators typically measure
outcomes, and not the actual norm or institution. Also, they are aggregated data based on a
vast amount of information and therefore become very difficult to understand. More
specifically, they do not at all translate into practical policy advice.
For example, a recent study by Busse et al. (2005) warns for the quick opening up of
borders without quality institutions in place. As a measure of institutional quality they
construct an index the basis of World Bank Doing Business (WBDB, 2004) information,
which they call the 'Regulation IndeX'. This is refreshing indicator of institutional quality, in
that it is less a subjective measure than for example the 'Polity Score'. But by creating this
index they lose an enormous amount of information, and create yet another index that
hardly carries information that can be translated to a policy maker.
Second, there are different kinds of institutions that work differently in an economy and
therefore interact differently with economic growth. Empirical studies have typically used
1 Douglas North in his lecture to the memory of Alfred Nobel, December 9, 1993.

one measme of institutions to conclude that institutions are of importance. This seems
hardly realistic, and a more interesting question arises. Which are the institutions important
for economic growth?
This paper sets out to understand the debate on the institution-growth nexus, and will
try to incorporate the two criticisms. The paper will attempt to understand which institutions
are important to economic growth. Where possible, aggregated data will be dis aggregated
and more useful and easy to interpret measmes of norms or institutions will be used. After
the empirical analysis, the international community'S focus on institutions in its current state
will be questioned for usefulness and relevance.
1.1. Defining institutions
Following the contemporary literatuxe on institutions, the definition used in this paper
will draw on North's (1981) definition, as it leaves ample room for manoeuvre. A distinction
between types of institutions is important. Acemoglu, Johnson and Robinson (A JR, 2004)
distinguish between political institutions (constitution and informal power) and economic
institutions (property rights and role of law). Political institutions are relatively static but are
nevertheless influenced by economic performance and the distribution of income. Both of
which are determined by the economic institutions.
Busse et al. (2005) follow distinguish between formal and informal institutions, noting
that in poorer countries the latter are more important. The outcome of the actions of the
formal and informal institutions is broadly defined as governance.
But this could be taken one step further. Institutions can be divided into economic,
political, legal and social institutions. These institutions can be formal or informal. Although
informal institutions are undoubtedly extremely important for an economy, and probably
more so in countries where the formal institutions are less developed, this paper will not deal
with informal institutions besides this mention. The reason for this is that there is a lack of
data on informal institutions. Below, Busse et al.'s figuxe is adapted to incorporate om
distinction between types of institutions.
2

Figure 1: Forms of Institutions
Forms ofInstitutions I
I I I Formal Informal
I I
Public I Private I
Political Political Political
Constitution Codes of Conduct Customs Regulation Taboos
Economic Economic Economic Property Rights Market Rules Informal Market Rules etc. etc. Sanctions
Social Social Social Religion Marriage Traditions Freedom of press Normative rules
Legal Legal Laws &
J
enforcement Contracts
Source: Adapted from Busse et al. (2005)
1.2. Approach and limits
This paper will categorize institutions into economic, political, legal and social
institutions and will use dis aggregate measures of their quality (where possible) to try and
answer the question: Which institutions are vital to economic development?
It addresses the debate of comparative development and criticises the methodologies of
studies that use aggregated measures of institutions which leads them to conclude that
institutions are crucial to economic development. Also, the available measures of
institutional quality are almost aiways outcome variables rather than measurements of a
norm or rule. This paper will propose some measures of norms.
3
1

The biggest limitations of this paper come threefold. First, infonnal institution cannot
and will not be dealt with. Second, the availability of data on institutions is limited. There is
hardly any data on actual nonns. Therefore, the same aggregated measures of institutions,
which the paper criticises for their questionable interpretability, are used. However, where
possible, there are deviations from the indices and more straightforward measures are
proposed.
Finally, the power of some of the statistical techniques used depends on the validity of
the underlying assumptions. These can be questioned. However, in the author's opinion,
before criticising the literature it should be covered. In that sense, the results are as valid as
any other recent paper on institutions.
13. Main findings in a nutshell
Whereas (income) level regressions show institutions to playa significant role, this
paper confirms Rodrik.'s (2006) finding that the link between institutions and growth is hard
to make. Despite the categorisation, it is also difficult to establish which institutions are
important, but there is some evidence that legal and social institutions have a bigger weight
in detennining economic perfonnance than economic and political. More specifically, the
only variable that is strongly significant and does not seem to work through human capital is
'Getting Credit' (categorised as a legal institution), a measure of the ease of lending and
borrowing money. The two proposed social institutions are surprisingly important as well.
Panel data analysis shows that institutions have an effect on average growth rates
outside their impact on growth through human capital. However, the critique that the
commonly used measures of institutional quality used do not contribute to a practical
understanding of what the policy implications are still holds.
1.4. Structure of the study
The rest of the paper is structured as follows. Chapter 2 provides a critical review of the
literature on institutions and their relation to growth. In chapter 3, the methodology that will
be applied to establish which institutions are important is presented. Also, this chapter
contains an exploratory analysis of the data. Chapter 4 presents the main findings,
investigating which institutions determine growth and whether human capital might not be
more important. Chapter 5 concludes.
4

It is unresolved questions, such as what might the factors if economic growth be,
that inspire the best minds to look for answers.
Peter de Haan (2006: 45)
Chapter 2 - A dive in the literature
Over the years, there has been ample literature on how economic growth interacts with
the quality of a country's institutions. While consensus seems eminent on physical and
human capital's role in raising a country's growth potential, controversy remains on how
these come about most effectively. Below, an overview of the literature is provided.
2.1. Institutions for growth
Many studies have established institutional quality to be vital for economic and social
development. These studies contest that long-lasting institutions are crucial for economic
development and any other determinants impact growth through institutions. An economy
must first get the political and economic institutions right, before it can think of growth. A
common definition of institutions is given by North (1981) as: "a set of rules, compliance
procedures, and moral and ethical behavioural norms designed to constrain the behaviour of
individuals in the interests of maximizing the wealth or urility of principles" (North 1981:
201-202). These constraints, then, provide the favourable environment for investment in
human and physical capital, which in turn wi111ead to economic growth. According to the
institutional view, economic growth is thus a function of the institutions the economy hosts.
There is abundant (empirical) literature on the indirect effects of institutional quality
on economic growth. Institutional quality has been cited as the reason for less income
inequality by Easterly (2001). Inequality could increase pressures for income redistribution,
and policies answering these calls might have distortionary effects on the economy. If these
calls are not heard, inequality may even result in political instability, especially in
democracies. Thus, a country that has no quality institutions might be more prone to
violence and conflict which may eventually hamper economic growth. Alesina et al. (2003)
and Murshed (2006) analyse this conflict-growth nexus in further detail and conclude that
institutional quality is the most important determinant for avoiding (ethnic) conflicts.
Furthermore, institutional quality has been associated with increased investment in human
5

and physical capital by Knack and Keefer (1995) and Arimah (2004), and to better financial
development by Beck et al. (2001).
In addition, studies have tried to analyse the direct impact of quality institutions on
economic growth. However, empirical research on the relationsJ:llp between institutional
quality and economic growth is hampered by an endogeneity problem. Institutional quality
might spur growth, but growth might improve institutions.
Acemoglu, Johnson and Robinson (AJR, 2001) attempt to tackle this problem. In their
influential work, they hypothesize that "settler mortality affected settlements; settlements
affected early institutions; and key institutions persisted and formed the basis of current
institutions" (AJR, 2002: 1373). Where the Europeans settled they brought with them their
superior quality institutions. Where they didn't settle, institutions were designed for
exploitative purposes. The differences in settler mortality thus account for differences in
institutions, but are unrelated to a country's income. Using this settler mortality rate (SMR)
as instrumental variable, AJR estimate large positive and robust effects of institutions on
economic growth.
Easterly and Levine (EL, 2002) use the SMR to estimate the relative contributions of
endowments, geography, policies and institutions to economic growth. Their results are
consistent with AJR and they conclude that policies and endowments affect growth through
institutions. They "find no evidence that tropics, germs, and crops affect country incomes
directly other than through institutions, nor do [they] find any effect of policies on
development once [they] control for institutions" (EL, abstract).
Rodrik, Subramanian and Trebbi (RST, 2002) put together the fitted trade instrument
for integration proposed by Frankel and Romer (1999) and the SMR instrument for
institutional quality. By combining methods, they are able to estimate the relative
contributions of geography, trade and institutions to growth. The authors conclude that "the
quality of institutions trumps everything else" (RST, 2002: 4). After controlling for
institutions, geography has weak effects on growth at best, and integration has no direct
effect whatsoever. But increased integration improves institutional quality, and raises growth
through institutions. These findings are robust to changes in the size of the datasets, to the
inclusion of regional dummies and different measures of institutions. RST also identify the
channels through which institutions affect growth. They find that institutions cause growth
6

more than anything else and do so by raising income, the human and physical capital stock
and productivity.
In 2004, AJR go a step further by theoretically framing how institutions are the
fundamental cause of long term growth. They distinguish between political institutions
(constitution and informal power) and economic institutions (property rights and rule of
law). Political institutions are relatively static but are nevertheless influenced by economic
performance and the distribution of income. Both of which are determined by the economic
institutions. These have a dominant role in comparative development. "Institutions matter;
it;ldeed [they] are central in determining relative prosperity" (AJR, 2004: 29).
But why do countries have different economic institutions? AJR provide a theoretical
framework distinguishing between (variants of) the 'Political Coase Theorem', based on
negotiation, and the social conflict view. They argue that economic institutions are
endogenous, determined as collective choices of society. But these choices result not from
consensus but from a conflict of interests. The more dynamic economic institutions are thus
determined by political power, or political institutions. The question, according to AJR, is
answered by looking at politics.
Finally, Busse et al. (2005) follow RST to estimate the importance of institutions for
growth in general, and for the looming trade liberalisation under the EP As for ECOW AS
countries in specific. The innovation in their work is the construction of a Regulation Index, a
weighted average of nine regulation indicators from the WBDB dataset (WB 2005). These
"allow us to obtain information o~ regulatory outcomes, such as time and money spent on
bureaucratic procedures, and thus to investigate the efficiency of governmental institutions
in place" (Busse et al., 2005: 23). They claim this to be a superior indicator of institutional
quality, because it attempts to bypass the subjectivity of commonly employed perception
based indicators of institutional quality.
They too find significant and strongly positive results of institutional quality on
economic growth. It trumps everything else. More specifically, Busse et al. point to the
importance of having in place good institutions before liberalising trade. The relatively poor
performance of countries on the institutional quality indicators should indulge them to adopt
a cautious approach towards trade liberalisation. Only through increased institutional quality
can the West African countries to reap benefits from increased trade. Through institutions
that is.
7

2.2. Growth for institutions
In contrast, some others see good institutions as a product of economic growth. They
do not deny the importance of institutions but argue that economic growth precedes the
formation of institutions. An economy starts with the accumulation of human and physical
capital, which does not so much depend on North's 'constraints' on the executive power,
but rather on the policies of this executive power. As the country's economy and human
capital advance, there is a greater plea for democracy and quality institutions to constrain the
executive power.
Glaeser et al. (2004) provide an interesting explanation of this argument,. showing that
a country ruled by a dictator, which by anybody's standards would not be classified as one
with good institutions, can still accumulate capital and thus experience growth. Like Lipset
(1960) before them, they argue that good policies are essential to growth, and tha~ good
institutions will follow in time as a consequence of increased wealth and improved
education. According to this view, "countries differ in their stocks of human and social
capital [ ... J and institutional outcomes depend to a large extent on these endowments"
(Glaeser et al., 2004: 272).
Although Glaeser et al. (2004) state that there seems to be "intellectual consensus"
(idem: 272) on the relationship between institutions and growth, the focus on institutions
might not be appropriate. First of all, the measures of institutions reflect neither constraints
on the government nor the enduring features of the environment, but the outcomes of
policy. The measures of institutional quality proposed by the literature so far are reflections
of economic development rather than measures of institutions.
Second, there is evidence of reverse causality between institutions and economic
growth. Regressing GDP per capita on several institution indicators and years of schooling,
they find that economic performance is much better explained by human capital. Whereas
"the initial level of education is a strong predictor of subsequent economic growth" (idem:
279), "initial executive constraints have no predictive power for subsequent economic
growth outside the 1980s" (idem: 282). Even for longer time spans, they claim the
institutional view got it wrong. The argument goes that average political outcome is a good
measure of durable constraints and that in the long run human capital does not explain
growth since it is not one of its 'deep" determinants. However, Glaeser et al. (2004) show
8

that the measures of average political outcome are much more volatile than measures of
human capital in the long run and have less explanatory power.
Thirdly, they claim that the SMR instrument is not a statistically valid tool for empirical
testing. An instrument must be uncorrelated with the error term, but this will not be valid if
settlement patterns influence growth in other ways than through institutions. Glaeser et al.
argue that they do, since they show how human capital in fact is more strongly correlated
with the SMR instrument than with institutions. Following Djankov et al. (2003), they argue
that "it seems at least as plausible that what [the Europeans] brought with them is
themselves, and therefore their lmow-how and human capital" (idem, p. 289).
So, Glaeser et al. (2004) conclude that "the causal link between institutions [is]
extremely difficult [to establish]" (Glaeser et al., 2004: 296) and claim the primacy of human
capital over institutions. That is not to say that institutions aren't important but the focus
should be "on actual rules rather than conceptually ambiguous assessments of institutional
outcomes" (idem: 298), which could be manipulated by policy makers.
Fielding and Torres (2006) show that that the SMR instrument is invalid not only for
statistical reasons. They argue that the SMR instrument is statistically insignificant if the
sample used for the regression analysis changes. Removing Malta, Hong Kong and
Singapore from the regressions leaves the results insignificant.
But more importandy, the theory behind the SMR is not solid. The argument that
Europeans settled only where the conditions were right is flawed. Fielding and Torres's
counterargument is that Europeans did not consider the costs of settlement (arguably the
SMR) in isolation, but contrasted them to the benefits of settlement. There were different
phases of colonialism whereby settlement was direcdy determined by the economic structure
back home. In the 14th and 15th century, Europe was mercantilist and needed minerals. The
benefits of settling in disease infested countries close to the equator were greater than the
costs. Argentina, for example, was not attractive for Europeans at the time, because it was
relatively poor in minerals. Conversely, in the 17th through the 19th centuries, this changed
with the rise of the industrial revolution. There was now a growing agricultural need and this
changed the pattern of settlement. 1bis development is more in line with AJR's reasoning.
However, following Celso Furtado (1976), Fielding and Torres (2006) argue that different
production structures caused different types of colonisation, not the settlement climate.
9

The authors then go on to propose an alternative instrument for institutional quality.
Arguing that pastoral agricultural production at the end of the colonial period explains a lot
about current production structures, they suggest per capita production of tradable meat.
Underscoring the lack of theoretical backbone for this new instrument, they show that meat
and beef per capita are good indicators of production structures just as good instruments as the
SMR, if not better.
2.3. A panel discussion
Durlauf et al. (2004) note that researchers are constrained by the small number of
countries for which data is available. Cross-section research only captures between country
variation, which "limits the extent to which researchers can apply more sophisticated
methods" (Durlauf et al., 2004: 103).
Therefore, there have been resorts to more sophisticated methods. Panel data
estimation, which uses the within country variation, allows for more complicated hypotheses
and interrelations. This also allows for a better understanding of the dynamics behind
institutions and their interactions with growth. The substantial majority of the panel data
studies that concentrate on growth uses a fixed effects estimator, which implies a "full set of
country-specific intercepts, one for each country, and inference proceeds conditional on the
particular countries observed" (idem: 105).
Using static panel data estimation, Dawson (1998) finds that institutions have a positive
effect on growth, that "political and civil liberties may stimulate investment [and that] an
important interaction exists between freedom and human capital investment" (Dawson,
1998: abstract). Bassanini et al. (2001) us the Pooled Mean Group (pMG) technique2 for
OECD countries "confirm the importance for growth of R&D activity, the macroeconomic
environment, trade openness and well developed financial markets" (Bassanini et al., 2001:
abstract). Similarly, Lewer and Saenz (2005) use fixed effects estimation to examine the
interaction of the security of property rights and growth. They underscore the 'De Soto
2 PMG is an option between the two extremes of fixed effects, which does not use the 'between' country variation, and pure time-series, where the coefficients are treated as entirely disparate. Bassanini et al. (2001) claim that "This approach allows intercepts, the convergence parameter, [the] short-run coeffic.ients and error variances to differ freely across countries, but imposes restrictions on the other parameters leading to more efficient estimates.
10
hypothesis', which "suggests that economic growth is significantly related to. the security of
property rights in a country" (Lewer and Saenz, 2005: 158).
However, Durlauf et al. (2004) note that many authors have articulated the potential
dangers of using fixed effects on cross-country panel data. Particularly, some variables hardly
change over time, as a result of which within-country information is not informative. This is
especially true for institutions, which are extremely static over time.
Bond, Hoeffler and Temple (2001) argue that the most appropriate procedure to analyse
growth in cross-country panel data is to use system GMIM (generalised method of moments),
a slight variation to the first-differenced G1MM Arellano and Bond (1998) proposed. Using
this technique, Eicher and Schreiber (2005) find that initial institutional quality among
transition economies strongly influences growth performance. As they put it, "[t]he quality
of institutions in 1991 can explain almost 50 percent of the variation of GDP per capita in
2001 across countries" (Eicher and Schreiber, 2005: 23). Compton et al. (2006) find mixed
results for their analysis of interactions between growth and political stability over time. They
find that growth is not dependent on political stability, in the long run or the shorter run,
and argue that this might be a sign that informal institutions actually have more weight in
determining the economic performance of countries.
All in all, there are still many unresolved questions to be answered, and it is yet to be
established which statistical techniques are most appropriate for investigating the relation
between growth and institutions.
2.4. Institutional reality: a dead end?
Building a bridge from the theoretical and empirical literature, Rodrik (2006) reviews, in
his controversial writing 'Goodqye Washington Consensus, Hello Washington Coifusion', the policies
proposed by international institutions. He discusses a recent WB (2005) publication, called
"Learning from Refoml', in which a relatively revolutionary stance is taken. The wave of
reforms in Latin America and sub-Saharan Africa has not brought economic growth. Where
the WB and International Monetary Fund (IMP) have traditionally univocally advocated the
'stabilize, privatize, and liberalize' mantra as a blueprint for development, there seems to be
anything but harmony at present. Interpreting the record of low growth, financial crisis and
increased poverty, the IMP disconcertingly contends that reforms were well designed but did
11
not go deep enough. "The policy implication that follows is simple: do more of the same,
and do it well" (Rodrik, 2006: 9).
The WB interprets the dreadful development record of the last two decades in a
surprisingly different way. First, conventional policies are not aimed at stimulating dynamic
forces behind the growth process but are too concerned with deadweight losses in society.
Second, broad objectives of reform cannot be translated into a unique set of policy actions.
Third, even if countries have similar problems, there need to be different solutions. Fourth,
there is a tendency to exaggerate the advantages of rules over discretion in government
behaviour. Finally, the focus has been too broad. Policy makers should focus on the binding
constraints to economic development before ticking off the whole reform shopping list. In
short, there is no blueprint for development.
Rodrik then goes on to discuss the two orthodox alternatives. Firstly, there is the view
that foreign aid will help developing countries on the ladder of development. Jeffrey Sachs
and the United Nations seem to advocate that the current levels of international aid are a
significant constraint on the achievement of global poverty reduction. An increase in foreign
aid, then, may provide the so-called 'big push' for development, helping developing
countries climb the ladder of development.
But Rodrik worries about this holistic approach, claiming that the assumption that we
know all the barriers to growth and can simply remove them is too simplistic. Besides, some
countries in Africa have received large quantities of foreign aid but not performed well,
while other countries received little and done well. Also, growth spurs eventually fizzle out,
pointing at some binding constraint on growth. As an alternative, Rodrik proposes to
diagnose and deal with the most significant constraints in an economy. He distinguishes
between two main constraints, namely too high costs of finance and thus access to credit is
vital to economic growth, or too low returns to investments.
Secondly, as the IJ\1F advocates, institutions have proven to be weak. It became clear
that "sound policies needed to be embedded in solid institutions" (idem, p. 9). But
institutions are deeply embedded in society, and if quality institutions are necessary but
lacking, that would imply a very deterministic pessimism about development.
The Washington Consensus' focus on quality institutions is a dead end, Rodrik argues.
There has not been established a causal link between institutions and economic growth.
Besides, empirical studies have focused on the long term relationship between institutions
12

and growth, as many studies typically use level of income in a recent year as dependent
variable, not the rate of growth, and have typically found strong results for these level
regressions. The link between institutions and economic growth is much weaker. Also,
asking of developing countries to erect quality institutions may not be realistic:
"Tellingpoor countries in Africa or Latin America that thry have to set their sights on the best-practice
institutions oj the U.S. or Sweden is like telling them that the onlY wqy to develop is to become developed -
hardlY tlsejul polity advicel"(Rndrik 2006: 13).
13


Focus on actual rules, rather than on ambiguous assessments if institutional outcomes
Glaeser et al. (2004: 298)
Chapter 3 - Methodology and Data Analysis
Tbis chapter starts off with an exploration of the data, investigating the links between
levels of income, economic growth and various measures of institutions. Then, the paper
presents the econometric methodology applied in the next chapter. It will depart from a
baseline regression wbich is adapted to test the typical specifications from recent literature.
The paper will follow both Glaeser et al. (2004) and Busse et al. (2005) in tbis respect, for
reasons of comparison.
The paper will argue that the debate that centres around the question whether
institutions are important does not contribute much to the understanding of contemporary
development economics. Institutions are important in one way or another and denying tbis
seems folly. Also, it is commonly accepted that human and physical capital are of great
importance to comparative development. Institutions have shown to be important either
direcdy on growth and income or indirecdy in their role of facilitating the accumulation of
capital.
In the author's view, it is more interesting to understand another question. Not whether
institutions are important but which institutions are important. Using one measure of
institutions to capture all the rules of the game might seem an oversimplification. The
argument is two-tiered. First, institutions will not work the same in all regions. Many
specifications include regional dummies to control for tbis, as will tbis paper, but tbis does
not really help our understanding of institutions. Tbis will, however, not be the focus of tbis
paper. Second, and at the centre of tbis paper, not all institutions are important for economic
growth, and some may be more so than others. Therefore, by defining categories of
institutions tbis paper hopes to shed light on wbich institutions are key.
3.1. Theory
Gross domestic product M is assumed to grow with increases in human capital (H) and
physical capital (K). Exogenous (Solow, 1956, Harrod-Domar, 1948) and endogenous
(Lucas, 1988, Romer, 1990) growth models have established these relationsbips. For trade
(Trade), the models have been less univocal, but Frankel and Romer (1999), Busse et al.
14

(2005), Noguer and Sis cart (2005) and Mamoon and Murshed (2005) have shown trade to
have a positive effect on income as well. Finally, improvements in the quality of institutions
(Institution) are also expected to exert positive effects on income. The vast volume of
empirical literature has shown institutional quality to be of great importance to income. RST
(2002), AJR (2001 and 2004) and EL (2002) amongst others have concluded that
institutional quality is the main deep determinant of growth.
All in all, income would thus depend on these variables in the following way:
Y = f(H,K,Trade,lnstitution) + + + +
Income is a function of human and physical capital, the amount of trade and the quality of
institutions. This specification can consequently be translated to an empirical specification.
3.2. Exploring the data
This section presents the data that will be used in the cross country analysis with a focus
on the variables capturing institutional quality. The definitions and the source can be found
in Appendix 1. Specifically, this section will explore which variables will represent which type
of institutions. Also, the data from the WBDB dataset will be analysed.
Measuring institutions is a tricky business. Institutions as North (1990) describes them
are rules, or norms. A norm could be that women are expected to work. However, the data
are mainly composed by outcome variables. For example, gender equity in its broadest sense
is an outcome variable, based on certain rules or norms. The same holds true for political
stability, which is an outcome variable as well.
In the case of the Kaufmann (2002) data, it seems quite obvious that these measures of
institutional quality are outcome variables and will be correlated with economic
performance. It is quite evident that improvements in government effectiveness, political
stability and rule of law have positive, rather than negative effects on income or growth. So
again, the argument for using dis aggregated measures where possible gets some backbone.
Also, it is interesting to see here how institutional quality differs among regions.
15

3.2.1. Institutions
The Kaufmann data comprise six indicators of 'good governance' which are summarized
in Box 1, together with the Polity IV indicators. These data are all very much correlated to
income (see Appendix 2).
The Kaufmann governance indicators have been oriented so that higher values
correspond to better outcomes on a scale from -2.5 to 2.5. They are categorized as
government effectiveness (Gc), regulatory quality (Rq), political stability (Ps), rule of law (Rl),
voice and accountability (Va) and control of corruption (Cc). Box 1 contains more details.
Box 1: Kaufmann and Polity IV indicators
Variables
Kaufmann Data
Government Effectiveness (Ge)
Regulatory Quality (Rq)
Political Stability (ps)
Rule rfLaw (RJ)
Voice and Accountability (Va)
Control rf Corruption (Cc)
Polity IV Data
Democrary Score (Demo)
Autocrary Score (Auto)
Polity Score (pol)
Source: Busse et aI. (2005: 20-21))
Meaning
Range -2.5 to 2.5 (-2.5=low, 2.5=high)
Measru:es perceptions of "inputs" that are required for the government to be able to produce and implement good policies (a.o. the quality of the independence of the civil service).
Measru:es the incidence of government intervention in the economy (wage or price controls, regulations on foreign trade, legal restrictions on business ownership or equity by nonresidents).
Measru:es perceptions of the likelihood that the government in power will be destabilised or even overthrown by unconstitutional and/or violent means.
Measru:es the extent to which agents have confidence in and follow the rules of society (contracts enforced, prevalence of
. black market activities, effectiveness of the judiciary).
Measru:es different aspects of political rights and civil liberties (free and fair elections, influence of the military in politics, independence of the media).
Measures the exercise of public power for private gain through effects of corruption on the attractiveness to do business, to the chance that additional payments are needed to 'get things done'.
Range =0 to 10 (0 = low,' 10 = high)
Democracy Score: general openness of political institutions.
Autocracy Score: general closedness of political institutions.
Polity Score: Computed by subtracting Auto from Demo; includes "standardized codes" (i.e., -66, -77, -88) for special polity condition. (Range = -10 to 10)
16

The Polity data are measured on an 11 point scale, with 10 being the 'perfect' democracy
or autocracy. The 'Polity Score' is an aggregation of these two variables3• Also from the Polity
data is 'Constraints on the Executive' (Xcons80), which measures the institutionalised constraints
on the decision makers. Freedom House (2005) offers two other variables capturing
institutional quality, namely 'Political Righti (Pr; and 'Civil Liberty' (C~. Freedom House (2006)
states that "Political rights enable people to participate freely in the political process,
including the right to vote freely for distinct alternatives in legitimate elections [ ... ] and elect
representatives who have a decisive impact on public policies and are accountable to the
electorate. Civil liberties allow for the freedoms of expression and belief, associational and
organizational rights, rule of law, and personal autonomy without interference from the
state" (Freedom House, 2006: Website). Both are measured on a 1-7 point scale where 1
represents the most free.
The figures in Appendix 2 provide pair wise correlations which show that all institution
variables are highly correlated to income. The figures confirm the expectation that increases
in institutional quality are associated with higher levels of income. Note that higher values
for Auto, Pr and Cl are associated with lower institutional quality. Therefore, the negative
slope in figures 10 through 12 is exactly what could have been expected.
3.2.2. World Bank Doing Business
The WBDB database provides data on 175 economies. The aim of the database is to
make available "objective measures of business regulations and their enforcement. [ ... ] They
indicate the regulatory costs of business and can be used to analyze specific regulations that
enhance or constrain investment, productivity, and growth." (WE, 2006:
www.doingbusiness.org).
Busse et al. (2005) are right to claim that this data is an attempt to bypass the subjectivity
of many of the other measures of institutions. Because the "principal data collection
methods for the indicators are the study of the existing laws and regulations in each
economy; targeted interviews with regulators or private sector professionals in each topic;
and cooperative arrangements with other departments of the World Bank, other donor
3 Where autocracy scores take on negative values. Polity Score thus typically ranges from -10 to 10, unless the country has been in crisis. For details, see http://www.cidcm.umd.edu/polity/
17

agencies, private consulting firms, business and law associations" (idem), the data provide
relatively impartial information.
Box 2: The 10 WBDB indicators
Indicator
Starting a Business
Protecting Investors
Hiring and Firing Workers
Trading across Borders
Pqying Taxes
Getting Credit
E1fforcing Contracts
Closing a Business
Dealing with Licenses
RBgisteringpropertJ
Meaning
Captures the procedures and costs of setting up a business,
Measures the strength of minority stakeholder protection against
directors' misuse of corporate assets for personal gain" (Busse et al.,
2005: 25).
Captures the regulations on the labour market
Measures the number of documents and signatures and time
required to import and export
Measures the effective tax paid in the second year of operation
Is an index measuring the ease of borrowing and lending money
Measures the number of judicial procedures and the duration and
cost of enforcing contracts
Captures the procedures and costs of setting up a business
Captures the procedures and time and costs for a business to build a
warehouse
Captures the procedures, time and costs to transfer a property title
from the seller to the buyer
It is interesting to see that the 'Regulation Index! Busse et al. (2005) construct is highly
correlated to income, whereas the individual subcomponent are less so, especially 'Hiring and
Firing Workers'. 1ms might offer some additional backbone for our argument that it is better
to use dis aggregated measures of doing business, because they seem to capture distinct
information, rather than one aggregated regulation index.
The 'Regulation Index! is constructed by standardising4 in total 55 variables, each of which
falls under one of 10 subcomponents, as summarised in Box 2. Busse et al. create one
indicator for the subcomponents, which is an average of the variables that fall under it. For
example, the variable 'Dealing with Licenses' is an unweighted average of the number of
4 That is, they construct the standardized variable, X, by taking the distance of observation XI from the mean
X. Thus: Xi = (X; -X)
18

procedures, the time in days and the cost as percentage of per capita income it takes to deal
with licences. With nine of these ten standardised averages, Busse et al. the construct the
aggregated 'Regulation Index, which is a weighted average of the subcomponents taking factor
loadings in principal components analysis as weights. The value of this statistical technique is
questionable, as weights are assigned to a variable on the basis of an analysis of how much
variability that variable explains. It makes is very hard to interpret the variable.
Although it is understandable why the authors choose to aggregate the data in light of
the statistical difficulties of finding a proper instrument, it does not provide a very sensible
and understandable outcome. Especially for policy ends, the aggregation of the measures
does not make things much clearer than the already existing measures of institutional quality.
Rather, this paper will adopt those measures that are least correlated with one another
and thus provide information on different aspects of doing business. Below, the correlation
matrix of the standardised unweighted averages of each of the subcomponents is shown5•
Table 1: WBDB - Correlation Matrix
SaB DWL HFW RP GC PI PT TaB EC CaB
Starting a Business 1
Dealing with Licenses 0.37 1
Hiring & Firing Workers 0.38 0.44 1
Registering Property 0.38 0.43 0.28 1
Getting Credit 0.37 0.28 0.16 0.37 1
Protecting Investors 0.33 0.23 0.31 0.17 0.43 1
Paying Taxes 0.38 0.38 0.45 0.31 0.18 0.24 1
Trading across Borders 0.45 0.45 0.22 0.44 0.53 0.30 0.26 1
Enforing Contracts 0.46 0.28 0.20 0.25 0.45 0.26 0.30 0.45 1
Closing a Business 0.48 0.21 0.15 0.23 0.57 0.41 0.26 0.52 0.61 1
Source: World Bank Doing Business database (2005)
As can be seen, the 'Trading across Borderi variable is most correlated with almost all the
other variables. This makes sense, because only if all the conditions of doing business are
right, and the chance of being successful is thus larger, will a business be able to import and
export.
5 For example, the subcomponent 'Dealing with Licenses' is an unweighted average of the number of procedures, the time in days and the cost as percentage of per capita income it takes to deal with licences.
19

Next, there seem to be two sets of variables that capture different information. On the
one hand, 'Starting a Businesl, 'Enforcing Contracts', 'Getting Credit", 'Protecting Investor! and
'Closing a Business' all show up on each other's lists of relatively high correlations6• These seem
to explain the underlying qualifications necessary to be able to get the business off the
ground, or the necessary preconditions. On the other hand, the variables 'Dealing with
licenses', 'PCf)'ing Taxes' and 'Hiring and Firing Workers' seem to capture the daily handlings of a
company. These represent the ease of actually running the business, once it is established.
These three sets of variables thus seem to capture different parts of doing business. This
paper will choose one variable out of the subgroups to 'represent' the group besides 'Trading
across Borders'. Of the first group, 'Getting Credit' is least correlated with the variables in the
second group. It also seems an appropriate variable to summarise information from the first
group, as getting credit is an indispensable part of starting up a business and as Rodrik
(2006) argues vital to economic growth. In the second group, 'Hiring and Firing Workers' is
least correlated with the variables of the first group.
3.2.3. Categorizing institutions
The novelty of this paper lies in its critique of the debate it addresses, and the proposed
divergence from it. This critique is quite simple. If institutions are defined as 'rules of the
game', isn't it obvious that they be important for the 'game'? Almost all studies so far have
aggregated all types of institutions under one measurement. This is done for statistical
purposes, the lack of data and problems of endogeneity being the main reasons.
Researchers typically work with for example 'rule of law' or 'expropriation risk' to
capture institutional quality within a country. There is one major objections with this
reasoning, which also make questionable the conclusions and policy implications.
Using an aggregate measure for institutions is not very illuminating. An aggregate
measure does not allow policy makers to discern which of the proxies for the several
institutions subsumed in an aggregate measure have an impact on outcomes. There are many
different types of institutions that work differently in different parts of the world. It would
be naive to say that institutions affect countries in similar ways in different regions, with
different conditions and circumstances.
6 Correlations are not particularly high, but because of statistical constraints it is impossible to include all of the variables in one regression. By checking correlations, an informed choice as to which variable capture which information is made.
20

Some institutions may be important for income levels, some may not. Political
institutions in China would not be regarded of high quality by international standards, yet its
economy experiences unprecedented growth. Freedom of press could be a very important
social institution, but may not affect economic indicators as much as would the security of
property rights. Therefore, it is useful to distinguish between types of institutions.
Furthermore, in a number of papers (AJR, 2001, RST, 2002, Busse et al., 2005, Fielding
and Torres, 2006) that study the effect of institutions, the authors do no include measures of
human and physical capital. This is justified on the basis of the argument that the search is
for deep determinants of growth. However, leaving human and physical capital out of a
growth equation might lead to an omitted variable bias and exaggerate the effect of
institutions.
This paper distinguishes between four types of institutions. Like in AJR (2004), a
distinction is made between political institutions and economic institutions. However, the
paper goes a step further. Like Mamoon (2006) does for his empirical analysis of the
interaction of institutions with inequality, four different types of institutions are identified: 1)
Economic, 2) Political, 3) Legal and 4) Social.
''Economic institutions include state effectiveness at collecting taxes or other forms of government revenue,
states' ability to create, deliver and maintain vital national infrastructure, states' ability to respond effectivelY
to domestic economic problems, independence of government economic policies from pressure from special
interest groups, trade and foreign exchange -FYstem, competition poliry, privatization, banking reform and
interest rate liberalisation, securities market and non-bank financial institutions etc." (Mamoon, 2006: 5).
"Legal institutions capture the transparenry and fairness of legal -FYstem, political rights of the citizens, State
legitimary, freedom of speech, independence ofjlldiciary, enforceability of contracts, police effectiveness, access to
independent and impartial cOllrts, c01ifidence in jtldicial -FYstem in ensuring property rights, prevention of
improper practices in public sphere, control of corruption etc. Political institutions represent political stability,
democrary, autocrary or dictatorship" (Idem).
For social institutions, this paper deviates from Mamoon (2006). In his work, social
institutions capture socio economic conditions such as health, education and nutrition etc.
and human capital is used as a proxy. But in this debate it would not make sense to define
human capital as a social institution, because they are outcome variables. If institutions are
21

defined as rules of the game then be careful to use those measures of institutions which
actually capture a nonn or a rule. Rather, freedom of press is forwarded as a social institution
and included as a dummy variable. Also, the paper forwards proxies for gender equality,
which in itself is an outcome variable too. Therefore, a dummy variable (gender) is included to
capture the nonn or institution 'women are expected to work'. This variable is based on
infonnation on the extent to which women enrol in education, how much access they have
to health care and preventive measures, and to what extent they participate in the labour
force. See the variable definitions on how exactly gender is constructed. Human capital does,
however, enter the equation as before.
This paper will follow the classification Mamoon (2006) makes to a certain extent and
will use the Kaufmann et al. (2002) data on governance to proxy for the different types of
institutions.
Economic institutions will be approximated by 'Government Efftctivenesl (Ge) and
'Regulatory Quality' (Rg). Also, the 'Regulation Index will be used as a proxy for economic
institutions. The aggregation of this "wealth of infonnation" (Busse et al. 2005: 23) from the
WB data means a loss of the data's value. This paper will thus use the dis aggregated
measures 'Hiring and Firing Worker! (HjW) and 'Trading across Border! (TaB) and will argue that
this is of more value to policymakers than the index.
For political institutions 'Political Stability' (Ps) seems the appropriate proxy,
complemented by two political indicators from the Polity dataset, namely 'Democrary Score'
(Demo) and 'Autocrary Score' (Auto) and their aggregation 'Polity Score' (Po~. But also the
variables 'Political Rightl (pr) and 'Civil Libertiel (C~ from Freedom House (2005) could be
used. 'Getting Credit (Gc) , 'Rule of Lml (~, 'Voice and Accountability' (Va) and ,'Control of
Corruption' (Cc) are used as legal institutions.
For social institutions, the self constructed dummy variable indicating whether there is
the nonn that women are expected to work (Gender; enters the equation, and 'Freedom ofPresl
(Fpress) is used as well. One might not expect an institution like freedom of press to have an
. enonnous impact on economic perfonnance. China is a good example of a country that
lacks freedom of press, but where it does not fonn a constraint to economic development.
Let's see if this can be generalised.
22

3.2.4. Institutional representatives: two options
Since it is statistically impossible to include all measures of institutions in one regression,
a selection of institutions has to be made. To see which variable will represent the categories,
the objective is to find the least correlated institutional variables. Variables in the 'economic
institutions' group that are highly correlated to institutional variables in other groups would
not make good candidates to 'represent' the group.
Appendix 3 shows the correlation matrix for all the institutions. Note that the
institutions are grouped according to category. From this information, it can be seen that of
the economic institutions 'HjW is least correlated to any of the variables from the other
categories. For the political institutions, 'Pr is least correlated to the others, 'Xcons80' for the
legal institutions and 'Gender for the social institutions. This paper will adopt these four
variables as representatives for the four types of institutions in the regressions.
Besides these four variables, the set of which we will label option 'A', another set of
variables will be considered. This option 'B' will be based pardy on logical and partly on
statistical reasoning. First, Rodrik (2006) argues that a lack of access to credit is often one of
the binding constraints to economic growth. Therefore, 'Getting Credit' will represent the
legal institutions. 'Gender will be replaced by 'Fpresl as well to test a different aspect of the
social institutions. Finally, 'Ge' for economic institutions and cPs' for political institutions will
enter the specification because these variables capture a very broad set of norms 7 and can
therefore be expected to have the strongest influence on income levels or growth. That is
they are expected to be significant in most of the cases. It should be noted that this choice is
arbitrary, but therefore not less meaningful.
3.2.5. Trade
Conventionally, the measure for trade is 'imports and exports over GDP'. This measure
has been criticised on two fronts. Firstly, by Alcala and Ciccone (AC, 2001) who state that
"the measure of international trade used in almost all empirical work on the effect of trade
on productivity is nominal imports plus exports relative to nominal GDP, usually referred to
as openness. [fhey] argue that there are sound theoretical reasons why this measure may result
in a misleading picture of the productivity gains due to trade" (AC 2001: 1). Rather, they
7 Which does not help their interpretation. This again shows the limitations of the current data on institutions.
23

propose the lnopen variable, 'imports and exports over purchasing power parity GDP', which
they call a measure of 'real openness'. AC note that the conventional openness indicator
(!copen) is not robust to the inclusion of 'distance from the equator', whereas the real
openness (lnopen) is.
However, as RST (2002) argue, this measure of openness is much more correlated with
income. Therefore, they "do not find the case for 'real openness' particularly compelling.
[They] worry that the 'more robust' results that AC claim. for it derive from the interaction of
strong reverse causality with imperfections of the instrument" (RST 2002:16-17). This paper
will adopt the conventional measure of openness (!copen) and will neglect the (lnopen) variable.
Second, Rose (2002) and Mamoon and Murshed (2005) argue that "the [ ... ] openness
measures show a weak relationship with income. This is expected because openness
measures capture overall trade in a country. This makes them weak proxies for trade policies
as differences in trade shares across countries can have many exogenous reasons along with
income itself, such as geography and trade policies" (MM 2005:8).
Although the criticism made by Rose (2002) and Mamoon and Murshed (2005) is valid,
the focus of this paper is not on trade in particular and including measures of trade policy
will considerably enlarge the scope of this paper. Therefore, the trade openness versus trade
policy debate will not be addressed in this paper, and the conventional measure of trade
openness will be employed.
24

3.3. Methodology
3.3.1. Baseline Regression
To assess which institutions determine economic growth, the paper departs from the
baseline ordinary least squares (OLS) regression:
(1) lnY2oo3' -In Y1975j = ao + a1X, + a2Institutionj + a3Hinitj + a4Kinit, + aicopenj + aicopenj * Re gionalDummy j + r j Re gionalDummy j +8,
where Yi is PPP GDP per capita in a specified year. X j are variables capturing country
size, access to a sea, population and distance from the equator as control variables and
Institutionj is the variable capturing institutional quality. Hinit; is initial year human capital as
captured by the average years of schooling in the population over age 2S in 1975, Kinitj is
initial year physical capital as captured by gross fixed investment as percentage of GDP in
1975. Lcopenjis our measure for trade openness.
From the baseline regression, this paper will compare level regressions with average
growth regressions. Note that the paper follows Glaeser et al. (2004) in the choice of
dependent variable. Whereas the majority of the literature investigates the interactions of
institutions with the level of income, the dependent variable here is average growth over the
1975-2003 period. As Rodrik (2006) notes, the literature finds strong results for level
regressions, but the link between institutions and economic growth is much weaker. By
changing the dependent variable to GDP per capita in 2003 (purchasing power parity) this
can be verified.
Also, in AJR (2002), RST (2002) and Busse et al. (2005) human capital does not enter the
specification, whereas in Glaser et al. (2004) it does. It seems completely inappropriate to try
to explain income or growth without accounting for both human and physical capital. The
paper will see how the results change when the capitals are included.
3.3.2. Instruments
The common approach is to use one aggregated measure of institutions and to perform
a two-stage least squares analysis. Namely, the endogeneity problem demands from the
authors some' statistical creativity. Instrumental variables (IV) must be found for both
institutions and trade to avoid biased estimators.
25

For trade openness (!copen) the literature has established that the most appropriate IV is
the predicted trade shares (Fittrade), as introduced by FR (1999). They identify the effects of
trade on income levels using the geographical component of trade volumes as an instrument.
Rodriguez and Rodrik (RR, 1999) contest this Fittrade variable, cautioning that the "results
cannot be direcdy applied to the effects of trade policies" (RR, 1999: 3). Also, FR do not
really explain why it is necessary to create a fitted variable as an instrument, instead of using
the geography indicators direcdy. However, Frankel and Rose (2001) argue that the Fittrade
has generally been well accepted. Despite being critical towards it, this paper's aim is not to
question or test the usefulness of Fittrade as an instrument and will therefore adopt it.
For institutions the IVs are relatively more contested. The IV introduced by AJR, the
settler mortality rate (SMR), has been widely applied. However, the dataset of 64
observations then becomes relatively small. RST (2004) extend the sample to 80
observations, but some authors have preferred to use the 'fraction of the population
speaking English (Engfrae) and Western European languages (Eurfrae) as the first language'
(Rodrik et al., 2004), which provides them with a larger data set of 140. Also, the legal origin
(Lcgor) of countries can be used as IV. This paper will initially use Eng/rae and Eurfrae and
legal origin, but later incorporate the SMR as well.
3.3.3. Level versus growth
The first step is thus to compare level regressions with average growth regressions. That
is, we compare the following two regressions, which are reduced forms of (1):
(2) InY2003/ -lnYI97s/ =ao +aIX/ +a2Institution/ +aslcopen/ +
a 6lcopen/ * RegionalDummYj +rj RegionalDummYj +8/
(3) InY2003/ = 130 + f31X/ + 132 Institution/ + f33lcopen/ +
f34lcopen/ * Re gionalDummy j + r j Re gionalDummy j + 8/
In equation (2) and (3), Institution; is replaced by the whole range of institutional quality
indicators one at a time. This is the simplest possible way to assess which type of institution
is most important to economic performance. That is, using 2SLS, estimating the effect of the
respective types of institutions one after the other. The second stage regressions would look
as follows:
26

(4)
(5)
Institution/ = Ali + (Ax; + VI Engfrac/ +-91Eurfrac/ +(ALegor/ + f11Fittrade; +
fjJl Fittrade / * Re gionalDummy j + rlj Re gionalDummy j + 8/
Institution/ = Ali + (AX/ + VI Engfrac; + -91Eurfrac/ + (ALego~ + f11Fittrade; +
fjJl Fittrade; * Re gionalDummy j + rl j Re gionalDummy j + 8/
3.3.4. Adding capitals
Theoretically and empirically, it seems inappropriate to run a model explaining income
levels or growth without accounting for human and physical capital. The next step is thus to
incorporate these capitals, and perform IV analysis on equation (1). Thus, Hinit; and Kinit;
enter the equation. Hini~ is the initial level of human capital as measured by the schooling
years in the total population at 25 or over in 1975, and Kinit; is the initial level of physical
capital as measured by the gross fixed investment over GDP in 1975. The second stage
regressions look the same as equation (4) and (5), only now including these two variables.
Although not completely absent, the endogeneity problem for initial year human capital
and physical capital does not pose serious problems and Durbin-Wu Hausman tests confirm
this. Human capital in 1975 is not directly endogenous to a country's income level in 2003,
but might be through some unobserved factor, like a country's mentality or working spirit.
In any case, the specification suffers from endogeneity, and the statistical techniques are only
imperfect ways of dealing with this. Despite this imperfection, it would be interesting to see
how the incorporation of human and physical capital affects the Institution; coefficient, (32'
3.3.5. Instrumental juggling
However, so far we have not deviated from the critique that all institutions are
aggregated under one measure. Therefore, to start analysing which institutions are important,
the paper sets off to establish correlations. Whereas 2SLS is used to avoid biased estimators,
it is hard to find good and theoretically sound IV s for institutions. But OLS can be used to
establish correlation. The coefficients themselves should not be devoted too much attention,
but their sign and relative size give useful insights in understanding our question. The OLS
specification looks as follows:
(6) lnY2003; -lnYI97s; = 130 + f31X; + f32LegalI, + f33PoliticalI; + 134 EconomicI; + f3sSocialI/ + f36Hinit/ + f37lcopen; + f3glcopen; * Re gionalDummy/ + y/ Re gionalDummy; + 8/
27

where the dependent variable is also changed to lnY2003i to compare with level regressions.
But we could go one step further. So far we have seen several instruments for
institutions. They have been debated and are controversial at best. But it is all we have and
they are most widely adopted. Therefore, we can use the SMR, the Engfrac and Euifrac, and
the legal origin variables as instruments for institutions. The second stage regressions will
comprise of (5), and the following:
(7) LegalIj =-1.3j +ifJ3Xj +If/tSMRj +v3Engfracj +!}.3Eurjracj +ifJ3Legolj +
f-l3Fittradej + fP3Fittrade/ * Re gionalDummy j + Y3j Re gionalDummy j + 8 j
(8) Political!, = A4j + ifJ4 X j + If/ 2SMR/ + V 4 Engfrac, + !}.4Eurjracj + ifJ4Legor/ +
f-l4Fittrade/ +fP4Fittradej *RegionalDummYj + Y4j RegionalDummYj + 8 j
(9) Economic!, =-1.Sj +ifJsXj +1f/3SMR/ +vsEngfracj +!}.sEurfracl +ifJsLegolj +
f-lsFittradel +fPsFittradej * RegionalDummYj +YSj RegionalDummYj +8 j
(10) SocialI, =-1.6j +ifJ6X/ +1f/4SMR/ +v6Engfrac/ +!}.6Eurfracj +ifJ6Legolj +
f-l6Fittrade; +fP6Fittrade; * RegionalDummYj +Y6j RegionalDummYj +8;
This specification is statistically possible to execute, namely there are four sets of
institutions and there are four instruments. However, it is crucial to note that the results
must be approached with caution. The specification is plagued with endogeneity problems
and the instruments used for these regressions are contested, or can be theoretically
questioned. Nevertheless, the results may help shed some light on what this paper believes
to be the more important question of which institutions are important for economic
development.
3.3.6. Panel Data
Due to a lack of data, most research has been confined to cross section analysis to
answer the question whether institutions are important for economic growth or income
levels. But every researcher in this field has been plagued by the problems of endogeneity
and a limited amount of countries for which observations are available.
Therefore, panel data is a logical step to take, as it can be used to bypass this problem.
As Verbeek (2000) mentions, "the availability of repeated observations on the same units
28

allows economists to specify and estimate much more complicated and more realistic models
than a single cross section [ ... ] would do" (Verbeek 2000: 309). The specification looks as
follows:
Where 1Jj is the country specific effect. As a dependent variable, average growth rates
over seven consecutive 5-year periods are taken in the period 1970-20038• Similarly, for
institutional quality averages of the Polity IV's 'PolIty Score' and of the Fraser Institute's
Economic Freedom of the World index ('if wind ex) are constructed for these five year
periods. For trade openness,S year averages are created for the log of imports and exports
over GDP. The specification furthermore includes initial year human capital (H197oJ and
initial year physical capital as the gross fixed capital formation as percentage of GDP (K197oJ
in 1970.
The approach will be as follows. First, a pooled OLS with regional dummies will be
analysed. Then the paper will follow the literature (Dawson (1998), Durlauf et al. (2004)
Lewer and Saenz (2005), Busse et al. (2005» by differencing equation (12) to take out the
country specific effects. Theoretically it has been argued that using random effects (RE) is
not appealing for cross-country panel data, as "standard random effects estimators require
that the individual effects [1JJ are distributed independendy of the explanatory variables, and
this requirement is clearly violated for a dynamic panel such as [(12)] by construction, given
the dependence oflogYr;, on [1JJ" (Durlauf et al., 2004: 105). Nevertheless, this paper will let
the data speak, and conduct a Hausman test to assess whether RE or fixed effects (FE)
estimators are most appropriate.
Using FE, specification (12) is differenced to eliminate the country specific effect:
(12) 11 log Y1,1 = (1 + fJ)lllog Y;,t-l + M1/p + 8;,1 - 8;,/_1
However, Durlauf et al. (2004) and the many authors they cite argue that there are
serious limitations to the application and interpretation of FE estimation for cross-country
B Note, the last '5-year' period is actually only 3 years, since data is generally not (yet) available for 2004 and 2005.
29

panel data. Firsdy, the institutional variables are static over time and may thus be treated as a
fixed effect. Second, the FE estimator ignores the between-country variation, which comes
at the expense of higher standard errors. Therefore, this paper will also touch upon the
debate of generalised method of moments (GMM) estimation.
The paper will follow Arellano and Bond (AB 1998), Bond, Hoeffler and Temple (BHT
2001) and Durlauf, Johnson and Temple (DJT 2004), who show this to be the most
appropriate type of analysis.
First-differenced Gl\tfM (or the Arellano-Bond method) uses lagged levels to instrument
for the first differences. This method was proposed by AB (1998). However, BHT show that
lagged levels do not make perfect instruments for the first differences, particularly because
the explanatory variables may be highly enduring which is the case for institutional variables.
Therefore BHT propose a system Gl\tfM which adds a component to the regressions in
which the levels are instrumented by the differences. Blundell and Bond (1998) provide
"some evidence that this estimator is more robust than the Arellano-Bond method in the
presence of highly persistent series" (Durlauf et al., 2004:111). This paper shordy touches on
all methods, but due to limitations of time, will not go into too much detail.
30

The obsession with comprehensive institutional reform leads to a polif} agenda
that is hopelesslY ambitious and virtuouslY impossible to fulfil.
Danny Rodrik (2006:13)
Chapter 4 - Which institutions determine growth?
In this section the results of the statistical analysis are presented and interpreted.
Although the analysis comprised an array of regressions, some of which are reported in the
annexes, this section will confine itself to the main findings. As shown in Appendix 49, the
exploratory baseline regressions suggest a significant and positive effect of institutions on the
level and growth of income. This is true even after controlling for human and physical
capital.
However, the analysis will show that the income-institution nexus is not very clear once
human and physical capital are controlled for and that there is some evidence for institutions
being important through human capital accumulation. Also, dis aggregating the data turns out
to be a sensible and value added process for the understanding of the result. However, it
proves difficult to establish which institutions directly determine for growth, despite some
useful insights, especially from the baseline regressions.
4.1. Institutions
Departing from the baseline regressions, the next step is to deal with the endogeneity
problem10 and perform instrumental variable analysis. The results are presented below and
are divided into three main subjects. First, institutions interact differently with income level
and average growth. Second, the World Bank. data is analysed and the Regulation Index
dis aggregated. Third, the discussion focuses on which institutions are important.
4.1.1. Level and Growth
Estimating equation (1) and (2), it is remarkable that the conclusion that institutions are
important depends heavily on the choice of dependent variable. Rodrik (2006) argues that
there are generally strong results for institutional quality and its effect on income level. In the
bivariate exploratory regressions, these findings are confirmed.
9 Only the results for the regressions that include human and physical capital are included due to limitations of space. When human and physical capital are excluded, the coefficients are larger and more significant. 10 Durbin-Wu-Hausman (DWH) tests confirm that there is a problem of endogeneity and that OLS coefficients will be biased.
31

Table 2: Exploratory Regressions: Institutions without controlling for capital
(1) (2) (3) (4)
OLS - Level OLS - Growth IV - Level IV - Growth
Economic Institutions Government Effictiveness 0.648** 0.334** 0.793** 0.217
[0.088] [0.078] [0.209] [0.158]
Regulatory Quality 0.575** 0.461** 1.066** 0.398* [0.097] [0.070] [0.298] [0.181]
Regulation Index (Busse) 0.134** 0.077** 0.138** 0.070+ [0.025] [0.021] [0.046] [0.037]
Hiring and Firing Workers 0.155+ 0.053 0.194 0.196 [0.085] [0.067] [0.183] [0.127]
Trading Across Borders 0.305** 0.194* 0.600* 0.289 [0.097] [0.075] [0.285] [0.196]
Political Institutions Political Stability 0.482** 0.268** 0.921** 0.259
[0.093] [0.076] [0.302] [0.188]
Democrary Score 0.125** 0.041+ 0.160** 0.043 [0.026] [0.022] [0.044] [0.036]
Autocrary Score -0.106** -0.054* -0.203** -0.066 [0.034] [0.026] [0.065] [0.048]
Polity Score 0.062** 0.024* 0.090** 0.027 [0.015] [0.012] [0.026] [0.021]
Political Rights -0.167** -0.091* -0.583* -0.186 [0.047] [0.035] [0.226] [0.117]
Civil Liberty -0.206** -0.151** -0.588** -0.240+ [0.059] [0.042] [0.211] [0.123]
Legal Institutions Getting Credit 0.472** 0.285** 0.728** 0.188
[0.081] [0.068] [0.221] [0.165]
Rule oJuw 0.692** 0.322** 0.880** 0.248+ [0.082] [0.076] [0.172] [0.146]
Voice andAccountability 0.552** 0.248** 1.142** 0.336 [0.095] [0.080] [0.319] [0.211]
Control oj Corruption 0.569** 0.271** 0.639** 0.163 [0.086] [0.076] [0.187] [0.143]
Constraints on the Executive 0.130** 0.029 0.233** 0.098+ [0.037] [0.030] [0.072] [0.058]
Social Institutions
Freedom oJPress 0.693** 0.325* 1.520** 0.508+ [0.178] [0.136] [0.439] [0.304]
Women Expected to Work 0.606** 0.493** 1.489** 0.652+ [0.167] [0.119] [0.548] [0.345]
Standard errors in brackets,+ significant at 10%; * significant at 5%; ** significant at 1% 32

First of all, since there are more instruments (Legal origin, Engfrac and Euifrac) than
instrumented variables, Hansen-Sargan overidentification tests can be prefonned to test the
instruments. These show that the instrumental variables have the desired statistical
properties.11 The first stage regressions also show that all the instruments used are technically
viable, whenever the institutional variable is significant. In case it isn't, the instruments are
typically not significant in the first stage regressions.
As can be seen in column (3) of table 2, 17 out of the 18 institutions are significant when
human and physical capital do not enter the equation. The coefficients are quite robust
compared to the OLS regressions when institutions and openness are instrumented for. If
anything, the coefficients increase. These are the results that a typical paper of the recent
literature on the interaction between institutions and income uses to stress the important
role played by institutions.
However, the results for the regressions with average growth over the 1975-2003 period
as dependent variable show completely different results. The results shown in column (4) are
quite weak indeed. Only 7 out of the 18 institutions variables are significant. The coefficients
of the significant results are similar to the OLS coefficients. Of th~ variables that are
significant, it is somewhat surprising to see that the two social institutions are significant at
the 10% leveL Apparendy, freedom of press is important, which would underscore the
philosophy that a free media translates to a greater control of corruption and finally to a
more efficient use of resources. The nonn that women should work also has a significandy
positive effect on average growth.
4.1.2. WB: index or disaggregate?
The results do not differ gready for the WBDB data. One of the critiques of the
approach taken by Busse et al. (2005) is on the 'Regulation IndeX' they create. This index is
produced by assigning weights on the basis of a statistical technique (principle components
analysis), but all this technique does is establish where most of the variation comes from and
assign the biggest weight to that variable. It is not easily interpreted. Why Busse et al. do not
use the individual subcomponents of their index, arguably much more practical, is not
obvious.
11 The Hansen Sru:gan x2-statistics and their p-valus ru:e not reported, due to limitations of space, but can be obtained on request.
33
But more severe is that they compile a mass of information and create an indicator of
institutional quality and the result hardly translates into useful policy advice. Appendix 5
shows the results for both level and growth regressions for this regulation index, but also for
a self-constructed unweighted index (.Ret-KI/) and more sensibly, for the ten subcomponents
of these indices12•
It is interesting that the simpler index, which gives equal weights to all the
subcomponents, gives very similar results. This unweighted average is significant whenever
the Regulation index by Busse et al. is, albeit less so, and has a larger coefficient.
Also, the results for the subcomponents provide a strong argument to dis aggregate the
'.Regulation Inde:K made by Busse et al. (2005). Busse et al. scrutinize level regressions without
controlling for capital. In the level regressions, several of the subcomponents are significant,
although not all. The variables 'Getting Credit, 'Trading across Borders', 'Etiforcing Contracts' and
'Closing a Business' are all significant at the 5 % level and 'Deallng with Licences' is at the 10%
level. Their coefficients range from 0.528 to 0.802, which is considerably larger than the
0.138 for the '.Regulation Index' proposed by Busse. Logically, the unweighted index's
coefficient lies much closer to these coefficients at 0.691. The other subcomponents are not
significant.
For growth, only the indices and 'Protecting Investors' are significant, but only at the 10%
level. As mentioned before, institutions are hardly significant for average growth and from
these results it is hard to strong establish a link between the WBDB indicators, the thereof
derived regulation indices and growth.
All in all, the value added of constructing an index on the basis of principle components
is not straightforward to see. Instead, using the individual subcomponents of this index
shows that different aspects of doing busilless in countries affect a country's income in
different ways. Some aspects of doing business are important for income levels than others,
and maybe deserve more attention from policy makers. An index will not show this.
12 The exploratory OLS regressions are not reported due to limitations of space. They can be obtained on request.
34

4.2. Institutional circus
So far, the paper has employed one institution at a time. In this section, the results of the
attempt to combine the four categories of institutions in equation (6) are presented.
Unfortunately, it is not possible for statistical reasons to employ all the institutions at the
same time. Already, the pl:Oposed methodology pl:Oves a high demand on the data.
Therefore, it turns out to be difficult to answer the question of which institutions determine
growth.
4.2.1. The two options
There are two different sets of institutions that are used, presented in Table 3. The first
option, option 'A', is based on the correlation between the institutional variables and
includes 'Hiring and Firing Workers' as a representative for economic institutions, 'Political
Right.1 for political institutions, 'Constraints on the Executive in 1980' for legal institutions, and
'Women are Expected to Work' for social institutions. These four institutions variables are least
correlated to all the other institutions variables, as is explained in Chapter 3.
Option 'B' is a slightly more arbitrary combination of institutions, and consists of
'Government Effectiveness', 'Political Stability', which capture a very bl:Oad range of information
and are therefore significant in most cases, 'Get.ting Credit, to test Rodrik's (2006) claim to
that access to credit is often a determinant factor of economic growth and 'Freedom qf Press',
which captures a different aspect of social norms.
Table 3: Two options of institutional combinations
A B
Economic Institution Hiring and Firing Workers Government Effectiveness
Political Institution Political Rights Political Stability
Legal Institution Constraints on the Executive Get.ting Credit
Social Institution Women Expected to Work Freedom qfPress
35

4.2.2. Tricky outcomes
Below in Table 4, the incidence and level of significance are shown for the three options.
Note that the main conclusion is that the analysis most probably suffers too much from the
high correlations between the institutions variables, and thus produces results that are not
viable. In all honesty, the IV coefficients are probably not very mea·ningful.
However, the OLS regressions can be checked for correlation, although the size of the
coefficients should be approached with care. On the basis of the benchmark regressions,
some very cautious conclusions can be made. In option 'A', Hiring and Firing Workers is
never significant. The ease of hiring and firing workers in a country does not seem to have
an impact on the income level and/or growth averages. 'Political Rights' and 'Constraints on the
Executive' are both significant for the level rgeressions but not so for the growth regression.
What is remarkable is that the variable 'Women are Expected to Work' is significant for growth,
e'Ven after controlling for human and physical capital. Subsequently, whether women are
expected to work is important for income levels. Moreover, the OLS coefficients are quite
robust as compared to the bivariate exploratory regressions.
In option 'B', the most interesting finding is the 'Getting Credit variable, which is
significant yet again. This coefficient is robust as well. For the level regressions, the 'Getting
Credit' coefficient goes down from 0.472 to 0.220 after controlling for three extra
institutional variables, and stays significant at the 5% level.
For the growth regressions, the coefficient only declines from 0.285 to 0.182. In
addition, the results for this variable are robust to the inclusion of human and physical
capital, something which catches the attention since many of the institution variables lose
significance once the human and physical capital are controlled for.
Therefore, these results do seem to hint at the fact that access to credit is a very
important factor in determining economic development, maybe more so than the other
institutional variables. These results underscore Rodrik's (2006) claim that the access to
credit can be a very influential factor in the comparative growth record of countries.
36

Table 4: Including four institutions in the regression
Human and Physical Capital Human and Physical Capital excluded included
OLS- OLS- N- N- OLS- OLS- N- N-level growth level growth level growth level growth
Op"tionA:
Hiring and Firing Workers 0.103 0.061 -0.152 -0.165 0.063 0.062 -0.088 -0.069 [0.075] [0.065] [0.635] [0.540] [0.073] [0.069] [0.321] [0.263]
Political Rights -0.108* -0.051 0.181 0.215 -0.073 -0.052 0.083 0.116 [0.046] [0.040] [0.323] [0.275] [0.047] [0.044] [0.174] [0.142]
Constraints on the Executive 0.092* -0.023 0.206 0.045 0.058 -0.033 0.093 -0.070 [0.037] [0.032] [0.165] [0.140] [0.037] [0.035] [0.141] [0.115]
Women are Expected to Work 0.346* 0.479** 1.520 1.362 0.226 0.475** 0.738 0.654 [0.167] [0.145] [1.185] [1.007] [0.167] [0.157] [1.034] [0.847]
Human Capital 0.135* 0.013 0.267 0.273+ [0.053] [0.050] [0.194] [0.159]
Physical Capital 0.008 0.002 -0.018 -0.018 [0.009] [0.008] [0.031] [0.025]
Op"tionB:
Government Effectiveness 0.397** 0.202 -0.172 -0.536 0.255+ 0.272+ -0.163 -0.446 [0.129] [0.122] [0.632] [0.921] [0.134] [0.137] [0.497] [0.702]
Political Stability 0.080 0.016 0.353 1.080 0.094 -0.017 0.095 0.604 [0.110] [0.104] [0.666] [0.970] [0.107] [0.109] [0.378] [0.535]
Getting Credit 0.220* 0.182* 0.697+ 0.553 0.220** 0.185* 0.183 -0.035 [0.084] [0.079] [0.383] [0.558] [0.079] [0.080] [0.325] [0.459]
Freedom of Press 0.242 0.120 0.831 0.100 0.109 0.142 0.299 -0.354 [0.159] [0.150] [0.749] [1.091] [0.160] [0.163] [0.581] [0.822]
Human Capital 0.134** -0.010 0.277 0.345 [0.045] [0.045] [0.186] [0.264]
Physical Capital 0.007 0.008 -0.008 -0.034 [0.008] [0.008] [0.030] [0.042]
Standard errors in brackets,+ significant at 10%; * significant at 5%; ** significant at 1%
The 'Getting Credit'variable is made up of the followingl3: "a Legal Rights Index, which
measures the degree to which collateral and bankruptcy laws facilitate lending, a Credit
Information Index, which measures rules affecting the scope, access, and quality of credit
information, public credit registry coverage, and private credit bureau coverage" (WB 2006:
website).
13 From http://www.doingbusiness.org/
37

This provides relatively useful information. Remarkable, and ironic in my view, is that
this is one of the least straightforward subcomponents of the WBDB dataset in<;licators.
Whereas the other subcomponents deal with information like 'time spent in days',
'percentage of GDP per capita spent' etc., arguably more straightforward to interpret, this
variable is made up of indices, which makes the information relatively less appealing.
Nevertheless, it is a sizeable step forward, because both 'Cetting Credit and 'Women are
Expected to Work' are very easily interpretable variables and translate to practical policy
advice.
4.3. Ranking institutions
On the basis of the regressions so far, a ranking of the institutions' importance can be
made. There are several ways to do this, but this paper will confine to two forms of ranking.
Fil:st, the number of times the variables in the different categories of institutions are
significant for the various regressions can give us an idea of which institutions are more
important. Second, for the K.aufinann data, the coefficients can be compared, because they
are measured on the same scale. This is unfortunately only true for the Kaufinann data and
excludes social institutions, because the data was grouped under the other three categories.
Table 5 below shows that social institutions are on average most often significant. This
could be a bit misleading because there are only two social institutions, 'Fpresf and 'Cendet'.
If the variable 'Constraints on the Executive' (Xcons80) would be excluded from the legal
institutions, this category would be more important according to this methodology (average
of 6.25). Nevertheless, it is very interesting indeed to see that the variables defined as social
institutions are significant so many times. Especially because they are less complicated
variables to interpret and better reflect an actual norm instead of an outcome than the other
measures of institutional quality.
Table 5: Ranking of Institutions
No. times No. of Si cant Variables Avera e RANKING
Economic Institutions 23 5 4.60 3
Political Institutions 26 6 4.33 4
Legal Institutions 28 5 5.60 2
Social Institutions 12 2 6.00 1
38
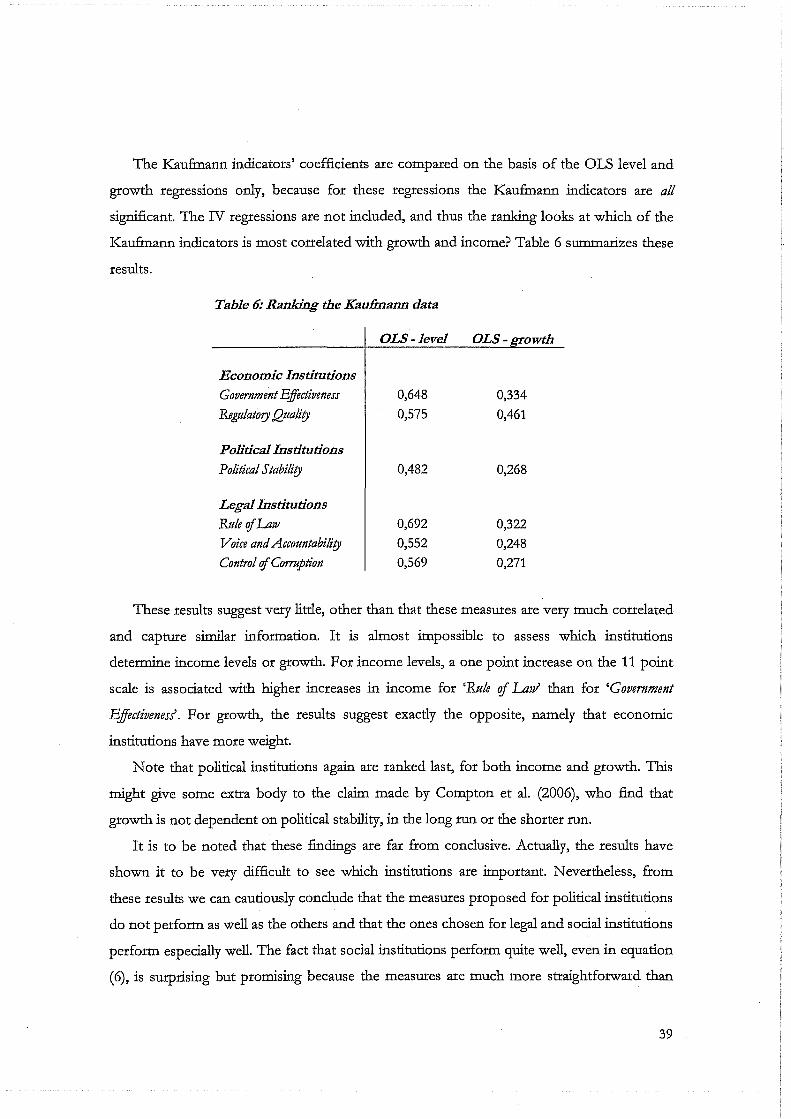
The Kaufmann indicators' coefficients are compared on the basis of the OLS level and
growth regressions only, because for these regressions the Kaufmann indicators are all
significant. The tv regressions are not included, and thus the ranking looks at which of the
Kaufmann indicators is most correlated with growth and income? Table 6 summarizes these
results.
Table 6: Ranking the Kaufmann data
Economic Institutions
Government Eifoctiveness
Regulatory Quality
Pvlitical Institutions
Political Stability
Legal Institutions
Rule of Law Voice and Accountability
Control of Corruption
OLS-level
0,648
0,575
0,482
0,692
0,552
0,569
OLS- vwth
0,334
0,461
0,268
0,322
0,248
0,271
These results suggest very little, other than that these measures are very much correlated
and capture similar information. It is almost impossible to assess which institutions
determine income levels or growth. For income levels, a one point increase on the 11 point
scale is associated with higher increases in income for 'Rule qf LanJ than for 'Government
Effictivenesl. For growth, the results suggest exactly the opposite, namely that economic
institutions have more weight.
Note that political institutions again are ranked last, for both income and growth. This
might give some extra body to the claim made by Compton et al. (2006), who find that
growth is not dependent on political stability, in the long run or the shorter run.
It is to be noted that these findings are far from conclusive. Actually, the results have
shown it to be very difficult to see which institutions are important. Nevertheless, from
these results we can cautiously conclude that the measures proposed for political institutions
do not perform as well as the others and that the ones chosen for legal and social institutions
perform especially well. The fact that social institutions perform quite well, even in equation
(6), is surprising but promising because the measures are much more straightforward than
39

the aggregated indices that capture a lot of similar information. A comforting conclusion is
that turning away from aggregations and focusing on more dis aggregated variables, like the
social institutions and WBDB subcomponents ('Getting Credit in particular), represents an
improvement in terms of policy understanding.
4.4. Human and physical capital
Now, it is interesting to see what happens if human and physical capital are included in
the regressions. Below, the results are presented that lead to an interesting finding, closely
related to the findings of Glaeser et al. (2004). It seems plausible that institutions may exert
an impact on income through their effect on the accumulation of physical and human capital
instead of on income of growth direcdy. Therefore, the interaction between institutions and
human and physical capital are examined here as well.
4.4.1. Capital controls
In Table 7, it can be seen that once human and physical capital are controlled for, the
significance as well as the size of the coefficients of the institutional variables decline. These
results suggest that institutions may not direcdy exert an impact on income but rather
through their effect on the accumulation of physical and human capital.
For the exploratory level regressions in column (3), now only 6 out of the 18 institutions
are significant. Note that three of these are legal institutions, all at the 5% level. Legal
institutions are consistendy important in the OLS and the IV-level regressions, whereas the
other categories seem to lose their importance once controls for human and physical capital
are included.
In most of the cases (11 out of 18), initial year human capital is significant. Physical
capital is never significant and thus of lillie importance in these specifications. From this,
one might argue that not institutions are so important, but human capital. The focus on
institutions is then important in that it provides a way to most effectively come about the
accumulation of capital, less so because of their direct impact on income.
For the growth regressions, none of the institutions is significant once human and
physical capital are controlled for. The results are very weak indeed and based on these
results the link. institutions-growth is difficult to make.
40

Table 7: Exploratory Regressions: Institutions while controlling for capital
(1) (2) (3) (4)
OLS - Level OLS - Growth N -Level N - Growth
Economic Institutions Government Effectiveness 0.478** 0.374** 0.652* 0.251
[0.098] [0.097] [0.290] [0.270]
Regulatory Quality 0.372** 0.476** 0.441 0.455
[0.094] [0.079] [0.324] [0.274]
Regulation Index (Busse) 0.082** 0.075** 0.03 0.062
[0.026] [0.025] [0.055] [0.052]
Hiring and Firing Workers 0.06 0.029 -0.062 0.128
[0.075] [0.072] [0.149] [0.143]
Trading Across Borders 0.135 0.176* 0.051 0.287
[0.091] [0.083] [0.323] [0.294]
Political Institutions Political Stability 0.328** 0.246** 0.576>1:' 0.147
[0.084] [0.082] [0.254] [0.235]
Democraf!j Score 0.059* 0.028 0.081 0.014
[0.029] [0.027] [0.055] [0.050]
Autocraf!j Score -0.041 -0.045 -0.087 -0.03
[0.032] [0.029] [0.071] [0.062]
Polity Score 0.027+ 0.019 0.043 0.011
[0.016] [0.014] [0.031] [0.028]
Political Rights -0.056 -0.074+ -0.309 -0.061
[0.045] [0.040] [0.192] [0.136]
Civil Uberty -0.07 -0.142** -0.383 -0.171
[0.057] [0.049] [0.254] [0.178]
Legal Institutions Getting Credit 0.355** 0.270** 0.471* 0.145
[0.071] [0.072] [0.202] [0.202]
Rule of Law 0.492** 0.326** 0.647* 0.135
[0.096] [0.096] [0.269] [0.272]
Voice andAccountability 0.338** 0.216* 0.587* -0.037
[0.099] [0.095] [0.291] [0.278]
Control of Cormption 0.368** 0.289** 0.276 0
[0.103] [0.099] [0.262] [0.263]
Constraints on the Executive 0.058 0.002 0.113 0.049
[0.035] [0.033] [0.079] [0.072]
Social Institutions
Freedom of Press 0.341+ 0.302+ 1.206* 0.42
[0.173] [0.159] [0.561] [0.445]
Women Expected to Work 0.205 0.418** 0.633 0.223
[0.158] [0.138] [0.856] [0.720]
Standard errors in brackets, + significant at 10%; * significant at 5%; ** significant at 1 % 41

4.4.2. So human capital after aD?
What is striking in all the regression is that controlling for the capitals decreases the
significance of the institutional variables so considerably. This gives the inkling that these
institutional variables may be working through allowing countries to build up human and
physical capital. It is appealing to investigate whether institutions. have a bearing on physical
and human capital. If so, institutions per se are not so important to economic development
but rather in their facilitative role allowing countries to build up physical and human capital.
Hence, they are important not directly but indirectly.
To test this claim, this paper explores the effect of the institutional variables on human
and physical capital. In Appendix 6, it can be verified that in the OLS regressions with
human capital as the dependent variable on institutions, openness, initial year human capital
and other control variables14 show a strong significance of institutions as determinants of the
level of human capital. These' results~ summarized in Table 8 below, suggest that institutions
are important for the accumulation of human capital. This is robust to the inclusion of initial
year physical capital as well.
However, institutions are insignificant in all specifications with physical capital as the
dependent variable. This could be explained by the fact that the accumulation of physical
capital, on its turn, works through the accumulated human capital. Investments will be made
by people who have the knowledge and the skills to do so in a sensible way. The regressions
of physical capital on institutions and human capital give some validity to this claim, as
human capital is generally significant.1s
Although the Durbin-Wu-Hausman tests showed that initial year human and physical
capital were exogenous and OLS estimates should thus provide unbiased estimates, a
possible critique on this approach is that the capitals are in fact endogenous. Therefore, the
paper also uses instrumental variables to instrument for institutions and trade openness. The
results are robust to this as well as to the inclusion of the 'other' capital.
14 The same variables as in the regressions with average growth or income as a dependent variable. 15 Due to limitations of space, and because it is not part of the central argument of this paper, the regressions with physical capital as the dependent variable are not reported. They can, however, be obtained upon request.
42

Table 8: Regressing human capital on institutions
(1) (2) (3) (4)
OLS IV OLS
Economic Institutions Legal Institutions
Government Effectiveness 1.057** 1.858** Getting Credit 0.296 1.472+ [0.228] [0.605] [0.217] [0.836]
Regulatory Quality 0.749** 2.866** Rule qfLaw 1.259** 2.132** [0.267] [1.071] [0.225] [0.568]
Regulation Index (Busse) 0.207** 0.356* Voice andAccountability 1.081 ** 1.823** [0.063] [0.147] [0.237] [0.628]
Hiring and Firing Workers 0.384* 0.791 Control oj Corruption 1.121** 1.604** [0.189] [0.526] [0.205] [0.511]
Trading Across Borders 0.634** 1.761* Constraints on the Executive 0.250** 0.442* [0.233] [0.849] [0.080] [0.180]
(5) (6) (7) (8)
OLS IV OLS IV
Political Institutions Social Institutions
Political Stability 0.526* 1.487+ Freedom ojPress 1.657** 3.608**
[0.225] [0.779] [0.416] [1.108]
Democrary Score 0.252** 0.300* Women Expected to Work 1.484** 4.944** . [0.061] [0.128] [0.375] [1.711]
Autocrary Score -0.218** -0.381*
[0.073] [0.171]
Polity Score 0.125** 0.170*
[0.034] [0.073]
Political Rights -0.424** -0.929**
[0.105] [0.348]
Civil Liberty -0.578** -1.267**
[0.126] [0.406]
Standard errors in brackets, + significant at 10%; * significant at 5%; ** significant at 1 %
In all cases, the results suggest that institutions are important for the accumulation of
human capital, except possibly for 'Getting Credit. The results for physical capital are also
very clear. Institutions in the way they are measured do not have a significant effect on
physical capital. Rather, there is some evidence that human capital is a stronger determinant
of physical capital accumulation. Care is asked for with these conclusions, but the results
lead us into a very interesting alley. Not ~stitutions are important for income and growth,
43

but human capital. Institutions have an indirect effect on growth, in that they can facilitate or
hamper the accumulation of human capital. These results closely link to Glaeser et al. (2004)
and Rodrik. (2006) and have interesting implications for international development
paradigms and policy, which will be addressed in the next chapter.
Note the fact that 'Getting Credit'is not significant in the OLS and only just (at the 10%
level) for IV. To some extent, this again underscores Rodrik.'s claim that access to credit has
a direct and significant impact on economic growth and income levels. That is, it does not
work through human capital.
4.5. Panel
Below the results of equation (11) and (12) for the panel data analysis are shown. First,
the results from the Pooled OLS, Random Effects and Fixed Effect estimations are treated.
Then; the results from the GMM analysis are presented.
4.5.1. Pooled, random and fixed
The panel results show a brighter picture for institutions. As summarised in Table 9, the
results for the Pooled OLS, the RE and FE estimators show that the 'Polity Score' and
'Efwindex are significandy positive. In the Pooled OLS and the RE, human capital and initial
year GDP are positive and significant. In the FE estimation, these variables are treated as
country specific effects because they do not display any variation and are thus ignored.
The Hausman tests show that there is no systematic difference between the RE
etimators and the FE estimators for the 'Polity Score' case. The data therefore suggest using
RE estimation for regressions with this variable as they are consistent and more efficient
than FE estimators. For the 'Efwindex the Hausman test suggests that FE estimation is more
appropriate.16
Note that the coefficients are very robust to changes in estimation technique. The
coefficient of the 'Efwindex does not vary much and the coefficient of the 'Polity Score'
varies even less. The Economic Freedom of the World index has a lillie more explanatory
power than the 'Polity Score', since its R-squared is larger. This index "uses data for 38
components to construct a measure of economic freedom [where] the 38 components of the
EFW index are divided into five major areas: (1) size of government, (2) legal system and
16 The x2-statistic for 'Polity Score' is 2.31, with a corresponding p-value of 0.5097. For the 'Efivinde:>?, the X,zstatistic is 12.63 with a p-value of 0.0055.
44

protection of property rights, (3) access to sound money, (4) freedom to trade with
foreigners, and (5) regulation of credit, labor, and business" (Gwartney and Lawson, 2006:
www.freetheworld.com).
Since, after controlling for FE, the results are robust there seems to be enough variation
in the institutional variables and help explain comparative growth records. However, the
'Polity Score' and the 'Efwinde:x! are indices that are measured on a different scale and are
therefore not easy to compare. However, the 'Democrary' and 'Autocrary' variables that the
'Polity Score' is made up of are based on a same scale. Regressing growth on these instead of
their aggregated index, gives almost identical results. The coefficients are almost exactly the
same. 17
Then, a one point increase in the 'Efwinde:x! is associated with a much bigger impact on
economic growth than a one point increase in the two components of the 'Polity Score'. Also,
the R-squared of the latter is lower for all estimation techniques, but not by much. That
suggests, that the 'Efwindex' better explains variability in growth averages.
It is noteworthy that the trade openness indicator (!copen) is significant and positive as
well. This is interesting, because in the cross section analysis this variable was never
significant, which can be verified in Appendices 4 through 6. This suggests that more open
countries perform better on average.
In any case, the institution variables as well as the human capital variable are significant
at the conventional levels and all have the expected sign. This, to some extent, counters the
results obtained from the cross-section data, in that this does not provide evidence that
institutions work through human capital. However, it is worth noting that this is a relatively
simple form of panel data, and more extensive investigation is required. Nevertheless, the
results do fit closely the contemporary studies on the interaction between institutions and
economic growth.
17 And therefore not reported, save the following. Demo: 1) Pooled OLS: 0.0025 [0.001] 2) RE: 0.0025 [0.001] 3) FE: 0.002 [0.001] and Auto: 1) Pooled OLS: 0.002 [0.001] 2) RE: 0.002 [0,001] 3) FE: 0.0014 [0.001]. The complete results can be obtained from the author upon request.
45
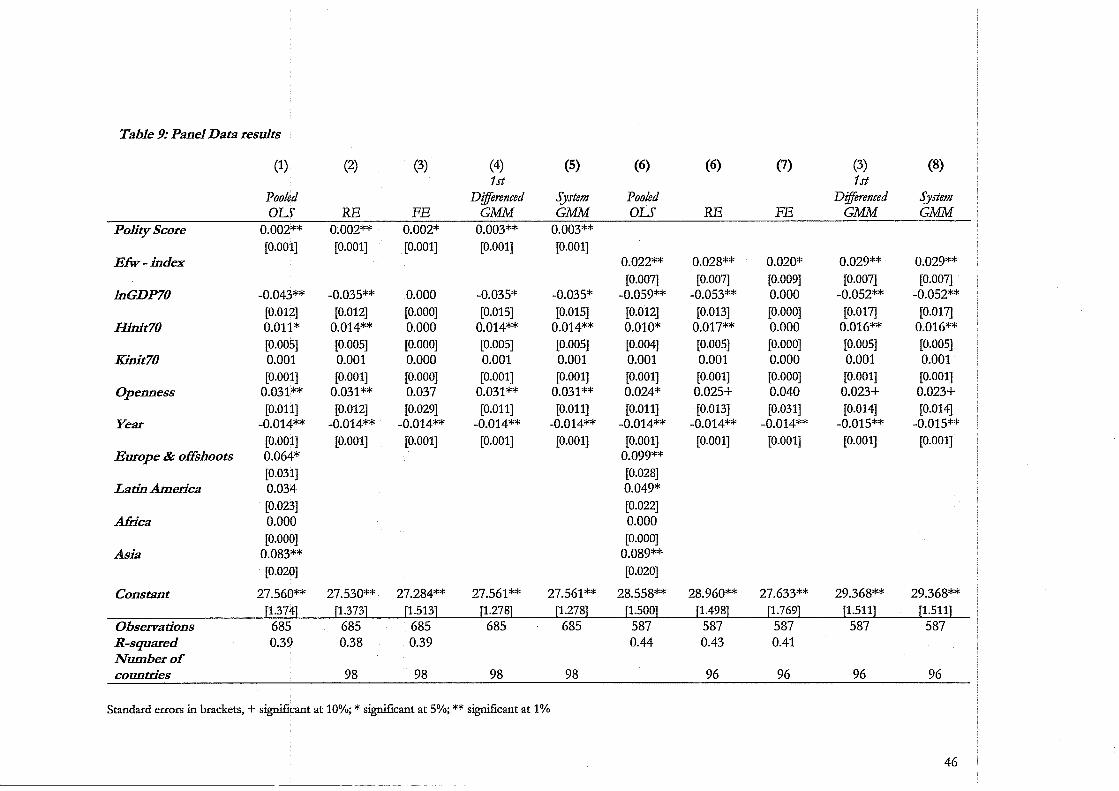
Table 9: Panel Data results
(1) (2) (3) (4) (5) (6) (6) (7) (3) (8) 1st 1st
Pooled Differenced .ijstem Pooled Differenced System OU' RE FE GMM GMM OU' RE FE GMM GMM
Polity Score 0.002** 0.002** 0.002* 0.003** 0.003** [0.001] [0.001] [0.001] [0.001] [0.001]
Efw-index 0.022** 0.028** 0.020* 0.029** 0.029**
[0.007] [0.007] [0.009] [0.007] [0.007] lnGDP70 -0.043** -0.035** 0.000 -0.035* -0.035* -0.059** -0.053** 0.000 -0.052** -0.052**
[0.012] [0.012] [0.000] [0.015] [0.015] [0.012] [0.013] [0.000] [0.017] [0.017] Hinit70 0.011* 0.014** 0.000 0.014** 0.014** 0.010* 0.017** 0.000 0.016** 0.016**
[0.005] [0.005] [0.000] [0.005] [0.005] [0.004] [0.005] [0.000] [0.005] [0.005] Kinit70 0.001 0.001 0.000 0.001 0.001 0.001 0.001 0.000 0.001 0.001
[0.001] [0.001] [0.000] [0.001] [0.001] [0.001] [0.001] [0.000] [0.001] [0.001] Openness 0.031** 0.031** 0.037 0.031** 0.031** 0.024* 0.025+ 0.040 0.023+ 0.023+
[0.011] [0.012] [0.029] [0.011] [0.011] [0.011] [0.013] [0.031] [0.014] [0.014] Year -0.014** -0.014** -0.014** -0.014** -0.014** -0.014** -0.014** -0.014** -0.015** -0.015**
[0.001] [0.001] [0.001] [0.001] [0.001] [0.001] [0.001] [0.001] [0.001] [0.001] Europe & offshoots 0.064* 0.099**
[0.031] [0.028] Latin America 0.034 0.049*
[0.023] [0.022] Africa 0.000 0.000
[0.000] [0.000] Asia 0.083** 0.089**
[0.020] [0.020]
Constant 27.560** 27.530** 27.284** 27.561** 27.561** 28.558** 28.960** 27.633** 29.368** 29.368** [1.374] [1.373] [1.513] [1.278] [1.278] [1.500] [1.498] [1.769] [1.511] [1.511]
Observations 685 685 685 685 685 587 587 587 587 587 R-squared 0.39 0.38 0.39 0.44 0.43 0.41 Number of countries 98 98 98 98 96 96 96 96
Standard errors in brackets, + significant at 10%; * significant at 5%; ** significant at 1%
46
4.2.GMM
Although the FE estimation shows that the institutional variables are not treated as fixed
effects and thus that there is enough variation, many authors note (see Durlauf et al. (2004)
for an elaborate discussion) that FE might not be appropriate for cross-country panel data.
Rather, they suggest that GMM: estimation is more appropriate. Below, the results for both
first-differenced GMM: as well as system GMM: are presented.
The results in Table 9 confirm the findings of the static panel estimation. Both 'Polity
Score' and 'Efwindex have positive and significant impacts on average growth for the five year
periods. Initial year human and physical capital also have the expected signs, although only
human capital is significant. Again, 'kopen'is also significant and positive.
Note that the magnitude of the coefficients does not change much when using dynamic
panel data estimation techniques, which may suggest that the RE and FE estimations are
actually quite appropriate. However, recent literature typically includes more control
variables, but this is beyond the scope of this paper which has already covered a large part of
the current debate on the interactions between institutions and growth.
47


Chapter 5 - Conclusions
ljyou believe everythingyou read, better not read
Japanese proverb
This paper set out not only to cover the literature on the institution-growth nexus but
also to understand a more pressing question, namely which institutions are important for
economic development. Arguably, institutions have very diverse functions and thus interact
differently with economic growth. In doing so, where possible disaggregated measures of
institutional quality have been used. Below the main findings are summarized but most
prominent in this chapter is the plea for caution with the current debate on institutions that
engulfs the international development community.
5.1. ll7hat the paper found
The analysis covered a large section of the contemporary literature on the institutions
growth debate. First of all, it confirms Rodrik's (2006) finding that the empirical literature
has typically found a strong influence of institutions on the income level, but that the link
between institutions and growth is much harder to make.
Second, to ascertain which institutions determine growth, the paper categorizes the
institutions into economic, political, legal and social institutions. There is some evidence that
social and legal institutions are more important than economic and political institutions.
Especially political institutions have less impact on both income and growth.
However, it proved very difficult to establish which institutions are most important for
growth. The categorisation of institutions is a very useful undertaking in that it is recognition
of the fact that different institutions interact differently with growth. But unfortunately, the
(lack of institutional) data does not support sophisticated statistical techniques to answer the
question. Moreover, the measures of institutions researchers have to work with are often
such broad measures, that they all capture similar information. Also, they are not measures
of norms, but "ambiguous assessments of institutional outcomes" as Glaeser et al. (2004:
298) put it
Therefore, this paper has adopted straightforward and dis aggregated data where possible.
More specifically, the two social institutions proposed both are measures of actual norms,
are easy too interpret and carry considerable policy relevance. The results suggest that the
48

norm that women are expected to work is important for income levels and growth. Also, if a
country has a free press it is expected to grow faster on average. The variables that capture
these norms actually seemed more important than political and economic institutions, which
might be counter-intuitive. A possible explanation could be that social institutions are a
better reflection of a society's informal institutions, which Compton et al. (2006) claim might
actually have more weight in determining the economic performance of countries. This
would also explain why political institutions are found to be less important.
But most convincing is the variable 'Getting Credit from the World Bank Doing Business
dataset and categorised as a legal institution, which measures the access to credit in a
country. This variable is significant in almost all regressions and this underscores Rodrik's
(2006) claim that poor access to credit is one of two most binding constraints for an
economy to grow.
This proves that dis aggregating of institutional indices may considerably enrich the
analysis. The typical literature uses measures of institutional quality that capture an array of
information and that are hard to disentangle logically. The 'Regulation IndeX' proposed by
Busse et al. (2005) is a good example of such an index. This paper used the subcomponents,
of which 'Getting Credit is one, that construct this index. It is a valuable undertaking as it
shows that the various aspects of doing business interact quite differently with economic
performance. An index does not capture this.
Third, the paper suggests that institutions may exert an impact on income through their
effect on the accumulation of physical and human capital instead of on income of growth
directly. Controlling for human and physical capital in the regressions diminished the effect
of institutions, or made them insignificant. Examining the interactions between institutions
and human and physical capital, the paper argues that institutions are a main determinant of
human capital accumulation. So are they important? Yes, but through their bearing on
human capital. This closely links to the findings of Glaeser et al. (2004) and would suggest
that the focus should be more on human capital rather than institutions. Note that the
'Getting Credit' variable is the only institutional variable that does not seem to work through
human capital but has a direct impact on a country's economic performance.
Finally, the light panel data analysis gives institutions a bit more slack. Both static and
dynamic panel estimations show institutions to have an impact on growth averages besides
the impact of human capital. But caution is asked for, because the only measures of
49

institutional quality that are available over a long stretch of rime are blurry, aggregate and
capture a lot of information. Thus, their meaning is questionable and the critique does not
crumble. The fact that more and more data on institutions is available is something that
could considerably enrich the analysis in the years to come.
5.2. Taking care of institutions or taking care with institutions?
Institutions are important. Obviously. Whether they impact growth direcdy or through
human capital, it has been established that institutions play an essential role in the
comparative development of countries. In that sense, this paper is superfluous. So should
countries focus on their institutional quality?
Improving institutional quality is an important policy implication of contemporary
research. The international development community has adopted the 'institution' in its
discourses and policies full-fledged. But is this appropriate? What is it telling countries that
are lower on the economic ladder? Which are the institutions at play, really?
The debate on institutions is not, as Rodrik calls it, a dead end. But he is right that the
way the 'institution' buzzword has (re-)entered the development debate does not provide
useful policy advise. The research measures institutions as aggregated indices, and typically
uses one measure to capture the whole range of economic, political, legal and social
institutions. The informal institutions are most probably even more important but are
treated only as a residual, if at all. This research could tell a country that the index it uses is
positively correlated to the country's growth, but that is all. It does not answer which
institutions have a Oarger) impact on growth, nor does it tell a country's policy maker what
to do. That countries should strengthen their institutions for growth would be what the
international community wants to hear. But does it bear any practical policy advice?
This paper is guilty too. It used the same blurry indices as many other studies and cannot
provide practical policy advice in this respect. However, this paper has also used the
dis aggregated WBDB data, and has found that restrictions on access to credit can be
detrimental to growth. Policy implication is that financial markets should be well regulated
but not restricting access to credit.
Also, it has proposed two social institutions, which capture norms rather than outcomes,
that have shown to be important. These translate to the relatively straightforward policy
50

advice to ensure a free and independent press, and to encourage women to work and make
this socially acceptable, if economic growth is the aim.
The paper has only partially succeeded in answering which institutions are important due
to the limitations of the data. However, the disaggregation and categorization of measures of
institutions is a small step towards more practical policy advice. In that sense, within-country
investigations on the 'real' institutions at play would be a considerable next step.
Hopefully, within the next decade, researcher will be able to tell a country's policy maker
what the institutions really are and which of them are important to economic performance.
It is time for research to make the next step.
51

References
Acemoglu, Daron, Simon Johnson and James Robinson (2001), 'The Colonial Origin of
Comparative Development: An Empirical Investigation', AmericanEconomic Review, Vol.
91, No.5, pp. 1369-1401.
Acemoglu, Daron, Simon Johnson and James Robinson (2004), 'Institutions as the
Fundamental Cause of Long-Run Growth', Handbook of Economic Growth, NBER
Working Paper No. W10481.
Alcala, Francisco & Ciccone, Antonio (2001), 'Trade and Productivity', CEPR Discussion
Papers 3095, CEPR Discussion Papers.
Alesina, Alberto, Arnaud Devleeschauwer, William Easterly, Sergio Kurlat, and Romain
Wacziarg (2003), 'Fractionalisation', journal of Economic Growth, Vol. 8, pp. 155-94.
Arellano, Manuel and Stephen Bond (1998), Dynamic Panel Estimation Using DPD98 for
Gauss: A guide for users, available at:
http://www.american.edu/ academic.deptsl casl econl gaussresl regressl dpdl dpd98.pdf.
Arlmah, Ben (2004), 'Poverty Reduction and Human Development in Africa', journal of Human Development, 5: 399-415.
Bassanini, Adrea, Stefano Scarpetta and Philip Hemmings (2001), 'Economic Growth: The
Role of Policies and Institutions. Panel Data Evidence from OECD Countries', OECD
Economics Department Working Paper No. 283. Available at SSRN:
http://ssm.com/ abstract=265091
Beck, Thorsten, George Clarke, Alberto Groff, Philip Keefer, and Patrick Walsh (2001),
'New Tools in Comparative Political Economy: The Database of Political Institutions',
The World Bank Economic Review, Vol. 15, No.1: 165-176.
Ben-David, Dan (1996), 'Trade and Convergence Among Countries', journal of International
Economics, 40, 279-298.
Bilal, San and Francesco Rampa (2006), 'Alternatives (to) EP As, Possible scenarios for the
future ACP trade relations with the EU', Policy Management Report 11, European
Centre for Development Policy Management (ECDPM), Maastricht: ECDPM.
www.ecdpm.org/pmt11.
52

Bond, Stephen R., Anke Hoeffler and Jonathan Temple (2001), 'GMM Estimation of
Empirical Growth Models', CEPR Discussion Papers 3048, available at SSRN:
http://ssrn.com/ abstract=290522.
Busse, Matthias, Axel Borrmann and Silke Neuhaus (2005), 'Trade, Institutions and Growth:
An Empirical Analysis of the Proposed ACP lEU Economic Partnership Agreements for
ECOWAS countries', Hamburgisches Welt-Wirtschafts-Archiv - Hamburg Institute of
International Economics, Hamburg.
Busse, Matthias, Axel Borrmann and Silke Neuhaus (2006), 'Institutional Quality and the
Gains from Trade', Hamburgisches Welt-Wirtschafts-Archiv - Hamburg Institute of
International Economics, Hamburg.
Compton, Ryan A., Daniel C. Giedeman and Noel D. Johnson (2006), 'Political Instability,
Institutions, and Economic Growth', preliminary draft presented at XIV International
Economic History Congress, Helsinki, May, available at:
http://www.helsinki.fi/iehc2006 Ipapers3 I Giedeman.pdf
Dawson,John W., (1998), Institutions, Investment, and Growth: New Cross-Country and
Panel Data Evidence, Economic Inquiry, XXXVI: 603-619.
Djankov, Simeon, Rafael La Porta, Florencio L6pez-de-Silanes and Andrei Shleifer (2002),
'The Regulation of Entry', Quarterfy Journal ojEconomics, Vol. 117, No.1, pp. 1 ... 37.
Easterly, William and Ross Levine (2002), 'Tropics, Germs, and Crops: How Endowments
Influence Economic Development', Working Paper 9106, URL:
http://www.nber.org/papers/w9106, National Bureau of Economic Research,
Cambridge.
Edwards, Sebastian (1997), 'Openness, Productivity and Growth: What do we really I<now?',
NBER Working Paper No. 5978.
Eicher, Theo and Till Schreiber (2005), 'Institutions and Growth Time Series Evidence from
a Natural Experiment', University of Washington, Ifo Institute of Economic Research,
http://www.ses.wsu.edu/ announcements I seminarl papers I tillschreibecjobmarketpaper
Fielding, David and Sebastian Torres (2006), 'Cows and Conquistadors, A Contribution on
the Colonial Origins of Comparative Development', Discussion paper, Department of
Economics, University of Otago.
53

Frankel, Jeffrey and David Romer (1999), 'Does Trade Cause Growth?', American Economic
Review, Vol. 89, No.3, pp. 379-99.
Frankel, Jeffrey and Andrew Rose (2001), 'An Estimate of the Effect of Common
Currencies on Trade and Income', Harvard University Faculty Research Working Papers
Series.
Freedom House (2006), Worst of the Worst: The World's Most Repressive Societies 2006,
Freedom House. Available at: http://www.freedomhouse.org/template.cfm?page=137
Furtado, Celso (1976), 'Economic Development of Latin America, Historical background
and contemporary problems', Cambridge University Press.
Giles, David and Chad Stroomer (2003), 'Does Trade Openness Affect the Speed of Output
Convergence?' Some Empirical Evidence, Econometrics Working Paper EWP0307
ISSN 1485-6441, Department of Economics University of Victoria.
Glaeser, Edward, Rafael La Porta, Florencia Lopez-De-Silanes and Andrei Shleifer (2004),
'Do Institutions Cause Growth?', Journal of Economic Growth, Vol. 9, No.3, pp. 271-303.
Gwartney, James and Robert Lawson (2006), 'Economic Freedom of the World: 2006
Annual Report', Vancouver: The Fraser Institute, Data retrieved from
www.freetheworld.com
Haan, Peter de (2006), Development in Hindsight, The Economics of Common Sense, KIT
Publishers, Amsterdam.
Heston, Alan, Robert Summers and Bettina Aten, Penn World Table Version 6.2, Center for
International Comparisons of Production, Income and Prices at the University of
Pennsylvania, September 2006.
Irwin, Douglas and Marko Temo (2002), 'Does Trade Raise Income? Evidence From the
Twentieth Century', Journal of International Economics, Vol. 58, No.1, pp. 1-18.
Johnson, Paul A., Steyen N. Durlauf and Jonathan R.W. Temple (2004). 'Growth
Econometrics', Vassar College Department of Economics Working Paper Series 61,
Vassar College Department of Economics.
Kaufmann, Daniel, Aart Ktaay and Massimo Mastruzzi (2005), 'Governance Matters IV:
Updated Indicators for 1996-2004', Policy Research Working Paper 3630, The World
Bank.
Knack, Stephen and Philip Keefer (1995), 'Institutions and Economic Performance:
Cross Country Tests Using Alternative Institutional Measures', Economics and
54

Politics 7 (3): 207-227.
Lewer, Joshua J. and Mariana Saenz (2005) "Property Rights and Economic Growth: Panel
Data Evidence," Southwestern Economic Review, Vol. 32(1), pp. 157-165.
Mamoon, Dawood and S. Mansoob Murshed (2005), 'Are Institutions more important than
Integration?', Working Paper Series No. 416, ORP AS - Institute of Social Studies, The
Hague.
Mamoon, Dawood (2006), 'Institutions, Integration and Inequality', Institute of Sodal
Studies, The Hague.
Murshed, S. Mansoob (2006), 'Turning Swords into Ploughshares and Little Acorns into Tall
Trees: The Conflict Growth Nexus and the Poverty of Nations', Prepared for the United
Nations (Department for Economic and Social Affaits) for the Work Economic &
Social Survey, 2006.
Noguer, Marta and Marc Sis cart (2005), 'Trade Raises Income: A Precise and Robust Result',
Journal of International Economics, Vol. 65, No.2, pp. 447-460.
Perla, Cecilia (2004), 'Is there a Mineral Resource Curse? - New Evidence on the
Relationship between Natural Resources, Institutions and Growth', MA thesis, MA
Development Studies, Institute of Social Studies, The Hague.
Rodriguez, Fransisco and Rodrik, Dani (1999), 'Trade Policy and Economic Growth: A
Sceptic's Guide to the Cross-National Evidence', University of Maryland and Harvard
University.
Rodrik, Dani, Arvind Subramanian and Francesco Trebbi (2004), 'Institutions Rule: The
Primacy of Institutions Over Geography and Integration in Economic Development',
Journal of Economic Growth, Vol. 9, No.2, pp. 131-165.
Rodrik, Dani (2006), 'Goodbye Washington Consensus, Hello Washington Confusion?',
Journal of Economic Literature, January 2006.
Roodman, D. 2005. xtabond2: Stata module to extend xtabond dynamic panel data
estimator. Center for Global Development, Washington.
http://econpapers.repec.org/software/bocbocode/s435901.htm
Rose, Andrew K. (2002), 'Do WTO Members have More Liberal Trade Policy?', NBER
Working Paper No. 9347.
Varian, Hal R. (1999), Intermediate Microeconomics -A Modem Approach, W.W. Norton
& Company, 5th Edition.
55

Verbeek, Marno (2000), A Guide to Modem Econometrics, John Wiley and Sons, Ltd.,
Chichester, West Sussex.
Woolclridge,Jeffrey M. (2003), 'Introductory Econometrics - A Modem Approach',
Thomas/South Western, 2nd Edition.
World Bank (2004), 'Doing Business in 2005: Removing Obstacles to Growth', Oxford
University Press, World Bank.
World Bank (2005), World Development Indicators 2005, Data on CD-ROM, World Bank:
Washington, DC.
56


Appendices
Appendix 1: Variables, definition and source:
Dependent Variables
Lngni
Growth
Institutions
WB Doing Business
Regulation Index
log of PPP GNI/capita 2003 (Source: World Bank (2006), World
Development Indicators)
lnGDP2003 (pPP per capita) - lnGDP1975 (pPP per capita) Penn World
Tables, Mark 6.
10 indicators of doing business, from the World Bank Doing Business
(2005) dataset. (see Table 2 for definitions).
(Re~B): Reconstruction of Busse et al.s (2005) weighted average of 10
subcomponents of the WB Doing Business (2005) dataset.
Regulation Index - KV (Re~KV): Author's own unweighted average of 10 subcomponents of the
World Bank Doing Business (2005) dataset.
Good Governance
Polity IV
Freedom House
Gender
Set of six good governance indicators, standardised values, range from -2.5
to +2.5. Six indicators: 1) Government Effectiveness (Ge), 2) Regulatory
Quality (Rg), 3) Political Stability (ps), 4) Rule of Law (Rl), 5) Voice and
Accountability 01 a), 6) Control of Corruption (Cc). See Table 1.
Set of three indicators: 1) Democracy Score (Demo): general openness of
political institutions. Range = 0-10 (0 = low; 10 = high), 2) Autocracy Score
(Auto): general closedness of political institutions. Range = 0-10 (0 = low;
10 = high), and 3) Combined Polity Score: Computed by subtracting Auto
from Demo; includes "standardized codes" (i.e., -66, -77, -88) for special
polity condition. Range = -10 to 10 (-10 = high autocracy; 10 = high
democracy). And 'constraints on the executive in the 1980s' (Xcons80).
Political Rights (pr) - 1 represents the most free and 7 the least free rating
and Civil Liberty (CI): - 1 represents the most free and 7 the least free
rating.
And Freedom of Press (Fpress) as classified by Freedom House.
(Gender): Dummy variable taking value 1 if women are expected to get
education and work (outside the household), 0 otherwise. Own
57

EFWindex
.J
construction on basis of WB 2006 (WDI) data: A country where the girl to
boy ratio in primary and secondary education in 2001 was higher than 95%
got one point. If the country had less than 50 % female adults with HIV as
% of population ages 15-49 with HIV, it got a second point and finally if
women made up more than 40% of the total labor force, the country got a
third point. If a country had 2 or more points, the dummy variables takes
value 1.
Economic Freedom of the World Index, Range 0-10, 10 highest. Fraser
Institute. See text or website for further explanation.
http://www.freetheworld.com/release.html
Other independent variables
Openness (lcopen): Natural logarithm of openness as given by the ratio of imports
plus exports to PPP GDP, Penn World Tables, Mark 6.
Human Capital Hinit): average years of schooling of the population aged 25 and over in
initial year (1970 or 1975), Barro & Lee dataset::
http:// post.economics.harvard.edu/ faculty /barro / data.html.
Distance from equator lacabst): Absolute value of the latitude of the country measured as
abs(latitude)/90. La Porta et al. (1999)
Regional Dummies Dummy variable taking value 1 if country belongs to specified region, 0
otherwise. Regions: Europe, Western Offshoots, Latin America, Asia,
North Africa, Sub-Saharan Africa.
Access to sea
Instrumental Variables
(Access) Dummy variable taking value 1 if country is landlocked = 1, 0
otherwise
SMR Settler Mortality Rate, Rodrik, Subramanian & Trebbi (2002)
Engfrac
Eurfrac
Fitttade
Fraction of the population speaking English as the fitst language, Rodrik,
Subramanian & Trebbi (2002)
Fraction of the population speaking a West European language as the fitst
language, Rodrik, Subramanian & Trebbi (2002)
LN Fitted trade (dep. Variable = nom.trade/GDP), Rodrik, Subramanian &
Trebbi (2002)
58

:::
:::
·15
:::
·2
·4
Appendix 2: Pair wise correlations between income and institutions
·2
·10
1 : Government Effectiveness'
·1 0 (lovemment Effectlvenes,.
3: Reguiation Index
·5 0 Ragullon Index Busse at al.
5: HIring and Firing Workers'
·1 o Hiring end Firing Workers
7: Trading Across Borders
.2 0 Trading Across Bordars
:::
10.
:::
·2
:::
·3
2: Reguiatory Quality
·1 Q Regulatory Quahty
. 4: Regulatiori iridex KV
Ragullon IndalKoan Voorand
6: Getting Credit
8: Political Stability
. _'smal
-1 0 .. f>0UtlcaIStabllity
• Luxarnbourg ,
·.Lu)(ombcurg
59

9: bemocracy Score
4 6 10 Oemoc~cy SeD,re
11: Political Rights ::: • Luxomboura :::
~ ~
~:[ ! {3 ~Q) :~cn
!Z z 'Cl ~Ul :-g: co
.9 --'
2 polltlca1 Rlghls
13: Rule of Law • Luxombourg
15: Contrai of Corruption
<0
~------,-------.------,-------.---2 -1 ° 2
Gontrol of Gorruplion
-2
10: Autocracy Score
,. -''W8.i"T: ~~~~~:s • Ol'¥Sou~1 Al'01bll1
'. .','
.TUfkil_~d
aCongo, qom. Rep.
10 '
12: Civil Liberty o Lw.:ombouro
• Unltod Arab Emlr::alo$
_Scudl Ar.Ibla
Civil ~lberlY
14:Voice and Accountability o LUliCombourg
Voice ,and AOccounlabllllY
16:'Constraints on the Executive • Luxembourg
eFrance
GArgont! .~TObagO
9U~ '1'IdlI:IItlomi:~PUbHC ~ • EI salv:ci'bIMtl%IJOla • Sri Lnnka • Ec8hlffipalca .
246 Constraints on Ihe Execulive
'.Indlll . • Papua Now Gulnaa o Gambia
60

Appendix 3: Determining which institutions - Correlation Matrix Institutions
GNI I EconOmic ___ l_ Political Legal Social
lngni ge rq reg_b re~kv hfw tab ps demo auto pr cl gc rl va cc xcons80 fpress gender
lngni 1.00
Ge '0.82 1.00
Rq 0.65 0.82 1.00
Re~b 0.79 0.81 0.71 1.00
Re~kv I 0.77 0.80 0.70 0.88 1.00
HfW 0.25 0.33 0.25 0.54 0.55 1.00
TaB 0.74 0.70 0.65 0.74 0.64 0.23 1.00
Ps 0.77 0.82 0.72 0.75 0.74 0.27 0.66 1.00
Demo 0.66 0.64 0.61 0.68 0.67 0.19 0.60 0.55 1.00
Auto -0.49 -0.51 -0.55 -0.58 -0.58 -0.16 -0.53 .(JAO .(J.92 1.00
Pr -0.55 -0.60 -0.67 -0.58 -0.54 -0.11 -0.58 .(J.55 .(J.80 0.76 1.00
CI -0.57 -0.65 -0.69 -0.61 -0.57 -0.12 -0.59 .(J.59 .(J.78 0.74 0.95 1.00
Gc 0.69 0.64 0.63 0.68 0.56 0.16 0.54 0.64 0.68 -0.60 -0.62 -0.62 1.00
R1 0.82 0.93 0.82 0.80 0.79 0.32 0.69 0.84 0.65 -0.48 -0.61 -0.65 0.63 1.00
Va 0.70 0.76 0.76 0.70 0.68 0.16 0.66 0.70 0.83 -0.76 -0.91 -0.92 0.69 0.76 1.00
Cc 0.77 0.90 0.75 0.79 0.78 0.30 0.67 0.78 0.67 -0.52 -0.62 -0.66 0.65 0.89 0.75 1.00
xconsBO 0:62 0.60 0.53 0.64 0.62 0.22 0.59 0.56 0.91 -0.86 -0.68 -0.66 0.68 0.58 0.72 0.62 1.00
Fpress 0.57
Gender 0.54
0.67 0.57 0.61 0.57 0.31 0.53 0.59 0.73 -0.59 -0.74 -0.76 0.49 0.67 0.77 0.73 0.61
i 0.41 0.43 0.44 0.35 -0.02 0.42 .. ,0.39 0.60 -0.56 -0.46 -0.43 0.51 0.44 0.56 0.41 0.64
1.00
0.36 1.00
61

Appendix 4: Baseline Exploratory Regressions - Growth Regressions (Dependent variable is average growth 1975-2003)
Economic Institutions (1) (2) (3) (4) (5) (1)
OLS OLS OLS OLS OLS OLS
ge 0.374**
[0.097]
rq 0.476**
[0.079]
reg_b 0.075**
[0.025]
hfw 0.029
[0.072]
tab 0.176*
[0.083]
gc 0.270**
[0.072]
rl
va
cc
xcons80
hinit 0.000 0.024 0.052 0.095* 0.031 0.073+
[0.044] [0.032] [0.044] [0.045] [0.042] [0.040]
kinit 0.008 -0.004 0.001 0.001 0.000 -0.001
[0.008] [0.006] [0.008] [0.009] [0.008] [0.008]
lcopen 0.173 0.146 -0.173 -0.083 -0.032 -0.196
[0.228] [0.198] [0.265] [0.288] [0.248] [0.255]
lnpop03 -0.009 -0.031 -0.009 0.025 0.058 0.009
[0.061] [0.052] [0.068] [0.072] [0.063] [0.065]
area 0.000 0.000* 0.000* 0.000+ 0.000+ 0.000*
[0.000] [0.000] [0.000] [0.000] [0.000] [0.000]
lacabst -1.328* -0.880+ -1.166+ -0.58 -0.225 -0.903
[0.526] [0.447] [0.587] [0.596] [0.532] [0.551]
access -0.079 -0.042 -0.042 -0.084 0.156 0.046
[0.137] [0.115] [0.136] . [0.146} [0.145] [0.134]
Constant 1.108 1.526 2.361 1.166 0.488 1.943
[1.738] [1.486] [1.892] [2.045] [1.738] [1.781]
Reg. Dummy Yes Yes Yes Yes Yes Yes
Observations 89 93 87 87 84 86
R-squared 0.47 0.55 0.4 0.32 0.41 0.43
Standard errors in brackets + significant at 10%; * significant at 5%; ** significant at 1%
Legal Institutions (2) (3) (4) (5)
OLS OLS OLS OLS
0.326**
[0.096]
0.216*
[0.095]
0.289**
[0.099]
0.002
[0.033]
0.009 0.041 0.01 0.100*
[0.041] [0.041] [0.048] [0.045]
0.001 -0.001 0.006 0.000
[0.007] [0.007] [0.008] [0.008]
0.212 0.156 0.302 -0.007
[0.224] [0.232] [0.240] [0.275]
0.017 0.003 0.035 -0.021
[0.059] [0.061] [0.065] [0.067]
0.000+ 0.000* 0.000 0.000*
[0.000] [0.000] [0.000] [0.000]
-1.153* -0.899+ -1.276* -0.864
[0.514] [0.525] [0.538] [0.556]
-0.052 -0.079 -0.114 -0.086
[0.129] [0.134] [0.139] [0.143]
0.64 0.914 -0.057 1.773
[1.665] [1.730] [1.821] [1.904]
Yes Yes Yes Yes
94 94 89 91
0.42 0.37 0.43 0.32

Growth Regressions (Dependent variable is average growth 1975-2003)
Political Institutions Social Institutions -1 -2 -3 -4 -5 -6 -1 -2
OLS OLS OLS OLS OLS OLS OLS OLS
ps 0.246**
[0.082]
demo 0.028
[0.027]
auto -0.045
[0.029]
pol 0.019
[0.014]
pr -0.074+
[0.040]
cJ -0.142**
[0.049]
fpress 0.302+
[0.159]
gender 0.418**
[0.138]
hinit 0.051 0.080+ 0.078+ 0.077+ 0.051 0.029 0.058 0.041
[0.041] [0.047] [0.044] [0.046] [0.040] [0.040] [0.040] [0.038]
kinit 0.004 0.000 0.001 0.001 0.003 0.004 0.001 -0.001
[0.008] [0.008] [0.008] [0.008] [0.007] [0.007] [0.007] [0.007]
lcopen 0.151 0.055 0.055 0.061 0.138 0.150 0.130 0.273
[0.234] [0.281] [0.275] [0.278] [0.226] [0.219] [0.226] [0.224]
lnpop03 0.002 -0.012 -0.020 -0.015 -0.038 -0.032 -0.011 -0.018
[0.063] [0.072] [0.071] [0.072] [0.055] [0.053] [0.055] [0.053]
area 0.000+ 0.000* 0.000* 0.000* 0.000* 0.000* 0.000* 0.000
[0.000] [0.000] [0.000] [0.000] [0.000] [0.000] [0.000] [0.000]
lacabst -1.508** -0.822 -0.699 -0.765 -0.975+ -0.963+ -1.173* -0.753
[0.554] [0.559] [0.563] [0.560] [0.508] [0.493] [0.529] [0.495]
access -0.093 -0.058 -0.046 -0.050 -0.077 -0.073 -0.091 -0.206
[0.138] [0.142] [0.141] [0.142] [0.135] [0.129] [0.134] [0.131]
Constant 1.127 1.234 1.575 1.329 1.891 1.955 1.241 0.670
[1.768] [2.004] [1.931] [1.961] [1.608] [1.556] [1.599] [1.562]
Reg. Dummy Yes Yes Yes Yes Yes Yes Yes Yes
Observations 90 90 90 90 94 94 95 95
R-squared 0.43 0.33 0.34 0.34 0.36 0.4 0.36 0.41
Standard eo:ors in brackets + significant at 10%; * significant at 5%; ** significant at 1 %
63

Level Regressions (Dependent variable is In GDP2003)
Economic Institutions Legal Institutions
(1) (2) (3) (4) (5) (1) (2) (3) (4) (5)
OLS OLS OLS OLS OLS OLS OLS OLS OLS OLS
ge 0.478**
[0.098]
rq 0.372**
[0.094]
reg:..b 0.082**
[0.026]
hfw 0.06
[0.075]
tab 0.135
[0.091]
gc 0.355**
[0.071]
rl 0.492**
[0.096]
va 0.338**
[0.099]
cc 0.368**
[0.103]
xconsBO 0.058
[0.035]
binit 0.127** 0.189** 0.186** 0.230** 0.192** 0.205** 0.122** 0.169** 0.138** 0.226**
[0.045] [0.039] [0.045] [0.046] [0.046] [0.039] [0.041] [0.042] [0.050] [0.048]
kinit 0.015+ 0.002 0.007 0.007 0.000 0.005 0.006 0.004 0.013 0.005
[0.008] [0.008] [0.008] [0.009] [0.009] [0.008] [0.007] [0.008] [0.008] [0.008]
lcopen -0.057 -0.084 -0.297 -0.227 -0.169 -0.347 -0.01 -0.096 0.105 -0.18
[0.230] [0.238] [0.275] [0.299] [0.271] [0.251] [0.223] [0.242] [0.250] [0.296]
lnpop03 0.001 -0.019 -0.004 0.028 0.06 0.013 0.031 0.011 0.053 0.007
[0.062] [0.063] [0.071] [0.075] [0.070] [0.064] [0.059] [0.063] [0.067] [0.072]
area 0.000 0.000 0.000 0.000 0.000 0.000 0.000 0.000+ 0.000 0.00
[0.000] [0.000] [0.000] [0.000] [0.000] [0.000] [0.000] [0.000] [0.000] [0.000] laLabst 0.531 1.019+ 0.439 1.030 1.539* 0.576 0.543 0.921+ 0.590 1.184+
[0.532] [0.537] [0.609] [0.620] [0.583] [0.543] [0.513] [0.545] [0.559] [0.599]
access -0.271+ -0.277* -0.305* -0.362* -0.099 -0.182 -0.244+ -0.282* -0.326* -0.243
[0.138] [0.138] [0.141] [0.152] [0.158] [0.132] [0.129] [0.139] [0.145] [0.154]
Constant 8.157** 8.515** 9.322** 8.264** 7.489** 9.054** 7.716** 8.137** 6.738** 8.025**
[1.758] [1.786] [1.963] [2.128] [1.904] [1.755] [1.663] [1.797] [1.891] [2.050]
Reg. Dummy Yes Yes Yes Yes Yes Yes Yes Yes Yes Yes Observations 89 93 87 87 84 86 94 94 89 91
R-squared 0.89 0.87 0.88 0.86 0.88 0.9 0.89 0.87 0.87 0.85 b4
Standard errors in brackets + significant at 10%; * significant at 5%; ** significant at 1%

Level Regressions (Dependent variable is in GDP2003)
Political Institutions Social Institutions
(1) (2) (3) (4) (5) (6) (1) (2)
OLS OLS OLS OLS OLS OLS OLS OLS
ps 0.328**
[0.084]
demo 0.059*
[0.029]
auto -0.041
[0.032]
pol 0.027+
[0.016]
pr -0.056
[0.045]
cl -0.070
[0.057]
fpress 0.341+
[0.173]
gender 0.205
[0.158]
hinit 0.191** 0.208** 0.232** 0.219** 0.221** 0.218** 0.211** 0.223**
[0.043] [0.050] [0.049] [0.050] [0.045] [0.046] [0.043] [0.044]
kinit 0.009 0.005 0.006 0.006 0.008 0.008 0.007 0.006
[0.008] [0.009] [0.009] [0.009] [0.008] [0.008] [0.008] [0.008]
lcopen -0.087 -0.093 -0.165 -0.126 -0.156 -0.155 -0.170 -0.098
[0.240] [0.301] [0.303] [0.302] [0.253] [0.253] [0.248] [0.257]
lnpop03 0.Q15 0.006 -0.010 -0.003 -0.053 -0.049 -0.032 -0.044
[0.064] [0.078] [0.079] [0.078] [0.062] [0.062] [0.060] [0.061]
area 0.000 0.000 0.000 0.000 0.000+ 0.000 0.000 0.000
[0.000] [0.000] [0.000] [0.000] [0.000] [0.000] [0.000] [0.000]
laLabst 0.265 1.202* 1.249* 1.244* 0.808 0.819 0.533 0.911
[0.568] [0.600] [0.620] [0.609] [0.570] [0.570] [0.578] [0.568]
access -0.284* -0.252 -0.274+ -0.260+ -0.325* -0.335* -0.324* -0.401 **
[0.142] [0.153] [0.155] [0.154] [0.151] [0.150] [0.147] [0.151]
Constant 8.202** 7.626** 8.535** 8.107** 9.507** 9.466** 9.094** 8.890**
[1.814] [2.153] [2.129] [2.133] [1.804] [1.802] [1.750] [1.792]
Reg. Dummy Yes Yes Yes Yes Yes Yes Yes Yes
Observations 90 90 90 90 94 94 95 95
R-squared 0.88 0.85 0.85 0.85 0.85 0.85 0.85 0.85
Standard errors in brackets + significant at 10%; * significant at 5%; ** significant at 1%
65

Appendix 5: World Bank Doing Business: Indices versus subcomponents
WBDB - Level Regression (Dep. Vat'. is lnGDP per capita in 2003)
(1) (2) (3) (4) (5) (6) (l) (8) (9) (10) (11) (12) IV IV IV IV IV IV IV IV IV IV IV IV
re~b 0.138** 0.030 [0.046] [0.055]
re~kv 0.691* 0.047 [0.276] [0.307]
hfw 0.194 -0.062 [0.183] [0.149]
gc 0.728** 0.471* [0.221] [0.202]
tab 0.600* 0.051 [0.285] [0.323]
dwl 0.802+ 0.176 [0.409] [0.285]
hlnit 0.216** 0.233** 0.247** 0.170** 0.218** 0.192** [0.063] [0.062] [0.052] [0.051] [0.078] [0.062]
kinit 0.006 0.006 0.006 0.007 -0.009 -0.002 [0.012] [0.012] [0.013] [0.011] [0.017] [0.014]
lcopen -0.009 -0.274 -0.041 -0.288 ..:0.056 -0.193 0.321 -0.091 -0.258 -0.209 0.068 -0.224 [0.420] [0.382] [0.450] [0.393] [0.586] [0.458] [0.430] [0.357] [0.547] [0.375] [0.668] [0.396]
area 0.000 0.000 0.000 0.000 0.000 0.000 0.000 0.000 0.000 0.000 0.000 0.000 [0.000] [0.000] [0.000] [0.000] [0.000] [0.000] [0.000] [0.000] [0.000] [0.000] [0.000] [0.000]
laCabst 0.824 1.043 1.134 1.207 1.751+ 1.398+ 0.725 0.579 1.593+ 1.637* 1.665 1.448* [0.784] [0.759] [0.795] [0.748] [0.903] [0.754] [0.831] [0.685] [0.859] [0.665] [1.078] [0.701]
access -0.359* -0.311* -0.379* -0.319* -0.531* -0.298+ -0.139 -0.140 0.155 -0.123 -0.140 -0.199 [0.171] [0.148] [0.181] [0.151] [0.216] [0.165] [0.201] [0.156] [0.308] [0.280] [0.283] [0.160]
lnpop03 -0.036 0.051 -0.070 0.050 -0.091 0.070 0.012 0.047 -0.042 0.080 0.156 0.072 [0.130] [0.103] [0.137] [0.108] [0.165] [0.116] [0.137] [0.095] [0.213] [0.105] [0.263] [0.107]
Constant 9.619** 8.072** 10.247** 8.016** 10.797* 7.135* 7.389* 7.537** 10.172+ 7.430** 5.849 7.680* [3.414] [2.832] [3.633] [2.972] [4.583] [3.498] [3.549] [2.572] [5.360] [2.735] [6.412] [2.904]
Reg. Dummy Yes Yes Yes Yes Yes Yes Yes Yes Yes Yes Yes Yes Observations 91 87 91 87 91 87 90 86 87 84 88 85 R-squared 0.81 0.87 0.79 0.86 0.69 0.86 0.80 0.89 0.77 0.87 0.58 0.86
Standard errors in brackets + significant at 10%; * significant at 5%; ** significant at 1% 66
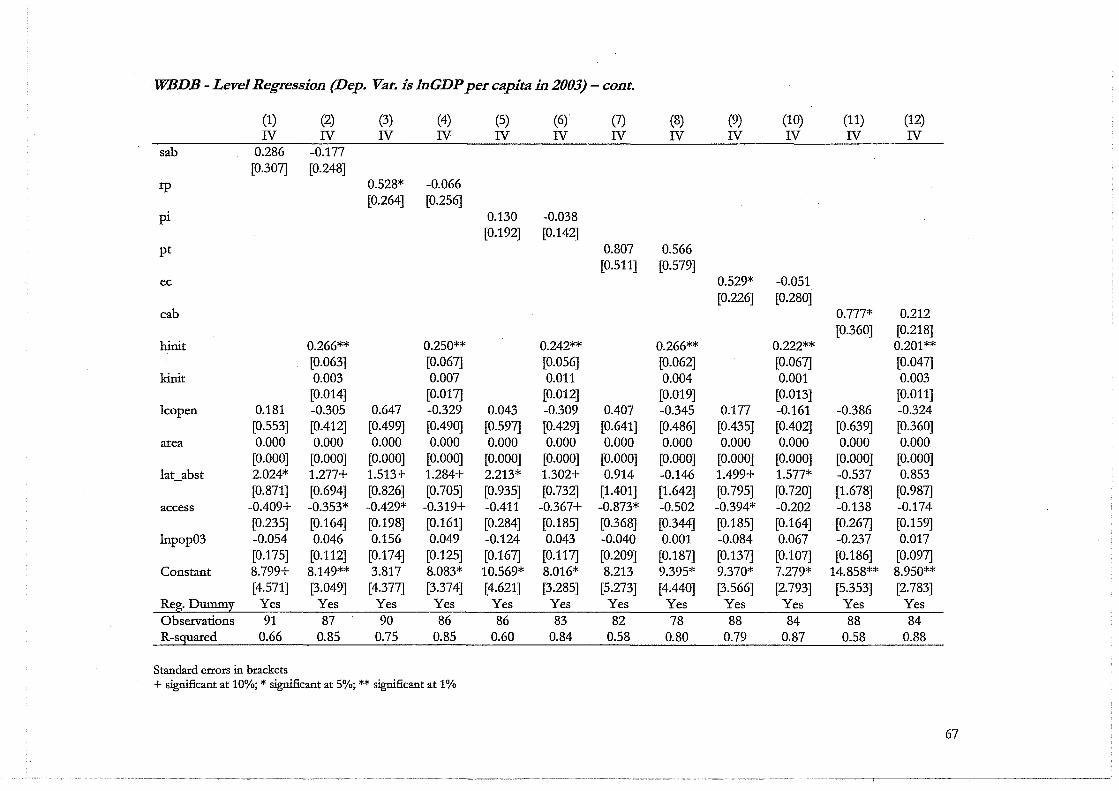
WBDB - Level Regression (Dep. Var. is lnGDP per capita in 2003) - cont.
(1) (2) (3) (4) (5) (6) (J) (8) (9) (10) (11) (12) N N N N N N N N N N N N
sab 0.286 -0.177 [0.307] [0.248]
rp 0.528* -0.066 [0.264] [0.256]
pi 0.130 -0.038 [0.192] [0.142]
pt 0.807 0.566 [0.511] [0.579]
ec 0.529* -0.051 [0.226] [0.280]
cab 0.777* 0.212 [0.360] [0.218]
hinit 0.266** 0.250** 0.242** 0.266** 0.222** 0.201** [0.063] [0.067] [0.056] [0.062] [0.067] [0.047]
kinit 0.003 0.007 0.011 0.004 0.001 0.003 [0.014] [0.017] [0.012] [0.019] [0.013] [0.011]
lcopen 0.181 -0.305 0.647 -0.329 0.043 -0.309 0.407 -0.345 0.177 -0.161 -0.386 -0.324 [0.553] [0.412] [0.499] [0.490] [0.597] [0.429] [0.641] [0.486] [0.435] [0.402] [0.639] [0.360]
area 0.000 0.000 0.000 0.000 0.000 0.000 0.000 0.000 0.000 0.000 0.000 0.000 [0.000] [0.000] [0.000] [0.000] [0.000] [0.000] [0.000] [0.000] [0.000] [0.000] [0.000] [0.000]
lat_abst 2.024* 1.277+ 1.513+ 1.284+ 2.213* 1.302+ 0.914 -0.146 1.499+ 1.577* -0.537 0.853 [0.871] [0.694] [0.826] [0.705] [0.935] [0.732] [1.401] [1.642] [0.795] [0.720] [1.678] [0.987]
access -0.409+ -0.353* -0.429* -0.319+ -0.411 -0.367+ -0.873* -0.502 -0.394* -0.202 -0.138 -0.174 [0.235] [0.164] [0.198] [0.161] [0.284] [0.185] [0.368] [0.344] [0.185] [0.164] [0.267] [0.159]
lnpop03 -0.054 0.046 0.156 0.049 -0.124 0.043 -0.040 0.001 -0.084 0.067 -0.237 0.017 [0.175] [0.112] [0.174] [0.125] [0.167] [0.117] [0.209] [0.187] [0.137] [0.107] [0.186] [0.097]
Constant 8.799+ 8.149** 3.817 8.083* 10.569* 8.016* 8.213 9.395* 9.370* 7.279* 14.858** 8.950** [4.571] [3.049] [4.377] [3.374] [4.621] [3.285] [5.273] [4.440] [3.566] [2.793] [5.353] [2.783]
Reg. Dummy Yes Yes Yes Yes Yes Yes Yes Yes Yes Yes Yes Yes Observations 91 87 90 86 86 83 82 78 88 84 88 84 R-squared 0.66 0.85 0.75 0.85 0.60 0.84 0.58 0.80 0.79 0.87 0.58 0.88
Standard errors in brackets + significant at 10%; * significant at 5%; ** significant at 1%
67

WBDB - Dep. Var. Average growth 1975-2003
(1) (2) (3) (4) (5) (6) f1) (8) (9) (10) (11) (12) N N N N N N N N N N N N
re~b 0.070+ 0.062 [0.037] [0.052]
re~k:v 0.393+ 0.309 [0.208] [0.282]
hEw 0.196 0.128 [0.127] [0.143]
gc 0.188 0.145 [0.165] [0.202]
tab 0.289 0.287 [0.196] [0.294]
dwl 0.202 0.008 [0.251] [0.255]
hinit 0.068 0.074 0.098+ 0.090+ 0.030 0.091 [0.059] [0.057] [0.050] [0.051] [0.071] [0.056]
kinit -0.004 -0.002 -0.001 -0.001 -0.008 -0.008 [0.012] [0.011] [0.012] [0.011] [0.016] [0.013]
leopen 0.068 -0.164 0.035 -0.212 -0.096 -0.373 0.195 -0.121 -0.061 -0.145 0.132 -0.114 [0.339] [0.362] [0.339] [0.361] [00406] [0.440] [0.322] [0.358] [0.377] [0.341] [00411] [0.356]
area 0.000* 0.000* 0.000* 0.000* 0.000 0.000* 0.000+ 0.000* 0.000+ 0.000* 0.000 0.000 [0.000] [0.000] [0.000] [0.000] [0.000] [0.000] [0.000] [0.000] [0.000] [0.000] [0.000] [0.000]
lacabst -0.771 -1.107 -0.678 -1.010 -0.507 -0.940 -0.377 -0.753 -0.242 -0.362 -0.124 -00410 [0.633] [0.718] [0.600] [0.688] [0.625] [0.725] [0.622] [0.685] [0.592] [0.605] [0.662] [0.629]
access -0.070 -0.041 -0.074 -0.047 -0.181 -0.113 -0.043 -0.009 0.229 0.250 0.071 0.059 [0.138] [0.140] [0.136] [0.139] [0.149] [0.158] [0.151] [0.156] [0.212] [0.255] [0.174] [0.143]
lnpop03 0.090 0.019 0.074 0.004 0.056 -0.011 0.086 0.022 0.086 0.063 0.136 0.036 [0.105] [0.098] [0.104] [0.099] [0.114] [0.112] [0.102] [0.095] [0.147] [0.096] [0.162] [0.096]
Constant -0.019 1.901 0.364 2.263 1.382 3.163 -0.584 1.393 0.221 1.005 -1.214 1.262 [2.755] [2.679] [2.742] [2.734] [3.174] [3.364] [2.659] [2.574] [3.693] [20487] [3.939] [2.606]
Reg. Dummy Yes Yes Yes Yes Yes Yes Yes Yes Yes Yesy Yes Yes Observations 91 87 91 87 91 87 90 86 87 84 88 85 R-squared 0.33 0.38 0.34 0.38 0.20 0.29 0.36 0040 0.36 0.37 0.09 0.33
Standard errors in brackets + significant at 10%; * significant at 5%; ** significant at 1 %
68

WBDB - Dep. Var. Average growth 1975-2003 - continued
(1) (2) (3) (4) (5) (6) (1) (8) (9) (10) (11) (12) N N N N N N N N N N N N
Sab 0.333 0.183 [0.220] [0.240]
rp 0.393 0.191 [0.251] [0.240]
pi 0.208+ 0.149 [0.116] [0.130]
pt 0.084 -0.056 [0.295] [0.469]
ec 0.148 0.251 [0.169] [0.279]
cab 0.216 0.160 [0.191] [0.207]
hlnit 0.086 0.083 0.094+ 0.100* 0.049 0.081+ [0.061] [0.063] [0.051] [0.050] [0.067] [0.044]
kinit 0.002 -0.010 0.002 -0.004 -0.011 -0.006 [0.013] [0.016] [0.011] [0.016] [0.013] [0.011]
lcopen 0.138 -0.164 0.469 0.033 -0.048 -0.350 0.201 -0.149 0.144 0.020 -0.033 -0.185 [0.397] [0.399] [0.475] [0.460] [0.362] [0.392] [0.371] [0.394] [0.326] [0.401] [0.339] [0.342]
area 0.000+ 0.000+ 0.000 0.000* 0.000 0.000+ 0.000+ 0.000+ 0.000 0.000* 0.000+ 0.000* [0.000] [0.000] [0.000] [0.000] [0.000] [0.000] [0.000] [0.000] [0.000] [0.000] [0.000] [0.000]
lacabst -0.252 -0.676 -0.649 -0.752 -0.090 -0.686 0.094 -0.110 -0.149 -0.653 .,.0.630 -0.883 [0.626] [0.672] [0.787] [0.661] [0.567] [0.670] [0.810] [1.330] [0.596] [0.718] [0.890] [0.938]
access -0.047 -0.032 -0.065 -0.078 -0.004 0.018 -0.149 -0.021 -0.008 -0.009 0.038 0.078 [0.169] [0.158]' [0.189] [0.151] [0.172] [0.169] [0.212] [0.279] [0.139] [0.164] [0.142] [0.151]
lnpop03 0.097 0.031 0.226 0.074 0.019 -0.026 0.081 0.045 0.079 0.012 0.011 0.005 [0.126] [0.108] [0.165] [0.117] [0.101] [0.107] [0.121] [0.151] [0.103] [0.107] [0.099] [0.093]
Constant -0.701 1.324 -3.793 0.297 1.426 3.025 -0.632 0.988 -0.335 1.345 1.638 2.152 [3.286] [2.955] [4.166] [3.165] [2.800] [3.004] [3.048] [3.597] [2.674] [2.786] [2.837] [2.647]
Reg. Dummy Yes Yes Yes Yes Yes Yes Yes Yes Yes Yes Yes Yesy Observations 91 87 90 86 86 83 82 78 88 84 88 84 R-squared 0.05 0.25 0.31 0.28 0.35 0.23 0.29 0.29 0.25 0.33 0.39
Standard errors in brackets + significant at 10%; * significant at 5%; ** significant at 1 %
69

Appendix 6 - Regressing human capital on institutions - Dep. Var. is Initial year human capital
Economic Institutions- Dependent Variable is initial year human capital (1) (2) (3) (4) (5) (1) (2) (3) (4) (5)
OLS OLS OLS OLS OLS N N N N N
ge 1.057** 1.858**
[0.228] [0.605]
rq 0.749** 2.866**
[0.267] [1.071]
re~b 0.207** 0.356*
[0.063] [0.147]
hfw 0.384* 0.791
[0.189] [0.526]
tab 0.634** 1.761*
[0.233] [0.849]
kinit 0.072** 0.047* 0.057** 0.065** 0.062** 0.114** 0.046 0.103* 0.139** 0.114
[0.019] [0.022] [0.021] [0.022] [0.023] [0.031] [0.040] [0.046] [0.051] [0.069]
leopen 1.447* 1.395* 1.542* 1.655* 1.705* 0.121 -0.192 0.562 -0.482 0.315
[0.585] [0.689] [0.703] [0.750] [0.702] [1.088] [1.543] [1.243] [1.754] [1.332]
lnpop03 0.273+ 0.131 0.151 0.217 0.263 -0.307 -0.679 -0.467 -0.703 -0.13
[0.161] [0.186] [0.187] [0.194] [0.185] [0.326] [0.491] [0.380] [0.482] [0.399]
area -0.000* 0.000 0.000 0.000 -0.00+ -0.000* 0.000 0.000 0.000 0.000
[0.000] [0.000] [0.000] [0.000] [0.000] [0.000] [0.000] [0.000] [0.000] [0.000]
lacabst 2.423+ 4.362** 2.522 4.001* 3.961* -1.074 1.225 -0.552 0.915 1.282
[1.379] [1.516] [1.585] [1.534] [1.498] [2.217] [2.632] [2.513] [2.816] [2.315]
access -0.306 -0.46 -0.46 -0.742+ -0.061 -0.088 -0.095 -0.419 -0.973 0.605
[0.365] [0.408] [0.368] [0.384] [0.428] [0.539] [0.642] [0.496] [0.594] [0.931]
Constant -8.201+ -5.46 -5.772 -7.303 -8.933+ 6.177 13.598 7.955 15.938 1.824
[4.556] [5.272] [5.151] [5.445] [5.024] [9.187] [13.446J [9. 982J [13.983J [10.026]
Reg. Dummy Yes Yes Yes Yes Yes Yes Yes Yes Yes Yes
Observations 89 93 87 87 84 89 93 87 87 84
R-squared 0.85 0.78 0.83 0.82 0.83 0.74 0.51 0.72 0.6 0.68
Standard errors in brackets,+ significant at 10%; * significant at 5%; ** significant at 1 % 70

Political Institutions - Dependent Variable is initial year human capital (1) (2) (3) (4) (5) (6) (1) (2) (3) (4) (5) (6)
OLS OLS OLS OLS OLS OLS IV IV IV IV IV IV
ps 0.526* 1.487+
[0.225] [0.779]
demo 0.252** 0.300*
[0.061] [0.128]
auto -0.218** -0.381*
[0.073] [0.171]
pol 0.125** 0.170*
[0.034] [0.073]
pr -0.424** -0.929**
[0.105] [0.348]
d -0.578** -1.267**
[0.126] [0.406]
kinit 0.073** 0.055** 0.064** 0.059** 0.058** 0.058** 0.121** 0.094** 0.101** 0.097** 0.048 0.054+
[0.021] [0.019] [0.020] [0.019] [0.020] [0.020] [0.042] [0.033] [0.034] [0.033] [0.033] [0.031]
lcopen 1.719** 2.282** 2.205** 2.247** 1.199+ 1.160+ 0.396 1.178 1.231 1.212 1.853 2.089+
[0.632] [0.655] [0.687] [0.669] [0.636] [0.620] [1.278] [1.365] [1.420] [1.381] [1.158] [1.181]
lnpop03 0.359* 0.229 0.176 0.200 0.018 0.048 -0.269 -0.553 -0.581 -0.562 0.082 0.154
[0.173] [0.181] [0.190] [0.184] [0.159] [0.155] [0.395] [0.480] [0.493] [0.483] [0.364] [0.369]
area -0.000* 0.000 0.000 0.000 0.000 0.000 -0.000* 0.000 0.000 0.000 0.000 0.000
[0.000] [0.000] [0.000] [0.000] [0.000] [0.000] [0.000] [0.000] [0.000] [0.000] [0.000] [0.000]
laLabst 3.109* 4.169** 4.900** 4.561** 3.416* 3.321* -1.687 2.681 3.905+ 3.227+ 2.538 2.630
[1.531] [1.322] [1.388] [1.346] [1.412] [1.376] [3.128] [1.826] [1.986] [1.866] [1.737] [1.764]
access -0.531 -0.265 -0.374 -0.302 -0.304 -0.334 -0.525 -0.375 -0.340 -0.354 0.129 0.071
[0.388] [0.358] [0.374] [0.365] [0.386] [0.373] [0.615] [0.492] [0.517] [0.500] [0.532] [0.506]
Constant -10.222* -12.210* -9.249+ -10.696* -1.483 . -1.521 5.500 4.236 6.571 5.154 -3.898 -5.670
[4.878] [4.851] [5.043] [4.916] [4.633] [4.508] [10.896] [12.757] [12.858] [12.725] [9.555] [9.737]
Reg. Dum Yes Yes Yes Yes Yes Yes Yes Yes Yes Yes Yes Yes
Observations 90 90 90 90 94 94 90 90 90 90 94 94
R-squared 0.82 0.84 0.82 0.83 0.80 0.81 0.65 0.75 0.73 0.74 0.73 0.72
Standard errors in brackets,+ significant at 10%; * significan,t at 5%; ** significant at 1%
71

Lef(31 Institutions- Dependent Variable is initial year human capital (1) (2) (3) (4) (5) (1) (2) (3) (4) (5)
OLS OLS OLS OLS OLS IV IV IV IV IV ,
gc 0.296 1.472+
[0.217] [0.836]
rl 1.259** 2.132**
[0.225] [0.568]
va 1.081** 1.823**
[0.237] [0.628]
cc 1.121** 1.604**
[0.205] [0.511]
xcons80 0.250** 0.442*
[0.080] [0.180]
kinit 0.063** 0.043* 0.041* 0.066** 0.058** 0.126* 0.062* 0.037 0.108** 0.082**
[0.022] [0.019] [0.020] [0.018] [0.019] [0.057] [0.028] [0.030] [0.032] [0.028]
lcopen 1.949* 1.246* 1.122+ 1.849** 2.114** 1.020 0.106 1.029 1.152 1.451
[0.738] [0.604] [0.641] [0.549] [0.679] [1.644] [1.110] [0.992] [1.005] [1.147]
lnpop03 0.268 0.205 0.172 0.417** 0.285 -0.518 -0.309 0.030 0.002 -0.215
[0.195] [0.162] [0.170] [0.152] [0.172] [0.505] [0.338] [0.322] [0.318] [0.355]
area -0.000+ 0.000 0.000 -0.000* -0,000* 0.000 0.000 0.000 -0.000* -0.000*
[0.000] [0.000] [0.000] [0.000] [0.000] [0.000] [0.000] [0.000] [0.000] [0.000]
laLabst 4.355** 2.107 3.343* 1.980 4.385** 0.017 -0.912 1.755 -0.476 2.986
[1.592] [1.406] [1.424] [1.303] [1.369] [3.307] [2.200] [1.790] [2.001] [1.796]
access -0.484 -0.216 -0.332 -0.391 -0.247 -0.026 -0.007 -0.193 -0.524 -0.063
[0.404] [0.357] [0.374] [0.340] [0.375] [0.755] [0.475] [0.434] [0.476] [0.497]
Constant -9.883+ -5.654 -5.001 -11.85** -11.977* 5.935 7.144 -2.380 -2.831 -2.394
[5.286] [4.574] [4.829] [4.255] [4.805] [13.115] [9.381] [8.612] [8.668] [9.846]
Reg. Dummy Yes Yes Yes Yes Yes Yes Yes Yes Yes Yes
Observations 86 94 94 89 91 86 94 94 89 91
R-squared 0.81 0.83 0.81 0.86 0.83 0.5 0.74 0.78 0.77 0.76
Standard errors in brackets, + significant at 10%; * significant at 5%; ** significant at 1 %
72

Social Institutions - Dependent Variable is initial year human capital
(1) (2) (1) (2)
OLS OLS N IV
£press 1.657** 3.608**
[0.416] [1.108]
gender 1.484** 4.944** [0.375] [1.711]
kinit 0.054** 0.045* 0.064* 0.013
[0.020] [0.021] [0.029] [0.043]
lcopen 1.126+ 1.642* 0.155 2.395+
[0.640] [0.641] [1.105] [1.426] lnpop03 0.138 0.086 -0.119 -0.108
[0.159] [0.158] [0.321] [0.393] area 0.000 -0.000+ 0.000 -0.000*
[0.000] [0.000] [0.000] [0.000]
lacabst 2.234 4.257** -0.687 3.193
[1.502] [1.395] [2.229] [2.175]
access -0.404 -0.875* -0.033 -1.310*
[0.383] [0.379] [0.503] [0.598]
Constant -4.300 -6.099 3.236 -7.372
[4.586] [4.610] [8.796] [11.376]
Reg. Dummy Yes Yes Yes Yes
Observations 95 95 95 95
R-squared 0.8 0.8 0.7 0.55
Standard errors in brackets,+ significant at 10%; * significant at 5%; ** significant at 1 %
73
