knowledge of diabetes mellitus and health-preventive
TRANSCRIPT

Walden UniversityScholarWorks
Walden Dissertations and Doctoral Studies Walden Dissertations and Doctoral StudiesCollection
2015
Knowledge of Diabetes Mellitus and Health-Preventive Behaviors Among African AmericanAdultsWanka NdiforWalden University
Follow this and additional works at: https://scholarworks.waldenu.edu/dissertations
Part of the Public Health Education and Promotion Commons
This Dissertation is brought to you for free and open access by the Walden Dissertations and Doctoral Studies Collection at ScholarWorks. It has beenaccepted for inclusion in Walden Dissertations and Doctoral Studies by an authorized administrator of ScholarWorks. For more information, pleasecontact [email protected].
Walden University
College of Health Sciences
This is to certify that the doctoral dissertation by
Wanka Ndifor
has been found to be complete and satisfactory in all respects, and that any and all revisions required by the review committee have been made.
Review Committee Dr. Eboni Green, Committee Chairperson, Public Health Faculty Dr. Joseph Robare, Committee Member, Public Health Faculty
Dr. Rodney Bowden, University Reviewer, Public Health Faculty
Chief Academic Officer Eric Riedel, Ph.D.
Walden University 2015

Abstract
Knowledge of Diabetes Mellitus and Health-Preventive Behaviors Among African
American Adults
by
Wanka Aloysius Ndifor
MPH, Universite Libre De Bruxelles, 2001
BPharm, Ahmadu Bello University, 1998
Dissertation Submitted in Partial Fulfillment
of the Requirements for the Degree of
Doctor of Philosophy
Public Health
Walden University
June 2015

Abstract
The purpose of this study was to gain insight into the risk within the African American
population of developing diabetes, its complications, and the benefits associated with
timely management and treatment of diabetes. The study also looked at how such
knowledge may be related to preventive health behaviors. The Risk Perception Survey-
Developing Diabetes and the Behavioral Risk Factor Surveillance System questionnaires
were employed in this study. The theoretical basis of this study was the health belief
model. This was a cross sectional, quantitative study with 126 participants. Descriptive
analysis was employed to calculate the mean scores and frequencies across each sub-
scale of the scoring tool. Among the participants, only 28.57% were found to be
knowledgeable of the risk factors of diabetes, and 74.60% were found to be
knowledgeable of the benefits of treating diabetes. Although 75.40%, 61.11%, and
64.29% of participants were found to be knowledgeable of healthy dieting, physical
exercise, and body weight control, respectively, fewer than 10% in each group indicated
they had implemented any of such behaviors. These data suggest a lack of knowledge of
the risk factors of diabetes amongst this population. These results remained unchanged
even when considering those with diabetes and their counterparts without the disease
separately and also across the different socio-economic groups of the sample. The
outcomes of this study may enhance understanding of diabetes among the African
American population. Similarly, the above findings might be able to facilitate
interventions that promote diabetes management within this population.
Knowledge of Diabetes Mellitus and Health-Preventive Behaviors Among African
American Adults
by
Wanka Aloysius Ndifor
MPH, Universite Libre De Bruxelles, 2001
BPharm, Ahmadu Bello University, 1998
Dissertation Submitted in Partial Fulfillment
of the Requirements for the Degree of
Doctor of Philosophy
Public Health
Walden University
June 2015

Acknowledgments
I would like to use this opportunity to thank Dr. Eboni Green, Dr. Joseph Robare,
and Dr. Rodney Bowden for serving as my chair and committee members, respectively,
in this research study. I also want to thank and appreciate all my friends and family
members who assisted me through this dissertation process.

i
Table of Contents
List of Tables ..................................................................................................................... vi
List of Figures ................................................................................................................... vii
Chapter 1: Introduction to the Study ....................................................................................1
Introduction ....................................................................................................................1
Types of Diabetes ..........................................................................................................2
Type 1 Diabetes or Immune Mediated Diabetes..................................................... 2
Type 2 or Noninsulin-Dependent Diabetes ............................................................. 3
Gestational Diabetes Mellitus (GDM) .................................................................... 4
Other Types of Diabetes ......................................................................................... 4
The Purpose of the Study ...............................................................................................5
Diabetes Risk Factors ....................................................................................................6
Management of Diabetes ...............................................................................................6
Problem Statement .........................................................................................................7
Significance....................................................................................................................9
Rational of the Study ...................................................................................................10
Framework ...................................................................................................................12
Research Questions and Hypothesis ............................................................................13
Nature of the Study ......................................................................................................16
Data Source for the Study ............................................................................................16

ii
Research Delimitations and Limitations ......................................................................17
Delimitations ......................................................................................................... 17
Limitations ............................................................................................................ 17
Definition of Terms......................................................................................................18
Summary ......................................................................................................................19
Chapter 2: Literature Review .............................................................................................21
Introduction ..................................................................................................................21
Literature Search Strategies .........................................................................................22
The Prevalence and Incidence of Diabetes ..................................................................24
Diabetes Prevalence by Sex and Age .................................................................... 30
The Prevalence of Obesity in the United States...........................................................31
Culture, Disease and Treatment ...................................................................................32
Naturalistic Approach ........................................................................................... 34
Personalistic Approach ......................................................................................... 34
The Relationship between Naturalistic and personalistic Approaches ................. 35
Disease and Illness .......................................................................................................36
Beliefs in Health Communication ................................................................................36
Socioeconomic Status and Diabetic Control ................................................................37
Perception ....................................................................................................................42
Definition .............................................................................................................. 42
iii
Preventive Health Behaviors................................................................................. 46
Perception of Disease Treatment .......................................................................... 48
Barriers to Diabetes Self-Management ........................................................................48
Framework ...................................................................................................................50
Summary ......................................................................................................................53
Chapter 3: Research Method ..............................................................................................57
Introduction ..................................................................................................................57
Research Design...........................................................................................................58
Instrumentation ............................................................................................................59
Risk Perception Survey for Developing Diabetes (RPS-DD)......................................59
Limitations of the Risk Perception Survey for Developing Diabetes ................... 62
The Behavioral Risk Factor Surveillance System .......................................................62
Validity and Reliability of Risk Perception Survey for Developing Diabetes ............62
Validity and Reliability of the Behavioral Risk Factor Surveillance System ..............63
Sampling and Setting ...................................................................................................64
Sampling ............................................................................................................... 64
Setting 65
Data Collection ............................................................................................................66
Power of the Study .......................................................................................................67
Data Analysis ...............................................................................................................68

iv
Study Variables ..................................................................................................... 68
Analysis................................................................................................................. 70
Analysis of Research Questions............................................................................ 73
Protection and Confidentiality of Participants .............................................................77
Agenda for Survey Completion ...................................................................................78
Limitations of the study ...............................................................................................78
Summary ......................................................................................................................79
Chapter 4: Results ..............................................................................................................80
Introduction ..................................................................................................................80
Survey Response ..........................................................................................................80
Socio-Demographic Characteristics .............................................................................81
The Risk Perception Survey for Developing Diabetes (RPS-DD) Scoring Tool ........84
Reliability .............................................................................................................. 84
Analysis of Research Questions...................................................................................90
Inferential Analysis Related to Hypothesis 1........................................................ 90
Conclusion Related to Hypothesis 1 ..................................................................... 92
Inferential Analysis Related to Hypothesis 2........................................................ 92
Conclusion Related to Hypothesis 2 ..................................................................... 93
Inferential Analysis Related to Hypothesis 3........................................................ 94
Conclusion Related to Hypothesis 3 ..................................................................... 96
v
Inferential Analysis Related to Hypothesis 4........................................................ 97
Conclusion Related to Hypothesis 4 ..................................................................... 98
Inferential Analysis Related to Hypothesis 5........................................................ 99
Conclusion Related to Hypothesis 5 ................................................................... 101
Summary ....................................................................................................................101
Chapter 5: Discussion, Conclusions, and Recommendations ..........................................104
Introduction ................................................................................................................104
Conclusions and Literature Review Comparisons .....................................................105
Concluding Statement ................................................................................................116
Recommendations for Action ....................................................................................117
Recommendations for Further Study .........................................................................118
Implications for Social Change ..................................................................................119
Study Limitations .......................................................................................................120
References ........................................................................................................................122
Appendix A: Risk Perception Survey-Developing Diabetes ...........................................136
Appendix B: Scoring Chart ..............................................................................................144
Appendix C: Consent Form .............................................................................................145
Curriculum Vitae .............................................................................................................148

vi
List of Tables
Table 1. Estimated Numbers of People With Diabetes by Region for 2000 and 2030 and
Summary of Population Changes .............................................................................. 25
Table 2. Blood Sugar Levels in a Fasting State ................................................................ 27
Table 3. Alpha Coefficient of the Risk Perception Survey for Developing Diabetes ...... 63
Table 4. Study variables and instruments ......................................................................... 69
Table 5.Time Frame for Survey Instrument Distribution and Collection ........................ 78
Table 6. Survey Response of Participants......................................................................... 81
Table 7. Educational Status of all Participants ................................................................. 82
Table 8. Educational Status of Participants With Diabetes .............................................. 83
Table 9. Annual Income of All Participants ..................................................................... 83
Table 10. Annual Income of All Participants With Diabetes ........................................... 84
Table 11. Frequency of number of correct responses ....................................................... 87
Table 12. Comparative Disease Risk and Comparative EnvironmentalRrisk .................. 89
Table 13. Summary of Mean Scores Across the Subscales .............................................. 91
Table 14. Knowledge of benefits associated with diabetes treatment .............................. 93
Table 15. Knowledge of Rrisk Factors of Diabetes Stratified by Diabetes Status ........... 94
Table 16. Knowledge of Treatment Benefits of Diabetes Stratified by Diabetes Status .. 96
Table 17. A tabulation of Healthy Habit Practices* ....................................................... 100

vii
List of Figures
Figure 1. Global diabetes prevalence by age and sex ....................................................... 31
Figure 2. Basic elements of the health bBelief model ...................................................... 50

1
Chapter 1: Introduction to the Study
Introduction
Diabetes is defined as a group of chronic diseases that usually manifest as high
blood glucose levels, due to the pancreas inability to produce insulin and/or the body's
inability to use insulin (American Diabetes Association [ADA], 2012); World Health
organization [WHO], 2012). Such a lack of insulin can either be absolute, in which case
no insulin is produce due to the fact that the pancreas are completely destroyed or
relative, where the pancreas are only partially destroyed and as a results are unable to
produce enough insulin for the body. The above classification of absolute or relative,
which is based on the amount of insulin produced by the islet of Langerhans (insulin
producing cells ) of the pancreas, has contributed in giving birth to the different types of
diabetes namely Type 1 diabetes, Type 2 diabetes and gestational diabetes. Genetic and
environmental factors combined have been attributed to both the insulin resistance and
the loss of cells of islets of Langerhans seen with diabetic patients (McPhee, Papadakis,
& Rabow, 2012). The Centers for Disease Control and Prevention (CDC; 2012) listed
diabetes as one of the most serious medical conditions the United States faces today.
Clinically, diabetes will manifest as glucose intolerance and also as alteration in
lipid and protein metabolism. These metabolic abnormalities over long periods will lead
to complications such cardiovascular diseases, retinopathy, nephropathy, and neuropathy
(Koda-Kimble et al., 2004). Diabetes remains the only single disease that affects virtually
every system of the human body and to date, there remains no effective treatment. Thus,

2
it is considered a serious medical condition that places many diabetics at risk for greater
morbidity and mortality when compared to any non-diabetic population.
Types of Diabetes
The International Diabetes Federation (IDF) has recognized three main types of
diabetes: Type 1 diabetes, Type 2 diabetes, and gestational diabetes (IDF, 2011). Type 2
diabetes is the most prevalent of all types of diabetes. Less common types of diabetes
include diabetic insipidus, neonatal diabetes mellitus (NDM), and maturity-onset diabetes
of the young (MODY; McPhee et al., 2012).
Type 1 Diabetes or Immune Mediated Diabetes
Type 1 diabetes, which is also called insulin dependent, immune mediated or
juvenile-onset diabetes, results from an autoimmune disorder whereby the body’s defense
system destroys the insulin-producing cells (Islets of Langerhans) within the pancreas.
Individuals with Type 1 diabetes produce very little or no insulin and account for
approximately 10% of all cases of diabetes in the United States (IDF, 2011). The rate of
pancreatic cell destruction is variable, being rapid in some individuals and slow in others.
The highest incidences of Type 1 diabetes have been noted within the Scandinavian and
Northern European countries, where the annual incidence may be as high as 40 per
100,000 children usually aged 14 years or younger. In the United States, the annual
incidence of Type 1diabetes is just below 16 per 100,000 children, with higher rates seen
in states that are more densely populated with persons of Scandinavian descent such as in
Minnesota (McPhee et al., 2012). This higher incidence observed in Scandinavian and

3
Northern European countries has been attributed to changes in environmental factors like
obesity (McPhee et al., 2012).
Type 2 or Noninsulin-Dependent Diabetes
Type 2, or noninsulin-dependent or adult-onset, diabetes accounts for more than
90% of all diabetic cases in the United States (IDF, 2011). Type 2 diabetes is
characterized by insulin resistance and/or relative insulin deficiency from the pancreas,
either of which may be present at the time Type 2 diabetes actually becomes clinically
manifest. Type 2 diabetes usually manifests after the age of 40 years, thus the name
adult-onset diabetes, though recent findings from the National Institutes of Health have
revealed that Type 2 diabetes can occur earlier especially in populations with high
diabetes prevalence like African Americans (National Diabetes Information
Clearinghouse [NDIC], 2007; McPhee et al., 2012).
Obesity is considered the most important environmental factor causing insulin
resistance, although the degree and prevalence of obesity varies among the different
racial groups with Type 2 diabetes in the United States (McPhee et al., 2012). African
Americans are afflicted with obesity more than other racial groups in the United States,
which may explain the high prevalence of Type 2 diabetes amongst this ethnic group
(ADA, 2012; CDC 2012). Type 2 diabetes can and often does go undetected for many
years, and in most cases, the diagnosis is only made after associated complications or
through an abnormal or blood glucose test (IDF, 2011).
4
Despite the strong influence of environmental factors like obesity in the
development of diabetes, present data suggest that genetic factors may also be involved
(McPhee et al., 2012). There is emerging evidence that more than 20 regions of the
genome may be involved in genetic susceptibility to Type 1diabetes. First degree
relatives have been found with a higher risk of developing Type 1 diabetes than unrelated
individuals from the general population (Dorman & Bunker, 2000). Similarly, studies
have shown that first degree relatives of individuals with Type 2 diabetes are about 3
times more likely to develop Type 2 diabetes when compared with individuals without a
positive family history of diabetes ((Florez, Hirschhorn, & Altshuler, 2003; Gloyn, 2003).
Thus, it is an indication that Type 1 and 2 diabetes has a strong genetic component.
Gestational Diabetes Mellitus (GDM)
Gestational diabetes mellitus refers to abnormal high blood glucose levels that
occur during pregnancy. According to the CDC, GDM affects between 2% and 10% of
pregnancies in the United States and 5% and 10% of women in this category eventually
are diagnosed with Type 2 diabetes after giving birth (CDC, 2012). More than 90% of the
time, GDM affects women’s health postpartum, and such women are at increased risk for
future episodes of GDM, Type 2 diabetes or prediabetes resulting from impaired glucose
tolerance and impaired fasting glucose (Kim et al., 2007).
Other Types of Diabetes
Less common types of diabetes include diabetes insipidus, NDM, and MODY.
Diabetes insipidus is an uncommon disease characterized by an increase in thirst and the
5
passage of large quantities of urine, usually caused by a deficiency in the hormone
vasopressin or resistance produced by the body in taking up the hormone (McPhee et al.,
2012). NDM, on the other hand, is a monogenic form of diabetes usually seen in neonates
within the first 6 months of life. This is a rare condition affecting approximately one in
100,000 to 500,000 live births (National Diabetes Information Clearinghouse, 2007).
Infants with NDM usually are not able to produce enough insulin, which leads to an
increase in blood glucose. MODY usually occurs in adolescence or early adulthood and
results from a gene mutation that limits the ability of the pancreas to produce insulin.
MODY accounts for approximately 1 % of all cases of diabetes in the United States, and
just as for other types of diabetes, family members are at greatly increased risk for the
condition.
The Purpose of the Study
The purpose of this study was to measure the level of understanding or awareness
of diabetes within the African American adult population. The focus of the study was on
the main types of diabetes, namely Type 1 diabetes, Type 2 diabetes, and gestational
diabetes as long as the criteria for inclusion is met as discussed in Chapter 3. Knowledge
of diabetes was evaluated in this study by considering the following variables: knowledge
of risk factors, knowledge of diabetes complications, knowledge of benefits associated
with timely management and treatment of diabetes, and knowledge of preventive health
behaviors. The focus of this study was on the mean values of these variables. Estimation
of parameters and testing of hypothesis was never employed in this study. This was due
6
to the fact that the study does not seek to examine and extrapolate about any relationships
between these variables.
Diabetes Risk Factors
An understanding of disposing factors or associated risk factors for developing
diabetes is important in determining a population’s perception of the disease. Individuals
who are more prone to developing diabetes later in life have the following characteristics.
They are over 45 years of age, have impaired glucose tolerance (IGT) and/or impaired
fasting glucose (IFG), are overweight, have a family history of disease, are inactive, have
a low amount of high density triglycerides, have high blood pressure, and are members of
ethnic groups such as African Americans and Hispanics, (Brunton & Gilman, 2011).
Further, women who have had gestational diabetes or had a baby weighing 9 pounds or
more at birth are more likely to experience the disease in the future than their
counterparts who had not experienced such situations or conditions (ADA, 2012).
Management of Diabetes
Due to the complexity of diabetes, the management of the disease has always
been three fold: diet, medications, and exercise. These components interact with each
other to the extent that no assessment and modification can be made on one without
taking the others into consideration (Koda-Kimble et al., 2004). Diabetes is a chronic
disease that requires continuous medical care and self-management to reduce morbidity
and mortality associated with long-term complications (Calvin et al., 2011). Assessing an
individual’s risk perception of the disease is important, but this by itself may be

7
insufficient due to the fact that such an assessment must take into considerations factors
like diet, medications and physical activity. Therefore it is imperative to gain a full
understanding of the perception of diabetes by specifically considering the following: (a)
risks factors and complications, (b) benefits of effective and timely management, and (c)
maintaining healthy lifestyles.
Problem Statement
Many researchers have shown that healthier behaviors can prevent diabetes and
resulting complications among populations that are at high risk of the disease (Brewer,
Weinstein, Cuite, & Herrington, 2004; Hivert, Warner, Shrader, Grant, & Meigs,
2009).Therefore, developing an understanding of the risk factors of a disease can be an
important determinant of behavioral change (Kim et al., 2007). A more accurate
perception of diabetic risk might imply a higher degree of prevention of the disease.
According to this school of thought, which is the theoretical basis of the health belief
model (HBM), higher perception of risk would result in healthier behaviors especially in
the area of diet, smoking and physical inactivity (Janz & Becker, 1984; Kim et al., 2007)
This ideal relationship of higher perception of risk of a disease leading to a higher
degree of prevention does not hold true in all populations (Knowler et al., 2002;
Lindström et al., 2003). Knowler et al. (2002) and Lindström et al. (2003) carried out
separate interventions on a mixed ethnic population, including African Americans, to
determine the effects of lifestyle modifications on the incidence of diabetes mellitus.
They concluded that intensive lifestyle interventions were able to produce long-term

8
beneficial changes in diet and physical activity, which eventually reduced the risk of
diabetes mellitus. However, the validity of generalizing such results to the general public
was uncertain because the interventions worked with some societies or ethnic groups but
not with others due to influences in economic, social, and cultural factors.
In the United States, ethnic minorities are disproportionately burdened by most
chronic diseases including diabetes (Calvin et al., 2011). African Americans are twice as
likely to develop Type 2 diabetes when compared with their European American
counterparts, and diabetes affects about 25% of all African American women over the
age of 55 years and 25% of all African Americans between the ages of 65 and 74 years
(Calvin et al., 2011), double the rate of their European American counterparts. The
incidence of this disease has tripled within the past 3 decades within the African
American population (Shaw-perry, 2006). According to the American Diabetes
Association, diabetes is the fifth leading cause of death in the United States. However,
diabetes is the third leading cause of death among the African American population
(ADA, 2012). Thus, this study is an attempt to fill a gap in knowledge by evaluating the
knowledge of African American adults on diabetes risk factors, diabetes complications,
treatment benefits and health preventive behaviors. Socio-economic status has been
identified as an important factor in the management and coping with diabetes (Calvin et
al., 2011). Thus, the knowledge of African American adults on diabetes risk factors,
diabetes complications, treatment benefits and health preventive behaviors will also be
evaluated across the different Socio-economic groups within this population. Finally, the

9
relationship between these diabetes risk factors and its complications and specific health
behaviors will be examined. The analysis will be compared with those with the disease
and their counterparts without the disease.
Significance
The purpose of this cross sectional study is to evaluate diabetes knowledge of
African Americans within the different socioeconomic groups while considering the
following main variables:
1. Knowledge of risk factors. Some of the risk factors of diabetes to be evaluated
include knowledge of age, race, family history of diabetes, gestational
diabetes etc.
2. Knowledge of Diabetes complications. Some of these complications include
blindness, foot amputation, arthritis, heart disease, cancer, high blood
pressure, stroke etc.
3. Knowledge of benefits associated with timely management and treatment of
diabetes.
4. Knowledge of Preventive health behaviors. These include healthy eating plan,
physical activity, quitting smoking and controlling weight.
Measuring the level of awareness of the above variables will be the focus of this
study. Quantifying knowledge of risk factors, diabetes complications, treatment benefit of
the population within the different socioeconomic groups and how such knowledge has or
has not been translated to healthier preventive behaviors is the expected outcome of this

10
study. Multi-component interventions that target knowledge on race, social, emotional
and family processes which facilitate diabetes management have been found to be more
potent than interventions that have targeted only one behavioral process (Wagner, 2011;
Walker, Mertz, Kalten, & Flynn, 2003). An important issue at this point is being able to
identify these multi elements needed for such interventions. Thus, the results of this
study should be able to provide some of that knowledge that might facilitate researchers
in developing future interventions especially in the area of behavioral interventions that
promote diabetes self-management. These interventions will assist in improving the
health status of this population.
Understanding outcomes is of prime importance because diabetes is a chronic
disease in which patient self-management is paramount in its control and reduction of
risk of long term complications (Calvin et al., 2011, Becker & Janz, 1984). Patient
adherence to treatment is influenced by understanding of its benefits and associated risk
(Nair, Levine, Lohfeld, & Gerstein, 2007). Thus, the implications for positive social
change will be that the outcomes of this study will potentially enhance understanding of
diabetes among the African-American population. Knowledge can only be most valuable
when put to use for the greater good of the population (Walden, 2012).
Rational of the Study
The purpose of this study was to expand on the concept that health disparities still
exist among the different ethnic groups in the United States and minority groups
including African Americans are more adversely affected. A better understanding of the

11
factors influencing the existence of such disparities and also, an understanding of the
extent to which the population understand their present predicament is very important in
reducing or eliminating such gap. Research has shown that general knowledge and
awareness of a health hazard in most cases, is the first step in taking action to reduce the
disease (Olden & White, 2005). Documenting the knowledge or awareness level of this
population will put healthcare professionals at a better position in the treatment,
management and prevention of future complications for this ethnic group. Many factors
have been documented in recent years as having considerable influence in the racial
disparity of health in the United States. These include poverty, education, access to
healthcare and preventive health behaviors.
African Americans have continued to maintain higher rates of most chronic
diseases. The development of diabetes within this population has been attributed to
socioeconomic factors that lead to suboptimal health care (Calvin et al., 2011).
Environmental conditions and unhealthy lifestyles seem to account only for a fraction of
the excess risk. Calvin et al., (2011) in their recent study, noted that research within this
population has not yet explored population personal issues such as illness perception,
treatment perception and their beliefs in their chances of acquiring diabetes and its
complications ( disease risk perception).
Thus, it is hoped this study will identify the above areas and may facilitate the
developing of interventions that will be able to aid in reducing the burden of this disease.
Specifically, the data collected on the area of risk knowledge, personal risk, treatment

12
benefits and preventive health behaviors should be able to pinpoint the focus of such an
intervention(s). Ideally, a patient is more likely to adhere to diabetic management if there
is a higher perceived risk for the disease and its complications which is the theoretical
basis of the HBM (Janz & Becker, 1984; Kim et al., 2007. That is, patient’s perception of
an illness will have the potential to influences adherence to their diabetic regimen.
The above mentioned study by Calvin et al., (2011) adapted a similar approach to
this research work but was focus only on African American who was of low
socioeconomic status. As such, the results could not be generalized to the general African
American population. This study cuts across all SES and this not only improve
generalizability but it also offers the opportunity to diabetic educators to be able to
provide tailored intervention programs.
Framework
The theoretical basis of this study will be the HBM. This is a conceptual
formulation for understanding why individuals did or did not engage in a wide variety of
health related behaviors (Janz & Becker, 1984). This model is based on the belief that
behavior is influenced by two main factors namely:
(a) the value the individual gives to a particular behavior and
(b) The individual’s belief that a given action will achieve a set goal.
In other words, the HBM explores or explains the perceived susceptibility to a
health problem which is the feeling of vulnerability to a condition, re-susceptibility and
the belief in diagnosis i.e. one’s perception of the risk of having the disease. The HBM

13
also explains perceived severity, which is the feeling of the individual of the seriousness
upon contracting the disease and the Perceived benefits of treatment of the disease and
Perceived barriers to undertaking the recommended behavior. The construct of this model
has been expanded in recent years to include cues of action, motivating factors and self-
efficacy.
The HBM tends to provide a framework that can be used to motivate people
towards a positive health outcome by using the desire to avoid a negative health outcome
as the major motivating factor (Recapp, 2012). Thus avoiding a negative health
consequence remains the key element in the application of this model.
Until recently, the HBM has been far the most commonly used theory in health
education and promotion (Turner et al., 2004). This model tends to relates only to
cognitive factors that predispose an individual to a health behavior that ends up with a
belief in self-efficacy for that behavior (Cengage, 2002). Factors modifying or
reinforcing behaviors are not well handled with this model and these become even more
important when predicting complex lifestyle behaviors that need to be maintained over a
long period of time. Thus it is slowly been replaced by other theories with more
predictive power.
Research Questions and Hypothesis
The following research questions will be addressed by this study:
1. What proportion of the African American adult population, are aware of the risk
factors and complications associated with diabetes mellitus?

14
Null Hypothesis 1: There is no relationship between the African American adult
population and their knowledge of risk factors and complications associated with
diabetes mellitus.
Alternative Hypothesis 1: There exists a relationship between the African
American adult population and their knowledge of risk factors and complications
associated with diabetes mellitus.
2. What proportion of the African American adult population, are aware of the
benefits associated with effective treatment and management of diabetes mellitus?
Null Hypothesis 2: There is no relationship between the African American adult
population and their knowledge of benefits associated with effective treatment
and management of diabetes mellitus.
Alternative Hypothesis 2: There is a relationship between the African American
adult population and their knowledge of benefits associated with effective
treatment and management of diabetes mellitus.
3. What is the relationship between African American adults with diabetes mellitus
and their counterparts without the disease when considering knowledge or
awareness of the risk factors, complications and treatment benefits of the disease?
Null Hypothesis 3: There is no significant difference between African American
adults with diabetes mellitus and their counterparts without the disease when
considering knowledge or awareness of the risk factors, complications and
treatment benefits of the disease.
15
Alternative Hypothesis 3: There is a significant difference between African
American adults with diabetes mellitus and their counterparts without the disease
when considering knowledge or awareness of the risk factors, complications and
treatment benefits of the disease.
4. What is the relationship between African American adults with diabetes mellitus
and their counterparts without the disease when considering knowledge or
awareness of the risk factors, complications and treatment benefits of the diabetes
mellitus when measured across the various socio-economic groups?
Null Hypothesis 4: There is no significant difference between African American
adults with diabetes mellitus and their counterparts without the disease when
considering knowledge or awareness of the risk factors, complications and
treatment benefits of diabetes mellitus when measured across the various socio-
economic groups.
Alternative Hypothesis 4: There is a significant difference between African
American adults with diabetes mellitus and their counterparts without the disease
when considering knowledge or awareness of the risk factors, complications and
treatment benefits of diabetes mellitus when measured across the various socio-
economic groups.
5. What is the relationship between knowledge of diabetes risk factors and
knowledge of health preventive behaviors and as such translated into any lifestyle
modifications within this ethnic group?
16
Null Hypothesis 5: There is no relationship between knowledge of diabetes risk
factors and knowledge of health preventive behaviors and as such no lifestyle
modifications were seen within the African American adults’ population.
Alternative Hypothesis 5: There exist a relationship between knowledge of
diabetes risk factors and knowledge of health preventive behaviors and this has
been translated into healthy lifestyle modifications within the African American
adults’ population.
Nature of the Study
Quantitative analysis will be the method utilized for this study. Quantitative
studies are capable of producing objectively, quantifying variables which is the focus of
this study (Creswell, 2008). The few studies that have been engaged in similar studies as
such have in most cases been qualitative and have looked at this problem by comparing
different subgroups or ethnic groups. Thus, this study is focused on quantifying the
magnitude of how African Americans are aware of the risk involved with having
diabetes, the benefits of timely treating the diseases in order to avoid complications and
the associated health preventive behaviors. These variables will be compared between
those already having the disease and those without the disease. Socioeconomic status
across both groups will also be examined.
Data Source for the Study
The Risk Perception Survey for Developing Diabetes (RPS-DD) was used to
collect data for the study. The RPS-DD questionnaire has been the primary source for
17
data collection in similar studies (Choi et al., 2012; Pinelli et al., 2009; Walker et al.,
2003). The RPS-DD is a validated instrument aimed at capturing multiple dimensions of
perceived risk for developing diabetes within any population. The RPS-DD has been used
in many quantitative studies due to the fact that internal reliability is well documented.
This instrument was developed by Elizabeth Walker at the Diabetes Research institute at
Albert Einstein College of Medicine of Yeshiva University (Walker & Wylie-Rosett,
1998).
Research Delimitations and Limitations
Delimitations
Lack of external validity may be the major delimitation noted in this study due to
a small sample size. This study had only 98 participants, which may not be a true
representation of the African American population. Because all the participants were
aware this was a research study, there was a chance that they were dishonest in their
responses to some of the questions.
Limitations
The questionnaire comprises closed-ended questions. This indicates that
participants who may have had in-depth knowledge about diabetes were not given the
opportunity to include it on the questionnaire. Participants’ understanding or
interpretation of the questions on the questionnaire may have also been a limiting factor.
This is a quantitative study, which may limit an understanding of why there was a low or

18
high perception of risk of diabetes and its complications within this population when
compared to exploratory or qualitative methodology.
Definition of Terms
Terms as they applied to this study are defined below.
African American: In this study, the term will be used for any individuals having
an origin in ancestry of the African tribes in the Sub-Saharan region or individuals that
can be identified with any of the Black cultures.
Perception: According to the Oxford English Dictionary, perception is the ability
to hear, see or to be aware of the existence of something (Oxford University press, 2013).
This study is focus on awareness or knowledge of the existence of risk factors, treatment
benefits, complications and preventive health behaviors.
Risk factors: Any condition, characteristic, or even behaviors that have the
possibility of increasing diabetes mellitus within the African American adults’
population.
Treatment benefits: Refers to the timely administration of any diabetic drug as
prescribed by the physician (medication compliance)
Preventive health behaviors: Refers to any activity undertaken by an individual
mainly for the purpose of disease prevention. The most common preventive behaviors:
include healthy dieting, smoking cessation and physical activity.

19
Socioeconomic status: The American Psychological Association conceptualized
this term as the social standing or class of an individual or group which is measured as a
combination of education, income and occupation (APA, 2012).
Summary
The focus of this study is to gain insight into diabetes risk knowledge, awareness
of diabetes complications, and benefits of timely management and treatment amongst
African American adults. This study also looked at how such knowledge or awareness
may be related to healthy behaviors within the African American population. The results
of these variables will be compared between those already having the disease and their
counterparts without the disease. Also, how the above knowledge of risk factors, diabetes
complications, treatment benefits and health preventive behaviors are distributed across
the different socioeconomic classes will be evaluated.
Chapter 2 will focus on the incidence of diabetes in the United States. Precisely,
this will look at the distribution of the disease within the different ethnic groups and this
will be tailored down to the African American population in an effort to pin-point the
need of some urgent interventions for this population. This will be followed by a review
of the important studies in this area. Finally, the HBM will be evaluated and as an
applicable model for this ethnic group. Chapter 3 will focus on the methodology that used
in the study. This is a quantitative study that applies a survey in which data will be
collected through a questionnaire. A modified version of the RPS-DD, in which some
items have been added to be able to measure socioeconomic status and health behaviors,

20
was adapted for use in this study. The final sections of this study include Chapter 4,
where the results and the analyses of the study research questions are presented, and
Chapter 5, which summarizes the findings, draws conclusions from the data, and suggests
recommendations for action and for further research. Chapter 5 also presents implications
for social change and explains the limitations of the study.

21
Chapter 2: Literature Review
Introduction
Ethnic minorities in the United States are disproportionately affected by most
chronic diseases with African Americans twice as likely to develop Type 2 diabetes
compared with their White counterparts (Calvin et al., 2011). In fact, the incidence of
diabetes has tripled within the past 3 decades within the Black population (Shaw-Perry,
2006). Diabetes is the fifth leading cause of death in the United States meanwhile within
the African American population; diabetes is the third leading cause of death (ADA,
2012). The purpose of this study is to attempt to fill a gap in knowledge by evaluating the
knowledge of African American adults on diabetes risk factors, diabetes complications,
treatment benefits and health preventive behaviors.
In Chapter 2, the diabetic epidemic in the United States is reviewed, with specific
emphasis on the African American adult population as an ethnic group and the
prevalence and incidence of the disease and its associated complications in the United
States. The incidence and prevalence of diabetes within the African American adult
population will be analyzed with careful consideration of national figures. The HBM is
the theoretical model underlying this study. Careful consideration was given to review
how the HBM can be applied to alleviate health disparity among the African American
population. The concept of perception of risk of diabetes, treatment benefit, socio-
economic status and preventive health behaviors which are the variable of focus for this
study were also discussed and how these can relates to the African American population.
22
Finally, just as Calvin et al. (2011) mentioned in a recent study in which the authors
explored the perception of risks of diabetes complications among African Americans,
there is scarcity of published research that actually focuses on perception of risk factors
for diabetes patients in the United States. This paucity of research studies on knowledge
of risk factors of diabetes becomes even more apparent when dealing with a single ethnic
group like the African American adults population (Allen, Purcell, Szanton, & Dennison,
2010; Cullen & Buzek, 2009; Edmonds-Myles, Tamborlane and Grey, 2010; Lipman et
al., 2012); McKenzie & Skelly, 2010; Vivian, Becker, & Carrel, 2012). Based on this
assertion, the final section of this chapter was focused on reviewing specifically, some of
these recent research works that have highlighted this problem within this ethnic group
and the country at large, with the aim of defining the problem and scope of this study.
Literature Search Strategies
A cross-section of the literature was analyzed for this study. Articles that focused
on perception or knowledge of diabetes risk factors, complications, treatment benefits
and preventive health behaviors were selected using the EBSCO host database (Research
Starter-Education, Academic Search Premier, CINAHL Plus, Medline, Cochrane and
Thoreau,), the American Journal of Public Health‘s search engine, the Journal of the
American Medical Association’s search engine, Health and Human Services, or CDC,
The United States National library of Medicine (PubMed), The ADA and text books on
diabetes mellitus and associated complications, treatment/management, health perception

23
and research design. Internet searches were focused primarily on Google and Google
Scholar.
Keywords and phrases, including the search methods were identified. Keywords
used for perception included perception, understanding, awareness and knowledge while
the search terms for Socioeconomic status included socioeconomic status, social class,
income, education and occupation. Health behavior was searched using the following
terms: smoking, cigarette, exercise, physical activity, alcohol, nutrition and diet. Other
terms or phrases used included risk factors, African American, diabetes, diabetes
complications, incidence of diabetes and prevalence of diabetes. These words were used
singularly and also in combination during each search. The keywords were first
combined to gather information on the general public and this was next tailored to the
African American population. A search was also made on the reference lists of several
articles especially those retrieved through the Google scholar website.
All the articles retained for this study were saved using the reference manager
Zotero. Zotero is a free, easy-to-use research tool that can assist in the collection,
organization and citation of research sources (references). Articles available in full text
PDF were downloaded immediately while articles that were downloaded prior to
completion of the literature review were retrieved again in order to ensure accessibility.
Additional references that were not fully accessible online were requested through the
university of Maryland library system or through librarians at the Walden University‘s
Library system.

24
Most of the articles that were retained for the study extended back approximately
6 years to the year 2007. A few older articles were retained because of their originality
and also due to their value to the present study.
The Prevalence and Incidence of Diabetes
The prevalence of diabetes mellitus has reached epidemic levels worldwide
(Zimmet, Alberti, & Shaw, 2001). Estimates from the World Health Organization (WHO)
are that by 2030, 366 million people will have diabetes; an increase from 171 million
people since 2000 (Wong &Toh, 2009), representing more than a two-fold increase
within 3 decades. Similar estimates have been documented by the United Nations
population division as shown in Table 1 (Wild, Roglic, Green, Sicree, & King, 2004).
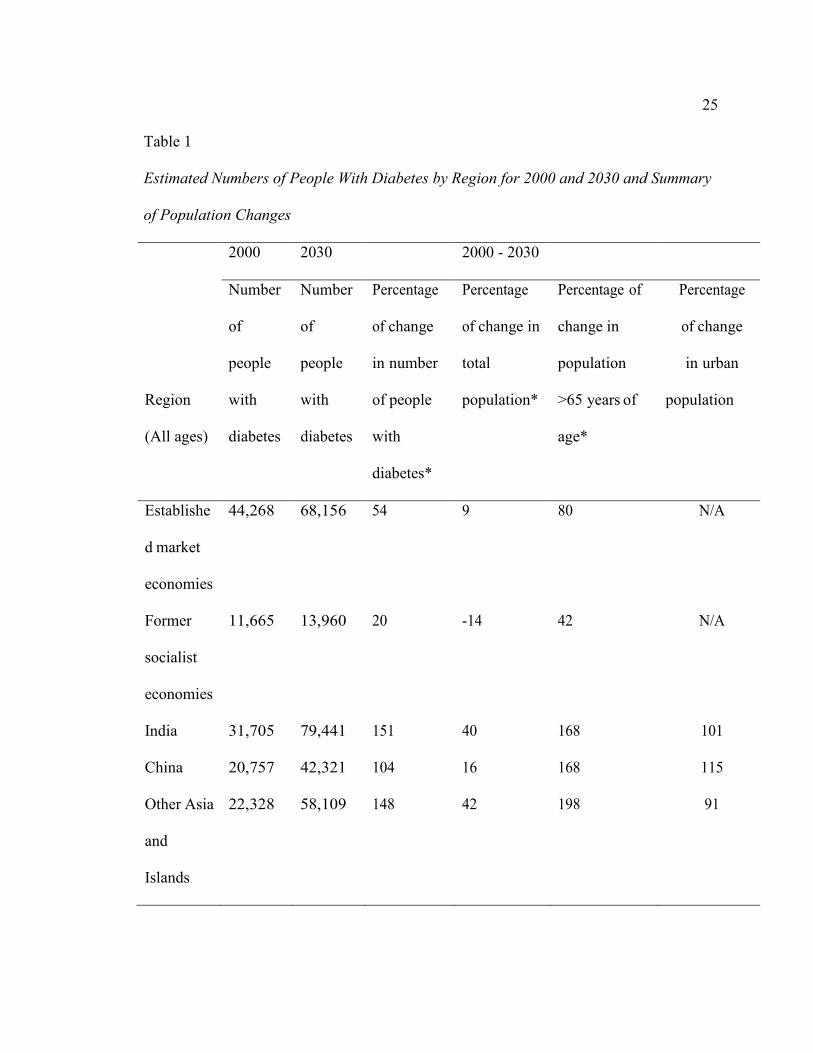
25
Table 1
Estimated Numbers of People With Diabetes by Region for 2000 and 2030 and Summary
of Population Changes
2000 2030 2000 - 2030
Region
(All ages)
Number
of
people
with
diabetes
Number
of
people
with
diabetes
Percentage
of change
in number
of people
with
diabetes*
Percentage
of change in
total
population*
Percentage of
change in
population
>65 years of
age*
Percentage
of change
in urban
population
Establishe
d market
economies
44,268 68,156 54 9 80 N/A
Former
socialist
economies
11,665 13,960 20 -14 42 N/A
India 31,705 79,441 151 40 168 101
China 20,757 42,321 104 16 168 115
Other Asia
and
Islands
22,328 58,109 148 42 198 91

26
Sub-
Saharan
Africa
7,146 18,645 161 97 147 192
Latin
America
13,307 32959 148 40 194 56
Middle
Eastern
Crescent
20,051 52,794 163 67 194 94
world 171,228 366,212 114 37 134 61
*A positive value indicates an increase; a negative value indicates a decrease.
As a result of the publication by the United Nations population division, diabetes
is now considered by the WHO as a major threat to human health in the present century.
In a comprehensive review of the literature that explored the incidence and prevalence of
the disease across the different continents of the world, the authors were able to show that
the number of people with diabetes just within a single decade from 2000 to 2010 was
almost doubled in most continents (Zimmet et al., 2001).This indicates that diabetes,
which was once considered a disease of the Western world, is an epidemic worldwide
today. This has been attributed to lifestyle changes especially in the less developed
nations.
The global situation of diabetes is a true reflection of what is seen with the United
States population today. According to statistics released by the CDC (CDC, 2012a) and
the ADA (ADA,2012a),, as of January 2011, 25.8 million children and adults in the

27
United States (18.8 million diagnosed and 7.0 million undiagnosed cases) had diabetes,
representing about 8.3% of the general population.
Prediabetes or borderline diabetic cases were estimated at about 79 million
people. Most individual who develop Type 2 diabetes, they almost always have pre-
diabetes. This is a state in which blood glucose levels are higher than normal but not yet
high enough to be diagnosed as diabetes, as seen in Table 2. Prediabetes is sometimes
referred to as either impaired glucose tolerance (IGT) or impaired fasting glucose (IFG),
depending on which test was performed in diagnosing the disease (ADA, 2012).
Individuals diagnosed with prediabetes are at a higher risk for developing Type 2
diabetes and associated cardiovascular diseases when compared with the general
population.
Table 2
Blood Sugar Levels in a Fasting State
Blood sugar levels Description
Below 100mg/dl Nondiabetic individuals
100 – 130mg/dl Prediabetic individuals
Above 130mg/dl Diabetic individuals (patients)
The diagnosis of prediabetes or diabetes is usually based on an arbitrary cut-off
point for a normal blood sugar level. It must be noted that blood sugar levels are never
28
constant but fluctuates during the course of the day depending on the type and quantity of
meal consumed and also on the amount of circulating sugar lowering hormone, insulin.
Though childhood diabetes is also growing at an alarming rate due to increasing
environmental factors like obesity, the CDC has noted that only 215,000, or 0.26%, of all
people with diabetes actually fall under the age of 20 years (CDC, 2011).
In 2010 1.9 million new cases of diabetes patients aged 20 years and older were
reported over the figures from the 2007- 2009 National Health Interview Survey (CDC,
2011). The number of people aged 20 years and older diagnosed as new cases of diabetes
in 2010 were grouped as follows: age group 20 – 44 years had 465, 000 people (25%),
age group 45 – 64 years had 1,052,000 people (55.0%) and individuals above 65 years
old had 390,000 (20.0%) increase over 2007-2009.
In 2007, the total costs of diagnosed diabetes in the United States amounted to
$174 billion with $116 billion reflecting direct medical cost and $58 billion reflecting
indirect medical cost. Most importantly, the CDC noted that the medical expenditure for
those with diabetes, when compared with those without diabetes, was 2.3 times higher
(ADA, 2012b; CDC, 2011). According to the 2007 – 2009 National Health Interview
Survey, direct medical cost was mostly directed towards insulin and oral medications
usage. Among adults with diabetes, 12.0% were receiving insulin only, 14.0% were
receiving insulin and oral medications, 58% received oral medications only, and 16.0%
didn’t take either insulin or oral medications.
29
The CDC (2011) has classified diabetes as the seventh cause of death in the
United States. This classification was based on death certificates where diabetes was
listed as the underlying cause of death. This differentiation is important because diabetes
continues to be a major contributing cause of death in many diabetic patients but
unfortunately, the CDC has noted that such cases were never taken into consideration
when documenting deaths from diabetes. This implies that a more realistic picture of
deaths from diabetes must include both situations instead of one as is the present situation
with the CDC and other disease surveillance groups and programs. In addition to the
above drawback, the CDC also noted that underreporting of diabetes as a cause of death
was a common problem within the United States adult population in virtually all the
states.
According to the 2007–2009 National Health Interview Survey, individuals in the
United States with diabetes aged 20 years and above showed great disparity in the
prevalence of the disease when classified according to racial and ethnic groups (ADA,
2012). According to the ADA, the 2007 – 2009 national survey the breakdown of
individuals with diabetes in the United States was as follows: 7.1% non-Hispanic Whites,
8.4% Asian Americans, 12.6% non-Hispanic Blacks, and 11.8% Hispanics.
Further analysis of this survey by the CDC revealed that after adjusting for
population age differences within these groups, the risk of diagnosed diabetes was 18.0%
higher among Asian Americans, 66.0% higher among Hispanics and 77.0% higher
30
among non-Hispanic-Blacks when compared to their non-Hispanic White adult
counterparts (CDC, 2011).
The development of diabetic complications as noted within the African American
community also surpasses all other races or ethnic groups in the United States. This is the
only ethnic group in the country with an increased prevalence of diabetes complications
within the past decade (Calvin et al., 2011). About 72.0% of African Americans with
Type 2 diabetes have hypertension (United States Department of Health & Human
Services, 2012). Similar leading trends in the other complications associated with
diabetes were also observed within this ethnic group. Diabetic complications among
African American have been attributed to a couple of factors. These included poor socio-
economic status, suboptimal health care, unhealthy lifestyles and suboptimal
environmental conditions(Calvin et al., 2011). Thus, it is the aim of this study to
determine the level of understanding or awareness of some of these factors within this
population.
Diabetes Prevalence by Sex and Age
As previously mentioned, though childhood diabetes is also growing at an
alarming rate in the United States and other developed nations due to increasing
environmental factors like obesity, diabetes appears to concentrate only within the adult
population aged 20 years and older. Estimates of relative risk of all cause-mortality noted
among individuals with diabetes classified by age and sex is shown in the diagram below.
These estimates provided by the United Nations Population division was derived from a
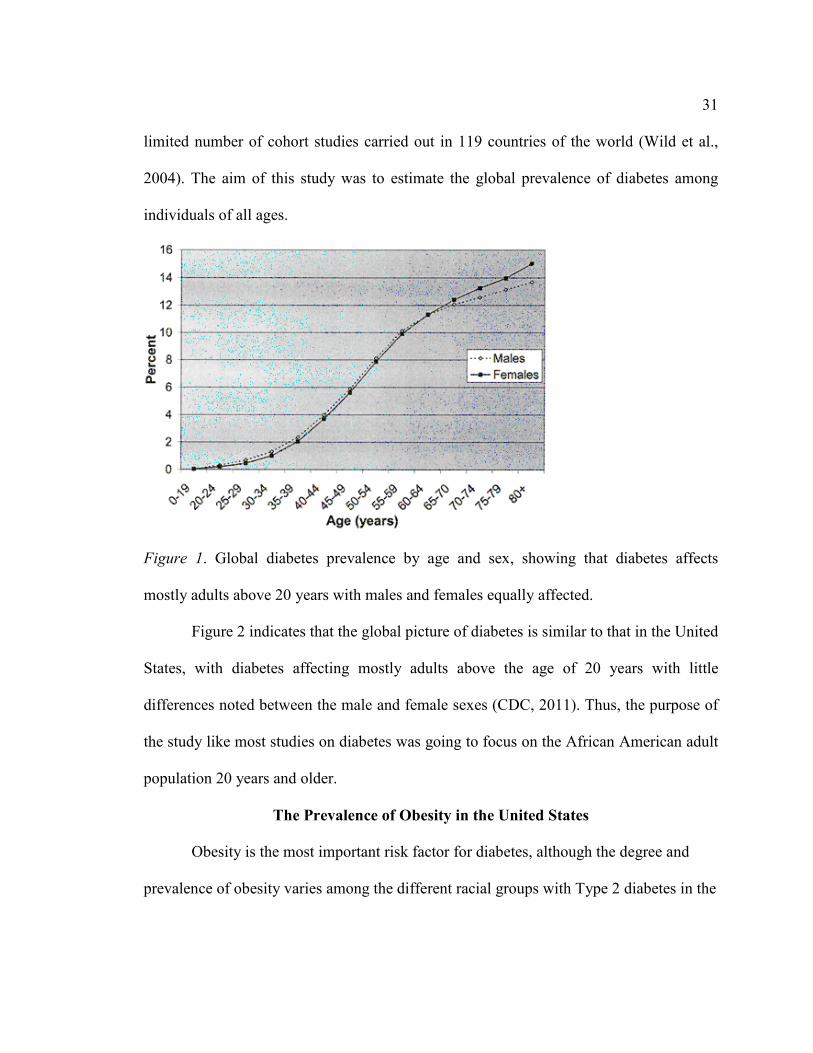
31
limited number of cohort studies carried out in 119 countries of the world (Wild et al.,
2004). The aim of this study was to estimate the global prevalence of diabetes among
individuals of all ages.
Figure 1. Global diabetes prevalence by age and sex, showing that diabetes affects
mostly adults above 20 years with males and females equally affected.
Figure 2 indicates that the global picture of diabetes is similar to that in the United
States, with diabetes affecting mostly adults above the age of 20 years with little
differences noted between the male and female sexes (CDC, 2011). Thus, the purpose of
the study like most studies on diabetes was going to focus on the African American adult
population 20 years and older.
The Prevalence of Obesity in the United States
Obesity is the most important risk factor for diabetes, although the degree and
prevalence of obesity varies among the different racial groups with Type 2 diabetes in the

32
United States (McPhee, Papadakis, & Rabow, 2011). According to the CDC (2011), more
than one third of the U.S. adult population are obese, with non-Hispanic Blacks having
the highest age-adjusted rates of obesity. Non-Hispanic Blacks and Mexican-American
men with higher incomes tended to be more obese than non-Hispanic Blacks and
Mexican-American men with lower incomes, while the reverse situation was noted
among women (Ogden, Lamb, Carroll, & Flegal, 2010)
Culture, Disease and Treatment
Culture is an important component of every ethnic group. In general terms culture
refers to the ways of living of any ethnic group. This includes things like language,
customs, geographical locations, economic status etc. (Noël, 2010). In fact, just as the
values of each ethnic group differs, research has revealed that interventions that work in
some societies or groups may not necessarily work in others due to the fact that these
cultural forces influences basic daily activities and decisions like diet and exercise
(Knowler et al., 2002). Just as the many cultures, in the United States are very diverse, so
too is the perception of disease, illness presentation and treatment. This implies we must
understand the cultural values of any group, society or race if we have to understand their
perception of any disease, its treatment and complications. This then becomes a major
concern in the United States due to two primary reasons:
1. There is much diversity in lifestyle patterns noted amongst the different
regions in the United States and also amongst ethnic groups.

33
2. Secondly, diabetes is much of a frequent problem in some of the ethnic groups
than others as seen above.
In a study by Noël (2010), where comparison of ethnic differences in causal
beliefs and treatment preferences for symptoms of depression among diabetic patients, it
was observed that across African American, Hispanics and non-Hispanic Whites adult
with Type 2 diabetes, there was significance differences in causal beliefs with respect to
depressive symptoms. Also Noel noted that culture had an association with treatment
preferences but not with provider preferences. Similarly, in a study aimed at evaluating
the need and efficacy of community-based culturally specific eye disease screening for
African Americans with diabetes, the researchers were able to demonstrate that culturally
specific technique approach was able to identify a significant number of patients with
diabetes that actually needed eye screening and treatment (Anderson et al., 2002).
In fact, there is always an associated cultural component whenever dealing with
disease diagnoses, management or treatment (Anderson et al., 2002). This implies
different ethnic groups are most likely going to perceive illness presentation and
treatment differently and as such, the explanation of illness varies from culture to culture.
Based on this assertion, some researchers believe illness can be explained as being either
personalistic or naturalistic (Westerlund, 2006).

34
Naturalistic Approach
The naturalistic approach looks at illness as a natural process occurring as a result of
deterioration of some body function through the influence of both internal and external
forces. That is to say, illness is a result of impersonal, mechanistic causes in nature that
can be understood and treated through some scientific methods (O’Neil, 2006). In this
case, an explanation can be offered for the origin of the disease (disease etiology).
Impersonal or mechanistic causes of illness acceptable in the naturalistic medical system
include procedures like some organ breakdown or deterioration. Such organ deterioration
can be in the form of heart failure, tooth decay etc. Other forms of impersonal or
mechanistic causes of illness include parasite infections from bacteria, worms, fungi or
viruses; malnutrition, injury resulting in broken bones or bullet wounds etc. The western
world today relies mostly on the naturalistic approach in the explanation of disease and
illness. The naturalistic approach began in the 4th and 5th centuries BC. but only took the
modern form of medical practice in the 16th century AD (O’Neil, 2006).
Personalistic Approach
The personalistic approach, on the other hand, is grounded in some form of
supernatural or mystical explanation. Illness is seen as been due to supernatural beings or
forces which may manifest in one of the following ways: Foreign objects being
introduced in to the body through some supernatural forces or procedure; some form of
spiritual possession of the individual or bewitching of the individual. In the past,
35
personalistic approach was mostly accepted by most non-Western nations but today it is
mostly seen in small-scale societies and subcultures of larger nations. Many of these
subcultures exist in the United States today.
The Relationship between Naturalistic and personalistic Approaches
As is the case with naturalistic approach, personalistic approach cannot be explained
in the light of modern medicine. Personalistic approach can be further broken down into
susto, evil eye, or aire. Personalistic approach is well rooted within cultural groups in the
United States. For example, within the African American and Latino groups, aire is a
well-grounded cultural belief which deals with bewitching or supernatural forces as the
etiology of illness and as such requires supernatural treatment also. The above goes to
buster the need of incorporating specific cultural beliefs when dealing with any ethnic
group.
Most people who believe in the naturalistic approach may find it difficult to
accept the personalistic approach. This is due to the fact the naturalistic explanation of
illness, disease and treatment is based on some scientific method meanwhile the
personalistic explanation relies on the idea of introducing objects into the body through
supernatural means. Whatever the situation, both approaches believe in the intrusion of
some unseen substance into the body. The germ theory adapted by modern medicine, by
which germs get into the body system, is very similar to the personalistic view of disease
or illness.
36
Disease and Illness
The terms disease and illness have always been used in the western world
interchangeable but researchers believe it is important to separate these two words
especially when dealing with non-western cultural traditions (O’Neil, 2006). Disease
refers to some objective measurable pathological condition exhibited by the human body.
This includes conditions like a broken bone or bacterial infection. Illness, on the contrast
refers to any feeling of not being healthy. This can include a disease but may also involve
psychological and spiritual conditions (O’Neil, 2006). Thus it can be seen that perception
of illness can be culturally related meanwhile the notion of disease is usually not.
Beliefs in Health Communication
Cultural factors and beliefs in health communication is also an important issue
that has been emphasizes for decades (Landrine and Klonoff, 1992; Thomas, Fine, &
Ibrahim, 2004). Thomas et al. (2000) in a review has noted that marked health disparity
continue to exist even with well elaborated systems like the VA health care system in
which access to care wasn’t an issue. This led the authors to conclude that other factors
like culture and health communication have to play a role. Scott, Mannion, Marshall, and
Davies, (2003) in a similar study questioned the role of culture of a population or
organization on healthcare performance. The authors concluded that culture is a relevant
factor in healthcare performance though the nature of such a relationship couldn’t be
defined. One of the major drawbacks noted was the difficulty and/or inconsistency in
defining and operationalizing the term culture.

37
Cultural norms embedded within the different groups in the United States have
contributed to lifestyles and associated behaviors that have influenced risk factors for
most chronic diseases including diabetes. This means any efforts deemed at eliminating
the present health disparities must also be able to influence culture on altitudes, beliefs
and behaviors especially of minority groups (Thomas et al., 2004). We must consider the
fact that culture act as a powerful filter through which information can be received. This
even becomes more apparent for healthcare professionals who handle people from other
cultures because understanding what they believe in and what kind of treatment is
considered effective and acceptable is important.
Due to the existence of these cultural differences, perception and treatment would
be better evaluated when considering a single ethnic group. Unfortunate, there are very
few studies that have focuses on African Americans as a single ethnic group to better
understands their perception of most of the chronic diseases plaguing the group with their
treatment and preventive health behavior patterns (Calvin et al., 2011).
Socioeconomic Status and Diabetic Control
Prior studies have noted socioeconomic differences with regards to outcome
expectations for diabetes. In a study by Figaro, Elasy, BeLue, Speroff, and Dittus, (2009)
in which they explore health behaviors of adults with Type 2 diabetes of different
socioeconomic status, it was observed that individuals classified as belonging to the
higher socioeconomic class exhibited more positive outcomes than subjects of lower
38
socioeconomic status. Perception of control of related health behaviors was suggested as
the reason behind such a socio-economic disparity. This means that programs aimed at
increasing compliance must take into account class- disease perception as suggested by
the authors. The drawback noted with this study was that it was a qualitative study in
which participants household income was limited to less than or equal to $40,000
annually and most important was the fact that the study examines differences between
African Americans and their White counterparts but wasn’t capable of quantifying any of
the health behaviors.
Similarly, studies have documented the association between smoking and
socioeconomic status. In terms of smoking rate, most of the studies have associated
greater smoking rate with low socioeconomic status (Pampel, Krueger, & Denney, 2010;
Willemsen, Hoogenveen and Van Der Lucht, 2002). In a recent study, in which Tjora,
Hetland, Aarø, Wold, & Øverland, (2012) compared smoking cessation across the
different socioeconomic classes, it was noted that those of higher socioeconomic status
are more likely to quit than their counterparts of lower socioeconomic status. The reason
advance in the above conclusion is the fact that those of higher socioeconomic status
have more understanding about smoking and more resources that can enable them to
quite. This still reflects the idea of perception of control as seen above.
Hanson and Chen (2007) in a similar study also noted poorer diets, less physical
activity and greater smoking amongst individuals with lower socioeconomic status. Thus
there seem to be a traditional association of greater negative health outcomes being
39
related to low socioeconomic status. Though these studies were able to establish the
relationship between socioeconomic status and health behaviors, these studies were not
focused on African Americans and were not capable of measuring level of awareness of
these health behaviors.
An important question at this point will be why do individuals of low–socioeconomic
status groups in most situations act in ways that tend to be harmful to their health than
their counterparts within the higher socioeconomic status? This was the locus of a recent
study by Pampel et al., 2010. The authors noted that the present literature has done little
to compare or contrast the mechanisms involved in this. As a result, they try to offer
some suggestions which include:
• There is a possibility that socioeconomic status can affect any incentives
or motivations for healthy behavior. Individuals within the low
socioeconomic status may have less reason than high- socioeconomic
status groups to want to forego the short-term pleasures of unhealthy
behavior for long-term gain in longevity. Individuals within the high-
socioeconomic status group may face less stress that might encourage
coping through unhealthy behavior and may gain more longevity benefits
from healthy behaviors. The idea of greater knowledge of risks that tend to
motivate healthy behavior amongst high socioeconomic status is still
unclear.

40
• Motives and means may be two important factors of consideration. This is
because socioeconomic status can affect the means to reach certain health
goals. Individuals within all socioeconomic status groups may have
similar desires towards healthy behaviors. Despite this, low-
socioeconomic status groups may have more difficulties in achieving their
goals. The above relationship between motives and means may not be that
linear as may appear. That is, this may tend to blur at some extreme
points as strong motive increases, there is the likely event that there is
going to be increased effort to find effective means. Also, factors like
social support will also affect the connection between motives and means.
Even with these drawbacks, some researchers still believe, these are
distinct factors, and distinguishing among them may be very helpful in
designing studies dealing with disparities in health behaviors.
The above traditional association of low socioeconomic status being related to greater
negative health behaviors is consistent across many studies. However, the association
noted between socioeconomic status and health behaviors may not be equally apparent
across the lifespan of an individual (Chen & Killeya-Jones, 2006; Hanson & Chen, 2007)
. In a detailed review by Hanson and Chen (2007) to determine the direction of
association between socioeconomic status and preventive health behaviors, they
concluded that though there may be some association between these variables during
adolescent, such an association may not be as robust as in adulthood. Adolescence is a
41
period characterized by social and biological changes and most important is the fact that
many health behaviors are actually been established at this point in life. Physical
inactivity, unhealthy diets and smoking were associated with low socioeconomic status in
adolescent meanwhile alcoholism and marijuana abuse was noted across the
socioeconomic status spectrum.
The above studies by Chen and Killeya-Jones (2006); Hanson and Chen (2007) is
an indication that the relationship between socioeconomic status and health behaviors
may exhibits a complex association. Similarly, introducing race/ethnicity, it appears
another different picture emerges. Edmonds-Myles et al.(2010) in a study aimed at
understanding the perception of the impact of Type 1 diabetes mainly on lower
socioeconomic status families of various ethnic backgrounds, noted that the impact on
African American, Latino and White families were all different. At moment very few
studies have actually determine the relationship between preventive health behaviors and
socioeconomic status varied by race though the role of ethnicity in any socioeconomic-
preventive health association seem to be very important. Even most important here is the
fact that to my best understanding, there is no study on a single race/ethnic group in
which such health preventive behaviors have been compared across the socioeconomic
status ladder of the group which is one of the aspects the present study intends to focus
on.

42
Perception
Definition
Perception in the broad sense refers to an individual’s ability to be aware of, to
understand or to realize the existence of something. According to the Oxford English
dictionary, this includes the ability to see, hear or be aware of something using human
senses (Oxford University Press, 2012). The focus of this definition is on the idea of
knowledge of the existence of something within an individuals’ vicinity. In the case of
diabetes, such knowledge can take many ramifications, considering the fact that it is a
complex chronic disease. Based on the above assertion, this study is going to evaluate
only the following knowledge base areas of the African American adults’ population:
Knowledge of risk factors and complications of diabetes, knowledge of treatments
benefits and knowledge of preventive health behaviors.
Due to the fact that the prevalence of diabetes mellitus is eventually reaching
epidemic levels worldwide, many studies have emerged that try to determine or measure
the level of understanding of their respective population of this disease. Such an
understanding is very important today because:
1. Patients must be fully involved in the management of the disease. This implies, a
general understanding and awareness is considered a first and most important step
in taking action aimed at reducing the threat of the disease (Allen et al., 2010).
2. Targeted interventions aimed at curtailing this epidemic can only be well crafted
if we can get a better understanding of the population involve. Interventions of

43
this nature have been proven to reduce diabetic risk (Diabetes Prevention Program
Research Group et al., 2009; Lindström et al., 2003).
In a large population-based study focused at understanding the risk of diabetes
amongst Singaporean’s and related health preventive behaviors, the authors were able to
conclude that better understanding of the disease was associated with favorable behaviors
(Wong and Toh, 2009). Unfortunate, this was never found to have translated to healthier
lifestyles. In another study aimed at evaluating the knowledge of kidney disease as a
complication of diabetes, in a mixed population at risk in rural North Carolina, it was
discovered that the community has some basic knowledge of the disease but the risk of
having the disease was never attributed to diabetes but more to lifestyle behaviors
(Jennette et al., 2010).
Similar research by (Lipman et al., 2012; Vivian et al., 2012)) focused at
understanding the level of awareness of parents living with diabetic children of the risk
factors associated with the disease, it was discovered that there is general lack of
understanding both within the African American and White communities. Also important
in these studies was the fact there was a paucity of research at moment that actually
address this parent-children perception of the disease.
So far the few studies that have dealt with perception of diabetes with/ without health
preventive behaviors have noted either a general lack of knowledge of the disease or even
where there is some understanding of the disease, such in most cases has always been a
wrong conception as was clearly shown by Cullen and Buzek (2009); Jennette et al.
44
(2010); Wong and Toh ( 2009). It is along this thought that Choi et al. (2012 in trying to
determine the perception of clinicians and patients with regards to the disease
management and the present status of diabetic education offered, were able to conclude
that current educational programs haven’t been able to meet the needs of the population.
They noted a marginal gap between awareness or understanding of the disease by the
patients and what was taught.
There are very few studies at moment that have actually looked at the perception of
risk for the disease amongst the general population (Calvin et al., 2011) . As concern
African Americans, there is even less information that describe their perceive risk of
developing diabetes, importance of diabetes management or healthy behaviors. Calvin et
al., (2011) have noted that the present published research that details the relationships
among diabetes, well-being and illness perception cannot be generalized to African
American adults. Most important is the fact that ethnicity was never addressed. Culture
influences illness representations (Scollan-Koliopoulos, Rapp and Bleich 2012).
Based on the above studies by Scollan-Koliopoulos et al. (2012); Calvin et al. (2011)
and other similar studies, the authors have been able to carry out exploratory studies in
which they focused on the perceived risk of diabetes complications. The results obtained
from these studies could not be generalized to the entire African American adult
population due to the fact that the authors failed to use a sample that covered all the
different levels of the socioeconomic ladder. The study by Calvin et al. (2011), was
focused only on urban African Americans of low socioeconomic status aged 18-75. Thus,

45
considering such drawbacks, a similar study of this nature cutting through all the different
socioeconomic status is warranted.
In an exploratory study McKenzie and Skelly (2010) aimed at exploring the
understanding of coronary heart disease amongst women with Type 2 diabetes, it was
noted that these women do not see themselves as being at risk for the disease. Most
importantly, their main reason for not identifying with the disease was associated to their
faith believes. Thus an important question here will be if the same situation or concept
holds for diabetes in the African American adult population. As mentioned in chapter
one, diabetes mellitus remains a major risk factor for most cardiovascular diseases
including coronary heart disease.
The authors Cullen and Buzek (2009) in another studying aimed at accessing the
diabetic knowledge and risk factors awareness among African American and Hispanic
families, also noted that there was a lack of such knowledge within both communities.
Most importantly, the authors discovered that among the individuals with diabetic risk
factors, there has been very little research on the influence of perceived risk on
preventive behaviors. In a similar study, the authors Kim et al. (2007) have also looked at
the risk perception among women who had had some history of gestational diabetes.
Despite the fact that the relationship between gestational diabetes and postpartum
diabetes are well understood, most of the women in the study consider themselves not to
be at risk when compared with the general population.

46
Studies have also been carried out to assess the knowledge of diabetic risk factors
and personal control among healthcare providers. Walker, Mertz, Kalten and Flynn
(2003) carried out an earlier study which was focused on physician’s perception of risk
factors for developing diabetes. The aim of this study was to gain information on expert
personal risk of having the disease. Such information was to be used in a future
comparison with perception of risk by lay groups. Thus, based on this a similar study on
pharmacist was later designed which assesses risk perception, optimistic bias and
personal control of diabetes. It was discovered that health care experts exhibited more
knowledge of risk perception, optimistic bias and personal control than the lay population
(Pinelli, Berlie, Slaughter and Jaber, 2009).
Effective risk communication between healthcare experts and the at-risk lay
population remains one of the primary prevention tools for this disease. Thus, studies of
this nature need to define comprehensive measures that can be used to frame or craft
appropriate messages for such at risk communities.
Preventive Health Behaviors
Health behaviors have been documented as a leading cause of morbidity and
mortality in the United States and public health efforts to improve the situation will
require basic epidemiological information like prevalence and level of awareness of the
disease (Mokdad and Remington, 2010). Risk perception and protective health behaviors
exhibits a complex relation (Brewer, Weinstein, Cuite, & Herrington, 2004). In most
studies, this has offered inconsistent results with some studies demonstrating the

47
existence of such an association but others do not. Theoretically, higher perception of risk
may be an important trigger towards a healthier lifestyle. This relationship has resulted
in three categories of results:
1. Some studies have noted that though the population was aware of their risk
associated with the disease, no knowledge of protective behavior accompanied
this risk. I e the higher the risk involve, less protective behavior (Brewer et al.,
2004; Cullen and Buzek, 2009)
2. On the other hand, understanding or awareness has been found to be associated
with positive health behaviors but this was never found to have been translated to
healthy lifestyles (Economos et al., 2012; Mathieu et al., 2012; Pawlak and Colby,
2009; Wong and Toh, 2009).
3. The third category here is those who understand the risk of the disease and its
associated preventive health behaviors, and have taken an extra step in translating
such into some healthy lifestyles. This remains an ideal situation yet to arrive at.
Ethnic minorities including African Americans have reported less physical
activity, poorer diets when compared with the general population (Mathieu et al.,
2012). Also, the authors in this study noted that involvement in physical activity
differs by race/ethnicity. This is similar to results obtained in earlier studies by
(Pawlak and Colby, 2009; Wong and Toh, 2009).

48
Perception of Disease Treatment
The non-compliance to diabetic drug regimen and the difficulties in improving
adherence in such patients are well documented (Chin, Polonsky, Thomas, and Nerney,
2000; Harris, Linn, Skyler and Sandifer, 1987). The American Public Health Association
(APHA), American Psychological Association (APA) along with the other health
organizations have proposed possible steps that must be implemented if the patient must
adhere to their treatment regimen. The most important factor identified by the American
Public Health Association is the need to identify barriers to adherence. Similarly, the
American Psychological Association has noted that patient adherence is influence by
knowledge of the drug, confidence or ability to take the regimen, ability to remember to
take the drug, the medication must be part of their daily routine and finally, they must be
able to adhere to their medication with changes in daily routines (Chisholm-Burns and
Spivey, 2008). Due to the importance of the patient’s behavior in the control of diabetes,
many studies have been carried out aimed at evaluating patients understanding of the
above factors. The HBM has been an important tool here in understanding drug regimen
compliance behaviors. Some of these studies have been presented in the next section.
Barriers to Diabetes Self-Management
Diabetes self-management remains the cornerstone in the overall management of
diabetes mellitus and as such identifying barriers to self-management is an important step
in achieving optimal health outcome. An understanding of the patient’s perception of
these barriers can possibly assist in explaining the present poor health outcomes among

49
minority patients in the united states (Onwudiwe et al., 2011). Limited health literacy or
lack of knowledge of the disease has been identified in a couple of studies as a major
drawback in diabetes self-management (Onwudiwe et al., 2011; Quinn et al., 2011). In a
cross-sectional study, Quinn et al., 2011 noted that patient specific information is needed
to address important issues related to diabetic self-management like foot care, food
choices and hemoglobin A1c monitoring.
Some patient and provider factors have been identified as a hindrance to patient
diabetic self- management (Nam, Chesla, Stotts, Kroon and Janson, 2011). Culture and
language capabilities have an influence on health beliefs, health literacy and attitudes
thereby affecting diabetic self-management. Clinicians on the other hand can influence
self-management through effective communication and maintaining a well-integrated
healthcare system. Some studies have identified the lack of support groups as an
important barrier in diabetes self-management (Fukunaga, Uehara and Tom, 2011; Nam
et al., 2011). Stigmatization amongst south Asians living in the United Kingdom has
recent been identified as an important barrier in diabetes self-management (Singh,
Cinnirella and Bradley, 2012)
In an earlier study by Glasgow, Toobert and Gillette (2001),they have
demonstrated that more information is required today on which barriers present the
greatest obstacles for which types of patients and this should be able to lead to practical
and cost effective interventions. For this to be effectively done, the present knowledge
level of such a population need to be determine which is the focus of the present study.

50
Designing such effective behavioral interventions aimed at combating the
associated barriers to diabetic self-management raises many questions. First, researchers
need to determine which theories and respective interventions provide reasonable
answers to the issue of diabetic self-management. Second, a single intervention may be
relatively easy to demonstrate when considering usual care but this has failed to provide a
step ahead on the issue of diabetic self-management. A recent meta-analysis has shown
that multicomponent interventions focusing on multiple behavioral, emotional, social and
family processes that facilitate diabetic self-management may be more potent than
interventions targeting a single direct behavioral process (Wagner, 2011).
Framework
The basic elements of the HBM model are presented in Figure 2.
Figure 2. Basic elements of the health belief model.

51
The element of perceived threat serves as the motivating factor towards any
behavioral modifications in this model. There are various health belief theories that have
been developed within the past decades of which the HBM remains the most applicable.
This model has identified five basic dimensions that influence behavior. These include
perceived severity, perceived susceptibility, perceived benefits, barriers/cost, and cues to
action (Harvey & Lawson, 2009).
The original model was primarily designed to predict behaviors related to
treatment received by acutely or chronically ill patients (Janz & Becker, 1984). It is
commonly used today to predict or explain general health behaviors which can either be
in the form of preventive or drug therapy compliance (Becker & Janz, 1985). Since the
inception of this model in 1966, considerable modifications or amendments have been
made either to accommodate evolving evidence, to take care of items or elements dealing
with validity and reliability of the model or to fit some special research situations(Hurley,
1990).
Among these amendments has been the development of the Diabetes Health
Belief Scale (DHBS; Harris et al., 1987). This scale has undergone numerous evaluations
to ascertain acceptable levels of validity and reliability (Hurley, 1990). The scale was
instituted to measure attitudes in the area of diabetic care hoping that this could lead to
some explanation of compliance of diabetic drug regimens. The original version of
diabetes health belief scale which had 71 items has undergone a couple of modifications
with the goal of creating a valid and reliable instrument that could be used as a self-report

52
measure and it should be able to be completed in less than 20-minutes. This scale has
been able to raise specific issues that pertain to diabetes especially in the areas of
treatment benefits, psychological barriers, severity and susceptibility to diabetes, cues of
action and general health motivation.
As mentioned above, many authors have applied the HBM with the hope of
understanding compliance behaviors with diabetic drug regimen. Becker and Janz (1985)
while applying the HBM to understanding diabetes drug compliance, has noted that this
model can serve as a useful tool in providing information for designing drug compliance
enhancing interventions for diabetic patients. This is due to the fact that adherence to
treatment plans remains the most serious obstacle in achieving any successful therapeutic
outcome in diabetic patients today. This observation was later supported by the study
carried out by of Turner, Kivlahan, Sloan, and Haselkorn (2007) while evaluating drug
adherence to disease modifying therapies in the case of multiple sclerosis. Similarly,
Gillibrand and Stevenson (2006) while investigating the experience of diabetes in young
children concluded that this model can be very useful in understanding socio-
psychological factors in such a population that can influences diabetic drug regimen
compliance.
The HBM has also been a very useful tool in predicting behaviors in other chronic
disease conditions other than diabetes. A recent study by Turner et al. (2007), focused on
evaluating ongoing therapy in patients with multiple sclerosis concluded that the HBM
was able to provide an understanding into the psychosocial mechanisms that actually
53
maintain adherence behaviors and focusing upon the perceived benefits of such an
ongoing therapy should be able to provide a focus for future interventions. Similarly,
Zhao et al. (2012) while working on a cross-sectional study aimed at predicting condom
use behaviors based on the HBM, concluded that this model is a framework capable of
providing useful information for predicting condom use behaviors.
The development of the Diabetes Health Belief Scale has enabled the application
of the HBM to diabetic patients. This has made possible for some issues that are specific
to the nature of the disease to be raised (Harris et al., 1987). Diabetic patients are
responsible for their daily care. Such daily care usually involves tremendous changes in
life-style which may include things like diets, medication and exercise. Diabetes is a
chronic disease with many complications requiring again tremendous changes or
adjustments to the patient’s life-style. This implies that any instrument designed to
measure health beliefs for these patients must be tailored to these specific needs or
realities.
Summary
The past decades have witnessed a surge in the prevalence and incidence of
diabetes mellitus. The developed countries have been affected mostly due to the
increasing situation of obesity, lifestyle changes and physical inactivity (Brunton and
Gilman, 2011). Obesity is considered the most important environmental factor causing
insulin resistance though it has been noted that the degree and prevalence of obesity
varies among the different racial groups with Type 2 diabetes in the United States

54
(McPhee, Papadakis, & Rabow, 2011). Data from the American Diabetes Association
and the Centers for Disease Control and Prevention reveals that African Americans are
mostly afflicted with obesity in the United States which may explains the high prevalence
rate of Type 2 diabetes amongst this ethnic group (Ogden et al., 2010).
The burden posed by diabetes has been shown to manifest differently within the
different ethnic groups in the United States. Ethnic minorities are disproportionately
burdened with this chronic disease. African Americans are as twice more likely to
develop Type 2 diabetes when compared with their white counterparts. Diabetes affects
about 25.0% of all African American women above the age of 55 years (Shaw-perry,
2006). According to the American Diabetes Association, diabetes has been recognized as
the fifth deadliest disease in the united states, affecting about 2.7 million or 11.4% of
African Americans aged 20 and older ( CDC, 2011). The development of diabetic
complications within the African American community also surpasses all other races or
ethnic groups in the United States. About 72.0% of African Americans with Type 2
diabetes have hypertension (United States Department of Health and Human services,
2012). The rates of amputations, kidney disease, cardiovascular diseases and blindness
are among African Americans having Type 2 diabetes (Calvin et al., 2011).
Despite the above situation, there are few studies at moment that have looked at
the perception of risk factors for the disease amongst the general population. There is
even less information that describe the perceive risk of developing diabetes, importance
of diabetes management or healthy preventive behaviors amongst African Americans.

55
Calvin et al. (2011) have noted that present published research that details the
relationships among diabetes, well-being and illness perception cannot be generalized to
African American adult’s population. Most important is the fact that ethnicity was never
addressed in most of these studies.
Recent studies have shown that illness representations are greatly influenced by
individual cultures. Thus, the above relationship dealing with illness or disease
representation must be analyzed differently when dealing with different ethnic groups
(Lipman et al., 2012; Scollan-Koliopoulos et al., 2012; Vivian et al., 2012). The concept
of perception or knowledge of risks factors for diabetes has been shown to vary by race
even when controlling for socioeconomic factors (Ford, Havstad, Brooks and Tilley,
2002). This implies that cultural factors must be factored in when identifying risk factors
for diabetes and when designing educational programs.
Some researchers are of the opinion that present educational programs designed
for diabetes patients are not well formulated due to the lack of understanding of the
concept of disease perception (Choi et al., 2012). This has led to the existence of a gap
between this concept and what is taught in such educational programs. This then calls for
more exploration in the area of the patients’ understanding of the disease state.
This is an indication that, in other to reduce the present burden of the disease, a
better understanding of perceived risk factors for diabetes, benefits associated with timely
management and treatment and maintaining health preventive behaviors within the
56
African American community is still warranted. This will provide possible ways for
much better educational programs to be formulated.
Also, more information is required to determine if African Americans’
perceptions or understanding of diabetes has a bearing on health preventive behaviors.
This chapter has indicated that there is an ever increasing prevalence of diabetes amongst
the African American adult community in the United States more than any other ethnic
group. However, there are no studies available to ascertain why such an increase
primarily in the African American population. Thus, this study is also aimed at
examining the perception or understanding of risk factors, its complications and benefits
of treatments of diabetes and how this is related to health behaviors across the different
socioeconomic groups within the African American population. Such a relationship may
be able to offer an explanation for the ever rising prevalence of the diabetes within this
ethnic group and thus offers possible ways of curtailing the disease.
Chapter 3 will present the study design needed for this study. This will also look
at the sample size required for this study. The sample size will be determined with the
aid of statistical data and. Chapter three also goes further to define the population and the
participants (sample) for the study, role of the researcher, instrumentation,
confidentiality, and the power of the analysis.

57
Chapter 3: Research Method
Introduction
The past 3decades have witnessed a surge in the incidence and prevalence of
diabetes within the African American adult population (Brunton &Gilman, 2011). A
review of present literature reveals that the burden posed by diabetes manifest differently
within the different ethnic groups in the United (McPhee, Papadakis, &Rabow, 2012).
Despite the above situation, there are few studies at moment that have looked at the
perception of risk factors for developing diabetes (Calvin et al., 2011). There is even less
information that describe the perceive risk of developing diabetes within the African
American adult population. This is an indication that studies focused on better
understanding of perceived risk factors for developing diabetes, benefits associated with
timely management and health preventive behaviors within the African American
community are still warranted.
In Chapter 3, a description of the research design will be presented. The rational
for choosing this specific design, instrumentation used and data analyses are will also be
presented in this chapter. This chapter will also provide a description of the participants,
the setting of the study and all possible measures undertaken to protect the participants in
this study. Finally the role of the researcher will be outlined here alongside a tentative
timeline for the collection of the required data. Thus, this chapter is focused on further
enhancing the reader’s knowledge of the research, methodology, and conceptual
framework presented earlier.
58
Research Design
A cross-sectional research design was used in this study. The few studies that
have been carried out on the perception of diabetes risk factors, complications, benefits of
timely treatment and management of diabetes have either been descriptive or exploratory
in nature and have evaluated this problem by comparing different subgroups or ethnic
groups. Exploratory designs, as any other type of qualitative study, have the advantage in
that such studies can produce an in-depth understanding of the present subject matter. On
the other hand, they can be time consuming and most importantly, such results can be
subjective. Coupled with the fact that qualitative studies usually have very small sample
sizes, generalization of such results has always been questionable (Creswell, 2009).
A study by Calvin et al. (2011) that focused on African American perception of
risk factors for diabetes and its complications could not be generalized to a general
population. This was due to the fact that as an exploratory study, the authors could only
focused on a few low in-come urban residents. As such, the authors recommended a
replication of a similar study among African American adult population with different
socioeconomic status which is part of the focus of the present study. Similar trends have
also been observed with other exploratory studies (Jennette et al., 2010; McKenzie and
Skelly, 2010).
Cross-sectional studies generally maintain some unique characteristics. They are
able to provide a snapshot of a health related characteristic of a population and as such,
they are less time consuming. Many epidemiological studies today have adopted this
59
design because of such a unique characteristic. The focus of the present study was to
measure the level of understanding of risk factors, complications, associated treatment
benefits of diabetes and how this may be related to health preventive behaviors within
this population. The results compared those with the disease and their counterparts
without the disease. A cross-sectional study has the feature of comparing different
population groups at a single point in time. Thus, this design also allowed for the
analyses of the above relationship across the different socioeconomic groups within this
population from a single point in time. The cross-sectional design also allowed for the
construction of a frame from which findings could be easily drawn.
Instrumentation
Risk Perception Survey for Developing Diabetes (RPS-DD)
Data was collected in this study via a survey in the form of a questionnaire. The
instrument adapted in this cross-sectional study was the validated Risk Perception Survey
for Developing Diabetes (RPS-DD) as outlined in similar studies by (Choi et al., 2012;
Pinelli, Berlie, Slaughter, & Jaber, 2009; Walker, Mertz, Kalten, & Flynn, 2003a).
This instrument was originally developed by Elizabeth Walker at the Diabetes
Research Institute at Albert Einstein College of Medicine, of Yeshiva University (Walker
& Wylie-Rosett, 1998). The surveys development phase was originally witness by a
panel of clinical diabetes experts, health psychologists and risk perception experts who
had the opportunity to review all the questions. This was followed by a pilot test, which
gave the experts additional information that aided in enhancing the validity, reliability,

60
and ease of use of the instrument (Walker et al. , 2003b). Thus, due to the fact that this
instrument has undergone vigorous revisions over the years, it has been used in many
studies due to the fact that validity and reliability has been well documented.
The original RPS-DD is a 43 item questionnaire which is appropriate for
gathering information on people who are at high risk for developing Type 2diabetes. This
instrument is also able to assess the comparative risk, complications and the
environmental perceived risk of the population for developing diabetes. For the purpose
of this study, the RPS-DD instrument has been updated with additional sections so as to
be able to measure actual behaviors, socioeconomic status and demographic
characteristic like age and sex of the population.
The RPS-DD questionnaire is made up of four main subscales that are aimed at
capturing multiple dimensions of perceived risk factor for diabetes. A copy of this
instrument is presented in Appendix A. These subscales include:
• General attitudes: This subscale measures the general attitudes of individuals
that are at risk of getting diabetes. It looks at the overall feelings of the
participants of the disease. The questions on this subscale are scored on the
following scale of 1 to 4: 1 (almost no risk), 2 (slight risk), 3 (moderate risk),
and 4 (high risk). The scoring guide for each of the items is presented in
Appendix B.
• Attitudes about health risks: This is the second subscale which focuses on how
participants perceive or aware of the complications of diabetes. Some of the

61
complications of diabetes assessed within this subscale include arthritis, heart
disease, high blood pressure, foot amputation, blindness, infections and
kidney failure. This subscale also attempts to classify each participant with
respect to their diabetes state (i.e., those with the disease, or any family
member with the disease, and those without the disease). Similar to the first
subscale on general attitudes, this subscale is also scored as 1 (almost no risk),
2 (slight risk), 3 (moderate risk), and 4 (high risk).
• Environmental health risks: This subscale looks at the possible hazards or
dangerous environmental health conditions around the participant that
predisposes the individual to some risk of developing diabetes. Some of these
environmental conditions include radiation from medical X-rays, pesticides,
air pollution, extreme weather, street drugs and cigarette smoke from people
around you. The scoring is similar to the other subscales: 1 (almost no risk), 2
(slight risk), 3 (moderate risk), and 4 (high risk).
• Risk of getting diabetes for people in the general public: This subscales asses
the participants’ knowledge of the risk factors of diabetes by looking at the
general public. This is an attempt to gather vital information on virtual all the
areas associated with risk factors for developing diabetes. Some of the risk
factors measured in this subscale include preventive health behaviors,
ethnicity, age, history of gestational diabetes, and history of diabetes
complication. This subscale is measured on a scale of 1 to 4 similar to the

62
other subscales. This subscale is used as a descriptor of level of knowledge of
diabetes risk factors.
Limitations of the Risk Perception Survey for Developing Diabetes
The RPS-DD questionnaire can only allow the researcher to determine the
knowledge level of risk factors for diabetes, complications, treatment benefits, and
preventive health behaviors. This questionnaire is unable to measure actual behaviors. As
such, a section of the Behavioral Risk Factor Surveillance System (BRFSS) questionnaire
from the CDC will be adapted to measure socioeconomic status, demographic
characteristics and actual health behaviors.
The Behavioral Risk Factor Surveillance System
The BRFSS was established in 1984 and by 1993; it was already a nationwide
surveillance system. The main idea behind this system was to collect data on actual
health behaviors rather than on knowledge or attitudes. The BRFSS has been updated
continually by a team of survey statisticians, methodologists, and operational experts and
as such the reliability and validity of the system has been well documented. Standardized
sets of questions are covered on topics like smoking, physical inactivity, diet, alcohol use,
street drugs usage, and hypertension.
Validity and Reliability of Risk Perception Survey for Developing Diabetes
The RPS-DD has shown adequate consistency in virtually all the subscales of the
instrument. The Chronbach’s alpha coefficients for all the subscales range from 0.50 –
0.84 as shown in Table 3.

63
Table 3
Alpha Coefficient of the Risk Perception Survey for Developing Diabetes
Subscale Alpha coefficient
Personal control 0.68
Worry 0.50
Optimistic bias 0.71
Personal Disease Risk 0.80
Comparative Environmental Risk 0.81
Composite Risk Score 0.84
Lower than usual scores were noted on the personal control and worry subscales.
The decision to maintain this instrument in this study was based on the fact that none of
the scores were below 0.50 and this is a new research tool that is still undergoing many
refinements. The Chronbach’s alpha coefficient is a test of the quality of data that will be
generated by the survey instrument. Values above 0.5 are generally accepted because this
is an indication that the items in a group are closely related to each other thus high
internal consistency.
Validity and Reliability of the Behavioral Risk Factor Surveillance System
Many separate studies have examined issues related to the reliability and validity
of the BRFSS and its ability in providing valid and reliable national estimates and
comparisons across the different states (CDC, 2010). According to the CDC (2012), the

64
study by Nelson, Holtzman, Bolen, Stanwyck, and Mack (2001) remains the most
comprehensive to date ever carried out to determine the validity and reliability of the
BRFSS. Nelson et al. (2001) after summarizing more than 200 studies on the reliability
and validity of the BRFSS concluded that most of the questions were at least moderately
valid and reliable with many being highly reliable and valid.
Similarly, Nelson, Powell-Griner, Town and Kovar (2003) carried out a study
aimed at comparing national estimates obtained from the National Health Interview
Survey and the Behavioral Risk Factor Surveillance System. The authors compared data
obtained by using 14 measures from the two surveys. These 14 sections included
smoking, height, weight, BMI, diabetes, hypertension, immunization, lack of insurance
coverage, cost as a barrier to medical care, and health status. They noted that national
estimates obtained from both survey systems were similar for 13 of the 14 measures
examined. Thus, they concluded that the BRFSS was able to provide valid and reliable
information that can be used to guide national policy and program decisions. A similar
study was also documented by Mokdad, Stroup, and Giles (2003).
Sampling and Setting
Sampling
African Americans constitute only 13.6% of the United States population, but the
African American population in the District of Columbia is 52.2% of the total population
of that city (United States Census Bureau, 2011). This will provide for a large African
American adult population that will be suitable for the study. All participants in this study

65
will be African Americans (men and women) and who at the time of the study must
reside in Washington, District of Columbia. Participants recruited for this study will be
those with a clinical diagnosis of diabetes and those who do not have a clinical diagnosis
of diabetes. The age range for inclusion was18-75 years and must have had health
insurance coverage for at least 12months. This will help to eliminate the barrier of
inaccessibility to adequate diabetic treatment and healthcare management. All of the
above information will be self-reported. The age range reflects the present trends in the
development of diabetes and its complications. Though diabetes is increasingly seen in
earlier ages today, it remains a disease for the aging afflicting both African American
men and women (Shaw-Perry, 2006).
Setting
A two stage random cluster sampling was implemented in this study. First, four
clusters were identified following the geographical break-up of the city of Washington,
DC, namely northwest, southwest, southeast, and northeast in an effort to improve
generalization of the results. The sample was obtained by random sampling of the four
clusters as discussed below. This allowed for a uniform distribution of the sample within
the population while minimizing time and cost of the study.
All participants in this study will be recruited from one of the four public libraries
selected within the city. The District of Columbia houses 26 public libraries which are
uniformly distributed within the city. Thus, a public library will be selected from each of
the four geographical regions of the town. The mission of all these libraries is very

66
similar. These are public facilities used for many different functions like job fairs and
town meetings apart from the usual library visits to use the computers and /or books in
the library.
All participants were randomly selected for this study. Each participant received a
copy of the consent form and this form had clear information of their right to refuse to
participate in the study. Prior to initiation of the study, the researcher conducted key
sessions with the library staff aimed at introducing the purpose of the study, inclusion
criteria and the study protocol. These key sessions also attempted to sort for support from
the library staff in carrying out this project. Part of the support from the library staff was
to coordinate with the librarian’s office to have a station placed in the lobby or entrance
of each of these libraries over the next 1 to 2 weeks so that individuals can ask questions
and fill out the survey during their regular visits of the library.
Data Collection
This study is focused on measuring knowledge level of risk factors, treatment
benefits, and preventive health behaviors of diabetes mellitus within the African
American adult population. The main exclusion criteria for study participants were non-
African American origin and under 18 years of age. Based on the fact that the District of
Columbia is largely populated by individuals of African American origin, the researcher
thought it wise to handout the survey to whoever will be willing to participate and any
individual that will be later identified not meeting the criteria of inclusion will then be

67
declared invalid. This will serve much time from trying to figure out which of the
participants actually meets the inclusion criteria or not.
I handed out the survey to each of the participants willing to participate in the
study from the station at the lobby of each of the four libraries after the informed consent
must have been obtained. All the participants were encouraged to read each question on
the survey carefully and to ask questions whenever there was need for clarification. The
researcher at period intervals also have to move around the library to either offer
assistance in completing the survey or to pick up surveys that were already completed.
This task went on for a couple of days until the required sample size was obtained. The
total burden to complete the survey was less than 15 minutes.
Power of the Study
This is a descriptive, cross sectional study that was designed to measure
characteristics of the population in terms of proportions. Thus, the appropriate formula
required to calculate the sample size for the study was:
N = 4(Z) (Z) [P(1-P)] / (D)(D)
Where N is the sample size, D width of the confidence interval, Z is a constant factor
corresponding to the desired confidence interval and P is a pre-study estimate of the
variable to be measured. The above formula depends on both the width of the confidence
interval (D) and also on the magnitude of the proportion (Eng, 2003).
Based on the above formula, at a 95% Confidence limit, confidence interval (CI)
of 5%, corresponding Z value of 1.96 and setting the estimated accuracy rate of response

68
at 50%, the number of cases required will be 384. If the margin of error (CI) is increased
to 10%, the sample size required drops to 96.
The above sample size requirements were further verified by the use of the
epidemiological software – Epi info v7. Thus, every attempt will be made to assure that
at least 96 cases will be evaluated for this study. This is a trade off in an attempt to meet
up with the time requirement for this study.
Data Analysis
Study Variables
The primary outcome variables in this study include knowledge of risk factors and
complications, treatment benefit and preventive health behaviors. The fourth main
variable in this study is actual preventive health behaviors exhibited by the study
participants. The instruments/methods that will be used in measuring each of these
variables is shown on Table 4.
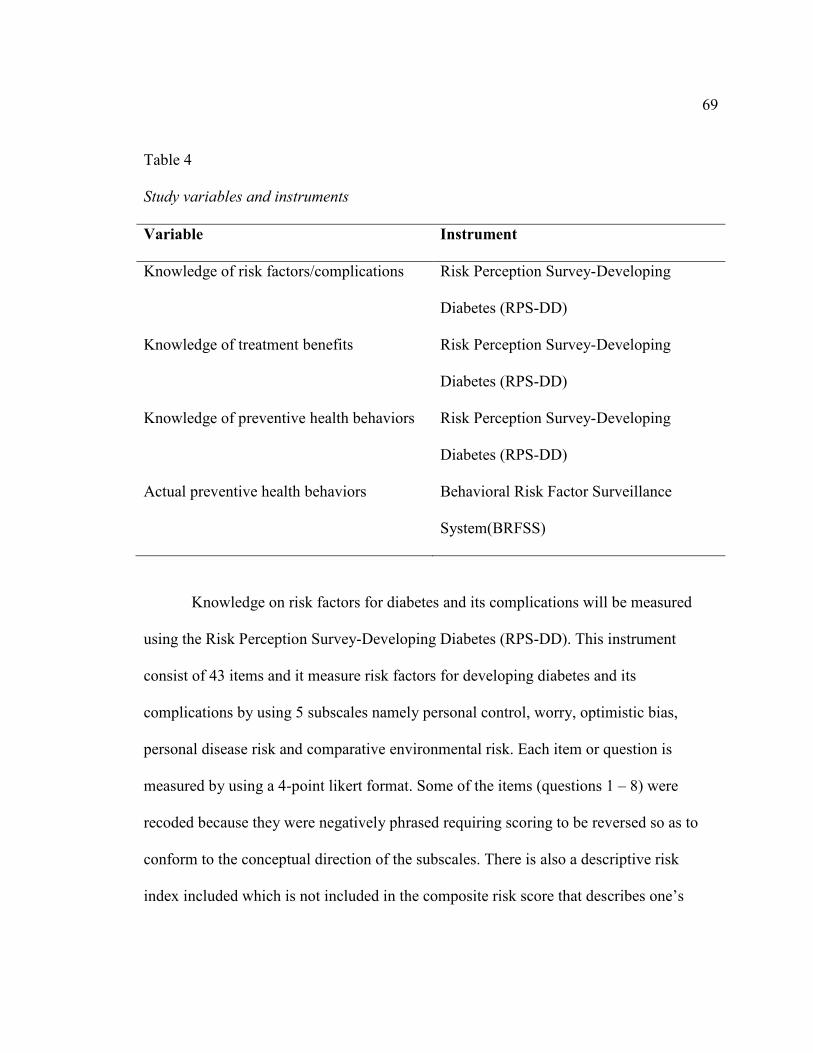
69
Table 4
Study variables and instruments
Variable Instrument
Knowledge of risk factors/complications Risk Perception Survey-Developing
Diabetes (RPS-DD)
Knowledge of treatment benefits Risk Perception Survey-Developing
Diabetes (RPS-DD)
Knowledge of preventive health behaviors Risk Perception Survey-Developing
Diabetes (RPS-DD)
Actual preventive health behaviors Behavioral Risk Factor Surveillance
System(BRFSS)
Knowledge on risk factors for diabetes and its complications will be measured
using the Risk Perception Survey-Developing Diabetes (RPS-DD). This instrument
consist of 43 items and it measure risk factors for developing diabetes and its
complications by using 5 subscales namely personal control, worry, optimistic bias,
personal disease risk and comparative environmental risk. Each item or question is
measured by using a 4-point likert format. Some of the items (questions 1 – 8) were
recoded because they were negatively phrased requiring scoring to be reversed so as to
conform to the conceptual direction of the subscales. There is also a descriptive risk
index included which is not included in the composite risk score that describes one’s

70
overall risk for developing diabetes based on the assessment of the participant’s overall
knowledge of the risk factors for the disease.
Analysis
The analysis in this study will include both descriptive and inferential statistics.
The statistical package Epi-Info v7 which is a specialized soft-ware developed by the
Centers for Disease Control and Prevention (CDC) for the analysis and interpretation of
epidemiological data will be used in this study. The analysis will begin with a descriptive
statistics of the socio-demographic characteristics of the respondents. The variables of
age, gender, educational level, occupation and income level are going to be included in
this table. Age will maintained as a continuous variable meanwhile all the others as
categorical variables. All these variables will be described with frequency tables (counts
and percentages). These tables will also goes further to give the measures of central
tendency which included the mean, median, mode, and standard deviation of each
variable.
Next, a similar table of socio-demographic characteristics will be constructed but
at this point, breaking the respondents into two categories: respondents with diabetes and
those without the disease.
The risk perception survey for developing diabetes (RPS-DD) scoring tool will be
used to calculate the risk perception of those with diabetes and those without diabetes.
According to the RPS-DD, risk perception is measured by the used of seven subscales.
These subscales include personal control, worry, optimistic bias, personal disease risk

71
(complications), comparative environmental risk, composite risk score and level of
knowledge. Each of these subscales was calculated for each questionnaire following the
scoring chart that accompanies the Risk Perception Survey-Developing Diabetes (RPS-
DD) instrument. A copy of the scoring chart is presented in appendix two.
Personal control will be calculated by considering the average score of the first
four items on the questionnaire which are Questions 1, 2, 3 and 4. This subscale measures
the level of knowledge of diabetes risks factors by looking at the respondents’ general
attitudes in controlling or preventing the disease. This subscale was design with the
assumption that individuals with more knowledge of the risks factors of diabetes should
have a more positive attitude and behavior in controlling the risk of getting the disease.
Worry is will be determined by considering the average score of questions 5 and
8. This subscale is based on the premise that respondents who are disturbed by the
thought of acquiring the disease may likely put in some effort in controlling their present
disease state or some preventive efforts in acquiring the disease in the future.
Optimistic bias is will be determined by the average scores of questions 6 and 7.
This is generally the mistaken belief that one’s chance of acquiring diabetes is lower than
that of one’s peers and the chances of maintaining good health (free from diabetes) in the
future is higher than that of one’s peer. Optimistic bias is more likely to be seen in
disease states that are controllable and as such people tend to stereotype typical
individuals that can acquire the disease (klein and Helweg-larsen, 2002).
72
Personal Disease Risk will be calculated by considering the likert score for each
of questions 9 - 23 plus 1 for either myself or/and any family member having the disease;
then the average scores across questions 9 – 23. The Personal Disease Risk subscale is
mostly focused on determining the knowledge level of the complications associated with
diabetes
Comparative Environmental Risk will be determined by considering the average
scores of questions 24 – 32. This subscale is aimed at measuring knowledge of risk
factors for diabetes that are associated with possible hazards or dangerous conditions in
the respondents’ environment like pollution, pesticides etc.
Composite Risk Score will be measured for each of the respondents by
considering the average scores of questions 1 – 32.
The last subscale in this questionnaire is the Diabetic Risk Knowledge. Though
included as a subscale, is actually an overall measure of the respondent’s knowledge of
risk of developing diabetes and has been used as a descriptor of the level of knowledge of
diabetes risk factors within a population. This subscale will be determined for each of the
respondents by considering the sum of correct responses to questions 33 – 43. All correct
responses are scored 1 and incorrect responses or ‘don’t know’ will be scored zero.
73
Analysis of Research Questions.
Five research questions were raised in this study. These research questions will be
approached as follows:
Research question 1: Are African American adult population knowledgeable of
the risk factors associated with DM?
Null Hypothesis 1: There is no relationship between the African American adult
population and their knowledge of risk factors and complications associated with diabetes
mellitus.
Alternative Hypothesis 1: There exists a relationship between the African American
adult population and their knowledge of risk factors and complications associated with
diabetes mellitus.
This question will be evaluated by first considering the scores obtained from each of the
first six subscales above. A higher score in each subscale implies a higher perception or
knowledge of that subscale and vice-versa. The last subscale which is used as a descriptor
of the general level of knowledge or perception of diabetes is scored differently. Sum of
correct responses of questions 33 – 43 are considered. A high score implies the
respondent is knowledgeable of the risk factors for diabetes. A detailed interpretation and
the results obtained from all the subscales reflecting the degree of knowledge of diabetes
risk factors will be discussed in chapter four.

74
Research question 2: Are African American adult population aware of the benefits
associated with treatment of diabetes?
Null Hypothesis 2: There is no relationship between the African American adult
population and their knowledge of benefits associated with effective treatment and
management of diabetes mellitus.
Alternative Hypothesis 2: There is a relationship between the African American adult
population and their knowledge of benefits associated with effective treatment and
management of diabetes mellitus.
This question will be evaluated by considering question 44. This question carries four
choices: 1 (strongly agree) implies the respondent is very knowledgeable of the benefits
associated with adequate treatment of diabetes. 2 (agree) implies decreasing knowledge
and 3 (disagree) and 4 (strongly disagree) implies the respondent has no knowledge of
treatment benefit for the disease.
Research question 3: do African American adult population with diabetes more
knowledgeable of the risk factors and treatment benefits of the disease, than their
counterparts without the disease?
Null Hypothesis 3: There is no significant difference between African American adults
with diabetes mellitus and their counterparts without the disease when considering
knowledge or awareness of the risk factors, complications and treatment benefits of the
disease.

75
Alternative Hypothesis 3: There is a significant difference between African American
adults with diabetes mellitus and their counterparts without the disease when considering
knowledge or awareness of the risk factors, complications and treatment benefits of the
disease.
This question will be evaluated by considering the previous two research questions. The
above will be repeated while placing the respondents into two classes: those with the
disease and those without the disease.
Question 4: How is knowledge of risk factors and treatment benefits distributed
across the African American population amongst those with the disease and those without
the disease when considering the different socioeconomic classes?
Null Hypothesis 4: There is no significant difference between African American adults
with diabetes mellitus and their counterparts without the disease when considering
knowledge or awareness of the risk factors, complications and treatment benefits of
diabetes mellitus when measured across the various socio-economic groups.
Alternative Hypothesis 4: There is a significant difference between African American
adults with diabetes mellitus and their counterparts without the disease when considering
knowledge or awareness of the risk factors, complications and treatment benefits of
diabetes mellitus when measured across the various socio-economic groups.
The respondents in the two classes of those with the disease and those without the disease
will be classified according to their response to the question on the fifth subscale. This
subscale consists of 11 items. Each item though with four responses is scored only with 1

76
and 0. Correct score=1, incorrect/don’t know=0. A categorical variable: Risk knowledge
was created for each respondent on the bases that six or more correct answers=1 and 0 for
five or less questions. Similarly, another categorical variable was created: SES which
places each respondent as either High SES (1), mid SES (2) and low SES (3). Using the
epidemiological software Epi info v7 a cross tabulation of these variables will be
performed.
A similar procedure will be carried out with the above three questions that measured
treatment benefits.
Question 5: What is the relationship between risk perception and health
preventive behaviors and does such translate into a healthier lifestyle within this ethnic
group?
Null Hypothesis 5: There is no relationship between knowledge of diabetes risk factors
and knowledge of health preventive behaviors and as such no lifestyle modifications were
seen within the African American adults’ population.
Alternative Hypothesis 5: There exist a relationship between knowledge of diabetes risk
factors and knowledge of health preventive behaviors and this has been translated into
healthy lifestyle modifications within the African American adults’ population.
Knowledge of risk perception was already determined above. Knowledge of preventive
health behaviors will be measured by considering responses to items 35, 41 and 43.
Similarly, healthier lifestyle will be determined by considering responses to questions on

77
the BRFSS. Thus, comparison will be made to determine if knowledge of preventive
health behaviors did translate into actual behaviors within this population or not
Protection and Confidentiality of Participants
Informed consent (Appendix C) will be obtained from each participants. There will be an
option for each respondent to decline participation on the consent form. This will be a
highlighted and bolded statement placed at the top of the consent form. Also the consent
form will clearly indicated that participants can leave the study at any time the wish to do
so even after they have consented to be a participant without penalty. Before the initiation
of the study, the Walden University Institutional Review Board (IRB) will have to
approve the study protocol for data collection and analysis as part of it commitment
towards the protection of human subjects and also in response to Federal mandate that
calls for increased emphasis on protection of human subjects in research. Walden
University’s approval number for this study was 06-03-14-0099017. Participants’ names
or any other personal identifiers were not used in any part of the study. All the surveys
received will be kept under lock and key, and I will be the only one that has access. These
data will be held for 5 years after the study has been conducted after which it will be
destroyed. .

78
Agenda for Survey Completion
Data collection for this study was expected to take about 6 weeks. This includes
the time required for the pilot surveys, review of pilot surveys, and the questionnaires. A
detailed time frame is shown on Table 5.
Table 5
Time Frame for Survey Instrument Distribution and Collection
Timeframe Activity
Week 1 Pilot surveys and consent letter at library A and B
Week 2 Pilot surveys and consent letter at library C and D
Week3 Review of pilot surveys and make any possible adjustments
Week4 Collecting of data from library A and B
Week5 Collecting of data from library C and D
Week5 Review of all surveys collected
Limitations of the study
External validity may be an issue in this study. The sample size of 96 was
maintained for this study which may be small to detect any trends within this population.
There is the possibility of bias on the part of the researcher as a result of direct interaction
between the researcher and respondents in an attempt to clarify issues raised in the
process of completing the survey. There are numerous factors that affect ones perception

79
or understanding that were not included in this study. These may have posed a limitation
in this study. These include finances, geographical location etc.
Summary
The present chapter has provided a brief description of the research design
required for this study. The rational for choosing this specific design, instrumentation
used and data analyses required were also discussed in this chapter. A detailed
description of the participants, the setting of the study and all possible measures
undertaken to protect the participants in this study was also discussed. Finally the role of
the researcher was outlined alongside a tentative timeline for the collection of the
required data. Thus, it is hoped that this chapter will further enhanced the reader’s
knowledge of the research, associated methodology and conceptual framework presented
earlier chapters of this study.
The results obtained from the present study design are presented in Chapter 4. A
concise analysis of the hypotheses and research questions raised in this study are
presented using the statistical package Epi-Info v7, a specialized soft-ware developed by
the CDC for the analysis and interpretation of epidemiological data. This statistical
package was used both for descriptive and inferential analyses.

80
Chapter 4: Results
Introduction
Findings from this research study are presented in this chapter. This contains the
results and the analyses of the hypotheses and addresses the five research questions posed
in this study. The findings of this study are presented in three main sections: (a) selected
socio-demographic characteristics of the participants (b) analysis of the five research
questions and hypotheses for this study, and (c) a summary of the results. The statistical
package Epi-Info v7, specialized software developed by the CDC for the analysis and
interpretation of epidemiological data, was employed for both descriptive and inferential
analysis. The RPS-DD scoring tool was used to determine the risk perception or level of
knowledge of both those with diabetes and those without diabetes.
Survey Response
I handed out a total of 168 surveys and consent forms to potential participants at
the four different public libraries in the city of Washington DC identified for this study.
Each library received 42 copies. The goal was a return of 30 completed surveys from
each location. Some of the returned surveys were incomplete and as a result were omitted
from analysis. Other surveys (16%) were never returned to the researcher. These data are
presented in Table 6.
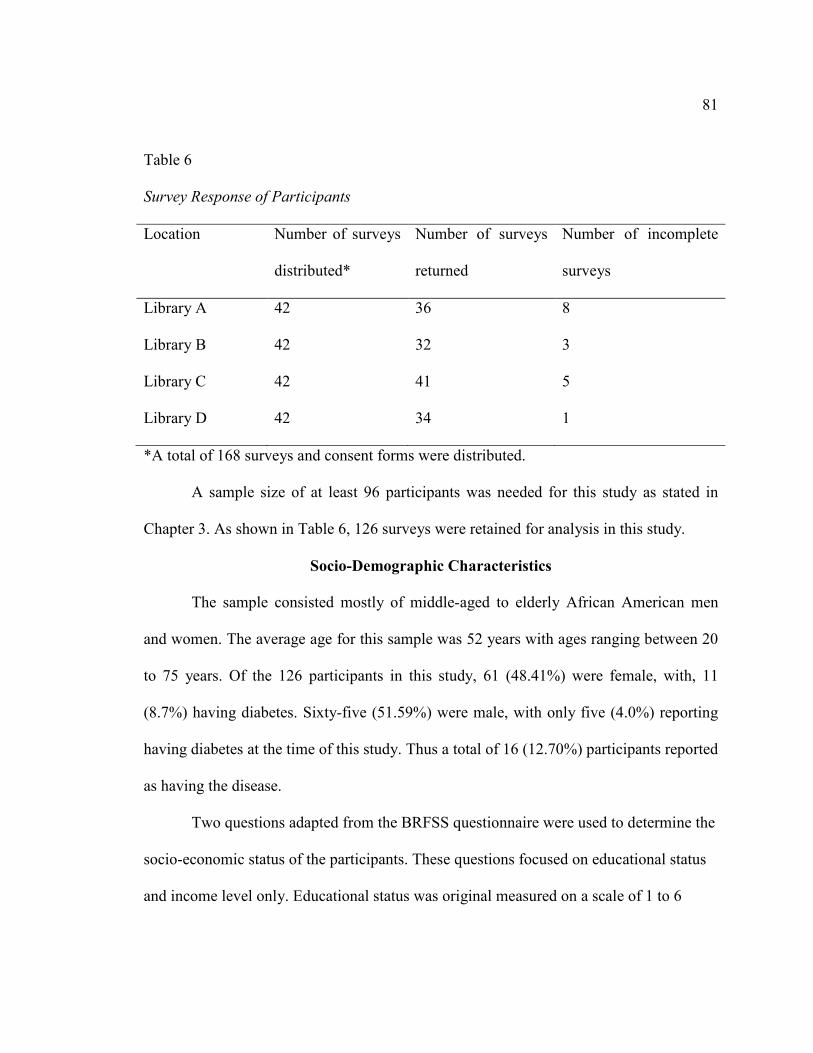
81
Table 6
Survey Response of Participants
Location Number of surveys
distributed*
Number of surveys
returned
Number of incomplete
surveys
Library A 42 36 8
Library B 42 32 3
Library C 42 41 5
Library D 42 34 1
*A total of 168 surveys and consent forms were distributed.
A sample size of at least 96 participants was needed for this study as stated in
Chapter 3. As shown in Table 6, 126 surveys were retained for analysis in this study.
Socio-Demographic Characteristics
The sample consisted mostly of middle-aged to elderly African American men
and women. The average age for this sample was 52 years with ages ranging between 20
to 75 years. Of the 126 participants in this study, 61 (48.41%) were female, with, 11
(8.7%) having diabetes. Sixty-five (51.59%) were male, with only five (4.0%) reporting
having diabetes at the time of this study. Thus a total of 16 (12.70%) participants reported
as having the disease.
Two questions adapted from the BRFSS questionnaire were used to determine the
socio-economic status of the participants. These questions focused on educational status
and income level only. Educational status was original measured on a scale of 1 to 6
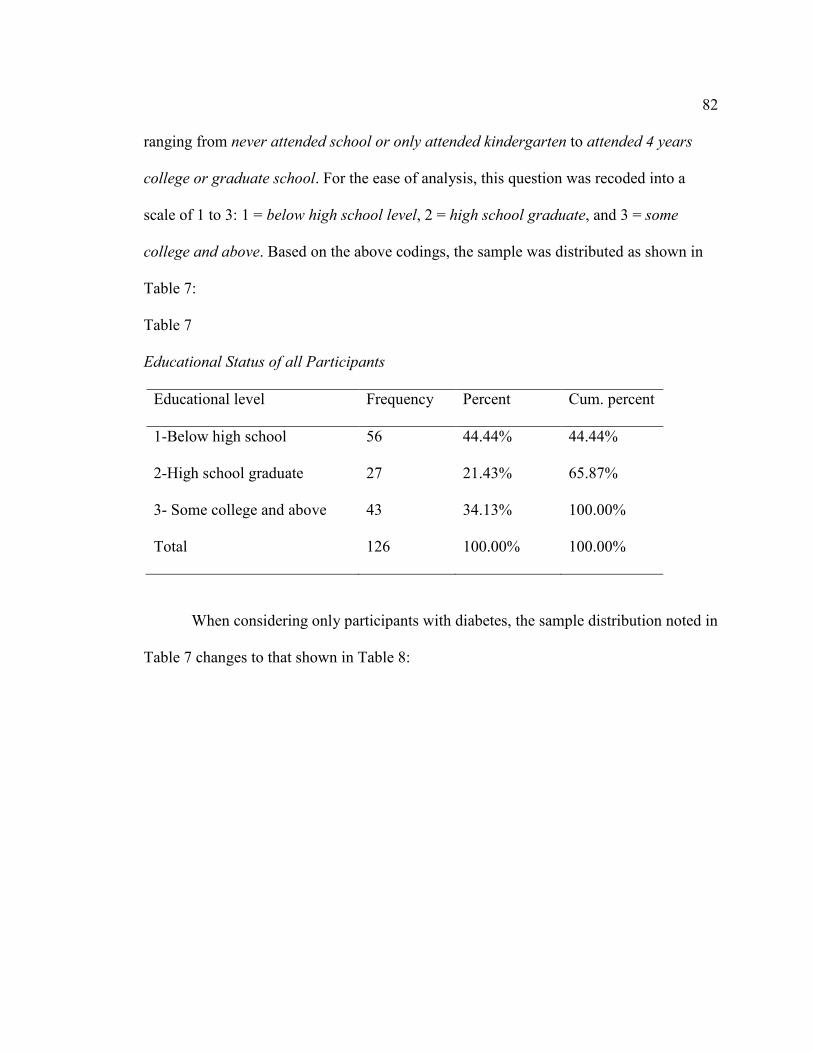
82
ranging from never attended school or only attended kindergarten to attended 4 years
college or graduate school. For the ease of analysis, this question was recoded into a
scale of 1 to 3: 1 = below high school level, 2 = high school graduate, and 3 = some
college and above. Based on the above codings, the sample was distributed as shown in
Table 7:
Table 7
Educational Status of all Participants
Educational level Frequency Percent Cum. percent
1-Below high school 56 44.44% 44.44%
2-High school graduate 27 21.43% 65.87%
3- Some college and above 43 34.13% 100.00%
Total 126 100.00% 100.00%
When considering only participants with diabetes, the sample distribution noted in
Table 7 changes to that shown in Table 8:

83
Table 8
Educational Status of Participants With Diabetes
Educational level Frequency Percent Cum. percent
1-Below high school 7 43.75% 43.75%
2-High school graduate 3 18.75% 62.50%
3-Some college and above 6 37.50% 100.00%
Total 16 100.00% 100.00%
Similarly, the annual income of the participants was originally recorded on a scale
of 1 to 8 ranging from less than $10,000 to $75,000 and above. This variable was
summarized into two broad categories: 1 = participants who earned less than $35,000
annually, and 2 = all participants who earned more than $35,000 annually, as shown in
Table 9.
Table 9
Annual Income of All Participants
Income Frequency Percent Cum. percent
1-(less than $35,000)* 96 76.19% 76.19%
2-($35,000 and above)* 30 23.81% 100.00%
Total 126 100.00% 100.00%
Note. *Annual income

84
When the data in Table 9 were compared with those having diabetes, the sample
distribution changes as shown on Table 10 below:
Table 10
Annual Income of All Participants With Diabetes
Income Frequency Percent Cum. percent
1-(less than $35,000)* 12 75.00% 75.00%
2-($35,000 and above)* 4 25.00% 100.00%
Total 16 100.00% 100.00%
*Annual income
The Risk Perception Survey for Developing Diabetes (RPS-DD) Scoring Tool
In an attempt to enhance the understanding of the results of this study using the
risk perception survey for developing diabetes (RPS-DD) scoring tool, a description of
the data for each of the six main survey subscales will be included in this section. This
description will include the number of items considered in each subscale, the response
format, mean scores of each subscale including the corresponding standard deviation
(±SD) and the internal consistency reliability coefficients for the sample.
Reliability
Cronbach’s coefficient alpha (α) was used to determine the internal consistency
reliability coefficient of the six variable constructs derived from the RPS-DD with the
data obtained in this study. Cronbach’s alpha determined for each of the variable
construct was as follows: (a) personal control = .84; (b) Worry = .75; (c) optimistic bias =

85
.93; (d) comparative disease risk = .92; (e) comparative environmental risk = 0.81 (f)
composite risk score = 0.84. A Cronbach’s alpha value of .70 or above is considered
acceptable. All constructs were reliable for the dataset used in this study.
The personal control subscale (4 items; α = 0.84), a mean score of 2.36 ± 1.05
was obtained. On a scale of 1 (strongly agree) to 4 (strongly disagree); a higher score
indicates greater perceived personal control over developing diabetes within the sample.
Thus the above mean score indicates a modest tendency towards personal control of
diabetes within this sample.
The next subscale has to deal with participants’ worry of having the disease
diabetes (2 items; α =0.75). A higher score in this subscale is an indication of a less
perceived risk of developing diabetes. On a scale of 1 (more worry) to 4 (less worry), a
mean score of 1.81±0.96 is an indication of a relatively slight perceived risk across this
subscale.
For the optimistic bias subscale (α 0.93), two items were considered. A higher
score in this subscale describes more perceived risk for developing diabetes, which
corresponds with a responds of less optimistic bias and more realism or pessimism about
developing diabetes. On a scale of 1 (more bias) to 4 (less bias), the mean score of 1.90
±1.07 obtained in this study, on average indicates a more tendency towards optimistic
bias.
The Comparative Disease Risk subscale (15 items; α = 0.92) measures perceived
risk across 15 diseases states and conditions. On a scale of 1 (“almost no risk”) to 4
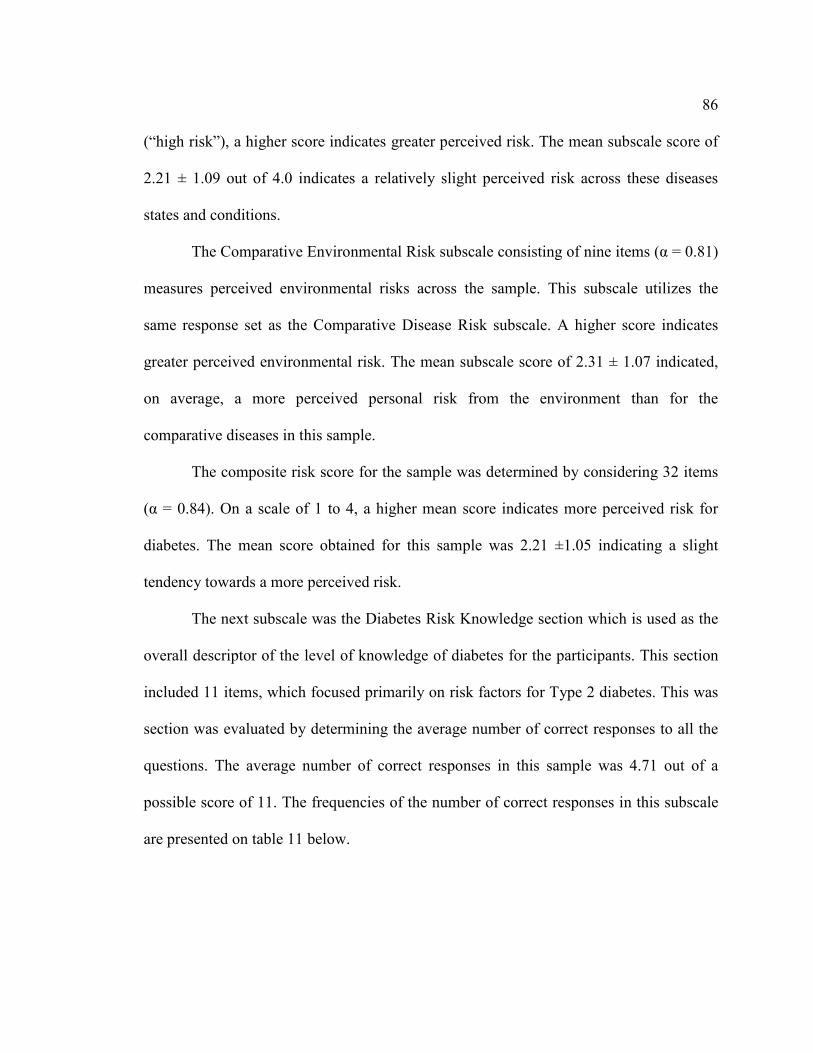
86
(“high risk”), a higher score indicates greater perceived risk. The mean subscale score of
2.21 ± 1.09 out of 4.0 indicates a relatively slight perceived risk across these diseases
states and conditions.
The Comparative Environmental Risk subscale consisting of nine items (α = 0.81)
measures perceived environmental risks across the sample. This subscale utilizes the
same response set as the Comparative Disease Risk subscale. A higher score indicates
greater perceived environmental risk. The mean subscale score of 2.31 ± 1.07 indicated,
on average, a more perceived personal risk from the environment than for the
comparative diseases in this sample.
The composite risk score for the sample was determined by considering 32 items
(α = 0.84). On a scale of 1 to 4, a higher mean score indicates more perceived risk for
diabetes. The mean score obtained for this sample was 2.21 ±1.05 indicating a slight
tendency towards a more perceived risk.
The next subscale was the Diabetes Risk Knowledge section which is used as the
overall descriptor of the level of knowledge of diabetes for the participants. This section
included 11 items, which focused primarily on risk factors for Type 2 diabetes. This was
section was evaluated by determining the average number of correct responses to all the
questions. The average number of correct responses in this sample was 4.71 out of a
possible score of 11. The frequencies of the number of correct responses in this subscale
are presented on table 11 below.
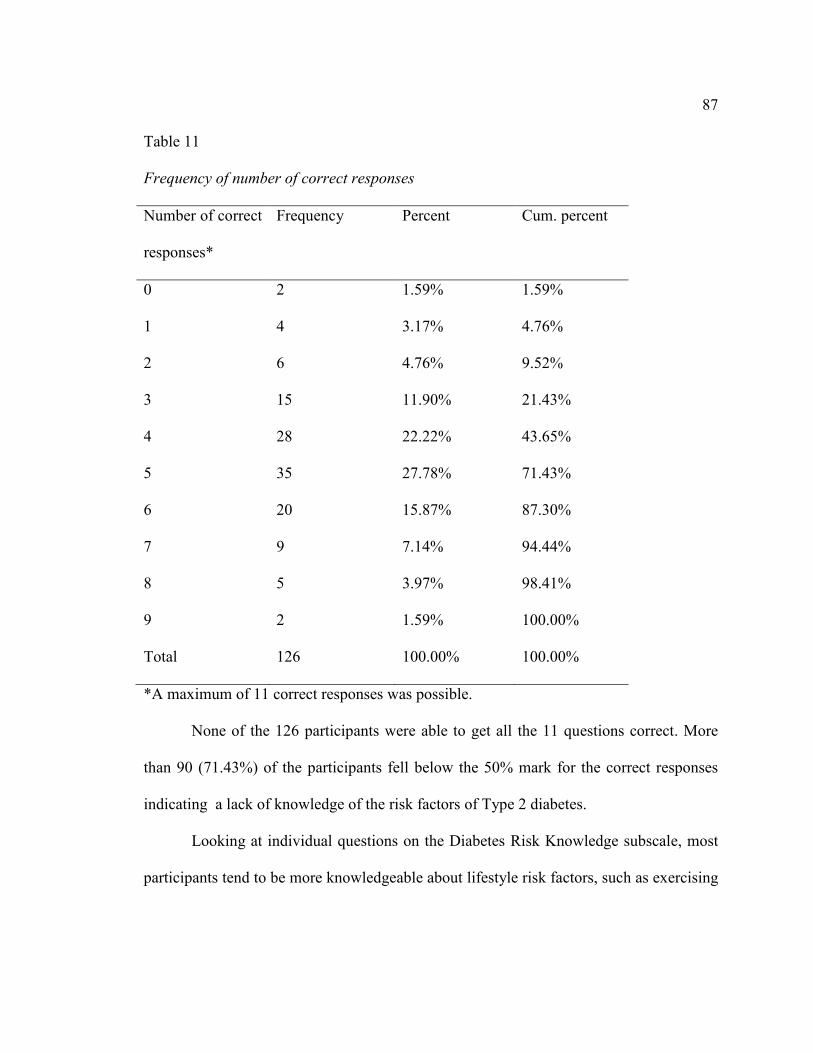
87
Table 11
Frequency of number of correct responses
Number of correct
responses*
Frequency Percent Cum. percent
0 2 1.59% 1.59%
1 4 3.17% 4.76%
2 6 4.76% 9.52%
3 15 11.90% 21.43%
4 28 22.22% 43.65%
5 35 27.78% 71.43%
6 20 15.87% 87.30%
7 9 7.14% 94.44%
8 5 3.97% 98.41%
9 2 1.59% 100.00%
Total 126 100.00% 100.00%
*A maximum of 11 correct responses was possible.
None of the 126 participants were able to get all the 11 questions correct. More
than 90 (71.43%) of the participants fell below the 50% mark for the correct responses
indicating a lack of knowledge of the risk factors of Type 2 diabetes.
Looking at individual questions on the Diabetes Risk Knowledge subscale, most
participants tend to be more knowledgeable about lifestyle risk factors, such as exercising

88
regularly, diet control or sedentary lifestyle, and less knowledgeable about risks to
specific ethnic groups. In particular, only about 30% of the participants knew that being
of Asian or Indian origin increased one’s risk of developing diabetes. Most of the
participants in this study (61%) were knowledgeable of the fact that being Black or of
African American origin greatly increases the risk of developing diabetes.
Table 12 below ranks by mean score the 15 diseases or conditions from the
Comparative Disease Risk subscale. This table gives the proportion of subjects who
responded that they were personally at high risk for each disease or condition. The
combined proportion of those who responded either moderate or high risk is also given. It
was noted that heart disease, infection needing treatment by a physician, high blood
pressure, kidney failure and cancer had higher mean scores for perceived personal risk to
health than did diabetes and other diseases and conditions, including several chronic
complications of diabetes. With a mean subscale score of 2.20±0.26, the majority of
respondents reported either “slight risk” or “moderate risk” of these 15 diseases or
conditions.
A similar ranking for the 9 Comparative Environmental Risk subscale items is
also presented on Table 12. Medical X-rays, driving/ riding in an automobile, Street
drugs and Cigarette smoke from other people also had higher mean scores for perceived
risk to health than the other environmental conditions. More than 50% of the participants
also perceived each of these 4 environmental conditions a “moderate “or “high”
environmental risk, in contrast to house hold chemicals and violent crime which was
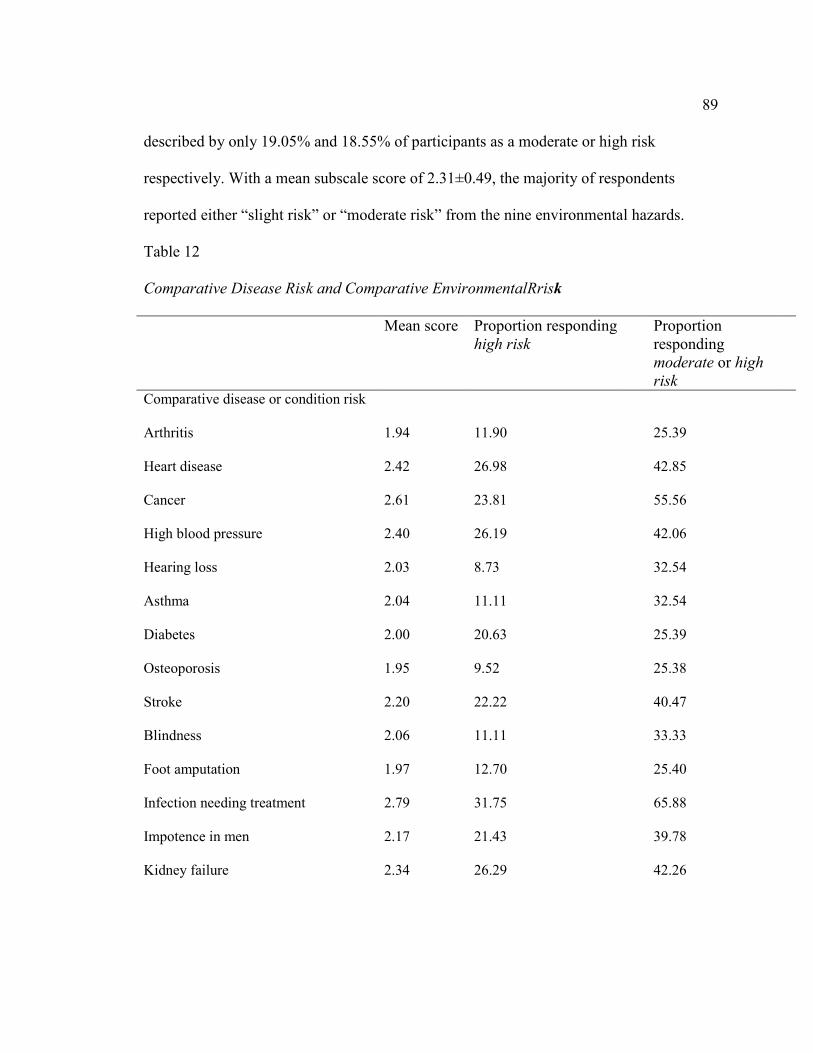
89
described by only 19.05% and 18.55% of participants as a moderate or high risk
respectively. With a mean subscale score of 2.31±0.49, the majority of respondents
reported either “slight risk” or “moderate risk” from the nine environmental hazards.
Table 12
Comparative Disease Risk and Comparative EnvironmentalRrisk
Mean score Proportion responding high risk
Proportion responding moderate or high
risk
Comparative disease or condition risk
Arthritis 1.94 11.90 25.39
Heart disease 2.42 26.98 42.85
Cancer 2.61 23.81 55.56
High blood pressure 2.40 26.19 42.06
Hearing loss 2.03 8.73 32.54
Asthma 2.04 11.11 32.54
Diabetes 2.00 20.63 25.39
Osteoporosis 1.95 9.52 25.38
Stroke 2.20 22.22 40.47
Blindness 2.06 11.11 33.33
Foot amputation 1.97 12.70 25.40
Infection needing treatment 2.79 31.75 65.88
Impotence in men 2.17 21.43 39.78
Kidney failure 2.34 26.29 42.26
90
Aids 2.10 19.05 41.27
Comparative environmental health
risk
Medical X-rays 2.89 40.48 63.50
Violent crime 1.78 8.87 18.55
Extreme weather (hot/cold) 2.00 19.05 30.16
Driving/riding in an automobile 2.81 42.06 56.35
Street drugs 2.75 32.54 55.56
Air pollution 1.93 15.08 29.37
Pesticide 2.01 13.49 27.78
Household chemicals 1.76 10.32 19.05
Cigarette smoke from other people 2.81 32.54 65.87
*Mean scores are based on response scale ranging from 1 (almost no risk) to 4 (high risk).
Analysis of Research Questions
Inferential Analysis Related to Hypothesis 1
Null Hypothesis 1: There is no relationship between the African American adult
population and their knowledge of risk factors and complications associated with diabetes
mellitus.
Alternative Hypothesis 1: There exists a relationship between the African
American adult population and their knowledge of risk factors and complications
associated with diabetes mellitus.

91
This hypothesis was evaluated by considering the mean scores obtained from each
of the six subscales above. A higher score in 4 of the subscales (personal control,
comparative disease risk, comparative environmental risk and composite risk score)
implies a higher perception or knowledge of that subscale and vice-versa. Meanwhile for
the subscales dealing with worry and optimistic bias, a higher score is an indication of
less knowledge and vice-versa. This is due to the fact that scoring within these 2
subscales was reversed to conform to conceptual direction of subscales. The last subscale
which is used as a descriptor of the general level of knowledge or perception of diabetes
was also determined. A high score implies the respondent is knowledgeable of the risk
factors for diabetes. A summary of the means scores calculated across all the subscales is
presented on Table 13 below.
Table 13
Summary of Mean Scores Across the Subscales
Subscale Mean
score
Std deviation Alpha coefficient
Personal control 2.36 2.05 0.84
Worry 1.81 0.96 0.75
Optimistic Bias 1.90 1.07 0.93
Comparative Disease
Risk
2.21 1.09 .092
Comparative 2.31 1.07 0.81

92
Environmental Risk
Composite Risk score 2.21 1.05 0.84
Diabetic Risk
Knowledge
4.67 1.73 N/A
Conclusion Related to Hypothesis 1
All the subscales indicated a slight tendency towards a more perceived risk of
diabetes. However, the diabetic risk knowledge subscale which is used as a descriptor of
level of knowledge for this scoring tool was determined to be only 4.71 out of a possible
score of 11. Based on this later assertion, the null hypothesis was rejected.
Inferential Analysis Related to Hypothesis 2
Null Hypothesis 2: There is no relationship between the African American adult
population and their knowledge of benefits associated with effective treatment and
management of diabetes mellitus.
Alternative Hypothesis 2: There is a relationship between the African American
adult population and their knowledge of benefits associated with effective treatment and
management of diabetes mellitus.
This research question was evaluated by considering Question 8B on the survey:
“I feel that taking my diabetes drugs as directed will help in controlling my illness”. This
question carries four possible choices ranging from: 1 (strongly agree) implies the
respondent is very knowledgeable of the benefits associated with adequate treatment of
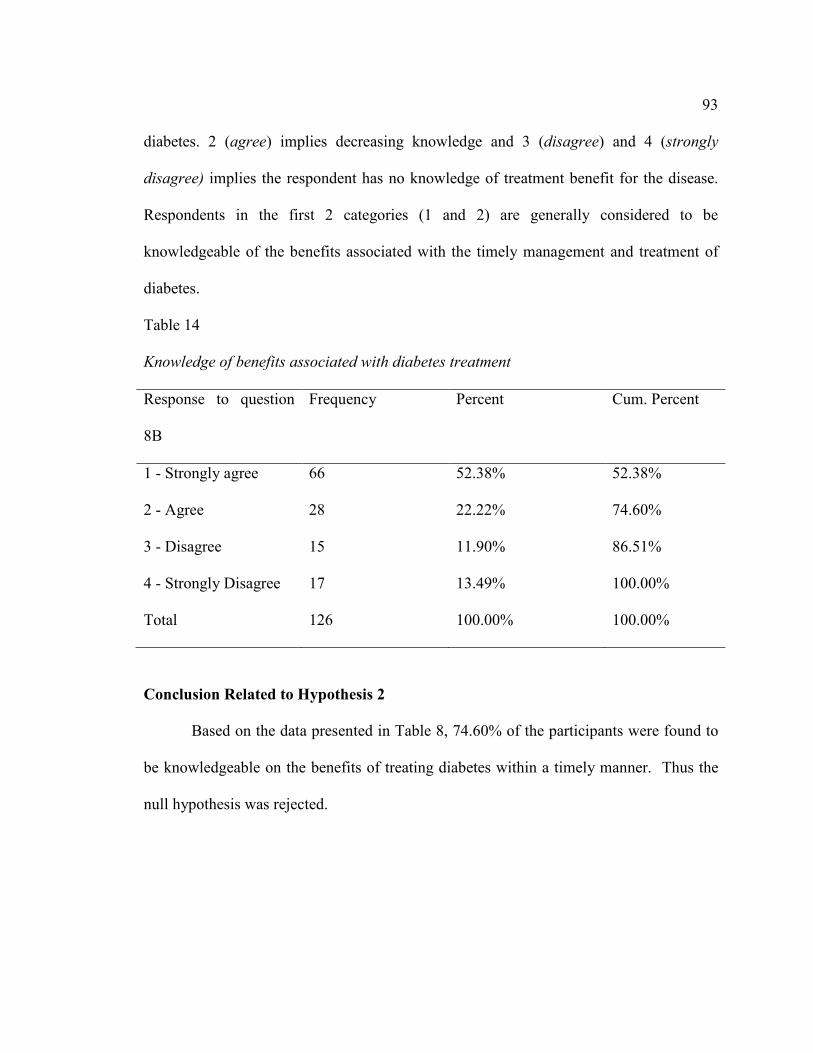
93
diabetes. 2 (agree) implies decreasing knowledge and 3 (disagree) and 4 (strongly
disagree) implies the respondent has no knowledge of treatment benefit for the disease.
Respondents in the first 2 categories (1 and 2) are generally considered to be
knowledgeable of the benefits associated with the timely management and treatment of
diabetes.
Table 14
Knowledge of benefits associated with diabetes treatment
Response to question
8B
Frequency Percent Cum. Percent
1 - Strongly agree 66 52.38% 52.38%
2 - Agree 28 22.22% 74.60%
3 - Disagree 15 11.90% 86.51%
4 - Strongly Disagree 17 13.49% 100.00%
Total 126 100.00% 100.00%
Conclusion Related to Hypothesis 2
Based on the data presented in Table 8, 74.60% of the participants were found to
be knowledgeable on the benefits of treating diabetes within a timely manner. Thus the
null hypothesis was rejected.

94
Inferential Analysis Related to Hypothesis 3
Null Hypothesis 3: There is no significant difference between African American
adults with diabetes mellitus and their counterparts without the disease when considering
knowledge or awareness of the risk factors, complications and treatment benefits of the
disease.
Alternative Hypothesis 3: There is a significant difference between African
American adults with diabetes mellitus and their counterparts without the disease when
considering knowledge or awareness of the risk factors, complications and treatment
benefits of the disease.
This question was evaluated by first considering the previous two hypotheses
(research question 1 and 2). The above was repeated while placing the respondents into
two classes: those with the disease and those without the disease. Respondent already
having diabetes were coded (1) and those without the disease were coded (0). A stratified
analysis was then carried out as shown on table 9 below.
Table 15
Knowledge of Rrisk Factors of Diabetes Stratified by Diabetes Status
Respondent without diabetes Respondents with diabetes
Knowledge
level
Frequency Percentage Cum.
percentage
Knowledge
level
Frequency Percentage Cum.
percentage
0 2 1.82 1.82 1 2 12.50 12.50
1 2 1.82 3.64 2 1 6.25 18.75

95
2 5 4.55 8.18 3 1 6.25 25.00
3 14 12.73 20.91 4 3 18.75 43.75
4 25 22.73 43.64 5 5 31.25 75.00
5 30 27.27 70.91 6 2 12.50 87.50
6 18 16.36 87.27 7 2 12.50 100.00
7 7 6.36 93.64
8 5 4.55 98.18
9 2 1.82 100.00
Respondents with 5 or less of the correct responses to questions 33 – 43 are
generally considered not knowledgeable of the risk factors for developing diabetes.
Considering the results on table 9 above, 70.91% of those without diabetes were found
not knowledgeable of the risk factors of diabetes. Comparing with those having diabetes,
75.0% also display a lack of knowledge of the risk factors for developing diabetes.

96
Table 16
Knowledge of Treatment Benefits of Diabetes Stratified by Diabetes Status
Respondent without diabetes Respondents with diabetes
Knowledge
of
treatment
Frequency Percentage Cum.
percentage
Knowledge
of
treatment
Frequency Percentage Cum.
percentage
1 56 50.91 50.91 1 10 62.50 62.50
2 25 22.73 73.64 2 3 18.75 81.25
3 13 11.82 85.45 3 2 12.50 93.75
416 16 14.55 100.00 4 1 6.25 100.00
Total 110 100.00 100.00 Total 16 100.00 100.00
Respondents in the first 2 categories (1 and 2) are generally considered to be
knowledgeable of the benefits associated with the timely management and treatment of
diabetes. Thus, considering the results on table 10 above, 73.64% of those without
diabetes were found knowledgeable of the benefits of diabetes management. Comparing
with those having diabetes, 81.25% was also found to be knowledgeable of the benefits
associated with the timely management and treatment of diabetes.
Conclusion Related to Hypothesis 3
Based on the above analysis, a difference was noted within the African American
adults’ population with diabetes mellitus and their counterparts without the disease when

97
considering knowledge or awareness of the risk factors, complications and treatment
benefits of the disease. Thus the null hypothesis was rejected.
Inferential Analysis Related to Hypothesis 4
Null Hypothesis 4: There is no significant difference between African American
adults with diabetes mellitus and their counterparts without the disease when considering
knowledge or awareness of the risk factors, complications and treatment benefits of
diabetes mellitus when measured across the various socio-economic groups.
Alternative Hypothesis 4: There is a significant difference between African
American adults with diabetes mellitus and their counterparts without the disease when
considering knowledge or awareness of the risk factors, complications and treatment
benefits of diabetes mellitus when measured across the various socio-economic groups.
The socio-economic status of the participants was determined by the using the
variables income and educational level. Educational level was coded as (1) -below high
school level, (2) -high school graduate and (3) - some college and above. Similarly,
income was coded as (1) - participants who earned less than $35,000 annually and (2) -
all participants who earned more than $35,000 annually.
Participants with diabetes were first considered in the analysis of this section.
A stratified analysis showed that among those with diabetes, all the individuals with
annual income above $35,000 had no knowledge of risk factors of diabetes while those
with a lower annual, only 33.33% were knowledgeable of such risk factors. Considering,
educational level, individuals falling below high school level, only 14.29% were able to

98
identify the risk factors for diabetes. Those in the categories of high school and college
level both scored 33.33% for those that could identify risk factors for diabetes.
Higher income individuals who were found to be knowledgeable of treatment
benefits of diabetes scored 75.0% meanwhile those with lower income was slightly
higher with 83.33% of college graduates, 71.43% of those below high school level and
66.67% of those with high school diploma display knowledge on treatment benefits of
diabetes respectively when considering educational level.
Similarly, among participants without diabetes, those with knowledge of the risk
factors of diabetes were distributed across the different educational levels as follows:
college graduates 35.14%, high school 25.00% and below high school level 26.53%.
Meanwhile 30.77% of high income earners and 28.57% of those earning less than
$35,000 annually did display such knowledge also.
86.49% of college graduates, 75.0% of those with high school diploma and
63.27% of participants below high school were found knowledgeable of the benefits of
diabetes treatment. A similar high trend was noted across income levels with 80.77% and
71.43% with regards to those earning more than $35,000 and those below $35,000
annually respectively.
Conclusion Related to Hypothesis 4
There is a general lack of knowledge of the risk factors for diabetes among those
with diabetes and their counterparts without the disease even when considering
socioeconomic differences within the sample. On the other hand, knowledge of treatment

99
benefits of diabetes maintained a high score across both groups. Based on the observed
differences, the null hypothesis was rejected.
Inferential Analysis Related to Hypothesis 5
Null Hypothesis 5: There is no relationship between knowledge of diabetes risk
factors and knowledge of health preventive behaviors and as such no lifestyle
modifications were seen within the African American adults’ population.
Alternative Hypothesis 5: There exist a relationship between knowledge of
diabetes risk factors and knowledge of health preventive behaviors and this has been
translated into healthy lifestyle modifications within the African American adults’
population.
The analysis of this question was slated into three sections: knowledge of risk
factors of diabetes, knowledge of preventive health behaviors and actions or steps (if any)
that have been put in place by the respondents in relationship to their knowledge levels of
risk factors of diabetes and preventive health behaviors.
28.57% of the participants were found to be knowledgeable of the risk factors of
diabetes. Three questions were used to measure the knowledge of preventive health
behaviors. The focused of these questions were on healthy dieting, physical exercise and
body weight control. The number of correct responses to these questions was 75.40%,
61.11% and 64.29% respectively.
From table 17, at least 24.60% of the participants do smoke cigarettes daily or
some days while a much smaller number (7.14%) indicated they chew tobacco. Only

100
7.14% of these participants indicated that during the past 12 months, they have actually
stopped smoking for at least one day or more because they were trying to quit smoking.
A similar trend was noted with alcohol consumption, with very little action being put in
place by the participants aimed at curtailing the number of drinks per day or per week.
33.33% of the participants indicated taking part in some physical activity or
exercise within the past month. Of this number, only 7.14% have actually made it a daily
event. Only a staggering number was noted to actually participate in maintaining a
healthy eating habit. In all the classes of food considered healthy, only about 10.00%
averagely, indicated it was their daily routine. Most importantly, 67.46% indicated they
have never considered vegetable consumption. Similar high numbers were also noted
across the other class of healthy foods as seen on table 17.
Table 17
A tabulation of Healthy Habit Practices*
Every day Some days Not at all Never/Not sure
Smoking
cigarettes
18.25 6.35 75.40 0
Chewing
tobacco
1.59 5.56 92.86 0
Per day Per week Per month Never/not sure
Juice
consumption
16.6 8.73 10.32 64.29
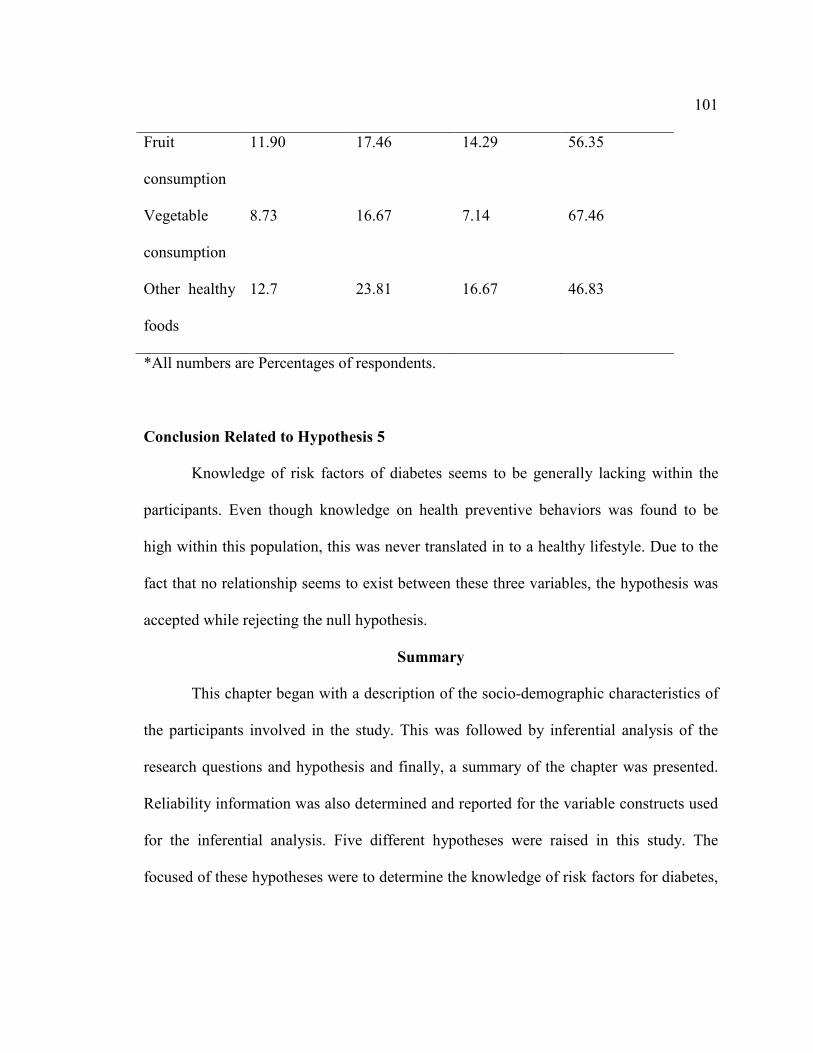
101
Fruit
consumption
11.90 17.46 14.29 56.35
Vegetable
consumption
8.73 16.67 7.14 67.46
Other healthy
foods
12.7 23.81 16.67 46.83
*All numbers are Percentages of respondents.
Conclusion Related to Hypothesis 5
Knowledge of risk factors of diabetes seems to be generally lacking within the
participants. Even though knowledge on health preventive behaviors was found to be
high within this population, this was never translated in to a healthy lifestyle. Due to the
fact that no relationship seems to exist between these three variables, the hypothesis was
accepted while rejecting the null hypothesis.
Summary
This chapter began with a description of the socio-demographic characteristics of
the participants involved in the study. This was followed by inferential analysis of the
research questions and hypothesis and finally, a summary of the chapter was presented.
Reliability information was also determined and reported for the variable constructs used
for the inferential analysis. Five different hypotheses were raised in this study. The
focused of these hypotheses were to determine the knowledge of risk factors for diabetes,

102
knowledge of benefits associated with timely management of diabetes, knowledge of
preventive health behaviors of diabetes and how such knowledge has been translated (if
any) into a healthy lifestyle.
Research question 1: Are African American adult population knowledgeable of
the risk factors associated with DM? The results of the analysis of this question indicated
that though all the subscales indicated a slight tendency towards a more perceived
knowledge of risk factors of diabetes, the diabetic risk knowledge subscale which is used
as a descriptor of level of knowledge was very low.
Research question 2: Are AA adult population aware of the benefits associated
with treatment of diabetes? The results of the analysis of this question indicated that more
than 74.60% of the participants are knowledgeable on the benefits of treating diabetes
within a timely manner.
Research question 3: do AA adult population with diabetes more knowledgeable
of the risk factors and treatment benefits of the disease, than their counterparts without
the disease? The results of the analysis of this question indicated that a difference does
exist within the African American adults’ population with diabetes mellitus and their
counterparts without the disease when considering knowledge or awareness of the risk
factors, complications and treatment benefits of the disease.
Research question 4: How is knowledge of risk factors and treatment benefits
distributed across the African American population amongst those with the disease and
those without the disease when considering the different socioeconomic classes? The

103
results showed a lack of knowledge of the risk factors for diabetes among those with
diabetes and their counterparts without the disease even when considering socioeconomic
differences within the sample. Knowledge of treatment benefits of diabetes maintained a
high score across both groups.
Question 5: What is the relationship between risk perception and health
preventive behaviors and does such translate into a healthier lifestyle within this ethnic
group? Knowledge of risk factors of diabetes was determined to be lacking within the
participants. Though knowledge on health preventive behaviors was found to be high
within this population, this was never translated into any healthy lifestyle.
The next chapter will summarize the research findings and draw conclusions for
the data presented in this chapter. Chapter 5 will also provide recommendations for
further study. This will also answer the research questions to the corresponding
hypothesis and compare the current study findings with data from past research reviewed
earlier in this study in chapter 2.

104
Chapter 5: Discussion, Conclusions, and Recommendations
Introduction
This chapter will present the summary of the findings, conclusions drawn from
the data and will go ahead to slat recommendations needed for further action. This
chapter also tries to compare the literature review carried out earlier in this study with the
research findings. The implications for social change and limitations noted in this study
are also explained.
The results of this study represent only a small portion of individuals who reside
in the District of Columbia. There are over 800,000 inhabitants in the District of
Columbia. This location was chosen for the study because though African Americans
constitute only 13.6% of the United States population, the African American population
in the District of Columbia is more than 52.2% (United States Census Bureau, 2011).
The purpose of this study was to evaluate the knowledge of African Americans on
the risk factors of diabetes like age, race, family history of diabetes and gestational
diabetes. It also looked at Knowledge of Diabetes complications, treatments benefits and
Knowledge of Preventive health behaviors like healthy dieting, physical inactivity,
smoking and weight control. Thus the quest of this study was to set a frame that should
be able to facilitate the developing of interventions that will be able to aid in reducing the
burden of this disease within the African American adults’ population. Specifically, the
data collected on the area of risk knowledge, personal risk, treatment benefits and

105
preventive health behaviors should be able to pinpoint the focus and type of such an
intervention(s).
A two stage random cluster sampling was implemented in this study. Four
clusters were identified following the geographical break-up of the city. A total of 168
surveys and consent forms were handed out to participants at these four locations. 143
surveys were completed and returned to the researcher but only126 were retained for the
analysis of this study due to missing data records. The results of this study indicated that
the African American adult population is not equipped with enough knowledge of the
risk factors associated with diabetes. Though knowledge on treatment benefits of diabetes
and health preventive behaviors was found to be high within this population, this was
never translated into any healthy lifestyle.
Conclusions and Literature Review Comparisons
Five research questions were raised in this study. Each of these research questions
tend to build on the knowledge gained from the previous questions. The main variables of
interest within these questions include knowledge of risk factors of diabetes and its
complications, benefits of timely management and treatment of diabetes, preventive
health behaviors and socio-economic factors.
Research question 1: Are African American adult population knowledgeable of
the risk factors associated with diabetes?
A critical look at past studies, has revealed that there are very few studies at
moment that have actually looked at the perception of risk factors of diabetes amongst the

106
general population (Calvin et al., 2011) . As concern African Americans, there is even
less information that describe such perceive risk of developing diabetes. Calvin et al.,
(2011) have noted that the present published research that details the relationships among
diabetes, well-being and illness perception cannot be generalized to African American
adults.
The few studies that have dealt with perception of diabetes with or without health
preventive behaviors have noted either a general lack of knowledge of the disease or even
where there is some understanding of the disease, such in most cases has always been a
wrong conception as was clearly shown by Cullen and Buzek (2009), Jennette et al.
(2010), and Wong and Toh ( 2009). Cullen and Buzek (2009) in another studying aimed
at accessing the diabetic knowledge and risk factors awareness among African American
and Hispanic families, also noted that there was a lack of such knowledge within both
communities. In a similar study, the authors Kim et al. (2007) have also looked at the risk
perception among women who had had some history of gestational diabetes. Despite the
fact that the relationship between gestational diabetes and postpartum diabetes are well
understood, most of the women in the study consider themselves not to be at risk when
compared with the general population.
The outcome of data collected for this study seems to be consistent with already
published studies. In this study, the RPS-DD was administered to a sample of
representatives who are at risk for diabetes. The six main subscales used with this
instrument to determine the knowledge of risk factor for diabetes had acceptable

107
reliability. The personal control subscale indicated a modest tendency towards personal
control of diabetes within this sample. Individuals with more knowledge of the risks
factors of diabetes should have a more positive attitude and behavior in controlling the
risk of getting the disease. The calculated mean score for this subscale indicates, that such
a positive attitude is absent in this sample.
The optimistic bias subscale on average indicated a more tendency towards
optimistic bias. This is generally the mistaken belief that one’s chance of acquiring
diabetes is lower than that of one’s peers. These results are consistent with past studies
that have indicated it is more likely for individuals to stereotype others as being more
prone to acquiring a chronic disease like diabetes than do themselves ( klein and Helweg-
larsen, 2002). Such a behavior was noted in this study by Kim et al. (2007). Bringing
together women with history of gestational diabetes, it was noted that though more than
90% of these women acknowledged a history of gestational diabetes as a risk factor for
future diabetes, less than 10% believe they themselves were at high risk for the disease.
Similarly, when considering the subscale dealing with worry, a relatively slight
perceived risk across this subscale is an indication that respondents are not much
disturbed by the thought of acquiring the disease. Individuals in this category may likely
not put in much effort in controlling their present disease state in other to avoid acquiring
the disease in the future.
The Comparative Disease Risk subscale indicates a relatively slight perceived risk
across these diseases states and conditions meanwhile the Comparative Environmental

108
Risk subscale on the other hand indicated, a more perceived personal risk from the
environment than for the comparative diseases in this sample. The Comparative Disease
Risk subscale is mostly focused on determining the knowledge level of the complications
associated with diabetes. It may be more obvious for participants to identify pollutants in
the environment like pesticides, smoke when compared to complications of diabetes that
may require some expert knowledge.
The last subscale in this questionnaire was the Diabetic Risk Knowledge. A very
low mean score was obtain in this subscale and less than 30% of the participants were
able to get 50% or more of the correct responses. Though included as a subscale, this is
actually an overall measure of the respondent’s knowledge of risk of developing diabetes
and has been used as a descriptor of the level of knowledge of diabetes risk factors within
a population.
Studies carried out so far on determining risk perception for diabetes within the
general population have centered on comparing the different ethnic groups in the united
states (Calvin et al., 2011). Results obtained from most of these studies have classified
African Americans amongst those ethnic groups with low knowledge of risk factors for
diabetes. The present study focused primarily on African American, has produced similar
results.
Research question 2: Are African American adults aware of the benefits
associated with treatment of diabetes?

109
Knowledge of diabetes management is paramount to the effective control of the
disease. The non-compliance to diabetic drug regimen and the difficulties in improving
adherence in such patients are well documented (Chin, Polanski, Thomas, and Nerney,
2000; Harris, Linn, Skyler and Sandifer, 1987). The American public health Association
APHA, American Psychological Association (APA) along with the other health
organizations have proposed possible steps that must be implemented if the patient must
adhere to their treatment regimen. Barriers to adherence to treatment regimens have been
identified as one of the most important factors. Lack of knowledge of the importance to
adhere to treatment protocols has been identified to be at the top of such barriers.
Based on the data collected in this study, about 75% of the participants were
found to be knowledgeable on the benefits of treating diabetes within a timely manner. A
relatively high knowledge of timely management and treatment of diabetes as such, is a
positive step in overcoming the non-compliance problem that has continued to plaque the
entire medical field cutting across all the disease states and ethnicities.
Due to the importance of the patient’s behavior in the control and management
of diabetes, many studies have been carried out on this topic. Limited health literacy or
lack of knowledge of the disease has been identified in a couple of studies as a major
drawback to lack of knowledge of treatment benefits associated with the disease
(Onwudiwe et al., 2011; Quinn et al., 2011). Though knowledge of the benefits of
treatments of diabetes seems high in this study, an overall lack of knowledge of the

110
disease remains an important factor to be addressed within the African American
community in the District of Washington DC and nationwide.
Research question 3: Do African American adult population with diabetes more
knowledgeable of the risk factors and treatment benefits of the disease, than their
counterparts without the disease?
It will be but logical to think that individuals with a chronic disease like diabetes
should be more knowledgeable of the risk factors for the disease and benefits associated
with timely management of the disease than their counterparts without the disease? The
results of this study indicates a lack of knowledge of risk factors for the disease from both
groups with only 25% of those with diabetes and about 30% of participants without the
disease displaying some knowledge of risk factors for the disease respectively. An
opposite picture was obtained when considering knowledge of the benefits of treatment
of diabetes. Both groups appear to be very knowledgeable on this topic.
Low literacy rate on diabetes may be a major contributing factor to the low level
of knowledge of the risk factors of the disease recorded in this study. Prior studies have
noted socioeconomic differences with regards to outcome expectations for diabetes. In a
study by Figaro, Elasy, BeLue, Speroff, and Dittus, (2009) in which they explore health
behaviors of adults with Type 2 diabetes of different socioeconomic status, it was
observed that individuals classified as belonging to the higher socioeconomic class
exhibited more positive outcomes than subjects of lower socioeconomic status. The
socio-economic distribution of the participants and how this has affected the distribution
111
of knowledge of risk factors of the disease and treatment benefits is the focus of the next
research question.
Due to the fact that a difference was noted within the African American adults’
population with diabetes mellitus and their counterparts without the disease when
considering knowledge or awareness of the risk factors, complications and treatment
benefits of the disease, the null hypothesis was rejected while retaining the alternative
hypothesis.
Research question 4: What is the relationship between African American adults
with diabetes mellitus and their counterparts without the disease when considering
knowledge or awareness of the risk factors, complications and treatment benefits of the
diabetes mellitus when measured across the various socio-economic groups?
Socio-economic disparity within any group or society may lead to differences in
knowledge. Thus the focus of this research question was to determine how such disparity
within the African American population has affected their knowledge or awareness of the
risk factors, complications and treatment benefits of the disease when controlling for
diabetes status.
Data collected reveals that college graduates and participants with higher income
were able to display more knowledge of the risk factors of diabetes when considering
those without diabetes. Similar, knowledge of benefits of treatment of diabetes also had
higher scores with college graduates and those of higher income within this group of
participants without diabetes. This means that participants of educational level below

112
high school and those of lower annual income presented with a lesser level of knowledge
of both risk factors and benefits of treatment of diabetes.
When the above paragraph was compared with individuals having diabetes, those
with lower annual incomes and those of high school and college level also reported
higher knowledge of the risk factors for diabetes. Similarly, considering the knowledge of
benefits of treatment of diabetes within this group, those with lower annual incomes and
college graduate level seem to be more knowledgeable. Thus participants with
educational level below high school and those of higher annual income presented with a
lower level of knowledge of both variables of risk factors and benefits of treatment of
diabetes within this group of individuals already having diabetes.
Two indicators were used in this study to measure the socio-economic status of
the participants namely education and income level. More than 62% of the participants
fall below high school level meanwhile about 76% earn less than $35,000 annually. This
is an indication that the population involved in this study is of a low socio-economic
status. Thus the findings so far in this study fits into the findings of Figaro, Elasy, BeLue,
Speroff, and Dittus, (2009) mentioned earlier in this chapter: socioeconomic differences
within the study group tends to affect the outcome expectations of knowledge of diabetes.
Thus at this point it can be speculated that the low level of knowledge of risk factors of
diabetes noted across all the different classes and groupings is due to the fact that the
population is mostly of a poorer or low socio-economic background.
113
The results documented on this research question confirm the fact that there seem
to exist a direct proportionality between knowledge and socio-economic status.
Generally, individuals with more income and higher education reported with more
knowledge in this study. Such a traditional association between socioeconomic and
knowledge of different disease states has been consistent across many studies. On the
other hand, it has also been noted that this association may not be that robust in all
situations. Such a situation is seen in this study where among individuals having diabetes,
those with lower annual incomes reported higher knowledge of the risk factors for
diabetes and knowledge of benefits of treatment of diabetes within this group instead.
Research question 5: What is the relationship between knowledge of diabetes risk
factors and knowledge of health preventive behaviors and has such translated into any
lifestyle modifications within this ethnic group?
Having an understanding of the risk factors of a disease like diabetes and
understanding the necessary preventive behaviors may be important factors to influence
the individual to adapt healthy behaviors like regular exercise, weight control and
Smoking. Research question 5 is actually slated into 3 sections: knowledge of risk
factors of diabetes, knowledge of preventive health behaviors and actions or steps (if any)
that have been put in place by the respondents in relationship to their knowledge levels of
risk factors of diabetes and preventive health behaviors.
In this study, only 28.57% of the participants were found to be knowledgeable of
the risk factors of diabetes. Three questions were used to measure the knowledge of
114
preventive health behaviors. The focused of these questions were on healthy dieting,
physical exercise and body weight control. The number of correct responses to these
questions was 75.40%, 61.11% and 64.29% respectively indicating that the participants
understand or have knowledge of the preventive health behaviors associated with
diabetes.
Though the participants in this study seem to understand the importance of health
preventive behaviors, only a staggering number actually put this into practice.
Knowledge of risk factors of diabetes seems to be generally lacking within the
participants. Even though knowledge on health preventive behaviors was found to be
high within this population, this was never translated in to a healthy lifestyle. This is
consistent with most of the studies that have evaluated this topic. In a large population
based study focused at understanding the risk of diabetes amongst Singaporean’s and
related health preventive behaviors, the authors were able to conclude that better
understanding of the disease was associated with favorable behaviors (Wong & Toh,
2009). These, researchers noted that though the participants in the study understood the
importance of knowledge of risk factors of diabetes and healthy behaviors but it was
never found to have been translated to healthier lifestyles. Ethnic minorities including
African Americans have always reported less physical activity, poorer diets when
compared with the general population (Mathieu et al., 2012).
As noted above, most of the individuals involved in this study are of the lower socio-
economic group. Thus it may be worthwhile questioning at this point why do individuals

115
of low–socioeconomic status in most cases always act in ways that tend to be harmful to
their health even when they are aware of the importance of maintaining healthy
behaviors? This was the focus of a recent study by Pampel et al., 2010, where he authors
noted that the present literature has done little to compare or contrast the mechanisms
involved in this. As a result, they try to offer some suggestions which include:
1. There is a possibility that socioeconomic status can affect any incentives or
motivations for healthy behavior. Individuals within the low socioeconomic
status may have less reason than high socioeconomic status groups to want to
forego the short-term pleasures of unhealthy behavior for long-term gain in
longevity. Individuals within the high socioeconomic status group may face
less stress that might encourage coping through unhealthy behavior and may
probably gain more longevity benefits from healthy behaviors. The idea of
greater knowledge of risks that tend to motivate healthy behavior amongst
high socioeconomic status is still unclear.
2. Motives and means may be two important factors of consideration. This is
because socioeconomic status can affect the means to reach certain health
goals. Individuals within all socioeconomic status groups may have similar
desires towards healthy behaviors. Despite this, low- socioeconomic status
groups may have more difficulties in achieving their goals. The above
relationship between motives and means may not be that linear as may appear.
That is, this may tend to blur at some extreme points as strong motive
116
increases, there is the likely event that there is going to be increased effort to
find effective means. Also, factors like social support will also affect the
connection between motives and means. Even with these drawbacks, some
researchers still believe, these are distinct factors, and distinguishing among
them may be very helpful in designing studies dealing with disparities in
health behaviors.
Concluding Statement
This study was designed to measure the knowledge of African Americans Adults’
population in the District of Washington DC on the risk factors of diabetes and its
complications, benefits of timely management and treatment of diabetes and preventive
health behaviors. Based on the above, five research questions were raised in this study.
Each of these research questions was tended to build on the knowledge gained from the
previous questions. The main variables of interest within these research questions include
knowledge of risk factors of diabetes and its complications, benefits of timely
management and treatment of diabetes, preventive health behaviors and socio-economic
factors of the population.
Data collected for this study reveals a lack of knowledge of the risk factors of
diabetes amongst this population. The lack of knowledge of the risk factors of diabetes
within this population was found to be consistent with previous studies. These results
remained unchanged even when controlled for diabetes status and socioeconomic status.
Knowledge on benefits of timely management and treatment of diabetes, preventive

117
health behaviors was noted to be prevalent within this population. Unfortunately, even
where such knowledge exists, it was never translated to any healthy behaviors.
Recommendations for Action
Healthcare in the United States and worldwide today still hold strongly on the old
paradigm of “prevention is better than cure”. This is due to the fact that the cost of
treating or managing a chronic disease like diabetes outweighs what it may take to
prevent the disease. This not even including pain and suffering from the disease, time lost
form work etc. Many programs offered by Medicare today have incorporated some form
of a prevention program. The Medicare Diabetes Prevention Act (S. 452/H.R. 962),
which is a legislation providing Medicare coverage for the National Diabetes Prevention
Program (National DPP) to eligible beneficiaries determined to be at high risk for Type 2
diabetes, has the potential to slow or halt the diabetes epidemic which impacts millions of
Americans and their families and which cost the united states government about $245
billion in 2012 (ADA, 2014).
The results of this study have shown that the African American population needs
to be educated on the risk factors of diabetes. Hispanics and non-Hispanic blacks
continue to maintain the highest prevalence rate of diabetes in the Unites states when
compared to their Non – Hispanic White adult counterparts (CDC, 2012f). Due to the
heightened level of prevalence of diabetes mellitus today, many studies have emerged
that try to determine or measure the level of understanding of their respective population
of this disease. Such an understanding is very important today because: (1) Patients must

118
be fully involved in the management of the disease. This implies, a general understanding
and awareness is considered a first and most important step in taking action aimed at
reducing the threat of the disease (Allen, Purcell, Szanton, & Dennison, 2010). This can
only happen if that awareness is enacted within the patient. (2) Targeted interventions
aimed at curtailing this epidemic can only be well crafted if we can get a better
understanding of the population involve. Interventions of this nature have been proven to
reduce diabetic risk (Diabetes Prevention Program Research Group et al., 2009;
Lindström et al., 2003).
The above analysis indicates the need for interventions tailored at empowering the
African American community to be involved in the prevention of this disease. Such
interventions must be focused on educating this community on the risk factors of
diabetes. Understanding the risk factors is the paramount and most important step in
reducing the incidence within any community.
Recommendations for Further Study
The present study was a cross-sectional study with only 126 participants.
Reciprocating this study with a larger sample size may be needed so as to be able to yield
better data and outcome related to the studied variables and characteristics of the
population. Further investigation on a longitudinal study is also needed to determine if
intentions to improve behavior within the African American population is associated with
actual behavioral changes. Such a study should also be able to determine whether risk

119
perception is responsive to these changes and whether interventions that modify risk
perception can translate to actual improvement in individual behavior.
It may also be necessary to explore the role of healthcare providers with respects
to education regarding the risk factors of diabetes. The focus of such an intervention
would be mainly to determine what the patients are being told and also to determine if
they are actually assimilating the intended message. This was a quantitative study. Thus
future research that is capable of exploring participants’’ perception of risk for diabetes
with qualitative methodology may be able to improve understanding by answering why
there was a low perception of risk for diabetes complications. This may also facilitate the
drafting of interventions that are capable of assist in correcting these incorrect
perceptions.
Implications for Social Change
The purpose of this study was to evaluate the knowledge of African
Americans within the different socioeconomic groups with regards to diabetes while
considering the following main variables: Knowledge of risk factors, Knowledge of
Diabetes complications, Knowledge of treatments benefits and Knowledge of Preventive
health behaviors of diabetes. This study has expanded on the concept that baseline
knowledge is needed so as to be able to craft effective educational programs or
interventions focused at curtailing the prevalence and incidence of diabetes in the United
States. Thus, the results of this study should be able to provide some of that knowledge
which might facilitate researchers in developing future interventions especially in the

120
area of behavioral interventions that promote diabetes management especially within the
African American population. Thus, the implications for positive social change will be
that the outcomes of this study will potentially enhance understanding of diabetes among
the African-American population. Knowledge can only be most valuable when put to use
for the greater good of the population (Walden, 2012). The morbidity and mortality of
diabetes is ever on the rise with Hispanics and non-Hispanic blacks affected the most.
Study Limitations
The first limitation noted in this study is the participation size. The sample size
for this study was 126. Though this population gave some statistical power, more
participants may have yielded better data and outcomes.
.Another limitation of this study was the fact that all participants self-reported the
information on the survey. Some of the questions were subjective in nature and may not
have reflected honest answers from the participants. It may be likely that If the same
questionnaires were issued out to the same participants at different times, the answers
may be different based on the day, emotional state or how the individual generally felt.
This is recall bias which can lead to Type I error in the study.
Another limitation identified in the study could have come from the survey tool.
Some of the questions the researcher did receive from individual participants indicated
that this tool may need to be at a much lower reading level. Participants seem not to
clearly comprehend some of the questions requiring the researcher to explain the survey,
which on the other hand could have influenced the participants’ responses. The results

121
obtained from this study indicate most of the participants are below high school level
which may go to explain the above drawback. The questionnaires were checked using the
SMOG readability test which gave an average of a sixth grade reading level. Thus this
drawback was minimized.

122
References
American Diabetes Association (ADA). (2011). Costs of diabetes in The United States.
Retrieved, from http://www.diabetes.org/diabetes-basics/diabetes-statistics/
American Diabetes Association (ADA). (2012). Diabetics basics. Retrieved
from http://www.diabetes.org/diabetes-basics/
The American Diabetes Association (2014). Preventing Diabetes in seniors.
Retrieved from
http://www.diabetes.org/advocacy/advocacy-priorities/prevention/preventing-
diabetes-in.html
American Psychological Association (2012). Socio-economic status.
Retrieved from
http://www.apa.org/topics/socioeconomic-status/index.aspx
Allen, J. K., Purcell, A., Szanton, S., & Dennison, C. R. (2010). Perceptions of cardiac
risk among a low-income urban diabetic population. Journal of Health Care for
the Poor and Underserved, 21(1), 362–370. doi:10.1353/hpu.0.0241
Anderson, R. M., Wolf, F. M., Musch, D. C., Fitzgerald, J. T., Johnson, M. W.,
Nwankwo, R. B., Gillard, M. L. (2002). Conducting community-based, culturally
specific, eye disease screening clinics for urban African Americans with diabetes.
Ethnicity & Disease, 12(3), 404–410.

123
Becker, M. H., & Janz, N. K. (1985). The health belief model Applied to understanding
diabetes regimen compliance. Diabetes Educator, 11(1), 41–47.
doi:10.1177/014572178501100108
Brewer, N. T., Weinstein, N. D., Cuite, C. L., & Herrington, J. E. (2004). Risk
perceptions and their relation to risk behavior. Annals of Behavioral
Medicine: a Publication of the Society of Behavioral Medicine, 27(2), 125–130.
doi:10.1207/s15324796abm2702_7
Brunton, L. & Gilman, A. (2011). Goodman & Gilman’s the pharmacological basis of
therapeutics. New York: McGraw-Hill Medical.
Cengage G (2002). Encyclopedia of public health. Health Belief Model. Retrieved from
http://www.enotes.com/health-belief-model-reference/health-belief-model
Calvin, D., Quinn, L., Dancy, B., Park, C., Fleming, S. G., Smith, E., & Fogelfeld, L.
(2011). African Americans’ perception of risk for diabetes complications.
Diabetes Educator, 37(5), 689–698. doi:10.1177/0145721711416258
Centers for Disease Control and Prevention (CDC). (2011a). National diabetes fact
sheet. Retrieved from http://www.cdc.gov/diabetes/pubs/estimates11.htm
Centers for Disease Control and Prevention (CDC). (2012). Adult obesity facts. Retrieved
from http://www.cdc.gov/obesity/data/adult.html
Chen, K. W., & Killeya-Jones, L. A. (2006). Understanding differences in marijuana use
among urban Black and suburban White high school students from two U.S.
124
community samples. Journal of in Ethnicity in Substance Abuse, 5(2), 51–73.
doi:10.1300/J233v05n02_04
Chin, M. H., Polonsky, T. S., Thomas, V. D., & Nerney, M. P. (2000). Developing a
conceptual framework for understanding illness and attitudes in older, urban
African Americans with diabetes. Diabetes Educator, 26(3), 439–449.
Chisholm-Burns, M. A., & Spivey, C. A. (2008). Pharmaco-adherence: A new term for a
significant problem. American Journal of Health-System Pharmacy, 65(7), 661–
667. doi:10.2146/ajhp070372
Choi, J. H., Park, C. Y., Cha, B. S., Kim, I. J., Park, T. S., Park, J. Y., … Park, S. W.
(2012). Perception of clinicians and diabetic patients on the importance of
postprandial glucose control and diabetes education status: a cross sectional
survey. Diabetes & metabolism journal, 36(2), 120–127.
doi:10.4093/dmj.2012.36.2.120
Creswell, J. (2009). Research design: Qualitative, quantitative and mixed methods
approaches (3rd ed.). California: SAGE Publications.
Cullen, K. W., & Buzek, B. B. (2009). Knowledge about Type 2 diabetes risk and
prevention of African-American and Hispanic adults and adolescents with family
history of Type 2 diabetes. Diabetes Educator, 35(5), 836–842.
doi:10.1177/0145721709341851

125
Diabetes Prevention Program Research Group, (2009). 10-year follow-up of diabetes
incidence and weight loss in the diabetes prevention program outcomes study.
Lancet, 374(9702), 1677–1686. doi:10.1016/S0140-6736(09)61457-4
Dorman, J. S., & Bunker, C. H. (2000). HLA-DQ Locus of the Human Leukocyte
Antigen Complex and Type 1 Diabetes Mellitus: A HuGE Review. Epidemiologic
Reviews, 22(2), 218–227.
Economos, C. D., Bakun, P. J., Herzog, J. B., Dolan, P. R., Lynskey, V. M., Markow, D.,
Nelson, M. E. (2012). Children’s perceptions of weight, obesity, nutrition,
physical activity and related health and socio-behavioural factors. Public health
nutrition, 1–9. doi:10.1017/S136898001200479X
Edmonds-Myles, S., Tamborlane, W. V., & Grey, M. (2010). Perception of the impact of
Type 1 diabetes on low-income families. The Diabetes educator, 36(2), 318–325.
doi:10.1177/0145721709349219
Eng, J. (2003). Sample size estimation: how many individuals should be studied?
Radiology, 227(2), 309–313. doi:10.1148/radiol.2272012051
Figaro, M. K., Elasy, T., BeLue, R., Speroff, T., & Dittus, R. (2009). Exploring
socioeconomic variations in diabetes control strategies: impact of outcome
expectations. Journal of the National Medical Association, 101(1), 18–23.
Florez, J. C., Hirschhorn, J., & Altshuler, D. (2003). The inherited basis of diabetes
mellitus: implications for the genetic analysis of complex traits. Annual review of

126
genomics and human genetics, 4, 257–291.
doi:10.1146/annurev.genom.4.070802.110436
Ford, M. E., Havstad, S. L., Brooks, B. L., & Tilley, B. C. (2002). Perceptions of diabetes
among patients in an urban health care system. Ethnicity & health, 7(4), 243–254.
doi:10.1080/1355785022000060709
Fukunaga, L. L., Uehara, D. L., & Tom, T. (2011). Perceptions of diabetes, barriers to
disease management, and service needs: a focus group study of working adults
with diabetes in Hawaii. Preventing chronic disease, 8(2), A32.
Gillibrand, R., & Stevenson, J. (2006). The extended health belief model applied to the
experience of diabetes in young people. British journal of health psychology,
11(Pt 1), 155–169. doi:10.1348/135910705X39485
Glasgow, R. E., Toobert, D. J., & Gillette, C. D. (2001). Psychosocial Barriers to
Diabetes Self-Management and Quality of Life. Diabetes Spectrum, 14(1), 33–
41. doi:10.2337/diaspect.14.1.33
Gloyn, A. L. (2003). The search for Type 2 diabetes genes. Ageing research reviews,
2(2), 111–127.
Hanson, M. D., & Chen, E. (2007). Socioeconomic status and health behaviors in
adolescence: a review of the literature. Journal of behavioral medicine, 30(3),
263–285. doi:10.1007/s10865-007-9098-3
Harris, R., Linn, M. W., Skyler, J. S., & Sandifer, R. (1987). Development of the diabetes
health belief scale. The Diabetes educator, 13(3), 292–297.

127
Harvey, J. N., & Lawson, V. L. (2009). The importance of health belief models in
determining self-care behaviour in diabetes. Diabetic medicine: a journal of the
British Diabetic Association, 26(1), 5–13. doi:10.1111/j.1464-5491.2008.02628.x
Hivert, M.-F., Warner, A. S., Shrader, P., Grant, R. W., & Meigs, J. B. (2009). Diabetes
Risk Perception and Intention to Adopt Healthy Lifestyles Among Primary Care
Patients. Diabetes care, 32(10), 1820–1822. doi:10.2337/dc09-0720
Hurley, A. C. (1990). The health belief model: evaluation of a diabetes scale. The
Diabetes educator, 16(1), 44–48.
International diabetes Federation (2011): Types of diabetes. Retrieved
from http://www.idf.org/types-diabetes
Janz, N. K., & Becker, M. H. (1984). The Health Belief Model: a decade later. Health
education quarterly, 11(1), 1–47.
Jennette, C. E., Vupputuri, S., Hogan, S. L., Shoham, D. A., Falk, R. J., & Harward, D.
H. (2010). Community perspectives on kidney disease and health promotion from
at-risk populations in rural North Carolina, USA. Rural and remote health, 10(2),
1388.
Kim, C., McEwen, L. N., Piette, J. D., Goewey, J., Ferrara, A., & Walker, E. A. (2007).
Risk perception for diabetes among women with histories of gestational diabetes
mellitus. Diabetes care, 30(9), 2281–2286. doi:10.2337/dc07-0618

128
klein, C., & Helweg-larsen, M. (2002). Perceived control and the optimistic bias: A meta-
analytic review. Journal of psychology and health, 17(4), 437–446.
doi:10.1080/0887044022000004920
Knowler, W. C., Barrett-Connor, E., Fowler, S. E., Hamman, R. F., Lachin, J., Walker, E.
A., & Nathan, D. M. (2002). Reduction in the incidence of Type 2 diabetes with
life style intervention or metformin. massachusetts Medical society, 364(6), 393–
403.
Koda-kimble, M., Young, L., Kradjan, W., Guglielmo, J., Alldredge, B., & Corelli, R.
(2004). Applied Therapeutics: The clinical use of drugs. (8th ed.). Baltimore:
Lippincott Williams & Wilkins.
Landrine, H., & Klonoff, E. A. (1992). Culture and health-related schemas: a review and
proposal for interdisciplinary integration. Health psychology: official journal of
the Division of Health Psychology, American Psychological Association, 11(4),
267–276.
Lindström, J., Louheranta, A., Mannelin, M., Rastas, M., Salminen, V., Eriksson, J., …
Finnish Diabetes Prevention Study Group. (2003). The Finnish Diabetes
Prevention Study (DPS): Lifestyle intervention and 3-year results on diet and
physical activity. Diabetes care, 26(12), 3230–3236.
Lipman, T. H., Murphy, K. M., Kumanyika, S. K., Ratcliffe, S. J., Jawad, A. F., &
Ginsburg, K. R. (2012). Racial differences in parents’ perceptions of factors
129
important for children to live well with diabetes. The Diabetes educator, 38(1),
58–66. doi:10.1177/0145721711427454
McPhee, S., Papadakis, M., & Rabow, M. (2012). Current medical diagnosis and
treatment 2013. (52nd ed.). San Francisco: McGraw-Hill Medical.
Mathieu, R. A., 4th, Powell-Wiley, T. M., Ayers, C. R., McGuire, D. K., Khera, A., Das,
S. R., & Lakoski, S. G. (2012). Physical activity participation, health perceptions,
and cardiovascular disease mortality in a multiethnic population: the Dallas Heart
Study. American heart journal, 163(6), 1037–1040.
doi:10.1016/j.ahj.2012.03.005
McKenzie, C., & Skelly, A. H. (2010). Perceptions of coronary heart disease risk in
African American women with Type 2 diabetes: a qualitative study. The Diabetes
educator, 36(5), 766–773. doi:10.1177/0145721710374652
Mokdad, A. H., & Remington, P. L. (2010). Measuring health behaviors in populations.
Preventing chronic disease, 7(4), A75.
Mokdad, A. H., Stroup, D. F., & Giles, W. H. (2003). Public health surveillance for
behavioral risk factors in a changing environment. Recommendations from the
Behavioral Risk Factor Surveillance Team. MMWR. Recommendations and
reports: Morbidity and mortality weekly report. Recommendations and reports /
Centers for Disease Control, 52(RR-9), 1–12.
130
Nair, K. M., Levine, M. A. H., Lohfeld, L. H., & Gerstein, H. C. (2007). “I take what I
think works for me”: a qualitative study to explore patient perception of diabetes
treatment benefits and risks. The Canadian journal of clinical pharmacology =
Journal canadien de pharmacologie clinique, 14(2), e251–259.
National Diabetes Information Clearinghouse (NDIC) (2007). Monogenic Forms of
Diabetes: Neonatal Diabetes Mellitus and Maturity-onset Diabetes of the
Young.r Retrieved from
http://diabetes.niddk.nih.gov/dm/pubs/mody/
Nam, S., Chesla, C., Stotts, N. A., Kroon, L., & Janson, S. L. (2011). Barriers to diabetes
management: patient and provider factors. Diabetes research and clinical
practice, 93(1), 1–9. doi:10.1016/j.diabres.2011.02.002
Nelson, D E, Holtzman, D., Bolen, J., Stanwyck, C. A., & Mack, K. A. (2001).
Reliability and validity of measures from the Behavioral Risk Factor Surveillance
System (BRFSS). Sozial- und Präventivmedizin, 46 Suppl 1, S3–42.
Nelson, David E, Powell-Griner, E., Town, M., & Kovar, M. G. (2003). A comparison of
national estimates from the National Health Interview Survey and the Behavioral
Risk Factor Surveillance System. American journal of public health, 93(8),
1335–1341.
Noël, L. T. (2010). An ethnic/racial comparison of causal beliefs and treatment
preferences for the symptoms of depression among patients with diabetes. The
Diabetes educator, 36(5), 816–827. doi:10.1177/0145721710380145

131
Ogden, C. L., Lamb, M. M., Carroll, M. D., & Flegal, K. M. (2010). Obesity and
socioeconomic status in children and adolescents: United States, 2005-2008.
NCHS data brief, (51), 1–8.
Olden, K., & White, S. L. (2005). Health-related disparities: influence of environmental
factors. The Medical clinics of North America, 89(4), 721–738.
doi:10.1016/j.mcna.2005.02.001
Onwudiwe, N. C., Mullins, C. D., Winston, R. A., Shaya, F. T., Pradel, F. G., Laird, A.,
& Saunders, E. (2011). Barriers to self-management of diabetes: a qualitative
study among low-income minority diabetics. Ethnicity & disease, 21(1), 27–32.
Oxford University press (2013). Definition of perception in English. Retrieved from
http://oxforddictionaries.com/us/definition/american_english/perception
Pampel, F. C., Krueger, P. M., & Denney, J. T. (2010). Socioeconomic Disparities in
Health Behaviors. Annual review of sociology, 36, 349–370.
doi:10.1146/annurev.soc.012809.102529
Pawlak, R., & Colby, S. (2009). Benefits, barriers, self-efficacy and knowledge regarding
healthy foods; perception of African Americans living in eastern North Carolina.
Nutrition research and practice, 3(1), 56–63. doi:10.4162/nrp.2009.3.1.56
Pinelli, N. R., Berlie, H. D., Slaughter, R. L., & Jaber, L. A. (2009). Risk perception for
developing diabetes among pharmacists. The Annals of pharmacotherapy, 43(6),
1050–1056. doi:10.1345/aph.1L692

132
Quinn, C. C., Royak-Schaler, R., Lender, D., Steinle, N., Gadalla, S., & Zhan, M. (2011).
Patient understanding of diabetes self-management: participatory decision-making
in diabetes care. Journal of diabetes science and technology, 5(3), 723–730.
Resource center for Adolescent pregnancy prevention (2009). Theories & Approaches:
Health Belief Model. Retrieved from
http://recapp.etr.org/recapp/index.cfm?fuseaction=pages.theoriesdetail&PageID=
13&PageTypeID=8
Scollan-Koliopoulos, M., Rapp, K. J., 3rd, & Bleich, D. (2012). Afrocentric cultural
values and beliefs: movement beyond the race and ethnicity proxy to understand
views of diabetes. The Diabetes educator, 38(4), 488–498.
doi:10.1177/0145721712445213
Scott, T., Mannion, R., Marshall, M., & Davies, H. (2003). Does organisational culture
influence health care performance? A review of the evidence. Journal of Health
Services Research & Policy, 8(2), 105–117. doi:10.1258/135581903321466085
Singh, H., Cinnirella, M., & Bradley, C. (2012). Support systems for and barriers to
diabetes management in South Asians and Whites in the UK: qualitative study of
patients’ perspectives. BMJ open, 2(6). doi:10.1136/bmjopen-2012-001459
Shaw-perry, M. (2006). Life style changes: Keys to reducing health disparities among
people of color; perceptions and beliefs about Type 2 diabetes among
non-diabetic black women. DePaul journal of health care law, 51, 73–83.
133
Thomas, S. B., Fine, M. J., & Ibrahim, S. A. (2004). Health Disparities: The Importance
of Culture and Health Communication. American Journal of Public Health,
94(12), 2050.
Tjora, T., Hetland, J., Aarø, L. E., Wold, B., & Overland, S. (2012). Late-onset smokers:
how many, and associations with health behaviors and socioeconomic status.
Scandinavian journal of public health, 40(6), 537–543.
doi:10.1177/1403494812454233
Turner, A. P., Kivlahan, D. R., Sloan, A. P., & Haselkorn, J. K. (2007). Predicting
ongoing adherence to disease modifying therapies in multiple sclerosis: utility of
the health beliefs model. Multiple sclerosis (Houndmills, Basingstoke, England),
13(9), 1146–1152. doi:10.1177/1352458507078911
Turner L W, Hunt S B, DdBrezzo R & Jones C (2004). Design and implementation of an
osteoporosis prevention program using the health belief model. American journal
of health studies 19(2), 115 - 21
United States Census Bureau (2011). Black or African American population: 2000 and
2010. Retrieved from
www.census.gov/prod/cen2010/briefs/c2010br-br-06.pdf
Vivian, E. M., Becker, T. L., & Carrel, A. L. (2012). Weight perceptions of parents with
children at risk for diabetes. BMC research notes, 5, 47. doi:10.1186/1756-0500-
5-47

134
Wagner, J. (2011). Behavioral Interventions to Promote Diabetes Self-Management.
Diabetes Spectrum, 24(2), 61–62. doi:10.2337/diaspect.24.2.61
Walden University (2012). The 2012 social change impact report. Retrieved on
September 12, 2012 from http://www.waldenu.edu/About-Us/Social-Change-
Impact-Report.htm
Walker, E. A., Mertz, C. K., Kalten, M. R., & Flynn, J. (2003a). Risk Perception for
Developing Diabetes Comparative Risk Judgments of Physicians. Diabetes Care,
26(9), 2543–2548. doi:10.2337/diacare.26.9.2543
Walker, E. A., Mertz, C. K., Kalten, M. R., & Flynn, J. (2003b). Risk perception for
developing diabetes: comparative risk judgments of physicians. Diabetes care,
26(9), 2543–2548.
Westerlund, D. (2006). African indigenous religions and disease causation from spiritual
beings to living humans. Leiden; Boston: Brill. Retrieved from
http://site.ebrary.com/id/10234900
Wild, S., Roglic, G., Green, A., Sicree, R., & King, H. (2004). Global Prevalence of
Diabetes Estimates for the year 2000 and projections for 2030. Diabetes Care,
27(5), 1047–1053. doi:10.2337/diacare.27.5.1047
Willemsen, M. C., Hoogenveen, R. T., & Van Der Lucht, F. (2002). New smokers and
quitters. Transitions in smoking status in a national population. European journal
of public health, 12(2), 136–138.

135
Wong, L. Y., & Toh, M. P. H. S. (2009). Understanding of diabetes mellitus and health-
preventive behavior among Singaporeans. Annals of the Academy of Medicine,
Singapore, 38(6), 478–479.
World Health Organization (2012). Health topics: Diabetes. Retrieved from
http://www.who.int/topics/diabetes_mellitus/en/
Zhao, J., Song, F., Ren, S., Wang, Y., Wang, L., Liu, W., Sun, Y. (2012). Predictors of
condom use behaviors based on the Health Belief Model (HBM) among female
sex workers: a cross-sectional study in Hubei Province, China. PloS one, 7(11),
e49542. doi:10.1371/journal.pone.0049542
Zimmet, P., Alberti, K. G., & Shaw, J. (2001). Global and societal implications of the
diabetes epidemic. Nature, 414(6865), 782–787. doi:10.1038/414782a
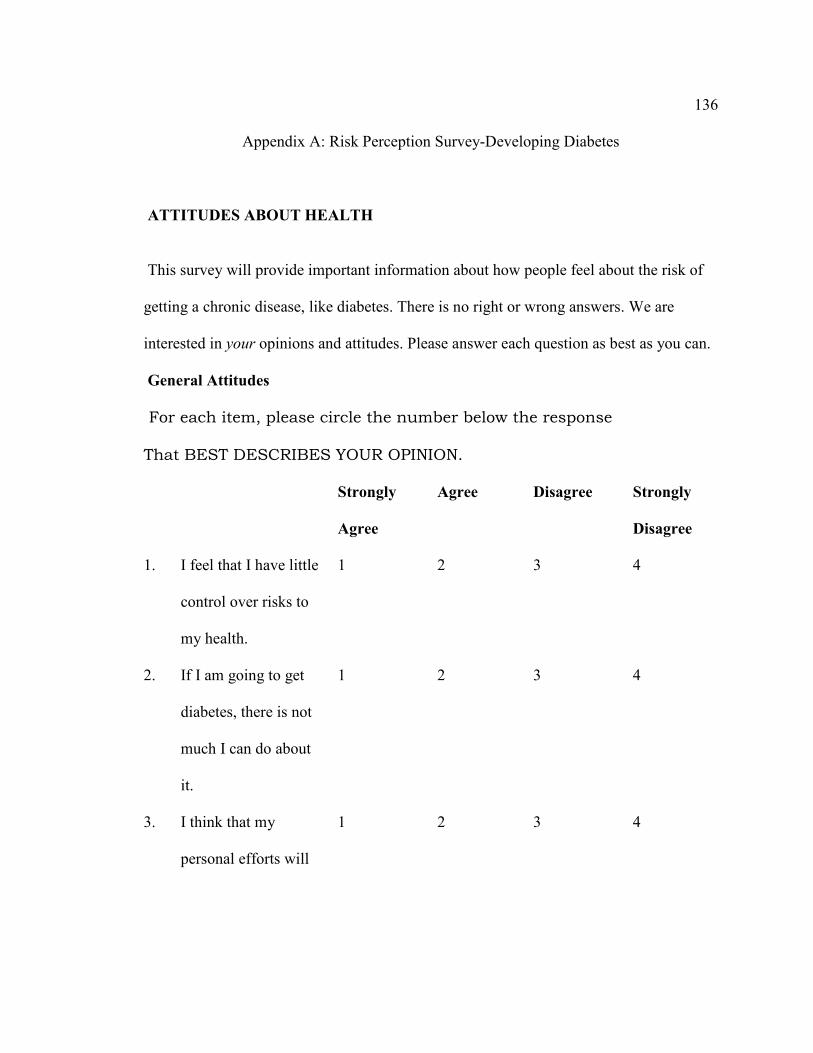
136
Appendix A: Risk Perception Survey-Developing Diabetes
ATTITUDES ABOUT HEALTH
This survey will provide important information about how people feel about the risk of
getting a chronic disease, like diabetes. There is no right or wrong answers. We are
interested in your opinions and attitudes. Please answer each question as best as you can.
General Attitudes
For each item, please circle the number below the response
That BEST DESCRIBES YOUR OPINION.
Strongly
Agree
Agree Disagree Strongly
Disagree
1. I feel that I have little
control over risks to
my health.
1 2 3 4
2. If I am going to get
diabetes, there is not
much I can do about
it.
1 2 3 4
3. I think that my
personal efforts will
1 2 3 4

137
help control my risks
of getting diabetes.
4. People who make a
good effort to control
the risks of getting
diabetes are much
less likely to get
diabetes.
1 2 3 4
5. I worry about getting
diabetes.
1 2 3 4
6. Compared to other
people of my same
age and sex (gender),
I am less likely than
they are to get
diabetes.
1 2 3 4
7. Compared to other
people of my same
age and sex (gender),
I am less likely than
they are to get a
1 2 3 4

138
serious disease.
8. Worrying about
getting diabetes is
very upsetting.
1 2 3 4
8B. I feel that taking my
diabetes drugs as
directed will help in
controlling my
illness.
1 2 3 4
Your Attitudes about Health Risks
Below is a list of health problems and diseases. For each one, please circle the number
below the words to tell us if you think your own personal health is at "almost no risk,"
"slight risk," "moderate risk" or "high risk" from these problems.
If you, or a family member, already have the disease (or had the disease in the past), please also check the appropriate line on the right.
Almost
no risk
Slight
risk
Moderate
risk
High
risk
Have or had this
disease:

139
Myself Family
member
9. Arthritis 1 2 3 4 ---------- ----------
10. Heart Disease 1 2 3 4 ---------- ----------
11. Cancer 1 2 3 4 ---------- ----------
12. High blood
pressure
1 2 3 4 ---------- ----------
13. Hearing loss 1 2 3 4 ---------- ----------
14. Asthma 1 2 3 4 ---------- ----------
15. Diabetes 1 2 3 4 ---------- ----------
16. Osteoporosis (bone
disease)
1 2 3 4 ---------- ----------
17. Stroke 1 2 3 4 ---------- ----------
18. Blindness 1 2 3 4 ---------- ----------
19. Foot amputation 1 2 3 4 ---------- ----------
20. Infection needing
treatment by a
doctor
1 2 3 4 ---------- ----------
21. Impotence (only in
men)
1 2 3 4 ---------- ----------
22. Kidney failure 1 2 3 4 ----------- ----------
23. AIDS 1 2 3 4 ---------- ----------
Environmental Health Risks

140
Below is a list of possible hazards or dangerous conditions in the environment around most of us. For each one, please circle the number below the words to tell us if your own personal
health is at "almost no risk," "slight risk," "moderate risk" or "high risk" from each of the
following hazards or conditions.
Almost
no
risk
Slight risk Moderate
risk
High
Risk
24.
Medical X-rays (radiation)
1
2
3
4
25.
Violent crime
1
2
3
4
26.
Extreme weather (hot or
cold)
1
2
3
4
27.
Driving/riding in an
1
2
3
4

141
automobile
28.
“Street drugs” (illegal
drugs)
1
2
3
4
29.
Air pollution
1
2
3
4
30.
Pesticides
1
2
3
4
31.
Household chemicals
1
2
3
4
32.
Cigarette smoke from
people smoking around you
1
2
3
4
Risks of Getting Diabetes for People in the General Public
We would like you to think about people in the general public and NOT about your own personal risk of getting diabetes.

142
Circle the number below the words that best describe your opinion about whether each
item listed below increases (or raises) the risk of someone getting diabetes, has no effect
on the risk, or decreases (or lowers) the risk of someone getting diabetes.
Increases
the risk
Has NO
effect on
risk
Decreases
the risk
Don’t
know
33. Being Asian
American
1 2 3 0
34. Being Caucasian
(white)
1 2 3 0
35. Eating a healthy diet 1 2 3 0
36. Being black or
African American
1 2 3
37. Being Hispanic 1 2 3 0
39. Having a blood
relative with diabetes
1 2 3 0
40. Being 65 years of age
or older
1 2 3 0
41. Exercising regularly 1 2 3 0
42. Being American 1 2 3 0

143
Indian
43. Controlling weight
gain
1 2 3 0
Thanks
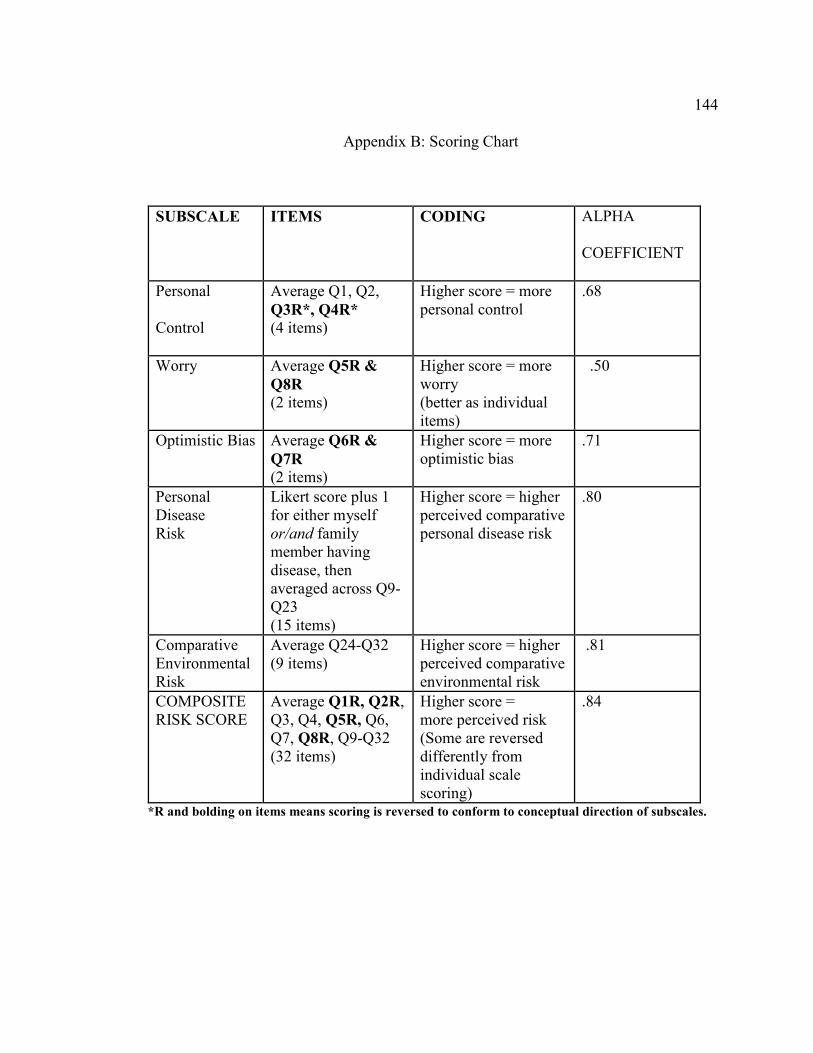
144
Appendix B: Scoring Chart
SUBSCALE ITEMS CODING ALPHA
COEFFICIENT
Personal
Control
Average Q1, Q2,
Q3R*, Q4R* (4 items)
Higher score = more personal control
.68
Worry Average Q5R &
Q8R (2 items)
Higher score = more worry (better as individual items)
. .50
Optimistic Bias Average Q6R &
Q7R (2 items)
Higher score = more optimistic bias
.71
Personal Disease Risk
Likert score plus 1 for either myself or/and family member having disease, then averaged across Q9-Q23 (15 items)
Higher score = higher perceived comparative personal disease risk
.80
Comparative Environmental Risk
Average Q24-Q32 (9 items)
Higher score = higher perceived comparative environmental risk
. .81
COMPOSITE RISK SCORE
Average Q1R, Q2R, Q3, Q4, Q5R, Q6, Q7, Q8R, Q9-Q32 (32 items)
Higher score = more perceived risk (Some are reversed differently from individual scale scoring)
.84
*R and bolding on items means scoring is reversed to conform to conceptual direction of subscales.

145
Appendix C: Consent Form
You are invited to take part in a research study of how you understand diabetes and
what you think is important regarding preventing yourself from having diabetes in
the future or effectively controlling the disease, if you already have it. You were
chosen for the study because you are over the age of 18 and live in the District of
Columbia. Please read this form and ask any questions you have before agreeing to
be part of the study.
This study is being conducted by a researcher named Wanka Ndifor, who is a
doctoral student at Walden University. Wanka is trying to understand the behavior
of people who are at high risk of having diabetes and those already having
diabetes, so as to identify if there are better ways to prevent or control the disease
such that diabetics can lead more active lives.
Background Information:
The purpose of this study is to measure your understanding of any behaviors or factors around you that can cause you to have diabetes in the future. This study also looks at your understanding of the need to maintain continues treatment of diabetes as directed by your healthcare team. This is aimed at providing possible ways that will prevent people from having diabetes in the future or provide possible suggestions that individuals can take to better control diabetes, in case they are already having the disease.
Procedures:
If you agree to be in this study, you will be asked to:
• Answer the questions on the survey. This will take at most 15minutes.

146
• Return the survey and consent form (if you don’t wish to keep it) to the
researcher.
Voluntary Nature of the Study:
Your participation in this study is voluntary. This means that everyone will respect your decision of whether or not you want to be in the study. If you decide to join the study now, you can still change your mind later. If you feel stressed during the study you may stop at any time. You may skip any questions that you feel are too personal.
Risks and Benefits of Being in the Study:
There are no risks to participate in the study. The benefits of this study will provide information that may identify possible ways to help prevent individuals from having diabetes in the future.
Compensation:
There is no monetary compensation for returning the survey and consent form.
Confidentiality:
Any information you provide will be kept confidential. The researcher will not use your information for any purposes outside of this research project. Also, the researcher will not include your name or anything else that could identify you in any reports of the study.
Contacts and Questions:
The researcher’s name is Wanka Aloysius Ndifor. The researcher’s faculty advisor is Dr.
Eboni Green. You may ask any questions you have now. Or if you have questions later,
you may contact the researcher via 240-535-3259 or via email at
[email protected] or the advisor at [email protected] or 1-800-925-
3368. If you want to talk privately about your rights as a participant, you can call Dr.
147
Leilani Endicott. She is the Director of the Research Center at Walden University. Her
phone number is 1-800-925-3368, extension 3121210. Walden University’s approval
number for this study is 06-03-14-0099017 and it expires on June 2, 2015.
The participants may keep this consent form if they wish to.
Further information
Further information on diabetes treatment, diagnosis, signs and symptoms, can be
obtained from the American Diabetic Association website at
http://www.diabetes.org/diabetes-basics/ or from the Center of Disease Control and
prevention website at http://www.cdc.gov/obesity/data/adult.html or you can talk to your
healthcare provider.
Statement of Consent:
In order to protect your privacy, no signatures will be collected. This means that your completion of the survey is an indication of your consent if you choose to participate.

148
Curriculum Vitae
Wanka, A. Ndifor, B. Pharm, MPH, CHES, R.ph
ACADEMIC EXPERIENCE
2005 – 2015 Doctor of Public Health (Dr.ph) – Department of
Epidemiology, Walden University, Minneapolis, Minnesota
2001 - 2002 Master of public Health (MPH) – School of public health,
faculty of medicine, Universite Libre De Bruxelles, Bruxelles
Belgium
1993 -1998 Doctor of pharmaceutical Sciences – School of pharmacy,
Ahmadu Bello University, Zaria, Kaduna state, Nigeria.
1999 - 2000 Associate Degree: Data processing and computer
programming, Soft Design computer institute Zaria Kaduna
state, Nigeria
149
RELEVANT PROFESSIONAL EXPERIENCE
2013 – Present clinical assistant professor, (preceptor).
University of Maryland, school of pharmacy
As a preceptor, I do play a vital role in the educational
process of pharmacy students while acting as a clinical
resource through which the students apply the medical
knowledge obtained during their training. This involves
mostly teaching activities in a clinical setting that can be in
the form of structured teaching rounds, chart review and
discussions, reading assignments, or informal consultations
between patient encounters and/or conferences. This is
normally done in accordance with current practice guidelines
and the accepted standards of care prescribed by the
university and the institution.
2005 - Present Registered clinical staff pharmacist
Clinical staff pharmacist - Sibley Memorial Hospital. My
duties include: Evaluating and filling medication orders for
150
inpatients, outpatients, and employees and maintaining
computerized medication profiles/prescription files. I am
also involved in providing services in the centralized or
decentralized pharmacy which includes communicating and
consulting with physicians and other healthcare personnel as
may be required and also monitor patient drug therapies for
safety and appropriateness and provide drug information. I
also supervise and direct support personnel, coordinating
department activities to ensure the accurate, timely and cost-
effective delivery of quality pharmacy services in a
convenient manner.
2002– 2006 Health educator. Certified Health Education specialist.
Interfit health consultants Houston Texas. we carryout
screening exercises with different companies. As a health
educator, I was responsible for placing each worker into
whatever wellness program being offered by the
company/community in which the worker lives after a careful
review of the screening results. We also design education

151
and health programs that are tailored to the special needs of
that community/group.
LICENSURE AND CERTIFICATIONS
Registered pharmacist, state of Maryland
Received November 17, 2007
License #19925
Registered pharmacist, District of Columbia
Received October 10, 2010,
License #PH00000904
Certified Health Education Specialist
Received June 15, 2004
License # 55004
PROFESSIONAL ORGANIZATIONS
-Member of the American public health association (APHA)

152
-Member of society of public health education (SOPHE)
-Member of the American Association of Pharmaceutical Scientists (AAPS).
SKILLS
Soft wares: word, power point, Excel, Epi-info, Spss, spreadsheet etc.-project
design, implementation, evaluation and feedback.-Aseptic techniques, G.L.P.
G.C.P. procedures-SDS-PAGE and agarose gel electrophoreses-Western,
Northern & Southern blotting