knowledge management workshop - sun movement
TRANSCRIPT
SUN MOVEMENT
SURVEY RESULTSThuy Nguyen, SUN Movement Secretariat
Knowledge Management Workshop, 21 March 2017, Geneva
SUN is a unique Movement founded on the principle that all people have a right to food & good nutrition.
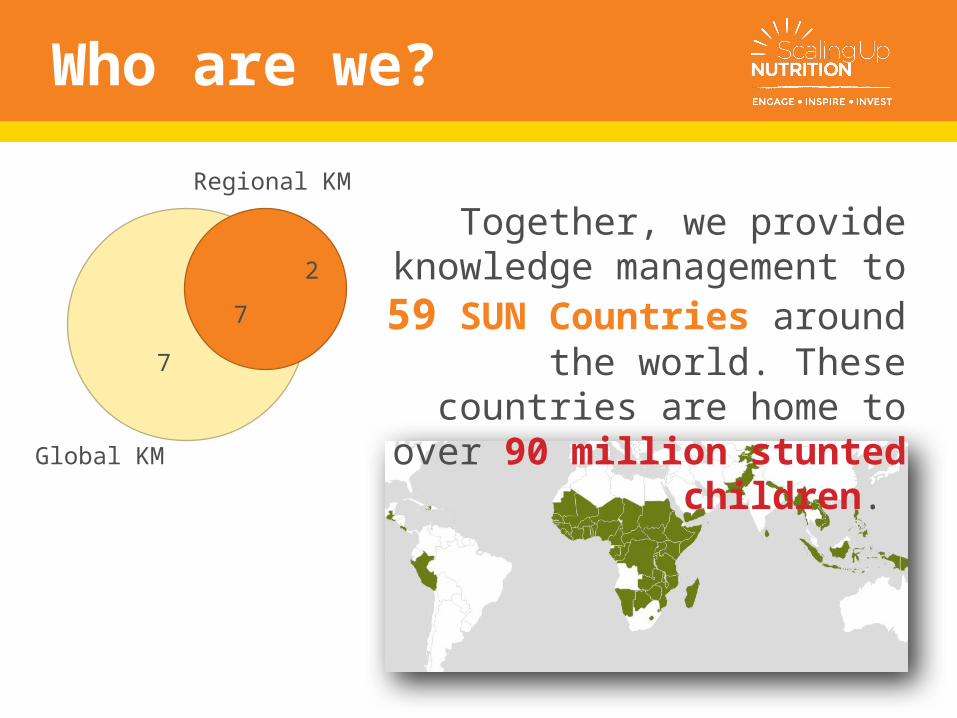
Global KM
Regional KM
7
7
2
Together, we provide knowledge management to 59 SUN Countries around the world. These countries
are home to over 90 million stunted children.
Who are we?
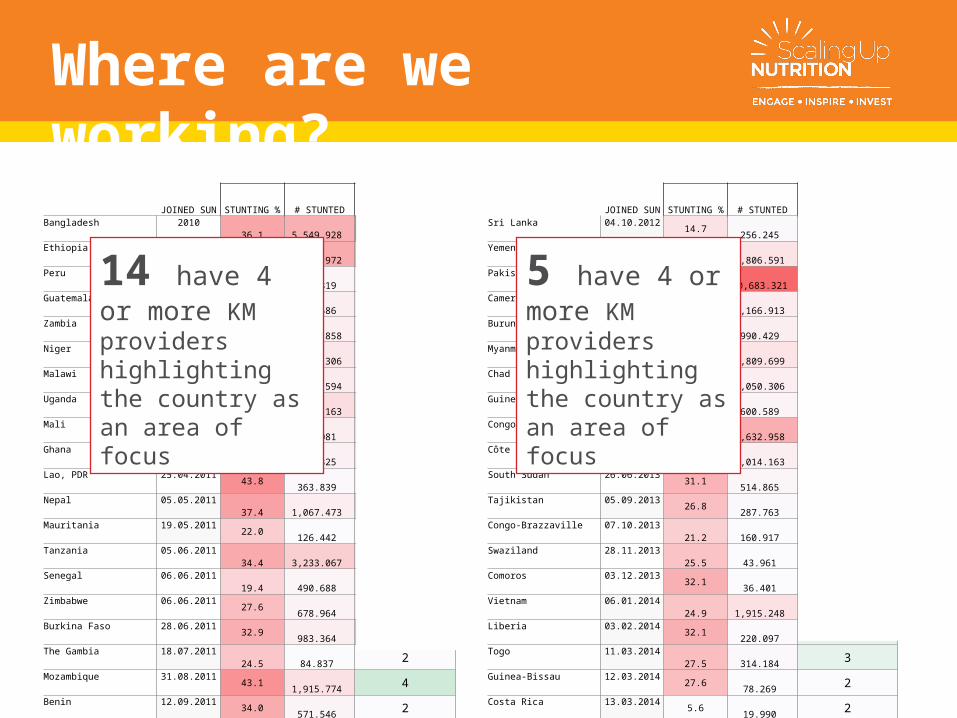
JOINED SUN STUNTING % # STUNTED SURVEY RESPONSESSri Lanka 04.10.2012 14.7 256.245 3Yemen 01.11.2012 46.5 1,806.591 3Pakistan 26.01.2013 45.0 10,683.321 5Cameroon 18.02.2013 31.7 1,166.913 3Burundi 26.02.2013 57.5 990.429 3Myanmar 24.04.2013 35.1 1,809.699 4Chad 02.05.2013 39.9 1,050.306 4Guinea 28.05.2013 31.3 600.589 4Congo, DR 29.05.2013 42.6 5,632.958 3Côte d’Ivoire 07.06.2013 29.6 1,014.163 3South Sudan 26.06.2013 31.1 514.865 4Tajikistan 05.09.2013 26.8 287.763 2Congo-Brazzaville 07.10.2013 21.2 160.917 2Swaziland 28.11.2013 25.5 43.961 2Comoros 03.12.2013 32.1 36.401 2Vietnam 06.01.2014 24.9 1,915.248 2Liberia 03.02.2014 32.1 220.097 3Togo 11.03.2014 27.5 314.184 3Guinea-Bissau 12.03.2014 27.6 78.269 2Costa Rica 13.03.2014 5.6 19.990 2Phillipines 20.05.2014 30.3 3,342.674 3Somalia 20.06.2014 25.9 460.530 3Cambodia 26.06.2014 32.4 571.434 3Lesotho 02.07.2014 33.2 91.097 2Botswana 09.04.2015 31.4 70.679 2Sudan 14.10.2015 38.2 2,244.920 3Papua New Guinea 12.04.2016 49.5 475.253 2Gabon 21.12.2016 17.5 39.667 2Central African Republic 01.02.2017 40.7 267.095 2
JOINED SUN STUNTING % # STUNTED SURVEY RESPONSESBangladesh 2010 36.1 5,549.928 9Ethiopia 2010 40.4 5,833.972 6Peru 19.11.2010 17.5 523.819 3Guatemala 07.12.2010 46.5 971.586 3Zambia 22.12.2010 40 1,092.858 3Niger 14.02.2011 43.0 1,585.306 3Malawi 15.03.2011 42.4 1,227.594 3Uganda 17.03.2011 33.7 2,229.163 4Mali 24.03.2011 38.5 983.081 4Ghana 25.03.2011 18.8 748.325 4Lao, PDR 25.04.2011 43.8 363.839 3Nepal 05.05.2011 37.4 1,067.473 5Mauritania 19.05.2011 22.0 126.442 2Tanzania 05.06.2011 34.4 3,233.067 3Senegal 06.06.2011 19.4 490.688 3Zimbabwe 06.06.2011 27.6 678.964 3Burkina Faso 28.06.2011 32.9 983.364 6The Gambia 18.07.2011 24.5 84.837 2Mozambique 31.08.2011 43.1 1,915.774 4Benin 12.09.2011 34.0 571.546 2Namibia 16.09.2011 23.1 74.192 2Nigeria 14.11.2011 32.9 10,028.847 8Kyrgyzstan 07.12.2011 12.9 98.251 4Indonesia 22.12.2011 36.4 8,772.061 4Rwanda 22.12.2011 37.9 642.360 3Sierra Leone 16.01.2012 37.9 376.460 4Madagascar 28.02.2012 49.2 1,631.433 3Haiti 11.06.2012 21.9 274.437 2Kenya 30.08.2012 26.0 1,838.775 5El Salvador 24.09.2012 14 73.636 3
14 have 4 or more KM providers highlighting the country as an area of focus
5 have 4 or more KM providers highlighting the country as an area of focus
Where are we working?
c c
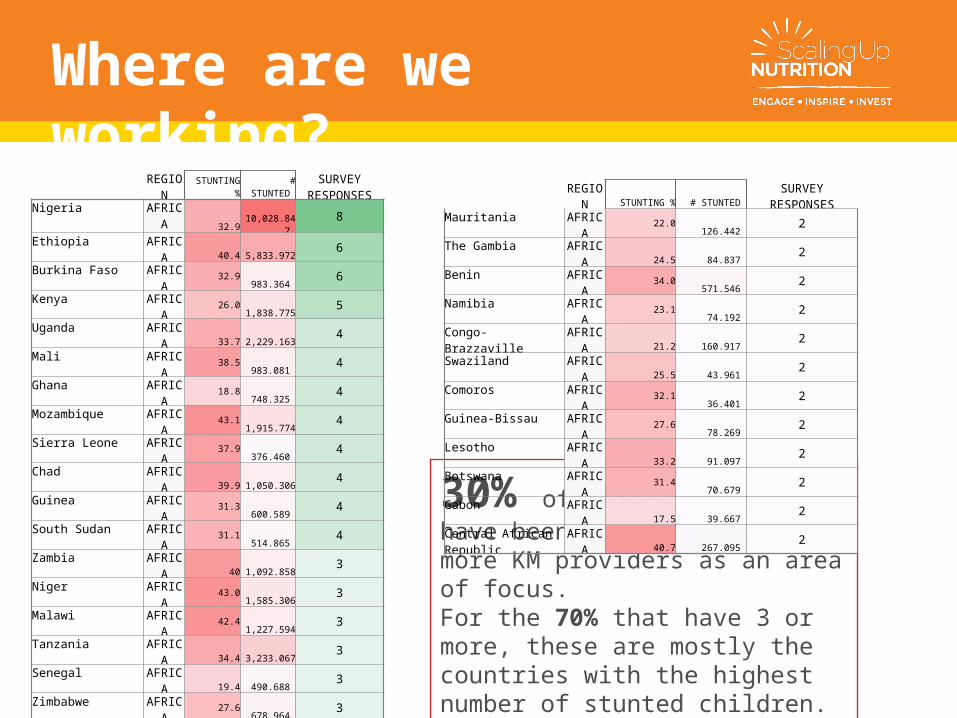
30% of African countries have been identified by 4 or more KM providers as an area of focus. For the 70% that have 3 or more, these are mostly the countries with the highest number of stunted children.
Where are we working?
REGIONSTUNTING
% # STUNTED
SURVEY RESPONSES
Nigeria AFRICA 32.9 10,028.847 8Ethiopia AFRICA 40.4 5,833.972 6Burkina Faso AFRICA 32.9 983.364 6Kenya AFRICA 26.0 1,838.775 5Uganda AFRICA 33.7 2,229.163 4Mali AFRICA 38.5 983.081 4Ghana AFRICA 18.8 748.325 4Mozambique AFRICA 43.1 1,915.774 4Sierra Leone AFRICA 37.9 376.460 4Chad AFRICA 39.9 1,050.306 4Guinea AFRICA 31.3 600.589 4South Sudan AFRICA 31.1 514.865 4Zambia AFRICA 40 1,092.858 3Niger AFRICA 43.0 1,585.306 3Malawi AFRICA 42.4 1,227.594 3Tanzania AFRICA 34.4 3,233.067 3Senegal AFRICA 19.4 490.688 3Zimbabwe AFRICA 27.6 678.964 3Rwanda AFRICA 37.9 642.360 3Madagascar AFRICA 49.2 1,631.433 3Cameroon AFRICA 31.7 1,166.913 3Burundi AFRICA 57.5 990.429 3Congo, DR AFRICA 42.6 5,632.958 3Côte d’Ivoire AFRICA 29.6 1,014.163 3Liberia AFRICA 32.1 220.097 3Togo AFRICA 27.5 314.184 3Somalia AFRICA 25.9 460.530 3Sudan AFRICA 38.2 2,244.920 3
REGION STUNTING % # STUNTED SURVEY RESPONSESMauritania AFRICA 22.0 126.442 2The Gambia AFRICA
24.5 84.837 2Benin AFRICA 34.0 571.546 2Namibia AFRICA 23.1 74.192 2Congo-Brazzaville AFRICA
21.2 160.917 2Swaziland AFRICA
25.5 43.961 2Comoros AFRICA 32.1 36.401 2Guinea-Bissau AFRICA 27.6 78.269 2Lesotho AFRICA
33.2 91.097 2Botswana AFRICA 31.4 70.679 2Gabon AFRICA
17.5 39.667 2Central African Republic AFRICA
40.7 267.095 2
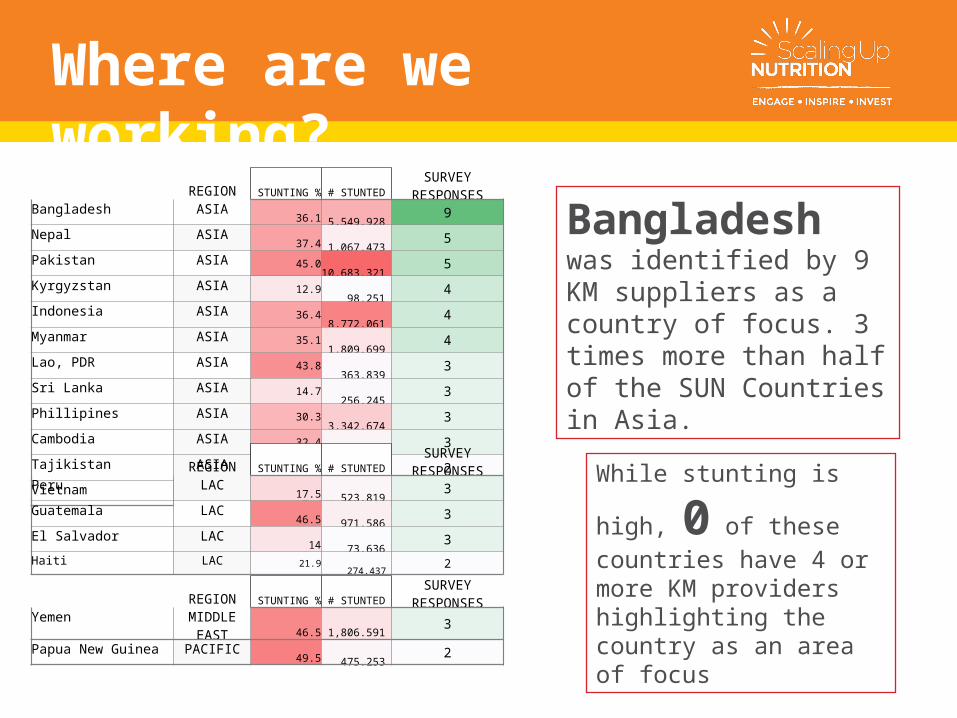
Bangladesh was identified by 9 KM suppliers as a country of focus. 3 times more than half of the SUN Countries in Asia.
While stunting is high, 0 of these countries have 4 or more KM providers highlighting the country as an area of focus
Where are we working?
REGION STUNTING % # STUNTED SURVEY RESPONSESBangladesh ASIA
36.1 5,549.928 9Nepal ASIA
37.4 1,067.473 5Pakistan ASIA 45.0 10,683.321 5Kyrgyzstan ASIA 12.9 98.251 4Indonesia ASIA 36.4 8,772.061 4Myanmar ASIA 35.1 1,809.699 4Lao, PDR ASIA 43.8 363.839 3Sri Lanka ASIA 14.7 256.245 3Phillipines ASIA 30.3 3,342.674 3Cambodia ASIA 32.4 571.434 3Tajikistan ASIA 26.8 287.763 2Vietnam ASIA
24.9 1,915.248 2
REGION STUNTING % # STUNTED SURVEY RESPONSESPeru LAC
17.5 523.819 3Guatemala LAC
46.5 971.586 3El Salvador LAC
14 73.636 3Haiti LAC 21.9 274.437 2
REGION STUNTING % # STUNTED SURVEY RESPONSESYemen MIDDLE EAST
46.5 1,806.591 3Papua New Guinea PACIFIC
49.5 475.253 2
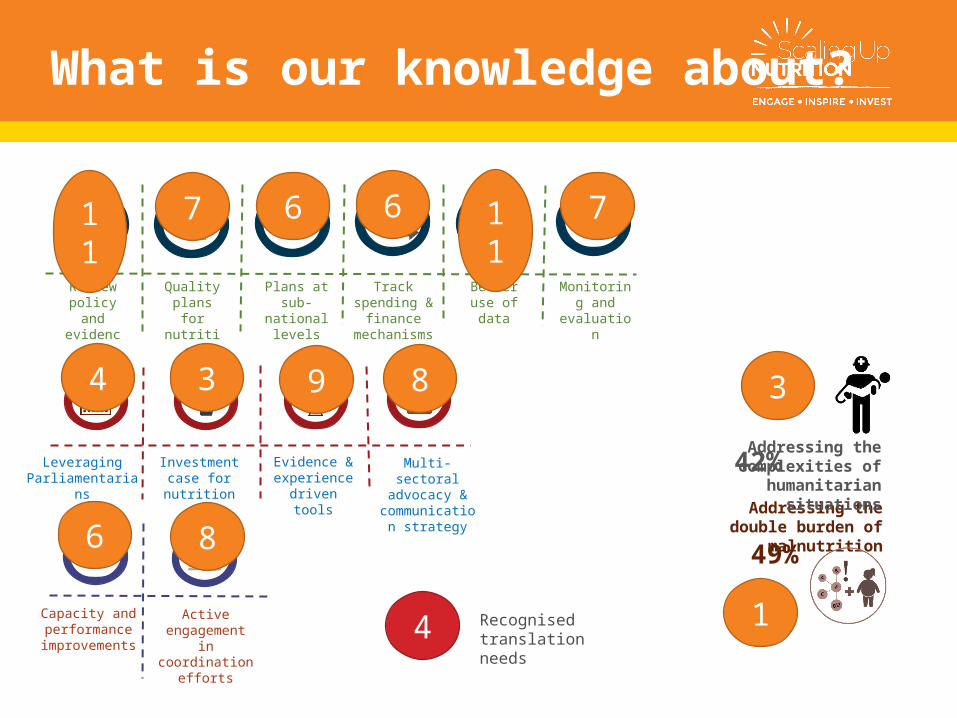
What is our knowledge about?
Review policy and
evidence
Quality plans for nutrition
Plans at sub-
national levels
Track spending &
finance mechanism
s
Better use of data
Monitoring and
evaluation
Leveraging Parliamentarians
Investment case for nutrition
Evidence & experience driven tools
Multi-sectoral advocacy &
communication strategy
Capacity and performance
improvements
Active engagement
in coordination
efforts
Addressing the double burden of malnutrition
Addressing the complexities of
humanitarian situations
49%
42%
11 7 6 6 11 7
4 3 9 8
6 8
3
14 Recognised translation needs
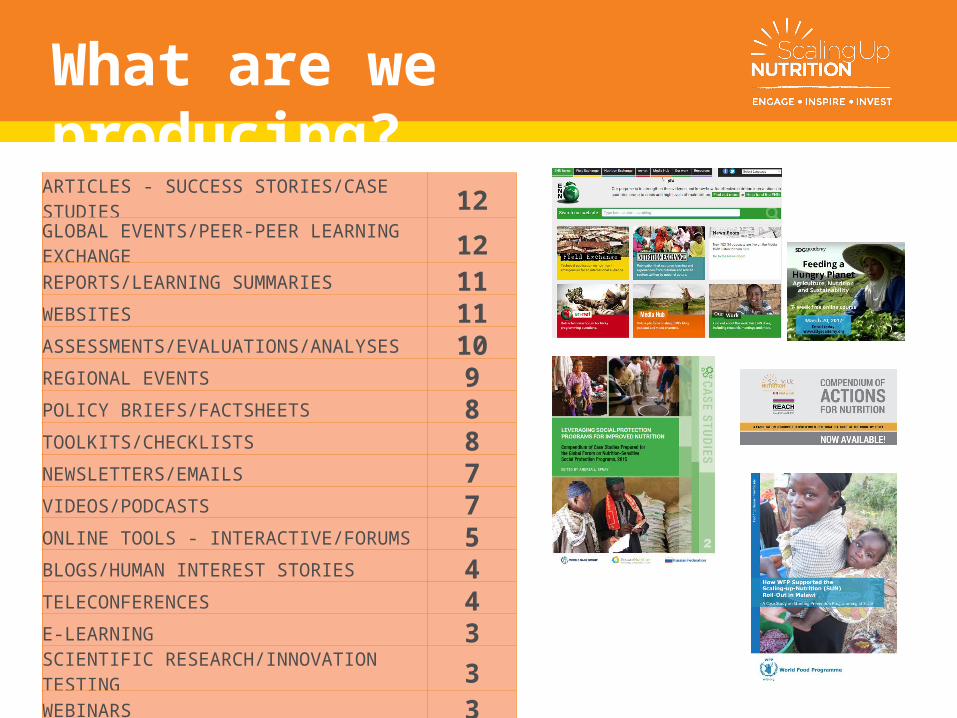
What are we producing?
ARTICLES - SUCCESS STORIES/CASE STUDIES 12GLOBAL EVENTS/PEER-PEER LEARNING EXCHANGE 12REPORTS/LEARNING SUMMARIES 11WEBSITES 11ASSESSMENTS/EVALUATIONS/ANALYSES 10REGIONAL EVENTS 9POLICY BRIEFS/FACTSHEETS 8TOOLKITS/CHECKLISTS 8NEWSLETTERS/EMAILS 7VIDEOS/PODCASTS 7ONLINE TOOLS - INTERACTIVE/FORUMS 5BLOGS/HUMAN INTEREST STORIES 4TELECONFERENCES 4E-LEARNING 3SCIENTIFIC RESEARCH/INNOVATION TESTING 3WEBINARS 3