knowledge-guided gene prioritization reveals new insights
TRANSCRIPT

RESEARCH Open Access
Knowledge-guided gene prioritizationreveals new insights into the mechanismsof chemoresistanceAmin Emad1 , Junmei Cairns2, Krishna R. Kalari3, Liewei Wang2* and Saurabh Sinha4*
Abstract
Background: Identification of genes whose basal mRNA expression predicts the sensitivity of tumor cells to cytotoxictreatments can play an important role in individualized cancer medicine. It enables detailed characterization of themechanism of action of drugs. Furthermore, screening the expression of these genes in the tumor tissue may suggestthe best course of chemotherapy or a combination of drugs to overcome drug resistance.
Results: We developed a computational method called ProGENI to identify genes most associated with the variationof drug response across different individuals, based on gene expression data. In contrast to existing methods, ProGENIalso utilizes prior knowledge of protein–protein and genetic interactions, using random walk techniques. Analysis oftwo relatively new and large datasets including gene expression data on hundreds of cell lines and their cytotoxicresponses to a large compendium of drugs reveals a significant improvement in prediction of drug sensitivity usinggenes identified by ProGENI compared to other methods. Our siRNA knockdown experiments on ProGENI-identifiedgenes confirmed the role of many new genes in sensitivity to three chemotherapy drugs: cisplatin, docetaxel, anddoxorubicin. Based on such experiments and extensive literature survey, we demonstrate that about 73% of our toppredicted genes modulate drug response in selected cancer cell lines. In addition, global analysis of genes associatedwith groups of drugs uncovered pathways of cytotoxic response shared by each group.
Conclusions: Our results suggest that knowledge-guided prioritization of genes using ProGENI gives new insight intomechanisms of drug resistance and identifies genes that may be targeted to overcome this phenomenon.
Keywords: Chemoresistance, Chemotherapy, Drug sensitivity, Gene interaction network, Gene prioritization,Network-based algorithm
BackgroundThe goal of gene prioritization is to rank genes with re-spect to their relationship to a phenotype (e.g., occurrenceof a disease, response to a drug, etc.), providing an experi-mentalist a way to prioritize genetic perturbation tests andleading to discovery of genes affecting the phenotype [1].In the context of drug design and drug sensitivity, variousgene prioritization techniques have been used to identifydrug targets, reveal mechanisms of action (MoAs) of
drugs, and identify genes associated with drug response,as well as for drug repositioning [2–5].It has been previously shown that gene expression is
the most informative currently available ‘omic’ featurewith respect to drug sensitivity prediction [6], and it hasbeen also successfully used to predict drug response inlarge clinical studies [7]. Basal gene expression of cancercell lines (CCLs) has been used to rank genes by theirrole in cytotoxic drug resistance, utilizing correlationanalysis [2, 8–11] or feature selection and regressiontechniques [12–16] to statistically associate drug re-sponse with gene expression profiles of cell lines. At thesame time, many genes with key roles escape identifica-tion based on expression profiling alone, due to thecomplexity of drug MoA and noisy data [2], and due tothe fact that current methods overlook known functional
* Correspondence: [email protected]; [email protected] of Molecular Pharmacology and Experimental Therapeutics,Gonda 19, Mayo Clinic Rochester, 200, 1st St. SW, Rochester, MN 55905, USA4Department of Computer Science and Institute of Genomic Biology,University of Illinois at Urbana-Champaign, 2122 Siebel Center, 201N.Goodwin Ave, Urbana, IL 61801, USAFull list of author information is available at the end of the article
© The Author(s). 2017 Open Access This article is distributed under the terms of the Creative Commons Attribution 4.0International License (http://creativecommons.org/licenses/by/4.0/), which permits unrestricted use, distribution, andreproduction in any medium, provided you give appropriate credit to the original author(s) and the source, provide a link tothe Creative Commons license, and indicate if changes were made. The Creative Commons Public Domain Dedication waiver(http://creativecommons.org/publicdomain/zero/1.0/) applies to the data made available in this article, unless otherwise stated.
Emad et al. Genome Biology (2017) 18:153 DOI 10.1186/s13059-017-1282-3

and biochemical relationships among genes involved inthe drug MoA. Indeed, several studies have shown thatutilizing such prior knowledge can improve geneprioritization based on identification of differentiallyexpressed genes in drug-treated CCLs [3, 5, 17–19]. Weposited, therefore, that knowledge-guided techniquesshould also improve analysis of basal gene expressiondata for identifying genes involved in drug MoA anddrug sensitivity.Although many aspects of drug MoA can be uncovered
through analysis of drug-perturbed gene expression inCCLs [3, 5, 17–19], analysis of basal gene expression isvaluable because it sheds light on the relationship betweenthe cell’s resting physiological state and its drug sensitivity.In addition to the direct targets of a compound, genes andproteins involved in the processes that precede and followthe binding of the compound to its targets also play acrucial role in the compound’s MoA [20], and variationsin their expression levels may underlie individual varia-tions in drug response, even if they are not found to bedifferentially expressed in response to drug treatment.Thus, our primary goal here was not to identify bioche-mical targets of a drug or genes whose expression are af-fected by the drug, but rather to identify genes whosebasal expression predicts the drug response. Over- orunder-expression of specific genes can be experimentallyshown to influence drug sensitivity [21, 22], but perform-ing these experiments for all genes is infeasible and com-putational methods that can suggest candidates for suchtests are necessary. Shortlisting such genes can providecomplementary insight into the MoAs of a drug, offer abetter understanding of drug resistance mechanisms,suggest novel targets to overcome drug resistance, andidentify biomarkers of drug resistance.We describe here a novel knowledge-guided gene
prioritization algorithm called Prioritization of GenesEnhanced with Network Information (ProGENI) thatdiscovers the relationship between basal gene expres-sion and drug response while incorporating priorknowledge in the form of an experimentally verifiednetwork of protein–protein interactions (PPIs) andgenetic interactions. We used the ProGENI geneprioritization technique to analyze two large andrelatively new datasets, one that includes nearly 300human lymphoblastoid cell lines (LCLs) and anotherthat spans over 600 CCLs of different tissues-of-origin. We employed a systematic way to evaluatedifferent methods for gene prioritization and demon-strate the advantage of the ProGENI method. Inaddition, we used siRNA knockdown experiments toconfirm the role of the highly ranked genes in drugsensitivity for three cytotoxic treatments widely usedin chemotherapy. The results of our analysis demon-strate ProGENI to be a powerful computational
technique for identifying genes that play key roles indetermining drug response.
ResultsA network-based method of gene prioritization frombasal expression and phenotype dataIn a recent study, Rees et al. [2] identified the genesmost associated with drug response variation in a collec-tion of cell lines based on Pearson’s correlation coeffi-cient (PCC) between basal gene expression andresponse, one gene at a time. We call this the ‘Pearsoncorrelation’ scheme (or PCC) for gene prioritization. Asan alternative to this ‘single gene’ analysis, we used theElastic Net algorithm [12, 15] to perform linear regres-sion on the drug response against the expression levelsof all genes, employing regularization to enforce sparsityof features and thus learn the most relevant genes.Henceforth, we call this the ‘Elastic Net’ scheme (or EN).See Additional file 1: Supplemental methods for details.We then developed a new method called Prioritization of
Genes Enhanced with Network Information (ProGENI) thatincorporates a network of known biological relationshipsamong genes in the gene prioritization task. The method isillustrated in Fig. 1a. It is given a gene expression matrix withgenes as columns and samples as rows, and a network withgenes as nodes and inter-gene relationships as edges. It firstperforms a ‘network-based smoothing’ [23, 24] of the expres-sion matrix so that the transformed expression value of agene also reflects the activity level of the gene’s network-neighborhood (see “Methods”). Next, it identifies a pre-set(say m) number of genes with the highest correlation (bothpositive and negative) between the transformed expressionvalues and the given phenotype measurements on samples;these are called the ‘response-correlated genes’ (RCGs).Then, it performs a random walk with restarts (RWR) on thenetwork, using the genes from the previous step as the re-start set, to obtain an equilibrium probability distribution onall the nodes of the network. These probabilities are thennormalized with respect to a global equilibrium distributionover all gene nodes that does not depend on the RCG set. Fi-nally, the normalized score for each node is used as the rank-ing criterion. This approach places the strongest RCGs at ornear the top of the list, but the algorithm also makes use ofprior knowledge encoded in the network.To make the reported gene rankings more robust to the
effect of noise in the data, we used a bootstrap samplingtechnique (illustrated in Fig. 1b; also see “Methods”),whereby prioritization is performed repeatedly on randomlyselected subsets of samples and the resulting ranked listsare aggregated to produce the final ranking of genes.Henceforth, we use the name ‘Robust-ProGENI’ wheneverwe refer to this bootstrapping scheme and the name ‘Pro-GENI’ for the basic method without bootstrapping.
Emad et al. Genome Biology (2017) 18:153 Page 2 of 21

a
b
c
Fig. 1 Overview of computational pipelines. a ProGENI: an RWR is used to obtain a vector representation of each gene and is used to perform anetwork transformation on the gene expression. The response-correlated genes (RCGs) are identified as 100 genes whose transformed expressionshave the highest absolute PCC with the drug response. An RWR is used to score each gene based on similarity to the RCG. These scores are thennormalized to remove the network bias. b Robust ranking: 80% of the cell lines are selected randomly and used with a prioritization method toobtain a ranked list of genes. This procedure is repeated r times and the acquired ranked lists are aggregated to obtain a final ranked list. cCross-validation scheme: a nonlinear support vector machine is trained on the training set using the top 500 genes to predict drug sensitivity ofthe test set and evaluate the accuracy of prediction
Emad et al. Genome Biology (2017) 18:153 Page 3 of 21

Genes prioritized by ProGENI are more predictive ofcytotoxic response than alternatives that do not usenetwork informationWe sought to identify the genes associated with individualvariation in sensitivity to cytotoxic treatments. Towardsthis goal, we obtained gene expression and cytotoxic re-sponse data (EC50 values for 24 treatments) on approxi-mately 300 LCLs from [25, 26] (see “Methods”). Weanalyzed this LCL dataset with ProGENI, using a networkobtained from the STRING database [27] based on pro-tein–protein and genetic interaction data, and focusing onone treatment at a time.In order to evaluate the gene ranking provided by this
method and other prioritization methods (Pearson correl-ation or Elastic Net), we used a support vector regression(SVR) algorithm to predict cytotoxic response from ex-pression levels of the top 500 ranked genes, and assessedits accuracy with fivefold cross-validation (see “Methods”;Fig. 1c). We used this evaluation setup to make sure thatinfluential factors such as the regression algorithm andthe number of used features are the same for all methodsand our setup only evaluates the prioritization perform-ance of these methods. This cross-validation scheme wasrepeated 50 times, resulting in 250 assessments. In eachassessment, the performance of the SVR was summarizedusing the ‘scaled probabilistic concordance index’ (SPCI)[6]. This measure ranges between 0 (bad) and 1 (good)and was specifically developed to compare drug sensitivityprediction algorithms in the DREAM 7 challenge(Additional file 1: Supplemental methods).To compare the overall performance of ProGENI with
baseline methods, we used the average SPCI values ofthe test sets for each drug (Fig. 2a, b). According to thisevaluation scheme, drug response prediction using genesidentified by ProGENI was significantly better than boththe PCC-SVR scheme (false discovery rate (FDR) = 6.5E-3, one-sided Wilcoxon signed rank test on the averageSPCI for each drug) and the EN-SVR scheme (FDR =9.6E-5). We also compared the SPCI values on the 250test sets between ProGENI and the baseline methods,separately for each treatment, using a two-sided Wil-coxon signed rank test adjusted for multiple compari-sons. Since samples used in different test sets are notcompletely distinct, the independence assumption of theper-treatment statistical test above may be violated.Therefore, we also defined a measure called Percent ofImproved Folds (PIF) as the percentage of test sets forwhich ProGENI outperformed the baseline for any giventreatment. According to these measures, ProGENI-SVRpredictions were significantly better (PIF >55%, FDR<0.05) than the PCC-SVR for 14 (of 24) treatments andbetter than EN-SVR for 20 treatments; on the otherhand, six treatments for PCC-SVR and three for EN-SVR showed the opposite trend (PIF <45%, FDR <0.05)
(Table 1; Additional file 1: Figures S1 and S2). Figure 3a,b show SPCI measures for these two prioritizationschemes over all 250 test sets, for five treatments.In addition to these evaluations, we also compared our
results with two other methods: (1) EN where thenumber of features is not limited to the top 500 and thepredictions are performed using the best linear model(as opposed to using SVR); and (2) Bayesian Multitask-MKL [6], the winning method of the DREAM 7 chal-lenge (see Additional file 1: Supplemental methods fordetails). Bayesian Multitask-MKL is a nonlinear methodthat uses the expression of all the genes for drug re-sponse prediction, and therefore cannot be used for geneprioritization. In spite of this, it is useful to know howwell the model trained on features selected by ProGENIperforms against this method. As shown in Fig. 2c, d,ProGENI-SVR provided significantly better predictionscompared to both EN (FDR = 7.2 E-5) and Bayesianmultitask-MKL (FDR = 7.2 E-5), using the average SPCIvalues of the test sets for each drug. In addition,ProGENI-SVR outperformed EN (PIF >55%) for 20drugs and outperformed (PIF >55%) Bayesian multitask-MKL for 22 drugs, while two drugs showed the oppositetrend (PIF <45%) for either method (Additional file 2;Additional file 1: Figures S3 and S4). Next, we askedwhether using the top 500 features identified and trans-formed by ProGENI improves the performance of Bayesianmultitask-MKL. We found this to be the case (p value =8.4E-4, one-sided Wilcoxon signed rank test on the aver-age SPCI for each drug); in addition, for 18 drugsProGENI-Bayesian-multitask-MKL outperformed Bayesianmultitask-MKL, while only for three drugs the trend wasopposite (Additional file 2).To gain further confidence in the above observations,
we proceeded to repeat the evaluation on a completelydifferent dataset. We obtained drug response data in theform of IC50 values for 139 cytotoxic treatments andgene expression data for more than 600 CCLs from theGenomics of Drug Sensitivity in Cancer (GDSC) data-base from 13 tissues of origin [28]. In evaluations similarto those above, ProGENI-SVR outperformed the PCC-SVR scheme (PIF >55%) for 66 (of 139) treatments andoutperformed EN-SVR for 110 treatments (Fig. 3c, d;Additional file 3), while 45 and five treatments showedthe opposite trend for these baseline methods, respect-ively. Using the average performance for each drug,evaluating performance on each drug separately, wefound ProGENI-SVR to show significant improvementcompared to PCC-SVR (FDR = 9.1E-4) and EN-SVR(FDR = 4.0E-21) using one-sided Wilcoxon signed ranktest. ProGENI-SVR also showed significantly betterperformance compared to EN (FDR = 4.2E-18), with97 drugs having PIF >55% and only eight drugshaving PIF <45% (Additional file 3). However, the
Emad et al. Genome Biology (2017) 18:153 Page 4 of 21

improvement of ProGENI-SVR compared to Bayesianmultitask-MKL was not significant (FDR = 0.46). Wenote, as above, that this comparison does notcompare gene prioritization performance of the twomethods, since the latter method does not lend itselfeasily to identification of the most important(predictive) genes.
Functional validations confirm the role of ProGENI-identified genes in drug responseWe sought to verify whether genes associated with drugresponse variation (IC50 in the GDSC dataset) identifiedby ProGENI could be linked in vitro to significantchanges in drug sensitivity. To this end, we selected thetop 15 genes identified using Robust-ProGENI for three
a b
c d
Fig. 2 The performance of drug sensitivity prediction based on ProGENI-SVR compared to the baseline methods (PCC-SVR, EN-SVR, EN, and Bayesianmultitask-MKL) using the LCL dataset for all drugs. The y-axis shows the SPCI corresponding to ProGENI-SVR while the x-axis shows the SPCIcorresponding to the baseline. Each point in the scatter plot corresponds to the average SPCI value of the test sets for a single drug. The p values arecalculated using one-sided Wilcoxon signed rank test. a Performance of ProGENI-SVR versus PCC-SVR. b Performance of ProGENI-SVR versus EN-SVR. cPerformance of ProGENI-SVR versus EN. d Performance of ProGENI-SVR versus Bayesian multitask-MKL
Emad et al. Genome Biology (2017) 18:153 Page 5 of 21

drugs—cisplatin, docetaxel, and doxorubicin—from theGDSC dataset. (These drugs belong to three differentclasses of cytotoxic drugs.) The selections included geneswith high Pearson correlation (positive and negative)with drug response (henceforth called ‘HPC’ genes), aswell as genes that were prioritized because their networkneighbors’ activity was correlated with drug response. Asshown in Fig. 4d, four genes for cisplatin, five genesfor docetaxel, and eight genes for doxorubicin thatwere ranked among the top 15 by Robust-ProGENIare not among the top 15 HPC genes. For example,the expression of CSNK2A1, a gene known for itsrole in doxorubicin response, is not highly correlatedwith the response to doxorubicin; however, it is dir-ectly connected in the network to two HPC genes(NOL3 and ATF1) and also has 23 neighbors that aredirectly connected to HPC genes.For each identified drug–gene pair, we mined the lit-
erature for direct evidence of the gene’s role in response
to that drug. Out of the 45 pairs examined, we found‘direct’ literature evidence for 23 drug–gene pairs in thatthe gene’s knockdown was previously shown to affectdrug sensitivity (Table 2; Additional file 4). For predicteddrug–gene pairs that were not validated by literature evi-dence, we performed siRNA knockdown experiments intwo different cell lines of clinical significance, the humantriple negative breast cancer MDA-MB-231 and BT549cells, since these drugs are first-line therapy for triplenegative breast cancer. Note that these genes were allexpressed in these cell lines (Additional file 4). ThesiRNA knockdowns were performed for 21 candidategenes predicted by ProGENI to be associated with doxo-rubicin (eight) docetaxel (seven), or cisplatin (six), withnegative siRNA as a control. The results of these assaysfor the 21 drug–gene pairs are shown in Fig. 4 and Add-itional file 1: Figures S10 and S11, revealing that 10 ofthe 21 pairs were validated. Therefore, overall 33 (73%)of our 45 top predictions for these three drugs have
Table 1 Performance of drug sensitivity prediction using 500 features selected by ProGENI compared to 500 features selected usingbaseline schemes, for the LCL dataset
Treatment ProGENI-SVR > PCC-SVR?(FDR, PIF)
ProGENI-SVR > EN-SVR?(FDR, PIF)
Average SPCI(ProGENI-SVR)
Average SPCI(PCC-SVR)
Average SPCI(EN-SVR)
Doxorubicin Yes (3.94E-11, 71.2%) Yes (2.79E-38, 93.2%) 0.660 0.641 0.498
MPA Yes (4.49E-24, 81.2%) Yes (2.63E-12, 71.6%) 0.732 0.714 0.701
TCN Yes (1.30E-19, 78.8%) Yes (2.54E-5, 60.4%) 0.581 0.522 0.539
Everolimus Yes (1.99E-8, 66%) Yes (2.63E-12, 69.6%) 0.595 0.570 0.554
Docetaxel Yes (1.04E-11, 68.4%) Yes (2.84E-7, 66%) 0.608 0.585 0.579
Oxaliplatin No (1.83E-8, 32.4%) Yes (5.44E-12, 68%) 0.676 0.694 0.633
Epirubicin Yes (2.99E-8, 65.6%) Yes (1.61E-12, 66.8%) 0.646 0.628 0.571
NAPQI Yes (1.11E-7, 66.8%) Yes (1.47E-2, 56.4%) 0.597 0.575 0.583
Radiation Yes (4.30E-8, 66%) Yes (2.38E-4, 58.8%) 0.583 0.560 0.561
Carboplatin Yes (2.66E-7, 64%) Yes (6.67E-9, 65.2%) 0.615 0.596 0.578
MTX No (5.52E-3, 42.4%) Yes (2.15E-7, 64%) 0.583 0.588 0.548
Cladribine Yes (5.68E-7, 63.6%) Yes (2.58E-5, 62.4%) 0.622 0.602 0.597
Arac Yes (5.51E-3, 60.45) Yes (9.13E-8, 63.2%) 0.658 0.650 0.629
Paclitaxel Yes (8.94E-7, 62.8%) Yes (6.83E-5, 61.2%) 0.559 0.542 0.538
Arsenic Yes (4.47E-6, 62.4%) Yes (1.47E-2, 57.2%) 0.530 0.513 0.519
6MP No (1.59E-4, 39.2%) Yes (2.58E-5, 62.4%) 0.627 0.638 0.597
Rapamycin Yes (3.56E-7, 61.2%) Yes (8.23E-4, 57.6%) 0.620 0.606 0.602
6TG No (1.62E-19, 24.8%) Yes (5.33E-4, 60.8%) 0.717 0.746 0.694
Metformin Similar (0.514, 48.4%) Yes (1.87E-3, 60.4%) 0.583 0.584 0.564
Fludarabine Similar (0.655, 46.4%) Yes (7.54E-5, 59.2%) 0.539 0.540 0.512
TMZ Similar (2.99E-2, 54%) No (4.23E-3, 41.6%) 0.482 0.471 0.496
Hypoxia Similar (0.406, 45.6%) No (4.41E-2, 42.8%) 0.588 0.590 0.600
CDDP No (2.01E-3, 44%) No (5.30E-4, 39.2%) 0.602 0.607 0.621
Gemcitabine No (1.10E-4, 37.2%) excluded 0.739 0.745 excluded
The FDR is calculated using a two-sided Wilcoxon signed rank test and corrected for multiple tests. The treatments are sorted based on the largest PIFof the improvement obtained using ProGENI compared to any of the baseline schemes. Results in the range 45% < PIF < 55% were considered similar.Gemcitabine was excluded, since for a few training sets the best model trained by EN only included the intercept
Emad et al. Genome Biology (2017) 18:153 Page 6 of 21

a
b
c
d
Fig. 3 (See legend on next page.)
Emad et al. Genome Biology (2017) 18:153 Page 7 of 21

knockdown-based evidence in their favor. Out of the top15 genes identified using ProGENI for their role incisplatin sensitivity, we found direct literature evidencefor nine genes (Table 2; Additional file 4). For example,CLDN3 (Claudin-3; ProGENI rank 4), a gene that isinvolved in tight junction-specific obliteration of theintercellular space, has been shown to regulate sensiti-vity to cisplatin by controlling expression of cisplatininflux transporter CTR1; in addition, knockdown ofCLDN3 has been shown to increase resistance to cis-platin in human ovarian carcinoma cells in both in vitroculture and an in vivo xenograft model [29]. As anotherexample, MMP2, a member of the matrix metallopro-teinase family involved in the breakdown of the extracel-lular matrix, was ranked ninth using ProGENI, whilePearson correlation analysis did not place it among thetop 15. An inhibitor of MMP2 has been shown to sig-nificantly increase cytotoxicity in cisplatin-resistant ovar-ian carcinoma cell line A2780cis [30]. In addition to thenine (of 15) genes with direct literature evidence, ourown experiments revealed that knockdown of three ofthe remaining six predicted genes, TUBB6, DYNC2H1,and ELK3, significantly sensitized both cell lines to cis-platin treatment (Fig. 4a). β-Tubulin, of which TUBB6 isa subtype, plays a prominent role in cell survival,allowing cancer cells to survive, and these cell survivalpathways can also be responsible for resistance tochemotherapy [31]. Suppression of ELK3 induces sensi-tivity of MDA-MB-231 cells to doxorubicin treatment byinhibiting autophagy [32]. However, no previous studyhad linked these three genes to cisplatin sensitivity,making our experimental validation a novel finding.Among the top 15 genes identified using ProGENI for
docetaxel, we found direct literature evidence for sevengenes (Table 2; Additional file 4). For example, YAP1(yes-associated protein 1; ProGENI rank 2) regulatesgenes involved in cell proliferation and apoptosis; induc-tion of this gene has been shown to induce resistance todocetaxel, and its knockdown has been shown tosensitize esophageal cancer cells to this drug [33].Knockdowns of three of the seven remaining genes,GNG12, FSTL1, and ST5, significantly increased doce-taxel sensitivity in both MDA-MB-231 and BT549 cells(Fig. 4b). These three genes are differentially expressedin some cancers. For example, GNG12 is found to be
down-regulated in endometrial cancer [34]. FSTL1 wasfound to be downregulated in v-myc and v-rasoncogene-transformed cells, with a possible role incarcinogenesis [35], poor prognosis of glioblastoma [36],and progression of prostate cancer [37]. ST5(DENND2B) activates guanosine triphosphatase Rab13at the leading edge of migrating cells and promotesmetastatic behavior [38]. However, none of these threegenes were previously known to affect docetaxelsensitivity.We also found direct literature evidence for eight
genes among the top 15 genes for doxorubicin (Table 2;Additional file 4). As an example, CSNK2A1 (Casein kin-ase 2 alpha 1) and its paralog CSNK2A2 are serine/threonine protein kinases that have regulatory roles incell proliferation, differentiation, and apoptosis. Both ofthese genes were ranked among the top 15 for doxorubi-cin using ProGENI, while Pearson correlation analysisplaces them at ranks 1587 and 4870, respectively. Severalstudies have shown the role of these genes in resistanceto doxorubicin and the synergistic effect between theirinhibition and cytotoxicity of doxorubicin [39–43]. Asanother example, Daugaard et al. [44] have shown thatthe ectopic expression of PSIP1 (LEDGF; ProGENI rank8) protects MFC-7 cells against several cytotoxic drugs,including doxorubicin. Through siRNA knockdown ex-periments, we found that three genes out of the eightremaining ‘top 15’ predictions for doxorubicin—ATF1,MIS12, and OSBPL2—changed doxorubicin sensitivity inboth MDA-MB-231 and BT549 cells (Fig. 4c, d). Knock-down of ATF1 and MIS12 significantly desensitized bothcell lines to doxorubicin treatment, while knockdown ofOSBPL2 significantly sensitized both cell lines to doxo-rubicin treatment. Additionally, knockdown of GOSR1also increased doxorubicin sensitivity in BT549 cells, buthad less effect on doxorubicin response in MDA-MB-231 cells. ATF1, a negative regulator of apoptosis, is up-regulated in metastatic melanoma cells, and inactivationof ATF1 in melanoma cells resulted in inhibition oftumor growth and metastasis in vivo [45]. The MIS12complex makes an important contribution to kineto-chore assembly during cell division [46]. Defects inkinetochore proteins often lead to aneuploidy and can-cer. However, no previous study had linked these genesto doxorubicin sensitivity.
(See figure on previous page.)Fig. 3 The performance of drug sensitivity prediction based on ProGENI compared to the baseline methods using the LCL (a, b) and GDSC (c, d)datasets for a selection of drugs. The y-axis shows the SPCI corresponding to ProGENI while the x-axis shows the SPCI corresponding to thebaseline. Each point in the scatter plot corresponds to one random choice of training/test set. The color of each point represents the density ofpoints in that region: a dark red color on a point means that the point is surrounded by many other points, while a blue color on a point meansthat the point is isolated. The FDR is calculated using a one-sided Wilcoxon signed rank test corrected for multiple tests. a Performance ofProGENI-SVR versus PCC-SVR for the LCL dataset. b Performance of ProGENI-SVR versus EN-SVR for the LCL dataset. c Performance of ProGENI-SVRversus PCC-SVR for the GDSC dataset. d Performance of ProGENI-SVR versus EN-SVR for the GDSC dataset
Emad et al. Genome Biology (2017) 18:153 Page 8 of 21

a
b
c
d
Fig. 4 Dosage-response curves for the genes identified using Robust-ProGENI which showed significant change compared to control for acisplatin, b docetaxel, and c doxorobicin in BT549 and MDA-MB-231 cell lines. Results are representative of at least three independentexperiments and data expressed as mean ± standard deviation (SD), n = 3. P values are calculated using a two-tailed unpaired t-test. dThe interaction network of genes highly ranked using Robust-ProGENI (green circles), genes highly ranked using Pearson correlation analysis (HPC; circleswith red border), and the shared neighbors of these two groups (small grey circles with no borders). Edges correspond to experimentally obtained PPIsand genetic interactions extracted from the STRING database; only edges with high affinity scores (>500) are depicted. The degree of a gene that ishighly ranked using ProGENI but not among the HPC genes (green circle with no border) shows the number of its HPC neighbors and the number ofits shared neighbors with HPC genes. These figures were drawn using Cytoscape [90]
Emad et al. Genome Biology (2017) 18:153 Page 9 of 21

Table 2 Experimental evidence for the top 15 genes identified using ProGENI from the GDSC dataset for cisplatin, docetaxel, anddoxorubicin
Gene symbol Rank (ProGENI) Rank (Pearson) Absolute value of Pearsoncorrelation coefficient
Evidence
Cisplatin
TUBB6 2 2 0.2759 Direct (this study)
DYNC2H1 3 4 0.2680 Direct (this study)
CLDN3 4 7 0.2602 Direct (literature)
SPARC 5 8 0.2574 Direct (literature)
GJA1 6 6 0.2623 Direct (literature)
ITGA5 7 11 0.2466 Direct (literature)
TPM2 8 9 0.2567 Direct (literature)
MMP2 9 37 0.2160 Direct (literature)
AXL 12 15 0.2373 Direct (literature)
ENG 13 47 0.2089 Direct (literature)
ELK3 14 13 0.2394 Direct (this study)
TIMP1 15 29 0.2207 Direct (literature)
FSCN1 1 1 0.2879 Not found
FHL3 10 10 0.2477 Not found
MMP14 11 39 0.2143 Not found
Docetaxel
CAV1 1 8 0.3713 Direct (literature)
YAP1 2 1 0.4148 Direct (literature)
AXL 6 2 0.4098 Direct (literature)
MMP14 7 22 0.3525 Direct (literature)
CYR61 9 6 0.3791 Direct (literature)
CAV2 10 16 0.3566 Direct (literature)
GNG12 11 5 0.3792 Direct (this study)
CTSB 12 27 0.3462 Direct (literature)
FSTL1 14 17 0.3557 Direct (this study)
ST5 15 7 0.3782 Direct (this study)
WWTR1 3 4 0.4075 Not found
PDGFC 4 13 0.3659 Not found
PTRF 5 3 0.4094 Not found
ITGB5 8 21 0.3534 Not found
PLAU 13 110 0.3033 Not found
Doxorubicin
ATF1 1 1 0.2000 Direct (this study)
MIS12 2 4 0.1887 Direct (this study)
OSBPL2 5 6 0.1865 Direct (this study)
CSNK2A1 7 1587 0.0752 Direct (literature)
PSIP1 (LEDGF) 8 46 0.1537 Direct (literature)
CAMK2A 9 6991 0.0157 Direct (literature)
CSNK2A2 10 4870 0.0347 Direct (literature)
GOSR1 11 6867 0.0167 Direct (this study)
MAPK8 13 7574 0.0112 Direct (literature)
SPI1 14 6287 0.0217 Direct (literature)
Emad et al. Genome Biology (2017) 18:153 Page 10 of 21

Finally, we note that though several of the associationswere not corroborated experimentally in selected breastcancer triple negative CCLs, this is expected to an extentas the selection of CCLs was based on clinical indica-tions for each drug. In addition, the ProGENI-predictedgenes were not obtained solely based on breast cancertriple negative CCLs (i.e, were not cell type-specific), butrather were based on data on many different types ofCCLs from 13 different tissues of origin. As a result,some of the genes that were not experimentally verifiedin breast cancer triple negative cell lines may influencedrug response in other cell types.
Genes highly ranked for many drugs point to commonpathways of cytotoxic responseClose examination revealed that some genes are highlyranked for many treatments. Additional file 5 contains alist of 137 genes that were among the top 500 Robust-ProGENI-identified genes for at least 40 (over a quarter of139 studied) treatments in the GDSC dataset. Functionalenrichment analysis using DAVID [47] (Additional file 5)revealed that these genes are involved in regulation of cellproliferation (43 genes, FDR = 9.19 E-18 using Fisher exacttest) and regulation of cell death (28 genes, FDR = 1.67 E-5), which can be explained by the cytotoxic nature of theconsidered drugs. On the other hand, some of these genesencode proteins that are involved in different processes atthe cell surface, such as plasma membrane (76 genes,FDR = 4.05E-08) and cell surface receptor linked signaltransduction (54 genes, FDR = 2.33 E-11). Several studieshave shown the involvement of plasma membranecomponents in multidrug-resistance (MDR) [48–50], andtransport through the cell membrane, particularly vesicu-lar transport (exosomes), has been linked to resistance tocytotoxic drugs [50]. Other enrichments include celladhesion (45 genes, FDR = 1.11 E-21) and focal adhesion(40 genes, FDR = 5.11 E-28) and particularly the integrinfamily (19 genes, FDR = 3.17 E-18), which has been shownto play an important role in drug resistance [51, 52].Seeking additional global insights about common
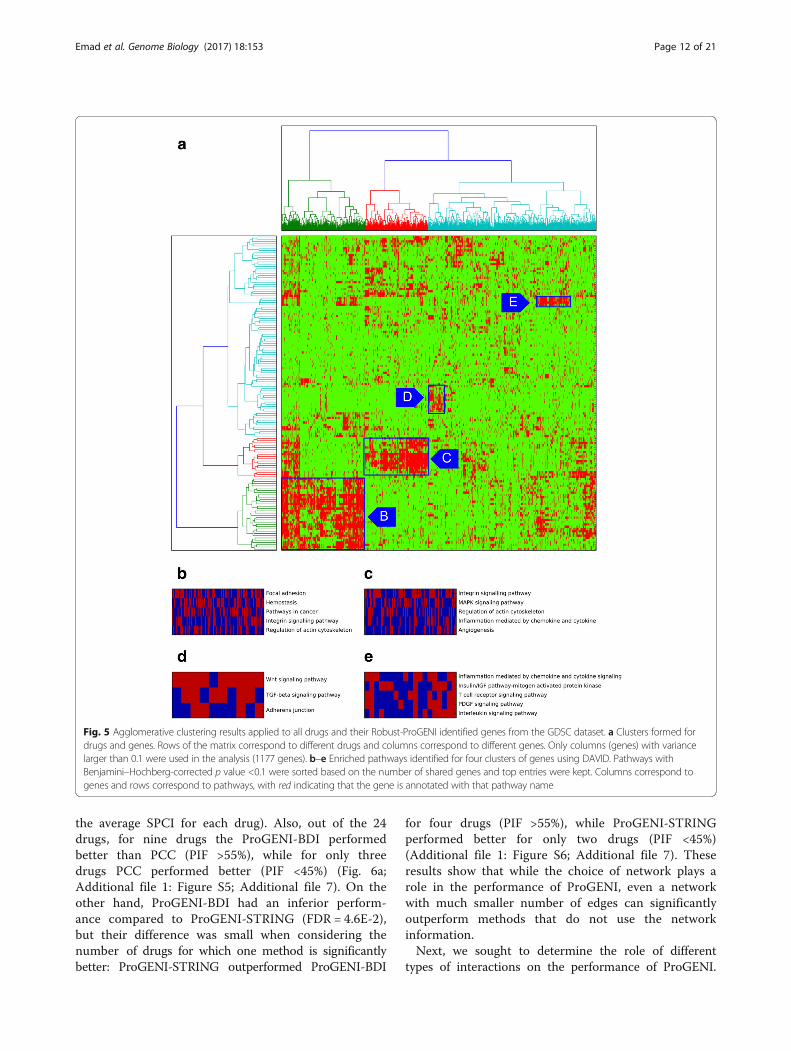
drug-associated genes, we next formed a drugs × genesmatrix indicating the top 500 genes identified for eachdrug, and used agglomerative clustering to identify four
dense biclusters of drugs and genes that are associatedwith each other (Fig. 5a; Additional file 6). We per-formed pathway enrichment analysis on the genes ineach bicluster, using DAVID (Fig. 5b–e). We noted thatone of the biclusters (Fig. 5c) includes genes enriched inthe MAPK signaling pathway (FDR = 6.72 E-12). Thisbicluster includes drugs such as ABT-263, AICAR,ATRA, bicalutamide, IPA3, lenalidomide, methotrexate,nilotinib, PAC1, vorinostat, and VX-702, for which eitherthe inhibition of the MAPK signaling pathway affectsdrug resistance or this pathway is involved in theirMoAs [53–63]. Another bicluster (Fig. 5d) includesgenes enriched in the Wnt signaling pathway, and drugssuch as QS11, doxorubicin, etoposide, OSU03012, thap-sigargin, and tipifarnib, whose association with the Wntsignaling pathway has been confirmed in previousstudies [64–69]. We also observed a bicluster (Fig. 5e)with a group of MEK inhibitors (AZD6244, CI-1040,PD-0325901, RDEA119) and genes enriched in theinflammation response pathways, consistent with priorreports of MEK inhibition resulting in anti-inflammatoryresponse [70]. To summarize, examination of a globalmap of drug–gene associations predicted by ProGENIreveals sub-groups of similarly acting compounds andpathways involved in their MoAs.
Systematic performance analysis of ProGENIProGENI utilizes an interaction network consisting of dif-ferent protein–protein and genetic interactions from theSTRING database. To test the sensitivity of this algorithmto the choice of network, we formed a PPI networkcontaining genetic interactions (GI), colocalizations (CO),and molecular associations (MA) from three databases:BioGRID [71], DIP [72], and IntAct [73]. The number ofedges in this network (called ‘BDI’ henceforth) is approxi-mately one-third of the number of edges in the STRINGnetwork. We used the cross-validation evaluation(depicted in Fig. 1c) on the LCL dataset to test the effectof changing the network to this new network. For allcases, we used SVR with Gaussian kernel as the regressionalgorithm to predict drug response using the identifiedgenes. ProGENI-BDI outperformed the PCC scheme(FDR = 3.2E-2, one-sided Wilcoxon signed rank test on
Table 2 Experimental evidence for the top 15 genes identified using ProGENI from the GDSC dataset for cisplatin, docetaxel, anddoxorubicin (Continued)
CREB1 15 665 0.1000 Direct (literature)
NOC3L 3 3 0.1893 Not found
IL27RA 4 2 0.1911 Not found
MGEA5 6 7 0.1814 Not found
WAPAL 12 8 0.1805 Not found
The first column shows the gene symbols, the second column shows the rank of each gene using Robust-ProGENI, the third column shows the rank of each geneusing the Pearson correlation scheme, the fourth column shows the absolute value of the PCC, and the fifth column shows the nature of the evidence
Emad et al. Genome Biology (2017) 18:153 Page 11 of 21
the average SPCI for each drug). Also, out of the 24drugs, for nine drugs the ProGENI-BDI performedbetter than PCC (PIF >55%), while for only threedrugs PCC performed better (PIF <45%) (Fig. 6a;Additional file 1: Figure S5; Additional file 7). On theother hand, ProGENI-BDI had an inferior perform-ance compared to ProGENI-STRING (FDR = 4.6E-2),but their difference was small when considering thenumber of drugs for which one method is significantlybetter: ProGENI-STRING outperformed ProGENI-BDI
for four drugs (PIF >55%), while ProGENI-STRINGperformed better for only two drugs (PIF <45%)(Additional file 1: Figure S6; Additional file 7). Theseresults show that while the choice of network plays arole in the performance of ProGENI, even a networkwith much smaller number of edges can significantlyoutperform methods that do not use the networkinformation.Next, we sought to determine the role of different
types of interactions on the performance of ProGENI.
Fig. 5 Agglomerative clustering results applied to all drugs and their Robust-ProGENI identified genes from the GDSC dataset. a Clusters formed fordrugs and genes. Rows of the matrix correspond to different drugs and columns correspond to different genes. Only columns (genes) with variancelarger than 0.1 were used in the analysis (1177 genes). b–e Enriched pathways identified for four clusters of genes using DAVID. Pathways withBenjamini–Hochberg-corrected p value <0.1 were sorted based on the number of shared genes and top entries were kept. Columns correspond togenes and rows correspond to pathways, with red indicating that the gene is annotated with that pathway name
Emad et al. Genome Biology (2017) 18:153 Page 12 of 21

Of the three interaction types available in the BDInetwork, ProGENI with only molecular associationedges had the best performance, while ProGENI withonly genetic-interaction edges had the worst perform-ance: ProGENI-BDI-MA, ProGENI-BDI-CO, andProGENI-BDI-GI performed better than PCC on 11,7, and 6 drugs (PIF >55%), respectively, while PCCperformed better in 3, 5, and 9 drugs (PIF <45%), re-spectively (Fig. 6a; Additional file 1: Figures S7–S9;Additional file 7). The poor performance of ProGENI-BDI-GI may be due to the small number of edgesand genes in that BDI-GI network (only ~ 1.5 K edgesamong ~1.5 K genes).Next, we evaluated the performance of ProGENI
with the STRING network to its performance whenusing random networks: using the LCL dataset andthe STRING network, we randomly permuted theinteraction network of all genes five times. In allcases, ProGENI-STRING outperformed ProGENI withthe randomly permuted network (α = 0.05, one-sidedWilcoxon signed rank test on the average SPCI foreach drug). ProGENI-STRING also outperformed theaverage performance of these five networks (p value =2.1E-3, one-sided Wilcoxon signed rank test on theaverage SPCI for each drug).Next, we sought to study the effect of different steps
in the performance of ProGENI (using the LCL datasetand the STRING network). In the first step, ProGENIperforms a network transformation on the gene expres-sion matrix, ensuring that the value assigned to eachgene represents its mRNA expression and the activitylevel of the genes surrounding it in the network. We
compared ProGENI with another variation called ‘Pro-GENI-PCC’ in which the absolute value of the Pearsoncorrelation coefficient of transformed gene expressionsand drug response was used to rank the genes. Whilethe average SPCI value over all drugs was higher forProGENI, comparing the average SPCI values for eachdrug did not show a significant difference (p value =0.42, one-sided Wilcoxon signed rank test on averageSPCI values for each drug). In the second step, ProGENIselects a small set of genes (the RCG set) and scoresgenes in the network based on their relevance to thisset. The motivation behind this step is that, due to thenoise in the data and the large number of genes com-pared to samples, it may be more reliable to score genesbased on a small but high confidence set of genes. Whilethis step showed only a slight improvement overall, forsome drugs this step was shown to be extremely import-ant. For example, ProGENI significantly outperformedProGENI-PCC for MPA (FDR = 1.95 E-19, PIF = 78%)and TCN (FDR = 8.3 E-18, PIF = 75.2%) (Additional file7). In summary, we found that the use of network RWRin the first and second steps improves performance, ifnot always with statistical significance.We also evaluated how sensitive the performance of
ProGENI is with respect to the size of the RCG set.We compared ProGENI (with an RCG set of size100) to another variation (‘ProGENI-ACG’) in whichall genes were used as the RCG set, with their restartprobabilities proportional to their absolute Pearsoncorrelation coefficient. While the average SPCI valueof ProGENI was higher than ProGENI-ACG, the dif-ference was not significant (p value = 0.41, one-sided
a b
Fig. 6 a The performance of ProGENI-SVR with different networks compared to PCC-SVR using all 24 treatments in the LCL dataset. The color bluein each bar chart represents the number of drugs for which the ProGENI-SVR performed better than the PCC-SVR (PIF >55%), while the color redshows the number of drugs for which the trend was opposite (PIF <45%). b The performance of predicting drug sensitivity of the test sets in theLCL dataset using 500 features selected by ProGENI using the LCL dataset (within-dataset) and the GDSC dataset (cross-dataset). The box plotshows the distribution of the SPCI values for each drug
Emad et al. Genome Biology (2017) 18:153 Page 13 of 21

Wilcoxon signed rank test on average SPCI values foreach drug), showing that ProGENI is not verysensitive to the size of the RCG set. For some drugs,however, selecting a small RCG set had a significanteffect: for example, ProGENI outperformed ProGENI-ACG for TCN (FDR = 1.3 E-19, PIF = 75.6%) andMPA (FDR = 2.32 E-22, PIF = 78.4%) (at least for somedrugs; Additional file 7).In light of the above evidence in favor of network-
guided gene prioritization, we next asked if similarlyhigh performance can be obtained by ignoring RCGsaltogether, using only the network information. Thismay be possible, for instance, if network hubs aregood predictors of drug response in general. Wetested this variant method (‘NHDS’), which runs anRWR on the network with all nodes as a restart setand thus prioritizes genes with high degree or genesin dense sub-networks, ignoring drug response dataaltogether. ProGENI significantly outperformed NHDSwith p value = 1.1 E-2 (one-sided Wilcoxon signedrank test on average SPCI values for each drug),showing that a combination of network informationand information about gene–phenotype correlations isnecessary to achieve the improved performance ofProGENI (Additional file 7). Finally, we tested a vari-ant (‘ProGENI-NH’) that omits the final step ofadjusting for the global equilibrium distribution overgene nodes (Fig. 1a, “Methods”), thereby potentiallyadvancing the ranks of network hubs. Cross-validationevaluation showed ProGENI and ProGENI-NH tohave very similar performance (p value = 0.38, one-sided Wilcoxon signed rank test on average SPCIvalues for each drug; Additional file 7). However, wenoted that omitting this step heavily biases the finalranked list towards network hubs (Table 3), regardlessof the phenotype being studied.A summary of all these results is provided in Additional
file 7.
ProGENI prioritizes drug-specific genesWe noted above that a network-based prioritizationmethod (ProGENI-NH) may show high accuracy inour cross-validation evaluation despite being heavilybiased towards network hubs. If so, it is also possiblethat the prioritized genes are not specific to the drugbeing analyzed. To investigate this, we tested whetherProGENI provides a drug-specific ranking of genes.We randomly partitioned the LCL cell lines into twogroups of approximately equal sizes and ran ProGENIfor all drugs on these two sets. Additional file 8 re-ports the intersection of the top 500 genes identifiedfor any pair of drugs using ProGENI (or Pearson cor-relation scheme), averaged over 100 repeats of thisprocedure. An expected sign of drug-specificity is that
gene lists for the same drug (but based on differentsubsets of cell lines) have a greater intersection thangene lists for different drugs. Indeed, we noted thatfor 10 of the 24 treatments the intersection betweengene lists based on different subsets of cell lines wasranked 1 or 2 compared to their intersection withgene lists for different drugs (Table 4). Note that thep value is calculated based on the fact that, under thenull hypothesis, the drug specificity rank follows adiscrete uniform{1,24} distribution. Combing these pvalues using the Fisher’s method resulted in a p valueof 2.25E-3 for drug specificity using ProGENI. Thisanalysis shows that ProGENI provides a drug-specificset of genes. However, the results are not as specificas provided by the Pearson correlation scheme(Table 4), which is expected since the latter relies ex-clusively on response data for each drug.
Table 3 Presence of network hubs among the highly rankedgenes provided by ProGENI and ProGENI-NH
Treatment Intersection with hubsfor ProGENI (p value)
Intersection with hubs forProGENI-NH (p value)
6MP 5 (0.82) 186 (5.75E-269)
6TG 0 (1) 173 (2.10E-235)
Arac 0 (1) 187 (9.61E-272)
Arsenic 4 (0.92) 195 (1.51E-295)
Carboplatin 0 (1) 173 (2.10E-235)
Cddp 4 (0.92) 141 (1.20E-165)
Cladribine 1 (0.99) 195 (1.51E-295)
Docetaxel 3 (0.97) 141 (1.20E-165)
Doxorubicin 12 (0.04) 176 (8.56E-243)
Epirubicin 4 (0.92) 167 (3.82E-221)
Everolimus 8 (0.38) 199 (<1.0E-307)
Fludarabine 0 (1) 197 (3.66E-302)
Gemcitabine 4 (0.92) 176 (8.56E-243)
Hypoxia 38 (3.98E-18) 194 (2.26E-292)
Metformin 5 (0.82) 185 (3.19E-266)
MPA 15 (0.0038) 100 (6.28E-94)
MTX 1 (0.99) 182 (3.54E-258)
NAPQI 2 (0.99) 167 (3.82E-221)
Oxaliplatin 1 (0.99) 163 (5.56E-212)
Paclitaxel 21 (5.30E-06) 175 (2.61E-240)
Radiation 1 (0.99) 199 (<1.0E-307)
Rapamycin 4 (0.916) 192 (3.16E-286)
TCN 2 (0.99) 194 (2.26E-292)
TMZ 4 (0.92) 189 (2.08E-277)
For each treatment, the table shows the size of intersection between the top 500genes obtained using Robust-ProGENI (or Robust-ProGENI-NH) and the set of 200genes in the network with the highest degree. P value for the intersection wascalculated using a hypergeometric test
Emad et al. Genome Biology (2017) 18:153 Page 14 of 21

Cross-dataset evaluation of ProGENIWe sought to determine whether drug-associated genesidentified using a heterogeneous set of cell lines (GDSCdataset) can help predict drug response in a more homo-geneous cohort of cell lines (LCL dataset). We identifiedseven drugs shared between these two datasets, appliedRobust-ProGENI on the GDSC dataset to identify thetop 500 genes for each drug and evaluated these geneson the LCL dataset using the SVR-based cross-validationscheme (Fig. 1c). We also compared this cross-datasetevaluation to the ‘within-dataset’ evaluation (Fig. 6b),where top genes are selected using the LCL cell lines inthe training set and used to predict the drug sensitivityof the LCL cell lines in the testing set. As expected, thewithin-dataset evaluations yield some improvement onthe performance compared to the cross-dataset evalua-tions; however, this improvement was not statisticallysignificant (p value = 6.4E-2, one-sided Wilcoxon signed
rank test on the average SPCI of test sets). In addition,for any given drug the average SPCI values for the twoschemes were similar (Fig. 6b), suggesting that it ispractical to utilize gene prioritization results from a di-verse cohort such as GDSC in a more specific contextsuch as LCLs.
DiscussionProfiling of cell lines is a promising means to betterunderstand the mechanisms that relate the genomic andtranscriptomic features to many different phenotypicoutcomes [74]. In this study, we used both cancer celllines and LCLs obtained from healthy individuals toidentify genes whose over/under-expression influencesdrug response of an individual. To achieve this goal, weproposed ProGENI, a novel method that integrates in-formation on gene interactions and relationships withdata on basal mRNA expression and drug cytotoxicity ina panel of cell lines to prioritize genes that determinedrug sensitivity. We showed that genes prioritized byProGENI can together predict drug response more ac-curately than top genes identified by a single genemethod (Pearson correlation [2]) as well as a multipleregression method (Elastic Net). Although our main goalin this study was not to develop the best drug responseprediction algorithm, and we used prediction perform-ance only to compare different prioritization methods,we showed that ProGENI-SVR outperforms severalwidely used prediction algorithms. Even compared tothe Bayesian multitask-MKL algorithm (the winner ofthe DREAM 7 challenge), our algorithm provides moreaccurate predictions (on the LCL dataset), or performsas well (on the GDSC dataset), with the added advantagethat it can also prioritize the most informative genes.We have also shown that when features selected and en-hanced using ProGENI are used with the Bayesianmultitask-MKL algorithm, the performance improves onthe LCL dataset.Several major steps in ProGENI differentiate it from
other methods, including existing methods that utilizenetwork information. We show that the networktransformation it performs on the gene expressionmatrix enables it to consider the expression of eachgene in the context of its network neighbors, andgreatly improves performance. The systematic removalof network bias from the output of RWR in the laststep of ProGENI allows it to prioritize drug-specificgenes; without this step the top ranked genes are sig-nificantly enriched in high-degree nodes (networkhubs), limiting our ability to obtain a complete pic-ture of drug resistance mechanisms, and divert ourattention to generic, phenotype-independent mecha-nisms. Similar effects of high-degree nodes onnetwork-based analysis have been noted before in
Table 4 Drug specificity of the top 500 genes identified usingProGENI and Pearson correlation scheme using the LCL dataset
Treatment Rank by ProGENI (p value) Rank by PCC (p value)
6MP 3 (0.13) 1 (0.04)
6TG 23 (0.96) 5 (0.21)
Arac 9 (0.38) 4 (017)
Arsenic 12 (0.5) 12 (0.5)
Carboplatin 5 (0.21) 2 (0.08)
Cddp 8 (0.33) 3 (0.13)
Cladribine 2 (0.08) 3 (0.13)
Docetaxel 1 (0.04) 1 (0.04)
Doxorubicin 2 (0.08) 2 (0.08)
Epirubicin 2 (0.08) 2 (0.08)
Everolimus 12 (0.5) 2 (0.08)
Fludarabine 11 (0.46) 8 (0.33)
Gemcitabine 2 (0.08) 1 (0.04)
Hypoxia 2 (0.08) 1 (0.04)
Metformin 3 (013) 7 (0.29)
MPA 1 (0.04) 1 (0.04)
MTX 13 (0.54) 18 (0.75)
NAPQI 11 (0.46) 1 (0.04)
Oxaliplatin 1 (0.04) 1 (0.04)
Paclitaxel 1 (0.04) 1 (0.04)
Radiation 24 (1) 24 (1)
Rapamycin 2 (0.08) 2 (0.08)
TCN 11 (0.46) 23 (0.96)
TMZ 15 (0.63) 16 (0.67)
A high rank (small entry) shows that the average size of intersection betweengenes identified using the prioritization method on the two sets of cell linesfor the same drug is larger than the intersection when the drug is comparedwith other drugs. The geometric means of all ranks for prioritization usingProGENI and Pearson correlation are 4.5 and 3.1, respectively
Emad et al. Genome Biology (2017) 18:153 Page 15 of 21

other contexts [75]. In addition to cross-validationperformance, we also used knockdown evidence fromthe literature and our own experiments to confirmthe role of many of the ProGENI-identified genes indrug resistance. These included genes whose expres-sion had a low correlation with drug response, butthe activity of their surrounding neighbors had a highcorrelation.Of the 12 genes for which siRNA knockdown did not
affect drug sensitivity, eight have expression highlycorrelated with drug response. Since these genes havehigh phenotype correlation both individually and in thecontext of the interaction network, we speculate that theexperimental validation failed because these genes are ina family of genes with similar function, and knockdownof one member is compensated for by other genes inthat family, or because the role of these genes in drugresistance can only be captured through their corre-sponding pathways, which do not become disrupted bysingle-gene knockdown. For example, both ProGENIand correlation analysis placed PTRF (Cavin-1) as an in-fluential gene for docetaxel-resistance. Cavin-1 is amember of the cavin family proteins, which along withthe caveolin family are responsible for assembly of cave-olae [76]. Although our analysis showed that siRNAknockdown of PTRF is not sufficient to affect sensitivityto docetaxel, several studies have shown the role of cave-olae and the cavin and caveolin protein families onmulti-drug resistance and sensitivity to various drugs, in-cluding docetaxel [77–80]. We speculate, therefore, thatthe role of cavin-1 in docetaxel resistance can only becaptured in the context of cavin and caveolin familiesand the pathways with which it is associated.The modeling techniques we employed in this study
can be extended and improved in several directions.First, in our analysis we did not consider the similaritiesbetween different treatments, and the identification ofgenes for each drug was performed independently ofother drugs. However, we expect that many of the genesthat affect drugs from the same family would be thesame. As a result, incorporating drug similarity informa-tion based on their chemical structure, their known tar-gets, or known MoAs can improve prediction accuracy[81]. Another area that can potentially improve these re-sults is incorporating genomic and epigenomic data inthe analysis, as has been shown, for example, in [26, 82].While gene expression data have been shown to be themost informative type of data in predicting drug re-sponse (e.g., [6]), inclusion of other types of data canprovide a more comprehensive picture of genomic prop-erties that are predictive of drug response. However, oneshould note that incorporating such data requires greatcaution, as the drastic increase in number of features ne-cessitates a much larger number of samples to recover
the signal and avoid over-fitting. While an increase inthe number of samples can be obtained by conductingcomprehensive experiments and measurements on manycell lines [15], an alternative approach is to combinevarious datasets obtained in different studies. However,the success of this approach highly depends on consistencyof the combined datasets; unfortunately, several studieshave shown a lack of consistency between the drug re-sponse of large public datasets [83]. As a result, new stan-dards and protocols may be necessary to ensurereproducibility in large-scale drug screening studies [84]. Inaddition, as more accurate and comprehensive datasets be-come available on PPIs and genetic interactions among thegenes, we expect that new aspects of drug resistance mech-anisms can be uncovered using network-based methods.Another aspect that should be further explored in fu-
ture studies is the clinical relevance of the identifiedgenes using in vitro datasets. Our results in this studyare based on in vitro cell line datasets, which have beenpreviously shown to be able to predict the clinical drugresponse in vivo [7] for a few drugs. However, with theemergence of new large datasets [85, 86] which includedrug response for a large cohort of drugs and samples,the role and predictive ability of genes identified in vitrocan be systematically evaluated in vivo.
ConclusionsWe have shown that knowledge-guided geneprioritization using ProGENI is a powerful computa-tional technique for identifying genes that play a key rolein determining drug response and provides deeper in-sights into mechanisms of drug resistance that cannotbe achieved otherwise. This method can be used to iden-tify mechanistic aspects of responses to a specific drug(e.g., genes, gene sets, or pathways) and find several newcandidates for experimental validation. Using this ap-proach, for the first time we confirmed the role of tennovel genes in the sensitivity of three chemotherapydrugs. The broader applicability of this new method goesbeyond pharmacogenomics studies: it offers scientists away to identify gene predictors of any phenotype ofinterest while incorporating prior knowledge aboutgenes and their mutual relationships, in a manner thatthe current de facto standard methods such as correl-ation analysis or regression analysis fail to provide.
MethodsData collectionFor the LCL dataset we obtained basal gene expressionand drug response (half maximal effective concentrationor ‘EC50’) data on 284 LCLs and 24 cytotoxic treatmentsfrom [25, 26]. For the GDSC dataset we obtained geneexpression and drug response (half maximal inhibitoryconcentration or ‘IC50’) data on 624 CCLs from 13
Emad et al. Genome Biology (2017) 18:153 Page 16 of 21

different tissue origins and 139 cytotoxic drugs from theGenomics of Drug Sensitivity in Cancer (GDSC) data-base (release-5.0) [28].The gene interaction network used here was obtained
from the STRING database [27] and consists of geneticinteractions, protein associations, and protein colocaliza-tions obtained experimentally. It includes more than1.48 million undirected weighted edges (relationships)among 15,589 nodes (genes). We also obtained a net-work containing genetic interactions, colocalizations,and molecular associations from three databases: Bio-GRID [71], DIP [72], and IntAct [73]. This network(called BDI) contained approximately 294 K undirectedunweighted edges among 20,788 genes. Of these edgesthere were ~ 1.5 K genetic interactions among 1478genes, ~ 261 K molecular associations among 20,615genes, and ~39 K colocalizations among 6565 genes.Note that since two genes may be connected with morethan one type of edge, we used the union of these threetypes of edges to find the BDI network. Additional de-tails are in Additional file 1: Supplemental methods.
Incorporating network information using random walkwith restartSeveral steps in the proposed algorithm ProGENI use therandom walk with restart (RWR) method [87] to incorpor-ate network information in the prioritization task. RWR isa method for quantifying the similarity between any givennode of a weighted network and a given set of the nodes,called the restart set. When at a node, the walker can ei-ther move to a neighboring node or jump to one of thenodes in the restart set. The probability of each of thesedecisions is determined by the weights of the adjacentedges and the restart probability p. The equilibrium prob-ability of visiting each node in the network determines thesimilarity between that node and the restart set.More formally, let A be an Nn ×Nn symmetric adjacency
matrix of the network (with Nn nodes) such that A(i, j) de-termines the weight of the edge between nodes i and j.Also, let B be the corresponding probability transitionmatrix obtained by normalizing each column of A to sumup to 1. Let v denote the equilibrium probability of all thenodes. This vector can be obtained iteratively using v(t + 1)
= (1 − p)Bv(t) + pw, where w is a probability vector oflength Nn determining initial probability of restart for eachnode. An entry in vector w is equal to zero if the corre-sponding node is not in the restart set, and is nonzerootherwise. See Additional file 1: Supplemental methodsfor the details of the convergence criterion.
Prioritization of genes enhanced with networkinformation (ProGENI)ProGENI is a method for gene prioritization that incor-porates prior information on gene–gene interactions
with basal gene expression and drug response data ob-tained from a large panel of samples (Fig. 1a). As input,this algorithm accepts a weighted undirected network ofgene–gene relationships, a matrix X of gene expressiondata (samples × genes), and a vector d of drug responsevalues for the samples. First, a log2 transformationfollowed by a Z-transform ensures that the expression ofeach gene across all cell lines follows a distribution withmean of zero and variance of one.Next, a network transformation is performed on the
gene expression matrix X to generate a ‘network-smoothed’ matrix X' as described next. Let Nn denote thenumber of nodes in the network and Ns denote the num-ber of genes shared between the gene expression datasetand the network. For each such gene, an Nn dimensionalvector representation with respect to other genes in thenetwork is obtained using a random walk with restart(RWR). This representation is equal to the vector of equi-librium probabilities, vi, when the restart set only consistsof node i: w(i) = 1, and w(j) = 0 for j ≠ i. Using these vectorrepresentations, an Ns ×Ns matrix V is formed, where itsith column is obtained from vi by removing entries corre-sponding to network nodes not in the expression datasetand normalizing it to sum to 1. Finally, the network-smoothed expression matrix is obtained according to X' =XV, followed by a Z-transformation on each column.Next, we compute for each gene i the absolute Pearson
correlation coefficient between their network-smoothedexpression (a column of X') and drug response (d),across all samples; this is denoted by ri. Then, ‘response-correlated genes’ (RCGs) are identified as the set of mgenes with the highest values of ri. The RCG set is usedas the restart set in a RWR, in which w(i) ∝ ri if gene i isan RCG. The vector w is scaled so that it sums to 1 andis used in a RWR to generate the equilibrium probabilityvector vRCG. In addition, a global equilibrium probabilityvector vglobal is obtained by performing a RWR on thenetwork, with the same probability of restart that wasused to obtain vRCG, and with all the nodes as the restartset (w(i) = 1/Nn for all i). Finally, vRCG − vglobal is used asthe ranking criterion for gene prioritization. In thisstudy, we used a probability of restart p = 0.5 for allRWRs, since this value provides a good balance betweenthe local and global topology of the network.
Robust prioritization using bootstrap sampling and Bordarank aggregationTo obtain rankings robust to noise in the data, we usedthe bootstrap sampling technique (Fig. 1b). A pre-specified number of samples (80% of the cell lines) arerandomly sampled, and used in the prioritizationmethod to obtain a ranked list of genes. This procedureis repeated Nr times (a user-specified number) and thegeometric mean of the Nr Borda scores obtained for
Emad et al. Genome Biology (2017) 18:153 Page 17 of 21

each gene is computed and is used as the final rankingcriterion [88]. See Additional file 1: Supplementalmethods for more details.
Cross-validation scheme for prediction of drug responseWe used a cross-validation scheme (Fig. 1c) to evaluatethe ability of different prioritization methods in identify-ing genes that determine and predict drug sensitivity.We used a fivefold cross-validation procedure, repeated50 times. In each repeat, the cell lines were randomlygrouped into five folds; four folds (80% of the cell lines)were used as the training set and the remaining cell lineswere used as the testing set. Prioritization methods wereused to analyze gene expression of cell lines within thetraining set and identify 500 genes. These genes werethen used to train a nonlinear support vector regression(SVR) model with Gaussian kernel, using their expres-sion values (smoothed expression for ProGENI and ori-ginal expression for baseline methods) as features.(Thus, each cell line was described by a 500 dimensionalfeature vector.) Hyperparameters of the SVR were learntusing a fourfold cross-validation applied inside the train-ing set. The trained model was then used with the fea-ture vectors corresponding to the cell lines in the testset to predict their drug sensitivity. See Additional file 1:Supplemental methods for the details on the set of pa-rameters used to train the SVR. Comparisons amongmethods were based on the same cross-validation parti-tions of cell lines.
Cell culture and treatments for knockdown experimentsHuman triple negative breast cancer MDA-MB-231 andBT549 cell lines were obtained from the American TypeCulture Collection (Manassas, VA, USA). MDA-MB-231cells were cultured in L-15 medium containing 10% FBSat 37 °C without CO2. BT549 cells were cultured inRPMI 1640 containing 10% FBS at 37 °C with 5% CO2.Doxorubicin, docetaxel, and cisplatin were purchased
from Sigma-Aldrich (St. Louis, MO, USA). Drugs weredissolved in DMSO and aliquots of stock solutions werefrozen at −80 °C. ON-TARGETplus SMARTpool siRNAsfor the candidate genes and negative control siRNA werepurchased from Dharmacon to prevent off-target effectscaused by both the sense and antisense strands whilemaintaining high silencing potency. Reverse transfectionwas performed for MDA-MB231and BT549 cells in 96-well plates. Specifically, 3000–4000 cells were mixed with0.3 μL of lipofectamine RNAi-MAX reagent (Invitrogen)and 10 nM siRNA for each experiment.Total RNA was isolated from cultured cells transfected
with control or specific siRNAs with the Qiagen RNeasykit (QIAGEN, Inc.), followed by qRT-PCR performedwith the one-step, Brilliant SYBR Green qRT-PCR mas-ter mix kit (Stratagene). Specifically, primers purchased
from QIAGEN were used to perform qRT-PCR usingthe Stratagene Mx3005P Real-Time PCR detectionsystem (Stratagene). All experiments were performed intriplicate with beta-actin as an internal control. Reversetranscribed Universal Human reference RNA (Strata-gene) was used to generate a standard curve. Controlreactions lacked RNA template.
MTS cytotoxicity assayCell proliferation assays were performed in triplicate ateach drug concentration. Cytotoxicity assays with the lym-phoblastoid were performed in triplicate at each dose.Specifically, 90 μL of cells (5 × 10⁴ cells) were plated into96-well plates (Corning, NY, USA) and were treated withincreasing doses of a specific drug or radiation. Afterincubation for 72 h, 20 μL of CellTiter 96® AQueous Non-Radioactive Cell Proliferation Assay solution (PromegaCorporation, Madison, WI, USA) was added to each well.Plates were read in a Safire2 plate reader (Tecan AG,Switzerland).Cytotoxicity assays with the tumor cell lines were per-
formed in triplicate at each drug concentration with theCellTiter 96® AQueous Non-Radioactive Cell ProliferationAssay (Promega Corporation, Madison, WI, USA). Specif-ically, 90 μL of cells (5 × 10³ cells) were plated into 96-wellplates and were treated with an increasing dose of the spe-cific drug. The escalation of concentrations is provided inAdditional file 1: Supplemental methods. After incubationfor 72 h, 20 μL of CellTiter 96® AQueous Non-RadioactiveCell Proliferation Assay solution (Promega Corporation,Madison, WI, USA) was added to each well. Plates wereread in a Safire2 plate reader (Tecan AG, Switzerland).Cytotoxicity was assessed by plotting cell survival versusdrug concentration (on a log scale).The p values in Fig. 4 were calculated using a two-tailed
unpaired t-test. The normality assumption for t-tests wasevaluated using the Cramer-von Mises test [89] (seeAdditional file 1 for more details and Additional file 4 forresults of this test).
Additional files
Additional file 1: Supplemental methods and supplemental figures.(DOCX 22058 kb)
Additional file 2: The performance comparison of drug sensitivityprediction based on ProGENI versus several baseline methods using theLCL dataset. (XLSX 57 kb)
Additional file 3: The performance comparison of drug sensitivityprediction based on ProGENI versus several baseline methods using theGDSC dataset. (XLSX 92 kb)
Additional file 4: The literature evidence for the role of the top 15genes identified for cisplatin, docetaxel, and doxorubicin in drugsensitivity. Also includes mRNA expression of the genes used inexperimental validations, the IC50 values of each test, and the results oftest of normality in two cell lines. (XLSX 52 kb)
Emad et al. Genome Biology (2017) 18:153 Page 18 of 21

Additional file 5: List of 137 genes that were among the top 500Robust-ProGENI-identified genes for at least 40 (over a quarter of 139studied) treatments in the GDSC dataset (sheet 1). Also includespathway and Gene Ontology enrichment analysis results of this set(sheet 2). (XLSX 126 kb)
Additional file 6: List of genes and drugs in each biclustercorresponding to Fig. 4. Also includes pathway enrichment analysisresults of each of these biclusters. (XLSX 92 kb)
Additional file 7: The drug sensitivity prediction obtained usingProGENI with different types of network and variations of ProGENI.(XLSX 65 kb)
Additional file 8: The intersection of the top 500 genes identified forany pair of drugs using ProGENI (or Pearson correlation scheme),averaged over 100 repeats of this procedure based on the LCL dataset.(XLSX 87 kb)
AcknowledgementsThis work was also supported by the Mayo Clinic Center for IndividualizedMedicine (CIM).
FundingThis research was supported by grant 1U54GM114838 awarded by NIGMSthrough funds provided by the trans-NIH Big Data to Knowledge (BD2K)initiative (https://commonfund.nih.gov/bd2k).
Availability of data and materialsWe obtained gene expression and drug response corresponding to the LCLdataset from [25, 26] (accessible through GEO with accession numberGSE24277). We obtained gene expression and drug response (IC50) data on624 CCLs from 13 different tissue origins and 139 cytotoxic drugs from theGenomics of Drug Sensitivity in Cancer (GDSC) database website (release-5.0)[28]. The STRING [27] network used in this study corresponds to“experimental” edges in the file http://version10.string-db.org/download/protein.links.detailed.v10/9606.protein.links.detailed.v10.txt.gz. The networkfrom BioGRID [71] corresponds to version 3.4.143 and was downloaded fromhttp://thebiogrid.org/downloads/archives/Latest%20Release/BIOGRID-ALL-LATEST.mitab.zip. The network from the DIP database [72] corresponds toversion dip20160731 and was downloaded from http://dip.doe-mbi.ucla.edu/dip/script/files/2016/tab25/dip20160731.txt. Finally, the network from theIntAct database [73] was downloaded from ftp://ftp.ebi.ac.uk/pub/databases/intact/current/psimitab/intact.zip.An implementation of ProGENI and ProGENI-PCC in python, with appropriatedocumentation is freely available at https://github.com/KnowEnG/ProGENI(doi: 10.5281/zenodo.826444). ProGENI will also be available, along with theunderlying network, through the cloud-based analysis framework KnowEnG(https://knoweng.org/) upon publication.
Authors’ contributionsAE, SS, and LW conceived the study and designed the algorithm. AEimplemented the algorithm and performed the statistical analyses of thealgorithm. JC performed the siRNA knockdown experiments, and JC and KRKperformed related statistical tests. All authors contributed to the drafting ofthe manuscript and critical discussion of the results. All authors read andapproved the final manuscript.
Ethics approval and consent to participateNot applicable.
Competing interestsThe authors declare that they have no competing interests.
Publisher’s NoteSpringer Nature remains neutral with regard to jurisdictional claims inpublished maps and institutional affiliations.
Author details1Carl R. Woese Institute for Genomic Biology, University of Illinois atUrbana-Champaign, Urbana, IL 61801, USA. 2Department of MolecularPharmacology and Experimental Therapeutics, Gonda 19, Mayo Clinic
Rochester, 200, 1st St. SW, Rochester, MN 55905, USA. 3Department of HealthSciences Research, Mayo Clinic, Rochester, MN 55905, USA. 4Department ofComputer Science and Institute of Genomic Biology, University of Illinois atUrbana-Champaign, 2122 Siebel Center, 201N. Goodwin Ave, Urbana, IL61801, USA.
Received: 17 April 2017 Accepted: 18 July 2017
References1. Aerts S, Lambrechts D, Maity S, Van Loo P, Coessens B, De Smet F,
Tranchevent L-C, De Moor B, Marynen P, Hassan B. Gene prioritizationthrough genomic data fusion. Nat Biotechnol. 2006;24:537–44.
2. Rees MG, Seashore-Ludlow B, Cheah JH, Adams DJ, Price EV, Gill S, Javaid S,Coletti ME, Jones VL, Bodycombe NE. Correlating chemical sensitivityand basal gene expression reveals mechanism of action. Nat Chem Biol.2016;12:109–16.
3. Guo H, Dong J, Hu S, Cai X, Tang G, Dou J, Tian M, He F, Nie Y, Fan D.Biased random walk model for the prioritization of drug resistanceassociated proteins. Sci Rep. 2015;5:10857.
4. Emig D, Ivliev A, Pustovalova O, Lancashire L, Bureeva S, Nikolsky Y,Bessarabova M. Drug target prediction and repositioning using anintegrated network-based approach. PLoS One. 2013;8:e60618.
5. Isik Z, Baldow C, Cannistraci CV, Schroeder M. Drug target prioritization byperturbed gene expression and network information. Sci Rep. 2015;5:17417.
6. Costello JC, Heiser LM, Georgii E, Gönen M, Menden MP, Wang NJ,Bansal M, Hintsanen P, Khan SA, Mpindi J-P. A community effort toassess and improve drug sensitivity prediction algorithms. NatBiotechnol. 2014;32:1202–12.
7. Geeleher P, Cox NJ, Huang RS. Clinical drug response can be predictedusing baseline gene expression levels and in vitro drug sensitivity in celllines. Genome Biol. 2014;15:R47.
8. Scherf U, Ross DT, Waltham M, Smith LH, Lee JK, Tanabe L, Kohn KW,Reinhold WC, Myers TG, Andrews DT, et al. A gene expression database forthe molecular pharmacology of cancer. Nat Genet. 2000;24:236–44.
9. Mariadason JM, Arango D, Shi Q, Wilson AJ, Corner GA, Nicholas C, AranesMJ, Lesser M, Schwartz EL, Augenlicht LH. Gene expression profiling-basedprediction of response of colon carcinoma cells to 5-fluorouracil andcamptothecin. Cancer Res. 2003;63:8791–812.
10. Robert J, Vekris A, Pourquier P, Bonnet J. Predicting drug response based ongene expression. Crit Rev Oncol Hematol. 2004;51:205–27.
11. Bussey KJ, Chin K, Lababidi S, Reimers M, Reinhold WC, Kuo WL, Gwadry F,Ajay K-MH, Fridlyand J, et al. Integrating data on DNA copy number withgene expression levels and drug sensitivities in the NCI-60 cell line panel.Mol Cancer Ther. 2006;5:853–67.
12. Barretina J, Caponigro G, Stransky N, Venkatesan K, Margolin AA, Kim S,Wilson CJ, Lehar J, Kryukov GV, Sonkin D, et al. The Cancer Cell LineEncyclopedia enables predictive modelling of anticancer drug sensitivity.Nature. 2012;483:603–7.
13. Basu A, Bodycombe NE, Cheah JH, Price EV, Liu K, Schaefer GI, Ebright RY,Stewart ML, Ito D, Wang S, et al. An interactive resource to identify cancergenetic and lineage dependencies targeted by small molecules. Cell. 2013;154:1151–61.
14. Garnett MJ, Edelman EJ, Heidorn SJ, Greenman CD, Dastur A, Lau KW,Greninger P, Thompson IR, Luo X, Soares J, et al. Systematic identification ofgenomic markers of drug sensitivity in cancer cells. Nature. 2012;483:570–5.
15. Iorio F, Knijnenburg TA, Vis DJ, Bignell GR, Menden MP, Schubert M, AbenN, Goncalves E, Barthorpe S, Lightfoot H, et al. A landscape ofpharmacogenomic interactions in cancer. Cell. 2016;166:740–54.
16. Liu X, Yang J, Zhang Y, Fang Y, Wang F, Wang J, Zheng X, Yang J. Asystematic study on drug-response associated genes using baseline geneexpressions of the Cancer Cell Line Encyclopedia. Sci Rep. 2016;6:22811.
17. Morrison JL, Breitling R, Higham DJ, Gilbert DR. GeneRank: using searchengine technology for the analysis of microarray experiments. BMCbioinformatics. 2005;6:233.
18. Kotlyar M, Fortney K, Jurisica I. Network-based characterization of drug-regulated genes, drug targets, and toxicity. Methods. 2012;57:499–507.
19. Chen X, Jiang W, Wang Q, Huang T, Wang P, Li Y, Chen X, Lv Y, Li X.Systematically characterizing and prioritizing chemosensitivity related genebased on Gene Ontology and protein interaction network. BMC MedGenomics. 2012;5:43.
Emad et al. Genome Biology (2017) 18:153 Page 19 of 21

20. Palmer AC. Chemical probes: the many genes of drug mechanism. NatChem Biol. 2016;12:57–8.
21. Chen T, Pengetnze Y, Taylor CC. Src inhibition enhances paclitaxelcytotoxicity in ovarian cancer cells by caspase-9-independent activation ofcaspase-3. Mol Cancer Ther. 2005;4:217–24.
22. Le XF, Bast Jr RC. Src family kinases and paclitaxel sensitivity. Cancer BiolTher. 2011;12:260–9.
23. Hofree M, Shen JP, Carter H, Gross A, Ideker T. Network-based stratificationof tumor mutations. Nat Methods. 2013;10:1108–15.
24. Cho H, Berger B, Peng J. Diffusion component analysis: unravelingfunctional topology in biological networks. In: Przytycka TM, editor.Research in Computational Molecular Biology: 19th Annual InternationalConference, RECOMB 2015, Warsaw, Poland, April 12-15, 2015, Proceedings.Springer; 2015. p. 62–4.
25. Niu N, Qin Y, Fridley BL, Hou J, Kalari KR, Zhu M, Wu TY, Jenkins GD, BatzlerA, Wang L. Radiation pharmacogenomics: a genome-wide associationapproach to identify radiation response biomarkers using humanlymphoblastoid cell lines. Genome Res. 2010;20:1482–92.
26. Hanson C, Cairns J, Wang L, Sinha S. Computational discovery of transcriptionfactors associated with drug response. Pharmacogenomics J. 2015;16:573–82.
27. Szklarczyk D, Franceschini A, Wyder S, Forslund K, Heller D, Huerta-Cepas J,Simonovic M, Roth A, Santos A, Tsafou KP, et al. STRING v10: protein-proteininteraction networks, integrated over the tree of life. Nucleic Acids Res.2015;43:D447–452.
28. Yang W, Soares J, Greninger P, Edelman EJ, Lightfoot H, Forbes S, Bindal N,Beare D, Smith JA, Thompson IR, et al. Genomics of Drug Sensitivity inCancer (GDSC): a resource for therapeutic biomarker discovery in cancercells. Nucleic Acids Res. 2013;41:D955–61.
29. Shang X, Lin X, Manorek G, Howell SB. Claudin-3 and claudin-4 regulatesensitivity to cisplatin by controlling expression of the copper and cisplatininflux transporter CTR1. Mol Pharmacol. 2013;83:85–94.
30. Laios A, Mohamed BM, Kelly L, Flavin R, Finn S, McEvoy L, Gallagher M, Martin C,Sheils O, Ring M, et al. Pre-treatment of platinum resistant ovarian cancer cellswith an MMP-9/MMP-2 inhibitor prior to cisplatin enhances cytotoxicity asdetermined by high content screening. Int J Mol Sci. 2013;14:2085–103.
31. Derry WB, Wilson L, Khan IA, Luduena RF, Jordan MA. Taxol differentiallymodulates the dynamics of microtubules assembled from unfractionatedand purified beta-tubulin isotypes. Biochemistry. 1997;36:3554–62.
32. Park JH, Kim KP, Ko JJ, Park KS. PI3K/Akt/mTOR activation by suppression ofELK3 mediates chemosensitivity of MDA-MB-231 cells to doxorubicin byinhibiting autophagy. Biochem Biophys Res Commun. 2016;477:277–82.
33. Song S, Honjo S, Jin J, Chang SS, Scott AW, Chen Q, Kalhor N, Correa AM,Hofstetter WL, Albarracin CT, et al. The Hippo coactivator YAP1 mediatesEGFR overexpression and confers chemoresistance in esophageal cancer.Clin Cancer Res. 2015;21:2580–90.
34. Orchel J, Witek L, Kimsa M, Strzalka-Mrozik B, Kimsa M, Olejek A, Mazurek U.Expression patterns of kinin-dependent genes in endometrial cancer. Int JGynecol Cancer. 2012;22:937–44.
35. Johnston IM, Spence HJ, Winnie JN, McGarry L, Vass JK, Meagher L,Stapleton G, Ozanne BW. Regulation of a multigenic invasion programmeby the transcription factor, AP-1: re-expression of a down-regulated gene,TSC-36, inhibits invasion. Oncogene. 2000;19:5348–58.
36. Reddy SP, Britto R, Vinnakota K, Aparna H, Sreepathi HK, Thota B, Kumari A,Shilpa B, Vrinda M, Umesh S. Novel glioblastoma markers with diagnosticand prognostic value identified through transcriptome analysis. Clin CancerRes. 2008;14:2978–87.
37. Trojan L, Schaaf A, Steidler A, Haak M, Thalmann G, Knoll T, Gretz N, Alken P,Michel MS. Identification of metastasis-associated genes in prostate cancerby genetic profiling of human prostate cancer cell lines. Anticancer Res.2005;25:183–91.
38. Ioannou MS, Bell ES, Girard M, Chaineau M, Hamlin JN, Daubaras M,Monast A, Park M, Hodgson L, McPherson PS. DENND2B activates Rab13at the leading edge of migrating cells and promotes metastaticbehavior. J Cell Biol. 2015;208:629–48.
39. Di Maira G, Brustolon F, Tosoni K, Belli S, Krämer SD, Pinna LA, Ruzzene M.Comparative analysis of CK2 expression and function in tumor cell linesdisplaying sensitivity versus resistance to chemical induced apoptosis. MolCell Biochem. 2008;316:155–61.
40. Zanin S, Borgo C, Girardi C, O’Brien SE, Miyata Y, Pinna LA, Donella-Deana A,Ruzzene M. Effects of the CK2 inhibitors CX-4945 and CX-5011 on drug-resistant cells. PLoS One. 2012;7:e49193.
41. Sandholt IS, Olsen BB, Guerra B, Issinger O-G. Resorufin: a lead for a newprotein kinase CK2 inhibitor. Anti-Cancer Drugs. 2009;20:238–48.
42. Stolarczyk EI, Reiling CJ, Pickin KA, Coppage R, Knecht MR, Paumi CM.Casein kinase 2α regulates multidrug resistance-associated protein 1function via phosphorylation of Thr249. Mol Pharmacol. 2012;82:488–99.
43. Tubi LQ, Gurrieri C, Brancalion A, Bonaldi L, Bertorelle R, Manni S, Pavan L,Lessi F, Zambello R, Trentin L. Inhibition of protein kinase CK2 with theclinical-grade small ATP-competitive compound CX-4945 or by RNAinterference unveils its role in acute myeloid leukemia cell survival, p53-dependent apoptosis and daunorubicin-induced cytotoxicity. J HematolOncol. 2013;6:1.
44. Daugaard M, Kirkegaard-Sørensen T, Ostenfeld MS, Aaboe M, Høyer-Hansen M,Ørntoft TF, Rohde M, Jäättelä M. Lens epithelium-derived growth factor is anHsp70-2 regulated guardian of lysosomal stability in human cancer. CancerRes. 2007;67:2559–67.
45. Jean D, Tellez C, Huang S, Davis DW, Bruns CJ, McConkey DJ, Hinrichs SH, Bar-Eli M. Inhibition of tumor growth and metastasis of human melanoma byintracellular anti-ATF-1 single chain Fv fragment. Oncogene. 2000;19:2721–30.
46. Cheeseman IM, Chappie JS, Wilson-Kubalek EM, Desai A. The conservedKMN network constitutes the core microtubule-binding site of thekinetochore. Cell. 2006;127:983–97.
47. da Huang W, Sherman BT, Lempicki RA. Bioinformatics enrichment tools:paths toward the comprehensive functional analysis of large gene lists.Nucleic Acids Res. 2009;37:1–13.
48. Milosavljevic N, Blanchard A, Wahl ML, Harguindey S, Poet M, Counillon L,Rauch C. Teaching new dogs old tricks: membrane biophysicalproperties in drug delivery and resistance. Recent Pat Anticancer DrugDiscov. 2011;6:334–46.
49. Ferreira RJ, dos Santos DJ, Ferreira MJ. P-glycoprotein and membrane rolesin multidrug resistance. Future Med Chem. 2015;7:929–46.
50. Yu DD, Wu Y, Shen HY, Lv MM, Chen WX, Zhang XH, Zhong SL, Tang JH,Zhao JH. Exosomes in development, metastasis and drug resistance ofbreast cancer. Cancer Sci. 2015;106:959–64.
51. Eke I, Cordes N. Focal adhesion signaling and therapy resistance in cancer.Semin Cancer Biol. 2015;31:65–75.
52. Seguin L, Desgrosellier JS, Weis SM, Cheresh DA. Integrins and cancer:regulators of cancer stemness, metastasis, and drug resistance. Trends CellBiol. 2015;25:234–40.
53. Keuling AM, Andrew SE, Tron VA. Inhibition of p38 MAPK enhances ABT-737-induced cell death in melanoma cell lines: novel regulation of PUMA.Pigment Cell Melanoma Res. 2010;23:430–40.
54. Du JH, Xu N, Song Y, Xu M, Lu ZZ, Han C, Zhang YY. AICAR stimulates IL-6production via p38 MAPK in cardiac fibroblasts in adult mice: a possible rolefor AMPK. Biochem Biophys Res Commun. 2005;337:1139–44.
55. Yu Z, Xing Y. atRA-induced apoptosis of mouse embryonic palatemesenchymal cells involves activation of MAPK pathway. Toxicol ApplPharmacol. 2006;215:57–63.
56. Terakawa T, Miyake H, Kumano M, Sakai I, Fujisawa M. The antiandrogenbicalutamide activates the androgen receptor (AR) with a mutation incodon 741 through the mitogen activated protein kinase (MARK) pathwayin human prostate cancer PC3 cells. Oncol Rep. 2010;24:1395–9.
57. Menges CW, Sementino E, Talarchek J, Xu J, Chernoff J, Peterson JR, TestaJR. Group I p21-activated kinases (PAKs) promote tumor cell proliferationand survival through the AKT1 and Raf–MAPK pathways. Mol Cancer Res.2012;10:1178–88.
58. Mendy D, Gaidarova S, Brady H, Lopez-Girona A. Lenalidomide treatmentinterferes with Ras/MAPK activation and induces apoptosis in multiplemyeloma. Cancer Res. 2009;69:1266.
59. Kim YJ, Song M, Ryu JC. Inflammation in methotrexate-induced pulmonarytoxicity occurs via the p38 MAPK pathway. Toxicology. 2009;256:183–90.
60. Konig H, Holtz M, Modi H, Manley P, Holyoake T, Forman S, Bhatia R.Enhanced BCR-ABL kinase inhibition does not result in increased inhibitionof downstream signaling pathways or increased growth suppression in CMLprogenitors. Leukemia. 2008;22:748–55.
61. Farooq A, Plotnikova O, Chaturvedi G, Yan S, Zeng L, Zhang Q, Zhou MM.Solution structure of the MAPK phosphatase PAC-1 catalytic domain.Insights into substrate-induced enzymatic activation of MKP. Structure.2003;11:155–64.
62. Uehara N, Kanematsu S, Miki H, Yoshizawa K, Tsubura A. Requirement ofp38 MAPK for a cell-death pathway triggered by vorinostat in MDA-MB-231human breast cancer cells. Cancer Lett. 2012;315:112–21.
Emad et al. Genome Biology (2017) 18:153 Page 20 of 21

63. Wishart DS, Knox C, Guo AC, Shrivastava S, Hassanali M, Stothard P, ChangZ, Woolsey J. DrugBank: a comprehensive resource for in silico drugdiscovery and exploration. Nucleic Acids Res. 2006;34:D668–72.
64. Zhang Q, Major MB, Takanashi S, Camp ND, Nishiya N, Peters EC,Ginsberg MH, Jian X, Randazzo PA, Schultz PG, et al. Small-moleculesynergist of the Wnt/beta-catenin signaling pathway. Proc Natl Acad SciU S A. 2007;104:7444–8.
65. Vangipuram SD, Buck SA, Lyman WD. Wnt pathway activity conferschemoresistance to cancer stem-like cells in a neuroblastoma cell line.Tumour Biol. 2012;33:2173–83.
66. Thiago LS, Costa ES, Lopes DV, Otazu IB, Nowill AE, Mendes FA, Portilho DM,Abreu JG, Mermelstein CS, Orfao A, et al. The Wnt signaling pathwayregulates Nalm-16 b-cell precursor acute lymphoblastic leukemic cell linesurvival and etoposide resistance. Biomed Pharmacother. 2010;64:63–72.
67. Baryawno N, Sveinbjornsson B, Eksborg S, Chen CS, Kogner P, Johnsen JI.Small-molecule inhibitors of phosphatidylinositol 3-kinase/Akt signalinginhibit Wnt/beta-catenin pathway cross-talk and suppress medulloblastomagrowth. Cancer Res. 2010;70:266–76.
68. Lu D, Choi MY, Yu J, Castro JE, Kipps TJ, Carson DA. Salinomycin inhibitsWnt signaling and selectively induces apoptosis in chronic lymphocyticleukemia cells. Proc Natl Acad Sci U S A. 2011;108:13253–7.
69. Termglinchan V, Wanichnopparat W, Suwanwongse K, Teeyapant C,Chatpermporn K, Leerunyakul K, Chuadpia K, Sirimaneethum O,Wijitworawong P, Mutirangura W, et al. Candidate cancer-targeting agentsidentified by expression-profiling arrays. Onco Targets Ther. 2013;6:447–58.
70. Jaffee BD, Manos EJ, Collins RJ, Czerniak PM, Favata MF, Magolda RL,Scherle PA, Trzaskos JM. Inhibition of MAP kinase kinase (MEK) results inan anti-inflammatory response in vivo. Biochem Biophys Res Commun.2000;268:647–51.
71. Chatr-aryamontri A, Oughtred R, Boucher L, Rust J, Chang C, Kolas NK,O’Donnell L, et al. The BioGRID interaction database: 2017 update. NucleicAcids Res. 2017;45(D1):D369–79.
72. Salwinski L, Miller CS, Smith AJ, Pettit FK, Bowie JU, Eisenberg D. Thedatabase of interacting proteins: 2004 update. Nucleic Acids Res. 2004;32:D449–51.
73. Kerrien S, Aranda B, Breuza L, Bridge A, Broackes-Carter F, Chen C, Duesbury M,et al. The IntAct molecular interaction database in 2012. Nucleic Acids Res.2011;40(D1):D841–6.
74. Masters JR. Human cancer cell lines: fact and fantasy. Nat Rev Mol Cell Biol.2000;1:233–6.
75. Gillis J, Pavlidis P. “Guilt by association” is the exception rather than the rulein gene networks. PLoS Comput Biol. 2012;8:e1002444.
76. Hansen CG, Nichols BJ. Exploring the caves: cavins, caveolins and caveolae.Trends Cell Biol. 2010;20:177–86.
77. Hehlgans S, Cordes N. Caveolin-1: an essential modulator of cancer cellradio-and chemoresistance. Am J Cancer Res. 2011;1:521–30.
78. Yi JS, Mun DG, Lee H, Park JS, Lee JW, Lee JS, Kim SJ, Cho BR, Lee SW, KoYG. PTRF/cavin-1 is essential for multidrug resistance in cancer cells. JProteome Res. 2013;12:605–14.
79. Kang J, Park JH, Lee HJ, Jo U, Park JK, Seo JH, Kim YH, Kim I, Park KH.Caveolin-1 modulates docetaxel-induced cell death in breast cancer cellsubtypes through different mechanisms. Cancer Res Treatment.2016;48:715–26.
80. Park JH, Kang JH, Jo UH, Gil EY, Park JK, Lee ES, Kim YH, Kim IS, Park KH.Caveolin-1 modulates docetaxel activity by inducing p53 expression inbreast cancer. Cancer Res. 2012;72:4895.
81. Zhang N, Wang H, Fang Y, Wang J, Zheng X, Liu XS. Predicting anticancerdrug responses using a dual-layer integrated cell line-drug network model.PLoS Comput Biol. 2015;11:e1004498.
82. Ding Z, Zu S, Gu J. Evaluating the molecule-based prediction of clinicaldrug responses in cancer. Bioinformatics. 2016;32(19):2891–5.
83. Haibe-Kains B, El-Hachem N, Birkbak NJ, Jin AC, Beck AH, Aerts HJ,Quackenbush J. Inconsistency in large pharmacogenomic studies. Nature.2013;504:389–93.
84. Hatzis C, Bedard PL, Birkbak NJ, Beck AH, Aerts HJ, Stem DF, Shi L, Clarke R,Quackenbush J, Haibe-Kains B. Enhancing reproducibility in cancer drugscreening: how do we move forward? Cancer Res. 2014;74:4016–23.
85. Gao H, Korn JM, Ferretti S, Monahan JE, Wang Y, Singh M, Zhang C,Schnell C, Yang G, Zhang Y. High-throughput screening usingpatient-derived tumor xenografts to predict clinical trial drug response.Nat Med. 2015;21:1318–25.
86. Bruna A, Rueda OM, Greenwood W, Batra AS, Callari M, Batra RN, PogrebniakK, Sandoval J, Cassidy JW, Tufegdzic-Vidakovic A. A biobank of breast cancerexplants with preserved intra-tumor heterogeneity to screen anticancercompounds. Cell. 2016;167:260–74. e222.
87. Tong HH, Faloutsos C, Pan JY. Fast random walk with restart and itsapplications. In: ICDM ’06: Sixth International Conference on Data Mining,Proceedings. Washington, DC: IEEE Computer Society; 2006. p. 613–22.
88. Sculley D. Rank aggregation for similar items. In: Apte C, Skillicorn D, Liu B,Parthasarathy S, editors. Proceedings of the 2007 SIAM InternationalConference on Data Mining. SIAM; 2007. p. 587–92.
89. Stephens MA. Tests based on EDF statistics. Goodness-of-fit Tech. 1986;68:97–193.
90. Shannon P, Markiel A, Ozier O, Baliga NS, Wang JT, Ramage D, Amin N,Schwikowski B, Ideker T. Cytoscape: a software environment for integratedmodels of biomolecular interaction networks. Genome Res. 2003;13:2498–504.
• We accept pre-submission inquiries
• Our selector tool helps you to find the most relevant journal
• We provide round the clock customer support
• Convenient online submission
• Thorough peer review
• Inclusion in PubMed and all major indexing services
• Maximum visibility for your research
Submit your manuscript atwww.biomedcentral.com/submit
Submit your next manuscript to BioMed Central and we will help you at every step:
Emad et al. Genome Biology (2017) 18:153 Page 21 of 21