knowing trends knowing trends helps you identify opportunities, design thorough strategy and compete...
Post on 20-Dec-2015
217 views
TRANSCRIPT
EASTERN EUROPE &
How to best approach this market
Samuel Vetrak, CEOStudentMarketing Ltd
May 2nd, 2011
---------------------------------------------------------------------With special attention to K-12 sector

How to best approach Eastern Europe
Knowing trends helps you identify opportunities,
design thorough strategy and compete successfully.
Good marketing decisions guided by market research
lead to 25% - 50% increase in revenues within 3 years.
Sources: D.Smith , J.H. Fletcher: The Art & Science of Interpreting Market Research Evidence
Research and development:

Outline
K-12 global student mobility
Eastern Europe
Agent market
How to best approach this market
How to best approach Eastern Europe

Definition of K-12
Is a designation for the sum of primary and secondary education. Internationally, it is often
understood as educational travel. The expression K-12 is a shortening of Kindergarten
through 12th grade (16-19 years old). It is often used in USA, Canada and Australia.
Statistically, K-12 global international student mobility is measured on secondary level only
or data for primary level are not measured separately.
Source: Macmillan Dictionary, CAPS-I, Australian Human Rights Commission, Whatis.com
K-12 global student mobility

23%
58%
71%
22%
32%
29%
31%
10 YTD Increase in % of change
2000 2001 2002 2003 2004 2005 2006 2007 2008 200980
90
100
110
120
130
140
150
160
170
180
K12
Language Travel
Study Abroad
Work Experience
Adventure Travel
Other - Group
Other - FIT
Percentage of change in the youth travel sectors
Sources: UNESCO, LTM, OECD, CAPS-I, CSIET, Citizenship and immigration Canada, Ministry of Education NZ, British Boarding Schools, Australian Education International
K-12 global student mobility
K-12 sector has not been affected by ecomonic downturn as much as some other sectors.
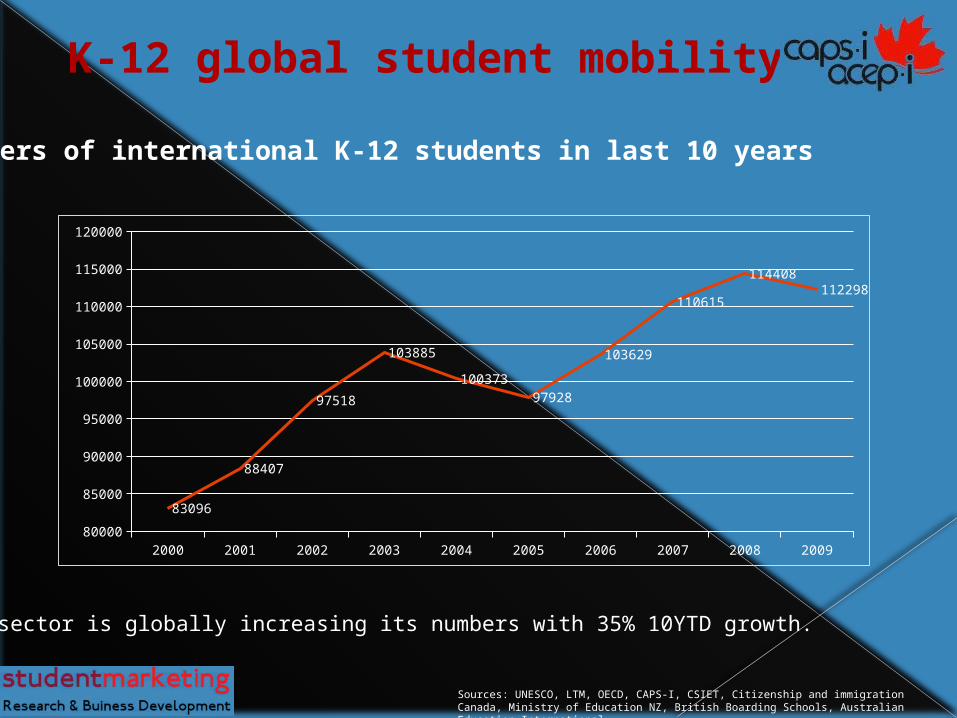
Numbers of international K-12 students in last 10 years
Sources: UNESCO, LTM, OECD, CAPS-I, CSIET, Citizenship and immigration Canada, Ministry of Education NZ, British Boarding Schools, Australian Education International
K-12 global student mobility
K-12 sector is globally increasing its numbers with 35% 10YTD growth.
2000 2001 2002 2003 2004 2005 2006 2007 2008 200980000
85000
90000
95000
100000
105000
110000
115000
120000
83096
88407
97518
103885
10037397928
103629
110615
114408112298

Sources: UNESCO, LTM, OECD, CAPS-I, CSIET, Citizenship and immigration Canada, Ministry of Education NZ, British Boarding Schools, Australian Education International & extrapolated data
2009USA 25%
Australia 24,5%UK 19%
Canada 16%New Zealand 15%
2008USA 25%
Australia 24%UK 18%
Canada 17%New Zealand 14,5%
Numbers of international K-12 students by receiving destinations
K-12 global student mobility
Total number of international K-12 students is estimated to be above 120,000.
USA
Australia
United Kingdom
Canada
New Zealand
0 5000 10000 15000 20000 25000 30000
27924
27506
21533
18319
17016
29004
28313
20545
19910
166362008
2009

Market shares in K-12*
Canada is one of the strongest K-12 destinations, but its market share is decreasing (1.9% in 3 years).
K-12 global student mobility
Sources: UNESCO, LTM, OECD, CAPS-I, CSIET, Citizenship and immigration Canada, Ministry of Education NZ, British Boarding Schools, Australian Education International & extrapolated data
* Calculated from total number of major international K-12 destinations where data available (2009).
USA Australia United Kingdom Canada New Zealand0.0%
5.0%
10.0%
15.0%
20.0%
25.0%
24.8% 24.5%
19.2%
16.3%15.2%
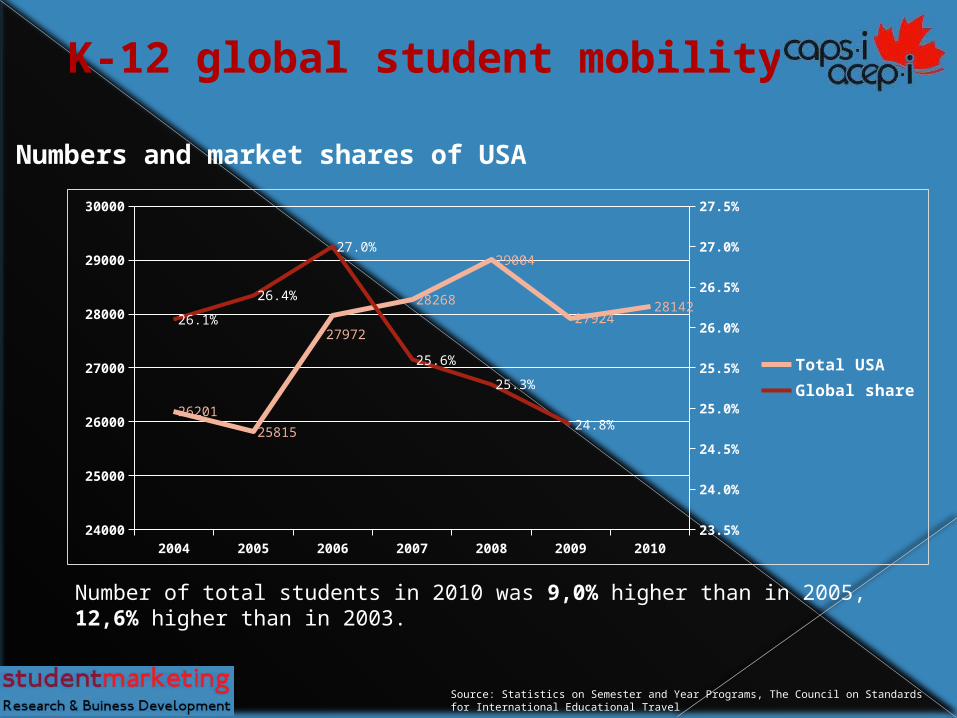
Number of total students in 2010 was 9,0% higher than in 2005, 12,6% higher than in 2003.
Source: Statistics on Semester and Year Programs, The Council on Standards for International Educational Travel
2004 2005 2006 2007 2008 2009 201024000
25000
26000
27000
28000
29000
30000
23.5%
24.0%
24.5%
25.0%
25.5%
26.0%
26.5%
27.0%
27.5%
26201
25815
27972
28268
29004
2792428142
26.1%
26.4%
27.0%
25.6%
25.3%
24.8%
Total USAGlobal share
K-12 global student mobility
Numbers and market shares of USA

Sources: Australian Education International
Number of total students in 2009 was 9,6% higher than in 2005.
2002 2003 2004 2005 2006 2007 2008 200920000
21000
22000
23000
24000
25000
26000
27000
28000
29000
22.0%
23.0%
24.0%
25.0%
26.0%
27.0%
28.0%
23224
2694727312
2509524471
26782
28313
27506
23.8%
26.0%
27.2%
25.6%
23.6%
24.2%
24.7%24.5%
Total studentsGlobal share
K-12 global student mobility
Numbers and market shares of Australia
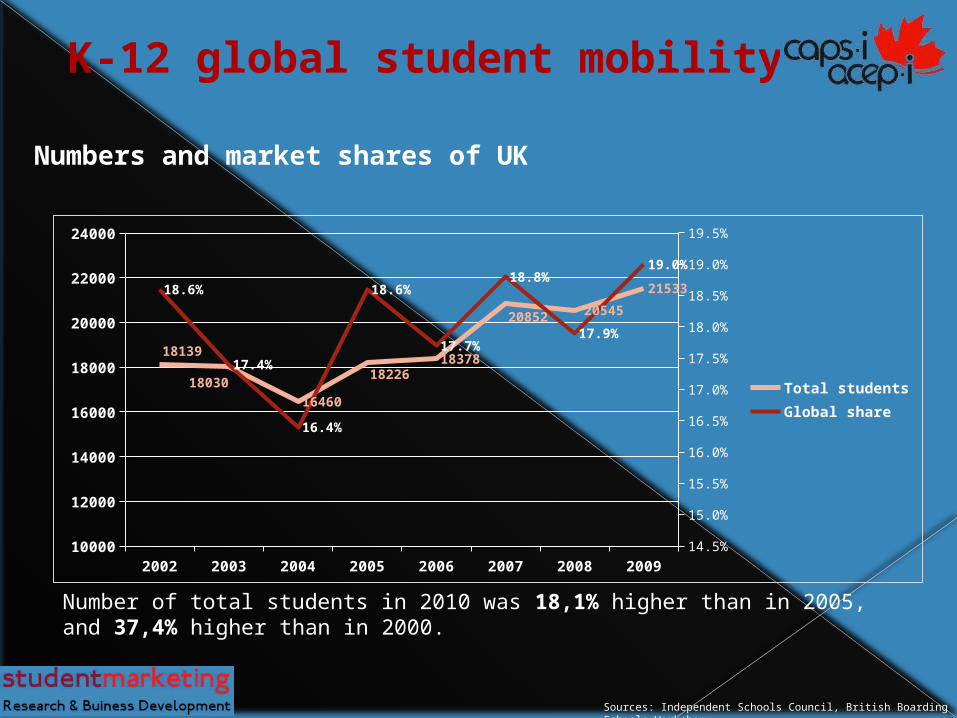
Numbers and market shares of UK
Sources: Independent Schools Council, British Boarding Schools Workshop
Number of total students in 2010 was 18,1% higher than in 2005, and 37,4% higher than in 2000.
2002 2003 2004 2005 2006 2007 2008 200910000
12000
14000
16000
18000
20000
22000
24000
14.5%
15.0%
15.5%
16.0%
16.5%
17.0%
17.5%
18.0%
18.5%
19.0%
19.5%
18139
1803016460
1822618378
20852 20545
2153318.6%
17.4%
16.4%
18.6%
17.7%
18.8%
17.9%
19.0%
Total studentsGlobal share
K-12 global student mobility

Sources: Ministry of Education of New Zealand
Number of total students in 2010 was 52,1% higher than in 2005, and 19,5% higher than in 2002.
2002 2003 2004 2005 2006 2007 2008 2009 201010000
11000
12000
13000
14000
15000
16000
17000
18000
19000
10.0%
11.0%
12.0%
13.0%
14.0%
15.0%
16.0%
17.0%
18.0%
15259
17448
14477
11984
13933
15207
1663617016
18228
15.6%
16.8%
14.4%
12.2%
13.4%13.7%
14.5%
15.2%
Total students NZGlobal share
K-12 global student mobility
Numbers and market shares of New Zealand

Source: Citizenship and Immigration Canada, CAPS-I & extrapolated data
Number of total sutdents in 2009 was 8,9% higher than in 2005, and 5,5% higher than in 2000.
2002 2003 2004 2005 2006 2007 2008 200910000
12000
14000
16000
18000
20000
22000
15.0%
15.5%
16.0%
16.5%
17.0%
17.5%
18.0%
18.5%
17366
15941
15923 16808
1887519506
19910
18319
17.8%
15.4%
15.8%
17.2%
18.2%
17.6%17.4%
16.3%
Total studentsGlobal share
K-12 global student mobility
Numbers and market shares of Canada

K-12 mobility and market shares in last 10 years
Sources: UNESCO, LTM, OECD, CAPS-I, CSIET, Citizenship and immigration Canada, Ministry of Education NZ, British Boarding Schools, Australian Education International
K-12 global student mobility
K-12 sector is globally increasing its numbers, whereas Canada‘s market share is decreasing.
Overall revenues generated internationally in K-12 sector are estimated to be cca 1.5 bn.
2001 2002 2003 2004 2005 2006 2007 2008 20090
20000
40000
60000
80000
100000
120000
140000
New Zealand
Canada
UK
Australia
USA
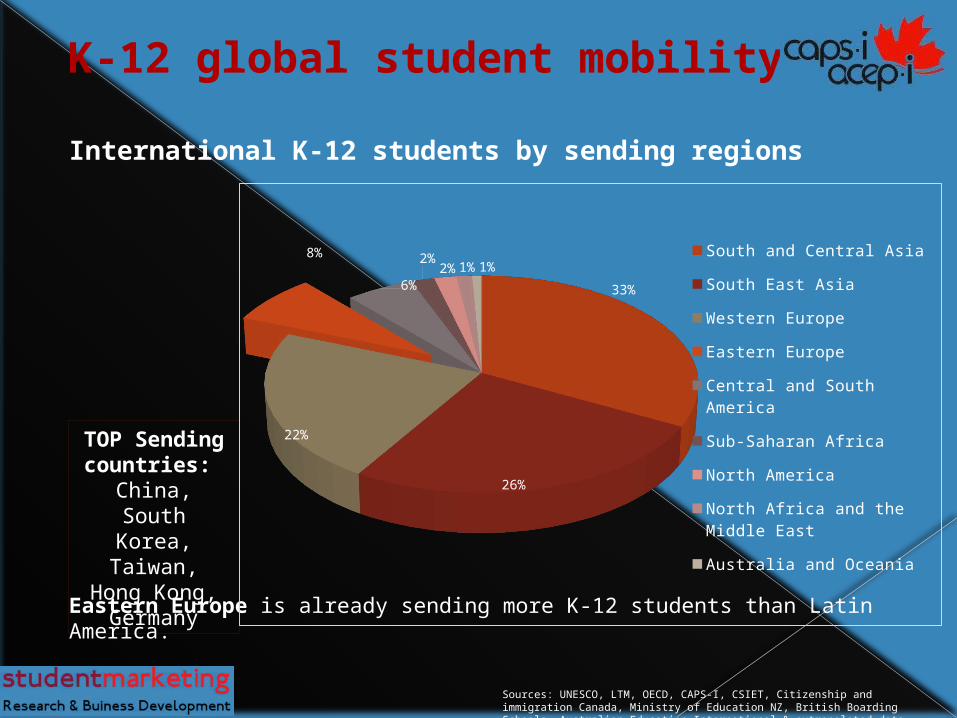
TOP Sending countries:
China, South Korea, Taiwan,
Hong Kong, Germany
Eastern Europe is already sending more K-12 students than Latin America.
Sources: UNESCO, LTM, OECD, CAPS-I, CSIET, Citizenship and immigration Canada, Ministry of Education NZ, British Boarding Schools, Australian Education International & extrapolated data
International K-12 students by sending regions
K-12 global student mobility
33%
26%
22%
8%
6%
2% 2% 1% 1%South and Central Asia
South East Asia
Western Europe
Eastern Europe
Central and South America
Sub-Saharan Africa
North America
North Africa and the Middle East
Australia and Oceania

Conclusions
•K-12 represents cca 120.000 students & 1.5 bn (18.319 & 300m in Canada)
•K-12 sector is growing more steadily than other sectors
•Canada is not gaining as much as some other destination
•Canada’s market share is actually descreasing (1.9% in 3 years)
•Eastern Europe is already sending more K-12 students than Latin America
K-12 global student mobility

Eastern Europe

• Multinational diversified region
• Economically growing market
• Interest in English learning
• Increasing demand for education abroad
• Sending more K-12 students than Latin America
• Price sensitive
• Demand for USA/North America
• Agents are predominant booking channel
Eastern Europe
Market features
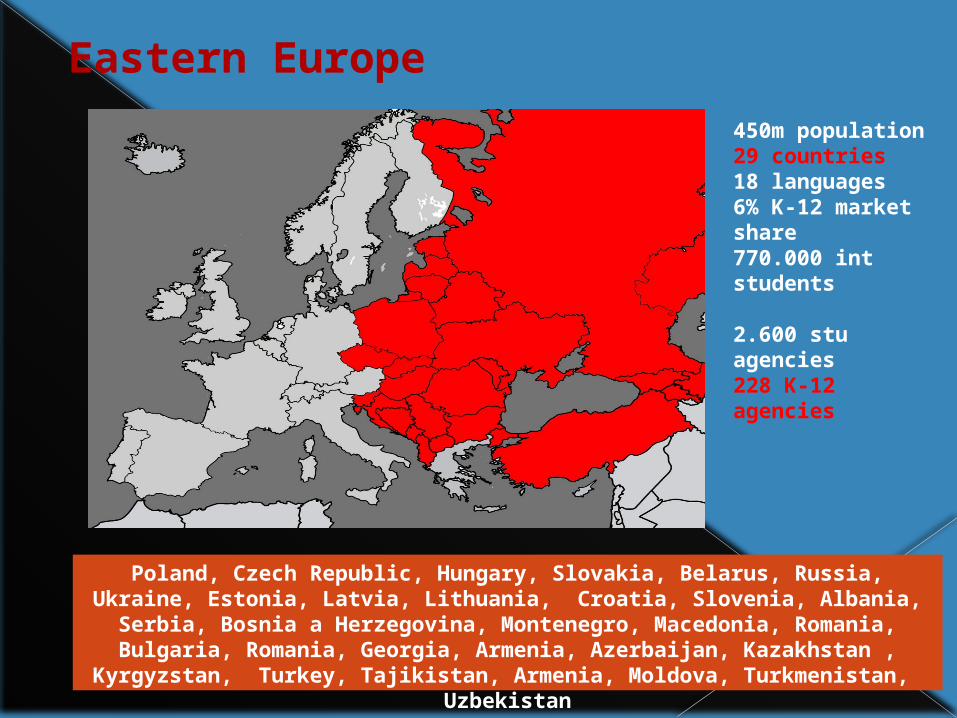
Poland, Czech Republic, Hungary, Slovakia, Belarus, Russia, Ukraine, Estonia, Latvia, Lithuania, Croatia, Slovenia, Albania, Serbia, Bosnia a Herzegovina, Montenegro, Macedonia, Romania, Bulgaria, Romania, Georgia, Armenia, Azerbaijan, Kazakhstan , Kyrgyzstan, Turkey, Tajikistan,
Armenia, Moldova, Turkmenistan, Uzbekistan
Eastern Europe
450m population29 countries18 languages6% K-12 market share770.000 int students
2.600 stu agencies228 K-12 agencies

Portugal
Greece
Italy
Sweden
Spain
France
Netherlands
Belgium
Finland
Austria
Germany
Norway
Swizerland
0 200 400 600 800 1000 1200 1400 1600 1800 2000
Eastern Europe Western Europe
Sources: Laborstats – ILO, 2010
TurkmenistanUzbekistan
UkraineBulgaria
KazakhstanRussia
RomaniaLatvia
HungaryTurkey
SlovakiaPoland
Czech RepublicCroatia
Slovenia
0 200 400 600 800 1000 1200 1400 1600 1800
Eastern Europe
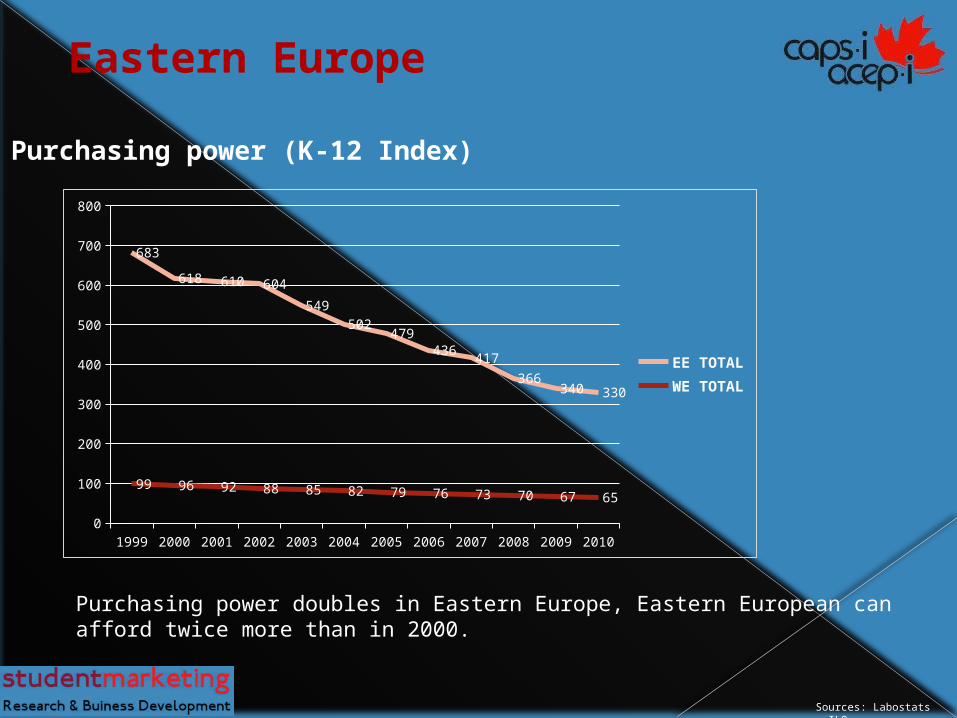
Purchasing power (K-12 Index) – sending countries
Similar to BigMac Index: number of working days one has to work for average wage to buy High School in Canada. The lower the column is, the stronger the buying power is.
Sources: Labostats - ILO
1999 2000 2001 2002 2003 2004 2005 2006 2007 2008 2009 20100
100
200
300
400
500
600
700
800
683
618 610 604
549502
479436 417
366340 330
99 96 92 88 85 82 79 76 73 70 67 65
EE TOTALWE TOTAL
Purchasing power doubles in Eastern Europe, Eastern European can afford twice more than in 2000.
Purchasing power (K-12 Index)
Eastern Europe

TOP 100 Most expensive cities in the world (Economist Intelligence Unit)
Source: Economist
4. London (UK)
.....
18. Sydney (Australia)
24. Melbourne (Australia)
28. New York (USA)
29. Manchester (UK)
34. Vancouver
36. Chicago (USA)
36. Montreal
39. Los Angeles (USA)
40. Perth (Australia)
41. Brisbane (Australia)
41. San Francisco (USA)
43. Toronto
44. Washington (USA)
Canadian destinations are more affordable than competitive destinations.
Eastern Europe

Eastern Europe
Market demand for education abroad
Market demand for education abroad is increasing in Eastern Europe, the region is becoming extremely important in the global student market and offers unique opportunity in upcoming years.
2000 20080
20000
40000
60000
80000
100000
120000
140000
160000
91000
146000
Language Travel
2004 2008270000
280000
290000
300000
310000
320000
330000
340000
350000
298000
350000Higher Education
2003 20090
1000
2000
3000
4000
5000
6000
7000
3104
6418
K-12

Eastern Europe
Demand for English in Europe (incl. Eastern Europe)
Eastern European countries increase their English knowledge faster then some in Western Europe.
ColombiaChina
Venezu
elaJap
an
Turke
y
Bulgaria
Hungary
Czech Rep
ublic Italy
Taiw
anSp
ain
Poland
Romania
Portuga
l
France
Lithuan
ia
Slova
kiaRussi
a
Argentina
Latvia
South Korea
Greece
Estonia
Croati
a
Austria
German
y
Slove
nia
Luxe
mbourg
Belgium
Finlan
d
Denmark
Malta
Netherl
ands
Swed
en0%
10%
20%
30%
40%
50%
60%
70%
80%
90%
100%
The increase is within young generation, their need and learn English more than their parents.

Eastern Europe is already sending more K-12 students than Latin America.
Sources: UNESCO, LTM, OECD, CAPS-I, CSIET, Citizenship and immigration Canada, Ministry of Education NZ, British Boarding Schools, Australian Education International & extrapolated data
International K-12 students by sending regions
33%
26%
22%
8%
6%
2% 2% 1% 1% South and Central Asia
South East Asia
Western Europe
Eastern Europe
Central and South America
Sub-Saharan Africa
North America
North Africa and the Middle East
Australia and Oceania
Eastern Europe

Australia
New Zealand
Canada
Ireland
France UK
USA
BelgiumBrazil
South Afric
a
Germany
Argentina0
5000
10000
15000
20000
25000
1430
5
1300
7
8614
1109
8
8364
1083
3
6592 75
21
7641
7152
3736
2105
1
1943
1
1685
9
1611
6
1559
4
1356
5
1369
0
1187
5
8243
8285
7667
Semester Year Abroad
(in CAD; ECB April 20th 2011)
Source: StudentMarketing 2011
Average prices in Eastern Europe (K-12 receiving destinations)
Eastern Europe
Price is an important factor for parents when making purchasing decisions.

Source: StudentMarketing 2011. On the basis of the offer of Eastern European agents. The prices are in average. They may vary due accommodation type (homestay/residence) and the school type (private/public).
(in CAD)
Australia Canada France USA UK SA
Semester (tuition, room, board) 14305 8614 8364 5829 10833 7641
Year (tuition, room, board) 21051 16859 15594 13690 13565 8243
Flight tickets (roundtrip) 1850 1122 227 924 269 1110
Visa fee 555 125 0-138 0 - 134 0 - 120 61
TOTAL 23456 18106 15821 14614 13834 9414
Average prices in Eastern Europe (K-12 receiving destinations)
Eastern Europe

Source: StudentMarketing 2011
Average prices in Europe (High School in Canada)
Eastern Europe
Western Europe Eastern Europe
Semester Public 13889 8042
YearPublic 21423 16552
Private 29255 23523
(in CAD)
Eastern Europe is still more price sensitive region than Western Europe (across sectors).
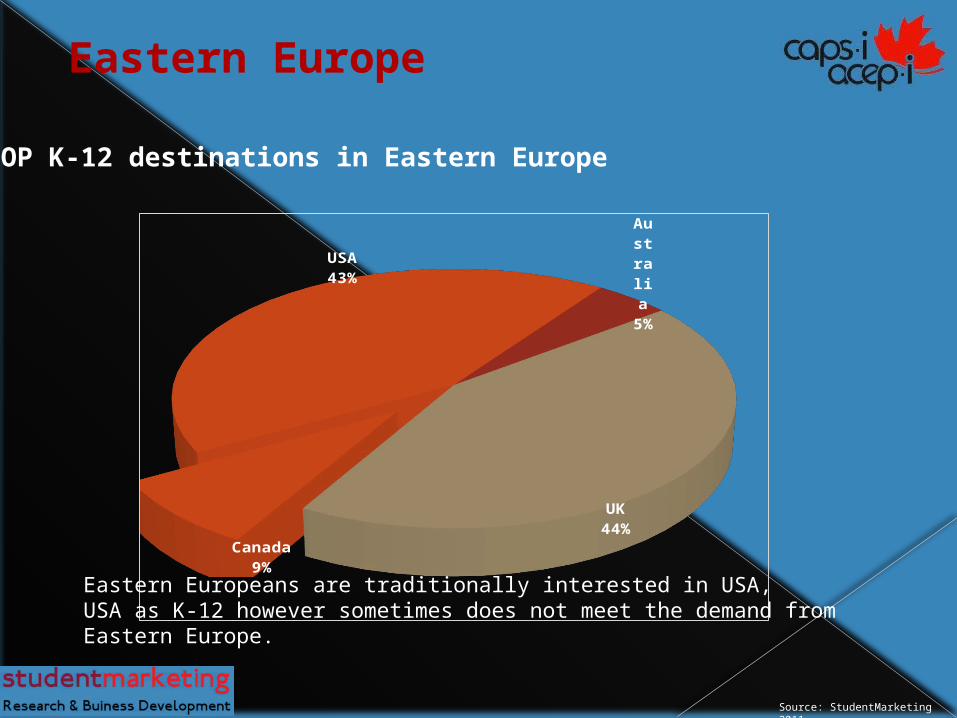
USA43%
Australi
a5%
UK44%
Canada9%
TOP K-12 destinations in Eastern Europe
Source: StudentMarketing 2011
Eastern Europe
Eastern Europeans are traditionally interested in USA, USA as K-12 however sometimes does not meet the demand from Eastern Europe.

Importance of agents
"Parents of prospective students often require the services of an agent to ensure they get exactly
what they are looking for. “In some of these countries,” asserts Declan Millar at High Schools
International, which places students in high schools in Ireland, the UK, Australia, the USA and
Canada, “clients do not have the expertise or experience to make good informed choices and
depend on agencies for this and for visa guidance. They also depend on local agents for
progression guidance to universities.”
Eastern Europe
Importance of agents
•Eastern Europe has similar booking habits to other markets
•Almost all K-12 bookings come from agents (industry experience, no data available)
•Trend similar to other junior levels in educational sectors (language, jugendreisen, etc.)
•Parents need agents due trust, orientation, paperwork, problemsolving, etc.
•Online shopping is not increasing in educational travel ama in other sectors
•Online presence however is important (cca 60-80% check before visiting stone office)
Eastern Europe
Conclusions
•Eastern Europe represents 29 countries (nationality mix)
•Eastern Europeans have now 2 times stronger purchasing power than in 2000
•Eastern Europe is growing and already sending more K-12 students than Latin America
•Canadian schools could gain from limited supply in USA
•Canadian schools could benefit from sensitive price strategy
•Canadian schools should approach agents as the most important channel
Eastern Europe

There are 29 countries and 2600 youth and student travel agents.
Agent market is maturing, but there are still mostly small agencies.
Average sending numbers per agent is 258.
Schools need to be prepared to work with several agencies in region.
To maintain effort and overheads, educators need to be selective what agents to work with.
Features of agents or how to qualify agencies:
- Age / Experience- Portfolio- Offices / Counsellors- Sending numbers- Price levels- Workshop attendance- Credentials / Association membership
Source: StudentMarketing 2011
Agents in Eastern Europe

Source: StudentMarketing 2011
Agents in Eastern Europe
Profile of agents by experience/age
Agent market is maturing, not so many new agencies, market is taken by old agencies who have made to buid their market position. These agencies are the best targets to make representatives.
1 to 5 5 to 10 10 to 15 15 to 20 20 to 30 30 to 40 40 to 50 50+0.0%
5.0%
10.0%
15.0%
20.0%
25.0%
30.0%
12.0%
24.5%25.7%
24.5%
9.6%
0.9% 0.6%1.8%

Profile of agents by portfolio (number of sectors they promote)
Source: StudentMarketing 2011
Agents in Eastern Europe
EE agents are more diversified, their promote more programs/sectors than agents in Western Europe or Asia. It is an attribute Canadian schools could use for their benefit.
1 2 3 4 5 6 70.0%
5.0%
10.0%
15.0%
20.0%
25.0%
30.0%
35.0%
40.0%
45.0%
6.3%
27.2%
41.4%
19.0%
3.3% 2.6%0.3%

Profile of agents by number of inter/national offices
Source: StudentMarketing 2011
Agents in Eastern Europe
EE agencies are usually small operations and have no more then 1 office. Canadian schools need to be prepared to work with several representatives in order to cover the region or countries like Russia.
1 2-3 4-5 1-5 6-10 11-15 15-20 20 +0.0%
10.0%
20.0%
30.0%
40.0%
50.0%
60.0%
70.0%
80.0%
57.2%
12.8%
4.2%
74.2%
3.7%1.2% 0.7% 1.1%
7.7%
2.2% 0.7%
10.5%
1.9% 0.3% 0.4% 0.8%
National offices
International Offices

1-10 10-50 50-100 100-200 200 and more0
5
10
15
20
25
30
35
40
31%
39%
9%13%
9%
Profile of agents by number of students administered by one employee
Source: StudentMarketing 2011
Most EE agents have qualified and sufficient personel to provide high level of consultancy and customer service the parents and youngsters require.
Agents in Eastern Europe

1-10 10-50 50-100 100-200 200 and more0%
5%
10%
15%
20%
25%
30%
35%
40%
6%
12%
28%
39%
15%
Profile of agents by number of students administered by one office
Source: StudentMarketing 2011
Agents in Eastern Europe
Most EE agents still offer in person customer service in their offices, it is also one of the reasons why the market is broken down to many small agencies.
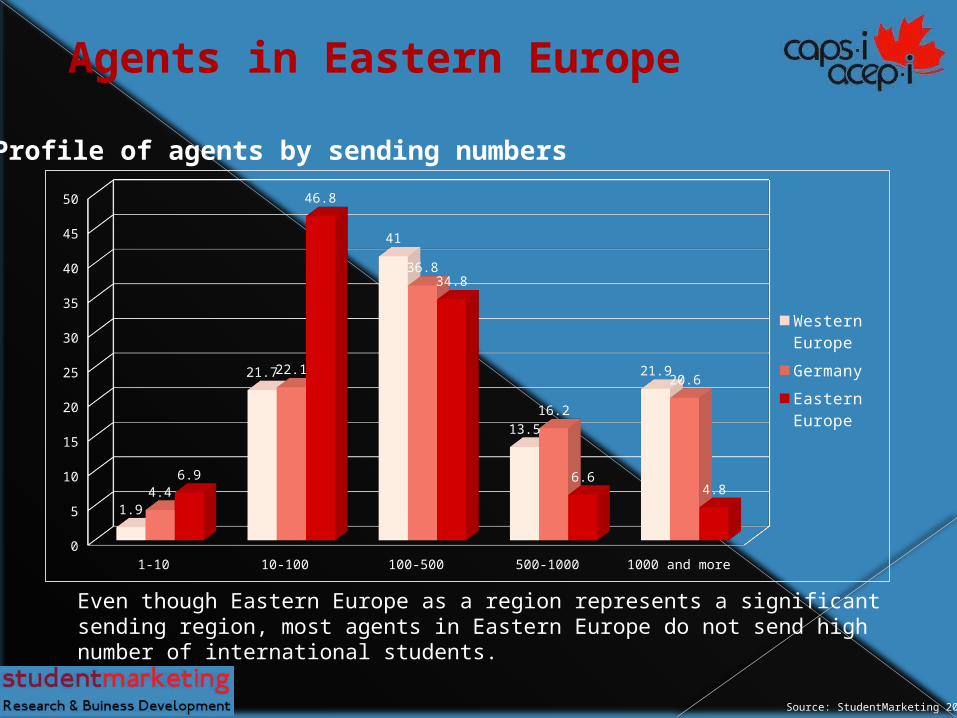
Profile of agents by sending numbers
Even though Eastern Europe as a region represents a significant sending region, most agents in Eastern Europe do not send high number of international students.
Source: StudentMarketing 2011
Agents in Eastern Europe
1-10 10-100 100-500 500-1000 1000 and more0
5
10
15
20
25
30
35
40
45
50
1.9
21.7
41
13.5
21.9
4.4
22.1
36.8
16.2
20.6
6.9
46.8
34.8
6.64.8
Western Europe
Germany
Eastern Europe

Profile of agents by price levels
There are various financialmethods in between educational institution and educational agency:
- Gross prices/Commission- Gross prices/Agency Fee- Net Prices - other
Eastern Europe is still very price sensitive and most agents need to adjust the price (only 25% of agencies promote they products for an average price).
below average over0.0%
5.0%
10.0%
15.0%
20.0%
25.0%
30.0%
35.0%
40.0%38.2%
25.5%
36.4%
Source: StudentMarketing 2011
Agents in Eastern Europe
Source: StudentMarketing 2011
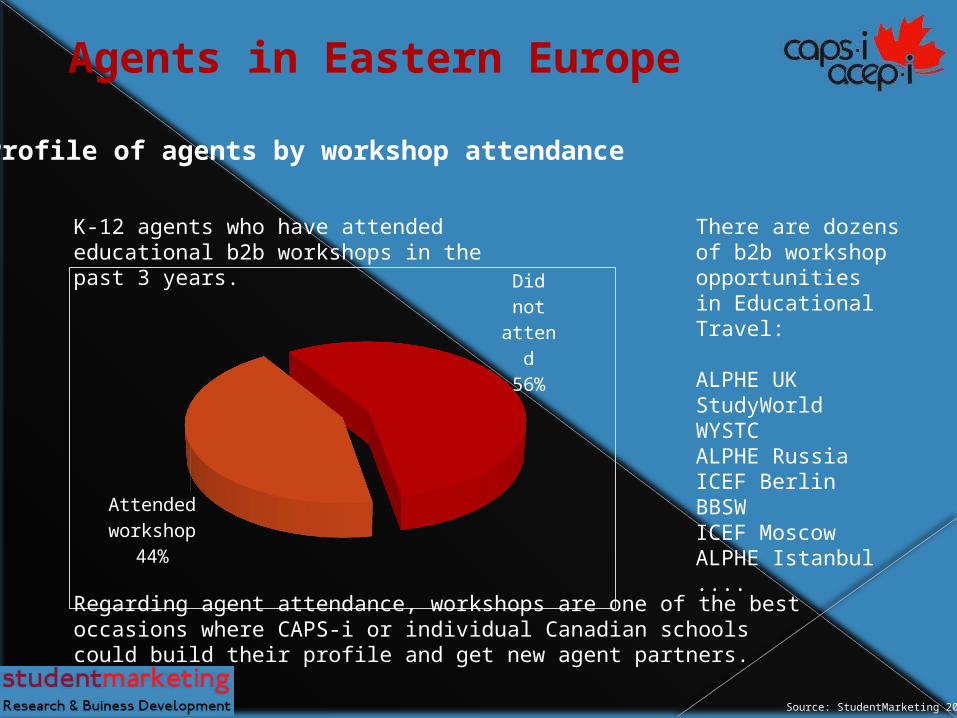
K-12 agents who have attended educational b2b workshops in the past 3 years.
Profile of agents by workshop attendance
Attended workshop
44%
Did not at-tend56%
Agents in Eastern Europe
There are dozens of b2b workshop opportunities in Educational Travel:
ALPHE UKStudyWorldWYSTCALPHE RussiaICEF BerlinBBSWICEF MoscowALPHE Istanbul....
Regarding agent attendance, workshops are one of the best occasions where CAPS-i or individual Canadian schools could build their profile and get new agent partners.

Source: StudentMarketing 2011
21%
79%
Member Not a member
Profile of agents by association membership
Agents in Eastern Europe
There are 110 agent associations worldwide, and dozens in Eastern Europe, that track quality of agencies:
•AREA•TEAG•UED
etc.
For CAPS-i or individual Canadian schools, agent associations represent a unique opportunity to increase their profile and open leads to new agent partners.
K-12 agents who are members of association.

BEST agents in Eastern Europe
Using previous understanding and profiling agents, identification of the most suitable quality agencies can be done as mentioned herein (sample picture only).
Source: StudentMarketing 2011
Agents in Eastern Europe

Conclusions
•Agent market is maturing, but still many small agencies in region
•2.600 agencies in 29 countries
•Educators need to be selective what agents to work with
•There are up to 20 criteria educators can consider
•228 K-12 agents and 800 edu agents (LT & HiEd) in Eastern Europe
•Selective approach enables educators to establish agent relationships effectively
Agents in Eastern Europe

Approach
•Educational value – emphasize academic value in comparison to other destinations
•Translations – to ease understanding for ultimate decision makers/parents
•Competitive price – individually by market
•Focus on agents – agents are predominant channel
•Be selective what agents to work with (out of 2.600)
•Individual educator: attend workshops; followed by sales trips
•Association: Branding at associations, workshops, trade mission; followed by FAM trip
How to best approach Eastern Europe

Source: StudentMarketing 2011
Canadian schools could benefit from emphasizing academic value and how it can lead students to first rate colleges and universities (as othet schools and study destination do actively).
Educational value
Canada USA
Pros
bilingual price
unexplored country attractive for young people
fresh environment and wild nature
growing economy high standard in education (TOP universities)
Consprice overcrowded
quite unknown "everybody goes there"
How to best approach Eastern Europe
For Eastern European market, it is important to present it in major local languages as ultimate decision makers do not speak English. It represents a significant competitive advantage.

(in CAD)
Competitive price
Source: StudentMarketing 2011, Caps-I
Canada USA Difference USA
Semester (tuition, room, board incl.) 8614 6592 - 2022 ↓23,5%
Year (tuition, room, board incl.) 16859 13690 - 3169 ↓18,8%
Tuition only 8219 8530 311 ↑3,8%
Homestay only (year) 8640 5160 3480 ↓40,3%
Flight tickets (roundtrip) 1122 924 - 198 ↓17,6%
Visa fee 125 0 / 134 - 125
How to best approach Eastern Europe
Should it be within possibility, competitve pricing and interactive pricing approach are relevant.

57,4% of High School agents do not promote Canada and represent an opportunity for Canadian schools to have fast approach to experienced agencies with existing outreach.
UK USA Canada Germany France Australia Ireland New Zealand Malta South Africa0
20
40
60
80
100
120
140 130 127
97
79
67 6661
4837
15
Potential agent partners
Source: StudentMarketing 2011
How to best approach Eastern Europe
K-12 agents by destinations

K-12 Agents by sectors
91% out of 2600 agents in Eastern Europe do not promote High School programs. Agents promoting Language and Higher Education represent an opportunity for Canadian schools.
0
10
20
30
40
50
60
70
80
90
9
87
5853
5
15
6
Source: StudentMarketing 2011
How to best approach Eastern Europe
Potential agent partners
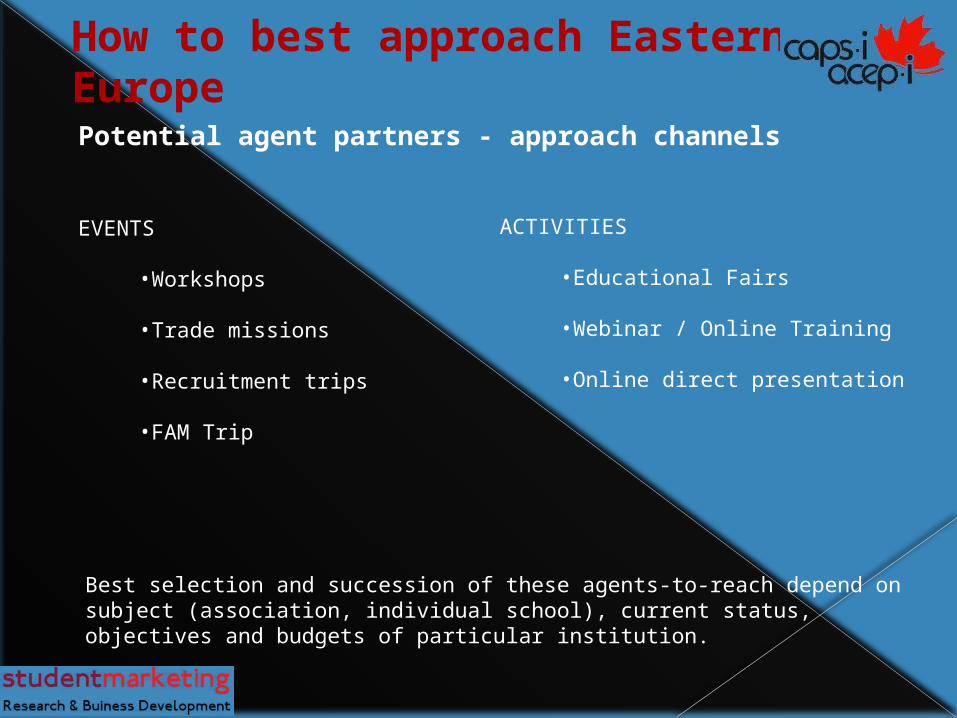
Potential agent partners - approach channels
EVENTS
•Workshops
•Trade missions
•Recruitment trips
•FAM Trip
How to best approach Eastern Europe
ACTIVITIES
•Educational Fairs
•Webinar / Online Training
•Online direct presentation
Best selection and succession of these agents-to-reach depend on subject (association, individual school), current status, objectives and budgets of particular institution.

educational provider located in Canada language, work and study,
internship, career college 10 years in industry total 6.000+ students
Goal: indentification of agents and market opportunities in EE (done in 2007) Result: 35% increase in 2008, 48% increase in 2009
2005 2006 2007 2008 2009 2010
How to best approach Eastern Europe
CASE STUDY

General Conclusions
•K-12 represents cca 120.000 students & $1.5 bn (18.319 & $300m in Canada)
•K-12 sector is growing, but Canada is not gaining as other destinations
•Eastern Europe is a growing region
•Multinational population with increasing demand for education abroad
•Academic value is not well known and needs to be promoted more
•Agents represent predominant recruitment channel in this segment and region
•Regarding number of agencies, selective approach but in person b2b meetings are needed
How to best approach Eastern Europe

EASTERN EUROPE &
How to best approach this market
-------------------------------------------------------Thank you!
Samuel Vetrak, CEOStudentMarketing Ltd
student-market.comMay 2nd, 2011