klimat och byggnader climate and buildings nr 2:1998
TRANSCRIPT

S£ 98072 7/
A
KunglTekniska
Hogskolan
Avdelningen for Uppvarmnings- och ventilationsteknik
ISSN 1100-8997ISBN KTH/EUV/KB-98/2-SE
KLIMAT OCH BYGGNADER CLIMATE AND BUILDINGS
Nr 2:1998
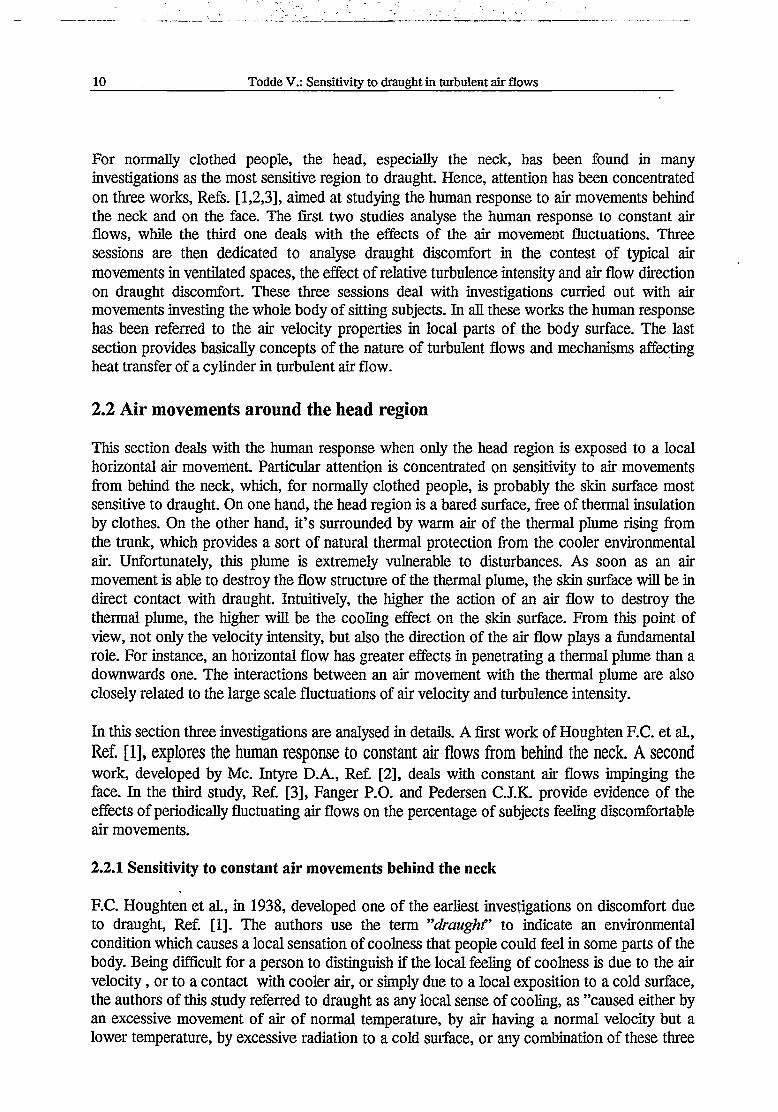
Percentage of Subjects Dissatisfied, Sensing the Strength and Coolness of The Air Flow
Air temp. [C]: 22.2 < Ta < 22.7 -
Turbulence: 23% < Tu < 29%
□ ....... PS: Subjects sensing any air movement0------PC: Subjects feeling any cooling air movemento ----- PD: Subjects dissatisfied to the air movement
Mean Air Velocity [m/s]
ioIT \s ###
VALENTINO TODDE
Sensitivity to Draught in Turbulent Air Flows
Thesis for Licentiate of EngineeringStockholm, September 1998

DISCLAIMER
Portions of this document may be illegible in electronic image products. Images are produced from the best available original document.

SENSITIVITY TO DRAUGHT IN TURBULENT AIR FLOWS
Valentino ToddeCiv. ing.
AKADEMISK AVHANDLING
som med tillstand av Kungliga Tekniska Hogskolan i Stockholm framlagges till offentlig granskning for avlaggande av
teknisk licentiatexamen mandagen den 28e September 1998, kl 10.00
i forelasningssalen Q23,KTH, Osquldas vag 6, pi 2, Stockholm.
Avhandlingen forsvaras pa engelska.
Sensitivity to draught in turbulent air flows
Valentino Todde
Department of Energy Technology, Division of Heating and Ventilation Technology, Royal Institute of Technology, S-100 44 Stockholm, Sweden.
Abstract
Even though, the ventilation system is designed to supply air flows at constant low velocity and controlled temperature, the resulting air movement in rooms is strongly characterised by random fluctuations. When an air flow is supplied from an inlet, a shear layer forms between the incoming and the standstill air in the room, and large scale vortices develops by coalescence of the vorticity shed at the inlet of the air supply. The formation of these vortices is generally associated to a preferred mode, i.e. to a typical Strouhal number. After a characteristically downstream distance, large scale vortices loose their identity because of the development of cascading eddies and transition to turbulence. Furthermore, non uniform temperature distribution in the walls, heat sources like radiators or electronic devices, movements of the occupants, are other typical sources of shear layers from which vorticity is enhanced. The interaction of all these vortical structures will rise a complicate three dimensional air movement affected by fluctuations whose frequencies could vary from fractions of Hz to several KHz.
The perception and sensitivity to the cooling effect enhanced by these air movements depend on a number of factors interacting with each-other: physical properties of the air flow, part and extension of the skin surface exposed to the air flow, exposure duration, global thermal condition, gender and posture of the person. At a prescribed air temperature, it exists a limit of mean air velocity under which the majority of the subjects could not feel coolness in the skin (clothed and/or bared), exposed to the air movement. This limit tends to decrease towards lower velocities as relative turbulence intensity increases and/or air temperature decreases.
Earlier studies were concerned with the percentage of dissatisfied subjects as a function of air velocity and temperature. Recently, experimental observations have shown that also the fluctuations, the turbulence intensity and the direction of air velocity have an important impact on draught discomfort. At present, the interpretation of the effects of macro and microscale turbulence on draught discomfort is far from any conclusion.
Two experimental investigations have been developed to observe the human reaction to horizontal air movements on bared skin surfaces, hands and neck. Attention was concentrated on the effects of relative turbulence intensity of air velocity and exposure duration on perception and sensitivity to the air movement. The air jet flows, adopted for the draught experiment in the neck, were also the object of an experimental study. This experiment was designed to observe the centre-line velocity of an isothermal circular air jet, as a function of the velocity properties at the outlet section.
Key words: draught, perception and sensitivity to air movements, thermal discomfort, low Reynolds number isothermal air jet flows.

KunglTekniskaHogskolan
Avdelningen for Uppvarmnings- och ventilationsteknik
ISSN 1100-8997ISRN KTH/EUV/KB-98/2-SE
KLIMAT OCH BYGGNADER CLIMATE AND BUILDINGS
Nr 2:1998
Percentage of Subjects Dissatisfied, Sensing the Strength and Coolness of The Air Flow
Air temp. [CJ: 22.2 < Ta < 22.1
Turbulence: 23% < Tu < 29%
□ ....... PS: Subjects sensing any air movement0------PC: Subjects feeling any cooling air movemento ----- PD: Subjects dissatisfied to the air movement
Mean Air Velocity [m/s]
VALENTINO TODDE
Sensitivity to Draught in / Turbulent Air Flows
Thesis for Licentiate of EngineeringStockholm, September 1998
SENSITIVITY TO DRAUGHT IN TURBULENT AIR FLOW
Valentino ToddeM. Sc.
Division of Heating and Ventilation Technology Department of Energy Technology
Royal Institute of Technology Stockholm, Sweden
Thesis for Licentiate of EngineeringStockholm, September 1998


3
Forord
Foreliggande licentiatavhandling behandlar dragproblem fran luftstralar mot hander och nacke. Framfor allt behandlas luftstralar med lag hastighet, vilket ar det vanligast forekommande vid ventilation. Avhandlingen utgor en logisk foljd (nu omfattande aven inverkan av turbulensen i stralama) pa det sedan lange forharskande betraktelsesattet i Sverige.
I litteraturgranskningen (kapitel 2) ges en bakgrund till arbetet fran undersokningar av varmedverforingen mot cylindrar i vilka ocksa turbulensens betydelse framgar.
Av de fdrsok som utfdrts behandlar nagra motsvarande betydelse for dragkanslan vilket gor undersokningen betydelsefull for beskrivningen av dragkriterier for luftstralar firan tilluftsdon.
Avslutningsvis gors en betraktelse over diskomforten i stralar av detta slag.
Preface
This licentiate thesis deals with thermal discomfort due to air movements in climatically controlled spaces. At present, the conditions of air temperature, velocity, humidity and mean radiant temperature providing thermal comfort for the majority of the occupants, need to be implemented due to the effects of local air movements (draught) around surfaces of the occupants.
A literature survey combines the results from experimental observations on human reactions to air movements, with the physical properties of air flows. The effects of relative turbulence intensity of air velocity have been related to the mechanism of heat transfer in turbulent air flows.
Two experiments have been developed to observe the human response to turbulent air movements in free air jet flows around bared skin surfaces, hands and neck. Particular attention has been dedicated to identify the effects of relative turbulence on sensitivity to air movement. Above all, an analysis on turbulent free air jets at low Reynolds number has been carried out.
4
Acknowledgements
This licentiate thesis work has been carried out at the division of Heating and Ventilation, Department of Energy Technology, Royal Institute of Technology, Stockholm, Sweden.
I’m grateful to my advisor," Professor Folke Peterson, for introducing me in this research activity and for stimulating discussions and support during the work.
Special thanks are due to Professor Mats Sandberg, for offering me the possibility to use the laboratory at the Department of Built Environment, (Royal Institute of Technology, Gavle, Sweden), for developing the experimental work. Thanks are also given to Tyrrel Burt for the revising of the language and valuable advice. I would like to express my thanks to all the staff at the Division of Heating and Ventilation, and at the Department of Built Environment, helping me with technical advises.
I wish also to express my gratitude to Politecnico of Torino (Turin, Italy), to the Swedish Council for Building Research, and to the Foundation Blanceflor Boncompagni-Ludovisi for providing me research grants and financing experimental equipment.
4

Todde V.: Sensitivity to draught in turbulent air flows 5
Contents
FORORD/PREFACE 3
ACKNOWLEDGEMENTS. 4
1 INTRODUCTION 71.2 Background 71.3 Objectives 7
2 SENSITIVITY TO AIR MOVEMENTS 92.1 Introduction 92.2 Local air movements around the head region 102.2.1 Sensitivity to constant air movements behind the neck 102.2.2 Sensitivity to constant air movements on the face 152.2.3 Sensitivity to fluctuating air movements behind the neck 172.3 Air movements around the whole body 212.3.1 Sensitivity to air movements of typically ventilated spaces 222.3.2 Effects of air velocity turbulence 232.3.3 Effects of air flow direction 312.4 Turbulent air flows 362.4.1 The nature of turbulent air flows 362.4.2 Cylinder in cross air flows 372.5 Conclusions 402.6 References 41
3 SENSITIVITY TO HORIZONTAL AIR MOVEMENTS WITH HANDS 433.1 Introduction 433.2 Air jet flow measurements 443.3 Hand test 463.4 Results 473.5 Conclusions 493.6 References 50
4 LOW REYNOLDS NUMBER AIR JET FLOWS 514.1 Introduction 514.2 Isothermal circular air jet flows 524.3 Air jet flow measurements 554.4 Results 564.5 References 63

6 Contents
5 SENSITIVITY TO HORIZONTAL AIR MOVEMENTS AT THE NECK 655.1 Introduction 655.2 Experimental methodology 675.3 Sensitivity to air movements 705.4 Skin temperature 725.5 Effects of turbulence intensity 745.6 Conclusions 755.7 References * 86
6 DISCOMFORT DUE TO HORIZONTAL AIR MOVEMENTS AT THE NECK 876.1 Introduction 876.2 Results 886.3 Conclusions 946.4 References 95
7 SUMMARISE 97

Chapter 1: Introduction 7
1 Introduction
1.1 Background
In this study, according to the Concise Oxford Dictionary, and to the third edition of Dictionary of Scientific and Technical Terms, McGraw-Hill (1984), the term "draught” indicates a "current of air in confined spaces”.
Air movement in climatically controlled spaces, such as dwellings, offices and transport systems, often generate unwanted cooling effects despite the respect of the conditions of global thermal comfort for the majority of the occupants. This discomfort sensation, referred to many researchers as draught, is mainly due to the combined effect of air velocity properties, with air temperature and thermal condition of the subjects. The air velocity impact on draught discomfort depends on the direction, the mean value and the relative turbulence intensity of the air flow velocity. These two last quantities play an important role for assessing the risk of draught discomfort in a correlated way. At defined air temperature, mean air velocity and air velocity direction, the lower the turbulence intensity, the lower the risk of draught.
For normally clothed subjects, the head region has been found in many experimental observations as the most sensitive to draught. The head surface is surrounded by the warm plume rising from the trunk, providing thermal protection from the cooler environmental air. The structure of the thermal plume, which also depends on the posture of the subject, is extremely vulnerable to external air flows: low air velocity flows are able to penetrate the thermal plume reaching the skin surface. The higher the action of an air flow to destroy the thermal plume, the higher the cooling effect on the skin surface. From this point of view, air flow direction, mean velocity and turbulence intensity play a fundamental role.
A number of studies have already explored the impact of air movement properties on draught perception and sensitivity. It seems that a comprehensive model to predict the percentage of discomfort due to draught is not yet existing. Earlier studies dealing with perceived discomfort due to draught were concerned with the percentage of dissatisfied subjects as a function of air velocity and temperature. More recently, experimental studies have shown that, besides mean air velocity and temperature, also the fluctuations, the turbulence intensity and the direction of air velocity have an important impact on thermal discomfort. At present, the interpretation of the effects of macro and microscale turbulence on draught discomfort is far from any conclusion.
The intensity of the human body reaction to an air flow varies with exposure duration and it’s felt by the subject with different intensity while the air flow persists blowing. Perception and sensitivity to draught is not a steady state condition even if the air movement properties remain constant. Thus, also exposure duration should be included in draught chart to predict the percentage of dissatisfied to air movement.
1.2 Objectives
The effects of air movement properties on draught perception and sensitivity has been the subject of a wide number of studies. The research and the corresponding results obtained from some of these works are described and analysed in the second chapter, with emphasis on the
8 Todde V.: Sensitivity to draught in turbulent air flows
methodology adopted in the experiments, on the instrumentation used for air flow measurements and on the conclusions obtained from the results.
Two experimental investigations have been developed with the aim to understand the human reaction to local air movements, while people are in a thermal comfort condition, performing light activity. The results have been used to advance some conclusions on human response to draught, and compared with previous works of different authors. The main purpose of these experiments was to find the domain of air velocity in terms of air mean value and relative turbulence intensity, at which normally clothed people, in global neutral thermal condition, could perceive and feel air movements in their bared skin surfaces. The impact of air temperature was analysed. All the experiments have been developed at an air temperature between 21 and 23 °C, as in typical occupied zones in Scandinavia.
The first experiment was developed to observe how people perceive and feel air movements on their hands, and how the relative turbulence intensity of air velocity affects this perception. Concerning the sensitivity to air movements, the experiment was intended to explore the eventual effects of skin temperature on draught perception, and to collect a number of information about impressions of air movements. The experiment was also intended to achieve useful indications to improve the instrumentation design for low speed air flow measurements and for the experimental methodology of the second draught experiment dealing with the sensitivity to air movements in the neck.
With the second experiment it was observed the human reaction to an air flow blowing from behind the neck. A number of references indicate this region as the most draught-sensitive area of normally clothed subjects. Complains due to draught have been observed at very low air velocities, hence the experiment was performed only for sedentary conditions. In fact, body movements increase the air velocity and the relative turbulence intensity in a random way, vanishing any attempt to properly correlate air movement properties with the human response. In this experiment it was analysed the exposure duration effects on perception and sensitivity to draught. Air mean velocity, relative turbulence intensity and exposure duration were the main independent parameters used to elaborate the data. Skin temperature has also been recorded with the use of thermocouples and related to the human response.
The air jet flows, adopted for the draught experiment in the neck, were also the object of an experimental study. A mathematical model to predict the physical properties of low speed air jet flows, with inlet velocity at the orifice lower than lm/s is of practical value for designing air supply in ventilated rooms. Thermal comfort and draught risk require quite often a level of mean air velocity lower than 15-30 cm/s in the occupied zone, with a low level of relative turbulence intensity as well The velocity of an air flow supplied into an occupied zone, is strongly conditioned by velocity properties at the inlet section, the geometry of the nozzle, the difference in temperature between the supplied air and the air in the room, the location of surrounding walls and by air movements in the room enhanced by external factors. This experiment was designed to observe the centre-line velocity of an isothermal circular air jet, as a function of the velocity properties at the outlet section.

Chapter 2: Sensitivity to air movements 9
2 Sensitivity to air movements
2.1 Introduction
A local air movement around the skin surface increases the rate of heat transfer between the skin and the air flow by convection and causes the skin temperature to decrease as well. The amount of heat absorbed from the skin depends on physical properties of the air flow: temperature, mean velocity, its relative turbulence intensity and direction. The perception and sensitivity to this cooling effect depend on subjective aspects and on a number of external factors such as air flow properties, part and extension of the skin surface exposed, posture, exposure duration, global thermal condition of the person and gender of the subject. Generally, an increase of mean air velocity, at constant relative turbulence intensity, increases the cooling of the skin surface. At a prescribed air temperature, it exists a limit of air mean velocity under which the majority of subjects could not perceive coolness in the skin exposed to the local air movement. This limit tends to decrease towards lower velocities as relative turbulence intensity increases. While the mean air velocity increases, people start to perceive the cooling effect with more or less intensity and feelings, depending mainly on the thermal condition of the person and on the entity of the cooling effect.
As an example, let’s suppose a person in thermal comfort condition, sitting in a office free of air movements. If the ventilation system starts to supply air in the room, the air flow will start to cool down the temperature of the exposed skin (exposed clothed surface as well). The subject could or not feel this effect: there is a range of air velocity at which the cooling effect is not perceived. The air movement is perceived as soon as the air velocity reaches a certain limit value. As a general trend, the lower the thermal vote of the person in still air, the lower will be this air velocity limit. Moreover, in warm thermal conditions, air flows could be felt with pleasantness. In this contest, air movements help to counteract discomfort due to warm air temperature. The opposite generally happens in cold conditions, where air movements increase thermal discomfort. The location of these limits depends also on the turbulence intensity of the air velocity, on the direction of air movements and, indeed, on the air temperature as well.
Research, based upon human response to air movements, has been developed to find air flow conditions which minimise the risk of thermal discomfort due to draught, Le. due to air movements. Extensive studies have been curried out to identify the surfaces of human body most sensitive to draught in normally clothed subjects, to evaluate the impact on the percentage of dissatisfied subjects to draught of mean air velocity combined with air temperature, turbulence intensity of air velocity and air velocity direction.
One feature of draught is to be ’’local”. In an occupied zone, where are respected the conditions of air temperature, velocity, humidity, mean radiant temperature to keep the majority of the occupants in thermal comfort, a local air movement impinging on the human surface (bared and/or clothed), could rise a situation of discomfort. The general equations of thermal comfort need to be implemented with conditions to avoid discomfort due to local air movements. This is a fairly complicate task: as mentioned before, the sensitivity to air movements depends on a wide number of factors, which are also inter-connected with each other. In the following sections, are analysed results from earlier research aimed at identifying the fundamental characteristics of air flows affecting the perception and sensitivity to air movements, and to quantify their impact on the percentage of dissatisfied subjects.
10 Todde V.: Sensitivity to draught in turbulent air flows
For normally clothed people, the head, especially the neck, has been found in many investigations as the most sensitive region to draught. Hence, attention has been concentrated on three works, Refs. [1,2,3], aimed at studying the human response to air movements behind the neck and on the face. The first two studies analyse the human response to constant air flows, while the third one deals with the effects of the air movement fluctuations. Three sessions are then dedicated to analyse draught discomfort in the contest of typical air movements in ventilated spaces, the effect of relative turbulence intensity and air flow direction on draught discomfort. These three sessions deal with investigations curried out with air movements investing the whole body of sitting subjects. In all these works the human response has been referred to the air velocity properties in local parts of the body surface. The last section provides basically concepts of the nature of turbulent flows and mechanisms affecting heat transfer of a cylinder in turbulent air flow.
2.2 Air movements around the head region
This section deals with the human response when only the head region is exposed to a local horizontal air movement. Particular attention is concentrated on sensitivity to air movements from behind the neck, which, for normally clothed people, is probably the skin surface most sensitive to draught. On one hand, the head region is a bared surface, free of thermal insulation by clothes. On the other hand, it’s surrounded by warm air of the thermal plume rising from the trunk, which provides a sort of natural thermal protection from the cooler environmental air. Unfortunately, this plume is extremely vulnerable to disturbances. As soon as an air movement is able to destroy the flow structure of the thermal plume, the skin surface will be in direct contact with draught. Intuitively, the higher the action of an air flow to destroy the thermal plume, the higher will be the cooling effect on the skin surface. From this point of view, not only the velocity intensity, but also the direction of the air flow plays a fundamental role. For instance, an horizontal flow has greater effects in penetrating a thermal plume than a downwards one. The interactions between an air movement with the thermal plume are also closely related to the large scale fluctuations of air velocity and turbulence intensity.
In this section three investigations are analysed in details. A first work of Houghten F.C. et al, Ref. [1], explores the human response to constant air flows from behind the neck. A second work, developed by Me. Intyre D.A, Ref. [2], deals with constant air flows impinging the face. In the third study, Ref. [3], Fanger P.O. and Pedersen C.J.K. provide evidence of the effects of periodically fluctuating air flows on the percentage of subjects feeling discomfortable air movements.
2.2.1 Sensitivity to constant air movements behind the neck
F.C. Houghten et aL, in 1938, developed one of the earliest investigations on discomfort due to draught, Ref. [1]. The authors use the term ”draught’ to indicate an environmental condition which causes a local sensation of coolness that people could feel in some parts of the body. Being difficult for a person to distinguish if the local feeling of coolness is due to the air velocity, or to a contact with cooler air, or simply due to a local exposition to a cold surface, the authors of this study referred to draught as any local sense of cooling, as ’’caused either by an excessive movement of air of normal temperature, by air having a normal velocity but a lower temperature, by excessive radiation to a cold surface, or any combination of these three

Chapter 2: Sensitivity to air movements 11
effects”. This investigation has been developed to determine the conditions of air temperature and velocity causing a sense of draught in the back of the neck and in the ankles.
The sensitivity to air movements was observed in ten young male subjects, sitting in a chamber were the air temperature was kept at the value of 70°F, (~21°C). Every test person participated at different tests, during which the back of their neck was exposed for 30 minutes to a constant combination of air velocity and temperature. Experiments were curried out with air velocity ranging from 5 cm/s to around 55 cm/s and air temperature from around 18 to 21°C. Every test began with a preliminary adaptation period of approximately 30 minutes: the test person was sitting in the chamber while air velocity was kept at minimum values. This phase was intended to stabilise the skin temperature in the neck. Afterwards, an air jet flow, atcontrolled temperature and velocity, started to blow towards the neck from behind. The air flow, as shown in figure 3 of [1], was supplied from a duct with the outlet section very close to the neck surface. During the tests were observed the skin temperature and the thermal sensation of the subject. An investigation with a similar procedure was also developed with an air flow blowing around the ankle.
According to the results obtained in the neck draught experiment, it appears that the skin temperature decreases progressively and continuously during all the 30 minutes, while the air flow was blowing. As we could expect from a heat transfer point of view, the drop in skin temperature was observed to rise with increased air flow velocities and also when the draught temperature was reduced. These results are shown in figure 2/1, where the lines indicate the drop in skin temperature after 30 minutes exposure to draught. Every line is obtained with polynomial equation of second order, listed in table 2-1.
Drop in Skin Temperature After 30 Minutes Exposure
o -••• -. Draught T. -21.1 CA -••• .- Draught T. - 20.5 C□ - .- Draught T. - 20.0 C* -- -. Draught T. - 19.4 C9 •••• "" Draught T. - 18.9 Co. .. - Draught T. = 18.3 C
yP
a4iC/3
V
.....i :
U-
©•-
i
-..e-—
___...
4«S..
H... O------
0.0 0.1 0.2 0.3 0.4Mean Air Velocity [m/s]
0.5 0.6
Figure 2/1. Drop in skin temperature in the neck versus air mean velocity, at different draughttemperatures, after 30 minutes exposure. Data obtained from analysis of figure 8 of Ref. [1].

12 Todde V.: Sensitivity to draught in turbulent air flows
Table 2-1. Polynomial equations of the curves in figure 2/1.--------------------- --------------- ------------------------------------- -------------------ii
21,10 AT = -3,972 + 7,IF20,55 A7=-3,972+7,37+ 0,520,00 AT = -4,3,72 + 8,07 + 0,919,44 AT = -3,572 + 7,77 +1,418,89 AT = -4,672 + 8,57 +1,818,33 AT = -3,572 + 7,97 + 2,1
OP: Kt = f(V) [°C]DRAUGHT TEMPERATURE [°C] ' SKIN fTEMPER^TURErp
To designate the level of comfort, the authors adopted the following scale: 1 decidedly cold, 2 cool, 3 comfortably cool, 4 ideally comfortable, 5 comfortably warm, 6 warm and 7 hot. According to this index scale, the authors related the per cent of comfort observations to the drop in skin temperature of the neck after 30 minutes exposure. The results are shown in figure 2/2, where the curves have been obtained fitting the lines in figure 11 of [1]. In this study, the authors have found difficulties in getting the test persons to properly evaluate their feeling for the air movement, particularly to distinguish between the index 3 and 4. Thus, in figure 2/2, is also plotted an additional curve denoting the combined votes 3 and 4.
1001
90CsTEl 80
0 701£ 60 §
O50
rrS 20Ph
10
0s=:
Percentage of Observed Comfort Degrees
X. ""0-4-0...... ir-o..
-------- H..........i............ i............ r %....f............ i-------
...X... !. . . . . . . . . . . . . . . . . .X i ./ I i ""a.
= 0/
0 r.
<Tx1...............n............'V.1'
i "W
........ ..........
3*
O ----- Votes 3 + 4A ----- Vote 4□ ...... Vote 3* ----- Vote 20 --- Vote 1
1 ..."
"EJ
0.0 0.5 1.0 1.5 2.0 2.5 3.0 3.5 4.0 4.5Drop in Skin Temperature After 30 Minutes Exposure, [C]
5.0
Figure 2/2. Percentage of different comfort levels versus drop in skin temperature of the neck after 30 minutes exposure. The data for curve design are obtained from figure 11 of Ref. [1].
From this figure it is possible to observe that draught causing a drop in skin temperature lower than 1°C is not felt uncomfortable at alL Only when the drop in skin temperature achieve around 1.8°C, the percentage of the combined votes 3 and 4 goes down till 90%, and then it decreases with a nearly linear trend. For instance, at draught conditions which bring the drop in skin temperature to 3.5°C, the corresponding percentage of thermal discomfort has already increased till 50%. Rather than an exact estimation of the comfort percentage, which seems to be a too much ambitious result from a so small sample of test persons, this graph provides a

Chapter 2: Sensitivity to air movements 13
clear crucial point of the drop in skin temperature located between 1.5 and 2.0°C, where we can easily observe some particular aspects:• The percentage of index two starts a linear upward trend which remains constant in all the.
subsequent range of drop in skin temperature.• The percentage of observations of vote three achieve its maximum value and, afterwards, it
starts to decrease linearly.• The percentage of vote four has already achieved low values and starts to follow a nearly
constant plateau with a weak downward slope.
The percentage of the combined votes 3 and 4 has then been adopted to denote the percentage of comfort, and, as shown in figure 2/3, it has been plotted versus air velocity for all the different draught temperatures investigated. In this graph, the percentage of comfort decreases linearly with air velocity. This trend starts at an air velocity which depends on draught temperature as well For instance, in the case of draught at 21.1 °C, it starts at 0.2 m/s, while for draught at 19.4°C, at standstill air. Moreover, draught temperature has also an impact on the slope of the lines denoting the percentage of comfort. Decreasing the draught temperature, the absolute value of the slope of these lines increases. In fact, an increase of air velocity of around 12 cm/s will cause the percentage of comfort to decrease of 10% with draught at 21.1°C, and of 20% with draught temperature at 18.3°C.
Percentage of Observed Comfort, (Votes 3+4)100$:
90
t£80
|»
6“o50
c0 405g®8 20
10
5: ~<RT
*i,^ Wv
-0. ""■••a s--
Xi X
""•'•sc"X
O ...... Draught T.= 21.1 CA ...... Draught T.= 20.5 C□ ------ Draught T.= 20.0 C* ........ Draught T.= 19.4 CV0
Draught T.= 18.9 C Draught T.= 18.3 C
•s..
X■0::
••»...
x.*••••.,
•••o..."S..."••a
X-.....
. . I« ̂ ..........
.......A
“x
0.0 0.1 0.2 0.3 0.4Mean Air Velocity [m/s]
0.5 0.6
Figure 2/3. Percentage of observed comfort versus mean air velocity at different draught temperatures. The data for curve design are obtained from figure 13 of Ref. [1].
The authors assumed as the limit of acceptable draught the condition of 90% indication of comfort, (combined votes 3 and 4). This limit has been observed to happen with a drop in skin temperature of the neck equal to 1.8°C. According to this condition, the authors constructed a final graph indicating the combination of air velocity and air temperature determining an ’’objectionable draught condition” for the neck. In figure 2/4, the mentioned line is plotted by fitting the data of figure 15 of the original paper. Based upon this graph, it appears that

14 Todde V.: Sensitivity to draught in turbulent air flows
standstill air at the temperature of around 19°C is already an objectionable draught condition, like an air flow at the temperature of 21°C with velocity equal to or bigger than 30 cm/s. The authors conclude that a drop of 1°C in dry bulb temperature of the local draught impinging the neck causes the neck skin temperature to decrease of around 0,83°C. Instead, the change in skin temperature of the neck per degree temperature change in room air (surrounding the entire body), has been found considerably lower. Moreover, according to the conclusions inthe paper, a drop of air temperature of 1 deg. F, (0,556 °C), will cause the same cooling effect due to an increase of air velocity of 15 fpm (7,62 cm/s).
Comfortable and Objectionable Draught
Draught Vel. = 0.0262 * T2- 0.915 * T+ 7.945 Data from Ref. [1]
& 0.2 Objectionable Ipraught
> 0.15
19.5 20.0Air Temperature [C]
Figure 2/4. Limit between comfortable and objectionable draught. The data for curve fitting are obtained from figure 15 of Ref. [1].
This study provides a wide number of useful information on discomfort due to draught and the results have been widely used for assessing criteria in indoor climate. In the USA, this work has been used as the basis of most American recommendations on maximum permitted air velocity, Ref. [2]. Besides the utility that this work has offered for long time, the resulting conditions of comfortable air movements, as shown in the previous figure 2/4, are not anymore sufficient to satisfy new requirements of comfort in occupied zones. This work has analysed the human response to constant air movements. In real occupied zones, air movements are fluctuating in a random way. Recent research, see for instance Ref. [6], has found more restrictive conditions of air velocity for comfortable environment. In fact, besides all the details of this work, it’s possible to recognise some drawback in the experimental methodology. As a first observation, there is the fact that ten male subjects are not a suitable number of subjects to construct a draught chart. In the description of air flow properties is totally omitted the level of relative turbulence intensity. From the picture in the paper, showing the test arrangement, we can observe that the flow is directed to the neck with a direction from behind with a little downwards direction, which counteract the plume of the natural convection around the head region of the subject. Moreover, the tube from which is blowing the air flow is placed too much close to the neck. In this way, the air flow is forced to penetrate the thermal plume of the

Chapter 2: Sensitivity to air movements 15
subject behind the neck. On the other hand, air flow measurements have been done without the presence of the subject. During the experimental observation, the position of the neck so close to the outlet of the supply, could produce a strong reduction of the air velocity. Hence, during the experiment, air velocities have been probably lower than the ones intended. In this circumstance, the observed percentage of dissatisfied subjects has been referred to over estimated air velocities.
The perception and sensitivity to air movement depends on a number of factors, like the thermal condition of the subject. In this paper is not specified if the subjects were or not in thermal neutrality before the jet started to supply air, and, how this condition has been respected during the exposure to draught. The drop in skin temperature depends also on the initial skin temperature just before the jet started to blow. Generally, if two subjects, with different initial skin temperature, are exposed to identical air flows conditions, they will not have an identical drop in skin temperature as well. Draught perception is also, depending on duration exposure. In this work it seems that all the thermal votes have been observed only at the end of the 30 minutes exposure.
2.2.2 Sensitivity to constant air movements on the face
In the study of Me Intyre D. A, Ref. [2], an investigation was developed to observe the human response to low speed air movements on the face. This work was mainly intended to quantify the percentage of subjects able to detect air movements, the level of discomfort due to low air velocity, to understand how people react to such air flows and how the reactions are distributed among the subjects.
Table 2-2. Database of the experiment of the three phases.
91 20 523 21 21I 4.6 4.0 4.023 17-19-21 21
0.15-0.20-0.25-0.35 0.50 - 0.70
0.15-0.20-0.25-0.35 0.50 - 0.70
0.15-0.20-0.25 0.35
2 2 30
Steady air flow, was supplied at controlled velocity and temperature from an outlet of 150 mm diameter towards the subject cheek, placed 300 mm downstream the outlet section. The turbulence intensity of air velocity was 0.03. The experiment was developed in three different phases, as summarised in table 2-2. At every exposure to a constant draught condition, the subject was invited to answer the questionnaire indicated in table 2-3.
Table 2-3. Questionnaire.
1 .Cold - 7.Hot1 .Cold - 7.Hot
1 .Just detectable - 4.Strong1 .Cold - 7.Hot
1.Unpleasant - 7.Pleasant1 .Never acceptable - 7.Always acceptable

16 Todde V.: Sensitivity to draught in turbulent air flows
In figure 2/5 are shown the percentage of subjects failing to detect the presence of air flow after two minutes exposure, in phase 1 and 2. These results reveal clear evidence of the effect of air flow temperature: the lower the air flow temperature, the higher the percentage of subjects able to detect the air movement. Air velocities higher than 0.35 m/s were nearly always detected. At air flow temperature of 23°C, air movement of 0.25 m/s was not felt by the 20% of the subjects. This percentage has been observed to rise up till 50% for air velocity of 0.15 m/s.
Percentage of Subjects Failing to Detect Air Movement50
45
40
35
&30
#25§
CL,15
10
5
00.2
i iO ........Air Flow Temperature - 23 C□ ....... Air Flow Temperature - 21 CA------Air Flow Temperature = 19 CO Air Flow Temperature - 17 C
;...........................;• : :\ i •: :
.............v..... r........................... :...........................
..... \....y.......................... i..........................
..... , X i\ m ......i
............. ............................................................
—-------------------- i —0.3 0.4 0.5
Mean Air Velocity [m/s]0.6 0.7
Figure 2/5. Percentage of subjects not detecting the air movement after 2 minutes exposureduration to the air flow. Data obtained from figure 2 of Ref. [2].
Graph A: Median Pleasantness Vote
0.3 0.4 0.5 0.6Mean Air Velocity [m/s]
Graph B: Pleasantness Vote in Phase 2iPleasantl
O ......... Upper QuartileO ------- Median□-------Lower Quartile
Unpleasant0.2 0.3 0.4 0.5 0.6
Mean Air Velocity [m/s]
Figure 2/6. Graph A: median of pleasantness votes recorded in phase 1, according to the thermal vote. Graph B: Median, upper and lower quartile of pleasantness votes at air jet temperature of 21°C, observed in phase 2. Data obtained from figures 2 and 3, of Ref. [2].

Chapter 2: Sensitivity to air movements 17
The pleasantness votes collected in phase 1, show a weak change of pleasantness level with air speed. In graph A of figure 2/6, are shown the median pleasantness votes according to the warmth sensation of the subjects. Based on the subject’s warmth vote (first question of the questionnaire), the subjects have been divided into three groups: cool group (C), W < 4; neutral group (N), 4 < W <5; warm group (W), W > 5. At air velocities lower than 0.25 m/s, all the three groups indicate a median vote close to the neutral level The warmer group shows a certain pleasantness only at air velocity of 0.35 m/s. At air velocity of 0.70 m/s, the median pleasantness votes are slightly under the neutral point, but still quite close to it. As the authors wrote, a similar trend has been found also for the pleasantness votes in phase two. In graph B of figure 2/6, is shown the median, upper and lower quartile of pleasantness votes recorded in phase 2 at air flow temperature of 21°C. It is possible to observe that the higher the air velocity, the wider the range of the votes.
In the third phase of the experiment, the subjects were exposed to a constant air flow condition for 30 minutes. During this period they answered the questionnaire at several intervals. As the author wrote, it has been not found significant change in pleasantness vote with duration exposure. The mean votes of pleasantness were 4.1 at 0.15 m/s, 3.7 at 0.25 m/s and 0.35 at 0.35 m/s. The warmth sensation of moving air changed significantly with exposure duration. As a general trend, the initial feeling of coolness was slowly decreasing until disappearing after 20 minutes exposure duration. In a similar way, also the strength of air movement followed a continuous decrease with exposure duration.
In this study the analysis of the results is mostly developed in terms of median vote and only in one graph the paper shows also the upper and lower quartile of the pleasantness vote. From a practical point of view, it not clear how the median vote could comprehensively describe the human response. Nowadays, research is mostly aimed to quantify the percentage of subjects sensing and/or dissatisfied to a particular air movement condition. Indeed, this could be provided only if results are based on a sufficiently large sample of test persons. The results obtained from the experimental observations in phase 3 are a bit surprising. The sensation of air flow temperature and the perception of strength of air movement at the skin surface, have been observed to decrease with time. However it has not found any change in pleasantness feelings. According to this conclusion, the pleasantness feeling becomes independent of thermal and strength sensation as the exposure to draught continues.
2.2.3 Sensitivity to fluctuating air movements behind the neck
The characteristics of fluctuating air movements, such as frequency and amplitude of the oscillation, could have a remarkable impact on the human sensitivity and on the percentage of subjects dissatisfied to draught. In an experimental investigation of 1977, P.O. Fanger and C.J.K. Pedersen, Ref. [3], observed the human response to fluctuating air movements behind the neck. The authors of this study defined draught as "an unwanted local cooling effect of the human body caused by air movement’.
A first experiment has been developed to obtain information on the level of dissatisfaction due to draught, as a function of the frequency of air velocity fluctuations. For this observation, sixteen seated subjects, 8 females and 8 males, clothed in short, were exposed to an horizontal fluctuating air flow from behind the neck. Each test person performed fifteen tests of 25 minutes each one. In every test they were exposed to prescribed air flow conditions: mean velocity between 0.1 and 0.3 m/s, frequency of the velocity fluctuation between 0 and 0.83 Hz

18 Todde V.: Sensitivity to draught in turbulent air flows
and turbulence intensity between 60% and 90%. The air temperature in the room was maintained at the preferred level (neutral temperature), selected by the test person in a previous test. The jet flow was supplied in nearly isothermal conditions. The test person was invited to report the sensation to draught behind the neck every 5 minutes with the following votes: 0 (not uncomfortable), 1 (uncomfortable), 2 (very uncomfortable). In figure 2/7, is reproduced the regression curve of the mean vote of draught sensation, observed in the experiments with mean air velocity equal to 0.3 m/s. This curve shows a maximum discomfort in the frequency domain between 0.3 and 0.5 Hz. The authors outlined that in the thermal simulation of the human skin, developed by Madsen, the heat flow just below the skin surface reaches a maximum at the similar frequency domain. From this correspondence the authors correlated the discomfort induced by draught to the heat flow rate in the skin layer were the thermoreceptors are situated.
Mean Value of The Degree of Discomfort
Mean Air Velocity = 0.3 mZ sec
Frequency of Air Velocity Fluctuation [Hz]
Figure 2/7. Regression curve of mean vote of discomfort degree versus frequency of air velocity. Data obtained from figure 2 of Ref. [3].
A second investigation has been curried out to estimate the percentage of the population ’’who can be expected to experience draught”. Based upon previous experimental observations, the authors have found the back of the neck as the most draught sensitive surface of the human body, for normally clothed subjects. Hence, this experiment was developed with 10 subjects, 5 females and 5 males, who exposed the back of the neck to horizontal periodically fluctuating air movements. These subjects were selected, in a previous test, among a sample of 100 test persons to identify the 10 most draught sensitive subjects. No significant difference in draught sensitivity has been found between females and males, and the 10 most draught sensitive subjects happened to be 5 females and 5 males. As in the first experiment, for each of these 10 subjects was determined the preferred air temperature (neutral temperature), in sedentary condition with 0.7 do clothes. Every test person participated at 16 one hour experiments, were he was exposed to 16 combinations of room air temperature, air movement temperature behind the neck and frequency of the air velocity fluctuations. In every one of the 16 experiments, the mean air velocity was changed in small steps every 8 minutes. For every

Chapter 2: Sensitivity to air movements 19
subject it was evaluated the ’’draught limit” as the average between the highest mean air velocity at which the subject didn’t feel uncomfortable and the lowest mean air velocity at which he felt uncomfortable. No significant differences in draught limit have been observed between females and males.
Draught Limits
1.0
0.0 1----- =----------- :----------- :----------- :----------- :----------- :----------- :----------- :----------- :------------4 -3 -2 -1 0 1 2 3 4 5
Umax/.Umean=.2,0-;-f—0,2-Hz
(Draught Temp.) - (Neutral Temp.) [C]
Figure 2/8. Examples of draught limits. Data obtained from figure 3 of Ref. [3],
The authors, based on the experimental data, elaborated a statistical model to predict the percentage of draught limits, Le. the mean velocity at which a defined percentage of the population can feel draught. In figure 2/8, are reproduced two graphs, where the estimated draught limits are plotted versus the difference between draught temperature and the neutral temperature, for constant and fluctuating air flows. The results shown in these two graphs provide clear evidence that the draught limits are higher for constant air movements than for fluctuating velocities. From the data of this experiment it has been elaborated a model to predict the x %-draught limit for x = 5, 10, 20 and 30, as a function of mean air velocity, the velocity fluctuation and the difference between the neutral temperature and the temperature of air movement. In the paper is omitted a mathematical expression to predict analytically the x %
20 Todde V.: Sensitivity to draught in turbulent air flows
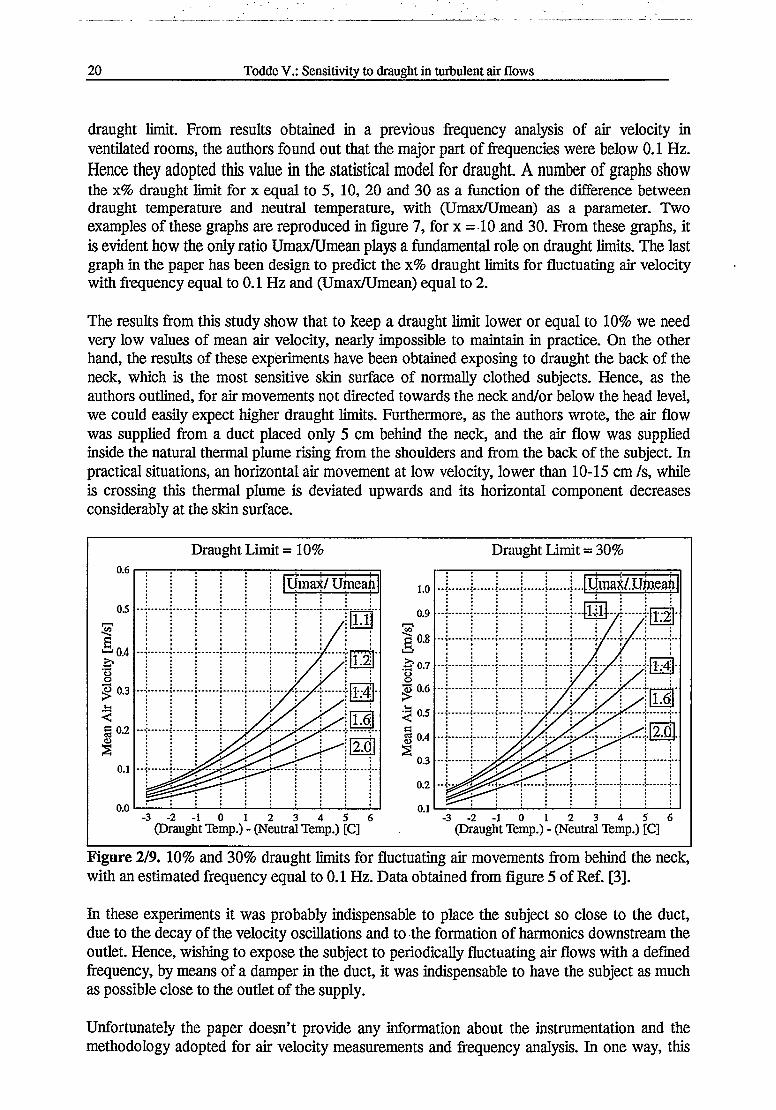
draught limit. From results obtained in a previous frequency analysis of air velocity in ventilated rooms, the authors found out that the major part of frequencies were below 0.1 Hz. Hence they adopted this value in the statistical model for draught. A number of graphs show the x% draught limit for x equal to 5, 10, 20 and 30 as a function of the difference between draught temperature and neutral temperature, with (Umax/Umean) as a parameter. Two examples of these graphs are reproduced in figure 7, for x =10 and 30. From these graphs, it is evident how the only ratio Umax/Umean plays a fundamental role on draught limits. The last graph in the paper has been design to predict the x% draught limits for fluctuating air velocity with frequency equal to 0.1 Hz and (Umax/Umean) equal to 2.
The results from this study show that to keep a draught limit lower or equal to 10% we need very low values of mean air velocity, nearly impossible to maintain in practice. On the other hand, the results of these experiments have been obtained exposing to draught the back of the neck, which is the most sensitive skin surface of normally clothed subjects. Hence, as the authors outlined, for air movements not directed towards the neck and/or below the head level, we could easily expect higher draught limits. Furthermore, as the authors wrote, the air flow was supplied from a duct placed only 5 cm behind the neck, and the air flow was supplied inside the natural thermal plume rising from the shoulders and from the back of the subject. In practical situations, an horizontal air movement at low velocity, lower than 10-15 cm /s, while is crossing this thermal plume is deviated upwards and its horizontal component decreases considerably at the skin surface.
Draught Limit = 10% Draught Limit = 30%
(Draught Temp.) - (Neutral Temp.) [C]
Figure 2/9. 10% and 30% draught limits for fluctuating air movements from behind the neck, with an estimated frequency equal to 0.1 Hz. Data obtained from figure 5 of Ref. [3].
In these experiments it was probably indispensable to place the subject so close to the duct, due to the decay of the velocity oscillations and to the formation of harmonics downstream the outlet. Hence, wishing to expose the subject to periodically fluctuating air flows with a defined frequency, by means of a damper in the duct, it was indispensable to have the subject as much as possible close to the outlet of the supply.
Unfortunately the paper doesn’t provide any information about the instrumentation and the methodology adopted for air velocity measurements and frequency analysis. In one way, this

I
Chapter 2: Sensitivity to air movements 21
study has been developed in 1977: in this period, frequency analysis of a recorded velocity time history was very difficult to curry out and, probably, required also expensive equipment. Even though, this study provides a number of useful information on draught discomfort due to, periodically fluctuating air velocity. Indeed, as the authors also have written, in real indoor environment air movements fluctuates in a random way, hence it could be of practical value to extend this investigation with experiments on human response to typical fluctuating air flows in ventilated rooms.
It could be of practical value to explore the human reactions to typical fluctuating air flows in indoor climate such as, large scale vortex shed downstream an air supply, or to air velocity direction fluctuations, or more generally, to air flows with macroscale turbulent structure of typical flows in climatically controlled environments. Furthermore, in warm thermal conditions, velocity fluctuations could also be a mean to counteract the annoyance enhanced by warm air.
2.3 Air movements around the whole body
Even though, the ventilation system is designed to supply air flows at constant low velocity and controlled temperature, the resulting air movement in rooms is still strongly characterised by random fluctuations. In indoor climate, a laminar flow is an extremely rare exception which could exist only in very small areas.
As soon as air is supplied from an inlet, a shear layer forms between the incoming and the standstill air in the room, and large scale vortices develops by coalescence of the vorticity shed at the inlet of the air supply. These vortices show a time of permanence before being destroyed by non-linear cascading that allows them to reach a characteristically downstream distance. The formation of these vortices is generally associated to a preferred mode, Le. to a typical Strouhal number (St = fD/U). As an example, in the case of axisimmetric isothermal jet flows, the value of the Strouhal number was shown by Crow S.C. & Champagne F.H., Ref. [4], to be about 0.30. This implies that jets with the same Reynolds number, but different diameters, will shed vortices at frequencies (/), which scale with the inverse of the square of the diameter (.D). When large scale vortices loose their identity because of the development of cascading eddies and transition to turbulence, the fluid-dynamics in the room is dominated by the latter. Moreover, non uniform temperature distribution in the walls, heat sources like radiators or electronic devices, movements of the occupants, are other typical causes of shear layers from which vorticity is enhanced. The interaction of all these vortical structures will rise a complicate three dimensional air movement affected by fluctuations whose frequencies could vary from fractions of Hz, large scale vortical structures at low velocities, to several KHz, small scale eddies in developed turbulent flows. Also the noise level in the room significantly contributes to the formation of vortical structures, large eddies.
It is of fundamental importance to know the human reaction to air flow conditions of real indoor environment. On one hand, it is impossible to reproduce in laboratory an air flow representing the ”typical air flow ” of all occupied zones. Every indoor space is characterised by his own particular ’’random” air movement, determined by the combination of a wide number of factors. On the other hand, there are some physical properties of air flows that have a predominant impact on thermal and draught discomfort risk for the majority of the occupants: air temperature, air velocity, its turbulence intensity and its direction.

22 Todde V.: Sensitivity to draught in turbulent air flows
This section starts with a work of P.O. Fanger and N.K. Christensen, Ref. [5], aimed at analysing the human response to air flows at mean air velocity combined with turbulence intensity according to typically ventilated spaces. This work has been further extended to air flows with a wider turbulence intensity domain, Ref. [6], to evaluate the impact of the latter on draught discomfort and to provide a comprehensive draught chart. In mechanically ventilated spaces, the type of ventilation system determine also the direction of air flow. Two works, Refs. [7 and 8], dealing with discomfort due to draught at different orientations, have been analysed. In all these studies the subjects were entirely exposed to the air flow. In this contest, draught has lost the ’’local” feature, but the sensitivity and discomfort to the air movement has been always referred to local surfaces of the human body.
2.3.1 Sensitivity to air movements of typically ventilated spaces
An investigation dealing with perception and sensitivity to horizontal air movements of typically ventilated spaces has been curried out by P.O. Fanger and N.K. Christensen, Ref. [5]. A draught chart, based on the human response to air movements, has been elaborated, to predict the percentage of people dissatisfied of draught as a function of mean air velocity and air temperature. The turbulence level corresponding to the mean air velocities investigated has been fixed in a way to reproduce air flows in typically ventilated spaces in practice. This chart applies for people while performing sedentary activity, office works, in neutral thermal condition. The human response to local air movements is fundamental to provide proper criteria to design air supply in occupied zones. The global convective heat loss for the entire human body is an indispensable quantity to evaluate heat balance for the whole human body and to elaborate a mathematical model to predict the thermal sensation for the whole body. This model doesn’t fit properly while the subject is exposed to a local cooling effect due to air movement. Hence, the necessity to explore the effects of local air flows on human sensation. In the mentioned work the term ’’draught” identifies ”an unwanted local cooling effect of the human body caused by air movement”.
Air Temp.= 26 C Air Temp = 20 C Air Temp = 23 C
Mean Air Velocity [m/s]
Velocity Range
20 40 60 80 100 120 140 160Exposure Duration [minutes]
Experimental Plan
Figure 2/10. Left graph: relative turbulence intensity versus mean air velocity during the three experiments. Right graph: planned mean air velocity in each experiment. Data obtained from figures 8 and 1 respectively, of Ref. [5].

Chapter 2: Sensitivity to air movements 23
In this investigation 100 subjects, 50 females and 50 males in good health, participated at three experiments of two and half hour each one. They were seated in a wide climate chamber were the air supply system was able to generate an horizontal air movement as in typically ventilated, spaces, directed to the subject from behind. The sensors for air velocity and air temperature measurements were placed 1.1 m above the floor at a distance of 15 cm from the back of theneck. The air velocity was recorded with a sampling rate of 10 Hz. From measurements done with mannequins exposed to the same air flow conditions of this experiment, air velocity was also estimated at the feet and at the location of elbows of the test persons.
Each of these experiments was performed at the constant air temperature of 20,23 and 26°C, respectively. In the left graph of figure 2/10, is reproduced the level of air velocity turbulence in all the three experiments versus mean air velocity. In the first hour of every experiment the subject was invited every 10 minutes to adjust his amount of clothes in order to achieve a neutral thermal condition. During this first period of thermal adaptation, mean air velocity was kept at the constant value of 0.2 m/s. Afterwards, the subject was exposed to 6 defined air mean velocities from 0.05 to 0.40 m/s, during 6 subsequent 15 minutes periods, as shown in the right graph of figure 2/10. From one period to the next one, the mean air velocity was always increasing. After 5, 10 and 15 minutes from the beginning of every period, the subject replayed to questions dealing with his thermal sensation for the entire body, the perception of air movement, whether it was uncomfortable and where. If a minimum of two of the three answers defined the air movement ’’uncomfortable”, then the air velocity was considered as ”draught’, i.e an unwanted cooling air movement.
70
13 50 'S9%40
0 30
1g 20
K
Dissatisfied Subjects
O Air Temp.= 26 C □ Air Temp.= 23 C A Air Temp.= 20 C
A
□
A t
' >□
<
£
i0
i :0.0 0.05 0.1 0.15 0.2 0.25 0.3 0.35
Mean Air Velocity [m/s]
70
13 505•a
0 30i
1 20
10
0.4 0.45
Dissatisfied Subjects
A female test persons O male test persons
0.0 0.05 0.1 0.15 0.2 0.25 0.3 0.35 Mean Air Velocity [m/s]
0.4 0.45
Figure 2/11. Left graph: the percentage of dissatisfied subjects, feeling draught at the head region, versus mean air velocity at 20, 23 and 26°C. Right graph: percentage of dissatisfied male and female test persons, feeling draught at the head region; responses at 20,23 and 26°C are pooled. Data obtained from figures 9 and 11 respectively, of Ref. [5].
From the results of this investigation it was observed that the head region, which includes the head, the neck, the shoulders and the upper part of the back, was the most sensitive to draught. Hence, the analysis of the human response has been referred to the results obtained for the head region. The left graph of figure 2/11, shows the percentage of subjects dissatisfied

24 Todde V.: Sensitivity to draught in turbulent air flows
of draught, ie. those feeling a draught at the head region, as a function of air velocity, with air temperature as a parameter. It is evident the impact of air temperature: the lower the air temperature, the higher the percentage of people dissatisfied. The results have been also analysed separately for men and women and no significant differences have been obtained. In the right graph of figure 2/11, the percentage of people feeling draught at the head region is compared between the two genders; the responses at all the three temperatures are pooled. It is possible to notice a little higher dissatisfied percentage for women, along the entire velocity range.
The experiments with the subjects were curried out during the whole day from the morning till the late evening. It has not found any relevant impact of the day time on the percentage of draught dissatisfaction. The experimental methodology was planned in a way to keep the subject in neutral thermal sensation for the entire body, during the last one and half hour exposure to air movements. This condition has not been completely respected. In the experiments at 20°C the vote was slightly under the neutral point and decreasing to "slightly cool” as air velocity was increased. At 26°C the vote was slightly above neutral with a tendency to decrease as air velocity increased. It was then possible to analyse the results with the global thermal sensation as a parameter. It has been found out that, at air temperature of 20°C, the percentage of dissatisfied was higher for the subjects with cooler thermal sensation in the lower air mean velocity range, and vice-versa at higher velocities. At air temperature of 23°C, the subjects with cooler thermal sensation have shown an higher percentage of dissatisfied in the whole velocity range. Even though, the authors conclude that this effect has no consistent influence of the thermal sensation although a cooler general thermal sensation seems to increase draughts complaints at low velocities and decrease draught complaints at high velocities. Results at air temperatures of 2CPC and 23°C are shown in figure 2/12.
Thermal Vote Impact Thermal Vote Impact
------ Thermal Vote = 0.0....... Thermal Vote = - 0.5------ Thermal Vote = -1.0
Temperature = 20 C
0.0 0.05 0.1 0.15 0.2 0.25 0.3 0.35 0.4 0.45
-------Thermal Vote = 0.0...... Thermal Vote = + 0.5-------Thermal Vote = -1.0
= 23 C
0.0 0.05 0.1 0.15 0.2 0.25 0.3 0.35 0.4 0.45Mean Air Velocity [m/s] Mean Air Velocity [m/s]
Figure 2/12. The percentage of dissatisfied subjects according to the thermal sensation, at airtemperatures of 20 and 23°C. Data obtained from figures 14 and 15 of Ref. [5].
Another result of this investigation was the estimation of the percentage of people who could perceive air movement. It was observed that this perception is independent of air temperature. The results obtained at the three air temperatures show nearly the same percentage at a defined

!
Chapter 2: Sensitivity to air movements 25
mean air velocity, figure 17 of ref. [5]. Moreover, this percentage is definitely higher than the one denoting the dissatisfied subjects to air movement.
t ' 1As the main purpose of this work, a draught chart has been elaborated to predict the percentage of dissatisfied subjects to draught as a function of air temperature and mean air velocity. This chart applies to sedentary people in typically ventilated occupied zones. This percentage could be evaluated from figure 2/13 obtained with the following equation:
Pi) = 13800fv -0.04 V
+ 0.0293y
-0.000857 (2:1)
Draught Chart
Data from Ref.[5] Data from Ref.[l]
Air Temperature [C]
Figure 2/13. Draught chart for sedentary persons, wearing normal indoor climate clothing, exposed to air movements of typically ventilated spaces. Data from previous equation 2:1. Results from Ref. [1] are also shown with the dotted line.
The authors conclude the article with a number of observations. They outline that the results they obtained indicate higher percentages of dissatisfied subjects to draught than in previous investigations, Ref. [1] and [2]. They attributed this difference to the effects of relative turbulence intensity of air velocity. Air velocity fluctuations seem to cause fluctuations of the skin temperature, which initiate warning signals to the brain. These signals could be the origin of the dissatisfaction feeling. On the other hand, the air velocity measurements done in the study of Refs. [1 and 2], were curried out without the presence of the test persons; considering the experimental design of these works, (the subject was placed very close to the outlet of air supply), this has probably lead to an over-estimation of air velocity. Furthermore, turbulence is responsible of an increase of the rate of heat absorbed by the air flow, by convection, from the skin surface. Also from a heat transfer point of view, air temperature plays an important role on the percentage dissatisfied by draught. It is surprising that this effect seems do not have any impact on the perception of air movements, see figure 17 of Ref. [5].

26 Todde V,: Sensitivity to draught in turbulent air flows
This work provides an useful tool for assessing indoor climate in occupied zones and, as the authors of the article outlined, gives a number of indications to implement existing standards. Even though, the methodology followed during the experiment and the air velocity measurement system adopted could had lead to imperfections in the results. The subjects participating at the experiment were performing the sensitivity to six conditions of air velocity in a continuous row. They were exposed to subsequent periods of constant air velocity condition from low to high level, without any pause between each single period. In this contest, the human response could be also affected by the transitional situation. As the skin surface is exposed to air movements, its temperature starts to decrease, and, consequently, also the sensitivity to air movements slow down. Moreover, as the skin temperature decreases the thermal plume rising from the body loose of intensity as well With the methodology adopted in this experiment there is an high risk that the sensitivity during one period is affected also by the air flow condition of the previous period as well To avoid this aspect, equilibrium of the skin temperature should be achieved before the starting of each period. This could be done with an interposition of a pause between the different periods, without any air movement, to let the skin temperature to recover his stable value while no air movements are present. Indeed, in this way the investigation would require a large amount of experimental hours with a probably consistent increase of costs and experimental duration as well A similar experimental methodology was also followed in Refs. [6 and 8].
In the first hour of the experiment, the subjects were constantly exposed to an air velocity of 0.2 m/sec, at which, the draught chart of this study, associates a percentage of dissatisfied subjects of around 30 % at 20 °C and nearly 20 % at 23 °C. Hence, when the subjects started the experiment at low air velocity, they were stepping from a condition with already a certain risk of discomfort to a potentially lower one.
Referring to the previous figure 2/13, we can observe an evident qualitative difference between the results of this work and the results of the study in Ref. [1]. In fact, in this work the lines denoting the mean air velocity at a prescribed percentage of dissatisfied are nearly linear: their slope is constant along all the temperature domain, while, in Ref. [1], the line of 10% dissatisfied, based upon the drop in skin temperature, has an increasing slope versus air temperature, see figure 15 of Ref. [1]. This difference could be due to the different methodology adopted for the experimental exposure.
The design of the climate room, the air supply system adopted and the location of the test person were intended to obtain an horizontal air flow mostly directed towards the test person from behind. Considering also the high vulnerability of low speed air flows to disturbances, the air velocity was probably affected by fluctuations in intensity and direction as well. The velocity sensor used for air velocity was not able to detect air velocity direction and his constant time, 10 Hz, seems to be too much high for measurements of turbulent flows. Air velocity lower than 0.2 m/s are very difficult to measure, due to the natural convection affecting the response of the velocity sensor. In this contest the velocity sensor is extremely sensitive to changes of flow direction in vertical plane. The combination of these effects could had been responsible of an over estimation of the mean air velocity directed towards the back of the test person and of the turbulence intensity. From a qualitative point of view, the effects of this eventual draw-back on the final results of the draught chart could be identified with an under estimation of the percentage of dissatisfied at a prescribed mean air velocity. Any quantification of this effect cannot be estimated without a detailed knowledge of the air
Chapter 2: Sensitivity to air movements 27
distribution in the climate chamber and information about the methodology used for the velocity sensor calibration.
Indeed, measurements of low speed air flows in ventilated rooms are very difficult to obtain with accuracy. To correlate the human response to such a measurements it’s even more delicate and also a frustrating task. This work, besides all the details on the methodology and flow measurements that could have lead to under, or over estimation of the percentage of dissatisfied, represents a first comprehensive study on draught, providing a number of information on factors affecting draught sensitivity and discomfort in real indoor climate conditions.
2.3.2 Effects of air velocity turbulence
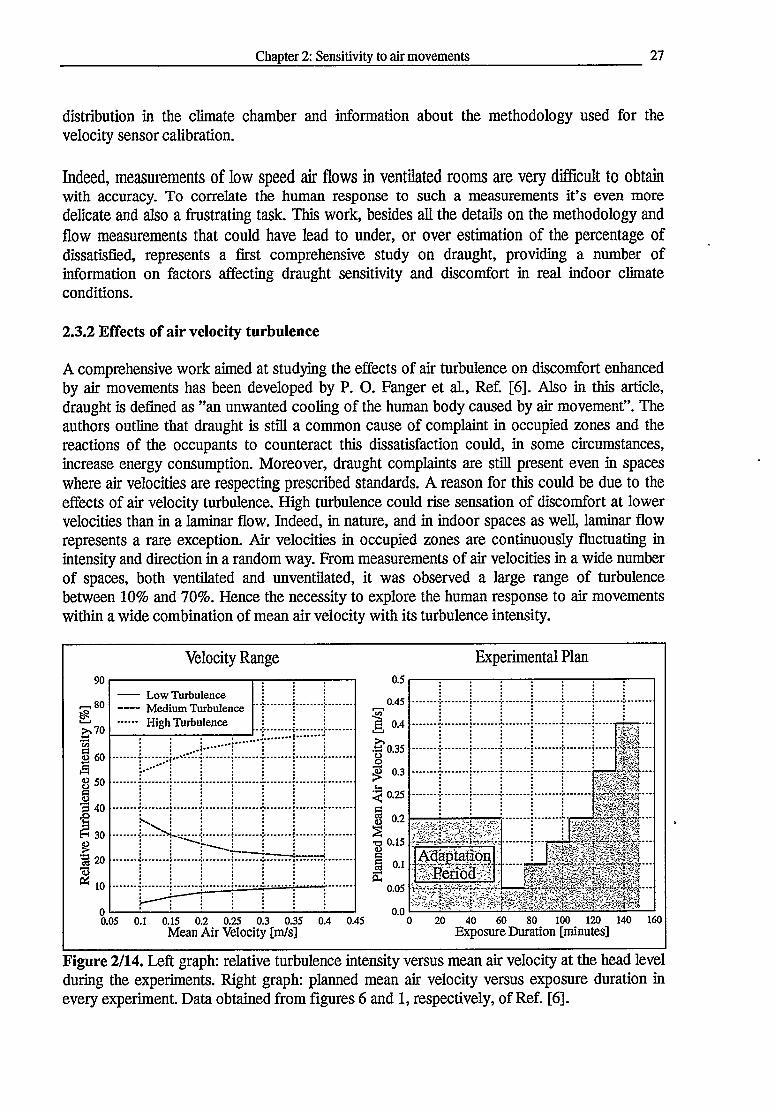
A comprehensive work aimed at studying the effects of air turbulence on discomfort enhanced by air movements has been developed by P. O. Fanger et aL, Ref. [6]. Also in this article, draught is defined as ’’an unwanted cooling of the human body caused by air movement”. The authors outline that draught is still a common cause of complaint in occupied zones and the reactions of the occupants to counteract this dissatisfaction could, in some circumstances, increase energy consumption. Moreover, draught complaints are still present even in spaces where air velocities are respecting prescribed standards. A reason for this could be due to the effects of air velocity turbulence. High turbulence could rise sensation of discomfort at lower velocities than in a laminar flow. Indeed, in nature, and in indoor spaces as well, laminar flow represents a rare exception. Air velocities in occupied zones are continuously fluctuating in intensity and direction in a random way. From measurements of air velocities in a wide number of spaces, both ventilated and unventilated, it was observed a large range of turbulence between 10% and 70%. Hence the necessity to explore the human response to air movements within a wide combination of mean air velocity with its turbulence intensity.
------ Low Turbulence------ Medium Turbulence........ High Turbulence
Mean Air Velocity [m/s]
Velocity Range
•ti 0.35
20 40 60 80 100 120Exposure Duration [minutes]
Experimental Plan
Figure 2/14. Left graph: relative turbulence intensity versus mean air velocity at the head level during the experiments. Right graph: planned mean air velocity versus exposure duration in every experiment. Data obtained from figures 6 and 1, respectively, of Ref. [6].

28 Todde V.: Sensitivity to draught in turbulent air flows
The experiment was developed with 50 healthy subjects, 25 females and 25 males. They participated at three tests of two and half hours each one. In every test the subject was exposed to an air flow from behind at a prescribed turbulence intensity. During the test, after an adaptation period of one hour, the mean air velocity was changed within six subsequent periods of 15 minutes, from a minimum of around 0.1 m/s till the velocity of around 0.4 m/s. The planned relative turbulence intensity in every test was 12 % in the test at low turbulence, between 20 and 35 % in the test with medium turbulence, higher than 55 % in the third test at high turbulence. The air temperature was kept at the constant value of 23°C in all the three tests. The experimental methodology was practically the same as the one adopted for the study in Ref. [5]. In figure 2/14 are shown the velocity domain of each experiment, left graph, and the planned mean velocity versus duration exposure of every experiment, right graph.
The climate room was equipped with an air supply system generating air movements with the three planned levels of turbulence. Low and high turbulence intensity tests were curried out with the subject seated, respectively, in the core and in the developed region of a large horizontal jet. The test at medium turbulence was provided with the use of fans placed in the ceiling. For more details of the climate room design see figure 2 of Ref. [6], In the first hour of the experiment, adaptation period, the subjects were invited to modify clothing to obtain a neutral thermal condition. While they were exposed to air movements they had to replay to a questionnaire similar to the one of Ref. [5], explained in the previous section. Air velocity and temperature were recorded at a distance of 0.15 m behind the neck at an height of 0.1, 0.6 and1.1 m above the floor.
Dissatisfied Subjects Dissatisfied Subjects60
■§•g40383 30
0 §>B 20 §1&, io
O Turb. < 12%□ 20% < Turb. <35%A Turb. > 55%
LA
i
k 4>
4 i
&
lJ
[1 <
]>
I00.0 0.05 0.1 0.15 0.2 0.25 0.3 0.35 0.4 0.45
Mean Air Velocity [m/s]
60
'5 40
Q 30<4-4OaB 20 §go* 10
A female test persons O male test persons
o
0f
4
> :
l< <0.0 0.05 0.1 0.15 0.2 0.25 0.3 0.35 0.4 0.45
Mean Air Velocity [m/s]
Figure 2/15. Left graph: percentage of subjects dissatisfied to draught at the head region versus air mean velocity. Right graph: percentage of female and male subjects dissatisfied to draught at the head region; results from experiments at high, medium and low turbulence level are pooled. Data obtained from figures 9 and 10 respectively of Ref. [6].
The percentage of people dissatisfied of the air movement, (PD), in the head region, is plotted versus mean air velocity, recorded behind the neck, in the left graph of figure 2/15. The effects of air velocity turbulence are remarkable. For instance, at an air mean velocity of around 0.2 m/s, the results from experiments at medium turbulence indicate a PD close to 10 %, and it increases till 40% in the experiments at high turbulence. Based on the results dealing with the
Chapter 2: Sensitivity to air movements 29
head region, an analysis has been developed to find eventual effects of gender, length of hair and subject’s self estimation of draught sensitivity. The results, as shown in the right graph of figure 2/15, indicate a little higher draught-sensitivity for women at low mean air velocity.
The impact of the length of the hair on the PD seems to be insignificant. It has found a good agreement between the self-impression of the subjects about their sensitivity to draught and the resulting trend of PD. All these factors didn’t show any significant impact on the detection of air movement, see figures 14,15 and 16 of Ref. [6].
The neutrality of the thermal sensation for the entire body was respected for nearly all the duration of the experiment. The mean thermal vote decreased a little only in the last period. The authors motivate the increase of PD at higher relative turbulence intensity from a heat transfer rate point of view. Convective heat transfer increases with turbulence. The fluctuations of the skin temperature induced by air movement fluctuations, seem to be also responsible of dissatisfaction feelings.
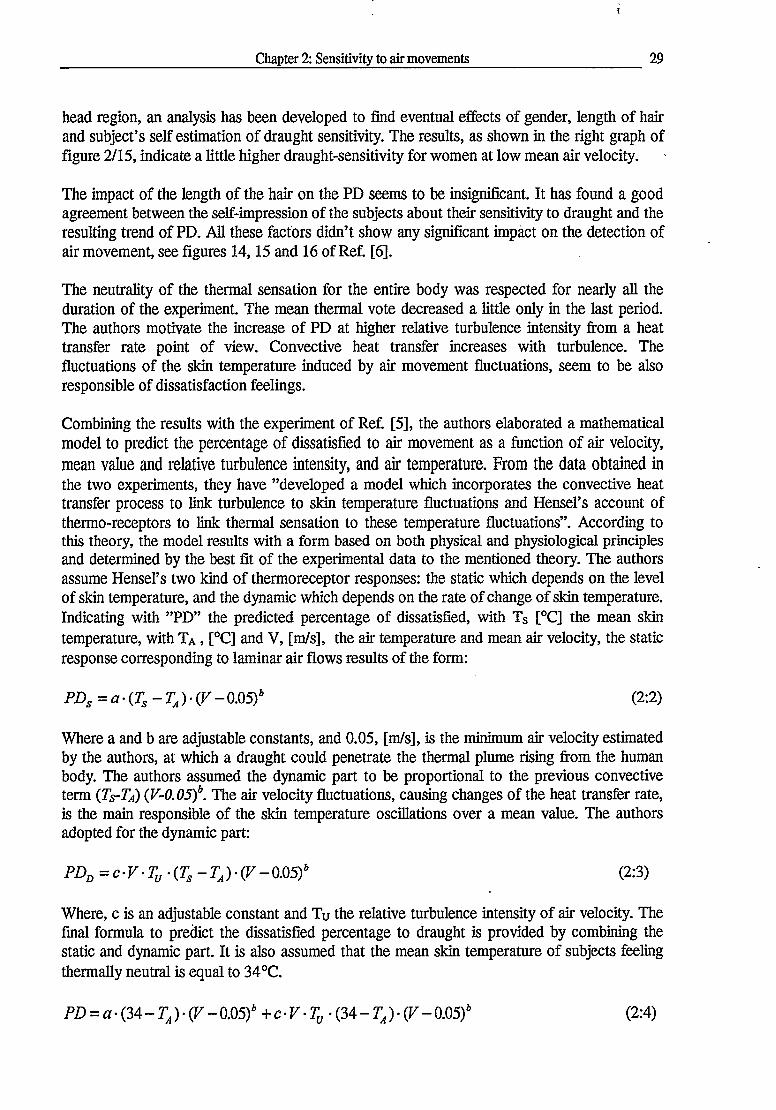
Combining the results with the experiment of Ref. [5], the authors elaborated a mathematical model to predict the percentage of dissatisfied to air movement as a function of air velocity, mean value and relative turbulence intensity, and air temperature. From the data obtained in the two experiments, they have ’’developed a model which incorporates the convective heat transfer process to link turbulence to skin temperature fluctuations and Hensel’s account of thermo-receptors to link thermal sensation to these temperature fluctuations”. According to this theory, the model results with a form based on both physical and physiological principles and determined by the best fit of the experimental data to the mentioned theory. The authors assume Hensel’s two kind of thermoreceptor responses: the static which depends on the level of skin temperature, and the dynamic which depends on the rate of change of skin temperature. Indicating with ”PD” the predicted percentage of dissatisfied, with Ts [°C] the mean skin temperature, with TA, [°C] and V, [m/s], the air temperature and mean air velocity, the static response corresponding to laminar air flows results of the form:
PDs=a-(Js-TA)-{V-M5)b (2:2)
Where a and b are adjustable constants, and 0.05, [m/s], is the minimum air velocity estimated by the authors, at which a draught could penetrate the thermal plume rising from the human body. The authors assumed the dynamic part to be proportional to the previous convective term (Ts-TA) (V-0.05)b. The air velocity fluctuations, causing changes of the heat transfer rate, is the main responsible of the skin temperature oscillations over a mean value. The authors adopted for the dynamic part:
fDo=cF.%,.(%-%).(F-0.05)* (2:3)
Where, c is an adjustable constant and Tu the relative turbulence intensity of air velocity. The final formula to predict the dissatisfied percentage to draught is provided by combining the static and dynamic part. It is also assumed that the mean skin temperature of subjects feeling thermally neutral is equal to 34°C.
PD = a-(34-TA)-(y-0.05)b +c-V-Tv *(34-7^)-(F-0.05)6 (2:4)

30 Todde V.: Sensitivity to draught in turbulent air flows
The values of the empirical coefficients a, b and c have been obtained with the best fitting of the experimental data: a = 3.143 , b = 0.6223 , c = 0.3696.
This model applies for air temperature between 20 and 26°C, mean air velocity from 0.05 to 0.40 m/s, within turbulence level between 10% and 70%, and has been included in European, American and international standards for indoor environment. In figures 2/16 and 2/17, are reproduced examples of lines denoting the predicted percentage of dissatisfied subjects with equation 2:4. In every graph the relative turbulence intensity is a fixed parameter, and the lines are drawn for a prescribed air temperature as indicated in the graphs.
------ Air Temp = 20.0------ Air Temp = 21.0-----Air Temp = 22.0....... Air Temp = 24.0----- Air Temp = 26.0
------ Air Temp = 20.0------ Air Temp = 21.0------Air Temp = 22.0........ Air Temp = 24.0----- Air Temp = 26.0
Draught Chart; Turbulence =10%
Mean Air Velocity [m/s]
Draught Chart; Turbulence = 20%
Mean Air Velocity [m/s]
Figure 2/16. Percentage of dissatisfied subjects due to draught: predictions from the model elaborated in Ref. [6], with equation 2:4. Left graph: Tu = 10%; right graph: Tu = 20%.
Draught Chart; Turbulence = 30% Draught Chart; Turbulence = 40%
------ Air Temp = 20.0------ Air Temp = 21.0------ Air Temp = 22.0........ Air Temp = 24.0----- Air Temp = 26.0
0.0 0.05 0.1 0.15 0.2 0.25 0.3 0.35 0.4 0.45
Air Temp = 20.0 Air Temp = 21.0 Air Temp = 22.0 Air Temp = 24.0 Air Temp = 26.0
0.0 0.05 0.1 0.15 0.2 0.25 0.3 0.35 0.4 0.45Mean Air Velocity [m/s] Mean Air Velocity [m/s]
Figure 2/17. Percentage of dissatisfied subjects due to draught: predictions from the model elaborated in Ref. [6], with equation 2:4. Left graph: Tu = 30%; right graph: Tu = 40%.

Chapter 2: Sensitivity to air movements 31
2.3.3 Effects of air velocity direction
In 1987, Mayer E. and Schwab R. developed an experimental investigation to observe the influence of air flow direction on the percentage of subjects feeling discomfortable air movement, Ref. [7]. This work has been developed in a climatic test chamber, where conditioned air flow was flowing into the chamber at 23°C at low level of turbulence intensity. The authors observed the human response of fifty subjects, 25 females and 25 males, to air flows with vertical and horizontal directions: upward, downward, from rear and front. The air flow was introduced into the room and directed to the seated subject, according to the flow direction, through a perforated ceiling, floor and wall The human response to every flow direction was observed while the air mean velocity was increased from 0.10 to 0.45 m/s in five steps of ten minutes. The relative turbulence intensity of air velocity was always 5% and the relative humidity between 20% and 50%. For every flow direction, the subject began the experiment with a first period of acclimatisation in still air (30 minutes). Then, every ten minutes, he was exposed to constant air mean velocity flow: 0,2 m/s, 0.1 m/s, 0.2 m/s, 0.3 m/s, 0.4 m/s and 0.45 m/s. At the end of each period they were asked if any uncomfortable air movement was felt at the face and/or at the neck. All the test persons performed the experiments wearing a training suit (0.8 do), performing sedentary activity.
The results obtained with vertical air flows, upward and downward, are shown in graph A of Figure 2/18, with indications of the percentage of subjects feeling discomfortable air movements at the face. According to the results of this graph, the upward air flow is considerably more uncomfortable than the downward air flow.
Graph A: Vertical Air Flows Graph B: Horizontal Air Flows
Mean Air Velocity [m/s] Mean Air Velocity [m/s]
Figure 2/18. graph A: percentage of dissatisfied subjects feeling discomfortable air movements at the face, due to upward and downward air flows. Graph B: percentage of dissatisfied subjects feeling discomfortable air movements at the face and neck, due to horizontal air movements. Data obtained from figures 2 and 3, respectively, of Ref. [7].
For draught discomfort at the neck, it has not found any significant difference between upward and downward air flows. Graph B of figure 2/18 shows the percentage of dissatisfied subjects, Le. those who felt uncomfortable air movement, observed during the experiments with

32 Todde V.: Sensitivity to draught in turbulent air flows
horizontal air flows. These results indicate a higher risk of draught discomfort for horizontal air flows blowing towards the neck than towards the face.
The authors present also the results obtained from measurements of the convective heat transfer coefficient at the face surface of a heated artificial head. In figure 2/19, the convective heat transfer coefficient is plotted versus air mean velocity for upward and downward air flows. This graph reveals clear evidence how this coefficient is higher for upward air flows. Moreover, it provides a physical explanation of the impact of air flow direction on draught discomfort due to vertical air movements, as shown in graph A of figure 2/18. Indeed, as the authors outline, also physiological aspects affect draught sensation. This is evident in graph B of figure 2/18: air flows with same velocity, turbulence intensity, direction (horizontal) and temperature cause different risk of draught discomfort.
Convective Heat Transfer Coefficient Measured at The FaceMio1,
I’
s*
rF
§u
O ....... Upward Air How□----- Downward Air Flow
........
... "
--------
..... -
Ss
r
ss
//s
1 0.0 0.05 0.1 0.15 0.2 0.25 0.3
Mean Air Velocity [m/s]0.35 0.4 045 0.5
Figure 2/19. Convective heat transfer coefficient at the face of a heated artificial head, with surface temperature equal to 34°C. Data obtained from figure 4 of Ref. [7].
This work shows clearly how air velocity direction towards the human body plays an important role on the sensitivity to air movements. Besides all the details dealing with the methodology of the experimental procedure and the results obtained, the paper doesn’t give a comprehensive information on the measurement system adopted, especially the resolution of the data acquisition from the velocity sensor, how the probe has been calibrated for the different velocity directions. In the contest of low air velocity, the answer of hot wire anemometry is strongly affected by the direction of the air flow. This is due to the interaction between natural and forced convection at the velocity sensor. To overcome this problem, it is of fundamental importance to calibrate the instrument for the different velocity directions. In fact, if we use an hot wire, calibrated with horizontal air flow, to measure downward velocities, we will obtain a significant under estimation of the air velocity. The opposite happens if we measure an upward air velocity. This aspect is particularly pronounced for air velocities lower than 20 cm/s and gains importance as air velocity decreases. This eventual drawback for the anemometry calibration is enough to lead to considerable errors of the results dealing with vertical air flows.

Chapter 2: Sensitivity to air movements 33
Unfortunately are missing some details of the experimental methodology, which could allow to better understand and interpret the results. There are no indications weather the velocity measurements were recorded with or without the presence of the test person in the room, and the location of the measurement points is not referred to the position of the test person. No indications are provided if the test person was exposed to a homogeneous air velocity fields, ie. if all the subject’s body surface facing to the air movement was exposed to the same air flow conditions. Also the thermal vote of the subjects, which affects the sensitivity to draught (see Ref. [3]), is not reported.
A recent investigation developed by Toftum J., Zhou G. and Melikov A, Ref. [8], deals with the human response to air flows blowing from five directions at three air temperature levels. During 15 experiments, forty subjects, 20 females and 20 males, performed their sensitivity to three horizontal air flow directions, from the front, the behind and the left side, and to two vertical air flows, upward and downward, at the air temperature of 20, 23 and 26°C. The subjects were seated at a desk in a climate room, performing light typical office activity. In every single experiment, the air flow direction and temperature were kept constant, while mean air velocity was increased from around 0.05 to 0.40 m/s, within subsequent periods of 15 minutes. Every single experiment began with an adaptation period of 45 minutes, while air velocity was maintained at a level of 0.2 m/s, to let the subject achieve a thermal neutral sensation by adjusting his clothing. Afterwards, during five periods of 15 minutes, the air mean velocity was provided at the values of around 0.05, 0.10, 0.20, 0.30 and 0.40 m/s respectively. In table 2-4 are indicated the air flow properties measured in every period for all the five directions.
During the single period at constant mean air velocity, the subject was invited every five minutes to indicate the thermal sensation for the whole body, the perception of air movements, and the eventual parts of human body where the air movement was felt as uncomfortable. An air velocity level was considered to cause draught when at least two answers indicated an uncomfortable feeling. In this study the term draught indicates ’’an unwanted local convective cooling of the skin”.
Table 2-4. Mean air velocity and ranges of turbulence intensity in all 15 minutes velocity periods at the five air flows directions. Data obtained from tables 1 and 2 of Ref. [8].________
Mean air velocity [m/s]Airflowdirection
Range of turbulence
[%1
Period of adaptation Period 1 Period 2 Period 3 Period 4 Period 5
From below 3-6 0.21 0.05 0.11 0.21 0.30 0.41From above 16-29 0.21 0.16 0.16 0.22 0.31 0.41From behind 5-16 0.20 0.07 0.12 0.20 0.29 0.39From front 10-23 0.20 0.06 0.11 0.19 0.30 0.40From side 9-20 0.20 0.07 0.11 0.20 0.31 0.40
Air velocity and air temperature were recorded with a sampling rate of 2 Hz, during successive periods of 220 sec. Attention was aimed to obtain air flows with minimum directional oscillations, horizontally and vertically. Even though, the air velocity profile at the position of the subject was not completely uniform. Hence, at horizontal exposures, the mean air velocity was controlled according to the air velocity measurements at an height of 1.1 m, between the subject and the wind-box generating the air flow, at a distance of around 0.2 m from the
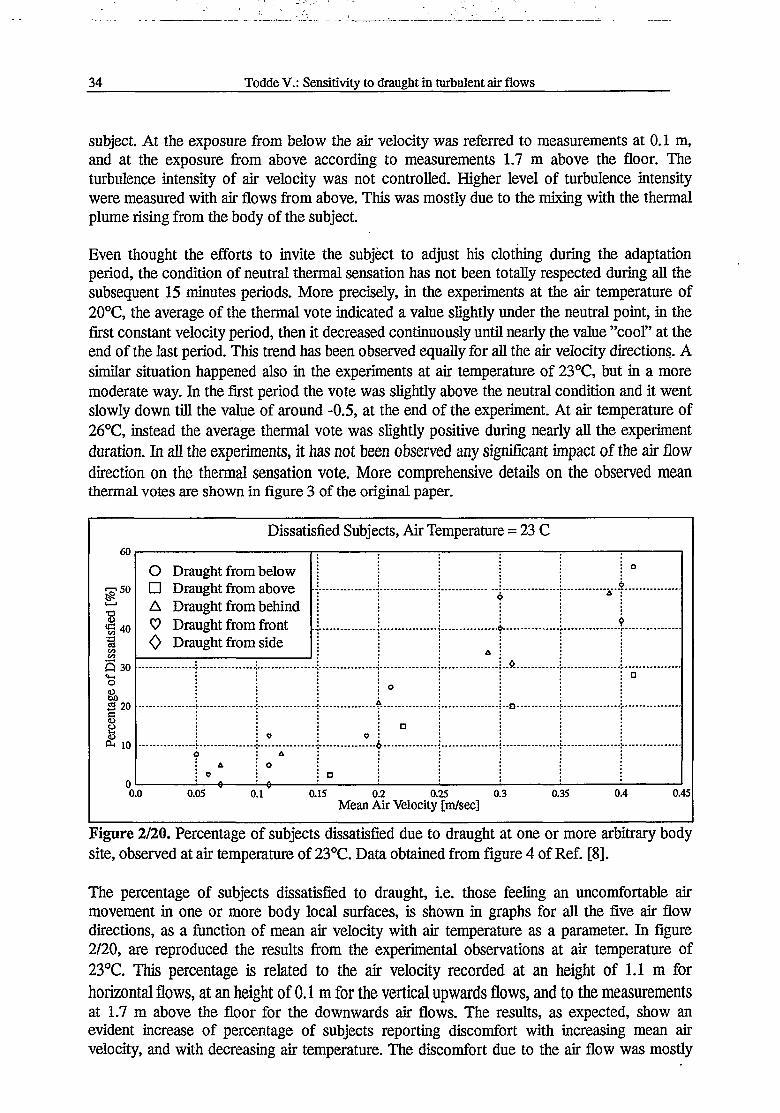
34 Todde V.: Sensitivity to draught in turbulent air flows
subject. At the exposure from below the air velocity was referred to measurements at 0.1 m, and at the exposure from above according to measurements 1.7 m above the floor. The turbulence intensity of air velocity was not controlled. Higher level of turbulence intensity were measured with air flows from above. This was mostly due to the mixing with the thermal plume rising from the body of the subject.
Even thought the efforts to invite the subject to adjust his clothing during the adaptation period, the condition of neutral thermal sensation has not been totally respected during all the subsequent 15 minutes periods. More precisely, in the experiments at the air temperature of 20°C, the average of the thermal vote indicated a value slightly under the neutral point, in the first constant velocity period, then it decreased continuously until nearly the value ’’cool” at the end of the last period. This trend has been observed equally for all the air velocity directions. A similar situation happened also in the experiments at air temperature of 23°C, but in a more moderate way. In the first period the vote was slightly above the neutral condition and it went slowly down till the value of around -0.5, at the end of the experiment. At air temperature of 26°C, instead the average thermal vote was slightly positive during nearly all the experiment duration. In all the experiments, it has not been observed any significant impact of the air flow direction on the thermal sensation vote. More comprehensive details on the observed mean thermal votes are shown in figure 3 of the original paper.
60
g50
•5 40
Q 300 &5 20
16 10
Dissatisfied Subjects, Air Temperature = 23 C
0.0 0.05 0.1 0.15 0.2 0.25 0.3Mean Air Velocity [m/sec]
0.35
O Draught from below □ Draught from aboveA Draught from behind V Draught from frontO Draught from side
O
' * A
<
A............
O□
9 9D
<A
9A
AO
□0.4 0.45
Figure 2/20. Percentage of subjects dissatisfied due to draught at one or more arbitrary body site, observed at air temperature of 23°C. Data obtained from figure 4 of Ref. [8].
The percentage of subjects dissatisfied to draught, ie. those feeling an uncomfortable air movement in one or more body local surfaces, is shown in graphs for all the five air flow directions, as a function of mean air velocity with air temperature as a parameter. In figure 2/20, are reproduced the results from the experimental observations at air temperature of 23°C. This percentage is related to the air velocity recorded at an height of 1.1 m for horizontal flows, at an height of 0.1 m for the vertical upwards flows, and to the measurements at 1.7 m above the floor for the downwards air flows. The results, as expected, show an evident increase of percentage of subjects reporting discomfort with increasing mean air velocity, and with decreasing air temperature. The discomfort due to the air flow was mostly

Chapter 2: Sensitivity to air movements 35
felt in the body areas directly exposed to the air movements and, predominantly, in the bared skin surfaces. Within vertical upwards air movements, feet, legs and lower back were the regions most sensitive to draught; within downwards air movements, draught was felt in the? neck, shoulders and hands. Instead, within horizontal air movements, the most sensitive regions were the neck, back, shoulders and legs for air movements from behind; face, hands and knees for air movements from the front; knee and arm exposed to the air flow for air movements from the side. Generally, in agreement with earlier draught discomfort investigations, the head region has been observed as the most sensitive to draught.
The results of this study show clearly that the effect of air flow direction on draught discomfort depends on the temperature level At an air temperature of 20 and 23°C the highest percentage of discomfort was observed at exposure to air movements from below, while the horizontal air flow directions had nearly the same impact on draught discomfort: no significant differences on the dissatisfied percentage have been found among the horizontal air flow directions. A definitely lower percentage of dissatisfied due to draught has been found for air flows from above. At 26°C, the percentage of dissatisfied is considerably reduced to low values for all the air flow directions and it is possible to notice a weak higher discomfort due to air flows from above and behind, at air mean velocities higher than 0.2 m/s.
Graph A: Air Flow From Behind Graph B: Air Flow From Behind
Draught Temp. = 20 C Draught Temp. = 23 C Draught Temp. = 26 C
------ Ref. [6]
0.0 0.05 0.1 0.15 0.2 0.25 0.3 0.35 0.4 0.45
Ref. [7]□----- Ref. [8]
0.0 0.05 0.1 0.15 0.2 0.25 0.3 0.35 0.4 0.45 0.5Mean Air Velocity [m/s] Mean Air Velocity [m/s]
Figure 2/21. Graph A: Comparison of prediction made with the model of Ref. [6] with the observed results in [8], for the head region, at air flows from behind. Graph B: Comparison between the observed results of Ref.[7] with Ref. [8], at air flows from behind (head), at 22PC.
The observed percentage of dissatisfied to horizontal air flow from behind, in the head region, has been compared with the draught model of ref. [6], graph A of figure 2/21. At the air temperature of 23 and 26°C the model predicts an higher percentage of dissatisfied than the one observed in this investigation. The thermal sensation of the subjects, especially at air temperature of 20 and 23 °C were on average below the neutral point. This situation, according to several studies, should increase the percentage of dissatisfied to draught referring to the neutral thermal condition, see for instance Ref. [3]. Instead the results of this work report a lower percentage than the model of ref. [6], which has been elaborated from results of experiments where the thermal neutrality of the subjects was nearly well respected. Even

36 Todde V.: Sensitivity to draught in turbulent air flows
though, it is possible to observe a relatively good agreement between the observed and thepredicted percentage of dissatisfied.
The percentage of dissatisfied to air movements in the face from below, above, the front and in the neck for flows from behind is compared with the results of Mayer and Schwab, Ref. [7]. In this last study, at the air temperature of 23°C, was observed a considerable higher percentage of dissatisfied, independently of the air flow direction, see graph B of figure 2/21 for air flows from behind. The percentage of dissatisfied to draught at the head region observed in the mentioned Ref. [7], have been also compared with the percentage feeling discomfortable draught at one or more arbitrary body surfaces. In this case, it has been found a relatively good correspondence between the two studies.
2.4 Turbulent air flows
In nature and in most of the engineering applications concerning air flow motion, we have to deal with turbulent flows rather than laminar. Also in climatically controlled spaces, where large engineering efforts are spent to provide an indoor climate as much as possible close to thermal comfort requirement, we have to deal with irregular flows. Even though in indoor climate where the air velocity is often kept at very low values and the air temperature is continuously controlled, we still have an air motion characterised by turbulence. A laminar flow is extremely rare and could exist only in very small area of an occupied zone. The reasons which rise irregularity in air motion are of large number: movements of people, not uniform temperature in the walls, air supply, heat source like radiators as cold surfaces like windows during cold seasons. If we add the fact that a low speed air flow is extremely vulnerable to disturbances, we can easily understand how only one of the previous factors is enough to destroy any regularity in the flow velocity field. In this section is provided an introduction of basically concepts about the nature of turbulent flows and heat transfer of a cylinder in crossflow. For details refer to Refs. [13-16].
2.4.1 The nature of turbulent air flows
In a turbulent air flow, the physical properties such as velocity, pressure, temperature cannot be evaluated with a deterministic description in all details as a function of time and space coordinates. Hence the need to refer to laws of probability by indicating distinct average values of the several flow properties. Even though some deterministic aspects have been recently demonstrated with coherent structures, in a turbulent motion, all the quantities show a random variation with time and space co-ordinates. Two different kind of turbulence could be discerned by the way of which are generated:• Wall turbulence: turbulence rise up from friction forces at fixed walls.• Free turbulence: turbulence is generated by flow of layers of fluids with different velocities
past or over one another.
Turbulence consists of many superimposed quasi-periodic motions, consequently many frequencies are present in turbulent motion with superposition of eddies of ever-smaller sizes. By viscosity actions, this superposition cannot continue indefinitely to the smaller scales: the smaller an eddy, the greater also the velocity gradient at which corresponds a greater viscous shear stress counteracting the eddy motion. Hence, in a turbulent flow there exists a lower limit on the size of the smallest eddy, leading a minimum scale of turbulence and a maximum frequency in the turbulent motion. At each eddy size corresponds a certain kinetic turbulent

Chapter 2: Sensitivity to air movements 37
energy, which is a function of its vorticity and of the intensity of velocity fluctuations. Even in the smallest eddies, whose dimensions are determined by viscosity effects, we are dealing with a continuum flow: the size of the smallest eddies is far away from the free path of molecules. In real viscous fluids, viscosity is the mean by which the kinetic energy of flow is transformed into heat, exhibiting then the dissipative nature of such flow. Furthermore, viscosity makes turbulence more homogeneous and less directional dependent. Being turbulent flows always dissipative, it is necessary a continuous external source of energy for the continuous generation of the turbulent motion, otherwise it will decay.
To describe quantitatively a turbulent motion, it is fundamental to introduce the notion of scale of turbulence: a certain scale in time and in space. The magnitude of these scales will depend by several aspects such as the dimensions of and the velocities within the apparatus in which the turbulent flow takes place. A more important aspect which characterise a turbulent flow, is its relative intensity defined by the ratio of the root mean square of velocity fluctuation to the mean air velocity.
We may define “isotropic turbulence”, when the flow field has quantitatively the same structure in all parts, i.e. its statistical feature has no preference for any direction. In such a situation no gradients for any quantity will take place among the flow field. Otherwise, we are dealing with “ shear-flow turbulence”, as in the case of wall turbulence.
Depending on the nature of the turbulent flow, average values can be determined in various ways. For a quasi steady turbulence flow we may adopt an averaging procedure with respect to time; conversely, an averaging procedure with respect to space could be used for an homogeneous turbulence flow. In the case that the flow field is neither steady nor homogeneous, we have to work out a large number of experiments to find out an appropriate average value. In the case of an homogeneous and stationary turbulence, the ergodic hypothesis is holding: the three average values are identical In reality turbulent flows are neither perfectly homogeneous nor stationary. When we are averaging with respect to time the velocity of a turbulent flow, we have to be careful to discern the fluctuations due to the turbulence, between the slight pulsation of low frequency which doesn’t belong with turbulence. Hence a finite value of time length (T) has to be adopted. This value must be sufficient large in the respect to the time scale of turbulence, but at the same time, it must be smaller than the period of any slow variation in the field of flow that is not belonging to the turbulence. The result of the averaging procedure has to be independent of the origin value of time, i.e. the time derivative of the average velocity should be zero, or at least negligibly small.
2.4.2 Cylinder in cross air flows
Thermal discomfort due to air movements is closely related to thermal interactions of the human body with the surrounding air flow. Calculation of heat transfer is extremely difficult due to the complicate geometry, the non homogeneous temperature distribution and the irregular roughness on the surface of the clothed subject. In the presence of turbulent air flows, the problem becomes even more complicate. Information of practical value on the heat transfer mechanism in turbulent air flows could be obtained from experimental observations of convective heat transfer from simple curvilinear bodies, such as cylinders in crossflow. This subject has been deeply developed, both analytically and experimentally by A. Zukauskas and J. Ziugzda, Ref. [15]. In this section are provided the most important findings of this study on the effects of relative turbulence intensity on heat transfer mechanism.
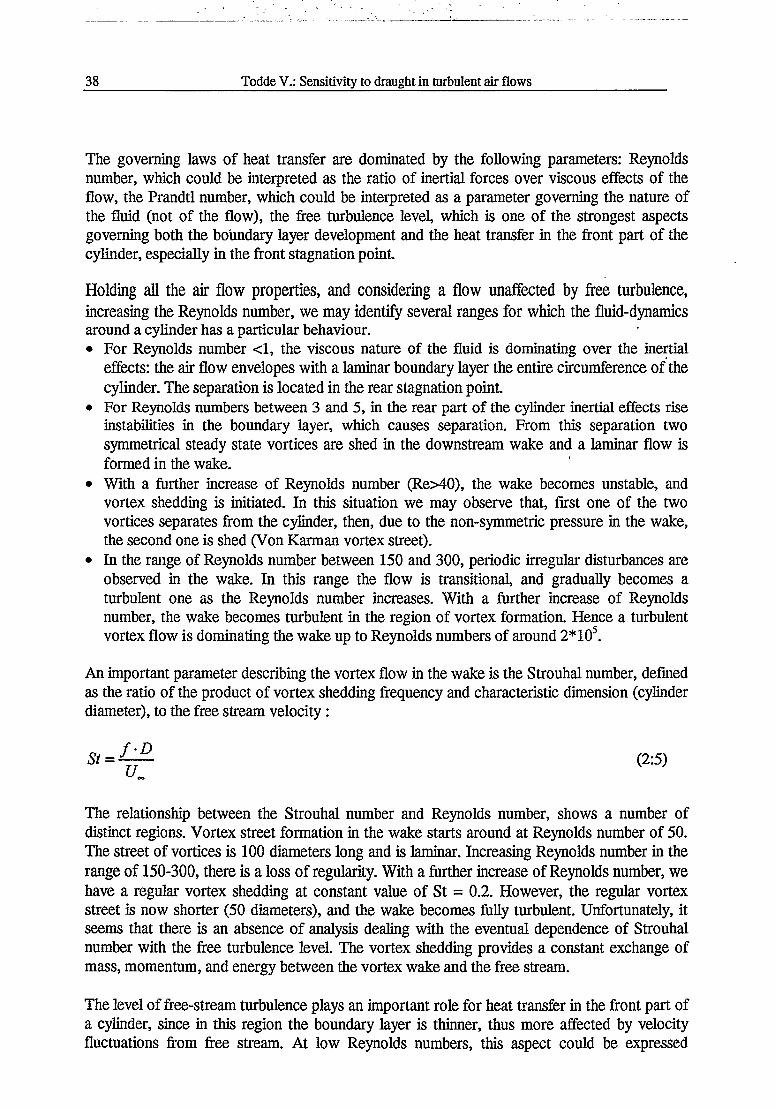
38 Todde V.: Sensitivity to draught in turbulent air flows
The governing laws of heat transfer are dominated by the following parameters: Reynolds number, which could be interpreted as the ratio of inertial forces over viscous effects of the flow, the Prandtl number, which could be interpreted as a parameter governing the nature of the fluid (not of the flow), the free turbulence level, which is one of the strongest aspects governing both the boundary layer development and the heat transfer in the front part of the cylinder, especially in the front stagnation point.
Holding all the air flow properties, and considering a flow unaffected by free turbulence, increasing the Reynolds number, we may identify several ranges for which the fluid-dynamics around a cylinder has a particular behaviour.• For Reynolds number <1, the viscous nature of the fluid is dominating over the inertial
effects: the air flow envelopes with a laminar boundary layer the entire circumference of the cylinder. The separation is located in the rear stagnation point.
• For Reynolds numbers between 3 and 5, in the rear part of the cylinder inertial effects rise instabilities in the boundary layer, which causes separation. From this separation two symmetrical steady state vortices are shed in the downstream wake and a laminar flow is formed in the wake.
• With a further increase of Reynolds number (Re>40), the wake becomes unstable, and vortex shedding is initiated. In this situation we may observe that, first one of the two vortices separates from the cylinder, then, due to the non-symmetric pressure in the wake, the second one is shed (Von Karman vortex street).
• In the range of Reynolds number between 150 and 300, periodic irregular disturbances are observed in the wake. In this range the flow is transitional, and gradually becomes a turbulent one as the Reynolds number increases. With a further increase of Reynolds number, the wake becomes turbulent in the region of vortex formation. Hence a turbulent vortex flow is dominating the wake up to Reynolds numbers of around 2*105.
An important parameter describing the vortex flow in the wake is the Strouhal number, defined as the ratio of the product of vortex shedding frequency and characteristic dimension (cylinder diameter), to the free stream velocity:
f-DSt = ^—— (2:5)
The relationship between the Strouhal number and Reynolds number, shows a number of distinct regions. Vortex street formation in the wake starts around at Reynolds number of 50. The street of vortices is 100 diameters long and is laminar. Increasing Reynolds number in the range of 150-300, there is a loss of regularity. With a further increase of Reynolds number, we have a regular vortex shedding at constant value of St = 0.2. However, the regular vortex street is now shorter (50 diameters), and the wake becomes fully turbulent. Unfortunately, it seems that there is an absence of analysis dealing with the eventual dependence of Strouhal number with the free turbulence level. The vortex shedding provides a constant exchange of mass, momentum, and energy between the vortex wake and the free stream.
The level of free-stream turbulence plays an important role for heat transfer in the front part of a cylinder, since in this region the boundary layer is thinner, thus more affected by velocity fluctuations from free stream. At low Reynolds numbers, this aspect could be expressed

Chapter 2: Sensitivity to air movements 39
analytically by treating the boundary layer as a pseudo - laminar, with enhanced turbulent viscosity and thermal conductivity due to the presence of turbulence.
The additional viscosity increases also the shear stress and move downstream the boundary layer separation. In the rear part of the cylinder, the free stream turbulence doesn’t look to play an important role: this aspect could be explained by the insensitivity of the highly turbulent flow in the wake to the minor external disturbances from the front free stream flow.
Both the fluid-dynamics and heat transfer in the close region beside the front stagnation pointcould be treated as a particular case of laminar or turbulent flow impinging normally onto a flatplate. A particular analysis is required to evaluate the heat exchange in the narrow region comprised in the range | <p | < 1°. Correlation are found for the Nusselt number, with analytical
procedure supported by experimental results. A number of authors have developed models with idealised assumptions and empirical constants. One such model is that due to Kayalar: ’’it consists of a cellular structure with a defined wavelength A,i and a definite frequency of fluctuation, superimposed on a laminar boundary layer. Two vortices of opposite direction are assumed”. ( See Fig. 5.2 on Ref. [15] ). Also other researches observed the presence of vortices near the front stagnation point. Kestin and Wood suggested that, in the case of these vortices exceed a critical size, they interact with a boundary layer. This interaction seems to produce a rise in heat transfer. Visual observations, confirms a relation between the wavelength of the cellular vortex structure, with the Reynolds number and free turbulence level. Some aspects of the cellular structure has not yet clearly defined. However it seems that its stability is strictly connected with the free-stream velocity, the surface curvature, and the boundary layer. It might reasonable to associate the early transition of the boundary layer that occurs for high turbulence level with the stability of the cellular structure.
Research works, as mentioned in Ref. [15], have already confirmed that the heat transfer at the front stagnation point is fairly influenced by the level of free stream turbulence: in fact in this region the boundary layer is quite constantly thin and the penetration of the external turbulence is pronounced. Several studies confirm that an increase in turbulence to 3% generates an increase of heat transfer coefficient of order 60% at the front stagnation point, Ref. [15]. Always from Ref. [15], we can read: ’’some authors maintain that the heat transfer does not respond to turbulence of low levels (Tu = 1%). Others authors present data that appear to demonstrate that the heat transfer coefficient increases continuously with turbulence level None of the published studies deals adequately with turbulence effects for a wide range of fluids, neither at the front stagnation point nor in the other circumferential regions.”
Several empirical correlation are provided to quantify the Nusselt number with turbulence level and Reynolds number, supported by experimental analysis and turbulence modellisation. The Nusselt number for the front stagnation point, for slow temperature difference between the air flow and the cylinder surface could be expressed with:
Nu-c- Rem- Pr0'35- TuK (2:6)
The exponent ”m” of the Reynolds number increases as the turbulence level does. Several research confirmed that when Tu increases from 1% till 8%, the exponent increases from 0,5 to 0,6. Moreover, the results of the research work of Ref.[15], and of a number of other authors, confirm the existence of a sort of threshold value of turbulence level where the effect of turbulence on heat transfer is initiated. This threshold value is lower at higher Reynolds

40 Todde V.: Sensitivity to draught in turbulent air flows
numbers: Tu = 1%, when Re is of order of 105, and Tu = 5%, for Reynolds around 103. This phenomenon could be related to changes in the spatial three-dimensional cellular structure of the fluid dynamics. Dealing with an elliptic cylinder, we have to mention one more aspect characterising the amount of heat transfer in the stagnation point: when the flow is parallel to the major axis, we have an higher heat transfer coefficient rather than the flow is parallel to the minor axis. This aspect confirms that the heat transfer coefficient in the stagnation point is higher for slender geometry.
On the front part of a cylinder in cross-flow, the heat transfer coefficient can be determined by a numerical analysis. With constant heat flux at the surface, as a boundary condition, we obtain higher heat transfer coefficient over the larger part of the circumference than for constant temperature case. Instead in the front part, up to 25, 30°, the two solutions are identical ( See Fig. 6.2 in Ref. [15] ). It seems widely confirmed that for Reynolds number up to 5*103.the average heat transfer coefficient is higher in the front half of the cylinder than in the rear. The free stream turbulence could increase the local heat transfer in the front part of the cylinder till 30-50%, ( See Fig. 6.5 in Ref. [15] ). As already mentioned, the effect of the turbulence is more pronounced in the region close to the stagnation point, and it decreases as we move downstream. Even the rear vortex flow, which generates fluctuations of the velocity in the front part, increases the heat transfer in the front part of the cylinder, (mainly at low Reynolds number). Indeed, the fluctuations of velocity rising from the vortex shedding have been observed to have a little effect on the heat transfer in the front part, but their elimination leads to a considerable decrease of the heat transfer in the rear part of the cylinder, since the macroscale vortex transfer in the near wake is obviously changed
The heat transfer in the rear stagnation point differs greatly from those for other regions of the cylinder surface. The main feature of the heat transfer at the rear stagnation point is its independence of the free - stream turbulence (over the range 1%<Tu<15%). The heat transfer must therefore be governed by the vortex processes in the wake, rather than by the free-stream turbulence.
2.5 Conclusions
• For normally clothed subjects, most of the experimental research indicates the head as the most sensitive region to air movements. An air flow blowing from behind towards the neck are perceived as most uncomfortable. The head region is a bared surface protected from the cooler environmental air by the thermal plume rising from the trunk. The structure of this plume depends on the posture. The interactions between an air flow with the thermal plume are strictly related to the air flow properties: direction, mean air velocity intensity, large scale fluctuations and turbulence. The higher the action of an air flow to penetrate the thermal plume, and to reach the skin surface, the higher the risk of draught discomfort.
• The perception and sensitivity to the cooling effect enhanced by air movements depends on a wide number of factors inter connected with each other: physical properties of the air flow, part and extension of the exposed surface (bared and/or clothed), posture, exposure duration, thermal condition of the person, and gender.
• The sensation of air flow temperature and the perception of strength of air movement at the skin surface, have been observed to decrease with duration exposure. At the same time it

Chapter 2: Sensitivity to air movements 41
has not found any change in pleasantness feelings: pleasantness (and/or unpleasantness), becomes independent of thermal and strength sensation as the exposure to draught continues.
• Earlier studies on perceived discomfort due to draught were concerned with limited numbers of parameters, and the results were presented in the form of percentage of dissatisfied subjects as a function of air velocity and temperature. Recent experimental evidence has shown that the fluctuations, the turbulence level and the directions of air velocity have an important impact on sensitivity to air movements. Turbulence enhance heat exchange between the human surface and the air movement. This physical aspect has been observed to have an importune impact on human response to air movements. High level of turbulence intensity decreases considerably the acceptable mean air velocity for the majority of the occupants.
• A draught chart has been elaborated by means of a mathematical model: The effects of fluid physical properties, on the percentage of dissatisfied subjects, have been expressed in terms of equations containing the air velocity the turbulence intensity and the air temperature to an appropriate power index.
• At present, the interpretation of the effects of a macro and microscale turbulence on draught discomfort is far from any conclusion and it presents a challenge from the experimental point of view, for simultaneous determination of the effects of both intensity and scale of the turbulence.
• Experimental observations have shown that air flow direction has an impact on perceived discomfort due to draught. Air flows from below and towards the back from behind are felt more uncomfortable. The effect of air velocity direction on draught discomfort also depends on the temperature level of the room air.
• No significant differences have been obtained between the reactions of women and men to air movements, and it has not found any relevant impact of the day time on the percentage of draught dissatisfaction.
• It is still not clear the effect of air temperature on sensation of the strength of air movements: results from experimental observations are in disagreement with each other.
2.6 References.
[1] Houghten F.C., Gutberlet C., Witkowski E. (1938). Draught temperatures and velocities inrelation to skin temperature and feeling of warmth. ASHVE Transactions. Vol.30, pp. 193-212.
[2] Me Intyre D. A. (1979). The effect of air movement on thermal comfort and sensation. InP.O. Fanger and O. Valbjom (eds.), Indoor Climate, Danish Building Research Institute,Copenhagen, pp. 541-560. 3
[3] Crow, S. C., Champagne, F. H. (1971) Orderly Structure in Jet Turbulence, Journal ofFluid Mechanics 48, pp. 547-591.
42 Todde V.: Sensitivity to draught in turbulent air flows
[4] Fanger P.O., Pedersen C.J.K. (1977). Discomfort due to air velocities in spaces. Proceeding of Meeting of Commission of Int. Inst, of Refrigeration in Belgrade, VoL 4, pp.289-296.
[5] Fanger P.O., Christensen N.K. (1986). Perception of draught in ventilated spaces. Ergonomics, Vol. 29 no. 2, pp.215-235.
[6] Fanger P.O., Melikov A.K., Hanzawa H., Ring J. (1988). Air turbulence and sensation of draught. Energy and Buildings, Lausanne, Switzerland: Elsevier Sequoia S.A.Vol 12.pp.21-39
[7] Toftum J., Zhou G., Melikov A. (1997). Effect of air flow direction on human perception of draught. Clima 2000, Brussels.
[8] Mayer E., Schwab R. (1988). Direction of low turbulent airflow and thermal comfort. Proc. Healthy Buildings ‘88, vol. 2, pp. 577-582. Stochkolm, Sweden.
[9] Fountain M.E., Arens E.A. (1993). Air movement and thermal comfort. ASHRAE Journal. August ‘93 pp.26-30.
[10] Fountain M.E., et al (1994). Locally controlled air movement preferred in warm isothermal environments. ASHRAE Trans., Vol. 100, part 2, pp.937-951.
[11] Hanzawa H., Melikov A.K., Fanger P.O. (1987). Air flow characteristics in the occupied zone of ventilated spaces. ASHRAE Trans., Vol.l, pp.524-538.
[12] Melikov A.K., Hanzawa H., Fanger P.O. (1988). Air flow characteristics in the occupied zone of heated spaces without mechanical ventilation. ASHRAE Trans., VoL 94 (1988), no. 1, pp.52-69.
[13] Hinze J.O. (1975). Turbulence. Second edition, McGraw-Hill
[14] Tennekes H. Lumley J.L. (1990). A first course in turbulence. MIT Press
[15] Zukauskas A. Ziugzda J. (1985). Heat transfer in cross flow of a cylinder. Springer Verlag.
[16] Kays W.M., Crawford M.E. (1993). Convective heat and mass transfer. Third edition, McGraw-Hill.

Chapter 3: Sensitivity to horizontal air movements with hands 43
3 Sensitivity to horizontal air movements with hands
3.1 Introduction
The aim of this first experiment was to investigate how people perceive air movements with their hands, and how the relative turbulence intensity of air velocity affects this perception. Normally clothed people, within an office activity, are more sensitive to air movements in bared surfaces, like the head region, and in the ankles. One of the purposes of the experiment was to find out the ranges of air velocity, in terms of mean value and relative turbulence intensity, at which normally clothed people could perceive the presence of air movement on their bared skin surfaces. The choice of the hand was mainly due to the easy way of carrying out the experiment with the existing equipment in the laboratory.
The experiment was also intended to achieve information about possible improvements of the instrumentation for air flow measurements at low velocity and for the experimental methodology of the second draught experiment dealing with the sensitivity to air movements in the neck (see chapters 5 and 6). Measurements of air velocity at low speed are very delicate. Hot wire anemometer, with a carefully calibration of the velocity sensor, and with a suitable geometry of the probe, could succeed to record with high accuracy air velocity of few cm/s. Dealing with a turbulent air flow, the sampling rate of the measurement is also important to achieve accuracy in the results. Turbulence consists of the superposition of eddies. The smallest eddies of a turbulent air movement determine the minimum scale of turbulence that corresponds to the highest frequency of the turbulent motion. The minimum size of the eddies is determined by the viscosity. The smaller the eddy, the higher the velocity gradient in the eddy and, consequently, the higher will be the shear stress which counteract the eddy motion.
CONTROL - PANEL
3.00 m
6.80 m
TABLE
Figure 3/1. Test room planimetry.
Concerning the sensitivity to air movements, the experiment was also intended to explore eventual effects of skin temperature on draught perception, and to collect a number of information about the impressions of air movements. In this investigation, a sample of 22 volunteers exposed their hand to an air flow issued from a low velocity nozzle. Figure 3/1 shows the planimetry of the test room. The subjects performed the experiment by moving the hand along selected cross sections through the jet. In this way, the hand was exposed to a

44 Todde V.: Sensitivity to draught in turbulent air flows
large combination of mean air velocities with their relative turbulence intensity. The age of the participants was between 19 and 52 years, six women and sixteen men.
All the experiments took place in the morning. For all the participants the mood status during the experiment was calm, pleased and aroused. Before starting the experiment the subjects were invited to adjust the amount of clothes to achieve thermal comfort. The test room air temperature was kept between 20.6 and 22.4 °C while the temperature of the jet flow was between the values of 20.4 and 22.2 °C. The difference in temperature between the air in the room and in the centre of the outlet section of the nozzle never exceed 0.2 °C. The arm was placed on a comfortable support as shown in figures 3/2 and 3/3.
ISUPPORT I
RAILING
CROSS SECTIONS [cm] |l70l Hal HIoI f40l
Figure 3/2. Experiment design.
•I ARM I
■ WHEELS
Figure 3/3. Arm support, lateral view.
In this support, the hand was free to move along the cross section of the jet flow at the same height of the centre of the outlet cross section of the nozzle, without any physical contact with the support. At each subject was asked to move slowly the arm-support from the outside of the jet towards its centre-line. This operation was repeated at seven different cross sections. For each section the subjects performed the experiment twice: in a first proof they exposed to the jet flow the inner hand side (the palm), and in the second one instead, the outer hand side, (the back of the hand). The position of the hand at which people started to feel air movement was recorded and referred to the air velocity properties.
3.2 Air jet flow measurements
A low speed nozzle was used to generate a turbulent air jet flow in the test room. The speed of the air at the centre of the outlet section of the nozzle was maintained at the constant value of 0.305 m/s. The outlet section of the cylindrical nozzle measured 24 cm. The values of mean velocity and turbulence intensity were recorded along seven cross sections of the jet.
The measurements were curried out with the use of a temperature-compensated probe: Dantec Fiber-film probe, 55R76. In all the points investigated, the data were recorded with a sampling rate of 300 Hz for a time length of 180 seconds. All the air velocities measurements were developed without test persons in the room. To achieve repeatability of the measurements it has found a minimum time length of the measurements of around 150 seconds.

Chapter 3: Sensitivity to horizontal air movements with hands 45
The same fluid-dynamics conditions at the outlet section of the measured jet were then carefully reproduced while subjects performed the tests. This jet flow of low velocity is extremely vulnerable to disturbances. To properly measure the velocities in the jet flow, it was necessary to have a very stable environment without disturbances in the room. As a sample, in figure 3/4 is shown a time history of the longitudinal air velocity component in the boundary of the jet flow. Figure 3/5 shows the corresponding spectral density distribution divided by variance, evaluated with Fast-Fourier transforms.
AIR VELOCITY,TIME HISTORY
------ MEAN VELOCITY = O.II [m/s]; R*TUI.= 0.480
O 0.05
20 40 60 80 100 120 140 160 180TIME [S]
Figure 3/4. Example of time history of the longitudinal component of air velocity.
POWER SPECTRAL DENSITY
FREQUENCY [Hz]
Figure 3/5. Power spectral density of the time history shown in figure 3/4.
Air velocity measurements were done along each cross section with a spatial step of 0.5 cm, starting from the centre of the jet flow till the outer boundary until reversal velocity had appeared. This last location was found with the use of a pulsed hot wire able to detect the direction of the air flow. Figure 3/6 shows the mean longitudinal air velocity (U) recorded at several cross sections of the jet flow.
MEAN LONGITUDINAL AIR VELOCITY
Z=60 cmZ = 70 cm
9---- - Z = 80 cm>• 0.2
Figure 3/6. Longitudinal mean air velocity component in different sections of the air jet flow.
DIMENSIONLESS VELOCITY PROFILE
O -----Z = 40 cmZ = 50 cm
□ ------Z = 60 cmZ = 70 cm
9 Z = 80 cm
0.0 0.2 0.4 0.6 0.8 1.0 1.2 1.4 1.6 1.8 2.0 Y/Yc
Figure 3/7. Dimensionless longitudinal mean air velocity in different sections of the air jet flow.

46 Valentino Todde: title thesis
In figure 3/7, is plotted the ratio of the local longitudinal mean air velocity to the velocity on the jet axis (U/Um), and instead of the distance from the jet axis, is adopted the ratio of this distance to the distance between the axis and the point at which the velocity is equal to half the axis velocity (Y/Yc). In this diagram it is evident that the similarity of the velocity profiles is not well respected. One reason is that the jet flow is not yet developed. Moreover, this aspect could be also a consequence to the high instability of the jet flow due to the extremely low velocity, to the measurement system, which exhibits some problems when the velocities were as low as 0.04 m/s. In this range of low velocity the response of the probe is also affected by natural convection. In this contest the direction of the flow in the vertical plane influences significantly the response of the probe. Furthermore, in the boundary region of the jet there are also transversal components of air velocity which affect the response of the probe and cannot be evaluated properly.
RELATIVE' TURBULENCE INTENSITY
Z = 40 cmZ = 50 cmZ = 60 cmZ = 70 cmZ = 80 cm
TRANSVERSAL COORDINATE, Y [ cm ]
Figure 3/8. R.Tu.I. of the longitudinal air velocity component in different sections of the jet.
Figure 3/8 shows the relative turbulence intensity (R.Tu.I.) of the longitudinal component of air velocity. The momentary value of the longitudinal velocity can be written as a sum of the mean component (U) plus the fluctuation component (u’). We define the intensity of the turbulence fluctuation by the root-mean-square value of the fluctuation. The ratio of this quantity to the mean velocity will give the relative turbulence intensity (R.Tu.I). In all of the three previous graphs the longitudinal co-ordinate is labelled with the letter ”z”.
3.3 Hand test
The test for hand draught sensitivity was developed with the following procedure. When a subject arrived in the test room he received an explanation of the experiment, but he was not informed on the properties of the air jet flow. He was asked to fill a short questionnaire about his mood and his own opinion on sensitivity to draught and air temperature. In the first part of the test he started to perform the experiment for around fifteen minutes, without recording any data. This first test was only intended to let the subject achieve some confidence with the experiment. After this stage, with the use of an infrared camera, was recorded the skin hand temperature on both sides, inner and outer, in three particular points for each side : wrist, centre of the palm, (and in the corresponding outer side point), top part of the fingers. Figure 3/9 shows the mean value of the recorded temperatures at each of the 6 skin points. At this stage the subject started the experiment. Seven cross sections of the jet flow were selected for the test, at distance of 40, 50, 60, 70, 80, 90 and 100 cm from the outlet of the nozzle. The

Chapter # test person experiment 47
subject performing the test was standing beside the jet flow. He placed his arm on the support, that could be easily moved along the cross section of the jet, without interacting with the air flow. The hand was exposed to the flow free of any physical contact with the support. The person started to push very slowly the support toward the centre line of the jet flow till he started to feel air movement in the centre of the palm. At this point he stopped to move the support and he was asked to answer some questions dealing with his sensation of air movement on his hand. The co-ordinate of this point was noted and the fluid-dynamics properties of the flow were deduced from the previous measurements of the flow characteristics. This procedure was repeated for all the seven sections for both sides of the hand, with a different section order from person to person. While the person was performing the test for the outer hand side it was recorded the position at which he started to sense air movement in the centre of this side.
SKIN HAND TEMPERATURE
Figure 3/9. Distribution of mean hand skin temperature
3.4 Results
The results of this experiment deal with hand’s sensation of draught in terms of mean value and turbulence intensity of air velocity. All the points analysed represent a condition at which the subject started to feel air movement. The draught sensation was a very week perception which could be considered the boundary at which people’s hands could detect air movements. The results were analysed in two different groups: one for the inner side of the hand and one for the outer side. Figures 3/10 and 3/11 show the results obtained from the whole sample of subjects. In both the graphs the solid line is obtained with a second order curve fitting. These two lines represent the average combination of mean air velocity and turbulence level at which people start to feel draught ( 50% P.I.D.S.). From these two diagrams it is possible to deduce that the inner hand side is slightly more sensitive than the outer one. The skin temperature in the inner side is higher than the outer. The dotted lines in these two diagrams represent the upper limit under which 95% of the subjects felt air movement, the lower lines instead represent this condition holding for only 5% of the subjects. Figure 3/12 deals with draught sensation for the inner hand. The continue line represents the 50% P.I.D.S. for the subjects having warmer hand palm skin temperature (palm skin temperature higher than 32.5°C). Instead the dotted line shows the same condition holding for the subjects with cooler palm hand skin temperature (palm skin temperature lower than 31°C). From this graph it seems that
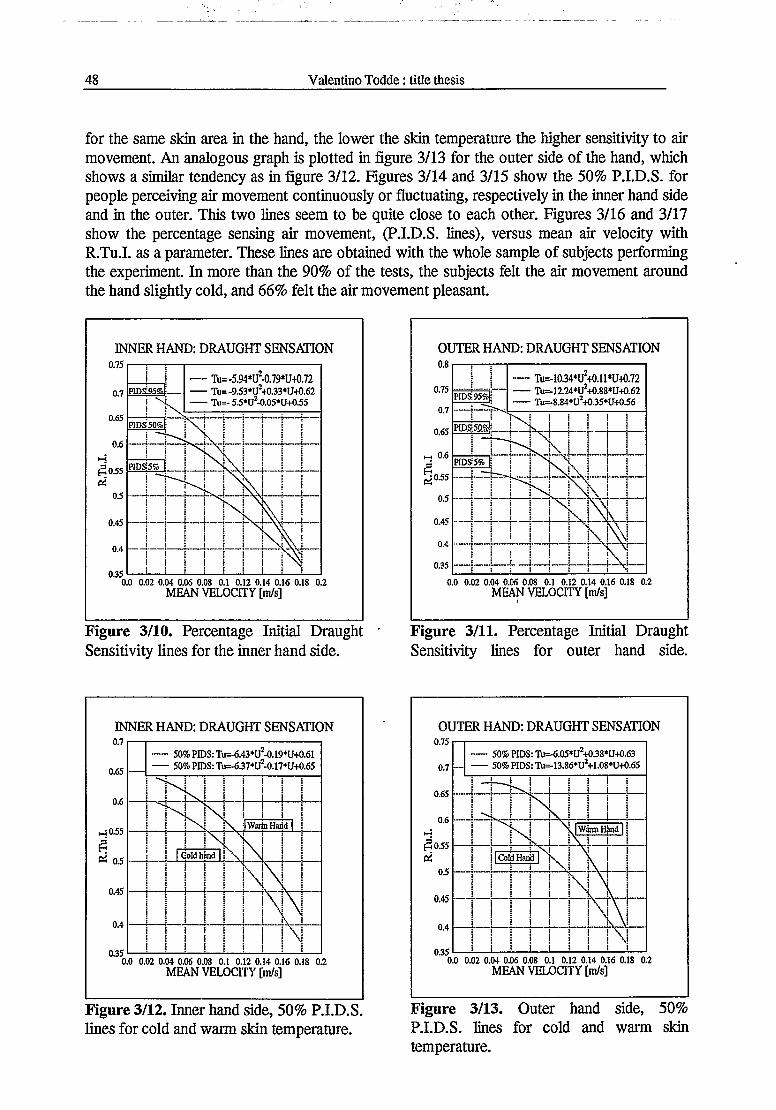
48 Valentino Todde: title thesis
for the same skin area in the hand, the lower the skin temperature the higher sensitivity to air movement. An analogous graph is plotted in figure 3/13 for the outer side of the hand, which shows a similar tendency as in figure 3/12. Figures 3/14 and 3/15 show the 50% P.I.D.S. for people perceiving air movement continuously or fluctuating, respectively in the inner hand side and in the outer. This two lines seem to be quite close to each other. Figures 3/16 and 3/17 show the percentage sensing air movement, (P.I.D.S. lines), versus mean air velocity with R.Tu.I. as a parameter. These lines are obtained with the whole sample of subjects performing the experiment. In more than the 90% of the tests, the subjects felt the air movement around the hand slightly cold, and 66% felt the air movement pleasant.
INNER HAND: DRAUGHT SENSATION
i — Tu=-5.94*U -0.79*11+0.72PID&Sal— ------Tu= -9.53*U2+0.33*U+0.62
i XI ------Tu=- 5.5*U2-0.05*U+0.55
0.0 0.02 0.04 0.06 0.08 0.1 0.12 0.14 0.16 0.18 0.2MEAN VELOCITY [m/s]
Figure 3/10. Percentage Initial Draught Sensitivity lines for the inner hand side.
INNER HAND: DRAUGHT SENSATION
----- 50% PIDS: Tu=-6.43*U -0.19*U+0.61------50% PIDS: Tu=-6.37*U2-0.17*U+0.65
WartoHadd
0.0 0.02 0.04 0.06 0.08 0.1 0.12 0.14 0.16 0.18 0.2MEAN VELOCITY [m/s]
Figure 3/12. Inner hand side, 50% P.I.D.S. lines for cold and warm skin temperature.
OUTER HAND: DRAUGHT SENSATION
— Tu=-10.34*U +0.11*U+0.72------Tu=-1Z24*U240.88*U+0.62------Tu=-8.84*U2+0.35*L7+0.56
0.0 0.02 0.04 0.06 0.08 0.1 0.12 0.14 0.16 0.18 0.2 MEAN VELOCITY [m/s]
Figure 3/11. Percentage Initial Draught Sensitivity lines for outer hand side.
OUTER HAND: DRAUGHT SENSATION
------50% PIDS: Tu=+5.05»U+0.38*U+0.63------50% PIDS: Tu=-13.86*U2+1.08*U+0.65
| COW Hand I
0.0 0.02 0.04 0.06 0.08 0.1 0.12 0.14 0.16 0.18 0.2MEAN VELOCITY [m/s]
Figure 3/13. Outer hand side, 50% P.I.D.S. lines for cold and warm skin temperature.

Chapter # test person experiment 49
INNER HAND: DRAUGHT SENSATION
----- INTERMITTENT FEELING :Tn--I4.38,U,-l-!.06»lM.64-----CONSTANT FEELING: Hi=-M.38«U2+I.06«U-ti>.60
MEAN VELOCITY [m/s]
Figure 3/14. Inner hand side : 50% P.I.D.S. lines for constant and intermittent draught.
OUTER HAND: DRAUGHT SENSATION
-----INTERMITTENT FEELING: Tii-13SO«U,+!X)S«UtO.S$-----CONSTANT FEELING :TU-11.73*AOS1»W).60
0.35 ------s-------------!--------------------------------- 2-------------0.0 0.02 0.04 0.06 0.08 0.1 0.12 0.14 0.16 0.18 0.2
MEAN VELOCITY [m/s]
Figure 3/15. Outer hand side: 50% P.I.D.S. lines for constant and intermittent draught.
INNER HAND DRAUGHT SENSATION
O —— Tu = 55%A ----- Tu = 50%□ —
0.0 0.02 0.04 0.06 0.08 0.12 0.14 0.16MEAN AIR VELOCITY [ m/s ]
Figure 3/16. Inner hand side: P.I.D.S. lines versus mean air velocity for different turbulence intensity.
3.5 Conclusions
OUTER HAND DRAUGHT SENSATION
A ----- Tu = 50%Tu = 45%
0.14 0.16 0.180.06 0.08MEAN AIR VELOCITY [m/s]
Figure 3/17. Outer hand side: P.I.D.S. lines versus mean air velocity for different turbulence intensity.
The results of this work are influenced by the fluid-dynamics of the boundary layer of the jet. The combination of mean air velocity and relative turbulence intensity determining the P.I.D.S. lines is partially dictated by the combination of these two quantities holding along a prescribed cross section of the jet flow. This limitation has been partially overcome by inviting the subjects to perform their test in a large number of cross sections (7). At the boundary of the jet flow we have very low mean air velocity (< 0.05 m/s), but we also have high turbulence affected by intermittence. The subjects have never explored their sensitivity to draught with
50 Valentino Todde: title thesis
low turbulence level in the lower velocity domain. The results indicate an important effect of relative turbulence intensity of air velocity on draught sensitivity. It was observed that the higher the turbulence intensity, the lower the mean air velocity value at which the majority of the subjects could detect an air movement. The percentage of initial draught sensitivity (P.I.D.S.), depends also on the part of the skin invested by the air movement: inner hand side was observed to be more sensitive than the outer. Also the temperature of the skin plays an important role on P.I.D.S.. From the skin temperature observations, it was found that a lower skin temperature induced a higher capability to detect the presence of an air movement.
3.6 References.
[1] Houghten F.C., Gutberlet C., Witkowski E. (1938). Draught temperatures and velocities in relation to skin temperature and feeling of warmth. ASHVE Transactions. Vol.30, pp. 193-212.
[2] Fanger P.O., Christensen N.K. (1986). Perception of draught in ventilated spaces. Ergonomics, Vol. 29 no. 2, pp.215-235.
[3] Fanger P.O., Melikov A.K. Hanzawa H., Ring J. (1988). Air turbulence and sensation of draught. Energy and Buildings, Lausamne, Switzerland: Elsevier Sequoia S.A.Vol 12.pp.21-39
[4] Fountain M.E., Arens E.A. (1993). Air movement and thermal comfort. ASHRAE Journal. August ‘93 pp.26-30.
[5] Ring, R. de Dear, A. Melikov (1993). Human Thermal Sensation: Frequency Response to Sinusoidal Stimuli at the Surface of the Skin.Energy and Buildings, 20, pp. 159-165.
[6] Mayer E. (1993). Objective Criteria for Thermal Comfort. Building and Environment, Vol 28, No 4, pp. 399-403.

Chapter 4: Low Reynolds number air jet flows 51
4 Low Reynolds number air jet flows
4.1 Introduction
This chapter deals with an experimental investigation of low speed isothermal free air jets. A mathematical model to predict the physical properties of these flows with inlet velocity at the orifice lower than lm/s is of practical value for designing air supply in ventilated rooms. Thermal comfort and draught risk require quite often a level of mean air velocity lower than15-30 cm/s in the occupied zone, with a low level of relative turbulence intensity as well Low air velocity is also recommended to reduce the noise from the ducts providing the air flow in rooms. There are a number of factors determining the fluid-dynamics of an air jet flow. Particularly, the air movement from a supply into an occupied zone, is strongly conditioned by the velocity properties of the air flow at the inlet section, the geometry of the nozzle, the difference in temperature between the supplied air and the air in the room, the location of surrounding walls and by air movements in the room enhanced by external factors.
From a practical point of view, especially for ventilation purposes, a deep knowledge of the vortical and turbulent structure of free jet flows at low Reynolds number, could give useful information for new geometrical design of passive flow control devices (FCDSs), to be placed at the inlet section of the supply. Active control devices, like sound waves emitted from a loudspeaker, have been studied for a long time (indeed, first observations of the effect of the sound on a jet date back to the XIX century). Though, much less attention has been dedicated to passive control methods, which are nonetheless more interesting from a practical standpoint. This kind of control can be cheaper and more reliable than active one as it requires no moving parts. This is the reason why nowadays large research efforts are aimed towards this kind of control in many engineering fields, particularly in fluid-mechanics. The theoretical implications of passive flow control are quite important, as these methods require a very deep knowledge of the motion field to be controlled and of its properties, to be effectively applied. The workingprinciple of passive FCDs is to interfere with the natural evolution of vorticity and turbulence by superposing to them a new vortex field. This requires of course a good knowledge of the baseline flow in the first place. As the important phenomena of mass and heat transfer in a jet are driven by vorticity and turbulence dynamics, it seems reasonable that this field could also benefit from passive FCDs. As an example, a geometrical configuration of passive FCD could be as toroidal rings with various dimensions disposed at different distances downstream the orifice. This geometry has already proved to be effective in 2D planar flows, see Ref [6].
This investigation is still far from a comprehensive analysis of the flow structure of the jet, and has been designed to obtain information on the centre-line velocity of an isothermal circular jet at low velocity, as a function of the flow velocity at the outlet section. The experiment was developed in a climate room where an air jet was supplied isothermally from the centre of one lateral wall This jet was then used for an investigation on human response to draught in the same climate room, (chapters 5 and 6).
The measurements were curried out with the use of a single fiber film probe. Attention was focused on the longitudinal air velocity component along the centre-line of the jet, in terms of mean value and relative turbulence intensity. The position of the velocity sensor in the centreline of the jet, was controlled with an accuracy of 0.1 mm. To record the air temperature in the

52 Todde V.: Sensitivity to draught in turbulent air flows
room, eight thermo-couples were placed symmetrically to the jet flow centre-line. Figure 4/1 shows the geometry of the room where the experiment took place.
Figure 4/1. Lateral views of the room: jet centre-line and location of the thermo-couples.
Measurements were curried out for different test cases with mean air velocity at the inlet section of the nozzle, U(0), lower than lm/s, and relative turbulence intensity close to 1%. The geometry of the nozzle with its components is shown in figure 4/2. The temperature of the air jet flow was recorded with two thermo-couples placed in the nozzle before the honey-comb. All the measurements were performed with a temperature compensated single probe, at a sampling rate of 2000 Hz for a time duration of 184 seconds. The results have been compared with earlier research and with empirical correlation based on both theoretical principles and experimental observations. A qualitative trend of the jet flow has been analysed with the use of smoke visualisation as well.
GRIDS
ROOM WALL
HONEY COMBHONEY COMB
THERMO COUPLE
30 cm
convergent]
40 cm 10 cm10 cm 20 cm 10 cm 20 cm
Figure 4/2. Nozzle design.
4.2 Isothermal circular air jet flows
In the early stage of the jet evolution, large scale ring vortices develop by coalescence of the vorticity shed at the nozzle lip. These vortices show a time of permanence before being

t
Chapter 4: Low Reynolds number air jet flows 53
destroyed by non-linear cascading that allows them to reach a downstream distance of some orifice diameters and allows thus observations of their properties. In figure 4/3, are shown two smoke visualisation of our low Reynolds number air jet flow. It is possible to distinguish a< region where large eddies develop and the location where they loose their identity.
A definitive agreement on the eddy structure in the early stages of the jet flows has not yet been reached. Some investigations observed only ring eddies, Refs. [1, 2], while other ones also suggest the presence of a superimposed helycoidal vortical structure, Ref. [3]. It is not well understood if the presence of the helycoidal vortex is due to boundary conditions, (disturbances), or if it is inherent to the physics of the jet flow. It must also be observed that other phenomena, like e.g. vortex pairing, may be present and strongly influence the dynamical behaviour of the eddies, see ref. [4].
a) Reynolds = 1075 ; U(0) = 31.82 cm/s
b) Reynolds = 3106; U(0) = 91.93 cm/sFigure 4/3. Smoke visualisation of low Reynolds number isothermal jet flows; £ = x/D, x is the longitudinal co-ordinate.

54 Todde V.: Sensitivity to draught in turbulent air flows
It has been shown, Ref. [2], that the formation of vortices is associated to a preferred mode, Le. to a typical Strouhal number: St = /D/U , where U is the mean air velocity at the orifice section, D is the orifice diameter and / the frequency at which ring eddies are shed. The value of this typical Strouhal number was shown by Crow & Champagne, [2], to be about 0.30. This implies that jets with the same Reynolds number but different diameters will shed vortices at the same Strouhal number. Thus, at a prescribed Reynolds number, the frequencies of shedding will be different for nozzles of different diameters, in particular they will scale with the inverse of the square of the diameter. Then, not only the Reynolds number but also the nozzle diameter will influence the flow-field structure (vortices and turbulence), until Reynolds- independence (which is known to occur in any turbulent flow provided Reynolds number is high enough) is reached. This aspect has been recently experimentally observed by Malmstrom et al in Ref. [5], for the decay of the centre-line mean velocity. In order to fully understand a low Reynolds number jet, it will therefore be of importance to study the way the nozzle diameter and the ejection velocity separately influence the downstream flow evolution.
Most previous studies have been concentrated on high Reynolds number air jet flows; the few low Reynolds numbers data were obtained out of nozzles with very small diameter, thus with still relative high inlet velocity.
When large scale vortices loose their identity because of the development of cascading eddies and transition to turbulence, the transfer mechanism is dominated by the latter. The development of the non-linear cascade is evidently influenced by the upstream conditions, as the large scale vortices, though other phenomena can be of importance. Crow & Champagne, [2], showed that large peaks of turbulence intensity on the jet axis, at downstream distance of about 4 diameters, can be obtained by forcing the flow with sound. Though, it must be observed that in [2], a top-hat nozzle outlet velocity profile was obtained.
The large scale vortices in the first section of the jet and the turbulence structure, (which, as already stressed, is deeply influenced by the vortices themselves), in the second part, drive the heat and mass transfer between the jet and the surrounding fluid. These transfers are of paramount importance in any technological application of jet flows, which explains the need for a better understanding of the vortices and turbulence dynamics.
The shear layer contouring a jet flow becomes unstable at extremely low Reynolds numbers and thus undergoes transition to turbulent conditions in the earliest stages of the jet. This instability stems from the fact that the shear between the jet and the surrounding still air shapes the velocity profile into one having an inflection point in it, regardless of the shape it has at the inlet section. Furthermore, it has to be observed that the initial velocity profile, while not influencing the fact that a transition will take place, has effect on the details of how this happens.
At relatively large Reynolds numbers, the transition is so fast that it is difficult to be observed. This fact is reflected by the usual statement that a high-Reynolds jet flow shear layer is turbulent as soon as it appears. Low Reynolds number air jets have thus the advantage of allowing a much better study of the transition phase. Clear observations with better space resolution and better detection of the instability region can be obtained just like better details of vortex evolution.
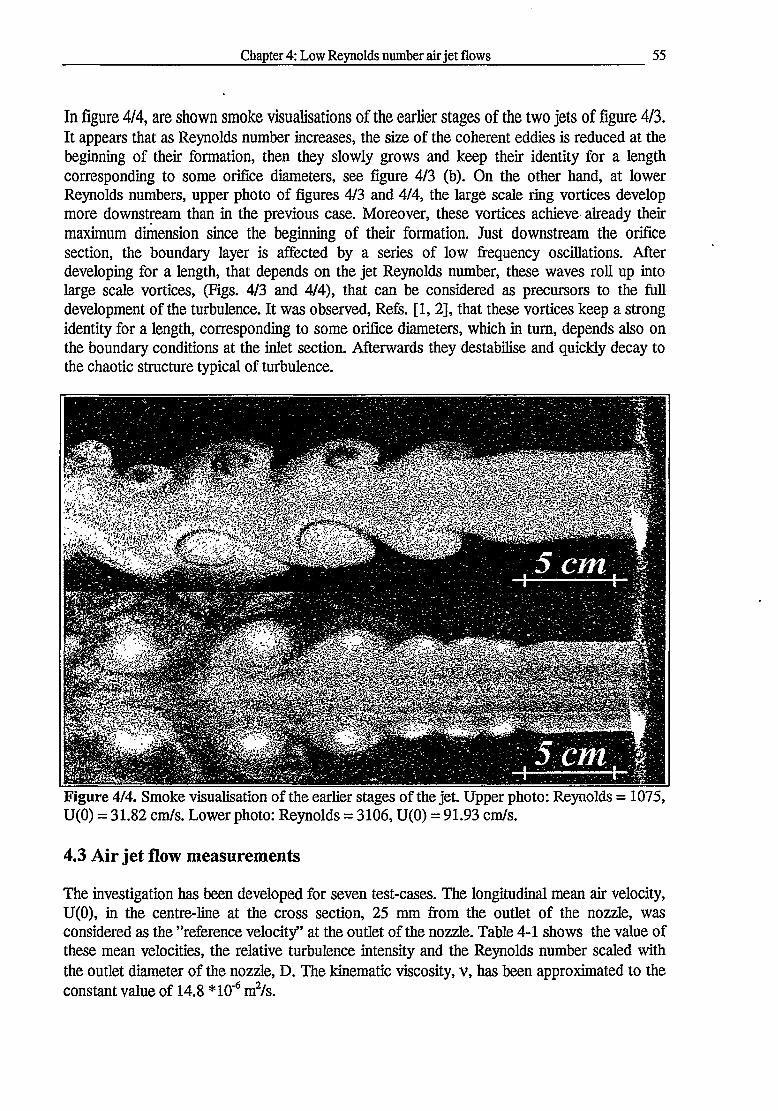
Chapter 4: Low Reynolds number air jet flows 55
In figure 4/4, are shown smoke visualisations of the earlier stages of the two jets of figure 4/3. It appears that as Reynolds number increases, the size of the coherent eddies is reduced at the beginning of their formation, then they slowly grows and keep their identity for a length corresponding to some orifice diameters, see figure 4/3 (b). On the other hand, at lower Reynolds numbers, upper photo of figures 4/3 and 4/4, the large scale ring vortices develop more downstream than in the previous case. Moreover, these vortices achieve already their maximum dimension since the beginning of their formation. Just downstream the orifice section, the boundary layer is affected by a series of low frequency oscillations. After developing for a length, that depends on the jet Reynolds number, these waves roll up into large scale vortices, (Figs. 4/3 and 4/4), that can be considered as precursors to the full development of the turbulence. It was observed, Refs. [1, 2], that these vortices keep a strong identity for a length, corresponding to some orifice diameters, which in turn, depends also on the boundary conditions at the inlet section. Afterwards they destabilise and quickly decay to the chaotic structure typical of turbulence.
Figure 4/4. Smoke visualisation of the earlier stages of the jet. Upper photo: Reynolds = 1075, U(0) = 31.82 cm/s. Lower photo: Reynolds = 3106, U(0) = 91.93 cm/s.
4.3 Air jet flow measurements
The investigation has been developed for seven test-cases. The longitudinal mean air velocity, U(0), in the centre-line at the cross section, 25 mm from the outlet of the nozzle, was considered as the "reference velocity” at the outlet of the nozzle. Table 4-1 shows the value of these mean velocities, the relative turbulence intensity and the Reynolds number scaled with the outlet diameter of the nozzle, D. The kinematic viscosity, v, has been approximated to the constant value of 14.8 *10"6 m2/s.

56 Todde V.: Sensitivity to draught in turbulent air flows
Table 4-1. Air velocity properties the at the outlet section.ll
31.82 1.25Bel. Turb„ Intensity [%]' Reynolds Number
107538.97 1.16 1316mamiwM 50.61 1.00 170961.11 1.09 206469.33 1.03 234282.32 0.98 278191.93 0.96 3106
The velocity was measured with the fibre-film probe, DANTEC 55R76 with temperature compensating sensor. The velocity sensor was nickel film deposited on 70 pm diameter quartz fibre, overall length 3 mm, sensitive film length 1.25 mm, copper and gold plated at the ends and the film was protected by a quartz coating approximately 0.5 pm in thickness. Also, a temperature compensated bridge of type DANTEC 56C14 with 56C01 CTA single channel system was used. The data acquisition has been done with Lab-View System of National Instruments. The board used for data acquisition was AT-MIO-16DE-10 with 12 bits. The main characteristics of an acquisition system are the sample rate and the resolution of the signal. The highest resolution of the signal is defined as:
(4:1)
Where AV is the signal range and n is the number of bits of the card. In this work the signal range was fixed between the values 0 and +2 Volts, with a corresponding resolution of the measurements of 0.48 mVolts.
4.4 Results
Measurements of the u-velocity component were conducted along the jet centre-line, over a streamwise distance, £=0.5 to £=30, where £ =X/D. The results dealing with the mean longitudinal component of velocity are plotted from figure 4/5 to 4/7. Figure 4/5 shows the trend of this component for all the test cases measured. All the curves have a first linear slow decay till the streamwise distance of £ = 5. Then it follows an ’’hyperbolic” decay. In figure 4/6 the mean longitudinal component is scaled with the outlet velocity, U(0). With the exception of the first region, £ <7, all the curves collapse onto a single curve. Figure 4/7 shows instead the ratio U/U(0). In this diagram it is possible to notice a linear trend for £ >6. The decay of the centre-line velocity could be expressed with the following relation:
™=A+B-t; (4:2)
Considering the distance to the virtual origin, xo, we can introduce the velocity decay coefficient, C, as it follows:
U(0) _ 1 (*-*o)U C D
(4:3)

Chapter 4: Low Reynolds number air jet flows 57
Combining these two last expressions, we have:
C = l/Box0=-B-(v4/B) (4:4)
Table 4-2 shows the results for every test-case. In all the test-cases, the virtual origin has a positive co-ordinate, in front of the outlet section. As the mean air velocity U(0) increases the virtual origin moves backwards. The slope of the lines expressed by equation 2, decreases as the mean outlet velocity increases.
Table 4-2. Jet centre-line velocity factors and virtual origin co-ordinate.Test Case
-0.6822 0.2702 3.7010 126msmigM -0.5859 0.2477 4.0371 118
-0.3925 0.2331 4.2900 84-0.2518 0.2274 4.3975 55-0.3387 0.2346 4.2625 72-0.2289 0.2154 4.6425 53-0.1952 0.2119 4.7192 46
MMBS&M
Discrepancies appear for the test-case 5, which are probably due to instabilities of the fan and duct system providing the air. The average of the coefficients, last row of table 4-2, could be used for a practical estimation of the mean centre-line velocity:
u=-----"P-----0.2343-1-0.3821
(4:5)
This expression, could provide an acceptable accuracy for the estimation of the mean centreline longitudinal velocity in the whole Reynolds number range investigated, from the longitudinal co-ordinate E, = 6.5. In figure 4/6 are compared the results from the measurements, with this averaged curve, and with the expression of Ref. [7], which predicts the mean centre-line longitudinal velocity as the following:
UCf(0)
(4:6)
Replacing the value 6.2 with 6.4 in equation 4:6, we obtain the expression suggested in Ref. [8]. Both these empirical equations have been obtained from analysis of momentum flux conservation, with assumptions made from experimental observations. This decay has been found from a longitudinal co-ordinate of around %=7. In Ref. [2], the decay of the centre-linevelocity of a free jet flow has been observed to start at %=7. But, in the case the jet was forced with sound waves this decay was advanced at an earlier stage. For instance, in a jet flow under 2% forcing at a Strouhal number of 60, this decay started at %=4. In our experiments, the non respect of a perfect top hat profile at the lip of the nozzle, is probably the reason for which the decay of mean velocity is anticipated at the co-ordinate %=5. In figure 4/8, eq. 4:4 is also compared with the results of the lower outlet velocity test cases of Ref. [5]. Only one of the curves fits closely with our equation.
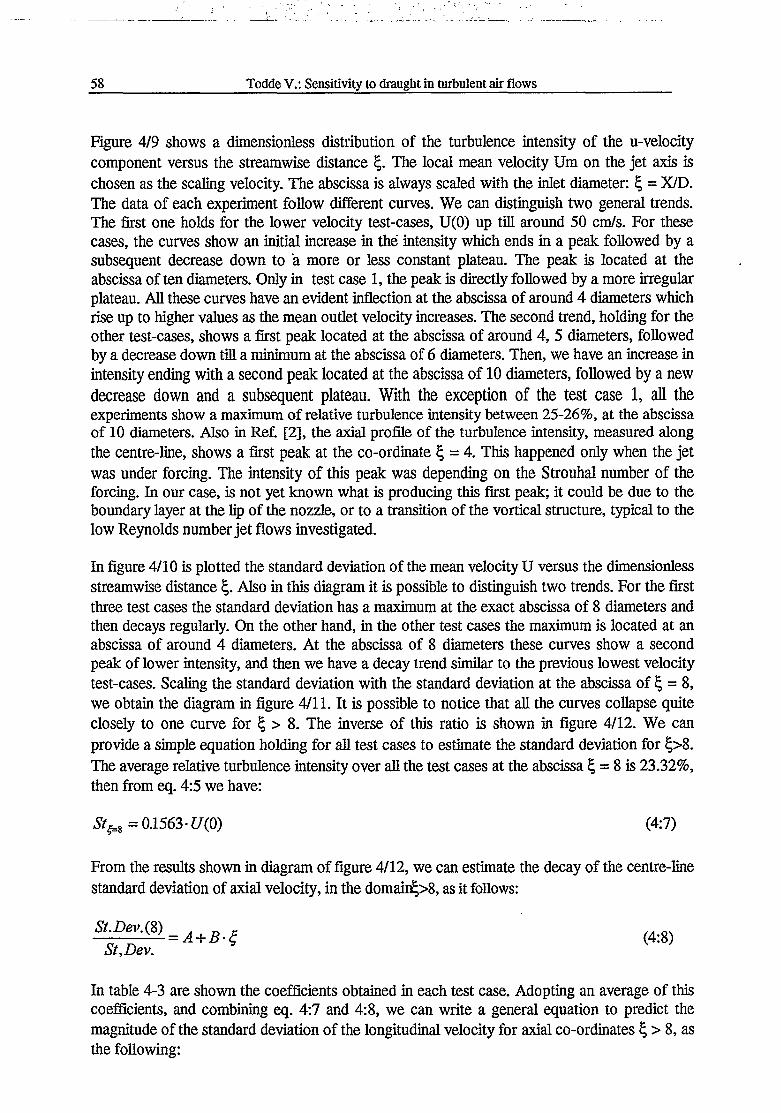
58 Todde V.: Sensitivity to draught in turbulent air flows
Figure 4/9 shows a dimensionless distribution of the turbulence intensity of the u-velocity component versus the streamwise distance %. The local mean velocity Um on the jet axis is chosen as the scaling velocity. The abscissa is always scaled with the inlet diameter: % = X/D. The data of each experiment follow different curves. We can distinguish two general trends. The first one holds for the lower velocity test-cases, U(0) up till around 50 cm/s. For these cases, the curves show an initial increase in the intensity which ends in a peak followed by a subsequent decrease down to a more or less constant plateau. The peak is located at the abscissa of ten diameters. Only in test case 1, the peak is directly followed by a more irregular plateau. All these curves have an evident inflection at the abscissa of around 4 diameters which rise up to higher values as the mean outlet velocity increases. The second trend, holding for the other test-cases, shows a first peak located at the abscissa of around 4, 5 diameters, followed by a decrease down till a minimum at the abscissa of 6 diameters. Then, we have an increase in intensity ending with a second peak located at the abscissa of 10 diameters, followed by a new decrease down and a subsequent plateau. With the exception of the test case 1, all the experiments show a maximum of relative turbulence intensity between 25-26%, at the abscissa of 10 diameters. Also in Ref. [2], the axial profile of the turbulence intensity, measured along the centre-line, shows a first peak at the co-ordinate % = 4. This happened only when the jet was under forcing. The intensity of this peak was depending on the Strouhal number of the forcing. In our case, is not yet known what is producing this first peak; it could be due to the boundary layer at the lip of the nozzle, or to a transition of the vortical structure, typical to the low Reynolds number jet flows investigated.
In figure 4/10 is plotted the standard deviation of the mean velocity U versus the dimensionless streamwise distance %. Also in this diagram it is possible to distinguish two trends. For the first three test cases the standard deviation has a maximum at the exact abscissa of 8 diameters and then decays regularly. On the other hand, in the other test cases the maximum is located at an abscissa of around 4 diameters. At the abscissa of 8 diameters these curves show a second peak of lower intensity, and then we have a decay trend similar to the previous lowest velocity test-cases. Scaling the standard deviation with the standard deviation at the abscissa of % = 8, we obtain the diagram in figure 4/11. It is possible to notice that all the curves collapse quite closely to one curve for E, > 8. The inverse of this ratio is shown in figure 4/12. We can provide a simple equation holding for all test cases to estimate the standard deviation for £>8. The average relative turbulence intensity over all the test cases at the abscissa % = 8 is 23.32%, then from eq. 4:5 we have:
=0.1563-/7(0) (4:7)
From the results shown in diagram of figure 4/12, we can estimate the decay of the centre-line standard deviation of axial velocity, in the domain^>8, as it follows:
St. Dev. (S) St,Dev.
A + B-% (4:8)
In table 4-3 are shown the coefficients obtained in each test case. Adopting an average of this coefficients, and combining eq. 4:7 and 4:8, we can write a general equation to predict the magnitude of the standard deviation of the longitudinal velocity for axial co-ordinates % > 8, as the following:

Chapter 4: Low Reynolds number air jet flows 59
St. Dev. ^ — um1.0499-f-2.3084
(4:9)
Table 4-3. Coefficients of equation 4:6.
1 -0.3583 0.1615i -0.3926 0.1646i -0.3581 0.17031 -0.3537 0.1674i -0.3721 0.16631 -0.3581 0.1604
||s§i||§|§||ll|||§|1 -0.3330 0.1582
The ratio between eq. 4:9 and 4:5 will provide the relative turbulence intensity of the longitudinal velocity in the centre-line from the co-ordinate^ = 8.
Mean Velocity
U(0) = 31.82U(0) = 38.97U(0) = 50.61
• U(0) = 61.11U(0) = 69.33U(0) = 82.32
• U(0) = 91.93
•a % q
j. u
C = X/DFigure 4/5. Centre-line air mean velocity in the centre-line of the jet

60 Todde V.: Sensitivity to draught in turbulent air flows
Normalised Centre- Line Mean Velocity
U(0) = 31.82 U(0) = 38.97 U(0) = 50.61 U(0) = 61.11 U(0) = 69.33 U(0) = 82.32 U(0) = 91.93
----- Mean Curve----- Reference [7]
Figure 4/6. Normalised air mean velocity in the centre-line of the jet.
Figure 4/7. Inverse of normalised air mean velocity in the centre-line of the jet.

Chapter 4: Low Reynolds number air jet flows 61
Normalised Centre- Line Mean Velocity
..... D = 40.1 mm; U(0) = 320 cm/ s• ■ • D = 75.8 mm; U(0) = 350 cm/ s
Actual Experiment: equation (4:4)
C =X/DFigure 4/8. Decay comparison of the mean air velocity in the centre-line of the jet.
Figure 4/9. Relative turbulence intensity of the u-component of air velocity in the centre-line.

62 Todde V.: Sensitivity to draught in turbulent air flows
Standard Deviation
■ U(0) = 31.82U(0) = 38.97U(0) = 50.61U(0) = 61.11U(0) = 69.33U(0) = 82.32
• U(0) = 91.93
•A B-
Figure 4/10. Standard deviation of the u-component of air velocity in the centre-line of the jet.
Normalised Standard Deviation
U(0) = 31.82 U(0) = 38.97 U(0) = 50.61 U(0) = 61.11 U(0) = 69.33 U(0) = 82.32 U(0) = 91.93 Mean Curve
0 aa
Figure 4/11. Normalised standard deviation of air velocity in the centre-line of the jet.

!
Chapter 4: Low Reynolds number air jet flows 63
Standard Deviation Decay
U(0) = 31.82U(0) = 38.97U(0) = 50.61U(0) = 61.11
• U(0) = 69.33U(0) = 82.32U(0) = 91.93
Figure 4/12. Inverse of standard deviation of air velocity in the centre-line of the jet.
4.5 References
[1] Becker H. A Massaro T. A. (1968). Vortex Evolution in a Round Jet, Journal of Fluid Mechanics 31, pp. 435-448
[2] Crow, S. C., Champagne, F. H. (1971). Orderly Structure in Jet Turbulence, Journal of Fluid Mechanics 48, pp. 547-591
[3] Brown G.B. (1935). On vortex motion in gaseous jets and the origin of their sensitivity to sound. Proc. Phys. Soc., 47,703-732
[4] Freymuth, P. (1966). On Transition in a Separated Laminar Boundary Layer, Journal of Fluid Mechanics 25, pp. 683-704
[5] Malmstrom T.G. Kirkpatrick AT. Christensen B. Knappmiller KJD. (1997). Centreline velocity decay measurements in low-velocity axisymmetric jets. J. Fluid Mech., 246,363-377.
[6] Iuso, G., Onorato, M., Carlomagno, G. M., De Luca, L., Cardone, G. (1995). Wall Heat Flux Reduction by Outer Layer Devices, Proceedings of the 7th International Symposium on Flow Visualization, Seattle, Washington, USA
[7] Rodi W. (1982). Turbulent buoyant jets and plumes. Pergamon Press.
[8] Tennekes H., Lumley J.L. (1990). A first course in turbulence. M.I.T. Press.


Chapter 5: Sensitivity to horizontal air movements at the neck 65
5 Sensitivity to horizontal air movements at the neck
5.1 Introduction
This investigation has been designed to find how people perceive and feel horizontal air movements flowing from behind their neck. Two experiments have been developed to observe the level of discomfort due to draught in this head region, with a large range of mean air velocities at controlled levels of relative turbulence intensity. Both the experiments took place in the same climate room where the jet flow investigation was developed, see chapter 3, and the same nozzle was used to supply the air. The wall temperature was kept at the constant value of around 22°C, while the jet flow was blowing in nearly isothermal conditions with the air in the room. The first experiment was carried out with twelve volunteer test persons, six males and six females, and the second one with four test persons, two females and two males. Every subject performed the test sitting with the centre of the neck placed in the centre-line of the jet flow, which was blowing horizontally from behind. The flow velocity was recorded at a distance of 20 cm behind the neck with a hot wire anemometer. The velocity sensor was mounted on a thin vertical support, which could be moved transversally to the jet flow centreline. To minimise the interaction with the flow field impinging the neck, the hot wire was kept behind the neck only for the indispensable time to record the air flow properties, then it was moved away. In figure 5/1, is shown the test room design with a plan and a lateral view.
PLAN VIEW LATERAL VIEW
Figure 5/1. Experimental design: plan and lateral view.
From the data obtained in the previous jet flow investigation, see chapter 3, it has been observed that the standard deviation and the mean value of the longitudinal component of air velocity start to decrease their longitudinal gradient at a co-ordinate % = 12 - 15, (% = X/D, where X is the downstream distance from the jet orifice, and D the diameter of the nozzle at the inlet section). Moreover, as already stressed in chapter 3, at the inlet section of the jet there is the formation of waves which, after developing for a length that depends on the jet Reynolds

66 Todde V.: Sensitivity to draught in turbulent air flows
number, roll up into large scale vortices. These vortical structures can be considered as precursors to the full development of the turbulence. It has been observed that these vortices keep a strong identity for a length corresponding to some orifice diameters, (around 8-10 diameters). Afterwards they destabilise and quickly decay to the chaotic structure typical of turbulence. As an example, figure 5/2 shows a smoke visualisation of the mentioned air jet at a Reynolds number of 2342. It is possible to observe the evolution of the large scale vortical structure and the transition to turbulence. More details are explained in chapter 3.
Figure 5/2. Smoke visualisation of the air jet flow at Reynolds number of 2342.
The relative turbulence intensity of air velocity is one of the fundamental properties of air movements affecting the sensitivity to draught, see Ref. [3]. The experiments were designed with a particular attention to analyse this effect. It was then chosen to expose the neck of the test persons to a developed turbulent air flow, i.e. to a flow where large scale voirtices have decayed. Thus it has been decided to locate the test person with the back surface of his neck at a distance of 80 cm, (% = 16), from the inlet section of the jet. The distance between the velocity sensor and the neck surface, 20 cm, was the minimum possible to obtain air velocity measurements free from interactions with the human body thermal plume.
Even though the presence of the subject slightly increased the air temperature in the room, it has been possible to keep the jet in an isothermal state with the room air, in the temperature range of 22,2 - 22,7 °C. The distance between the neck and the inlet of the nozzle, was long enough to cancel eventual low non isothermal conditions of the air flow with the air in the room, at the position of the velocity sensor.
In the first experiment, every subject performed six or seven individual tests. In every test they were exposed to a particular condition of air velocity for twenty minutes. The range of mean air velocity investigated was between 0,14 and 1,00 m/s with a relative turbulence intensity between 23% and 29%. Before the beginning of every test, the subject was asked to sit in the room for around half an hour in order to achieve thermal neutrality by adjusting the amount of clothing. During this phase, the mechanical supply ventilation was switched off to keep air velocities as low as possible. The skin temperature was recorded with a thermo-couple placed on the neck.
The second experiment was aimed at analysing the impact of relative turbulence intensity on the sensitivity to air movements. This investigation was performed following a similar

Chapter 5: Sensitivity to horizontal air movements at the neck 67
procedure and using the same equipment as in the first experiment. Every test person participated in eleven small tests where they were exposed to a constant draught condition for ten minutes. The human response to draught was observed for mean air velocities between 0.08 and 0.41 m/s, at two levels of relative turbulence intensity of around 23% and 52%.
5.2 Experimental methodology
In the first experiment, twelve volunteers, six females and six males, were in a state of thermal comfort. The subjects participated in small tests of around one hour each, during which they were exposed to one constant draught condition. All tests were developed following the same procedure. The test person was seated on a chair in the climate room, with slightly reclined posture. The position of the chair was adjusted in a way that the centre of the back surface of the neck was at 80 cm from the inlet of the nozzle. With a light laser pointer it was then checked that the neck was placed symmetrically to the centre-line of the jet flow. Long hair was tied up, and shirts without collars were worn, so that the back of the neck was always fully exposed. A thermo-couple was then fixed with a tape on the skin at the back of the neck. The size of the tape was 3 cm2, with 5 cm of the thermo-couple wire in contact with the skin. Unfortunately the tape influenced both the skin temperature, as an insulator, and the thermocouple’s temperature. But it was the only way to keep the ending part of the temperature sensor in good contact with the skin. The room was then closed and the test person was invited to adjust clothing, to achieve thermal comfort. The subject then relaxed until the skin temperature of the neck stabilised. Generally this phase required a period not less than half an hour. When stability of the neck skin temperature was observed, the jet started to blow air in the room isothermally with a constant flow rate for twenty minutes.
Communication with the test person took place over loud-speakers and microphones. In this way it was possible to ask the test person impressions dealing with his sensitivity to draught behind his neck, from outside the room without interacting with the air movement. People were asked at several intervals during the test, more precisely, after 2, 5, 10, 15 and 20 minutes exposure to the jet flow. The questions included three impressions dealing with the sensitivity to air movement behind the neck: the air velocity intensity, the air temperature and the pleasantness of the air movement
To the first question dealing with the intensity of air velocity, the test person could reply as it follows:• No air movement at all. The test person doesn’t feel the presence of any air movement
behind his neck.• Very slightly. The test person feels a weak air movement but not constantly.• Slightly. The test person continuously feels a weak air movement.• Definitely. The test person continuously feels an air movement with a certain intensity.• A lot. The test person continuously feels an intense air movement
To the question dealing with the air temperature behind the neck the test person was invited to reply with one of the following impressions:• Neutral. The test person prefers neither warmer nor cooler air temperature behind his neck.• Slightly cool. The test person starts to have a weak feeling of the coolness of air. The air
behind the neck seems to be at lower temperature than the one in the room.

68 Todde V.: Sensitivity to draught in turbulent air flows
• Cool. The test person feels the air behind his neck definitely cooler than the one in the room, but it’s not cold.
• Cold. The test person feels the air temperature behind the neck cold.• Very cold. The test person feels the coolness of the air behind the neck with high intensity.
The third question dealing with the feeling for the air movement was the most detailed. The test person could reply with one of the following impressions:• Pleasant• Slightly pleasant• Neutral• Slightly unpleasant• Unpleasant• Very unpleasant.
In order to help the test persons to reply to this question, especially for the negative feelings from slightly unpleasant to very unpleasant, the scale was related to the amount of effort the test persons were prepared to exert to change their thermal conditions. They were asked to imagine themselves on a train. The vote of slightly unpleasant was attributed to the condition when the test person would like to turn off the supply of air movement by simply pressing a button, but if he could not, he would not look for another seat. The situation was considered unpleasant in case it was impossible to turn off the air supply, and the test person, still imagining himself on a train, would look for another seat in the same carriage. If instead, the test person wished to change carriage, disregarding the available seats beside him, the feeling was dropped to very unpleasant. In table 5-1, are listed the vote corresponding to the several impressions for draught. In some situations, when the test person had some difficulties to express his impression, he was allowed to use middle votes, in between the above listed judgements. He was for instance allowed to judge the intensity of air movement with a ” between slightly and definitely”. These situations happened very seldom.
Table 5-1. Draught sensitivities and relative vote.
A LOTDEFINITELYSLIGHTLY PLEASANT
VERY SLIGHTLY SLIGHTLY PLEASANTNOT AT ALL NEUTRAL NEUTRAL
SLIGHTLY COOL SLIGHTLY UNPLEASANTCOOL UNPLEASANTCOLD VERY UNPLEASANT
VERY COLD
During the test, the hot wire was moved towards the jet centre-line to perform velocity measurement for three minutes at a sampling rate of 2000 Hz. The instrument for velocity measurements was a fibre-film probe with temperature compensating sensor. The velocity sensor was a nickel film deposited on 70 |im diameter quartz fibre, overall length 3 mm, sensitive film length 1.25 mm, copper and gold plated at the ends. The film was protected by a quartz coating approximately 0.5 pm in thickness. Also, a temperature compensated bridge in a single-channel system was used. The board for data acquisition was with 12 bits. After the three minutes of measurement, the velocity sensor was moved away from the jet flow, with a

Chapter 5: Sensitivity to horizontal air movements at the neck 69
remote control from the outside of the chamber. At the end of the test, the subject was invited to relax in a adjacent room doing some reading, or study activity for around 40-50 minutes. In this room the air temperature was kept at nearly the same value as the air in the climate chamber and no air movements were mechanically supplied. Then, he started again the test with another jet flow condition. Every test person performed a minimum of six and a maximum of seven tests, but he was not allowed to perform more than three tests on the same day. The number of subjects participating at each test and the relative range of velocity conditions in terms of mean value and relative turbulence intensity are indicated in table 5-2.. The letter F indicates female test person, while the letter M indicates male test person.
Table 5-2. Mean initial skin temperature, [°C], at the subject’s neck, and air flow properties of each test.
5F-5M 34.3 14-19 27% - 29%
fsasir 6F-6M 34.8 20-25 25% - 29%
p«sp 5F-6M 34.3 30-35 24% - 28%6F-7M 34.4 36-45 24% - 27%
pUSST 6F-5M 34.6 46-60 24% - 26%
liama 6F-4M 34.7 61-70 24%-26%6F-6M 34.7 80-100 23% - 26%
Figure 5/3 shows the relative turbulence intensity (R.T.I.) versus the mean air velocity recorded in every test. The flow properties were measured in the centre-line of the jet flow. From results obtained in a previous pre-test, it was observed that with the velocity sensor at a distance of 20 cm behind the neck, the velocity measurements were not affected by the presence of the subject, (provided no sudden movements of the subjects). Hence, the air flow conditions measured during a single experiment correspond to the air flow properties without the test person. Therefore, it was decided to carry out the air velocity measurements with a subject present, to prevent eventual lacks of the air supply system, during the course of the experiment.
0.3
0.29
E 0.28
I,,,I3 0.26 |
H 0.25
IS 0.24
<20.23
0.22
Air Velocity Range: Total Points Investigated
o female test persons°4>
Ao
a male test persoris
tp°___ _____
o/so0
A A
b...............
o °o
5"”zr 0>
AO O o
T.......A
A.............
I r! o
!
......kv< I.......>
o> N o o
> A
4 ° < >
o.i 0.2 0.3 0.4 0.5 0.6 0.7Mean Air Velocity [m/s]
0.8 0.9 1.0
Figure 5/3. Relative turbulence intensity versus mean air velocity in each test.

70 Todde V.: Sensitivity to draught in turbulent air flows
Along the cross section of the jet flow, 20 cm behind the neck, mean air velocity and relative turbulence intensity were not uniform. More precisely, as we move away from the centre-line, the mean value decreases and turbulence increases. The trend of these two quantities, with the presence of the subject, is plotted in figure 5/4. The measurements refers to a co-ordinate of 20 cm behind the neck. Both mean air velocity and R.T.I. are normalised with the corresponding value in the jet centre-line.
Air Flow Properties in the Cross Section 20 cm Behind the Neck
Normalized Mean Air Velocity Normalized R.T.I.
Distance from the Jet Centre-Line [cm]
Figure 5/4. Normalised flow properties along the cross section 20 cm behind the neck.
5.3 Sensitivity to air movements
All the data obtained from the impressions of the test persons were analysed separately for each gender. For every one of the seven tests, the mean vote of the human responses was calculated and referred to the average mean air velocity of the corresponding test. For each gender, were obtained seven mean votes for every one of the three impressions, at the average mean air velocity of the corresponding test. In this way it was drawn a trend for every one of the three impressions of air movement versus mean air velocity, with duration exposure as a parameter. Based upon these results, were evaluated the time history trends for all the three impressions of air movement. The small number of test persons doesn’t allow a reliable analysis in terms of percentage. Hence, only the mean vote of the several impressions was estimated for female and male test persons. Instead, in the next chapter, the votes are elaborated also in terms of percentage, for calculating the percentage of dissatisfied subjects to the air movement without any distinction between the genders.
Figure 5/5 shows the results dealing with the sensitivity to air velocity intensity after 2, 10 and 20 minutes of exposure to draught, versus mean air velocity. At the beginning of the exposure, this sensitivity to air movement is practically the same for female arid male test persons. As the exposure continues, at the highest velocities investigated women show a slightly higher sensitivity, Le. a higher mean vote. From the graphs dealing with the sequence of the vote of air velocity intensity in figures 5/8 and 5/9, for both females and males we can distinguish two trends. At air velocities lower than 0.25 m/s the mean vote decreases only slightly with time. In all the other velocity ranges, the sensitivity decreases more with time. The vote 1.0, which corresponds to a very slightly perception of air movement can be considered the limit at which people start to feel air movement. This condition, has been found to be nearly independent of
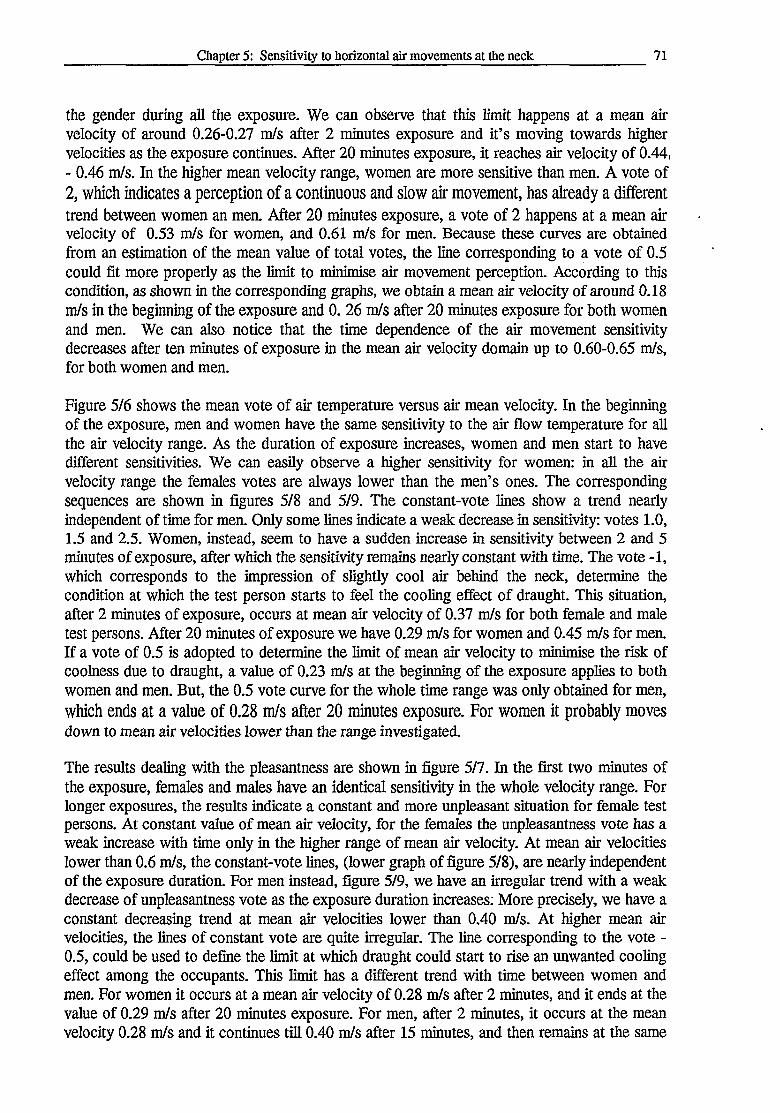
Chapter 5: Sensitivity to horizontal air movements at the neck 71
the gender during all the exposure. We can observe that this limit happens at a mean air velocity of around 0.26-0.27 m/s after 2 minutes exposure and it’s moving towards higher velocities as the exposure continues. After 20 minutes exposure, it reaches air velocity of 0.44, - 0.46 m/s. In the higher mean velocity range, women are more sensitive than men. A vote of 2, which indicates a perception of a continuous and slow air movement, has already a different trend between women an men. After 20 minutes exposure, a vote of 2 happens at a mean air velocity of 0.53 m/s for women, and 0.61 m/s for men. Because these curves are obtained from an estimation of the mean value of total votes, the line corresponding to a vote of 0.5 could fit more properly as the limit to minimise air movement perception. According to this condition, as shown in the corresponding graphs, we obtain a mean air velocity of around 0.18 m/s in the beginning of the exposure and 0. 26 m/s after 20 minutes exposure for both women and men. We can also notice that the time dependence of the air movement sensitivity decreases after ten minutes of exposure in the mean air velocity domain up to 0.60-0.65 m/s, for both women and men.
Figure 5/6 shows the mean vote of air temperature versus air mean velocity. In the beginning of the exposure, men and women have the same sensitivity to the air flow temperature for all the air velocity range. As the duration of exposure increases, women and men start to have different sensitivities. We can easily observe a higher sensitivity for women: in all the air velocity range the females votes are always lower than the men’s ones. The corresponding sequences are shown in figures 5/8 and 5/9. The constant-vote lines show a trend nearly independent of time for men. Only some lines indicate a weak decrease in sensitivity: votes 1.0, 1.5 and 2.5. Women, instead, seem to have a sudden increase in sensitivity between 2 and 5 minutes of exposure, after which the sensitivity remains nearly constant with time. The vote -1, which corresponds to the impression of slightly cool air behind the neck, determine the condition at which the test person starts to feel the cooling effect of draught. This situation, after 2 minutes of exposure, occurs at mean air velocity of 0.37 m/s for both female and male test persons. After 20 minutes of exposure we have 0.29 m/s for women and 0.45 m/s for men. If a vote of 0.5 is adopted to determine the limit of mean air velocity to minimise the risk of coolness due to draught, a value of 0.23 m/s at the beginning of the exposure applies to both women and men. But, the 0.5 vote curve for the whole time range was only obtained for men, which ends at a value of 0.28 m/s after 20 minutes exposure. For women it probably moves down to mean air velocities lower than the range investigated.
The results dealing with the pleasantness are shown in figure 5/7. In the first two minutes of the exposure, females and males have an identical sensitivity in the whole velocity range. For longer exposures, the results indicate a constant and more unpleasant situation for female test persons. At constant value of mean air velocity, for the females the unpleasantness vote has a weak increase with time only in the higher range of mean air velocity. At mean air velocities lower than 0.6 m/s, the constant-vote lines, (lower graph of figure 5/8), are nearly independent of the exposure duration. For men instead, figure 5/9, we have an irregular trend with a weak decrease of unpleasantness vote as the exposure duration increases: More precisely, we have a constant decreasing trend at mean air velocities lower than 0.40 m/s. At higher mean air velocities, the lines of constant vote are quite irregular. The line corresponding to the vote - 0.5, could be used to define the limit at which draught could start to rise an unwanted cooling effect among the occupants. This limit has a different trend with time between women and men. For women it occurs at a mean air velocity of 0.28 m/s after 2 minutes, and it ends at the value of 0.29 m/s after 20 minutes exposure. For men, after 2 minutes, it occurs at the mean velocity 0.28 m/s and it continues till 0.40 m/s after 15 minutes, and then remains at the same

72 Todde V.: Sensitivity to draught in turbulent air flows
value until the end of the exposure. Furthermore, as the mean air velocity increases, the difference between the reactions of women and men becomes more evident. In table 5-3, are summarised the data obtained from this analysis with indication of the mean air velocity corresponding to the vote 0.5, and 1 for all the three impressions of draught.
Table 5-3. Mean air velocity corresponding to the votes 0.5 and 1.0 at the beginningend^^i^raugh^mosur^o^^^ietiim^mpressions
Impression Gender Mean Air Velocity Mean Air Velocity
It is evident, especially considering results from earlier research, see chapter 3, that this analysis, based on estimation of mean vote, provides too high air velocities to satisfy the requirement of 10% of dissatisfied subjects. Even thought the small number of the test persons, in next chapter 6 is developed an analysis in terms of percentage of dissatisfied, i.e those feeling air movements with unpleasantness.
In Ref. [3], we can find that an air jet flow at 23°C, doesn’t rise sensation of discomfort in the first two minutes of exposure for air velocities up to 0.25 m/s. This finding is in good agreement with the graphs, in figures 5/8 and 5/9, dealing with the pleasantness votes. Still in the findings of ref. [3], we have that feelings of discomfort remains constant during the exposure duration. This trend has been observed only with female test persons at mean air velocities up to 0.6 m/s. From a qualitative point of view, the results dealing with the sensitivity to the strength of air velocity are in good agreement: the air velocities are perceived with less intensity as the exposure continues. This trend has been found in Ref.[3], also for the feelings of coolness. This aspect is in disagreement with the current results, especially for the votes observed with female test persons.
5.4 Skin Temperature
The skin temperature at the back of the neck has been recorded before the jet started to blow air, and is referred to us as the initial skin temperature, I.S.T.. In table 5-4, are shown the average values recorded in every test. There are more women than men in the groups with higher I.S.T.
To determine the eventual impact of I.S.T on draught sensitivity, the mean votes of air movement sensitivity were evaluated according to test persons having lower and higher I.S.T.

Chapter 5: Sensitivity to horizontal air movements at the neck 73
than the average. Only a slight difference in sensitivity between these two groups was observed, and there were not a well defined trend holding for the whole mean velocity range and exposure duration as well Moreover, the difference in sensitivity between these two - groups was considerably smaller than the one found between the two genders. The small sample of test persons limits an analysis on impact of initial skin temperature to draught sensitivity within the same gender. Useful information could be obtained from an investigation with a larger number of test persons, suitable for a separate analysis between female and male test persons, with lower and higher I.S.T.
%Table 5-4. Test persons: distribution of Initial Skin Temperature, (I.S.T.) in every test.
34.3 2 Females - 5 Males 3 Females - 2 Males34.8 2 Females - 4 Males 4 Females - 2 Males34.3 2 Females - 4 Males 3 Females - 2 Males34.4 2 Females - 5 Males 4 Females - 2 Males34.6 2 Females - 3 Males 4 Females - 2 Males34.7 3 Females - 2 Males 3 Females - 2 Males
mg&M 34.7 3 Females - 3 Males 3 Females - 3 Males
During the exposure to draught, the neck skin temperature was recorded as well Figure 5/10shows the mean skin temperature drop from the I.S.T. in every test, versus mean air velocity, for females and males. For some test persons we had to reject the data, due to the imperfect attachment of the thermo-couple with the skin surface. At the beginning of the exposure females and males show an equal drop of skin temperature. As the exposure duration increases, females have a greater drop in skin temperature along all the velocity range investigated.
In the graph dealing with the drop of skin temperature after 20 minutes exposure, the line from the data of reference [1] is also plotted. More precisely, this line corresponds to the drop of skin temperature after 30 minutes exposure to draught at an air temperature of 21.1 °C., which is the closest situation investigated in reference [1] with our experiment. Moreover, this line has been obtained with only male test persons, for an air temperature of around 1°C lower, and an exposure duration of 10 minutes longer than in the current investigation. Even though, the mentioned curve fits quite well with the results dealing with male test persons.
Also from the results of reference [1], a drop in the neck skin temperature close to 1.8 °C determines the limit between comfortable and uncomfortable draught based on the condition of 10% dissatisfied to the air movement. In figure 5/11, we can observe that a drop of 1.8 °C in the neck skin temperature, after 20 minutes exposure, corresponds to a mean vote of pleasantness -0.4, for both females and males. From the lower graph of figure 5/10, a drop in skin temperature of 1.8° has been observed at mean air velocities of around 0.25 and 0.32 m/sec for females and males respectively, after 20 minutes exposure. Considering the lower graph in figure 5/7, we can easily notice how these velocities are very far from satisfying the requirement of 10% dissatisfied to the air movement. This partially confirms, as already advanced in chapter 2, that in Ref. [1] air velocities have been over estimated.

74 Todde V.: Sensitivity to draught in turbulent air flows
5.5 Effects of turbulence intensity
A small investigation has been designed to provide qualitative ideas of the effects of relative turbulence intensity (R.T.I.), on draught sensitivity. The experiment was developed with four test persons, two females and two males. The procedure was identical to the first experiment, with a shorter exposure to draught, 10 minutes. A total of 44 single tests have been analysed in the mean velocity range between 0.08 and 0.42 m/s. Two levels of air velocity turbulence have been investigated: a low level of around 23% and a high level of around 52%. High level of R.T.I was generated by means of two rotating wells (with three blades), inside the nozzle, and by grid screens at the inlet section of the nozzle. The test persons were allowed to express their votes with a higher resolution than in the previous experiment. For example it was possible to vote the. air velocity intensity with a vote between ’’very slightly’ and ’’slightly’. In all the tests the air temperature was kept between 22.2 and 22.5 °C.
Figures 5/12 - 5/14, show the results obtained for the three impressions of air movement behind the neck. The graphs reveal an important impact of R.T.I. on draught discomfort. This aspect is in agreement with Ref. [2]. For all the three impressions of air movement, the curves corresponding to high R.T.I. indicate a higher sensitivity than the ones at lower R.T.I.. The difference is particularly pronounced at the higher mean air velocity range. The limited number of test persons in this experiment doesn’t allow a comprehensive prediction of mean vote of draught sensitivity and percentage of dissatisfied subjects as functions of mean air velocity and relative turbulence intensity. Hence it was not possible to compare the results with earlier investigations. Anyhow, it was useful to provide indications on how an increase in R.T.I. could strongly affect the perception of air movement.
Figure 5/12 deals with the mean vote of air velocity intensity. The results obtained from the tests at low relative turbulence intensity seem to follow quite closely the ones obtained with the first experiment. Comparing the last two graphs in figure 5/12, we can notice a well defined difference of air movement sensitivity for a constant mean air velocity. With high turbulence, the votes seem to remain constant with exposure duration, while at low turbulence the sensitivity decreases rapidly with time.
Table 5-5. Mean air velocity corresponding to the votes 0.5 and 1.0 at the beginning and the end of the draught exposure for all the three impressions, at low and high R.T.I.. _____

Chapter 5: Sensitivity to horizontal air movements at the neck 75
The results for the air temperature sensitivity are shown in figure 5/13. After 10 minutes exposure we can notice that the mean air velocity corresponding to the vote -0.5 and -1 at low turbulence level is around double the ones at high turbulence. As shown in figure 5/14, also for the pleasantness vote, the effect of R.T.I. of air velocity is remarkable. Table 5-5 shows the values of mean air velocity corresponding to the votes 0.5 and 1.0 at the beginning of the exposure and after 10 minutes, for all the three impressions, at low and high R.T.I..
5.6 Conclusions
• The sensitivity to draught depends on the exposure duration, especially in the higher range of mean air velocity investigated.
• At the beginning of the exposure, no differences in sensitivity to the air flow were observed between females and males. For both, females and males, the strength of the air flow was detected at lower mean air velocities than the cooling effect was.
• As the exposure continues, the sensitivity to air velocity intensity decreased rapidly and the test persons started to be more sensitive to air temperature. Female test persons decreased the sensitivity to air velocity intensity, mostly in the first ten minutes. In the first five minutes of exposure, the thermal sensitivity of females was observed to increase. Male test persons revealed a large decrease of sensitivity to air velocity intensity during all the exposure duration. The thermal sensitivity to air temperature was nearly constant
• A vote of unpleasantness was always associated with a vote of coolness. For both females and males, it was never found a negative vote of pleasantness without a negative vote of air temperature.
• A vote of pleasantness was more stable with exposure duration for women than for men. Women were also more strict for the pleasantness vote in the whole velocity range investigated.
• With the exception of the initial period of exposure, all three impressions about draught denoted a clear difference between females and males. All the results showed the female test persons more sensitive than males.
• At the beginning of the exposure, females and males had the same drop in skin temperature. As the exposure continued, females revealed a greater drop than men, along all the mean air velocity domain investigated.
• From the results of the second experiment, relative turbulence intensity (R.T.I.) of air velocity had an evident impact on the sensitivity to air movement. Higher R.T.I. increased significantly the sensitivity to draught.
• In the experiments at high R.T.I., the mean votes of all the three impressions were observed to be more constant and regular with exposure duration than at lower R.T.I..

76 Todde V.: Sensitivity to draught in turbulent air flows
Air Velocity Intensity: Mean Votes and Standard Deviation After 2 Minutes
female test persons: mean votes - male test persons: mean votes
females: standard dev.
males: standard dev.
Mean Air Velocity [m/s]
Air Velocity Intensity: Mean Votes and Standard Deviation After 10 Minutes
o ----- female test persons: mean votes□ ----- male test persons: mean votes
females: standard dev.
males: standard dev.
Mean Air Velocity [m/s]
Air Velocity Intensity: Mean Votes and Standard Deviation After 20 Minutes
o----- female test persons: mean votes□ ----- male test persons: mean votes
females: standard dev.
males: standard dev.
Mean Air Velocity [m/s]
Figure 5/5. Mean vote of air velocity intensity. Only half standard deviation is drawn.

Chapter 5: Sensitivity to horizontal air movements at the neck 77
Air Temperature: Mean Votes and Standard Deviation After 2 Minutes
o----- female test persons: mean votes□ ----- male test persons: mean votes
standard dev.females
males: standard dev.
Mean Air Velocity [m/s]
Air Temperature: Mean Votes and Standard Deviation After 10 Minutes
o----- female test persons: mean votes□ ----- male test persons: mean votes
F -1.5
females: standard dev.
males: standard dev.
Mean Air Velocity [m/s]
Air Temperature: Mean Votes and Standard Deviation After 20 Minutes
o------female test persons: mean votes□ ----- male test persons: mean votes
females: standard dev.
males: standard dev.
Mean Air Velocity [m/s]
Figure 5/6. Mean vote of air temperature. Only half standard deviation is drawn.

78 Todde V.: Sensitivity to draught in turbulent air flows
Pleasantness: Mean Votes and Standard Deviation After 2 Minutes
o----- female test persons: mean votes□ ----- male test persons: mean votes
females standard dev.
males: standard dev.
Mean Air Velocity [m/s]
Pleasantness: Mean Votes and Standard Deviation After 10 Minutes
o----- female test persons: mean votes□ ----- male test persons: mean votes
standard dev.
I males: standard dev.
Mean Air Velocity [m/s]
Pleasantness: Mean Votes and Standard Deviation After 20 Minutes
o----- female test persons: mean votes□ ----- male test persons: mean votes
females standard dev.
males: standard dev.
Mean Air Velocity [m/s]
Figure 5/7. Mean vote of pleasantness. Only half standard deviation is drawn.

Chapter 5: Sensitivity to horizontal air movements at the neck 79
Female Test Persons: Air Velocity Intensity Vote
Vote = 0.5Vote= 1.0
•• Vote= 1.5
Vote = 2.5□-----Vote = 3.0
Vote = 3.5
Mean Air Velocity [m/s]
Female Test Persons: Air Temperature Vote
Vote = - 0.5Vote = -1.0Vote = -1.5Vote = - 2.0•3 15 — Vote = - 2.5
— Vote = - 3.0
0.4Mean Air Velocity [m/s]
Female Test Persons: Pleasantness Vote
Vote = - 0.5Vote = -1.0Vote = -1.5
• • Vote = - 2.0
Mean Air Velocity [m/s]
Figure 5/8. Female test persons: time history of the votes for air movement impressions.

80 Todde V.: Sensitivity to draught in turbulent air flows
Male Test Persons: Air Velocity Intensity Vote
Vote = 0.50 ----- Vote = 1.0
— Vote= 1.5Vote = 2.0Vote = 2.5
0.2 0.4 0.6Mean Air Velocity [m/s]
Male Test Persons: Air Temperature Vote
Vote = - 0.5O ----- Vote = -1.0
Vote = -1.5Vote = - 2.0
— Vote = - 2.5
0.4Mean Air Velocity [m/s]
Male Test Persons: Pleasantness Vote
Vote = - 0.50 ----- Vote = -1.0
— Vote = -1.5Vote = - 2.0
0.4Mean Air Velocity [m/s]
'igure 5/9. Male test persons: time history of the votes for air movement impressions.

Chapter 5: Sensitivity to horizontal air movements at the neck 81
Drop in Skin Temperature After 2 Minutes
1.8
5 1.6I1'4
r # 1.02 0.8 C/5•5 0.6 8-
0.2
o female test personsa male test persons
— female test persons .......male test persons
.............^-.2::
...........
......
0/<-1...........
..............______
....<£2......
....................................................,2:.
"ao 0.2 0.4 0.6 0.8 1.0Mean Air Velocity [m/s]
Drop in Skin Temperature After 10 Minutes
3.55<o 3.0LI,c
iu
.50*1.0
0.5
o female test personsa male test persons
-----female test persons.......male test persons
....... .^.-07.2.7
.........
A--*
O/
.........
... .7±'.........
'A
“ao 0.2 0.4 0.6 0.8 1.0Mean Air Velocity [m/s]
Drop in Skin Temperature After 20 Minutes
4.5
54.0y§ 3.5 2“3.0E(2 2.52 2.0 CO•S 1.5 &£1.0
0.5
o female test personsa male test persons
-----female test persons....... male test persons----- reference [1]
..............
............
_____________
.... ><f
...................'A
“•“0.0 0.2 0.4 0Mean Air Veloci
6 0.8 1.0 ty [m/s]
Figure 5/10. Drop of skin temperature versus mean velocity.

82 Todde V.: Sensitivity to draught in turbulent air flows
Mean Votes of Air Velocity Intensity
/ ■
........................ ^ ................ • .
............ A
k: ^4------------
O ....... females: after 2 minutes□------males: after 2 minutesA ....... females: after 10 minutes0------males: after 10 minutes9 ....... females: after 20 minutesX------males: after 20 minutes
Z. /X
/
f >•-
3.5
5*3.0
1a Z5
8 2.0p.h 1.5<
1.0
£0.5
0.00.0 0.5 1.0 1.5 2.0 2.5 3.0 3.5
Drop in Skin Temperature [C]4.0 4.5 5.0
Mean Votes of Air Temperature
0.0
2o -1.0
-2.5
-3.0
;s: after 2 minutes after 2 minutes
;s: after 10 minutes.\ XA.. ^_ O ....... femal<
□------malesA ....... femal
o'
<
m:xXxx .
§--------males9 ....... femalix------males
after 10 minutes ;s: after 20 minutes
after 20 minutes
j •
\\XZX :•
\• • •• • •••
b
\ ....... :- - - — — - ■*............ Z'- xi.................
0.0 0.5 1.0 1.5 2.0 2.5 3.0 3.5 4.0 4.5 5.0Drop in Skin Temperature [C]
Mean Votes of Pleasantness
0.0
,-0.5
r1-0O „o -1.5S
-2.0
..VV
V. :
"4
o□A09x
females: after 2 minutes males: after 2 minutes females: after 10 minutes males: after 10 minutes females: after 20 minutes males: after 20 minutes
V-v %X
Vo
-2.50.0 0.5 1.0 1.5 2.0 2.5 3.0
Drop in Skin Temperature [C]3.5 4.0 4J 5.0
Figure 5/11. Vote of draught versus drop of skin temperature.

Chapter 5: Sensitivity to horizontal air movements at the neck 83
Air Velocity Intensity: Vote After 10 Minutes
O ------ Low R.T.I.A------High R.T.I.
Mean Air Velocity [m/s]
Low R.T.I.: Vote of Air Velocity Intensity
Vote = 0.5A ------ Vote =1.0
Vote = 1.25Vote = 1.5Vote = 2.0
Mean Air Velocity [m/s]
High R.T.I.: Vote of Air Velocity Intensity
Vote = 0.5Vote = 1.0Vote = 1.5Vote = 2.0
— Vote = 2.5
Mean Air Velocity [m/s]
Figure 5/12. Mean vote of air velocity intensity after 10 minutes and time history.

84 Todde V.: Sensitivity to draught in turbulent air flows
Air Temperature: Vote After 10 Minutes
-0.51
&-1.01
<-,.5
0
1
-2.0
-2J
11
10
8 9!;
g,
I;
2
1
A.
O---------
..............
s*..................X
X........
&O ----- Low R.T.I.A-----High R.T.I.
0.05 0.1 0.15 0.2 0.25 0.3 0.35 0.4Mean Air Velocity [m/s]
Low R.T.I.: Vote of Air Temperature
;
/
.................; —
/
, /...............
...... Vote = - 0.5A ----- Vote = - 1.0
-----Vote = - 1.25O • • - Vote = - 1.5
..............i 1
/ ..........\ •
0.05 0.1 0.15 0.2 0.25 0.3 0.35 0.4Mean Air Velocity [m/s]
High R.T.I.: Vote of Air Temperature
10
? 9
1:
5,
i;
2
1
•
\ \........... 4............. —o...............
X............[.............
....^>......./........./
I1
1i
...... Vote - - 0.5A -------- Vote = - 1.0
-----Vote = - 1.5O ■ • - Vote = - 2.0
\ „.l.....................
\
0.05 0.1 0.15 0.2 0.25 0.3 0.35 0.4Mean Air Velocity [m/s]
Figure 5/13. Mean vote of air temperature after 10 minutes and time history.

Chapter 5: Sensitivity to horizontal air movements at the neck
Pleasantness: Vote After 10 Minutes
0-1.5
O ------ Low R.T.I.— High R.T.I.
0.2 0.25Mean Air Velocity [m/s]
Low R.T.I.: Vote of Pleasantness
Vote = - 0.5Vote = -1.0Vote = -1.25
Mean Air Velocity [m/s]
High R.T.I.: Vote of Pleasantness
Vote = - 0.5Vote = -1.0
Vote = - 2.0
Mean Air Velocity [m/s]
Figure 5/14. Mean vote of pleasantness after 10 minutes and time history.

86 Todde V.: Sensitivity to draught in turbulent air flows
5.7 References
[1] Houghten F.C. 1938. Draught temperatures and velocities in relation to skin temperatureand feeling of warmth. ASHVE Transactions. Vol.30, pp. 193-212.
[2] Fanger P.O., Melikov A.K., Hanz'awa H., Ring J. 1988. Air turbulence and sensation of draught. Energy and Buildings, Lausanne, Switzerland: Elsevier Sequoia S.A.Vol 12 pp.21-39
[3] Me Intyre D.A. 1979. The effect of air movement on thermal comfort and sensation. Indoor Climate. P.O. Fanger and O. Valbjom, eds. Copenhagen, Denmark: Danish Building Research Inst, pp.541-560.

Chapter 6: Discomfort due to horizontal air movements at the neck 87
6 Discomfort due to horizontal air movements at the neck
6.1 Introduction
The human response to horizontal draught from behind the neck, observed in the experiment of chapter 5, is analysed in order to estimate the percentage of dissatisfied subjects (PD), Le. those feeling discomfort due to the air movement. This percentage has been evaluated as a function of mean air velocity and exposure duration, from the observed votes denoting the pleasantness level. Despite a large number of definitions adopted in earlier scientific studies, in this work, the term "draught is used to indicate ”a local air movement”. The sample of test persons participating in this experiment was too small for a comprehensive representation of the general human response, but it can still provide useful qualitative information of practical value, for instance the effect of exposure duration. Results dealing with the mean vote of pleasantness, shown in chapter 5, indicate a possible different reaction between female and male test persons. However, to avoid a percentage analysis based on an even more small sample of subjects, this study is developed without any distinction between the genders.
Figure 6/1. Test person in the climate room. The air jet flow, smoke visualisation, is blowing at a velocity of 30 cm/s at the probe position (point of the vertical bar 20 cm behind the neck).
An air movement condition was considered responsible of draught discomfort when the pleasantness vote was under the neutral level Hence, all the negative votes of pleasantness were then referred to us as a condition denoting dissatisfaction. Based on this criteria, the PD is provided as a function of air mean velocity, with exposure duration as a parameter. During the experiment, the subject was always keeping the trunk in an almost vertical position, slightly bending backwards, see figure 6/1. This position was found by the test persons as the most comfortable, and at the same time, was also minimising the effects of the thermal plume rising from the trunk on the horizontal jet flow. In the case of a person sitting in front of a table, bending the trunk ahead, an hypothetical air flow from behind should cross a thicker thermal

88 Todde V.: Sensitivity to draught in turbulent air flows
plume before to arrive in contact with the neck surface. Hence, in this experiment the sitting position of the subject was the one minimising the natural defence from external air movements provided by the thermal plume of the trunk. Indeed, the subject was invited to seat as much comfortable as possible on the chair during the adaptation period, and then he was asked to keep the posture for the whole experiment, while the air jet flow was blowing.
6.2 Results
This analysis is based on the observed votes of pleasantness level while the test person was sitting in the climate room, and the air jet flow blowing horizontally from behind onto the neck. In graph (A) of figure 6/2 there is an example of the collected pleasantness votes versus mean air velocity. These data have been divided in seven groups according to the air velocity, and referred to the mean air velocity of the corresponding group, see graph (B) of figure 6/2. In table 6-1 are indicated the number of subjects and the air velocity properties of each group.
Graph A Graph B
v-oo-{*ooe<mO'-90-coq»frO--{>-.
- -O- --JO O -OQ - ©■ — Q * ©■ - *£-2.0
0.0 0.1 0.2 0.3 0.4 0.5 0.6 0.7 0.8 0.9Mean Air Velocity [m/s] Mean Air Velocity [m/s]
Figure 6/2. Graph A: vote of pleasantness after two minutes exposure. In graph B the data are pooled into seven groups, according to the referred mean air velocities, as indicated in table 6-1.
Table 6-1. Test persons, air flow properties and referred mean air velocities in all groups.
5F-5M 14-19 15.7 27% - 29%6 F - 6 M 20-25 22.8 25% - 29%5F-6M 30-35 33.6 24% - 28%6F-7M 36-45 41.1 . 24% - 27%6F-5M 46-60 54.4 24% - 26%6F-4M 61 -70 66.9 24% - 26%6F-6M 80-100 91.3 23% - 26%
For each of these groups it was evaluated the percentage of test persons dissatisfied to draught, Le. the percentage of pleasantness vote under the neutral point (a vote <0), after 2,5,10,15 and 20 minutes exposure. In figure 6/3, we can observe that at air velocities lower than around 0.22-
88

Chapter 6: Discomfort due to horizontal air movements at the neck 89
0.24 m/s, the PD remains at low values of around 20%. Afterwards, in the velocity range from around 0.25 m/s until 0.50-0.55 m/s, the PD rises very fast up till values of nearly 100%.
Percentage of Dissatisfied Subjects
Air temp,[C]: 22.2 < Ta < 22.7
Turbulence: 23% < Tu < 29%
O ----- PD after 2 minutesa----- PD after 5 minutes□ — PD after 10 minutes 0 — PD after 15 minutes* ........ PD after 20 minutes
Mean Air Velocity [m/s]
Figure 6/3. Percentage of dissatisfied subjects versus mean air velocity at different exposure duration.
Percentage of Dissatisfied Subjects
Air temp.[C]: 22.2 < Ta < 22.7 Turbulence: 23% < Tu < 29% Mean Air Velocity
33.6 cm/s
22.8 cm/s
15.7 cm/s
10 15Exposure Duration [minutes]
Figure 6/4. Percentage of dissatisfied subjects versus exposure duration at different mean air velocities.
In figure 6/4, the PD is plotted versus duration exposure with mean air velocity as a parameter. At the lower range of air velocity investigated, the PD remained at low values of around 20% during all the exposure period. Between air velocities from around 0.22-0.24 m/s until 0.50- 0.55, the PD was observed to decrease as the exposure continued. For instance, a PD of 90% was observed at the beginning of the exposure for air velocities of around 0.40 m/s, then it decreased until around 45% at the end of the exposure period (20 minutes). At air velocities

90 Todde V.: Sensitivity to draught in turbulent air flows
higher than 0.55-0.60 m/s the PD was observed to constantly remain at values of 100% for all the exposure period.
From the results shown in figure 6/3, it was then evaluated the mean value of PD over all the 20 minutes of exposure and referred to the corresponding mean air velocity. The resulting trend of this mean PD is shown in figure 6/5 and compared with the experimental observations in Ref. [1], with the model of P.O. Fanger et al, Ref. [2], and with the experimental results of Mayer E. and Schwab R., Ref. [3].
Percentage of Dissatisfied Subjects
o ----- PD: Mean value* ....... PD: Reference [1]O-----PD: Reference [2]□------PD: Reference [3]
Mean Air Velocity [m/s]
Figure 6/5. Percentage of dissatisfied subjects. Comparison with results from Refs. [1,2,3].
The results from ref. [1], obtained with air movement temperature of around 21°C (the level of turbulence intensity is not indicated), indicate very low PD level versus mean air velocity. This is probably due to imperfections of the experimental design, see chapter 2. The line relative to the mathematical model, Ref. [2], is calculated with an air temperature of to 22.5°C and velocity turbulence of 30%. This model is based on experimental observations of the human response of subjects continuously exposed to increasing air velocity steps. This methodology might have contributed to an under estimation of the PD at the higher velocity range investigated, probably because the test persons had time to adapt to the previous air flow. This aspect is also supported by the trend of PD versus exposure duration, observed in the current experiment at air velocities between 0.22-0.24 m/s and 0.50-0.55 m/s, see figure 6/4. In the current experiment, the test persons were continuously sitting in the chair keeping the same posture, slightly reclined, for all the exposure duration. In the work of Ref. [2], the test persons were sitting in front on a desk. In this situation, the posture of the test person, bending forwards, was probably more effective in counteracting the incoming air flow from behind towards the head region, due to the thicker thermal plume rising from the trunk. The results of Ref. [3] were obtained with an horizontal air flow from behind the neck at low level of turbulence intensity, 5%, and at a temperature of 23°C, the method otherwise being similar to Ref.[2]. Both Refs. [2] and [3] indicate a nearly linear increase of PD with air velocity. This finding is not totally respected by the current results. The results from Ref. [3] are closely following the current experimental observations at the end of the exposure period, i.e. after 15-20 minutes exposure.
90

Chapter 6: Discomfort due to horizontal air movements at the neck 91
Vote of Pleasantness: Percentage of Votes 0, -1, - 2, - 3
| Air temp.: 22.2 < Ta < 22.7 o ----- VoteOa----- Vote -1□ — Vote - 2 0 .......Vote-3
Turbulence: 23% <Tu< 29%
--0-:
Mean Air Velocity [m/s]
Figure 6/6. Percentage of the votes of pleasantness: mean value over all exposure period.
More information about the mean line of PD of figure 6/4, could be obtained from figures 6/6 to 6/9. In figure 6/6, are shown the mean values of the percentage of every vote of pleasantness over the whole exposure period. As explained in chapter 5, the vote of pleasantness was related to the efforts that the test persons were prepared to exert to change their thermal condition.
A vote of -1 had a relevant percentage along the whole velocity range where discomfort was observed. A vote -1 means that the subject was prepared to do only a very light activity to improve his environment (pressing a button), otherwise he would endure the annoyance induced by the cooling effect of the air movement. This discomfort could decrease concentration and/or performance in light work. Thus the importance to supply air flows in rooms where the occupants need concentration within a comfortable level of air velocity should not neglected. Furthermore, the possibility for the occupants to adjust the level of air velocity by means of a simple manual command, would greatly reduce the risk of annoyance induced by discomfortable air movements.
In figure 6/7, the percentage of the observed vote -1 is shown at different exposure duration. At the beginning of the exposure we have a peak at 0.4 m/s. Afterwards, as exposure continues the vote -1 tends to spread over a large range of mean air velocity with a percentage of around 45%. The evolution of the percentage of vote -1 with the exposure duration is also shown in figure 6/8. In the two groups at the referred mean air velocity of around 0.33 m/s and 0.41 m/s the percentage of vote -1 was observed to decrease during the exposure period from values of around 65%-75% towards 45%. At lower air velocities, the percentage of vote -1 remained close to values of 20%, during all exposure period. Also for air velocities between 0.55 m/s and 0.70 m/s, the percentage of vote -1 was observed to be quite high, 40%-65% at the beginning of the exposure, and 45%-50%, at the end of the exposure.

92 Todde V.: Sensitivity to draught in turbulent air flows
Figure 6/7. Percentage of the vote of pleasantness -1 versus mean air velocity at different exposure periods.
Mean Air VelocityMean Air Velocity
Exposure Duration [minutes]
Percentage of Vote -1
Exposure Duration [minutes]
Percentage of Vote -1
Figure 6/8. Percentage of vote of pleasantness -1 versus exposure duration at different mean air velocities.
Percentage of Vote - 2 Percentage of Vote - 3
O ------ 2 minutesA------5 minutes□----- 10 minutes0------15 minutes* ........ 20 minutes
O ------ 2 minutesA------5 minutes□----- 10 minutes0 ------15 minutes* ........ 20 minutes
<j/r/
■a—b-0.0 0.1 02 03 0.4 05 0.6 0.7 0.8 0.9
Mean Air Velocity [m/s]0.0 0.1 02 03 0.4 05 0.6 0.7 0.8 0.9
Mean Air Velocity [m/s]
Figure 6/9. Percentage of votes of pleasantness -2 and -3 versus mean air velocity at different exposure periods.
92
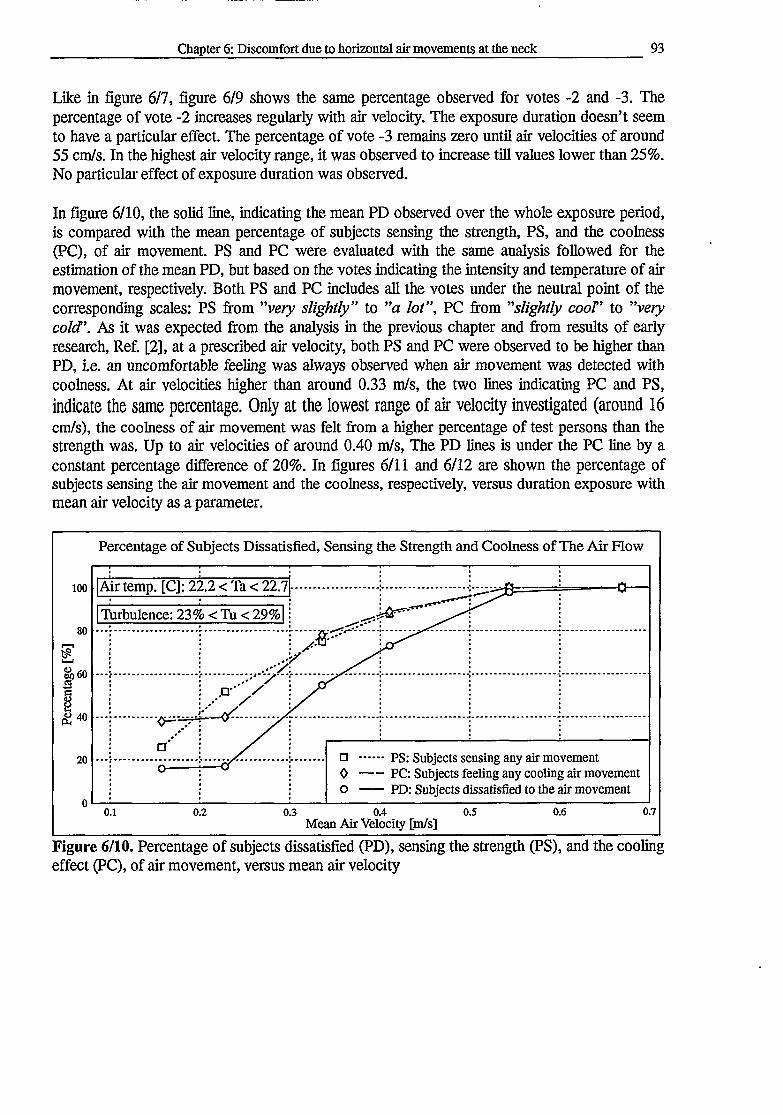
Chapter 6: Discomfort due to horizontal air movements at the neck 93
Like in figure 6/7, figure 6/9 shows the same percentage observed for votes -2 and -3. The percentage of vote -2 increases regularly with air velocity. The exposure duration doesn’t seem to have a particular effect. The percentage of vote -3 remains zero until air velocities of around 55 cm/s. In the highest air velocity range, it was observed to increase till values lower than 25%. No particular effect of exposure duration was observed.
In figure 6/10, the solid line, indicating the mean PD observed over the whole exposure period, is compared with the mean percentage of subjects sensing the strength, PS, and the coolness (PC), of air movement. PS and PC were evaluated with the same analysis followed for the estimation of the mean PD, but based on the votes indicating the intensity and temperature of air movement, respectively. Both PS and PC includes all the votes under the neutral point of the corresponding scales: PS from ’’very slightly” to ”a lot”, PC from ”slightly cooF’ to ’’very cold’. As it was expected from the analysis in the previous chapter and from results of early research, Ref. [2], at a prescribed air velocity, both PS and PC were observed to be higher than PD, i.e. an uncomfortable feeling was always observed when air movement was detected with coolness. At air velocities higher than around 0.33 m/s, the two lines indicating PC and PS, indicate the same percentage. Only at the lowest range of air velocity investigated (around 16cm/s), the coolness of air movement was felt from a higher percentage of test persons than the strength was. Up to air velocities of around 0.40 m/s, The PD lines is under the PC line by a constant percentage difference of 20%. In figures 6/11 and 6/12 are shown the percentage of subjects sensing the air movement and the coolness, respectively, versus duration exposure with mean air velocity as a parameter.
Percentage of Subjects Dissatisfied, Sensing the Strength and Coolness of The Air Flow
Air temp. [C]: 22.2 < Ta < 22.7 -
Turbulence: 23% < Tu < 29%
□ ....... PS: Subjects sensing any air movementO----- PC: Subjects feeling any cooling air movemento ----- PD: Subjects dissatisfied to the air movement
Mean Air Velocity [m/s]
Figure 6/10. Percentage of subjects dissatisfied (PD), sensing the strength (PS), and the cooling effect (PC), of air movement, versus mean air velocity
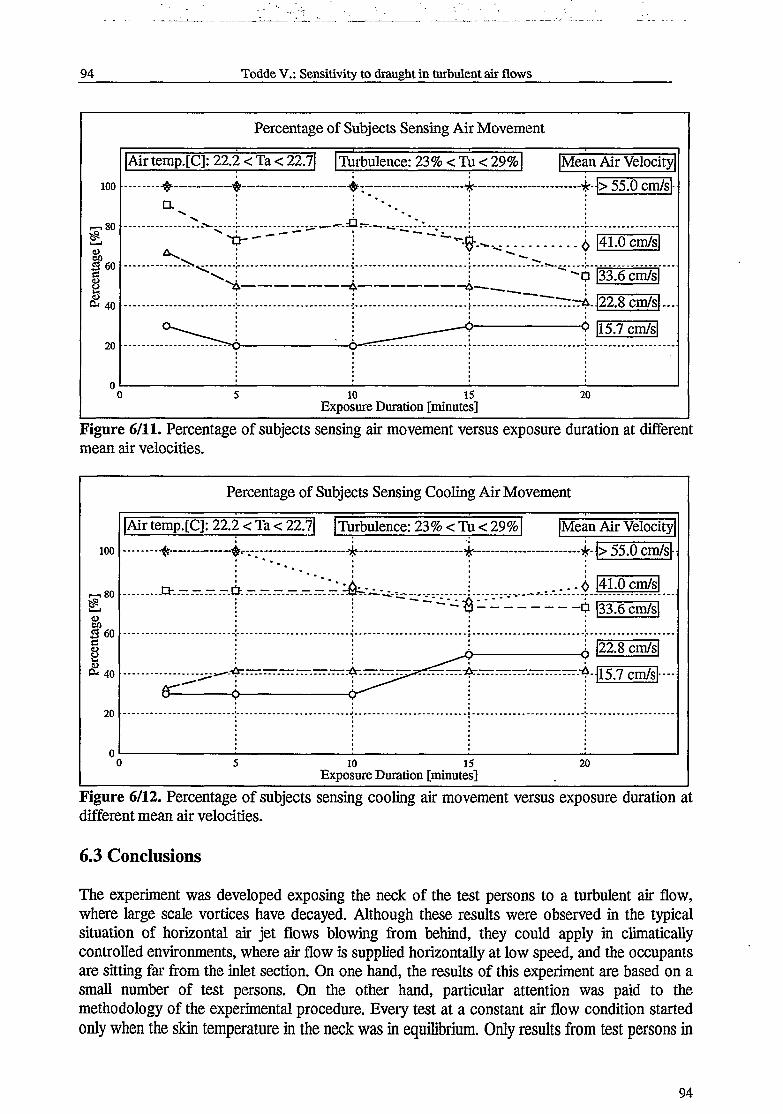
94 Todde V.: Sensitivity to draught in turbulent air flows
Percentage of Subjects Sensing Air Movement
100
,80
8>5 60
I& 40
20
Air temp.[C]: 22.2 < Ta < 22.7| Turbulence: 23% < Tu < 29% Mean Air Velocity
>55.0cm/s|-TQT ------- X
CLX.
■x
x — 't
................................ ^
r. " 7* ....................................*! :
...............=..............................................L"■t
......................»
.............................................:................... ............U
41.0 cm/s..................................
L---------------------------------«: ""O
* : ...........................................:..................................,7~—A.
33.6 cm/s
22.8 cm/s ....
__________ —9--------------------------------o 15.7 cm/s
10 15Exposure Duration [minutes]
20
Figure 6/11. Percentage of subjects sensing air movement versus exposure duration at different mean air velocities.
Percentage of Subjects Sensing Cooling Air Movement
|Air temp,[C]: 22.2 < Ta < 22/71 [Mean Air VelocityTurbulence: 23% < Tu < 29%
41.0 cm/s
33.6 cm/s
22.8 cm/s
15.7 cm/s
10 15Exposure Duration [minutes]
Figure 6/12. Percentage of subjects sensing cooling air movement versus exposure duration at different mean air velocities.
6.3 Conclusions
The experiment was developed exposing the neck of the test persons to a turbulent air flow, where large scale vortices have decayed. Although these results were observed in the typical situation of horizontal air jet flows blowing from behind, they could apply in climatically controlled environments, where air flow is supplied horizontally at low speed, and the occupants are sitting far from the inlet section. On one hand, the results of this experiment are based on a small number of test persons. On the other hand, particular attention was paid to the methodology of the experimental procedure. Every test at a constant air flow condition started only when the skin temperature in the neck was in equilibrium. Only results from test persons in
94

Chapter 6: Discomfort due to horizontal air movements at the neck 95
perfect thermal neutrality during all the experiment were considered. All the test persons were sitting with the same posture and performed light activity (reading) at the same level Efforts were concentrated on the set-up and calibration of air velocity measurement system to achieve high resolution and accuracy of the signal in the velocity range between 0.03 to 1.5 m/s. The following conclusions were drawn.
• At air velocities lower than around 0.22-0.24 m/s, the percentage of dissatisfied subjects, PD, was observed to remain at low values of around 20% during the whole exposure period.
• Between air velocities of around 0.23 and 0.55 m/s, the PD increased considerably with mean air velocity up to values close to 100%. In this air velocity range, the exposure duration had an effect on the PD. The shorter the exposure, the faster the increase in PD with mean air velocity. In the velocity range between 0.33 and 0.41 m/s the PD was observed to decrease continuously with the exposure duration from values of 65-90% till 45-60% at the end of the exposure period.
• At air velocities higher than 0.55 m/s, the PD was observed to remains close to the value of 100% for the whole exposure period
• The percentage of dissatisfied subjects (PD), the percentage sensing air movement (PS) and the percentage sensing the coolness of air movement (PC), increased with increasing air velocity. Only at the lowest range of air velocity investigated (around 0.16 m/s), the coolness of air movement was felt by a higher percentage of test persons than the strength was.
• The mean PD over the whole exposure period was observed to be 20% lower than the mean PC, up to air velocities of 0.40 m/s.
• From mean air velocities of 0.33 m/s, the coolness and strength of air movement were felt by the same percentage of test persons.
• The majority of the subjects feeling uncomfortable air movements, were only prepared to expend a small effort, by means of remote control, to improve their environment, otherwise they would endure the annoyance of the air movement. At the beginning of the exposure, this percentage was observed with a peak of around 75% at mean air velocity close to 0.4 m/s. Afterwards, as exposure continued, the percentage of this reaction decreased to values of around 45% over a range of mean air velocity between 0.30 m/s and 0.70 m/s.
6.4 References
[1] Houghten F.C., Gutberlet C., Witkowski E. (1938). Draught temperatures and velocities in relation to skin temperature and feeling of warmth. ASHVE Transactions. Vol.30, pp. 193-212.
[2] Fanger P.O., Melikov A.K., Hanzawa H., Ring J. (1988). Air turbulence and sensation of draught. Energy and Buildings, Lausanne, Switzerland: Elsevier Sequoia S.A.Vol 12.pp.21-39
[3] Mayer E., Schwab R. (1988). Direction of low turbulent airflow and thermal comfort. Proc. Healthy Buildings ‘88, vol. 2, pp. 577-582. Stochkolm, Sweden.


Chapter 7: Summarise 97
7 Summarise
In ventilated spaces, large scale vortices develops from the shear layer between the supplied and the standstill air, by coalescence of the vorticity shed at the inlet of the air supply. Large scale vortices loose their identity because of the development of cascading eddies and transition to turbulence. Non uniform temperature distribution in the walls, radiators, electronic devices, movements of the occupants, are other typical sources of shear layers enhancing vorticity. Also the noise level in the room significantly contributes to the formation of vortical structure, large eddies, and affects their decay. The interaction of all these vortical structures will rise a complicate three dimensional air movement affected by fluctuations whose frequencies could vary from fractions of Hz to several KHz in developed turbulent flows.
The perception and sensitivity to the cooling effect enhanced by air movements depends on a wide number of factors inter connected with each other: Physical properties of the air flow, part and extension of the exposed surface ( bared and/or clothed), posture, exposure duration, thermal condition of the person, gender and probably also the age.
For normally clothed subjects, most of the experimental research indicates the head as the most sensitive region to air movements. An air flow blowing from behind towards the neck are perceived as most uncomfortable. The head region is a bared surface protected from the cooler environmental air by the thermal plume rising from the trunk. The structure of this plume also depends on the posture of the person. The interactions between an air flow with the thermal plume are strictly related to the air flow properties: direction, mean air velocity intensity, large scale fluctuations and turbulence.
A draught chart has already been elaborated to predict the percentage of subjects dissatisfied to the air movement. The perceived discomfort due to draught has been concerned with air temperature mean air velocity and its turbulence intensity. The interpretation of the effects of a macro and microscale turbulence on draught discomfort is not yet well understood and it presents a challenge from the experimental point of view, for simultaneous determination of the effects of both intensity and scale of the turbulence.
Experimental evidence of earlier research has shown that periodically fluctuating air flows at low frequency are felt with more unpleasantness than constant air flows. The sensation of air flow temperature and the perception of strength of air movement at the skin surface, have been observed to decrease with duration exposure. At the same time it has not found any change in pleasantness feelings: pleasantness (or unpleasantness), have been observed independent of thermal and strength sensation as the exposure to draught continued. It has not found any relevant impact of the day time on the percentage of draught dissatisfaction. No significant differences have been observed the human response to air movements between women and men. Air flow direction has a clear effect on perceived discomfort due to draught. This effect is also related to the temperature of the air flow.
In a first experiment of the current work, it was observed how people perceive air movement in their hand, and how the relative turbulence intensity (R.T.I.), of air velocity influenced this perception. One of the purposes of the experiment was also to find out the ranges of air

98 Todde V.: Sensitivity to draught in turbulent air flows
velocity, in terms of mean value and (R.T.I.), at which normally clothed people could perceive the presence of air movement on their bared skin surfaces. It was observed that the higher the turbulence intensity, the lower the mean air velocity value at which the majority of the subjects could detect an air movement. The percentage of initial draught sensitivity (P.I.D.S.), depended also on the part of the skin: the inner hand side was observed to be more sensitive than the outer. Also the temperature of the skin played an important role on P.I.D.S.. A lower skin temperature induced a higher capability to detect the presence of an air movement.
A second experimental investigation was designed to find how people perceive and feel horizontal air movements flowing from behind their neck. In this experiment, the sensitivity to draught was observed to be depending on the exposure duration. At the beginning of the exposure, no differences in sensitivity to the air movements were revealed between females and males. As the exposure continued, the sensitivity to air velocity intensity decreased rapidly. Female test persons decreased the sensitivity to air velocity intensity, mostly in the first ten minutes. In the first five minutes of exposure, the thermal sensitivity of females was observed to increase. Male test persons revealed a large decrease of sensitivity to air velocity intensity during all the exposure duration. The thermal sensitivity to air temperature was nearly constant during all the exposure period. A vote of unpleasantness was always associated with a vote of coolness, for both females and males. With the exception of the initial period of exposure (first 2 minutes), all the results showed the female test persons more sensitive than males. At the beginning of the exposure, females and males had the same drop in skin temperature. As the exposure continued, females revealed a greater drop in skin temperature than men. It was also observed an increase of sensitivity to air movements with increased R.T.I.
At air velocities lower than around 0.22-0.24 m/s, the percentage of dissatisfied subjects, PD, to the air movements was observed to remain at low values of around 20% during the whole exposure period. Between air velocities of around 0.23 m/s and 0.55 m/s, the PD increased considerably with mean air velocity up to values close to 100%. In the velocity range between 0.33 m/s and 0.41 m/s the PD was observed to decrease continuously with the exposure duration from values of 65-90% till 45-60% at the end of the exposure period.
The majority of the subjects feeling uncomfortable due to the air movement, were only prepared to expend a small effort, by means of remote control, to improve their thermal condition, otherwise they would endure the annoyance of the air movement. At the beginning of the exposure, this percentage was observed with a peak of around 75% at mean air velocity close to 0.4 m/s. Afterwards, as exposure continued, the percentage of this reaction decreased to values of around 45% over a range of mean air velocity between 0.30 m/s and 0.70 m/s.
More accurate information on the human response to air movements could be obtained from experiments developed with a large sample of test persons, suitable for an accurate statistical analysis. It would be of practical value to develop the experiments at different local surfaces of the human body and with air flows with different directions, air temperature, and level of turbulence intensity. Great attention should also be paid to the air velocity measurement system and to the experimental methodology.
98