kkh56 inqse ch11 p541 588 final.indd · page 541 · 1/1/07...
TRANSCRIPT

541
KH56_INQSE_CH11_p541_588_final.indd · Page 541 · 1/1/07 · 2:25:03 PMKH56_INQSE_CH11_p541_588_final.indd · Page 541 · 1/1/07 · 2:25:03 PM

542
Carbon. It is a diverse element, and it is vital for life. In your body, for example, carbon makes up about 50 percent of your tissues and about
28 percent of your bones. That is a lot. Carbon also makes up roughly half of the various tissues in plants. And you’ve probably learned about photosynthesis. Remember, this is the process that transfers carbon from the atmosphere to plants or other photosynthesizing organisms. Carbon links to life in many ways.
But carbon’s reach does not stop with life. Carbon is also found in nonliving (abiotic) objects such as minerals, like diamond. Carbon is also a part of many types of rocks, such as limestone or rocks with fossil fuels (petroleum, coal, and natural gas). Yet even before arriving on Earth and becoming part of an organism, such as you, carbon is manufactured in stars in our Milky Way Galaxy. In other parts of the galaxy, carbon is found as hydrocarbons in massive molecular clouds. Carbon is part of many kinds of systems at many scales.
Goals for the Chapter How might you characterize carbon to a friend who was not in your science class? How is carbon part of your clothes, foods, or medicines? How many forms of carbon are there? How does carbon relate to the energy that society needs? Chapter 11, Carbon on the Move, will help you answer questions like those. By the end of this chapter, you will learn the following:
• Earth has a fixed amount of carbon.
• Some substances with carbon can be analyzed with simple tests.
• Carbon moves among several main reservoirs on Earth.
• Carbon transport involves reactions that change the properties of the carbon substances.
• Simple reactions simulate the carbon cycle.
• Some carbon sinks in the geologic past are now valuable sources of fossil fuels.
Carbon on the Move
KH56_INQSE_CH11_p541_588_final.indd · Page 542 · 1/1/07 · 2:25:50 PMKH56_INQSE_CH11_p541_588_final.indd · Page 542 · 1/1/07 · 2:25:50 PM

543Chapter 11 Carbon on the Move
In the last chapter, you learned that the water cycle describes water (H2O) in systems of various sizes and forms. For example, words such as “evaporation” and “transpiration” describe how water moves between plants and air. You saw that moving the water or changing its form involved changes in energy.
But what are some of the ways that carbon moves around Earth? You will investigate the ways in this chapter. To understand this, you will simulate in your classroom a number of simple chemical reactions that involve carbon. A simulation is a small-scale model or test of a much larger process. Your simulations will help you transfer what you learn about carbon to larger systems on Earth—much larger, global systems. As you can see in the opening photos to the chapter, these systems include the ocean and the atmosphere.
In this chapter, you will complete the following activities:
Characterizing Carbon
Carbon Changing Costumes
The Carbonated Geosphere
Fossil Carbon
The Flux Is the Crux
Carbon Quest
Chapter organizers help you see what you have learned and where you are headed. They help you organize your understanding of the physical world. As you have been learning in this program, when you are organized, it is easier to learn.
Look at the chapter organizer every day. Think about where you are in its flow. Compare what you know now with what you knew a week ago. Think about what you will learn today. Let the chapter organizer help you map your learning and monitor your progress. That way, you can look back and see what you have accomplished.
KH56_INQSE_CH11_p541_588_final.indd · Page 543 · 1/1/07 · 2:25:51 PMKH56_INQSE_CH11_p541_588_final.indd · Page 543 · 1/1/07 · 2:25:51 PM

544
Carbon on the Move
ENGAGE
Characterizing Carbon
Key Idea:Indicator solutions let you monitor carbon movement in simple systems.
EXPLORE
Carbon Changing Costumes
Key Idea:Simple reactions with carbon-bearing substances at 8 stations represent carbon transport between different settings on Earth.
EXPLAIN
The Carbonated Geosphere
Key Idea:Carbon is a key part of terrestrial (land), atmospheric, and oceanic settings. Carbon is stored in these settings as organic and inorganic carbon.
��
Linking Question
Are humans part of the carbon cycle?
Linking Question
What kinds of reactions move carbon around Earth?
���
���
Linking Question
Where do reactions with carbon occur on Earth?
��
�
KH56_INQSE_CH11_p541_588_final.indd · Page 544 · 1/1/07 · 2:25:52 PMKH56_INQSE_CH11_p541_588_final.indd · Page 544 · 1/1/07 · 2:25:52 PM

545
Linking Question
How much do you understand about
carbon cycles?
CHAPTER
11 Major Concepts
� Some substances with carbon can be analyzed with simple tests.
� Earth has a fi xed amount of carbon; that carbon moves among several main reservoirs.
� Carbon transfer involves chemical reactions with changes in atomic structures of carbon, and in properties of the carbon-bearing material.
� Simple reactions simulate carbon cycling in the natural world.
� Some carbon sinks in the geologic past are now valuable sources of fossil fuels and energy for society.
Linking Question
How fast does a carbon atom move around Earth?
ELABORATE
The Flux Is the Crux
Key Idea:Carbon cycles at different rates among carbon reservoirs. The carbon flux and reservoir size tells how long an average carbon atom resides in a reservoir.
��
�
���
EVALUATE
Carbon Quest
Key Idea:You can answer questions, and revise your answers, about your understanding of the carbon cycle. You learn things better by critically evaluating your own work.
���
EXPLORE
Fossil CarbonPart I: Carboniferous Combustion
Key Idea:Energy production and fossil fuel combustion make carbon dioxide. Geologic data shows the pattern of humans adding CO2 to the atmosphere.
Fossil CarbonPart II: Showing the Carbon Cycle
Key Idea:A series of reactions with carbon can be linked to represent key parts of the carbon cycle.
��
�
KH56_INQSE_CH11_p541_588_final.indd · Page 545 · 1/1/07 · 2:25:59 PMKH56_INQSE_CH11_p541_588_final.indd · Page 545 · 1/1/07 · 2:25:59 PM

546 Unit 3 Moving Matter
Characterizing Carbon What color is carbon? You might say that carbon is black like charcoal, coal, or graphite, or clear and sparkly like a diamond. But what about other objects with carbon, such as leaves, gasoline, seashells, plastics, white marble sculptures, or you? What about gases in the atmosphere that contain carbon? How would you characterize carbon in these objects?
After a few minutes, you may realize that this is not a simple question. A description might even be tricky for a system where carbon changes from one substance to another. For example, what about a burning log in a fireplace—where does carbon in the wood go? The more you think about it, the more complex the answer seems.
A good way to start learning about carbon is to consider carbon in small parts. Leave carbon complexity aside for the moment and try to think about carbon in simple ways. In fact, that is a good way to break down and simplify any system. In Characterizing Carbon, you will work with a team to explore two interesting processes with carbon. Keep in mind how these investigations might relate to carbon moving around Earth. Color gives a clue here, but the colors you see are not the color of carbon.
Investigation 1
MaterialsFor each team of 3 students
2 plastic bottles or jars with tightly sealing caps
universal indicator solution
seltzer water
1 ruler
1 sheet of plain white paper
Process and Procedure In this activity, you will do two investigations with carbon and a water system in a team of three students. Listen carefully to your teacher for instructions about materials for the two investigations. For each investigation, keep this focus question in mind: “In what form is the carbon?”
1. Put 1 sample of seltzer water about 2–3 centimeters (cm) deep in each of 2 plastic containers. Quickly add 6 drops of universal indicator to each and close the containers immediately.
KH56_INQSE_CH11_p541_588_final.indd · Page 546 · 1/1/07 · 2:26:07 PMKH56_INQSE_CH11_p541_588_final.indd · Page 546 · 1/1/07 · 2:26:07 PM

Chapter 11 Carbon on the Move 547
Keep both containers closed very tightly to preserve as much fizz as possible.
2. Complete Steps 2a–c and record your observations in your science notebook.
a. Select 1 of the water containers as the control. After the universal indicator is added, do not open the control. Place this container on the sheet of white paper and do not move it.
b. Shake the other container vigorously for 15 seconds (sec). Open the seal on the lid briefly to release the fizz. Close the container.
You can also tilt the container for about 5 sec so that the water comes near the opening. But do not pour out any water!
c. Repeat Step 2b about 10 times until no more fizz is escaping. 3. During each step, compare the color of the shaken sample with
your control. Record in your science notebook all the changes occurring between your sample and the control.
4. Describe in your science notebook the relationship between the amount of fizz and the color.
5. Copy figure 11.1 into your science notebook. Make a qualitative graph showing the amount of fizz relative to the color that you observe.
6. Record in your science notebook your team’s ideas about the following questions.
a. What do you know about seltzer water? b. What was happening as you released the fizz? c. What process on Earth might this investigation model? d. How do you think this investigation involved carbon?
� Figure 11.1 Experiment to shake seltzer water. Use these axes to plot the amount of fizz versus the color of shaken seltzer water. Copy this diagram into your science notebook and label the axes according to your observations.
KH56_INQSE_CH11_p541_588_final.indd · Page 547 · 1/1/07 · 2:26:11 PMKH56_INQSE_CH11_p541_588_final.indd · Page 547 · 1/1/07 · 2:26:11 PM

548 Unit 3 Moving Matter
Investigation 2
MaterialsFor each team of 3 students
3 pairs of safety goggles
1 pair of gloves or cloth
2 beakers (at least 350 mL) or tall glass jars
water solution with bromthymol blue (BTB)
1 10�10 cm square of aluminum foil
1 sheet of white paper
1 ruler
1 small piece of tape
1–2 pieces of dry ice (about 2 cm per side)
Process and Procedure 1. Get 2 glass containers. Add the mixture of water and
bromthymol blue (BTB) indicator to a depth of 1.5 cm in each container.
2. Place 1 of the containers on a sheet of white paper at least 10 cm from the experiment beaker. Use this container as the control.
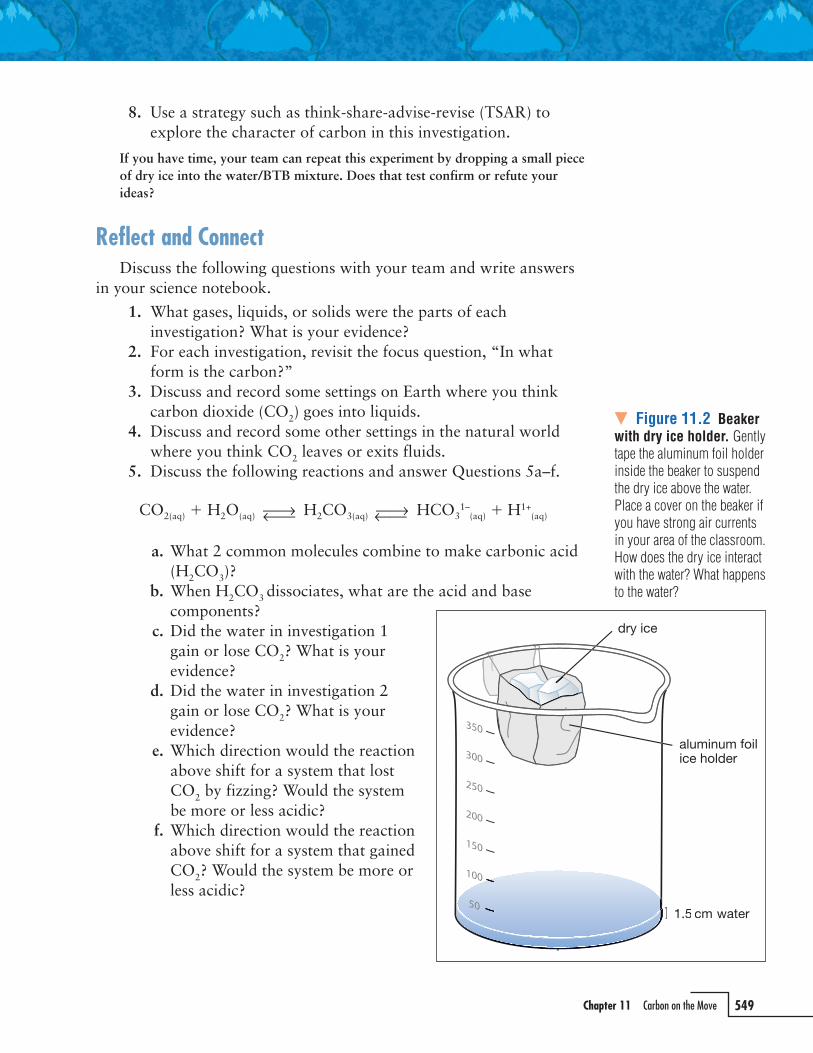
3. Squeeze aluminum foil around your thumb to make a holder for 1–2 pieces of dry ice. Use a small piece of tape to attach the foil holder above the water inside one of the jars (figure 11.2).
4. Obtain from your teacher a small piece of dry ice (roughly 2 cm per side). What do you think the dry ice is?
5. Quickly place the dry ice in the foil holder in the open container. Make observations for the next 3–4 minutes (min).
a. What happens to the dry ice? b. What happens to the water? c. What happens to the control?
You can place a cover on your container if you have air currents in your classroom.
6. Discuss with your team the sequence of events or changes that must occur for the dry ice to interact with the water. Record this sequence of events as boxes connected by arrows in your science notebook.
7. Discuss with your team where the dry ice goes and how you think it interacts with the water.
Wear safety goggles.
Only handle dry ice with a cloth or gloves.
KH56_INQSE_CH11_p541_588_final.indd · Page 548 · 1/1/07 · 2:26:16 PMKH56_INQSE_CH11_p541_588_final.indd · Page 548 · 1/1/07 · 2:26:16 PM
Chapter 11 Carbon on the Move 549
8. Use a strategy such as think-share-advise-revise (TSAR) to explore the character of carbon in this investigation.
If you have time, your team can repeat this experiment by dropping a small piece of dry ice into the water/BTB mixture. Does that test confirm or refute your ideas?
Reflect and Connect Discuss the following questions with your team and write answers in your science notebook.
1. What gases, liquids, or solids were the parts of each investigation? What is your evidence?
2. For each investigation, revisit the focus question, “In what form is the carbon?”
3. Discuss and record some settings on Earth where you think carbon dioxide (CO2) goes into liquids.
4. Discuss and record some other settings in the natural world where you think CO2 leaves or exits fluids.
5. Discuss the following reactions and answer Questions 5a–f.
a. What 2 common molecules combine to make carbonic acid (H2CO3)?
b. When H2CO3 dissociates, what are the acid and base components?
c. Did the water in investigation 1 gain or lose CO2? What is your evidence?
d. Did the water in investigation 2 gain or lose CO2? What is your evidence?
e. Which direction would the reaction above shift for a system that lost CO2 by fizzing? Would the system be more or less acidic?
f. Which direction would the reaction above shift for a system that gained CO2? Would the system be more or less acidic?
� Figure 11.2 Beaker with dry ice holder. Gently tape the aluminum foil holder inside the beaker to suspend the dry ice above the water. Place a cover on the beaker if you have strong air currents in your area of the classroom. How does the dry ice interact with the water? What happens to the water?
KH56_INQSE_CH11_p541_588_final.indd · Page 549 · 1/1/07 · 2:26:21 PMKH56_INQSE_CH11_p541_588_final.indd · Page 549 · 1/1/07 · 2:26:21 PM

550 Unit 3 Moving Matter
Carbon Changing Costumes In the engage activity, Characterizing Carbon, you experienced carbon on the move. You saw a form of carbon move into and out of water. The color changes in the solution indicated that a chemical reaction was taking place.
On a bigger scale, carbon can participate in many chemical reactions as it moves through natural systems. Photosynthesis is an
example of this that you have already studied in Level 1 of this program. Here the carbon changes from a simple molecule to a complex one. During photosynthesis, carbon in CO2 is converted to organic compounds. Examples of these compounds are starch and cellulose.
In Carbon Changing Costumes, you will explore eight simple reactions with carbon. These reactions simulate a series of real carbon pathways. As you carry out the reactions, think about how they relate to the world around you. Also think with your team about how some of the reactions might relate or link together. This helps you understand the pathways of carbon movement around Earth.
MaterialsFor each team of 3 studentsSee figure 11.3 for materials for the stations.
! Cautions
Wear safety goggles for investigations with chemical reactions and open flames.
Station Materials per team of 3
2
2 500-mL beakers or jars1 stirring spoon or rod1 funnel1-cup measuring cup1 fi lter paper or coffee fi ltersoil, or bag of potting soil or rotting vegetationtap water
3
2 test tubes2 antacid tablets with calcium carbonate (CaCO3)2 test tubesvinegar (5% acetic acid, CH3COOH)tap water1 calculator
4
3 pairs of safety goggles2 test tubes1 test-tube holderBunsen burner or other heat source1 scale or weighing stationsodium bicarbonate (NaHCO3)1 dropper bottle of universal indicator solutiontap water1 3�3 cm aluminum foil squarematches or fl ame source
5
2 beakers, at least 300 mL2 spoons for stirringsodium bicarbonate (NaHCO3)calcium chloride (CaCl2)1 dropper bottle of universal indicator solutiontap water
8
1 test tube or small beaker1 dropper bottle of distilled water with BTB indicatortap water1–2 straws
� Figure 11.3 Table of materials. Refer to this table for a summary of materials needed at each station by each team.
Note: Materials for stations 1, 6, and 7 are at those stations.
KH56_INQSE_CH11_p541_588_final.indd · Page 550 · 1/1/07 · 2:26:27 PMKH56_INQSE_CH11_p541_588_final.indd · Page 550 · 1/1/07 · 2:26:27 PM

Chapter 11 Carbon on the Move 551
Process and Procedure In the next two class periods, you will explore reactions with carbon at eight stations. At each station, record your answers in your science notebook. Pay particular attention to the chemical reaction that moves carbon from reactants to products. The class will complete station 8 together.
1. Copy the large diagram in figure 11.4 onto a full page in your science notebook. Title it “Carbon Environs.” At the end of the activity, your diagram should show the locations of all stations. Feel free to be creative. Add color, shading, or other enhancements to improve your diagram. At each station, you will• identify with your team in which natural environment you
think the reaction occurs and• write the station number on the diagram in the appropriate
environment. 2. Listen to your teacher for suggestions or instructions about
the stations. Complete all the stations, but not necessarily in numeric order.
Station 1
What does it mean for a gas to dissolve, or be “soluble,” in a liquid? How does this relate to gas escaping or leaving a liquid? You will think about these questions in this investigation.
1. Look at the 4 bottles of seltzer water labeled from 1 to 4. Sketch the setup in your science notebook and add the appropriate labels.
2. What variable could be different between the bottles?
� Figure 11.4 Carbon environs. This diagram shows natural settings for carbon reactions on land and in the ocean and the atmosphere. Where on the diagram do you think carbon reactions for the eight stations occur? Copy this diagram onto a full page in your science notebook. You will add the number of each station to show where you expect its reaction to occur.
KH56_INQSE_CH11_p541_588_final.indd · Page 551 · 1/1/07 · 2:26:32 PMKH56_INQSE_CH11_p541_588_final.indd · Page 551 · 1/1/07 · 2:26:32 PM

552 Unit 3 Moving Matter
3. Copy the table in figure 11.5 into your science notebook. Record your observations for the experiment in this data table.
4. On the count of 3, your teacher will quickly open all 4 bottles. What do you observe? Discuss as a class whether the bottles behave similarly or differently.
5. You have been learning that gases like CO2 either escape from fluids or dissolve into fluids. Use figure 11.5 to record your ideas and observations for Questions 5a–c.
a. Discuss as a class which of the bottles lost CO2 the fastest. b. You have learned that the solubility of a substance indicates
how much will dissolve in a liquid. If CO2 has a high solubility in a liquid, does the CO2 tend to leave the liquid or remain in the liquid?
c. Write a chemical equation showing the escape of CO2 gas from water. Write another equation showing that CO2 dissolves in water.
d. If CO2 escapes quickly from a liquid, does this mean that CO2 has a low solubility or a high solubility in that liquid?
e. In which of the bottles (1–4) is CO2 solubility the highest? That is, which bottle has the least fizzing?
6. Discuss as a class what variable differs between the bottles. Write how CO2 solubility relates to that variable.
7. Draw in your science notebook axes for a simple graph showing how CO2 solubility (on the y-axis) changes with the variable in Step 6 (on the x-axis).
a. Use your observations to draw a line on that graph. b. Does the line in the plot show a direct or an indirect
relationship? 8. Write the following sentence in your science notebook and fill
in the blanks:
“This experiment shows that carbon in CO2 moves more rapidly to the atmosphere from water than from
water. This means that carbon dioxide is more soluble in water than in water.”
Bottle number
Observations when opened
Rate of CO2 escape (fast/slow)
CO2 solubility (high/low)
1
2
3
4
� Figure 11.5 CO2 solubility table. Make a data table like this in your science notebook to record observations of the 4 bottles of seltzer.
KH56_INQSE_CH11_p541_588_final.indd · Page 552 · 1/1/07 · 2:26:37 PMKH56_INQSE_CH11_p541_588_final.indd · Page 552 · 1/1/07 · 2:26:37 PM

Chapter 11 Carbon on the Move 553
9. Add the station number to your carbon environs diagram in your science notebook.
Station 2
What happens as rainwater percolates through organic soils? Do this investigation to explore how natural waters interact with soil.
1. Add 2 cups (c) of water to a beaker. 2. Add ½ c of soil or rotten vegetation to the beaker. Stir
thoroughly with a stirring rod or spoon for 1–2 min. Write about the mixture and draw a diagram of it in your science notebook.
3. Prepare a filter assembly with a clean beaker beneath it. Transfer the mixture into the funnel and collect the fluid that drains.
4. What does the filtered solution look like? Explain. 5. Write your ideas for what forms you think carbon takes in
the soil. What forms do you think carbon takes in the filtered solution?
6. Write the following sentence in your science notebook and fill in the blanks:
“Compared with processes in nature, this experiment represents movement of carbon from to
.” 7. Add the station number to your carbon environs diagram in
your science notebook.
Station 3
Here is a different type of investigation with carbon. Some antacid tablets are mostly calcium carbonate (CaCO3), and thus contain carbon.
1. Imagine that the antacid tablets represent a carbonate rock. For the 0.5 grams (g) of CaCO3 in a tablet, what percentage of it is carbon?
Use the gram atomic weights for the 3 elements in CaCO3 to estimate. Sum the weights and determine the proportion of carbon.
2. Obtain 2 test tubes. Place 3 inches (in) of acetic acid (CH3COOH) in one test tube, and 3 in of water in another test tube.
3. Add 1 antacid tablet to each test tube. What happens in each tube?
4. Balance the following reaction with your team. Check that it is charge and mass balanced.
KH56_INQSE_CH11_p541_588_final.indd · Page 553 · 1/1/07 · 2:26:42 PMKH56_INQSE_CH11_p541_588_final.indd · Page 553 · 1/1/07 · 2:26:42 PM

554 Unit 3 Moving Matter
5. Did you see evidence for the reaction product in the far right side of the equation in Step 4? What was the evidence?
6. In nature, a better model of rock weathering is the reaction between calcium carbonate and carbonic acid, H2CO3. Weak carbonic acid forms in rainwater as CO2 dissolves in raindrops.
a. Write the reaction to make carbonic acid (H2CO3) from rainwater and CO2.
b. Complete the following reaction in your science notebook. Be sure to check with your team for charge and mass balance.
c. In the reaction in Step 6b, does the chemical reaction remove CO2 from the atmosphere or add CO2 to the atmosphere? Agree on an answer with your team and write your evidence in your science notebook.
d. How does the reaction in Step 4 with acetic acid compare with the reaction between carbonic acid and CaCO3? In particular, did the reaction of calcium carbonate with acetic acid consume or produce CO2?
7. Write the following sentence in your science notebook and fill in the blanks:
“Compared with processes in nature, this experiment represents movement of carbon from the to
.”
8. Add the station number to your carbon environs diagram in your science notebook.
Station 4
Limestone is a rock that contains a lot of carbon. The carbon is in calcium carbonate, CaCO3 (figure 11.6). Often, rocks like limestone get pushed deep into the earth, where it is very hot. What do you think happens to the rock? You can simulate a heated carbonate rock with a similar material, sodium bicarbonate, NaHCO3. This is just baking soda.
1. What do you think will happen if you heat sodium bicarbonate (NaHCO3)? Complete the following chemical reaction. Use the reaction to write a prediction in your science notebook. The reaction shows 1 reaction product.
Listen to your teacher for instructions about who
will be using an open
flame for this station.
KH56_INQSE_CH11_p541_588_final.indd · Page 554 · 1/1/07 · 2:26:47 PMKH56_INQSE_CH11_p541_588_final.indd · Page 554 · 1/1/07 · 2:26:47 PM

Chapter 11 Carbon on the Move 555
It is OK to be wrong about a prediction. Scientists use predictions to see how well they understand systems. The key is thinking carefully about why you didn’t get the correct answer. This will help you make a better prediction the next time.
2. Complete Steps 2a–f to heat and weigh sodium bicarbonate (NaHCO3).
a. Measure the mass of a small test tube. b. Weigh 1.5–2 g NaHCO3 onto foil or weighing paper.
Carefully transfer the powder to the bottom of the test tube. c. Heat the test tube for about 3 min. Obtain a dull red glow
for the glass and powder. Record all changes that you observe for the NaHCO3.
d. After heating, gently cover the test tube with a small piece of foil. This keeps the sample from absorbing water vapor.
e. Let the test tube cool for at least 1 min. If needed, cool the test tube further by immersing it in several inches of water.
Do not get water inside the test tube or around the foil on the top of the test tube.
f. When the test tube is at room temperature, completely dry the exterior, remove the foil cover, and weigh the test tube plus the powdery substance.
3. Summarize the masses of the reactants and the products. a. Write the masses of sodium bicarbonate and product 1
(NaOH):
mass of reactant NaHCO3 �
mass of product 1 NaOH � b. How would you determine the mass of product 2? Explain
this in your science notebook and write the mass in the form shown.
mass of product 2 � c. What percentage of the initial reactant mass is product 2? 4. Chemical reactions are important predictive tools. For example,
the completed reaction for Step 1 shows that 48 percent by mass of reaction products should be NaOH(s). Use this data about the reaction to answer Questions 4a–d.
a. For your initial mass of NaHCO3, predict the mass of NaOH from your experiment.
b. Explain how similar or different your answers are for measured and predicted masses in Steps 3 and 4. If your answers are different, list sources of error that you think might account for this.
c. What percentage of the initial mass of reactant do you infer for product 2? Show in your science notebook 2 different ways to calculate this.
KH56_INQSE_CH11_p541_588_final.indd · Page 555 · 1/1/07 · 2:26:52 PMKH56_INQSE_CH11_p541_588_final.indd · Page 555 · 1/1/07 · 2:26:52 PM

556 Unit 3 Moving Matter
(NaHCO3) analogy. Complete the following reaction and use it to predict what happens when the CaCO3 in limestone is heated in the earth.
7. Write the following sentence into your science notebook and fill in the blanks:
“Compared with processes in nature, this experiment represents movement of carbon from to the
.”
8. Add the station number to your carbon environs diagram in your science notebook.
Station 5
What do you think the seafloor looks like at a depth of 1–2 kilometers (km)? Yes, it is dark with many unfamiliar forms of life. Complete this investigation to simulate carbon changing forms in the ocean.
1. Think of different ways for carbon to move from the shallow ocean to greater depths. Explain these ideas as best you can in your science notebook.
2. Obtain 2 glass beakers, at least 300 mL in volume. In the first, add 150 mL of water. Add a spoonful of baking soda (NaHCO3) and stir until the solution is clear.
3. In the other beaker, add 150 mL of water. Add 1 large spoonful of calcium chloride (CaCl2) and stir until the solution is completely clear.
d. What is product 2? Explain your evidence in your science notebook.
5. Show that the reaction product NaOH differs from reactant NaHCO3.
a. Dissolve the remaining NaOH in the test tube with 20–30 milliliters (mL) of water.
b. Dissolve a similar amount of NaHCO3 in 20–30 mL of water in a test tube.
c. Add 5 drops of universal indicator to each.
d. Which test tube has a stronger base? Does this correlate with NaOH or with NaHCO3? Explain your evidence.
6. Return to the limestone (CaCO3) analogy, rather than the sodium bicarbonate � Figure 11.6
Fossiliferous limestone. This limestone has fossils of shells. The shells consist of calcium carbonate, CaCO3. How much carbon is this?
KH56_INQSE_CH11_p541_588_final.indd · Page 556 · 1/1/07 · 2:26:57 PMKH56_INQSE_CH11_p541_588_final.indd · Page 556 · 1/1/07 · 2:26:57 PM

Chapter 11 Carbon on the Move 557
Have different team members prepare the 2 solutions. If you cannot entirely dissolve either of the powders, add another 50 mL of water and stir.
4. Dissolving NaHCO3 and CaCl2 in water are 2 disassociation reactions. Complete the following reactions and write them in your science notebook.
5. What do you think will happen if you mix these 2 solutions? Make a prediction with a chemical reaction by completing Steps 5a–c.
a. Take the reaction products in Step 4 and rearrange them as reactants. You will mix the 2 solutions in Step 7.
b. Predict the reaction products from mixing the solutions. Write this prediction in your science notebook.
Note that sodium (Na1+) and chlorine (Cl1–) are very soluble and remain dissolved in a solution.
c. Show your prediction to your teacher before you begin Step 6. 6. Add 8 drops of universal indicator solution to each beaker.
Record the color. 7. Pour the contents of the beakers together. Describe carefully
what you see. a. What color is the mixture? What does that tell you about the
pH of the mixture? b. How many reaction products form in the mixture? Describe
these very carefully. What happens to the mixture after 20–30 sec?
c. Make a sketch of the beaker with the mixture; add appropriate labels that show your main observations.
This is a good place to use the labeling strategies “What I see” and “What it means.”
8. Evaluate your prediction strategy from Step 5. Consider what you saw and the reactants in this experiment. What is your evidence for the solid? Write a complete chemical reaction.
9. Write the following sentence in your science notebook and fill in the blanks:
“Compared with processes in nature, this experiment represents movement of carbon from to the
.” 10. Add the station number to your carbon environs diagram in
your science notebook.
KH56_INQSE_CH11_p541_588_final.indd · Page 557 · 1/1/07 · 2:27:02 PMKH56_INQSE_CH11_p541_588_final.indd · Page 557 · 1/1/07 · 2:27:02 PM

558 Unit 3 Moving Matter
Station 6
You’ve studied photosynthesis in this program in several contexts. You know that plants use this process to make the food and tissues that they need. Review the chemical reaction for photosynthesis at this station.
1. Observe and sketch the plant at this station. The plant is growing and needs carbon to grow leaves, branches, roots, and a thicker trunk. Draw a sketch of the plant that shows labels and a scale.
2. Balance the following photosynthesis reaction. Recall that reaction products are glucose (C6H12O6) and 6 molecules of oxygen gas (O2). Glucose is one of many thousands of kinds of carbon molecules (figure 11.7).
The reaction product is represented here as glucose. A prior step (not shown) builds a 3-carbon sugar that plants convert to glucose.
3. What forms does carbon appear in for the reactants and the products?
4. Write the following sentence in your science notebook and fill in the blanks:
“Compared with processes in nature, this experiment represents movement of carbon from the to
.” 5. Add the station number to your carbon environs diagram in
your science notebook.
� Figure 11.7 Molecular diagrams with carbon. The carbon atom is highly versatile and forms hundreds of thousands of kinds of molecules. These 3 diagrams show the atomic structure of carbon in glucose, carbon dioxide, and the mineral calcite (CaCO3).
KH56_INQSE_CH11_p541_588_final.indd · Page 558 · 1/1/07 · 2:27:07 PMKH56_INQSE_CH11_p541_588_final.indd · Page 558 · 1/1/07 · 2:27:07 PM

Chapter 11 Carbon on the Move 559
Station 7
What might you see if you dug into soils on a forest floor? Mostly, you would see a lot of leaves and branches in a state of decay. But where does the carbon go that is in that vegetation? You explored one such carbon pathway in soils in station 2. See another pathway at this station.
1. View, touch, and smell the decaying vegetation at this station. Have a member of your team read the following paragraph about decaying vegetation.
In Level 1 of this program, you learned about cellular respiration. During cellular respiration, the cells in your tissues use oxygen and sugars to produce energy for your body. Because this kind of respiration uses or consumes oxygen, it is called aerobic respiration. In soils, small organisms called microbes “eat” and use fallen vegetation as a source of energy. Some of these are single-celled organisms. Thus, microbial respiration leads to the decay that you see.
2. Use glucose (C6H12O6) as a product of photosynthesis. Glucose is not quite cellulose, or the parts of plants with leaves, wood, roots, or bark. Still, it is a good molecule to model the decay of vegetation in soils.
a. Complete the following reaction for microbial respiration with oxygen. Assume that microbes consume glucose. Make sure that the reaction is charge and mass balanced.
b. What must be the reaction product on the blank line in Step 2a?
3. Follow Steps 3a–c to learn about another kind of cellular respiration.
a. Use a reading strategy with your team to read the following paragraph.
Many microbes live deep in soils, the ocean, or even the intestines of animals. In those settings, the microbes do not have oxygen for respiration. Yet they still consume glucoselike molecules to produce energy and stay alive. This energy-generating process is still called respiration. But without oxygen, it is called anaerobic respiration. These microbes are sometimes called anaerobes. You have already studied anaerobic fungi—yeast. They consume sugar and produce ethanol (C2H5OH). Yeast do this without oxygen.
KH56_INQSE_CH11_p541_588_final.indd · Page 559 · 1/1/07 · 2:27:12 PMKH56_INQSE_CH11_p541_588_final.indd · Page 559 · 1/1/07 · 2:27:12 PM

560 Unit 3 Moving Matter
b. Complete the following reaction for anaerobic respiration by microbes.
Is your reaction charge and mass balanced? You might recall that this process is called fermentation.
c. How many moles (mol) of reaction products are made from 1 mol of C6H12O6?
4. Balance the reaction for the anaerobic production of methane (CH4). Other anaerobes produce methane from glucose in swamps and from the intestines of animals.
5. Write the following sentence in your science notebook and fill in the blanks:
“Compared with processes in nature, this experiment represents movement of carbon from to the
.”
6. Add the station number to your carbon environs diagram in your science notebook.
Station 8
Complete the following steps to investigate cellular respiration further. Recall that you have already studied cellular respiration in Level 1 of this program.
1. For a molecule of glucose (C6H12O6), complete and balance the following chemical reaction. This represents cellular respiration for a plant or an animal.
2. Fill a test tube with 10 mL of water. Add 5 drops of BTB solution from a dropper bottle. Swirl gently until the solution is a uniform color.
3. Obtain a straw and blow gently into the blue solution. What color does the solution turn? What does the change in color tell you about the acidity of the solution?
It may help you to refer to the reaction in Question 5 of the Reflect and Connect from the engage activity. Yellow means more acidic, blue more basic.
! Cautions
Do not draw water up the straw. Only blow out through the straw.
KH56_INQSE_CH11_p541_588_final.indd · Page 560 · 1/1/07 · 2:27:17 PMKH56_INQSE_CH11_p541_588_final.indd · Page 560 · 1/1/07 · 2:27:17 PM

Chapter 11 Carbon on the Move 561
4. What are the reaction products of cellular respiration? How did the color change serve as evidence for the reaction products?
5. Rinse the solution out of the test tube when you are finished. 6. Write the following sentence in your science notebook and fill
in the blanks:
“The process of cellular respiration moves carbon from to the .”
7. Add the station number to your carbon environs diagram in your science notebook.
Reflect and Connect Discuss the following questions with your team and write answers in your science notebook. For all chemical equations, confirm that they are charge and mass balanced.
1. At station 5, you used baking soda (NaHCO3) to make a solution with a high concentration of bicarbonate (HCO3)
1–. If CO2(g) dissolves in the ocean or a lake, write a reaction with water (H2O) to show one way to make a bicarbonate ion (HCO3)
1–.
It will help you to recall the acid-base reactions in the engage activity.
2. Geologists test whether a rock is limestone by looking for a “fizz” when they put a drop of hydrochloric acid (HCl) on it. Assuming that the fizz is a release of CO2, balance the following reaction to represent this handy field test for limestone.
3. A solution in a beaker is nearly saturated in NaHCO3. Another beaker contains limewater, a solution nearly saturated in calcium hydroxide Ca(OH)2. Predict what happens when the 2 solutions are mixed.
a. Write a dissociation reaction for 2 mol of NaHCO3. b. Write another dissociation reaction for 1 mol of Ca(OH)2. c. List the reaction products from the steps above. Imagine that
these are reactants when one of the beakers is poured into the other to make a mixture.
d. Use your results at station 5 to predict the reaction products for Question 3c. Check your equation for charge and mass balance.
Recall that sodium (Na1+) and the hydroxide ion (OH1–) are very soluble and stay in solution.
KH56_INQSE_CH11_p541_588_final.indd · Page 561 · 1/1/07 · 2:27:23 PMKH56_INQSE_CH11_p541_588_final.indd · Page 561 · 1/1/07 · 2:27:23 PM

562 Unit 3 Moving Matter
4. Review station 7 with the 3 respiration reactions from glucose (C6H12O6).
a. Write each of these reactions together in your science notebook and label them.
b. Starting with 1 mol of glucose, which of the 3 respiration reactions generates the most CO2?
c. Which of the 3 reactions generates the least CO2? d. What are the molar ratios of CO2 produced in each of the 3
respiration reactions? 5. CO2 dissolves into the ocean in both polar and equatorial
areas. Would CO2 dissolve more readily into cold polar oceans or warm equatorial oceans? Use your data from station 1 to explain your answer.
6. Which station or stations represent a reaction that is the basis for food chains in ecosystems? Use 2 examples to explain your answer.
The Carbonated Geosphere In the explore activity, Carbon Changing Costumes, you saw carbon change costume through chemical reactions. Carbon can move between substances in the liquid, solid, or gas state. You probably even noted that some stations had reactions that were the reverse of other stations.
Indeed, carbon takes many forms. This is because its bond structure is so versatile, as you have been learning in science. But to change settings on Earth and participate in different reactions, carbon has to move around. You have probably traced the flow of water (H2O) between different reservoirs. The movement of water between reservoirs is the water cycle.
What about carbon? How does carbon move around between different geologic and biologic settings? In The Carbonated Geosphere, you and your team will analyze carbon transport on Earth.
MaterialsFor each team of 3 students
3 Carbon Chemical Reaction Table handouts
3 Carbon Transport Table handouts
Process and Procedure Begin by observing as a class 2 containers with water and substances with carbon.
KH56_INQSE_CH11_p541_588_final.indd · Page 562 · 1/1/07 · 2:27:28 PMKH56_INQSE_CH11_p541_588_final.indd · Page 562 · 1/1/07 · 2:27:28 PM

Chapter 11 Carbon on the Move 563
1. Look at the containers of water your teacher has set up. Are they similar or different? Can you tell which one has dissolved NaHCO3? Discuss these containers as a class and answer Questions 1a–c in your science notebook.
a. Discuss what forms of carbon you think might be in the 2 containers of water. What is your evidence, and how might you test your ideas?
b. What do you think will happen if the 2 are mixed? Write a prediction.
c. What ideas do you have about the geologic or biologic setting that the mixture might represent?
2. Obtain the Carbon Chemical Reaction Table and the Carbon Transport Table handouts. Refer to these tables with your team as you complete the following reading. The tables are an important tool to help you map pathways of carbon on Earth.
3. Use a reading strategy with your team to complete the following reading, Carbon Transport across the Globe. This will help you learn more about how carbon moves around Earth.
Carbon Transport across the Globe
Terrestrial Carbon and Fall ColorsWhat is it like in the woods, the mountains,
or a city park on a brisk fall day? What indicates the changing seasons to you? Maybe you note that the Sun is at a lower angle in the sky, or that not only are leaves changing colors, but many are fluttering to the ground. The leaves fall amidst limbs or trees that have fallen, as well as the remains of other leaves that fell to the forest floor last fall.
Each year, this process repeats itself in forests. Vegetation that grew in the spring and summer is transferred to forest floors in the fall. The buildup of leaves and limbs on the forest floors is called litter (figure 11.8). This process
moves carbon from trees to the forest floor. As litter, the carbon in that organic material can enter a new series of decay pathways. When litter starts to decay, it is sometimes called humus. In the explore activity, you saw several possible fates for carbon in the humus of the forest floor. Do you remember what these were? One was microbes that consume humus. For the microbes, this is a stage of cellular respiration. Much of the carbon is converted to CO2. Another fate for carbon in the humus occurs from the rinsing or leaching of the humus by rainwater. As the rainwater then drains to rivers, the carbon may remain in particles of organic
KH56_INQSE_CH11_p541_588_final.indd · Page 563 · 1/1/07 · 2:27:30 PMKH56_INQSE_CH11_p541_588_final.indd · Page 563 · 1/1/07 · 2:27:30 PM

564 Unit 3 Moving Matter
matter. This is often called dissolved organic carbon, or DOC for short. Rivers carry DOC to the ocean—that’s where rivers go (figure 11.9). But carbon also takes another form in rivers. This is the carbon from rock weathering, such as the weathering of limestone (CaCO3). Do you recall the reaction that makes the bicarbonate ion HCO3
1– from rock weathering? Rivers also carry a lot of this carbon. Since CaCO3 is not organic carbon (CaCO3 doesn’t “grow on trees,” so to speak), it is called dissolved inorganic carbon, or DIC for short.
Maybe you have heard the word terrestrial. This refers to something found on land. The processes above describe terrestrial carbon—that is, the carbon in forests, rocks, rivers, and lakes. There are two other key parts of Earth with a lot of carbon. You can probably guess what those are.
Atmospheric CarbonThink back to one of your first activities
with seltzer water. Your team noted a very common reaction product that carried carbon straight into the atmosphere. What was it? That’s right—it was carbon dioxide, CO2. The atmosphere doesn’t have a huge concentration of carbon as CO2, but it is enough to support processes like photosynthesis. Atmospheric mixing is a key process to help transport and move that carbon around. Rivers are one way to move carbon from the land to the ocean. But atmospheric mixing is a faster way to move carbon around Earth.
With atmospheric mixing, for example, the movement of carbon from the land to the ocean occurs in two steps. Wind moves the atmosphere from the land over the ocean. Then CO2 dissolves from the atmosphere into the ocean. You have seen
in several activities how CO2 dissolves into water. This also happens with the ocean. How else does carbon get to the atmosphere? Look at your tables. Another key transport process is volcanic degassing. This moves carbon in CO2 from inside Earth to the atmosphere. But how did the carbon get into the earth? If you study more geology, you will learn how rocks like limestone get pushed deep into the earth. Recall station 4, where CaCO3 decomposes under heat and pressure, releasing CO2 gas. This is what happens to limestone when it is pushed into the earth.
Carbon Transport across the Globe, continued
� Figure 11.8 Fall leaves. These trees are losing their leaves in the fall. Carbon in leaves, limbs, and trunks fall to the forest floor to become litter.
KH56_INQSE_CH11_p541_588_final.indd · Page 564 · 1/1/07 · 2:27:35 PMKH56_INQSE_CH11_p541_588_final.indd · Page 564 · 1/1/07 · 2:27:35 PM

Chapter 11 Carbon on the Move 565
� Figure 11.9 River transport. This lowland river has dark water, in part due to the high content of dissolved organic carbon. Even though you cannot see it, the river also carries a lot of dissolved inorganic carbon.
Gather around the 1–2 new containers of water at the front of the class. Listen to directions from your teacher for what to do to the containers.
1 Record the following in your science notebook.
a. What are the components of the setup? You should be answering questions such as, “What do you see?” “How big are the containers?”
b. Make a sketch with labels of one of the containers. Review what the BTB indicator detects and what it is evidence of.
c. Watch carefully what happens as your teacher starts the experiment. Write your observations in your notebook.
2 Answer Questions 2a–b about the role of carbon in the experiment.
a. What compounds of carbon would you predict in the experiment?b. What does the experiment tell you about the movement of carbon?
In what types of settings on Earth might such movement of carbon occur?
3 Use a reading strategy for your team to continue the reading.
KH56_INQSE_CH11_p541_588_final.indd · Page 565 · 1/1/07 · 2:27:45 PMKH56_INQSE_CH11_p541_588_final.indd · Page 565 · 1/1/07 · 2:27:45 PM

566 Unit 3 Moving Matter
Carbon Transport across the Globe, continued
Oceanic Carbon Envision carbon moving in terrestrial settings. These settings have a lot of vegetation, and we are familiar with these environments. The transport occurs by processes such as respiration, making forest litter, and carrying DIC and DOC in rivers. Blowing trees, flags, or kites are evidence of CO2 in the atmosphere being mixed up. But what about the ocean? Is there much carbon that moves around the ocean? What forms would this carbon take? Indeed, the ocean transports massive amounts of carbon around the globe. In fact, the ocean is the largest reservoir of “active,” or mobile carbon on Earth. When ocean waters mix, a massive flux of carbon results. You have used the word “flux” for the mass of matter that is moved in a given amount of time. You learned that the ocean covers about 70 percent of Earth, making it the largest reservoir of water. The ocean ranges from vast, shallow banks teeming with life, to deep, cold, dark trenches over 11 km deep. These waters are deeper than Mount Everest, the tallest mountain on Earth. How could you visualize the transport and mixing of carbon from shallow ocean waters to deep ocean waters? Actually, you’ve already done a simulation of this process. Think back to the tall bottle in the Stop and Think demonstration. Your teacher forced CO2 into water. The BTB indicator recorded changes in acidity, which were a response to adding CO2 to the water. Depending on the setup, you might have even seen yellow volumes, or patches, of relatively carbon-rich water moving to the bottom of the container. Did you also see blue cells of water moving to the surface? This also happens in the ocean. Upwelling and downwelling transport vast amounts of carbon. But what chemical forms does carbon take in the ocean? You know this as well. In
the ocean, it is just DIC and DOC from rivers, or CO2 that dissolves in the ocean from the atmosphere. DOC enters the ocean from rivers. (Recall that DOC comes from the leaching of soils and vegetation.) In the ocean, DOC is eaten by microorganisms and converted to CO2. This CO2 can either escape to the atmosphere, be used for photosynthesis, or be converted to HCO3
1–. The latter, the bicarbonate ion, is inorganic carbon (DIC). Another source of DIC into the ocean comes from rivers due to rock weathering. Inorganic carbon is then available to marine animals to make their shells. So several processes add carbon to the ocean—DIC and DOC from rivers, and CO2 from the atmosphere. You saw that CO2 solubility was higher in cold water than in warm water. Cold waters in polar regions (the Arctic and the Antarctic) are much better at absorbing CO2 from the atmosphere than are warm waters at the equator. Remember the simple experiment you did with several bottles of seltzer water? The CO2 was more soluble in cold water than in warm water. How else is carbon transported in the ocean? Another way is by marine animals. These animals consist largely of carbon, and they range in mass from phytoplankton to whales (figure 11.10). Phytoplankton are microorganisms at the ocean’s surface that use dissolved CO2 in photosynthesis. Phytoplankton are primary producers. They are the foundation of the marine food web, just as plants are the primary producers on land. Many marine organisms also build houses or shells out of calcium carbonate, CaCO3. At some point, these organisms are either eaten, which moves their carbon up the food chains, or they die. When they die, their carbon sinks to the bottom of the ocean.
KH56_INQSE_CH11_p541_588_final.indd · Page 566 · 1/1/07 · 2:27:58 PMKH56_INQSE_CH11_p541_588_final.indd · Page 566 · 1/1/07 · 2:27:58 PM

Chapter 11 Carbon on the Move 567
Reflect and Connect After completing the reading with your team, discuss and answer the following questions. Your team should prepare to share its ideas with the class.
1. Review the handout Carbon Chemical Reaction Table. Review the reactions with carbon.
a. Fill in the blank columns to the right with examples of carbon-bearing reactants and products.
Review your carbon environs diagram to see whether the reactions occur in the ocean, the atmosphere, or terrestrial settings.
� Figure 11.10 Life in shallow oceans. Several types of life exist at different water depths in the ocean. Ultimately, all of these organisms rely on photosynthesis for their food.
KH56_INQSE_CH11_p541_588_final.indd · Page 567 · 1/1/07 · 2:28:04 PMKH56_INQSE_CH11_p541_588_final.indd · Page 567 · 1/1/07 · 2:28:04 PM

568 Unit 3 Moving Matter
b. Go back in your notes to the stations in Carbon Changing Costumes. Label each station with the process from the table.
It may help to use a different-colored pen or pencil.
2. Review with your team the handout Carbon Transport Table. Review how carbon is transported between terrestrial, atmospheric, and oceanic settings.
a. Fill in the blank columns to the right with the settings or environments between which carbon is transported.
b. Go back in your notes to the stations in Carbon Changing Costumes. Label each station with a carbon transport process from the table.
3. Recall the water mixing demonstrations at the beginning of this activity. Discuss as a group and write in your science notebook how the mixing experiments can help you remember the chemical forms of DIC and DOC in carbon cycling.
a. Which experiment models the transport and mixing of carbon in the ocean? Explain why.
b. Which experiment models carbon in rivers? What is the evidence?
4. Trees and vegetation store carbon in terrestrial environments. You probably see this every day. But what about the ocean? What organisms do you think store carbon in the ocean? For example, what organisms can carry out photosynthesis beneath the ocean’s surface? Figure 11.10 provides a clue. Does much carbon reside there?
5. What does the title of the activity Carbon Changing Costumes mean to you?
Fossil Carbon You have explored carbon transport around the globe that is independent of human actions. But how do we fit into the picture? Humans rely on carbon in many ways. It is a key part of our bodies, our environment, and our economy. In this manner, we are also a part of carbon pathways around Earth.
Do humans affect carbon movement around Earth? The answer is pretty simple. We do. Every time we turn on a light, use the grill, or drive our cars, we are converting carbon from one form to another. In Part I of Fossil Carbon, you and your team will investigate how human needs for energy have become part of carbon cycling. Then in Part II, you will use your learning to construct a model of the carbon cycle.
KH56_INQSE_CH11_p541_588_final.indd · Page 568 · 1/1/07 · 2:28:13 PMKH56_INQSE_CH11_p541_588_final.indd · Page 568 · 1/1/07 · 2:28:13 PM

Chapter 11 Carbon on the Move 569
Part I: Carboniferous Combustion
MaterialsFor each team of 3 students
1 metal spoon
paper towels
1 ice cube
1 ruler
1 candle
matches
1 Atmospheric CO2 Records handout
Process and Procedure Gather with your team to complete the following steps. Keep in mind how the investigation relates to fossil fuels as a source of energy.
1. Place a metal spoon on a paper towel, and put a cube of ice on the metal spoon. Over 5–10 min, the ice should conform to the shape of the spoon. The spoon will get very cold.
2. Use a reading strategy with your team for the following paragraph on fossil fuels and hydrocarbons.
Fossil fuels include many carbon-bearing substances. Humans rely on these substances every day for transportation, electricity, and warmth in our homes. We call them fossil fuels, or hydrocarbons, for a simple reason. Fossil fuels consist of hydrogen and carbon compounds from geologic deposits of organic carbon. Of course, these hydrocarbons began as organic molecules that were cellulose, wood, bark, or starches in plants, or were even animal remains. Fossil fuels formed many millions of years ago. You have probably heard of fossil fuels such as coal, petroleum, or natural gas. Combusting these fuels provides valuable energy for society. As such, this combustion is an exothermic reaction.
3. Complete these steps to investigate a burning candle. A burning candle is a simple example of combusting hydrocarbons.
a. Candles may consist of several kinds of wax, or paraffin. A general formula for wax is CnH(2n+2), where n can vary from about 20 to 30. Write the formula for paraffin with a value of n � 20.
b. Make a T-table showing values of n from 20 to 25 and the corresponding formula for paraffin.
c. Is a burning candle a source of energy? Explain why. 4. How would you write a chemical reaction for the combustion of
fossil fuels? Start with the chemical reaction for burning a candle (figure 11.11). Use these steps to determine the 2 reactants.
� Figure 11.11 Burning candle. What are the reaction products of a burning candle?
Go to: www.scilinks.orgTopic: fossil fuelsCode: 2Inquiry569aTopic: hydrocarbonsCode: 2Inquiry569b
KH56_INQSE_CH11_p541_588_final.indd · Page 569 · 1/1/07 · 2:28:17 PMKH56_INQSE_CH11_p541_588_final.indd · Page 569 · 1/1/07 · 2:28:17 PM

570 Unit 3 Moving Matter
a. Use paraffin with a value of n � 20 as 1 reactant. b. What gas needs to be present for a combustion reaction?
This is your second reactant. 5. Determine 1 of the reaction products using the cold spoon and
a lit candle. a. Check that your metal spoon is very cold. The ice should be
melted into the shape of the spoon. b. Draw away all the water around the ice with a paper towel.
Completely dry the bottom of the spoon with a dry paper towel. The spoon should be very cold and completely dry on the bottom.
Your teacher may have dry ice to use on the spoon. This will make the spoon much colder than ice, and it will not melt.
c. Hold the cold, dry spoon about 1 cm above the tip of the candle flame. What do you see happening on the bottom of the spoon?
d. What is the substance on the bottom of the spoon? How could you test what the substance is? Describe a test in your science notebook for that substance. Show it to your teacher—if it’s a good test, you may be allowed to try it.
6. Candle combustion has a second reaction product. Follow these steps and your teacher’s directions to determine this product.
a. Get from your teacher water with BTB indicator that is sky blue. Add this to a depth of 0.5 cm in each of 2 flat glass dishes. Place each on a white sheet of paper.
b. Place 3 or 4 very short (or cut) candles in the water. Light them.
c. Place a glass lid on top of 1 of the containers, but do not let the candles extinguish. As the candle flames dim, slide the lid sideways to let in more oxygen.
d. What do you observe happening to the color of the water in the 2 containers?
e. What molecule could be causing this effect? Explain several lines of evidence.
7. Write a third reaction product of combusting fossil fuel. This is the whole reason that we use fossil fuels.
8. Write the complete chemical reaction for candle combustion in these steps. Use a candle formula of C20H42.
a. Make a T-table with reactants in the left column and products in the right. Label the columns.
b. Reconfigure reactants and products around an arrow, as in a chemical reaction.
c. Work with your team to balance the equation.
Don’t put your finger too
close to the flame, or you will discover this reaction
product firsthand.
KH56_INQSE_CH11_p541_588_final.indd · Page 570 · 1/1/07 · 2:28:27 PMKH56_INQSE_CH11_p541_588_final.indd · Page 570 · 1/1/07 · 2:28:27 PM

Chapter 11 Carbon on the Move 571
To balance the equation, start by equating the number of carbons on the left with the number on the right. Then balance the hydrogen. Balance the oxygen last.
d. Return to the Carbon Chemical Reaction Table from the explain activity, The Carbonated Geosphere. Add the reaction from Step 8c to line 10 on the handout. Write in the process “fossil fuel combustion.”
9. Complete the following 2 sentences in your science notebook. a. “Two settings or locations where hydrocarbons are combusted
to make energy are and .” b. “This experiment simulates the movement of carbon from
to the to the .”
PART I
After completing the reading in Step 2 with your team, discuss and answer the following questions.
1 Fossil shells have carbon in calcium carbonate, CaCO3. Could you combust shells, a source of fossil carbon, to use as fuel? Use evidence from this chapter in your answer.
It may help you to use the terms endothermic and exothermic.
2 Propane (C3H8) is a hydrocarbon used for energy. Balance the following reaction for combusting propane.
3 Natural gas is an important source of energy. It is close to a mixture of about 50 percent methane (CH4) and 50 percent ethane (C2H6). Balance the following reaction for combusting natural gas.
4 Figure 11.12 shows concentrations of CO2 in the atmosphere measured each month in Hawaii from 1958 to 2002. Tick marks on the year axis represent January 1.
a. Draw a best-fit line through the center of the squiggle pattern. What is the slope of the line you drew? Be sure to include units on the slope.
Recall that slope is change in y (�y) divided by change in x (�x). You may also know this as “rise over run.”
KH56_INQSE_CH11_p541_588_final.indd · Page 571 · 1/1/07 · 2:28:32 PMKH56_INQSE_CH11_p541_588_final.indd · Page 571 · 1/1/07 · 2:28:32 PM

572 Unit 3 Moving Matter
� Figure 11.12 Atmospheric CO2 concentration, 1958–2002. In this plot of atmospheric CO2 concentration from 1958 to 2002, measurements were taken each month from the top of Mauna Loa, Hawaii. The detail shows the CO2 curve from 1995 to 2002. How many kinds of patterns do you see in these data?
STOP & THINK, PART I, continued
Source: Keeling, C.D. and T.P. Whorf, 2005. Atmospheric CO2 records from sites in the SIO air sampling network. In Trends: A compendium of Data on Global Change. Carbon Dioxide Information Analysis Center, Oak Ridge National Laboratory, U.S. Department of Energy, Oak Ridge, TN, U.S.A.
KH56_INQSE_CH11_p541_588_final.indd · Page 572 · 1/1/07 · 2:28:39 PMKH56_INQSE_CH11_p541_588_final.indd · Page 572 · 1/1/07 · 2:28:39 PM
Chapter 11 Carbon on the Move 573
b. What months of the year does CO2 increase in concentration? How much does CO2 concentration typically increase?
c. What months of the year does CO2 decrease in concentration? How much does CO2 concentration typically decrease?
d. What month in each year is CO2 the highest?e. Think about the month you identified in Step 4d. What happens each
year during that month that would affect the concentration of CO2 in the atmosphere?
Not counting equatorial forests, the Northern Hemisphere has much more vegetation than the Southern Hemisphere.
f. What process in plants can explain the annual pattern in figure 11.12?
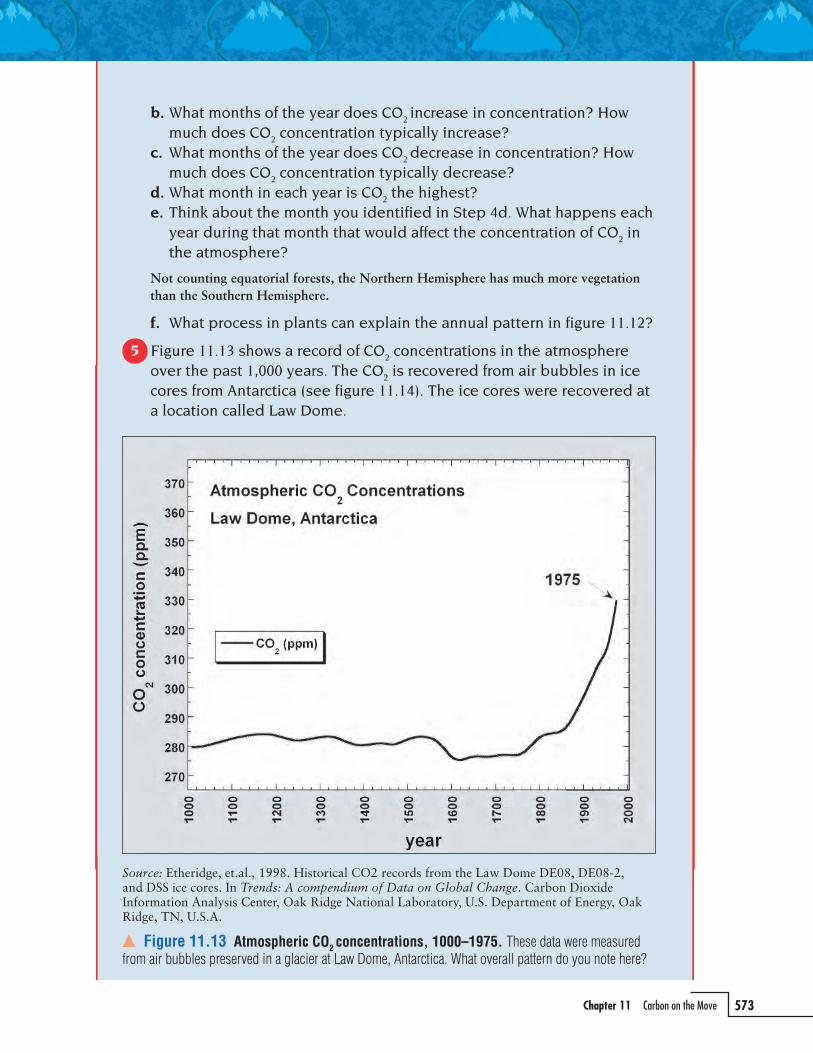
5 Figure 11.13 shows a record of CO2 concentrations in the atmosphere over the past 1,000 years. The CO2 is recovered from air bubbles in ice cores from Antarctica (see figure 11.14). The ice cores were recovered at a location called Law Dome.
� Figure 11.13 Atmospheric CO2 concentrations, 1000–1975. These data were measured from air bubbles preserved in a glacier at Law Dome, Antarctica. What overall pattern do you note here?
Source: Etheridge, et.al., 1998. Historical CO2 records from the Law Dome DE08, DE08-2, and DSS ice cores. In Trends: A compendium of Data on Global Change. Carbon Dioxide Information Analysis Center, Oak Ridge National Laboratory, U.S. Department of Energy, Oak Ridge, TN, U.S.A.
KH56_INQSE_CH11_p541_588_final.indd · Page 573 · 1/1/07 · 2:28:48 PMKH56_INQSE_CH11_p541_588_final.indd · Page 573 · 1/1/07 · 2:28:48 PM

574 Unit 3 Moving Matter
a. Describe the pattern of CO2 concentration in the atmosphere from 1000 to 1750.
b. Compare the pattern from Step 5a with the pattern from 1750 to 2000.c. Estimate the slope of the line from about 1900 to 1975. How does this
compare with the slope you estimated from Step 4a?d. Discuss with your team some possible explanations for this change.
Write those reasons in your science notebook.e. Refer back to the data from Mauna Loa in figure 11.12. On your
handout, neatly draw a box showing the limits of figure 11.12 from 1958 to 2002.
f. Write an X on the graph for Law Dome to show CO2 concentrations in 2002.
g. What does this tell you about changes in CO2 concentrations in the atmosphere?
6 Use FYI—Fill ’er Up!—What’s in Your Tank? to answer the following questions about CO2. Assume complete combustion of octane (C8H18).
a. A typical gas tank is 15 gallons (gal). How much CO2 does that produce for the atmosphere?
b. On average, each person in the United States uses 461 gallons of gasoline per year. How many kilograms (kg) of CO2 does this add to the atmosphere?
c. The United States has a population of about 290 million people. Estimate how many kilograms of CO2 the United States adds to the atmosphere each year.
� Figure 11.14 Working with an ice core sample. Small bubbles in this ice core preserve a record of past CO2 contents in the atmosphere.
STOP & THINK, PART I, continued
KH56_INQSE_CH11_p541_588_final.indd · Page 574 · 1/1/07 · 2:29:07 PMKH56_INQSE_CH11_p541_588_final.indd · Page 574 · 1/1/07 · 2:29:07 PM

Chapter 11 Carbon on the Move 575
When were you last in a car or bus? Did you ride
in one of those to school today? Did you use a car
or bus to go shopping last weekend? You know that
a transportation system won’t work without a source
of energy. That energy usually comes from a fossil
fuel, particularly gasoline. Scientists are concerned
that the amount of gasoline humans use might be
affecting Earth’s climate.
Gasoline is made by distilling and refining crude
oil that is extracted from the ground. The final
chemistry depends on the kind of crude oil, the
Fill ’er Up!—What’s in Your Tank?refining process, and the additives. Still, most of
gasoline is a hydrocarbon that can represented with
CnH(2n+2). While n for gasoline may vary from 7 to 11,
a good example is octane, with n � 8. The formula
for octane is C8H18.
What happens to gasoline after it is combusted in
a car’s engine? What are the reaction products, and
how much of each is produced? Let’s take a look by
starting with 1 gal of octane that is fully combusted
in a car’s engine.
Step 1 is to write a balanced reaction of octane plus oxygen to produce water,
carbon dioxide, and energy. The following reaction shows that 1 mol of octane
needs 12.5 mol of O2 (25/2) to produce 8 mol of CO2 and 9 mol of H2O and energy:
Step 2 is to determine how many moles of octane are in 1 gallon. We will use the
following conversion factors:
• 3.786 liters (L) � 1 gal
• density of octane � 702.5 grams per liter (g/L)
• gram atomic weight of octane � 114 grams per mole (g/mol)
Step 3 is to calculate the moles of the reaction products and convert them to
mass. We’ll start with CO2:
So, 1 gal of octane gasoline produces about 8.2 kg of CO2, or about 18 pounds
(lb) of CO2. Because about 27 percent of a CO2 molecule is carbon, this is the same
as adding about 5 lb of carbon to the atmosphere (18 � 0.27).
Topic: hydrocarbonGo to: www.scilinks.orgCode: 2Inquiry575
KH56_INQSE_CH11_p541_588_final.indd · Page 575 · 1/1/07 · 2:29:13 PMKH56_INQSE_CH11_p541_588_final.indd · Page 575 · 1/1/07 · 2:29:13 PM

576 Unit 3 Moving Matter
Now you see that the total mass of the reactants
is also 11.99 kg (9.33 kg O2 � 2.66 kg octane).
Fill ’er Up!—What’s in Your Tank?, continued
This equals the mass of the products. Does this
relationship between reactants and products sound
familiar? It should—the law is the conservation of
mass.
But real cars don’t completely combust gasoline
made of pure octane. Rather, their incomplete
combustion makes smog, particularly in cities. That
smog contains nitrogen oxides, the poisonous gas
carbon monoxide (CO), and unburned hydrocarbons
(soot).
Why should humans be concerned about
adding CO2 to the atmosphere? First, CO2 in the
atmosphere is a greenhouse gas. This means that
it traps and retains heat from the Sun inside Earth’s
atmosphere. Many scientists are concerned that
increasing global temperatures could affect the
balance of animals in food webs in ecosystems.
Climate change also is linked to sea level change,
and perhaps to patterns of food production for
humans.
Second, besides photosynthesis, CO2 is also
removed from the atmosphere by dissolving into
the ocean. You have seen that adding CO2 to water
makes water more acidic. Many scientists are
seeing evidence for the impact of increased acidity
(decreasing pH) on the ability of marine organisms
such as corals and clams to form shells and
protective structures of calcium carbonate.
� Pumping gas. Humans rely on petroleum products like gasoline as an inexpensive source of energy, especially for transportation. How many gallons of gas does a car tank hold?
The same approach shows how much water is produced. Start with the octane:
The sum of the reaction products, water and carbon dioxide, is 11.99 kg (3.78 kg
H2O � 8.21 kg CO2). But how do you get about 12 kg of reaction products from only
2.66 kg of octane? Does that make sense? Don’t forget the other reactant—oxygen.
Here’s the mass of oxygen used in the combustion:
KH56_INQSE_CH11_p541_588_final.indd · Page 576 · 1/1/07 · 2:29:19 PMKH56_INQSE_CH11_p541_588_final.indd · Page 576 · 1/1/07 · 2:29:19 PM

Chapter 11 Carbon on the Move 577
Part II: Showing the Carbon Cycle
MaterialsFor each team of 3 students
15 sticky notes
1 pair of scissors
1 pencil and eraser
3 pieces of clear tape
1 sheet of 11�17 in paper (optional)
colored pencils (optional)
1 Terrestrial, Atmospheric, and Oceanic Carbon Cycling handout
You have explored a lot of carbon reactions so far. You have also been thinking about how carbon moves around. Now it’s time for your team to map out a way that these processes join together in the carbon cycle. You’ll focus on Earth of course, even though the carbon cycle would be very different on other planets or moons (see sidebar, Titanic Carbon).
Process and Procedure Gather in a team of three for the following steps. Be prepared to share, describe, and answer questions about your carbon cycle in a class discussion.
1. Obtain a copy of the handout Terrestrial, Atmospheric, and Oceanic Carbon Cycling. Tape the backs together to make a single sheet about 11�17 in.
Your teacher may also provide large sheets of paper to use as a background. Model the background environmental setting from the handout.
2. Use your completed Carbon Chemical Reaction Table and Carbon Transport Table to write each of the 10 carbon reactions on a different sticky note. Then write each of the 5 transport processes on a separate sticky note.
Use the main reaction path for microbial respiration.
3. Attach each sticky note to the background in a position where the reaction or transport process might occur. Discuss your reasons for the placement of each sticky note.
During your discussion, you may adjust or move any sticky note.
4. Use your pencil to draw lines and link the different carbon reactions and transport processes.
KH56_INQSE_CH11_p541_588_final.indd · Page 577 · 1/1/07 · 2:29:26 PMKH56_INQSE_CH11_p541_588_final.indd · Page 577 · 1/1/07 · 2:29:26 PM

Titanic Carbon
SIDE
BAR
578 Unit 3 Moving Matter
5. Decide on any other visual props or diagrams that you can add to your map of the carbon cycle. For example, what might you add to help visually represent reaction 10?
Reflect and Connect Discuss and answer the following questions based on your diagram of the carbon cycle. These questions make sure that your team is seeing the links and connections in the carbon system.
1. Complete this check on possible carbon paths. You should be able to follow a carbon atom in a continuous path from arrow to arrow from a power plant, to the atmosphere, into phytoplankton in the shallow ocean, to the deep ocean, and then to sediments. Does your diagram represent this path of carbon?
2. Complete this check on possible carbon paths. You should be able to follow carbon with arrows from the atmosphere, to forests, to litter, to rivers, to the ocean, and into organisms like corals. Does your diagram represent this path of carbon?
From all signs, the mission was going
well. The capsule plummeted into the thick,
orange haze surrounding Titan—Saturn’s
largest moon. Still, other missions like this
had ended in disaster. In the past decade,
several spacecraft to Mars had “gone silent”
during descent. They had probably crashed
directly onto the planet’s surface. But those
were the risks. Such missions were the only
way to study the chemistry of other parts of
the solar system.
The descending capsule was the Huygens
probe, launched only 3 weeks before
(December 2004) from the Cassini spacecraft.
The Cassini spacecraft had spent the past 7
years traveling to Saturn and its 31 moons.
Cassini had been able to image the outer
parts of Titan’s atmosphere (see figure).
Now it would be up to the Huygens probe
to penetrate the upper layers of Titan’s
atmosphere and to explore the dense, lower
atmosphere and Titan’s surface.
All evidence was that Titan would have
carbon in several forms. But what would
they be? Was there evidence for a carbon
cycle or even life on Titan? What might that
carbon cycle look like?
The carbon cycle on Earth involves
gases in the atmosphere, liquids in the
hydrosphere, and solids in the geosphere
and biosphere. Interactions among these
four parts of Earth make up the carbon cycle
as the carbon changes forms by chemical
reactions. A cycle on Titan would also
need to include evidence for transport of
KH56_INQSE_CH11_p541_588_final.indd · Page 578 · 1/1/07 · 2:29:30 PMKH56_INQSE_CH11_p541_588_final.indd · Page 578 · 1/1/07 · 2:29:30 PM

Chapter 11 Carbon on the Move 579
carbon-bearing substances and chemical
reactions. The evidence wasn’t hard to see.
The mission controllers waited anxiously
as the Huygens probe plummeted into the
orange haze and toward Titan’s surface.
Soon, features became clear, showing
shapes that resembled river channels and a
coastline (see figure). Given temperatures of
nearly �300° Fahrenheit at Titan’s surface,
the liquid could not be H2O. The liquid likely
came from “rains” of liquid methane (CH4)
or ethane (C2H6).
Amazingly, after a safe landing, the probe
operated for about 2 hours. It sent back a
close-up view of Titan’s surface (see figure)
and detected hydrocarbon gases in the
lower atmosphere. Scientists believe that
these images show pieces of solid ice (H2O)
or methane (CH4) blocks. Then the Huygens
probe went silent.
Since January 2005, scientists have learned
much more about Titan’s atmosphere.
Like Earth, Titan’s atmosphere is about
80–90 percent nitrogen (N2). Titan’s
atmosphere also has carbon compounds,
particularly CH4. Dissociation of N2 and
CH4 by ultraviolet radiation from the Sun
results in other hydrocarbons and nitrogen
compounds. These include C2H6 (ethane),
C3H8 (propane), C2H2 (acetylene), C2H4
(ethylene), C3H4 (methylacetylene), HCN
(hydrogen cyanide), HC3N (cyanoacetylene),
C2N2 (cyanogen), and H2 (hydrogen). There
is also evidence for CO2 (carbon dioxide)
and CO (carbon monoxide), just like on
Earth, but no free oxygen (O2).
So, it would appear that Titan has a
carbon cycle, of sorts. Combined with the
absence of O2, Titan may be similar to Earth
before life formed, but perhaps somewhat
colder. Studying carbon pathways on Titan
helps us understand our planet and the
prospects for life elsewhere in the universe.
� Three views of hydrocarbons on Titan. (a) The first image, taken by the Cassini spacecraft, shows layering of gases, mostly N2 and CH4, in Titan’s atmosphere. (b) This image was taken by the Huygens probe in January 2005 during its descent to the surface. It shows river channels that join and drain a liquid, probably liquid CH4, from left to right. (c) The last image shows blocks of “dirty ice” and CH4 on the surface of Titan.
a.
b.
c.
KH56_INQSE_CH11_p541_588_final.indd · Page 579 · 1/1/07 · 2:29:34 PMKH56_INQSE_CH11_p541_588_final.indd · Page 579 · 1/1/07 · 2:29:34 PM

580 Unit 3 Moving Matter
The Flux Is the Crux Have you seen photographs of the Amazon River basin in South America? It is a vast area of massive trees and dense jungles (figure 11.9). The Amazon basin is almost as big as the United States. Surely the Amazon basin stores massive amounts of carbon. Could anything on Earth have more carbon than dense tropical jungles?
You have learned that reservoirs store matter, be it water or carbon. You could even think of a bank as a reservoir—banks store dollars. You also learned that fluxes tell the rate that matter moves into and out of reservoirs. In The Flux Is the Crux, you and your team will apply these concepts to carbon in the geosphere. You will be able to figure out the main reservoirs of carbon on Earth. This is a key part of our being able to live on Earth.
Materials1 calculator
Process and Procedure Gather with your team and record all information and ideas in your science notebook. This activity will help you to be successful in the evaluate activity, Carbon Quest.
1. Discuss with your team whether you think there is more carbon in Earth’s atmosphere or in all the vegetation on Earth. Write your reasons or evidence in your science notebook.
Scientists often refer to the biosphere as the living part of the planet. This can include all plants, animals, and soils, plus analogous parts of the ocean.
2. Use a reading strategy with your team for the following paragraphs about rates of carbon transport in the carbon cycle.
Dissolved carbon flows down a river to the ocean. Maybe the carbon is in a bicarbonate ion used by a clam to build its shell. Or imagine carbon entering a plant by photosynthesis and then leaving the plant by respiration after a week. Or what about carbon in the atmosphere, dissolving into the ocean, and then quickly entering phytoplankton by photosynthesis?
In each of these cases, carbon is mobile. That carbon moves quickly between carbon reservoirs on Earth. In some cases, the carbon might even cycle back and forth, such as in the photosynthesis-respiration path. Such interactions occur over days, weeks, or perhaps a few years. For this reason, this carbon might be called active or mobile carbon. Sometimes this quickly moving carbon is referred to as the biologic carbon cycle.
KH56_INQSE_CH11_p541_588_final.indd · Page 580 · 1/1/07 · 2:29:36 PMKH56_INQSE_CH11_p541_588_final.indd · Page 580 · 1/1/07 · 2:29:36 PM

Chapter 11 Carbon on the Move 581
In contrast, other parts of Earth have large amounts of carbon that interact much more slowly in the ocean, land surface, or atmosphere. This carbon is mostly beneath Earth’s surface. It is stored in geologic deposits of limestone or hydrocarbons such as coal, petroleum, or natural gas. These geologic reservoirs of carbon are viewed as inactive carbon because they were not part of rapid carbon cycling at Earth’s surface. Some geologists call this the geologic carbon cycle. This is because such carbon reservoirs require millions of years to develop, mature, and cycle.
3. Recall your carbon reactions and transport processes from earlier in this chapter. Answer the following 2 questions.
a. Discuss with your team 2 paths or processes where carbon in the geologic carbon cycle is transferred to become active, biologic carbon.
b. Discuss with your team 2 paths or processes where carbon in the biologic carbon cycle is transferred to become inactive, geologic carbon.
It may be helpful to use a sketch with labels to illustrate your answers.
4. Copy figure 11.15 into your science notebook (including the blank columns) and complete the following steps. The table shows the main active reservoirs of carbon on Earth and their masses.
a. Rewrite the mass of carbon (g C) from column 2 as the mass of carbon with the exponent of 1015 in column 3. Remember how to move decimals and change the exponent.
If you were changing 1,000 g to kilograms, you would use these steps:
1,000 g � 1.0 � 103 g � 1 kg
After you have done this, do a visual check with your team to make sure that the values make sense.
b. In column 4, show the mass of carbon as petagrams of carbon (Pg C). Use the conversion where 1 petagram of carbon equals 1015 grams of carbon (1 Pg C = 1015 g C).
c. At the bottom of column 4, sum the carbon in Pg C for all the reservoirs.
d. In column 5, calculate the percentage of active carbon in each reservoir.
e. Make a T-table in your science notebook. List the reservoirs from largest to smallest in the left column and include their percentages in the right column.
f. Sketch in your science notebook how you would represent the result from Step 4d as a bar graph and a pie chart.
Go to: www.scilinks.orgTopic: biologic carbon cycleCode: 2Inquiry581aTopic: geologic carbon cycleCode: 2Inquiry581b
KH56_INQSE_CH11_p541_588_final.indd · Page 581 · 1/1/07 · 2:29:41 PMKH56_INQSE_CH11_p541_588_final.indd · Page 581 · 1/1/07 · 2:29:41 PM

582 Unit 3 Moving Matter
5. Answer the following questions based on your completed table from figure 11.15. Use petagrams of carbon to compare reservoir sizes (for example, 50 is 2 times larger than 25).
a. What are the first- and second-largest reservoirs of active carbon on Earth? Are these the reservoirs that you expected?
b. Reevaluate your team’s response to Step 1. (Is there more carbon in Earth’s atmosphere or in all the vegetation on Earth?)
c. Soils are a key player in the active carbon cycle. How many times larger is the amount of carbon in soils than in the atmosphere? In vegetation?
d. Notice that land animals are not included in figure 11.15. Why do you think they are not included?
6. Estimate how much carbon is in the inactive, or geologic, carbon cycle by following Steps 6a–d.
a. Geologists think that sediments and muds beneath the ocean have about 1.5 x 10²² g C. Show how you move decimals to express this number in Pg C.
b. Geologists estimate that sediments on continents hold about 7.6 × 10²² g C. Express this as Pg C.
c. How many Pg C from Steps 6a–b? d. How many times larger are estimates for carbon in all
geologic sediments (Step 6c) compared with carbon in the active (biologic) carbon cycle?
Many of the estimates that you have made in the last 2 questions are sometimes called “back of the envelope” calculations. You can do them on a small piece of paper to make a quick approximation or comparison. But do these in your science notebook.
Carbon reservoir
Mass of carbon (g C)
Mass of carbon (g C with � 1015 notation)
Mass of carbon (Pg C)
Percentage of active carbon (% total carbon)
Soils 1.66 � 1018
Marine life 3.0 � 1015
Shallow ocean 9.0 � 1017
Middle, deep ocean 3.71 � 1019
Atmosphere 5.9 � 1017
Vegetation 6.4 � 1017
Total Pg C
Source: Sarmiento, J.L. & Gruber, N. 2002. Sinks for anthropogenic carbon. Physics Today, 55(8) 30-36, and Intergovernmental Panel on Climate Exchange, 2001. Climate change 2001: The scientific basis. Chapter 3: The carbon cycle and atmospheric carbon dioxide.
� Figure 11.15 Carbon reservoir table. Use a table like this one to help you organize the data from the 6 main reservoirs of mobile carbon. Fill in the columns for petagrams of carbon (Pg C), total carbon, and the percentage of active carbon.
KH56_INQSE_CH11_p541_588_final.indd · Page 582 · 1/1/07 · 2:29:46 PMKH56_INQSE_CH11_p541_588_final.indd · Page 582 · 1/1/07 · 2:29:46 PM

Chapter 11 Carbon on the Move 583
7. Use a reading strategy with your team for the following reading, Carbon Taking Up Residence. Do you remember from chapter 10 how flux was used for french fries and water? This is the same, but with carbon.
Carbon Taking Up Residence
The word flux indicates the amount of matter that moves into, or out of, a reservoir in a given time. Reservoirs that interact and exchange matter are a system. In this chapter, the matter has been carbon. When there are several inputs
(or outputs), all the inputs (or outputs) need to be added together for the reservoir. For example, figure 11.16 shows fluxes of carbon (Pg C) per year between reservoirs of carbon on Earth. Four arrows point to the
� Figure 11.16 Natural carbon flux. This diagram shows fluxes of natural carbon between major reservoirs of carbon in the geosphere. Units are petagrams of carbon (1015 g C) per year. Where are the largest fluxes of carbon?
KH56_INQSE_CH11_p541_588_final.indd · Page 583 · 1/1/07 · 2:29:49 PMKH56_INQSE_CH11_p541_588_final.indd · Page 583 · 1/1/07 · 2:29:49 PM

584 Unit 3 Moving Matter
8. Copy figure 11.17 into your science notebook. Discuss Questions 8a–d with your team and explain your answers in your notebook.
a. Consider using fossil fuels to make energy. Are fossil fuels a source or a sink of carbon to the ocean? Explain your evidence and reasons.
b. Enter estimates for mass of carbon per reservoir in column 2 of figure 11.17. Refer to your work in Step 4 (figure 11.15).
atmosphere. Thus, the atmosphere receives carbon from respiration by vegetation (60.0), microbes in the soils (59.6), river carbon moving to the atmosphere (0.6), and CO2 leaving the shallow ocean (70.0). The total flux to the atmosphere is about 190.2 Pg C per year (60 � 59.6 � 0.6 � 70 � 190.2 Pg C/yr). With humans, emissions of carbon from fossil fuels increase the flux to the atmosphere by about 5–6 Pg C/yr. This is about 2–3 percent of the total. If a reservoir is accumulating carbon over time, it is a carbon sink. The reservoir has inputs of carbon greater than outputs. An example is seafloor sediments. Carbon accumulates there, making geologic sediments. On the other hand, if a reservoir of carbon is losing carbon over
time to other reservoirs, it is a carbon source. The reservoir has outputs of carbon greater than inputs. Examples of carbon sources are volcanic eruptions and rock weathering. These provide new carbon for the active carbon cycle. Residence time tells, on average, the amount of time that matter is in a reservoir. For carbon, short residence times mean that carbon cycles quickly to a neighboring reservoir. Long residence times indicate that carbon stays in the reservoir for much longer times. Only then does the carbon move to the next reservoir in a cycle. Here is a key point: residence time comes from dividing the mass in a reservoir by the total flux into (or total flux out of) the reservoir.
Carbon Taking Up Residence, continued
Carbon reservoir
Mass of carbon (Pg C)
Individual carbon fl ux per year (Pg C/yr)
Total carbon fl ux per year (Pg C/yr)
Average residence time (yr)
Soils
Marine life
Shallow ocean
Middle, deep ocean
Atmosphere
Vegetation
� Figure 11.17 Carbon mass, flux, and residence time. Copy this table into your science notebook. Use it to record fluxes for the 6 major carbon reservoirs on Earth. Estimate residence times of carbon in those systems.
KH56_INQSE_CH11_p541_588_final.indd · Page 584 · 1/1/07 · 2:29:55 PMKH56_INQSE_CH11_p541_588_final.indd · Page 584 · 1/1/07 · 2:29:55 PM

Chapter 11 Carbon on the Move 585
c. Examine figure 11.17 with your team. Enter the total flux from inputs or outputs per reservoir into column 3 of your table.
Remember, if a reservoir has several inputs or outputs, they must be summed together for the total flux for that reservoir. Tally the individual fluxes listed in column 3 for the total in column 4.
d. Calculate residence time in years and enter the number in column 5.
9. Complete Questions 9a–c about residence times of carbon in different reservoirs on Earth.
a. Where does carbon reside for the longest period of time? Explain whether this makes sense to your team, and why or why not.
b. Where does carbon reside for the shortest period of time? Explain whether this makes sense to your team, and why or why not.
c. How much longer or shorter are the residence times for carbon in soils compared with vegetation (forests)? Explain whether this makes sense to you.
Reflect and Connect After creating a carbon cycle with your team, discuss and answer the following questions.
1. What is the residence time for a given dollar in a bank? Use the fictional Bank of the Lower 48, with total holdings of $10 billion. Transfer rates per business day average $7.5 million. How long on average does a dollar stay in the bank before moving out again into the economy?
2. See figure 11.16, which shows estimates for fluxes of natural carbon into and out of the atmosphere. Note that the units are petagrams of carbon per year (Pg C/yr).
a. In your science notebook, make a T-table with values for inputs and outputs of carbon for the atmosphere.
b. Show total fluxes for the atmosphere at the bottom of each column. How similar or different are these?
c. Given these estimates, is the atmosphere gaining or losing carbon?
d. Fossil fuels are adding carbon to the atmosphere at a rate of 5–6 Pg C/yr. What percentage of the total flux into or out of the atmosphere is this?
e. Scientists estimate that the ocean and vegetation absorb about 1.5–2.0 Pg C/yr. What percentage of the 5–6 Pg C from humans is this?
KH56_INQSE_CH11_p541_588_final.indd · Page 585 · 1/1/07 · 2:29:59 PMKH56_INQSE_CH11_p541_588_final.indd · Page 585 · 1/1/07 · 2:29:59 PM

586 Unit 3 Moving Matter
Carbon Quest Indeed, carbon is on the move. You see this all around through processes like photosynthesis, the decay of vegetation in soils, or the use of fossil fuels. You have even worked with some other types of carbon reactions that in nature move carbon from one reservoir to another.
You have also seen how carbon is stored in reservoirs in limestone or coal layers. These range from carbon stored in the deepest, coldest oceans, to carbon stored atop Mount Everest, the highest mountain on Earth.
In Carbon Quest, you will complete a short assessment on key features of the carbon cycle. Then you will use the Learn from Mistakes (LFM) Protocol from Chapter 4, to analyze, discuss, and explain your answers. This gives you the chance to revise incorrect answers and improve your grade.
� Figure 11.18 Mount Everest. This photograph shows Mount Everest and the buff-colored limestone band near the peak. Limestone consists of organisms such as clams. Clams remove carbon from the ocean to build shells of calcium carbonate (CaCO3).
3. Imagine that you are an atom of carbon, Carl Carbon, in the elbow of 1 of your teammates. At a time in the past, you were in a clam in a limestone that was slowly dissolving and weathering near the top of Mount Everest (figure 11.18). The clam in the limestone formed 480 million years ago in a shallow ocean on the southern part of continental Asia.
Develop with your team a sequence showing a possible history for Carl Carbon. Begin before the atom became part of the limestone and ended up in your teammate. For a carbon atom weathered from Mount Everest, what series of reactions and transport could move the atom to a human in the United States? Be prepared to share your ideas with the class. Use the x-axis to represent time; add labels to show the location or setting of the carbon above.
You can check a map to see river basins and drainage patterns from Mount Everest.
ProtocolProtocol
KH56_INQSE_CH11_p541_588_final.indd · Page 586 · 1/1/07 · 2:30:01 PMKH56_INQSE_CH11_p541_588_final.indd · Page 586 · 1/1/07 · 2:30:01 PM

Chapter 11 Carbon on the Move 587
MaterialsFor each student
1 Carbon Quest handout
1 pencil
1 calculator
Process and Procedure 1. Review as a class the LFM Protocol (on page 155). To
summarize, you will• take a short test on the carbon cycle,• participate in a discussion about questions that you or your
classmates might have missed, and• write an explanation for why one of your wrong answers
was not correct and what the correct answer would be.
2. Get from your teacher the handout Carbon Quest. Take about 15 min to complete the multiple-choice questions on the handout. All answers must be given on the attached answer sheet.
3. Turn in the answer sheet to your teacher. 4. Participate in a class discussion about questions where you or
your classmates had incorrect answers. Note that your teacher will not necessarily give you the correct answer. By analyzing the wrong answers, however, you should be able to explain the reason why another answer is the correct one.
It is OK to ask questions during this session. You should also keep notes on questions you missed.
5. For each of the questions you missed on the test, do Steps 5a–e with a small group of 2–3 students. You can earn 50 percent of the original credit for each question you missed (that is, you can raise a score of 60 percent to a score of 80 percent).
a. Write your raw score as a percentage in the upper right corner of your answer sheet.
b. List under your score the number of the questions that you missed.
c. Represent the original question in a different way than it was presented on the test. For example, if the question was mostly words, represent it now with a labeled sketch. Or try representing a sketch with words or phrases. Do not copy questions word for word.
d. Work with a small group (no more than 3 students) to identify and explain the mistakes that you each made on
KH56_INQSE_CH11_p541_588_final.indd · Page 587 · 1/1/07 · 2:30:07 PMKH56_INQSE_CH11_p541_588_final.indd · Page 587 · 1/1/07 · 2:30:07 PM

588 Unit 3 Moving Matter
the test. Be sure to explain conceptual misunderstandings that you might have had. A correct answer with no clear explanation does not receive additional credit.
Explanations like “I read the problem wrong” or “I pushed the wrong button on the calculator” will receive no credit.
e. Show the correct answer or solution. As you can, provide any governing equations with symbolic form, followed by numeric values. Correct answers must include labels on sketches and units for values.
6. Listen to instructions from your teacher about when your corrected explanations are due. This may be at the end of the class period or at the beginning of the next class. For credit, you must include your original answer sheet with your explanations and sketches.
KH56_INQSE_CH11_p541_588_final.indd · Page 588 · 1/1/07 · 2:30:12 PMKH56_INQSE_CH11_p541_588_final.indd · Page 588 · 1/1/07 · 2:30:12 PM