kiss fx
TRANSCRIPT

8/2/2019 KISS FX
http://slidepdf.com/reader/full/kiss-fx 1/34
Copyright M. Linden

8/2/2019 KISS FX
http://slidepdf.com/reader/full/kiss-fx 2/34
2
Table of Contents
1 KISSFXBREAKOUTSTRATEGY.................... ................ ................... ................. ................... ................. . 3
1.1 FOREWORD ...................................................... ............................................................. .............................................. 3
1.2 INTRODUCTION ......................................................... ............................................................. .................................... 3
2 MAGICOFCOMPOUNDING......................................................................................................................5
3 CHART-SETUP...................... ................. ................... ................. ................... ................ .................. ............. 8
4 TRENDISYOURFRIEND.................. ................. .................. ................. ................... ................. ..............10
5 MARKETPATTERNS ................... ................. ................... ................ ................... ................. ................... .12
5.1 SUPPORT&RESISTANCE ........................................................................................................................................12
5.2 OTHERMARKETPATTERNS ...................................................................................................................................14
5.3 BREAKOUTS ..............................................................................................................................................................16
6 MONEYMANAGEMENT ..........................................................................................................................19
6.1 RISK‐TO‐REWARDRATIO .......................................................................................................................................19
7 HOWTOTRADE? ................... ................. ................... ................. .................. ................. ................... .......22
7.1 ENTRYSTRATEGY ....................................................................................................................................................22
7.2 TRADEMANAGEMENT .............................................................................................................................................25
7.3 EXITSTRATEGY ........................................................................................................................................................27
8 EXAMPLETRADES ................. ................. ................... ................ ................... ................. ................... .......29
9 FINALWORD .................. ................. ................... ................. .................. ................. ................... ................33
10 BOOKRECOMMENDATIONSANDSOURCES .................................................................................34

8/2/2019 KISS FX
http://slidepdf.com/reader/full/kiss-fx 3/34
3
1 KISS FX breakout strategy
This guidebook provides a complete trading strategy for forex intra-day traders. The target
audience of KISS FX breakout strategy is intra-day traders, who find using indicators complex anddifficult. KISS FX breakout strategy is an indicator free trading strategy. Using KISS FX breakout
strategy continuous profits are possible without any mathematical indicators.
The key elements of KISS FX breakout strategy are market patterns and breakouts. Trading
doesn’t have to be complex so the strategy focuses only on the most obvious market patterns,
especially support & resistance. Market patterns are the key for profiting in forex and breakout
trading is one of the simplest modes of trading. The money management rules are also crucial for
succeeding with KISS FX breakout or any other trading strategy.
KISS = Keep it simple stupid
1.1 Foreword
KISS FX breakout strategy can be used by anyone interested in forex market. However, this
guidebook is targeted for intra-day forex traders, who already have the basic knowledge of the
market. Forex School offered by babypips.com is recommended for beginners. The author of this
guidebook is a graduating BBA student, not a professional trader. It is not recommended to go on
a live account without testing the strategy on a demo account at first. The author will not take any
responsibilities in case the strategy doesn’t work for someone. This guidebook is free and it can be
freely forwarded to anyone interested in forex trading. However, it is forbidden to copy this
guidebook without the permission of the author.
1.2 Introduction
KISS FX breakout strategy is concentrated on market patterns and on support & resistance levels
+ breakouts in more specific. Mathematical indicators (such as RSI, MACD or Stochastic) aren’t
needed if one realises the idea of market patterns. Price action itself provides all the information
needed for trading.

8/2/2019 KISS FX
http://slidepdf.com/reader/full/kiss-fx 4/34
4
Some traders believe that to make a successful trade they have to see something from the chart
that no one else is seeing. They couldn’t be more wrong. The idea of market patterns is that a
trader wants to spot the most obvious market patterns that many other traders notice as well. If
many other traders (especially the big players such as banks, hedge funds etc) notice the same
patterns, and predict the price to move to the same direction that you are trading, you will get
profit. This is the reason why a trader should be moving with other traders, not against them.
Remember that losses are part of the game. Even the best traders take losses. Money management
section will explain, how to control the losses so that you will live to trade another day.
ALWAYS RECORD YOUR TRADES BY KEEPING A TRADING LOG. WRITE DOWN
WHY YOU ENTERED A TRADE AND LEARN FROM YOUR MISTAKES!

8/2/2019 KISS FX
http://slidepdf.com/reader/full/kiss-fx 5/34
5
2 Magic of compounding
Before going into details with the trading strategy, everyone should understand the concept of
magic of compounding. To be a successful trader, one doesn’t have to make huge profits right away.Being persistent is what makes the success in forex.
Example 1
Imagine that someone would tell you that he would give you two options to gain money. The first
option would be getting $1 million dollars right away and the second would be getting 1 cent now,
and doubling it every day during a 30 day period. Which one would you choose?
Table 1. Example 1 and magic of compounding described.
Day Deposit Capital
Day 1 1 2 cents
Day 2 2 4 cents
Day 3 4 8 cents
Day 4 8 16 cents
Day 5 16 32 cents
Day 6 32 64 cents
Day 7 64 128 cents
Day 8 128 256 cents
Day 9 256 512 centsDay 10 512 1024 cents
Day 11 1024 2048 cents
Day 12 2048 4096 cents
Day 13 4096 8192 cents
Day 14 8192 16384 cents
Day 15 16384 32768 cents
Day 16 32768 65536 cents
Day 17 65536 131072 cents
Day 18 131072 262144 cents
Day 19 262144 524288 cents
Day 20 524288 1048576 centsDay 21 1048576 2097152 cents
Day 22 2097152 4194304 cents
Day 23 4194304 8388608 cents
Day 24 8388608 16777216 cents
Day 25 16777216 33554432 cents
Day 26 33554432 67108864 cents
Day 27 67108864 134217728 cents
Day 28 134217728 268435456 cents
Day 29 268435456 536870912 cents
Day 30 536870912 1073741824 cents
After 30 days in usd $ 10 737 418

8/2/2019 KISS FX
http://slidepdf.com/reader/full/kiss-fx 6/34
6
Starting with 1 cent and doubling the capital daily during a 30-day period one would end up having
nearly $ 11 million dollars. Currency trading is not for people, who want to get rich quick.
However, tremendous profits can be achieved by being persistent and relying on to magic of
compounding.
Table 2. Magic of compounding explained in terms of forex. A trader starts with an initial deposit
of $ 2500 dollars. He would risk 3% of his capital on every trade placed and trade 16 days per
month. His monthly gain would be 15 %. After every month the trader would withdraw 50 %
from his trading account into his personal account for living expenses. He would obey this money
management during 3 years (36 months).
Month Bank 15 % per month per day 50 %
drawing
1 2 500$ 2 875$ 375$ 23$ 188$
2 2 688$ 3 091$ 403$ 25$ 202$
3 2 889$ 3 322$ 433$ 27$ 217$
4 3 106$ 3 572$ 466$ 29$ 233$
5 3 339$ 3 839$ 501$ 31$ 250$
6 3 589$ 4 127$ 538$ 34$ 269$
7 3 858$ 4 437$ 579$ 36$ 289$
8 4 148$ 4 770$ 622$ 39$ 311$
9 4 459$ 5 127$ 669$ 42$ 334$10 4 793$ 5 512$ 719$ 45$ 359$
11 5 153$ 5 925$ 773$ 48$ 386$
12 5 539$ 6 370$ 831$ 52$ 415$
13 5 954$ 6 848$ 893$ 56$ 447$
14 6 401$ 7 361$ 960$ 60$ 480$
15 6 881$ 7 913$ 1 032$ 65$ 516$
16 7 397$ 8 507$ 1 110$ 69$ 555$
17 7 952$ 9 145$ 1 193$ 75$ 596$
18 8 548$ 9 831$ 1 282$ 80$ 641$
19 9 190$ 10 568$ 1 378$ 86$ 689$
20 9 879$ 11 361$ 1 482$ 93$ 741$
21 10 620$ 12 213$ 1 593$ 100$ 796$
22 11 416$ 13 129$ 1 712$ 107$ 856$
23 12 272$ 14 113$ 1 841$ 115$ 920$
24 13 193$ 15 172$ 1 979$ 124$ 989$
25 14 182$ 16 310$ 2 127$ 133$ 1 064$
26 15 246$ 17 533$ 2 287$ 143$ 1 143$
27 16 389$ 18 848$ 2 458$ 154$ 1 229$
28 17 618$ 20 261$ 2 643$ 165$ 1 321$
29 18 940$ 21 781$ 2 841$ 178$ 1 420$
30 20 360$ 23 414$ 3 054$ 191$ 1 527$
31 21 887$ 25 170$ 3 283$ 205$ 1 642$
32 23 529$ 27 058$ 3 529$ 221$ 1 765$33 25 294$ 29 088$ 3 794$ 237$ 1 897$
8/2/2019 KISS FX
http://slidepdf.com/reader/full/kiss-fx 7/34
7
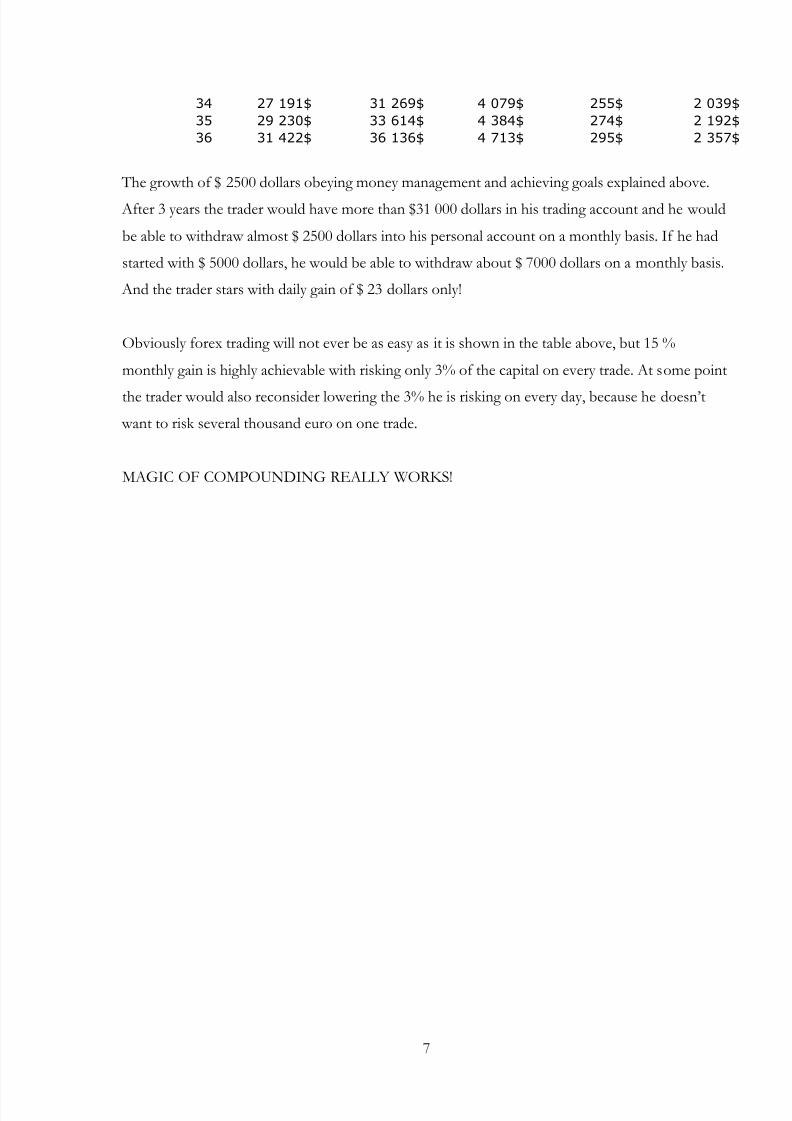
34 27 191$ 31 269$ 4 079$ 255$ 2 039$
35 29 230$ 33 614$ 4 384$ 274$ 2 192$
36 31 422$ 36 136$ 4 713$ 295$ 2 357$
The growth of $ 2500 dollars obeying money management and achieving goals explained above.
After 3 years the trader would have more than $31 000 dollars in his trading account and he would
be able to withdraw almost $ 2500 dollars into his personal account on a monthly basis. If he had
started with $ 5000 dollars, he would be able to withdraw about $ 7000 dollars on a monthly basis.
And the trader stars with daily gain of $ 23 dollars only!
Obviously forex trading will not ever be as easy as it is shown in the table above, but 15 %
monthly gain is highly achievable with risking only 3% of the capital on every trade. At some point
the trader would also reconsider lowering the 3% he is risking on every day, because he doesn’t
want to risk several thousand euro on one trade.
MAGIC OF COMPOUNDING REALLY WORKS!
8/2/2019 KISS FX
http://slidepdf.com/reader/full/kiss-fx 8/34
8
3 Chart-setup
This chapter explains the chart-setup for the KISS FX breakout strategy. It is not required that
everyone’s chart-setup should look exactly the same, but the important thing is that the charts arekept as clear and as understandable to oneself as possible.
KISS FX breakout strategy’s main timeframe 15min. However, one should be aware of the entire
picture (also other timeframes) of the market. This strategy will apply to any other time frame as
well, but 15 min is recommended because of the possibility to small stop losses.
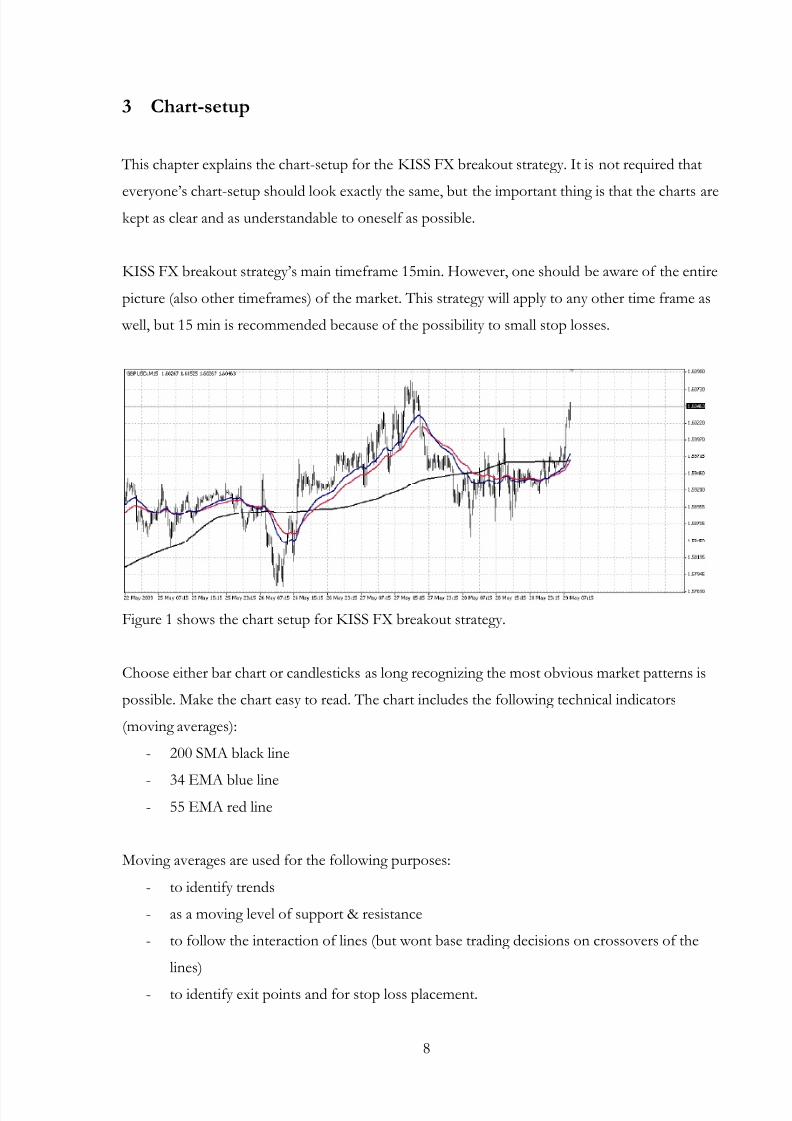
Figure 1 shows the chart setup for KISS FX breakout strategy.
Choose either bar chart or candlesticks as long recognizing the most obvious market patterns is
possible. Make the chart easy to read. The chart includes the following technical indicators
(moving averages):
- 200 SMA black line
-
34 EMA blue line- 55 EMA red line
Moving averages are used for the following purposes:
- to identify trends
- as a moving level of support & resistance
- to follow the interaction of lines (but wont base trading decisions on crossovers of the
lines)
- to identify exit points and for stop loss placement.

8/2/2019 KISS FX
http://slidepdf.com/reader/full/kiss-fx 9/34
9
KISS FX breakout strategy doesn’t use any technical indicators besides moving averages, as they
simply are not needed to make profit in forex. In case someone is interested adding other technical
indicators to their own strategy, the author recommends following indicators: pivot points &
Fibonacci retracement levels (to identify other possible support and resistance lines) and MACD &
volumes (for confirmation of entry and exit signals).
NOTE! The moving average indicators (nor other technical indicators) should never be used alone
as a trading system, because they don’t pay any attention to other market variants like other
participants for example. Technical indicators don’t spot market patterns or support & resistance
lines.

8/2/2019 KISS FX
http://slidepdf.com/reader/full/kiss-fx 10/34
10
4 Trend is your friend
Number one mistake in any financial market is trading against the trend. One should always
recognize the direction of the trend. Ask yourself a question “is the trend going up, down orsideways?” The price moves always in trends and trends are always more likely to continue than
reverse. This means that the odds are on your side, if you trade on the same direction that the
trend is. Prices do make corrective retracement moves, but they will continue their main direction
most likely than reverse.
Simple moving average 200 (SMA 200, the black line) helps identifying the trend. If the trend is
not obvious, the high- and low points of the price action can be marked to price chart. During an
uptrend the price action produces higher highs and higher lows, and during a downtrend lower
highs and lower lows. When there is no clear trend the market is moving sideways. Market doesn’t
produce clear higher lows or lower highs. When using the KISS FX breakout strategy, it is not
recommendable to trade at all during unclear trends.
Figure 2. A nice upward sloping trend in EURUSD currency pair (15min timeframe).
During an uptrend price action produces higher highs and higher lows (marked with a red lines).
200 SMA (black line) is clearly going up.

8/2/2019 KISS FX
http://slidepdf.com/reader/full/kiss-fx 11/34
11
Figure 3. A downward sloping trend in EURUSD currency pair (15min timeframe).
During downtrend price action produces lower highs and lower lows (marked with a red lines).
200 SMA (black line) is going down.
Figure 4. An unclear trend with sideways movement.
Without a clear trend trading is not recommendable because it is more difficult.
ALWAYS WAIT FOR A CLEAR TREND AND NEVER TRADE AGAINST IT!

8/2/2019 KISS FX
http://slidepdf.com/reader/full/kiss-fx 12/34
12
5 Market patterns
Market patterns are key elements for KISS FX breakout strategy. Instead of technical indicators,
the entire “trading-system” is based on market patterns. Trader using market patterns will have apossibility to keep the charts simple and look for the same things than the big players (banks,
hedge funds etc) are looking for from their price charts. If trader moves on the same direction
with big players he will most likely win than lose. Market patterns are formed over and over again
in charts hence they create many trading possibilities.
5.1 Support & resistance
Support & Resistance are the base for market patterns. Most of the readers are probably already
familiar with the concept of support & resistance, but here is the idea:
The market forms high and low points of the price action to the price chart. High points are
points, where the price refuses to go any higher. Low points are points, where price refuses to go
any lower. Depending on the trend (up, down or sideways) points will be formed either upward
sloping, downward sloping or vertically. Traders can draw lines between these points on their
trading platforms. These points are formed in price charts every day. However, notice that the
contact points don’t always have to be 100 % perfect. The sizes and durations of support and
resistance lines are always different.
Sometimes traders can draw only a support line, sometimes only a resistance line. Sometimes the
price action forms a channel-pattern, where both support and resistance lines are represented. An
interesting thing about support and resistance lines is also the fact that previous support usually
becomes resistance and vice versa.
When price reaches the line (support or resistance) it will either bounce back to the opposite
direction or break out through the line.

8/2/2019 KISS FX
http://slidepdf.com/reader/full/kiss-fx 13/34
13
Figure 5. shows two red lines representing support and resistance lines.
The price hits support at least 6 times and resistance at least 5 times in this example. Finally the
resistance line is broken and the price continues going upwards.
Figure 6. An example of support & resistance lines.
This time the lines formed a clear channel pattern, which was eventually broken with a big move
upwards.

8/2/2019 KISS FX
http://slidepdf.com/reader/full/kiss-fx 14/34
14
Figure 7. A resistance line and also the concept of previous resistance becoming support (red
circle).
A trader doesn’t always have to draw both support and resistance line. Notice how price bounces
back down always after hitting the resistance line before the breakout.
Figure 8. An example of moving averages (EMA 34 and EMA 55) acting as a moving support line.
TRY SEARCHING SUPPORT AND RESISTANCE LINES FROM YOUR OWN PRICE
CHARTS!
5.2 Other market patterns
KISS FX breakout strategy is mainly concentrated on support and resistance lines and channels.
However, there are also other market patterns that are worth of taking a look.

8/2/2019 KISS FX
http://slidepdf.com/reader/full/kiss-fx 15/34
15
Figures 9&10. Examples of triangle patterns.
Triangle patterns are also channel patterns, but they form a triangle on the other end.
Figure 11. A flag pattern with a flagpole.
Flag is also a channel pattern. This time the flag patterns is downwards, but there clearly is a
flagpole, the flag and finally a breakout from the flag. Flag patterns usually include a profit target,
as the breakout is often as long as the flagpole.

8/2/2019 KISS FX
http://slidepdf.com/reader/full/kiss-fx 16/34
16
Figure 12. A double top. Double tops form a nice vertical resistance line.
Figure 13. A double bottom. Double bottoms are obvious support lines.
5.3 Breakouts
The easiest way to base trade market patterns is to wait for breakouts. One can also trade the
bounces off the support and resistance lines, but KISS FX breakout strategy trades only breakouts.
Breakouts occur often enough to give a trader continuous profits in the market.
The price action, where the price forces itself out from a pattern (support or resistance line), iscalled a breakout. These breakouts occur in every currency pair and on every timeframe on a daily
basis. It is recommended to leave old support and resistance lines in place, as previous support
often becomes resistance, as explained earlier. These lines can help in stop loss determining.
For breakout traders it is important to have a strategy for breakout confirmation, as false
breakouts occur every now and then. Breakout confirmation is explained later on in this
guidebook.

8/2/2019 KISS FX
http://slidepdf.com/reader/full/kiss-fx 17/34
17
Figure 14. A breakout of a resistance line.
This figure is also a perfect example of how previous resistance becomes support as the price hits
the previous resistance line at first after breaking through it.
Figure 15. A false breakout and a breakout of moving averages (red circles).
The blue circle shows a false breakout. Two red circles represent breakouts of moving averages
(first the prices go through 34 and 55 EMA´s, and in the second circle the price crosses 200SMA).

8/2/2019 KISS FX
http://slidepdf.com/reader/full/kiss-fx 18/34
18
Figure 16. A double top (resistance line) and a support line.
These lines together form a triangular channel. The price breaks through the resistance line on the
third time, when price reaches the resistance line (double top).

8/2/2019 KISS FX
http://slidepdf.com/reader/full/kiss-fx 19/34
19
6 Money management
Apart from what many beginners think, in forex money management is far more important than a
good entry point. Money management is the biggest single factor for successful forex trading. Thisfact cannot be stressed too much. This chapter provides money management rules for KISS FX
breakout strategy.
MONEY MANAGEMENT IS WHAT ENSURES YOUR CONTINUOUS PROFITS AND
MAKES SURE THAT YOU WILL LIVE TO TRADE ANOTHER DAY!
6.1 Risk-to-reward ratio
All the upcoming calculations are based on the following situations:
- Capital $ 5000 dollars
- Traded currency pair EURUSD (pip value 10 USD, standard lot size 100 000) (Pip value is
different in different currency pairs)
- Used risk percentage per trade 3 %
- Used stop loss +- 30 pips
- Leverage 1:100
- Timeframe used 15 min
1. Determine the risk
At first, let’s determine how much we are willing to risk from our total capital to a single trade. It is
recommended to risk 1-3% of capital on a single trade. KISS FX breakout strategy uses the risk
percentage of 3%.
Let’s calculate the amount at risk we are willing to put on a stake on every trade ( Account balance X
Risk percentage=Amount at risk ):
5000 x 0,03 = 150. $ 150 dollars is the risk of every trade.

8/2/2019 KISS FX
http://slidepdf.com/reader/full/kiss-fx 20/34
20
2. Determine the trade size
To determine the trade size, we can afford to take (so that they risk wont get too big) we need to
determine where to put the stop loss. KISS FX break out strategy uses stop losses of about 30 pips
depending on the market pattern. The pip value must also be known to be able to figure out, how
much money we will lose with every pip (if the trade goes against us). A pip value on EURUSD
currency pair is $ 10 dollars.
http://www.goforex.net/pip-calculator.htmis recommended for calculating pip values.
Let’s calculate the trade size Amount at risk / (pips at risk X value per pip) = number of contracts :
150 / (30x10) = 0,50. The lot size we can afford with the capital of $ 5000 dollars is ½ lot. This
means that we are not buying complete lots (and when trading, the pip value will be only 5 dollars
per pip)
As the lot size is ½, every pip we win or lose will be worth of $ 5 dollars. If we place the stop loss
to 30 pips, we will risk $ 150 dollars. Take profit will be put to 30 pips as well. If the trade goes in
our favour, we will win $ 150 dollars. Hence the risk-to-reward ratio is 1:1. This means that 50 %of the trades we make have to be correct to break even. No one does trading just for sake of for
breaking even, the meaning is to make money. Using KISS FX breakout strategy it is possible to
achieve at least 70%-80% win rate.
The stop loss placement varies according to the market pattern our trading decision is based on.
Sometimes you have to use bigger stop loss, but try to achieve 30 pips or smaller stop losses.
BY PLACING STOPP LOSSES ACCORDING TO THE MONEY MANAGEMENT RULES,
YOU WILL ALWAYS ENSURE THE ABILITY TO TRADE ALSO TOMORROW. THIS IS
IMPORTANT BECAUSE YOUR WINNING RATE WILL NOT EVER BE 100%.
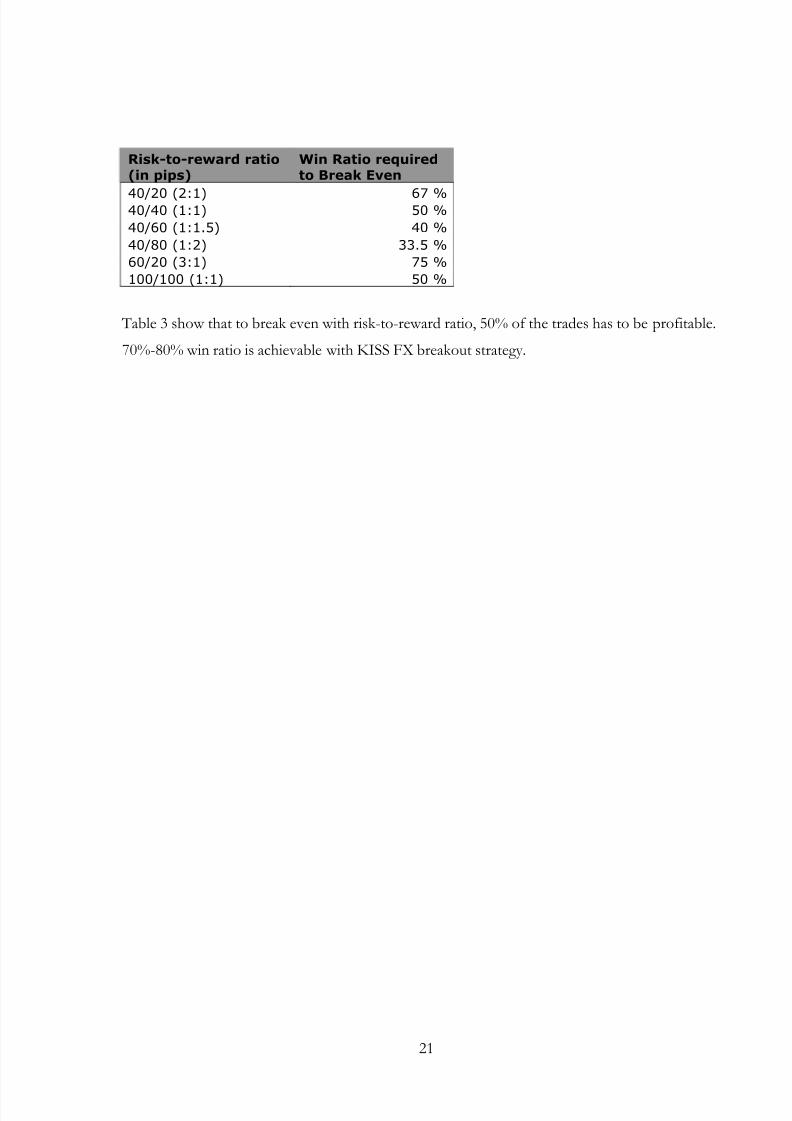
Table 3. Examples of risk-to-reward ratios, and how often a trader should be correct in his
analysis.
8/2/2019 KISS FX
http://slidepdf.com/reader/full/kiss-fx 21/34
21
Risk-to-reward ratio(in pips)
Win Ratio requiredto Break Even
40/20 (2:1) 67 %40/40 (1:1) 50 %
40/60 (1:1.5) 40 %
40/80 (1:2) 33.5 %
60/20 (3:1) 75 %
100/100 (1:1) 50 %
Table 3 show that to break even with risk-to-reward ratio, 50% of the trades has to be profitable.
70%-80% win ratio is achievable with KISS FX breakout strategy.

8/2/2019 KISS FX
http://slidepdf.com/reader/full/kiss-fx 22/34
22
7 How to trade?
This chapter describes entry-, exit- and trade management strategies for KISS FX breakout
strategy. Before considering a trade, a technical trader must be aware of the upcoming newsreleases. The author recommends www.forexfactory.com for following upcoming news releases.
BE CAREFUL ENTERING TRADES BEFORE IMPORTANT NEWS RELEASES, AS THE
PRICE CAN EASILY CHANGE THE DIRECTION BECAUSE OF ECONOMIC NEWS!
This trading strategy applies to any currency pair. However, it is recommended to trade major
currency pairs with low spreads. For the sake of simplicity it is recommended to concentrate only
on two or three currency pairs simultaneously. If one tries to follow all the currency pairs available,
the process of trading will be a total mess. Don’t worry about losing trading chances because of
not following all currency pairs available. Two or even one currency pair will provide enough
trading changes to make continuous profits in forex. Remember that A loss of chance is better than a
loss of capital.
7.1 Entry strategy
To enter a position one must a have a good reason for it. It is not wise to trade just for the sake of
trading. Entering a position without a good reason is called overtrading, which is one of the main
reasons why many beginners in forex fail. They get too confident and trade “because the last trade
was a winning trade as well”.
Before a trade can be opened pay attention to the points below:
1. What is the trend? (What is the direction of moving averages? Is the market producing
higher highs and higher lows or lower highs and lower lows? What is the direction the
price is most likely going to go?)
2. Is the price above or below the moving averages? (Don’t sell if the price is above moving
averages, don’t buy if the price is below moving averages).
3. LOOK FOR THE MOST OBVIOUS PATTERNS! Are there clear support and
resistance lines or market patterns (channels, triangles, flags etc) with many contact points?
8/2/2019 KISS FX
http://slidepdf.com/reader/full/kiss-fx 23/34
23
For clarity, check also bigger picture from other timeframes to be sure that there are no
support or resistance lines you cannot see from the timeframe used.
4. WAIT FOR A BREAKOUT!
5. WAIT FOR BREAKOUT CONFIRMATION! When a price bar closes above/below
support or resistance line, wait for confirmation of price closing outside the support- or
resistance line and going 3 pips above/below the previous high- or low point.
RULES FOR ENTERING A TRADE
BUY
- Trend is upwards
- Price is above moving averages
- It is also preferable that shorter moving averages (34 & 55 EMAS) are above the 200 SMA
- There is are clear resistance line
- Breakout upwards is about to take place
- BREAKOUT CONFIRMATION: Price closes above the resistance line. After a closed
bar, the price must go 3 pips above the previous high point.
SELL- Trend is downwards
- Price is below moving averages
- It is also preferable that shorter moving averages (34 & 55 EMAS) are below the 200 SMA
- There is a clear support line
- Breakout downwards is about to take place
- BREAKOUT CONFIRMATION: Price closes below the support line. After a closed bar,
the price must go 3 pips below the previous low point.

8/2/2019 KISS FX
http://slidepdf.com/reader/full/kiss-fx 24/34
24
Figure 17. Factors to take into account before a trade can be taken.

8/2/2019 KISS FX
http://slidepdf.com/reader/full/kiss-fx 25/34
25
Figure 18. The confirmation of a breakout.
When the bar closes above the resistance line (red circle), we enter 3 pips above the high point (red
line).
Figure 19. An example of a confirmed breakout.
The bar closes above resistance line and we would have entered 3 pips above the high point.
7.2 Trade management
Determine stop loss- and take profit points before a trade is opened. As the aimed risk-to-reward
is 1:1 the stop loss and take profits are set to similar pips distances. KISS FX breakout strategy
uses about 30 pips stop loss and take profits (conservative traders can set their profit targets toeven 10 or 20 pips).

8/2/2019 KISS FX
http://slidepdf.com/reader/full/kiss-fx 26/34
26
The stop loss and take profits will not always be the mentioned 30 pips. If a breakout from a
resistance line occurs, a good stop loss point is right below the broken resistance line (because
previous resistance becomes support). If a breakout of a support line occurs, stop loss would be
placed above the broken support line (because previous support becomes resistance).
REMEMBER TO KEEP YOUR PROFIT TARGETS SIMILAR TO STOP LOSSES!
Figure 20. A possible trade on EURUSD.
We would have entered 3 pips below the previous high after confirmed breakout (the white area
between red and blue box). The stop loss would have been right below the broken resistance line
(about 33 pips) and the profit target at the top of the blue box (about 34 pips).
Minimize the losses and let your profits run. The first part means using stop losses ALWAYS and the
second part means exiting positions partly after profit target has been reached. Lets say we
determine stop loss- and take profit-points. They will both be 30 pips (according to risk-to-rewardratio). Once we are following the trade it finally reaches the 30 pips we wanted. At that point we
close only 80 % of the trade, move the stop loss to break-even and let the 20% run until we get an
exit signal. These remaining 20 % can bring massive gains, but don’t forget to move the stop loss
point so that the trade wont go against you. In case the trade continues gaining pips, move the
stop loss further and ensure profits. (For example after every 40 pips of gain). This kind of exit
strategy is called partial exits .

8/2/2019 KISS FX
http://slidepdf.com/reader/full/kiss-fx 27/34
27
NOTE! WHILE YOU MOVE YOUR STOP LOSS, PLEASE MAKE SURE THAT THE
PRICE HAS ENOUGH ROOM FOR MOVEMENTS!
Example 2
You go long (buy) in EURUSD at 1.4000. Stop loss and profit target are 30 pips away, so SL
1.3970 & TP 1.4030. When the price reaches 1.4030 exit 80 % of the position and take profits.
Then move the stop loss to break-even 1.4000. 20 % of the position is still running as the price
reaches 1.4080 (your 20% has gained 80 pips). At this point you want to take some profits so you
move your stop loss to 1.4040, that ensures 40 pip gain for the 20% as well. As the price goes
further up, keep moving the stop loss after every 40 pips of gain, until you see an exit signal.
7.3 Exit strategy
As mentioned already in previous chapter, KISS FX breakout strategy uses partial exits to ensure
gained profits. Set profit target for the bigger part of the trade (80%). Set the profit target to 10-30
pips depending on personal willingness to risk and risk-to-reward ratio.
As the magic of compounding chapter shows, even 10 pips per day can make massive gains in the
long run. Exit the 80 % after the profit target is reached. Move the stop loss according to money management rules. Exit the 20 % from the trade, when 34 EMA rolls over.
Figure 21. An example of a good trade entry, trade management and exit.
We entered 3 pips after a confirmed breakout and set the stop loss 5 pips below the resistance line
(about 40 pips because the first above resistance line closed bar was quite long). Then we set our

8/2/2019 KISS FX
http://slidepdf.com/reader/full/kiss-fx 28/34
28
profit target to 30 pips (Note that risk-to-reward ratio of 1:1 is not completely reached). The profit
target was soon reached and we exited the 80 % of the trade. The 20 % of the trade was running
until the 34 EMA turned downwards. (Note that if we would have moved stop loss, the 20% of
our position would have been stopped out soon after profit target was reached).
8/2/2019 KISS FX
http://slidepdf.com/reader/full/kiss-fx 29/34
29
8 Example trades
Look carefully at the examples shown below. There are examples of good and bad trades. These
examples are not live examples, but the meaning is to give the reader a clear picture of the thingsto look for before entering a trade.
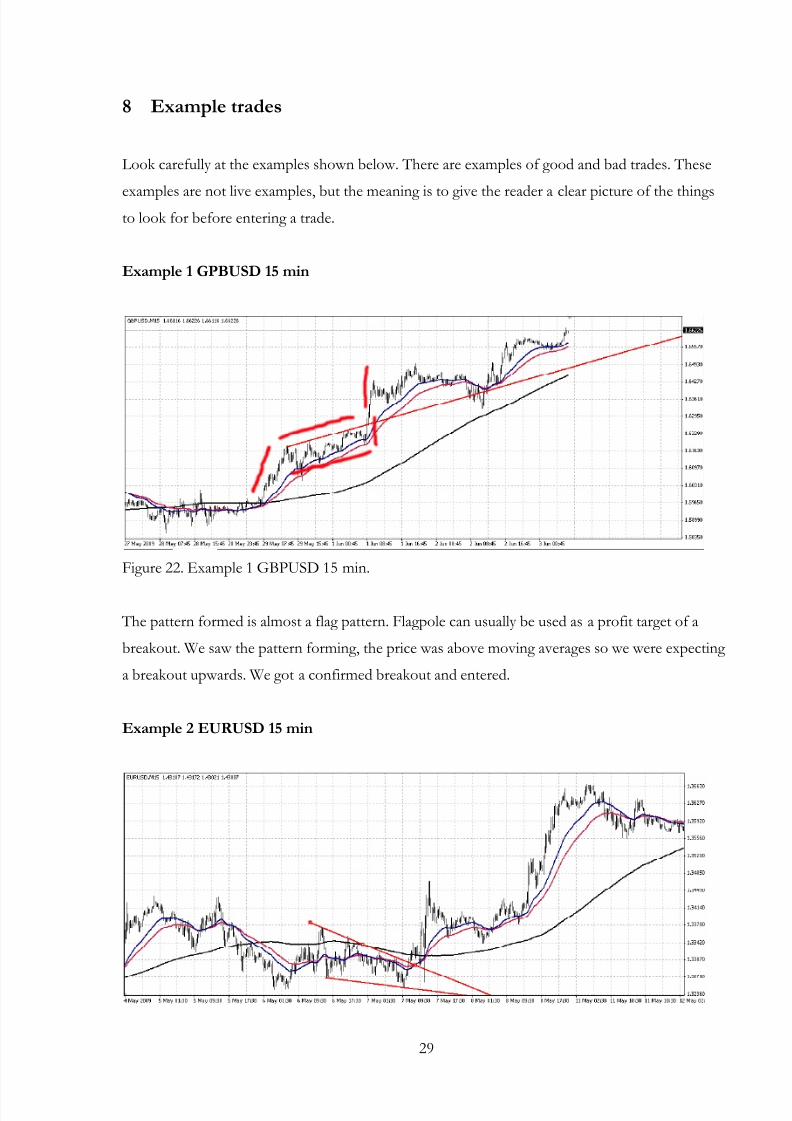
Example 1 GPBUSD 15 min
Figure 22. Example 1 GBPUSD 15 min.
The pattern formed is almost a flag pattern. Flagpole can usually be used as a profit target of a
breakout. We saw the pattern forming, the price was above moving averages so we were expecting
a breakout upwards. We got a confirmed breakout and entered.
Example 2 EURUSD 15 min
8/2/2019 KISS FX
http://slidepdf.com/reader/full/kiss-fx 30/34
30
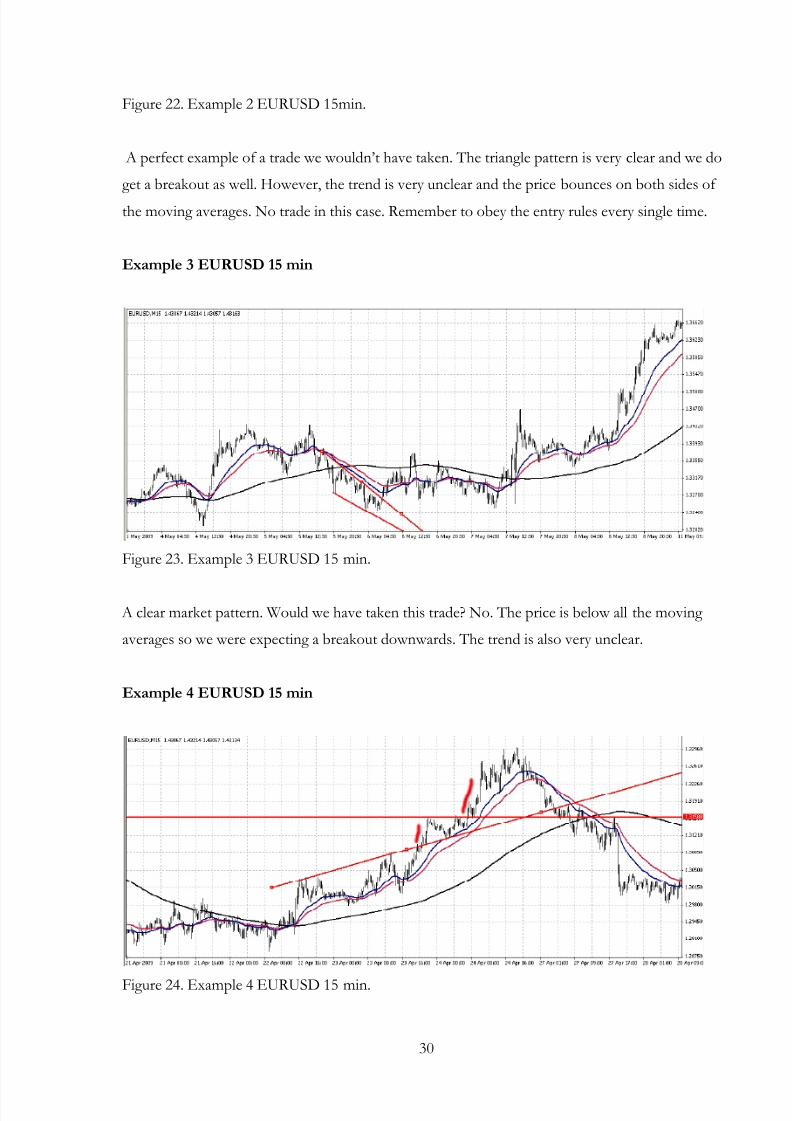
Figure 22. Example 2 EURUSD 15min.
A perfect example of a trade we wouldn’t have taken. The triangle pattern is very clear and we do
get a breakout as well. However, the trend is very unclear and the price bounces on both sides of
the moving averages. No trade in this case. Remember to obey the entry rules every single time.
Example 3 EURUSD 15 min
Figure 23. Example 3 EURUSD 15 min.
A clear market pattern. Would we have taken this trade? No. The price is below all the moving
averages so we were expecting a breakout downwards. The trend is also very unclear.
Example 4 EURUSD 15 min
Figure 24. Example 4 EURUSD 15 min.

8/2/2019 KISS FX
http://slidepdf.com/reader/full/kiss-fx 31/34
31
A perfect example of support & resistance + a breakout trade. We can actually spot two breakout
trades from this figure. The first breakout occurred and we made profits. We left the old resistance
line in place and eventually the price came back down and found support from the old resistance
line. Then the price formed a double top before a breakout and we made profits from the second
breakout too.
Example 5 EURUSD 15 min
Figure 25. Example 5 EURUSD 15 min.
A nice descending channel. The moving averages are also acting as a sloping resistance line. The
prices were nicely below all the moving averages. However, the breakout occurred upwards so we
didn’t enter, as we were expecting a downward breakout.

8/2/2019 KISS FX
http://slidepdf.com/reader/full/kiss-fx 32/34
32
Example 6 EURUSD 15 min
Figure 26. Example 6 EURUSD 15 min.
A very obvious uptrend with many market patterns. Trading can be easy, when an uptrend like this
is found. This particular example included four very obvious breakout trade possibilities during 3
days.

8/2/2019 KISS FX
http://slidepdf.com/reader/full/kiss-fx 33/34
33
9 Final word
The trading method described above can be a highly profitable method in forex. Remember to
obey the rules given and be patient. Don’t worry about losses, because every trader will face alsolosses. Winning trades will follow losers if one sticks persistent and relies on the strategy. Just cut
your losses short and wait for the next winning trade. Remember to follow the money
management rules so the trading is possible the next day.
Special thanks to Pipthefx.com forex community forex course!
Enjoy and happy pipping!

8/2/2019 KISS FX
http://slidepdf.com/reader/full/kiss-fx 34/34
10 Book recommendations and sources
The author recommends following books for everyone interested in forex. These books have also
been used as sources of this strategy.
Tim Knight. 2007. Chart Your Way to Profits. John Wiley & Sons Inc, Hoboken, New Jersey.
James Dicks. 2004. Forex Made Easy: 6 Ways to Trade the Dollar. The McGraw-Hill Companies,
Columbus.
John Jagerson & S. Wade Hansen. 2006. Profiting With Forex: The Most Effective Tools and
Techniques for Trading Currencies. The McGraw-Hill Companies, Columbus.
Louis B. Mendelshon. 2006. Forex Trading Using Intermarket Analysis. Market Technologies,
LLC, Columbus.