kingsun lee 1department of mechanical engineering ... · 1department of mechanical engineering,...
TRANSCRIPT

OPTIMIZATION OF INJECTION MOLDING PARAMETERS FOR LED LAMPSHADE
Kingsun Lee1 and Jui-Chang Lin21Department of Mechanical Engineering, ChienKuo Technology University, 500 Changhua, Taiwan
2Department of Mechanical Design Engineering, National Formosa University, 632 Huwei, Yunlin, TaiwanE-mail: [email protected]; [email protected]
ICETI 2012-J1147_SCINo. 13-CSME-70, E.I.C. Accession 3528
ABSTRACTThe unibody of LED (light-emitting diodes) lampshades is fabricated by injection mold; the forming tech-nique is complicated, especially for multi-cavity molds. This study applies a finite element analysis toexplore the influences of the shrinkage of LED lampshades. The effect of selected injection parametersand their levels on shrinkage size, and the subsequent design of experiments were accomplished using theTaguchi method. The results were confirmed by experiments, which indicated that the selected injectionparameters effectively reduce the shrinkage. The error between optimal estimated value and verified valueis within 3.82%.
Keywords: micro injection; LED lampshade; shrinkage; Taguchi method.
OPTIMISATION DES PARAMÈTRES DE MOULAGEPAR INJECTION POUR ABAT-JOURS LED
RÉSUMÉLes abat-jours monocoques LED (diode électroluminescente) sont fabriqués par moule à injection ; la tech-niques de préforme est compliquée, surtout pour les moules à cavités multiples. La présente recherches’intéresse à l’application de la méthode d’analyse des éléments finis pour explorer les influences des ré-trécissements sur l’abat-jour LED. L’effet des paramètres d’injection sélectionnés et le niveau d’ampleurdu rétrécissement, ainsi que la conception subséquente des expériences ont été accomplis selon la méthodeTaguchi. Les résultats ont été confirmés par des expériences, lesquelles ont indiqué que les paramètres d’in-jection sélectionnés réduisent efficacement le rétrécissement. L’erreur entre la valeur optimale estimée et lavaleur vérifiée est en dedans de 3.8%.
Mots-clés : micro-injection ; abat-jour LED ; retrait ; méthode Taguchi.
313Transactions of the Canadian Society for Mechanical Engineering, Vol. 37, No. 3, 2013
1. INTRODUCTION
Injection molding is one of important process in the industry; it possesses high production rate, shortermolding cycle, low waste rate, smooth surface and complicated shape. Many defects resulted in poor qualityof products, such as short shots, shrinkage, warpage and residual stress during injection molding process.Faced with increasing complexity of product design and the high requirement of quality in injection moldingindustry, using the trial-and-error approach to determine the process parameters for injection molding is nota smart way. Good mold design and optimal process parameters are the key influences of productivity,quality, and cost of production.
The process of injection molding can be divided into three stages: (1) during the filling stage, the mouldcavity is filled with molten plastic fluid under high pressure; (2) after the mold cavity is completely filled,it is necessary to deliver more plastic fluid for compensation of shrinkage of plastic, ensuring the cavity isproperly filled; and (3) cooling and removing of the products.
The Newton fluid model is the simplest filling model. Richardson [1] was the first to propose the compre-hensive and detailed concept in flow filling. The major concept was based on the relationship of lubricationtheory. The 3D flow theory was simplified to a 2D Hele–Shaw flow theory. For sufficiently simple initialdomains D0 these allow the problem to be reduced to the solution of a finite system of algebraic equations.For more complex initial domains an approximation scheme leads to a similar system of equations to besolved.
In fact, Bird [2, 3] assumed that the plastic material was a Newton fluid, and observed a Newton fluidmodel flow in the mold cavity. He speculated and derived mold flow theory based on this fact. When theshape of the mold is complicated and varies in thickness, then the equation becomes non-linear and we’reunable to analyze. Thus, finite difference and numerical method should be used to solve the problems [4,5]. Because the polymer was viscoelastic properties of fluid, it is an optimal tool to utilize viscoelasticformula to solve the problem of fluidity. Goyal et al. [6] used the White–Metzner viscoelastic modelto simulate flowing conditions of disk mold center pouring. When Goyal solved these governing equationsusing the finite difference method, he found that the influence of viscoelastic makes no change to temperaturedistribution, but that it imposed a significant impact to the stress range. Assuming it is viscoelastic fluidmodel, the popular Generalized Newtonian Fluid (GNF) model was generally used to simulate the flowingactivity. Thus, the finite difference and GNF model are very suitable for numerical simulation; the simulatedresults are very close to the actual conditions.
Jansen et al. [7] systematically analyzed shrinkage effects of injection parameters in seven types of thermoplastic materials (PC, PS, ABS, HIPS, PBT 1505, PBT 3235, HDPE). It turned out that the holding pressurewas the key parameter. The effect of the melt temperature is slightly less important. Injection speed and themold temperature have relatively small effects.
Chang [8] systematically researched shrinkage conditions of three plastic materials (HPDE, GPS, ABS)in the injection process using the Taguchi Method. He found that mold temperatures, melt temperatures,holding pressure, and holding time have the most effects on these three materials. The optimal conditionsfor reducing shrinkage identified by the Taguchi method are experimentally verified and validated by t-statistic tests.
Huang and Tai [9] studied factors affecting the warpage of thin-shell injection parts using the C-Mold andthe Taguchi methods. The results showed that the holding pressure has the most effect, followed by moldtemperatures, melt temperatures, and holding time. In addition, applying the experimental design of Taguchimethod is a quite effective method to deduce the optimum set of effective factors in injection molding toproduce plastic parts with minimum warpage.
Hsu [10] used the Moldflow software to conduct a simulation analysis on aspheric lenses. In addition,the Taguchi Method was used to find the effect of molding conditions to the shrinkage of aspheric lenses.
314 Transactions of the Canadian Society for Mechanical Engineering, Vol. 37, No. 3, 2013
The results indicated that holding pressure, filling duration, and gate size have significant effects on thevolumetric shrinkage rate. Multi-step holding pressure and a slower flow rate were found to be helpful inreducing the rate of volumetric shrinkage.
Chen et al. [11] proposed a LED lens design optimization system using Taguchi methods, and the Back-Propagation Neural Network (BPNN) was used to establish the LED lens quality predictor to predict theviewing angle and luminance uniformity in different overall sizes. The Genetic Algorithm (GA) with thequality predictor was used to find out the optimum design parameter combination of overall size accordingto the required quality objective. A LED optical lens with a 135◦ FWHM angle and a 93.35% uniformitywas designed by this approach.
Liu [12] used FEM to analyze the LED lamp heat sink, the length, width and numbers of the heat sink finsbeing design variables, and the maximum junction temperature of LED being the objective function. Theresults show that the conditions of the LED chip junction temperature do not exceed 60◦, and the heat sinkstructure optimized values were the following: fin length is 62.5 mm, fin width is 1 mm, and the number offins is 20.
Numerical simulations are very important tools in science and engineering for the analysis of mold flow-ing; the Taguchi method is very popular for solving optimization. Therefore, this study applies finite elementanalysis to explore the influences of the shrinkage of LED lampshade. The 3D model is built to simulateinjection conditions, the effect of selected injection parameters and their levels on shrinkage size, and thesubsequent design of experiments were accomplished using the Taguchi technique. A statistical analysis ofvariance (ANOVA) is employed to indicate the impact of injection parameters on shrinkage. The results canbe used in industrial applications to produce high quality of LED lampshade.
2. THEORY
2.1. Governing EquationsThis study assumed that the plastic was an inelastic non-Newtonian fluid in the melting state. Its viscositycould be described as a power-law fluid. It was also assumed that the plastic was very thin (with a thicknessto length/width ratio of < 1 : 10). Compressible GHS (Generalized Hele–Shaw) was used to describe plasticflow.
The 3D flow activity inside the mold can be described by the following conservation equation:
∂ρ
∂ t+∇ ·ρu = 0, (1)
−∇P−∇ · (µγ) = 0, (2)
ρ∂ui
∂ t=− ∂P
∂xi+
[3
∑j=1
∂τ ji
∂x j
], (3)
ρCp
[∂T∂ t
+u ·∇T]= ∇(k∇T )+ηγ
2, (4)
ρCp∂T∂ t
= k∇2T, (5)
where ρ is density, u is velocity vector, T is temperature, t is time, p is pressure, τ is shear stress, µ isviscosity, k is thermal conductivity coefficient, Cp is specific heat, γ is shear rate.
Equations (1–5) represent the simplified governing equations to the modeling of the mold-flow processes.The homogenous mold temperature and the sequence of filling following the optimized injection moldingdesigns will affect the shrinkage of the molded product.
315Transactions of the Canadian Society for Mechanical Engineering, Vol. 37, No. 3, 2013
Table 1. Control factors and levels.Factors Level 1 Level 2 Level 3 Level 4A: Mold temperature (◦C) 110 115 120 125B: Melt temperature (◦C) 270 280 290 300C: Pack pressure (kg/cm2) 60 80 100 120D: Pack time (sec) 1 2 3 4E: Cooling time (sec) 90 100 110 120
2.2. Taguchi MethodThe Taguchi method was created by Genichi Taguchi in 1949. It is an engineering methodology for obtainingthe relationship between products and manufacturing process.
The Taguchi method is an important tool for robust design, combining experimental design theory andthe concept of quality loss function. It offers a simple and systematic approach to optimize performancedesign, quality and cost [13–15]. Taguchi’s approach is based on statistical design of experiments, whichfulfills the requirements to solve engineering problems and enhance process optimization. Taguchi suggestsanalyzing variation using an appropriately chosen signal-to-noise ratio (S/N). These S/N ratios are derivedfrom the quadratic loss function. The Taguchi analysis of the S/N ratio involves three kinds of qualitycharacteristic, including the-nominal-the-better, the-smaller-the-better, and the-larger-the-better. To obtainoptimal molding performance, the-smaller-the-better quality characteristic for shrinkage must be taken; itcan be expressed as
SN
=−10log
(1n
n
∑i=1
y2i
), (6)
where yi is the observed data. Regardless of the category, n is the number of tests in a trial, a greater S/Nratio corresponds to a better performance. The level of a factor with the highest signal-to-noise ratio is theoptimum level [16].
2.2.1. Experimental designThe Taguchi method uses a practical design of orthogonal arrays and a relatively small number of ex-periments to find one set of optimization. This experiment involved five factors: melt temperature, moldtemperature, pack time, pack pressure and the cooling time. Each factor was used at four levels. Table 1lists the experimental factors and levels.
The Taguchi method experiments were used to investigate the relationship between injection process-ing parameters and shrinkage in this study. Table 2 lists the orthogonal array; each experiment has sevenexperimental data, and the S/N ratio is calculated using Eq. (6).
3. SIMULATION AND ANALYSIS
The material used in this experiment is polycarbonate (PC) resin from CHI MEI Co. (Taiwan). The me-chanical properties of PC resin are listed in Table 3. Modex 3D professional analytic software is applied inmold flow analysis, the analytic mesh model is shown in Fig. 1.
Optimum design of a gate and balanced runner system is necessary for injection molds, so that meltedplastic flowing conditions are the same or very similar during filling phase. The dimensions of runners arevery important for filling the cavity with melted plastic of enough high temperature and pressure. The gateposition also plays a key role because it influences the location of weld lines in a product and it should bedesigned carefully to obtain a good quality of the products.
316 Transactions of the Canadian Society for Mechanical Engineering, Vol. 37, No. 3, 2013
Table 2. Orthogonal array L16 (45).Set No. Control factors S/N
A B C D E1 1 1 1 1 1 1.62 1 2 2 2 2 7.563 1 3 3 3 3 –3.944 1 4 4 4 4 –5.365 2 1 2 3 4 3.256 2 2 1 4 3 9.167 2 3 4 1 2 –3.528 2 4 3 2 1 –4.789 3 1 3 4 2 5.6810 3 2 4 3 1 8.8311 3 3 1 2 4 –2.6212 3 4 2 1 3 1.1813 4 1 4 2 3 10.5714 4 2 3 1 4 7.4215 4 3 2 4 1 –1.2816 4 4 1 3 2 –0.83
Table 3. Mechanical properties of PC resin.Specifications Units ValuesTensile strength kg/cm2 630Bending strength kg/cm2 920IZOD impact strength kg-cm/cm 87Melt temperature ◦C 150Melt flow rate g/10 min 10.0
The LED lampshade was an injection molded part with a thick shell. It was easily affected by coldmold wall and led to heat loss, and consequently short shots were occurred. Therefore, the main factors ofshort shots were subject to mold temperature and plastic temperature. The mold had to maintain a uniformtemperature in the range of 110 to 130◦C by using hot oil through the mold to prevent short shots.
The packing pressure directly affected the shrinkage of plastic after filling phase. The results of shrinkagedistribution indicated that large shrinkage was presented on the far area of the gate while packing pressurewas small, packing pressure can be considered as one of significant influencing factors for the shrinkage ofthe plastic.
The analytical results of shrinkage, temperature, deflection and residual stress are shown in Figures 2–5;an unbalanced cooling process will result in deflection, residual stress and shrinkage of plastic parts.
4. RESULT AND DISCUSSION
4.1. Optimal Parameters CombinationThis study attempts to investigate the flowing conditions of the melted polymer using mold flow analysissoftware and Taguchi method. The simulation results of injection molding show that numerous factorsaffect the shrinkage, warpage and shear stress in molding process, such as mold design, product design,molding processing and the characteristic of the material and so on. Especially, the melt, solidification,crystal molecules orientation and residual stress of the material are shown to have a significant effect onwarpage and shrinkage.
317Transactions of the Canadian Society for Mechanical Engineering, Vol. 37, No. 3, 2013
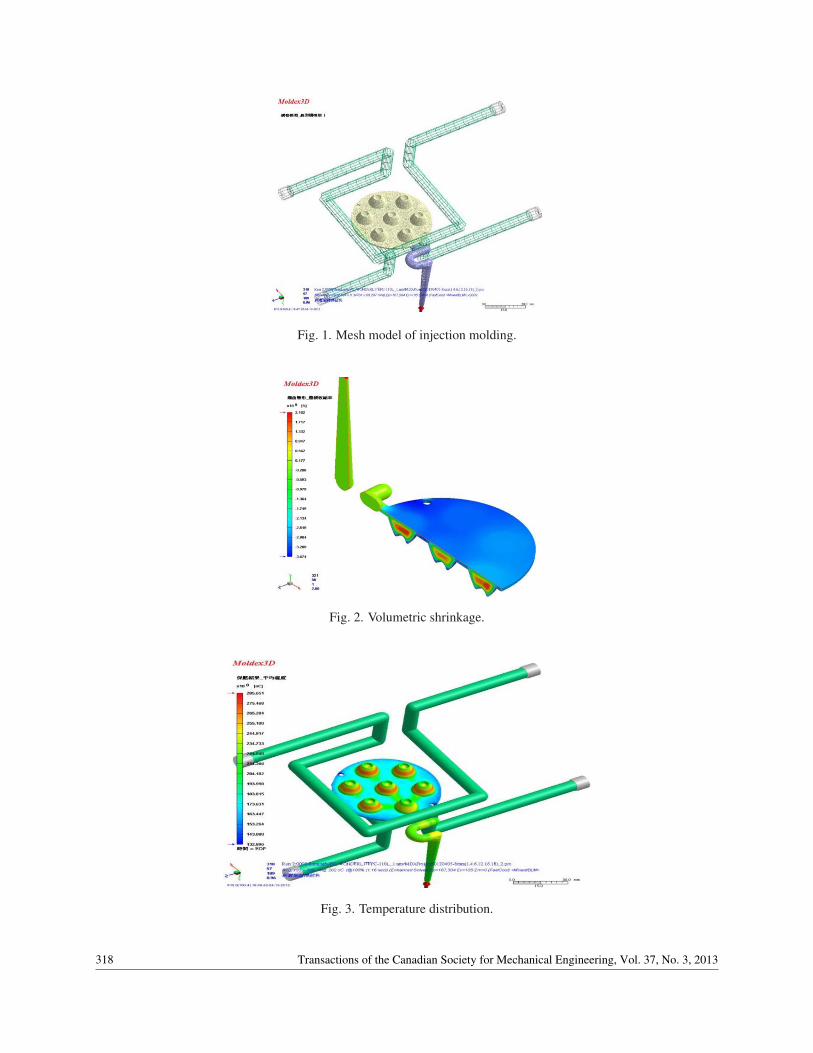
Fig. 1. Mesh model of injection molding.
Fig. 2. Volumetric shrinkage.
Fig. 3. Temperature distribution.
318 Transactions of the Canadian Society for Mechanical Engineering, Vol. 37, No. 3, 2013
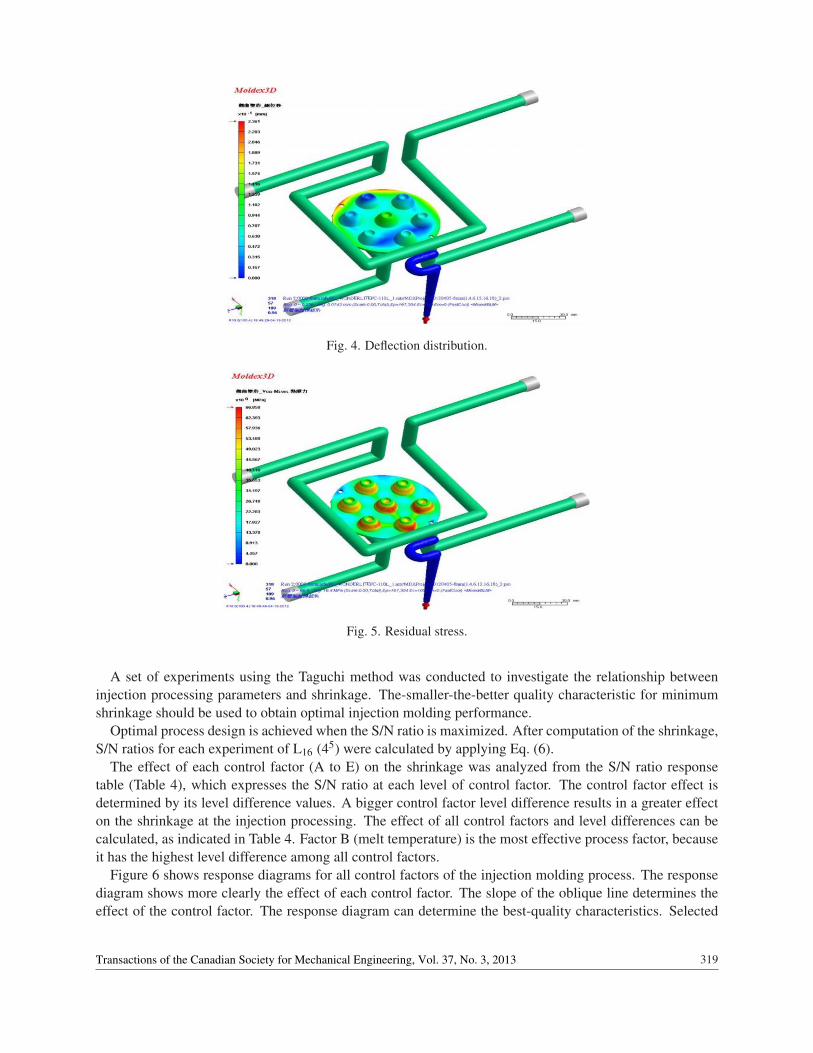
Fig. 4. Deflection distribution.
Fig. 5. Residual stress.
A set of experiments using the Taguchi method was conducted to investigate the relationship betweeninjection processing parameters and shrinkage. The-smaller-the-better quality characteristic for minimumshrinkage should be used to obtain optimal injection molding performance.
Optimal process design is achieved when the S/N ratio is maximized. After computation of the shrinkage,S/N ratios for each experiment of L16 (45) were calculated by applying Eq. (6).
The effect of each control factor (A to E) on the shrinkage was analyzed from the S/N ratio responsetable (Table 4), which expresses the S/N ratio at each level of control factor. The control factor effect isdetermined by its level difference values. A bigger control factor level difference results in a greater effecton the shrinkage at the injection processing. The effect of all control factors and level differences can becalculated, as indicated in Table 4. Factor B (melt temperature) is the most effective process factor, becauseit has the highest level difference among all control factors.
Figure 6 shows response diagrams for all control factors of the injection molding process. The responsediagram shows more clearly the effect of each control factor. The slope of the oblique line determines theeffect of the control factor. The response diagram can determine the best-quality characteristics. Selected
319Transactions of the Canadian Society for Mechanical Engineering, Vol. 37, No. 3, 2013
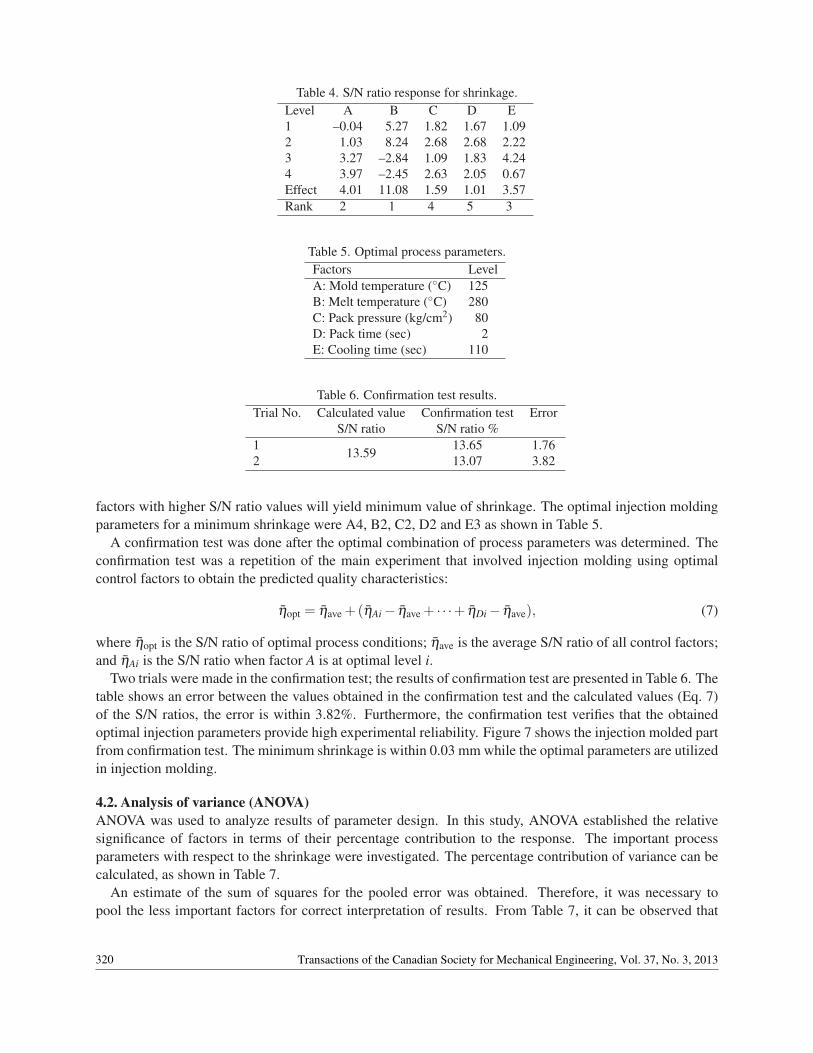
Table 4. S/N ratio response for shrinkage.Level A B C D E1 –0.04 5.27 1.82 1.67 1.092 1.03 8.24 2.68 2.68 2.223 3.27 –2.84 1.09 1.83 4.244 3.97 –2.45 2.63 2.05 0.67Effect 4.01 11.08 1.59 1.01 3.57Rank 2 1 4 5 3
Table 5. Optimal process parameters.Factors LevelA: Mold temperature (◦C) 125B: Melt temperature (◦C) 280C: Pack pressure (kg/cm2) 80D: Pack time (sec) 2E: Cooling time (sec) 110
Table 6. Confirmation test results.Trial No. Calculated value Confirmation test Error
S/N ratio S/N ratio %1 13.59 13.65 1.762 13.07 3.82
factors with higher S/N ratio values will yield minimum value of shrinkage. The optimal injection moldingparameters for a minimum shrinkage were A4, B2, C2, D2 and E3 as shown in Table 5.
A confirmation test was done after the optimal combination of process parameters was determined. Theconfirmation test was a repetition of the main experiment that involved injection molding using optimalcontrol factors to obtain the predicted quality characteristics:
ηopt = ηave +(ηAi − ηave + · · ·+ ηDi − ηave), (7)
where ηopt is the S/N ratio of optimal process conditions; ηave is the average S/N ratio of all control factors;and ηAi is the S/N ratio when factor A is at optimal level i.
Two trials were made in the confirmation test; the results of confirmation test are presented in Table 6. Thetable shows an error between the values obtained in the confirmation test and the calculated values (Eq. 7)of the S/N ratios, the error is within 3.82%. Furthermore, the confirmation test verifies that the obtainedoptimal injection parameters provide high experimental reliability. Figure 7 shows the injection molded partfrom confirmation test. The minimum shrinkage is within 0.03 mm while the optimal parameters are utilizedin injection molding.
4.2. Analysis of variance (ANOVA)ANOVA was used to analyze results of parameter design. In this study, ANOVA established the relativesignificance of factors in terms of their percentage contribution to the response. The important processparameters with respect to the shrinkage were investigated. The percentage contribution of variance can becalculated, as shown in Table 7.
An estimate of the sum of squares for the pooled error was obtained. Therefore, it was necessary topool the less important factors for correct interpretation of results. From Table 7, it can be observed that
320 Transactions of the Canadian Society for Mechanical Engineering, Vol. 37, No. 3, 2013
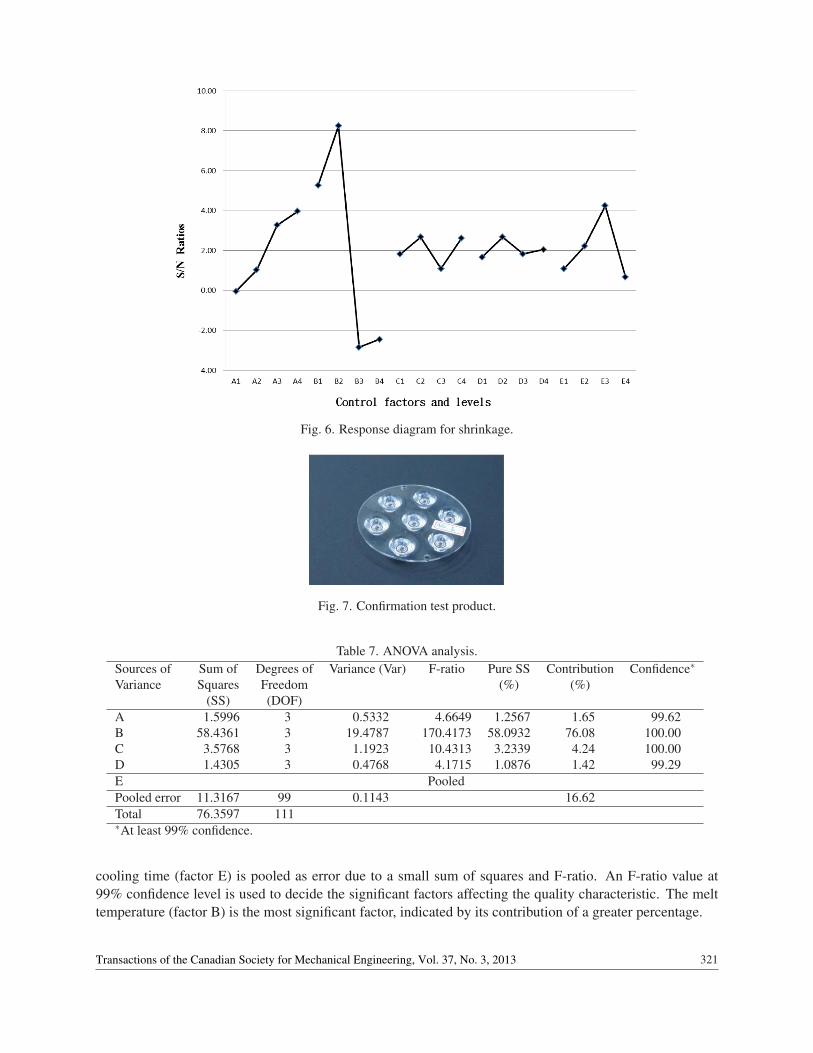
Fig. 6. Response diagram for shrinkage.
Fig. 7. Confirmation test product.
Table 7. ANOVA analysis.Sources of Sum of Degrees of Variance (Var) F-ratio Pure SS Contribution Confidence∗
Variance Squares Freedom (%) (%)(SS) (DOF)
A 1.5996 3 0.5332 4.6649 1.2567 1.65 99.62B 58.4361 3 19.4787 170.4173 58.0932 76.08 100.00C 3.5768 3 1.1923 10.4313 3.2339 4.24 100.00D 1.4305 3 0.4768 4.1715 1.0876 1.42 99.29E PooledPooled error 11.3167 99 0.1143 16.62Total 76.3597 111∗At least 99% confidence.
cooling time (factor E) is pooled as error due to a small sum of squares and F-ratio. An F-ratio value at99% confidence level is used to decide the significant factors affecting the quality characteristic. The melttemperature (factor B) is the most significant factor, indicated by its contribution of a greater percentage.
321Transactions of the Canadian Society for Mechanical Engineering, Vol. 37, No. 3, 2013
The calculation of ANOVA was made on the basis of the equations in [16]. The total sum of the squareddeviations SST is decomposed into two components: the sum of the squared deviations SSm due to eachfactor and the sum of the squared error SSe.
In ANOVA, total sum of squares (SST) can be calculated as:
SST =n
∑i=1
r
∑j=1
Y 2i j −nrY 2, (8)
where Yi j is the experimental data, n is the number of experiments, each experiment has r experimental data,Y is the grand mean.
The sum of squares (SS) for each factor m can be expressed as:
SSm =nrL
L
∑k=1
(Yk − Y )2, (9)
where Yk is the response values at level k of factor and L is the number of levels.
Total Degrees of freedom (DOF) = Total number of experiments−1 (10)
DOF for each factor = Number of levels(L)−1 (11)
Variance (Var) = SS/DOF (12)
F-ratio = Var/Var of error (Ve) (13)
Pure sum of square = SS-Ve ∗ DOF (14)
Percentage Contribution = Pure SS/Total SS (15)
5. CONCLUSIONS
This study applied the Taguchi method on injection molding of LED lampshade to optimize injection pa-rameters with the aim of reducing the shrinkage. This result satisfies the required standard for LED factoryproduction, and provides practical assistance to engineers in selecting a suitable parameter for injectionmolding. The experimental results may be summarized as follows:
1. Optimum processing design of LED lampshade tended to obtain minimum shrinkage during coolingand shrinkage stage. The minimum shrinkage is within 0.03 mm.
2. ANOVA verified that factor B is very significant for injection LED lampshades. Factors E had lessinfluence and were pooled as error.
3. The optimal combination of injection parameters was confirmed through confirmation experiments.The results indicate that the error between confirmation tests and predicted values was within 3.82%.
REFERENCES
1. Richardson, S., “Hele–Shaw flow with a free boundary produced by the injection of fluid into a narrow channel”,Journal of Fluid Mechanics, Vol. 56, No. 4, pp. 609–618, 1972.
2. Bird, R.B., Armstrong, R.C. and Hassager, O., Dynamics of Polymeric Liquids, Vol. 1: Fluid Mechanics, 2ndedn. Wiley, New York, 1987.
3. Bird, R.B., Curtiss, C.F., Armstrong, R.C. and Hassager, O., Dynamics of Polymeric Liquids, Vol. 2: KineticTheory, 2nd edn. Wiley, New York, 1987.
322 Transactions of the Canadian Society for Mechanical Engineering, Vol. 37, No. 3, 2013
4. Crochet, M.J., Davies, A.R. and Walters, K., Numerical Simulation of Non-Newtonian Flow, Elsevier, 1984.5. Lapidus, L. and Pinder, G.F., Numerical Solution of Partial Differential Equation in Science and Engineer,
Wiley, New York, 1982.6. Goyal, S.K., Chu, E. and Kamel, M.R., “Non-isothermal radial filling of center-gated disc cavities with vis-
coelastic polymer melts”, Journal of Non-Newtonian Fluid Mechanics, Vol. 28, pp. 373–406, 1988.7. Jansen, K.M.B., Van Dijk, D.J. and Husselman, M.H., “Effect of processing conditions on shrinkage in injection
molding”, Polymer Engineering and Science, Vol. 38, No. 5, pp. 838–846, 1998.8. Chang, T.C., “Shrinkage behavior and optimization of injection molded parts studied by the Taguchi method”,
Polymer Engineering and Science, Vol. 41, No. 5, pp. 703–710, 2001.9. Huang, M.C. and Tai, C.C., “The effective factors in the warpage problem of an injecton-molded part with a thin
shell feature”, Journal of Materials Processing Technology, Vol. 110, No. 1, pp. 1–9, 2001.10. Hsu, T.T., “Study on simulation and optimization in injection molding of plastic aspherical lens”, Master’s
Thesis, Feng Chia University, Taiwan, ROC, 2004.11. Chen, W.C., Lai, T.T., Wang, M.W. and Hung, H.W., “An optimization system for LED lens design”, Expert
Systems with Applications, Vol. 38, pp. 11976–11983, 2011.12. Liu, Y.B., “On thermal structure optimization of a power LED lighting”, Procedia Engineering, Vol. 29,
pp. 2765–2769, 2012.13. Park, S.H., Robust Design and Analysis for Quality Engineering, Chapman & Hall, London, 1996.14. Unal, R. and Dean, E.B., “Taguchi approach to design optimization for quality and cost: An overview”, in
Proceedings of the International Society of Parametric Analysts 13th Annual, New Orleans, LA, USA, May21–24, 1991.
15. Phadke, M.S., Quality Engineering Using Robust Design, Prentice-Hall, Englewood Cliffs, NJ, 1989.16. Lee, H.H., Taguchi Method Quality Characteristics Concept and Practices, GaoLi Books, Taipei, Taiwan, ROC,
2005.
323Transactions of the Canadian Society for Mechanical Engineering, Vol. 37, No. 3, 2013