king county programmatic habitat assessment
TRANSCRIPT
King County Programmatic Habitat Assessment
June 2012
Water and Land Resources Division Department of Natural Resources and Parks
King Street Center 201 South Jackson Street, Suite 600
Seattle, WA 98104-3855 206-296-6519 Fax 206-296-0192

Acknowledgements Department of Natural Resources and Parks River and Floodplain Management Section Contributing Staff: Sylvia Aro, Administrative Specialist Steve Bleifuhs, Manager Priscilla Kaufmann, Co-Lead, Project/Program Manager, Countywide Policy and Planning Unit Brian Murray, Supervisor, Countywide Policy and Planning Unit Ken Zweig, Project/Program Manager, Countywide Policy and Planning Unit Scientific and Technical Support Section Contributing Staff: Gino Lucchetti, Co-Lead, Environmental Scientist Ruth Schaefer, Environmental Scientist Jennifer Vanderhoof, Environmental Scientist Stormwater Services Contributing Staff: Curt Crawford, Manager Ken Krank, Supervising Engineer Doug Navetski, Senior Engineer Mark Wilgus, Senior Engineer Agriculture and Forestry Program Kathy Creahan, Manager Claire Dyckman, Program/Project Manager Rick Reinlasoder, Program/Project Manager Wastewater Treatment Division Contributing Staff: Steve Hirschey, Water Quality Planner Department of Development and Environmental Services Director’s Office Contributing Staff: Harry Reinert, Special Projects Manager Information Services Contributing Staff: Paul McCombs, GIS Specialist, Master Land Use Services Division, Critical Area Review Contributing Staff: Steve Bottheim, Supervisor, Land Use Services Division Pesha Klein, Acting Supervisor, Critical Areas Review Greg Wessel, Environmental Scientist Department of Public Health Community Environmental Health Contributing Staff: Gregory Bishop, Health and Environmental Investigator David Koperski, Health and Environmental Investigator We gratefully appreciate the guidance provided by staff at FEMA, Region X.

Executive Summary
King County
Programmatic Habitat Assessment


King County National Flood Insurance Program Biological Opinion . Compliance Submittal and Programmatic Habitat Assessment
1
Introduction On September 22, 2008, National Marine Fisheries Service (NMFS) issued a biological opinion (Bi-Op) concerning implementation of the Federal Emergency Management Agency’s (FEMA) National Flood Insurance Program (NFIP). The Bi-Op was issued following a formal consultation between NMFS and FEMA pursuant to Section 7 of the Endangered Species Act and consistent with judicial order in NWF v. Federal Emergency Management Agency (FEMA). The Bi-Op focused on the effects of the NFIP on species of Puget Sound salmon and killer whales that are currently listed under the federal Endangered Species Act (ESA) as threatened or endangered. The main focus of the Bi-Op was whether activities conducted under the NFIP are likely to jeopardize recovery of ESA-listed species in the Puget Sound region or adversely modify their critical habitats. Analysis focused on whether a cause and effect relationship exists between activities fundamental to the NFIP and habitat changes that adversely affect listed species and their critical habitats. The Bi-Op found that implementation of the NFIP is likely to jeopardize the continued existence of Puget Sound Chinook salmon, Puget Sound steelhead, Hood Canal summer chum salmon, and Southern Resident killer whales, and is likely to adversely modify Puget Sound Chinook salmon, Hood Canal summer-run chum salmon, and Southern Resident killer whale critical habitat. Within the Bi-Op, NMFS described reasonable and prudent alternatives (RPA) that FEMA could take to avoid the likelihood of jeopardy to ESA-listed species or the adverse modification of designated critical habitat. Following the issuance of the Bi-Op, FEMA developed a model ordinance to provide one option for how communities can meet the requirements of the Bi-Op. To maintain eligibility under the NFIP, King County and other communities were required to comply with the Bi-Op by September 21, 2011 through one of three options:
Adopting the model ordinance; Demonstrating compliance through a checklist and accompanying narrative, or via a
comprehensive programmatic assessment of the effects of implementing its regulations and other programs that affect floodplain habitats; or
Demonstrating compliance on a permit by permit basis.
Background In September 2010 King County submitted a checklist and supporting documentation to demonstrate how their current regulations comply with the elements of the RPA required by the Bi-Op. FEMA responded to King County’s submittal in February 2011, requesting additional informational to demonstrate compliance with some of the requirements set forth in the Bi-Op. Areas where King County’s regulations are not consistent with the Bi-Op include:
A 165 feet buffer rather than Bi-Op required 250 feet buffer on shorelines of the state and a 200 feet buffer on fish bearing streams wider than 5 feet that are not shorelines of the state;
The Bi-Op standards of retaining 65 percent native vegetation and not more than 10 percent effective impervious area on parcels of land within the floodplain, but beyond (outside) of the Protected Area.1
1 A sixty-five percent native vegetation retention standard is in King County code but not being implemented due to ruling by Washington State courts.

King County National Flood Insurance Program Biological Opinion . Compliance Submittal and Programmatic Habitat Assessment
2
Rather than provide FEMA additional information to contrast County regulations and Bi-Op requirements, King County decided to demonstrate compliance by conducting a comprehensive programmatic habitat assessment (PHA) in accordance with the Matrix of Pathways and Indicators consultation guidance document (NMFS 1998) for making Endangered Species Act effects determinations. This PHA is a comprehensive review of King County’s regulations for development that will be reviewed and approved by King County in the floodplains mapped on FIRMs. The PHA used assumptions that reflect the most likely location and extent of development that might occur in King County’s floodplains based on zoning and allowed land uses at full build-out. The goal of the PHA was to comprehensively assess the combined net effect of development regulated by the County and the County’s protection and restoration actions in mapped FEMA floodplains on ESA- listed species and their habitats in order to make appropriate ESA and Magnusson-Stevens Act (MSA) effects determinations for species covered under those acts. The PHA approach was chosen over other Bi-Op options in order to provide a comprehensive view of the effects of the County’s actions on ESA species and their habitats, as well as a highly relevant land use and land cover database for use in floodplain management and salmon recovery that would also serve as a framework for assessing floodplain land cover and land use change over time. The permit-by-permit approach was not selected due to potential technical and administrative complexities and costs to landowners and the County, and the limited utility and assessment of effects that such an approach would provide. The Bi-Op’s model ordinance was not adopted because of certain elements, such as buffer requirements that would result in buffers 35 to 85 feet wider than the County’s current standards in many areas (see Appendix A for justification of the County’s buffer widths). The justification to adopt the Bi-Op’s Model Ordinance additional protections, including larger buffers, was not clear from the County’s perspective, given the County’s relatively recent and extensive work at assessing the science basis, risks and adequacy of its new Critical Areas Ordinance (CAO) and updated Shoreline Master Plan (SMP). In 2005 the County initiated a new highly restrictive set of comprehensive environmental protections under the CAO. The CAO included much larger and more extensive buffers than previously required. The CAO’s standards prioritized protection of salmon habitats and habitat-forming processes and were substantively based on the County’s Best Available Science, which was both peer-reviewed and, ultimately, legally challenged and affirmed through Washington State Courts. More recently, after a multi-year planning process, the County adopted a new Shoreline Master Plan (SMP) in 2010, although it awaits final approval from Washington Department of Ecology before implementation. The SMP incorporates CAO regulatory protections while further defining and limiting shoreline uses to those that are strictly water dependent. Analysis conducted as part of the SMP update indicated that the County’s shorelines are likely to experience no net loss of ecological function of shorelines and should be restored relative to the current condition.2 The PHA did not review regional land uses that are identified in K.C.C. chapter 21A.08 for which a special use permit is required. These regional land uses are generally large and hard to site, therefore the special use permit is approved by the King County Council rather than the
2 It should be noted, that the ESA standard is “no adverse impact” which is a different and, typically, more restrictive standard than Washington State’s “no net loss.”

King County National Flood Insurance Program Biological Opinion . Compliance Submittal and Programmatic Habitat Assessment
3
Department of Development and Environmental Services, and requires an extensive review process and ability to add additional conditions of approval. This PHA also did not assess mineral extraction activities defined in Standard Industrial Classification Division 10, mining of coal and lignite; extraction of peat, Division 12, mining of uranium and thorium ores, and Division 14, other mining and quarrying. These activities will require separate assessments if proposed in a mapped FEMA floodplain. All other development proposals that would be allowed in the floodplain under current zoning and regulations in effect as of September 2011 have been considered in this PHA. An initial draft PHA was sent to FEMA on the deadline date (September 22, 2011) with a conclusion that the net effect of likely future development under full build-out in combination with current and likely future habitat protection and restoration actions within—and contributing to—mapped FEMA floodplains under County jurisdiction would result in an effects determination of “May Affect, Not Likely to Adversely Affect” for ESA- and MSA-listed species. Subsequent revisions addressed additional FEMA comments and questions, and further refined the parcel land cover and land use database. A final PHA including a final effects determination of NLAA for all listed species was submitted on June 21, 2012.
Approach The PHA assessed the combined net effect of development and protection and restoration actions on mapped FEMA floodplains. Current (ca 2011) environmental regulations were applied to currently undeveloped private parcels with development potential in the floodplain. An analysis was conducted to project future conditions using development footprints based on underlying zoning and regulatory constraints. Development effects were then compared to the projected future conditions anticipated from restoration projects and acquisition of permanent open space (POS) lands reflected in the County’s many non-regulatory and non-floodplain regulatory actions. Land covers and land uses were assessed in detail at various scales based on full build-out of the floodplain to provide a basis for assessing change in floodplain condition over time and for making ESA and MSA effects determinations (see Chapter 6 for details).3 A parcel-based land cover and land use database was established for each mapped FEMA floodplain and floodplain delta area with the potential to support ESA-listed species. The “delta area” is the difference between the Bi-Op protected area and King County’s regulatory portion of the floodplain. This database was used to estimate current (ca 2011) and project future development footprints on all currently undeveloped private parcels with development potential in the floodplain, and to project future amounts of restoration on parcels currently designated as POS. Additional analysis was done to estimate: (a) watershed-scale ratios of current percent forest cover and total and effective percent impervious surface; (b) the number of times a parcel may require a reasonable use exception; and (c) the potential for additional forest cover to be established in regulatory aquatic area buffers in the floodplain. The PHA was conducted for all mapped FEMA floodplains in King County’s jurisdiction except those above natural, year-round, permanent barriers to migration by salmon on the Snoqualmie (Snoqualmie Falls) and South Fork Skykomish Rivers (Sunset Falls) and Red Creek, a tributary
3 “Full build-out” means that nominal building and clearing footprints consistent with highest and best use as allowed under current zoning were applied to all private and undeveloped parcels with development potential in the floodplain.
King County National Flood Insurance Program Biological Opinion . Compliance Submittal and Programmatic Habitat Assessment
4
to the White River. These areas were excluded because they either do not have any ESA- or MSA-listed species or habitat or, in the case of the South Fork Skykomish, where ESA-listed salmonids are passed above a natural barrier, the land is dominated by federally managed forest and wilderness lands, and the potential for new development in floodplains under King County jurisdiction is very small. Major floodplain areas were identified as the spatial scale for analysis of effects. These areas were further delineated into sub-areas to understand variability within each major floodplain area. In all, six major floodplain areas and eighteen sub-areas were assessed, including:
o Lower Snoqualmie River, including the Lower Snoqualmie, Tolt and Raging Rivers and Patterson and Cherry Creeks sub-areas,
o Sammamish River, including the Sammamish River and Issaquah and Big Bear Creeks sub-areas,
o Cedar River, including the Cedar River and May Creek (a Lake Washington tributary) sub-areas,
o Green River, including the Lower, Middle and Upper Green River and Soos and Newaukum Creeks sub-areas,
o White River, including the White River and Boise Creek sub-areas, o Vashon-Maury Island (VMI - note: although not discrete sub-areas, VMI has small
amounts of floodplain on Shinglemill, Christianson, Fisher, Judd, Tahlequah and Raab’s Lagoon Creeks).
The PHA has chapters that describe the: purpose and history (Chapter 1); species use and habitat conditions (Chapters 2 and 3); County’s land use regulations (Chapter 4); range of actions beyond floodplain regulations that benefit floodplains (Chapter 5 and
Appendix C); assessment of land cover and land use (Chapter 6); ESA effects and determinations (Chapter 7); and history of FEMA interactions (Chapter 8).
Additionally, there are appendices that describe the justification for the County’s current buffer standards (Appendix A), the Agricultural Drainage Assistance Program (Appendix B), and various maps including FEMA floodplains, floodplain delta areas (where King County’s protections are less than the Bi-Op’s), the location of parcels with development potential, and salmon distribution (Appendix D).
Key Findings King County uses a comprehensive approach to environmental protection and restoration wherein regulatory protections are complemented by many additional capital and programmatic actions to protect and restore the environment, most of which contribute, either directly or indirectly, to the health of floodplains and recovery of salmon and their habitats.
King County National Flood Insurance Program Biological Opinion . Compliance Submittal and Programmatic Habitat Assessment
5
Future potential development on many tens of thousands of acres in and upstream of floodplains, including almost all current agricultural lands as well as many large and small private forest and rural tracts of land, is precluded or severely limited by County programs such as current use taxation, public benefit rating, transfer of development rights, forest and farmland preservation and open space acquisition that provide tax incentives or that acquire development rights or lands outright (Tables 5-1 and 5-2). Based on actions listed in the King County Flood Hazard Management Plan and WRIA salmon recovery plans, many additional floodplain and surrounding watershed habitats are likely to be protected in the future as those plans are implemented. Regulations upstream from and adjacent to floodplains provide added protections and contribute to floodplain health and restoration potential. Over 8,300 riparian acres are contained in aquatic area buffers along Coho-bearing streams alone upstream from floodplains.4 Additional upstream or adjacent regulatory protections include buffers along non-Coho-bearing streams (not estimated), the non-floodplain area of wetlands at least partially in a floodplain (2,100 acres), mapped moderate or severe channel migration areas extending beyond a mapped FEMA floodplain (760 acres), mapped steep slopes (>40%, 6,300 acres), landslide hazard areas (11,800 acres) and erosion hazard areas (18,000 acres) within one-thousand feet of a floodplain and some 30,000 acres of critical aquifer recharge area (Table 5-3).5 Capital improvement projects (CIPs) acquire, protect, and restore lands and, where appropriate, modify, setback or remove structures, including houses, levees and revetments. They are a major part of the County’s comprehensive approach for managing floodplains to reduce flood hazards and promote salmon recovery. Between 2010 and 2016, across all of the County’s six major floodplains, the County has—or will—implement about 60 CIPs in or in close proximity to its mapped FEMA floodplains (Table 7-2). Projects range widely in scope and size. For example, the Glacier Northwest gravel mine on Maury Island protects a mile of Puget Sound shoreline and 300 acres of uplands and the Rainbow Bend Levee Removal and Floodplain Reconnection on the Cedar River has removed 58 homes and will restore 40 acres of floodplain. There are also relatively small, but important actions, such as removing 225 feet of creosote piling and bulkhead material at Piner Point on Maury Island. The County’s environmental protection and restoration actions occur against a backdrop of ongoing current and potential future land development. Key findings on land use and land cover for the current (baseline) condition at the FEMA floodplain, delta area and contributing watershed-scales and potential future conditions at the FEMA floodplain and delta area scales, include: Current Conditions King County has jurisdiction over 8,980 parcels containing 28,173 acres of mapped FEMA
floodplain. Among these, 4,228 floodplain acres are above natural barriers on the Snoqualmie and South Fork Skykomish Rivers, and on Red Creek (a White River tributary) and were not assessed (Table 6-1).
Out of 6,991 floodplain parcels and 23,796 floodplain acres assessed for the NFIP Bi-Op
response, 516 parcels containing 1,420 floodplain acres were found to be private and undeveloped with development potential in the floodplain (Table 6-1). Among these,
4 Coho-bearing streams are used for illustration purposes only. They are inclusive of all Chinook-bearing stream reaches and almost all steelhead-bearing stream reaches, except those in relatively steep headwaters. 5 Area estimates are not mutually exclusive and may overlap.

King County National Flood Insurance Program Biological Opinion . Compliance Submittal and Programmatic Habitat Assessment
6
distributed across all the major floodplains were 296 parcels containing 445 acres of floodplain “delta” area, where the county’s regulatory protections fall short of those specified in the NMFS Bi-Op.
The contributing watershed-scale ratio of percent forest cover to percent effective
impervious area (EIA) across the entire county’s mapped FEMA floodplains, is 62/1.7 including cities and tribal lands and 64.6/0.9 when cities and tribal areas are excluded and as measured from the furthest downstream end of their respective floodplains, i.e., reflecting the most developed condition (Table 6-4). For both scenarios, the proportion of forest cover is below the 65 percent threshold cited by the Bi-Op, albeit very close when lands over which the County has no jurisdiction are excluded.
Among the six major floodplain areas assessed, the Snoqualmie, Cedar, and White Rivers
had contributing watershed-scale forest covers of 65.8, 69.5, and 73.3 percent, respectively, when cities and tribal lands are excluded. The other three floodplains—the Green and Sammamish Rivers and Vashon-Maury Island (at the entire island scale)—had contributing watershed forest covers, of 54.4, 62.5 and 64 percent, respectively (Table 6-4), less than the Bi-Op’s threshold. It should be noted, however, that for floodplains in these three major watersheds, the threshold may not logically apply because: (1) the Green River hydrology and sediment transport and resulting floodplains are highly affected by water supply/flood control dams; (2) the Sammamish River and its floodplain is heavily influenced by the moderating effects of Lake Sammamish, the state’s sixth largest lake; and (3) the Vashon-Maury Island floodplain is largely marine shoreline and thus largely affected by marine rather than contributing watershed factors. 6
Among the eighteen sub-areas that together comprise the six major floodplain areas, ten
had contributing watershed-scale forest covers of less than the nominal 65 percent threshold (Table 6-4). Of these, eight had watershed forest covers between 55 and 62 percent, reflecting clearing from past rural land development. Two floodplain sub-areas—Newaukum and Soos Creeks—had low contributing watershed-scale forest covers of 28 and 46 percent, respectively, presumably due to a combination of extensive past clearing for agriculture and rural land development. It should be noted that the Newaukum and Soos Creek watersheds have a combination of flat topography and significant amounts of moderate to highly permeable lahar and glacial outwash soils that likely moderate effects of reduced forest cover.
The contributing watershed-scale effective impervious areas across all the floodplain and
floodplain sub-areas are well below the Bi-Op’s 10 percent threshold of concern, with a maximum of 4.2 percent watershed effective impervious area for the Big Bear Creek floodplain sub-area (Table 6-4).
Potential Future (full build-out) Conditions Within the County’s FEMA floodplains, the combined effect of development and restoration
would result in a potential net increase in floodplain forest cover of almost three percent, from 22.9 percent currently to 25.7 percent, while the proportion of total and effective impervious area (TIA, EIA) in the floodplain would change from 3.0 and 1.2 percent, respectively, under current conditions, to 3.2 and 1.3 percent, respectively, under a full
6 Although its watershed-scale forest cover exceeds 65 percent, the Cedar River is also heavily affected by a dam.

King County National Flood Insurance Program Biological Opinion . Compliance Submittal and Programmatic Habitat Assessment
7
build-out scenario (Table 6-5). Hence overall forest cover is estimated to slightly improve over the foreseeable future, while the extent of impervious area will essentially remain at near-current levels.
Within only the “delta area” portions of the County’s floodplains, forest cover would
potentially increase by about four percent, from 23.6 to 27.5 percent, under full build-out, while delta area TIA would increase from 3.9 to 4.1 percent and delta area EIA would not change appreciably from its current estimate of 1.6 percent (Table 6-5). Hence overall forest cover within the “delta areas” is estimated to improve about 4 percent (about 50 percent more than for the entire floodplain), while impervious area again remains about the same as current conditions.
Within the County’s existing minimum 165-feet wide aquatic area buffers, there are 374
acres of immature coniferous forest cover with potential to become mature forest. Among these, 365 acres are zoned rural (not agricultural), and thus have relatively high likelihood of growth into mature forest cover (Table 6-6).
A total of 71 parcels, out of 158 candidate parcels with insufficient area to accommodate
development (less than 0.5 to 0.75 acre) outside of regulatory buffers, floodway and severe channel migration areas, were identified as having the potential for requiring at least some impact to a County aquatic area buffer in order to meet constitutionally-protected property rights, and thus would potentially require a Reasonable Use Exception (RUE) to allow for development (Table 6-7). However, when granted, these RUEs require (in decreasing order or preference) avoidance, minimization and mitigation of impact.
Because of the many uncertainties that determine ultimate development and land cover
patterns and to be conservative in favor of the ESA-listed species, the land cover and land use assessment was constructed conservatively by somewhat overstating the likely amount of potential new development, and somewhat understating the likely amount of restoration. Thus, the analysis is precautionary in favor of the listed species as required by the ESA.
King County has established and maintains a system of environmental goals, targets, indicators and performance measures (KingStat) to inform and track success of its management. KingStat includes explicit measures for ESA-listed Puget Sound Chinook salmon and relevant environmental indicators of the health of endangered species and their habitats. This system is supported by a comprehensive environmental monitoring and assessment program to collect data and track changes in a wide array of conditions including land use, land cover, fish and wildlife, benthic invertebrates, and water quality. Regulation of land development activities is permitted and managed using a County database that tracks permits, compliance from start to end of project, mitigation and enforcement. To assess the PHA’s assumptions and methodology, King County is committed to updating the land use and land cover analysis no more than every five years, but at least every ten years. Furthermore, if King County were to make major area-wide zoning changes within the floodplain, or significant changes to land use regulations that reduce habitat protection measures, the analysis would be updated in association with those zoning and regulation changes. King County has been a leader in assessing and responding to potential effects of climate change, including developing institutional mechanisms, measures and hydrologic models to
King County National Flood Insurance Program Biological Opinion . Compliance Submittal and Programmatic Habitat Assessment
8
assess, track and adapt to change. The County has an extensive history of floodplain activities (buyouts, levee removals or setbacks, floodplain reconnection and restoration) that have increased capacity to handle potential increases in flood flows while providing improved habitat for endangered salmonids. In the near-future (through 2016), the County plans to construct many similar floodplain projects to further increase climate change capacity and restore habitat.
Conclusions This PHA estimated the total net effects of all current and projected future land-use
(excluding those requiring special use or mining permits) under King County’s regulations (ca 2011) from the perspective of current baseline conditions. It includes assessment of the effects of the County’s many past, current and (likely) future protection and restoration actions. The analysis of environmental effects concluded that that the overall result of ongoing and future land-use regulation by the County may affect, but would not likely adversely affect ESA and MSA-listed species and will result in no adverse effects within the Protected Area that is defined by the BiOp.
The condition of most, if not all, of twenty habitat variables that were assessed would likely
be on an improving trajectory within the 100-year floodplain, although the degree of change would not likely be sufficient to be considered “restored” for any given variable (as per assessment criteria within the NMFS Matrix of Pathways and Indicators). Hence the net result will be that the condition of all the habitat variables that were assessed in this PHA will remain in their current status (as either Properly Functioning, At Risk, or Not Properly Functioning—see Table 7-1 in PHA).
Although not directly assessed, it appears that remediating the effects of historic and existing land uses may be as much or a greater concern as the effects of future development on the County’s floodplains and ESA-listed species.
Chapter 1
King County Programmatic
Habitat Assessment


King County National Flood Insurance Program Biological Opinion . Compliance Submittal and Programmatic Habitat Assessment
1-i
Chapter 1 Contents
Purpose ...................................................................................................................................... 1-1 Background ................................................................................................................................ 1-1 FEMA Guidance Documents ..................................................................................................... 1-3 Compliance with the Biological Opinion ..................................................................................... 1-3 King County’s Submittal ............................................................................................................. 1-4 FEMA’s Response ..................................................................................................................... 1-4 Overview of the King County Programmatic Habitat Assessment ............................................. 1-4
Scope of the Habitat Assessment .......................................................................................... 1-4 Overview of the Document ..................................................................................................... 1-5
Conclusion ................................................................................................................................. 1-7

King County National Flood Insurance Program Biological Opinion . Compliance Submittal and Programmatic Habitat Assessment
1-ii

King County National Flood Insurance Program Biological Opinion . Compliance Submittal and Programmatic Habitat Assessment
1-1
Chapter 1 – King County Programmatic Habitat Assessment
Purpose This Programmatic Habitat Assessment is prepared to demonstrate King County’s compliance with the Reasonable and Prudent Alternatives outlined in the September 22, 2008 Biological Opinion for the implementation of the National Flood Insurance Program in the Puget Sound Region. This document provides broad descriptions of salmonid habitat within mainstem rivers, streams, lakes, and saltwater shorelines and associated 100-year floodplains depicted on FEMA’s flood insurance rate maps (FIRMs) in King County, Washington. The document also identifies the ESA- or MSA-listed salmonid species that occupy these areas, and estimates the probable biological effects resulting from development after implementing all of King County’s regulatory and non-regulatory programs that are aimed at protecting and restoring these habitats. This Habitat Assessment has been performed at the programmatic level following guidance set forth by the Federal Emergency Management Agency (FEMA) document entitled Floodplain Habitat Assessment and Mitigation: Draft Regional Guidance (FEMA Region 10, 2011). This Programmatic Habitat Assessment was prepared based on the zoning and land use regulations that were in place as of September 22, 2011. Any major area-wide zoning amendments or substantive changes to land use regulations will require an assessment, and possible update, to this Programmatic Habitat Assessment.
Background On September 22, 2008, the National Marine Fisheries Service (NMFS) issued a Biological Opinion that determined implementing the National Flood Insurance Program (NFIP) causes jeopardy to several Endangered Species Act (ESA) and the Magnuson-Stevens Act (MSA) listed Puget Sound Salmonids and Southern Resident Orca Whales as well as adverse modification to their habitat. The Biological Opinion was drafted by the National Marine Fisheries Service (NMFS) following consultation with FEMA in accordance with the judicial order NWF v. FEMA, 345 F. Supp. 2d 1151 (W.D. Wash. 2004). Analysis focused on three elements of the NFIP—floodplain mapping, minimum floodplain management criteria, and the Community Rating System—with the intent being to understand whether causation exists between activities fundamental to the NFIP and habitat changes that adversely affect listed species and their critical habitat. The Biological Opinion found that implementation of the NFIP adversely affects listed species in Puget Sound and the critical habitat on which those species depend. The Opinion determines that the NFIP directly and indirectly promotes alterations to the floodplain that leads to floodplain development, which has numerous detrimental effects to habitat and habitat forming processes. The Biological Opinion establishes Reasonable and Prudent Alternatives (RPA) to modify the implementation of the NFIP in a manner that would reduce the jeopardy to a level that may effect, but not likely to adversely affect the listed species. A Notice of Error and Correction was issued on October 2, 2008 making corrections to Reasonable and Prudent Alternative Element 6. A Second Notice of Error and Correction issued on May 14, 2009 made multiple corrections
King County National Flood Insurance Program Biological Opinion . Compliance Submittal and Programmatic Habitat Assessment
1-2
to the September 22, 2008 Biological Opinion, most significantly to Appendix 4 establishing the width of the Riparian Buffer Zones. NMFS prepared a number of informational documents related to the Biological Opinion. One document was titled “Reasonable & Prudent Alternative Element 3: Floodplain Management Criteria” (February 2011). This document summarizes the reasonable and prudent alternatives (RPAs) as follows:
A. “FEMA shall modify its Floodplain Management Criteria ASAP for PS NFIP communities to carry out the following measures: 1. Allow no development in the Riparian Buffer Zone (RBZ, identified as the greater of
the channel migration zone plus a 50-foot buffer, the riparian buffer width specified by stream type, and the floodway), OR
2. Local jurisdictions must demonstrate to FEMA that proposed RBZ development does not adversely affect salmon habitat needs.
3. In addition to either 1 or 2 above, either: a) Prohibit development in the 100-year floodplain, OR b) Avoid, rectify or compensate for any loss of floodplain storage and fish habitat
from the development in the 100 yr floodplain (outside RBZ). Any development allowed must use Low Impact Development methods to minimize or avoid stormwater effects. Any indirect adverse effects must be mitigated.
c) Structural improvements/repairs resulting in greater than 10% increase in structure footprint must mitigate adverse effects to fish or their habitats.”
The Biological Opinion establishes an estimate of the extent of take that will occur through the implementation of the RPAs. NMFS cannot quantify the specific number of adult or juvenile fish, or incubating eggs, or fry that will be killed or injured, but they can estimate the extent of habitat likely to be affected. Take from habitat modification will occur according to three factors: 1) human population growth rate; 2) amount of developable floodplains; and 3) the implementation period. Human population growth rates are taken from the Washington State Office of Financial Management and Growth Management Plans. King County’s population growth rate is 1.3 percent per year. However because King County has floodplain management regulations significantly higher than the minimum NFIP requirements, along with highly protective critical areas, clearing and grading and stormwater regulations, NMFS anticipates the extent of take from floodplain development to be significantly less than the population growth rates. Consequently the Biological Opinion establishes a take exemption of 0.15 percent per year for King County based on King County’s regulatory and non-regulatory environment. Floodplain lands by County are divided into: 1) areas inside city limits; 2) areas designated as urban growth areas outside city limits; and 3) areas outside city limits and outside designated urban growth areas. The Biological Opinion calculates 46.01 square miles in unincorporated King County outside cities. Therefore King County has a take exemption of .069 square miles per year (46.01 square miles of floodplain X 0.0015 take exemption per year = .069 square miles per year). Converting this to acres, this would be 44.16 acres per year. Consequently King County’s take exemption is approximately 132.5 acres (44.16 acres/yr X 3 years) or 4.5 percent of the County’s floodplain over the three year period the Biological Opinion established to implement the Reasonable and Prudent Alternatives.

King County National Flood Insurance Program Biological Opinion . Compliance Submittal and Programmatic Habitat Assessment
1-3
Chapter 7 of this Programmatic Habitat Assessment evaluates the effects of actions based on future development within King County’s floodplains. Using the National Marine Fisheries Services matrix of pathways and indicators to summarize the environmental parameters affecting ESA-listed salmonids, King County anticipates restoration of 15 of the pathways and indicators and maintenance of four of the pathways and indicators. King County does not anticipate any additional degradation of any of these pathways and indicators as a result of development under King County’s existing regulations. Consequently although the Biological Opinion establishes a take exemption of 44.16 acres per year for King County, the assessment is that take will not occur although there may be some minor changes in land use based on development potential in the floodplain.
FEMA Guidance Documents FEMA Region 10 established a Focus Group comprised of representation from affected communities to explore options for implementing the Biological Opinion. This Focus Group, working with consultant services, prepared the following guidance documents to assist communities comply with the Biological Opinion: Floodplain Habitat Assessment and Mitigation (PDF 6.3 KB, TXT 63 KB) Regional Guidance for Hydrologic and Hydraulic Studies (PDF 768 KB, TXT 51 KB) CRS Credits for Habitat Protection (PDF 4.3 KB, TXT 52 KB) Engineering With Nature (PDF 2.6 KB, TXT 75 KB) Living With The River (PDF 1.4 KB, TXT 74 KB)
Compliance with the Biological Opinion Approximately 122 communities in the Puget Sound Region must comply with the Biological Opinion. These communities were divided into three tiers based on an evaluation of fish populations contributing to the Evolutionarily Significant Unit (ESU) or Distinct Population Segment (DPS) overall viability. “Tier One” communities, of which King County is identified, must restore populations to a low extinction risk status because their contribution to the abundance, diversity, spatial structure and productivity to the ESU or DPS are critical. “Tier Two” communities may also have traits that are important to ESU or DPS viability, but their contribution is less important. All other Puget Sound NFIP communities are in “Tier Three.” The NMFS initially established September 22, 2010—two years after issuing the Biological Opinion—as the deadline for Tier 1 communities to comply with the Biological Opinion. Tier Two communities were given until March 22, 2011 and Tier Three communities until September 22, 2011. As the September 22, 2010 deadline approached it became apparent that additional time was needed by Tier One communities to comply. On September 10, 2010, the NMFS agreed to the request by FEMA to extend the deadline for Tier One and Tier Two communities to September 22, 2011, resulting in the requirement for 100 percent of the communities in the Puget Sound regions subject to the Biological Opinion to demonstrate compliance by that date. FEMA has identified three options for NFIP-participating communities to document compliance with the Biological Opinion. Local jurisdictions can either: Adopt the model ordinance developed by FEMA (Option #1),

King County National Flood Insurance Program Biological Opinion . Compliance Submittal and Programmatic Habitat Assessment
1-4
Complete a FEMA-developed checklist to document that local regulations and best available science will reduce jeopardy to a level that may effect, but not likely to adversely effect the listed species (Option #2), or
Perform a habitat assessment on a case-by-case basis for development within the mapped 100-year floodplain (Option #3).
King County’s Submittal King County selected the Option #2 approach to comply with the Biological Opinion. Even though the deadline for Tier One communities was extended by one year from the original deadline, King County chose to submit the Option #2 package to FEMA on September 22, 2010. King County’s submittal included:
1. Cover letter dated September 22, 2010 to Mark Carey, Director, Mitigation Division, FEMA Region 10 from Mark Isaacson, Director, King County Water and Land Resource Division.
2. Completed Biological Opinion checklist. 3. Copies of King County’s critical areas, clearing and grading and stormwater regulations
with cross-references to the checklist. 4. King County Best Available Science review for King County’s critical areas, clearing and
grading and stormwater regulations (2 volumes). 5. Copy of the court decision on Citizens’ Alliance for Property Rights v. Ron Sims, No.
59416-8-L (Court of Appeals of Washington, Division 1, July 7, 2008).
FEMA’s Response On February 18, 2011, FEMA Region 10 provided a response to King County’s September 22, 2010 submittal with additional questions and comments. The questions and King County’s response to those questions is contained in the Addenda to this Programmatic Habitat Assessment. King County met with FEMA Region 10 staff along with staff from NMFS on April 18, 2011 to clarify the questions and comments contained in the February 18, 2011 letter. Following that meeting, King County proceeded with the preparation of this Programmatic Habitat Assessment.
Overview of the King County Programmatic Habitat Assessment
Scope of the Habitat Assessment This Programmatic Habitat Assessment is a comprehensive review of King County’s regulations for development that will be reviewed and approved by King County in the floodplains mapped on FIRMs. King County recognizes that some development proposals will include activities, such as in-water work or federally-funded projects, that will require additional federal permits. In such cases a federal nexus would exist and additional ESA and MSA review would be conducted by the federal agency and NMFS. In addition, this Programmatic Habitat Assessment uses assumptions of development that reflect the most likely scale of development that might occur in King County’s floodplains based on zoning and allowed land uses at full buildout. This Programmatic Habitat Assessment does not include a review of regional land uses that are identified in K.C.C. chapter 21A.08 for which a special use permit is required. Because these regional land uses are generally large and hard to site, the special use permit is approved by
King County National Flood Insurance Program Biological Opinion . Compliance Submittal and Programmatic Habitat Assessment
1-5
the King County Council rather than the Department of Development and Environmental Services, and requires an extensive review process and ability to add additional conditions of approval. This Programmatic Habitat Assessment also does not include mineral extraction activities defined in Standard Industrial Classification Division 10, mining of coal and lignite; extraction of peat, Division 12, mining of uranium and thorium ores, and Division 14, other mining and quarrying. All other development proposals that would be allowed in the floodplain under current zoning and regulations in effect as of September 2011 have been considered in this Programmatic Habitat Assessment. This King County Programmatic Habitat Assessment addresses the following basins broken out by rivers and their major tributaries with mapped floodplains as follows: Lower Snoqualmie River, including the major rivers (Tolt, Raging) and creeks (Cherry, Patterson) Sammamish River, including Bear and Issaquah Creeks Cedar River, including May Creek, a tributary to SE Lake Washington Green River, including Soos and Newaukum White River, including Boise Creek Vashon-Maury Island and Judd, Shinglemill, Christianson, and Fisher Creeks. The areas that are excluded are the South Fork Skykomish above Sunset Falls, Snoqualmie above Snoqualmie Falls and Red Creek, a tributary to the White River, because they either do not have any ESA- or MSA-listed species or habitat or, in case of the SF Skykomish where ESA-listed salmonids are passed above a natural barrier, the land is dominated by federally managed forest and wilderness lands and the amount of potential new development under King County jurisdiction is very small. See chapter 3 for a comprehensive discussion of the presence of ESA- and MSA-listed species in King County.
Overview of the Document The following is a brief overview of King County’s Programmatic Habitat Assessment: Chapter 1: King County Programmatic Habitat Assessment Chapter 1 includes a statement of the purpose of King County’s Programmatic Habitat Assessment, brief overview of the Biological Opinion, requirements and schedule for compliance, a summary of King County’s initial submittal to FEMA and FEMA’s response to that submittal, and an overview of the King County Programmatic Habitat Assessment. Chapter 2: Protected Species Chapter 2 describes those indigenous salmonid stocks that are listed under the Endangered Species Act (ESA) and the Magnuson-Stevens Act (MSA) that inhabit water bodies shown in FEMA’s FIRMs. This chapter discusses the species description and life history, the factors related to the decline in the species, the habitat needs, use of the floodplains and the abundance and trends. Chapter 3: Protected Species Utilization of Floodplain Habitat Chapter 3 is a more detailed analysis of the habitat characterizations by Water Resource Inventory Areas (WRIA). Each basin is described by its geology and topography, human occupation, the environment, and ESA and MSA species present.

King County National Flood Insurance Program Biological Opinion . Compliance Submittal and Programmatic Habitat Assessment
1-6
Chapter 4: Regulatory Environment Chapter 4 begins with an overview of land use planning in King County and a description of the zoning classifications applied to floodplain lands. The bulk of the chapter is a comprehensive overview of King County’s critical areas, clearing and grading, and stormwater regulations. Chapter 5: Non-regulatory and Non-floodplain Regulatory Protection and Restoration Actions Chapter 5 describes the wide range of non-regulatory programs that contribute toward protection of habitat. These include such programs as: Transfer of Development Rights, Farmland Preservation Program, Livestock Program, Forest Lands Program, and the Open Space Taxation Program. In addition, there is an overview of the capital improvement projects that are either specifically habitat restoration projects or other projects that include habitat restoration above and beyond mitigation for impacts. Chapter 6: Land Cover and Land Use Assessment Chapter 6 provides a description of the methodology used to complete the King County Programmatic Habitat Assessment. This chapter also includes the data on acres and parcels that are subject to future development within King County’s floodplains, and the assumptions used to assess the future impacts to ESA- and MSA-listed species. Chapter 7: Effects of Actions Chapter 7 describes the probable biological effects of development measured by the pathways identified by the National Marine Fisheries Service and United States Fish and Wildlife to identify baseline conditions within the project area and then predict likely effects. The factors evaluated include water quality (temperature, sediment/turbidity, chemical contamination/nutrients); habitat access (physical access); habitat elements (substrate, large woody debris, pool frequency, pool quality, off-channel habitat, refugia); channel condition and dynamics (width/depth ratio, streambank condition, stream buffers, floodplain connectivity); and flow/hydrology (altered peak/base flows, drainage network increase, road density/location, riparian reserves). The second half of this chapter evaluates the effects on ESA- and MSA-listed species—direct, indirect, cumulative, interdependent, interrelated and beneficial. This chapter provides an overview of conservation measures, mitigation, and monitoring and maintenance. Chapter 7 concludes with a determination of effect for each of the ESA- and MSA-listed species in King County. Chapter 8: Response to FEMA on King County’s September 22, 2010 Checklist Chapter 8 is a written response to the specific questions FEMA raised in their February 18, 2011 response to King County’s September 22, 2010 checklist submittal for compliance with the Biological Opinion. References References can be found at the end of each chapter. Appendix A: Justification for King County’s Buffer Standards Appendix A is a short paper that assessed the basis, limits and applicability of buffers recommended by Knutson and Naef (1997), the document cited as the basis for NOAA’s BiOp buffers. The paper also describes the buffer requirements established by King County in both the Critical Areas Ordinance (2004) and the proposed Shoreline Master Program update (King County Council passed in 2010) which were derived from best available science (BAS circa 2004) using contemporary science in combination with both comprehensive reach and watershed scale information on ecology, biology, and land use conditions accumulated over several decades.

King County National Flood Insurance Program Biological Opinion . Compliance Submittal and Programmatic Habitat Assessment
1-7
Appendix B: Agricultural Drainage Assistance Program (ADAP) Appendix B includes information about King County’s Agricultural Drainage Assistance Program (ADAP). This program was established by King County to help farmers navigate the permitting process and to provide assistance in the implementation of best management practices required by federal, state, and local regulations. Appendix C: Non-Regulatory Programs and Projects Appendix C includes examples of King County’s non-regulatory restoration and protection programs to acquire land, provide conservation incentives to private landowners, and construct projects that protect and restore floodplain habitat process, structure, and function. Appendix D: Maps Appendix D includes several maps illustrating the protected area in unincorporated King County, as well as the assessment of potential development impacts.
Conclusion Development in unincorporated King County is subject to critical area, clearing and grading, and stormwater regulations that were developed through a Best Available Science process under the Growth Management Act. As NMFS notes in the NFIP Biological Opinion, these regulations exceed the minimum requirements of the NFIP and, taken together, “minimize the effects of floodplain development on fish habitat and habitat forming processes.” This programmatic habitat assessment and evaluation of potential future development impacts confirms NMFS’ conclusion, and further demonstrates that future development impacts may affect but are not likely to adversely affect habitat conditions for protected species in King County’s watersheds. In addition to these regulatory actions, King County implements a variety of incentive-based conservation programs and has invested significantly in habitat protection and restoration actions that benefit protected species.

Chapter 2
Protected Species

King County National Flood Insurance Program Biological Opinion . Compliance Submittal and Programmatic Habitat Assessment
2‐i
Chapter 2 Contents
Overview .................................................................................................................................... 2-1 Protected Species Table ............................................................................................................ 2-1 Protected Species Primary Constituent Elements ..................................................................... 2-3
Primary Constituent Elements (PCEs) for ESA and MSA Listed Salmon and Steelhead ..... 2-3
Salmon and Steelhead PCEs ............................................................................................. 2-3 Bull Trout PCEs .................................................................................................................. 2-3 Killer Whale PCSs .............................................................................................................. 2-4 Puget Sound Chinook (Onchorynchus tshawytscha) ......................................................... 2-4 Steelhead Trout (Onchorynchus mykiss) .......................................................................... 2-11 Bull Trout (Salvalinus confluentus) ................................................................................... 2-14 Coho Salmon (Onchorynchus kisutch) ............................................................................. 2-17 Pink Salmon (Oncorhynchus gorbuscha) ......................................................................... 2-19 Southern Resident Killer Whale (Orcinus orca) ................................................................ 2-21
References ............................................................................................................................... 3-23
Tables Table 2-1 Occurrence of listed species and critical habitat in or near the study area ............... 2-2 Table 2-2 Puget Sound Chinook ESU status at a glance ......................................................... 2-6
Figures Figure 2-1 Drainage area of Puget Sound basins that support Chinook salmon ...................... 2-5

King County National Flood Insurance Program Biological Opinion . Compliance Submittal and Programmatic Habitat Assessment
2‐ii
King County National Flood Insurance Program Biological Opinion . Compliance Submittal and Programmatic Habitat Assessment
2‐1
Chapter 2 – Protected Species
Overview
This report focuses specifically on indigenous species that are listed under the Endangered Species Act (ESA) and the Magnuson-Stevens Act (MSA). Aquatic habitats areas within floodplains depicted in FEMA’s FIRMs within the study area support three distinct salmonid stocks and one distinct stock of marine mammals that are listed as threatened under the ESA: the Puget Sound Evolutionarily Significant Unit (ESU) of Chinook salmon (Oncorhynchus tshawytscha) (Myers et al. 1998; Rosenberg 1999); the Puget Sound ESU of steelhead trout (Onchorynchus mykiss) (Hard et al. 2007; Oliver 2008a), and the West Coast/Puget Sound Distinct Population Unit (DPU) of bull trout (Salvelinus confluentus) (Barry 1999). In 2005 NOAA Fisheries listed the Southern Resident population of killer whales (Orcinus orca) as endangered under the ESA (Hogarth 2005; Caretta et al. 2010, NMFS 2011). These orcas spend several months of the summer and fall each year in Washington State's Puget Sound including in nearshore areas of Vashon Island shown on FEMA’s FIRMs. Puget Sound coho salmon (Onchorhynchus kisutch) and Puget Sound pink salmon (Oncorhynchus gorbuscha) are listed under the MSA, which requires identification of Essential Fish Habitat (EFH) (Oliver 2008b) and federal agencies to consult with NOAA Fisheries on activities that may adversely affect EFH. The MSA defines EFH as those waters and substrate necessary to fish for spawning, breeding, feeding, or growth to maturity.
Protected Species Table Table 2-1 lists the three salmonid fish species listed as Threatened under the federal ESA, and species managed under the federal MSA for which EFH has been designated.

King County National Flood Insurance Program Biological Opinion . Compliance Submittal and Programmatic Habitat Assessment
2‐2
Table 2-1. Occurrence of listed species and critical habitat in or near the study area.
Common Name
Scientific Name ESA Status
EFH Species Jurisdiction
Critical Habitat Present
Biological Requirements
and Population
Trends Puget Sound Evolutionarily Significant Unit (ESU) Chinook Salmon
Oncorhynchus tshawytscha
Threatened Yes NMFS Yes Nehlsen et al. 1991; Myers et al. 1998; WDFW 2002
Puget Sound Distinct Population Segment (DPS) Steelhead Trout
Oncorhynchus mykiss
Threatened Yes NMFS No Ford et al. 2010, WDFW 2002
Coastal-Puget Sound Distinct Population Segment (DPS) Bull Trout
Salvelinus confluentus
Threatened No USFWS Yes Kraemer 1994. WDFW, Draft publication and WDFW 1998.; Barry 1999, WDFW 2002. Manson 2005
Southern Resident Killer Whale
Orcinus orca Endangered No NMFS Yes Wiles 2004; NMFS 2006, Carretta et al. 2009
Puget Sound Distinct Population Segment (DPS) Coho Salmon
Oncorhynchus kisutch
Not Warranted
Yes NMFS No Schmitten 1995, WDFW 2002, Ford et al, 2010
Puget Sound Distinct Population Segment (DPS) Pink Salmon
Oncorhynchus gorbuscha
Not Warranted
Yes NMFS No WDFW 2002, Good et al. 2005, Ford et al. 2010

King County National Flood Insurance Program Biological Opinion . Compliance Submittal and Programmatic Habitat Assessment
2‐3
Protected Species Primary Constituent Elements
Primary Constituent Elements (PCEs) for ESA and MSA Listed Species
Salmon and Steelhead PCEs On September 2, 2005, NMFS designated critical habitat for 12 salmon and steelhead ESUs in California and the Pacific Northwest (Hogarth 2005). Designated critical habitat for salmon discussed in this report includes all waterbodies addressed in this report shown within 100-year floodplains shown on FEMA FIRMs that support ESA and MSA protected species. Specific primary constituent elements (PCEs) for salmon and steelhead in freshwater and marine/estuarine areas, as defined by NMFS (Hogarth 2005) include: • Freshwater spawning sites with water quantity and quality conditions and substrate
supporting spawning, incubation and larval development. • Freshwater rearing sites with water quantity and floodplain connectivity to form and
maintain physical habitat conditions, and support juvenile growth and mobility; water quality and forage supporting juvenile development; and natural cover such as shade, submerged and overhanging large wood, log jams and beaver dams, aquatic vegetation, large rocks and boulders, side channels, and undercut banks.
• Freshwater migration corridors free of obstruction with water quantity and quality
conditions and natural cover such as submerged and overhanging large wood, aquatic vegetation, large rocks and boulders, side channels, and undercut banks supporting juvenile and adult mobility and survival.
• Estuarine areas free of obstruction with water quality, water quantity, and salinity
conditions supporting juvenile and adult physiological transitions between fresh- and saltwater; natural cover such as submerged and overhanging large wood, aquatic vegetation, large rocks and boulders, and side channels; and juvenile and adult forage, including aquatic invertebrates and fishes, supporting growth and maturation.
• Nearshore marine areas free of obstruction with water quality and quantity conditions and
forage, including aquatic invertebrates and fishes supporting growth and maturation; and natural cover such as submerged and overhanging large wood, aquatic vegetation, large rocks and boulders, and side channels.
• Offshore marine areas with water quality conditions and forage, including aquatic invertebrates and fishes, supporting growth and maturation.
All of the above PCEs except offshore marine areas occur within the project Action Area.
Bull Trout PCEs The PCEs for bull trout include, but are not limited to: space for individual and population growth and for normal behavior; food, water, or other nutritional or physiological
King County National Flood Insurance Program Biological Opinion . Compliance Submittal and Programmatic Habitat Assessment
2‐4
requirements; cover or shelter; sites for breeding, reproduction, or rearing of offspring; and habitats that are protected from disturbance or are representative of the historic geographical and ecological distributions of a species. All the areas proposed as critical habitat for bull trout are within the historic geographic range of the species and contain enough of these physical or biological features essential to the conservation of the species for the species to be able to carry out normal biological function (Manson 2005).
Killer Whale PCEs The PCEs for Southern Resident killer whales are water quality to support growth and development; prey species of sufficient quantity, quality and availability to support growth and development; sound levels that do not exceed thresholds that inhibit communication or foraging activities or result in temporary or permanent hearing loss; and safe passage conditions to support migration and foraging (NMFS 2006).
Puget Sound Chinook (Onchorynchus tshawytscha) Species Description and Life History Chinook salmon (Oncorhynchus tshawytscha), also commonly referred to as king, spring, quinnat, Sacramento, California, or tyee salmon, is the largest of the Pacific salmon (Myers et al. 1998). The species historically ranged from the Ventura River in California to Point Hope, Alaska, in North America; and in northeastern Asia from Hokkaido, Japan, to the Anadyr River in Russia (Healey 1991). Additionally, Chinook salmon have been reported in the Mackenzie River area of northern Canada (McPhail and Lindsey 1970). Chinook salmon exhibit up multiple life history variations including a range of ages at return and periods of residence in freshwater and estuarine habitat (Healy 1983). Gilbert (1912) initially described two generalized freshwater life history types: “stream-type” Chinook salmon that reside in freshwater for a year or more following emergence, and “ocean-type” fish that migrate to the ocean within their first year. Healey (1983, 1991) promoted the use of broader definitions for ocean type and stream type to describe two distinct races of Chinook salmon. This racial approach incorporates life history traits, geographic distribution, and genetic differentiation, and provides a valuable frame of reference for comparisons of Chinook salmon populations. For this reason, the NOAA Fisheries’ Biological Review Teams that review the status of Chinook salmon populations have adopted the broader “racial” definitions of ocean and stream type in reviews of the status of Chinook populations managed under the ESA. Of the two life history types, ocean-type Chinook salmon exhibit the most variable history trajectories. Ocean-type Chinook juveniles outmigrate to the ocean as fry, subyearling juveniles (during their first spring or fall), or as yearling juveniles (during their second spring), depending on environmental conditions. Ocean-type Chinook salmon also undertake distinct, coastally oriented, ocean migrations. The timing of the return to freshwater and spawning is closely related to the ecological characteristics of a population’s spawning habitat. Five different run times are expressed by different ocean-type Chinook salmon populations: spring, summer, fall, late-fall, and winter. In general, early run times (spring and summer) are exhibited by populations that use high spring flows to access headwater or interior regions. Ocean-type populations within a basin that express different run times appear to have evolved from a common source population. Stream-type populations appear to be nearly obligate yearling outmigrants (although in rare instances smolts outmigrate as two-year olds). Stream-type Chinook undertake extensive offshore ocean migrations and generally return to freshwater as spring- or summer-run fish. Stream-type populations are found in northern British Columbia, Alaska, and the headwater regions of the Fraser River and Columbia River

King County National Flood Insurance Program Biological Opinion . Compliance Submittal and Programmatic Habitat Assessment
2‐5
interior tributaries. Prior to development of the ESU policy (Waples 1991), NMFS recognized Sacramento River winter-run Chinook salmon as a distinct population segment (DPS) under the ESA (NMFS 1987). Subsequently, in reviewing the biological and ecological information concerning West Coast Chinook salmon, Biological Review Teams (BRTs) have identified Puget Sound Chinook salmon as one of several evolutionarily significant units from Washington, Oregon, and California and Idaho. In the United States, Chinook salmon are found from the Bering Strait area off Alaska south to Southern California. Historically, they ranged as far south as the Ventura River in California. Chinook salmon also occur along the coast of Siberia and south to Hokkaido Island, Japan. The Puget Sound Chinook salmon ESU is composed of 31 historically quasi-independent populations, 22 of which are believed to be extant currently (see Table 2-1) (Ruckelshaus et al. 2006). Figure 2-1 lists the extant stocks of Puget Sound Chinook and sizes of the drainages they inhabit. The nine populations presumed to be extinct are mostly early returning fish, and formerly returned to streams in mid to southern Puget Sound, Hood Canal and the Strait of Juan de Fuca. In addition to these outright population losses, the full historical diversity of Chinook in both the Lake Sammamish and Cedar basins no longer exists, Green River early run Chinook are extinct (although it is not clear whether these fish represented an historically independent population), and White River late run Chinook are no longer extant (Ruckelshaus et al. 2006).
Figure 2-1. Drainage area of Puget Sound basins that support Chinook salmon.
King County National Flood Insurance Program Biological Opinion . Compliance Submittal and Programmatic Habitat Assessment
2‐6
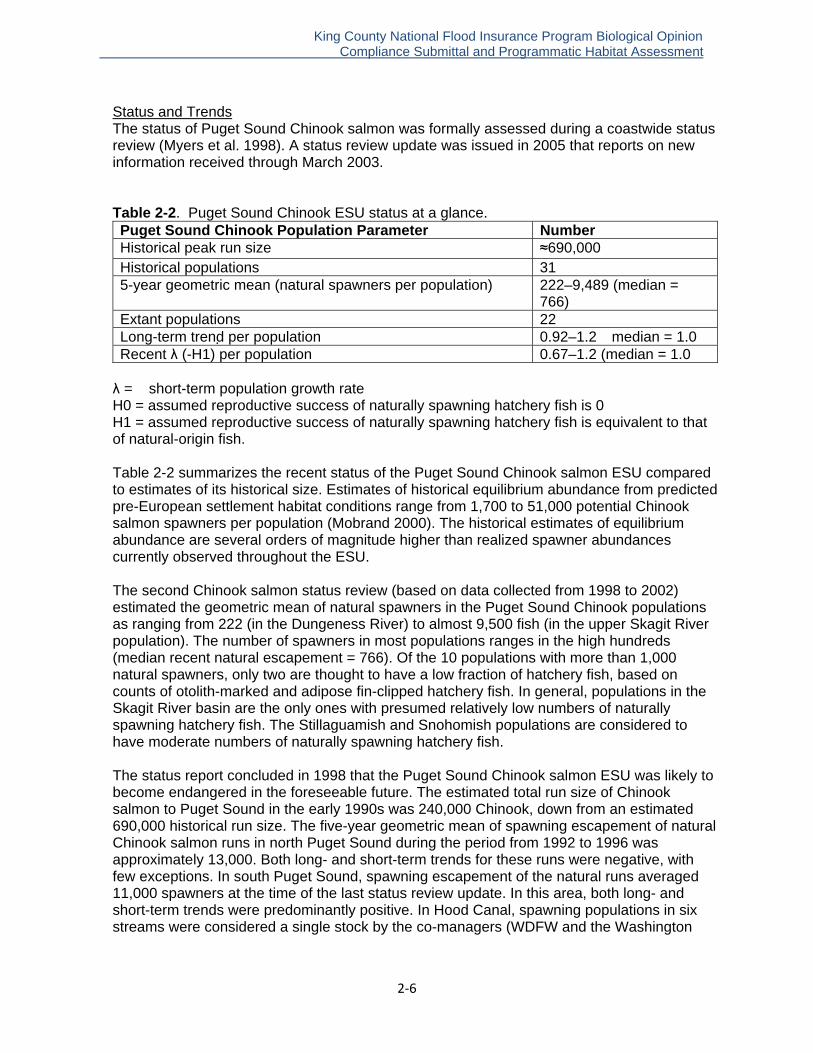
Status and Trends The status of Puget Sound Chinook salmon was formally assessed during a coastwide status review (Myers et al. 1998). A status review update was issued in 2005 that reports on new information received through March 2003. Table 2-2. Puget Sound Chinook ESU status at a glance. Puget Sound Chinook Population Parameter Number Historical peak run size ≈690,000 Historical populations 31 5-year geometric mean (natural spawners per population) 222–9,489 (median =
766) Extant populations 22 Long-term trend per population 0.92–1.2 �median = 1.0� Recent λ (-H1) per population 0.67–1.2 (median = 1.0�
λ = short-term population growth rate H0 = assumed reproductive success of naturally spawning hatchery fish is 0 H1 = assumed reproductive success of naturally spawning hatchery fish is equivalent to that of natural-origin fish. Table 2-2 summarizes the recent status of the Puget Sound Chinook salmon ESU compared to estimates of its historical size. Estimates of historical equilibrium abundance from predicted pre-European settlement habitat conditions range from 1,700 to 51,000 potential Chinook salmon spawners per population (Mobrand 2000). The historical estimates of equilibrium abundance are several orders of magnitude higher than realized spawner abundances currently observed throughout the ESU. The second Chinook salmon status review (based on data collected from 1998 to 2002) estimated the geometric mean of natural spawners in the Puget Sound Chinook populations as ranging from 222 (in the Dungeness River) to almost 9,500 fish (in the upper Skagit River population). The number of spawners in most populations ranges in the high hundreds (median recent natural escapement = 766). Of the 10 populations with more than 1,000 natural spawners, only two are thought to have a low fraction of hatchery fish, based on counts of otolith-marked and adipose fin-clipped hatchery fish. In general, populations in the Skagit River basin are the only ones with presumed relatively low numbers of naturally spawning hatchery fish. The Stillaguamish and Snohomish populations are considered to have moderate numbers of naturally spawning hatchery fish. The status report concluded in 1998 that the Puget Sound Chinook salmon ESU was likely to become endangered in the foreseeable future. The estimated total run size of Chinook salmon to Puget Sound in the early 1990s was 240,000 Chinook, down from an estimated 690,000 historical run size. The five-year geometric mean of spawning escapement of natural Chinook salmon runs in north Puget Sound during the period from 1992 to 1996 was approximately 13,000. Both long- and short-term trends for these runs were negative, with few exceptions. In south Puget Sound, spawning escapement of the natural runs averaged 11,000 spawners at the time of the last status review update. In this area, both long- and short-term trends were predominantly positive. In Hood Canal, spawning populations in six streams were considered a single stock by the co-managers (WDFW and the Washington
King County National Flood Insurance Program Biological Opinion . Compliance Submittal and Programmatic Habitat Assessment
2‐7
treaty tribes) because of extensive transfers of hatchery fish (WDF et al. 1993). Fisheries in the area were managed primarily for hatchery production and secondarily for natural escapement; high harvest rates directed at hatchery stocks resulted in failure to meet natural escapement goals in most years. Long-term trends in abundance noted in the 1998 status review for naturally spawning populations of Chinook salmon in Puget Sound indicated that approximately half the populations are declining, and half are increasing in abundance over the length of available time series. The median over all populations of long-term trend in abundance is 1.0 (range 0.92–1.2), indicating that most populations were just replacing themselves. Over the long term, the most extreme declines in natural spawning abundance have occurred in the combined Dosewallips and Elwha populations. Those populations with the greatest long-term population growth rates are the North Fork Nooksack and White rivers. All populations were considered likely to have a moderate to high fraction of naturally spawning hatchery fish, making it difficult to determine with precision trends in naturally spawning, natural-origin Chinook salmon populations. Fewer populations exhibited declining trends in abundance over the short term than over the long term—four of 22 populations in the ESU declined from 1990 to 2002 (median = 1.06, range = 0.96–1.4). In general, populations with a relatively high proportion of hatchery-original natural spawners tended to have greater declines in short-term abundance than in those populations with a lower proportion of hatchery fish. The most extreme short-term declines in natural spawner abundance have occurred in the upper Sauk, Cedar, Puyallup, and Elwha populations. Of these populations, only the upper Sauk is likely to have a low fraction of hatchery fish in escapements. The biggest estimated short-term population declines were in the Green, Skykomish, North Fork Stillaguamish, and North Fork Nooksack populations. The populations with the most positive short-term trends and population growth rates are the combined Dosewallips and White river populations. Both of these populations are thought to have a moderate fraction of naturally spawning hatchery fish, but because such estimates are not available, estimating the trends in natural-origin spawners is not possible. Factors of Decline and Threats Habitat throughout the Puget Sound ESU has been blocked or degraded. In general, forest practices impacted upper tributaries, and agriculture or urbanization impacted lower tributaries and mainstem rivers. WDF et al. (1993) cited diking for flood control, draining and filling of freshwater and estuarine wetlands, and sedimentation due to forest practices and urban development as problems throughout the ESU. Blockages by dams, water diversions, and shifts in flow regime due to hydroelectric development and flood control projects are major habitat problems in several basins. Bishop and Morgan (1996) identified a variety of critical habitat issues for streams in the range of this ESU, including changes in flow regime (all basins), sedimentation (all basins), high temperatures (Dungeness, Elwha, Green/Duwamish, Skagit, Snohomish, and Stillaguamish rivers), streambed instability (most basins), estuarine loss (most basins), loss of large woody debris (Elwha, Snohomish, and White rivers), loss of pool habitat (Nooksack, Snohomish, and Stillaguamish rivers), and blockage or passage problems associated with dams or other structures (Cedar, Elwha, Green/Duwamish, Snohomish, and White rivers).
King County National Flood Insurance Program Biological Opinion . Compliance Submittal and Programmatic Habitat Assessment
2‐8
The Puget Sound Salmon Stock Review Group of the Pacific Fishery Management Council (PFMC 1997) extensively reviewed habitat conditions for several stocks in this ESU. It concluded that reductions in habitat capacity and quality have contributed to escapement problems for Puget Sound Chinook salmon, citing evidence of direct losses of tributary and mainstem habitat due to dams, and of slough and side-channel habitat due to diking, dredging, and hydromodification. It also cited reductions in habitat quality due to land management activities. WDF et al. (1993) classified 11 out of 29 stocks in this ESU as being sustained, in part, through artificial propagation. Nearly two billion fish have been released into Puget Sound tributaries since the 1950s (Myers et al. 1998). The vast majority of these fish were derived from local returning fall-run adults. Returns to hatcheries have accounted for 57 percent of total spawning escapement, although the hatchery contribution to spawner escapement is probably much higher than that, due to hatchery-derived strays on the spawning grounds. Almost all releases into this ESU have come from stocks within this ESU, with the majority of within-ESU transfers coming from the Green River Hatchery or hatchery broodstocks derived from Green River stock (Marshall et al. 1995). The electrophoretic similarity between Green River fall-run Chinook salmon and several other fall-run stocks in Puget Sound (Marshall et al. 1995) suggests that there may have been a significant effect from some hatchery transplants. Overall, the pervasive use of Green River stock throughout much of the extensive hatchery network that exists in this ESU may reduce the genetic diversity and fitness of naturally spawning populations. Harvest impacts on Puget Sound Chinook salmon stocks were quite high. Ocean exploitation rates on natural stocks averaged 56-59 percent; total exploitation rates averaged 68-83 percent (1982-1989 brood years) (PFC 1994). Total exploitation rates on some stocks have exceeded 90 percent (PFC 1994). Previous assessments of stocks within this ESU identified several stocks as being at risk or of concern (reviewed in Myers et al. 1998). The Puget Sound Technical Recovery Team (TRT) also estimated the total number of hatchery-origin Chinook salmon returning to streams (Ruckleshaus 2006). For each population, these estimates include the total return—returns to natural spawning grounds and to hatchery racks within a population’s geographic boundaries—excluding possible strays of hatchery fish from outside the population’s boundaries. It was apparent that even populations of Chinook salmon in northern Puget Sound (which is not a hatchery production management area) receive significant numbers of adult hatchery fish returning each year. The average annual numbers of juvenile releases declined since the time of the earlier status review in the Nooksack, Skagit, and Green river basins, but releases remained roughly the same in the North Lake Washington/Cedar, White/Puyallup rivers, and south Puget Sound streams. In contrast, juvenile Chinook salmon releases increased in the Snohomish and Elwha river basins, in eastern Kitsap Peninsula streams, and in Hood Canal. With the exception of the Skagit and Stillaguamish river basins, all major watersheds in Puget Sound receive annual releases of over a million (close to seven million in Hood Canal) juvenile Chinook salmon. The most dramatic change in recent natural escapement estimates from the previous status assessment was in the Green River, for which the more recent natural-origin escapement estimate was lower than the previous one by almost 5,000 spawners. This apparent drop in natural escapement was probably due primarily to new information about the fraction of hatchery fish that are spawning naturally. Otherwise throughout the ESU, the estimates of trends in natural spawning escapements for Puget Sound Chinook salmon populations were similar to the previous status review of Puget
King County National Flood Insurance Program Biological Opinion . Compliance Submittal and Programmatic Habitat Assessment
2‐9
Sound Chinook salmon conducted with data through 1997. Some populations exhibited improvements in trends relative to the last status assessment, and others showed more significant declines. The median across populations of the long-term trend in natural spawners was a 1.1 percent decline per year through 1997, compared to a median estimate indicating a flat trend through 2002. Twelve populations had declining long-term trends through 1997, and 10 populations had declining long-term trends through 2002. Short-term trends were generally more positive in the years analyzed in the second status review—the median trend across 22 populations through 1997 was a 4 percent decline per year, and the median trend through 2002 was a 1.1 percent increase per year. Fourteen populations showed declining short term trends at the time of the previous status reviews, and only four populations exhibit declining short-term trends in recent years. The TRT noted that information on the fraction of naturally spawning, hatchery-origin fish for 10 of the 22 populations of Chinook salmon in Puget Sound remained limited, so our understanding of the trend in natural-origin spawners among populations across the ESU was incomplete. The spatial distribution of Chinook salmon populations with a strong component of natural-origin spawners in the Puget Sound ESU did not change since the first status assessment. Populations containing significant numbers of natural-origin spawners whose status could be reliably estimated occur in the Skagit River basin, the South Fork Stillaguamish, and the Snohomish River basin. The remaining populations in mid- and south Puget Sound, Hood Canal, and the Strait of Juan de Fuca had significant (but non-quantifiable) fractions of hatchery origin spawners, so their contribution to spatial structure in the ESU is not possible to estimate. The change in diversity in the ESU from historical conditions also did not change since the first status review. An estimated 31 independent populations of Chinook salmon occurred historically in the ESU, and 22 remain extant. All but one of the nine putatively extinct Chinook salmon stocks were early run populations (or a component of such a population). The BRT considered the loss of early run Chinook stocks in Puget Sound to represents an important loss of part of the evolutionary legacy of the historical ESU. The 2010 status report reflected updates in population data through 2009 received from the co-managers. Based on available escapement data for the period 1985-2009, ESU natural spawning abundance was at a mid range from 1985-1990, declined during the period from 1991-1999, increased from 2000-2004, and then decreased again from 2004-2009, with 2009 being back down at the 1990’s low levels. The highest abundances were in 2002, 2004, and 2006, with 2004 having the highest abundance with 45,000 natural original returning spawners and 60,000 total natural spawners (including naturally-spawning hatchery-origin fish). Hatchery fish contributed from 15 to 40 percent of the natural spawners for the ESU as a whole during these years. The most recent five-year (2005-2009) geometric mean of natural spawners in populations of Puget Sound Chinook salmon ranged from 81 (in the Mid-Hood Canal population) to almost 10,345 fish (in the upper Skagit population). Most populations contained natural spawners numbering in the high hundreds (median recent natural escapement = 909). No trend was notable for the total ESU escapements, while trends varied from decreasing to increasing among populations. During this period (1985-2000), returns (pre-harvest run size) from the natural spawners was highest in 1985 and showed a decline through 1994, remained low through 1999, increased
King County National Flood Insurance Program Biological Opinion . Compliance Submittal and Programmatic Habitat Assessment
2‐10
in 2000 and again in 2001 and has shown a decline through 2009, with 2009 having the lowest returns since 1997. Pre-harvest returns reflect productivity of the populations due to environmental conditions, while spawning abundance returns reflect both environmental variation and the pressures from harvest and broodstock take. While natural origin spawner escapements remained fairly constant during this time period (1985-2009), returns and productivity continued to decline since the 2005 status review. Median recruits per spawner for the last five-year period (from brood years 2002-2006) is the lowest over any of the five year intervals. Factors of Decline and Threats Chinook salmon on the west coast of the United States have experienced declines in abundance in the past several decades as a result of both natural and human factors. Forestry, agriculture, mining, and urbanization have degraded, simplified, and fragmented habitat. Water diversions for agriculture, flood control, domestic, and hydropower purposes (especially in the Columbia River and Sacramento-San Joaquin Basins) have greatly reduced or eliminated historically accessible habitat. Studies indicate that in most western states, about 80 to 90 percent of the historic riparian habitat has been eliminated. Further, it has been estimated that during the last 200 years, the lower 48 states have lost approximately 53 percent of all wetlands and the majority of the rest are severely degraded. Wetlands in Washington and Oregon are estimated to have diminished by one third, while California has experienced a 91 percent loss of its wetland habitat. Loss of habitat complexity has also contributed to the decline of Chinook salmon. For example, in national forests in Washington, there has been a 58 percent reduction in large, deep pools due to sedimentation and loss of pool-forming structures such as boulders and large wood. Similarly, in Oregon, the abundance of large, deep pools on private coastal lands has decreased by as much as 80 percent. Sedimentation resulting from land use activities is recognized as a primary cause of habitat degradation in the range of west coast Chinook salmon (FEMAT 1993). Historically, Chinook salmon were abundant in many Pacific coastal and interior waters of the United States. Chinook salmon support important tribal, commercial, and recreational fisheries throughout their range, contributing millions of dollars to numerous local economies, as well as providing important cultural and subsistence needs for Native Americans. The extent of that support was much greater historically. Overfishing in the early days of European settlement depleted many stocks of Chinook and other salmonids even before extensive habitat degradation began. However, following the degradation of many west coast aquatic and riparian ecosystems, exploitation rates were higher than many Chinook populations could sustain. Therefore, harvest may have contributed to the further decline of some populations. Introductions of nonnative species and habitat modifications have increased predator populations in numerous river systems—thereby increasing the level of predation that salmonids experienced. Chinook salmon face predation pressures from native and nonnative fish, several species of birds, as well as from marine mammals. Predation by marine mammals is also of concern in areas where Chinook salmon run sizes are dwindling. Even though Chinook salmon and marine mammals have coexisted for thousands of years, most investigators consider predation a significant contributing factor to the declines being observed in Chinook salmon populations, particularly in areas where habitat alterations have tipped the predator/prey balance in favor of predators. Chinook salmon are exposed to numerous bacterial, viral, and parasitic organisms during their life cycle. Native Chinook salmon have evolved with certain of these organisms, but the widespread use of artificial
King County National Flood Insurance Program Biological Opinion . Compliance Submittal and Programmatic Habitat Assessment
2‐11
propagation has introduced some exotic organisms not historically present in some watersheds. Some scientific studies may indicate that Chinook salmon are more susceptible to disease organisms than other salmonids. Habitat conditions such as low water flows and high temperatures can exacerbate susceptibility to disease, though hatchery Chinook salmon appear to be more susceptible than native or naturally spawning Chinook salmon. Natural climatic conditions have served to exacerbate the problems associated with degraded and altered riverine and estuarine habitats. Persistent drought conditions have reduced already limited spawning, rearing and migration habitat. Further, climatic conditions appear to have resulted in decreased ocean productivity which may significantly affect Chinook salmon abundance. This factor can be particularly damaging to Chinook salmon populations facing degraded freshwater habitat conditions. In an attempt to mitigate the loss of habitat, extensive hatchery programs have been implemented throughout the range of Chinook salmon. While some of these programs have been successful in providing fishing opportunities, the impacts of these programs on native, naturally-reproducing stocks are not well understood. Competition, genetic introgression, and disease transmission resulting from hatchery introductions may significantly reduce the production and survival of native, naturally-reproducing Chinook salmon. Furthermore, collection of native Chinook salmon for hatchery broodstock purposes may result in additional negative impacts to small or dwindling natural populations. It is important to note, however, that artificial propagation could play an important role in Chinook salmon recovery and that some hatchery populations of Chinook salmon may be deemed essential for the recovery of threatened or endangered Chinook salmon ESUs. In addition, alternative uses of supplementation, such as for the creation of terminal fisheries, must be fully explored to try to limit negative impacts to remaining natural populations. This use must be tempered with the understanding that protecting native, naturally-reproducing Chinook salmon and their habitats is critical to maintaining healthy, fully-functioning ecosystems. In conclusion, no single specific factor for decline is affecting Chinook salmon; rather, habitat destruction and modification, species overutilization for recreational purposes, and natural and human-made factors all have contributed to the decline of Chinook salmon. Floodplain Use Floodplain rearing has been shown to contribute to increased growth and larger sizes of wild salmon including Chinook compared to cohorts that rear in river mainstems (Sommer et al. 2001, Sommer et al. 2005); Jeffres et al. 2008 found that juvenile Chinook growth varies with river flow. Fish that can access complex habitats with a variety of hydraulic conditions grow more rapidly and experience mortality than fish that are confined to mainstem areas with faster velocity water. Fish that are entrained in flood flows and swept prematurely swept into estuarine areas also experience higher mortality than those that have access to complex floodplain habitat (Jeffres et al. 2008). Warmer temperatures and abundant prey in off-channel habitats also contribute to higher growths rates, which in turn can lead to higher juvenile survival rates (Lim and Marchetti 2003).
Steelhead Trout (Onchorynchus mykiss) Species Description and Life History The historic range of anadromous steelhead trout (Onchorynchus mykiss) extends from drainages that flow into the southern Gulf of Alaska to the northern Baja Peninsula in Southern California and includes the interior basins of the Columbia River. Anadromous steelhead occupy a band-line distribution across the North Pacific south of the Aleutian
King County National Flood Insurance Program Biological Opinion . Compliance Submittal and Programmatic Habitat Assessment
2‐12
archipelago, although the highest oceanic steelhead densities are found along the North Pacific Coast. Steelhead trout can reach up to 55 pounds (25 kg) in weight and 45 inches (120 cm) in length, though their average size is much smaller. They are usually dark-olive in color, shading to silvery-white on the underside with a heavily speckled body and a pink to red stripe running along their sides. Steelhead exhibit an unusual degree of life history plasticity, depending on their environment. All steelhead hatch in gravel-bottomed, fast-flowing, well-oxygenated rivers and streams, but that some stay in freshwater all their lives are called rainbow trout. Anadromous steelhead develop a slimmer profile, become more silvery in color, and typically grow to much larger sizes than rainbow trout. Steelhead adults migrate from the marine environment where they migrate for hundreds of miles before returning to their natal freshwater streams and rivers. Unlike other Pacific salmonids, they are iteroparous; in other words, they can spawn more than once and migrate from fresh to saltwater before returning to freshwater to spawn a second or even a third time. The maximum life span of steelhead is about 11 years. Males generally return to freshwater at two years, and females at three. Juvenile steelhead may spend up to seven years in freshwater before migrating to estuarine areas as smolts. Anadromous steelhead smolts are usually larger (15 to 20 cm total length) and rear longer in freshwater than those of coho and Chinook salmon. Smolt outmigration usually occurs in the spring, and anadromous steelhead remain the ocean for up to four years before returning to freshwater to spawn. Some populations return to freshwater after their first season in the ocean, return to the sea without spawning after one winter in freshwater. Timing of return to the ocean can vary, and even within a stream system there can be different seasonal runs depending the timing of the peak spawning period. Once at sea, steelhead may remain close to the mouth of their natal stream (Everest 1973), or migrate in the ocean for long distances (Harris 1988). Steelhead can be divided into two basic reproductive types based on the time of year—summer or winter, state of sexual maturity at the time of river entry and duration of spawning migration. Stream-maturing steelhead enter freshwater in a sexually immature condition between May and October and require several months to mature and spawn. Ocean-maturing enter freshwater between November and April with well-developed gonads, and spawn shortly thereafter. Coastal streams are dominated by winter-run steelhead, whereas inland steelhead of the Columbia River basin are almost exclusively summer-run fish. Some drainages have summer and winter populations. Steelhead may use the same large stream areas used by Chinook for spawning (albeit at different times of the year), or they may spawn in smaller headwater streams. Adult female steelhead will prepare a redd (or nest) in a stream area with suitable gravel substrate, water depth and water velocity and deposit eggs in four to five "nesting pockets" within a single redd. The eggs hatch in three to four weeks. Outmigration to the sea usually occurs in the spring. Juvenile steelhead and rainbow trout feed primarily on zooplankton. Adults feed on aquatic and terrestrial insects, mollusks, crustaceans, fish eggs, minnows, and other small fishes including other salmonids.
King County National Flood Insurance Program Biological Opinion . Compliance Submittal and Programmatic Habitat Assessment
2‐13
Steelhead can tolerate a wide range of temperature conditions, but do best where the dissolved oxygen concentration is at least seven parts per million. Spawning habitat consists of clean moderately coarse gravel substrate free of excessive silt. Deep low-velocity pools are important wintering habitats for juveniles and adults. During low flow periods zero-age steelhead typically occupy higher order tributaries and off-channel terrace tributaries and wetted areas on the margins of floodplains, while older fish tend to occupy riffles within larger channels (Roper et al. 1994). A study by Everest et al. (1986) that evaluated salmonid habitat improvements in Fish Creek, a tributary of the upper Clackamas River, found that juvenile steelhead habitat use varies with fish size and seasonally. Subyearling steelhead trout made significant use of all habitat types in the study area, but showed relatively little affinity for beaver ponds than coho salmon. Subyearling steelhead appeared to prefer quiet shallow habitats such as glides, alcoves, and side channels, but small fish also used riffle and pool margins. In late spring and early summer emergent steelhead fry used slow-velocity channel margins, whereas age l+ steelhead preferred deep, rocky pools as well as riffles, side channels, alcoves, and beaver ponds in descending order. Preferred winter habitat for age l+ steelhead trout consisted of boulder-dominated stream channel segments. Solazzi et al. (2000) found that streams with constructed floodplain channel habitats in western Oregon had greater summer populations of juvenile coho salmon (Oncorhynchus kisutch) and higher numbers of coho salmon, cutthroat trout (Onchorynchus clarki), and steelhead smolts than streams without such habitats. Resident rainbow trout tend to occur as large, self-sustaining populations only where there are major hydrological modifications of the watersheds such as the impoundments in the upper Cedar River watershed, or other impassable natural barriers such as Sunset Falls. In 1994, NMFS received a petition to list steelhead throughout its range in California, Oregon, Washington, and Idaho under the ESA (NMFS 2005). The Oregon Coast DPS was listed as a Species of Concern on April 15, 2004 (Cain 2004) . Critical habitat for 10 west coast steelhead DPSs was designated on September 2, 2005. On January 5, 2006, NMFS listed nine DPSs of west coast steelhead as threatened and one as endangered (Balsiger 2006). Some of them had been previously listed between 1996 and 1998, but, because of legal and other issues, all listings were reaffirmed and/or revised in 2006. The Puget Sound DPS was listed as threatened on May 11, 2007 (Rauch 2007). Protective regulations were issued by NOAA Fisheries on September 28, 2008, and the status of the West Coast DPS as threatened was reaffirmed along with NOAA Fisheries’ issuance of the latest five-year review on August 15, 2011 (Conant 2011). Population Abundance and Trends The Puget Sound steelhead DPS is composed primarily of winter-run populations. No abundance estimates exist for most of the summer-run populations; all appear to be small, most averaging less than 200 spawners annually. Summer-run populations are concentrated in northern Puget Sound and Hood Canal; only the Elwha River and Canyon Creek support summer-run steelhead in the rest of the DPS. Steelhead are most abundant in northern Puget Sound, with winter-run steelhead in the Skagit and Snohomish rivers supporting the two largest populations (approximately 3,000 and 5,000 respectively). Most Puget Sound populations have declined in recent decades. Widespread declines in
King County National Flood Insurance Program Biological Opinion . Compliance Submittal and Programmatic Habitat Assessment
2‐14
abundance and productivity in most natural populations have been dramatically affected by a number of large dams in the Puget Sound Basin that eliminated access to habitat or degraded habitat by changing river hydrology, temperature profiles, downstream gravel recruitment, and movement of large woody debris. In the lower reaches of rivers and their tributaries, urban development has converted natural areas into impervious surfaces causing increases in flood frequency, peak flow, and stormwater pollutants. The hydrologic changes have resulted in gravel scour, bank erosion, sediment deposition during storm events, and reduced summer flows (Moscrip and Montgomery 1997; Booth et al. 2002). Factors of Decline and Threats Factors of decline include timber harvest, genetic introgression with hatchery fish, conversion of land to agricultural uses, small (e.g., hung culverts) and large scale (e.g., dams) blockages, and major changes in stream hydroperiod due to logging and urbanization, excessive harvests and unfavorable fluctuations in climatic and oceanic conditions. The majority of steelhead produced within the Puget Sound region appears to be of hatchery origin, and continued heavy reliance on hatchery production may lead to loss of diversity within and among steelhead populations. Nonetheless, most hatchery fish are harvested, and estimates of hatchery fish escaping to spawn naturally are less than 15 percent of total natural escapement, except for the Tahuya (south Hood Canal) and Morse Creek (Clallam County) stocks where the hatchery proportion is approximately 50 percent. Another cause for concern is that hatchery production of steelhead originates from a single stock, Chambers Creek, which could increase genetic homogenization within the ESU despite management efforts to minimize introgression of the hatchery gene pool into natural populations via separation of hatchery and natural run timing and high harvest rates focused on hatchery runs. The status of certain stocks within the ESU is also of concern, especially the depressed status of most stocks in the Hood Canal area and steep declines of Lake Washington winter steelhead and Deer Creek summer steelhead (Hard et al. 2007). In addition, there is very little information regarding the abundance and status of summer steelhead in the Puget Sound ESU. Although the numbers of summer steelhead have historically been small relative to winter steelhead, they represent a substantially different life history strategy and loss of these fish would diminish the ecological and genetic diversity of the entire ESU. Uncertainty also exists regarding the degree of interaction between hatchery and natural stocks. The co-managers assume there is little overlap in spawning between natural and hatchery stocks of winter steelhead throughout the ESU is generally supported by available evidence, but for populations in many basins it is based largely on models and assumptions regarding run timing rather than empirical data. Because of their limited distribution in upper tributaries, summer run steelhead may be at higher risk than winter run steelhead from habitat degradation in larger, more complex watersheds (Hard et al. 2007).
Bull Trout (Salvelinus confluentus) Species Description and Life History Bull trout (Salvelinus confluentus) were listed in 1999 as threatened throughout their range in the coterminous United States, which includes Washington, Oregon, Idaho, Montana and Nevada. Bull trout are a cold-water fish of relatively pristine streams and lakes in northwestern North America. They are grouped with the char, within the salmonid family of fishes. They have more specific habitat requirements than most salmonids, including the "Four C's": Cold, Clean, Complex, and Connected habitat. Bull trout require
King County National Flood Insurance Program Biological Opinion . Compliance Submittal and Programmatic Habitat Assessment
2‐15
the coldest water temperatures; they require among the cleanest stream substrates for spawning and rearing; they require complex habitats, including streams with riffles and deep pools, undercut banks and lots of large logs; and they need connection from river, lake and ocean habitats to headwater streams for annual spawning and feeding migrations. Bull trout have been found in certain freshwater and saltwater areas within WRIAs 7, 8, 9 and 10, however, their distribution is scattered and patchy, primarily due to habitat degradation and fragmentation. They are excellent indicators of water quality and protecting and enhancing their habitat can improve the water quality of rivers and lakes throughout their range. Most bull trout populations are migratory, spending portions of their life cycle in larger rivers or lakes before returning to smaller streams to spawn, while some populations complete their entire life cycle in the same stream. Some bull trout in the Coastal-Puget Sound population are anadromous, i.e., they migrate between fresh water and the marine environment and thus have a more complex life history than the non-anadromous forms. Smolts typically move out to Puget Sound as early as late February but usually in April, May and early June, spending the remaining spring and summer months in the marine environment. They then return to the lower main stem rivers to begin their spawning migration in the late summer of that same year (Kraemer 1994). The historic distribution of bull trout in the Puget Sound basin is not well understood, but there is consensus that they now occur in a reduced part of their historic range. Adult bull trout typically spawn in the upper portion of watersheds. In most cases, anadromous bull trout define the upper limit of anadromous use in a watershed. Large adults have been documented over 120 river miles inland at an elevation of over 3,200 feet (Kraemer 1994). Spawning in the north Puget Sound drainages has been observed as early as August and as late as November. Females deposit anywhere from a few hundred to 5,000 eggs in their redds, depending on their size. The embryos incubate until spring; the surviving fry emerge from redds in April through May. Temperature may be the most important factor affecting bull trout distribution. Water temperatures in excess of 15°C are thought to limit bull trout distribution (Rieman and McIntyre 1993). Bull trout spawning is more dependent on temperature than time of year; stream temperatures must drop below 8°C for spawning to commence. Spawning activities usually stop or slow if stream temperatures rise above 8°C (Kraemer 1994). Water temperature also appears to be a critical factor for egg development. McPhail and Murray (1979) found that the survival to emergence for bull trout varied with water temperature: 0 to 20 percent survival in 8 to 10°C, 60 to 90 percent in 6°C, and 80 to 95 percent in 2 to 4°C. The substrate and water depth can vary greatly between spawning sites. However, spawning generally occurs in uniform substrate 0.2 to 2.0 inches in diameter and water from eight inches to two feet deep. Depending on water temperature, incubation takes about 130 days; embryo development requires the accumulation of about 635 temperature units (Meehan 1991). Eggs hatch around the end of January but the alevins may remain in the gravel until April. This extended rearing within the interstitial spaces of the gravel makes bull trout very sensitive to increased sediment loads.
King County National Flood Insurance Program Biological Opinion . Compliance Submittal and Programmatic Habitat Assessment
2‐16
Factors of Decline and Threats Bull trout were historically found throughout the Pacific Northwest, from northern California to the upper Yukon, as well as Siberia and Korea. Bull trout have declined due to habitat degradation and fragmentation, blockage of migratory corridors, poor water quality, past fisheries management, and the introduction of non-native species such as brown, lake and brook trout. While bull trout occur over a large area, their distribution and abundance has declined and several local extinctions have been documented. Many of the remaining populations are small and isolated from each other, making them difficult to monitor and susceptible to local extinctions. Expected climate change threatens bull trout throughout their range in the coterminous United States. With a warming climate, cool-enough spawning and rearing areas are expected to shrink during warm seasons, in some cases very dramatically, causing them to become even more isolated from one another. Climate change will likely interact with other stressors, such as habitat loss and fragmentation, invasions of non-native fish, disease and other threats, to render some current spawning, rearing and migratory habitats marginal or wholly unsuitable. Regulatory Status The USFWS is the lead regulatory agency for the listing of bull trout under the ESA, and has designated bull trout as a threatened species throughout its range in the lower 48 states. The bull trout critical habitat designation is intended to serve the following goals that are important for species recovery: Conserve opportunity for diverse life-history expression Conserve opportunity for genetic diversity Ensure bull trout are distributed across representative habitats Ensure sufficient connectivity among populations Ensure sufficient habitat to support population viability (e.g. abundance, trends) Consider threats to the species Ensure sufficient redundancy in conserving population units. In 2005, the Service designated approximately 3,828 miles of streams and 143,218 acres of lakes in Idaho, Montana, Oregon and Washington as critical habitat for the bull trout. Approximately 985 miles of shoreline paralleling marine habitat in Washington also was designated. In 2010, the U.S. Fish and Wildlife Service expanded the previously designated extent of critical habitat for bull trout throughout their U.S. range to 18,795 miles of streams and 488,252 acres of lakes and reservoirs in Idaho, Oregon, Washington, Montana and Nevada were designated as critical habitat for the wide-ranging fish. In Washington, 754 miles of marine shoreline also were designated. Critical habitat for bull trout includes geographic areas that contain features essential for the conservation of a listed species and other areas which the Service believes are essential for the conservation of the species. The critical habitat proposal applies only to the stream channel as defined by its ordinary high-water line as defined by the U.S. Army Corps of Engineers in 33 CFR 329.11. In areas for which high-water has not been defined, the width of the stream channel is defined by its bank-full elevation. The critical habitat proposal does not extend to the floodplain or the adjacent land. Bank-full elevation is the level at which water begins to leave the stream channel and move into the floodplain. This is reached at a discharge which generally recurs at 1- to 2-year intervals. The critical habitat designation extends from the bank-full elevation
King County National Flood Insurance Program Biological Opinion . Compliance Submittal and Programmatic Habitat Assessment
2‐17
on one side of the stream to the bank-full elevation on the opposite side. Even though the floodplain or the adjacent land may not be designated as critical habitat, effects to these areas are likely to be evaluated during the consultation process, if there is a federal nexus, due to the indirect effect that upland actions may have on identified as the physical and biological features essential to bull trout conservation. Critical habitat for marine nearshore areas extends from the mean higher high-water (MHHW) line, which is the average of all the higher high water heights of the two daily tidal levels, offshore to the depth of 33 feet (10 meters) relative to mean lower low water (MLLW). The MLLW line is the average of all the lower low-water heights of the two daily tidal levels (a zero tide level). This area equates to the average depth of the photic zone, which is the band of aquatic habitat along the shoreline in which organisms are exposed to light. The lateral extent of critical habitat in lakes is defined by the perimeter of the water body as mapped on standard 1:24,000 scale topographic maps.
Coho Salmon (Onchorynchus kisutch) Species Description and Life History Coho salmon have dark metallic blue or greenish backs with silver sides and a light belly and there are small black spots on the back and upper lobe of the tail while in the ocean. The gumline in the lower jaw has lighter pigment than Chinook salmon. Spawning fish in inland rivers are dark with reddish-maroon coloration on the sides. Coho range up to two feet (61 cm) in length, and can weigh up to 36 pounds (16 kg); their average weight is eight pounds (3.6 kg). Coho salmon are native to many drainages along the Pacific rim from the central California coast to the northwest coast of Alaska and Japan. They are found in a broader diversity of habitats than any other anadromous salmonid species including small tributaries of coastal streams, lakes and inland tributaries of large rivers (Meehan and Bjorn 1991). Adult coho salmon are semelparous; they migrate from saltwater environments between mid-summer and early winter to their natal freshwater streams and rivers where they spawn once before dying. They spawn in smaller streams or along the channel margins of larger streams with clean gravel substrates. The remainder of the life cycle is spent foraging in estuarine and marine waters of the Pacific Ocean. Most coho adults return to their stream of origin at age three, although some sexually mature males known as "jacks" return as two-year-olds. Incubation typically lasts for six to seven weeks before hatching of fry with disperse into available rearing areas upstream and downstream from incubation areas. Juveniles rear for one or more years before migrating to sea, and forage on and insects. Initially, juveniles occupy shallow areas along channel and pool margins, but as they grow they move into deeper, faster water. As water temperatures cool in the fall, juveniles seek areas out areas with more cover than the areas they occupied during the summer including side channels, sloughs, beaver ponds and other habitats with abundant woody debris, overhanging cover and dense overhanging vegetation. As the time for migration to the sea approaches, juvenile coho lose their parr marks and the dark back and light belly coloration exhibited by fish living in saltwater. Their gills and kidneys also begin to adapt to salt water at

King County National Flood Insurance Program Biological Opinion . Compliance Submittal and Programmatic Habitat Assessment
2‐18
this time. After entering saltwater, coho become pisciverous and grow rapidly prior to returning to fresh water. Because of the relatively prolonged residence of juveniles freshwater, coho salmon are particularly dependent on the availability of a variety of habitats for forage and cover, including waterbodies with appropriate temperature regimes; adequate food sources; natural cover including shade, large wood, overhanging vegetation, undercut banks; and unobstructed access to off-channel winter rearing areas such as side channels and ponds. Regulatory Overview The Central California coast coho ESU was listed as threatened on October 31, 1996. The Oregon coast coho ESU was listed as threatened on August 10, 1998. ESA critical habitat for the central California coast and southern Oregon/northern California coast ESU was designated on May 5, 1999. Critical habitat for Central California Coast and Southern Oregon/Northern California Coasts coho was designated on May 5, 1999. Critical habitat was designated for 19 ESUs of salmon and steelhead in Washington, Oregon, Idaho, and California on February 16, 2000. This critical habitat designation included all waterways, substrate and adjacent riparian zones below longstanding, naturally impassable barriers (i.e., natural waterfalls in existence for at least several hundred years). The Puget Sound/Strait of Georgia coho ESU was listed as a Species of Concern on April 15, 2004. The threatened and endangered ESUs of coho salmon were reaffirmed, and the Central California Coastal ESU was uplisted from threatened to endangered on June 28, 2005. The Oregon Coast ESU was listed as threatened on February 11, 2008. Abundance and Trends NOAA Fisheries completed a coastwide status review of coho salmon on July 25, 1995 (Schmitten 1995) in which it several coho ESUs throughout the west coast, including a Puget Sound/Strait of Georgia ESU. At that time NOAA Fisheries determined that listing the Puget Sound/Strait of Georgia ESU was not warranted, because relative to the other coho salmon ESUs, populations in the Puget Sound/Strait of Georgia ESU were abundant, and with some exceptions, run sizes and natural spawning escapements were generally stable. Nevertheless, the 1995 status review report stated that abundance in the Canadian populations in the ESU had declined more severely than in the U.S. populations over the long and short term. A recent status review update for Pacific salmon and steelhead concluded that the abundance of coho salmon in Puget Sound remains quite high (Ford et al. 2010). The single largest natural population (Snohomish River) had a geometric mean of 122,000 spawners during 2000-2008, reaching 252,000 fish in 2004. Trends in spawning abundance in the major natural production areas have remained fairly flat since 2005, but are down from the peaks seen in 2002-2004. Current spawning escapement is similar to levels in the 1990s (Ford et al. 2010). Exploitation rates have fallen dramatically since high levels in the vicinity of 80 percent in the late 1980s as stocks began to be managed for natural production within Puget Sound and almost a complete cessation of coho fisheries was implemented by Canada on the West Coast of Vancouver to protect critically depressed upper Fraser River coho. Recreational and commercial fisheries in Washington and Oregon waters also decreased beginning in 1999, when large scale marking of hatchery fish began. Since 2000 harvest of this ESU has remained stable in the range of 40 percent or less (Ford et al. 2010).
King County National Flood Insurance Program Biological Opinion . Compliance Submittal and Programmatic Habitat Assessment
2‐19
Factors of Decline and Threats The 1995 status review report evaluated potential threats to the viability of the Puget Sound/Strait of Georgia ESU, including fisheries overharvest in fisheries and hatchery operations (Weitcamp et al. 1995). The authors of the status review expressed considerable concern that over half of the U.S. portion of the run was hatchery fish, hatchery production in the Canadian portion of the run had also rapidly increased relative to low historical levels. Not surprisingly considering intense harvest levels and high hatchery production, the average size of adult coho in the Puget Sound/Strait of Georgia ESU had also decreased along with fecundity. The decrease in size and fecundity was expected to decrease productivity in the ESU as a whole. The overall conclusion for the ESU was that if present trends continued, the ESU was likely to become endangered in the foreseeable future, although it also recommended that further information would likely clarify some of these uncertainties Other threats identified in the assessment included widespread habitat degradation, droughts, and changes in ocean productivity, all of which could be expected to reduce ESU productivity. Despite these threats, the status review report noted total abundance of naturally-reproducing fish was fairly high and apparently stable. Because of this NOAA Fisheries concluded that listing was not warranted (Schmitten 1995). However, because of the threats to the overall health of this ESU, it was added it to the Candidate List (later known as the ‘‘Species of Concern List’’). Concerns associated with declining adult size included reduced fecundity, greater likelihood that redds would be destroyed by winter storms due to their shallower depth, the inability of salmon to successfully ascend challenging river reaches, and genetic changes such that populations would permanently lose the ability to produce large individuals; taken together, these would result in lower population productivity.
Pink Salmon (Oncorhynchus gorbuscha) Species Description and Life History Pink salmon is the smallest and most abundant Pacific salmon species. The range on pink salmon extends from streams that flow into the central California coast to the north slope of Alaska and the Northwest Territories of Canada, and east to the rivers in Siberia, North Korea and Japan, but the core of their range comprises coastal rivers and streams in Washington and British Columbia. Puget Sound and the Strait of Juan de Fuca in Washington State are the southern limit of persistent spawning populations of pink salmon (Hard et al. 1996). Juveniles lack parr marks, and have greenish backs. Adults in the saltwater are silvery in color, and pale grey with a yellowish white belly. Mature males are yellowish gray on the sides of their body, blotched with brown, and dark along back. During upstream migration males develop a pronounced humped back, hence their nickname "humpies." Females are olive green on the sides of their body with dusky stripes. Both males and females appear dirty white below the lateral line, and their tails have large oval spots. Pink salmon have a strict two-year life cycle, which results in reproductive isolation of even-year and odd-year stocks (Larkin and Ricker 1964; Hart 1973; Donnelly 1983). Most pink salmon spawn during late summer and fall in coastal areas and the lower ends of streams and rivers, but populations in large river systems such as the Fraser and Skeena Rivers may migrate up to 300 miles to reach spawning grounds. Spawning may occur in high densities of hundreds of thousands of fish in some locations (Heard 1991; WDF et al., 1993). Pinks exhibit ocean-type migratory behavior by outmigrating to saltwater almost immediately after emerging from their redds (Salo 1991). Therefore, survival and growth of juvenile pink salmon depend less on freshwater conditions than on favorable estuarine, nearshore and
King County National Flood Insurance Program Biological Opinion . Compliance Submittal and Programmatic Habitat Assessment
2‐20
oceanic conditions. Another behavioral difference between pinks and salmonids that rear extensively in freshwater is that juvenile pink salmon form schools, presumably to reduce predation (Bonar et al. 1989). Length of incubation depends on water temperature, but stocks in Washington and British Columbia typically hatch from late December to late February (Neave 1966). After hatching, the alevins remain in the gravel for several weeks while absorbing their yolk sac. After emerging from the gravel, pink salmon migrate immediately to rearing areas along the margins of estuaries and nearshore areas, where they feed on invertebrate eggs, amphipods, and copepods (Gerke and Kaczynski 1972; Kaczynski et al. 1973). Most pink salmon rear for several weeks in the nearshore marine environment feeding and growing rapidly before migrating to the open ocean by late summer or early fall. In their oceanic phase, adult pink salmon feed primarily on amphipods, euphausids and fish (LeBrasseur 1966). Pink salmon mature at the smallest average size of any species of Pacific salmon (up to 5.5 lbs), perhaps because of their short residence at sea. Regulatory Overview A pink salmon status review published in 1995 identified two ESUs of pink salmon in Washington: the odd-year and even-year ESUs. The odd-year ESU includes all odd-year pink stocks in Washington, and southern British Columbia including the Fraser River and eastern Vancouver Island, to the Johnstone Strait (Hard et al. 1996). The second pink ESU includes even-year stocks in the Snohomish River. At the time of this announcement, NMFS had determined that neither of these ESUs warranted listing as a threatened or endangered species. This determination was reaffirmed in subsequent status review updates (Good et al. 2005, Ford et al. 2010). Abundance and Trends The status of Puget Sound pink salmon populations was assessed in 1996 when the only persistent population of even-year pink salmon in Washington occurred in the Snohomish River in spite of historical attempts to transplant even-year pink salmon from Alaska and British Columbia into Puget Sound. The status review noted that life history and genetic information for Snohomish River even-year pink salmon were consistent with the hypothesis the Snohomish population resulted from a natural colonization event. The 1996 status review concluded that Puget Sound even-year pink salmon were not at risk of extinction, although concerns were expressed about the low abundance and variable age structure of this ESU. As of the status review publication date, most populations of the odd-year ESU also appeared to be healthy, and overall abundance appeared to be close to historical levels, with some exceptions including populations in the Dungeness and Elwha Rivers (Hard et al. 1996). Since the early 2000s populations of pink salmon in King County rivers have increased dramatically for reasons that are not well understood. Factors of Decline and Threats Of all species of Pacific salmon, pink salmon rely the least on freshwater habitat. In some watersheds they spawn in brackish water in river deltas along the edges of estuaries. Even populations that spawn much further upstream spend very little time in freshwater after emerging from incubation gravel. Instead, they migrate to saltwater immediately after hatching and forage and grow in estuarine and nearshore habitats before migrating to sea. Because of this, they are less affected by habitat alterations that degrade or eliminate instream and off channel habitat. The main threat to their survival in fresh water is redd-scouring flood flows that release developing embryos into the channel before they have consumed their yolk sacs and flush pink fry prematurely to estuaries before they are physiologically prepared to survive in high saline water.
King County National Flood Insurance Program Biological Opinion . Compliance Submittal and Programmatic Habitat Assessment
2‐21
Of the 14 recognized stocks (one even-year and 13 odd-year stocks) in this region, two are of special interest—the odd-year summer and fall runs of the Dungeness River in the Strait of Juan de Fuca. They represent the southwestern boundary of the species range and are widely separated from other pink salmon populations in Puget Sound (Shaklee et al. 1995). Their geographic location, unique life history, and genetic variation contribute significantly to the ecological and genetic diversity of pink salmon in this region (Hard et al. 1996). Starting in the late 1970s, the fall run experienced a rapid decline in abundance, and 1995 has been the target of conservation hatchery propagation. The goal of this program is to conserve the fall pink stock without genetic introgression from summer run Dungeness pink salmon, which spawn in different sections of the river, but overlap somewhat in run timing. Salmon stock assessments have described the status of the fall stock as at ‘‘moderate risk of extinction’’ (Nehlsen et al. 1991), ‘‘at risk’’ (Hard et al. 1996), and ‘‘critical’’ (WDFW 2002). In contrast, several of the other Puget Sound pink salmon stocks, especially odd-year stocks including those of the Green and Puyallup watersheds, have increased dramatically in the past decade. The reasons for this are not well understood, but may be related to relatively high rates of straying exhibited by pink salmon and their ability to exploit suitable habitat and/or changes in ocean conditions (Ladley 2011). Southern Resident Killer Whale (Orcinus orca) Species Description and Life History Killer whales comprise four genetically distinct populations that are referred to as Southern Residents, Northern Residents, Transients, and Offshores. These populations rarely interact and do not interbreed despite having largely sympatric year-round geographic ranges that extend into British Columbia and other areas along the west coast of North America (Wiles 2004). Southern Resident killer whales occur primarily in Washington State and British Columbia in the summer and fall and in coastal waters in the winter. They and Transient killer whales are the only populations that regularly enter the state’s coastal waters, whereas Offshore whales mainly inhabit open ocean off the outer coast. Northern Residents are rare visitors to the state (Wiles 2002). Southern Resident killer whales are believed to feed almost exclusively on salmon, especially Chinook and over 20 other species of fish as well as squid. They occur in small highly stable social units known as matrilines, in which all individuals are maternally related. Pods are larger social groups comprised of several matrilines of about 10 to 60 whales. The Southern Resident population comprises three pods identified as J, K, and L pods. Southern Killer whales are found in the Georgia Basin and Puget Sound from late spring to fall, and constitute the majority of killer whales found in Washington. The population travels more extensively during other times of the year to sites as far north as the Queen Charlotte Islands in British Columbia and as far south as Monterey Bay in California (Wiles 2002). Regulatory Overview The DPS of Southern Resident killer whales was listed as endangered under the ESA on November 18, 2005 (Hogarth 2005). Prior to the ESA listing NMFS determined that the Southern Resident stock was below its optimum sustainable population (OSP) and designated it as depleted under the Marine Mammal Protection Act (MMPA) in May 2003 (68 FR 31980). A status review for Southern Resident killer whales was published in December

King County National Flood Insurance Program Biological Opinion . Compliance Submittal and Programmatic Habitat Assessment
2‐22
of 2002 (Krahn et al. 2002). A final recovery plan was published On January 17, 2008 (NMFS 2008). There is considerable uncertainty regarding which threats are responsible for the decline in the population, or which is the most important to address for recovery. The recovery program links population management actions to an active research program to fill data gaps and a monitoring program to assess effectiveness. The recovery program in the plan includes actions to address prey availability; pollution and contamination vessel effects; oil spills; acoustic effects; education and outreach; and response to sick, stranded and injured killer whales. The recovery strategy also includes transboundary and interagency coordination of population and individual monitoring, research and enforcement. The Southern Resident killer whale recovery plan is also linked to salmon recovery efforts in the region including habitat, harvest and hatchery management (NMFS 2008). Abundance and Trends The Southern Resident DPS experienced an almost 20 percent decline from 1996 to 2001, was petitioned for listing under the ESA in 2001 (Krahn et al. 2002), and was listed as endangered in 2005. Since 2001 the population has increased, with 87 whales, including newborns, in the Southern Resident DPS in 2007. The census for each pod was as follows: J Pod = 26, K Pod = 20, L Pod = 41. Southern Resident population trends are unknown before 1960, when roughly 80 whales were present, but it is quite likely that numbers were at a depleted level due to Indiscriminant shooting by fishermen. The population is believed to have recovered somewhat during the early and mid-1960s, but live-captures for aquaria removed or killed at least 47 of the whales during the 1960s and 1970s. The population has been closely monitored since 1974, with exact numbers of animals and other demographic details learned through annual photoidentification surveys. Membership increased from 70 to 98 whales between 1974 and 1995, but this was followed by a rapid net loss of 18 animals, or 18 percent of the population, from 1996 to 2001. J and K pods have generally maintained their numbers during the decline, with both equaling or exceeding their largest recorded sizes as of September 2003. However, L pod, which comprises about half of the southern resident population, has been in sharp decline since 1994 and shows no strong sign of reversing this trend. This pod’s decline is of concern because it involves both increased mortality of members and reduced birth rates. Factors of Decline and Threats The major threats identified in the listing were prey availability including depleted salmon stocks, pollution and contaminants, and effects from vessels and sound. In addition, the population is vulnerable to demographics, small population size, vulnerability to oil spills and other factors including disease; oil spills; global warming; and elimination of a breeding generation totaling nearly 60 whales during the capture era between 1962 and 1977 (Hogarth 2005).
King County National Flood Insurance Program Biological Opinion . Compliance Submittal and Programmatic Habitat Assessment
2‐23
References Balsiger, J.W. 2006. Endangered and Threatened Species: Final Listing Determinations for 10
Distinct Population Segments of West Coast Steelhead. Federal Register Federal Register 71:834-862.
Barry, D. Endangered and Threatened Wildlife and Plants; Determination of Threatened Status
for Bull Trout in the Coterminous United States. Federal Register 64:58910-58933. Bishop, S., and A. Morgan, (eds.). 1996. Critical habitat issues by basin for natural chinook
salmon stocks in the coastal and Puget Sound areas of Washington State. Northwest Indian Fisheries Commission, Olympia, WA, 105 p. (Available from Northwest Indian Fisheries Commission, 6730 Martin Way E., Olympia, WA 98506.)
Bonar, S.A., G.B. Pauley, and G.L. Thomas. 1989. Species profiles: life histories and
environmental requirements of coastal fishes and invertebrates (Pacific Northwest)--pink salmon. Report prepared for U. S. Fish and Wildlife Service, Washington, D.C., Report 82(11.88); and U.S. Army Corps of Engineers, Waterways Experiment Station, Vicksburg, Virginia, Report #TR EL-82-4.
Booth, D.B., Hartley, D. & Jackson, R. 2002. Forest cover, impervious-surface area, and the
mitigation of stormwater impacts. J. Am. Water Resour. Assoc., 38: 835-845. Cain, W.L. 2004. Endangered and Threatened Species; Establishment of Species of Concern
List, Addition of Species to Species of Concern List, Description of Factors for Identifying Species of Concern, and Revision of Candidate Species List Under the Endangered Species Act. Federal Register 69:19975-19979.
Carretta, J.V., Forney, K.A., Lowry, M.S., Barlow, J., Baker, J., Johnston, D., Hanson, B.,
Brownell Jr., R.L., Robbins, J., Mattila, D.K., Ralls, K., Muto, M.M., Lynch, D. and L. Carswell. 2010. U.S. Pacific Marine Mammal Stock Assessments: 2009. NOAA Technical Memorandum NMFS-SWFSC-453. National Marine Fisheries Service, Northwest Fisheries Science Center, Seattle, Washington.
Conant, T. 2011. Endangered and Threatened Species; 5-Year Reviews for 17 Evolutionarily
Significant Units and Distinct Population Segments of Pacific Salmon and Steelhead. Federal Register 72: 50448- 50449.
Donnelly, R.F. 1983. Factors affecting the abundance of Kodiak archipelago pink salmon
(Oncorhynchus gorbuscha Walbaum). Ph.D. dissertation, University of Washington, Seattle, Washington.
Everest, F.H. 1973. Ecology and management of summer steelhead in the Rogue River.
Oregon State Game Commission, Fish Research Report 7. Portland, Oregon. Everest, F.R, Reeves, G.H., Sedell, J.K., Hohler, D.B. and T. Cain. 1986. The effects of habitat
enhancement on steelhead trout and coho salmon smolt production, habitat utilization and habitat availability in Fish Creek, Oregon, 1983-1986. Prepared for U.S. Department of Energy, Bonneville Power Administration, Division of Fish and Wildlife, Portland, Oregon, Project 84-11.

King County National Flood Insurance Program Biological Opinion . Compliance Submittal and Programmatic Habitat Assessment
2‐24
Ford, M .J., Cooney T, McElhany P, Sands N, Weitkamp L, Hard J, McClure M, Kope R, Myers J., Albaugh A, Barnas K, Teel D, Moran P, Cowen J. 2010. Status review update for Pacific salmon and steelhead listed under the Endangered Species Act: Northwest. Draft U.S. Department of Commerce, NOAA Technical Memorandum NOAA-TM-NWFSC-XXX.
Forest Ecosystem Management Assessment Team (FEMAT). 1993. Forest Ecosystem
Management: an ecological, economic, and social assessment. Report published by the U.S. Department of Agriculture and five other federal agencies, July 1993.
Gerke, R. J., and V. M. Kaczynski. 1972. Food of Juvenile Pink and Chuo Salmon in Puget
Sound, Washington; Technical Report No. 10. Washington Department of Fisheries, Olympia, Washington.
Gilbert, C. H. 1912. Age at maturity of Pacific coast salmon of the genus Oncorhynchus. Bull.
U.S. Fish Comm. 32: 57-70. Good, T.P., R.S. Waples, and P. Adams (editors). 2005. Updated status of federally listed ESUs
of West Coast salmon and steelhead. U.S. Dept. Commer., NOAA Tech. Memo. NMFS-NWFSC-66. National Marine Fisheries Service, Northwest Fisheries Science Center, Seattle, Washington; and Southwest Fisheries Science Center, Santa Cruz, California.
Hard, J.J., Kope, R.G., Grant, W.S., Waknitz, F.W., Parker, L.T. and R.S. Waples. 1996. Status
Review of Pink Salmon from Washington, Oregon, and California. Technical Memorandum NMFS-NWFSC-25. National Marine Fisheries Service, Northwest Fisheries Science Center, Seattle, Washington.
Hard, J.J., Myers, J.M., Ford, M.J., Kope, R.G., Pess, G.R., Waples, R.S., Winans, G.A.,
Berejikian, B.A., Waknitz, F.W., Adams, P.B., Bisson, P.A., Campton, D.E., and R. R. Reisenbichler. 2007. Status review of Puget Sound steelhead (Oncorhynchus mykiss). NOAA Technical Memorandum NMFS-NWFSC-81. National Marine Fisheries Service, Northwest Fisheries Science Center, Seattle, Washington; and Southwest Fisheries Science Center, Santa Cruz, California; Olympic Forestry Sciences Laboratory, Olympia, Washington; U.S. Fish and Wildlife Service, Abernathy Fish Technology Center, Longview, Washington; U.S. Geological Survey Western Fisheries Research Center, Seattle, Washington.
Harris, C. K. 1988. Recent changes in the pattern of catch of North American salmonids by the
Japanese high seas salmon fisheries. Pages 4 1-65, In: W. McNeil (ed.), Salmon production, management, and allocation: biological, economic and policy issues. Proceedings of the World Salmonid Conference. Oregon State University Press, Corvallis.
Hart, J.L. 1973. Pacific fishes of Canada. Bulletin of the Fisheries Research Board of Canada
180: 740 p. Healey, M. C. 1983. Coastwide distribution and ocean migration patterns of stream- and ocean
type chinook salmon, Oncorhynchus tshawytscha. Canadian Field-Naturalist 97:427-433.

King County National Flood Insurance Program Biological Opinion . Compliance Submittal and Programmatic Habitat Assessment
2‐25
Healey, M.C. 1991. The life history of chinook salmon (Oncorhynchus tshawytscha), p. 311-393. In Life History of Pacific Salmon (C. Groot and L. Margolis, eds.). Vancouver, British Columbia, University of British Columbia Press.
Heard, W.R. 1991. Life history of pink salmon (Oncorhynchus gorbuscha). p. 119-230. In:
Groot, C. and L. Margolis (eds.) Pacific Salmon Life Histories. University of British Columbia Press, Vancouver, British Columbia.
Hogarth, W.T. 2005. Endangered status for Southern Resident killer whales. Federal Register
70:69903-69912. Jeffres, C. A., J. J. Opperman, and P. B.Moyle. 2008. Ephemeral floodplain habitats provide
best growth conditions for juvenile Chinook salmon in a California river. Environmental Biology of Fishes 83:449–458.
Kaczynski , V.W. , Feller, R.J. Clayton, J. and R.G. Gerke.1973.Trophic analysis of juvenile pink
and chum salmon in Puget Sound. J. Fish. Res. Board Can. 30: 1003-1008. Kraemer, C. 1994. (draft) Some observations on the life history and behavior of the native char,
Dolly Varden (Salvelinus malma) and bull trout (Salvelinus confluentus) of the North Puget Sound region. Olympia, Washington: WDFW.
Krahn, M.M., Wade, P.R., Kalinowski, S.T., Dahlheim, M.E. ,Taylor, B.L., Hanson, M.B., Ylitalo,
G.M., Angliss, R.P., Stein, J.E. and R.S.Waples. 2002. Status review of southern resident killer whales (Orcinus orca) under the Endangered Species Act. NOAA Technical Memorandum NMFS-NWFSC-54, U.S. Department of Commerce, National Marine Fisheries Service, Seattle, Washington.
Ladley, Russ. 2011. pers. comm. Puyallup Tribe of Indians, Fisheries Division, Puyallup,
Washington. Larkin, P.A. and W.E. Ricker 1964 Canada's Pacific marine fisheries. Past performance and
future prospects. Inventory of the natural resources of British Columbia. p. 194-268. LeBrasseur, R. J. 1966. Stomach contents of salmon and steelhead trout in the northeastern
Pacific Ocean. J. Fish. Res. Board Can. 23:85-100. Limm, M.P. and M.P. Marchetti. 2003. Contrasting patterns of juvenile chinook salmon
(Oncorhynchus tshawytscha) growth, diet, and prey densities in off-channel and main stem habitats on the Sacramento River. Prepared for The Nature Conservancy, Chico, California.
Manson, C. 2005. Endangered and Threatened Wildlife Plants; Designation of Critical Habitat
for the Bull Trout; Final Rule. Federal Register 70: 56211-56311. Marshall, A.R., C. Smith, R. Brix, W. Dammers, J. Hymer, and L. LaVoy. 1995. Genetic diversity
units and major ancestral lineages for chinook salmon in Washington. In: C. Busack and J. B. Shaklee (eds.), Genetic diversity units and major ancestral lineages of salmonid fishes in Washington, p. 111-173. Technical Report RAD 95-02. Washington Department of Fish and Wildlife, Olympia, Washington.
King County National Flood Insurance Program Biological Opinion . Compliance Submittal and Programmatic Habitat Assessment
2‐26
McPhail, J.D. and C.C. Lindsey 1970 Freshwater fishes of northwestern Canada and Alaska. Fish. Res. Board Can. Bull. 173: 381.
McPhail, J. D., and C. B. Murray. 1979. The early life-history and ecology of Dolly Varden
(Salvelinus malma) in the upper Arrow Lakes. Department of Zoology and Institute of Animal Resources, University of British Columbia, Vancouver, British Columbia.
Meehan, W.R., editor. 1991. Influences of Forest and Rangeland Management on Salmonid
Fishes and their Habitats. American Fisheries Society Special Publication 19, Bethesda, Maryland.
Meehan, W R, and Bjornn, T C, 1991. Salmonid distributions and life histories. American
Fisheries Society Special Publication 19: 47-82. Bethesda, Maryland. Mobrand, L. 2000. Preliminary Assessment of Recovery Objectives Based on Properly
Functioning Habitat Conditions. Report submitted to Washington Department of Fish and Wildlife and the Northwest Indian Fish Commission.
Moscrip, A.L. & Montgomery, D.R. 1997. Urbanization, flood frequency, and salmon abundance
in Puget lowland streams. J. Am. Water Resources Assoc., 33: 1289-1297. Myers, J.J., Kope, R.G., Bryant, G.J., Teel, D., Lierheimer, L.J., Wainwright, T.C.,
Grant, W.S., Waknitz, F.W. and Neely, K., Lindley, S.T. and R.S. Waples. 1998. Status Review of Chinook Salmon from Washington, Idaho, Oregon, and California. NOAA Technical Memorandum NMFS-NWFSC-35. National Marine Fisheries Service, Northwest Fisheries Science Center, Seattle, Washington; and Southwest Fisheries Science Center, Long Beach, California.
National Marine Fisheries Service (NMFS). 1987. Endangered and threatened species; winter-
run chinook salmon. Federal Register 52:6041-6048. National Marine Fisheries Service (NMFS). 2005. Status Review Update for Puget Sound
Steelhead. National Marine Fisheries Service, Northwest Fisheries Science Center, Seattle, Washington.
National Marine Fisheries Service (NMFS). 2005. Endangered and Threatened Species;
Designation of Critical Habitat for 12 Evolutionarily Significant Units of West Coast Salmon and Steelhead in Washington, Oregon, and Idaho. 70 Fed. Reg. 170 (2005) (to be codified at 50 C.F.R. pt. 226).
National Marine Fisheries Service (NMFS). 2008. Recovery Plan for Southern Resident Killer
Whales. National Marine Fisheries Service, Northwest Region, Protected Resources Division, Seattle, Washington.
National Marine Fisheries Service (NMFS). 2006. Designation of Critical Habitat for Southern
Resident Killer Whales Biological Report. National Marine Fisheries Service. Northwest Region, Seattle, Washington.
National Marine Fisheries Service (NMFS). 2011. Southern Resident Killer Whales (Orcinus
orca) 5-Year Review: Summary and Evaluation. National Marine Fisheries Service, Northwest Regional Office, Seattle, Washington.
King County National Flood Insurance Program Biological Opinion . Compliance Submittal and Programmatic Habitat Assessment
2‐27
Neave, F. 1966. Pink salmon in British Columbia. A review of the life history of north Pacific
salmon. Int. Pac. Salmon Fish. Comm. Bull. 18: 70-79. Nehlsen, W.J., J.E. Williams, and J.A. Lichatowich.1991. Pacific salmon at the crossroads:
Stocks at risk from California, Oregon, Idaho, and Washington. Fisheries 16(2);4-21. Oliver, J. 2008a. Endangered and Threatened Species: Final Protective Regulations for
Threatened Puget Sound Steelhead. Federal Register 73:55451-55455. Oliver, J. 2008b. Fisheries Off West Coast States; West Coast Salmon Fisheries; Amendment 14; Essential Fish Habitat Descriptions for Pacific Salmon. Federal Register 73:60987-
60994. Pacific Fisheries Management Council (PFMC). 1997. An Assessment of the Status of the
Puget Sound Chinook and Strait of Juan de Fuca Coho Stocks as Required Under the Salmon Fishery Management Plan. Pacific Fishery Management Council, Portland, Oregon.
Pacific Salmon Commission (PSC). 1994. Pacific Salmon Commission Joint Chinook Technical
Committee 1993 Annual Report (94-1). Pacific Salmon Commission, Vancouver, British Columbia.
Rauch, S.D. 2007. Endangered and Threatened Species: Final Listing Determination for Puget
Sound Steelhead. Federal Register 72: 26722- 26735. Rieman, B.E. and J.D. Mclntyre. 1993. Demographic and habitat requirements for conservation
of bull trout. Gen. Tech. Rep. INT-302. U.S. Department of Agriculture, Forest Service, Intermountain Research Station, Ogden, Utah.
Roper, B.B., Scarnecchia, D.L. and T.J. La Marr 1994. Summer distribution of and habitat use
by chinook salmon and steelhead within a major basin of the South Umpqua River, Oregon. Transactions of the American Fisheries Society 123: 298-308.
Rosenberg, A. A. 1999. Endangered and threatened species; threatened status for three
Chinook Salmon evolutionarily significant units (ESUs) in Washington and Oregon, and endangered status for one Chinook Salmon ESU in Washington. Federal Register 64:14308–14328.
Ruckelshaus, M.H., K.P. Currens, W.H. Graeber, R.R. Fuerstenberg, K. Rawson, N.J. Sands,
and J.B. Scott. 2006. Independent populations of Chinook salmon in Puget Sound. U.S. Dept. Commer., NOAA Tech. Memo. NMFS-NWFSC-78, National Marine Fisheries Service, Northwest Fisheries Science Center, Seattle, Washington.
Salo, E.O. 1991. Life history of chum salmon, Oncorhynchus keta. In: Groot, C., and L.
Margolis (eds.), Pacific Salmon Life Histories, p. 231-309. University of British Columbia Press, Vancouver, British Columbia.
Schmitten, R.A. 1995. Endangered and Threatened Species; Proposed Threatened Status for
Three Contiguous ESUs of Coho Salmon Ranging From Oregon Through Central California. Federal Register 60:38011-38030.
King County National Flood Insurance Program Biological Opinion . Compliance Submittal and Programmatic Habitat Assessment
2‐28
Shaklee, J. B., J. Ames, and D. Hendrick. 1995. Genetic diversity units and major ancestral
lineages for pink salmon in Washington. In C. Busack and J. B. Shaklee (editors), Genetic diversity units and major ancestral lineages of salmonid fishes in Washington. Tech. Rep. RAD 95-02, p. B1-B37. Washington Department of Fish and Wildlife, Olympia, Washington.
Solazzi, M.F., Nickelson, T.E., Johnson, S.L. & Rodgers, J.D. 2000. Effects of increasing winter
rearing habitat on abundance of salmonids in two coastal Oregon streams. Can. J. Fish. Aquat. Sci., 57: 906-914.
Sommer, T.R., Nobriga, M.L. and Harrell, W.C. 2001. Floodplain rearing of juvenile chinook
salmon: evidence of enhanced growth and survival. Can. J. Fisheries and Aquatic Sci. 58: 325-333.
Sommer, T.R., Harrell, W.C. and M.L. Nobriga. 2005. Habitat use and stranding risk of juvenile
Chinook salmon on a seasonal floodplain. North American Journal of Fisheries Management 25:1493–1504.
Waples, R.S. 1991. "Definition of 'Species' Under the Endangered Species Act: Application to
Pacific Salmon." U.S. Department of Commerce. NOAA Technical Memorandum NMFS F/NWC-194.
Washington Department of Fisheries (WDF), Washington Department of Wildlife and Western
Washington Treaty Tribes. 1993. 1992 Washington State Salmon and Steelhead Stock Inventory (SASSI). Olympia, Washington.
Washington Department of Fish and Wildlife (WDFW). 1998. Washington State Salmonid Stock
Inventory Bull Trout/Dolly Varden (SASSI), September 1997. Olympia, Washington. Washington Department of Fish and Wildlife. 1992 and 2002 Salmon and Steelhead Stock
Inventories. Olympia, Washington. http://wdfw.wa.gov/conservation/fisheries/sasi/index.html
Washington Department of Fish and Wildlife, Puyallup Indian Tribe, and Muckleshoot Indian
Tribe. 1996. Recovery plan for White River spring chinook salmon (unpublished report). Washington Department of Fish and Wildlife, Olympia, Washington.
Weitcamp, L.A., Wainwright, T.C., Bryant, G.J., Milner, G.B., Teel, D.J., Kope, R.G. and R.S.
Waples. 1995. Status review of coho salmon from Washington, Oregon and California. National Marine Fisheries Service, Northwest Fisheries Science Center, Seattle, Washington and Southwest Region, Long Beach, California.
Wiles, G. J. 2004. Washington State status report for the killer whale. Washington Department
Fish and Wildlife, Olympia. 106 pp.
Chapter 3
Protected Species Utilization of
Floodplain Habitat

King County National Flood Insurance Program Biological Opinion . Compliance Submittal and Programmatic Habitat Assessment
3‐i
Chapter 3 Contents King County Floodplain Habitats Overview ................................................................................ 3-1 WRIA 7 Protected Species and Habitat Evaluation ................................................................... 3-4
Snoqualmie Watershed Overview .......................................................................................... 3-4 WRIA 7 Sub-Area Habitats and Protected Species Use ........................................................ 3-4 The Snoqualmie River Mainstem and Its Valley Floor Tributaries .......................................... 3-4 Cherry Creek, WRIA #07.0240 (Confluence @ RB, RM 6.7) ................................................. 3-5 Tolt River (Confluence @ RB, RM 24.9), RM 0.0 to 6.? ......................................................... 3-6 WRIA 7 Sub-Area Water Quality Issues ................................................................................. 3-7 Habitat Features in the Floodplains of the Lower Snoqualmie and Its Major Tributaries ....... 3-9 Distribution of Snoqualmie Salmonids in Habitats of Primary Importance ........................... 3-10
Snohomish/Skykomish Steelhead Trout ........................................................................... 3-11 Snohomish-Skykomish Bull Trout ..................................................................................... 3-12 Snohomish Coho Salmon ................................................................................................. 3-13 Snohomish Pink Salmon ................................................................................................... 3-13
WRIA 8 Protected Species and Habitat Evaluation ................................................................. 3-15 WRIA 8 Study Area Overview ............................................................................................... 3-15
Upper Sammamish River and Lake Sammamish in Marymoor Park ................................... 3-15 Lake Sammamish ................................................................................................................. 3-15 The Sammamish River ......................................................................................................... 3-15 Issaquah Creek Watershed .................................................................................................. 3-15 Bear-Evans Creek Watershed .............................................................................................. 3-16 May Creek Watershed .......................................................................................................... 3-17 Cedar River Watershed ........................................................................................................ 3-17 WRIA 8 Protected Species ................................................................................................... 3-18
Lake Washington-Cedar River Chinook Salmon .............................................................. 3-18 Lake Washington Winter Steelhead Trout ........................................................................ 3-20 Cedar River Bull Trout ...................................................................................................... 3-20 Lake Washington Coho Salmon ....................................................................................... 3-21
WRIA 9 Protected Species and Habitat Evaluation ................................................................. 3-22
The Historic Green-Duwamish River Watershed .................................................................. 3-22 The Present Day Green-Duwamish Watershed ................................................................... 3-22 Mainstem Green River...................................................................................................... 3-24 Soos Creek ....................................................................................................................... 3-25 Newaukum Creek ............................................................................................................. 3-25 WRIA 9 Protected Species ................................................................................................... 3-26 Duwamish-Green Fall Chinook ........................................................................................ 3-26 Bull Trout (Salvelinus confluentus) ................................................................................... 3-27 Green River (Duwamish) Steelhead (Oncorhynchus mykiss) .......................................... 3-28 Green-Duwamish-Soos -Newaukum Coho Salmon (Oncorhynchus kisutch) .................. 3-30 Green River Odd-Year Pink Salmon (Oncorhynchus gorbuscha) .................................... 3-31
WRIA 10 Protected Species and Habitat Evaluation ............................................................... 3-32 Watershed Overview ............................................................................................................. 3-32 The White River (WRIA #10.0031) ....................................................................................... 3-32 Boise Creek (WRIA #10.0057) .............................................................................................. 3-34

King County National Flood Insurance Program Biological Opinion . Compliance Submittal and Programmatic Habitat Assessment
3‐ii
Puyallup River Fall Chinook ............................................................................................... 3-34 White River Spirng Chinook ............................................................................................... 3-35 Puyullup Carbon White River Bull Trout ............................................................................ 3-36 Steelhead ........................................................................................................................... 3-36 Puyallup-White Pink Odd-Year Salmon ............................................................................. 3-37 Puyallup-White River Coho Salmon ................................................................................... 3-38
Vashon-Maury Island Protected Species and Habitat Evaluation ............................................ 3-40
Overview .............................................................................................................................. 3-40 Geology and Topography ..................................................................................................... 3-40 Human Occupation ............................................................................................................... 3-40
Terrestrial and Freshwater Environment .................................................................................. 3-41 Streams and Salmon Usage ................................................................................................ 3-42
Shinglemill Creek and its Tributaries ................................................................................ 3-43 Christensen Creek ............................................................................................................ 3-44 Fisher Creek ..................................................................................................................... 3-45 Judd Creek ....................................................................................................................... 3-45 Raab’s Lagoon Creek (Mileta Creek) ............................................................................... 3-46
Water Quality ........................................................................................................................ 3-46 Marine Nearshore Environment ............................................................................................... 3-48
Selected Nearshore Habitat Types ...................................................................................... 3-49 Eelgrass Meadows ............................................................................................................... 3-50 Kelp Forests ......................................................................................................................... 3-52 Sand Spits ............................................................................................................................ 3-54 Beaches and Backshore ...................................................................................................... 3-55 Banks and Bluffs .................................................................................................................. 3-57 Marine Riparian Zone ........................................................................................................... 3-58
Marine Riparian Conditions .............................................................................................. 3-59 Marine Sediment .................................................................................................................. 3-68 Drift Cells in More Detail ....................................................................................................... 3-73 Salmonid Use of the Nearshore Environment ...................................................................... 3-76
Essential Fish Habitat ....................................................................................................... 3-80 Marine Water Quality ............................................................................................................ 3-83
References ............................................................................................................................... 3-87
King County National Flood Insurance Program Biological Opinion . Compliance Submittal and Programmatic Habitat Assessment
3‐iii
Tables Table 3-1 Floodplain Habitat Characteristics ........................................................................... 3-2 Table 3-2 Shinglemill Creek and Selected Stream Substrate Types ..................................... 3-43 Table 3-3 Pool-to-Riffle Ratios in Shinglemill Creek Subbasin .............................................. 3-43 Table 3-4 Shoreline lengths where various cliff types were recorded in the
ShoreZone database .............................................................................................. 3-57 Table 3-5 The condition of trees between 2002 and 2009 for marine jurisdictions within WRIA 9 ........................................................................................................ 3-60 Table 3-6 Classifies the loss of treed shoreline into different categories of cause ................ 3-63 Table 3-7 Comparison of the amount of marine shoreline armoring occurring Between 2004 and 2009 on Vashon Island .......................................................... 3-64 Table 3-8 Comparison showing drift cells where there was a change in the amount of Intact sediments sources between 2004 and 2009 ............................................... 3-70 Table 3-9 Salmonids: Summary of nearshore and estuarine habitat use .............................. 3-78
Figures Figure 3-1 Extent of trees adjacent to and density of trees along the marine shorelines of WRIA 9 in 2009 ................................................................................................. 3-61 Figure 3-2 Extent of the changes in vegetation found along the marine shoreline Between 2002 and 2009 ...................................................................................... 3-62 Figure 3-3 Shoreline armoring in relation to shoretype within WRIA 9 in 2009 ..................... 3-65 Figure 3-4 Locations hosing increases and decreases in marine shoreline armoring Within WRIA 9 ....................................................................................................... 3-66 Figure 3-5 Location of drift cells within WRIAs 8 and 9 ......................................................... 3-69 Figure 3-6 The percent of intact sediment sources within drift cells of WRIA 9 ..................... 3-72

King County National Flood Insurance Program Biological Opinion . Compliance Submittal and Programmatic Habitat Assessment
3‐iv
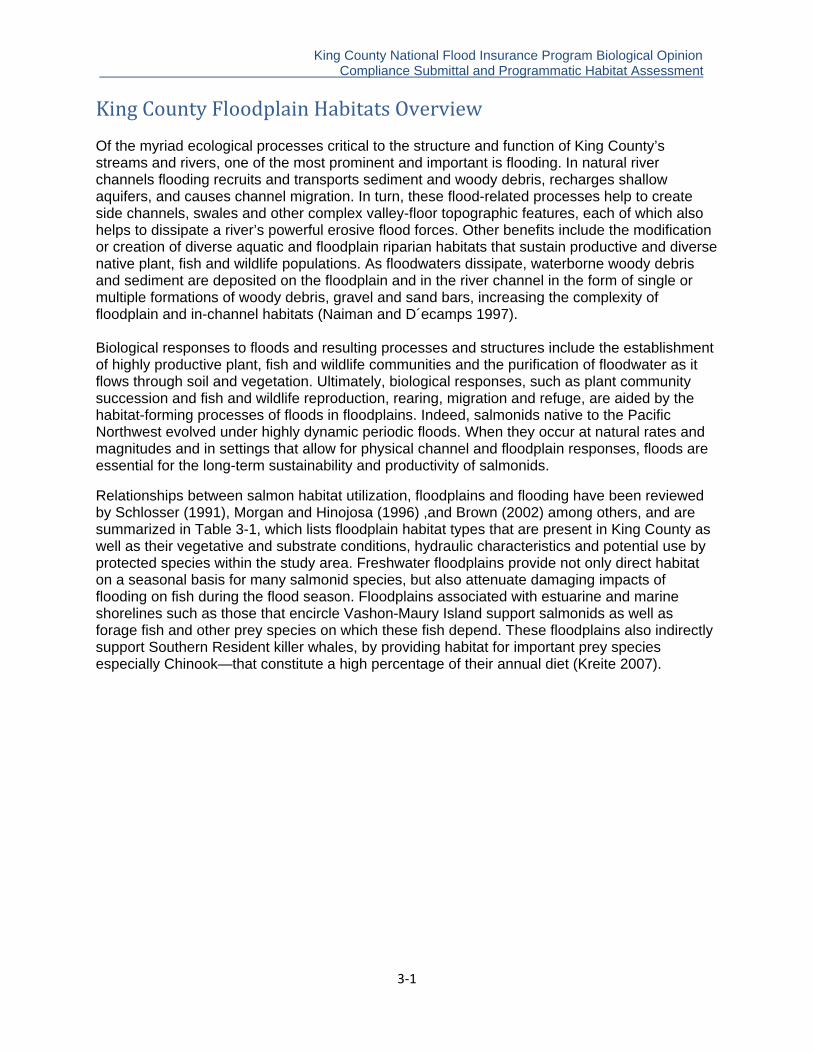
King County National Flood Insurance Program Biological Opinion . Compliance Submittal and Programmatic Habitat Assessment
3‐1
King County Floodplain Habitats Overview Of the myriad ecological processes critical to the structure and function of King County’s streams and rivers, one of the most prominent and important is flooding. In natural river channels flooding recruits and transports sediment and woody debris, recharges shallow aquifers, and causes channel migration. In turn, these flood-related processes help to create side channels, swales and other complex valley-floor topographic features, each of which also helps to dissipate a river’s powerful erosive flood forces. Other benefits include the modification or creation of diverse aquatic and floodplain riparian habitats that sustain productive and diverse native plant, fish and wildlife populations. As floodwaters dissipate, waterborne woody debris and sediment are deposited on the floodplain and in the river channel in the form of single or multiple formations of woody debris, gravel and sand bars, increasing the complexity of floodplain and in-channel habitats (Naiman and D´ecamps 1997). Biological responses to floods and resulting processes and structures include the establishment of highly productive plant, fish and wildlife communities and the purification of floodwater as it flows through soil and vegetation. Ultimately, biological responses, such as plant community succession and fish and wildlife reproduction, rearing, migration and refuge, are aided by the habitat-forming processes of floods in floodplains. Indeed, salmonids native to the Pacific Northwest evolved under highly dynamic periodic floods. When they occur at natural rates and magnitudes and in settings that allow for physical channel and floodplain responses, floods are essential for the long-term sustainability and productivity of salmonids.
Relationships between salmon habitat utilization, floodplains and flooding have been reviewed by Schlosser (1991), Morgan and Hinojosa (1996) ,and Brown (2002) among others, and are summarized in Table 3-1, which lists floodplain habitat types that are present in King County as well as their vegetative and substrate conditions, hydraulic characteristics and potential use by protected species within the study area. Freshwater floodplains provide not only direct habitat on a seasonal basis for many salmonid species, but also attenuate damaging impacts of flooding on fish during the flood season. Floodplains associated with estuarine and marine shorelines such as those that encircle Vashon-Maury Island support salmonids as well as forage fish and other prey species on which these fish depend. These floodplains also indirectly support Southern Resident killer whales, by providing habitat for important prey species especially Chinook—that constitute a high percentage of their annual diet (Kreite 2007).
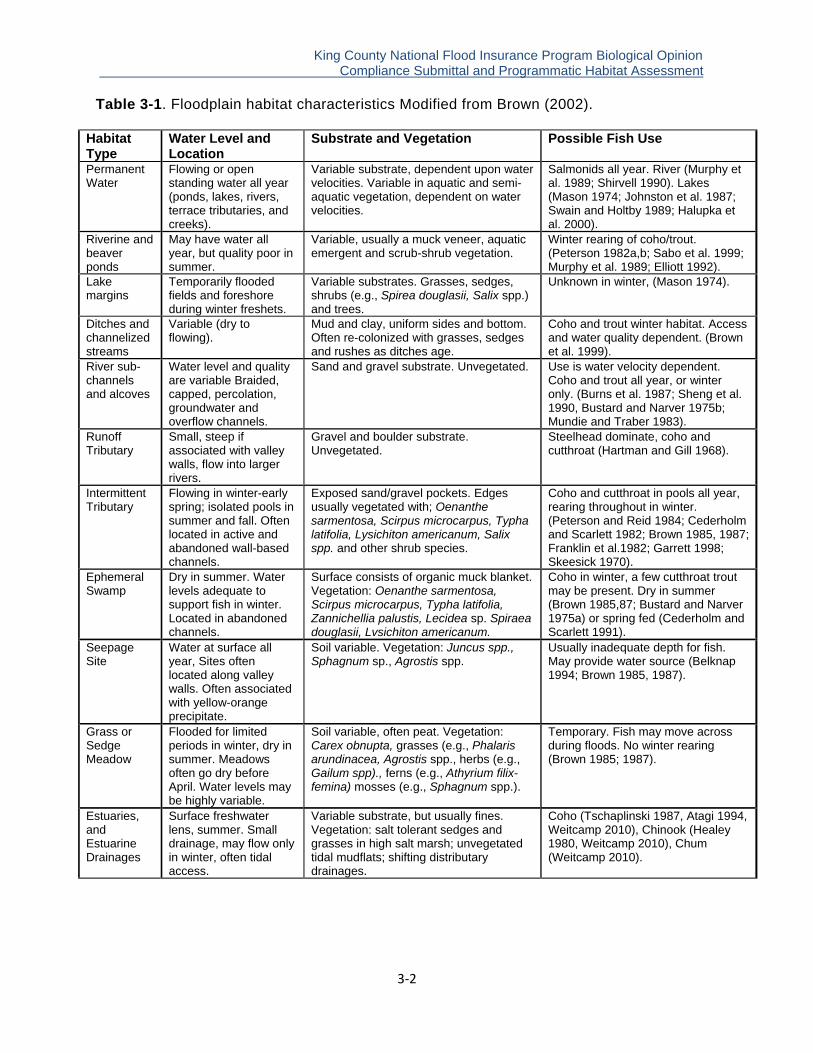
King County National Flood Insurance Program Biological Opinion . Compliance Submittal and Programmatic Habitat Assessment
3‐2
Table 3-1. Floodplain habitat characteristics Modified from Brown (2002).
Habitat Type
Water Level and Location
Substrate and Vegetation Possible Fish Use
Permanent Water
Flowing or open standing water all year (ponds, lakes, rivers, terrace tributaries, and creeks).
Variable substrate, dependent upon water velocities. Variable in aquatic and semi-aquatic vegetation, dependent on water velocities.
Salmonids all year. River (Murphy et al. 1989; Shirvell 1990). Lakes (Mason 1974; Johnston et al. 1987; Swain and Holtby 1989; Halupka et al. 2000).
Riverine and beaver ponds
May have water all year, but quality poor in summer.
Variable, usually a muck veneer, aquatic emergent and scrub-shrub vegetation.
Winter rearing of coho/trout. (Peterson 1982a,b; Sabo et al. 1999; Murphy et al. 1989; Elliott 1992).
Lake margins
Temporarily flooded fields and foreshore during winter freshets.
Variable substrates. Grasses, sedges, shrubs (e.g., Spirea douglasii, Salix spp.) and trees.
Unknown in winter, (Mason 1974).
Ditches and channelized streams
Variable (dry to flowing).
Mud and clay, uniform sides and bottom. Often re-colonized with grasses, sedges and rushes as ditches age.
Coho and trout winter habitat. Access and water quality dependent. (Brown et al. 1999).
River sub-channels and alcoves
Water level and quality are variable Braided, capped, percolation, groundwater and overflow channels.
Sand and gravel substrate. Unvegetated. Use is water velocity dependent. Coho and trout all year, or winter only. (Burns et al. 1987; Sheng et al. 1990, Bustard and Narver 1975b; Mundie and Traber 1983).
Runoff Tributary
Small, steep if associated with valley walls, flow into larger rivers.
Gravel and boulder substrate. Unvegetated.
Steelhead dominate, coho and cutthroat (Hartman and Gill 1968).
Intermittent Tributary
Flowing in winter-early spring; isolated pools in summer and fall. Often located in active and abandoned wall-based channels.
Exposed sand/gravel pockets. Edges usually vegetated with; Oenanthe sarmentosa, Scirpus microcarpus, Typha latifolia, Lysichiton americanum, Salix spp. and other shrub species.
Coho and cutthroat in pools all year, rearing throughout in winter. (Peterson and Reid 1984; Cederholm and Scarlett 1982; Brown 1985, 1987; Franklin et al.1982; Garrett 1998; Skeesick 1970).
Ephemeral Swamp
Dry in summer. Water levels adequate to support fish in winter. Located in abandoned channels.
Surface consists of organic muck blanket. Vegetation: Oenanthe sarmentosa, Scirpus microcarpus, Typha latifolia, Zannichellia palustis, Lecidea sp. Spiraea douglasii, Lvsichiton americanum.
Coho in winter, a few cutthroat trout may be present. Dry in summer (Brown 1985,87; Bustard and Narver 1975a) or spring fed (Cederholm and Scarlett 1991).
Seepage Site
Water at surface all year, Sites often located along valley walls. Often associated with yellow-orange precipitate.
Soil variable. Vegetation: Juncus spp., Sphagnum sp., Agrostis spp.
Usually inadequate depth for fish. May provide water source (Belknap 1994; Brown 1985, 1987).
Grass or Sedge Meadow
Flooded for limited periods in winter, dry in summer. Meadows often go dry before April. Water levels may be highly variable.
Soil variable, often peat. Vegetation: Carex obnupta, grasses (e.g., Phalaris arundinacea, Agrostis spp., herbs (e.g., Gailum spp)., ferns (e.g., Athyrium filix-femina) mosses (e.g., Sphagnum spp.).
Temporary. Fish may move across during floods. No winter rearing (Brown 1985; 1987).
Estuaries, and Estuarine Drainages
Surface freshwater lens, summer. Small drainage, may flow only in winter, often tidal access.
Variable substrate, but usually fines. Vegetation: salt tolerant sedges and grasses in high salt marsh; unvegetated tidal mudflats; shifting distributary drainages.
Coho (Tschaplinski 1987, Atagi 1994, Weitcamp 2010), Chinook (Healey 1980, Weitcamp 2010), Chum (Weitcamp 2010).

King County National Flood Insurance Program Biological Opinion . Compliance Submittal and Programmatic Habitat Assessment
3‐3
Habitat Type
Water Level and Location
Substrate and Vegetation Possible Fish Use
Nearshore Areas
Sand spits, intertidally inundated beaches and backshore areas flooded during normal tidal cycles and may be deeply inundated during storm coastal surges. Water levels may be highly variable.
Variable substrates consisting of silt, sand, gravel, cobbles, occasional boulders and driftwood.
Seasonal use by juvenile and adult salmonids, seasonal and year around use by a variety of important salmonid prey species (zooplankton, marine benthic invertebrates and vertebrate fishes) (Brennan et al. 2004, Brennan and Culverwell 2004), and Southern Resident killer whales (e.g., herring), which also consume adult salmon in close proximity (up to 15 meters from marine coastlines (Kreite 2007).
King County National Flood Insurance Program Biological Opinion . Compliance Submittal and Programmatic Habitat Assessment
3‐4
WRIA 7 Protected Species and Habitat Evaluation
Snoqualmie Watershed Overview The lower Snoqualmie River near Duvall mainly provides transportation and rearing habitat for all salmon species that utilize upper basin areas for spawning and rearing, but spawning habitat in this part of the river is rather limited compared to areas upstream and in a number of tributaries. Several off-channel refuge areas and oxbows are present in the reach of the Snoqualmie River near the confluence of Griffin Creek. These areas provide important rearing and refuge habitat for juvenile salmonids. The presence of these habitats in close proximity to important spawning habitat suggest they play an important role in the survival of newly emergent Chinook fry as well as coho originating from the Griffin Creek watershed. The Snoqualmie River Tolt and Raging River delta reaches support the majority of Chinook spawning in the Snoqualmie River watershed. These reaches are characterized by higher reach gradients and deposition of large volumes of gravel that form extensive riffles and runs suitable for spawning and natal area rearing. Remnant side channels downstream of these confluence areas provide rearing and overwintering habitat for coho and steelhead.
WRIA 7 SubArea Habitats and Protected Species Use The study sub-area encompasses floodplains within King County’s jurisdiction depicted in FIRMs for the portions of WRIA 7 downstream from Snoqualmie Falls. This study sub-area comprises the Snoqualmie River mainstem (#07.0219) from the King-Snohomish County line (RM 6.1) to Snoqualmie Falls (RM 40.2) and its floodplain, tributaries with valley floor floodplains that overlap the Snoqualmie River floodplain, and other major tributaries with floodplains that extend upstream from the valley floor including Cherry Creek (#07.0240), the Tolt River (#07.0291), Patterson Creek (#07.0376) and the Raging River (#07.0384). Portions of WRIA 7 upstream from Snoqualmie Falls and Sunset Falls are excluded from this analysis for reasons explained in Chapter 1 and 6.
The Snoqualmie River Mainstem and Its Valley Floor Tributaries The headwaters of the Snoqualmie River lie in the Cascade Mountains east of North Bend. The mainstem river has two distinct periods of high stream flows: peak flows that primarily occur during large flood events that are accompanied by rapid melting of snowpack in headwater areas between November and March, and high flows resulting from snowmelt in the headwaters during the months of May and June. Annual low flows generally occur in August and early September, because most of the snowmelt runoff has occurred and very little rainfall typically occurs in mid to late summer. Low-flow basins, such as the Raging River and small lowland tributaries are not influenced by high elevation snowpack. Peak flows in these streams are typically associated with winter storms from October through March, and minimum flows occur in August and late September.

King County National Flood Insurance Program Biological Opinion . Compliance Submittal and Programmatic Habitat Assessment
3‐5
The lower Snoqualmie River valley and the downstream segments of its main tributaries are characterized by a variety of land uses ranging from a complex forested wetlands such as those within the 190-acre Carnation Marsh wetland complex, other publicly owned natural areas and parks, agricultural pastures and row crop fields, scattered barns and single family farmhouses, golf courses, to relatively small urbanizing areas near the Cities of Duvall and Carnation and population centers in unincorporated Fall City and Preston. Upland and floodplain areas of the lower Snoqualmie watershed have been extensively modified since the late 1850s by timber harvest, agriculture, flood control practices, road building and land development. In addition to repeated waves of deforestation of headwater areas, the broad floodplain on the valley floor has been extensively modified by forest clearing, conversion to agriculture, channelization of the mainstem river and numerous valley floor tributary segments, construction of bank-armored levees and revetments, road and bridge construction and other alterations that simplified or cut off access to side channels and oxbows that formerly provided large expanses of salmonid spawning and rearing habitat. Stormwater from a number of residential developments on the western plateaus discharges into the Snoqualmie River through drainage systems or direct pipelines (Onwumere and Batts 2004). Approximately 60 percent of the banks of the Snoqualmie River lack riparian vegetation other than invasive herbaceous species, and where native vegetation is present it is often confined to a strip of land that can accommodate only a narrow band of trees and shrubs. Almost 30 percent of the floodplain tributaries have been channelized, and urbanization and in and near Duvall, Carnation and Fall City has eliminated portions of the floodplain through placement of fill for construction of urban buildings and infrastructure. In spite of these modifications, the Snoqualmie River and its tributaries on the valley floor contain extensive areas of habitat of primary association for ESA and Magnuson-Stevens Act (MSA) listed species.
Cherry Creek, WRIA #07.0240 (Confluence @ RB, RM 6.7) Cherry Creek flows into the Snoqualmie River at RM 6.7 (Williams et al. 1975). Lower Cherry Creek flows though a large historic alluvial fan that has been heavily fragmented by past removal of forest cover, channelization, wetland drainage and periodic dredging. In addition, an unscreened pump intake just upstream from State Highway (SR) 203 is a significant source of juvenile mortality for several fish species. Upstream from the agriculture-dominated Snoqualmie valley floor, Cherry Creek is generally healthy and supports abundant populations of coho, steelhead, and freshwater mussels (Solomon and Boles 2002). A habitat survey of lower Cherry Creek (RM 0.0 to 2.1) conducted in 2001 noted that this reach has a very low gradient (0–0.5 percent), and that the stream flows for a considerable distance along the east edge of the valley wall where it is entrenched within an agricultural ditch. The streambed morphology in this segment of Cherry Creek is riffle-glide, with very long, deep (up to up to three feet) glides. The substrate in this reach ranges from gravel where the stream descends to the valley floor, to sand and silt at the mouth. Both banks are armored in many locations throughout this reach. The riparian vegetation includes alder and cottonwood trees on the right bank, alder and big leaf maple on the left bank, and reed canarygrass and blackberry on both banks. Overhead canopy ranges from sparse to non-existent from mouth to the confluence with Hanstead Creek just upstream from SR 203. Upstream from there, Cherry Creek has been channelized along the toe of the north valley wall, and riparian vegetation is sparse along the left bank, which borders agricultural fields. Upstream from the confluence with

King County National Flood Insurance Program Biological Opinion . Compliance Submittal and Programmatic Habitat Assessment
3‐6
North Fork Cherry Creek, a narrow band of maturing riparian vegetation is present as a result of revegetation conducted as mitigation for agricultural drainage projects. Fish surveys by the Wild Fish Conservancy (WFC) (formerly known as Washington Trout) found one- and two-year-old juvenile Chinook in lower Cherry Creek (Thompson et al. 2011), which suggests that certain stream segments of the lower Snoqualmie River subbasin support stream-type juvenile Chinook, which are a far less common life history type in Puget Sound Chinook than their ocean-type counterparts. The WFC and several project partners are working on a project to address compromised habitat conditions in lower Cherry Creek Valley by reconnecting the creek’s intact historic channel and consolidating three floodplain ditches into a single naturalized stream channel. This project will improve instream and riparian habitat diversity and complexity along nearly a mile of lower Cherry Creek and its adjacent floodplain. These habitat improvements will benefit seven species of salmonids, including Chinook and steelhead. This project complements additional work Washington Department of Fish and Wildlife (WDFW) is carrying out along lower Cherry Creek to acquire and restore segments of the stream and its floodplain, including removal of levees and at least one pump that adversely impact fish populations and habitat.
Tolt River (Confluence @ RB, RM 24.9), RM 0.0 to 6.5 The Tolt River, which drains a 101-square-mile (262 square km) basin, is the largest tributary to the lower Snoqualmie River. The City of Seattle operates a reservoir on the South Fork Tolt River that drains a 13,300-acre watershed that provides 30 percent of the drinking water for 1.3 million people in the Seattle area. The Tolt River is the largest contributor of coarse sediment to the Snoqualmie mainstem. This sediment forms a delta at the Tolt’s confluence and a gravel-rich reach of the Snoqualmie River that are among the most heavily used salmonid spawning areas in the Snohomish basin (Lucchetti 2005). Geomorphically, the Tolt River delta exerts a great influence on the larger Snoqualmie River channel, constricting and steepening it enough to create a diversity of habitats, including large pools and gravel-bedded spawning riffles that differ greatly from the majority of the Snoqualmie River’s low gradient, sand- and silt-bedded, meandering channel. The six miles of the Tolt River upstream from the delta are the Tolt River subbasin’s most productive for salmon. Historically this reach exhibited considerable channel migration due to deposition of cobble and gravel sediments from the canyons upstream. The process of sediment deposition and subsequent channel migration resulted in a myriad of complex mainstem and floodplain side-channel habitats, many of which meander through second- and third-growth forest with scattered single-family homes. In many places, side channels still exist within the river’s broad historic meander belt, but along the mainstem revetments and levees prevent the river from periodically flushing out or reoccupying these side channels or migrating laterally to create new ones. The net effect is a decline in habitat diversity and productivity with increasing proximity to the City of Carnation, which extends from the SR-203 Bridge to about RM 2. As a result, the long-term value of these habitats is reduced due to habitat simplification and riparian habitat, and the inability of the river to occupy old off-channel habitats or create new ones. The riparian vegetation along the lower Tolt River is dominated by black cottonwood and big leaf maple, along with significant patches of conifers. Much of the riparian zone along the lower

King County National Flood Insurance Program Biological Opinion . Compliance Submittal and Programmatic Habitat Assessment
3‐7
Tolt River has been extensively modified, initially by logging, and more recently by moderate to low density residential development. The Tolt River supports populations of all five species of salmon native to the northwest, steelhead and resident rainbow trout, sea-run and resident cutthroat trout, bull trout, brook trout, mountain whitefish, and sculpin. An evaluation of salmon habitat in WRIA 7 found that the lower Tolt River supported at least 12 percent of the total Chinook spawners in the WRIA 7 watershed (Snohomish Basin Salmon Recovery Forum 2005). Several sightings of adult char (either bull trout or Dolly Varden trout) have occurred in the Tolt River and the mainstem Snoqualmie River near the mouth of the Tolt River, suggesting that these river segments may be used by bull trout for foraging (Berge and Mavros 2001). Since 1989 the WFC has performed snorkel surveys in the Tolt watershed to document the numbers and origin (hatchery or wild) of adult steelhead that utilize the North and South Forks of the Tolt River. In addition, WDFW counts redds in the Forks of the Tolt River. These population monitoring programs indicated that during the early 1990s, the abundance of steelhead in the forks of the Tolt was low and declining. As a result, the anadromous reaches of the forks of the Tolt have been closed to recreational fishing since 1991. Since then, steelhead use of the forks of the Tolt has been variable, and in 2011 the Tolt River was closed to steelhead fishing because of predictions that wild steelhead would return in numbers far short of target levels (WDFW 2011a).
WRIA 7 SubArea Water Quality Issues Since the late 1990s the Washington Department of Ecology (Ecology) has conducted two Total Maximum Daily Load (TMDL) projects aimed at addressing water quality problems in the Snoqualmie basin. In July 1996 the Environmental Protection Agency (EPA) approved the first TMDL plan for the Snoqualmie River. In 1994 Ecology made recommendations on how to protect and improve water quality in the river in the report, Snoqualmie River TMDL Study (Joy 1994). In March 2008 Ecology published an updated TMDL study on fecal coliform bacteria, dissolved oxygen, ammonia-nitrogen, and pH levels in the watershed in order to determine the effectiveness of TMDL clean-up efforts in the lower Snoqualmie River basin following issuance of the original cleanup plan in 1966 (Sargeant and Svrjcek 2008). Ecology updated the Snoqualmie River TMDL plan to address high water temperatures throughout the watershed (Svrjcek et al. 2011). Snoqualmie River. Ecology does not have a water quality monitoring station on the lower Snoqualmie River within the study area, but does maintain one at RM 2.7 in Snohomish County. Water quality at this station met or exceeded expectations and was deemed to be of lowest concern based on Ecology’s water-year 2010 data summary. The quality of water going over Snoqualmie Falls into the Lower Snoqualmie watershed was good throughout the quality water sampling program that Ecology conducted between 2003 and 2005 as part of a TMDL effectiveness monitoring study (Sargeant and Svrjeck 2008). Cherry Creek bacteria levels improved between the 1989 to 1991 and the 2003 to 2005 TMDL studies. Wet season water quality was good, but water quality during the August-October critical low flow period remained poor, and dissolved oxygen, pH, and temperature levels did not meet standards. In addition, a 63 percent reduction in fecal coliform levels would have been needed during the critical low flow period in order to avoid water quality exceedences. Ecology recommended continued work with Cherry Creek property owners to control critical period

King County National Flood Insurance Program Biological Opinion . Compliance Submittal and Programmatic Habitat Assessment
3‐8
pollution discharges. Cherry Creek was considered a higher priority stream for focused water cleanup projects because of the consistently elevated bacteria levels and poor overall water quality (Sargeant and Svrjeck 2008). In Tuck Creek, water quality deteriorated since Ecology’s original 1989-91 TMDL study (Joy 1994). The 2003-2005 effectiveness monitoring study detected problems with bacteria, ammonia-nitrogen, dissolved oxygen, and pH levels. A 39 percent reduction in fecal coliform bacteria levels would have been needed during the critical high flow period to meet the state water quality standard for fecal coliform. Because of persistent elevated bacteria levels and poor overall water quality, Tuck Creek was deemed a good candidate for focused water cleanup projects (Sargeant and Svrjeck 2008). Ames Creek bacteria levels showed improvement since Ecology’s original 1989-91 TMDL study (Joy, 1994). However water quality assessed between 2003 and 2005 remained poor, and an 86 percent reduction in fecal coliform levels have been needed during the August through October critical low flow period in order to meet the state water quality standard for fecal coliform. Ecology recommended continued work with Ames Creek property owners to control both dry-weather and wet-weather pollution discharges. Because of the consistently elevated bacteria levels and poor overall water quality, Ames Creek was deemed a higher priority for focused water cleanup projects (Sargeant and Svrjeck 2008). Harris Creek, which shares a portion of its 100-year floodplain with that of the Snoqualmie River, had good water quality during the wet season but showed higher bacteria levels during storm events. A 10 percent reduction in fecal coliform bacteria levels would be needed during the August through October critical low period. Ecology recommends continued work with Harris Creek property owners to control stormwater runoff. Because of the large size of the developable area, growth pressures, and potential changes in property ownership, Ecology considers Harris Creek an important area for continued water cleanup efforts (Sargeant and Svrjeck 2008). Patterson Creek: During the 2003 to 2005 water quality sampling program, water quality was poor during the critical late summer low flow period between August and October with violations of fecal coliform, dissolved oxygen, and temperature criteria. The highest bacteria levels were observed in association with storm events. The report stated that that a 64 percent reduction in fecal coliform bacteria levels would be needed during the critical low flow period in order to meet the water quality standard for fecal coliform. Subsequent water quality sampling at Ecology’s water quality monitoring station at RM 0.7 near Fall City continued to be of concern based on water-year 2010 data, because of moderately low dissolved oxygen, moderately high fecal coliform bacteria and total phosphorus, and high concentrations of total nitrogen. To improve water quality in Patterson Creek, Ecology recommended examination of compliance with livestock ordinances, on-site sewage treatment systems, and stormwater conveyances. The Tolt River showed good water quality for bacteria, pH, and dissolved oxygen levels. Ecology recommended continued attention to stormwater management in the Tolt River watershed to prevent water quality problems in the future. Griffin Creek, which shares a portion of its 100-year floodplain with that of the Snoqualmie River, had good water quality during the wet season (November through April), but high bacteria levels during storm events. Although mean bacteria levels in Griffin Creek have improved since the original 1989-91 TMDL study, a 43 percent reduction in fecal coliform bacteria levels would be needed during the critical wet season period in order to meet the state water quality for fecal

King County National Flood Insurance Program Biological Opinion . Compliance Submittal and Programmatic Habitat Assessment
3‐9
coliform. Ecology recommends continued work with Griffin Creek property owners to control stormwater runoff. Because of the small size of the developable area and relative lack of growth pressure, Griffin Creek is a lower priority for focused water cleanup projects (Sargeant and Svrjeck 2008). Raging River: Ecology determined that the Raging River met the TMDL target for bacteria during the study period, but pH and temperature exceeded state water quality criteria. Ecology conducted a special diagnostic study of the Snoqualmie River in the Fall City area between September 2003 and September 2005 that revealed higher fecal coliform, nitrite-nitrate nitrogen, and chloride levels just upstream of the Fall City area on the left bank of the mainstem. As a result, Ecology recommended additional evaluation of potential pollution sources and water quality monitoring upstream from the confluence of the Raging River, as well as in the Raging River itself (Sargeant and Svrjeck 2008). Tokul Creek had generally good water quality except for high nitrogen and pH levels possibly related to operation of the Tokul Creek fish hatchery (Sargeant and Svrjeck 2008). Although Ecology considers water quality to be good in the Snoqualmie watershed in many respects, two water quality parameters have remained problematical in spite of implementation of TMDLs: fecal coliform bacteria and water temperature. Bacterial levels in the main river have improved greatly over the last 10 years and for the most part no longer exceed state water quality standards. In some of the tributaries, however, bacterial levels remain high. In addition, water temperatures throughout the watershed are very high during the summer. These temperature problems can be attributed to deforestation and other land modifications that make portions of the watershed inhospitable for salmonids during late summer and early fall when Chinook and several other salmonid species return to freshwater to spawn. One way to cool water temperature is to shade the water body by adding or retaining streamside vegetation, but existing land uses, especially agriculture, restricts opportunities to revegetate riparian areas because of concerns about potential adverse impacts of riparian shading on crop production (Svrjeck et al. 2011).
Habitat Features in the Floodplains of the Lower Snoqualmie River and Its Major Tributaries Downstream from Snoqualmie Falls, the Snoqualmie River flows generally northwest and north, crossing the boundary of King and Snohomish Counties just north of the City of Duvall. The most important tributaries in this segment of the river are Cherry, Ames, Harris, Griffin, Patterson and Tokul Creeks and the Tolt and Raging Rivers. Perkins (1996) prepared a channel migration study of the three forks area of the Snoqualmie River upstream of Snoqualmie Falls. This information, which provides descriptive details of this area, is incorporated here by reference. Shannon & Wilson (1991) also produced channel migration studies of the Tolt and Raging Rivers that provide descriptive details of those two major tributaries. Historically, the lower Snoqualmie valley had mostly been in dairy agriculture (Ehrlich 1978), but in the past 30 years many dairy farms were converted to row crops and other non-dairy agriculture including poplar plantations.
King County National Flood Insurance Program Biological Opinion . Compliance Submittal and Programmatic Habitat Assessment
3‐10
There are many discontinuous levees and revetments in the lower Snoqualmie, particularly on the outside river bends between RM 39.5 and RM 6. Many of these facilities are training revetments that mainly protect against erosion and channel migration, and confine the channel in its present position. Most of the levees are low and only contain flows up to the 2-year recurrence interval. As a result, much of the valley floor is inundated during large floods. In the Tolt River, the dominant type of channel migration differs in different reaches (Shannon & Wilson 1991). Channel splitting and overflow side-channels are more common downstream from RM 3.8, which is the upstream end of a large alluvial deposit known as the Tolt Delta. Levees and revetments along the lower 2.2 miles of the river prevent major erosion and avulsions. Upstream from RM 2.2, avulsions and cutoffs are the dominant type of channel migration, which gives this reach a braided appearance. Lateral migration is also dominant from RM 5.0 to 5.9. Levees and revetments along the lower six miles of the river either cut off or restrict connections with mostly forested side channels, ponds and wetlands, although a culvert in the Frew levee at RM 0.8 on the right bank allows fish to access off-channel flood refuge and rearing areas. The Raging River has a reputation for fast runoff and flash flooding, hence its name. Levees have been constructed along the full length of both banks in the lower two miles of the channel near Fall City. In the 1960s, gravel was removed from the mouth of the Raging River as a flood control measure (Shannon & Wilson 1991). Channel migration zones occur from about RM 2.0 to RM 3.8, and from RM 5.8 to 8. Straightening of bends by cutoffs and short avulsions have occurred from RM 2.8 to 5.8; multiple channels have formed in the reach between RM 4.7 (the I-90 bridge) and 5.8, giving the reach a braided appearance (Shannon & Wilson 1991), but the river is constrained in many places by its own narrow valley walls and road embankments along Preston-Fall City Road.
Distribution of Snoqualmie Salmonids in Habitats of Primary Importance The majority of the Snoqualmie Fall Chinook population returns to the Snoqualmie River portion of WRIA 7 in King County rather than to areas within the Skykomish basin. Adults return to the system from August through September, with spawning starting in late September and continuing through mid to late November in the King County streams. Areas of high density Chinook spawning and the upper extent of Chinook distribution in WRIA 7 study sub-area are available on WDFW’s SalmonScape at http://wdfw.wa.gov/mapping/salmonscape/index.html. Areas of concentrated spawning in King County include: (1) the mainstem Snoqualmie River, especially in gravel riffle and braided reaches downstream of the mouths of the Tolt River, RM 22 to RM 25, and the Raging River, RM 34 to RM 35; (2) the Tolt River from mouth upstream to about RM 6; (3) the Raging River from the mouth upstream to about RM 5; and (4) Tokul Creek from the mouth to the barrier dam at RM 0.5 (Williams et al. 1975; Snohomish Basin Salmon Recovery Technical Committee 1999). A larger percentage of Snoqualmie Chinook juveniles than is normally found in Puget Sound fall or summer/fall Chinook populations migrate to sea as age-1 smolts (Snohomish Basin Salmon Recovery Technical Committee 1999). Increased smolt size confers a survival advantage in the marine environment (Hartman and Scrivener 1990, Zabel and Achord 2004). Therefore, habitat features suitable for both summer and overwinter rearing of juvenile Chinook are likely to be especially important for this stock, which exhibits a higher percentage of age-1 outmigrant
King County National Flood Insurance Program Biological Opinion . Compliance Submittal and Programmatic Habitat Assessment
3‐11
smolts than most other Puget Sound Chinook stocks. These habitat features include suitable cool summer water temperatures (under 74oF), availability of deep mainstem pools with large wood, off-channel sloughs and ponds, and other low-velocity areas provide summer rearing areas and winter flood refuge. The historic isolation of channels from floodplain habitats by levees and revetments has truncated natural riverine processes in which streams migrate laterally within forested floodplains, thereby maintaining habitat for salmonid species including Chinook that overwinter in freshwater. Other anadromous fish stocks utilizing portions of this system include one stock each of summer and winter steelhead, one stock of chum salmon, an odd-year stock of pink salmon, and sea-run cutthroat trout. Longtime local residents also mention a run of small sockeye salmon that ascended the Snoqualmie River to the vicinity of Fall City (K. Beardslee, pers. comm. 2001). Resident rainbow and cutthroat trout are also present downstream from Snoqualmie Falls, but populations of these fish are much more abundant and robust in the three forks of the river upstream of Snoqualmie Falls (Pfeifer 1985). Fish use much of the mainstem Snoqualmie River downstream of Snoqualmie Falls as a migration corridor. Major Chinook spawning aggregations occur in gravel riffle and channel split areas between RM 22 and 25 downstream of the mouth of the Tolt River, and between RM 34 and 35 downstream of the mouth of the Raging River. Some Chinook spawning also occurs in the boulder strewn reach between the mouth of Tokul Creek and Snoqualmie Falls, upstream of RM 39.6. While some coho salmon spawn in the mainstem reaches between RM 22 and 25 and between RM 34 and 35, utilizing the shallower and slower side channels and braids, and in the mainstem reach between Tokul Creek and Snoqualmie Falls, most coho spawning occurs in the tributaries. The reach between the mouth of Tokul Creek and Snoqualmie Falls also appears to be a holding area for a portion of the adult summer steelhead bound for the Tolt River (K. Beardslee, pers. comm. 2001). These fish hold in the Tokul Creek to Snoqualmie Falls reach, then, later in the fall, drop back and ascend the Tolt River where they eventually spawn. Although Chinook salmon spawn and rear in the Raging River up to and beyond RM 7.0, it has been estimated that 85 percent of the spawning takes place in the lower four miles of river downstream of Preston (Williams et al. 1975). Coho salmon inhabit the entire accessible river and tributaries, with a fair number of fish using Lake and Deep Creeks (Williams et al. 1975). Chinook and coho salmon also utilize the Tolt River, as do steelhead, chum and pink salmon (the latter two species in the lower four miles). Coho salmon also use Stossel and Langlois Creeks.
Snohomish/Skykomish Steelhead Trout The Snohomish/Skykomish stock of winter steelhead is one of the two largest steelhead populations in the Puget Sound Evolutionarily Significant Unit (ESU) (Hard et al. 2007). The wild steelhead winter run occurs primarily between February and April, while the hatchery fish generally run from mid-November through mid-February. Spawning occurs through most of this entire winter and spring period primarily in the mainstem Snoqualmie River and the Tolt River. The escapement goal for the Snohomish basin wild winter steelhead is 6,500 fish. The trend in this stock has been upward in recent years (Hard et al. 2007). The summer steelhead in the Tolt and North Fork Skykomish are native and the South Fork Skykomish summer steelhead stock was developed artificially via a trap-and-haul program to allow colonization of non-native fish. Native summer stocks are small runs of fish limited by their

King County National Flood Insurance Program Biological Opinion . Compliance Submittal and Programmatic Habitat Assessment
3‐12
habitats, spawning in areas isolated from native winter stocks. Since only a few miles of stream are used for spawning, native summer steelhead populations are small (Haring 2002).
SnohomishSkykomish Bull Trout In King County, self-sustaining native char have been documented in the Skykomish, Cedar and White River basins. Native char have been observed in the Tolt River, Issaquah Creek, the lower Cedar River (below Landsburg), Lake Washington, Lake Sammamish, Shilshole Bay, the lower Green River and the Duwamish estuary (King County 2000b). A few adult bull trout have been observed in the North and South Forks of the Tolt River since the late 1990s (King County 2000b, Glasgow 2005). The Tolt River system is considered important for seasonal foraging by migratory bull trout and is currently accessible to anadromous and fluvial bull trout. These observations do not necessarily indicate the presence of self-sustaining populations, as these fish exhibit complex life history strategies and migration patterns including a marine life history stage that is not widely understood (Berge and Mavros 2001). The USFWS has designated a total of 282.7 RM within WRIA 7 as critical habitat for bull trout (USFWS 2010). Most of the area occupied by bull trout in WRIA 7 is in Snohomish County in the North Fork Skykomish River (WDFW 1998). Prior to construction of the Sunset Falls trap and haul facility in the mid 1950s, bull trout were not known to be present in the King County portion of the system (Kraemer 2001). Following construction of that facility, a few bull trout were transported above Sunset Falls and released into the upper South Fork Skykomish River. This established a modest spawning population of about 50 returning adults per year. Fish begin arriving at Sunset Falls as early as late May, and continue into August. Spawning occurs from late August to mid November, with peak activity usually between the first week of October and the first week of November (WDFW 1998). A 1993 radio tagging study of bull trout collected at the Sunset Falls facility revealed that almost all of these fish spawn in the East Fork Foss River from RM 4.3 to RM 7 or 8 within the Mount Baker-Snoqualmie National Forest, where there are no FEMA FIRMS. To access this reach, the fish must ascend a falls and at least two steep cascades that Williams et al. (1975) mapped as impassable by salmon. However, bull trout, more so than other salmonids, are capable of ascending such barriers to reach suitable spawning areas (Kraemer 2001). The Snohomish–Skykomish River critical habitat sub unit (CHSU) is considered essential to bull trout conservation because it represents the second stronghold for the amphidromous life history form within the Coastal bull trout recovery unit (USFWS 2010). This CHSU also represents part of the core distribution of amphidromous bull trout in Puget Sound. Extensive portions of the habitat are within protected areas (Henry Jackson Wilderness, Wild Sky Wilderness, and Alpine Lakes Wilderness). The Snohomish–Skykomish River CHSU is located on the western slopes of the Cascade Range and includes the mainstem Snohomish River; the lower Snoqualmie River; the mainstem Skykomish River and its two major forks, the North and South Forks; and associated tributaries accessible to bull trout. The following waterbodies are included in this CHSU: (1) The Snohomish River from its mouth at Puget Sound upstream 32.3 km (20.1 mi) to its confluence with the Skykomish and Snoqualmie Rivers—including Ebey, Steamboat, and Union Sloughs—provides foraging and overwintering habitat and an essential migratory corridor for amphidromous bull trout; (2) the Pilchuck River from the mouth of the river to a natural barrier at RM 35.5 provides foraging, migrating, and over-wintering (FMO) habitat in the lower reaches of the Snohomish River; (3) the Snoqualmie River from its mouth to Snoqualmie Falls at RM 39.3; (4) the Tolt River from the mouth to the confluence of the North and South Forks at RM 8.4 mi); (5) the North Fork Tolt River up to a natural barrier at RM 6.1;

King County National Flood Insurance Program Biological Opinion . Compliance Submittal and Programmatic Habitat Assessment
3‐13
and (6) the South Fork Tolt River to a natural barrier at RM 8.1 all provide FMO habitat for bull trout within the Snohomish–Skykomish Rivers core area.
Snohomish Coho Salmon Coho salmon spawning occurs from early November through late January throughout the mainstem Snoqualmie River and tributaries downstream from Snoqualmie Falls (Williams et al. 1975). Stock assessments conducted by WDFW in 1992 and 2002 (WDFW 1992, 2002) rated Snohomish coho salmon as healthy. Pess et al. (2002) studied the spatial distribution of returning adult coho salmon in relation to landscape characteristics and land use in the Snohomish River watershed. They found that although inter-annual adult fish abundance varied substantially, adult coho densities were significantly correlated with wetland occurrence, local geology, stream gradient and land use. The 25 percent of the spawning survey index reaches with the highest average abundance of spawning salmon accounted for nearly half of the fish counted in the index reaches. In contrast, the 25 percent of the index reaches with the fewest salmon on average supported less than 5 percent of the spawning coho salmon. Portions of the drainage basin or riparian area underlain by shallow bedrock had lower salmon abundances than those underlain by peat. Median adult coho salmon densities in forest-dominated areas were 1.5 to 3.5 times the densities found in rural, urban, and agricultural areas and these distribution patterns were consistent over time. The authors surmised that basin areas dominated by bedrock generally produce channels that are too steep to support spawning habitat and lack pool habitat favored by for coho salmon for rearing.
Snohomish Pink Salmon Even-year pink salmon in Washington are known only to occur in the Snohomish River (WDF et al. 1993). The origin of this population is uncertain; these fish may be endemic or may have resulted from one or more transplants of even-year fish from Alaska or Canada. Regardless of its origin, the Snohomish River even-year population has apparently been naturally self-sustaining for at least the last 18 generations (about 36 years) (Hard et al. 1996). Features of the Snohomish River pink salmon even-year population are similar to those in other even-year populations from central British Columbia in terms of peak timing, which is comparable to that of even-year British Columbia pink salmon, and three to four weeks earlier than that of odd-year pink salmon in the Snohomish River. As of the mid-1990s, the Snohomish River even-year pink salmon population was relatively small, on the order of a few thousand adults per generation (Hard et al. 1996). The odd-year Snohomish River pink salmon population, which uses the same spawning habitat as the even-year stock, is one to two orders of magnitude larger (Hard et al. 1996). Even- and odd-year Snohomish pink salmon are managed as a single unit, with an escapement goal for natural spawners of 30,000/year for even-year fish and 120,000/year for odd-year fish. The odd-year stock spawns from mid-September through October throughout the drainage in all accessible mainstem waters and larger tributaries. The even-year stock spawns primarily in September in the mainstem Snohomish and in the lower reaches of the Skykomish. Within King County pink salmon spawn in the mainstem Snoqualmie River, lower Cherry Creek (RM 0.0 to 4.0) and some of its tributaries, the Tolt River (RM 0.0 to 8.0) and the lower mile of its Forks and lower Tokul Creek (0.0 to 2.1). Stock status for both stocks are designated as healthy, even though spawner escapements for the even-year stock are relatively low, possibly because escapements of Snohomish even-year pink salmon have substantially increased since counts

King County National Flood Insurance Program Biological Opinion . Compliance Submittal and Programmatic Habitat Assessment
3‐14
by WDFW began in 1984 (WDFW 2002). Both the even-year and odd-year Snohomish populations of pink salmon were stable or increasing (WDFW 2002). Starting in the early 2000s, the even year stocks began to rise sharply. In 2004, almost 1.4 million even year pinks returned to WRIA 7, followed by a run of only just over 26,000 fish in 2006 and only 350 fish in 2008 and 24 fish in 2010 (WDFW 2011b). Also starting in the early 2000s, the odd year stock rose dramatically, to well over one million natural spawners each year since; total natural escapement exceeded 1.9 fish in 2009 (WDFW Salmonscape).
King County National Flood Insurance Program Biological Opinion . Compliance Submittal and Programmatic Habitat Assessment
3‐15
WRIA 8 Protected Species and Habitat Evaluation
WRIA 8 Study Area Overview For this analysis, this WRIA includes portions of the Cedar-Lake Washington basin within unincorporated King County, namely the segment of the Lake Sammamish shoreline and the Sammamish River within Marymoor Park (RM 12.5-13.7), Issaquah Creek upstream from Issaquah (RM 8.0 to headwaters), segments of the Bear-Evans Creek watershed upstream from Redmond and Woodinville, the portion May Creek, a tributary to south Lake Washington, upstream from the City of Renton (RM 6.7), and the Cedar River from Renton to Landsburg (RM 5.1 to 21.5).
Upper Sammamish River and Lake Sammamish in Marymoor Park The 98-square-mile Lake Sammamish watershed stretches from the Cities of Issaquah, Sammamish, Bellevue, Redmond, Woodinville, Bothell and Kenmore, and consists of numerous creeks that flow into the Lake Sammamish and the Sammamish River.
Lake Sammamish Lake Sammamish is seven miles long, 1.5 miles wide, has a maximum depth of 105 feet and a surface area of eight square miles. It stretches from Issaquah in the south to Redmond in the north. At Issaquah it is fed by Issaquah and Tibbetts Creeks, Lewis and Laughing Jacobs Creeks, and several smaller creeks in Bellevue and Redmond. Of these, Issaquah Creek is by far the largest tributary, supplying 70 percent of the inflow to the lake. Historically, the lake shoreline was forested, but clearing for urban and residential development have almost entirely eliminated forested habitat along the lake and altered shoreline in other ways including wetland filling. The shoreline near the outlet of Lake Sammamish within Marymoor Park is a notable exception to this development pattern, where a large expanse of the original deciduous forested swamp and marsh that historically encircled the lake can still be seen. Although the Sammamish River has been extensively channelized and armored within Marymoor Park, some of the river’s historic floodplain is still intact, especially in the areas of the park that border the lake, which is lined with dense thickets of willows and cottonwood trees.
The Sammamish River The Sammamish River is formed by the outlet of Lake Sammamish at RM 13.8, which flows northwesterly through a broad valley that opens into the northern end of Lake Washington. Because the majority of the river lacks off-channel habitat, wetlands near the lake outlet and patches of shade-producing, overhanging riparian habitat along the mainstem form disproportionately important transportation corridor habitat for fish travelling between spawning grounds and rearing habitats in tributaries of the river and the lake.
Issaquah Creek Watershed The Issaquah Creek watershed upstream from the City of Issaquah is an important resource for salmonid fish production (Williams et al. 1975). It includes a wide variety of streams, wetlands

King County National Flood Insurance Program Biological Opinion . Compliance Submittal and Programmatic Habitat Assessment
3‐16
and lakes that range in condition from semi-pristine to very degraded. Land use in the middle and upper parts of the basin is predominantly rural, and is over 80 percent forested. The two primary sub-basins within the study area are the middle and upper portions of Tibbetts Creek and Issaquah Creek. Both systems show residual impacts from historical land uses including mining and logging, but both support significant salmonid populations, especially Issaquah Creek and its larger tributaries: McDonald, Fifteenmile, East Fork Issaquah Creek, Holder Creek and Carrey Creek. Past patterns of logging and clearing for residential development have reduced the structural complexity of many channel segments through removal of large woody material and increases in stormwater runoff. The most destabilized streams are in the McDonald and Tibbetts Creek basins. Due to steep topography, the Tibbetts and Issaquah Creek basins have narrow floodplains and fewer wetlands than many other similar-sized basins in King County (King County et al. 1991).
BearEvans Creek Watershed The total length of the Bear Creek watershed is approximately 60 RMs comprising five important tributaries greater than two miles in length: Evans Creek (8.2 RMs), Mackey Creek (2.6 RMs), Cottage Lake Creek, Seidel Creek (2.8 RMs, much of which is protected within the City of Redmond Watershed) and Struve Creek (1.8 RMs). Bear Creek is 12.4 miles in length and originates in Paradise Valley in Snohomish County north of Paradise Lake. It drains southwesterly through Redmond and enters the right bank of the Sammamish River at RM 12.2 (King County 1993). The basin can be divided into four major sub-basins: Upper Bear Creek, Cottage Lake Creek, Evans Creek and Lower Bear Creek. The upper Bear Creek sub-basin flows through rolling terrain with mostly rural land uses to the confluence of Cottage Lake Creek. Fish use is very high, especially along the mainstem but also in the numerous tributaries that drain the eastern uplands. The upper Bear Creek sub-basin contains excellent spawning and rearing areas in diverse stream segments bordered by extensive wetlands. The Cottage Lake Creek sub-basin also supports very high fish use, most notably Chinook salmon, especially downstream from Cottage Lake, but also upstream from the lake in lateral tributaries. The upper sub-basin is rural, but development has occurred in Woodinville and Redmond downstream from Cottage Lake. Much of lower Bear and Evans Creeks lies in flat valleys that contain a mixture of urban, suburban, and agricultural land uses. The headwaters of all of the tributaries are similar to those of upper Bear Creek and lie in relatively undeveloped rural landscapes. Evans Creek originates east of Redmond on Union Hills, and flows south from mostly forested hillsides through a narrow canyon with steep gradients until it abruptly turns northwest until it joins Bear Creek at RM 2.0 south of Redmond. The lower 2.5 miles of Evans Creek lie in the Sammamish valley, which contains a mixture of farmland and clusters of urban development. Cottage Lake Creek, which supports the highest density of salmon spawning in the basin, originates at Little Lake and Crystal Lake and joins Bear Creek at RM 4.9 (King County 1993). In spite of urbanization of downstream segments of the watershed, Bear Creek and several of its tributaries, mostly notably Cottage Lake Creek, contain some of the most productive salmonid spawning and rearing habitat in Central Puget Sound. The 63-acre Cottage Lake helps hydrologically stabilize downstream segments of the watershed. A number of publicly owned conservation lands help protect some of the best habitat in the system. The downstream portions of the watershed exhibit locally good fish habitat, but have been the most heavily affected by adverse land use changes prior to the current environmental regulatory framework including conversion of forests to agricultural, residential and urban uses and impervious surface; wetland and floodplain filling, channelization, and bank hardening; road and bridge
King County National Flood Insurance Program Biological Opinion . Compliance Submittal and Programmatic Habitat Assessment
3‐17
construction; and severe channel incision in ravines upstream from valley floor areas (King County 1993).
May Creek Watershed The May Creek watershed encompasses a 14-square mile area and includes 26 miles of stream channels, two small lakes (Lakes Boren and Kathleen) and over 400 acres of wetlands. The western, southwestern and northwestern portions of the basin are within the Cities of Renton and Newcastle, and are relatively well protected from land use impacts other than stormwater runoff within corridors of mostly forested park lands that flank mainstem and tributary stream segments which descend within ravines from the extensive, much flatter portion of the watershed that flows through a broad wetland floodplain in May Valley within King County. The headwaters have undergone waves of deforestation and suburban development, as well as impacts from quarry mining. The May Valley portion of the watershed contains a 200-acre wetland that along with the stream channel has been desnagged, channelized, straightened and repeatedly dredged in past decades to address flooding impacts to mostly agricultural lands that lie within the valley. Cessation of dredging and the gradual infill of the channel with sediment have reduced channel capacity within the valley and increase the frequency of overbank flow. Extensive flooding of pastures and other open land occurs annually during the winter. Development in headwater areas have increased the frequency and duration of flooding on the valley floor. Lack of large wood in steeper segments of the mainstem and its tributaries have simplified instream habitat and limited the potential value of the watershed for its key salmonid species, coho and salmon and steelhead trout. Sockeye salmon and adfluvial cutthroat are somewhat more tolerant of these habitat alterations and are still relatively widespread in the watershed. In spite of these many impacts, the May Creek basin still retains high quality natural resources and attributes, and supports several species of salmonids (King County 2001). May Creek has consistently high fecal coliform counts in May Valley and upper basin areas. Poor livestock practices and failing septic counts both contribute to these high coliform counts. Several tributaries also have similar water quality problems (King County 2001).
Cedar River Watershed Prior to 1917, when the Montlake cut was constructed and the Hiram M. Chittenden Locks and Lake Washington Ship Canal were completed, the Cedar River discharged into the Black River, which was also the outlet for the Lake Washington drainage. As part of the ship canal operation, the Cedar River was diverted into Lake Washington and the Black River outlet ceased. The Cedar River originates in the Cascade Mountains near Stampede Pass and flows west-northwest nearly 50 miles to its present confluence with Lake Washington at Renton. The uppermost 10 miles flow through steep-sloped, narrow, forested mountain terrain in a channel characterized by high gradient riffles and cascades. Two water storage reservoirs, Chester Morris and Cedar Lake, occur in the next nine miles. Downstream from Cedar Lake to the City of Seattle water diversion dam at Landsburg (RM 21), the forested valley is alternately narrow and broad. Upstream from Landsburg the river has many gentle-gradient reaches with good pool-riffle areas, but for almost a century the diversion dam was a total barrier to upstream migration of anadromous fish (Kiffney et al. 2009). Downstream from Landsburg the King County River Management Program inventory lists 65 flood and erosion control facilities along 9.9 miles of stream bank. The reach between the
King County National Flood Insurance Program Biological Opinion . Compliance Submittal and Programmatic Habitat Assessment
3‐18
diversion dam and the Highway 18 Bridge at approximately RM 14.6 contains several high gradient boulder areas with only intermittent pool-riffle sequences (Perkins 1993). This is, however, an area of good gravel recruitment and high use by spawning salmon. The King County River Management Program inventory shows several bank protection revetments along this reach. Rock Creek, a tributary utilized by anadromous fish, enters at RM 18.2 (King County 2003). Downstream of Maple Valley to the SR-169 crossing (approximately RM to 11.0 to 13.4) land use is primarily residential. Although levees at the upper end of this reach constrain the river and provide some flood protection, all of them overtop. The river meanders over a shallow, relatively broad valley through this reach, taking on a pool-riffle character with good spawning and rearing habitat for fish. Peterson and Downs (a.k.a. Taylor) Creeks, tributaries used by anadromous fish, enter at RM 13.8 and 12.8 respectively (King County 2003). River miles 9.0 to 11.0 are referred to as the Belmondo reach. Here the gradient is moderately steep and the channel splits, even though bedrock along much of the left bank and an old railroad grade parallel to the river are major confining features. While RMs 4.3 to 9.0, where SR-169 crosses again, have a series of revetments and training levees that confine the river, there is still opportunity for the channel to move near the confluence of Madsen Creek at RM 4.5. Levees in this reach provide flood protection up to a 25-year event. A levee setback project between RMs 7.2 and 7.6 was completed in 2008, and subsequently the channel has widened considerably and migrated toward the right bank, forming a new side channel within the former main channel along the left bank within the middle segment of the project reach. Several formerly abandoned side channels on both banks were reconnected to the main channel as a result of this project, and extensive gravel bars with large wood accumulations have deposited within this reach. The Cavenaugh Pond Natural Area, which is owned by King County and located on the left bank of the mainstem Cedar River between 5.5 to 7.0, is a large expanse of off-channel habitat formed by a former gravel mining operation. It includes a variety of fish and wildlife habitats including a riparian forest, a structurally complex wetland utilized by spawning sockeye and coho salmon, as well as the mainstem Cedar River, which is used by coho, Chinook and sockeye salmon, steelhead trout and coastal cutthroat trout. The lower three miles of the Cedar River are heavily channelized and industrialized. Downstream from the I-405 Bridge at RM 1.6, the river flows through the City of Renton and a Boeing manufacturing complex. The flood control facilities in this lower reach are owned and managed by the City of Renton (King County 2003).
WRIA 8 Protected Species The Cedar River is used by ESA-listed Cedar River Chinook salmon, Cedar River coho salmon, Cedar River winter steelhead and, within the Cedar River watershed, Cedar River bull trout.
Lake WashingtonCedar River Chinook Salmon The WDFW identifies Cedar Chinook as a stock based on their distinct spawning distribution and genetic analysis that has shown that Cedar Chinook are significantly different from Chinook populations in Issaquah Creek and the North Lake Washington tributaries (Marshall 2000). These fish spawn from mid-September to early November mostly in the mainstem Cedar River
King County National Flood Insurance Program Biological Opinion . Compliance Submittal and Programmatic Habitat Assessment
3‐19
from RM 2.0 to RM 21, although some spawning also occurs in Taylor Creek and in Rock Creek, a Cedar River tributary that enters at RM 18.2 (Mavros et al. 2000). Chinook spawning in Rock Creek appears to be impaired at times due to water withdrawals by the City of Kent, which has a water right that allows operation of a set of pumps that remove water from the creek and associated groundwater via a gallery of shallow wells (Gino Lucchetti, pers. comm. 2011). Areas of concentrated Chinook spawning are located at RM 6 to 7, RM 10 to 11, and RM 13 to 19 (Mavros et al. 2000). The 1992 Salmon and Steelhead Stream Inventory (SASSI) listed the stock status of Cedar River Chinook as unknown, and the 2002 SASSI listed it as depressed due to a long-term negative trend in escapements and chronically low escapement values. Index escapements have declined since the early 1980s with a low of 120 spawners in 2000. The estimated Cedar River Chinook escapement was just under 500 fish in 2010 (WDFW Salmonscape), and the stock remains classified as depressed. Genetic evidence indicates that Sammamish and Cedar River Chinook are different stocks, which is consistent with the historical location of the Cedar River watershed within the Green-Duwamish-White River watershed (Marshall 2000). In past decades Green River Chinook were introduced into the Sammamish watershed and may have replaced the historical population . The characteristics of this historical Sammamish population are unknown, but it represents a loss of historical diversity in this region and in the Puget Sound ESU. Likewise, status and potential contributions (if any) of lake-spawning Chinook salmon life histories in Lake Washington are unknown. The significance of these diversity losses to the ESU’s viability is unknown (Ruckelshaus et al. 2006). Factors of Decline and Threats Following completion of the Landsburg fish passage project in 2003, salmon acquired access to stream habitat upstream of Landsburg for the first time in over 100 years. To evaluate the effectiveness of the fish passage project, a monitoring and research project of salmon recolonization in the watershed is being conducted collaboratively by Seattle Public Utilities (SPU), National Oceanic and Atmospheric Administration (NOAA) Fisheries, and the University of Washington scientists (Kiffney et al. 2009). The research began with collection of data on resident fish populations and aquatic ecosystem characteristics prior to fish passage from 2000 to 2002. Since 2003, the study has evaluated a number of different aspects of the salmon recolonization process, including numbers and characteristics of fish passing through Landsburg, spawning locations and timing, interactions with resident fish, growth and survival of juvenile salmon, and effects of salmon carcasses on stream ecosystems. Since installation of the fish ladder, juvenile coho salmon and trout rapidly dispersed and colonized multiple habitats within the mainstem and Rock Creek (WRIA #08.0345), which enters the left bank of the Cedar River at RM 23.9. By 2006, overall, fish densities had increased in survey reaches closest to Landsburg, and even more in survey reaches further upstream. Juvenile coho salmon and trout >80 cm accounted for the largest increases in fish use, and researchers postulated that higher densities of large trout may be due to increased prey resources (salmon eggs, smaller salmon fry and carcasses) or influx of trout from below Landsburg. In contrast, juvenile Chinook salmon densities declined, initially, but this may have been an artifact of the survey methodology, since surveys occurred after most Chinook had migrated to Puget Sound.
King County National Flood Insurance Program Biological Opinion . Compliance Submittal and Programmatic Habitat Assessment
3‐20
Spawning surveys showed rapid colonization by salmon of the Cedar River after the passage barrier was removed, indicating that salmon in the Cedar River have the innate ability to colonize newly available habitat. Juvenile fish preferentially selected side-channel habitat. Coho survival to the Ballard Locks from Rock Creek was relatively high compared to other Puget Sound systems. Monitoring of this project has documented anadromy in rainbow trout, which has implications for conservation of depressed steelhead populations in the basin (Kiffney et al. 2009).
Lake Washington Winter Steelhead Trout Spawning takes place from mid-December through early June throughout the Lake Washington basin including Bear Creek and several other Sammamish watershed and Lake Washington tributaries, Issaquah, Coal Creek and May Creeks, and the Cedar River. Since 1995 most Puget Sound winter run steelhead populations, including the Lake Washington population, have been in severe decline (Ford et al. 2010). Since 1986 total escapement has decreased from approximately 1,800 fish to fewer than 100 fish in 2005. Because of this, WDFW rates this population as depressed in 1998, and critical in 2002 (WDFW 2002). The steelhead escapement goal for Cedar/Lake Washington winter steelhead is 1,600 fish but actual escapement has been in single-digit numbers since 2007 (WDFW Salmonscape). Factors of Decline and Threats High levels of urbanization in most of the Lake Washington watershed are likely responsible for some of the steep decline of Lake Washington winter steelhead populations. Habitat problems affecting these populations include flooding, unstable soils, and poor land management practices. Other factors include a dam on the Cedar River, floodplain development, water withdrawals and logging (Kerwin and Nelson 2000).
Cedar River Bull Trout The only portion of WRIA 8 in which bull trout complete their life cycle is within the Cedar River Watershed in the Masonry Pool, Chester Morse Lake, and segments of several tributaries to the lake including the Cedar and Rex rivers and Rack Creek. The Cedar River population of bull trout is isolated from downstream areas by Cedar Falls, a natural barrier to upstream migration on the Cedar River. Bull trout are not present elsewhere in the Cedar-Lake Washington watershed because lack of suitable cold water habitat for spawning and rearing. Factors of Decline and Threats Historically, the bull trout population in the upper Cedar basin faced natural habitat-altering threats such as floods and forest fires as well as human-caused impacts including road building, timber harvest and construction of passage barriers. In 1962 the Seattle Water Department (now a division of SPU) embarked on acquisition of all watershed lands, thereby enabling improved fire protection and public access control. In 1996 the U.S. Department of Agriculture (USDA) Forest Service ceded its watershed land to the SPU, and SPU gained ownership of the entire watershed. At present, the watershed is managed as an ecological reserve under a Habitat Conservation Plan (HCP), and logging is undertaken only for ecological restoration purpose. In addition, SPU is implementing other restoration actions intended to benefit bull trout, and annual redd counts suggest that the population is currently relatively stable. Remaining potential impacts on bull trout stem from the operation of the Masonry Pool and Chester Morse Lake as a reservoir with fluctuating water levels that at times could deeply inundate bull trout redds thereby increasing the potential for sedimentation that could cause egg mortality.

King County National Flood Insurance Program Biological Opinion . Compliance Submittal and Programmatic Habitat Assessment
3‐21
Very low lake levels during the fall spawning season could dewater spawning habitat in the Cedar and Rex rivers, and encourage fish to spawn in downstream sub-optimal areas. Water level fluctuations could also alter water temperature regimes, food supplies, or affect other significant ecological processes.
Lake Washington Coho Salmon In Lake Washington/Sammamish Tributaries coho salmon spawn from late October to mid-December in tributaries of Lake Washington, the Sammamish River and Lake Sammamish including Issaquah Creek. Cedar River coho salmon spawn from late October to early March in the mainstem Cedar River accessible tributaries include channel segments upstream from Landsburg Dam, to which passage was restored in 2003. Cedar River coho also use the river from Renton to the several miles above Landsburg in the Cedar River Watershed (Kiffney et al. 2009). Rock Creek, Downs Creek, and several of the other Cedar River tributaries are also known coho spawning tributaries (Williams et al. 1975). Between 1965 and 1993 the average run size of Lake Washington coho salmon in all WRIA 8 watersheds was 25,310 fish (Weitcamp et al. 1995). In 1992 the WDFW salmon stock inventory rated Lake Washington-Cedar River coho stock as healthy, but in 2002 this stock was rated as depressed because index escapement values in the 1990s had declined to levels far below those observed in the 1980s. The WDFW stock assessments in 1992 and 2002 rated the Lake Washington/Sammamish River/Lake Sammamish tributaries stock as depressed due to record low escapement index, which have dropped precipitously from those observed in the 1980s. Following completion of the Landsburg fish passage project in 2003, all salmonids except sockeye, which are excluded from the watershed, acquired access to stream habitat upstream of Landsburg for the first time in over 100 years. To evaluate the effectiveness of the fish passage project, salmonid recolonization of the watershed is being conducted by an interagency team of scientists. Local Empirical Information and Monitoring A baseline habitat utilization study was conducted to collect data on resident fish populations and aquatic ecosystem characteristics prior to removal of the fish passage blockage (Kiffney et al. 2009, Kiffney et al. 2002). Since 2003 the study has evaluated various aspects of the salmon recolonization process, including numbers and characteristics of fish passing through Landsburg, spawning locations and timing, interactions between anadromous and resident fish, growth and survival of juvenile salmon, and effects of salmon carcasses on stream ecosystems. Following removal of the passage blockage at Landsburg, juvenile salmon, mostly coho and trout, rapidly colonized multiple habitats in the mainstem Cedar River within the watershed and one of its larger tributaries. Overall, fish densities were initially highest closest to Landsburg, and juvenile coho salmonid densities approximately doubled in the three reaches closest to Landsburg, and trout accounted for the largest increases in fish use. The highest densities of observed Chinook spawning are in the segments of the mainstem closest to Landsburg, but Chinook also spawn further upstream in the mainstem almost all the way to Cedar Falls and in Rock Creek (Kiffney et al. 2009). These project results may have implications for habitat restoration strategies along the lower Cedar River where acquisitions of flood damaged properties and flood control facility setbacks restore damaged and formerly fish-inaccessible floodplain habitats.

King County National Flood Insurance Program Biological Opinion . Compliance Submittal and Programmatic Habitat Assessment
3‐22
WRIA 9 Protected Species and Habitat Evaluation
The Historic GreenDuwamish River Watershed The present day Duwamish River is the lower 12 miles of the Green-Duwamish River in Tukwila and Seattle. The White River flowed into the Green River at RM 31, which in turn meandered through the broad, relatively flat, marshy lower Green River Valley and was joined by the Black River, which received flow from the Cedar River and conveyed it into the Green River at RM 12 in Tukwila to form the Duwamish River. In 1906 the White River channel in Auburn near RM 31 of the present-day Green River was filled by a debris jam during a flood, blocking the river and diverting it away from King County into the Stuck River, which flowed into the Puyallup River in Pierce County. Not long afterward, the debris dam was replaced by a permanent diversion structure in Game Farm Park in Auburn, and the White River has remained in its current configuration ever since. In 1911 the Cedar River was diverted away from the Black River in present-day Renton to empty into Lake Washington. With the opening of the Lake Washington Ship Canal in 1917, the lake's level dropped nearly nine feet and the Black River dried up except for its remnant outlet, which conveys flow from the Springbrook Creek subbasin into the Duwamish River. Since these channel modifications and construction of Howard Hanson Dam in 1964, almost all of the lower Green and Duwamish River valley has been annexed into the Cities of Auburn, Kent, Renton, Tukwila and Seattle, and much of the floodplain has been filled for a variety of land uses ranging from single and multi-family housing, commercial development and heavy industry. Unincorporated agricultural lands enrolled in the King County Farmland Preservation Program still exist along the left bank of the river near Kent in the Mill Creek-Mullen Slough subbasin from RM 21.6 to 23.0, and from RM 24.2 to 27.6 near the Kent-Auburn city line. The middle Green River and its expansive floodplain remains entirely within King County upstream of the City of Auburn-King County line at RM 31.9.
The Present Day GreenDuwamish Watershed The headwaters of the Green River are in the Cascade Mountains on Blowout Mountain about 30 miles northeast of Mount Rainier. The Green River flows generally west and northwest for about 25 miles through a mostly narrow, steeply sloped, forested, undeveloped valley. Slightly more than 10 percent of the land upstream from Howard Hanson Dam is owned by Tacoma Public Utilities (TPU), and another approximately 30 percent is owned by other public agencies including the U.S. Forest Service (USFS), the Washington Department of Natural Resources (WDNR) and the Corps; almost all of the rest of the watershed is owned private timber companies (TPU 2008) and is managed primarily for timber production and municipal water supply for the City of Tacoma. At RM 68, the Green River enters the reservoir behind Howard Hanson Dam, a U.S. Army Corps of Engineers (Corps) flood control facility at RM 64.5 that was completed in 1962, and facilitated urban development in the Cities of Auburn, Kent and Tukwila. Downstream from the dam at RM 61.0 is Tacoma’s water diversion facility, which represents the present upper limit of anadromous fish migration. Downstream of the water diversion, the river descends through the tightly confined Green River Gorge, and emerges into the broad,

King County National Flood Insurance Program Biological Opinion . Compliance Submittal and Programmatic Habitat Assessment
3‐23
relatively flat upper Green River Valley at RM 44.9 in Flaming Geyser Park. Because the river gradient is much flatter, the river deposits amounts of gravel which give the river a more braided channel form along much of its length in the mostly agricultural valley that extends from RM 31.9 in Auburn to the gorge. Within the middle Green River valley, the river is bordered by extensive floodplain areas. Almost seven river miles of the channel between Flaming Geyser Gorge and the Auburn City limits are flanked along one or both banks by a series of parks and natural areas owned by King County or Washington State Parks that include Flaming Geyser State Park and Natural Area, Whitney Bridge Park, the Green River Natural Area (formerly known as the Metzler-O'Grady and Green River Waterway Parks), the Neely Natural Area, the Porter Levee Natural Area, Hatchery Natural Area, and the Auburn Narrows Natural Area and State Park, which total approximately seven of the 13 river miles in this reach. At least 18 discontinuous levees and revetments were constructed in this reach in the 1960s and 1970s mainly to prevent channel migration rather than provide flood containment. As a result, large portions of the valley are inundated during flows that exceed the two-year flood frequency interval. Important fish-bearing tributaries in this reach include Newaukum, Crisp, Burns, and Soos Creeks, each of which has significant floodplain areas on the valley floor and upstream from the valley. Because numerous connections between the river and its floodplain and lower tributaries remain physically and hydraulically connected in this reach and extensive corridors of riparian vegetation are present, it is considered to be among the most productive mainstem areas for anadromous salmonids in King County (Coccoli 1993). The King County River and Floodplain Management Program inventory lists 137 flood and erosion control facilities totaling 36 miles of stream bank along the Green River from Flaming Geyser State Park to the Tukwila-Seattle city line at RM 6.6. All of these facilities impede lateral migration of the Green River, and most of the facilities in Auburn, Kent and Tukwila also provide substantial flood containment. Howard Hanson Dam was completed by the Corps in 1962. Outflows from the dam are regulated so that the flow at Auburn will not exceed 12,000 cubic feet per second (cfs), the equivalent of a two-year recurrence-interval flood prior to construction of the dam (Perkins 1993). The size of the two-year recurrence-interval flood at Auburn today is about 27 percent less than it was prior to construction of the dam (Perkins 1993). Though regulation has reduced the magnitude of floods on the river, water stored by the dam during one flood must be released to create storage for the next. As such, the operation of the dam has also increased the duration of moderately high flows, i.e., those between 1,500 and 10,000 cfs (Dunne and Dietrich 1978; Perkins 1993). Howard Hansen Dam exerts a strong influence on downstream conditions by stopping of sediment and large woody debris, altering seasonal temperature and flood flow regimes, and preventing fish into the upper watershed (Kerwin and Nelson 2000). Since a large proportion of the sediment on the riverbed is mobilized by flows greater than 2,200 cfs, significant amounts of bank erosion can occur within this range of flows. Howard Hanson Dam also traps sediment from about 55 percent of the watershed upstream of Auburn, which has greatly reduced the sediment supply downstream. Alluvial and glacial deposits between Green River Gorge and Auburn continue to supply some coarse sediment to the river, as does Newaukum Creek (Perkins 1993). Soos Creek’s sediment load, trapped in low gradient reaches within the creek itself, does not reach the Green River (King County 1990; Perkins 1993). The result of this is that gravels in the Green River streambed give way to sand and silt at about RM 25.5, which marks about the lowest point at which salmon spawning occurs.

King County National Flood Insurance Program Biological Opinion . Compliance Submittal and Programmatic Habitat Assessment
3‐24
Mainstem Green River The Green River is used by six populations of federally listed species: Duwamish-Green summer/fall Chinook, Newaukum Creek summer/fall Chinook, Green River winter steelhead and rainbow trout, Green River-Soos Creek coho, Newaukum Creek coho and Green River pink salmon (Williams et al. 1975). In addition two stocks of chum salmon, one stock each of summer and winter steelhead, and sea-run cutthroat trout also use the river and its tributaries. The system is also used by resident stocks of cutthroat trout and by whitefish. As mentioned above, the TPU water diversion facility represents the present upper limit of anadromous fish migration in the system, but some returning adult fish are trapped downstream of this facility and released above Howard Hanson Dam in an effort to reintroduce salmon and steelhead into the upper watershed. According to the historical record, anadromous native char (either bull trout or Dolly Varden char) also occurred (Suckley 1859). Occasional bull trout have been captured in middle Green River, including one near the mouth of Newaukum Creek in the winter of 2000, and there is ample evidence that anadromous bull trout regularly use the lower Duwamish River downstream of RM 5.8, especially in the spring. These fish are believed to be migratory visitors from other watersheds that entered the Duwamish perhaps to forage on outmigrating smolts (King County 2001). No bull trout have been found in recent surveys of the upper basin upstream of Howard Hanson Dam and no bull trout stock is presently recognized as existing in the Green River by WDFW (WDFW 1998). Odd-year pink salmon historically used the Green-Duwamish basin, but were so rare until the 2000s they were thought to have become extinct starting in the mid-1930s (Williams et al. 1975). Since 2007 pink salmon returns have increased dramatically. The lower Green River up to RM 25.5 is used primarily as a migration corridor by adult salmonids moving to upstream spawning areas, and by downstream migrating smolts. Coho salmon also enter the old Black River system (confluence at RM 11) and spawn and rear in its tributary, Springbrook Creek and further upstream in Garrison Creek (Williams et al. 1975). Coho salmon utilize Mill Creek and Mullen Slough for spawning and rearing (Williams et al. 1975) and juvenile Chinook have been found in the lower reaches of both of these streams. Spawning in the mainstem Green River by Chinook, coho, steelhead and pink salmon takes place upstream from 25.5, the lower limit of suitable spawning gravels. Coho spawning and rearing also occurs in several miles of the Soos Creek watershed, and Chinook salmon also use the lower six miles of Soos Creek for spawning. Newaukum Creek has its own recognized stocks of Chinook and coho salmon. The Newaukum population of Chinook spawn in the lower 10 miles of the stream, and coho spawn and rear much farther upstream in all accessible tributaries. Segments of the Green River and certain of its tributaries are on Ecology’s 303(d) list of "troubled waterbodies" for temperature, dissolved oxygen, fecal coliform and mercury violations. Temperature and dissolved oxygen are of primary concern in the lower mainstem, but exceedences have been detected at sampling sites in the middle Green River as well. Two TMDL plans are in place to address problems related to temperature and dissolved oxygen in the lower and middle Green River and Newaukum Creek (Coffin et al. 2011). The Green River Temperature TMDL focuses on two distinct reaches of the river. The middle Green River TMDL includes the river segment from Howard Hanson Dam RM 61.to the downstream end of Auburn Narrows at RM 32.0. The TMDL also addresses water quality in the lower Green River from
King County National Flood Insurance Program Biological Opinion . Compliance Submittal and Programmatic Habitat Assessment
3‐25
Auburn Narrows to the confluence of the Black River at RM 12.0. The Newaukum Creek temperature TMDL includes the entire Newaukum Creek watershed. Sources of fecal contamination within the lower Green River include agricultural land uses, failing septic systems, and pet wastes. Temperature exceedences are typically related to land use changes that decrease tributary shading and increase urban runoff. Temperature impairment may also be due to industrial wastewater inputs. Low dissolved oxygen may be related to high water temperatures and high biological oxygen demand caused by oxygen-consuming chemical and/or biological processes. Water quality problems in the lower river may be exacerbated during late summer/early fall low flow conditions by natural droughts and/or water withdrawals by the City of Tacoma.
Soos Creek Soos Creek flows into the middle Green River at 33.7. Its 70-square-mile drainage basin includes 25 tributaries totaling over 60 linear miles, the four largest of which are Covington, Jenkins, Little Soos and Soosette Creeks, and several lakes with a combined surface area of roughly 1,370 acres including Lake Youngs, which is part of SPU’s water supply system, Shadow Lake, Lake Meridian, Lake Sawyer, Lake Morton, interconnected Pipe and Lucerne Lakes and Wilderness Lakes. The Soos Creek basin also contains an extensive system of wetlands, floodplains infiltrating soils that collectively attenuate peak stream flows. Over four miles of the Soos Creek corridor including much adjacent wetlands and portions of the floodplain are protected within parks and open space in King County, Covington and Kent (King County 1990). Land use in the Soos Creek basin consists of rural residential, agriculture, and highly urban commercial and residential areas in Kent. Chinook, coho, sockeye, pink and chum salmon, as well as winter steelhead have been observed spawning in Soos Creek (Kerwin and Nelson 2000). Resident and anadromous cutthroat occur throughout the basin. The Soos Creek State Hatchery, which has been in continuous operation since 1901, releases over three million fall Chinook sub-yearlings and 6000,000 coho yearlings per year (Kerwin and Nelson 2000). Soos Creek was formerly classified as a “Class A” water body under the 1997 Washington State water quality rules, under the 2003 rules is categorized as “core salmon migration and rearing habitat” for aquatic life use and “primary contact” for recreational use. Segments of Soos Creek are on Ecology’s 303(d) list for violation of dissolved oxygen and fecal coliform bacteria standards. Parts of Little Soos Creek are listed for violation of dissolved oxygen, temperature, and fecal coliform bacteria standards (Coffin et al. 2011).
Newaukum Creek The Newaukum Creek watershed drains an area of approximately 27.8 square miles (Kerwin and Nelson 2000). The creek originates in the mountains east of Enumclaw Plateau, flows for roughly 14 miles, and enters the left bank of the middle Green River at River Mile 40.7. Eight tributaries to the creek provide an additional 13.5 miles of stream length. Historically, the basin was mostly forested, but over the past century three-quarters of the basin have been converted to agricultural and rural residential uses (Kerwin and Nelson 2000). The middle segment of creek flows through agricultural and residential lands on Enumclaw Plateau. The downstream end of the creek descends through a forested ravine into the Green River about two miles downstream from the Whitney Bridge. Newaukum Creek is a major producer of winter steelhead, fall Chinook and coho, and also supports sockeye and chum and anadromous and resident cutthroat trout (Kerwin and Nelson 2000).

King County National Flood Insurance Program Biological Opinion . Compliance Submittal and Programmatic Habitat Assessment
3‐26
Prior to revision of the Washington State water quality standards in 2003, Newaukum Creek was classified as a Class A water body. Since 2003 it has been categorized as “core summer salmonid habitat” for aquatic life use, and “primary contact” for recreational use. Segments of the creek are on the 303(d) list for violation of fecal coliform bacteria standards. Water quality conditions in Newaukum Creek have historically been characterized as “fair” (Metro 1990) due to high nutrient concentrations and high fecal coliform bacteria counts related to agricultural practices. A 25-year (1979-2004) trend analysis conducted with base flow water quality data collected from the mouth of Newaukum Creek showed that some improvements in water quality have occurred since 1979. Total suspended solids, ammonia, total nitrogen, and fecal coliform bacteria have all shown a significant decrease over the period of analysis, but pH values showed a significant decreasing trend and conductivity and phosphorus concentrations increased significantly. A water quality conducted for the Green-Duwamish River in 2003 found that Newaukum Creek had low dissolved oxygen and nutrient concentrations in both base and storm flow, particularly at sites representing agricultural land use, relative to the rest of the Green-Duwamish watershed (Herrera 2005). Turbidity and total suspended solids were elevated in the creek during storm events. Total aluminum concentrations exceeded EPA chronic criterion during base flow sampling, and acute criterion during storm flow sampling. Newaukum Creek is targeted in the Green River TMDP Plan because of temperature exceedences (Coffin et al. 2011).
WRIA 9 Protected Species DuwamishGreen Fall Chinook (Onchorhynchus tshawytscha) Historic and Current Abundance The historical characteristics of Green River Chinook salmon are unknown. Green River-origin Chinook salmon were used as a broodstock not only in the Green-Duwamish basin, but widely throughout Puget Sound for more than a century (Marshall et al. 1995). It appears that a summer/early fall stock existed historically, but there is little information about these fish. The loss of this putative stock would represent loss of additional diversity or possibly geographic distribution of Chinook within freshwater and marine portions of Central Puget Sound (Ruckelshaus et al. 2006). Most spawning takes place from mid-September to early November in the mainstem Green River from RM 25 to 61, and in the lower six miles of Newaukum and Soos Creeks. Stock status assessments were conducted by WDFW in 1992 and 2002. In 1992 WDFW treated the Green River and Newaukum Creek populations separately, but based on subsequent genetic analysis (allozyme analysis) they determined there is no significant difference between these sub-populations (Marshall 2000), and so grouped them together for the 2002 assessment. Both assessments rated this population as healthy (WDFW 1992, 2002). The 2002 WDFW stock assessment noted that hatchery fish that spawn naturally contribute heavily to total Chinook spawning escapements in the Green River drainage (WDFW 2002). The authors of the 2005 Puget Sound Chinook salmon status report revised the natural Green River fall Chinook escapement estimate from the previous status assessment sharply lower—by almost 5,000 spawners—stating that this apparent drop in natural escapement is probably due primarily to new information about the high fraction of hatchery fish that spawn naturally in the Green River (Good et al. 2005).

King County National Flood Insurance Program Biological Opinion . Compliance Submittal and Programmatic Habitat Assessment
3‐27
Factors of Decline and Threats Approximately 98 percent of the historic Duwamish River estuary has been lost due to channelization and filling of former mudflats, marshes and forested riparian areas during industrialization of this portion of WRIA 9 starting in the mid-19th century (Blomberg et al. 1988). These alterations have greatly reduced the quality and quantity of habitat available for rearing of juvenile salmonids that originate in the Green River watershed. Green River wild and hatchery Chinook have been shown to bioaccumulate polychlorinated biphenyls (PCBs) and presumably are similarly affected by other organic contaminants in estuarine sediments that accumulate in salmonid prey species and are consumed by fish that rear in the estuary (Nelson et al. 2004; Meador et al. 2010). Many biological responses in fish and other biota have been reported for PCBs, including mortality, impaired growth and reproduction, immune dysfunction, hormonal alterations, enzyme induction, neurotoxicity, behavioral responses, disease susceptibility, and mutagenicity. The range of potential effects of such contaminant exposure include mortality, growth inhibition, and reproductive impairment, all of which could reduce population fitness. Wild salmon growth may be affected by competition with more than three million hatchery fish released yearly into the river (Cordell et al. 2010). Extensive habitat loss has also occurred in the lower Green River and many of its tributaries due to urbanization accompanied by channelization, removal of large wood and vegetation, floodplain filling and disconnection between remaining floodplain areas and the mainstem. Fish passage is totally blocked by the TPU headworks and by Howard Hanson Dam. Efforts to transport fish above the dam have been carried out, but their outcome is uncertain. Although habitat restoration efforts are underway in the estuary and in the middle Green River, it is difficult to determine whether they are sufficient to support increases in the naturally spawning Chinook population. Bull Trout (Salvelinus confluentus) Historic and Current Abundance Two native char species are potentially present in the Green/Duwamish River watershed: bull trout and Dolly Varden. Bull trout and Dolly Varden can be distinguished based on differences in morph metrics, osteological features and embryological development (Cavender 1978). Both species have similar life history traits and habitat requirements (WDFW 1998). Populations of bull trout exist in several nearby Puget Sound drainages, including the Puyallup, Snohomish and Skagit Rivers (WDFW 1998), and a few bull trout have been captured in the Green/Duwamish River in recent decades. In spite of numerous studies, information on the presence, abundance, distribution and life history of bull trout/Dolly Varden char in the Green River basin is extremely limited (WDFW, 1998). Bull trout were historically present in the watershed, but in recent years only a handful of sightings have been recorded, mostly in the estuary (Jeff Chan 2000). Staff of the USFS determined that no records exist that suggest bull trout have ever occupied habitat upstream of Howard Hanson Dam. In support of their Incidental Take Permit application for lands in the upper Green River watershed, Plum Creek Timber Company biologists conducted presence/absence surveys for bull trout in the Upper Green River mainstem and in Intake Creek, Sawmill Creek, Pioneer Creek, and Tacoma Creek in 1994 using the Hillman and Platts (1993) methodology. In 1995 Plum Creek staff surveyed the North Fork Green River, but no bull trout were found during these surveys (Light 1999). In a study of factors limiting salmonid production within the Plum Creek habitat conservation plan area within forested headwater catchments of the Green River, Watson and Toth (1994) concluded that it is unclear whether the upper Green River supports a population of bull trout, although the habitat surveys Plum Creek conducted above Howard Hanson Dam were spotty (Craig 2000). While native char have been captured as far upstream as RM 40, Watson and Toth (1994) stated that it was impossible to
King County National Flood Insurance Program Biological Opinion . Compliance Submittal and Programmatic Habitat Assessment
3‐28
determine whether the observed fish were fluvial or anadromous bull trout; instead these authors considered these fish to have been Dolly Varden. Lands in the upper watershed have been degraded by timber harvesting. Because of this and the fact that the Green River watershed headwaters lie at relatively low elevations ranging less than 3,500 feet, this system may not provide the cold waters and pristine habitat needed by bull trout during critical life history stages. A single bull trout was captured in February 2000 by a member of the Muckleshoot Indian Tribe (MIT) near the mouth of Newaukum Creek (Malcom 2000), and there is convincing evidence that anadromous bull trout regularly use the Duwamish River. In March 1978 MIT staff observed three anadromous char landed by non-Indian anglers within a 30-minute period at North Wind Weir (RM 5.8; Moore 1978). In March 1994 an adult bull trout was recovered at RM 5.2 in the Duwamish River during a routine juvenile habitat utilization study by MIT staff (Rod Malcom, MIT, pers. comm. 2000). Another native char was recovered by MIT staff in roughly the same location in the spring of 2000 (Warner 2000), and several more subadults in the 250-300 mm size range were recovered by King County Water and Land Resources Division (WLRD) staff in the Turning Basin (RM 5.3, LB) in late August 2000 (Berge 2000). While it is possible that these fish originated in the upper Green River watershed, it is more likely that they were migratory visitors from other watersheds, where bull trout are more prevalent, that entered the Duwamish from Puget Sound to forage on outmigrating juvenile salmonids, which are abundant in the lower river during the spring. The fish captured in 1994 had salmonid smolts in its stomach (Warner 2000). There is evidence that native char may have historically occurred in the lower Green/Duwamish River (Grette and Salo 1986). Historical records report thousands of native char in the vicinity of RM 35 in the 1800s. It is noteworthy that this report was compiled prior to the diversion of the White River into the Puyallup watershed, where a bull trout population still exists (WDFW 1998). At present, however, water temperatures in much of the mainstem are unsuitably warm for bull trout over prolonged periods of time during the summer and early fall (Caldwell 1994). Another factor that likely limits bull trout populations in the Green River watershed is the existence of two long-standing total passage barriers: the TPU headworks, which has posed a physical barrier to passage between the lower and upper watershed for over 80 years, and Howard Hanson Dam, which has posed a similar barrier for almost 40 years. Factors of Decline and Threats While structural habitat within portions of the action area may be suitable for bull trout during times of the year when the water is cool, the potentially lethal summer water temperatures—up to 73o F recorded at several locations in the action area during multiple studies conducted in recent decades—coupled with the relative scarcity of juvenile salmonid prey in the action area during the mid- to late summer, make it unlikely that bull trout would occupy the action area during the construction season. It is conceivable that bull trout could hold in lower mainstem areas where cool springs create localized temperature refugia, but information is lacking on the locations of such springs. On balance, it is rather unlikely that bull trout would remain within the action area during the summer construction season (Chan 2000). Green River (Duwamish) Steelhead (Oncorhynchus mykiss) Historic and Current Abundance: Winter Steelhead Spawning takes place from early March through mid-June in the Green River from RM 25 to 61, in the lower 12 RM of Newaukum Creek, and in Soos Creek and several of its larger tributaries, including Covington, Jenkins and Lower Soosette Creeks. The stock status was rated as healthy in WDFW’s 1992 and 2002 assessments (WDFW 1992, 2002), because spawner
King County National Flood Insurance Program Biological Opinion . Compliance Submittal and Programmatic Habitat Assessment
3‐29
escapements generally varied within a range of 25 percent above or below the escapement goal of 2,000 wild spawners. Allozyme analysis of Green River winter Chinook clusters them with winter steelhead from the Cedar, White and Puyallup rivers and with some Snohomish basin steelhead (Phelps et al. 1997). The hatchery winter steelhead program on the Green River utilizes Chambers Creek Hatchery-origin fish, which return to the river and spawn earlier than the native stock, which spawn from mid-January through mid-March, thereby limiting genetic exchange between the hatchery and wild stocks. Historic and Current Abundance: Summer Steelhead Green River summer steelhead are a non-native stock originating from the Skamania Hatchery in the lower Columbia River basin. There is no evidence that summer steelhead were present in this system prior to their introduction as a hatchery stock. Their stock status was rated as depressed in 2000 based on a long-term negative trend, and a short-term severe decline in abundance (WDFW 2002). Spawning is assumed to occur in the Green River below the TPU headworks, and in larger tributaries including Soos and Newaukum Creeks. The timing of natural spawning is unknown, but is assumed to be similar to that of hatchery-origin fish, generally from mid-January through mid-March. Factors of Decline and Threats Green River winter and summer steelhead populations have declined due to land use changes beginning with extensive deforestation of the watershed in the mid- to late 1800s, and conversion of the lower Green River Valley to agriculture, which entailed extensive removal of wood from the channel and construction of primitive levees to moderate flooding and limit channel migration. Even more profound habitat changes were caused by diversion of the Cedar-Black River into Lake Washington in present-day Renton, and diversion of the White River into the Puyallup River to control flooding in present-day Auburn. Together these diversions reduced the river’s total discharge by approximately 75 percent. As urbanization proceeded in the lower valley, the number of bank stabilization and flood control facilities increased to the point where at present they are nearly continuous from RM 31 to Elliott Bay. In addition, closure of the Howard Hanson Dam in 1962 not only blocked fish passage to hundreds of miles of habitat upstream from the dam, it also greatly modified the river’s hydroperiod by allowing storage of flood flows above the 2-year frequency interval (measured at the Auburn gauge) in the reservoir upstream from the dam, and necessitating prolonged post-flood high flows during drawdown of the reservoir. Water withdrawals by TPU result in lower summer flows, although this impact has in recent years been somewhat mitigated by expansion of water storage above the dam for release during the steelhead spawning season. In recent decades summer temperatures in the lower and middle Green River have exceeded state water quality standards, and at times in late summer are at near lethal levels for salmonids including upstream-migrating Chinook salmon. Total maximum daily loads for two segments of the Green River from Howard Hanson Dam to the confluence of the Black River were approved by the U.S. Environmental Protection Agency on August 11, 2011. The implementation plan is aimed at addressing the river’s water temperature problems through riparian plantings, but this may be difficult to achieve because of the Corps’ levee maintenance requirements, which mandate that miles of the banks of the lower Green River be kept in a devegetated condition. All of the above factors of decline preferentially affect steelhead because of their prolonged residence in freshwater. The other major threat to steelhead populations in the Green River is the heavy reliance by the co-managers on hatchery production, which poses risk to their continued genetic diversity (Kerwin and Nelson 2000).
King County National Flood Insurance Program Biological Opinion . Compliance Submittal and Programmatic Habitat Assessment
3‐30
GreenDuwamishSoos Newaukum Coho Salmon (Oncorhynchus kisutch) Historic and Current Abundance Until recently, coho salmon were the most numerous anadromous fish in the Green/Duwamish basin (King County 1978); but in the past decade pink salmon have become far more numerous (Fisher 2011). The Green River/Soos Creek coho stock is of mixed origin, meaning that it consists of both hatchery fish and naturally spawning fish. The naturally spawning component consists of both wild fish that spawn upstream from the Soos Creek hatchery in both Soos Creek and in the mainstem and certain upstream tributaries. Most spawning takes place from late October to mid-December throughout the mainstem Green River from RM 25 to 61 and its accessible tributaries. Stock status assessments conducted by WDFW in 1992 and 2002 rated this population as healthy (WDFW 1992, 2002). Allozyme analysis of a large sample of Soos Creek Hatchery coho taken in the mid-1990s shows that these fish are significantly different from all other Washington coho stocks examined. They most closely resemble the Lewis Creek (Snohomish basin) coho sample and are very dissimilar to Minter Creek Hatchery coho, the only other South Sound coho stock (WDFW 2002). A study in the late 1990s of juvenile salmonid use of lateral stream habitats found that juvenile coho use the river margins and off-channel habitats near the Porter Levee at RM 34.3 from late March through the end of June (R2 Resource Consultants 1998). In addition, Corps (Goetz 1999) found coho juveniles in a side channel immediately downstream of the Porter levee. Newly emergent fry usually congregate in schools in pools of their natal stream. As juveniles grow, they tend to move into riffle habitats and aggressively defend their territory, resulting in displacement of excess juveniles downstream to less favorable habitat (Wydowski and Whitney 2003). The aggressive behavior of juvenile coho may be an important factor maintaining the numbers of juveniles within the carrying capacity of the stream, and distributing juveniles more widely downstream. Once territories are established, individuals may rear in selected areas of the stream feeding on drifting benthic organisms and terrestrial insects until the following spring (Hart 1973). Juvenile coho rear in the Green River watershed for approximately 15 months prior to migrating downstream to the ocean, but may extend their freshwater rearing time to two years. The peak of coho smolt outmigration occurs between late April and late May (Nelson et al. 2004). Factors of Decline and Threats Because of their relatively prolonged residence in freshwater, coho salmon are sensitive to adverse impacts on freshwater habitat. Bilby and Mollot (2008) examined the relationship between the spatial distribution of spawning coho salmon and changes in land use from 1984 through 2001 at 84 sites in four rivers draining into northern Puget Sound including the Green River. Changes in land use over this period were determined from LandSat imagery, county zoning designations, and aerial photographs. Substantial reduction in forest cover occurred in many of the index watersheds during this time. The proportion of salmon using sites subjected to increased urban land use over the study period declined about 75 percent. Increases were observed at forested sites and those with increased rural residential use. Because of their prolonged residence in freshwater, habitat alterations caused by the above mentioned factors of decline for steelhead also apply to coho salmon. In addition, levees and revetments that disconnect the mainstem from tributaries and off-channel habitats presumably have a more deleterious effect on coho and steelhead than on other anadromous species that are less dependent on off-channel habitat. Past channelization and construction of flood control facilities along some segments of the middle Green River have favored the formation of long, fast-velocity lateral scour pools at the toe of these facilities along outside river bends and
King County National Flood Insurance Program Biological Opinion . Compliance Submittal and Programmatic Habitat Assessment
3‐31
convergence pools downstream from bridge abutments (Levesque 1999) that are less suitable than the deep, slow velocity pools preferred by juvenile coho. Feist et al. (2011) found that adult coho salmon returning from the ocean to spawn in urban basins in the Puget Sound region have been prematurely dying at high rates (up to 90 percent of the total runs) for more than a decade. These deaths appear to be caused by toxic chemical contaminants in urban runoff during the fall spawning season. Spawner mortality is closely and positively correlated with density of impervious surface including roads and commercial property within a basin. Using future climate simulation models, Mantua et al. (2010) assessed the potential effects of warming summer stream temperatures and altered stream flows on the reproductive success of Washington salmon populations. Impacts varied for different life history-types and watershed-types. Diminishing stream flows and higher stream temperatures in summer are likely to be stressful for stream-type salmon populations including coho salmon, which rear in freshwater during the summer. With diminishing snowpack predicted for most montane headwater areas, a shift to decreased summer flows and increased winter flooding will likely reduce egg-to-fry survival rates for ocean-type and stream-type salmon such as coho. Green River OddYear Pink Salmon (Oncorhynchus gorbuscha) Historic and Current Abundance Prior to the early 2000s, odd-year pink salmon inhabited the Green River in relatively low numbers and as recently as the early 1970s were thought to be extinct in the Green River (Williams et al. 1975). A pink salmon status conducted by NOAA Fisheries in 1996 stated that “[p]ink salmon apparently occurred historically in the Green/Duwamish River system in Puget Sound; the Washington Department of Fisheries. . . reported these fish as very scarce in the Green River, and absent from Burns, Newaukum, Spaight, and Soos Creeks. The highest annual number of adult pink salmon observed in the Green River over the last several decades is 13.” Over the past decade, however, the pink salmon population has increased dramatically. In 2011 the pink salmon run is estimated to total 2.1 million fish (Patillo 2011). Most of these fish spawn on the mainstem in late August and September from approximately RM 26 to the TPU headworks and in the lower half mile of Newaukum Creek. The reasons for the tremendous increase in the Green River pink salmon population are not well understood, but may be related to changes in the flow regime released from Howard Hanson Dam, which is regulated to some extent to minimize redd dewatering during the steelhead spawning season and to enable Chinook salmon upstream migration in the late summer and early fall (Coccoli 2011). Factors of Decline and Threats Although odd-year pink salmon are currently extremely abundant in the Green River, certain aspects of the biology of these fish make them more susceptible to decline than species that return as adults of variable ages. Because entire brood-year cohorts return during the same spawning season, any type of natural environmental disruption such as a severe drought that delays upstream migration or greatly reduces availability of spawning habitat, floods that severely scour streambeds containing incubating fish disease outbreaks, or adverse changes in ocean conditions can have a disproportionately large impact on a local population because an entire cohort of spawners could have few or no surviving offspring.
King County National Flood Insurance Program Biological Opinion . Compliance Submittal and Programmatic Habitat Assessment
3‐32
WRIA 10 Protected Species and Habitat Evaluation
Watershed Overview The Puyallup/White watershed comprises over 1,300 RMs of stream channels over an area greater than 1,000 square miles. The three major river basins include the Puyallup, White and Carbon Rivers, which flow within Pierce County and part of south King County. All of these systems originate from glaciers along the north and west slopes of Mount Rainier within Mount Rainier National Park. The Carbon and White Rivers converge with the Puyallup River at RM 17.8 and RM 10.4, respectively. WRIA 10 also includes several smaller tributaries, including Hylebos Creek, which flows into Commencement Bay near Fife, and small independent tributaries that flow into Puget Sound in the Cities of Federal Way and Des Moines. The most important salmonid-bearing streams under King County’s jurisdiction are the White River and Boise Creek, both of which have extensive floodplains.
The White River (WRIA #10.0031) The source of the White River is the Emmons Glacier on the northeast side of Mount Rainier within Pierce County. The river flows from ice caves at the toe of the glacier within Mount Rainier National Park. After several miles the river enters Mount Baker-Snoqualmie National Forest and then turns westward. Further downstream at RM 49.2 it is joined by one of its main tributaries, the West Fork White River, which also originates at a glacier in Mount Rainier National Park. At RM 45.8 the Greenwater River flows into the White River, and at this location the White River forms the boundary between Pierce and King Counties. Downstream from the confluence with the Greenwater River, the White River flows generally west through Federation Forest State Park. At RM 35.3 the White River is joined by another major tributary, the Clearwater River. Several miles downstream the White River is impounded by Mud Mountain Dam, which creates a marshy intermittent lake called Mud Mountain Lake between RMs 29.3 and 29.6. The dam was originally constructed by the Corps in the 1940s as a flood control facility. In 1995 the Corps constructed two new tunnels within a new intake tower that contains a new outlet structure. Since then additional modifications have been made to strengthen the dam, and more work is planned to better armor the dam against bedload scour from sediment that passes through the dam. In 1911 the Puget Sound Power & Light Company, a predecessor company of Puget Power (PP), built a dam on the White River at RM 24.3 to divert water from an approximately 20-mile stretch of the White River to its power generation facility at Lake Tapps. The diversion sends water through a flume, a canal and a pipeline to Lake Tapps, which was also impounded in 1911 to serve as a water storage reservoir for PP’s Dieringer Powerhouse. An outlet canal on the west side of the lake routes water through the turbines within the powerhouse dam, and the water is returned to the lower White River via a 0.5 mile long "tailrace" canal. Since its construction, the diversion has drastically altered flows in the 14 mile long segment of the lower river between the diversion dam and the downstream end of the tailrace canal, impeding
King County National Flood Insurance Program Biological Opinion . Compliance Submittal and Programmatic Habitat Assessment
3‐33
upstream and downstream passage of fish, as well as impacting spawning and rearing in the affected reach of the White River (WDFW et al. 1996). Minimum instream flows had been established by the Department of Ecology for the Puyallup River watershed except for the White River, because the hydro project predated Washington’s instream flow rule (Chapter 173-150 WAC) (Ecology 2010). Therefore, the hydro project was not required to comply with the minimum flow rule established for the rest of the watershed.
In 2003, PP determined it was no longer economically viable to operate the hydro project, in part because of anticipated Federal Energy Regulatory Commission (FERC) relicensing requirements to address fish and salmonid habitat impacts. In early 2004 PP ceased generating electricity at the hydro project. Puget Power continued to own the water right for the diversion, and has continued to divert water into the Lake Tapps Reservoir for recreation. In addition, PP conducted negotiations with the Cascade Water Alliance, WDOE, WDFW, Pierce County, the MIT, the Puyallup Tribe of Indians (PTI), nearby cities and Lake Tapps community groups to use water diverted from the White River and stored in Lake Tapps as a municipal water supply. An agreement was reached in 2010 to acquire water rights for this purpose. Under the agreement, Cascade has the authority to use up to 48 million gallons of lake water per day for public use. The agreement sets a “recommended flow regime” of at least 500 cfs based on the natural seasonal pattern of flow conditions to help improve fish habitat and fish populations in the White and lower Puyallup Rivers. The agreement also identifies other mitigation measures including water quality, fish and habitat improvements (WDOE 2010a).
Construction of Mud Mountain Dam at RM 29.6, which was completed in 1948, completely blocked upstream fish passage. To mitigate for this, in 1940 the Corps replaced the fish ladder on the Buckley diversion dam with a fish trap and began trap and haul operations to relocate adult salmonids from the Buckley trap to the upper White River 12 miles upstream from Mud Mountain Dam. Boise Creek enters the right bank of the White River at RM 23.3 near Buckley, a short distance downstream from the Lake Tapps diversion. Downstream from the lake, the White River enters a broad floodplain and flows through the City of Pacific before emptying into the Puyallup River at Sumner. The White River transports exceptionally high volumes of suspended glacial sediment that give its waters a milky color during the spring and summer, as well as large volumes of gravel that are responsible for its braided channel morphology and propensity for channel migration. The river is also notable for the high volumes of large wood that it contains, which forms debris jams in the active channel deposits in many floodplain areas. Prior to 1906 the White River was a tributary to the Green River, which it flowed into at RM 31.0 in present-day Auburn. Prior to 1960 the majority of the discharge of the White River flowed north towards Elliott Bay, and a small portion of it flowed south to the Commencement Bay via the Stuck River and Puyallup Rivers. In November 1906 a flood formed a large debris jam that blocked the main channel causing severe flooding in what is now downtown Auburn, and created an avulsion that sent nearly the entire White River toward the Stuck River and thence into the Puyallup River, more than doubling the discharge in the lower Puyallup River. In 1915 a concrete structure was built to permanently divert the White River into the Puyallup River, into which it flows at RM 10.6 near Sumner. The diversion is an early segment of a 90 RM long system of levees and revetments that currently lines the banks of the lower White and Puyallup Rivers. Flood control facilities are also present along the lower mile of the Greenwater River.

King County National Flood Insurance Program Biological Opinion . Compliance Submittal and Programmatic Habitat Assessment
3‐34
In addition to maintaining systems of levees and revetments, King and Pierce Counties have conducted buyouts of frequently flood-damaged homes. In Pierce County alone, over 21 homes and 500 acres of floodplain areas have been acquired. A large levee setback project is underway along almost a mile of the White River upstream from the Pierce-King County Line to reduce flooding and restore instream and riparian habitat; construction is scheduled to start in 2012. Gravel mining has been conducted historically in Puyallup, Carbon and White Rivers for flood control and resource extraction purposes, but the amounts of gravel removed in these operations have not been well documented (Marks et al. 2007, 2009).
Boise Creek (WRIA #10.0057) Boise Creek is approximately 12.2 miles long and its covers 9,861 acres (15.4 square miles) including a portion of the City of Enumclaw and areas to the east. It flows into the right bank of the White River at RM 23.5 just downstream from the SR 410 Bridge. The basin has been significantly degraded by land use activities, but in spite of this it contains 4.5 RM of suitable habitat for Chinook, coho, pink and sockeye salmon, small numbers of chum salmon, and steelhead and cutthroat trout, and is one of the most productive small salmonid streams in central Puget Sound. The distribution of anadromous species in the watershed is limited by a bedrock falls at RM 4.5, just upstream of the Enumclaw Golf Course that may have been created by re-relocating the stream south of its original course in order to construct SR-410 east of Enumclaw. Large rainbow and cutthroat trout inhabit the reaches upstream of this barrier, and bull trout may also occur in forested headwater areas upstream from fish-impassible natural falls at RM 6.3 and 7.0 upstream from SR-410. Many segments of Boise Creek exhibit poor floodplain connectivity, bank instability, lack of large woody debris, limited pool habitat, few side channel habitats, fine substrate deposition in some stream reaches, poor riparian habitat, water quality impairment including high water temperatures (as high as 21o F in some locations in late summer), and water quantity problems—specifically, low base flow conditions (Kerwin 1999). The impairments to Boise Creek habitat are largely a result of channelization, bank armoring, and the removal of large wood and riparian vegetation which decreased the natural sinuosity, reduced habitat complexity, and reduced the volume and accessibility of off-channel habitats. Removal of riparian vegetation has increased water temperatures and increased erosion and fine sediment loading to the stream. Most of the major stream channels within the Boise Creek basin are homogenous, dominated by riffle and run habitats and lacking pools. Puyallup River Fall Chinook (Oncorhynchus tshawytscha) Ford et al. (2004) reported that approximately 40 percent of the Chinook smolts sampled in the White River upstream from the Buckley diversion dam were fall-run Chinook, and the other 60 percent are spring-run Chinook. Puyallup fall Chinook spawn from mid-September to early November in the mainstem Puyallup River, lower White River, Carbon River and various tributaries to these mainstem river systems. A large component of these fish are of hatchery origin from several WDFW fall Chinook hatcheries located in other Puget Sound watersheds, including the Green River hatchery. Carcass sampling from 2003 to 2006 on Boise Creek showed that 47 to 64 percent of the Chinook sampled in Boise Creek (see below) were of hatchery origin based on the presence of coded wire tags and/or adipose fin clips (Marks et al. 2007, 2009). Over 99 percent of juvenile Puyallup fall Chinook spend only a short time in
King County National Flood Insurance Program Biological Opinion . Compliance Submittal and Programmatic Habitat Assessment
3‐35
freshwater before migrating to the estuary between February and the end of August, with the peak of the outmigration occurring around the end of May. Historic Abundance It is unclear whether a native fall Chinook stock existed in the upper White River (i.e., above the Buckley trap) historically. Various fall Chinook hatchery stocks have been transplanted into the White River between the early 1950s and the early 1980s (Shaklee and Young 2003). Current Abundance White River fall Chinook are counted at the Buckley trap, and the PTI conducts spawning surveys. Spawner counts in the early 2000s increased above levels observed in the late 1998s, before decreasing sharply in the late 2000s. In 1992 and 2002, WDFW rated the status of this stock as unknown (WDFW 1992, 2002). At present, Puyallup River fall Chinook escapements are decreased, possibly due to redd scour during a large flood in January 2009 (Ladley 2011).
White River Spring Chinook (Oncorhynchus tshawytscha) White River spring Chinook are distinguished from Puyallup River fall Chinook based on their early river entry, generally prior to July 1, spawning timing and genetic composition. Spawning takes place in the mainstem White River, West Fork White River, the lower reaches of the Clearwater and Greenwater Rivers, and in lower Huckleberry Creek in late August through September, and historically took place upstream from Mud Mountain Dam. Historic Abundance Historical abundances of White River spring Chinook are not well documented, but the population is known to have declined from an average annual escapement of just over 2,950 (1942-1950 average) to less than 500 fish by the late 1950s, presumably in large part due to juvenile and adult passage problems and habitat degradation (WDFW et al. 1996, Shaklee and Young 2003, Marks et al. 2007, 2009). Recovery efforts that rely on hatchery production have been underway since the 1970s. Current Abundance The White River spring Chinook stock was rated as critical in WDFW’s 1992 and 2002 stock assessments (WDFW 1992, 2002). Because of severe stock depletion, White River spring Chinook are reared at the MIT’s White River hatchery and at the WDFW Hupp Springs Hatchery on the Kitsap Peninsula near Gig Harbor, acclimated in ponds upstream from Mud Mountain Dam, and released into the White River. The WDFW 1992 and 2002 stock assessments rated this stock as critical due to chronically low escapements values and questions about the origin of the stock. As of the 1992 assessment, there was no evidence that a naturally spawning population of spring Chinook had reestablished, let alone achieved self-sustainability. Up to 30 percent of the Chinook captured at the trap near Buckley are fall Chinook rather than White River spring Chinook (Shaklee and Young 2003). Allozyme and DNA analyses have indicated that White River spring Chinook are genetically distinct from all other Washington Chinook stocks (Marshall et al. 1995). Microsatellite DNA analysis has shown that fall Chinook intermingle with spring Chinook at the Buckley trap (Shaklee and Young 2003). At present, Puyallup River fall Chinook escapements are depressed, possibly due to redd scour during a large flood in January 2009 (Ladley 2011).
King County National Flood Insurance Program Biological Opinion . Compliance Submittal and Programmatic Habitat Assessment
3‐36
PuyallupCarbonWhite River Bull Trout (Salvelinus confluentus) Bull trout inhabit the Puyallup, Carbon and White River drainages, but the sizes of these populations are unknown. Documented areas of utilization include the lower and upper mainstems of the Puyallup, White, Carbon and Mowich Rivers. The upper White River provides some of the best habitat in the entire watershed for bull trout spawning and rearing. Surveys of numerous headwater tributaries along the White River and the West Fork White River during the summer of 2000 revealed the presence of juvenile bull trout in several drainages. Each year several dozen adult bull trout are captured in the Buckley trap. Since the late 1990s, staff of the Puyallup Indian Tribe’s Fisheries Division have studied bull trout in WRIA 10 using a variety of methods including habitat and fish utilization surveys, analysis of fish captured at the Buckley trap, mark-recapture studies, and monitoring the movements of radio-tagged fish (Marks et al. 2007, 2009). To date, genetic analysis of all of the tissue samples from char collected in the Buckley trap and elsewhere in WRIA 10 have been found to be bull trout rather than Dolly Varden, which so far have not been found in the watershed (Marks et al. 2007, 2009). Data gathered from fish captured by Puyallup tribal biologists strongly indicates that they exhibit both fluvial and anadromous life history traits. Anadromous fish migrate downstream to forage in marine waters. Fluvial fish rear and forage in mainstem river segments and tributaries, and migrate to their natal and other upper watershed streams to spawn from late August through early October, with the majority of spawning occurring in the first three weeks of September. Spawners in the upper White River tributaries have been observed spawning in a range of materials from small gravels to small cobble. Redds are constructed in pool tail-outs and along channel margins. The fry emerge in late winter and spring, and by mid-March can be seen foraging in marginal habitat along the upper White River and associated tributaries (Marks et al. 2007, 2009). Steelhead Trout (Oncorhynchus mykiss) Both steelhead and rainbow trout are present throughout the Puyallup/White River watershed. Most of the steelhead in the WRIA 10 are winter-run, but a few summer-run strays also, most likely from the Green or Skagit Rivers, are caught annually in August and September in the lower Puyallup River and in the Buckley trap on the White River. The main run of winter steelhead enters the Puyallup River in November, with the peak of the run occurring in mid-December. On the White River, steelhead are occasionally caught as early as late December, although most fish migrate upstream from March through June, with peak migration in mid to late April. Although spawners frequently utilize the mainstem Puyallup, White and Carbon Rivers, most of the spawning takes place in tributaries, including Boise Creek, and the Clearwater and Greenwater Rivers. In the Puyallup watershed, the upper reaches of Kellogg, Nilsson and LeDout Creeks support the majority of the spawners, along with the segment of the mainstem downstream from the Electron diversion dam at RM 41.7. In 2000 a project was completed to enable fish passage upstream from the dam, but the effectiveness of this project has not been definitively demonstrated (Marks et al. 2007, 2009). Scale data from 792 adult winter steelhead captured in the Buckley trap from 1985 to 2004 show that the majority (81.6 percent) of young wild winter steelhead migrate to saltwater after two years in freshwater. Approximately 2.5 percent of the steelhead sampled spent a year in freshwater, 15.6 percent spent three years, and less than 0.25 percent spent four years in freshwater before outmigrating. Nearly all hatchery steelhead, if grown to a large enough size (i.e., five fish per pound, or 90 grams), migrate to saltwater shortly after release as yearlings. After spending between one to four years in saltwater, winter steelhead return to the
King County National Flood Insurance Program Biological Opinion . Compliance Submittal and Programmatic Habitat Assessment
3‐37
Puyallup/White system. Typically, most fish (56 percent) return as four year olds after two or three years in saltwater; the rest return as older adults (Marks et al. 2007, 2009). Historic Abundance Gayeski et al. (2011) analyzed commercial catch data and other historical information to estimate the abundance of winter steelhead in Puget Sound rivers in 1895, the year in which the peak commercial catch of steelhead occurred. Their analysis shows that current abundance is likely to be just one to four percent what it was prior to the turn of the 20th century. These researchers concluded that a dramatic loss of the productivity of Puget Sound steelhead must have occurred that dwarfs the quantitative loss of freshwater habitat that has taken place over the past century. Historic and current abundances of Puget Sound steelhead populations have also been estimated by Hard et al. (2007) and are somewhat lower than those derived by Gayeski et al. (2011), but are generally consistent in concluding that most steelhead populations in Puget Sound are vastly smaller than peak historic abundances. Current Abundance Both WDFW and PTI operate steelhead hatcheries that rely in part on broodstock captured at the Buckley trap. In spite of this, winter steelhead stocks in WRIA 10 have been declining since 1990 especially in past few years. Factor(s) responsible for the decline in steelhead escapement are unknown, especially when other salmonid populations are stable or, in the case of pink salmon, increasing. Steelhead escapement at the Buckley trap in 2005 was only 152 adults, the lowest ever recorded since trap operations started in 1941. Decreased numbers of steelhead redds have also been observed in several other drainages as well, but a few segments of the watershed including Boise Creek have comparatively stronger returns in spite of the basinwide decline (Marks et al. 2009). In 2006 the Puyallup and Muckleshoot Tribes and WDFW began a steelhead supplementation pilot project on the White River aimed at restoring the run to a strong self-sustaining population. The pilot project utilizes captured wild broodstock from the Buckley trap to generate approximately 35,000+ yearling smolts per year. So far, the results of this project are encouraging, as escapements increased threefold since the program began (Ladley 2011). Factors of Decline Steelhead spend a much higher proportion of their life cycle in freshwater and more range more extensively from river mouths to headwater areas than do other anadromous salmon species. Therefore, some of the factors of decline discussed elsewhere in this document, e.g., dams and other age barriers, can adversely affect steelhead populations including the population in WRIA 10. PuyallupWhite Pink OddYear Salmon (Oncorhynchus gorbuscha) Odd year pink salmon range throughout the watershed including the White River and Boise Creek. In 1975 WDFW described WRIA 10 pink salmon as occurring almost exclusively in the mainstem Puyallup, lower Carbon and White Rivers, and in South Prairie and Fennel Creeks (Williams et al. 1975). This description of pink salmon distribution was generally accurate until 2003, when an unprecedented number of adult pinks began returning to the watershed and occupying additional stream segments. All pink salmon in WRIA 10 are wild. Upstream migration and spawning enter the Puyallup River as early as mid-July, and spawning occurs from late August through mid November. Like chum, pinks are mass spawners, frequently utilizing the habitat found in lower velocity side channels and channel margins along mainstem rivers, as well as main river tributaries. Peak spawning occurs from late September to early
King County National Flood Insurance Program Biological Opinion . Compliance Submittal and Programmatic Habitat Assessment
3‐38
October, with fry emerging from late fall through winter. Residence time instream is limited, with smolt outmigration occurring from February to June, and peak outmigration at the end of March. After two years in the marine environment, all pink adults return to spawn as two-year-olds. Historic Abundance WDFW escapement data from 1959 to 2001 shows that the number of adult pinks returning to the Puyallup system ranged from 2,700 to 49,000, with an average seasonal return of 19,400. Current Abundance Recent pink salmon escapement estimates from WDFW reported an estimated pink return of 171,900 fish during the 2003 run, and 466,340 during the 2005 return. The 2007 adult pink escapement was 615,501 in 2007, and 1,201,862 in 2009 (WDFW Salmonscape), and in 2011 escapement was expected to exceed 750,000 fish. The reasons for the recent dramatic increase in odd-year pink salmon in many Puget Sound Rivers are unknown, but may be related to changes in ocean conditions (Ladley 2011). For the first time since 1941 when the Buckley trap was built, significant numbers of pink salmon began to be transported above Mud Mountain Dam starting in 2003 to enable spawning in the Upper White River and the West Fork of the White River. At present, substantial numbers of pinks spawn extensively in the upper White River and various tributaries, and pinks have been observed as high as Sunrise Creek, which enters the White River at RM 63. The Puyallup and Carbon River drainages have not experienced the same significant expansion of pink salmon utilization, but spawning has recently occurred in record numbers throughout the mainstem Puyallup River downstream from RM 27.5 as well in the lower Carbon River, and South Prairie, Wilkeson and Fennel Creeks. Factors of Decline and Threats At the present time, odd-year pink salmon are not in decline, and in fact their populations are increasing dramatically. Because of their rather simple life history compared to that of other anadromous salmonid species, pink salmon are more susceptible to stochastic events that can severely impact an entire year class. PuyallupWhite River Coho Salmon (Oncorhynchus kisutch) Coho salmon are prevalent throughout the Puyallup/White River Watershed. They frequently spawn in headwater areas such as Silver Springs, which enters the White River at RM 60.5, and smaller numbers make their way into habitat available upstream from Puget Sound Energy’s Electron Diversion Dam on the Puyallup River at RM 41.7 where a project was recently conducted to restore fish passage. Most coho in the system spawn in tributaries, but mainstem spawning also occurs along mainstem channel margins and in lower velocity side channels. Key spawning areas include South Prairie Creek, Boise Creek, the Clearwater and Greenwater Rivers, and in Huckleberry Fox Creeks, which are tributaries to the Puyallup River (Marks et al. 2009). Current Abundance Coho salmon have been artificially propagated in WDFWs hatchery on Voights Creek since 1917. In the past, fry and smolts from other drainages including Big Soos Creek, Minter Creek, Garrison Springs, George Adams Creek, and the Skagit and Washougal Rivers were transferred to the hatchery to supplement local broodstock. The Voights Creek hatchery produces up to 1.5 million coho pre-smolts annually, of which 100,000 to 200,000 are
King County National Flood Insurance Program Biological Opinion . Compliance Submittal and Programmatic Habitat Assessment
3‐39
transferred to the PTI’s acclimation ponds in the upper Puyallup watershed. Hatchery fish from Voights Creek are released in April and generally outmigrate rapidly following release. The majority of wild coho juveniles rear in freshwater for 18 months before migrating to marine waters. Wild smolt outmigration occurs from March through the early July, with peak migration in May. Smolt trapping data collected in 2005 on the Puyallup River indicated that approximately 91 percent of wild coho smolts migrate to marine waters as yearlings (Berger and Williamson 2005), although small numbers of fish outmigrate as sub-yearlings and two-year-old smolts. The vast majority of coho spend over a year in saltwater before returning to freshwater to spawn as three-year-olds, but small numbers of fish return to spawn as two- to four-year-olds. Adult coho enter the lower Puyallup River system in early August and spawn from mid September through late December, with peak spawning around the end of October through early November. However, data collected at the Buckley trap and spawning surveys conducted by PIT show that some coho move through the system and spawn as late as February. South Prairie Creek supports a unique late run of coho that spawn well into February and early March, and hundreds of adult coho are often observed holding in South Prairie Creek in December before moving into upper tributaries such as Coal Mine and Spiketon Creeks to spawn. Historic Abundance Estimates of the historic WRIA 10 coho salmon populations are generally unavailable. Current Abundance Wild coho escapements have increased in recent years in spite of a large flood in January 2009 that scoured many of the redds of other salmon species (Ladley 2011).
King County National Flood Insurance Program Biological Opinion . Compliance Submittal and Programmatic Habitat Assessment
3‐40
Vashon‐Maury Island Protected Species and Habitat Evaluation Overview Vashon-Maury Island is located in central Puget Sound within the boundaries of King County, Washington1. Colvos Passage separates the island from Kitsap County to the west, East Passage lies between the island and the King County mainland to the east, and Dalco Passage separates Pierce County from the island on the south. Puget Sound proper extends to the north. Land area totals approximately 37 square miles (24,000 acres), of which 29.7 square miles are on Vashon Island and 7.0 square miles are on Maury Island. Geology and Topography The island was physically formed by the advance and retreat of at least four recent glaciations in the Puget Sound area (cumulatively called the Fraser Glaciation). The last of these, appropriately called the Vashon stade (glacial advance), occurred between 13,000 and 15,000 years ago. The general north-south orientation of the island and the Puget Sound trough is a result of these glacial movements. The composition of the island consists completely of materials left by glaciers—no bedrock occurs anywhere on the island. For the most part, Vashon is composed of sand and gravel deposited as the glaciers expanded and declined. Beneath the ice, sands, gravels, and clays were compressed into glacial till or hardpan, the most extensive soil type found on the island. Surficial deposits of glacial outwash are found mostly in the southern portions of the island.
The topography of Vashon-Maury Island exhibits characteristics similar to other Puget Sound islands (the San Juan Islands are the exception) and to the low-lying mainland areas as well. Steep slopes rise from the sea to elevations of 400 feet or higher. At these upper elevations the topography levels off into gently rolling plateaus. Few steep slopes are found on the upland plateaus except where indented by the major rivers or deep ravines. Some of the steepest slopes on Vashon-Maury Island are found between Point Robinson and Piner Point. These are nearly cliff-like in many portions. The maximum elevation on the island is just over 500 feet at Maury Island Marine Park. Human Occupation With a population estimated at just over 10,600 (U.S. Census Bureau 2010), the island has maintained a rural character despite its close proximity to Seattle. Low-density residential development covers much of the island with zoning of one home per five and ten acres. Higher density residential areas are concentrated in the Vashon Town Center, Vashon Heights, Burton, Dockton, and along parts of the island’s shoreline. The Town Center contains much of the island’s commercial development. Beyond this, several smaller rural neighborhood centers contain business and commercial development. Approximately 6.6 percent of Vashon-Maury Island is in public ownership; management objectives for these properties vary widely. Of these public lands, approximately six percent are managed as open space or as recreation lands. An additional two percent are privately
1 Text in this Overview section is extracted nearly verbatim in excerpts from King County (2008b).
King County National Flood Insurance Program Biological Opinion . Compliance Submittal and Programmatic Habitat Assessment
3‐41
managed as open space and resource lands; this includes private easements, Vashon-Maury Island Land Trust properties, and Water District properties. The Island Center Forest, King County’s largest natural lands property on the island, is managed by WLRD with input from the Friends of Island Center Forest. This 363-acre property contains the headwaters of Judd Creek and serves as a working forest and ecological area. Another beautiful ecologically significant open space area is the Maury Island Marine Park. This 331-acre park is managed by King County Parks Division and provides habitat for a diversity of marine species. There are many other ecologically-sensitive lands that have been protected by the Vashon-Maury Island Land Trust’s efforts; these include Vashon’s largest open-water pond (Fisher Pond), Fern Cove—a small estuary, miles of stream habitat, sphagnum bogs, and other treasures.
Terrestrial and Freshwater Environment Vashon-Maury Island has experienced significant and substantial change since Euro-American settlement.2 Virtually all of the original pre-settlement forests of Sitka spruce and western red cedar, and the upland forests of western hemlock and Douglas fir were logged and removed by 1897 (King County 2000a). There followed an interlude of decades when the land was used for farming. Logging of the island continued with the harvest of second growth timber in the 1940s and 1950s. The island does contain some remnants of an earlier mature coniferous forest system. Burton Acres Park on the west side of Quartermaster Harbor contains trees potentially pre-dating European settlement, and the island has numerous second growth forests in various stages of succession. Although forestlands have regenerated on the island, their composition is significantly different from the old-growth coniferous forests prior to settlement. The forests are considerably younger with a significant hardwood presence. Common hardwoods are red alder and big leaf maple, with Pacific Madrone dominant in the drier, southern portions of the island. A substantial Pacific Madrone forest is located along the steep slopes of Maury Island, and is one of only handful of such habitats in the Puget Sound. Vashon's terrestrial habitats have in the past been documented to support 181 species of birds, 57 of these being waterfowl (grebes, loons, cormorants, etc.); 37 species of mammal; seven amphibian species, including long-toed salamanders and northwest salamanders; and four species of reptile (including the northern alligator lizard and the uncommon northwestern fence lizard). The island’s varied forests support a number of priority species, including the Bald Eagle. Vashon-Maury contains a number of priority habitats as well (WDFW Priority Habitat Species Program). One of these, the cliff features of the island greater than 25 feet in height, occurs at many points around the perimeter of Vashon-Maury. These locations include the southern end of Vashon, its southwestern shoreline, its northern end, and Maury’s southern and eastern shores. Near-vertical cliffs, which are used for nesting by various species, such as the Pigeon Guillemots, Belted Kingfisher, and Rough-winged Swallows, are found in several locations. Aspen stands are another uncommon priority habitat found on the island. Vashon’s freshwater environments include 75 mapped streams, ranging from high-gradient streams with little or no salmonid habitat to lower gradient channels that support substantial salmonid populations (Washington Trout 2001). Fifteen streams are known to support salmonids on Vashon-Maury Island. Salmonid (salmon and trout) species inhabiting streams include coastal cutthroat trout, rainbow/steelhead trout, coho salmon, and chum salmon.
2 Text in portions of this section is extracted nearly verbatim from King County (2001).

King County National Flood Insurance Program Biological Opinion . Compliance Submittal and Programmatic Habitat Assessment
3‐42
Juvenile and adult coho, Chinook, chum and coastal trout have been observed at numerous points along the marine shorelines as well (Washington Trout 2001). The larger streams, such as Shinglemill and Judd Creeks, originate from a series of groundwater seeps and wetlands in the upland areas of the island and flow through a system of steep ravines before discharging into Puget Sound. Smaller stream systems also originate from the upland seeps and springs and flow through steep, incised ravines to Puget Sound. Available information shows that stream habitat on Vashon-Maury has been significantly altered by land use practices. Washington Trout (2001) assessed the conditions of 38 of the island's streams by examining nine parameters that are indicators of habitat conditions. Large woody debris was rated as good in 25 percent of streams examined, fair in 25 percent, and poor in 50 percent of streams examined during the study. Streambed sediment was rated as poor in 88 percent of streams that were rated. Overall, riparian conditions were rated as poor in 75 percent of streams examined (King County 2000a). Also of note, invasive plant species are present in many forested riparian and wetland habitats. English ivy and Himalayan blackberry are the primary invasive species in these areas. Vashon-Maury Island also has a number of high quality freshwater wetland systems. One of these, the 7,000 year old Whispering Firs Bog, is a large sphagnum bog that supports a complex of rare plants characteristic of sphagnum bogs including bog laurel, Labrador tea, sundew, stunted hemlock and fir. The bog interior is encircled by a moat and scrub-shrub wetland with native crabapple, skunk cabbage, sedges, and many other native hydrophytic plant species. Many of these larger, high quality habitats are currently held in preservation status or are identified as ecosystems warranting conservation. Streams and Salmon Usage3 The larger of the streams in terms of stream length, flow and drainage basin, on Vashon and Maury Islands (the Island) typically originate from small, diverse series of groundwater seeps in the upland areas of the Island. In these reaches, the streams are generally low gradient and meander across the landscape. These upland areas are usually between 300 to 500 feet above sea level. The larger stream systems (such as Judd and Shinglemill Creeks) flow through an extensive system of long, high-gradient ravines before entering the Puget Sound estuary. The streams that have smaller drainage areas and lower flows may also originate from upland seeps and/or seeps and springs present inside of the steep incised ravines that drop through the bluff line that rings the Island. All of these streams drop through steep (gradients of 10-15 percent) stream channels before they enter the Puget Sound estuary with little or no freshwater to saltwater interface. For many of the streams on the Island, basic habitat quality data has not been collected. Much of the data and information in this chapter was collected by survey crews from Washington Trout (2001) from surveys conducted during the summer of 2000. Most of their data is qualitative and was subject to the best professional judgment of the survey crews involved in the collection. Unless otherwise noted, the information below is attributed to Washington Trout (2001). Williams et al. (1975) identified only a few of the Island streams, and Ames and Bucknell (1981)
3 Text in this Streams and Salmon Usage section is extracted nearly verbatim in excerpts from Kerwin and Nelson (2000).
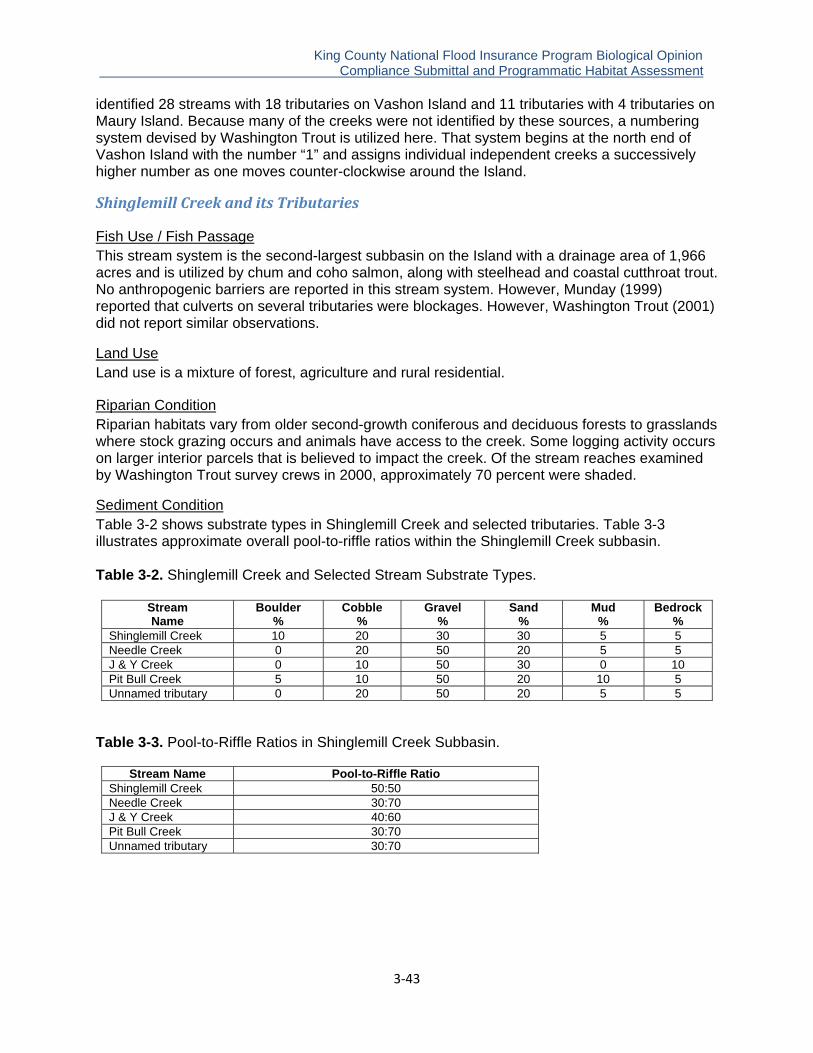
King County National Flood Insurance Program Biological Opinion . Compliance Submittal and Programmatic Habitat Assessment
3‐43
identified 28 streams with 18 tributaries on Vashon Island and 11 tributaries with 4 tributaries on Maury Island. Because many of the creeks were not identified by these sources, a numbering system devised by Washington Trout is utilized here. That system begins at the north end of Vashon Island with the number “1” and assigns individual independent creeks a successively higher number as one moves counter-clockwise around the Island.
Shinglemill Creek and its Tributaries
Fish Use / Fish Passage This stream system is the second-largest subbasin on the Island with a drainage area of 1,966 acres and is utilized by chum and coho salmon, along with steelhead and coastal cutthroat trout. No anthropogenic barriers are reported in this stream system. However, Munday (1999) reported that culverts on several tributaries were blockages. However, Washington Trout (2001) did not report similar observations.
Land Use Land use is a mixture of forest, agriculture and rural residential.
Riparian Condition Riparian habitats vary from older second-growth coniferous and deciduous forests to grasslands where stock grazing occurs and animals have access to the creek. Some logging activity occurs on larger interior parcels that is believed to impact the creek. Of the stream reaches examined by Washington Trout survey crews in 2000, approximately 70 percent were shaded.
Sediment Condition Table 3-2 shows substrate types in Shinglemill Creek and selected tributaries. Table 3-3 illustrates approximate overall pool-to-riffle ratios within the Shinglemill Creek subbasin. Table 3-2. Shinglemill Creek and Selected Stream Substrate Types.
Stream Name
Boulder %
Cobble%
Gravel%
Sand%
Mud %
Bedrock%
Shinglemill Creek 10 20 30 30 5 5 Needle Creek 0 20 50 20 5 5 J & Y Creek 0 10 50 30 0 10 Pit Bull Creek 5 10 50 20 10 5 Unnamed tributary 0 20 50 20 5 5
Table 3-3. Pool-to-Riffle Ratios in Shinglemill Creek Subbasin.
Stream Name Pool-to-Riffle RatioShinglemill Creek 50:50 Needle Creek 30:70 J & Y Creek 40:60 Pit Bull Creek 30:70 Unnamed tributary 30:70
King County National Flood Insurance Program Biological Opinion . Compliance Submittal and Programmatic Habitat Assessment
3‐44
Stream channel bed load and scour was identified as a problem during coho egg incubation periods (Vashon-Maury Island Land Trust 1999). Bed scour of up to 8.75 inches and redeposited sediments of up to 6 inches occurred at some locations in Shinglemill Creek. This data is from only one season sampling effort but is indicative of adverse egg incubation or fry emergent success.
Hydrology A flow survey was conducted during the 1998/99 winter. Flow discharge rates remained at 5 cfs or less from early August through mid-November. The highest flows measured were in late November 1998 and January 1999 at 37 cfs and 39 cfs respectively. A more typical seasonal flow during winter months was approximately 10 cfs (Vashon-Maury Island Land Trust 1999). There are municipal water system wells (Westside Water District) on the mainstem Shinglemill Creek, and historic private water supply systems on Pit Bull Creek and the unnamed tributary. Christensen Creek4 Fish Use / Fish Passage Staff of the WDFW reported the presence of coastal cutthroat trout in this creek in 1995 (Schneider 1995). A culvert perched approximately three feet high at Redding Beach Road is believed to be an impassable barrier to salmonids.
Land Use Land use within this subbasin is a mixture of forest, agriculture and rural residential. There is a single-family residence at the mouth of the creek.
Riparian Condition The lower stream reaches riparian habitat consists of ornamental plantings and landscaping associated with the residence there. Large boulders have been placed in the stream apparently in an effort to control bank erosion. Upstream of this reach, the riparian condition is typically a mix of second-growth deciduous and coniferous trees and rural residential. Stream channel complexity is provided by abundant amounts of brush and moderate amounts of logs, rootwads and tree limbs. Approximately 70 percent of the stream exists in a shaded condition.
Sediment Condition Overall, the substrate condition of Christensen Creek was characterized as 5 percent boulder, 15 percent cobble, 30 percent gravel, 30 percent sand, 15 percent mud, and 5 percent bedrock. A landslide approximately 600 feet downstream of Redding Beach Road is depositing a moderate amount of sediments into the creek. There is an active landslide present in the mainstem Christensen Creek near the confluence with tributary “D” that contributes sediments to downstream reaches. This slide appears to be caused by stormwater discharge from a culvert that carries runoff from Redding Beach Road. Pool-to-riffle ratios are reported as 1:1.
Hydrology No data was located that indicated changes in stream flows. There are at least two private water collection systems in this subbasin. The Christensen Creek Pond and the two ponds (approximately half an acre each) are constructed ponds and also alter stream flow characteristics.
4 Within Kerwin and Nelson (2000), Christensen creek was mistakenly spelled “Christianson.” It has been spelled correctly within this document.
King County National Flood Insurance Program Biological Opinion . Compliance Submittal and Programmatic Habitat Assessment
3‐45
Hydromodification As noted above there are at least three constructed ponds in this stream system.
Fisher Creek The Fisher Creek subbasin drains an area of approximately 1,549 acres. The headwaters are north of Old Mill Road and it flows south until it empties into Quartermaster Harbor along the west shore near the mouth of the harbor.
Fish Use/Fish Passage Cutthroat trout, coho salmon and sculpin can be found in its lower reaches. There is a potential barrier at 232nd Street. WDNR has listed the stream upstream of 232nd Street as a Type 3 to the headwater pond approximately a quarter mile upstream of the road crossing. The outlet structure of the headwater pond is a stand-pipe that controls water elevation and is also a possible barrier to upstream migration.
Land Use Land use within this subbasin is a mixture of forest, agriculture and rural residential.
Riparian Condition Where Fisher Creek leaves saltwater it traverses through a channelized and landscaped reach and then crosses under Vashon Highway SW through a 30-inch culvert. Upstream of the highway the creek traverses through an abandoned blueberry patch before entering a steep walled ravine. The vegetation in this ravine is a mixed coniferous and deciduous second-growth forest with a shrub understory of salmonberry, skunk cabbage, and sword ferns. Only limited information was available that indicated the riparian habitat after the creek exited the ravine. Livestock rearing occurs in the upper reaches and the headwater pond is a created structure. Approximately 70 percent of the stream is in shaded reaches.
Sediment Condition Overall, the substrate is condition is approximately 5 percent boulders, 15 percent cobble, 30 percent gravel, 30 percent sands, 10 percent mud, and 10 percent bedrock. The creek has an approximate pool-to-riffle ratio of 40:60.
Hydrology The Burton Water Company has facilities located on this creek and withdraws water for domestic use. As is the case with most water withdrawal situations, the greatest need for potable water is during low baseflow periods.
Hydromodification The stream channel has been modified in several places as noted previously in the riparian section above.
Judd Creek Judd Creek was not surveyed by Washington Trout as a part of their year 2000 efforts.5
Chum, coho, and Chinook salmon (WDFW Spawning Ground Survey Database) along with steelhead trout are known to spawn in this stream system. Coastal cutthroat trout juveniles have also been observed in the lower reaches. 5 Judd Creek was surveyed in May 2001, and coho fry were observed in the lower portion of the mainstem.

King County National Flood Insurance Program Biological Opinion . Compliance Submittal and Programmatic Habitat Assessment
3‐46
Lack of habitat information is a data gap.
Raab’s Lagoon Creek (Mileta Creek) Raab’s Lagoon Creek originates from Maury Island and flows southerly into Quartermaster Harbor.
Fish Use / Fish Passage There are no known barriers to anadromous or resident salmonids on Rabb’s Lagoon Creek. There is some type of water control structure at the bulkhead at the downstream end of the creek and the exact purpose of this structure is unknown.
Land Use Land use within this subbasin is a predominantly agriculture with some single-family rural residences.
Riparian Condition The riparian condition is typically a mix of second-growth deciduous and coniferous forest and rural residential. A small wetland downstream of Dockton Road is fenced to eliminate livestock intrusion. A braided stream channel traverses through a wetland dominated by skunk cabbage and bullrush. Approximately 60 percent of the stream exists in a shaded condition primarily with streamside associated shrubs.
Sediment Condition The creek is a low gradient system and is dominated by mud (60 percent) and sand (20 percent) with patches of 1-6 inch gavels (20 percent). The amount of the stream in pools is approximately 30 percent.
Hydrology No data was located that indicated changes in stream flows.
Hydromodification Local culverts limit stream channel migration. Upstream of the Dockton Road, the stream channel resembles a roadside ditch as it parallels the road before the creek turns northwesterly where it originates from a series of diverse seeps.
Water Quality Streams on Vashon Island drain directly to Puget Sound, which is classified as Class AA marine waters.6 As such, all streams on Vashon Island are classified AA by default (WAC 173-201A). Beneficial Uses for Class AA streams include the following: • Water supply • Stock watering • Fish and shellfish habitat, fishery, and migration • Wildlife habitat • Recreation • Commerce and navigation No waters on Vashon Island were listed on Ecology’s 2008 303(d) list (but the marine waters of Quartermaster Harbor and Puget Sound east of Vashon are listed; see below).
6 Text in this Water Quality section is extracted nearly verbatim in excerpts from King County (2004).

King County National Flood Insurance Program Biological Opinion . Compliance Submittal and Programmatic Habitat Assessment
3‐47
Water quality data from 20 King County sampling stations was available for review (King County 2004). Sampling observation periods varied from one to four years among the King County stations. Parameters reported included pH, dissolved oxygen (DO), water temperature, and turbidity. East Vashon had five sampling stations. Mean DO levels were above the 9.5 mg/L standard for AA waters. However, minimum DO levels at all locations were below the standard. Three locations had minimum pH levels below the lower limit but within the limit of variability due to manmade causes. Two stations exhibited temperatures above the 16°C limit. Average turbidity was relatively high at two locations, with extremely high maximum turbidity levels associated with rainfall. High levels were reported for the maximum readings at the other locations. Judd Creek Basin had seven sampling stations. Minimum DO levels were below the standard at all locations. Three stations had minimum pH readings just below the 6.5 lower limit, at 6.4. Average and maximum temperatures were at or below the standard of 16.0°C. For average conditions, turbidity was relatively high at three locations. All locations showed high maximum turbidity. Shinglemill Creek Basin had three sampling stations. Minimum DO levels were below the standard at two locations. One station had a minimum pH reading below the lower limit of 6.5. Temperatures were below the limit at all locations. Turbidity was relatively high for two stations with elevated maximums. West Vashon had four sampling stations. One station had an average DO level below the standard. All stations had minimum DO levels below standard. Two stations had a pH reading below the lower limit of 6.5. One station had a maximum temperature above the limit. Turbidity measurements were somewhat high, and maximum turbidity measurements were high to extremely high at three locations. Maury Island had one sampling station, with average DO of 8.8 mg/l, below the 9.5 mg/l standard. Temperatures were below the established maximum. The minimum pH at 6.4 was below the 6.5 standard; however, a 0.2 variation is allowed for manmade causes. Average turbidity was 4.3 Nephelometric Turbidity Units (NTU), but the maximum turbidity event was extremely high with a measurement of 138 NTU associated with heavy rain. An area-wide problem for Vashon-Maury Island has been lead and arsenic contamination of surface soils by emissions from historical smelter activity in the Tacoma area. The King County Health Department is conducting a study and planning effort to address the contamination. The level of stormwater runoff contamination has not been quantitatively assessed through current monitoring data, and could be a priority for inclusion in future monitoring. Additional sampling is recommended for agriculture-related parameters for general water quality sampling island-wide. This would include fecal coliform, biological oxygen demand (BOD), ammonia-nitrogen, and in heavily farmed areas, pesticides. In the Vashon Town Center and other areas that have more human activity, consideration should be given to sampling for metals and toxins, in coordination with a Health Department study.
King County National Flood Insurance Program Biological Opinion . Compliance Submittal and Programmatic Habitat Assessment
3‐48
Marine Nearshore Environment The nearshore ecosystem is the interface between marine and terrestrial environments.7 The nearshore is generally considered to extend from the top of shoreline bluffs to the depth offshore where light penetrating Puget Sound waters still supports plant growth (photic zone), and upstream into estuaries to the head of tidal influence. Vashon-Maury Island nearshore comprises 51 miles of shoreline, which accounts for more than half of the 92 miles of marine shoreline in King County (Higgins et. al 2005). This shoreline is much less armored than other King County marine shorelines; however, even on Vashon-Maury, shoreline armoring is present on over 50 percent of the shoreline. The Vashon-Maury shoreline consists of a mosaic of beaches, bluffs, lagoons, spits, pocket estuaries, and fringing eelgrass and kelp beds that supports a variety of communities and ecosystem functions. A large number of shoreline reaches on the Vashon/Maury Island complex remain either lightly modified or unmodified from original conditions. Marine riparian vegetation there is more intact, and anthropogenic shoreline modifications are less intrusive overall (Anchor Environmental 2006). Forage fish spawning habitat is present along much of the natural shoreline of Vashon-Maury Island. Sediment from eroding steep bluffs, along with contributions from island streams, provides material for nearshore flats and beaches. Longshore drift, the process of eroding bluffs feeding down current beaches through erosion, transport and deposition is a critical component of Vashon-Maury Island's nearshore environment. Back beach and riparian habitats contain mature riparian vegetation on most unarmored beaches (Anchor Environmental 2004). Quartermaster Harbor is a relatively shallow, protected embayment between Vashon and Maury islands that comprises 3,000 surface acres of water. A natural bay of this size is relatively uncommon in Puget Sound (WDNR 2004). Transition zones between freshwater surface flows and the marine water within the bay include the estuaries at the mouth of Judd Creek, Fisher Creek and Raab’s Lagoon. Numerous smaller streams and seeps deliver freshwater to Quartermaster Harbor and Maury Island’s east shoreline. Fish species that inhabit or visit the intertidal zone of Quartermaster Harbor include juvenile salmon, arrow goby—which inhabits the low intertidal zone; several varieties of sculpin, and members of the righteye flounder family. Among these, the rock sole and the starry flounder are known to eat clam siphons, small mollusks, marine worms, small crabs and other fish in the intertidal zone. Within Quartermaster Harbor, the intertidal substrate includes boulders, cobbles, sand, and mud. Many of the beaches, which may appear to be mud, are actually sand with a high content of organic matter on the surface. The intertidal zone supports a large number of bivalve mollusks consisting primarily of clams, but including bay mussels and nonnative Japanese oysters. Three species of barnacles inhabit this community and filter feed on microscopic organisms while attached to hard substrate such as rocks and pilings. Limpets and periwinkles feed on the benthic diatoms. Beach hoppers and the shore crabs feed primarily on detritus, and sand dollars occur in local patches throughout the harbor. Predators of the sand dollar include several fish species and three species of sea star. Geoducks and horse mussels are common infaunal members of this community. Geoducks are extremely abundant at the mouth of the bay and along the east side of Maury Island.
7 Text in this Marine Nearshore Environment section is extracted nearly verbatim in excerpts from King County (2008b).
King County National Flood Insurance Program Biological Opinion . Compliance Submittal and Programmatic Habitat Assessment
3‐49
Regionally important habitats and the species or populations associated with them found in Quartermaster Harbor include forage fish spawning grounds that support herring, surf smelt and sand lance; rearing areas and migratory corridors for salmon and trout (i.e., Chinook, coho, chum, steelhead, cutthroat), bottom fish rearing habitat, and an important wintering ground for migratory marine birds including Red-throated Loons, Pacific Loons, and Common Loons, Red-necked Grebes, Eared Grebes, and Western Grebes, Green-backed Herons, Green-winged Teal, Ruddy Ducks as well as several other species. Spawning and wintering grounds of the quality found within the reserve are not replicated anywhere else in the central Puget Sound sub-basin (WDNR 2004). In all, approximately 60 species of fish and 78 species of birds, several species of marine mammals and a plethora of marine invertebrates inhabit or use Quartermaster Harbor (WDNR 2004). The southeastern shoreline of Maury Island includes a high-energy marine shoreline that extends from the mouth of Quartermaster northeast to Point Robinson. The area supports a unique, uninterrupted drift cell that converges at Point Robinson with another drift cell along the northern shore of Maury Island. This convergence zone provides sediment to a sand spit located at Point Robinson. Drift along the south and east shore of Maury Island moves northeast from Piner Point to the convergence zone at Point Robinson. Such long, relatively uninterrupted drift cells are becoming a rare occurrence in the central Puget Sound region. These physical features are critical for the maintenance and development of accretion shore features (e.g. beaches, spits, hooks). This drift cell also feeds the sand spit found at Point Robinson, itself an increasingly uncommon occurrence within Puget Sound. More detailed information about habitat types and species use in the nearshore are in the following section. Note that the information in the following section includes all nearshore in WRIA 9, not just Vashon-Maury Island.
Selected Nearshore Habitat Types8 Numerous habitat types occur within the nearshore environment, including eelgrass meadows, kelp forests, flats, tidal marshes, subestuaries, sand spits, beaches and backshore, banks and bluffs, and marine riparian vegetation. These habitats provide myriad critical functions. For example, eelgrass meadows, kelp forests, flats, tidal marshes, sand spits and riparian zones provide primary production. All habitat types support invertebrates and juvenile and adult fishes (including juvenile salmonids), and provide foraging and refuge opportunities for birds and other wildlife. Several known factors cause these habitats stress, including physical disturbances from shoreline armoring, marina construction, and bivalve harvesting; shading from overwater structures; contamination by chemicals; and competition from non-native species. Unfortunately, numerous data gaps in understanding of these habitats exist, making it difficult to fully assess them. Information about the historical distribution/abundance of these habitats is lacking, and there are no comprehensive maps. What role these habitats play in the food web is also not well understood, as are the effects of shoreline armoring and bivalve harvesting. This section provides more detail about the functions of, stressors to, and data gaps about these nearshore environments. It also discusses the current and historical distributions of these habitats in WRIA 9, where known. 8 Text in this Selected Nearshore Habitat Types section has been extracted nearly verbatim in excerpts from Williams et al. (2001).
King County National Flood Insurance Program Biological Opinion . Compliance Submittal and Programmatic Habitat Assessment
3‐50
Eelgrass Meadows Functions within Ecosystem Eelgrass (Zostera marina L.) is one of about five species of seagrass that occurs in the Pacific Northwest. It forms small patches to large meadows in the low intertidal and shallow subtidal zone in Puget Sound. Phillips (1984) lists the following functions for eelgrass: Primary production Nutrient processing Wave and current energy buffering Organic matter input Habitat for fish and invertebrates Food for birds Location of Eelgrass Eelgrass occurs from about +1 m to -5 m MLLW in the central Puget Sound area (Bulthuis 1994; Thom et al. 1998). The primary factor controlling distribution at the upper boundary is desiccation stress, and at the lower boundary is light penetration (Thom et al. 1998). Competition for light and nutrients with macroalgae species can also affect eelgrass distribution. Current understanding of the distribution of eelgrass is limited because comprehensive surveys have not been performed within WRIA 9. The primary sources of distribution data are from surveys that included observations made during low tides and covered primarily intertidal and very shallow subtidal meadows and patches. These data include the Coastal Zone Atlas (WDOE 1979), which is more than 20 years old, and very recent estimates provided by the WDNR (1999). Other site-specific studies supply some detail within the East Passage (Thom et al. 1976; Thom et al. 1984; Thom and Hallum 1990). WRIA 9 Eelgrass Distribution The ShoreZone coastal mapping program was adopted as a state-wide coastal inventory system in Washington as part of a joint project between the WDNR Nearshore Habitat Program (part of the Puget Sound Ambient Monitoring Program) and WDFW between 1995 and 1999 (WDNR 1999, WDNR 2001). This database indicates that in the late 1990s, eelgrass covered approximately 114,150 m (66 percent) of the shoreline in WRIA 9, and approximately 82 percent of the Vashon/Maury Island shoreline was covered by eelgrass (WDNR 1999). Eelgrass is also present in Quartermaster Harbor (Wyllie-Echeverria 2011). Stressors Stressors to eelgrass are those things that negatively affect the factors that control eelgrass growth or directly affect eelgrass itself. There are two broad categories of stressors: natural stressors, and human-influenced stressors (Schanz et al. 2010). This section discusses each in turn. Natural stressors to eelgrass include: Increased turbidity Foraging Black rot disease Rhizome exposure Hydrogen sulfide in soils
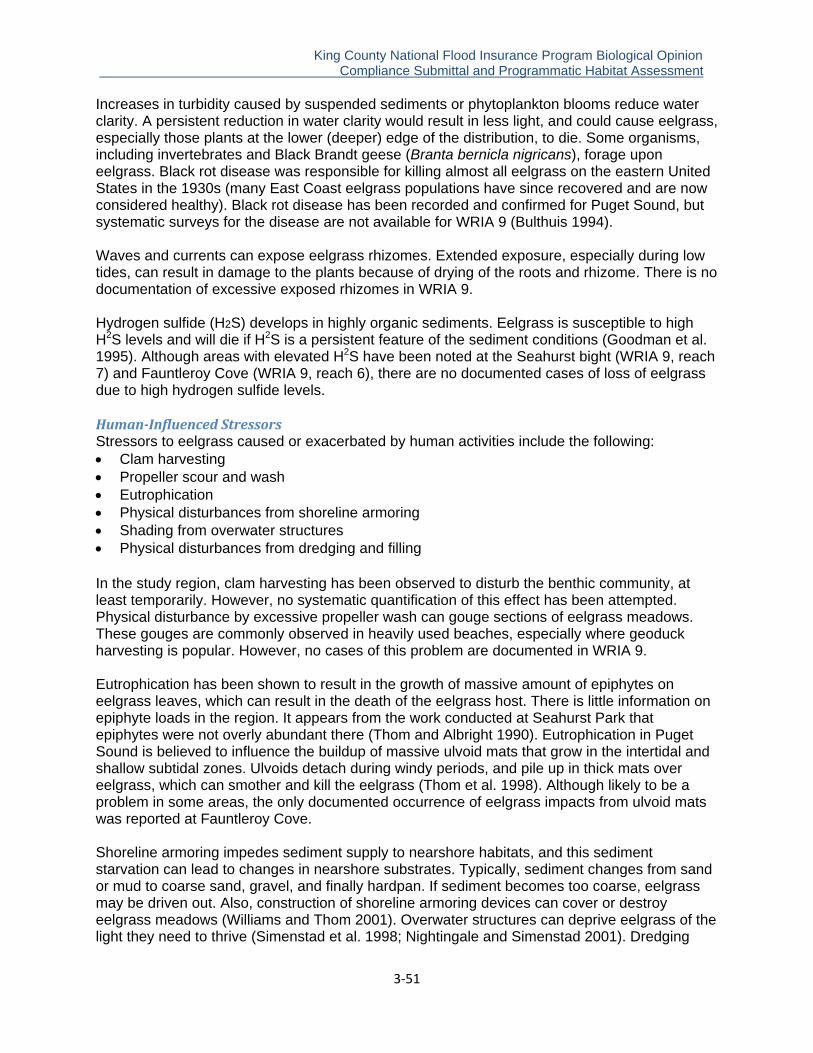
King County National Flood Insurance Program Biological Opinion . Compliance Submittal and Programmatic Habitat Assessment
3‐51
Increases in turbidity caused by suspended sediments or phytoplankton blooms reduce water clarity. A persistent reduction in water clarity would result in less light, and could cause eelgrass, especially those plants at the lower (deeper) edge of the distribution, to die. Some organisms, including invertebrates and Black Brandt geese (Branta bernicla nigricans), forage upon eelgrass. Black rot disease was responsible for killing almost all eelgrass on the eastern United States in the 1930s (many East Coast eelgrass populations have since recovered and are now considered healthy). Black rot disease has been recorded and confirmed for Puget Sound, but systematic surveys for the disease are not available for WRIA 9 (Bulthuis 1994). Waves and currents can expose eelgrass rhizomes. Extended exposure, especially during low tides, can result in damage to the plants because of drying of the roots and rhizome. There is no documentation of excessive exposed rhizomes in WRIA 9. Hydrogen sulfide (H2S) develops in highly organic sediments. Eelgrass is susceptible to high H2S levels and will die if H2S is a persistent feature of the sediment conditions (Goodman et al. 1995). Although areas with elevated H2S have been noted at the Seahurst bight (WRIA 9, reach 7) and Fauntleroy Cove (WRIA 9, reach 6), there are no documented cases of loss of eelgrass due to high hydrogen sulfide levels. HumanInfluenced Stressors Stressors to eelgrass caused or exacerbated by human activities include the following: Clam harvesting Propeller scour and wash Eutrophication Physical disturbances from shoreline armoring Shading from overwater structures Physical disturbances from dredging and filling In the study region, clam harvesting has been observed to disturb the benthic community, at least temporarily. However, no systematic quantification of this effect has been attempted. Physical disturbance by excessive propeller wash can gouge sections of eelgrass meadows. These gouges are commonly observed in heavily used beaches, especially where geoduck harvesting is popular. However, no cases of this problem are documented in WRIA 9. Eutrophication has been shown to result in the growth of massive amount of epiphytes on eelgrass leaves, which can result in the death of the eelgrass host. There is little information on epiphyte loads in the region. It appears from the work conducted at Seahurst Park that epiphytes were not overly abundant there (Thom and Albright 1990). Eutrophication in Puget Sound is believed to influence the buildup of massive ulvoid mats that grow in the intertidal and shallow subtidal zones. Ulvoids detach during windy periods, and pile up in thick mats over eelgrass, which can smother and kill the eelgrass (Thom et al. 1998). Although likely to be a problem in some areas, the only documented occurrence of eelgrass impacts from ulvoid mats was reported at Fauntleroy Cove. Shoreline armoring impedes sediment supply to nearshore habitats, and this sediment starvation can lead to changes in nearshore substrates. Typically, sediment changes from sand or mud to coarse sand, gravel, and finally hardpan. If sediment becomes too coarse, eelgrass may be driven out. Also, construction of shoreline armoring devices can cover or destroy eelgrass meadows (Williams and Thom 2001). Overwater structures can deprive eelgrass of the light they need to thrive (Simenstad et al. 1998; Nightingale and Simenstad 2001). Dredging

King County National Flood Insurance Program Biological Opinion . Compliance Submittal and Programmatic Habitat Assessment
3‐52
operations can excavate eelgrass meadows or cause detrimental increases in turbidity, and filling can smother eelgrass meadows permanently. Historical Distribution Comprehensive historical records of eelgrass distribution are lacking in WRIA 9. Eelgrass information comes from site-specific studies, which are incomplete in terms of providing a historical picture of distribution. In an attempt to document changes in eelgrass, Thom and Hallum (1990) compiled all known records of eelgrass. The oldest records came from marks on U.S. Coast and Geodetic Survey navigation charts that were developed for several bays in Puget Sound, including Padilla Bay. These charts date back in some cases to the period of 1850-1890. No records on these charts showed eelgrass in any portion of WRIAs 8 and 9. Other site-specific records on eelgrass include dive work done by Ron Phillips in 1962 at about 100 locations throughout Puget Sound and Hood Canal. Patchy intertidal eelgrass may have increased in reaches 4, 5, 6 and 9 in WRIA 9 based on a comparison of the records of Thom and Hallum (1990) and WDNR maps. Reasons for Change Eelgrass occurred in most shallow water areas along Vashon/Maury Island. Historic losses of eelgrass are related to overwater structures, bulkheads, marinas, groins, and dredging and filling. Observed increases in eelgrass beds may be may be related to increases in fine substrates. However, historical mapping has been conducted at different scales and with various methods, and it is difficult to pinpoint the exact causes of changes in eelgrass beds. Kelp Forests Kelp Functions within the Ecosystem Nereocystis luetkeana (Bull kelp) is the largest brown algae found in the Pacific Northwest. It forms small patches to large forests in the shallow subtidal zone in Puget Sound. Other large brown algal species common in the study region include Costaria costata (seersucker kelp) Laminaria saccharina (sugar kelp), and Sargassum muticum (Japanese brown algae). These latter species are often found associated with bull kelp forests. S. muticum is a non-native species that was introduced by the Japanese (a.k.a. Pacific) oyster (Crassostrea gigus) mariculture industry to the Northwest in the 1930s (Scagel 1956). There is no comprehensive evaluation of the functions of kelp in Puget Sound, but the following list highlights functions typically associated with kelp: Primary production Habitat for fish, especially rockfish, but also salmon Contributor to pelagic food webs through particulate and dissolved carbon Herring spawning substrate Wave and current buffering (Duggins 1980; Harrold et al. 1988; Jackson and Winant 1983) Substrate for secondary production Extraction of chemicals for commercial use (Whyte and Englar 1980) A kelp forest provides a three-dimensional habitat. This is important for many fish whose larvae use the kelp as settlement habitat. Adult fish feed on and hide in the kelp fronds. Many invertebrates such as crabs, snails, bryozoans, sponges, tunicates, anemones, and shrimp use the blades as living habitat (Foster and Schiel 1985).
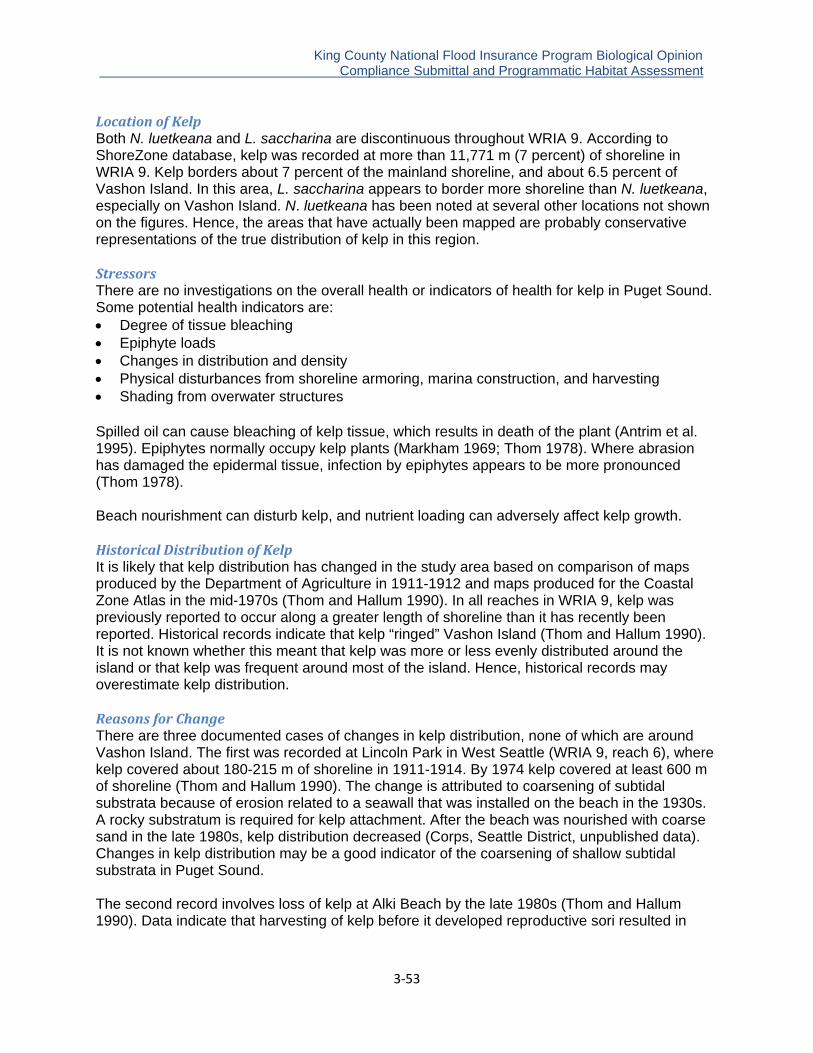
King County National Flood Insurance Program Biological Opinion . Compliance Submittal and Programmatic Habitat Assessment
3‐53
Location of Kelp Both N. luetkeana and L. saccharina are discontinuous throughout WRIA 9. According to ShoreZone database, kelp was recorded at more than 11,771 m (7 percent) of shoreline in WRIA 9. Kelp borders about 7 percent of the mainland shoreline, and about 6.5 percent of Vashon Island. In this area, L. saccharina appears to border more shoreline than N. luetkeana, especially on Vashon Island. N. luetkeana has been noted at several other locations not shown on the figures. Hence, the areas that have actually been mapped are probably conservative representations of the true distribution of kelp in this region. Stressors There are no investigations on the overall health or indicators of health for kelp in Puget Sound. Some potential health indicators are: Degree of tissue bleaching Epiphyte loads Changes in distribution and density Physical disturbances from shoreline armoring, marina construction, and harvesting Shading from overwater structures Spilled oil can cause bleaching of kelp tissue, which results in death of the plant (Antrim et al. 1995). Epiphytes normally occupy kelp plants (Markham 1969; Thom 1978). Where abrasion has damaged the epidermal tissue, infection by epiphytes appears to be more pronounced (Thom 1978). Beach nourishment can disturb kelp, and nutrient loading can adversely affect kelp growth. Historical Distribution of Kelp It is likely that kelp distribution has changed in the study area based on comparison of maps produced by the Department of Agriculture in 1911-1912 and maps produced for the Coastal Zone Atlas in the mid-1970s (Thom and Hallum 1990). In all reaches in WRIA 9, kelp was previously reported to occur along a greater length of shoreline than it has recently been reported. Historical records indicate that kelp “ringed” Vashon Island (Thom and Hallum 1990). It is not known whether this meant that kelp was more or less evenly distributed around the island or that kelp was frequent around most of the island. Hence, historical records may overestimate kelp distribution. Reasons for Change There are three documented cases of changes in kelp distribution, none of which are around Vashon Island. The first was recorded at Lincoln Park in West Seattle (WRIA 9, reach 6), where kelp covered about 180-215 m of shoreline in 1911-1914. By 1974 kelp covered at least 600 m of shoreline (Thom and Hallum 1990). The change is attributed to coarsening of subtidal substrata because of erosion related to a seawall that was installed on the beach in the 1930s. A rocky substratum is required for kelp attachment. After the beach was nourished with coarse sand in the late 1980s, kelp distribution decreased (Corps, Seattle District, unpublished data). Changes in kelp distribution may be a good indicator of the coarsening of shallow subtidal substrata in Puget Sound. The second record involves loss of kelp at Alki Beach by the late 1980s (Thom and Hallum 1990). Data indicate that harvesting of kelp before it developed reproductive sori resulted in
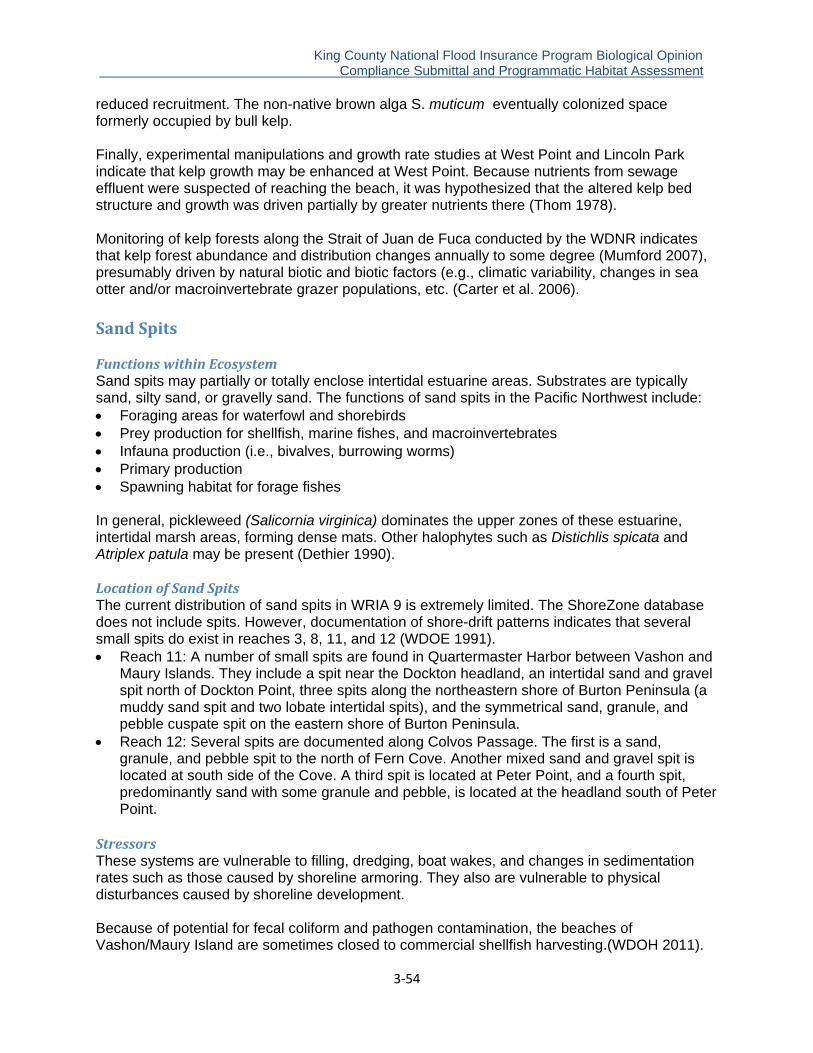
King County National Flood Insurance Program Biological Opinion . Compliance Submittal and Programmatic Habitat Assessment
3‐54
reduced recruitment. The non-native brown alga S. muticum eventually colonized space formerly occupied by bull kelp. Finally, experimental manipulations and growth rate studies at West Point and Lincoln Park indicate that kelp growth may be enhanced at West Point. Because nutrients from sewage effluent were suspected of reaching the beach, it was hypothesized that the altered kelp bed structure and growth was driven partially by greater nutrients there (Thom 1978). Monitoring of kelp forests along the Strait of Juan de Fuca conducted by the WDNR indicates that kelp forest abundance and distribution changes annually to some degree (Mumford 2007), presumably driven by natural biotic and biotic factors (e.g., climatic variability, changes in sea otter and/or macroinvertebrate grazer populations, etc. (Carter et al. 2006). Sand Spits Functions within Ecosystem Sand spits may partially or totally enclose intertidal estuarine areas. Substrates are typically sand, silty sand, or gravelly sand. The functions of sand spits in the Pacific Northwest include: Foraging areas for waterfowl and shorebirds Prey production for shellfish, marine fishes, and macroinvertebrates Infauna production (i.e., bivalves, burrowing worms) Primary production Spawning habitat for forage fishes In general, pickleweed (Salicornia virginica) dominates the upper zones of these estuarine, intertidal marsh areas, forming dense mats. Other halophytes such as Distichlis spicata and Atriplex patula may be present (Dethier 1990). Location of Sand Spits The current distribution of sand spits in WRIA 9 is extremely limited. The ShoreZone database does not include spits. However, documentation of shore-drift patterns indicates that several small spits do exist in reaches 3, 8, 11, and 12 (WDOE 1991). Reach 11: A number of small spits are found in Quartermaster Harbor between Vashon and
Maury Islands. They include a spit near the Dockton headland, an intertidal sand and gravel spit north of Dockton Point, three spits along the northeastern shore of Burton Peninsula (a muddy sand spit and two lobate intertidal spits), and the symmetrical sand, granule, and pebble cuspate spit on the eastern shore of Burton Peninsula.
Reach 12: Several spits are documented along Colvos Passage. The first is a sand, granule, and pebble spit to the north of Fern Cove. Another mixed sand and gravel spit is located at south side of the Cove. A third spit is located at Peter Point, and a fourth spit, predominantly sand with some granule and pebble, is located at the headland south of Peter Point.
Stressors These systems are vulnerable to filling, dredging, boat wakes, and changes in sedimentation rates such as those caused by shoreline armoring. They also are vulnerable to physical disturbances caused by shoreline development. Because of potential for fecal coliform and pathogen contamination, the beaches of Vashon/Maury Island are sometimes closed to commercial shellfish harvesting.(WDOH 2011).
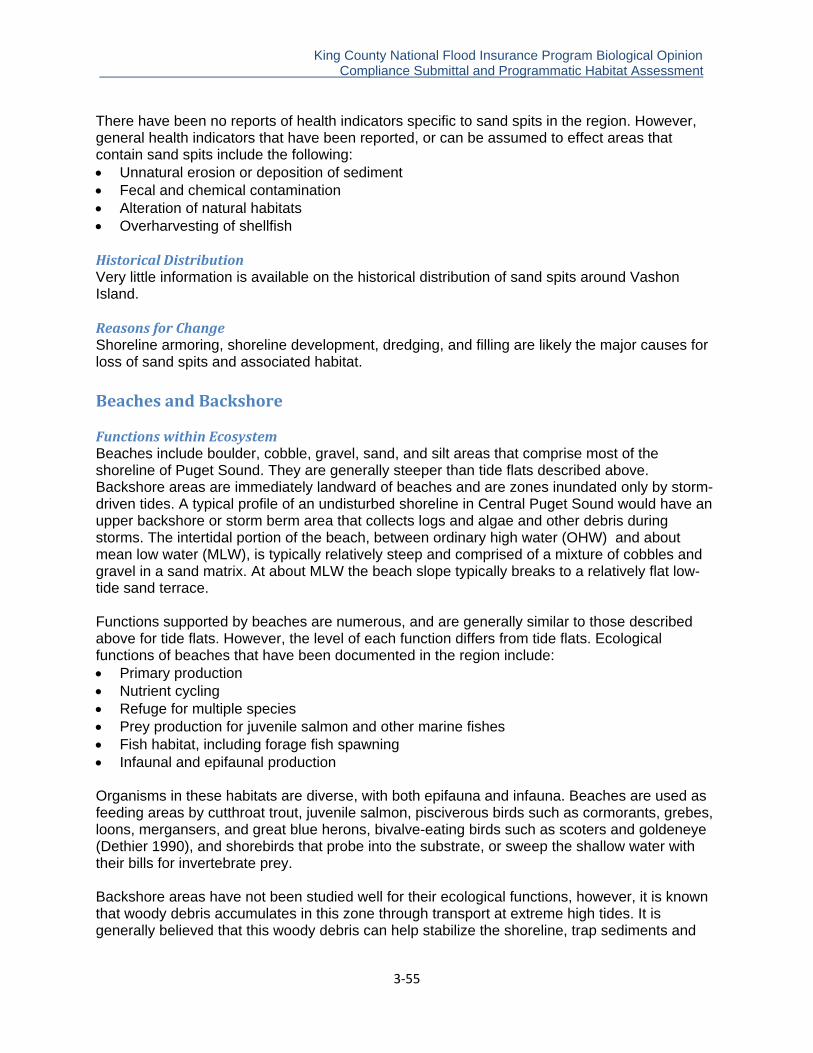
King County National Flood Insurance Program Biological Opinion . Compliance Submittal and Programmatic Habitat Assessment
3‐55
There have been no reports of health indicators specific to sand spits in the region. However, general health indicators that have been reported, or can be assumed to effect areas that contain sand spits include the following: Unnatural erosion or deposition of sediment Fecal and chemical contamination Alteration of natural habitats Overharvesting of shellfish Historical Distribution Very little information is available on the historical distribution of sand spits around Vashon Island. Reasons for Change Shoreline armoring, shoreline development, dredging, and filling are likely the major causes for loss of sand spits and associated habitat. Beaches and Backshore Functions within Ecosystem Beaches include boulder, cobble, gravel, sand, and silt areas that comprise most of the shoreline of Puget Sound. They are generally steeper than tide flats described above. Backshore areas are immediately landward of beaches and are zones inundated only by storm-driven tides. A typical profile of an undisturbed shoreline in Central Puget Sound would have an upper backshore or storm berm area that collects logs and algae and other debris during storms. The intertidal portion of the beach, between ordinary high water (OHW) and about mean low water (MLW), is typically relatively steep and comprised of a mixture of cobbles and gravel in a sand matrix. At about MLW the beach slope typically breaks to a relatively flat low-tide sand terrace. Functions supported by beaches are numerous, and are generally similar to those described above for tide flats. However, the level of each function differs from tide flats. Ecological functions of beaches that have been documented in the region include: Primary production Nutrient cycling Refuge for multiple species Prey production for juvenile salmon and other marine fishes Fish habitat, including forage fish spawning Infaunal and epifaunal production Organisms in these habitats are diverse, with both epifauna and infauna. Beaches are used as feeding areas by cutthroat trout, juvenile salmon, pisciverous birds such as cormorants, grebes, loons, mergansers, and great blue herons, bivalve-eating birds such as scoters and goldeneye (Dethier 1990), and shorebirds that probe into the substrate, or sweep the shallow water with their bills for invertebrate prey. Backshore areas have not been studied well for their ecological functions, however, it is known that woody debris accumulates in this zone through transport at extreme high tides. It is generally believed that this woody debris can help stabilize the shoreline, trap sediments and

King County National Flood Insurance Program Biological Opinion . Compliance Submittal and Programmatic Habitat Assessment
3‐56
organic matter, and provide microhabitats for invertebrates and birds. Backshore areas also support a unique assemblage of vegetation tolerant of wind, salt spray, and shifting substrate. Location of Beaches and Backshore Beaches and backshore areas occur along the shorelines of Vashon/Maury Island. A beach is an accumulation of unconsolidated material formed by waves and wave-induced currents in the zone that extends landward from the lower low water line for large (spring) tides, to a place where there is a marked change in material or physiographic form, usually the effective limit of storm waves. Backshore areas are those where water reaches only during extreme high tides that occur during major storms. The ShoreZone database shows 124,843 m of beaches within all of WRIA 9. The mainland shoreline has 45,386 m of beaches, and Vashon/Maury Islands have 6800 m of beaches. The predominant substrates are sand and sand mixed with pebbles. Stressors Beaches are subject to the same stressors affecting flats. These include overabundance of ulvoids, physical disturbances as a result of shoreline armoring, contamination by organic matter and fecal coliform, Spartina conversion to monoculture marshes, and overwater structures and marinas. Shellfish harvesting can also be particularly damaging to these systems. Some indicators of the health of beaches include the following: Fecal contamination Chemical contamination Alteration of natural habitats Alteration of resource use of natural habitats Alteration of sediment supply Presence of non-native species Shoreline armoring is particularly harmful to recruitment of new beach materials. This is evident along the entire beach from Alki Point to Duwamish Head where seawalls are present for approximately 13,000 linear feet from Pier 91 to Magnolia Bluff. Only 5,580 linear feet from Magnolia Bluff to West Point are free of shoreline armoring (Pentec Environmental 2000). Shoreline armoring likely reduces recruitment of new beach materials throughout WRIA 9. In contrast, only about half of the shoreline of Vashon/Maury Island is armored (King County 2004). Because of the potential for fecal coliform and pathogen contamination, the beaches of WRIA 9 are closed to commercial shellfish harvesting (Puget Sound Water Quality Action Team 2000). Chemical contamination is likely, but few studies have focused on beaches. Historical Distribution No comprehensive historical maps are available for assessing historical distribution. Reasons for Change from Historical Distribution Shoreline armoring, overwater structures, dredging, filling, and resource harvesting are likely the major causes for loss of beach habitat.
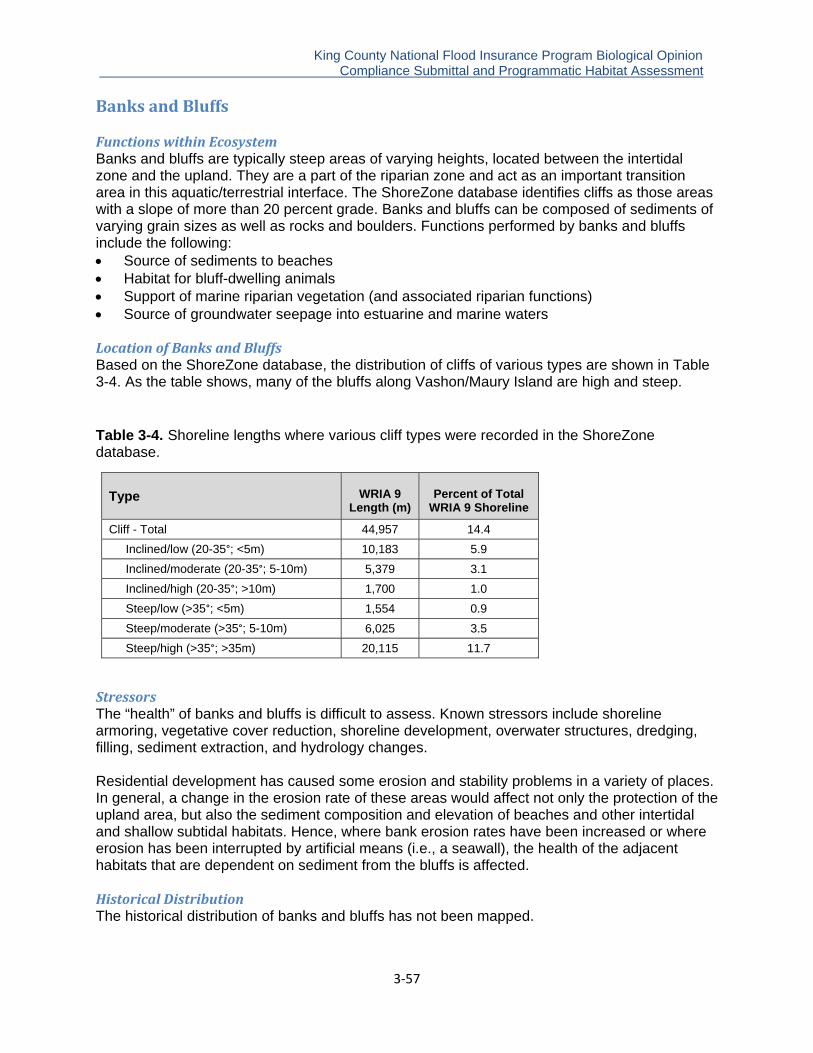
King County National Flood Insurance Program Biological Opinion . Compliance Submittal and Programmatic Habitat Assessment
3‐57
Banks and Bluffs Functions within Ecosystem Banks and bluffs are typically steep areas of varying heights, located between the intertidal zone and the upland. They are a part of the riparian zone and act as an important transition area in this aquatic/terrestrial interface. The ShoreZone database identifies cliffs as those areas with a slope of more than 20 percent grade. Banks and bluffs can be composed of sediments of varying grain sizes as well as rocks and boulders. Functions performed by banks and bluffs include the following: Source of sediments to beaches Habitat for bluff-dwelling animals Support of marine riparian vegetation (and associated riparian functions) Source of groundwater seepage into estuarine and marine waters Location of Banks and Bluffs Based on the ShoreZone database, the distribution of cliffs of various types are shown in Table 3-4. As the table shows, many of the bluffs along Vashon/Maury Island are high and steep. Table 3-4. Shoreline lengths where various cliff types were recorded in the ShoreZone database.
Type
WRIA 9 Length (m)
Percent of Total WRIA 9 Shoreline
Cliff - Total 44,957 14.4
Inclined/low (20-35°; <5m) 10,183 5.9
Inclined/moderate (20-35°; 5-10m) 5,379 3.1
Inclined/high (20-35°; >10m) 1,700 1.0
Steep/low (>35°; <5m) 1,554 0.9
Steep/moderate (>35°; 5-10m) 6,025 3.5
Steep/high (>35°; >35m) 20,115 11.7
Stressors The “health” of banks and bluffs is difficult to assess. Known stressors include shoreline armoring, vegetative cover reduction, shoreline development, overwater structures, dredging, filling, sediment extraction, and hydrology changes. Residential development has caused some erosion and stability problems in a variety of places. In general, a change in the erosion rate of these areas would affect not only the protection of the upland area, but also the sediment composition and elevation of beaches and other intertidal and shallow subtidal habitats. Hence, where bank erosion rates have been increased or where erosion has been interrupted by artificial means (i.e., a seawall), the health of the adjacent habitats that are dependent on sediment from the bluffs is affected. Historical Distribution The historical distribution of banks and bluffs has not been mapped.
King County National Flood Insurance Program Biological Opinion . Compliance Submittal and Programmatic Habitat Assessment
3‐58
Reasons for Change The major obvious changes are likely due to shoreline armoring and coastal development that directly affects bluffs and their maintenance processes.
Marine Riparian Zone Functions within the Ecosystem Riparian zones are those areas on or by land bordering a stream, lake, tidewater, or other body of water (Hall 1987) that constitute the interface between terrestrial and aquatic ecosystems (Swanson et al. 1982). They perform a number of vital functions that affect the quality of aquatic and terrestrial habitats as determined by their physical, chemical and biological characteristics. Riparian-aquatic interactions are now recognized by scientists as so important that riparian buffers have been established as a central element of forest practice rules and watershed restoration efforts (Spence et al. 1996). Riparian vegetation composition, density and continuity are some of the most important characteristics of riparian systems. In general, healthy riparian systems have the following characteristics (Brennan and Culverwell 2004): long linear shapes high edge to area ratios microclimates distinct from those of adjacent uplands standing water present all or most of the year, or a capacity to retain water periodic flooding which results in greater natural diversity composition of native vegetation differing somewhat from upland systems Most of what is known about riparian functions and values comes from investigations of freshwater systems, which have been the subject of extensive research. Although marine riparian zones have not been subject to the same level of scientific investigation, increasing evidence suggests that riparian zones serve similar functions regardless of the salinity of the water bodies they border (Desbonnet et al. 1995) and are likely to provide additional functions unique to nearshore systems (Brennan and Culverwell 2004). Riparian functions that are known or likely to contribute to nearshore ecosystem health include protection of water quality and bank stability; provision of wildlife habitat, microclimate, and shade; and input of nutrients and large woody debris.
Location of Marine Riparian Vegetation Marine riparian vegetation, defined as trees overhanging the intertidal zone, was found along 22,408 feet of shoreline in WRIA 9 (WDNR 1999). This represents 11 percent of the shoreline. However, the width, species composition, continuity, density, and age structure of riparian vegetation have not been determined. These factors are important for determining riparian functions and values and for developing management and recovery options.
Stressors Stressors can be broken down into natural and anthropogenic causes. Natural stressors include earthquakes, slides, disease, parasitism, wave action during storms, and wind. Anthropogenic stressors include vegetation clearing, increased impervious surfaces and surface water runoff, air and water pollution, herbicides, and intentional changes in vegetation (i.e., landscaping). Vegetation removal and the introduction of exotic species change community structure, increase the chance of competitive interactions, change soil chemistry and microclimate, and increase solar and wind exposure.

King County National Flood Insurance Program Biological Opinion . Compliance Submittal and Programmatic Habitat Assessment
3‐59
Historical Distribution Macdonald and Witek (1994) provide a brief historical description of vegetation type and distribution:
Historically, western Washington included the most densely forested region in the United States. Temperate coniferous forests predominated and the size and longevity of the dominant species was unrivaled elsewhere in the world (Franklin and Dyrness 1988). Explorers and early pioneers describe old-growth forest coming right down to the shore—an occurrence now limited to scattered inaccessible sites along the outer ocean coast of the Olympic Peninsula (Egan 1990; Dunagan 1991; Kruckeberg 2003).
Historical photographs and other historical accounts of northwest estuaries (Sedell and Duval 1985; Maser et al. 1988; Dunagan 1991) suggest that the above description is representative of the study area. More recent changes may be represented by a study conducted by researchers with American Forests, a Washington D.C.-based non-profit organization. They analyzed satellite imagery of 3.9 million acres of land on the east side of Puget Sound to determine how forest cover in the basin changed from 1972 to 1996. The analysis showed that dense vegetation and tree canopy coverage declined by 37 percent. The decline in coastal areas is likely to have occurred earlier and in greater amounts due to high development pressures and land use practices in these areas. Reasons for Change Vegetation clearing occurs with most development projects, including those at the water’s edge. Most Puget Sound shorelines were logged off around the turn of the century (Macdonald and Witek 1994). Timber on the shorelines was some of the first cut due to the ease of access and transport (Dunagan 1991) and for land development (Brennan and Culverwell 2004). Over time, vegetation has been removed for timber, housing and other land development, roads, railroads, port development and other commercial and industrial development, view corridors, shoreline armoring, landscaping, beach access, and other land use practices. While much research, attention, and protection have been given to freshwater riparian areas, very little attention has focused on the potential importance of marine riparian areas. Some local governments provide limited guidelines for the removal of vegetation in their shoreline master programs, but most regulators admit it is extremely difficult to enforce (Broadhurst 1998) and regulations and enforcement have been woefully inadequate to protect this critical element of the nearshore ecosystem (Brennan and Culverwell 2004). Marine Riparian Conditions This section includes assessments of shoreline vegetation, large woody debris, and shoreline armoring.
Shoreline Vegetation9 The riparian condition of the marine shorelines was assessed in 2004 by Anchor Environmental. (Anchor Environmental 2004). The data was created primarily through photo interpretation of 2002 era oblique and aerial photographs at a 100-foot resolution along the shore. Riparian data is represented by a single line which runs along the shoreline and matches the location of the line data that WDNR created as part of the ShoreZone database (WDNR 1999). The data described the riparian condition for a 200-foot-wide buffer area starting at the approximate 9 Text in this Shoreline Vegetation section is extracted nearly verbatim in excerpts from Latterell et al. (2011).

King County National Flood Insurance Program Biological Opinion . Compliance Submittal and Programmatic Habitat Assessment
3‐60
ordinary high water line and going inland. Limited field verification occurred for the data. Vegetation was classified into trees, shrubs, grass/landscaped, and none. Vegetation was further characterized by density (continuous/dense or patchy), by if the vegetation was adjacent to the water or separated by a human made structure, and if the vegetation was overhanging the intertidal area or not. Data for 2009 were created by evaluating a combination of 2009 King County aerial photographs and 2006 oblique photographs from Ecology. GIS data representing 2002 was overlain onto 2009 aerial images and any changes in type, density or distance between the seven years were reclassified. Changes to the extent of overhanging vegetation were not tracked. No field surveys have been done to ground truth the 2009 data, however, the quality of aerial images has improved such that using the newer aerial images to create this data is a very accurate and cost effective way to create this data. An examination of changes by jurisdiction revealed that two jurisdictions accounted for most of the observed changes in shoreline vegetation (Table 3-5). The shorelines of Vashon/Maury Island (King County) experienced the greatest loss of dense trees, totaling 2,032 linear feet along the shore. This loss did not occur in a single location, but rather within 28 separate areas spread across the study area (Figure 3-2). The resulting increase of 1,592 linear feet of patchy trees along Vashon/Maury island is mostly due to conversion of densely treed areas to areas of patchy trees. So while there was an increase in patchy trees, this came at the expense of dense stands of trees. Table 3-5. The condition of trees along the shoreline of Vashon/Maury Island, 2002 and 2009.
Dense Trees Patchy Trees 2002 2009 2002 2009
total shoreline
miles miles % of total
change in feet miles
% of total
change in feet
17.16 33.33% -2,032 10.89 21.16% 1,592
Evaluation of the causes of changes in shoreline vegetation from 2002 to 2009 revealed distinct patterns. All of the gains appeared to be natural regrowth of previous slide areas (Figure 3-2). Restoration plantings were too immature to have grown large enough to change the vegetation classification. Furthermore, relatively few revegetation projects along the marine shoreline had been conducted prior to the assessment. Representing 64 percent of the losses, the majority of the loss of trees occurred around existing development, e.g., a house, structure or road with new clearing occurred close existing development. The next largest category of loss, representing 26 percent, was associated with new development that was not present in the 2002 aerial photograph, but visible in aerial photographs from later years development replaced previously existing trees. Approximately eight percent of the tree loss occurred within landslides along steeper bluffs. While landslides are classified as considered to be a natural cause of tree loss, it is possible that the rate of land sliding has been affected by upslope development patterns.

King County National Flood Insurance Program Biological Opinion . Compliance Submittal and Programmatic Habitat Assessment
3‐61
Figure 3-1. Extent of trees adjacent to and density of trees along the marine shorelines of WRIA 9 in 2009.

King County National Flood Insurance Program Biological Opinion . Compliance Submittal and Programmatic Habitat Assessment
3‐62
Figure 3-2. Extent of the changes in vegetation found along the marine shoreline between 2002 and 2009.

King County National Flood Insurance Program Biological Opinion . Compliance Submittal and Programmatic Habitat Assessment
3‐63
Table 3-6. Causes of tree loss along marine shorelines of WRIA 9.
Cause of Loss Feet Percent
Natural—landslides* 479 8.07%
Clearing—new house/road 1,550 26.11%
Clearing—existing house 3,777 63.63%
Clearing—reason unclear 130 2.19%
total 5,936 100% *Landslides may have been caused or exacerbated by upland development patterns.
The trajectory of the overall condition of marine riparian vegetation is downward. Loss of vegetation has occurred throughout WRIA 9, but is predominately occurring on Vashon and Maury Islands. Very few marine riparian restoration projects have been undertaken to date. Recent shoreline restoration projects have incorporated replanting into their projects, but at least half of these projects will not provide complete riparian revegetation due to site constraints. Given the current trajectory of losses occurring throughout the marine shorelines of WRIA 9 and the relative dearth of riparian restoration projects, the downward trend in vegetative conditions along marine shorelines is expected to continue at least in the near future. It should be noted that these data represent changes in shoreline conditions that occurred several years prior to adoption of the WRIA 9 salmon recovery plan in 2005. In reviewing some of the larger clearings that occurred during new development, at least one of the larger clearings occurred in 2008, well after King County had adopted its Critical Area Ordinance (CAO), but the permits for this project were vested prior to adoption of the CAO, and clearing around the new house occurred over a period of time. Thus, some of the loss of trees that occurred prior to implementation of the WRIA 9 plan may represent permitting conditions in place prior to plan adoption.
Large Woody Debris10 Approximately 64 percent of the shoreline within WRIA 9 had no accumulations of large wood. Of the 36 percent of the shoreline with wood accumulations, drift logs and large woody debris (LWD) were identified along 21 percent and 15 percent of the WRIA 9 shoreline, respectively. Much of the LWD identified along the shoreline of WRIA 9 are on Vashon and Maury Islands. Large woody debris accumulations were identified along 23 percent of the islands’ shoreline, whereas only four percent of the mainland shoreline had LWD. Drift log accumulations on the islands and the mainland were nearly identical (21 percent and 22 percent, respectively).
Marine shoreline armoring11 Shoreline armoring in the marine environment has increased in some areas while decreasing in others. Figure 3-6shows the percentages of three shoreline categories in 2009: armored, new shoreline armored, and accretion shoreform-armored. Overall, there was a small decrease in the amount of shoreline armoring between 2004 and 2009 (Table 3-7). At 51 miles, the Vashon-Maury shoreline is the longest marine shoreline in WRIA 9, and the only one outside of the Urban Growth Area (UGA). Thus, it is not surprising that it has by far the highest percentage (52 percent) of unarmored shoreline in WRIA 9. As shown in Figure 3-4, there has been only a small net gain (48 feet) shoreline armoring occurred since the WRIA 9
10 Text in this Large Woody Debris section is largely extracted from Higgins et al. (2005). 11 Text in this Marine Shoreline Armoring section is drawn from Latterell et al. (2011).

King County National Flood Insurance Program Biological Opinion . Compliance Submittal and Programmatic Habitat Assessment
3‐64
salmon recovery was adopted in 2005, but net gain would have been much greater were it not for removal of armoring along approximately 418 linear feet of shoreline armoring due to habitat restoration and mitigation projects. At least one new permitted bulkhead was constructed along 150 linear feet of the shoreline shortly after the plan was adopted; it is unclear whether the construction of armoring along two other newly armored bank lines was permitted. Table 3-7. Comparison of the amount of marine shoreline armoring occurring between 2004 and 2009 on Vashon-Maury Island.
2004 2009 Total
shoreline length
(feet) Unarmore
d (feet) Unarmore
d (%)Armored
(feet)Armored
(%)
Change in
Armoring (feet)
Change in
Armoring (%)
270,020 139,974 52 130,163 48 -76 48
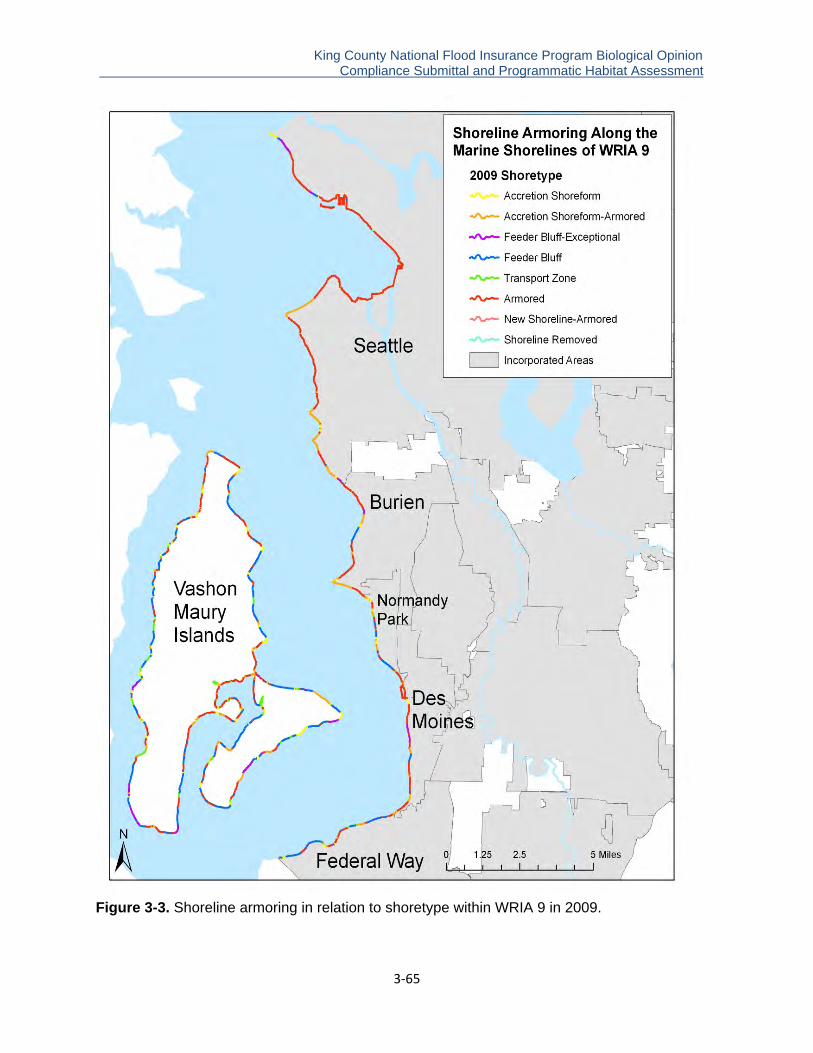
King County National Flood Insurance Program Biological Opinion . Compliance Submittal and Programmatic Habitat Assessment
3‐65
Figure 3-3. Shoreline armoring in relation to shoretype within WRIA 9 in 2009.

King County National Flood Insurance Program Biological Opinion . Compliance Submittal and Programmatic Habitat Assessment
3‐66
Figure 3-4. Locations showing increases and decreases in marine shoreline armoring within WRIA 9 (Given the small size of the actual amounts the increases and decreases, a larger point was used to represent the locations).
King County National Flood Insurance Program Biological Opinion . Compliance Submittal and Programmatic Habitat Assessment
3‐67
In the marine environment the shoreline habitat condition trajectory in shoreline condition is mixed, with removal of existing armoring barely keeping pace with new armoring. Relatively few shoreline armoring removal projects have been conducted to date, with the Seahurst Park bulkhead removal making up the majority of the armoring removed. Land use is dramatically different along most of the armored marine shoreline compared to land uses along freshwater shorelines within WIRA 9. While the armored banks of the Green River are composed mostly of industrial, commercial and agricultural upland uses, the dominant land use along the marine shoreline is single-family residential use. Finding landowners willing to allow bulkhead removal is challenging, and for this reason most of the removals have occurred on public lands. In contrast, new shoreline armoring has occurred almost entirely on private property in association with existing development, rather than in association with new building construction. Several areas of new armoring entailed relatively minor extensions of existing bulkheads, although new bulkheads have been built along the full length of several lots. In addition, several new bulkheads along Vashon and Maury Islands do not appear to have been permitted by regulatory agencies.
Summary12 Spatial overlap between wood accumulations and shoreline armoring revealed patterns similar to those identified for marine shoreline vegetation and shoreline armoring. Almost 90 percent of the armored shorelines had no drift log or LWD accumulations. In comparison, only 78 percent of unarmored shorelines had drift log or LWD accumulations. Only 1.1 percent of the armored shorelines had LWD accumulations, compared to 62.2 percent of the unarmored shorelines where LWD accumulations were present. Just over 10 percent of the armored shorelines had drift log accumulations, compared to 40 percent of the unarmored shorelines where drift logs were present. This delineation of shoreline features in WRIA 9 indicates that areas with shoreline armoring often have different marine riparian vegetation and wood accumulations than unarmored areas. Frequently, when shoreline properties were developed for residential or industrial purposes, vegetation was cleared and armoring was built to provide maximize development area and waterfront views, and the presence of built structures precludes future revegetation. In the case of LWD accumulations, and in many cases of drift log accumulations, armoring itself appears to be the primary cause of the differences seen in the shorelines with and without armoring. Along the marine shorelines of WRIA 9 bank armoring is frequently located at or below the ordinary high water mark in locations where drift logs or LWD would normally accumulate. In essence, armoring has cut off the backshore from interacting with the intertidal area, creating areas that are unable to retain drift logs and accumulations of LWD. While these data document physical and structural changes that have occurred to the shoreline through development and concurrent armoring, it is not clear what the biological responses to these changes have occurred. Williams et al. (2001) suggested that marine riparian areas provide the following ecological functions within marine nearshore areas: water quality protection, bank stability, wildlife habitat, maintenance of unique microclimates, shade, nutrient inputs, and LWD recruitment to the nearshore. These data also suggest that LWD and drift logs provide nutrient input; refuge, nesting and foraging opportunities for fish and wildlife; beach stabilization, as well as support growth of riparian vegetation.
12 Much of the text in this summary section is largely extracted from Higgins et al. (2005).

King County National Flood Insurance Program Biological Opinion . Compliance Submittal and Programmatic Habitat Assessment
3‐68
Several other studies have tied nearshore abundance and areal extent of LWD and riparian vegetation along natural and armored bank lines in Puget Sound. Sobocinski (2003) showed that unarmored beaches had higher densities of beach hoppers (Talitridae) and insects. Toft (2005) found similar results with an armored site having overall lower densities in riparian insects compared to an adjacent unarmored site. Toft et al. (2004) found that unarmored sites had over twice as much terrestrial riparian prey items in Chinook diets as armored sites (due to lower amounts of riparian vegetation). Holsman and Willig (2007) took aerial photographs during low altitude aerial surveys of nearshore beaches in WRIA 9 in 2006 to examine relationships between bank armoring, marine riparian vegetation and woody debris within 100 feet of the shoreline. They found that unarmored, natural saltwater shorelines within King County appear to have significantly more LWD and are lined with more trees and natural vegetation than armored shorelines. In addition, they found that the shoreline near every house visible in the aerial photographs they took of the study area was reinforced with vertical bulkheads or riprap, while all houses that occurred along natural shorelines were set back from the beach.
Marine Sediment13 Marine shorelines are broken into discreet reaches of shoreline based on how sediment moves along the shore (Figure 3-5). A drift cell, or drift sector, is a unique section of shoreline where the net direction of sediment transport over the course of a year is in one direction. A drift cell typically begins at a feeder bluff or some form of sediment source and ends with some form of accretion area. It can be thought of as a very slow river of sand and gravel moving along the shoreline. The availability of sediment sources and the ability for it to move along the shoreline unobstructed is likely one of the most important physical process in the marine nearshore environment because it is related to many aspects of shoreline habitat. Sediment processes drives benthic food availability and type, forage fish spawning habitats, survival of submerged aquatic vegetation (eelgrass) beds, and enhance rearing/shallow water habitats within salmonid migration corridors, as well as provide natural storm protection to the built environment. Metric There are no quantitative data available on drift cells that can be used to assess how much sediment is needed in order to sustain properly functioning conditions in nearshore habitat. Given the variability of drift cells, it is likely that each drift cell requires a different amount sediment in order to function properly. Since there is no accepted direct metric that can be used to assess the amount of sediment drift cells need to support properly functioning habitat conditions, the intactness of drift cell sediment sources (expressed as a percentage of the linear extent of each drift cell source) was broken into five categories to represent varying levels of drift cell sediment source degradation. These categories are: 100 percent intact, 50 to 99 percent intact, 25 percent to 49 percent intact, 5 to 24 percent intact, and 0 to 4 percent intact. Throughout this section any reference to the percent of sediment sources refers to the linear extent of a sediment source, and does not address differences in volume between different bluffs. It should be noted that the following discussion does not include quantitative evaluation of impacts of drift cell sediment sources on nearshore habitat, as that level of analysis was beyond the scope of this study.
13 Text in this Marine Sediment section is derived from excerpts from Latterell et al. (2011).
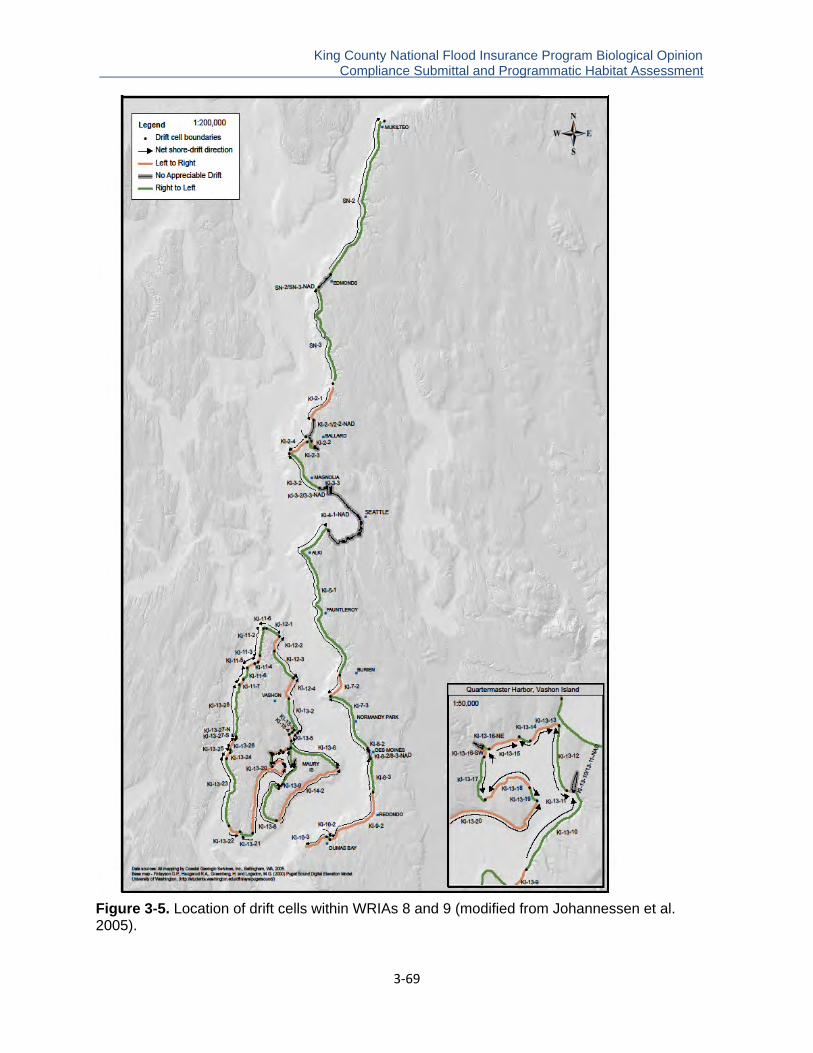
King County National Flood Insurance Program Biological Opinion . Compliance Submittal and Programmatic Habitat Assessment
3‐69
Figure 3-5. Location of drift cells within WRIAs 8 and 9 (modified from Johannessen et al. 2005).
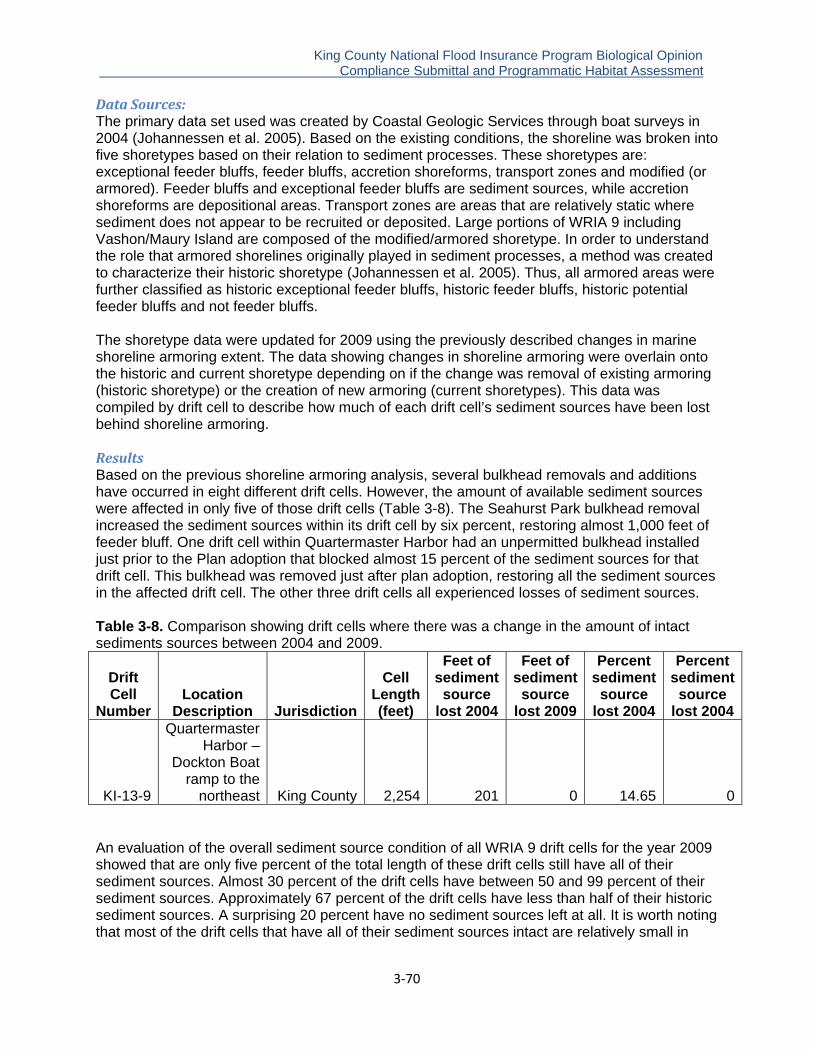
King County National Flood Insurance Program Biological Opinion . Compliance Submittal and Programmatic Habitat Assessment
3‐70
Data Sources: The primary data set used was created by Coastal Geologic Services through boat surveys in 2004 (Johannessen et al. 2005). Based on the existing conditions, the shoreline was broken into five shoretypes based on their relation to sediment processes. These shoretypes are: exceptional feeder bluffs, feeder bluffs, accretion shoreforms, transport zones and modified (or armored). Feeder bluffs and exceptional feeder bluffs are sediment sources, while accretion shoreforms are depositional areas. Transport zones are areas that are relatively static where sediment does not appear to be recruited or deposited. Large portions of WRIA 9 including Vashon/Maury Island are composed of the modified/armored shoretype. In order to understand the role that armored shorelines originally played in sediment processes, a method was created to characterize their historic shoretype (Johannessen et al. 2005). Thus, all armored areas were further classified as historic exceptional feeder bluffs, historic feeder bluffs, historic potential feeder bluffs and not feeder bluffs. The shoretype data were updated for 2009 using the previously described changes in marine shoreline armoring extent. The data showing changes in shoreline armoring were overlain onto the historic and current shoretype depending on if the change was removal of existing armoring (historic shoretype) or the creation of new armoring (current shoretypes). This data was compiled by drift cell to describe how much of each drift cell’s sediment sources have been lost behind shoreline armoring. Results Based on the previous shoreline armoring analysis, several bulkhead removals and additions have occurred in eight different drift cells. However, the amount of available sediment sources were affected in only five of those drift cells (Table 3-8). The Seahurst Park bulkhead removal increased the sediment sources within its drift cell by six percent, restoring almost 1,000 feet of feeder bluff. One drift cell within Quartermaster Harbor had an unpermitted bulkhead installed just prior to the Plan adoption that blocked almost 15 percent of the sediment sources for that drift cell. This bulkhead was removed just after plan adoption, restoring all the sediment sources in the affected drift cell. The other three drift cells all experienced losses of sediment sources. Table 3-8. Comparison showing drift cells where there was a change in the amount of intact sediments sources between 2004 and 2009.
Drift Cell
Number Location
Description Jurisdiction
Cell Length (feet)
Feet of sediment
source lost 2004
Feet of sediment
source lost 2009
Percent sediment
source lost 2004
Percent sediment
source lost 2004
KI-13-9
Quartermaster Harbor –
Dockton Boat ramp to the
northeast King County 2,254 201 0 14.65 0
An evaluation of the overall sediment source condition of all WRIA 9 drift cells for the year 2009 showed that are only five percent of the total length of these drift cells still have all of their sediment sources. Almost 30 percent of the drift cells have between 50 and 99 percent of their sediment sources. Approximately 67 percent of the drift cells have less than half of their historic sediment sources. A surprising 20 percent have no sediment sources left at all. It is worth noting that most of the drift cells that have all of their sediment sources intact are relatively small in

King County National Flood Insurance Program Biological Opinion . Compliance Submittal and Programmatic Habitat Assessment
3‐71
comparison to the rest of the drift cells within WRIA 9. Finding long reaches of shoreline where the sediment sources are entirely intact is rare. An examination of the spatial pattern of intact drift cell sediment sources revealed that none of the drift cells along the mainland shoreline north of Federal Way have more than 50 percent of their sediment sources (Figure 3-6). Given the level of shoreline armoring described earlier, this is not surprising. The north end of Vashon Island and Quartermaster Harbor’s are also composed primarily of cells with less than 50 percent of their sediment sources. The drift cells along Federal Way and the eastern and western portions of Vashon Island are mostly intact. The Colvos side of Vashon Island has the longest contiguous reach approximately 10 linear miles) of drift cells with more than 50 percent of their sediment sources. The pattern of intactness generally follows the land use development pattern, with more developed areas having less intact sediment sources.

King County National Flood Insurance Program Biological Opinion . Compliance Submittal and Programmatic Habitat Assessment
3‐72
Figure 3-6. The percent of intact sediment sources within drift cells of WRIA 9.

King County National Flood Insurance Program Biological Opinion . Compliance Submittal and Programmatic Habitat Assessment
3‐73
Drift Cells in More Detail14 East Maury Island The East Maury Island subarea is comprised of two drift cells that converge at Point Robinson from the south and north shorelines of Maury Island. In the southern portion of the subarea, there are steep bluffs and the shoreline is generally armored where there are residences atop the bluffs. The central portion of the south shoreline near Sandy Shores contains unarmored steep bluffs with immature trees, and the northern portion of the south shoreline near Gold Beach contains a dense cluster of houses, typically with an armored shoreline and almost no riparian vegetation. There is also an active feeder bluff in this area that has little armoring and immature vegetation. There are four apparent derelict piers in the intertidal zone of the central portion of the south shoreline, including the pier at Sandy Shores. North of Point Robinson, there are long stretches of unarmored shoreline with mature vegetation and houses along the top of the bluff. Similar to other locations in the project area, the potential long‐term stability of these houses is in question, and policy‐level decisions will need to be made regarding their rebuilding in the context of the nearby eroding bluffs. This area also contains one stretch of shoreline with residential armoring, wide areas of shallow water, and a series of short groins. Dockton Road flanks the westernmost portion of the north shoreline near Portage and a seawall is present that supports the road. There are no WDFW documented salmon streams in this subarea (WDFW 2002). The strength of this subarea lies in its intact riparian habitats and areas of feeder bluffs along the shoreline. Thus, habitat goals for this subarea include extending this habitat as far as possible by restoring sediment delivery and rehabilitating sediment transport processes in areas where the processes have been altered. East Vashon Island The East Vashon Island subarea contains three drift cells that span almost the entire east shoreline of the island, two of which converge on Point Beals, and one of which extends from Ellisport south past Point Heyer to Portage. The northernmost section of the subarea has alternating stretches of unarmored areas with native vegetation and areas of single rows of residences that are armored and have little vegetation. The drift cells converging on Point Beals exhibit large areas of unarmored shoreline with intact riparian vegetation, despite the numerous houses. The drift cell to the north of Point Heyer, which feeds sediment to the point, is comprised of extensive feeder bluffs that are unarmored and have intact native riparian vegetation. The houses present in the area of Point Heyer are in a single row along the shore, each with a bulkhead. Also, the Point Heyer area contains a large and relatively intact lagoon and marsh complex with a large radio tower (KVI tower) on the point. The access road to the KVI tower extends over the lagoon entrance. There are no WDFW documented salmon streams in this subarea (WDFW 2002). Because this subarea contains two points, Point Heyer and Point Beals, that depend on sediment transport, maintaining longshore sediment supply is crucial to maintaining these habitat features, particularly the lagoon at Point Heyer and the important low‐energy refuge
14 Text in this Drift Cells in More Detail section is extracted nearly verbatim in excerpts from Anchor Environmental, L.L.C. (2006).
King County National Flood Insurance Program Biological Opinion . Compliance Submittal and Programmatic Habitat Assessment
3‐74
habitat it provides. Thus, key habitat needs in this subarea are to conserve sediment sources and to recover lost riparian function along the shore between these features. North Vashon Island The North Vashon Island subarea contains five small drift cells wrapping around the northern tip of the island and continuing south down the western island shore. Much of its shoreline perimeter is configured with houses at the base of bluffs with armoring in front, and houses atop the bluff as well. Typically, there is some vegetation below the bluff top houses and above the houses at the base of bluffs, but in general, the subarea is nearly entirely armored with houses and bulkheads along the north face of the island extending south to the Vashon Ferry Terminal. Also, there is a long row of effective residential groins along the northern stretch of shore from Fern Cove to Point Vashon. Despite its armored state, the subarea also exhibits an unusually wide riparian corridor compared to other parts of the project area. This is a unique attribute of this area, and it is desirable to preserve this corridor to maintain the integrity of the canopy and the source for LWD to the shore. This subarea contains the second largest watershed on the islands, Shinglemill Creek. WDFW has documented that the creek supports anadromous salmonids (WDFW 2002). The creek’s outlet is unarmored and there is a large marsh adjacent to the creek. South of the creek, much of the shoreline is armored but there is much mature riparian vegetation. Several other smaller tributaries occur in this subarea. The subarea also contains several points and shoreline protrusions, some with large marshes and low energy refuge areas, as is the case with Peter Point. Because of its proximity to Shinglemill Creek and other salmon streams, the North Vashon Island subarea is important for its low energy and shaded habitats. Maintaining these habitats for feeding and migrating juveniles is a key need in this area, especially near the creek mouths and points with marsh vegetation. Also, given the residential buildout of the shoreline and the number of bulkheads here, the value of protecting and increasing the amount of unarmored habitat is significant. West Vashon Island The subarea covering western Vashon Island includes a series of mostly large drift cells that converge on the Sandford Point and Tahlequah areas; a northern drift cell extends from just north of Lisabuela to just north of Sunset Beach. This subarea is characterized by long stretches of unarmored feeder bluffs with extensive marine riparian vegetation, with concentrations of houses along the shoreline that have armoring and little vegetation. Along the subarea, in various places, there are several small stream mouths that are unarmored and well‐vegetated. Christenson Creek, which flows into Puget Sound just south of Lisabuela in the central portion of the subarea, is one of only three documented salmon streams on the islands (WDFW 2002). However, other creeks in this subarea may be periodically utilized by salmon and the creek mouths of all tributaries, particularly those that are not in pipes, may be utilized by juvenile salmon migrating and rearing in the nearshore. In the southwest side of the subarea, there is a long stretch of relatively unaltered habitat that may be the longest stretch like this in the project area, but nearing the Tahlequah Ferry Terminal, armoring is nearly continuous along the south shoreline of the island. Habitat quality is relatively high within a subarea with long drift cells. Thus, key needs for this area are to conserve the unarmored and vegetated quality of the shoreline, both for sediment
King County National Flood Insurance Program Biological Opinion . Compliance Submittal and Programmatic Habitat Assessment
3‐75
transport and for migratory corridors. Additionally, goals are to protect the existing tributary mouths for salmon use and feeding opportunities. West Quartermaster Harbor The West Quartermaster Harbor subarea is composed of one long drift cell extending from Neill Point to Camp Burton inside west Quartermaster Harbor. This area has extensive feeder bluffs with few houses and mature riparian vegetation, although the houses present do have armored shorelines. To the north, this area transitions to a long section of shoreline with houses one to two rows deep along the shoreline; in this area, riparian vegetation is present, but it is separated from the shore by the houses. There are several roads along the shoreline in various sections as the shore turns to an east/west direction, with more residential development. Approaching Magnolia Beach from the south, there is a long, shallow, flat shoreline with some small freshwater sources, but the main creek in the subarea is Fisher Creek, which contains a marsh at Magnolia Beach that extends through the front yard of the houses. This stream drains into a wide delta with dendritic intertidal channels. There is a very large, intact marsh at Camp Burton that includes LWD accumulations. Pacific herring have been documented as spawning along the entire shoreline of this subarea and the southernmost portion is adjacent to an identified herring holding area (WDFW 2003). There are no WDFW documented salmon streams in this subarea (WDFW 2002). The strength of habitat in this area is in its long, wide, flat, well‐vegetated riparian areas with small tributary mouths, and large lagoons. One key need with regard to this habitat is to improve the mouth of Fisher Creek to expand the marsh habitat to take full advantage of the refuge and feeding opportunities there. With its importance for herring holding and spawning, the subarea’s extensive flat beaches should not be overlooked. Thus, sediment supply to this area should be conserved, protected, and restored, and riparian vegetative cover should remain at a premium here. Inner Quartermaster Harbor The subarea at inner Quartermaster Harbor includes several drift cells extending into and out of the harbor. It is the most highly developed area on Vashon Island; this area includes the marina inside the harbor. The harbor has areas of fragmented habitat function overall, depending on individual residential choices for planting or removing riparian vegetation and installing docks. Generally, the entire shore of this subarea is armored. The Judd Creek watershed is the largest watershed on the islands and flows into Quartermaster Harbor in this subarea. It is a documented salmon stream and is the only stream in the project area other than the Green/Duwamish River with documented Chinook utilization (WDFW 2002). The mouth of Judd Creek is armored and there is little riparian vegetation along the creek delta. Other creeks in the subarea may be periodically utilized by salmon if accessible and the creek mouths of all tributaries, particularly those that are not in pipes, may be utilized by juvenile salmon migrating and rearing in the nearshore. The subarea contains Raab’s Lagoon, which exhibits a small creek and an armored berm that partially disconnects the lagoon from the bay. Habitat needs in this subarea include conserving and restoring the tributary mouths and lagoon, which have been subject to development along the borders. Restoring riparian vegetation where possible in this entire area is important to maintain and sustain the herring spawning here. In addition, low‐energy habitats offered by the tributary mouths and lagoon could be greatly improved to offer highly functioning juvenile salmonid feeding habitat.
King County National Flood Insurance Program Biological Opinion . Compliance Submittal and Programmatic Habitat Assessment
3‐76
East Quartermaster Harbor The East Quartermaster Harbor subarea has two drift cells that both extend northward toward Quartermaster Harbor from Piner Point. The southern portion of the East Quartermaster Harbor subarea has a wide flat with extensive, unarmored feeder bluffs. Further north, there is a single row of houses lining the shore with armoring in front of each. The subarea also contains significant shoreline structures, including a small marina at Dockton Park with a fish processing house connected to the pier, and a former cannery with derelict overwater structure, derelict piling, and shoreline rubble. This area is an important herring spawning area, and like the rest of Quartermaster Harbor, it is adjacent to an identified herring holding area that has been documented in the area approximately between Neill Point on Vashon Island and Piner Point on Maury Island out into Puget Sound (WDFW 2003). There are no WDFW documented salmon streams in this subarea (WDFW 2002). In this subarea, sediment supply is of foremost importance to conserve the extensive and important herring spawning areas in and around Quartermaster Harbor. Feeder bluffs need to be conserved and longshore transport south of the point at Dockton should be restored to maintain sediment supply to the harbor. Remnant overwater structures should be removed to maintain the migratory corridor and allow for rehabilitation of riparian vegetation. Salmonid Use of the Nearshore Environment15 The saltwater habitats used by anadromous salmonids in WRIAs 8 and 9 provide a critical component of their life histories (Simenstad et al. 1991; Thom 1987). All anadromous salmonids use nearshore and estuarine habitats during adult spawning migrations and for juvenile migration and rearing to some extent, but Chinook, chum, pink, and cutthroat use these habitats more than others do. In fact, ocean-type Chinook originating in WRIAs 8 and 9 are the most estuarine-dependent salmonid in the scope of this report, with chum as second. A substantial number of young salmon enter and pass through estuaries and the nearshore environment between early March and late June. These dates vary substantially depending on the species, location, and inter-annual differences. For example, recent beach seining studies found juvenile salmonids in the WRIA 8 and 9 nearshore through August (King County unpublished data). Depending on the species and life stage (fry or smolt), there is also wide variability in the duration of occurrence in the nearshore (Weitkamp 2001). Fry and juvenile salmonids enter estuaries primarily at night (MacDonald 1960; Davis 1981). Estuaries provide a wide variety of habitat characteristics. Juvenile salmonids are present in many different estuaries with a diverse range of biological and physical conditions. This is an indication that juvenile salmonids are adaptable to a wide range of habitats. It is important to distinguish, however, where salmonids occur in nearshore environments versus those habitat features upon which they are dependent upon it for a fundamental function/period of their life history. Juvenile salmonids use both constructed and natural habitats that appear to be meeting their needs. The extent to which constructed habitat characteristics can be modified and critical natural habitat can be preserved to better meet salmonid needs remains difficult to determine. An excellent literature review of the roles that a variety of estuarine habitats provide for many species of juvenile salmon is summarized in Weitkamp (2001). 15 Text in this Salmonid Use of the Nearshore Environment section is extracted nearly verbatim in excerpts from Williams et al. (2001).
King County National Flood Insurance Program Biological Opinion . Compliance Submittal and Programmatic Habitat Assessment
3‐77
Five species of juvenile salmon reside in nearshore ecosystems in Puget Sound, and their utilization of nearshore habitats is critical to their viability, persistence and abundance. Use of nearshore ecosystems varies considerably between and within species. Juvenile Chinook and chum salmon nearshore habitats more extensively than other salmonid species (Fresh 2006). Residence migration timing from riverine deltas and estuaries into Puget Sound habitats are a function of several factors including fish size, length of time spent in estuarine habitat, and possibly water temperature. Chinook abundance peaks in June and continues through at least October (Fresh 2006). Smaller fish tend to prefer low-gradient, shallow water with fine-grained substrates (silts and mud), low salinity, and low wave energy. As they grow, Chinook salmon venture farther from the shoreline and use a greater diversity of habitat including deeper, more offshore habitats before they depart for feeding grounds in the ocean (Fresh 2006). Less is known about nearshore use by chum salmon, but some fry migrate directly from estuaries of their natal streams into the sound, while rear for weeks in estuaries before moving into nearshore habitats (Fresh 2006). Chum salmon abundance in nearshore areas peaks in May and June. Juvenile chum abundance peaks in June and declines thereafter as most of these fish move farther offshore and migrate into the ocean, although some chum linger in nearshore areas through October (Fresh 2006). Many investigations show two or more species together in the same habitat. Each species, however, exhibits tendencies that separate it from others to some degree. Smaller fish tend to use shallower water than larger fish (Bisson et al. 1998). Chinook, chum, and pink salmon are found within two to three meters of the water’s surface (MacDonald et al. 1987), and can be either along shallow shorelines or over deeper water along the face of piers or naturally steep shorelines (Kask and Parker 1972). Migratory behavior is very size-structured and most juvenile salmon <55-65 mm (fork length) preferentially select shallow water unless they have no option, such as when confronted with a pier apron or docks. Larger fish are much less confined to shallow water. An excellent review of this is found in Simenstad et al. (1999). Young salmon tend to resist large changes in light intensity during migration. Changes to ambient underwater light environments pose a risk of altering fish migration behavior and increasing mortality risks (Nightingale and Simenstad 2001). Studies in the Puget Sound region have suggested that shade-induced light changes could result in the following behavioral changes: (1) migration delays due to disorientation; (2) loss of schooling in refugia due to fish school dispersal under light-limited conditions; and (3) increased size-selective predation risk due to changes in migratory routes to deeper waters to avoid light changes (Nightingale and Simenstad 2001). While in the nearshore, salmonids, as a group, prey on an array of benthic, epibenthic, and pelagic organisms. The prey species vary depending on the estuarine or nearshore habitat type and the size and species of the fish. Irrespective of the variation in quantity, quality, and timing of organic matter contributing to the food web, evidence indicates that individual stocks and life history stages of juvenile salmonids focus their foraging on certain types, species and life history stages of prey taxa. There is evidence that the densities of certain prey taxa play an important role in determining residence time and growth of salmonid stocks (Wissmar and Simenstad 1998; Simenstad and Salo 1982). Returning adult salmon and some resident stocks (cutthroat and bull trout) use nearshore habitats as foraging areas where they feed on baitfish (forage fish) such as Pacific herring (Clupea harengus pallasi), surf smelt (Hypomesus pretiosus), and sand lance (Ammodytes hexapterus) (Penttila 1995; Brodeur 1990; Fresh et al. 1981). Adult salmon may delay their
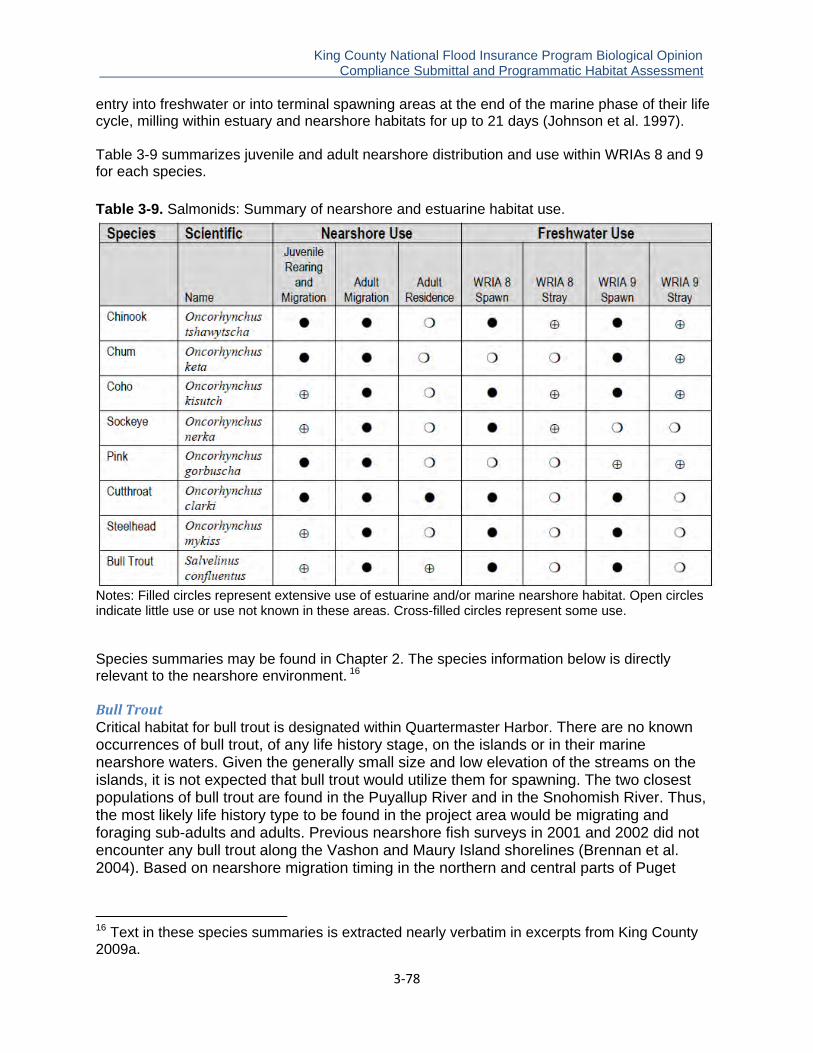
King County National Flood Insurance Program Biological Opinion . Compliance Submittal and Programmatic Habitat Assessment
3‐78
entry into freshwater or into terminal spawning areas at the end of the marine phase of their life cycle, milling within estuary and nearshore habitats for up to 21 days (Johnson et al. 1997). Table 3-9 summarizes juvenile and adult nearshore distribution and use within WRIAs 8 and 9 for each species.
Table 3-9. Salmonids: Summary of nearshore and estuarine habitat use.
Notes: Filled circles represent extensive use of estuarine and/or marine nearshore habitat. Open circles indicate little use or use not known in these areas. Cross-filled circles represent some use.
Species summaries may be found in Chapter 2. The species information below is directly relevant to the nearshore environment. 16
Bull Trout Critical habitat for bull trout is designated within Quartermaster Harbor. There are no known occurrences of bull trout, of any life history stage, on the islands or in their marine nearshore waters. Given the generally small size and low elevation of the streams on the islands, it is not expected that bull trout would utilize them for spawning. The two closest populations of bull trout are found in the Puyallup River and in the Snohomish River. Thus, the most likely life history type to be found in the project area would be migrating and foraging sub-adults and adults. Previous nearshore fish surveys in 2001 and 2002 did not encounter any bull trout along the Vashon and Maury Island shorelines (Brennan et al. 2004). Based on nearshore migration timing in the northern and central parts of Puget
16 Text in these species summaries is extracted nearly verbatim in excerpts from King County 2009a.

King County National Flood Insurance Program Biological Opinion . Compliance Submittal and Programmatic Habitat Assessment
3‐79
Sound, if they were present, one would expect bull trout to be present in the marine waters between March and July (Goetz et al. 2004). Chinook Adult and sub-adult Chinook salmon generally would be found in the deeper marine waters but are sometimes found along the shorelines. Beach seine sampling along Maury Island at dusk on October 9, 2001, yielded over 20 sub-adults close to shore. Sub-adults are likely to be found in the deeper waters throughout the year. Adults are likely to be found migrating through the project area between July and October. The two closest populations of adult Chinook are from the Green and Puyallup Rivers, 24.3 km (15.1miles) and 21.3 km (13.25 miles) away, respectively. Juvenile Chinook salmon are known to occur within the project area throughout much of the year. Sampling of the marine nearshore environments of Vashon and Maury Islands and mainland portions of WRIA 9 in 2001 and 2002 showed that juvenile Chinook (subyearlings) can be found in the nearshore primarily from April through December. While juveniles were found throughout most of the year, the peak abundance of juvenile Chinook was in June of both years. Sampling at KVI beach, approximately 0.5 miles to the east of the project area, produced over 170 juvenile Chinook salmon for both years combined. Recovery of coded wire tags showed that juveniles from many stocks use the nearshore near the project area. These stocks included juveniles from the Green River, Puyallup River, White River, Skykomish River, and Nisqually River. The same sampling showed that the diet of juvenile Chinook changes throughout the year dependent on what is available and on size of the fish. Smaller fish eat a variety of benthic worms and planktonic organisms. They also rely heavily on terrestrial insects, on average over 50 percent of the organisms in their diet being terrestrial insects (Brennan et al. 2004). As part of the designation of critical habitat, NMFS (2005) has defined specific primary constituent elements (PCEs) for Chinook salmon. These are elements that are essential to the conservation of the species. The project area includes the following PCEs: Nearshore marine areas free of obstruction with water quality and quantity conditions and forage, including aquatic invertebrates and fishes, supporting growth and maturation; and natural cover such as submerged and overhanging large wood, aquatic vegetation, large rocks and boulders, and side channels. Steelhead Steelhead trout are known to be present in marine nearshore waters in at least small numbers. Sampling of the marine nearshore environments of WRIAs 8 and 9 in 2001 and 2002 caught only nine juvenile steelhead trout (Brennan et al. 2004), with one of those nine fish captured a half mile from the project area. Given the small numbers of fish captured in this study and similar studies, juvenile use and timing of their presence in the marine nearshore is unknown, but likely limited. The occurrence and timing of adult steelhead in the marine nearshore waters around Vashon Island is relatively unknown. In Puget Sound, there are two major life history forms of steelhead: summer and winter that are based on when they return to their natal rivers. They are known to migrate near the shore in northern Puget Sound, but this pattern has not been seen in other parts of Puget Sound. Steelhead and/or rainbow trout have been found in both Judd and Shinglemill Creeks in the past (see freshwater section).

King County National Flood Insurance Program Biological Opinion . Compliance Submittal and Programmatic Habitat Assessment
3‐80
Essential Fish Habitat The MSA requires proposed projects with a federal nexus to evaluate potential impacts to habitat of commercially managed fish populations (salmon, groundfish, and pelagic fish species). Species include Chinook (discussed above), coho, and pink salmon. All three of these species use the nearshore for juvenile out-migration and rearing where suitable habitat is present. Juvenile coho were found in the highest numbers when sampling started in mid May, indicating they had already begun their outward migration by the time sampling had started (Brennan et al. 2004). Their number quickly declined with much fewer fish being caught into late May and June. Sampling in June of 2006 caught several young of the year coho in both Ellis and Ellisport Creeks, both situated at the northern terminus of the project area (Nelson 2006). Based on out migration timing in the Duwamish River, juvenile coho outmigration starts in early April and goes until the end of June, with the majority leaving in May (King County 2008a). Beauchamp (1986) found that most juvenile coho in the Snohomish River system migrated out from freshwater environments late April through late May, with a peak in mid May. Adult coho salmon return to most rivers and streams to spawn primarily in November and December, thus they can be found in marine nearshore waters from July through October as they migrate to their natal rivers to spawn. There are several streams on Vashon Island that have known spawning of coho salmon, including Mileta and Raab Creeks (Kerwin and Nelson 2000). Forage Fish There are three main species of fish that are characterized as forage fish: Pacific herring, Pacific sand lance, and surf smelt. All three species are an integral part of the food chain within Puget Sound, especially for marine birds, adult salmon, and various marine mammals. They are included in this assessment because of their importance to salmon as well as Southern Resident Killer Whales (SRKWs). Within King County, Pacific herring spawning area is limited to within Quartermaster Harbor and the immediate vicinity (WDNR 2004). The closest spawning site is located on the southern shore of Maury Island, approximately seven miles (along the shore) south of the project. This herring stock generally spawns from January through April. Herring generally spawn on intertidal and subtidal submerged aquatic vegetation. While suitable spawning habitat exists, herring are not known to spawn within the project area; however, they are known to be in the nearshore waters for most of the year. Much less is known about the life history of Pacific sand lance. Sand lance spawn on sandy to gravel beaches from November through February. They spawn in the upper third of the intertidal zone, generally between mean higher high water and about +5 feet in tidal elevation in central Puget Sound or local equivalent (Pentilla 2007). The number of known sand lance spawning beaches increased over the past five years due to a temporary sampling effort by WDFW. However, the spawning habitat within the project is highly degraded by the location of Dockton Road and the riprap bulkhead in front of the road, with only small patches of spawning habitat available (King County unpublished data). No spawning sites for sand lance are known to occur within the Dockton Road project area. The closest site is approximately 2.5 miles to the north, outside of Tramp Harbor. Within Quartermaster Harbor, the closest sand lance spawning beach is on the Burton Peninsula, approximately four miles away. While sand lance spawning sites
King County National Flood Insurance Program Biological Opinion . Compliance Submittal and Programmatic Habitat Assessment
3‐81
have not been found within the project area, sand lance have been caught in small numbers during May through September, immediately adjacent to the project area (Brennan et al. 2004). Surf smelt spawning beaches are more widely distributed around the island than the other two forage fish species. Surf smelt spawn on beaches composed of fine sand to small gravel. They generally spawn higher on the beach than sand lance, from +7 elevation to the extreme high water mark. Within central Puget Sound, surf smelt spawn from October to March, while they spawn year round in other parts of Puget Sound. Surf smelt have been documented at the same location within the project site three times. In December 2000 King County identified surf smelt eggs on the beach in the location of the 2003 repair (as cited in Eastman 2002). WDFW forage fish GIS data also shows that a survey on December 13, 2005, also identified surf smelt eggs in the same location. Sampling on October 20, 2009, also found surf smelt eggs on the same beach. As with sand lance, the spawning habitat available to them throughout the project area has been greatly degraded by the presence of the road and bulkhead for the past 80 years. Southern Resident Killer Whale (SRKW)17 Since 2005 the broad window for endangered SRKW visits to Vashon-Maury Island waters has been from October to March, with most encounters occurring between November and January. Prey samples collected by Mark Sears and NOAA researchers in local waters indicate that the SRKWs are targeting chum and Chinook salmon (American Cetacean Society, Puget Sound Chapter 2008). Southern Resident Killer Whales use all waterways surrounding Vashon and Maury Islands: East Passage, Colvos Pass, Dalco Passage, waters off the north end between Blake and Vashon Islands. Indeed, sometimes the whales circumnavigate the island. Vashon and Maury Islands are the only islands in Central Puget Sound that the whales are known to circumnavigate. They may also circumnavigate Blake Island, but this is as yet undocumented. Since 2004 the Vashon Hydrophone Project’s hydrophone in Colvos Passage has recorded the SRKW at night, in rough seas not conducive to vessel-based research, and at other times when they would have gone undetected (Stateler 2011). Vashon Hydrophone Project recordings made in fall and winter indicate that SRKW forage in Vashon-Maury Island waters day and night, if prey is available. Under certain conditions SRKWs can be seen in East Passage at night. However, without a hydrophone to monitor the east side of Vashon and Maury Islands, it is probable that SRKW nocturnal presence in East Passage goes largely undetected. It is a goal of the Vashon Hydrophone Project to establish a suitable hydrophone site on the east side of Vashon-Maury Island.
Southern Resident Killer Whale visits to Vashon-Maury Island waters have been highly variable. Typically, members of all three pods are seen here, with the notable exception of 2006 when J Pod failed to appear. The Vashon Hydrophone Project (VHP) record is as follows: 2005: 10 confirmed SRKW visits to Vashon and Maury Islands, plus 4 more orca sightings
reported to the Vashon Hydrophone Project in 1/05 that coincided with confirmed Vashon and Maury Islands SRKW sightings on adjacent days, but could not be positively
17 This entire section was extracted from Stateler (2011).
King County National Flood Insurance Program Biological Opinion . Compliance Submittal and Programmatic Habitat Assessment
3‐82
identified by VHP criteria. Transients were in the area around the same time and cannot be ruled out absolutely.
2006: 11 confirmed SRKW visits to Vashon and Maury Islands of K and L Pod members with
no documentation of J Pod; this was extraordinary because J Pod once was the most commonly sighted SRKW pod in Vashon-Maury Island waters.
2007: 21 confirmed SRKW visits (all three pods) to Vashon and Maury Islands, with a
remarkable cluster of 15 encounters and/or recordings of K Pod with some L Pod members between 12/12 and 12/31/07. Presumably, the draw for the SRKW was an abundant Chum run.
2008: 8 confirmed SRKW visits to Vashon and Maury Islands, with an odd distribution of 5 in
1/08 and 3 in 12/08. 2009: 7 confirmed SRKW visits to Vashon and Maury Islands. 2010: 4 confirmed SRKW visits to Vashon and Maury Islands in January, October, and
November, compared with 21 known Transient visits between March and September. 2011 to date: 5 confirmed SRKW visits to Vashon and Maury Islands in February 2011. A
January killer whale sighting reported to the Vashon Hydrophone Project by reliable observers could not be positively identified as SRKWs in accordance with VHP criteria. Again, Transients were in range at the same time.
SRKW behaviors observed and documented in Vashon-Maury Island waters include an extensive repertoire. Many behaviors are associated with socializing and communicating:
Foraging and prey sharing Traveling and porpoising (high-speed travel) Mating and other sexual expression, often between males Resting and logging Milling Spyhopping - rising slowly out of the water until head and flippers are exposed, and then
slowly sinking underwater. Orcas can see well both in and out of water. Orcas spyhop to check for boats or prey and to maintain visual contact with podmates
Percussive behaviors such as tail slapping, breaching, pectoral flipper slapping, cartwheeling, dorsal slapping
Parental care and alloparental care such as babysitting Play (e.g., wake surfing behind container ships, kelping) Grieving the deaths of podmates - deaths elicit a markedly subdued behavioral state in
the SRKW that is unlike anything else observed by Vashon Hydrophone Project associates
Photo-identification of newborn SRKW calves with fetal folds, mostly by Mark Sears but also by other NOAA researchers, strongly suggests birthing occurs in Vashon-Maury Island waters. Over the years, Sears has been the first researcher to document nearly a dozen SRKW fall/winter calves in local waters, particularly in J Pod. A recent discovery was J47 on 1/3/10 in East Passage between Vashon and Maury Islands and Three Tree Point in Normandy Park.

King County National Flood Insurance Program Biological Opinion . Compliance Submittal and Programmatic Habitat Assessment
3‐83
For lack of a more scientific description, SRKWs appear to “celebrate” births. Certain SRKW behavioral cues, such as abrupt, frequent changes in travel direction, alert us to look for newborns in Vashon-Maury Island waters. Births are evidently momentous events in SRKW society–every orca present seeks to touch the new baby, it seems. Southern Resident Killer Whales are intensely matriarchal, and with rare exceptions, neither males nor females disperse from their natal pods. Social bonds of Resident orcas may be the most durable of any species. Transient Killer Whales (TKWs) are a separate population that occurs throughout the eastern North Pacific, and have primarily been observed in waters off the continental coast of the United States and Canada. Transients are federally and Washington State listed as an endangered species, they can appear in Vashon-Maury Island waters at any time. Transient visits to Vashon and Maury Islands increased between 2006 and 2010, culminating in the “Year of the Transient” in 2010 with 21 known visits, and likely more. Transients are cryptic and less vocal than SRKWs and may pass through Vashon-Maury Island waters undetected and, thus be underreported. Transient visits to Vashon and Maury Islands decreased in 2011.
Marine Water Quality18 No waters on Vashon Island were listed on Ecology’s 1998 303(d) list, but the marine waters of Quartermaster Harbor and Puget Sound east of Vashon are on the proposed 2010 list because of exceedences of temperature, bacteria, mercury, pesticides and hydrocarbon contaminants (WDOE 2010b). Water Temperature – Offshore waters Monthly temperature measurements were taken throughout the water column from the surface to just above the seafloor at each offshore station. For offshore stations sampled in 2005, 2006, and 2007, temperatures ranged from 4.6 to 19.5°C (including data from all depths), with the highest temperatures found at or near the surface. The mean temperature between 2005 and 2007 was 10.5°C, which is similar to the mean temperature of 10.7°C in 2004. In 2005 temperatures ranged from 4.9 to 15.6°C (mean = 10.7°C), in 2006 they ranged from 7.4 to 19.5°C (mean = 10.6°C), and in 2007 they ranged from 4.6 to 18.9°C (mean = 10.2°C). For all three years, the warmest temperatures were measured in surface waters in July. In 2006 and 2007, the warmest temperatures were seen at the shallow Quartermaster Harbor stations (NSAJ02 and MSWH01) and in 2005 at station KSBP01. The coldest temperature was also seen in Quartermaster Harbor. Water Temperature – Beach stations Between 2005 and 2007 water temperatures were lower at the Vashon Island station MSJL01, which is influenced by freshwater runoff from Gorsuch Creek. In January 2007 the Burton Acres station (MSXK01) in Quartermaster Harbor had the coldest observed temperature, 4.1°C, when ice was observed floating on the surface in inner Quartermaster Harbor. During the summer months, the two Vashon Island stations generally had the lowest temperatures. Ammonia – Offshore waters Of the nutrients measured by King County, ammonia is the only one with a published criterion for marine water quality, as it can be toxic to marine plants and animals in high concentrations. In marine waters, ammonia can be found at elevated concentrations as a byproduct of sewage 18 Text in the Marine Water Quality section is extracted nearly verbatim in excerpts from King County 2009b.
King County National Flood Insurance Program Biological Opinion . Compliance Submittal and Programmatic Habitat Assessment
3‐84
(both municipal and septic treatment systems), agricultural practices, and lawn fertilization practices in urban areas. Elevated ammonia levels are also seen following large phytoplankton blooms, as ammonia is produced during the decay process. Ecology’s water quality standards for ammonia in marine waters with respect to aquatic organisms are based upon un-ionized ammonia and are less than 0.035 mg/L for long-term effects (chronic) and less than 0.233 mg/L for short-term effects (acute) (WAC, 173-201A, 2003). Ecology cites an EPA document for more specific criteria for total ammonia (which King County measures) based on temperature, salinity, and pH values. Assuming a temperature of 15°C, a salinity of 30 PSS, and a pH of 8.0, the total ammonia chronic criterion is 1.6 mg/L (EPA 1989). Concentrations of ammonia ranged from less than the MDL (0.010 mg/L) in all three years to 0.25 mg/L in 2005, 0.19 mg/L in 2006, and 0.20 mg/L in 2007. As in previous years, the maximum concentration in 2005 was detected at station KSSK02 (West Point outfall) at 55 m. The maximum concentrations in 2006 and 2007 occurred at stations RT625NP (South Plant Outfall) and MSWH01 (Quartermaster Harbor), respectively. The mean concentration for all stations and depths was 0.02 mg/L for all three years. The highest concentrations of ammonia usually occur in the summer and fall months and the lowest concentrations occur in the winter months. Figures 3-25 and 3-26 show the vertical profiles for ammonia concentrations at selected ambient and outfall stations from 2005 to 2007. If any sample result was below the 0.01 mg/L detection limit, a value of 0.01 mg/L was assigned to that result in order to create the figures. The ammonia values in surface waters for the East Passage station (NSEX01) in 2007 are likely due to degradation of phytoplankton, as indicated by high chlorophyll values. Ammonia concentrations from both outfall and ambient offshore stations generally increased with depth, illustrating that uptake is primarily from phytoplankton in the photic zone and lowered uptake and increased excretion by zooplankton is occurring below the photic zone. The highest concentration measured was more than six times lower than the criterion. Ammonia – Offshore stations Ammonia concentrations at beach stations ranged from a minimum of less than MDL (0.010 mg/L) in all three years to 0.050 mg/L in 2005, 0.083 mg/L in 2006, and 0.164 mg/L in 2007. The mean concentrations were 0.019 mg/L, 0.020 mg/L, and 0.027 mg/L in 2005, 2006, and 2007, respectively. The highest concentrations generally occurred during warmer months (May - October), particularly during times when large amounts of decaying seaweed are typical along the shoreline. This was particularly evident in July of 2006 and 2007 when the highest average concentrations were measured. An abundance of the green seaweed Ulva spp. was observed along much of the shoreline in 2006 due in part to climate conditions—warm air temperatures in early spring and summer. Warmer than normal conditions began in April 2006 with exceptionally warm air temperatures occurring in July. July 2006 temperatures were almost four degrees higher than the long-term average which provided optimal growing conditions for seaweed. Although not as warm as in 2006, the first two weeks in July 2007 were warm, including one 98 degree day. Station MSJL01 in the vicinity of the Vashon Treatment Plant, along with station LSKS01, had the highest average ammonia concentrations in 2005. Gorsuch Creek is near station MSJL01 and has a considerable influence on water quality at this site. All measured ammonia concentrations at beach stations were significantly lower than the water quality criterion recommended by the EPA.

King County National Flood Insurance Program Biological Opinion . Compliance Submittal and Programmatic Habitat Assessment
3‐85
Silica – Offshore waters Silica concentrations at offshore stations ranged from less than MDL (<0.050) in both 2005 and 2006 to a maximum of 4.2 mg/L and 5.2 mg/L, respectively. Values ranged from 0.35 to 6.0 mg/L in 2007. Mean concentrations were 2.6 mg/L in 2005, 2.9 mg/L in 2006, and 3.1 mg/L in 2007. The minimum concentrations seen in 2005 and 2006 were unusual as concentrations are rarely below the detection limit. These low values occurred at stations KSBP01 (Point Jefferson) and JSUR01 (Point Wells) in July of 2005 and at stations MSWH01 and NSAJ02 (Quartermaster Harbor) in June of 2006. In both years the <MDL values were measured during the second large phytoplankton bloom of the year. The first bloom of the year occurred in April of both 2005 and 2006, during which nitrate+nitrite levels were depleted to a level at which they could not be detected (<0.020 mg/L). Silica concentrations, however, ranged from 0.18 to 1.75 mg/L, indicating that the spring bloom was nitrogen limited. The phytoplankton blooms during July 2005 and June 2006 were so large that silica likely became the limiting growth factor, rather than nitrogen. Although sufficient nitrate+nitrite levels were available in the water column to sustain the bloom, silica was depleted before nitrogen could become limiting. Low silica values during the summer months are expected when diatoms that use silica for frustule growth are most abundant; however this was the first time that silica concentrations were below the MDL. Aside from the two unusual circumstances mentioned above, a seasonal trend in silica concentrations was observed. Concentrations tended to be lowest in the surface layer during the summer months and highest during the winter months when uptake by phytoplankton was low and freshwater inputs were relatively high. Chlorophylla and Pheophytin Phytoplankton are microscopic photosynthetic plants made up of two major groups, diatoms and dinoflagellates. Chlorophyll-a, the main pigment controlling photosynthesis, is the only pigment that is commonly present in all phytoplankton species, therefore, the amount of chlorophyll present can be used as an indicator of phytoplankton biomass. Chlorophyll can be degraded during natural senescence (die-off) of algal cells and also by grazing by herbivorous zooplankton. One of the degradation products of chlorophyll is pheophytin. Pheophytin is used as an indicator of physiological condition and also the amount of grazing on the phytoplankton. In situ fluorescence measurements (an estimate of chlorophyll-a) were made at all offshore stations throughout the water column. In addition, discrete water samples were collected between 1 and 35 m and analyzed for chlorophyll-a and pheophytin in the laboratory. Discrete samples were not collected below 35 m as enough light does not penetrate to depths below 35 m to allow phytoplankton growth. Results from samples analyzed in the laboratory will be discussed as these tend to be more accurate quantitative measurements of chlorophyll abundance than those measured in situ, particularly when concentrations are high. Between 2005 and 2007 chlorophyll-a values ranged from less than the detection limit to a high of 54.4 μg/L at Station MSWH01 (Quartermaster Harbor) in 2006. Other than the high value at the Quartermaster Harbor station, high values were measured in April of 2005 when large blooms (an accumulation of phytoplankton) were noted at most stations. In general for all three years, the spring bloom in April had the highest chlorophyll concentrations with the June bloom also having high concentrations. These high chlorophyll levels coincided with high oxygen levels in the surface layer produced through photosynthetic activity. It should be noted that samples are only collected monthly and it is possible that some phytoplankton blooms were missed. The length of phytoplankton blooms can vary from a day to
King County National Flood Insurance Program Biological Opinion . Compliance Submittal and Programmatic Habitat Assessment
3‐86
a month, dependent on a variety of factors such as nutrient availability, the amount of tidal exchange, and weather conditions. Strong winds and a large difference between the high and low tides tend to make blooms dissipate rapidly. Even given the sampling limitations, the data indicate several spatial and temporal patterns. Phytoplankton blooms in the southern portion of the Central Basin (East Passage and Quartermaster Harbor) occurred both earlier and later in the year than at other stations. Blooms in East Passage and Quartermaster Harbor occurred as early as March and as late as October. The October 2006 bloom in Quartermaster Harbor was a large bloom, with a chlorophyll-a concentration of 43.5 ug/L at the inner harbor station. The spring bloom in 2005 was evident at all stations and all but one chlorophyll concentration was over 20 ug/L. Blooms in 2005 were captured throughout the spring and summer at most of the stations sampled, whereas no blooms were evident in early spring of 2006, with the exception of the East Passage and Quartermaster Harbor stations. It is likely the spring bloom occurred but was missed with monthly sampling. For all stations, the maximum chlorophyll concentration was not at the surface, but rather a few meters below the surface. The chlorophyll maximum was generally between four to six meters dependent upon the station and weather conditions. Several factors can influence the depth of where maximum chlorophyll concentrations are detected, including photoinhibition and water column stratification. Pheophytin concentrations mirrored the seasonal chlorophyll concentrations, with higher amounts of pheophytin during phytoplankton blooms. Dissolved Oxygen Dissolved oxygen measurements were made throughout the water column from the surface to just above the seafloor at each offshore station. Dissolved oxygen concentrations ranged in 2005 from 4.9 to 15.1 mg/L (mean = 7.5 mg/L), in 2006 from 4.1 to 15.4 mg/L (mean = 7.5 mg/L), and in 2007 from 3.6 to 12.1 mg/L (mean = 7.6 mg/L). The range and mean values observed in 2005, 2006, and 2007 are similar to measurements made in previous years. A DO concentration of 5.0 mg/L is the level at which biological stress may be induced by low dissolved oxygen and areas where DO concentrations are below 5.0 mg/L should be closely examined. DO levels for all offshore stations in 2005 were at or above 5.0 mg/L. The minimum values in 2006 and 2007 (most importantly, the 3.6 mg/L in 2007) were found at stations MSWH01 and NSAJ02, both located in Quartermaster Harbor. These especially low levels of dissolved oxygen are of great concern and are the reason monitoring stations were placed in Quartermaster Harbor. Low levels of DO in this area may be in part due to the shallow depths and the fact that it is a harbor, where flushing and introduction of oxygenated water is limited. Other than the previously mentioned exceptions, minimum dissolved oxygen levels were observed below approximately 50 m in late summer and fall during all three years. This is a result of the seasonal influx of Pacific Ocean water, which has low ambient concentrations of DO, into deep Puget Sound coinciding with the oxidation of organic matter from spring, summer, and early fall phytoplankton blooms. Increased water column density stratification in the spring and summer also contributes to low DO levels in the deeper layers as it impedes vertical mixing. A surface/subsurface DO maximum was seen in spring and summer at stations in the upper 35 m approximately. The maximums in dissolved oxygen correspond with maximums in chlorophyll-a concentration, temporally and spatially, and may therefore be attributed to primary productivity.

King County National Flood Insurance Program Biological Opinion . Compliance Submittal and Programmatic Habitat Assessment
3‐87
References
American Cetacean Society. Winter 2008. Newsletter of the Puget Sound Chapter, Kirkland,
Washington. Ames, J. and P. Bucknell. 1981. Puget Sound River Mile Index supplement to A Catalog of
Washington Streams and Salmon Utilization. Volume 1 – Puget Sound. Washington Department of Fisheries. Olympia, Washington.
Anchor Environmental, L.L.C. 2004. Marine Shoreline Inventory Report - WRIA 9. Prepared for
Seattle Public Utilities and WRIA 9. Seattle, Washington. Anchor Environmental, L.L.C. 2006. Prioritization of marine shorelines of water resource
inventory area 9 for juvenile salmonid habitat protection and restoration. Prepared for Water Resource Inventory Area 9 Technical Committee. King County Department of Natural Resources and Parks, Water and Land Resources Division, Seattle, Washington.
Antrim, L.D., Thom, R.M., Gardiner, W.W., Cullinan, V.I. , Shreffler, D.K. and R.W. Bienert.
1995. Effects of petroleum products on bull kelp (Nereocystis luetkeana). Marine Biology 122: 23-31.
Atagi, D.Y. 1994. Estuarine use by juvenile Coho salmon (Oncorhynchus kisutch): is it a viable
life history strategy? M.Sc.Thesis, University of British Columbia, Vancouver, British Columbia.
Beardslee, Kurt, 2001. Washington Trout, personal communication, Duvall, Washington. Beauchamp, D.A. 1986. Snohomish River Juvenile Salmon Outmigration Study. Prepared by R.
W. Beck and Associates for the United States Department of the Navy. R.W. Beck, Seattle, Washington.
Belknap, W. 1994. Wall-base channels in western Washington: Location, detection, mapping
and winter use by juvenile salmonid fishes. M.S. Thesis, University of Washington, Seattle, Washington.
Berge, Hans. 2000. Pers. comm. King County Department of Natural Resources, Water and
Land Resources Division, Seattle, Washington. Berge, H.B. and B.V. Mavros. 2001. King County bull trout program 2000 bull trout surveys.
King County Department of Natural Resources, Water and Land Resources Division, Seattle, Washington.
Berger, A. and K. Williamson. 2005. Puyallup River Juvenile Salmonid Production Assessment
Project 2005. Puyallup Indian Tribe, Fisheries Division, Puyallup, Washington. Bilby R.E., and L.A. Mollot (2008). Effect of changing land use patterns on the distribution of
coho salmon (Oncorhynchus kisutch) in the Puget Sound region. Canadian Journal of Fisheries and Aquatic Sciences 65: 2138-2148.
King County National Flood Insurance Program Biological Opinion . Compliance Submittal and Programmatic Habitat Assessment
3‐88
Bisson, P. A., Sullivan, K. and J.R. Nielsen. 1998. Channel hydraulics, habitat use, and body
form of juvenile coho salmon, steelhead, and cutthroat trout in streams. Transactions of the American Fisheries Society 117: 262-273.
Blomberg, G., Simenstad, C. and P. Hickey. 1988. Changes in Duwamish River estuary habitat
over the past 125 years, in Proceedings of the First Annual Meeting on Puget Sound Research, Volume II. Puget Sound Water Quality Authority, Seattle, Washington.
Brennan, J., and H. Culverwell. 2004. Marine Riparian: An Assessment of Riparian Functions in
Marine Ecosystems. Washington Sea Grant Program, University of Washington, Seattle, Washington.
Brennan, J.S., Higgins, K.F., Cordell, J.R. and V.A. Stamatiou. 2004. Juvenile Salmon
Composition, Timing, Distribution, and Diet in Marine Nearshore Waters of Central Puget Sound in 2001-2002. King County Department of Natural Resources and Parks, Seattle, WA 164pp.
Broadhurst, G. 1998. Puget Sound nearshore habitat regulatory perspective: A review of issues
and obstacles. Puget Sound/Georgia Basin Environmental Report Series: No. 7. Puget Sound/Georgia Basin International Task Force, Seattle, Washington.
Brodeur, R.D. 1990. A synthesis of the food habits and feeding ecology of salmonids in marine
waters of the North Pacific. (INPFC Doc.) FRI-UW-9016. Fisheries Research Institute, School of Fisheries, University of Washington, Seattle, Washington.
Brown, T.G. 1985. The role of abandoned stream channels as over-wintering habitat for juvenile
salmonids. M. Sc. Thesis, University of British Columbia, Vancouver, British Columbia. Brown, T.G. 1987. Characterization of salmonid over-wintering habitat within seasonally flooded
land on the Carnation Creek flood-plain. Land Management Report No. 44. British Columbia Ministry of Forestry, Victoria, British Columbia.
Brown, T.G. 2002. Floodplains, flooding, and salmon rearing habitats in British Columbia: a
review. Canadian Science Advisory Secretariat Research Document 2002/2007. Pacific Biological Station, Department of Fisheries and Oceans Canada, Nanaimo, British Columbia.
Brown, T.G., Langford, G. and L. Barton, 1999. Coho salmon habitat within Black Creek,
Vancouver Island. Fisheries and Oceans Canada, Nanaimo, British Columbia. Canada. Department of Fisheries and Oceans, Pacific Biological Station, Nanaimo, British Columbia.
Bulthuis, D. A. 1994. Distribution of seagrasses in a North Puget Sound estuary: Padilla Bay,
Washington, USA. Aquatic Botany 50: 99-105. Burns, T., Harding, E.A. and B.D. Tutty. 1988. Cowichan River assessment: the influence of
river discharge on sidechannel fish habitats. Canada Department of Fisheries and Oceans, Nanaimo, British Columbia.
King County National Flood Insurance Program Biological Opinion . Compliance Submittal and Programmatic Habitat Assessment
3‐89
Bustard, D.R., and D.W. Narver. 1975a. Aspects of the winter ecology of juvenile coho salmon (Oncorhynchus kisutch) and steelhead trout (Salmo gairdneri). Journal of the Fisheries Research Board of Canada 32: 667–680.
Bustard, D.R., and D.W. Narver. 1975b. Preferences of juvenile coho salmon (Oncorhynchus
kisutch) and cutthroat trout (Salmo clarki) relative to simulated alteration of winter habitat. Journal of the Fisheries Research Board of Canada 32: 681–687.
Caldwell, J.E. 1994. Green River temperature investigation 1992. Technical Report Prepared
for the Muckleshoot Tribe Fisheries Department. Muckleshoot Indian Tribe. Fisheries Department, Auburn, Washington.
Carter, S.K., VanBlaricom, G.R. and B.L. Allen. 2006. Testing the generality of the trophic
cascade paradigm for sea otters: a case study with kelp forests in northern Washington. Hydrobiologia 579: 233-249.
Cavender, T.M. 1978. Taxonomy and distribution of the bull trout, Salvelinus confluentus
(Suckley), from the American Northwest. California Fish and Game 64: 139-174. Cederholm, C.J., and W.J. Scarlett. 1982. Seasonal immigrations of juvenile salmonids into four
small tributaries of the Clearwater River, Washington, 1977-1981. In E. L. Brannon and E. O. Salo (eds.), Proceedings of the Salmon and Trout Migratory Behavior Symposium. School of Fisheries, University of Washington, Seattle, Washington.
Chan, Jeff. 2000. pers. comm. U.S. Fish and Wildlife Service, Lacey, Washington. Coccoli, Holly. 1996-2011. Personal communications. Muckleshoot Indian Tribe, Auburn,
Washington. Coffin, C., Lee, S. and C. DeGasperi. 2011. Green River Temperature Total Maximum Daily
Load: Water Quality Improvement Report. Washington Department of Ecology, Bellevue, Washington and King County Department of Natural Resources and Parks, Seattle, Washington.
Cordell, J.R, Toft, J.D., Gray, A., Ruggerone, G.T. and M. Cooksey. 2010. Functions of
restored wetlands for juvenile salmon in an industrialized estuary. Ecological Engineering 37: 343-353.
Craig, Scott. 2000. Personal communication. USFWS, Olympia, Washington. Davis, S.K. 1981. Determination of body composition, condition, and migration timing of juvenile
chum and Chinook salmon in the lower Skagit River, Washington. Master’s Thesis. University of Washington, Seattle, Washington.
Desbonnet, A., Lee, V., Pogue, P., Reis, D., Boyd, J., Willis, J. and M. Imperial. 1995.
Development of Coastal Vegetated Buffer Programs. Coastal Management, Volume 23, pp. 91-109.
Dethier, M.N. 1990. A marine and estuarine habitat classification system for Washington State.
Washington Natural Heritage Program, Washington State Department of Natural Resources, Olympia.
King County National Flood Insurance Program Biological Opinion . Compliance Submittal and Programmatic Habitat Assessment
3‐90
Duggins, D.O. 1980. Kelp dominated communities: Experimental studies on the relationships
between sea urchins, their predators, and algal resources. Dissertation Abstracts, International Doctoral Dissertation. 41/11-b:3995. Zoology Department, University of Washington, Seattle, Washington.
Dunagan, C. 1991. Rising from Toppled Trees. In: Hood Canal: Splendor at Risk, J. Brody
(editor). Published by The Sun Newspaper, Bremerton, Washington. Dunne, T. and W.E. Dietrich. 1978. Geomorphology and hydrology of the Green River, p. A1-
A33. In A River of Green. Report to King County. Jones and Jones, Seattle, Washington.
Eastman, D. 2002. Dockton seawall replacement project: draft biological assessment for Puget
Sound Chinook salmon, coho salmon, bull trout, bald eagle, marbled murrelet, Stellar sea lion, humpback whale, and leatherback sea turtle. Prepared by King County Department of Natural Resources and Parks, Ecological Services Unit for King County Department of Transportation, Road Services Division, Seattle, Washington.
Egan, T. 1990. The good rain: across time and terrain in the Pacific Northwest. Random House,
Vintage Books, New York New York. Ehrlich, D.H. 1978. Floodplain regulation in Washington’s Green and Snoqualmie River valleys.
Journal of Soil and Water Conservation 33: 245-247. Elliott, S.T. 1992. A rough trap for catching coho salmon smolts emigrating from beaver ponds.
North American Journal of Fisheries Management 12: 837-840. Environmental Protection Agency (EPA). 1989. Ambient Water Quality Criteria for Ammonia
(Saltwater). EPA 440/5-88-004. Environmental Protection Agency, Washington, D.C. Feist, B.E., Buhle, E.R., Arnold, P., Davis, J.W. and N.L. Scholz. 2011. Landscape
ecotoxicology of coho salmon spawner mortality in urban streams. PLoS 6(8): e23424. doi:10.1371/journal.pone.0023424.
Fisher, Larry. 2011. pers. comm. Washington Department of Fish and Wildlife, Issaquah,
Washington. Ford, M.J., Lundrigan, T. and M. Baird. 2004. Population structure of White River Chinook
salmon, draft Report. NOAA Fisheries, Northwest Fisheries Science Center Seattle, Washington.
Ford, M.J., Cooney, T., McElhany, P., Sands, N., Weitkamp, L., Hard, J., McClure, M., Kope, R.,
Myers, J., Albaugh, A., Barnas, K., Teel, D., Moran, P. and J. Cowen. 2010. Status review update for Pacific salmon and steelhead listed under the Endangered Species Act: Northwest. Draft U.S. Department of Commerce, NOAA Technical Memorandum NOAA-TM-NWFSC-XXX. National Marine Fisheries Service, Northwest Fisheries Science Center, Seattle, Washington.
King County National Flood Insurance Program Biological Opinion . Compliance Submittal and Programmatic Habitat Assessment
3‐91
Foster, M. S. and D. R. Schiel. 1985. The ecology of giant kelp forests in California: A community profile. Biological report 85(7.2), U.S. Fish and Wildlife Service, Washington, D.C.
Franklin, J.F., and C.T. Dyrness. 1988. Natural vegetation of Oregon and Washington. U.S.
Forest Service (1988). Reprinted by Oregon State University Press, Corvallis, Oregon. Franklin, J.F., Swanson, F.J. and J.R. Sedell. 1980. Relationships within the valley floor
ecosystems in western Olympic National Park: a summary. Pp. 43-45, In E.E. Starkey, Franklin, J.F. and J.W. Matthews (editors) Ecological research in national parks of the Pacific Northwest: Proceedings, second conference on scientific research in the national parks. Oregon State University, Forest Research Laboratory, Corvallis, Oregon.
Fresh, K.L., Cardwell, R.D. and R.P. Koons. 1981. Food habits of Pacific salmon, baitfish, and
their potential competitors and predators in the marine waters of Washington, August 1978 to September 1979. Progress Report No. 145. Washington Department of Fisheries, Olympia, Washington.
Fresh, K.L. 2006. Juvenile Pacific Salmon in Puget Sound. Puget Sound Nearshore Partnership
Report No. 2006-06. Published by Seattle District, U.S. Army Corps of Engineers, Seattle, Washington.
Garrett, A.M. 1998. Interstream movements of coastal cutthroat trout (Oncorhynchus clarki
clarki) in the Clearwater River, Jefferson County, Washington. M.E.S. Thesis, The Evergreen State College, Olympia, Washington.
Gayeski, N., McMillan, B. and P. Trotter. 2011. Historical abundance of Puget Sound steelhead,
Oncorhynchus mykiss, estimated from catch record data. Canadian Journal of Fisheries and Aquatic Sciences. 68: 498–510.
Goetz, Fred. 1999. Personal communication. U.S. Army Corps of Engineers, Seattle District,
Seattle, Washington. Goetz, F., Jeanes, E.D. and E.M. Beamer. 2004. Bull trout in the nearshore. U.S. Army Corps of
Engineers, Preliminary draft, Seattle, Washington. Glasgow, J. 2005. Letter from J. Glasgow, to U.S. Fish and Wildlife Service regarding bull trout
observations in the Snoqualmie River, King County, Washington. July 13, 2005. Washington Trout, Duvall, Washington.
Good, T.P., R.S. Waples, and P. Adams (editors). 2005. Updated status of federally listed ESUs
of West Coast salmon and steelhead. U.S Department of Commerce, NOAA Technical Memorandum. NMFS-NWFSC-66. National Marine Fisheries Service, Northwest Fisheries Science Center, Seattle, Washington; and Southwest Fisheries Science Center, Santa Cruz, California.
Goodman, J.L., Moore, K.A. and W.C. Dennison. 1995. Photosynthetic responses of eelgrass
(Zostera marina L.) to light and sediment sulfide in a shallow barrier island lagoon. Aquatic Botany 50: 1995):37-47.

King County National Flood Insurance Program Biological Opinion . Compliance Submittal and Programmatic Habitat Assessment
3‐92
Grette, G.B. and E.O. Salo. 1986. The status of anadromous fishes of the Green/Duwamish River system. Evans-Hamilton, Inc. Seattle, Washington.
Hall, F. 1987. Characterization of Riparian Systems. IN: Proceedings of the symposium
Streamside Management: Riparian Wildlife and Forestry Interactions. Edited by K.J. Raedeke. Institute of Forest Resources, University of Washington, Seattle, Washington.
Halupka, K.C., Mason, D., Bryant, M.F., Willson, and F.H. Everest. 2000. Biological
characteristics and population status of anadromous salmon in Southeast. General Technical Report PNW-GTR-468. U.S. Department of Agriculture, Forest Service, Pacific Northwest Research Station, Portland, Oregon.
Hard, J.J., Kope, R.G., Grant, W.S., Waknitz, F.W., Parker, L.T. and R. S. Waples. 1996. Status
Review of Pink Salmon from Washington, Oregon, and California. Technical Memorandum NMFS-NWFSC-25. National Marine Fisheries Service, Northwest Fisheries Science Center, Seattle, Washington.
Hard, J.J., Myers, J.M., Ford, M.J., Kope, R.G., Pess, G.R., Waples, R.S., Winans, G.A.,
Berejikian, B.A., Waknitz, F.W., Adams, P.B., Bisson, P.A., Campton, D.E., and R.R. Reisenbichler. 2007. Status review of Puget Sound steelhead (Oncorhynchus mykiss). NOAA Technical Memorandum NMFS-NWFSC-81. National Marine Fisheries Service, Northwest Fisheries Science Center, Seattle, Washington; and Southwest Fisheries Science Center, Santa Cruz, California; Olympic Forestry Sciences Laboratory, Olympia, Washington; U.S. Fish and Wildlife Service, Abernathy Fish Technology Center, Longview, Washington; U.S. Geological Survey Western Fisheries Research Center, Seattle, Washington.
Haring, D. 2002. Salmonid Habitat Limiting Factors Analysis: Snohomish River Watershed
Water Resource Area 7 Final Report. Washington State Conservation Commission, Olympia, Washington.
Harrold, C.J. Watanabe, and S. Lisin. 1988. Spatial variation in the structure of kelp forest
communities along a wave exposure gradient. Marine Ecology 9: 131-156. Hart, J.L. 1973. Pacific fishes of Canada. Bulletin of the Fisheries Research Board of Canada
180: 740 p. Hartman, G.F. and C.A. Gill. 1968. Distributions of juvenile steelhead and cutthroat trout (Salmo
gairdneri and S. clarki clarki) within streams in southwestern British Columbia. Journal of the Fisheries Research Board of Canada 25: 33-48
Hartman, G.F., and J.C. Scrivener. 1990. Impacts of forestry practices on a coastal stream
ecosystem, Carnation Creek, British Columbia. Canadian Journal of Fisheries and Aquatic Sciences 223. 80-85.
Healey, M.C. 1980. Utilization of the Nanaimo River estuary by juvenile Chinook salmon,
Oncorhynchus tshawytscha. Fishy Bulletin 77: 653-668. Herrera Environmental Consultants, Inc. 2005. Year 2003 Water Quality Data Report, Green-
Duwamish Watershed Water Quality Assessment. Report prepared for King County Department of Natural Resources and Parks in association with Anchor Environmental,
King County National Flood Insurance Program Biological Opinion . Compliance Submittal and Programmatic Habitat Assessment
3‐93
LLC and Northwest Hydraulic Consultants, Inc., King County Department of Natural Resources and Parks, Water and Land Resources Bulletin, Seattle, Washington.
Higgins, K. Schlenger, P., Small, J., Hennessy, D. and J. Hall. 2005. Spatial relationships
between beneficial and detrimental nearshore habitat parameters in WRIA 9 and the City of Seattle. Proceedings of the 2005 Puget Sound/Georgia Basin Research Conference, March 29-31, 2005, Seattle, Washington.
Hillman, T.W., and W.S. Platts. 1993. Survey plan to detect the presence of bull trout. Don
Chapman Consultants Incorporated, Boise, Idaho. Holsman, K.K. and J. Willig. 2007. Large-scale patterns in large woody debris and upland
vegetation among armored and unarmored shorelines of Puget Sound, WA. People for Puget Sound, Seattle, Washington.
Jackson, G. A. and C. D. Winant. 1983. Effect of a kelp forest on coastal currents. Continental
Shelf Research 2: 75-80. Johannessen, J.W., MacLennan, A. and McBride, A. 2005. Inventory and Assessment of
Current and Historic Beach Feeding Sources/Erosion and Accretion Areas for the Marine Shorelines of Water Resource Inventory Areas 8 & 9, Prepared by Coastal Geologic Services, Prepared for King County Department of Natural Resources and Parks, Seattle, Washington.
Johnson, O.W., Grant, W.S., Kope, R.G., Neely, K., Waknitz, F.W. and R.S. Waples. 1997.
Status review of chum salmon from Washington, Oregon, and California. NOAA Technical Memorandum NMFS-NWFSC-32. U.S. Department of Commerce, National Oceanic and Atmospheric Administration, National Marine Fisheries Service, Seattle, Washington.
Johnston, N.T., Irvine J.R. and C.J. Perrin. 1989. Coho salmon (Onchorynchus kisutch)
utilization of tributary lakes and streams in the Keogh River drainage, British Columbia. Canadian Manuscript Report of Fisheries and Aquatic Science, 1973.
Joy, J., 1994. Snoqualmie River Total Maximum Daily Load Study. Publication No. 94-71.
Washington State Department of Ecology, Olympia, Washington. Kask, B.A. and R.R. Parker. 1972. Observations on juvenile chinook salmon in the Somass
River Estuary, Port Alberni, B.C. Fisheries Research Board of Canada. Technical Report No. 308.
Kerwin, J. 1999. Salmon Habitat Limiting Factors Report for the Puyallup River Basin (Water
Resource Inventory Area 10). Washington Conservation Commission, Olympia, Washington.
Kerwin, J. and T.S. Nelson. (Eds.). 2000. Habitat Limiting Factors and Reconnaissance
Assessment Report, Green/Duwamish and Central Puget Sound Watersheds (WRIA 9 and Vashon Island). Washington Conservation Commission, Olympia, Washington and the King County Department of Natural Resources, Seattle, Washington.
King County National Flood Insurance Program Biological Opinion . Compliance Submittal and Programmatic Habitat Assessment
3‐94
Kiffney, P. M., Volk, C.J. and C. Eberhart, J.E. Hall. 2002. Community and ecosystem attributes of the Cedar River watershed above Landsburg Diversion before arrival of Pacific salmon. Report to Seattle Public Utilities Technical draft report. National Marine Fisheries Service, Northwest Fisheries Science Center, Seattle, Washington.
Kiffney, P.M., Pess, G.R., Anderson, J.H., Faulds, P., Burton, K. and S.C. Riley. 2009. Changes
in fish communities following recolonization of the Cedar River, WA, USA by Pacific salmon after 103 years of local extirpation. River Research and Applications 25: 438-452.
King County. 1978. Technical appendices to The River of Green. King County Resource
Planning Division, Seattle, Washington. King County. 1990. Soos Creek Basin Plan. King County Department of Public Works, Surface
Water Management Division, Seattle, Washington. King County Surface Water Management Division. 1993. Bear Creek Basin Plan. King County
Surface Water Management Division, Seattle, Washington. King County. 2000a. 2000 King County Comprehensive Plan. King County Department of
Development and Environmental Services, Bellevue, Washington. King County. 2000b. Literature Review and Recommended Sampling Protocol for Bull Trout in
King County. Seattle. King County Department of natural Resources and Parks, Water and Land Resources Division, Seattle, Washington.
King County. 2001. Final Adopted May Creek Basin Plan. King County Water and Land
Resources Division, Seattle, Washington. King County. 2003. Programmatic Biological Effects Analysis. King County Department of
Natural Resources and Parks, River Management Program, Seattle, Washington. King County. 2004. Vashon-Maury Island Rapid Rural Reconnaissance. King County Water and
Land Resources Division, Department of Natural Resources and Parks, Surface Water Management Division, Seattle, Washington.
King County. 2008a. June 2008 Draft, Juvenile Chinook Migration, Growth and Habitat Use in
the Lower Green River, Duwamish River and Nearshore of Elliott Bay, 2001-2003. King County Department of Natural Resources and Parks, Water and Land Resources Division, Seattle, Washington.
King County. 2008b. Greenprint for Vashon-Maury Island: Ecological Focus Areas. King
County Department of Natural Resources and Parks, Seattle, Washington. King County. 2009a. Marine Nearshore Baseline Report: Dockton Road Preservation Project.
Prepared by King County Department of Transportation & Department of Park and Natural Resources. Water and Land Resources Division, Seattle, Washington.
King County. 2009b. 2005-2007 Water Quality Status Report for Marine Waters, Section 3,
Summary of Water Monitoring Data. King County Department of Natural Resources and Parks, Water and Land Resources Division, Seattle, Washington.
King County National Flood Insurance Program Biological Opinion . Compliance Submittal and Programmatic Habitat Assessment
3‐95
King County, City of Issaquah and Washington State Department of Ecology. 1991. Issaquah Creek Basin Current/Future Conditions and Source Identification Report. King County Surface Water Management Division, Seattle, Washington; City of Issaquah Department of Public Works, Issaquah, Washington; Washington State Department of Ecology Water Quality financial Assistance Program, Olympia, Washington.
Kriete, B. 2007. Orcas in Puget Sound. Puget Sound Nearshore Partnership Report No. 2007-
01. Published by Seattle District, U.S. Army Corps of Engineers, Seattle, Washington. Kruckeberg, A.R. 2003. The natural history of Puget Sound Country. University of Washington
Press. Seattle, Washington. Ladley, Russ. 2011. pers. comm. Puyallup Tribe of Indians, Fisheries Division, Puyallup,
Washington. Latterell, J.K., Higgins, K., Lynch, K., Bergeron, K, Patterson, T. and M. Knox. 2011. WRIA 9
Draft Monitoring Report. WRIA 9 Implementation Technical Committee. King County Department of Natural Resources, Water and Land Resources Division, Seattle, Washington.
Levesque, Andy, King County Water and Land Resources Division, Personal communication,
1999. Light, Jeff, 2000. Personal communication. Plum Creek Timber Company, Inc., Seattle,
Washington. Lucchetti, G. 2005. Salmonid use of the Snoqualmie River—Tolt Delta Reach. King County
Department of Natural Resources and Parks, Water and Land Resources Division, Seattle, Washington. March 2005. 7 p.
Lucchetti, Gino. 2011. pers. comm. King County Department of Natural Resources and Parks,
Water and Land Resources Division, Seattle, Washington. Macdonald, J. 1960. The behavior of Pacific salmon fry during their downstream migration to
freshwater and saltwater nursery areas. Journal of the Fisheries Research Board of Canada 17:655-676.
Macdonald, J.S., Birtwell, I.K. and G. M. Kruzynski. 1987. Food and habitat utilization by
juvenile salmonids in the Campbell River Estuary. Canadian Journal of Fisheries and Aquatic Sciences 44:1233-1246.
Macdonald, K.B. and B. Witek. 1994. Management options for unstable bluffs in Puget Sound,
Washington. Coastal Erosion Management Studies, Volume 8. Shorelands and Coastal Zone Management Program, Washington Department of Ecology, Olympia, Washington.
Malcom, Rod. 1994-2000. Personal communication. Muckleshoot Indian Tribe, Auburn,
Washington. Mantua, N., Tohver, I.M. and A.F. Hamlet. (2010) Climate change impacts on streamflow
extremes and summertime stream temperature and their possible consequences for freshwater salmon habitat in Washington State. Climate Change 102: 187-223.
King County National Flood Insurance Program Biological Opinion . Compliance Submittal and Programmatic Habitat Assessment
3‐96
Markham, J. W. 1969. Vertical distribution of epiphytes on the stipe of Nereocystis luetkeana (Mertens) postels and ruprecht. Syesis 2: 227-240.
Marks, E.L., Ladley, R.C. and T.G. Sebastian. 2007. 2006-2007 Annual salmon, steelhead, and
bull trout report: Puyallup/White River Watershed, Water Resource Inventory Area 10. Puyallup Tribe of Indians, Puyallup, Washington.
Marks, E.L., R.C. Ladley, B.E. Smith and T.G. Sebastian. 2009. 2008-2009 Annual salmon,
steelhead, and bull trout report: Puyallup/White River Watershed, Water Resource Inventory Area 10. Puyallup Tribe of Indians, Puyallup, Washington.
Marshall, A.R. 2000. Genetic analysis of Cottage Lake Creek/Bear Creek and Issaquah Creek
naturally spawning fall-run chinook. Washington Department of Fish and Wildlife. Olympia, Washington.
Marshall, A.R., Smith, C., Brix, R., Dammers, W., Hymer, J. and L. LaVoy. 1995. Genetic
diversity units and major ancestral lineages for chinook salmon in Washington. In: C. Busack and J. B. Shaklee (eds.), Genetic diversity units and major ancestral lineages of salmonid fishes in Washington, p. 111-173. Technical Report RAD 95-02. Washington Department of Fish and Wildlife, Olympia, Washington.
Marshall, A.R. 2000. Genetic analysis of Cottage Lake Creek/Bear Creek and Issaquah Creek
naturally spawning fall-run chinook. Washington Department of Fish and Wildlife, Olympia, Washington.
Maser, C., Tarrant, R.F., Trappe J.M. and J.F. Franklin, eds. 1988. From the Forest to the Sea:
A Story of Fallen Trees. Pac. NW Res. Sta. USDA Forest Service Gen. Tech. Rept. PNW-GTR-229. U.S. Forest Service, Pacific Northwest Forest and Range Experiment Station, Portland, Oregon.
Mason, J.C. 1974. Aspects of the ecology of juvenile coho salmon (Oncorhynchus kisutch) in
Great Central Lake, B.C. Fisheries Research Board of Canada Technical Report 438. Department of Fisheries and Oceans. Fisheries Research Branch. Pacific Biological Station. Nanaimo, British Columbia.
Mavros, B., Foley, S., Burton, K., and K. Walters. 2000. 1999 Chinook spawner survey data
technical report for the Lake Washington watershed. King County Department of Natural Resources, Water and Land Resources Division, Seattle, Washington.
Meador, J.P., Ylitalo, G.M., Sommers, F.C. and D.T. Boyd. 2010. Bioaccumulation of
polychlorinated biphenyls in juvenile chinook salmon (Oncorhynchus tshawytscha) outmigrating through a contaminated urban estuary: dynamics and application. Ecotoxicology 19: 141-152.
Moore, D. 1978. Muckleshoot Indian Tribe, personal communication. Morgan, A., and F. Hinojosa. 1996. Literature review and monitoring recommendations for
salmonid winter habitat. TFW-AM9-96-004. Northwest Indian Fisheries Commission, Timber Fish Wildlife Ambient Monitoring Program, Olympia, Washington.

King County National Flood Insurance Program Biological Opinion . Compliance Submittal and Programmatic Habitat Assessment
3‐97
Mumford, T. 2007. Kelp and Eelgrass in Puget Sound. Puget Sound Nearshore Partnership Report No. 2007-05. Seattle District, U.S. Army Corps of Engineers, Seattle, Washington.
Munday, E. 1999. Current Watershed Habitat Descriptions, Conditions, and Problem Areas on
Vashon-Maury Island. King County Department of Natural Resources, Water and Land Resources Division, and Central Puget Sound Watershed Team, Seattle, Washington.
Mundie, J.H. and R.E. Traber. 1983. Carrying capacity of an enhanced side-channel for rearing
salmonids. Canadian Journal of Fisheries and Aquatic Sciences 40: 1320-1322. Municipality of Metropolitan Seattle (METRO). 1990. Quality of Local Lakes and Streams 1988 -
1989 Status Report. Municipality of Metropolitan Seattle, Seattle, Washington. Murphy, M.L., Heifiez, J., Thedinga, J.F. and K.V. Koski, 1989. Habitat utilization by juvenile
Pacific salmon (Oncorhynchus) in the glacial Taku River, southeast Alaska. Canadian Journal of Fisheries and Aquatic Sciences 46: 1677-1685.
Naiman, R.J. and H. D´ecamps. 1997. The ecology of interfaces: riparian zones. Annual
Review of Ecology, Evolution, and Systematics. 28: 621–58. National Marine Fisheries Service (NMFS). 2005. “Endangered and Threatened Species;
Designation of Critical Habitat for 12 Evolutionarily Significant Units of West Coast Salmon and Steelhead in Washington, Oregon, and Idaho.” 70 Fed. Reg. 170, 50 C.F.R. pt. 226): 52630-52858.
Nelson, T., Ruggerone, G., Kim, H., Schaefer, R. and M. Boles. 2004. Juvenile Chinook
migration, growth and habitat use in the lower Green River, Duwamish River and Nearshore of Elliott Bay, 2001-2003. Draft Report. WRIA 9 Juvenile Salmonid Survival Study. King County Department of Natural Resources and Park. Seattle, Washington.
Nelson, T.G., 2006. Unpublished data. King County Department of Natural Resources and
Parks, Water and Land Resources Division, Seattle, Washington. Nightingale, B.J. and C.A. Simenstad. 2001. Overwater structures: Marine Issues. White paper
prepared for the Washington Department of Fish and Wildlife, Washington Department of Ecology and Washington Department of Transportation, Olympia, Washington.
Onwumere, G. and D. Batts, 2004. Quality Assurance Project Plan: Snoqualmie River Total
Maximum Daily Load Effectiveness Evaluation, Publication No. 04-03-201. Washington State Department of Ecology, Olympia, Washington.
Patillo, Pat. 2011. Pers. comm. Washington Department of Fish and Wildlife, Olympia,
Washington. Pentec Environmental. 2000. Unpublished field survey notes and photographs. Pentec
Environmental, Inc., Edmonds, Washington. Penttila, D.E. 1995. The Washington Department of Fish and Wildlife’s Puget Sound intertidal
baitfish spawning beach survey project. In: Proceedings of Puget Sound Research. 1995. pp. 235-241. Puget Sound Water Quality Authority, Seattle, Washington.
King County National Flood Insurance Program Biological Opinion . Compliance Submittal and Programmatic Habitat Assessment
3‐98
Pentilla, D., 2007. Draft, Washington Department of Fish and Wildlife Priority Habitat and
Species Management Recommendations: Forage Fish Spawning Habitats. Olympia, Washington.
Perkins, S.J. 1993. Green River channel migration study. Seattle, King County Department of
Public Works, Surface Water Management Division, Seattle, Washington. Perkins, S.J. 1996. Channel migration in the Three Forks area of the Snoqualmie River. King
County Surface Water Management Division, Seattle, Washington. Pess, G.R., Montgomery, D.R., Steel, E.A., Bilby, R.E., Feist, B.E. and H.M. Greenberg. 2002.
Landscape characteristics, land use, and coho salmon (Oncorhynchus kisutch) abundance, Snohomish River, Wash., U.S.A. Canadian Journal of Fisheries and Aquatic Science 59: 613–623.
Peterson, N.P. 1982a. Population characteristics of juvenile coho salmon (Oncorhynchus kisutch) overwintering in riverine ponds. Canadian Journal of Fisheries and Aquatic Sciences 39:1303–1307.
Peterson, N.P. 1982b. Immigration of juvenile coho salmon (Oncorhynchus kisutch) into riverine
ponds. Canadian Journal of Fisheries and Aquatic Sciences 39: 1308–1310. Peterson, N.P. and L.M. Reid. 1984. Wall-based channels: their evolution, distribution, and use
by juvenile coho salmon in the Clearwater River, Washington, p. 215-225 In J.M. Walton and D.B. Houston [ed.] Proceedings of the Olympic Wild Fish Conference, March 23-25, 1983. Peninsula College, Port Angeles, Washington.
Pfeifer, R. 1985. Cutthroat in the Fuller Mountain Lakes—a wild trout management proposal.
Report 85-3. Washington State Game Department, Fish Management Division, Olympia, Washington.
Phelps, S.R., Leider, S.A., Hulett, P.L., Baker, B.M. and T. Johnson. 1997. Genetic analysis of
Washington steelhead: preliminary results incorporating 36 new collections from 1995 and 1996. Progress Report, February 1997. Washington Department of Fish and Wildlife, Olympia, Washington.
Phillips, R.C. 1984. The ecology of eelgrass meadows in the Pacific Northwest: A community
profile. FWS/OBS-84/24. U.S. Fish and Wildlife Service. Portland, Oregon. Puget Sound Water Quality Action Team. 2000. Puget Sound update. Seventh Report of the
Puget Sound Ambient Monitoring Program. Olympia, Washington. 127 pp. R2 Resource Consultants, Inc. 1998. Juvenile salmonid use of lateral stream habitats, Middle
Green River, Washington. Report Prepared for the U.S. Army Corps of Engineers, Seattle District. R2 Resource Consultants, Redmond, Washington.
Ruckelshaus, M.H., Currans, K.P., Graeber, W.H., Fuerstenberg, R.R., Rawson, K., Sands, N.J.
and J.B. Scott. 2006. Independent populations of Chinook salmon in Puget Sound. U.S. Department of Commerce, NOAA Technical Memorandum NMFS-NWFSC-78, National Marine Fisheries Service, Northwest Fisheries Science Center, Seattle, Washington.

King County National Flood Insurance Program Biological Opinion . Compliance Submittal and Programmatic Habitat Assessment
3‐99
Sabo, M.J., Bryan, C.F., Kelso, W.E. and D.A. Rutherford. 1999. Hydrology and aquatic habitat
characteristics of a riverine swamp: I. Influence of flow on water temperature and chemistry. Regulated Rivers 15: 505-523.
Sargeant, D. and R. Svrjcek. 2008. Snoqualmie River Basin Fecal Coliform Bacteria, Dissolved
Oxygen, Ammonia-Nitrogen, and pH Total Maximum Daily Load Water Quality Effectiveness Monitoring Report March 2008, Publication No. 08-03-005. Washington Department of Ecology, Olympia, Washington.
Scagel, R.F. 1956. Introduction of a Japanese alga, Sargassum muticum, into the Northeast
Pacific. Fisheries Research Papers, State of Washington 1: 1–10. Schanz, A., Julich, H., Ferrier, L. and H. Berry. 2010. Eelgrass Stressor-Response Report 2007-
2008: Zostera marina L. (eelgrass) transplant growth and survival along a spatial and tidal gradient in Westcott Bay. Washington Department of Natural Resources, Nearshore Habitat Program Aquatic Resources Division, Olympia, Washington.
Schlosser, I.J. 1991. Stream fish ecology: a landscape perspective. BioScience 41: 704-712. Schneider, Phil. 1995. Personal communication. Washington Department of Fish and Wildlife,
Mill Creek, Washington. Sedell, J.R. and W.S. Duval. 1985. Water transportation and storage of logs. IN: Meehan, W.R.,
ed. Influence of forest and rangeland management on anadromous fish habitat in western North America. Gen. Tech. Rep. PNW-186. Portland OR: U.S. Department of Agriculture, Forest Service, Pacific Northwest Forest and Range Experiment Station, Portland, Oregon.
Shaklee, J.B. and S.F. Young. 2003. Microsatellite DNA analysis and run timing of Chinook
salmon in the White River, Puyallup basin. Washington Dept. Fish and Wildlife Technical Report #FPT 03-5. Washington Department of Fish and Wildlife, Olympia, Washington.
Shannon and Wilson, 1991. Tolt and Raging Rivers channel migration study, King County,
Washington, with maps. Prepared for Surface Water Management Division, King County Department of Public Works, Seattle, WA by Shannon & Wilson, Inc., Seattle, Washington.
Sheng, M.D., M. Foy and A.Y. Fedorenko. 1990. Coho salmon enhancement in British Columbia
using improved groundwater-fed side channels. Canadian Manuscript Report Fisheries and Aquatic Sciences 2071:81 p.
Shirvell, C.S. 1990. Role of instream rootwads as juvenile coho salmon (Oncorhynchus kisutch)
and steelhead trout (O. mykiss) cover habitat under varying streamflows. Canadian Journal of Fisheries and Aquatic Sciences 47: 852-861.
Simenstad, C.A., Olson, A.M. and R.M. Thom. 1998. Mitigation between regional transportation
needs and preservation of eelgrass beds. Washington Department of Transportation, Olympia, Washington.
King County National Flood Insurance Program Biological Opinion . Compliance Submittal and Programmatic Habitat Assessment
3‐100
Simenstad, C.A., and E.A. Salo. 1982. Foraging success as a determinant of estuarine and nearshore carrying capacity of juvenile chum salmon (Oncorhynchus keta) in Hood Canal, Washington. Pages 21-37 In: Melteff, B.R. and R.A. Neve (eds.). Proceedings of the North Pacific Aquaculture Symposium, August 18-27, 1980. Anchorage, Alaska, and Newport, Oregon.
Simenstad, C.A., Nightingale, B.J., Thom, R.M. and D.K. Shreffler. 1999. Impacts of ferry
terminals on juvenile salmon migration along Puget Sound shorelines, phase I; synthesis of state of knowledge. Prepared for the Washington State Transportation Commission, Olympia, Washington.
Simenstad, C.A., Tanner, C.D., Thom, R.M. and L.L. Conquest. 1991. Puget Sound Estuary
Program: estuarine habitat assessment protocol. EPA 910/9-91-037. Prepared for U.S. Environmental Protection Agency, Region 10, Seattle, Washington.
Skeesick, D.G. 1970. The fall immigration of juvenile coho salmon into a small tributary.
Resources Report to the Fisheries Commission of Oregon pages 90-95, Salem, Oregon. Snohomish Basin Salmon Recovery Forum (SBSRF). 2001. Snohomish River Basin Chinook
Salmon Near-Term Action Agenda. Snohomish County Surface Water Management Division, Everett, Washington.
Snohomish Basin Salmon Recovery Forum (SBSRF). 2005. Snohomish River Basin Salmon
Conservation Plan. Snohomish County Department of Public Works, Surface Water Management Division, Everett, Washington. Snohomish Basin Salmon Recovery Technical Committee 1999. Initial Snohomish River Basin
Chinook Salmon Conservation/Recovery Technical Work Plan. Snohomish County Department of Public Works, Surface Water Management Division, Everett, Washington.
Sobocinski, K.L. 2003. The impact of shoreline armoring on upper beach fauna of central Puget
Sound. MS Thesis. School of Aquatic and Fishery Sciences. University of Washington. Seattle.
Solomon, F. and M. Boles. 2002. Snoqualmie watershed aquatic habitat conditions report:
summary of 1999-2001 data. King County Water and Land Resources Division, Seattle Washington.
Spence, B.C., Lomnicky, G.A., Hughes, R.M. and R.P. Novitzki. 1996. An ecosystem approach
to salmonid conservation. TR-4501-96-6057. ManTech (Management Technology) Environmental Research Services Corporation, Corvallis, Oregon.
Stateler, A. 2011. Vashon Hydrophone Project Summary of Endangered Southern Resident
Killer Whale Encounters in Vashon-Maury Island Waters from 2005 to Present. Vashon Hydrophone Project, Vashon Island, Washington.
Suckley, G. 1859. In: Stevens, I.I., ed. volume 12 of Pacific Railroad Surveys, Vol. 12. In:
Supplementary Report of Explorations for a Route for a Pacific Railroad.
King County National Flood Insurance Program Biological Opinion . Compliance Submittal and Programmatic Habitat Assessment
3‐101
Svrjcek, R., Stohr, A. and J. Kardouni. 2011. Snoqualmie River Basin Temperature Total Maximum Daily Load Water Quality Improvement Report and Implementation Plan, Publication No. 11-10-041. Washington Department of Ecology, Olympia, Washington.
Swain, D.P., and L.B. Holtby. 1989. Differences in morphology and behaviour between juvenile
coho salmon (Oncorhynchus kisutch) rearing in a lake and its tributary stream. Canadian Journal of Fisheries and Aquatic Sciences 46: 14061414.
Swanson, F.L., Gregory, S.V., Sedell, J.R. and A.G. Campbell. 1982. Land-water interactions:
the riparian zone. Pages 267-291 in: R.L. Edmonds, editor. Analysis of coniferous forest ecosystems in the Western United States, Vol. 14, Hutchinson Ross Publishing Company, Stroudsberg, Pennsylvania.
Tacoma Public Utilities (TPU). 2008. Green River Watershed Management Plan, Volume II.
Tacoma Public Utilities, Tacoma Water Department, Tacoma, Washington. Thom, R.M. 1978. The composition, growth, seasonal periodicity, and habitats of benthic algae
on the eastern shore of Central Puget Sound, with special reference to sewage pollution. Doctoral Dissertation. College of Fisheries, University of Washington, Seattle, Washington. 237 pp.
Thom, R.M. 1987. The biological importance of Pacific Northwest estuaries. Northwest
Environmental Journal 3: 21-42. Thom, R.M., and L. Hallum. 1990. Long-term changes in the areal extent on tidal marshes,
eelgrass meadows, and kelp forests of Puget Sound. FRI-UW-9008. Fisheries Research Institute, School of Fisheries, University of Washington, Seattle, Washington.
Thom, R.M., and R.G. Albright. 1990. Dynamics of benthic vegetation standing-stock,
irradiance, and water properties in Central Puget Sound. Marine Biology 104:129-141. Thom, R.M., Armstrong, J.W., Staude, C.P., Chew, K.K. and R.E. Norris. 1976. A survey of the
attached marine flora at five beaches in the Seattle, Washington, area. Syesis 9:267-275.
Thom, R.M., L.D. Antrim, A.B., Borde, W.W., Gardiner, D.K., Shreffler, P.G., Norris, J.G. S.
Wylie-Echverria and T.P. McKenzie. 1998. Puget Sound’s eelgrass meadows: Factors contributing to depth distribution and spatial patchiness. In: Proceedings of Puget Sound Research. 1998. pp. 363-370. Puget Sound Water Quality Action Team, Olympia, Washington.
Thom, R.M., Albright, R.G., Simenstad, C.A., Hampel, J., Cordell J.R. and K.K. Chew. 1984.
Renton sewage treatment plant project: Seahurst baseline study. Volume IV, Section 5: Intertidal and shallow subtidal benthic ecology. FRI-UW-8413. Fisheries Research Institute, School of Fisheries, University of Washington, Seattle, Washington.
Thompson, A.M., Glasgow, J., Buehrens, T. and E.G. Drucker. 2011. Mortality in juvenile
salmonids passed through an agricultural Hidrostal pump. Fisheries Management and Ecology 18: 333–338.
King County National Flood Insurance Program Biological Opinion . Compliance Submittal and Programmatic Habitat Assessment
3‐102
Toft, J. 2005. Benthic Macroinvertebrate Monitoring at Seahurst Park 2004, Pre-Construction of Seawall Removal. Technical Report SAFS-UW-0502, Prepared for the City of Burien. School of Aquatic and Fishery Sciences, University of Washington, Seattle, Washington.
Toft, J.D., Cordell, J. Simenstad C. and L. Stamatiou. 2004. Fish distribution, abundance, and
behavior at nearshore habitats along City of Seattle marine shorelines, with an emphasis on juvenile salmonids. Technical Report SAFS-UW-0401, School of Aquatic and Fishery Sciences, University of Washington. Prepared for Seattle Public Utilities, Seattle, Washington.
Tschaplinski, P.J. and G.F. Hartman. 1983. Winter distribution of juvenile coho salmon
(Oncorhynchus kisutch) before and after logging in Carnation Creek British Columbia, and some implications for overwinter survival. Canadian Journal of Fisheries and Aquatic Sciences 40: 452-461.
U.S. Census Bureau. 2010. U.S. 2010 Census Quick Facts (web site: http://quickfacts.census.gov/qfd/states/53/5374305.html). U.S. Fish and Wildlife Service (USFWS). 2010. Bull Trout Final Critical Habitat Justification:
Rationale for Why Habitat Is Essential, and Documentation of Occupancy. U.S. Fish and Wildlife Service, Idaho Fish and Wildlife Office, Boise, Idaho, Pacific Region, Portland, Oregon.
Vashon-Maury Island Land Trust. 1999. Shinglemill Creek Monitoring Report. Vashon-Maury
Island Land Trust, Vashon Island, Washington. Warner, Eric. 2000. Personal communication. Muckleshoot Indian Tribe, Auburn, Washington. Washington Department of Ecology (WDOE). 1979. Coastal zone atlas of Washington. Volume
6, King County. No. DOE-77-21-6. Washington Department of Ecology, Shorelands and Environmental Assistance Program, Lacey, Washington.
Washington Department of Ecology (WDOE). 1991. Net shore-drift in Washington State:
Volume 3, Central Puget Sound Region. Shorelands and Coastal Zone Management Program, Washington Department of Ecology, Lacey, Washington.
Washington Department of Ecology (WDOE). 2010a. Report on Examination to Appropriate
Public Waters of the State of Washington: Cascade Water Alliance, Application Number #2-29920 Permit Number #2-29920(A). Washington Department of Ecology, Water Resources Program, Lacey, Washington.
Washington Department of Ecology (WDOE). 2010b. 2010 Water Quality Assessment.
Washington Department of Ecology, Water Quality Program, Lacey, Washington. Washington Department of Fish and Wildlife (WDFW), Puyallup Indian Tribe, and Muckleshoot
Indian Tribe. 1996. Recovery plan for White River spring chinook salmon, unpublished report. Washington Department of Fish and Wildlife, Olympia, Washington.
Washington Department of Fish and Wildlife (WDFW). 1998. Washington State Salmonid Stock
Inventory Bull Trout/Dolly Varden (SASSI). Washington Department of Fisheries, Olympia, Washington.
King County National Flood Insurance Program Biological Opinion . Compliance Submittal and Programmatic Habitat Assessment
3‐103
Washington Department of Fish and Wildlife (WDFW). 1992 and 2002 Salmon and Steelhead
Stock Inventories. Olympia, Washington. Washington Department of Fish and Wildlife (WDFW). 2002. Washington State Salmon and
Steelhead Stock Inventory. Prepared by Washington Department of Fish and Wildlife (WDFW), Olympia, Washington.
Washington Department of Fish and Wildlife (WDFW). 2003. Priority Habitats and Species
Report. Washington Department of Fisheries and Wildlife, Olympia, Washington. Washington Department of Fish and Wildlife (WDFW). 2011a. 2011/2012 sport fishing rules.
Washington Department of Fish and Wildlife, Olympia, Washington. Washington Department of Fish and Wildlife (WDFW). 2011c. Conservation Database website:
Washington Department of Fish and Wildlife https://test-fortress.wa.gov/dfw/score/score/species/population_details.jsp?stockId=4465 Washington Department of Fisheries (WDF), Washington Department of Wildlife (WDW) and
Western Washington Treaty Tribes. 1993. 1992 Washington State Salmon and Steelhead Stock Inventory (SASSI). Olympia, Washington.
Washington Department of Natural Resources (WDNR). 1999. ShoreZone inventory (1999).
Olympia, Washington. Washington Department of Natural Resources (WDNR). 2001. Washington ShoreZone
Inventory, 2001. Washington Department of Natural Resources, Nearshore Habitat Program, Olympia, Washington.
Washington Department of Natural Resources (WDNR). 2004. Final Supplemental
Environmental Impact Statement: Maury Island Aquatic Reserve. Washington Department of Natural Resources, Aquatic Resources Division, Olympia, Washington.
Washington Trout. 2001. Vashon Island stream survey and stream mouth inventory.
Washington Trout, Duvall, Washington. Watson, G. and S. Toth. 1994. Limiting factors analysis for salmonid fish stocks in the Plum
Creek Habitat Conservation Plan (HCP) areas. Report prepared by Plum Creek Timber Company, Seattle, Washington.
Weitcamp, D.E. 2001. Estuarine habitat used by young salmon: an annotated bibliography
(review draft). Parametrix, Inc., Bellevue, Washington. Weitcamp, L.A., Wainwright, T.C., Bryant, G.J., Milner, G.B., Teel, D.J., Kope, R.G. and R.S.
Waples. 1995. Status review of coho salmon from Washington, Oregon and California. National Marine Fisheries Service, Northwest Fisheries Science Center, Seattle, Washington and Southwest Region, Long Beach, California.
Weitcamp, D.E. 2010. Estuarine habitat use by young salmon: an annotated bibliography.
Parametrix, Inc., Bellevue, Washington.

King County National Flood Insurance Program Biological Opinion . Compliance Submittal and Programmatic Habitat Assessment
3‐104
Whyte, J.N.C. and J. R. Englar. 1980. Seasonal variation in the inorganic constituents of the marine alga Nereocystis luetkeana. Part II, non-metallic elements. Botanica Marina 23:19-24.
Williams, G.D. and R.M. Thom. 2001 Marine and estuarine shoreline modification issues.
Washington Department of Ecology, and Washington State Department of Transportation, Olympia, Washington.
Williams, G.D., Thom, R.M., Starkes, J.E., Houghton, J.P., Woodruff, D., Striplin, P.L., Miller, M.,
Pedersen, M., Skillman, A., Kropp, R., Borde, A., Freeland, C., McArthur, K., Fagerness, V., Blanton, S., Blackmore, L. and J.S. Brennan, Editor. 2001. Reconnaissance Assessment of the State of the Nearshore Ecosystem: Eastern Shore of Central Puget Sound, Including Vashon and Maury Islands (WRIAs 8 and 9). J.S. Brennan, Editor. Report prepared for King County Department of Natural Resources, Seattle, Washington.
Williams, R.W., R.M. Laramie and J.J. Ames. 1975. A catalog of Washington streams and
salmon utilization. Washington Department of Fisheries, Olympia, Washington. Wissmar, R.C., and C.A. Simenstad. 1998. Variability of riverine and estuarine ecosystem
productivity for supporting Pacific salmon. Change in Pacific Northwest Coastal Ecosystems: A NOAA Decision Analysis Series Report. Ecological Society of America, Washington, D.C.
Wydowski, R.S. and R.R. Whitney. 2003. Inland Fishes of Washington, Second Edition.
Bethesda, Maryland: American Fisheries Society in association with University of Washington Press, Seattle, Washington.
Wyllie-Echeverria, S.W. 2011. Pers. comm. University of Washington, School of Marine Affairs,
Seattle. Washington. Zabel, R.W. and S. Achord. 2004. Relating size of juveniles to survival within and among
populations of Chinook salmon. Ecology 85: 795–806.

Chapter 4
Regulatory Environment

King County National Flood Insurance Program Biological Opinion . Compliance Submittal and Programmatic Habitat Assessment
4‐i
Chapter 4 Contents
Planning in King County ............................................................................................................. 4-1
King County Comprehensive Plan Land Uses and Zoning ........................................................ 4-2
Zoning within King County’s Floodplains ................................................................................... 4-3
King County Zoning ................................................................................................................... 4-4
Forest Production Districts ......................................................................................................... 4-8
Agricultural Production Districts ................................................................................................. 4-9
King County Regulatory Environment ........................................................................................ 4-9
Critical Areas ............................................................................................................................ 4-10
Alterations and Alteration Exceptions Overview ...................................................................... 4-13
Agricultural Activities in Critical Areas ...................................................................................... 4-19
Agricultural Ditch Maintenance Program ................................................................................. 4-20
Farm Management Plans ......................................................................................................... 4-20
Rural Stewardship Planning ..................................................................................................... 4-22
Forest Stewardship Planning ................................................................................................... 4-24
Coal Mine Hazard Areas .......................................................................................................... 4-25
Erosion Hazard Areas .............................................................................................................. 4-26
Flood Hazard Areas ................................................................................................................. 4-27
Channel Migration Zones ......................................................................................................... 4-30
Landslide Hazard Areas ........................................................................................................... 4-31
Seismic Hazard Areas ............................................................................................................. 4-32
Volcanic Hazard Areas ............................................................................................................ 4-33
Steep Slope Hazard Areas ...................................................................................................... 4-34
Critical Aquifer Recharge Areas ............................................................................................... 4-35
Wetlands .................................................................................................................................. 4-38
Aquatic Areas ........................................................................................................................... 4-55
Wildlife Habitat Conservation Areas ........................................................................................ 4-71
Clearing and Grading ............................................................................................................... 4-80
Drainage Review and Requirements ....................................................................................... 4-84
Water Quality Code .................................................................................................................. 4-93
Stormwater Pollution Prevention Manual ................................................................................. 4-93
Shoreline Master Program ....................................................................................................... 4-93
King County National Flood Insurance Program Biological Opinion . Compliance Submittal and Programmatic Habitat Assessment
4‐ii
Tables
Table 4-1 Comprehensive Plan Land Use Zone Designations ................................................ 4-2
Table 4-2 Zone Designations ................................................................................................... 4-3
Table 4-3 Required buffer widths for wetlands located within the UGA ................................... 4-40
Table 4-4 Mitigation to reduce buffers for wetlands located within the UGA ............................ 4-41
Table 4-5 Required buffer widths for wetlands located outside of the UGA
(K.C.C. 21A.24.325B) ............................................................................................ 4-42
Table 4-6 Required ratios of wetland mitigation area to area of permanent alteration ............ 4-44
Table 4-7 Required ratios of wetland mitigation area to area of temporary alteration ............. 4-45
Table 4-8 Required buffer widths for aquatic areas within the UGA ........................................ 4-57
Table 4-9 Required buffer widths for aquatic areas outside the UGA ...................................... 4-57
Table 4-10 Wildlife habitat conservation area setbacks (K.C.C.21A.24.382) ............................ 4-71
Table 4-11 Mitigation ratios for wildlife habitat networks ........................................................... 4-73
Figures
Figure 4-1 Critical Area Alterations ........................................................................................... 4-18
Figure 4-2 Zero Rise Floodway ................................................................................................. 4-27
Figure 4-3 CMZ Map Example .................................................................................................. 4-30

King County National Flood Insurance Program Biological Opinion . Compliance Submittal and Programmatic Habitat Assessment
4‐1
Chapter 4 – Regulatory Overview
Planning in King County
King County's comprehensive land use planning dates back to 1964. Two decades later, the 1985 Comprehensive Plan identified an urban growth boundary line to limit urban growth to areas that could support urban levels of density. The 1985 Plan also established policies to preserve the Rural Area, conserve the natural environment and designate resource lands for long-term agriculture and forest production. In 1990, the Washington State legislature adopted the Growth Management Act (GMA) which directs the state's most populous and fastest growing counties and their cities to prepare comprehensive land use plans that anticipate growth for a 20-year horizon. Comprehensive plans adopted in accordance with GMA must manage growth so that development is directed to designated urban areas and away from the Rural Area and Resource Lands. The GMA also requires jurisdictions to designate and protect critical areas and commercially significant forestry, agriculture, and mining areas. The GMA requires each comprehensive plan to adhere to a set of thirteen goals and to include the following elements: land use, housing, capital facilities, utilities, rural, and transportation. King County’s first comprehensive plan under the GMA was adopted in 1994. King County conducted the first major review and update to this 1994 Plan in 2000 and continues to update the Comprehensive Plan every four years for major policy changes and annually to make minor corrections or changes that do not involve a major change in policy. The King County Comprehensive Plan provides a legal framework for guiding regional growth and making decisions about land use in unincorporated King County. Public and private agencies, property owners, developers, community groups and King County staff use the comprehensive plan in several ways. First, the plan is the framework for other plans and regulations such as subarea plans and the King County Code that govern the location and density of land uses and provide framework for development. It provides guidance to county officials for decisions on proposals such as zoning changes and developments. It also gives the public direction on the county's position on proposed changes in land use or zoning, environmental regulations, or broader policy issues. The plan also provides a basis for decisions about public spending on facilities and services. And, the plan presents other agencies, such as cities and special purpose districts, with King County's position on large-scale matters such as annexation, use of resource lands, environmental protection and others. The King County Countywide Planning Policies (CPPs) set the framework for the county's and cities' comprehensive plans. The CPPs, adopted by the county and cities in 1992 and amended several times since 1992, establish an Urban Growth Area (UGA) within the western one-third of King County where most growth and development is targeted. The goals of the policies include: reducing urban sprawl, protecting the Rural Area, providing affordable housing throughout the county and coordinating protection of environmentally critical areas.

King County National Flood Insurance Program Biological Opinion . Compliance Submittal and Programmatic Habitat Assessment
4‐2
Another piece of the planning puzzle in King County is the multi-county planning policies (MPPs), which the GMA requires of the largest counties with adjacent urban areas. The Puget Sound Regional Council has developed the MPPs through extensive collaboration with four counties in the central Puget Sound region: Snohomish, King, Pierce and Kitsap counties. Vision 2040 is an integrated strategy that takes on regional issues that cannot be comprehensively addressed within a single jurisdiction. The Vision 2040 document outlines the regional growth strategy and specifies policies to help us achieve the strategy. The MPPs provide guidance and direction to regional, county, and local governments on such topics as setting priorities for transportation investment, stimulating economic development, planning for open space, making city and town centers more suitable for transit and walking, and improving transportation safety and mobility.
King County Comprehensive Plan Land Uses and Zoning
King County adopts comprehensive land uses through the King County Comprehensive Plan. These land uses guide the establishment of zoning as well as decision-making on requests for zone reclassifications. Land uses adopted by the Comprehensive Plan can only be amended during the annual plan update process for changes that that do not require substantive change to comprehensive plan policy language and that do not alter the urban growth area boundary, and during the four-year update to the Comprehensive Plan. A land use designation is implemented by one or more specific zone classifications, as indicated on the following table: Table 4-1. Comprehensive Plan Land Use Zone Designations.
Comprehensive Plan Land Uses Zoning Unincorporated Activity Center : White Center R-12, R-18, R-24, R-48, NB, CB, O, I Community Business Center NB, CB, O Neighborhood Business Center NB, O Commercial Outside of Centers NB, CB, RB, O, I - this is the range of existing
zoning in place when the comprehensive plan was adopted
Urban Planned Development R-1, R-4, R-6, R-8, R-12, R-18, R-24, R-48, NB, CB, RB, O, I
Urban Residential, High R-18, R-24, R-48 Urban Residential, Medium R-4, R-6, R-8, R-12 Urban Residential, Low R-1 Rural City Urban Growth Area UR The following two zones were in place in the
North Bend UGA when the comprehensive plan was adopted in 1994: I, RB
Rural Town R-1, R-4, R-6, R-8, R-12, R-18, R-24, R-48, NB, CB, RB, O, I
Rural Neighborhood Commercial Center NB, RA-5 Rural Area RA-2.5, RA-5, RA-10, RA-20 Industrial I Forestry F, M Agriculture A Mining M Greenbelt/Urban Separator R-1 King County Open Space System All zones Other Parks/Wilderness All zones

King County National Flood Insurance Program Biological Opinion . Compliance Submittal and Programmatic Habitat Assessment
4‐3
Zoning within King County’s Floodplains
King County’s mapped floodplains cover approximately 33,696 acres, or 2.47 percent of the County. Over half of King County’s floodplains are located within the Agricultural Production District with A zoning that allows a density of no more than one dwelling unit per 10 acres. An additional 29.81 percent of King County’s floodplain has RA zoning that allows no more than one dwelling unit per 5 acres. Forestry and mining comprise slightly more than 6.35 percent, an additional 6.08 percent that is undesignated (roads, water, etc.) leaving only 6.34 percent of King County’s mapped floodplains that would allow for high density urban land uses.
Table 4-2. Zoning designations. Zoning Designations Density Allowed Acres in
Floodplain % of total
King County Floodplain
A-10 or A-35 - Agricultural 10 acres per lot or 35 acres per lot
17,323.84 51.41%
F - Forest 80 acres per lot 2,120.53 6.29%
M - Mining residential not allowed 21.15 0.06%
RA-2.5 - Rural Area 5 acres per lot (NOT 2.5) 1,189.94 3.53%
RA-5 - Rural Area 5 acres per lot 4,039.86 11.99%
RA-10 - Rural Area 10 acres per lot 4,815.76 14.29%
RA-20 - Rural Area 20 acres per lot 0.00 0.00%
UR - Urban Reserve 5 acres per lot 915.09 2.72%
R-1 Residential 1 acre per dwelling unit 482.63 1.43%
R-4 Residential 4 dwelling unit per acre 368.94 1.09%
R-6 Residential 6 dwelling units per acre 68.35 0.20%
R-8 Residential 8 dwelling units per acre 1.16 0.00%
R-12 Residential 12 dwelling units per acre 0.21 0.00%
R-18 Residential 18 dwelling units per acre 0.00 0.00%
R-24 Residential 24 dwelling units per acre 0.00 0.00%
R-48 Residential 48 dwelling units per acre 0.00 0.00%
NB - Neighborhood Business
8 dwelling units per acre (only through incentives or targeted drainage review (TDR))
4.48 0.01%
CB - Community Business 18 dwelling units per acre (only through incentives or TDR)
6.52 0.02%
RB - Regional Business 36 dwelling units per acre (only through incentives or TDR)
0.01 0.00%
O - Office 36 dwelling units per acre (only through incentives or TDR)
0.34 0.00%
I - Industrial residential not allowed 288.84 0.86%No designation generally non-buildable 2,048.24 6.08%
Total 33,695.89 100.00%

King County National Flood Insurance Program Biological Opinion . Compliance Submittal and Programmatic Habitat Assessment
4‐4
King County Zoning
Agricultural Zone (51.41% of the floodplain) The purpose of the agricultural zone (A) is to preserve and protect irreplaceable and limited supplies of farmland well suited to agricultural uses by their location, geological formation and chemical and organic composition and to encourage environmentally sound agricultural production. These purposes are accomplished by: 1. Establishing residential density limits to retain lots sized for efficient farming; 2. Allowing for uses related to agricultural production and limiting nonagricultural uses to those
compatible with farming, or requiring close proximity for the support of agriculture; and 3. Allowing for residential development primarily to house farm owners, on-site agricultural
employees and their respective families. Use of this zone is appropriate for lands within agricultural production districts designated by the Comprehensive Plan and for other farmlands deemed appropriate for long-term protection. Forest Zone (6.29% of the floodplain) The purpose of the forest zone (F) is to preserve the forest land base; to conserve and protect the long-term productivity of forest lands; and to restrict uses unrelated to or incompatible with forestry. These purposes are accomplished by: 1. Applying the F zone to large contiguous areas where a combination of site, soil and climatic
characteristics make it possible to sustain timber growth and harvests over time; 2. Limiting residential, recreational, commercial and industrial uses to those uses that are
compatible with forestry, to minimize the potential hazards of damage from fire, pollution and land use conflicts; and
3. Providing for compatible outdoor recreation uses and for conservation and protection of municipal watersheds and fish and wildlife habitats.
Use of this zone is appropriate for lands within forest production districts designated by the Comprehensive Plan. Mineral Zone (0.06% of the floodplain) The purpose of the mineral zone (M) is to provide for continued extraction and processing of mineral and soil resources in an environmentally responsible manner by: 1. Reserving known deposits of minerals and materials within areas as protection against
premature development of the land for non-extractive purposes; 2. Providing neighboring properties with notice of prospective extracting and processing
activities; and 3. Providing appropriate location and development standards for extraction and on-site
processing to mitigate adverse impacts on the natural environment and on nearby properties.
Use of this zone is appropriate for known deposits of minerals and materials on sites that are of sufficient size to mitigate the impacts of operation and that are served or capable of being served at the time of development by adequate roads and other public services; and for sites containing mineral extracting and processing operations that were established in compliance with land use regulations in effect at the time the use was established.
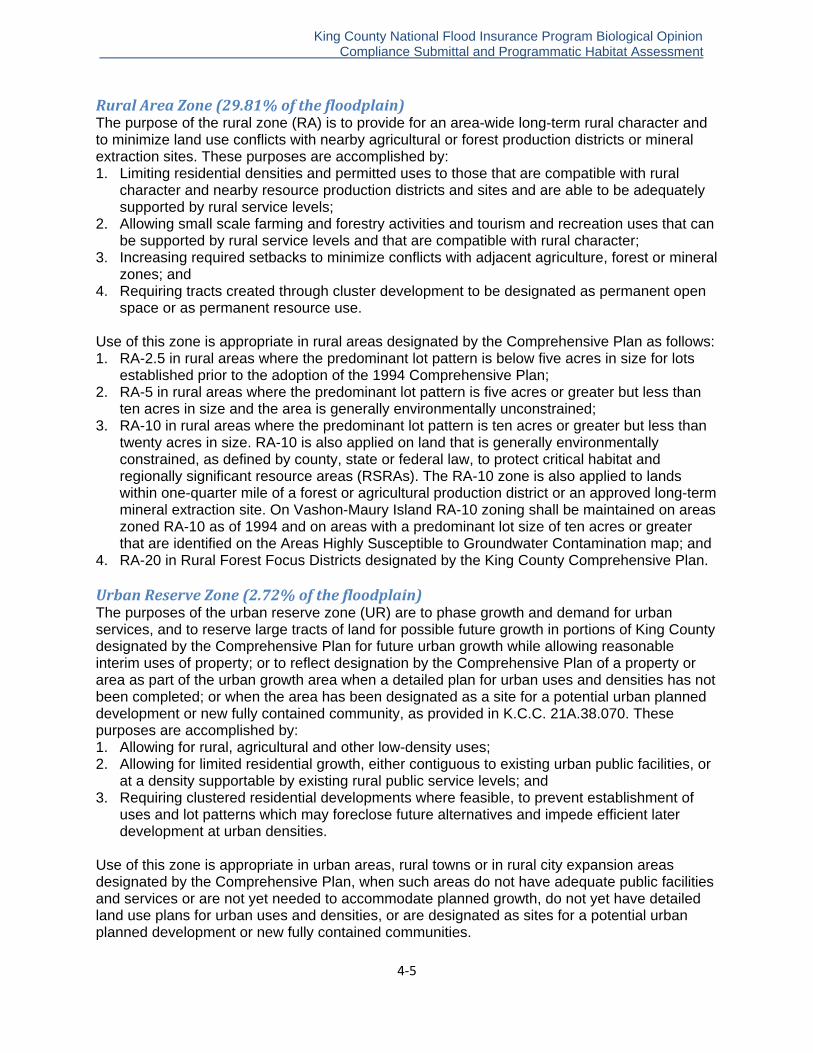
King County National Flood Insurance Program Biological Opinion . Compliance Submittal and Programmatic Habitat Assessment
4‐5
Rural Area Zone (29.81% of the floodplain) The purpose of the rural zone (RA) is to provide for an area-wide long-term rural character and to minimize land use conflicts with nearby agricultural or forest production districts or mineral extraction sites. These purposes are accomplished by: 1. Limiting residential densities and permitted uses to those that are compatible with rural
character and nearby resource production districts and sites and are able to be adequately supported by rural service levels;
2. Allowing small scale farming and forestry activities and tourism and recreation uses that can be supported by rural service levels and that are compatible with rural character;
3. Increasing required setbacks to minimize conflicts with adjacent agriculture, forest or mineral zones; and
4. Requiring tracts created through cluster development to be designated as permanent open space or as permanent resource use.
Use of this zone is appropriate in rural areas designated by the Comprehensive Plan as follows: 1. RA-2.5 in rural areas where the predominant lot pattern is below five acres in size for lots
established prior to the adoption of the 1994 Comprehensive Plan; 2. RA-5 in rural areas where the predominant lot pattern is five acres or greater but less than
ten acres in size and the area is generally environmentally unconstrained; 3. RA-10 in rural areas where the predominant lot pattern is ten acres or greater but less than
twenty acres in size. RA-10 is also applied on land that is generally environmentally constrained, as defined by county, state or federal law, to protect critical habitat and regionally significant resource areas (RSRAs). The RA-10 zone is also applied to lands within one-quarter mile of a forest or agricultural production district or an approved long-term mineral extraction site. On Vashon-Maury Island RA-10 zoning shall be maintained on areas zoned RA-10 as of 1994 and on areas with a predominant lot size of ten acres or greater that are identified on the Areas Highly Susceptible to Groundwater Contamination map; and
4. RA-20 in Rural Forest Focus Districts designated by the King County Comprehensive Plan. Urban Reserve Zone (2.72% of the floodplain) The purposes of the urban reserve zone (UR) are to phase growth and demand for urban services, and to reserve large tracts of land for possible future growth in portions of King County designated by the Comprehensive Plan for future urban growth while allowing reasonable interim uses of property; or to reflect designation by the Comprehensive Plan of a property or area as part of the urban growth area when a detailed plan for urban uses and densities has not been completed; or when the area has been designated as a site for a potential urban planned development or new fully contained community, as provided in K.C.C. 21A.38.070. These purposes are accomplished by: 1. Allowing for rural, agricultural and other low-density uses; 2. Allowing for limited residential growth, either contiguous to existing urban public facilities, or
at a density supportable by existing rural public service levels; and 3. Requiring clustered residential developments where feasible, to prevent establishment of
uses and lot patterns which may foreclose future alternatives and impede efficient later development at urban densities.
Use of this zone is appropriate in urban areas, rural towns or in rural city expansion areas designated by the Comprehensive Plan, when such areas do not have adequate public facilities and services or are not yet needed to accommodate planned growth, do not yet have detailed land use plans for urban uses and densities, or are designated as sites for a potential urban planned development or new fully contained communities.

King County National Flood Insurance Program Biological Opinion . Compliance Submittal and Programmatic Habitat Assessment
4‐6
Urban Residential Zone (2.72% of the floodplain) The purpose of the urban residential zone (R) is to implement comprehensive plan goals and policies for housing quality, diversity and affordability, and to efficiently use urban residential land, public services and energy. These purposes are accomplished by: 1. Providing, in the R-1 through R-8 zones, for a mix of predominantly single detached dwelling
units and other development types, with a variety of densities and sizes in locations appropriate for urban densities;
2. Providing, in the R-12 through R-48 zones, for a mix of predominantly apartment and townhouse dwelling units, mixed-use and other development types, with a variety of densities and sizes in locations appropriate for urban densities;
3. Allowing only those accessory and complementary nonresidential uses that are compatible with urban residential communities; and
4. Establishing density designations to facilitate advanced area-wide planning for public facilities and services, and to protect environmentally sensitive sites from over development.
Use of this zone is appropriate in urban areas, activity centers, or Rural Towns designated by the Comprehensive Plan as follows: 1. The R-1 zone on or adjacent to lands with area-wide environmental constraints where
development is required to cluster away from sensitive areas, on lands designated urban separators or wildlife habitat network where development is required to cluster away from the axis of the corridor on critical aquifer recharge areas, and on Regionally and Locally Significant Resource Areas (RSRAs/LSRAs) or in well-established subdivisions of the same density, which are served at the time of development by public or private facilities and services adequate to support planned densities;
2. The R-4 through R-8 zones on urban lands that are predominantly environmentally unconstrained and are served at the time of development by adequate public sewers, water supply, roads and other needed public facilities and services; and
3. The R-12 through R-48 zones next to Unincorporated Activity Centers, in Community or Neighborhood Business Centers, in mixed-use development, on small, scattered lots integrated into existing residential areas, or in Rural Towns, that are served at the time of development by adequate public sewers, water supply, roads and other needed public facilities and services.
Neighborhood Business Zone (0.01% of the floodplain) The purpose of the neighborhood business zone (NB) is to provide convenient daily retail and personal services for a limited service area and to minimize impacts of commercial activities on nearby properties and in urban areas on properties with the land use designation of commercial outside of center, to provide for limited residential development. These purposes are accomplished by: 1. Limiting nonresidential uses to those retail or personal services which can serve the
everyday needs of a surrounding urban or rural residential area; 2. Allowing for mixed use (housing and retail/service) developments and for townhouse
developments as a sole use on properties in the urban area with the land use designation of commercial outside of center; and
3. Excluding industrial and community/regional business-scaled uses. Use of this zone is appropriate in urban neighborhood business centers, rural towns, or rural neighborhood centers designated by the comprehensive plan, on sites which are served at the time of development by adequate public sewers when located in urban areas or adequate on-site sewage disposal when located in rural areas, water supply, roads and other needed public facilities and services.
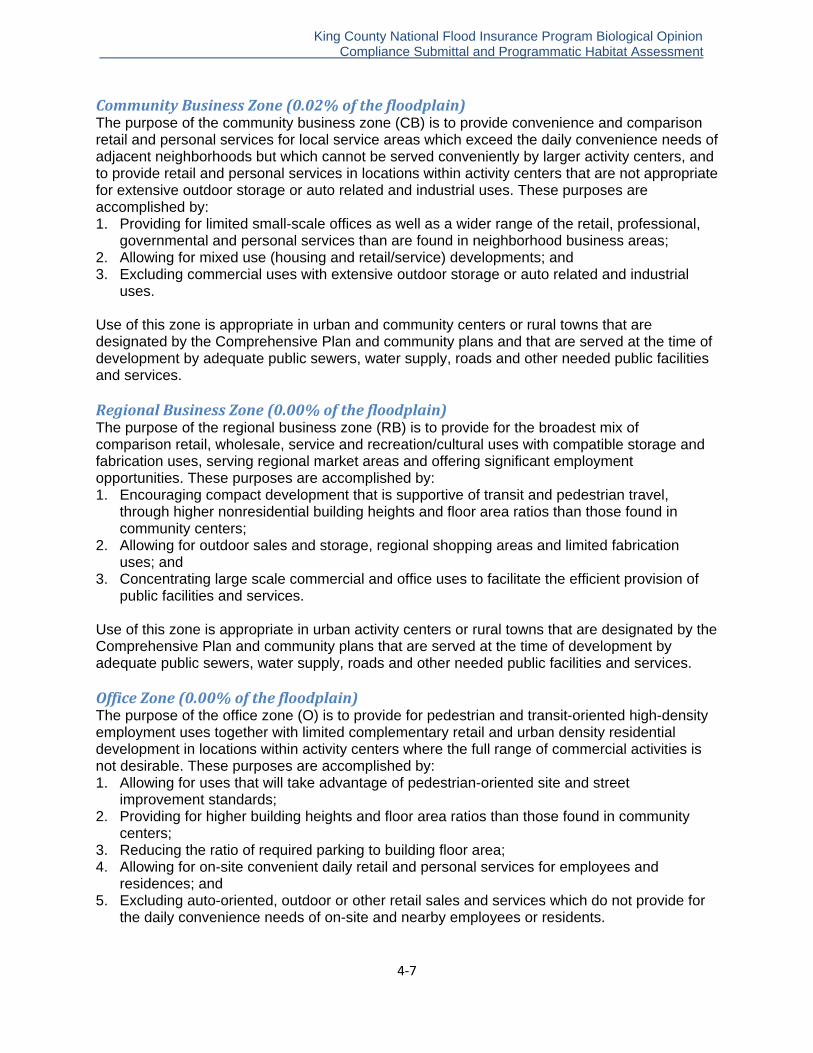
King County National Flood Insurance Program Biological Opinion . Compliance Submittal and Programmatic Habitat Assessment
4‐7
Community Business Zone (0.02% of the floodplain) The purpose of the community business zone (CB) is to provide convenience and comparison retail and personal services for local service areas which exceed the daily convenience needs of adjacent neighborhoods but which cannot be served conveniently by larger activity centers, and to provide retail and personal services in locations within activity centers that are not appropriate for extensive outdoor storage or auto related and industrial uses. These purposes are accomplished by: 1. Providing for limited small-scale offices as well as a wider range of the retail, professional,
governmental and personal services than are found in neighborhood business areas; 2. Allowing for mixed use (housing and retail/service) developments; and 3. Excluding commercial uses with extensive outdoor storage or auto related and industrial
uses. Use of this zone is appropriate in urban and community centers or rural towns that are designated by the Comprehensive Plan and community plans and that are served at the time of development by adequate public sewers, water supply, roads and other needed public facilities and services. Regional Business Zone (0.00% of the floodplain) The purpose of the regional business zone (RB) is to provide for the broadest mix of comparison retail, wholesale, service and recreation/cultural uses with compatible storage and fabrication uses, serving regional market areas and offering significant employment opportunities. These purposes are accomplished by: 1. Encouraging compact development that is supportive of transit and pedestrian travel,
through higher nonresidential building heights and floor area ratios than those found in community centers;
2. Allowing for outdoor sales and storage, regional shopping areas and limited fabrication uses; and
3. Concentrating large scale commercial and office uses to facilitate the efficient provision of public facilities and services.
Use of this zone is appropriate in urban activity centers or rural towns that are designated by the Comprehensive Plan and community plans that are served at the time of development by adequate public sewers, water supply, roads and other needed public facilities and services. Office Zone (0.00% of the floodplain) The purpose of the office zone (O) is to provide for pedestrian and transit-oriented high-density employment uses together with limited complementary retail and urban density residential development in locations within activity centers where the full range of commercial activities is not desirable. These purposes are accomplished by: 1. Allowing for uses that will take advantage of pedestrian-oriented site and street
improvement standards; 2. Providing for higher building heights and floor area ratios than those found in community
centers; 3. Reducing the ratio of required parking to building floor area; 4. Allowing for on-site convenient daily retail and personal services for employees and
residences; and 5. Excluding auto-oriented, outdoor or other retail sales and services which do not provide for
the daily convenience needs of on-site and nearby employees or residents.
King County National Flood Insurance Program Biological Opinion . Compliance Submittal and Programmatic Habitat Assessment
4‐8
Use of this zone is appropriate in activity centers designated by the Comprehensive Plan and community plans which are served at the time of development by adequate public sewers, water supply, roads and other needed public facilities and services. Industrial zone (0.86% of the floodplain) The purpose of the industrial zone (I) is to provide for the location and grouping of industrial enterprises and activities involving manufacturing, assembly, fabrication, processing, bulk handling and storage, research facilities, warehousing and heavy trucking. It is also a purpose of this zone to protect the industrial land base for industrial economic development and employment opportunities. These purposes are accomplished by: 1. Allowing for a wide range of industrial and manufacturing uses; 2. Establishing appropriate development standards and public review procedures for industrial
activities with the greatest potential for adverse impacts; and 3. Limiting residential, institutional, commercial, office and other non-industrial uses to those
necessary for the convenience of industrial activities. Use of this zone is appropriate in urban activity centers or rural towns designated by the Comprehensive Plan and community plans which are served at the time of development by adequate public sewers, water supply, roads and other needed public facilities and services. No Designation (0.6.08% of the floodplain) Land covered by water, contained in rights-of-way for streets or alleys, or railroads are considered unclassified and do not have zoning designations.
Forest Production Districts
The purpose of the Forest Production District (FPD) is to prevent intrusion of incompatible uses, manage adjacent land uses to minimize land use conflicts, and prevent or discourage conversion to nonforestry-based uses. A comparison of the area of forestland converted since 1987 inside the FPD with the area converted outside the district indicates that designation and zoning of commercial forest lands help to discourage subdivision and conversion. Sixty percent of the land area in King County is within the designated FPD. The FPD comprises 1,300 square miles (825,000 acres) of forestland in east King County. Most of this land is held in large blocks of contiguous ownership. At this larger scale, it is easier to manage for multiple purposes such as habitat and long-term forest health. About 70 percent of the FPD is in public ownership: parts of the Mt. Baker-Snoqualmie National Forest, including wilderness areas, state and county parks, Washington State Department of Natural Resources (WDNR) lands, and watersheds for the cities of Seattle and Tacoma. Public land management affects the region’s economy, recreation, wildlife habitat, forest health, stream flows, water supply, flood control and climate change mitigation capabilities. In 2004, King County purchased the development rights on the 90,000-acre Snoqualmie Forest. This purchase conserves the forest land base for the long term while supporting the continuation of commercial forest production. Within King County’s floodplains, approximately 6.31 percent or 2015.06 acres are located within the FPD and designated for long-term forestry. With a residential density of one home for every
King County National Flood Insurance Program Biological Opinion . Compliance Submittal and Programmatic Habitat Assessment
4‐9
80 acres, King County does not anticipate significant conversion of land from forestry to residential use.
Agricultural Production Districts
In 1985, King County first designated its Agricultural Production Districts (APDs), which have remained stable since then at about 42,000 acres. The five APDs are the Sammamish Valley, the Snoqualmie Valley, the Lower Green River Valley, the Upper Green River Valley and the Enumclaw Plateau. Most parcels within the boundaries of an APD are zoned Agricultural, either A-10 or A-35, which establishes a density of one dwelling unit for every ten acres or one dwelling unit for every thirty-five acres, respectively. Land uses within the APDs are generally limited to those that directly support agricultural production: residential structures so farmer can live on the land they are farming, home industries located within residential structures, farm supply retail, agricultural product sales, livestock sales, and small-scale farm product warehousing, refrigeration and storage, to name a few. Other compatible uses, such as trails and stables, are also allowed. King County’s largest APD, the Snoqualmie Valley APD, is largely located within the mapped FEMA floodway that under Washington state statutes restricts new residential structures and under King County code, only agricultural structures are allowed to be constructed. Some of the highest quality salmon habitat in King County is found within APDs. Additional protection or restoration of critical habitat within the APDs has been recommended by each of the Water Resources Inventory Area Salmon Conservation Plans. Protection and enhancement of existing salmon habitat is a resource-based land use that is generally included in all farm management plans. Specific habitat protection rules are balanced to not jeopardize the agricultural productivity within APDs. King County Code recognizes existing tilled land, but requires any conversion of land within an APD from forested to tilled to comply with all critical areas standards, including buffers and mitigation for all impacts. Approximately 51.41 percent of King County’s floodplains have A zoning and are located primarily within the APDs. Because of the strict limit on allowed uses, the low density of allowed development and the requirement to protect agricultural soils, King County anticipates little change in the land cover or use within the APDs. Conclusion The vast majority of King County’s floodplains are located in areas designated by the King County Comprehensive Plan as lands that are limited to low density development for the purposes of resource protection or rural lands. Only about 2.75 percent of the floodplain is zoned for high density development.
King County Regulatory Environment
King County regulates land use primarily through the Critical Areas Ordinance (CAO), the Surface Water Management Ordinance and the Clearing and Grading Ordinance, and the Shoreline Management Act (SMA). These ordinances are codified in the King County Code in chapter 21A.24, Title 9, chapter 16.82, and chapter 21A.25 respectively. This chapter provides

King County National Flood Insurance Program Biological Opinion . Compliance Submittal and Programmatic Habitat Assessment
4‐10
an overview of King County’s CAO regulations and Shoreline Master Program (SMP) and describes portions of the Clearing and Grading Ordinance that pertain to critical areas. In addition, this chapter summarizes the Small Project drainage review requirements, Water Quality Code and the Stormwater Pollution Prevention Manual adopted under the Surface Water Management Ordinance. King County adopted its CAO regulations to protect public health and safety by limiting development in hazard areas, such as on steep slopes or flood zones, and protect environmentally sensitive areas, such as wetlands and streams. The CAO is intended to protect critical areas from being adversely affected by clearing and development of land for residential and commercial land use, agriculture, forestry and mining. The Surface Water Management Ordinance regulates activities that increase storm water runoff. The ordinance establishes a drainage review process and is implemented through the Surface Water Design Manual and Stormwater Pollution Prevention Manual. The design manual contains design standards and best management practices (BMPs) that are intended to limit impacts to aquatic resources and downstream properties. The Clearing and Grading Ordinance regulates activities involving the clearing or removal of vegetation, excavation, grading, earthwork, gravel pits, dumping quarrying and mining. The ordinance is intended to minimize the adverse impacts associated with these activities’ storm water impacts; reduce habitat loss; protect water quality and critical areas; facilitate long-term forestry and establish administrative procedures for the issuance of permits, approval of plans and inspections; and provide penalties for violations of the ordinance. The SMP is adopted under authority of the state SMA, RCW Chapter 90.58. To manage shoreline development and uses, the SMA established a cooperative relationship between local governments and the Washington Department of Ecology (Ecology). The SMA applies to most streams, lakes greater than 20 acres, and marine waters as well as associated shorelands, wetlands, and floodplains. The SMA has three main purposes:
Encourage reasonable and orderly development of shorelines, with an emphasis on water-dependent and related uses that control pollution and prevent damage to the natural environment.
Protect the natural character of Washington shorelines, the land, vegetation, wildlife, and shoreline environment.
Promote public access and provide opportunities to enjoy views and recreational activities in shoreline areas.
Critical Areas
Applicability (K.C.C. 21A.24.020) These critical areas regulations apply to all land uses in King County. King County’s approval of a development proposal does not discharge the obligation of the property owners from complying with these CAO regulations. Presumption of Salmonids Public Rule In 2000, King County adopted a Public Rule that established a presumption of salmonid use for streams based on their physical characteristics. The standards were based on WDNR rules. A stream is presumed to be used by salmonids if:

King County National Flood Insurance Program Biological Opinion . Compliance Submittal and Programmatic Habitat Assessment
4‐11
a. The stream has a defined channel two feet or greater in width between the ordinary high water marks and has a gradient of 16 percent or less; or
b. The stream has a gradient of 20 percent or less, but greater than 16 percent, a defined channel two feet or greater in width, and has a contributing basin greater than 50 acres in size.
The Public rule is available at: http://your.kingcounty.gov/ddes/pub_rule/acrobat/21A-24SAFinal.pdf . The presumption of salmonids standards were incorporated into the CAO beginning in 2005. See K.C.C. 21A.24.355. Construction of Trails in Critical Areas and Buffers Public Rule King County has developed a Public Rule that establishes standards for the construction of a trail in a wetland or stream buffer or in a steep slope or landslide hazard area or buffer. The Public Rule is available at: http://your.kingcounty.gov/ddes/pub_rule/acrobat/21A-24Trails.pdf Disclosure by Applicant (K.C.C. 21A.24.090) An applicant must submit an affidavit declaring any knowledge of illegal alteration of any critical areas on the site, whether the applicant had previously been found in violation of any critical areas regulations and whether the violation has been corrected. Critical Area Review (K.C.C. 21A.24.100) Prior to any clearing, grading, or site preparation for a development proposal permit application or any other reason to alter a site, a critical area review must be conducted to see if a critical area or buffer is located on or near the development site. Critical areas that are located off site may have a buffer that extends into the proposed development. The critical area review will identify all critical areas and buffers and determine if the critical or buffer will be altered due to the development proposal and determine if the development proposal is consistent with this chapter. If impacts are proposed, the review will determine if the proposal has avoided impacts to the critical area and to insure that the mitigation measures and monitoring are consistent with the goals, objectives, and requirements of this chapter. Report Requirements (K.C.C. 21A.24.110) The applicant for a development proposal is required to submit a Critical Areas Report to the department for review. The department will determine whether a Level I, II, III or IV Critical Areas Report is required based on the information needed to adequately evaluate the proposal and identify probably impacts. Avoiding Impacts to Critical Areas (K.C.C. 21A.24.125) If the development is proposing impacts or alterations to critical areas or critical area buffers then the applicant must try to avoid the impact to the extent possible by applying mitigation sequencing. There are seven mitigation measures that are listed in order of priority. 1. Avoiding the impact or hazard by not taking a certain action; 2. Minimizing the impact or hazard by:
a. limiting the degree or magnitude of the action with appropriate technology; or b. taking affirmative steps, such as project redesign, relocation or timing;
3. Rectifying the impact to critical areas by repairing, rehabilitating or restoring the affected critical area or its buffer;
4. Minimizing or eliminating the hazard by restoring or stabilizing the hazard area through engineered or other methods;
King County National Flood Insurance Program Biological Opinion . Compliance Submittal and Programmatic Habitat Assessment
4‐12
5. Reducing or eliminating the impact or hazard over time by preservation or maintenance operations during the life of the development proposal or alteration;
6. Compensating for the adverse impact by enhancing critical areas and their buffers or creating substitute critical areas and their buffers; and
7. Monitoring the impact, hazard or success of required mitigation and taking remedial action.
The applicant is required to document in the critical area report that the appropriate mitigation measure was applied. Mitigation and Monitoring (K.C.C. 21A.24.130) Mitigation is required to compensate for impacts to the critical areas or critical area buffers. In addition, the sequential mitigation measures regarding avoidance of the impact must be applied and documented in the critical areas report. Once the mitigation plan has been approved by the department the applicant may implement the plan. When the plan is installed, the applicant will contact the department so that an inspection can be conducted. The applicant will also have to provide the department reasonable access to the property for future monitoring inspections during the monitoring period. The purpose of the monitoring plan is to monitor the performance of the mitigation plan and includes a contingency plan in the event of a failure of mitigation or of unseen impacts. The monitoring schedule may extend throughout the impact of the activity. The duration, frequency, and methods of monitoring depend on the goals and objectives and performance standards for the project. In general, mitigation projects will be monitored for at least three to five years. Offsite Mitigation (K.C.C. 21A.24.133) The applicant should mitigate for impacts to critical areas and buffers on or contiguous to the site. If this is not possible, then the department may approve mitigation off the development site if the applicant: Can demonstrate that it is not practical to mitigate on the site or contiguous to the site; and The offsite mitigation will achieve equal or greater hydrological, water quality and wetland
habitat features. Priority will be given to locations that are within the same drainage subbasin and are mitigation banking sites, resource mitigation reserves, private mitigation sites, or public mitigation sites authorized by this chapter. The department may require documentation that the mitigation site has been permanently preserved from future development. Critical Areas Markers and Signs (K.C.C. 21A.24.160) Permanent survey stakes and permanent signs delineating the boundary between adjoining property and the critical area tracts are required. When the critical area is not required to be placed in a track, permanent signs and fences are required. Notice of Critical Areas (K.C.C. 21A.24.170) The applicant/owner of any development proposal that contains a critical area, critical area buffer, or critical area mitigation, will be required to file a Notice of Critical Areas with King County Records and Elections. King County has adopted a Public Rule for Notice on Title requirements http://your.kingcounty.gov/ddes/pub_rule/acrobat/21a-24N-Title.pdf.

King County National Flood Insurance Program Biological Opinion . Compliance Submittal and Programmatic Habitat Assessment
4‐13
Critical Area Tracts (K.C.C. 21A.24.180) The applicant will use a recorded critical area tract to delineate and protect critical areas and buffers in development proposals for subdivisions, short subdivisions, or binding site plans. Building and Setback Lines (K.C.C. 21A.24.200) A building setback line (BSBL) of 15 feet is required between the edge of the critical area buffer and any building or structure. Landscaping, uncovered decks, building overhangs that do not exceed more than 18 inches into the setback area, driveways, patios, and drainfields, and some utility connections are allowed within the BSBL. Critical Areas Designation (K.C.C. 21A.24.500) The critical areas designation process enables a property owner or applicant to determine the conditions and constraints on site development. Through this process a property owner can establish a site plan that will be vested for a period of five years. The scope of the process can be adapted to meet the property owner’s needs. Options Include: Limited Scope Critical Areas Designations – address only those issues and that portion of
the property requested by the applicant. Comprehensive Critical Areas Designations – address all critical areas in the proposed
development area (Required for projects that propose new onsite septic and/or wells).
Onsite Septic System and Well Location Approval (K.C.C. 21A.24.510) King County requires a Certificate of Sewer Availability and Water Availability at the time of application for a residential building permit or for the subdivision of land. If the development proposal relies on either a new onsite septic system or new well, Seattle King County Department of Public Health must approve the location. A critical areas designation is required as part of the public health application process.
Alterations and Alteration Exceptions Overview
Alteration is a broadly defined term that includes almost any human activity that may affect a critical area or buffer. Whether the alterations is regulated or requires a permit to perform depends on the type of critical area and the type of activity. Alteration does not include passive recreation such as walking, fishing or any other similar activity. Alteration specifically includes: Grading; Filling; Dredging; Channelizing; Applying herbicides or pesticides or any hazardous substance; Discharging pollutants except storm water; Grazing domestic animals; Paving; Constructing; Applying gravel; Modifying topography for surface water management purposes; Cutting; Pruning;
King County National Flood Insurance Program Biological Opinion . Compliance Submittal and Programmatic Habitat Assessment
4‐14
Topping; Trimming; Relocating or removing vegetation; or Any other human activity that results or is likely to result in an impact to existing vegetation,
hydrology, fish or wildlife or their habitats.
The CAO divides critical areas into two basic categories. Those critical areas in which all alterations are allowed, and those where only specific alterations are allowed. The critical areas in which all alterations are allowed, subject to compliance with development standards include: Critical aquifer recharge area; Coal mine hazard area; Erosion hazard area; Flood hazard area except in the severe channel migration hazard area; Landslide hazard area under 40 percent slope; Seismic hazard area; and Volcanic hazard area. The critical areas where only specific alterations are allowed include: Severe channel migration hazard area; Landslide hazard area over 40 percent slope; Steep slope hazard area; Wetland and wetland buffers; Aquatic area and aquatic area buffers; Wildlife habitat conservation area; and Wildlife habitat network. For these critical areas, alterations are only allowed if they are classified as an allowed alteration or can be approved as an alteration exception. These two options are discussed in more detail below. Allowed Alterations (K.C.C. 21A.24.045) The allowed alterations are identified in a table in K.C.C. 21A.24.045. An allowed alteration may be subject to the permitting or approval requirements, such as a building, clearing or grading permit. Federal and state permits may also be required, particularly for alterations within wetlands and aquatic areas. The table includes a list of alteration activities grouped by subject matter under the following headings: Structures; Grading; Clearing; Forest practices; Roads; Bridges or culverts; Utilities and other infrastructure; Recreation areas; Habitat and science projects; Agriculture; and Other.

King County National Flood Insurance Program Biological Opinion . Compliance Submittal and Programmatic Habitat Assessment
4‐15
The critical areas where only specific alterations are allowed are included in this table. The definitions in K.C.C. chapter 21A.06 should be consulted since many of the listed activities include terms that are defined in the code. Specific development standards apply to each critical area and apply to all alterations within the critical areas. Alterations Utilizing the Regional Road Maintenance ESA Program Guidelines In January 2002, twenty-four Washington State agencies (including WSDOT) formally submitted a joint routine road maintenance program to the National Marine Fisheries Service (NOAA Fisheries) for approval under Limit 10 of the Endangered Species Act (ESA) section 4(d) rule. The Regional Road Maintenance ESA Program Guidelines (Regional Program) describes physical, structural, and managerial best management practices designed so that when they are used, singularly or in combination, they reduce road maintenance activities’ impacts on water and habitat. A Biological Opinion was prepared by NOAA Fisheries pursuant to section 7 of the ESA on the effects of the proposed qualification of the Regional Road Maintenance Program submitted by twenty-four jurisdictions in Washington State for 12 threatened salmonid Evolutionarily Significant Units (ESUs), pursuant to Limit No 10 (ii) of the NMFS 4(d) Rule. In this opinion, NOAA Fisheries concludes that the proposed action is not likely to jeopardize the continued existence of ESA-listed salmon or adversely modify their designated critical habitat. This document contains consultation on Essential Fish Habitat (EFH) pursuant to section 305 (d) of the Magnuson-Stevens Fishery Conservation and Management Act and its implementing regulations (50 CFR Part 600). NOAA Fisheries concludes that the proposed action may adversely affect designated EFH for 47 species of ground fish, 5 coastal pelagic species, and 3 species of Pacific Salmon. As required by section 305 (b)(4)(A) of the MSA, included are conservation recommendations that NOAA Fisheries believes will avoid, minimize, mitigate, or otherwise offset adverse effects on EFH resulting from the proposed action. King County requires use of the Regional Road Maintenance ESA Program Guidelines for many allowed alterations within critical areas. This document is available at: http://www.kingcounty.gov/transportation/kcdot/Roads/environment/RegionalRoadMaintenanceESAGuidelines/ESAProgramGuidelines.aspx. Alteration Exceptions (K.C.C. 21A.24.070) If a proposed alteration is not allowed in a critical area because the conditions cannot be satisfied or the alteration is not identified as an allowed alteration, the Department of Development and Environmental Services (DDES) may approve an alteration exception. Alteration exceptions are equivalent to zoning code variances. An alteration exception may allow the modification of a condition on the alteration table or allow an alteration not included on the table. Alteration exceptions may not modify a development standard. For example, the flood hazard regulations require compensatory storage for fill in the FEMA floodway. This is a development standard that cannot be modified through an alteration exception. There are two types of alteration exceptions: one for linear alterations and another for non-linear alterations. Linear Alteration Exceptions (K.C.C. 21A.24.070A.1) A linear alteration is infrastructure that supports development that is linear in nature and includes:
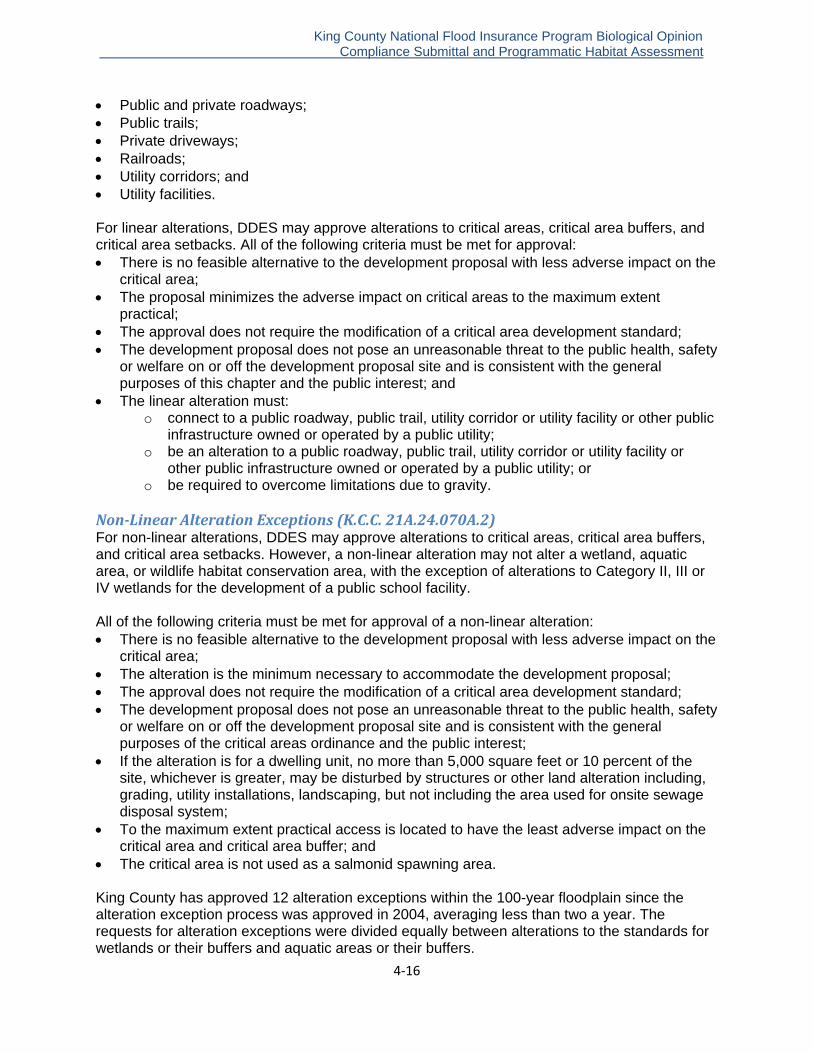
King County National Flood Insurance Program Biological Opinion . Compliance Submittal and Programmatic Habitat Assessment
4‐16
Public and private roadways; Public trails; Private driveways; Railroads; Utility corridors; and Utility facilities. For linear alterations, DDES may approve alterations to critical areas, critical area buffers, and critical area setbacks. All of the following criteria must be met for approval: There is no feasible alternative to the development proposal with less adverse impact on the
critical area; The proposal minimizes the adverse impact on critical areas to the maximum extent
practical; The approval does not require the modification of a critical area development standard; The development proposal does not pose an unreasonable threat to the public health, safety
or welfare on or off the development proposal site and is consistent with the general purposes of this chapter and the public interest; and
The linear alteration must: o connect to a public roadway, public trail, utility corridor or utility facility or other public
infrastructure owned or operated by a public utility; o be an alteration to a public roadway, public trail, utility corridor or utility facility or
other public infrastructure owned or operated by a public utility; or o be required to overcome limitations due to gravity.
NonLinear Alteration Exceptions (K.C.C. 21A.24.070A.2) For non-linear alterations, DDES may approve alterations to critical areas, critical area buffers, and critical area setbacks. However, a non-linear alteration may not alter a wetland, aquatic area, or wildlife habitat conservation area, with the exception of alterations to Category II, III or IV wetlands for the development of a public school facility. All of the following criteria must be met for approval of a non-linear alteration: There is no feasible alternative to the development proposal with less adverse impact on the
critical area; The alteration is the minimum necessary to accommodate the development proposal; The approval does not require the modification of a critical area development standard; The development proposal does not pose an unreasonable threat to the public health, safety
or welfare on or off the development proposal site and is consistent with the general purposes of the critical areas ordinance and the public interest;
If the alteration is for a dwelling unit, no more than 5,000 square feet or 10 percent of the site, whichever is greater, may be disturbed by structures or other land alteration including, grading, utility installations, landscaping, but not including the area used for onsite sewage disposal system;
To the maximum extent practical access is located to have the least adverse impact on the critical area and critical area buffer; and
The critical area is not used as a salmonid spawning area. King County has approved 12 alteration exceptions within the 100-year floodplain since the alteration exception process was approved in 2004, averaging less than two a year. The requests for alteration exceptions were divided equally between alterations to the standards for wetlands or their buffers and aquatic areas or their buffers.

King County National Flood Insurance Program Biological Opinion . Compliance Submittal and Programmatic Habitat Assessment
4‐17
Prior to the adoption of the CAO, the process for relief from the standards for protection of critical areas and their buffers was through a variance. Between 1998 and 2004 when the alteration exception process was approved, 32 variances were approved for properties within the 100-year floodplain. However, about one-third of those were for zoning standards such as street setbacks and building height. Of the variances to critical areas standards, the average was about four per year between 1998 and 2004 with the largest number in 1998. As with alteration exceptions, the request for variances to CAO standards was split about evenly between alterations to wetlands or their buffers and aquatic areas or their buffers. Reasonable Use Exception (K.C.C. 21A.24.070B) If application of the CAO will leave no reasonable use of the property, the director may approve alterations to critical areas, critical area buffers, critical area setbacks, and critical area development standards. All of the following criteria must be met for approval: There is no other reasonable use with less adverse impact on the critical area; The development proposal does not pose an unreasonable threat to the public health, safety
or welfare on or off the development proposal site and is consistent with the general purposes of the CAO and the public interest;
Any authorized alteration to the critical area or critical area buffer is the minimum necessary to allow for reasonable use of the property; and
If the reasonable use is for a dwelling unit, no more than 5,000 square feet or 10 percent of the site, whichever is greater, may be disturbed by structures or other land alteration including, grading, utility installations, and landscaping, but not including the area used for driveway , and onsite sewage disposal system.
Since 1998 King County has approved 55 reasonable use exceptions. Of those, seven were within a FEMA-mapped floodplain and were primarily to the steep slope standards.
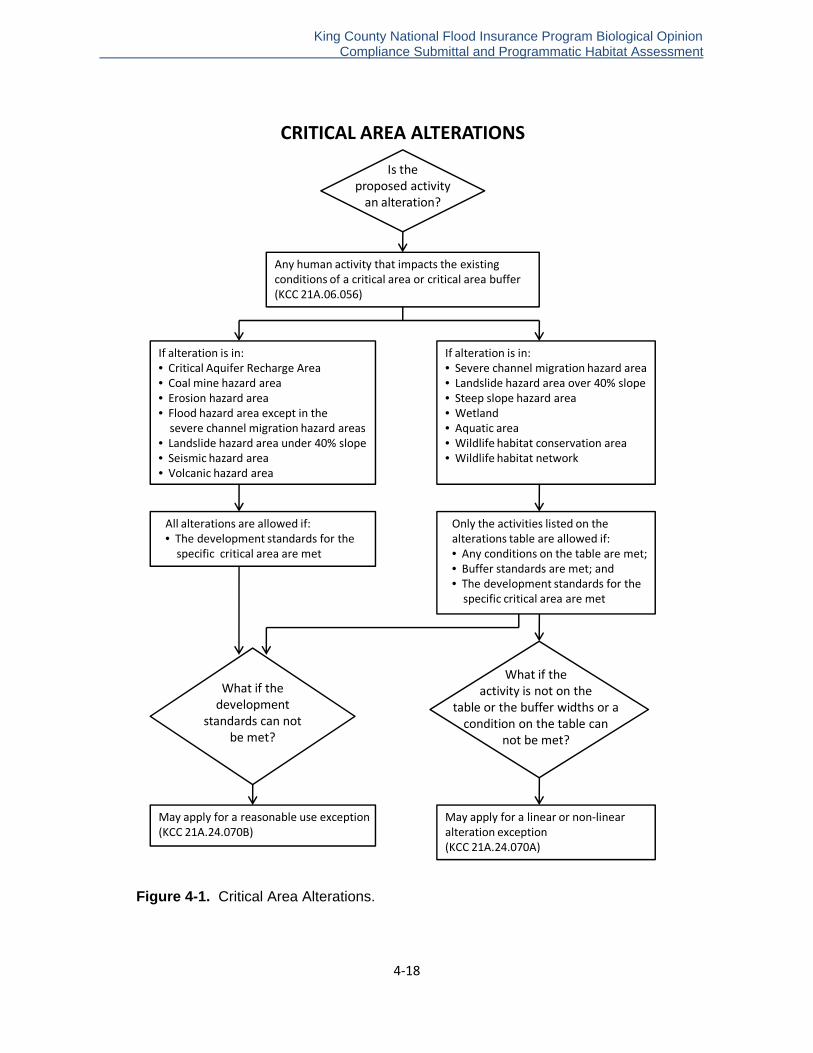
King County National Flood Insurance Program Biological Opinion . Compliance Submittal and Programmatic Habitat Assessment
4‐18
CRITICAL AREA ALTERATIONS
Is the proposed activity an alteration?
Any human activity that impacts the existing conditions of a critical area or critical area buffer (KCC 21A.06.056)
If alteration is in:• Critical Aquifer Recharge Area• Coal mine hazard area• Erosion hazard area• Flood hazard area except in the severe channel migration hazard areas
• Landslide hazard area under 40% slope• Seismic hazard area• Volcanic hazard area
If alteration is in:• Severe channel migration hazard area• Landslide hazard area over 40% slope• Steep slope hazard area• Wetland• Aquatic area• Wildlife habitat conservation area• Wildlife habitat network
Only the activities listed on the alterations table are allowed if:• Any conditions on the table are met;• Buffer standards are met; and• The development standards for the specific critical area are met
All alterations are allowed if:• The development standards for thespecific critical area are met
What if the development
standards can not be met?
What if the activity is not on the
table or the buffer widths or a condition on the table can
not be met?
May apply for a reasonable use exception (KCC 21A.24.070B)
May apply for a linear or non‐linear alteration exception(KCC 21A.24.070A)
Figure 4-1. Critical Area Alterations.
King County National Flood Insurance Program Biological Opinion . Compliance Submittal and Programmatic Habitat Assessment
4‐19
Agricultural Activities in Critical Areas
Agricultural activities are considered "alterations" under the critical areas regulations. How they are regulated depends upon the following factors: Whether the activity is currently existing or new. New includes existing activity that is
expanding into a new area; The type of agricultural activity involved such as tilling the soil or grazing livestock; Whether the new activity will occur on lands defined as prior-cleared or lands defined as
forested; The type of critical area involved; and Whether or not the property has a farm plan approved to meet regulatory requirements. Existing agricultural activities that have been in "continuous existence" may continue without change in all critical areas. They may, however, be subject to other regulatory measures such as the federal Clean Water Act or federal and state regulations for the use of pesticides. Continuous existence includes cyclical operations and managed periods of soil restoration, enhancement or other fallow states associated with horticultural and agricultural activities. The expansion of existing agricultural activities into critical areas and the establishment of agricultural activities on new lands or parcels are subject to the critical areas regulations in K.C.C. chapter 21A.24 and the Livestock Ordinance in K.C.C. chapter 21A.30. The specific regulation depends upon the type of agricultural activity and critical area involved. Types of Agricultural Activities Alterations (K.C.C. 21A.06.1390 and K.C.C. 21A.06.695, .700, .705, .710) “Agriculture” is not a defined term in the code. However many agricultural activities are specifically listed on the allowed alterations table under the following headings: Horticulture activity including tilling, disking, planting seeding, harvesting, preparing soil,
rotating crops and related activity; Grazing livestock; Construction or maintenance of livestock manure storage facility; Construction or maintenance of livestock flood sanctuary; Construction or maintenance of agricultural drainage; and Construction or maintenance of farm pond, fish pond or livestock watering pond. The alteration table also contains other agricultural activities, such as construction or maintenance of a farm field access drive, building a nonresidential structure or removal of noxious weeds that are not strictly limited to agriculture but may occur in an agricultural setting. Specific activities relating to agriculture are defined, including: Agricultural drainage (K.C.C. 21A.06.037); Farm field access drive (K.C.C. 21A.06.451); Grazed or tilled wet meadow (K.C.C. 21A.06.1390); Livestock, large livestock, small livestock and livestock sales. (K.C.C. 21A.06.695, .700,
.705, .710).
King County National Flood Insurance Program Biological Opinion . Compliance Submittal and Programmatic Habitat Assessment
4‐20
New agricultural activities or the expansion of existing agricultural activities is allowed in the following critical areas if in compliance with the development standards for each critical area: Critical aquifer recharge area; Coal mine hazard area; Erosion hazard area; Flood hazard areas except in the severe channel migration hazard area; Landslide hazard area under 40 percent slope; and Volcanic hazard area. New agricultural activities or the expansion of existing agricultural activities are only allowed if in compliance with general development standards and with special conditions in the following critical areas: Landslide hazard areas over 40 percent slope; Steep slope hazard areas; Wetland and wetland buffers; Aquatic area and aquatic area buffers; Severe channel migration hazard area; and Wildlife area and wildlife network.
Agricultural Ditch Maintenance Program
King County government sponsors a program called the Agricultural Drainage Assistance Program (ADAP) that provides both technical and financial assistance to landowners who have agricultural ditches that need maintenance. ADAP works with farmers to preserve water quality and protect fish through a set of best management practices implemented through a Farm Management Plan. See section below for additional information on Farm Management Plans. For a more comprehensive description of the ADAP program, see Appendix B.
Farm Management Plans
Farm Management Plans are one of several options for landowners to achieve the goals of the CAO. Farm plans are obtained from King Conservation District (KCD). In the event that the KCD is unable to provide services to landowners, the landowner may obtain an alternate agricultural plan from King County Department of Natural Resources and Parks. The KCD develops and approves a farm plan according to the planning process, standards, and best management practices in the Field Office Technical Guide as written by the Natural Resources Conservation Service (NRCS) and modified to reflect resource conditions of northwest Washington. The process is designed and conducted to simultaneously address the needs of the agricultural operation and the needs for resource protection on a specific site. When Farm Plans are Required (K.C.C. 21A.24.051) Farm plans related to this code are only required if a landowner: Needs to conduct a new activity that is permitted in the allowed alterations table in K.C.C.
21A.24.045 only in compliance with an approved farm plan;

King County National Flood Insurance Program Biological Opinion . Compliance Submittal and Programmatic Habitat Assessment
4‐21
Chooses to conduct a regulated activity according to the practices and conditions developed through the farm planning process instead of according to the practices and conditions otherwise described in the code;
Wants to avoid the costs and time of the permit process for activities that may be implemented according to the specification or practices of a farm plan;
Wants the advantages of the "small site drainage review process" for large agricultural structures that may otherwise require full drainage review related to a county building permit; or
Has received an order to implement a farm plan as the result of an enforcement case under the Water Quality Ordinance or the Livestock Management Ordinance.
Voluntary Farm Plans Farm plans are not required if the landowner chooses to meet the regulatory buffer standards in the code or to use the permit process to obtain an alteration exception or reasonable use exemption. Farm plans should be used by landowners who want to improve management of their land, water, animals, crops, pests, etc. Farm plans may be required to obtain federal, state or local funding to implement practices that will improve an agricultural operation. For example, a Dairy Nutrient Management Plan—a type of farm plan—is required for dairies of a certain size as a tool to meet state water quality standards. Required Farm Plans The KCD will develop farm plans that are to be used for regulatory purposes in the same way as voluntary farm plans—all approved to NRCS standards. The farm plans that landowners submit to the county for the benefits of alternative treatment under the standard regulations, may differ from voluntary farm plans in following ways: The portions of the farm plan that relate to the activity that is regulated under the code must
be implemented as approved by the KCD and not revised in significant ways; The county may confirm the implementation of the farm plan at some point in the future if
needed; If an agricultural structure is allowed in a buffer, future landowners must know that it is
contingent upon the property being in agriculture and the farm plan implemented, and may not be used or expanded for non-agricultural uses.
A KCD approved farm plan registered with the county is required for an agricultural landowner to conduct the following activities (no permit is needed): Installing a field access road, including a bridge for a livestock crossing over certain sizes of
streams in certain locations, in critical area buffers and in tilled or grazed wet meadows; Building a covered manure compost shed of less than 240 square feet in aquatic area and
wetland buffers, grazed or tilled wet meadows, and fish and wildlife habitat conservation areas;
Maintaining drainage functions in agricultural waterways (a state Hydraulic Project Approval (HPA) may be needed); and
Installing confinement areas of specified materials, depths and area in aquatic area and wetland buffers, grazed or tilled wet meadows, and fish and wildlife habitat conservation areas.
If the activities cannot be installed or conducted according to the conditions recommended by the farm plan process, the KCD will send the landowner to the county to proceed with the regular permit process.

King County National Flood Insurance Program Biological Opinion . Compliance Submittal and Programmatic Habitat Assessment
4‐22
A KCD approved farm plan registered with the county is required if an agricultural landowner proposes to conduct the following activities that also require a permit: Siting an agricultural structure over 240 square feet in an aquatic area or wetland buffer, a
grazed or tilled wet meadow, or a fish and wildlife habitat conservation area (otherwise precluded unless accepted through a variance or reasonable use process);
Siting a residence in a grazed or tilled wet meadow (otherwise precluded without going through the reasonable use process succeeds).
King County has adopted a public rule for Farm Management Plan, which is available at: http://www.kingcounty.gov/operations/policies/rules/utilities/put821pr.aspx The public rule adopts a set of best management practices for existing or proposed farm site conditions and related agricultural activities that are consistent with NRCS Field Office Technical Guide or with practices that have been developed mutually between King Conservation Service and King County. The best management practices include:
Best Management Practices 1: Small Manure Compost Facility Best Management Practices 2: Livestock Flood Sanctuaries in Flood Hazard Areas Best Management Practices 3: Manure Storage Facilities in Flood Hazard Areas Best Management Practices 4: Livestock Bridge
King County has approved 27 farm management plans since 2005, of which 14 were for property located within the 100-year floodplain. Of these 14 farm plans in the 100-year floodplain, one was for agricultural ditch drainage, one was to reduce a critical areas buffer and the remaining 12 were for the construction of a farm pad to provide a safe storage area for livestock, farm equipment, and other farm-related materials.
Rural Stewardship Planning
Under King County's CAO, rural landowners have the option to pursue a Rural Stewardship Plan if they would like to achieve some flexibility from standard critical areas protections when developing their property. The planning process offers landowners an opportunity to tailor wetland and stream buffers to their land use needs in exchange for committing to implement a management plan that will protect or enhance natural resources over the long term. Only properties zoned Rural Residential (RA) are eligible for the site-specific flexibility with CAO buffers allowed by a Rural Stewardship Plan. Rural Stewardship Modifications and SiteSpecific Protections (K.C.C. 21A.24.055) Buffers or other critical areas such as critical aquifer recharge areas or geologic hazard areas (i.e., steep slopes or landslide hazard areas) cannot be modified through a Rural Stewardship Plan. Properties zoned Rural Residential (RA) may, via a Rural Stewardship Plan, achieve modifications for: Minimum buffer widths for aquatic areas; Minimum buffer widths for wetlands; Minimum buffer widths for wildlife habitat conservation areas; and Maximum clearing restrictions.

King County National Flood Insurance Program Biological Opinion . Compliance Submittal and Programmatic Habitat Assessment
4‐23
Allowed buffer modifications and clearing restrictions will vary between plans, depending on elements including: Basin condition that the property lies in, as identified in the Basin and Shoreline Conditions
Map; For sites with aquatic areas, the location of the site within the drainage basin, with sites in
upper drainage basins having different requirements than sites in lower drainage basins; Existing critical area buffer condition, categorized as high, medium, or low; The ecological function of any wetlands; Site specific wildlife habitat evaluation, if applicable; and The size of the property, with properties greater than five acres having different clearing
requirements than properties that are five acres or smaller. Modifications to the noted critical area buffers will only be allowed in return for developing a long-term stewardship plan that incorporates BMPs to maintain, restore or enhance critical areas, buffers and native vegetation. Goals and Objectives of the Rural Stewardship Plan (K.C.C. 21A.24.055E) An approved Rural Stewardship Plan must achieve the following goals, listed in priority order: 1. To avoid impacts to critical areas to the maximum extent practicable; 2. If there is the potential to impact more than one category of wetland, type of aquatic
area, or more than one species of native fish or wildlife, impacts to the highest category of wetland, type of aquatic area, or most protected fish or wildlife species should be avoided first;
3. To maintain or enhance the natural hydrologic systems on site to the maximum extent practicable;
4. To maintain, restore or enhance native plants; 5. To maintain, restore or enhance the function and value of critical areas or critical area
buffers; 6. To minimize habitat fragmentation and enhance corridors between wetlands, riparian
corridors, wildlife habitat conservation areas and other priority habitats; 7. To minimize development impacts by implementing BMPs and meeting performance
standards over the life of the development; and 8. To monitor the effectiveness of stewardship practices and to implement additional
practices to maintain, restore or enhance critical area functions when necessary. King County has provided technical assistance to approximately 54 property owners which resulted in 15 approved Rural Stewardship Plans since 2005. Of these 15 Rural Stewardship Plans, 12 requested some flexibility from critical areas standards and the other three were approved for increased land stewardship. None of these sites are in a mapped 100-year floodplain, with the exception of a small sliver of floodplain along two or three properties. There has been little to no interest in the Rural Stewardship Program since mid 2008 and King County currently does not have a designated staff person to manage this program. King County has adopted a public rule to implement the rural stewardship program. The public rule is available at: http://www.kingcounty.gov/operations/policies/rules/utilities/put820pr.aspx For more information on rural stewardship planning visit: http://www.kingcounty.gov/environment/stewardship/sustainable-building/land-stewardship/rural-stewardship-plan.aspx
King County National Flood Insurance Program Biological Opinion . Compliance Submittal and Programmatic Habitat Assessment
4‐24
Forest Stewardship Planning
A Forest Stewardship Plan is a management plan that helps property owners reach individual ownership objectives and integrates the protection and/or enhancement of multiple forest resources. Developing a stewardship plan helps clarify short and long-term objectives for a property. Through the process, the property owner analyzes conditions of forest resources, determines what resource protection or enhancement measures would be beneficial and develops an organized sequence of activities to accomplish objectives. When is a forest stewardship plan required in King County? To apply for Timberlands or the Forest Stewardship Land category of the Public Benefit
Rating System current use taxation programs. To apply for a building permit within the Forest Production District. To accompany a Transfer of Development Rights or Forest Legacy application. To receive recognition as a "Stewardship Forest" (property sign and certificate). To avoid being subject to a Forest Practice Moratorium in conjunction with a Washington
State Class 2, 3 or 4S Forest Practice Permit, or a King County Non-Conversion Class 4G Permit.
To obtain a Class 4G Non-Conversion Permit. To practice forestry in a resource tract of a cluster development or in a resource area. To allow in critical area buffers firewood cutting, habitat restoration, and vegetation removal
for forest fire prevention. Criteria to Be Met for Forest Stewardship Plan Approval Must be signed by the landowner. Must address protection and/or enhancement of the forest resource categories. Must cover a timeframe of at least 10 years. Longer timeframe is encouraged. Must cover the entire forested ownership land that will be planted to forest. Management activities must be consistent with landowner objectives. Requirements for Forest Harvest (K.C.C. 16.82.140) In Washington State, the state has jurisdiction over forest practices through the State Forest Practices Act, RCW 76.09, and the State Forest Practices Rules, Title 222 WAC. The responsible agency is WDNR and for King County, the South Puget Regional office in Enumclaw. For the most part, the state retains jurisdiction over forest practices on lands being retained in forestry, and King County has jurisdiction over practices related to conversion of the property to another use. Class IV General Forest Practices are those on lands platted after 1960 and those that have been or are being converted to another use. As provided in RCW 76.09.240 in September 1999, the state transferred the administration and enforcement of Class IV General Forest Practices to King County. Class IV General Conversion Forest Practice If the forest practice is related to a conversion from forestry to another use or involves permanent clearing which will not be replanted, the activity requires a King County Clearing Permit and is subject to the county development standards.
King County National Flood Insurance Program Biological Opinion . Compliance Submittal and Programmatic Habitat Assessment
4‐25
Class IV General NonConversion Forest Practice If the forest practice takes place on a property that was platted after 1960 but is not a conversion to another use, and the property will be retained in forest use, the practice may be eligible for a King County Class IV General Non-Conversion Permit. In order to qualify for a Class IV General Non-Conversion Permit, the applicant must have a long-term Forest Management Plan, also known as a Forest Stewardship Plan, and must sign a statement of intent not to convert the property from forestry within six years. Although the county administers the permit, it recognizes that the property is remaining in forest use and requires that the permit meets the standards in RCW 76.09 and Title 222 WAC, rather than King County development standards. Forest Practices Moratorium In order to receive a Forest Practice Permit from WDNR, an applicant must sign a Notice of Moratorium on Non-Forestry Uses of the Land as required by RCW 76.09.060. The notice states that the land subject to the permit application will not be converted to an active use incompatible with timber growing within six years of permit approval. A copy of the notice is submitted to the local jurisdiction, which shall deny any applications for permits or approvals relating to non-forestry uses of the property. In addition, the notice is filed with King County Records and King County places a six-year moratorium on properties harvested under a Class IV General Non-Conversion Permit. There are two ways the applicant can avoid the effects of the moratorium before commencing the forest harvest. One is to develop a Conversion Option Harvest Plan, which is a harvest plan reviewed and approved by DDES and attached to the state Forest Practice Permit. The other is to harvest consistent with a Forest Management Plan that is approved by King County and that excludes the area proposed for development. The moratorium can be lifted only after King County makes a determination that the applicant was the unknowing subject of criminal trespass, timber theft or fraud, or the site is fully restored, meeting the requirements of K.C.C. 16.82.140. Conversion Option Harvest Plan With a Conversion Option Harvest Plan (COHP), forest practices can be conducted under state jurisdiction while the applicant retains the option to convert the property to another use within six years. Through a COHP, the applicant meets all development standards required by the county, thereby avoiding the Forest Practice Moratorium.
Coal Mine Hazard Areas
Coal mine hazards in King County are regulated to specify the nature of the foundation materials beneath proposed structures and the likelihood of the collapse of underground workings. If there are no underground workings, the only “hazard” is the potential presence of uncontrolled fill (mine waste) that might not provide suitable foundation support. If underground workings are present, then geologic and engineering studies are sometimes required to both quantify the nature of the hazard (basically, the potential for surface subsidence) and to recommend measures to deal with the hazard. Coal Mine Classifications (K.C.C. 21A.24.205) For the purposes of regulation, coal mine hazards are classified into three types of hazard:
King County National Flood Insurance Program Biological Opinion . Compliance Submittal and Programmatic Habitat Assessment
4‐26
1. "Declassified" coal mine hazard areas are those areas where the risk of catastrophic collapse is not significant and that the hazard assessment report has determined do not require any special engineering or hazard mitigation. These areas typically include sites not underlain by underground workings and sites underlain by underground workings that are in excess of 300 feet below the surface.
2. “Moderate” coal mine hazard areas are those areas that pose significant risk of property damage because of coal mine subsidence, but that can be mitigated through special engineering or architectural recommendations. These areas often include areas underlain or directly affected by abandoned underground workings that are less than 300 feet deep or with overburden cover-to-seam thickness ratios of less than 10 to one, depending on the inclination of the seam.
3. “Severe” coal mine hazard areas include those sites that pose a significant risk of catastrophic surface collapse, such as unmitigated openings (portals, adits, mine shafts, sinkholes, improperly filled mine openings) and other areas of past or probable surface collapse, including shallow subsurface workings extending to a depth of 150 feet.
Coal Mine Development Standards (K.C.C. 21A.24.210A) Within declassified coal mine hazard areas, all alterations are allowed without mitigation because it would have been determined in the course of evaluation that there is no effective hazard. Within moderate and severe hazard areas, the code requires that: Within moderate coal mine hazard areas, the risk of structural damage be minimized
(through effective mitigation); and Within severe coal mine hazard areas, the risk of personal injury be minimized or eliminated
(again through mitigation). Coal Mine Allowed Alterations (K.C.C. 21A.24.210D) All alterations are allowed in declassified hazard areas. Within moderate coal mine hazard areas and coal mine byproduct stockpiles (areas of uncontrolled fill), all alterations are allowed provided the risk of structural damage is minimized. Within severe hazard areas, the following alterations are allowed: All grading, filling, stockpile removal and reclamation activities in accordance with a hazard
assessment report for the purposes of mitigating threats to human health, public safety, environmental restoration, and property protection, if accompanied by plans and as-built drawings prepared by a professional engineer and submitted to the department for review;
Private road construction when significant risk of personal injury is eliminated or minimized; Building of less than 4,000 square feet of floor space that contains no living quarters or
places of employment or public assembly when significant risk of personal injury is eliminated or minimized; and
Additional land activities if consistent with recommendations within any mitigation plan required by a hazard assessment report.
Erosion Hazard Areas
Erosion hazard areas are those areas thought to be underlain by soils that are subject to severe erosion when exposed. The definition for erosion hazard areas includes, but is not limited to, several particular soil types that commonly erode rapidly because of the nature of their constituents and the engineering properties of the soil. The mapped extent of erosion hazard areas is based upon past regional soils mapping by several government agencies and is somewhat generalized.

King County National Flood Insurance Program Biological Opinion . Compliance Submittal and Programmatic Habitat Assessment
4‐27
Erosion Hazard Areas Development Standards (K.C.C. 21A.24.220) All alterations are allowed in erosion hazard areas provided they are done using appropriate sedimentation and erosion control practices. To insure that development within erosion hazard areas does not result in erosion or sedimentation problems, either within the affected parcel or on adjacent properties, clearing and grading is sometimes regulated and erosion control techniques are sometimes mandated. The regulations state that: Clearing in an erosion hazard area is only allowed from April 1 to October 1, except that
clearing of up to 15,000 square feet may occur at any time (most single-family residences fall well below this amount of clearing).
Clearing of noxious weeds may occur at any time. Forest practices (logging) regulated by the department are allowed at any time in
accordance with a Clearing and Grading Permit if the harvest is in conformance with applicable state laws.
All subdivisions, short subdivisions, binding site plans, or urban planned developments within erosion hazard areas are required to retain all existing vegetation until the applicable building permits are issued for individual lots. Erosion and sedimentation control plans are considered under the building permit review. However, larger-scale clearing may be approved if it is part of a larger-scale grading plan.
If the department determines that erosion from a development site poses a risk of damage to downstream wetlands or aquatic areas, then regular monitoring of the development activity may be required.
If water quality standards are not met, further development work may be suspended until such standards are met.
Flood Hazard Areas
Flood hazard areas are composed of: (K.C.C. 21A.24.230) 1. Floodplain; 2. Zero-rise flood fringe; 3. Zero-rise floodway; 4. FEMA floodway; and 5. Channel migration zones.
Figure 4-2. Zero Rise Floodway.
King County National Flood Insurance Program Biological Opinion . Compliance Submittal and Programmatic Habitat Assessment
4‐28
Development Standards in Flood Hazard Areas The flood hazard standards apply to all developments that are proposed within a flood hazard area. Alterations are allowed in flood hazard areas, except for in severe channel migration hazard areas, if done in accordance with the standards in the CAO. The allowed alterations in severe channel migration hazard areas are found in K.C.C. 21A.24.045. Key Standards in the ZeroRise Flood Fringe (K.C.C. 21A.24.240) Compensatory storage is required. Development is not allowed if depth is more than three feet and velocity is more than three
feet per second except for agricultural accessory structures, roads, bridges, utilities, surface water and flood structures and public park structures.
New lots need 5,000 square feet outside the zero-rise floodway and FEMA floodway. Subdivisions must identify base flood elevations and required flood protection elevations,
floodplain and floodway boundaries, channel migration zones, building setbacks, assure adequate drainage away from building sites, and include a notice that the site is in a floodplain and emergency access may not be available during flood events.
Utilities must be elevated or flood-proofed, allowed only if no alternative is available. The lowest floor must be elevated at least three feet above base flood elevation. Non-residential agricultural buildings with an assessed value of sixty-five thousand dollars or
less may be built at grade if flood-resistant materials are used; those over sixty-five thousand dollars of assessed value can request an exception to the three-foot elevation standard.
Foundations must contain openings to allow floodwaters to enter and exit. Flood-resistant materials are required. Post and piling techniques required, but alternatives are allowed through critical areas
report. All structures must be anchored. Critical facilities only allowed in certain portions of
floodplain and elevated to at least three feet above the base flood elevation or to the 500-year elevation, whichever is greater.
Farm pads and manure storage facilities are allowed through a farm plan and only if there is no suitable holding area on site that is outside the floodplain.
Recreational vehicles can be on site no more than one hundred and eighty days or be licensed and ready for highway use.
Key Standards in the Zero-Rise Floodway (K.C.C. 21A.24.250) The standards that apply to the zero-rise flood fringe also apply to the zero-rise floodway. No rise in the base flood elevation is allowed unless the flood insurance rate map is
changed and all affected property owners agree to the higher flood levels. Temporary structures and hazardous materials, except for those used in agriculture, must
be removed from floodplain during flood season. New residential structures or substantial improvements to residential structures are allowed
only on lots that were in existence before November 27, 1990 and have at least 5,000 square feet outside the zero-rise floodway.
Public and private utilities are allowed only if no feasible location is available outside the zero-rise floodway.
Critical facilities are not allowed except for structures that are dependent on being located in the zero-rise floodway, including, but not limited to bridge piers, bank stabilization structures and dams.

King County National Flood Insurance Program Biological Opinion . Compliance Submittal and Programmatic Habitat Assessment
4‐29
Key Standards in the FEMA Floodway (K.C.C. 21A.24.260) The standards that apply to the zero-rise flood fringe and zero-rise floodway also apply to
the FEMA floodway; No rise in the base flood elevation is allowed; New residences and nonresidential structures are prohibited except for agricultural buildings
and farm pads within the APDs; Maintenance, repair, replacement of existing farmhouses, substantially damaged existing
residential structures and historic structures in FEMA floodway is allowed if they meet certain standards;
Manure storage facilities are prohibited in the FEMA floodway.
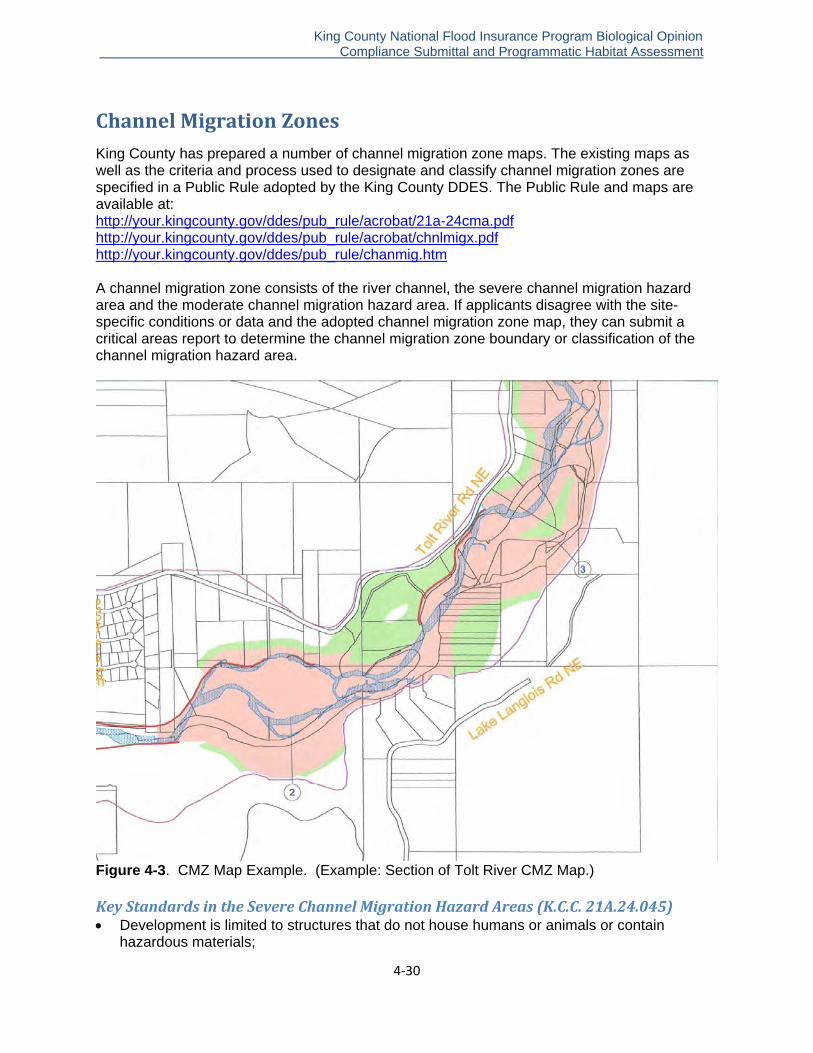
King County National Flood Insurance Program Biological Opinion . Compliance Submittal and Programmatic Habitat Assessment
4‐30
Channel Migration Zones
King County has prepared a number of channel migration zone maps. The existing maps as well as the criteria and process used to designate and classify channel migration zones are specified in a Public Rule adopted by the King County DDES. The Public Rule and maps are available at: http://your.kingcounty.gov/ddes/pub_rule/acrobat/21a-24cma.pdf http://your.kingcounty.gov/ddes/pub_rule/acrobat/chnlmigx.pdf http://your.kingcounty.gov/ddes/pub_rule/chanmig.htm A channel migration zone consists of the river channel, the severe channel migration hazard area and the moderate channel migration hazard area. If applicants disagree with the site-specific conditions or data and the adopted channel migration zone map, they can submit a critical areas report to determine the channel migration zone boundary or classification of the channel migration hazard area.
Figure 4-3. CMZ Map Example. (Example: Section of Tolt River CMZ Map.) Key Standards in the Severe Channel Migration Hazard Areas (K.C.C. 21A.24.045) Development is limited to structures that do not house humans or animals or contain
hazardous materials;
King County National Flood Insurance Program Biological Opinion . Compliance Submittal and Programmatic Habitat Assessment
4‐31
Replacement of existing structures is allowed if there is no expansion of the footprint of primary structures;
Existing accessory structures can be expanded if the total footprint of all structures on the lot does not exceed 1,000 square feet and there is no expansion of the footprint toward the channel migration;
Grading of up to fifty cubic yards on a lot less than five acres and clearing of up to 1,000 square feet or up to 35 percent of the severe channel migration hazard area on the lot if both are at least 165 feet away from the ordinary high water mark in the rural area or 115 feet from the ordinary high water mark in the urban area;
Removal of hazard trees, limited cutting and pruning, and firewood removal under a vegetation management plan;
Removal of noxious weeds; Maintenance of public roads; Construction of flood facilities to prevent bank erosion under conditions to protect public
roads, primary dwelling units, accessory dwelling units and accessory living quarters; Maintenance of existing flood facilities if the height is not increased unless that facility is
moved landward of existing location and there is no expansion waterward; and livestock manure facility if no alternative location and approved through a farm management
plan. Key Standards in the Moderate Channel Migration Hazard Areas (K.C.C. 21A.24.275) Maintenance, repair, modification, or additions to existing structures are allowed if the
footprint is not expanded toward the source of channel migration. New primary dwellings units, accessory dwelling units and accessory living quarters are
allowed if: o on lots created before February 16, 1995; o no feasible area outside the channel migration zone is available; and o located farthest away from the source of channel migration;
New accessory structures are allowed if: o no feasible area outside the channel migration zone is available; and o located farthest away from the source of channel migration;
When subdividing property, each lot must contain at least 5,000 square feet outside of the moderate channel migration hazard area and all lots must have safe access routes to the lot;
Infrastructure for new lots must be outside the moderate channel migration hazard area, except septic systems, which are allowed under certain circumstances.
Landslide Hazard Areas
Landslide hazards include a variety of geologic features that together present hazards to development both above and below the landslide. Such hazards include slope failures, large-scale block failures, debris flows, rock falls, rapid undercutting by stream erosion or wave action, and snow avalanches. The general intent of the CAO is to encourage avoidance of landslide hazards. If avoidance is not desirable or practical, then the regulations call for scientific and engineering studies that both characterize the nature of the specific hazard and recommend ways to eliminate the hazard to the proposed development.
King County National Flood Insurance Program Biological Opinion . Compliance Submittal and Programmatic Habitat Assessment
4‐32
Landslide Hazard General Provisions (K.C.C. 21A.24.280) Landslide hazard areas may be separated into two varieties for the purposes of considering the applicable development restrictions: Landslide hazard areas that are also steep slopes (> 40 percent grade); and Landslide hazard areas that are on slopes of less than 40 percent grade. Landslide hazard areas and steep slopes may be totally overlapping and even intimately related, but they are still considered separately (as are all critical areas) for the purposes of regulation. Landslide Hazard Allowed Alterations (K.C.C. 21A.24.280) In general, all alterations are allowed on landslide hazard areas provided that the landslide hazard itself is mitigated through proper engineering of the development so that the risk of property damage and injury is minimized or eliminated. A geologic characterization and evaluation of the landslide hazard is typically required (sometimes including deep boreholes and subsurface modeling by a geologist with experience in landslide investigations) that includes proposals for landslide mitigation sufficient to protect the property and the people from the hazard. Review of the development plans by the geotechnical engineer is required. No alteration is permitted that would increase the landslide hazard to adjacent properties. Landslide Hazard Areas Slopes More Than 40% Grade (K.C.C. 21A.24.280A) For landslide hazard areas that are also steep slopes, both the landslide requirements above and the additional steep slope requirements must be met. See K.C.C. 21A.24.045 for an expanded listing of allowed alterations on steep landslide hazards, which in this case is nearly identical to that for steep slopes. Landslide Hazard Areas Slopes Less Than 40% Grade (K.C.C. 21A.24.280BE) For landslide hazard areas that are not on steep slopes, only the requirement for appropriate mitigation must be met. However, on all landslide hazard areas, vegetation removal is prohibited unless it is a necessary part of an allowed alteration. In some cases, removal of the vegetation would not affect the landslide hazard so clearing and grading may be allowed without any mitigation, however all alterations are subject to critical areas review and a critical areas study may be required to evaluate the impacts of the hazard and the proposed development. Landslide Hazard Buffers and Setbacks (K.C.C. 21A.24.280B) Unmitigated landslide hazards are protected (i.e., isolated from the public) with buffers and building setbacks. The typical buffer is 50 feet, with an additional 15-foot building setback, but the buffer may be reduced or enlarged depending upon the specific site conditions and the nature of the hazard.
Seismic Hazard Areas
Seismic hazard areas in King County are those areas where the foundation soils may be subject to liquefaction (loss of strength and bearing capacity) or lateral spreading during an earthquake. Typically, these soils are found in low-lying areas near bodies of water, such as along the larger streams and around lakes. Sandy soils that are saturated with water are particularly prone to liquefaction.

King County National Flood Insurance Program Biological Opinion . Compliance Submittal and Programmatic Habitat Assessment
4‐33
Seismic Hazard Areas Development Standards (K.C.C. 21A.24.290) Alterations and developments in seismic hazard areas can only be approved if either: An evaluation of the potential seismic hazard area shows that there is no seismic hazard of
the type described above (an investigative study by a consulting geotechnical engineer or geologist is sometimes required), or
The development plans include mitigation based on the best available engineering and geological practices that either eliminates or minimizes the risk of structural damage or injury resulting from seismically induced settlement or liquefaction.
The requirements for mitigation (and indeed for any further geotechnical or geological investigation) may be waived for mobile homes, additions or alterations to existing structures that do not increase occupancy or affect the risk of damage or injury, or buildings of less than 2,500 square feet that are not dwelling units or places of public assembly (such as barns, agricultural buildings, garages, etc.). Seismic Hazard Areas Allowed Alterations All alterations are allowed, provided that either it is shown that no seismic hazard exists, or that mitigation is included in the development proposal that eliminates or minimizes the risk of structural damage or injury resulting from seismically induced settlement or liquefaction.
Volcanic Hazard Areas
Volcanic hazards as addressed by King County are largely restricted to potential mudflows along stream drainages originating on Mt. Rainier. The White River upstream of Mud Mountain Dam is particularly affected. The White River downstream of the Mud Mountain Dam and other parts of the Green and Duwamish River basins are similarly affected but to a lesser degree. Other hazards related to an eruption of Mt. Rainier, such as ash falls, are not addressed by the King County Zoning Code. This section is not effective until King County has completed the required modeling and mapping of volcanic hazard areas, which has not yet been completed (K.C.C. 21A.24.300). Volcanic Hazard Areas Development Standards (When mapping is complete) For volcanic hazard areas located along the White River upstream of the Mud Mountain Dam, the King County Zoning Code requires that: No critical facilities, apartments, townhouses, or commercial structures be allowed; All new lots created by subdivision, short subdivision, or binding site plan shall designate
building areas and building setbacks outside of the volcanic hazard areas; and Notice of critical areas is required for new single detached dwellings on existing lots. For volcanic hazard areas along the White River downstream from the Mud Mountain Dam and along the Green and Duwamish Rivers, the department shall evaluate development proposals for critical facilities for risk of inundation or flooding resulting from mudflows originating on Mt. Rainier. Critical facilities shall be designed to withstand, without damage, the effects of mudflows equal in magnitude to the prehistoric electron mudflow. Volcanic Hazard Areas Allowed Alterations Effectively, all alterations are allowed without meeting any of the above development standards because the volcanic hazard areas restrictions are not yet in effect.

King County National Flood Insurance Program Biological Opinion . Compliance Submittal and Programmatic Habitat Assessment
4‐34
Steep Slope Hazard Areas
Steep slopes (meaning slopes greater than 40 percent grade and greater than 10 feet tall) are regulated as critical areas in King County because of the potential for erosion problems and landsliding on the slopes. In general, the King County Zoning Code encourages avoidance of the slopes and actually prohibits development on and near the slopes in many cases. Substantial revegetation (planting both trees and understory plants) may be required at sites that have been cleared illegally. Steep Slope Hazard Areas General Provisions (K.C.C. 21A.24.310) Steep slopes can be divided into four groups for regulatory purposes: 1. Steep slopes that are less than 10 feet high in vertical extent, which are NOT regulated by
King County and so not affected by these development standards; 2. Steep slopes that are between 10 and 20 feet high, which may be totally exempted from
these development standards based upon a critical area report prepared by a geotechnical engineer or geologist that approves of the proposed development and concludes that no impact will result from the development of the steep slope;
3. Steep slopes greater than 20 feet high, which are regulated by these development standards; and
4. Steep slopes that were created by previous legal grading, which can be altered and/or developed if the alteration is geotechnically feasible. A report prepared by a geotechnical engineer is typically required. The report must approve the proposed development/alteration and conclude that no impact will result either to the development or to adjacent properties.
Steep Slope Buffers (K.C.C. 21A.24.310B) A buffer is required around all edges of a steep slope, which shall consist of unaltered native vegetation on undeveloped parcels or maintained landscaping or vegetation on lots that have been previously legally altered from their natural state. The width of the buffer is determined based upon a critical area report prepared by a geotechnical engineer or geologist. In the absence of a critical area report, the buffer width is a minimum of 50 feet. For single detached dwelling units only, the department may waive the critical area report requirement and authorize buffer reductions if the department determines that the reduction will adequately protect the development and the critical area. Unless otherwise provided for, removal of any vegetation from a steep slope or steep slope buffer is prohibited. Steep Slope Allowed Alterations (K.C.C. 21A.24.045D) For steep slopes greater than 20 feet high (and their buffers) that have not been developed previously: Utility lines in certain locations (including above ground electric lines, septic/sewer lines and
water lines, with restoration/revegetation as appropriate); Certain surface and storm water facilities, such as discharge sites, provided other restrictions are met;
Mining and mineral extraction; Water wells (as utilities, but NOT well houses or maintained access roads, with
restoration/revegetation as appropriate); Trails and viewing platforms; Hazard tree removal; Restoration/revegetation using native plants; Maintenance and/or creation of view corridors through very limited trimming and pruning;
See Public Rule at: http://your.kingcounty.gov/ddes/pub_rule/acrobat/21A-24View.pdf

King County National Flood Insurance Program Biological Opinion . Compliance Submittal and Programmatic Habitat Assessment
4‐35
Construction of a farm field access road if in compliance with a farm management plan; Limited clearing and grading needed to prepare a critical areas report; and Stabilization of the slope necessary to protect existing structures and other features. For steep slopes greater than 20 feet high (and their buffers) that have been developed prior to November of 1990 all of the above plus the following: Maintenance and repair of existing structures (provided there is no landslide hazard that is
not mitigated); Maintenance of existing landscaping, pavement, slope stabilization, uncovered decks, and
other existing alterations; Replacement of existing structures (provided there is no landslide hazard that is not
mitigated); and Expansion of existing structures provided:
o there is no expansion of the footprint of non-residential structures, o for dwelling units, the expansion is no more than 1,000 square feet of footprint, and o the location of any expansions have the least impact on the critical area.
All expansions must be accompanied by landslide hazard mitigation as necessary. For steep slopes greater than 20 feet high (and their buffers) that were created or altered through previously legal grading such that the current surface topography can be considered manmade, all of the above is allowed along with new construction and development provided that the alterations are geotechnically feasible. A report prepared by a geotechnical engineer is typically required that approves the proposed development/alteration and concludes that no impact will result either to the development or to adjacent properties.
Critical Aquifer Recharge Areas
Critical aquifer recharge areas (CARAs) are areas in King County that overlie significant groundwater resources and are particularly susceptible to ground water contamination should pollutants be released on the surface or in the shallow subsurface (such as from a leaking fuel tank, a landfill, or pesticides on a golf course). Significant groundwater resources include those used by public water wells as well as sole-source aquifers. Another element of CARA is the protection of groundwater recharge; this element is addressed countywide via clearing and grading standards and storm water standards that aim to protect and maximize existing groundwater recharge. CARAs are located along many major rivers in King County and along some of the largest tributaries of those rivers. This is due to the abundant groundwater supplies that are close to the land surface in those areas and because those areas have high permeability soils. Vashon and Maury Island are entirely covered by CARAs, but these are a special case with respect to the rest of the county because Vashon and Maury, being isolated islands surrounded by undrinkable salt water, depend exclusively on well water from local recharge for their water supply. Mapped CARAs and Categories (K.C.C. 21A.24.311) The CARAs were mapped based on the geology and physical characteristics of the soils in the county, depth to groundwater, and known aquifers and active groundwater supplies. An assessment of the relative sensitivity of the areas led to the classification of CARAs into three
King County National Flood Insurance Program Biological Opinion . Compliance Submittal and Programmatic Habitat Assessment
4‐36
categories (numbered I, II, and III), with Category I being the most critical and Category III the least. There are three categories of Critical Aquifer Recharge Areas: (K.C.C. 21A.24.13) 1. Category I critical aquifer recharge areas include those mapped areas that King County has
determined are highly susceptible to groundwater contamination and that are located within a sole source aquifer or a wellhead protection area.
2. Category II critical aquifer recharge areas include those mapped areas that King County has determined:
a. have a medium susceptibility to ground water contamination and are located in a sole source aquifer or a wellhead protection area; or
b. are highly susceptible to ground water contamination and are not located in a sole source aquifer or wellhead protection area.
3. Category III critical aquifer recharge areas include those mapped areas that King County has determined have low susceptibility to groundwater contamination and are located over an aquifer underlying an island that is surrounded by saltwater. This includes all of Vashon and Maury Islands that is not either Category I or Category II.
New Developments in Category I CARAs (K.C.C. 21A.24.316A) Except as otherwise provided, the following new development proposals and alterations are not allowed on a site located in a Category I CARA: Transmission pipelines carrying petroleum or petroleum products; Sand and gravel, and hard rock mining unless:
o the site has mineral zoning as of the effective date of this section; or o mining is a permitted use on the site and the CARA was mapped after the date a
complete application for mineral extraction on the site was filed with the department; Mining of any type below the upper surface of the saturated ground water that could be used
for potable water supply; Disposal of radioactive wastes, as defined in chapter 43.200 RCW; Hydrocarbon extraction; Commercial wood treatment facilities on permeable surfaces; All underground storage tanks, including tanks that are exempt from the requirements of
chapter 173 WAC, with hazardous substances, as defined in chapter 70.105 RCW, that do not comply with standards of chapter 173-360 WAC and K.C.C. Title 17;
Above-ground storage tanks for hazardous substances, as defined in chapter 70.105 RCW, unless protected with primary and secondary containment areas and a spill protection plan;
Golf courses; Cemeteries; Wrecking yards; Landfills for hazardous waste, municipal solid waste or special waste; On lots smaller than one acre, an onsite septic system, unless:
o the system is approved by the Washington State Department of Health and the system either uses an up flow media filter system or a proprietary packed-bed filter system or is designed to achieve approximately 80 percent total nitrogen removal for typical domestic wastewater; or
o the Seattle-King County Department of Public Health determines that the systems described above will not function on the site.
King County National Flood Insurance Program Biological Opinion . Compliance Submittal and Programmatic Habitat Assessment
4‐37
New Developments in Category II CARAs (K.C.C. 21A.24.316B) Except as otherwise provided, the following new development proposals and alterations are not allowed on a site located in a Category II CARAs: Mining of any type below the upper surface of the saturated ground water that could be used
for potable water supply; Disposal of radioactive wastes, as defined in chapter 43.200 RCW; Hydrocarbon extraction; Commercial wood treatment facilities located on permeable surfaces;
o Except for a Category II CARAs located over an aquifer underlying an island that is surrounded by saltwater, underground storage tanks with hazardous substances, as defined in chapter 70.105 RCW, that do not meet the requirements of chapter 173-360 WAC and K.C.C. Title 17.
o For a Category II CARA on Vashon and Maury Islands, all underground storage tanks, including tanks that are exempt from the requirements of chapter 173 WAC, with hazardous substances, as defined in chapter 70.105 RCW, that do not comply with standards of chapter 173-360 WAC and K.C.C. Title 17.
Above-ground storage tanks for hazardous substances, as defined in chapter 70.105 RCW, unless protected with primary and secondary containment areas and a spill protection plan;
Wrecking yards; Landfills for hazardous waste, municipal solid waste, or special waste; On lots smaller than one acre, an onsite septic system, unless:
o the system is approved by the Washington State Department of Health and the system either uses an up flow media filter system or a proprietary packed-bed filter system or is designed to achieve approximately 80 percent total nitrogen removal for typical domestic wastewater; or
o the Seattle-King County Department of Public Health determines that the systems described above will not function on the site.
New Developments in Category III CARAs (K.C.C. 21A.24.316C) Except as otherwise provided, the following new development proposals and alterations are not allowed on a site located in a Category III CARA: Disposal of radioactive wastes, as defined in chapter 43.200 RCW; Hydrocarbon extraction; Commercial wood treatment facilities located on permeable surfaces; Underground storage tanks, including tanks that are exempt from the requirements of
chapter 173 WAC, with hazardous substances, as defined in chapter 70.105 RCW, that do not comply with standards of chapter 173-360 WAC and K.C.C. Title 17;
Above ground storage tanks for hazardous substances, as defined in chapter 70.105 RCW, unless protected with primary and secondary containment areas and a spill protection plan;
Wrecking yards; and Landfills for hazardous waste, municipal solid waste, or special waste.
Existing Underground Storage Tanks in CARAs (K.C.C. 21A.24.316D) The following standards apply to development proposals and alterations that are substantial improvements on a developed site located in a CARA: The owner of an underground storage tank, including tanks that are exempt from the
requirements of chapter 173 WAC, with hazardous substances, which are located in a
King County National Flood Insurance Program Biological Opinion . Compliance Submittal and Programmatic Habitat Assessment
4‐38
Category I or III CARA or a Category II on Vashon and Maury Islands shall either bring the tank into compliance with standards of chapter 173-360 WAC and K.C.C. Title 17 or properly decommission or remove the tank, and;
The owner of an underground storage tank in a Category II CARA that is not on Vashon and Maury Islands shall bring the tank into compliance with the requirements of chapter 173-360 WAC and K.C.C. Title 17 or shall properly decommission or remove the tank.
Other CARA Provisions (K.C.C. 21A.24.316E,F,G,I) Some other provisions of the CARA restrictions call for water well decommissioning and monitoring as well as instituting best management practices to limit storm water runoff. These include: In any CARA, property owners shall properly decommission all wells that are abandoned.
This may include plugging the abandoned well with an approved inert and impervious substance so that groundwater contamination is not possible in the future. Ecology regulations describe the requirements for decommissioning in WAC 173-160-381, which is already required by state law.
Within the urban growth area, proposals for new residential development shall incorporate best management practices included in the King County Surface Water Design Manual in order to infiltrate storm water runoff to the maximum extent practical.
On an island surrounded by saltwater, the owner of a new well located within 200 feet of the ordinary high water mark of the marine shoreline shall test the well for chloride levels using testing protocols approved by the Washington State Department of Health. The owner shall report the results of the test to Seattle-King County Department of Public Health and to the Department of Natural Resources and Parks. If the test results indicate saltwater intrusion is likely to occur (or has occurred), the King County Department of Natural Resources and Parks, in consultation with Seattle-King County Department of Public Health, shall recommend appropriate measures to prevent saltwater intrusion.
Nonconforming Development Proposals and Future Evaluation in CARAs (K.C.C. 21A.24.316H) On sites greater than 20 acres, the department may approve development proposals otherwise prohibited by this ordinance if the applicant demonstrates through a critical areas report that the development proposal is located outside the CARA and that the proposal will not cause a significant adverse environmental impact to the CARA. King County may also evaluate and implement, as appropriate, ground water management plans and wellhead protection programs to further protect ground water resources.
Wetlands
Within the CAO, wetlands are defined as non-aquatic areas that are inundated or saturated by ground water at a frequency and duration sufficient to support, and under normal circumstances supports, a prevalence of vegetation typically adapted for life in saturated soil conditions. Except for features intentionally made for the purpose of mitigation, a wetland does not include an artificial feature made from a non-wetland area. There are many types of wetlands from open water, emergent, forested, scrub-shrub, to wetland meadows. Several new definitions have been added or modified in the CAO regarding wetlands.
King County National Flood Insurance Program Biological Opinion . Compliance Submittal and Programmatic Habitat Assessment
4‐39
Wetlands that are wet meadows, grazed or tilled have been redefined as an emergent wetland that has grasses, sedges, rushes or other herbaceous vegetation as its predominant vegetation and has been previously legally converted to agricultural activities. A new definition, wetland complexes, has been added to the CAO. A wetland complex is a grouping of two or more wetlands with the establishment of vegetated corridors between the wetlands. Best available science found that wetlands are also influenced by the immediate adjoining area, the watershed and the landscape. Grouping wetlands and connecting them with corridors will reduce wetland isolation and habitat fragmentation, results of development that lead to decreased species richness and local extinctions of wetlands.
Wetland Categories (K.C.C. 21A.24.318) The CAO has adopted Ecology’s Wetland Rating methodology. Wetlands are classified into four categories using the Washington State Wetland Rating System for Western Washington. The Washington State Wetland Rating System categorizes wetlands based on specific attributes such as rarity, sensitivity, and function. The rating system uses a point system designed to differentiate between wetlands based on their sensitively to disturbance, their rarity, our ability to replace them and the functions that they provide. The wetland categories are:
Wetlands Category I Wetlands that represent a unique or rare wetland type, or are more sensitive to disturbance than most wetlands, or are relatively undisturbed and contain ecological attributes that are impossible to replace within a human lifetime, or provide a high level of functions, score of 70 points (out of 100) on the wetland rating form. Category 1 wetlands include estuarine, bogs, mature and old-growth forests, coastal lagoons, wetlands that perform many functions very well. Category 1 wetlands may be part of the “priority habitat” as defined by the Washington State Department of Fish and Wildlife (WDFW), or be identified as a Natural Heritage wetland by the Washington Natural Heritage Program of the Department of Natural Resources (DNR). Wetlands Category II Wetlands that are difficult, though not impossible to replace, and provide high levels of some functions. These wetlands occur more commonly than Category I wetlands but still need a relatively high level of protection. Category II wetlands include, but are not limited to, wetlands that perform functions well and score 51 to 69 points for habitat. Wetlands Category III Wetlands with a moderate level of functions, scores between 30 to 50 points for habitat and generally have been disturbed in some ways, and are often less diverse or more isolated. Wetlands Category IV Wetlands that have the lowest levels of functions (scores less than 30 points for habitat) and are often heavily disturbed. These are wetlands that we should be able to replace or improve. These wetlands may provide some important function and also need to be protected.
Wetland Buffers (K.C.C. 21A.24.325) A wetland buffer is a designated area contiguous to and intended to protect and be an integral part of a wetland. Beyond providing protection for wetlands, buffers also serve valuable

King County National Flood Insurance Program Biological Opinion . Compliance Submittal and Programmatic Habitat Assessment
4‐40
functions for a variety of wildlife species as they provide habitat for foraging, breeding, and protective cover. Buffers are measured horizontally from the edge of the delineated wetland. The buffer width is determined based on the category of the wetland, the location of the wetland inside or outside of the UGA established by the King County Comprehensive Plan and habitat score based on Ecology’s Wetland Rating System. Table 4-3. Required buffer widths for wetlands located within the UGA. WETLAND CATEGORY
BUFFER WIDTH
Category I Natural Heritage Wetlands 215 Bog 215 Estuarine 175 Coastal lagoon 175 Habitat score from 29 to 36 points 225 Habitat score from 20 to 28 points 150 Category I wetlands not meeting any criteria below 125 Category II Estuarine 135 Habitat score from 29 to 36 points 200 Habitat score from 20 to 28 points 125 Category II wetlands not meeting any criteria below 100 Category III Habitat score from 20 to 28 points 125 Category III wetlands not meeting any criteria below 75 Category IV 50
Buffer Modification for Urban Wetlands (K.C.C. 21A.24.325A.23.) Urban buffers may be increased by 50 feet if they are Category I or II wetlands with habitat scores greater than 20 points and are located within 300 feet of a priority habitat area as defined by WDFW unless: The applicant provides a relatively undisturbed vegetated corridor at least 100 feet wide
between the wetland and all priority habitat areas located within 300 feet of the wetland. The corridor is protected through a conservation easement, native growth protection easement or equivalent; and
The applicant implements all applicable mitigation measures identified in Table 4-4. Urban buffers may be decreased by 25 feet if: The applicant implements applicable mitigation measures identified in Table 4-4; or The applicant proposes alternate mitigation to reduce the impacts of the development and
the department determines the alternative provides equivalent mitigation.

King County National Flood Insurance Program Biological Opinion . Compliance Submittal and Programmatic Habitat Assessment
4‐41
Table 4-4. Mitigation to reduce buffers for wetlands located within the UGA. DISTURBANCE MEASURES TO MINIMIZE
IMPACTS ACTIVITIES THAT MAY CAUSE THE DISTURBANCE
Lights Direct lights away from wetland Parking lots, warehouses, manufacturing, high density residential
Noise Place activity that generates noise away from the wetland
Manufacturing high density residential
Toxic runoff Route all new untreated runoff away from wetland, or covenants limiting use of pesticides within 50 feet of wetland, or implement integrated pest management program
Parking lots, roads, manufacturing, residential areas, application of agricultural pesticides, landscaping
Change in water regime
Infiltrate or treat, detain and disperse into buffer new runoff from impervious surfaces
Any impermeable surface, lawns, tilling
Pets and human disturbances
Privacy fencing or landscaping to delineate buffer edge and to discourage disturbance of wildlife by humans and pets
Residential areas
Dust BMPs for dust Tilled fields Degraded buffer condition
Nonnative plants to be removed and replaced with native vegetation per an approved landscaping plan
All activities potentially requiring buffers

King County National Flood Insurance Program Biological Opinion . Compliance Submittal and Programmatic Habitat Assessment
4‐42
Table 4-5. Required buffer widths for wetlands located outside of the UGA (K.C.C. 21A.24.325B).
INTENSITY OF IMPACT OF ADJACENT LAND USE
HIGH IMPACT
MODERATE IMPACT
LOW IMPACT
WETLAND CATEGORY AND CHARACTERISTICS Category I Category I wetlands not meeting any of the criteria below
100 feet 75 feet 50 feet
Natural Heritage Wetlands 250 feet 190 feet 125 feet Bog 250 feet 190 feet 125 feet Estuarine 200 feet 150 feet 100 feet Coastal lagoon 200 feet 150 feet 100 feet Habitat score from 29 to 36 points 300 feet 225 feet 150 feet Habitat score from 20 to 28 points 150 feet 110 feet 75 feet Water quality improvement score from 24 to 32 points and habitat score less than 20 points
100 feet 75 feet 50 feet
Category II Category II wetlands not meeting any of the criteria below
100 feet 75 feet 50 feet
Estuarine 150 feet 110 feet 75 feet Interdunal 150 feet 110 feet 75 feet Habitat score from 29 to 36 points 300 feet 225 feet 150 feet Habitat score from 20 to 28 points 150 feet 110 feet 75 feet Water quality improvement score from 24 to 32 points and habitat score less than 20 points
100 feet 75 feet 50 feet
Category III Category III wetlands not meeting any of the criteria below
80 feet 60 feet 40 feet
Habitat score from 20 to 28 points 150 feet 110 feet 75 feet Category IV 50 feet 40 feet 25 feet Buffer Width Modification for Wetlands Located Outside of the Urban Growth Area (K.C.C. 21A.24.325) Buffer width averaging if:
o Ecological structure and function of the buffer after averaging is equivalent to or greater than before averaging;
o Averaging includes the corridors of a wetland complex; o The total buffer area after averaging is equivalent to or greater than the area of the
buffer before averaging; o The additional buffer is contiguous with the standard buffer; and o If buffer averaging allows a structure or landscape area to intrude into the area that
was buffer area before averaging, the resulting landscaped area can not extend

King County National Flood Insurance Program Biological Opinion . Compliance Submittal and Programmatic Habitat Assessment
4‐43
more than 15 feet from the edge of the structure’s footprint towards the reduced buffer.
Wetlands that contain documented habitat for endangered, threatened or species: o The department will establish the appropriate buffer based on a habitat assessment
to ensure that the buffer provides adequate protection for the sensitive species; o The department may apply the buffer increase rules; o The department may apply the buffer reduction rules; and o The department may apply the buffer averaging rules.
Wetlands with Steep Slope or Landslide Hazard Areas, the buffer width is the greater of either the wetland buffer or 25 feet beyond the hazard area.
The buffer widths for wetland complexes located outside of the Urban Growth Boundary or within the Urban Growth Boundary and designated as “high” on the Basin and Shoreline Conditions Map:
o The buffer width for each wetland within the complex is the same width as the buffer width required for the category of the wetland;
o If the buffers of the wetlands in the complex do not touch or overlap with at least one other wetland in the complex, then a corridor is required between the two wetlands.
A wetland complex is defined as a grouping of two or more wetlands (not including grazed wetland meadows) that include the following criteria:
o Each wetland included in the complex is within 500 feet of the delineated edge of at least one other wetland complex;
o The complex includes at least one Category I or II wetland, three Category III wetlands, or four Category IV wetlands;
o The area between each wetland and at least one other wetland in the complex is predominately vegetated with shrubs and trees; and
o There are no barriers to migration or dispersal of amphibian, reptile, or mammal species that are commonly recognized to exclusively or partially use wetland and wetland buffers during a critical life cycle stage such as breeding, rearing, or feeding.
Where a legally established road transects a buffer, the minimum required buffer width may be reduced to the edge of the roadway if the buffer on the other side of the roadway:
o Does not provide additional protection from the proposed development or the wetland; and
o Provides insignificant biological, geological, or hydrological buffer functions. The department may approve a modification of the minimum required buffer for voluntary
enhancement or restoration projects that are not mitigation for a development proposal or alteration.
The department may approve a modification of the minimum buffer through a Rural Stewardship Plan or Farm Management Plan.
Wetland Delineation The delineation will be consistent with the methods in the 1997 Washington State Wetlands Identification and Delineation Manual, titled Washington State Department of Ecology publication #96-94. The wetland delineation must be conducted by an expert. Level II, III, and IV reports are required when additional information is needed to determine potential impacts or risks and appropriate mitigation.
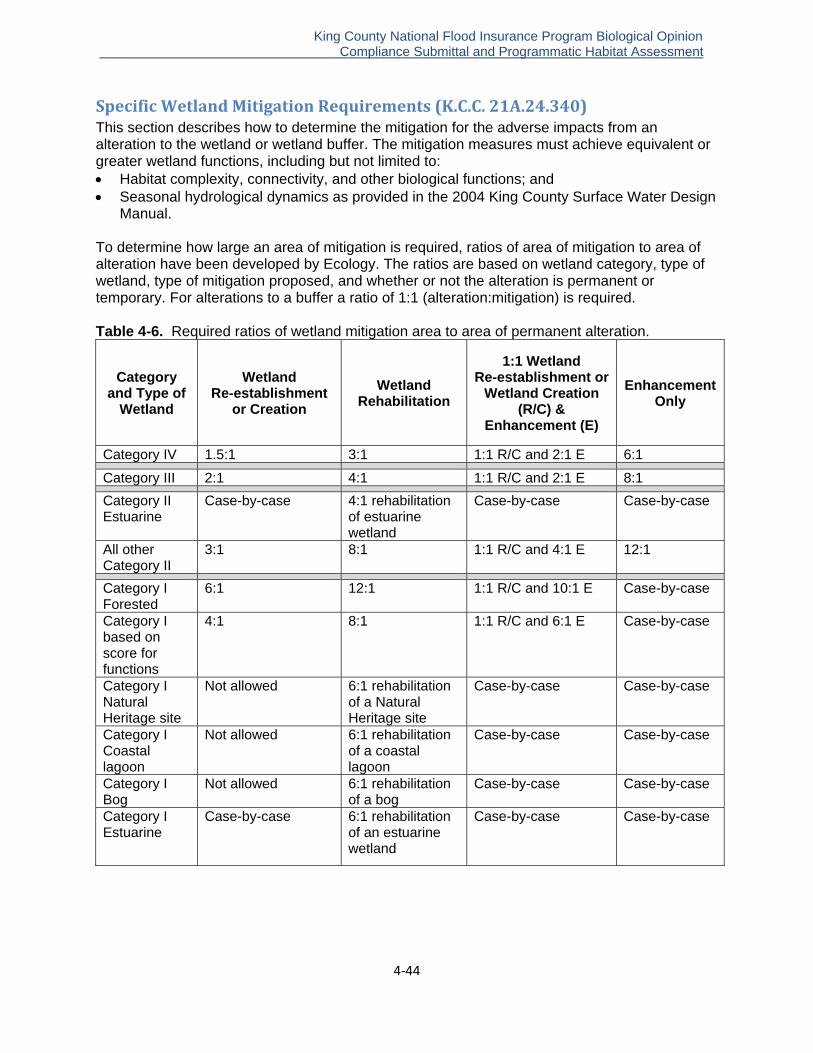
King County National Flood Insurance Program Biological Opinion . Compliance Submittal and Programmatic Habitat Assessment
4‐44
Specific Wetland Mitigation Requirements (K.C.C. 21A.24.340) This section describes how to determine the mitigation for the adverse impacts from an alteration to the wetland or wetland buffer. The mitigation measures must achieve equivalent or greater wetland functions, including but not limited to: Habitat complexity, connectivity, and other biological functions; and Seasonal hydrological dynamics as provided in the 2004 King County Surface Water Design
Manual. To determine how large an area of mitigation is required, ratios of area of mitigation to area of alteration have been developed by Ecology. The ratios are based on wetland category, type of wetland, type of mitigation proposed, and whether or not the alteration is permanent or temporary. For alterations to a buffer a ratio of 1:1 (alteration:mitigation) is required. Table 4-6. Required ratios of wetland mitigation area to area of permanent alteration.
Category and Type of
Wetland
Wetland Re-establishment
or Creation
Wetland Rehabilitation
1:1 Wetland Re-establishment or
Wetland Creation (R/C) &
Enhancement (E)
Enhancement Only
Category IV 1.5:1 3:1 1:1 R/C and 2:1 E 6:1
Category III 2:1 4:1 1:1 R/C and 2:1 E 8:1
Category II Estuarine
Case-by-case 4:1 rehabilitation of estuarine wetland
Case-by-case Case-by-case
All other Category II
3:1 8:1 1:1 R/C and 4:1 E 12:1
Category I Forested
6:1 12:1 1:1 R/C and 10:1 E Case-by-case
Category I based on score for functions
4:1 8:1 1:1 R/C and 6:1 E Case-by-case
Category I Natural Heritage site
Not allowed 6:1 rehabilitation of a Natural Heritage site
Case-by-case Case-by-case
Category I Coastal lagoon
Not allowed 6:1 rehabilitation of a coastal lagoon
Case-by-case Case-by-case
Category I Bog
Not allowed 6:1 rehabilitation of a bog
Case-by-case Case-by-case
Category I Estuarine
Case-by-case 6:1 rehabilitation of an estuarine wetland
Case-by-case Case-by-case

King County National Flood Insurance Program Biological Opinion . Compliance Submittal and Programmatic Habitat Assessment
4‐45
Table 4-7. Required ratios of wetland mitigation area to area of temporary alteration.
Wetland category
Permanent conversion of forested and shrub wetlands into emergent wetlands
Mitigation for temporal loss of forested and shrub wetlands when the impacted wetlands will be revegetated to forest
or shrub communities
Enhancement Rehabilitation Creation or restoration
Enhancement Rehabilitation Creation or
restoration
Category I 6:1 4.5:1 3:1 3:1 2:1 1.5:1
Category II
3:1 2:1 1.5:1 1.5:1 1:1 .75:1
Category III
2:1 1.5:1 1:1 1:1 .75:1 .5:1
Category IV
1.5:1 1:1 .75:1 Not applicable
Not applicable
Not applicable
Wetland mitigation ratios may be increased in Table 4-6 and Table 4-7 when:
o There is uncertainty as to the success of the proposed restoration or creation; o A significant period of time will elapse between impact and mitigation; o The proposal will result in a lower category of wetland or reduce functions; and o The alteration causing the impact was unauthorized.
Wetland mitigation ratios may be decreased in Table 4-6 and Table 4-7 when: o There is a high likelihood of success based on hydrologic data; o The proposal will provide functions and values greater than wetland being impacted; o Mitigation has been conducted in advance of the impacts and is successful; and o When several wetlands hydrogeomorphic classes are found in one boundary then
flexibility is provided.
Agreement to Modify Wetlands Mitigation Ratios (K.C.C. 21A.24.342) The department may enter into an agreement to modify mitigation ratios for entities that have demonstrated a strong track record of success in terms of mitigation and have assurance of financial resources to be able to carry through a long-term (8 to 10+ years) monitoring program. Allowed Alterations to Wetlands and Buffers (K.C.C. 21A.24.335) The standards established in K.C.C. 21A.24.045, the allowed alterations table, apply to all developments that are proposed within a wetland or its buffer. Alterations are allowed in the wetland and buffer if the alteration complies with the development standards, mitigation requirements, and other applicable requirements in this chapter. Additional standards include: The applicant cannot introduce non-indigenous plants or wildlife to the Puget Sound lowland
unless authorized by state or federal permit approval;
King County National Flood Insurance Program Biological Opinion . Compliance Submittal and Programmatic Habitat Assessment
4‐46
A Category IV wetland less than 2,500 square feet that is not part of a wetland complex may be altered by relocating its functions into a new wetland on the site in accordance with an approved mitigation plan; and
Alterations to Category I wetlands containing bogs or fens are limited to harvesting of plant material for restoration projects and data collection and research.
Allowed Alterations in Wetlands and Wetland Buffers (K.C.C. 21A.24.045)
Single detached dwelling unit in wetlands and wetland buffers Construction of single detached dwelling units is limited to farm residences in grazed or tilled wet meadows and subject to limitations.
Nonresidential farm structures in wetlands and wetland buffers Construction of nonresidential farm structures is allowed within grazed or tilled wet meadows or buffers of wetlands or aquatic areas where: The site is predominately used for the practice of agriculture; The structure is in compliance with an approved Farm Management Plan; The structure is either:
o on or adjacent to existing nonresidential impervious surface areas, additional impervious surface area is not created waterward of existing impervious surface areas and the area was not used for crop production,
o higher in elevation and no closer to the severe channel migration hazard area, or aquatic area or aquatic area buffer than its existing position,
o located away from existing impervious surface area that is determined to be the optimum site in the Farm Management Plan;
Best management practices associated with the structure specified in the Farm Management Plan are installed and maintained; and
Installation of fencing in accordance with K.C.C. chapter 21A.30 does not require the development of a Farm Management Plan if required best management practices are followed and the installation does not require clearing of critical areas or their buffers.
Existing structures in wetlands and wetland buffers Existing structures may be maintained or repaired. Expansion or replacement of existing primary structures is allowed only in the buffer or building setback outside a severe channel migration hazard area if: Expansion or replacement does not increase the footprint of a nonresidential structure; The expansion or replacement does not increase the footprint of a dwelling unit by more
than 1,000 square feet and the location of the expanded area has the least adverse impact on the critical area;
The structure was not established as the result of a variance, buffer averaging or Reasonable Use Exception; and
To the maximum extent practical, the expansion or replacement is not located closer to the critical area or within the relic channel that can be connected to an aquatic area.

King County National Flood Insurance Program Biological Opinion . Compliance Submittal and Programmatic Habitat Assessment
4‐47
Allowed upon another portion of an existing impervious surface outside a severe channel migration hazard area if: The structure is not located closer to the critical area; and The existing impervious surface within the critical area or buffer is not expanded. Remodeling in wetlands and wetland buffers Interior remodeling is allowed. Docks or piers in wetlands and wetland buffers Construction of new docks or piers are limited to seasonal floating docks or piers in a Category II, III, or IV wetland or its buffer or along a lake shoreline or its buffer where: The existing and zoned density of all properties abutting the entire lake shoreline averages
three dwelling units per acre or more; At least 75 percent of the lots abutting the shoreline or 75 percent of the lake frontage,
whichever constitutes the most lake frontage, has been developed with dwelling units; There is not any significant vegetation where the alteration is proposed and the loss of
vegetation was not the result of any violation of law; The wetland or lake shoreline is not a salmonid spawning area; Hazardous substances or toxic material are not used; Allowed on Type N or O aquatic areas if hazardous substances or toxic materials are not
used; and Allowed on Type S or F aquatic areas outside of the severe channel migration hazard area
and if in compliance with K.C.C. Title 25 (Shorelines). Maintenance, repair, or replacement of dock or pier is allowed when located on a lake and if in compliance with K.C.C. Title 25. Grading in wetlands and wetland buffers Grading is not allowed in a wetland. Slope stabilization in wetlands and wetland buffers Construction of new slope stabilization is allowed only where erosion or landsliding threatens a structure, utility facility, roadway, driveway, public trails, aquatic area or wetland if, to the maximum extent practical, stabilization work does not disturb the slope and its vegetation cover or any associated critical areas. Maintenance of existing slope stabilization is allowed when not performed under the direction of a government agency only if: The maintenance does not involve the use of herbicides, hazardous substances, sealants or
other liquid oily substances in aquatic areas, wetlands or their buffers; and When the maintenance or the replacement of bridges or culverts involves waters used by
salmonids, the work is in compliance with ditch standards in a Public Rule and the maintenance of culverts is limited to removal of sediment and debris from the culvert and its inlet, invert and outlet and the stabilization of the disturbed or damaged bank or channel immediately adjacent to the culvert and does not involve the excavation of a new sediment trap adjacent to the inlet.
King County National Flood Insurance Program Biological Opinion . Compliance Submittal and Programmatic Habitat Assessment
4‐48
Clearing in wetlands and wetland buffers Clearing is allowed for the removal of hazard trees and vegetation as necessary for surveying or testing purposes. Clearing is also allowed for harvesting of plants and plant materials, such as plugs, stakes, seeds or fruits, and for restoration and enhancement projects. Cutting of firewood is subject to the following: Not allowed in a wildlife habitat conservation area; Allowed within a critical area for personal use with an approved forest management plan or
rural stewardship plan; and Allowed within a wildlife network with an approved management plan under
K.C.C.21A.14.270 as recodifed by this ordinance. Removal of vegetation for fire safety is allowed in buffers if in accordance with best management practices approved by the King County Fire Marshal. Removal of noxious weeds or invasive vegetation is allowed if: In accordance with an approved Forest Management Plan, Farm Plan, or Rural Stewardship
plan; or Without an approved Forest Management Plan or Rural Stewardship Plan if:
o removal is undertaken with hand labor, including hand-held mechanical tools, unless King County Noxious Weed Control Board otherwise prescribes the use of riding mowers, light mechanical cultivating equipment or biological control methods. The area of noxious weed or invasive vegetation removal must be stabilized to avoid re-growth or regeneration and the area must be re-vegetated with native or non-invasive vegetation and stabilized against erosion, and
o herbicide use is in accordance with federal and state law.
Forest practices in wetlands and wetland buffers Non-Conversion Class IV-G Forest Practice is allowed if conducted in accordance with chapter 76.09 RCW and Title 222 WAC and a Forest Management Plan is approved for the site by the King County Department of Natural Resources and Parks. The property owner must also provide a notice of intent in accordance with RCW 76.09.060 that the site will not be converted to non-forestry use within six years.
Roads in wetlands and wetland buffers Construction of new roads, right-of way structure on unimproved right-of way if: There is no feasible location with less adverse impact on an aquatic area and its buffer; The road corridor is not located over habitat used for salmonid rearing or spawning or by
any species listed as endangered or threatened by the state and federal government unless the department determines there are no other feasible crossing sites;
The road corridor width is minimized to the maximum extent practical; The construction occurs during approved periods for instream work; and The corridor will not change or diminish the overall aquatic area flow peaks, duration or
volume or the flood storage capacity.
King County National Flood Insurance Program Biological Opinion . Compliance Submittal and Programmatic Habitat Assessment
4‐49
Maintenance of public road right-of-way structure is allowed: When performed by or at the direction of or authorized by a government agency in
accordance with the regional road maintenance guidelines. Expansion beyond public road right-of-way structure is allowed when: There is no feasible location with less adverse impact on an aquatic area and its buffer; The road corridor is not located over habitat used for salmonid rearing or spawning or by
any species listed as endangered or threatened by the state and federal government unless the department determines there are no other feasible crossing sites;
The road corridor width is minimized to the maximum extent practical; The construction occurs during approved periods for instream work; and The corridor will not change or diminish the overall aquatic area flow peaks, duration or
volume or the flood storage capacity. Repair, replacement or modification within the roadway is allowed when performed by or at the direction of or authorized by a government agency in accordance with the regional road maintenance guidelines.
Driveways and private access roads in wetlands and wetland buffers Construction of driveways or private access roads is allowed if: An alternative access is not available; Impact to the critical area is minimized to the maximum extent practical including the use of
walls to limit the amount of cut and fill necessary; The risk associated with landslide and erosion is minimized; Access is located where it is least subject to risk from channel migration; or Construction occurs during approved periods for instream work
Farm field access drives in wetlands and wetland buffers Construction of farm field access drives are allowed if in compliance with an approved Farm Management Plan. Maintenance of a driveway, private access road, or farm field access drive is allowed. When the maintenance is not performed under the direction of a government agency, the maintenance is allowed only if: The maintenance does not involve the use of herbicides, hazardous substances, sealants or
other liquid oily substances in aquatic areas, wetlands or their buffers; and When the maintenance or the replacement of bridges or culverts involves waters used by
salmonids, the work is in compliance with ditch standards in a Public Rule and the maintenance of culverts is limited to removal of sediment and debris from the culvert and its inlet, invert and outlet and the stabilization of the disturbed or damaged bank or channel immediately adjacent to the culvert and does not involve the excavation of a new sediment trap adjacent to the inlet.
King County National Flood Insurance Program Biological Opinion . Compliance Submittal and Programmatic Habitat Assessment
4‐50
Bridges or culverts in wetlands and wetland buffers Maintenance or repair of a bridge or a culvert is allowed when: Performed by or at the direction of a government agency in accordance with regional road
maintenance guidelines. The maintenance does not involve the use of herbicides, hazardous substances, sealants or
other liquid oily substances in aquatic areas, wetlands or their buffers, and When the maintenance or the replacement of bridges or culverts involves waters used by
salmonids the work is in compliance with ditch standards in a Public Rule and the maintenance of culverts is limited to removal of sediment and debris from the culvert and its inlet, invert and outlet and the stabilization of the disturbed or damaged bank or channel immediately adjacent to the culvert and does not involve the excavation of a new sediment trap adjacent to the inlet.
Replacement of a bridge or culvert is allowed when: Performed by or at the direction of a government agency in accordance with regional road
maintenance guidelines. The replacement of a bridge or culvert is made fish passable in accordance with the most
recent WDFW manuals or with the NOAA Fisheries guidelines for federally listed salmonid species.
Expansion of a bridge or culvert is allowed if it is necessary to bring the bridge or culvert up to current standards; and There is no other feasible alternative solution available with less impact on the aquatic area
and its buffer, and The bridge or culvert must be located to the maximum extent practical to minimize impacts
to the aquatic area and its buffer.
Utilities and other infrastructure in wetlands and wetland buffers New utility corridors or utility facilities are allowed if they are located within an existing roadway and are consistent with the regional road maintenance guidelines. New utilities and other infrastructure are limited to construction of pipelines, cables, wires and support structures of utility facilities within utility corridors. The following requirements must be met: New pipelines, cables, wires and support structures are allowed only when there is no
alternative location with less adverse impact on the critical area and critical area buffer; New utility corridors must meet all of the following requirements to the maximum extent
practical; o do not locate over habitat used for salmonid rearing or spawning or by a species
listed as endangered or threatened by the state or federal government unless the department determines that there is no other feasible crossing site.
o do not locate a new utility corridor in an aquatic area if the mean annual flow rate is equal to or greater than 20 cubic feet per second, and
o paralleling the channel or following a down-valley route near the channel should be avoided.
To the maximum extent practical, new utility corridors must be located as follows; o minimize the width of the utility corridor;
King County National Flood Insurance Program Biological Opinion . Compliance Submittal and Programmatic Habitat Assessment
4‐51
o minimize removal of trees greater than 12 inches diameter at breast height; and o provide additional, contiguous and undisturbed critical area buffer, equal in area to
the disturbed critical area buffer area including allowed maintenance roads. To the maximum extent practical, access for maintenance of utility corridors must be at
limited access points into the aquatic area buffer rather than by a parallel maintenance road. If a parallel maintenance road is necessary, the following standards must be met:
o minimize the width of the maintenance road to the maximum extent practical and in no event can it be greater than 15 feet; and
o locate the maintenance road contiguous to the utility corridor on the side of the utility corridor farthest from the critical area.
New utility corridors or utility facilities must not change or diminish the overall aquatic area hydrology or flood storage capacity.
Construction must occur during approved periods for in stream work. This period is usually from about June 15 to September 30, but work at other times can sometimes be approved on a site-by-site basis. The timing is usually specified in the HPA and in DDES permit conditions.
The utility corridor must serve multiple purposes and properties to the maximum extent practical.
Bridges or other construction techniques that do not disturb the critical areas must be used to the maximum extent practical.
Bored, drilled or other trenchless crossings of the aquatic area or buffer must be laterally constructed at least 4 feet below maximum depth of scour for the base flood.
Bridge piers or abutments for bridge crossing must not be placed within the FEMA floodway or the ordinary high water mark.
Open trenching may only be used during low flow periods and only within aquatic areas when they are dry. The department may approve open trenching of Type S or F aquatic areas only if there is no feasible alternative and equivalent or greater environmental protection can be achieved.
Minor communication facilities may collocate on existing utility facilities if: o no new transmission support structure is required; and o equipment cabinets are located on the transmission support structure.
Maintenance, repair or replacement is allowed for private individual utility service connections on site or to public utilities if the disturbed area is not expanded and no hazardous substances, pesticides or fertilizers are applied.
Wells and onsite sewage disposal systems in wetlands and wetland buffers Maintenance or repair of existing wells is allowed if the disturbed area is not expanded, clearing is limited to the maximum extent practical and no hazardous substances, pesticides or fertilizers are applied. Maintenance or repair of onsite sewage disposal systems is allowed.
Surface water systems in wetlands and wetland buffers Construction of new surface water conveyance systems is allowed if conveying the surface water into the wetland buffer and discharging into the wetland buffer or at the wetland edge has
King County National Flood Insurance Program Biological Opinion . Compliance Submittal and Programmatic Habitat Assessment
4‐52
less adverse impact upon the wetland or wetland buffer than if the surface water was discharged at the buffer’s edge and allowed to naturally drain through the buffer. Maintenance, repair or replacement of existing surface water conveyance systems are allowed if: Performed by or at the direction of a government agency in accordance with the regional
road maintenance guidelines; If they are located within an existing roadway and are consistent with the regional road
maintenance guidelines; and Constructed only with vegetation. Construction of new surface water flow control or surface water quality treatment facilities are allowed if they are located within an existing roadway and are consistent with the regional road maintenance guidelines. Maintenance or repair or existing surface water flow control or surface water quality treatment facility is allowed if performed by or at the direction of a government agency in accordance with the regional road maintenance guidelines.
Instream structures in wetlands and wetland buffers New instream structures or instream work is allowed if performed by or at the direction of a government agency in accordance with the regional road maintenance guidelines. Existing instream structures may be maintained or repaired.
Recreation areas in wetlands and wetland buffers Construction of a new trail is not allowed in a wildlife habitat conservation area. Otherwise, construction of a new trail is allowed as far landward as feasible in the buffer if: The trail surface is not made of impervious material except that public multipurpose trails
may be made of impervious materials if they meet all the requirements in K.C.C. chapter 9.12; and
To the maximum extent practical, buffers are expanded equal to the width of the trail corridor including disturbed area.
Maintenance of outdoor public park facilities, trails and publicly improved recreation areas is allowed only if the maintenance: Does not involve the use of herbicides or other hazardous substances except for the
removal of noxious weeds or invasive vegetation; When salmonids are present, the maintenance must be in compliance with the King County
Public Rule: Maintenance of Agricultural Ditches and Streams Used by Salmonids; and Does not involve the expansion of any roadway, lawn, landscaping, ditch, culvert,
engineered slope or other improved area being maintained.
Habitat and science projects in wetlands and wetland buffers Habitat restoration or enhancement projects are limited to:
King County National Flood Insurance Program Biological Opinion . Compliance Submittal and Programmatic Habitat Assessment
4‐53
Those sponsored by a public agency that has natural resource management as a primary
function or by a federally recognized tribe; Habitat restoration or enhancement projects prepared by a qualified biologist; or Conducted in accordance with an approved Forest or Farm Management Plan or Rural
Stewardship Plan. Scientific sampling for salmonids is allowed if done in accordance with a scientific sampling permit issued by WDFW and where applicable, an incidental take permit issued under Section 10 of the ESA. Drilling and testing for critical areas reports is allowed for limited clearing and grading needed to prepare a Critical Areas Report. If associated spoils are contained on site (i.e. in a manner that the spoils will not mobilize or erode), the following are allowed: Data collection and research if carried out by non-mechanical or hand-held equipment to the
maximum extent practical; Survey monument placement; Site exploration and gage installation if performed in accordance with state-approved
sampling protocols and accomplished to the maximum extent practical by hand-held equipment; and
Similar work associated with an incidental take permit issued under Section 10 or consultation under Section 7 of the ESA.
Agriculture activities in wetlands and wetland buffers Horticulture activities, including tilling, disking, planting, seeding, harvesting, preparing soil, rotating crops and related activities, and grazing of livestock are allowed if these activities have been in existence since January 1, 2005, and there is no expansion into the critical area or critical area buffer. "Continuous existence" includes cyclical operations and managed periods of soil restoration, enhancement or other fallow states associated with these horticultural and agricultural activities. The expansion of existing or new agricultural activities is allowed where: The site is predominately involved in the practice of agriculture; There is no expansion into an area that has been cleared under I, II, III, IV-S Forest Practice
Permit; or Is more than 10,000 square feet with tree cover at a uniform density of more than 90 trees
per acre and with the predominant mainstem diameter of the trees at least 4 inches in diameter at breast height, not including areas that are actively managed as agricultural crops for pulpwood, Christmas trees or ornamental nursery stock;
The activities are in compliance with an approved Farm Management Plan; and All best management practices associated with the activities specified in the Farm
management plan are installed and maintained.
Livestock manure storage facilities in wetlands and wetland buffers Construction or maintenance of livestock manure storage facilities are allowed under the same conditions above for horticultural activities, but are only allowed in grazed or tilled wet meadows or their buffers if:
King County National Flood Insurance Program Biological Opinion . Compliance Submittal and Programmatic Habitat Assessment
4‐54
The facilities are designed to the standards of an approved Farm Management Plan or an approved Livestock Management Plan in accordance with K.C.C. chapter 21A.30;
There is no feasible alternative location available on the site; and The facilities are located close to the outside edge of the aquatic area buffer to the
maximum extent practical.
Livestock flood sanctuaries in wetlands and wetland buffers Construction or maintenance of livestock flood sanctuaries is allowed.
Agricultural drainage in wetlands and wetland buffers Construction of agricultural drainage is allowed if in compliance with an approved Farm Management Plan and all best management practices associated with the activities specified in the Farm Management Plan are installed and maintained. Maintenance of agricultural drainage is allowed if these activities have been in existence since January 1, 2005, and there is no expansion into the critical area or critical area buffer. "Continuous existence" includes cyclical operations and managed periods of soil restoration, enhancement or other fallow states associated with these horticultural and agricultural activities. Maintenance of agricultural drainage is allowed if: The site is predominately involved in the practice of agriculture; There is no expansion into an area that has been cleared under I, II, III, IV-S or Conversion
IV-G Forest Practice Permits or where there is more than 10,000 square feet with tree cover at a uniform density of more than 90 trees per acre and with the predominant mainstem diameter of the trees at least 4 inches in diameter at breast height, not including areas that are actively managed as agricultural crops for pulpwood, Christmas trees or ornamental nursery stock;
The activities are in compliance with an approved Farm Management Plan; and All best management practices associated with the activities specified in the Farm
Management Plan are installed and maintained. Maintenance of an agricultural drainage that is used by salmonids is allowed if it is in compliance with an approved farm plan.
Farm ponds, fish ponds, livestock watering ponds in wetlands and wetland buffers Construction or maintenance of farm ponds, fish ponds, or livestock watering ponds are allowed if these activities have been in existence since January 1, 2005, and there is no expansion into the critical area or critical area buffer. "Continuous existence" includes cyclical operations and managed periods of soil restoration, enhancement or other fallow states associated with these horticultural and agricultural activities. New farm ponds, fish ponds, or livestock watering ponds or expansion of existing farm ponds, fish ponds, or livestock watering ponds are allowed if: The site is predominately involved in the practice of agriculture; There is no expansion into an area that has been cleared under I, II, III, IV-S or Conversion
IV-G Forest Practice Permits or where there is more than 10,000 square feet with tree cover at a uniform density of more than 90 trees per acre and with the predominant mainstem
King County National Flood Insurance Program Biological Opinion . Compliance Submittal and Programmatic Habitat Assessment
4‐55
diameter of the trees at least 4 inches in diameter at breast height, not including areas that are actively managed as agricultural crops for pulpwood, Christmas trees or ornamental nursery stock;
The activities are in compliance with an approved Farm Management Plan; and All best management practices associated with the activities specified in the Farm
Management Plan are installed and maintained.
Cemetery graves in wetlands and wetland buffers Excavation of cemetery graves in an established and approved cemetery is allowed. Maintenance of cemetery graves is allowed, whether in an established and approved cemetery or not.
Lawns, landscaping and gardening in wetlands and wetland buffers Maintenance of lawns, landscaping and gardening for personal consumption is allowed within existing landscaped areas or other previously disturbed areas.
Golf courses in wetlands and wetland buffers Maintenance of golf courses is allowed when not performed under the direction of a government agency only if: The maintenance does not involve the use of herbicides, hazardous substances, sealants or
other liquid oily substances in aquatic areas, wetlands or their buffers; and When the maintenance or the replacement of bridges or culverts involves waters used by
salmonids the work is in compliance with ditch standards in a Public Rule and the maintenance of culverts is limited to removal of sediment and debris from the culvert and its inlet, invert and outlet and the stabilization of the disturbed or damaged bank or channel immediately adjacent to the culvert and does not involve the excavation of a new sediment trap adjacent to the inlet.
Aquatic Areas
Aquatic areas are defined as any nonwetland water feature including all shorelines of the state, rivers, streams, marine waters, inland bodies of open water including lakes and ponds, reservoirs and conveyance systems and impoundments of these features if any portion of the feature is formed from a stream or wetland and if any stream or wetland contributing flows is not created solely as a consequence of storm water pond construction. "Aquatic area" does not include water features that are entirely artificially collected or conveyed storm or wastewater systems or entirely artificial channels, ponds, pools or other similar constructed water features.
Water Types (K.C.C. 21A.24.355) Type S waters include all aquatic areas inventoried as "shorelines of the state" under King County's SMP, K.C.C. Title 25, in accordance with chapter 90.58 RCW, including segments of streams where the mean annual flow is more than 20 cubic feet per second, marine shorelines and lakes 20 acres in size or greater. Examples include: Puget Sound, Snoqualmie River, Ames Lake, Issaquah Creek.

King County National Flood Insurance Program Biological Opinion . Compliance Submittal and Programmatic Habitat Assessment
4‐56
Type F waters include all segments of aquatic areas that are not Type S waters and that contain fish or fish habitat, including waters diverted for use by a federal, state or tribal fish hatchery from the point of diversion for 1,500 feet or the entire tributary if the tributary is highly significant for protection of downstream water quality. Examples include: Tuck Creek, Mill Creek, Rock Creek, all lakes and ponds smaller than 20 acres that contain fish or fish habitat. Type N waters include all segments of aquatic areas that are not Type S or F waters and that are physically connected to Type S or F waters by an above-ground channel system, stream or wetland. Examples include: the steep upper reaches (often seasonal) of other wetlands or fish bearing streams. Type O waters include all segments of aquatic areas that are not Type S, F or N waters and that are not physically connected to Type S, F or N waters by an above-ground channel system, stream or wetland. Examples include: springs from hillsides that then infiltrate with no known surface connection, ephemeral streams with no fish-bearing potential or associated wetlands, an isolated pond or closed depression that dries out or are too acidic or too shallow for fish to live.
Aquatic Areas Buffers (K.C.C. 21A.24.358) Riparian corridors provide a wide range of highly valuable functions and are essential for sustaining wild fish populations. The most common way to protect these areas is with buffers. A stream buffer is a designated area contiguous to and intended to protect and be an integral part of a stream. Buffers are generally upland areas of vegetation that protect the ecological structure and riparian function of streams from indirect impacts and from the adverse impacts of an adjacent land use. Ecological structure refers to the type, size, age of vegetation, and habitat diversity. The ecological function assessment would evaluate which function or functions the buffer or aquatic area provide and which functions would be lost or compromised from the impact. Not all buffers perform all functions and they provide functions to varying degrees. There are several functional assessment methods that have been developed for the Pacific Northwest. Stream buffers are measured horizontally from the edge of the ordinary high water mark (OHWM) or top of the stream bank if the OHWM cannot be determined. In situations where the aquatic area is located within a mapped severe channel migration hazard area, the aquatic area buffer width will be the greater of the two buffers (i.e., either the outer edge of the aquatic area or the outer edge of the severe channel migration area). If the aquatic area buffer includes a steep slope or a landslide hazard, then the aquatic buffer width is the greater of the two or 25 feet from the top of the hazard area. The required buffer setback area is determined by one or more of the following: The water type; The location of the aquatic area inside or outside of the Urban Growth Area established by
the King County Comprehensive Plan; The Basin or Shoreline Designation Map; or Location in the Bear Creek drainage basin.
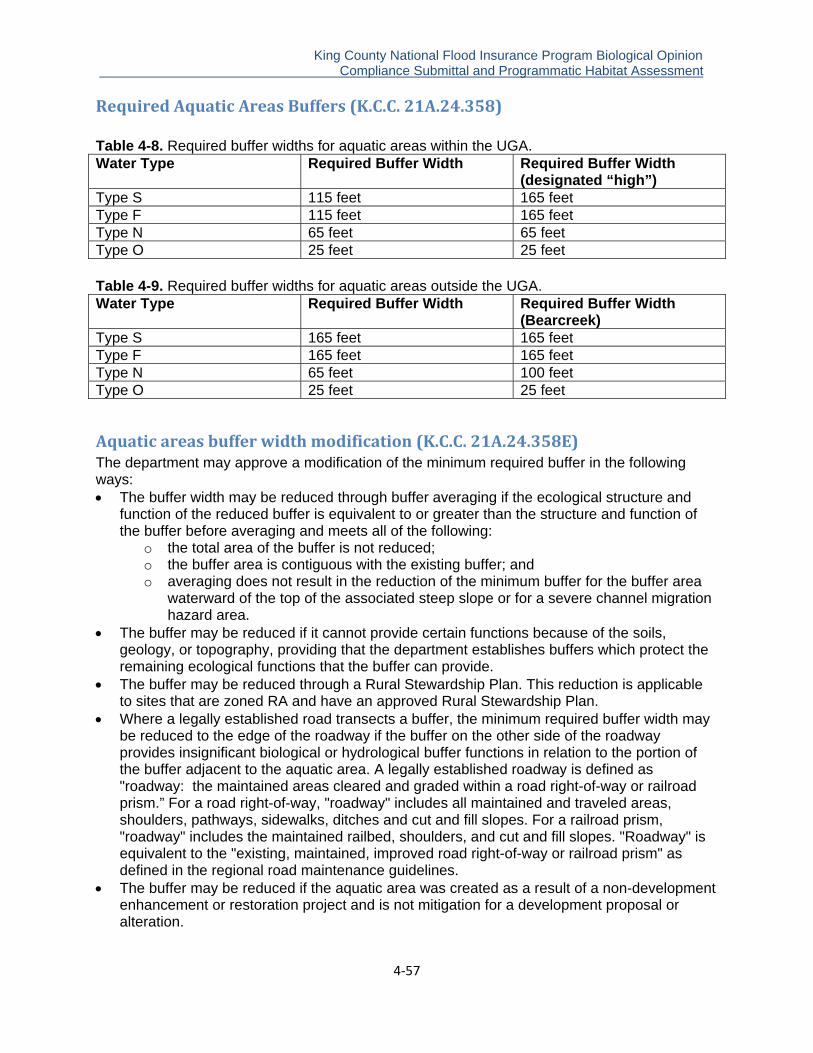
King County National Flood Insurance Program Biological Opinion . Compliance Submittal and Programmatic Habitat Assessment
4‐57
Required Aquatic Areas Buffers (K.C.C. 21A.24.358) Table 4-8. Required buffer widths for aquatic areas within the UGA. Water Type Required Buffer Width Required Buffer Width
(designated “high”) Type S 115 feet 165 feet Type F 115 feet 165 feet Type N 65 feet 65 feet Type O 25 feet 25 feet Table 4-9. Required buffer widths for aquatic areas outside the UGA. Water Type Required Buffer Width Required Buffer Width
(Bearcreek) Type S 165 feet 165 feet Type F 165 feet 165 feet Type N 65 feet 100 feet Type O 25 feet 25 feet
Aquatic areas buffer width modification (K.C.C. 21A.24.358E) The department may approve a modification of the minimum required buffer in the following ways: The buffer width may be reduced through buffer averaging if the ecological structure and
function of the reduced buffer is equivalent to or greater than the structure and function of the buffer before averaging and meets all of the following:
o the total area of the buffer is not reduced; o the buffer area is contiguous with the existing buffer; and o averaging does not result in the reduction of the minimum buffer for the buffer area
waterward of the top of the associated steep slope or for a severe channel migration hazard area.
The buffer may be reduced if it cannot provide certain functions because of the soils, geology, or topography, providing that the department establishes buffers which protect the remaining ecological functions that the buffer can provide.
The buffer may be reduced through a Rural Stewardship Plan. This reduction is applicable to sites that are zoned RA and have an approved Rural Stewardship Plan.
Where a legally established road transects a buffer, the minimum required buffer width may be reduced to the edge of the roadway if the buffer on the other side of the roadway provides insignificant biological or hydrological buffer functions in relation to the portion of the buffer adjacent to the aquatic area. A legally established roadway is defined as "roadway: the maintained areas cleared and graded within a road right-of-way or railroad prism.” For a road right-of-way, "roadway" includes all maintained and traveled areas, shoulders, pathways, sidewalks, ditches and cut and fill slopes. For a railroad prism, "roadway" includes the maintained railbed, shoulders, and cut and fill slopes. "Roadway" is equivalent to the "existing, maintained, improved road right-of-way or railroad prism" as defined in the regional road maintenance guidelines.
The buffer may be reduced if the aquatic area was created as a result of a non-development enhancement or restoration project and is not mitigation for a development proposal or alteration.
King County National Flood Insurance Program Biological Opinion . Compliance Submittal and Programmatic Habitat Assessment
4‐58
Specific mitigation requirements for aquatic areas (K.C.C. 21A.24.380) This section describes how to determine the mitigation for the adverse impacts from an alteration to the aquatic area or aquatic area buffer. The mitigation measures must achieve equivalent or greater functions including but not limited to: Habitat complexity, connectivity, and other biological functions; Seasonal hydrological dynamics, water storage capacity and water quality; and Geomorphic and habitat process and functions. To the maximum extent practical, permanent alterations that require restoration or enhancement must consider the following design factors as applicable to the function being mitigated: The natural channel or shoreline reach dimensions including its depth, width, length, and
gradient; The horizontal alignment and sinuosity; The channel bed, sea bed, or lake bottom with identical or similar substrate and similar
erosion and sediment transport dynamics; Bank and buffer configuration and erosion and sedimentation rates; and Similar vegetation species diversity, size, and densities in the channel, sea bed, or lake-
bottom and on the riparian bank or buffer. Mitigation to compensate for adverse impacts shall meet the following standards: Not upstream of a barrier to fish passage; Is equal or greater in biological function; and To the maximum extent practical is located on the site of the alteration or within one-half
mile of the site and in the same aquatic reach at a 1:1 ratio of area of mitigation to area of alteration; OR
Is located in the same aquatic area drainage subbasin or marine shoreline and attains the following ratios of area of functional mitigation to area of alteration:
Type S or F 3:1 Type N or O 2:1
Reducing mitigation ratios for aquatic areas (K.C.C. 21A.24.380E) The department may reduce the mitigation ratios of this section to 2:1 for Type S or F aquatic areas and 1.5:1 for Type N and O aquatic areas if the applicant provides a scientifically rigorous mitigation monitoring program.
Allowed alterations to aquatic areas and buffers (K.C.C. 21A.24.045D) The standards established in K.C.C. 21A.24.045 apply to all developments that are proposed within an aquatic area or its buffer. Alterations are allowed in the aquatic area and buffer if the alteration complies with the development standards, mitigation requirements, and other applicable requirements in this chapter. Refer to the table in K.C.C. 21A.24.045D that lists the allowed alteration with the corresponding number which refers to the alteration condition that applies. General limitations regarding alterations within aquatic areas or their buffers include: Grading in buffers is only allowed from May 1 to October 1, provided that this period may be
modified when the department determines it is necessary along marine shorelines to protect critical forage and salmonid migration.

King County National Flood Insurance Program Biological Opinion . Compliance Submittal and Programmatic Habitat Assessment
4‐59
The moisture-holding capacity of the topsoil layer on all areas of the site not covered by impervious surfaces should be maintained by minimizing soil compaction or reestablishing natural soil structure and the capacity to infiltrate. Refer to the Clearing and Grading Code.
New structures within buffers should be sited to avoid the creation of future hazard trees and to minimize the impact on groundwater movement.
To the maximum extent practical, the soil duff layer should not be disturbed, but if disturbed the soil should be redistributed to other areas of the project; a spatial connection should be provided between vegetation within and outside of the buffer to prevent creation of wind throw hazards; and hazard trees should be retained in the buffer and either topped or pushed over toward the aquatic area.
Allowed alterations in aquatic areas and buffers (K.C.C. 21A.24.045)
Single detached dwelling unit in aquatic areas and buffers Construction of single detached dwelling units is allowed within a buffer of a lake that is 20 acres or larger on a lot that was created before January 1, 2005, if: At least 75 percent of the lots abutting the shoreline of the lake or 75 percent of the lake
frontage, whichever constitutes the most developable lake frontage, has existing density of four dwelling units per acre or more;
The development proposal, including mitigation required by this chapter, will have the least adverse impact on the critical area;
Existing native vegetation within the critical area buffer will remain undisturbed except as necessary to accommodate the development proposal and required building setbacks;
Access is located to have the least adverse impact on the critical area and critical area buffer;
The alteration is the minimum necessary to accommodate the development proposal and in no case in excess of a development footprint of 5,000 square feet;
The alteration does not exceed the residential development setbacks required under K.C.C. chapter 25.04 and in no circumstances shall the alteration be allowed closer than:
o 25 feet of the ordinary high water mark of the lake shoreline designated urban under K.C.C. chapter 25.16,
o 50 feet of the ordinary high water mark of a lake shoreline designated rural under K.C.C. chapter 25.20 or conservancy under K.C.C. chapter 25.24, or
o 100 feet of the ordinary high water mark of a lake shoreline designated natural under K.C.C. chapter 25.28; and
To the maximum extent practical, alterations are mitigated on the development proposal site by enhancing or restoring remaining critical area buffers.
Nonresidential structures in aquatic areas and buffers Construction of nonresidential farm structures is allowed within grazed or tilled wet meadows or buffers of wetlands or aquatic areas where: The site is predominately used for the practice of agriculture; The structure is in compliance with an approved Farm Management Plan;
King County National Flood Insurance Program Biological Opinion . Compliance Submittal and Programmatic Habitat Assessment
4‐60
The structure is either:
o On or adjacent to existing nonresidential impervious surface areas, additional impervious surface area is not created waterward of existing impervious surface areas and the area was not used for crop production;
o Higher in elevation and no closer to the severe channel migration hazard area or aquatic area or aquatic area buffer than its existing position;
o Located away from existing impervious surface area that is determined to be the optimum site in the Farm Management Plan;
o Best management practices associated with the structure specified in the Farm Management Plan are installed and maintained; or
o Installation of fencing in accordance with K.C.C. chapter 21A.30 does not require the development of a Farm Management Plan if required best management practices are followed and the installation does not require clearing of critical areas or their buffers.
In the severe channel migration hazard area portion of an aquatic buffer only if: There is no feasible location on site; The structure is not used to house animals or store hazardous substances; and The total footprint of all accessory structures within the severe channel migration hazard
area will not exceed the greater of 1,000 square feet within the severe channel migration hazard or two percent of the severe channel migration hazard area on site.
Existing structures in aquatic areas and buffers Existing structures may be maintained or repaired. Expansion or replacement of existing primary structures is allowed within a severe channel migration hazard area if: There is not an increase of the footprint of any existing structure; There is not a substantial improvement as defined in K.C.C. 21A.06.1270; and Expansion or replacement does not increase the footprint of a nonresidential structure. Expansion or replacement of existing accessory structures is allowed if: Addition to the footprint will not make the total footprint of all existing structures more than
1,000 square feet; and There is not an expansion of the footprint towards any source of channel migration hazard
unless the applicant demonstrates that the location is less subject to risk and has less impact on the critical area.
Expansion or replacement of existing primary structures is allowed only in grazed wet meadows or the buffer or building setback outside a severe channel migration hazard area if: The expansion or replacement does not increase the footprint of a nonresidential structure; The expansion or replacement does not increase the footprint of a dwelling unit by more
than 1,000 square feet and the location of the expanded area has the lease adverse impact on the critical area;
The structure was not established as the result of a variance, buffer averaging or reasonable use exception, and
To the maximum extent practical, the expansion or replacement is not located closer to the critical area or within the relic channel that can be connected to an aquatic area.

King County National Flood Insurance Program Biological Opinion . Compliance Submittal and Programmatic Habitat Assessment
4‐61
Existing structures are allowed upon another portion of an existing impervious surface outside a severe channel migration hazard area if: The structure is not located closer to the critical area; and The existing impervious surface within the critical area or buffer is not expanded.
Remodeling in aquatic areas and buffers Interior remodeling is allowed.
Docks or piers in aquatic areas and buffers Construction of new docks or priers is limited to seasonal floating docks or piers in a Category II, III, IV wetland or its buffer or along a lake shoreline or its buffer where: The existing and zoned density of all properties abutting the entire lake shoreline averages
three dwelling units per acre or more; At least 75 percent of the lots abutting the shoreline or 75 percent of the lake frontage,
whichever constitutes the most lake frontage, has been developed with dwelling units; There is not any significant vegetation where the alteration is proposed and the loss of
vegetation was not the result of any violation of law; The wetland or lake shoreline is not a salmonid spawning area; Hazardous substances or toxic material are not used; Allowed on Type N or O aquatic areas if hazardous substances or toxic materials are not
used; or Allowed on Type S or F aquatic areas outside of the severe channel migration hazard area
and if in compliance with K.C.C. Title 25 (Shorelines). Maintenance, repair or replacement of docks or piers is allowed if: Allowed on Type N or O aquatic areas if hazardous substances or toxic materials are not
used; or Allowed on Type S or F aquatic areas outside of the severe channel migration hazard area
and if in compliance with K.C.C. Title 25 (Shorelines).
Grading in aquatic areas and buffers The following are allowed in the severe channel migration hazard area if: Conducted more than 165 feet from the ordinary high water mark in the rural area and 115
feet from the ordinary high water mark in the urban area; Grading up to 50 cubic yards on lots less than five acres; and Clearing up to 1,000 square feet or up to a cumulative 35 percent of the severe channel
migration hazard area. Construction of new slope stabilization is allowed only where erosion or landsliding threatens a structure, utility facility, roadway, driveway, public trails, aquatic area or wetland if to the maximum extent practical, stabilization work must not disturb the slope and its vegetation cover or any associated critical areas. Maintenance of existing slope stabilization is allowed when performed by or at the direction of a government agency in accordance with regional road maintenance guidelines.
King County National Flood Insurance Program Biological Opinion . Compliance Submittal and Programmatic Habitat Assessment
4‐62
Maintenance of existing slope stabilization is allowed when not performed under the direction of a government agency only if: The maintenance does not involve the use of herbicides, hazardous substances, sealants or
other liquid oily substances in aquatic areas, wetlands or their buffers; and When the maintenance or the replacement of bridges or culverts involves waters used by
salmonids, the work is in compliance with ditch standards in a Public Rule and the maintenance of culverts is limited to removal of sediment and debris from the culvert and its inlet, invert and outlet and the stabilization of the disturbed or damaged bank or channel immediately adjacent to the culvert and does not involve the excavation of a new sediment trap adjacent to the inlet.
Clearing in aquatic areas and buffers The following are allowed in the severe channel migration hazard area if: Conducted more than 165 feet from the ordinary high water mark in the rural area and 115
feet from the ordinary high water mark in the urban area; Grading up to 50 cubic yards on lots less than five acres; and Clearing up to 1,000 square feet or up to a cumulative 35 percent of the severe channel
migration hazard area. Clearing is allowed for the removal of hazard trees and vegetation as necessary for surveying or testing purposes. Clearing is also allowed for harvesting of plants and plant materials, such as plugs, stakes, seeds or fruits, for restoration and enhancement projects. Cutting of firewood is: Not allowed in a wildlife habitat conservation area; Allowed within a critical area for personal use with an approved Forest Management Plan or
Rural Stewardship Plan; and Allowed within a wildlife network with an approved management plan under K.C.C.
21A.14.270. Removal of vegetation for fire safety is allowed in buffers if in accordance with best management practices approved by the King County Fire Marshal. Removal of noxious weeds or invasive vegetation is allowed if: In accordance with an approved Forest Management Plan, farm plan, or Rural Stewardship
Plan; or Without an approved Forest Management Plan or Rural Stewardship Plan if:
o Removal is undertaken with hand labor, including hand-held mechanical tools, unless the King County Noxious Weed Control Board otherwise prescribes the use of riding mowers, light mechanical cultivating equipment or biological control methods. The area of noxious weed or invasive vegetation removal must be stabilized to avoid re-growth or regeneration and the area must be re-vegetated with native or non-invasive vegetation and stabilized against erosion; and
o Herbicide use is in accordance with federal and state law.
King County National Flood Insurance Program Biological Opinion . Compliance Submittal and Programmatic Habitat Assessment
4‐63
Forest practices in aquatic areas and buffers Non-Conversion Class IV-G Forest Practice is allowed if conducted in accordance with chapter 76.09 RCW and Title 222 WAC and a Forest Management Plan is approved for the site by the King County Department of Natural Resources and Parks. The property owner must also provide a notice of intent in accordance with RCW 76.09.060 that the site will not be converted to non-forestry use within six years. Class I, II, III, IV-S forest practice is allowed.
Roads in aquatic areas and buffers Construction of new roads, right-of way structure on unimproved right-of way is allowed if: There is no feasible location with less adverse impact on an aquatic area and its buffer; The road corridor is not located over habitat used for salmonid rearing or spawning or by
any species listed as endangered or threatened by the state and federal government unless the department determines there are no other feasible crossing sites;
The road corridor width is minimized to the maximum extent practical; The construction occurs during approved periods for instream work; and The corridor will not change or diminish the overall aquatic area flow peaks, duration or
volume or the flood storage capacity. Maintenance of a public road right-of-way structure is allowed: When performed by or at the direction of a government agency in accordance with the
regional road maintenance guidelines. King County has developed a Public Rule on Maintenance of Roadside Ditches Used by
Salmonids. The Public Rule is available at: http://your.kingcounty.gov/ddes/pub_rule/acrobat/21A-24Road-Ditch.pdf
Expansion beyond public road right-of-way structure is allowed when: There is no feasible location with less adverse impact on an aquatic area and its buffer; The road corridor is not located over habitat used for salmonid rearing or spawning or by
any species listed as endangered or threatened by the state and federal government unless the department determines there are no other feasible crossing sites;
The road corridor width is minimized to the maximum extent practical; The construction occurs during approved periods for instream work; and The corridor will not change or diminish the overall aquatic area flow peaks, duration or
volume or the flood storage capacity. Repair, replacement or modification within the roadway is allowed if: When performed by or at the direction of a government agency in accordance with the
regional road maintenance guidelines.
Driveways and private access roads in aquatic areas and buffers Construction of a driveway or private access road is allowed if: An alternative access is not available; Impact to the critical area is minimized to the maximum extent practical including the use of
walls to limit the amount of cut and fill necessary;
King County National Flood Insurance Program Biological Opinion . Compliance Submittal and Programmatic Habitat Assessment
4‐64
The risk associated with landslide and erosion is minimized; Access is located where it is least subject to risk from channel migration; and Construction occurs during approved periods for instream work.
Farm field access drives in aquatic areas and buffers Construction of farm field access drives is allowed with an approved Farm Management Plan. Maintenance of a driveway, private access road, or farm field access drive is allowed. When the maintenance is not performed under the direction of a government agency, the maintenance is allowed only if: The maintenance does not involve the use of herbicides, hazardous substances, sealants or
other liquid oily substances in aquatic areas, wetlands or their buffers, and When the maintenance or the replacement of bridges or culverts involves waters used by
salmonids, the work is in compliance with ditch standards in a Public Rule and the maintenance of culverts is limited to removal of sediment and debris from the culvert and its inlet, invert and outlet and the stabilization of the disturbed or damaged bank or channel immediately adjacent to the culvert and does not involve the excavation of a new sediment trap adjacent to the inlet.
Bridges or culverts in aquatic areas and buffers Maintenance or repair of a bridge or a culvert is allowed when: Performed by or at the direction of a government agency in accordance with regional road
maintenance guidelines; The maintenance does not involve the use of herbicides, hazardous substances, sealants or
other liquid oily substances in aquatic areas, wetlands or their buffers, and When the maintenance or the replacement of bridges or culverts involves waters used by
salmonids, the work is in compliance with ditch standards in a Public Rule and the maintenance of culverts is limited to removal of sediment and debris from the culvert and its inlet, invert and outlet and the stabilization of the disturbed or damaged bank or channel immediately adjacent to the culvert and does not involve the excavation of a new sediment trap adjacent to the inlet.
Replacement of a bridge or culvert is allowed when: Performed by or at the direction of a government agency in accordance with regional road
maintenance guidelines. The replacement of a bridge or culvert is made fish passable in accordance with the most
recent Washington State Department of Fish and Wildlife manuals or with the NOAA Fisheries guidelines for federally listed salmonid species.
The site must be restored with appropriate native vegetation. Expansion of a bridge or culvert is allowed if it is necessary to bring the bridge or culvert up to current standards; and There is no other feasible alternative solution available with less impact on the aquatic area
and its buffer; and The bridge or culvert must be located to the maximum extent practical to minimize impacts
to the aquatic area and its buffer.

King County National Flood Insurance Program Biological Opinion . Compliance Submittal and Programmatic Habitat Assessment
4‐65
Utilities and other infrastructure in aquatic areas and buffers New utility corridors or utility facilities are allowed if they are located within an existing roadway and are consistent with the regional road maintenance guidelines. New utilities and other infrastructure are limited to construction of pipelines, cables, wires and support structures of utility facilities within utility corridors. The following requirements must be met: New pipelines, cables, wires and support structures are allowed only when there is no
alternative location with less adverse impact on the critical area and critical area buffer. New utility corridors must meet all of the following requirements to the maximum extent
practical: o do not locate over habitat used for salmonid rearing or spawning or by a species
listed as endangered or threatened by the state or federal government unless the department determines that there is no other feasible crossing site.
o Do not locate a new utility corridor in an aquatic area if the mean annual flow rate is equal to or greater than 20 cubic feet per second.
o Paralleling the channel or following a down-valley route near the channel should be avoided.
To the maximum extent practical, new utility corridors must be located as follows: o minimize the width of the utility corridor; o minimize the removal of trees greater than 12 inches diameter at breast height;
and o Provide additional, contiguous and undisturbed critical area buffer, equal in area to
the disturbed critical area buffer area including any allowed maintenance roads. To the maximum extent practical, access for maintenance of utility corridors must be at
limited access points into the aquatic area buffer rather than by a parallel maintenance road. If a parallel maintenance road is necessary, the following standards must be met:
o minimize the width of the maintenance road to the maximum extent practical and in no event can it be greater than 15 feet; and
o locate the maintenance road contiguous to the utility corridor on the side of the utility corridor farthest from the critical area.
New utility corridors or utility facilities must not change or diminish the overall aquatic area hydrology or flood storage capacity.
Construction must occur during approved periods for instream work. This period is usually from about June 15 to September 30, but work at other times can sometimes be approved on a site-by site basis. The timing is usually specified in the HPA and in DDES permit conditions.
The utility corridor must serve multiple purposes and properties to the maximum extent practical.
Bridges or other construction techniques that do not disturb the critical areas must be used to the maximum extent practical.
Bored, drilled or other trenchless crossings of the aquatic area or buffer must be laterally constructed at least four feet below the maximum depth of scour for the base flood.
Bridge piers or abutments for bridge crossing must not be placed within the FEMA floodway or the ordinary high water mark.
Open trenching may only be used during low flow periods and only within aquatic areas when they are dry. The department may approve open trenching of Type S or F aquatic areas only if there is no feasible alternative and equivalent or greater environmental protection can be achieved.
King County National Flood Insurance Program Biological Opinion . Compliance Submittal and Programmatic Habitat Assessment
4‐66
Minor communication facilities may co-locate on existing utility facilities if:
o no new transmission support structure is required; and o equipment cabinets are located on the transmission support structure.
Maintenance, repair or replacement is allowed for private individual utility service connections on site or to public utilities if the disturbed area is not expanded and no hazardous substances, pesticides or fertilizers are applied.
Wells and onsite sewage disposal systems in aquatic areas and buffers Maintenance or repair of existing wells and onsite sewage disposal systems is allowed if the disturbed area is not expanded, clearing is limited to the maximum extent practical and no hazardous substances, pesticides or fertilizers are applied.
Surface water systems in aquatic areas and buffers Construction of new surface water conveyance systems, surface water flow control or surface water quality treatment facilities are allowed if they are within an existing roadway and are constructed to be consistent with the regional road maintenance guidelines. If not within the roadway, only vegetation may be used to construct a new surface water conveyance system. Maintenance, repair or replacement of existing surface water conveyance systems or surface water flow control or surface water quality treatment facilities is allowed if performed by or at the direction of a government agency in accordance with the regional road maintenance guidelines. Open, vegetated storm water management conveyance systems and outfall structures that simulate natural conditions may be maintained, repaired or replaced if: Fish habitat features necessary for feeding, cover and reproduction are included, when
appropriate; The vegetation is maintained and added adjacent to all open channels and ponds, if
necessary, to prevent erosion, filter sediments or shade the water; and Bioengineering techniques are used to the maximum extent practical. Closed, tight lined conveyance system and outfall structures may be maintained, repaired or replaced if: Necessary to avoid erosion of slopes; and Bioengineering techniques are used to the maximum extent practical.
Flood protection facilities in aquatic areas and buffers Construction of a new flood protection facility is allowed in a severe channel migration hazard area portion of an aquatic area buffer to prevent bank erosion only if consistent with the Washington State Integrated Stream Protection Guidelines and if bioengineering techniques are used to the maximum extent practical, unless the applicant can demonstrate that other methods provide equivalent structural stabilization and environmental function. New flood protection facilities are only allowed in a severe channel migration hazard area to protect the following: Public roadways; Sole access routes that were in existence before February 16, 1995; or

King County National Flood Insurance Program Biological Opinion . Compliance Submittal and Programmatic Habitat Assessment
4‐67
New primary dwelling units, accessory dwelling units or accessory living quarters and residential accessory structures located outside the severe channel migration hazard area if: o the site is adjacent to or abutted by properties on both sides containing buildings or sole
access routes protected by legal bank stabilization in existence before February 16, 1995. The buildings, sole access routes or bank stabilization must be located no more than 600 feet apart as measures parallel to the migrating channel; and
o the new primary dwelling units, accessory dwelling units, accessory living quarters or residential accessory structures are located no closer to the aquatic area than similar structures on abutting adjacent properties.
Maintenance, repair or replacement of lawfully established flood protection facilities is allowed if: Maintained by a public agency; The height of the facility is not increased; The linear length of the affected edge of the facility is not increased; The footprint of the facility is not expanded waterward; If consistent with the King County's Guidelines for Bank Stabilization Projects and
bioengineering techniques are used to the maximum extent practical; and The site is restored with appropriate native vegetation.
Instream structures in aquatic areas and buffers New instream structures or instream work is allowed if performed by or at the direction of a government agency in accordance with the regional road maintenance guidelines. If the aquatic area is a Type N or O, the new instream structure or work must be done in the least impacting way and at the least impacting time of the year. It must also be done in conformance with applicable best management practices and all the affected instream and buffer features restored. If the aquatic area is a Type S or F, the new instream structure or work must be included as part of a project to evaluate, restore or improve habitat, and must be sponsored or co-sponsored by a public agency that has natural resource management as a function or by a federally recognized tribe. Existing instream structures may be maintained or repaired.
Recreation areas in aquatic areas and buffers Construction of a new trail is not allowed in a wildlife habitat conservation area. Otherwise, a new trail is allowed as far landward as feasible in the buffer if: The trail surface is not made of impervious material except that public multipurpose trails
may be made of impervious materials if they meet all the requirements in K.C.C. chapter 9.12; and
To the maximum extent practical, buffers are expanded equal to the width of the trail corridor including disturbed area.
Maintenance of outdoor public park facilities, trails and publicly improved recreation areas is allowed only if the maintenance: Does not involve the use of herbicides or other hazardous substances except for the
removal of noxious weeds or invasive vegetation;
King County National Flood Insurance Program Biological Opinion . Compliance Submittal and Programmatic Habitat Assessment
4‐68
When salmonids are present, the maintenance must be in compliance with the King County
Public Rule for Maintenance of Agricultural Ditches and Streams Used by Salmonids; and Does not involve the expansion of any roadway, lawn, landscaping, ditch, culvert,
engineered slope or other improved area being maintained.
Habitat and science projects in aquatic areas and buffers Habitat restoration or enhancement projects are limited to: Those sponsored by a public agency that has natural resource management as a primary
function or by a federally recognized tribe. Habitat restoration or enhancement projects prepared by a qualified biologist; or Conducted in accordance with an approved forest or Farm Management Plan or Rural
Stewardship Plan. Scientific sampling for salmonids is allowed if done in accordance with a scientific sampling permit issued by Washington State Department of Fish and Wildlife and where applicable an incidental take permit issued under Section 10 of the ESA. Drilling and testing for Critical Areas Reports is allowed for limited clearing and grading needed to prepare a Critical Areas Report. If associated spoils are contained on site (i.e. in a manner that the spoils will not mobilize or erode), the following are allowed: Data collection and research if carried out by non-mechanical or hand-held equipment to the
maximum extent practical; Survey monument placement; Site exploration and gage installation if performed in accordance with state-approved
sampling protocols and accomplished to the maximum extent practical by hand-held equipment; and
Similar work associated with an incidental take permit issued under Section 10 or consultation under Section 7 of the ESA.
Agricultural activities in aquatic areas and buffers Horticulture activities, including tilling, disking, planting, seeding, harvesting, preparing soil, rotating crops and related activities, and grazing of livestock are allowed if these activities have been in existence since January 1, 2005, and there is no expansion into the critical area or critical area buffer. "Continuous existence" includes cyclical operations and managed periods of soil restoration, enhancement or other fallow states associated with these horticultural and agricultural activities. Allowed for the expansion of existing or new agricultural activities where: The site is predominately involved in the practice of agriculture; There is no expansion into an area that has been cleared under a I, II, III, IV-S Forest
Practice Permit; or Is more than 10,000 square feet with tree cover at a uniform density of more than 90 trees
per acre and with the predominant mainstem diameter of the trees at least 4 inches in diameter at breast height, not including areas that are actively managed as agricultural crops for pulpwood, Christmas trees or ornamental nursery stock;
The activities are in compliance with an approved Farm Management Plan; and
King County National Flood Insurance Program Biological Opinion . Compliance Submittal and Programmatic Habitat Assessment
4‐69
All best management practices associated with the activities specified in the Farm Management plan are installed and maintained.
Livestock manure storage facilities in aquatic areas and buffers Construction or maintenance of livestock manure storage facilities is allowed under the same conditions above for horticultural activities, but are only allowed in grazed or tilled wet meadows or their buffers if: The facilities are designed to the standards of an approved Farm Management Plan or an
approved Livestock Management Plan in accordance with K.C.C. chapter 21A.30. There is no feasible alternative location available on the site; and The facilities are located close to the outside edge of the aquatic area buffer to the
maximum extent practical; Construction or maintenance of livestock manure storage facilities is allowed in a severe channel migration hazard area portion of an aquatic area buffer if: The facilities are designed to the standards of an approved Farm Management Plan; There is no feasible alternative location available on the site; and The structure is located where it is least subject to risk from channel migration. Construction or maintenance of a livestock flood sanctuary is allowed in a severe channel migration hazard area portion of an aquatic area buffer if: The facilities are designed to the standards of an approved Farm Management Plan; There is no feasible alternative location available on the site; and The structure is located where it is least subject to risk from channel migration.
Agricultural drainage in aquatic areas and buffers Construction of agricultural drainage is allowed if in compliance with an approved Farm Management Plan and all best management practices associated with the activities specified in the Farm Management Plan are installed and maintained. Maintenance of agricultural drainage is allowed if these activities have been in existence since January 1, 2005, and there is no expansion into the critical area or critical area buffer. "Continuous existence" includes cyclical operations and managed periods of soil restoration, enhancement or other fallow states associated with these horticultural and agricultural activities. Maintenance of agricultural drainage is allowed if: The site is predominately involved in the practice of agriculture; There is no expansion into an area that has been cleared under I, II, III, IV-S or Conversion
IV-G Forest Practice Permits or where there is more than 10,000 square feet with tree cover at a uniform density of more than 90 trees per acre and with the predominant mainstem diameter of the trees at least 4 inches in diameter at breast height, not including areas that are actively managed as agricultural crops for pulpwood, Christmas trees or ornamental nursery stock;
The activities are in compliance with an approved Farm Management Plan; and All best management practices associated with the activities specified in the Farm
Management Plan are installed and maintained.
King County National Flood Insurance Program Biological Opinion . Compliance Submittal and Programmatic Habitat Assessment
4‐70
Maintenance of an agricultural drainage that is used by salmonids is allowed if it is in compliance with an approved farm plan.
Farm ponds, fish ponds, livestock watering ponds in aquatic areas and buffers Construction or maintenance of farm ponds, fish ponds, or livestock watering ponds is allowed if these activities have been in existence since January 1, 2005, and there is no expansion into the critical area or critical area buffer. "Continuous existence" includes cyclical operations and managed periods of soil restoration, enhancement or other fallow states associated with these horticultural and agricultural activities. New farm ponds, fish ponds, or livestock watering ponds or expansion of existing farm ponds, fish ponds, or livestock watering ponds are allowed if: The site is predominately involved in the practice of agriculture; There is no expansion into an area that has been cleared under I, II, III, IV-S or Conversion
IV-G Forest Practice Permits or where there is more than 10,000 square feet with tree cover at a uniform density of more than 90 trees per acre and with the predominant mainstem diameter of the trees at least 4 inches in diameter at breast height, not including areas that are actively managed as agricultural crops for pulpwood, Christmas trees or ornamental nursery stock;
The activities are in compliance with an approved Farm Management Plan; and All best management practices associated with the activities specified in the Farm
Management Plan are installed and maintained.
Cemetery graves in aquatic areas and buffers Excavation of cemetery graves in an established and approved cemetery is allowed. Maintenance of cemetery graves is allowed, whether in an established and approved cemetery or not.
Lawns, landscaping and gardening in aquatic areas and buffers Maintenance of lawns, landscaping and gardening for personal consumption is allowed within existing landscaped areas or other previously disturbed areas.
Golf courses in aquatic areas and buffers Maintenance of golf courses is allowed when not performed under the direction of a government agency only if: The maintenance does not involve the use of herbicides, hazardous substances, sealants or
other liquid oily substances in aquatic areas, wetlands or their buffers; and When the maintenance or the replacement of bridges or culverts involves waters used by
salmonids, the work is in compliance with ditch standards in a Public Rule and the maintenance of culverts is limited to removal of sediment and debris from the culvert and its inlet, invert and outlet and the stabilization of the disturbed or damaged bank or channel immediately adjacent to the culvert and does not involve the excavation of a new sediment trap adjacent to the inlet.

King County National Flood Insurance Program Biological Opinion . Compliance Submittal and Programmatic Habitat Assessment
4‐71
Wildlife Habitat Conservation Areas
A wildlife habitat conservation area is an area for a species whose habitat the King County Comprehensive Plan requires the county to protect including an active breeding site and the area surrounding the breeding site that is necessary to protect breeding activity. Nine species of birds and one bat species have been identified as having habitat to protect. They include the bald eagle, great blue heron, marbled murrelet, northern goshawk, osprey, peregrine falcon, spotted owl, Red-tailed Hawk, and Townsend’s big-eared bat. Active breeding sites of species not listed above will also be protected if they are identified in the King County Comprehensive Plan. The majority of these species is not likely to be found in the urban or rural residential portions of King County (areas more likely to be developed) or is not known to be actively breeding in the county. However, their breeding habitat is protected. Adopted management recommendations by the Washington State Department of Fish will be used for the species that are listed. If management recommendations have not been adopted for a species identified in the King County Comprehensive Plan, then the department will base recommendations on best available science. Table 4-10. Wildlife habitat conservation area setbacks (K.C.C. 21A.24.382). Species Wildlife Habitat
Conservation Area Timing of Alteration
Bald eagle 400-foot radius from active nest
March 15-April 30, alterations not allowed within 800 feet of nest. January 1-August 31, land clearing machinery (bulldozers, graders, heavy equipment may not be operated within 800 feet of the nest
Great Blue Heron
820-foot radius from the rookery. Department can increase radius up to an additional 164 feet if population of rookery is declining
January 1-July 31, clearing or grading not allowed within 924 feet of the rookery
Marbled Murrelet One-half mile radius around an active nest
Northern goshawk
1,500-foot radius around an active nest located outside of the UGA
Osprey 230-foot radius around an active nest
April 1-September 30, alterations not allowed within 660 feet of nest
Peregrine falcon Extending 1,000 feet of an eyrie on a cliff face, the area immediately above the eyrie on the rim of the cliff, and the area immediately below the cliff
March 1-June 30, land-clearing activities that result in loud noises (blasting, chain sawing, or heavy machinery) are not allowed within one-half mile of eyrie. New power lines may not be constructed within 1,000 feet of the eyrie.
Spotted Owl 3,700-foot radius from an active nest
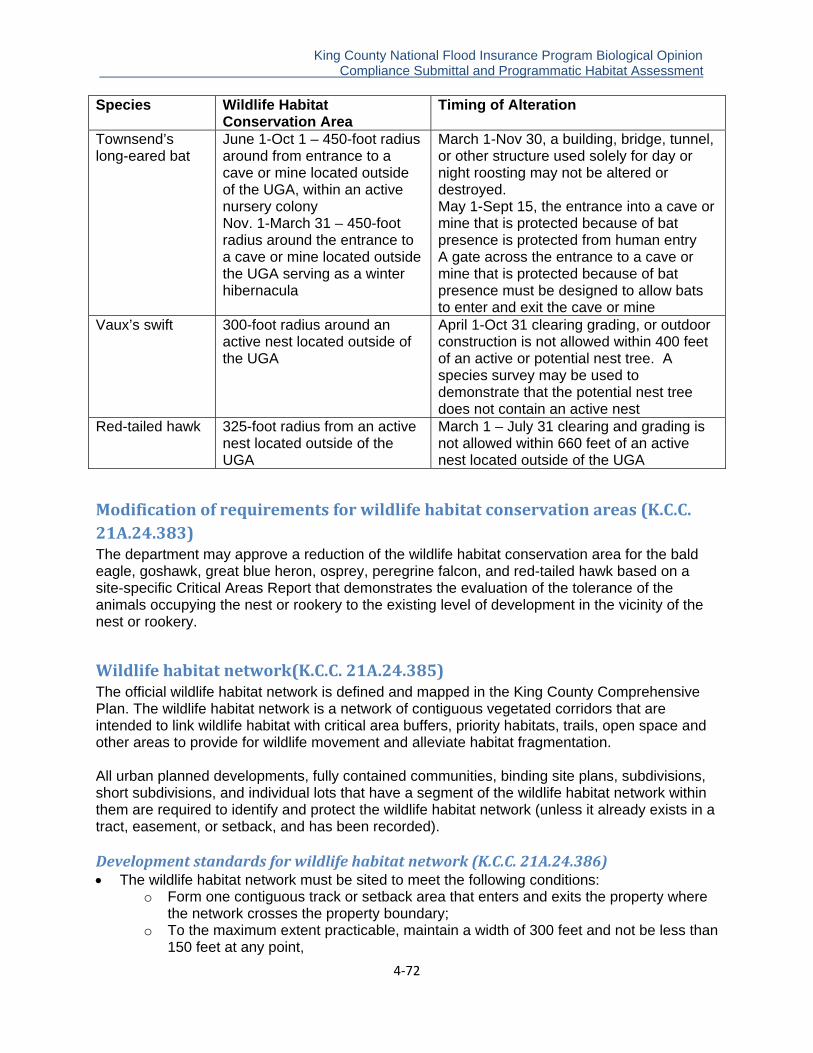
King County National Flood Insurance Program Biological Opinion . Compliance Submittal and Programmatic Habitat Assessment
4‐72
Species Wildlife Habitat Conservation Area
Timing of Alteration
Townsend’s long-eared bat
June 1-Oct 1 – 450-foot radius around from entrance to a cave or mine located outside of the UGA, within an active nursery colony Nov. 1-March 31 – 450-foot radius around the entrance to a cave or mine located outside the UGA serving as a winter hibernacula
March 1-Nov 30, a building, bridge, tunnel, or other structure used solely for day or night roosting may not be altered or destroyed. May 1-Sept 15, the entrance into a cave or mine that is protected because of bat presence is protected from human entry A gate across the entrance to a cave or mine that is protected because of bat presence must be designed to allow bats to enter and exit the cave or mine
Vaux’s swift 300-foot radius around an active nest located outside of the UGA
April 1-Oct 31 clearing grading, or outdoor construction is not allowed within 400 feet of an active or potential nest tree. A species survey may be used to demonstrate that the potential nest tree does not contain an active nest
Red-tailed hawk 325-foot radius from an active nest located outside of the UGA
March 1 – July 31 clearing and grading is not allowed within 660 feet of an active nest located outside of the UGA
Modification of requirements for wildlife habitat conservation areas (K.C.C. 21A.24.383) The department may approve a reduction of the wildlife habitat conservation area for the bald eagle, goshawk, great blue heron, osprey, peregrine falcon, and red-tailed hawk based on a site-specific Critical Areas Report that demonstrates the evaluation of the tolerance of the animals occupying the nest or rookery to the existing level of development in the vicinity of the nest or rookery.
Wildlife habitat network(K.C.C. 21A.24.385) The official wildlife habitat network is defined and mapped in the King County Comprehensive Plan. The wildlife habitat network is a network of contiguous vegetated corridors that are intended to link wildlife habitat with critical area buffers, priority habitats, trails, open space and other areas to provide for wildlife movement and alleviate habitat fragmentation. All urban planned developments, fully contained communities, binding site plans, subdivisions, short subdivisions, and individual lots that have a segment of the wildlife habitat network within them are required to identify and protect the wildlife habitat network (unless it already exists in a tract, easement, or setback, and has been recorded). Development standards for wildlife habitat network (K.C.C. 21A.24.386) The wildlife habitat network must be sited to meet the following conditions:
o Form one contiguous track or setback area that enters and exits the property where the network crosses the property boundary;
o To the maximum extent practicable, maintain a width of 300 feet and not be less than 150 feet at any point,

King County National Flood Insurance Program Biological Opinion . Compliance Submittal and Programmatic Habitat Assessment
4‐73
o Be contiguous with and include critical areas and their buffers; o To the maximum extent practicable, connect isolated critical areas or habitat; o To the maximum extent practicable, connect wildlife network segments, open space
tracts, or wooded areas on adjacent properties; and o Be permanently marked in accordance with this chapter.
Proposals for recreation, forestry, or any other use compatible with preserving and enhancing the habitat value of the wildlife network must have an approved management plan. The applicant must record the plan and monitor and assure compliance with the plan.
Clearing within the wildlife habitat area network in a tract or tracts are limited to that allowed by an approved management plan. If a wildlife habitat network is contained within a setback, a management plan is not required. Clearing is not allowed within a setback area on individual lots unless the property owner has an approved management plan.
In urban planned developments, fully contain communities, binding site plans, subdivisions and short subdivisions, a homeowner's associate or other entity capable of long-term maintenance and operations shall monitor and assure compliance with any approved management plan.
Segments of the wildlife habitat network set aside in tracts, conservation easements, or setback area must comply with K.C.C. 16.82.150 (Grading Code).
The department may credit a permanent open space tract containing the wildlife habitat network toward the other applicable requirements.
The director may waive or reduce these standards for public facilities such as schools, fire stations, parks and road projects.
Mitigation requirements for wildlife habitat conservation area and wildlife habitat network (K.C.C. 21A.24.388) In addition to the requirements in K.C.C. 21A.24.045 (allowed alterations), K.C.C. 21A.24.125 (Avoiding Impacts to Critical Areas), and K.C.C. 21A.24.133 (Offsite Mitigation), the following mitigation applies to compensate for adverse impacts in wildlife habitat conservation areas and wildlife habitat networks. Mitigation to compensate for the adverse impacts on wildlife habitat conservation areas
must prevent disturbance of each protected species. Onsite mitigation may include management practices such as timing of the disturbance. Offsite mitigation is limited to sites that will enhance the wildlife habitat conservation area.
Mitigation to compensate for the adverse impacts on wildlife habitat network must achieve equivalent or greater biological functions including but not limited to greater biologic functions including but not limited to habitat complexity and connectivity functions. Specific mitigation requirements for impacts include: o Expand or enhance as close to the impact as feasible; o Attain the mitigation ratios in Table 2 for the area of alteration;
Table 4-11. Mitigation ratios for wildlife habitat network. Onsite Mitigation Offsite Mitigation 1:1 rectify illegal alteration 2:1 rectify illegal alteration 1.5:1 enhancement or restoration 3:1 enhancement or restoration Additional requirements: For temporary alterations the department may require rectification, restoration, or
enhancement of the altered wildlife habitat network. The department may increase the width of the wildlife habitat network to mitigate for risks to
habitat functions.
King County National Flood Insurance Program Biological Opinion . Compliance Submittal and Programmatic Habitat Assessment
4‐74
To the maximum extent possible the mitigation should replicate the site prior to the alteration, including soil type, conditions and physical features, vegetation diversity and density, and biologic and habitat functions.
The department may modify the requirements in this section if the applicant demonstrates that greater wildlife habitat functions will be obtained in the same wildlife habitat conservation area or wildlife habitat network through alternative mitigation measures.
Allowed alterations for wildlife habitat conservation areas and wildlife network (K.C.C. 21A.24.045) The standards established in K.C.C. 21A.24.051 for agricultural activities apply to all developments that are proposed at or near a wildlife habitat conservation area or wildlife habitat network. Alterations are allowed in these areas if the alteration complies with the development standards, mitigation requirements, and other applicable requirements in this chapter. Construction of single detached dwelling units is not allowed. Construction of nonresidential farm structures is allowed within grazed or tilled wet meadows
or buffers of wetlands or aquatic areas where: o The site is predominately used for the practice of agriculture; o The structure is in compliance with an approved Farm Management Plan;
The structure is either: o on or adjacent to existing nonresidential impervious surface areas, additional
impervious surface area is not created waterward of existing impervious surface areas and the area was not used for crop production,
o higher in elevation and no closer to the severe channel migration hazard area, or aquatic area or aquatic area buffer than its existing position, or
o located away from existing impervious surface area that is determined to be the optimum site in the Farm Management Plan;
Best management practices associated with the structure specified in the Farm Management Plan are installed and maintained; and
Installation of fencing in accordance with K.C.C. chapter 21A.30 does not require the development of a Farm Management Plan if required best management practices are followed and the installation does not require clearing of critical areas or their buffers.
Construction of nonresidential farm structures is allowed in a severe channel migration hazard area portion of an aquatic buffer only if: There is no feasible location on site; The structure is not used to house animals or store hazardous substances; and The total footprint of all accessory structures within the severe channel migration hazard
area will not exceed the greater of 1,000 square feet within the severe channel migration hazard or two percent of the severe channel migration hazard area on site.
These alterations are allowed in a wildlife conservation area if no clearing, external construction or other disturbance occurs during breeding seasons established under K.C.C. 21A.24.382. Existing structures may be maintained or repaired. Expansion or replacement of existing primary structures if:
o The expansion or replacement does not increase the footprint of a nonresidential structure;
o The expansion or replacement does not increase the footprint of a dwelling unit by more than 1,000 square feet and the location of the expanded area has the least adverse impact on the critical area;
King County National Flood Insurance Program Biological Opinion . Compliance Submittal and Programmatic Habitat Assessment
4‐75
o The structure was not established as the result of a variance, buffer averaging or reasonable use exception; and
o To the maximum extent practical, the expansion or replacement is not located closer to the critical area or within the relic channel that can be connected to an aquatic area.
Interior remodeling is allowed within wildlife habitat conservation areas and the wildlife habitat network.
Construction of a new dock or pier is not allowed in wildlife habitat conservation areas or the wildlife habitat network.
Maintenance, repair or replacement of docks or piers is allowed. Grading is allowed.
Clearing in allowed. Construction of new slope stabilization is allowed only where erosion or landsliding
threatens a structure, utility facility, roadway, driveway, public trails, aquatic area or wetland if to the maximum extent practical, stabilization work must not disturb the slope and its vegetation cover or any associated critical areas.
Maintenance of existing slope stabilization is allowed. Clearing is allowed for the removal of hazard trees and vegetation as necessary for
surveying or testing purposes. Clearing for harvesting of plants and plant materials, such as plugs, stakes, seeds or fruits,
for restoration and enhancement projects is allowed. Cutting of firewood is not allowed in a wildlife habitat conservation area. Cutting of firewood is allowed within wildlife habitat network with an approved management
plan under K.C.C.21A.14.270. Removal of vegetation for fire safety in a wildlife habitat conservation area is allowed if:
o No clearing, external construction or other disturbance occurs during breeding seasons; and
o If in accordance with best management practices approved by the King County Fire Marshal.
Removal of noxious weeds or invasive vegetation is allowed if: o in accordance with an approved Forest Management plan, farm plan, or Rural
Stewardship Plan; or o Without an approved Forest Management Plan or Rural Stewardship Plan if removal
is undertaken with hand labor, including hand-held mechanical tools, unless the King County Noxious Weed Control Board otherwise prescribes the use of riding mowers, light mechanical cultivating equipment or biological control methods. The area of noxious weed or invasive vegetation removal must be stabilized to avoid re-growth or regeneration and the area must be re-vegetated with native or non-invasive vegetation and stabilized against erosion, and herbicide use is in accordance with federal and state law.
Non-Conversion Class IV-G Forest Practice is allowed in wildlife areas if: o Conducted in accordance with chapter 76.09 RCW and Title 222 WAC and a Forest
Management Plan is approved for the site by the King County Department of Natural Resources and Parks. The property owner must also provide a notice of intent in accordance with RCW 76.09.060 that the site will not be converted to non-forestry use within six years.
o In compliance with published Washington State Department of Fish and Wildlife and Washington State Department of Natural Resources Management standards for the species. If there are no published Washington Standards, only if in compliance with
King County National Flood Insurance Program Biological Opinion . Compliance Submittal and Programmatic Habitat Assessment
4‐76
management standards determined by the county to be consistent with best available science.
Class I, II, III, and IV-S Forest Practices are allowed in wildlife habitat conservation areas and wildlife habitat networks.
Construction of a new public road right-of-way and expansion beyond a public road right-of-way structure is prohibited in wildlife habitat conservation areas and wildlife habitat network.
Maintenance of public road right-of-way structures and repair, replacement or modification of a road within an existing right-of-way is allowed when:
o Performed by or at the direction of a government agency in accordance with the regional road maintenance guidelines; and
o To the maximum extent practical, during breeding season, land clearing machinery such as bulldozers, graders or other heavy equipment is not operated within a wildlife habitat conservation area.
Construction of farm field access drives are allowed if approved through a Farm Management Plan.
Construction of driveways or private access roads is allowed if: o An alterative access is not available; o Impact to the critical area is minimized to the maximum extent practical including the
use of walls to limit the amount of cut and fill necessary; o The risk associated with landslide and erosion is minimized; o Access is located where it is least subject to risk from channel migration; and o Construction occurs during approved periods for instream work.
Maintenance of a driveway, private access road, or farm field access drive is allowed only if: o To the maximum extent practical, during breeding season established under Section
198 of this ordinance, land clearing machinery such as bulldozers, graders or other heavy equipment is not operated within a wildlife habitat conservation area;
o The maintenance does not involve the use of herbicides, hazardous substances, sealants or other liquid oily substances in aquatic areas, wetlands or their buffers; and
o When the maintenance or the replacement of bridges or culverts involves waters used by salmonids, the work is in compliance with ditch standards in a Public Rule and the maintenance of culverts is limited to removal of sediment and debris from the culvert and its inlet, invert and outlet and the stabilization of the disturbed or damaged bank or channel immediately adjacent to the culvert and does not involve the excavation of a new sediment trap adjacent to the inlet.
Maintenance or repair of a bridge or a culvert is allowed when: o Performed by or at the direction of a government agency in accordance with regional
road maintenance guidelines. o The maintenance does not involve the use of herbicides, hazardous substances,
sealants or other liquid oily substances in aquatic areas, wetlands or their buffers; and
o When the maintenance or the replacement of bridges or culverts involves waters used by salmonids the work is in compliance with ditch standards in a Public Rule and the maintenance of culverts is limited to removal of sediment and debris from the culvert and its inlet, invert and outlet and the stabilization of the disturbed or damaged bank or channel immediately adjacent to the culvert and does not involve the excavation of a new sediment trap adjacent to the inlet; and
o To the maximum extent practical, during breeding season, land clearing machinery such as bulldozers, graders or other heavy equipment is not operated within a wildlife habitat conservation area.
King County National Flood Insurance Program Biological Opinion . Compliance Submittal and Programmatic Habitat Assessment
4‐77
Replacement of a bridge or culvert is allowed: o When performed by or at the direction of a government agency in accordance with
regional road maintenance guidelines; and o To the maximum extent practical, during breeding season, land clearing machinery
such as bulldozers, graders or other heavy equipment is not operated within a wildlife habitat conservation area.
Expansion of a bridge or culvert is allowed in a wildlife conservation area if no clearing, external construction or other disturbance occurs during breeding season.
Construction of a new utility corridor or utility facility is allowed if: o An alterative access is not available; o Impact to the critical area is minimized to the maximum extent practical including the
use of walls to limit the amount of cut and fill necessary; o The risk associated with landslide and erosion is minimized; o Access is located where it is least subject to risk from channel migration; o Construction occurs during approved periods for instream work; and o Allowed only for new utility facilities in existing utility corridors.
Maintenance, repair or replacement of a utility corridor or utility facility is allowed: o In a wildlife conservation area if no clearing, external construction or other
disturbance occurs during breeding season established under Section 198 of this ordinance;
o In an existing roadway if constructed with the regional road maintenance guidelines; and
o If the disturbed area is not expanded, clearing is limited to the maximum extent practical and no hazardous substances, pesticides or fertilizers are applied.
Maintenance or repair of existing well or maintenance, repair, or replacement of an existing surface water conveyance system is allowed:
o In a wildlife conservation area if no clearing, external construction or other disturbance occurs during breeding season; and
o If the disturbed area is not expanded, clearing is limited to the maximum extent practical and no hazardous substances, pesticides or fertilizers are applied.
Maintenance or repair of an onsite sewage disposal system, existing surface water flow control, surface water quality treatment facility, and exiting instream structure or construction of a new surface water conveyance system is allowed in:
o Wildlife conservation area if no clearing, external construction or other disturbance occurs during breeding season.
Construction of new surface water flow control or a surface water quality facility is allowed: o In a wildlife conservation area if no clearing, external construction or other
disturbance occurs during breeding season established under Section 198 of this ordinance; and
o In an existing roadway if constructed with the regional road maintenance guidelines. Construction of a new flood protection facility is allowed:
o If to the maximum extent practical, during breeding season, land clearing machinery such as bulldozers, graders or other heavy equipment is not operated within a wildlife habitat conservation area;
o In a severe channel migration hazard area portion of an aquatic area buffer to prevent bank erosion only if consistent with the King County's Guidelines for Bank Stabilization Projects and if bioengineering techniques are used to the maximum extent practical, unless the applicant can demonstrate that other methods provide equivalent structural stabilization and environmental function.
King County National Flood Insurance Program Biological Opinion . Compliance Submittal and Programmatic Habitat Assessment
4‐78
New flood protection facilities are only allowed in a severe channel migration hazard area to protect the following:
o Public roadways; o Sole access routes that were in existence before February 16, 1995; or o New primary dwelling units, accessory dwelling units or accessory living quarters and
residential accessory structures located outside the severe channel migration hazard area if: o The site is adjacent to or abutted by properties on both sides containing buildings
or sole access routes protected by legal bank stabilization in existence before February 16, 1995. The buildings, sole access routes or bank stabilization must be located no more than 600 feet apart as measured parallel to the migrating channel; and
o the new primary dwelling units, accessory dwelling units, accessory living quarters or residential accessory structures are located no closer to the aquatic area than similar structures on abutting adjacent properties.
Maintenance, repair or replacement of lawfully established flood protection facilities is allowed if:
o Maintained by a public agency; o The height of the facility is not increased; o The linear length of the affected edge of the facility is not increased; o The footprint of the facility is not expanded waterward; o If consistent with the King County's Guidelines for Bank Stabilization Projects and if
bioengineering techniques are used to the maximum extent practical; o The site is restored with appropriate native vegetation; and o To the maximum extent practical, during breeding season, land clearing machinery
such as bulldozers, graders or other heavy equipment is not operated within a wildlife habitat conservation area.
A new instream structure or instream work is allowed: o If performed by or at the direction of a government agency in accordance with the
regional road maintenance guidelines; o In a wildlife conservation area if no clearing, external construction or other
disturbance occurs during breeding season; and o If the aquatic area is a Type N or O, the new instream structure or work must be
done in the least impacting way and at the least impacting time of the year. It must also be done in conformance with applicable best management practices and all the affected instream and buffer features restored. If the aquatic area is a Type S or F, the new instream structure or work must be included as part of a project to evaluate, restore or improve habitat, and must be sponsored by a public agency that has natural resource management as a function or by a federally recognized tribe.
Construction of a new trail is not allowed in a wildlife habitat conservation area. Maintenance of outdoor public park facilities, trails and publicly improved recreation areas is
allowed in the wildlife conservation area if: o No clearing, external construction or other disturbance occurs during breeding
seasons; and o It does not involve the use of herbicides or othr hazardous substances except for the
removal of noxious weeds or invasive vegetation. When salmonids are present, the maintenance must be in compliance with the King County Public Rule for Maintenance of Agricultural Ditches and Streams Used by Salmonids.
King County National Flood Insurance Program Biological Opinion . Compliance Submittal and Programmatic Habitat Assessment
4‐79
Habitat restoration or enhancement projects are allowed in a wildlife conservation area if no clearing, external construction or other disturbance occurs during breeding season and are limited to:
o Those projects sponsored by a public agency that has natural resource management as a primary function or by a federally recognized tribe;
o Habitat restoration or enhancement projects prepared by a qualified biologist; and o Being conducted in accordance with an approved forest or Farm Management Plan
or Rural Stewardship Plan. Scientific sampling for salmonids is allowed on Type N or O aquatic areas if hazardous
substances or toxic materials are not used. Drilling and testing for Critical Areas Reports are allowed in a wildlife conservation area if no
clearing, external construction or other disturbance occurs during breeding season established under Section 198 of this ordinance.
Horticulture activities, including tilling, disking, planting, seeding, harvesting, preparing soil, rotating crops and related activities; grazing of livestock; construction or maintenance of livestock manure storage facility; and construction or maintenance of farm pond, fish pond, or livestock watering pond are allowed:
o If these activities have been in continuous existence since January 1, 2005, and there is no expansion into the critical area or critical area buffer. "Continuous existence" includes cyclical operations and managed periods of soil restoration, enhancement or other fallow states associated with these horticultural and agricultural activities; and
o For the expansion of existing or new agricultural activities where: o the site is predominately involved in the practice of agriculture, o there is no expansion into an area that has been cleared under I, II, III, IV-S
Forest Practice Permits, or is more than 10,000 square feet with tree cover at a uniform density of more than 90 trees per acre and with the predominant mainstem diameter of the trees at least 4 inches in diameter at breast height, not including areas that are actively managed as agricultural crops for pulpwood, Christmas trees or ornamental nursery stock,
o the activities are in compliance with an approved Farm Management; and o all best management practices associated with the activities specified in the
Farm Management Plan are installed and maintained. Construction or maintenance of livestock flood sanctuaries is not allowed in wildlife habitat
conservation areas and wildlife habitat networks. Construction of agricultural drainage is allowed in a wildlife conservation area if no clearing,
external construction or other disturbance occurs during breeding season and if in compliance with an approved Farm Management Plan and all best management practices associated with the activities specified in the Farm Management Plan are installed and maintained.
Maintenance of agricultural drainage is allowed if these activities have been in continuous existence since January 1, 2005, and there is no expansion into the critical area or critical area buffer. "Continuous existence" includes cyclical operations and managed periods of soil restoration, enhancement or other fallow states associated with these horticultural and agricultural activities. Maintenance of agricultural drainage is allowed if: o The site is predominately involved in the practice of agriculture; o There is no expansion into an area that has been cleared under I, II, III, IV-S or
Conversion IV-G Forest Practice Permits or where there is more than 10,000 square feet with tree cover at a uniform density of more than 90 trees per acre and with the predominant mainstem diameter of the trees at least 4 inches in diameter at breast

King County National Flood Insurance Program Biological Opinion . Compliance Submittal and Programmatic Habitat Assessment
4‐80
height, not including areas that are actively managed as agricultural crops for pulpwood, Christmas trees or ornamental nursery stock;
o The activities are in compliance with an approved Farm Management Plan; and o All best management practices associated with the activities specified in the Farm
Management Plan are installed and maintained. Maintenance of an agricultural drainage system that is used by salmonids is allowed if it in
compliance with an approved farm plan. Excavation of cemetery graves in an established and approved cemetery is allowed.
Maintenance of cemetery graves is allowed, whether in an established and approved cemetery or not.
Maintenance of lawns, landscaping and gardening for personal consumption is allowed within existing landscaped areas or other previously disturbed areas.
Maintenance of golf courses is allowed in a wildlife conservation area if no clearing, external construction or other disturbance occurs during breeding season, and when not performed under the direction of a government agency only if: o The maintenance does not involve the use of herbicides, hazardous substances,
sealants or other liquid oily substances in aquatic areas, wetlands or their buffers, and o When the maintenance or the replacement of bridges or culverts involves waters used
by salmonids, the work is in compliance with ditch standards in a public rule and the maintenance of culverts is limited to removal of sediment and debris from the culvert and its inlet, invert and outlet and the stabilization of the disturbed or damaged bank or channel immediately adjacent to the culvert and does not involve the excavation of a new sediment trap adjacent to the inlet.
Clearing and Grading Purpose King County’s clearing and grading regulations are intended to regulate and protect critical areas from adverse clearing and grading operations including but not limited to the removal of vegetation, grading and earthwork construction, and mining and materials processing operations. These regulations establish standards for how and when clearing and grading activities can be undertaken, establishes administrative procedures for the approval, issuance and inspection of clearing and grading permits and provides for penalties for the violation of these regulations. When is a clearing and grading permit required? Clearing or grading in any amounts within critical areas or critical areas buffers. Clearing in any quantities in areas subject to property specific development standards
provided under K.C.C. 21A.38. Different thresholds apply if the work is occurring outside of critical areas. Exceptions when a clearing and grading permit is not required: Certain activities conducted in and adjacent to critical areas are exempt from the need to obtain a permit provided the work is conducted in accordance with operating standards in K.C.C. 16.82.100 and conforms to the limitations outlined in the permit exception table and the critical area alterations table. These exempt activities include: Maintenance of lawn, landscaping and gardening for personnel consumption; Maintenance of public and private roadways with some limitations adjacent to aquatic areas
and wetlands;

King County National Flood Insurance Program Biological Opinion . Compliance Submittal and Programmatic Habitat Assessment
4‐81
Construction and maintenance of farm field access roads subject to an approved farm management plan;
Certain agricultural practices including tilling, discing, planting and seeding, and related activities;
Construction and maintenance of manure storage facilities, and maintenance of ponds and drainage facilities subject to an approved farm management plan.
Clearing and Grading Permits The short form is a field issued permit for projects that generally meet the following criteria:
o In certain limited instances, short form permits are used to authorize hazard tree removal and other minor miscellaneous clearing from critical area buffers provided the alterations are allowed under the CAO.
o The project is exempt from State Environment Policy Act (SEPA) review or was covered under a prior determination; and
o The proposal does not include any permanent drainage facilities or exceed the thresholds requiring preparation of a drainage plan as outlined in K.C.C. 9.04 and the King County Surface Water Design Manual.
If you do not qualify for a short form a standard permit application will be required. Emergencies Any activity that would normally require a permit, including alterations to critical areas, that at the time taken was not in compliance with the provisions of this code, will not be considered a violation if the action was undertaken in response to an emergency and the following steps are taken: The department was notified prior to undertaking the activity, or if that is not possible, within
48 hours of performing the work. A pre-application meeting is scheduled within 48 hours of conducting the work and is held
within 30 days. At the pre-application meeting, the department will provide direction to the applicant for corrective action or mitigation necessary to comply with K.C.C. chapter 21A.24. Clearing and grading permit decision processes Clearing and grading permits are reviewed pursuant to the permit process and procedures provisions of K.C.C. Chapter 20.20 for compliance with applicable King County codes including, but not limited to, the critical area ordinance, shoreline management program and King County Surface Water Design Manual and may also be conditioned to mitigate identified project impacts. Projects that cannot mitigate impacts to less than significant levels or that cannot be modified or conditioned to meet King County code requirements will be denied. Conditions necessary to comply with the critical area, shoreline, drainage and other King County development regulations are incorporated by reference into all clearing and grading permits. Clearing and grading standards Any activity that involves clearing, grading or that otherwise alters the condition of any critical area or buffer, whether or not a permit has been obtained or is required, in addition to meeting the critical area development standards, must also meet the operating standards of the clearing and grading ordinance. These operating conditions are aimed primarily at developing stable construction sites while maintaining soil hydrology, protecting water quality, preserving native vegetation.

King County National Flood Insurance Program Biological Opinion . Compliance Submittal and Programmatic Habitat Assessment
4‐82
Soil hydrology related to clearing and grading Areas that have been cleared or graded shall have the soil moisture holding capacity restored to that of the original undisturbed soil native to the site. This can be accomplished in several ways. The organic duff layer and native topsoil can be left in an undisturbed state. If any of these
materials are removed during grading, they should be stockpiled on site in designated areas that are not adjacent to public resources or critical areas. The duff layer and topsoil shall be reapplied to other portions of the site at the completion of grading. If the reapplication of duff and topsoil is not adequate to meet this requirement, soil amendments can be applied.
If the soil in any area has been compacted or if portions of the duff or topsoil layers have been removed, the soil shall be amended to mitigate for the lost moisture-holding capacity. The topsoil shall be replaced between May 1 and October 1: and
o be a minimum of 8 inches thick unless the owner can demonstrate that a different application will replicate the pre-disturbance soil moisture holding capacity of the site;
o have an organic matter content of 8 to 13 percent dry weight and a pH suitable for the proposed landscaping.
Organic matter content can be achieved by: Amending soils on site with compost; importing compost-amended soil to the site and mixing it with existing soil; importing compost-amended soil and spreading it over the graded areas, or scooping native soils with plants intact to a depth of 18 inches, or below the root zone,
whichever is deeper, and moving them to a receiving site, or back to the original location. Topsoil-compost blends imported from offsite should contain from 10 to 30 percent fines passing the number 200 sieve. For best results, subsoils should be scarified to a depth of at least 2 inches in order to avoid stratified soil layers. These standards do not apply if the cleared or graded area will be covered by an approved impervious surface or incorporated into an approved drainage facility.
Water quality protection and clearing and grading Any person who clears, grades or disturbs a site is required to provide erosion and sediment control that prevents the transport of sediment to wetlands and aquatic resources, drainage facilities or adjacent properties. In addition, from October 1 through April 30, no clearing or grading shall be performed until it has been determined by the director, in writing, that work during this period will comply with the erosion and sediment control performance and implementation requirements of the King County Surface Water Design Manual. In making this determination, the director will consider: Slope, soil type, aspect, vegetative cover and proximity of receiving waters; Proposed limitations on activities and extent of disturbed areas; Proposed erosion and sediment control measures; and Natural resource values. Certain activities are exempt from the seasonal requirements listed above. These include: Repair and maintenance of erosion and sediment control facilities; Sites with approved, installed ESC facilities that infiltrate 100% of surface water runoff; Routine landscape activities of existing single-family residences that do not require a permit;
and Response to emergencies that threaten the public health, safety or welfare.

King County National Flood Insurance Program Biological Opinion . Compliance Submittal and Programmatic Habitat Assessment
4‐83
Activities that are exempt from these seasonal limitations must still comply with other provisions of this ordinance as well as the development conditions in the CAO.
Vegetation management and clearing and grading On individual lots in the RA Zone, native vegetation shall be retained as follows: For lots 1¼ acre or smaller, excluding clearing necessary for access, utilities and onsite
septic systems, clearing shall not exceed the greater of: o the amount cleared before January 1, 2005, or cleared under a complete permit
application filed before October 25, 2004; o 50 percent of the lot area; or o 7,000 thousand square feet.
For lots greater than 1¼ acres and up to 5 acres, clearing shall not exceed the greater of: o the amount legally cleared before January 1, 2005, or cleared under a complete
permit application filed before October 25, 2004; or o 50 percent of the lot area.
For lots greater than 5 acres, clearing shall not exceed the greater of: o the amount legally cleared before January 1, 2005, or cleared under a complete
permit application filed before October 25, 2004; o 2½ acres; or o 35 percent of the lot area.
For lots greater than 1¼ acres in either the Bear Creek, Issaquah Creek or May Creek Basins, clearing shall not exceed the greater of:
o the amount legally cleared before January 1, 2005 or cleared under a complete permit application filed before October 25, 2004; or
o 35 percent of the lot area. These standards will not apply if more restrictive standards apply through application of the CAO or Special District overlays under K.C.C. 21A.38. Areas set aside for critical areas or buffers may count towards these clearing retention standards. The maximum amount of clearing may also be modified through an approved and current rural stewardship or farm management plan prepared pursuant to K.C.C. 21A.24. These clearing standards will also not apply under the following circumstances: Lots within a subdivision or short subdivision that were approved with clearing restrictions
that conform to these standards; Areas within open space tracts created as part of a subdivision or short subdivision may be
credited on a pro-rata basis towards the clearing retention standards for an individual lot within the subdivision or short subdivision;
Areas encumbered by a utility corridor, or easement for a public road or trail rights-of-way or access easement will not be counted toward the cleared area limit; and
The minimum clearing necessary to relocate an equestrian trail will not be counted towards the cleared area limit;
Within the urban growth area, conifer trees greater than 8 inches in diameter and deciduous trees greater than 12 inches in diameter shall be retained or replaced. The rate of retention and/or replacement is a function of the intensity of development. Project sites with 25 percent or more of the total gross site area in critical areas, critical area buffers or other areas to be left undisturbed, such as wildlife corridors, are exempt from these urban tree retention standards.

King County National Flood Insurance Program Biological Opinion . Compliance Submittal and Programmatic Habitat Assessment
4‐84
Drainage Review and Requirements Projects that require permits in King County may be subject to drainage review as required under the surface water runoff policies codified in Chapter 9.04 of the King County Code. This section describes the drainage review procedures and types, and provides an overview of drainage requirements. Drainage Review Drainage review is the evaluation by DDES permit review staff of a proposed project's compliance with the drainage requirements of the Surface Water Design Manual (SWDM). The Surface Water Design Manual is available at: http://your.kingcounty.gov/dnrp/library/water-and-land/stormwater/surface-water-design-manual/MainBody-2009.pdf During drainage review, members of the DDES permit review staff also evaluate the proposed project for compliance with other King County drainage-related requirements such as those specified in the critical areas and clearing and grading codes. Drainage review is an integral part of the overall permit review process. Determine whether your proposed project is subject to the requirements of the SWDM by seeing if it meets any of the thresholds for drainage review specified in ”Projects Requiring Drainage Review” below. Making this determination requires an understanding of the key definitions listed below. If drainage review is required, use the flow chart to determine what type of drainage review will be conducted by DDES. The type of drainage review defines the scope of drainage requirements that will apply to your project. Check the more detailed threshold information in the narrative discussion under the heading “Projects Requiring Drainage Review” to verify that you have determined the correct type of drainage review. Key Words and Phrases Construct or modify: To install a new drainage pipe/ditch or make improvements to an existing drainage pipe/ditch (for purposes other than maintenance, and excluding driveway culverts installed as part of single-family residential building permits) that either serves to concentrate previously non-concentrated surface and storm water runoff or serves to increase, decrease, and/or redirect the conveyance of surface and storm water runoff. High-use site: A commercial or industrial site that (1) has an expected average daily traffic (ADT) count equal to or greater than 100 vehicles per 1,000 square feet of gross building area, (2) is subject to petroleum storage or transfer in excess of 1,500 gallons per year, not including delivered heating oil, or (3) is subject to use, storage, or maintenance of a fleet of 25 or more diesel vehicles that are over 10 tons net weight (trucks, buses, trains, heavy equipment, etc.). Also included is any road intersection with a measured ADT count of 25,000 vehicles or more on the main roadway and 15,000 vehicles or more on any intersecting roadway, excluding projects proposing primarily pedestrian or bicycle use improvements. Land disturbing activity: Any activity that results in a change in the existing soil cover (both vegetative and non-vegetative) and/or the existing soil topography. Land disturbing activities

King County National Flood Insurance Program Biological Opinion . Compliance Submittal and Programmatic Habitat Assessment
4‐85
include, but are not limited to demolition, construction, clearing, grading, filling, excavation, and compaction. Landscape maintenance, gardening, and farming activities are not considered to be land disturbing activities. Maintenance: Those usual activities taken to prevent a decline, lapse, or cessation in the use of currently serviceable structures, facilities, equipment or systems if there is no expansion of the structure, facilities, equipment or system and there are no significant hydrologic impacts. Maintenance includes the repair or replacement of non-functional facilities and the replacement of existing structures with different types of structures, if the repair or replacement is required to meet current engineering standards or is required by one or more environmental permits and the functioning characteristics of the original facility or structure are not changed. For the purposes of applying this definition to the thresholds and requirements of this manual, DDES will determine whether the functioning characteristics of the original facility or structure will remain sufficiently unchanged to consider replacement as maintenance. Native vegetated surface: A surface in which the soil conditions, ground cover, and species of vegetation are like those of the original native condition for the site. More specifically, this means (1) the soil is either undisturbed or has been treated according to the "native vegetated landscape" specifications in Appendix C, Section C2.2.7, (2) the ground is either naturally covered with vegetation litter or has been top-dressed with 4 inches of hog fuel (or other suitable mulch) consistent with the native vegetated landscape specifications in Appendix C, and (3) the vegetation is either (a) comprised predominantly of plant species, other than noxious weeds, which are indigenous to the coastal region of the Pacific Northwest and which reasonably could have been expected to naturally occur on the site, or (b) comprised of plant species as specified for a native vegetated landscape in Appendix C. Examples of plant species include trees such as Douglas fir, Western hemlock, Western red cedar, alder, big-leaf maple and vine maple; shrubs such as willow, elderberry, salmonberry and salal; and herbaceous plants such as sword fern, foam flower, and fireweed. Natural discharge area: An onsite area tributary to a single natural discharge location. Natural discharge location: The location where runoff leaves the project site under existing site conditions. New impervious surface: The addition of a hard or compacted surface such as roofs, pavement, gravel or dirt, or the addition of a more compacted surface such as the paving of pre-existing dirt or gravel. New pervious surface: The conversion of a native vegetated surface or other native surface to a non-native pervious surface (e.g., conversion of forest or meadow to pasture land, grass land, cultivated land, lawn, landscaping, bare soil, etc.), or any alteration of existing non-native pervious surface that significantly increases surface and storm water runoff (e.g., conversion of pasture land, grass land, or cultivated land to lawn, landscaping, or bare soil). Project: Any proposed action to alter or develop a site that may also require drainage review. Project site: That portion of a site and any offsite areas subject to proposed project activities, alterations, and improvements including those required by this manual. . Redevelopment project: A project that proposes to add, replace, or modify impervious surfaces (for purposes other than a residential subdivision or maintenance) on a site that is

King County National Flood Insurance Program Biological Opinion . Compliance Submittal and Programmatic Habitat Assessment
4‐86
already substantially developed in a manner consistent with its current zoning or with a legal non-conforming use or has an existing impervious surface coverage of 35% or more. The following examples illustrate the application of this definition. A Redevelopment Project that Adds New Impervious Surface
A Redevelopment Project that Replaces Impervious Surface
A Redevelopment Project that Adds and Replaces Impervious Surface
Replaced impervious surface: Any existing impervious surface on the project site that is proposed to be removed and re-established as impervious surface, excluding impervious surface removed for the sole purpose of installing utilities or performing maintenance. Removed means the removal of buildings down to bare soil or the removal of Portland cement concrete (PCC) slabs and pavement or asphaltic concrete (AC) pavement together with any asphalt-treated base (ATB). It does not include the removal of pavement material through grinding or other surface modification unless the entire layer of PCC or AC together with ATB is removed. Single-family residential project: Any project that (a) constructs or modifies a single-family dwelling unit, (b) makes improvements (e.g., driveways, roads, outbuildings, play courts, etc.) or clears native vegetation on a lot that contains or will contain a single-family dwelling unit, or (c) is a plat, short plat, or boundary line adjustment which creates or adjusts lots that will contain single-family dwelling units. Site (a.k.a. development site): A single parcel, or two or more contiguous parcels that are under common ownership or documented legal control, used as a single parcel for purposes of applying for authority from King County to carry out a development/project proposal. For projects located primarily within dedicated rights-of-way, site includes the entire width of right-of-way within the total length of right-of-way subject to improvements proposed by the project.
Existing
Existing Parking
New
Existing Parking
New Parking
Existing Pervious
Area (65%)
Existing Impervious
Existing Bldg
Commercial Site
Existing Impervious
Commercial Site Residential Site
New Bldg
Existing Bldg
New
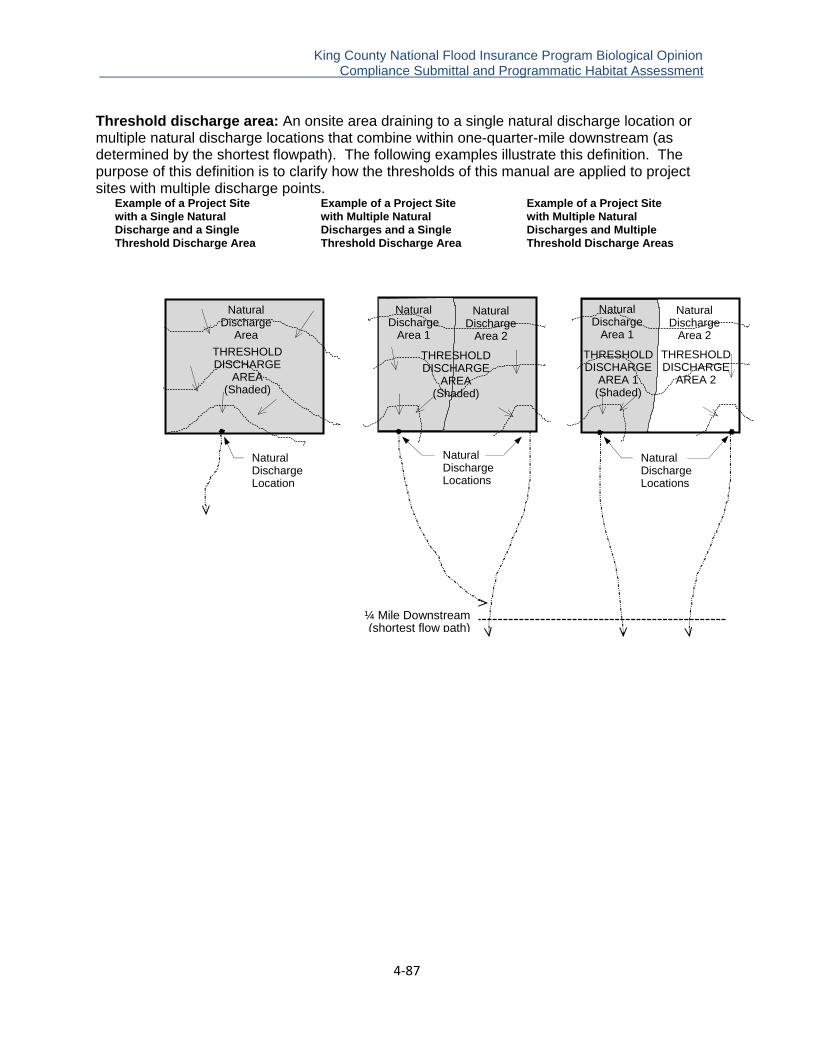
King County National Flood Insurance Program Biological Opinion . Compliance Submittal and Programmatic Habitat Assessment
4‐87
Threshold discharge area: An onsite area draining to a single natural discharge location or multiple natural discharge locations that combine within one-quarter-mile downstream (as determined by the shortest flowpath). The following examples illustrate this definition. The purpose of this definition is to clarify how the thresholds of this manual are applied to project sites with multiple discharge points.
Example of a Project Site with a Single Natural Discharge and a Single Threshold Discharge Area
Example of a Project Site with Multiple Natural Discharges and a Single Threshold Discharge Area
Example of a Project Site with Multiple Natural Discharges and Multiple Threshold Discharge Areas
THRESHOLDDISCHARGE
AREA 2
Natural Discharge Locations
Natural Discharge
Area 1
Natural Discharge
Area 2
THRESHOLD DISCHARGE
AREA (Shaded)
Natural Discharge
Area 1
Natural Discharge
Area 2
Natural Discharge
Area
THRESHOLD DISCHARGE
AREA (Shaded)
THRESHOLD DISCHARGE
AREA 1 (Shaded)
¼ Mile Downstream(shortest flow path)
Natural Discharge Location
Natural Discharge Locations

King County National Flood Insurance Program Biological Opinion . Compliance Submittal and Programmatic Habitat Assessment
4‐88
Projects Requiring Drainage Review Drainage review is required for any proposed project (except those proposing only maintenance) that is subject to a King County development proposal, permit, or approval listed at right, AND which meets any one of the following conditions:
The project adds or will result in 2,000 square feet1 or more of new impervious surface; OR The project proposes 7,000 square feet1 or more of land disturbing activity; OR The project proposes to construct or modify a drainage pipe/ditch that is 12 inches or more in size/depth, or receives surface and storm water runoff from a drainage pipe/ditch that is 12 inches or more in size/depth; OR The project contains or is adjacent to a floodplain, stream, lake, wetland, closed depression, or other critical area as defined in K.C.C. 21A.24, excluding seismic, coal mining, and volcanic hazard areas; OR The project is located within a critical drainage area;2 OR The project is a redevelopment project proposing $100,0003 or more of improvements to an existing high-use site; OR The project is a redevelopment project on a single or multiple parcel site in which the total of new plus replaced impervious surface is 5,000 square feet or more and whose valuation of proposed improvements (including interior improvements and excluding required mitigation and frontage improvements) exceeds 50% of the assessed value of the existing site improvements. If drainage review is required for the proposed project, the type of drainage review must be determined based on project and site characteristics as described below. The type of drainage review defines the scope of drainage requirements that must be evaluated for project compliance with the SWDM.
1 The thresholds for new impervious surface and land disturbing activity shall be applied by threshold discharge area and in accordance with the definitions of these surfaces and activities. 2 See Reference Section 3 for a list of critical drainage areas. 3 This is the "project valuation" as declared on the permit application submitted to DDES. The dollar amount of this threshold is considered to be as of January 8, 2001 and may be adjusted on an annual basis using the local consumer price index (CPI). Note: January 8, 2001 is the effective date of the ESA 4(d) Rule for Puget Sound Chinook salmon.
King County Permits and Approvals
Administrative Subdivision (short plat) Binding Site Plan Boundary Line Adjustment Conditional Use* Clearing Commercial Building Experimental Design Adjustment* Formal Subdivision (plat) Franchise Utility Right-of-Way Use Grading Pre-application Adjustment* Right-of-Way Use Shoreline Substantial Development* Single-family Residential Building Special Use* Unclassified Use* Urban Planned Development Zoning Reclassification* Zoning Variance* *Note: If the proposed project will require subsequent permits subject to drainage review, then DDES may allow the drainage review to be deferred until application for the later permits.
King County National Flood Insurance Program Biological Opinion . Compliance Submittal and Programmatic Habitat Assessment
4‐89
Drainage Review Types and Requirements For most projects adding 5,000 square feet or more of impervious surface, the full range of core and special requirements contained in Sections 1.2 and 1.3 must be evaluated for compliance through the drainage review process. However for some types of projects, the scope of requirements applied is narrowed to allow more efficient, customized review. Each of the following four drainage review types tailors the review process and application of drainage requirements to a project's size, location, type of development, and anticipated impacts to the local and regional surface water system: Small Project Drainage Review Targeted Drainage Review Full Drainage Review Large Project Drainage Review Each project requires only one of the above drainage review types, with the single exception that a project which qualifies for small project drainage review may also require targeted drainage review. The following flow chart can be used to determine which drainage review type would be required. Note that projects requiring full drainage review and large site drainage review will require the services of a professional engineer. Many projects requiring targeted drainage review will also require the services of a professional engineer.

King County National Flood Insurance Program Biological Opinion . Compliance Submittal and Programmatic Habitat Assessment
4‐90
FLOW CHART FOR DETERMINING TYPE OF DRAINAGE REVIEW REQUIRED
Is the project a single family residential or agricultural project that results in 2,000 sf of new impervious surface and meets one of the following criteria?
The project results in 10,000 sf of total impervious surface added since 1/8/01 and 35,000 sf of new pervious surface, or for sites zoned as RA, F, or A, new pervious surface 70,000 sf or 35% of the site, whichever is greater, OR
The project results in 4% total impervious surface and 15% new pervious surface on a single parcel site zoned as RA or F, or a single/multiple parcel site zoned as A, and all impervious area on the site, except 10,000 sf of it, is set back from any down slope site boundary, drainage system, or critical area at least 100 ft for every 10,000 sf of total impervious surface?
Yes
SMALL PROJECT DRAINAGE REVIEW
Note: The project may also be subject to Targeted Drainage Review as determined below.
No
Does the project result in 2,000 sf of new impervious surface or 35,000 sf of new pervious surface, OR is the project a redevelopment project on a parcel or combination of parcels in which new plus replaced impervious surface totals 5,000 sf and whose valuation of proposed improvements (excluding required mitigation and frontage improvements) is >50% of the assessed value of existing improvements?
No
Does the project have the characteristics of one or more of the following categories of projects (see the more detailed threshold language on p. 3.7)?
1. Projects that contain or are adjacent to floodplains or critical areas; projects within a Critical Drainage Area or Landslide Hazard Drainage Area; or projects that propose 7,000 sf (3 ac if the project is in Small Project Drainage Review) of land disturbing activity.
2. Projects proposing to construct or modify a drainage pipe/ditch that is 12" or larger or receives runoff from a 12" or larger drainage pipe/ditch.
3. Redevelopment projects proposing $100,000 in improvements to an existing high-use site.
Yes No Yes
Reassess whether drainage review is required
TARGETED DRAINAGE REVIEW
Note: See Surface Water Design Manual.
Is the project an Urban Planned Development (UPD), OR does it result in 50 acres of new impervious surface within a subbasin or multiple subbasins that are hydraulically connected, OR does it have a project site 50 acres within a critical aquifer recharge area?
No FULL DRAINAGE REVIEW
Note: See Surface Water Design Manual.
Yes
LARGE PROJECT DRAINAGE REVIEW
Note: See Surface Water Design Manual
King County National Flood Insurance Program Biological Opinion . Compliance Submittal and Programmatic Habitat Assessment
4‐91
Small Project Drainage Review Small Project Drainage Review is a simplified drainage review for a small residential building, clearing, and subdivision projects or small agricultural projects that result in either:
10,000 square feet or less of impervious surface added on or after January 8, 2001 (the effective date of the ESA 4(d) Rule for Puget Sound Chinook salmon) or
less than 4% of total impervious surface. The core and special requirements applied under Full Drainage Review are replaced with simplified small project drainage requirements that can be applied by a non-engineer. These requirements include simple stormwater dispersion, infiltration, and site design techniques called flow control BMPs, which provide the necessary mitigation of flow and water quality impacts for small projects. Also included are simple measures for erosion and sediment control (ESC). This simplified form of drainage review acknowledges that drainage impacts for many small project proposals can be effectively mitigated without construction of costly flow control and water quality facilities. The Small Project Drainage Review process minimizes the time and effort required to design, submit, review, and approve drainage facilities for these proposals. In most cases, the requirements can be met with submittals prepared by contractors, architects, or homeowners without the involvement of a civil engineer. Threshold for Small Project Drainage Review Small Project Drainage Review is required for any single family residential project or agricultural project that will result in 2,000 square feet or more of new impervious surface, replaced impervious surface, or new plus replaced impervious surface, or 7,000 square feet or more of land disturbing activity, AND that meets one of the following criteria:
The project will result in no more than 10,000 square feet of total impervious surface added on or after January 8, 2001, no more than 5,000 square feet of new impervious surface, and no more than 35,000 square feet of new pervious surface (for sites zoned as RA, F, or A, the new pervious surface threshold may be increased to 52,500 square feet or to the remaining portion of the site if 65% or more of the site is preserved in native vegetation by clearing limit, covenant, easement, or tract), OR
The project will result in no more than 10,000 square feet of total impervious surface added on or after January 8, 2001 and its new pervious surface area will be no more than 35,000 square feet minus 3.25 times the area of new impervious surface being proposed by the project (for sites larger than 22,000 square feet, a factor of 2.25 may be used instead of 3.25, and for sites zoned as RA, F, or A or the allowable amount of new pervious surface calculated herein may be increased by 50% or may be the remaining portion of site if 65% or more of the site is preserved in native vegetation by clearing limit, covenant, easement, or tract), OR
The project will result in no more than 4% total impervious surface and 15% new pervious surface on a single parcel site zoned as RA or F, or on a single or multiple parcel site zoned as A, AND all impervious surface area, except 10,000 square feet of it, will be set back from its natural location of discharge from the site at least 100 feet for every 10,000 square feet of total impervious area.
Targeted Drainage Review Targeted Drainage Review (TDR) is an abbreviated evaluation by DDES permit review staff of a proposed project's compliance with selected core and special requirements. Projects subject to this type of drainage review are typically Small Project Drainage Review proposals or other small projects that have site-specific or project-specific drainage concerns that must be addressed by a civil engineer or DDES engineering review staff. Under Targeted Drainage

King County National Flood Insurance Program Biological Opinion . Compliance Submittal and Programmatic Habitat Assessment
4‐92
Review, engineering costs associated with drainage design and review are kept to a minimum because the review includes only those requirements that would apply to the particular project. Threshold for Targeted Drainage Review TDR is required for any proposed project that is subject to drainage review but is not subject to Full or Large Project Drainage Review, AND that has the characteristics of one or more of the following project categories:
TDR Project Category #1: Projects that contain or are adjacent to a flood hazard area, erosion hazard area, or steep slope hazard area as defined in K.C.C. 21A.06; OR projects located within a Critical Drainage Area or Landslide Hazard Drainage Area; OR projects that propose 7,000 square feet (1 acre if in Small Project Drainage Review) or more of land disturbing activity. Note: at the discretion of DDES, this category may also include any project in Small Project Drainage Review that has a design or site-specific issue that must be addressed by a civil engineer.
TDR Project Category #2: Projects that propose to construct or modify a drainage pipe/ditch that is 12 inches or more in size/depth or receives surface and storm water runoff from a drainage pipe/ditch that is 12 inches or more in size/depth.
TDR Project Category #3: Redevelopment projects that propose $100,000 or more of improvements to an existing high-use site.
Full Drainage Review Full Drainage Review is the evaluation by King County staff of a proposed project's compliance with the full range of core and special requirements in the Surface Water Design Manual. This review addresses the impacts associated with changing land cover on typical sites. Threshold for Full Drainage Review Full Drainage Review is required for any proposed project, including a redevelopment project, that is subject to drainage review, AND that meets one or more of the following criteria:
The project will result in 2,000 square feet or more of new impervious surface, replaced impervious surface, and new plus replaced impervious surface but is not subject to Small Project Drainage Review, OR
The project will result in 7,000 square feet or more of land disturbing activity but is not subject to Small Project Drainage Review, OR
The project is a redevelopment project on a parcel or combination of parcels in which the total of new plus replaced impervious surface is 5,000 square feet or more and whose valuation of proposed improvements (including interior improvements and excluding required mitigation and frontage improvements) exceeds 50% of the assessed value of the existing parcel improvements.
Large Project Drainage Review Large Project Drainage Review is applied to development proposals that are large and/or involve resources or problems of special sensitivity or complexity. Because of the large size and complexities involved, there is usually a greater risk of significant impact or irreparable damage to sensitive resources. Such proposals often require a more definitive approach to drainage requirements than that prescribed by the core and special requirements; it may be appropriate to collect additional information about site resources, use more sophisticated models, and prepare special studies not specified in this manual. Large Project Drainage Review entails preparation of a master drainage plan (MDP) or limited scope MDP that is reviewed and approved by DDES.
King County National Flood Insurance Program Biological Opinion . Compliance Submittal and Programmatic Habitat Assessment
4‐93
Threshold for Large Project Drainage Review Large Project Drainage Review is required for any proposed project that is subject to drainage review, AND that meets any one of the following criteria:
The project is designated for an Urban Planned Development (UPD) on the King County Comprehensive Plan Land Use Map, OR
The project would, at full buildout, result in 50 acres or more of new impervious surface within a single subbasin or multiple subbasins that are hydraulically connected15 across subbasin boundaries, OR
The project site is 50 acres or more (including growth reserve areas) within a critical aquifer recharge area as defined in K.C.C. 21A.06.
Water Quality Code
The Water Quality Code (King County Code 9.12 Water Quality) protects surface and ground water quality by providing minimum requirements for reducing and controlling the discharge of contaminants. The code prohibits any person from discharging contaminants into surface and storm water and ground water, and requires preventative measures to restrict contaminants from entering such waters. King County provides technical assistance to identify appropriate preventative measures, or BMPs. Failure to prevent contaminants from entering the water could result in enforcement and fines can be levied.
Stormwater Pollution Prevention Manual
The Stormwater Pollution Prevention Manual was developed to identify BMPs to prevent contaminants from entering storm, surface and ground waters. Pollutant source control BMPs, either structural or nonstructural, are identified by pollutant-generating activities. Examples include: 1) an engine repair activity would require the use of drip pans and ground cloths (nonstructural) to capture oil spills and drips, 2) a vehicle washing activity may require hookup to a sanitary sewer (structural) for discharge of soapy wash water. If source control measures are not sufficient to prevent contamination, then a treatment BMP, such as an oil/water separator, may be required to remove the pollutant. The Stormwater Pollution Prevention Manual can be viewed online at: http://dnr.metrokc.gov/wlr/dss/spcm.htm. Technical assistance is provided to identify required BMPs.
Shoreline Master Program
King County adopted its original SMP in 1978. That SMP still applies to King County’s shorelines. However, in October 2011 King County submitted to Ecology an updated SMP to bring King County’s SMP into compliance with updated guidelines adopted by Ecology in 2003. In the interim period, under state law King County’s existing CAO applies to critical areas located within the shoreline jurisdiction.
Bldg Bldg Area (35%) Area (35%) House

King County National Flood Insurance Program Biological Opinion . Compliance Submittal and Programmatic Habitat Assessment
4‐94
The SMP adopted by King County provides a legal framework for decision making on land use and other activities that complies with the SMA. This section describes the elements of the SMP, with the details being further developed throughout this chapter.
Components of the Shoreline Master Program
The King County SMP consists of this chapter and the implementing shoreline management regulations. This chapter describes King County’s shoreline goals and policies. It addresses the shoreline jurisdiction, overall shoreline policy goals, shoreline element policies, SMP relationship to other laws, shoreline environment designations, environmental protection, shoreline use and modification, and administrative policies. The following documents provide supporting information for these goals and policies:
King County Shoreline Protection and Restoration Plan (September 2010): The Shoreline Protection and Restoration Plan summarizes the methods and results of King County’s shoreline analysis with respect to restoration planning, the elements and applicability of the restoration plan, and the ways in which shoreline restoration is expected to occur over time. King County Shoreline Public Access Plan (September 2010): The Shoreline Public Access Plan includes an inventory of existing formal and informal shoreline public access opportunities in the unincorporated area, and identifies gaps in public access opportunities. The Shoreline Public Access Plan describes King County’s priorities for providing new public access to major shorelines in the unincorporated area. King County Shoreline Cumulative Impacts Assessment (September 2010): The Shoreline Cumulative Impacts Assessment provides a mechanism for examining the potential success of county policies and regulations in meeting the goal of no net loss of shoreline ecological processes and functions. King County Shoreline Inventory and Characterization (May 2007): The Shoreline Inventory and Characterization includes the data and analytic methods used to develop King County’s shoreline inventory and shoreline characterization (including evaluation of existing physical and shoreline ecological processes and functions, public access and recreation, land use and economic development, public facilities and utilities, and archaeological and historic resources). In addition, the Shoreline Inventory and Characterization includes methodologies for cumulative impact analysis associated with shoreline management and comprehensive shoreline restoration planning. Specific data can be found at: http://www.metrokc.gov/shorelines/shorelines-plan-update.aspx. King County Shoreline Map Folio (September 2010): The Shoreline Map Folio includes all maps produced and referenced as part of the SMP update, with the exception of those maps included in this chapter. All geographic information can be found at: http://www.kingcounty.gov/shorelines/shorelines-plan-update.aspx.
The terms “Shoreline Master Program,” “SMP,” “Shoreline Program” and “Program” are all used throughout this chapter to describe King County’s shoreline policies (this chapter) and shoreline management regulations in their entirety.
King County National Flood Insurance Program Biological Opinion . Compliance Submittal and Programmatic Habitat Assessment
4‐95
Shoreline policies
The SMP contains specific policies relating to a wide variety of shoreline uses and issues. Shoreline policies establish broad shoreline management directives. They are statements of intent by King County that direct or authorize a course of action or specify criteria for regulatory or non-regulatory action. The policies serve as the basis for regulations that govern use and development along the shoreline. King County’s shoreline policies must:
1. Be consistent with the SMA; 2. Address the master program elements of RCW 90.58.100; 3. Include policies for environmental designations as described in WAC 173-26-211; 4. Be designed and implemented in a manner consistent with all relevant constitutional and
other legal limitations on regulation of private property; and 5. Be consistent with the King County Comprehensive Plan and functional plans adopted
as components of the Comprehensive Plan. Shoreline policies provide a comprehensive foundation for the SMP regulations, which are more specific standards that are used to evaluate shoreline development proposals. King County must evaluate permit applications in light of the shoreline policies and may approve a permit only after determining that the development conforms to the policies in the Shoreline Master Plan. In addition, shoreline policies assist in prioritizing King County’s spending on facilities and services within shorelines of the state. Finally, the shoreline policies provide direction for regional issues such as resource management, environmental protection, transportation, inter-governmental coordination and regional planning.
Shoreline Environments
The SMA requires that shoreline management programs classify shoreline areas into specific environment designations. Ecology's guidelines recommend six different environment designations, but does not require that local programs adopt this particular scheme. King County's 1978 SMP adopted the four environment designations recommended by Ecology at that time: Urban, Rural, Conservancy, and Natural. King County adopted eight environment designations in total, based on the recommendations from Ecology. These environment designations are:
High Intensity Shoreline Environment: Applied to areas that provide high-intensity water-oriented commercial, transportation, and industrial uses. Residential Shoreline Environment: Applied to accommodate residential uses at urban densities, while allowing for non-residential uses that are consistent with the protection of the shoreline jurisdiction. Rural Shoreline Environment: Applied to accommodate rural residential shoreline development, while allowing for rural non-residential uses that are consistent with the protection of the shoreline.

King County National Flood Insurance Program Biological Opinion . Compliance Submittal and Programmatic Habitat Assessment
4‐96
Conservancy Shoreline Environment: Applied to protect and conserve the shoreline for ecological, public safety, and recreation, purposes. Includes areas with important shoreline ecological processes and functions, valuable historic and cultural features, flood and geological hazards and recreational opportunities. Residential areas can also be designated as conservancy shorelines. Resource Shoreline Environment: Applied to allow for mining and agriculture land uses, except for shorelines that are relatively intact or that have minimally degraded shoreline processes and functions. Forestry Shoreline Environment: Applied in areas to allow for forest production and protect municipal water supplies. Natural Shoreline Environment: Applied to shorelines that are relatively intact or have minimally degraded shoreline processes and functions that are intolerant of human use. Aquatic Shoreline Environment: Applied to the areas waterward of the ordinary high water mark.
Shoreline program elements
The SMA identifies eight “program elements” that must be addressed and included in local SMPs:
Economic development element that considers the location and design of industries, industrial projects of statewide significance, transportation facilities, port facilities, tourist facilities, commerce, and other developments that are particularly dependent on shorelines of the state. Public access element that considers public access to publicly owned land along shorelines of the state. Recreational element that identifies recreational opportunities along shorelines, such as parks, tidelands, beaches, and recreational areas, and that pursues acquisition through implementation of the King County SMP. Circulation element that consists of the general location and extent of existing and proposed major thoroughfares, transportation routes, terminals, and other public utilities and facilities. Land use element that considers the general distribution and location, as well as the extent of use on the shorelines and adjacent areas for housing, business, industry, transportation, agriculture, natural resources, recreation, education, public buildings and grounds, and other categories of public and private use of the land. Conservation element that addresses the preservation of natural resources including, but not limited to, scenic vistas, aesthetics, and vital estuarine areas for fish and wildlife. Historic, cultural, scientific and educational element that prevents the destruction of or damage to any site having historic, cultural, scientific, or educational value as identified by
King County National Flood Insurance Program Biological Opinion . Compliance Submittal and Programmatic Habitat Assessment
4‐97
the appropriate authorities, including affected Tribes, and the state office of archaeology and historic preservation. Flood hazard element that considers the prevention and minimization of flood damages.
Shoreline modifications and uses
The SMA requires that local SMPs distinguish between shoreline modifications and shoreline uses. Shoreline modifications are generally related to construction of a physical element such as a dike, breakwater, dredged basin, or fill, but can include other actions such as clearing, grading or application of chemicals. A shoreline modification is usually undertaken in support of or in preparation for a shoreline use. Shoreline uses are classified as "water-dependent," "water-related," "water-enjoyment," or "water-oriented."
A water-dependent use is a use or portion of a use that cannot exist in a location that is not adjacent to the water and that is dependent on the water by reason of the intrinsic nature of its operations. A water-related use is a use or portion of a use that is not intrinsically dependent on a waterfront location but whose economic viability is dependent upon a waterfront location because: (a) The use has a functional requirement for a waterfront location such as the arrival or
shipment of materials by water or the need for large quantities of water; or (b) The use provides a necessary service supportive of the water-dependent uses and
the proximity of the use to its customers makes its services less expensive or more convenient.
A water-enjoyment use is a recreational use or other use that facilitates public access to the shoreline as a primary characteristic of the use; or a use that provides for recreational use or aesthetic enjoyment of the shoreline for a substantial number of people as a general characteristic of the use and which, through location, design and operation, ensures the public’s ability to enjoy the physical and aesthetic qualities of the shoreline. In order to qualify as a water-enjoyment use, the use must be open to the general public and the shoreline-oriented space within the project must be devoted to the specific aspects of the use that fosters shoreline enjoyment. A water-oriented use is a use that is water-dependent, water-related, water-enjoyment, or a combination of such uses.
Shoreline jurisdiction The SMA applies to all “shorelines of the state.” “Shorelines of the state” are defined to include “shorelines” and “shorelines of statewide significance.”

King County National Flood Insurance Program Biological Opinion . Compliance Submittal and Programmatic Habitat Assessment
4‐98
It is important to understand the distinction between the terms “shorelines” and “shorelines of statewide significance.” Both terms are used throughout the SMA and define the scope of King County’s shoreline jurisdiction. The distinction is important because the SMA imposes greater and more specific obligations when dealing with shorelines of statewide significance. Shorelines. Shorelines are defined in the SMA as:
“Shorelines” means all of the water areas of the state, including reservoirs, and their associated shorelands, together with the lands underlying them; except (i) shorelines of statewide significance; (ii) shorelines on segments of streams upstream of a point where the mean annual flow is twenty cubic feet per second or less and the wetlands associated with such upstream segments; and (iii) shorelines on lakes less than twenty acres in size and wetlands associated with such small lakes.
Shorelines of statewide significance. Shorelines of statewide significance, as specifically defined in the SMA include:
Those areas of Puget Sound between the ordinary high water mark and the line of extreme low tides;
Lakes, whether natural, artificial or a combination thereof, with a surface acreage of 1,000 acres or more measured at the ordinary high water mark; and
Natural rivers or segments thereof downstream of a point where the mean annual flow is measured at 1,000 cubic feet per second or more.
In unincorporated King County, the water bodies that qualify as shorelines of statewide significance include:
The marine waters around Vashon-Maury Island Northeast Lake Washington (north of Kirkland) and southwest Lake Washington
(west of Renton) Lake Sammamish at Marymoor State Park and Lake Sammamish State Park Mud Mountain Reservoir and White River from river mile 15.5 to river mile 46
(excluding the Muckleshoot Indian Reservation between river mile 8.9 and river mile 15.5)
Green River from its confluence with the Duwamish River to river mile 95 Duwamish River from river mile 3.5 to river mile 5 Chester Morse Lake (Reservoir) Tolt Reservoir Mainstem Snoqualmie River to river mile 43 and Middle Fork Snoqualmie River to
river mile 39 South Fork Skykomish River to river mile 30.
Associated shorelands that are adjacent to shorelines of statewide significance are included within the shoreline of statewide significance jurisdiction. Shorelands. Shorelines includes “associated shorelands” which are defined in the SMA as follows:
King County National Flood Insurance Program Biological Opinion . Compliance Submittal and Programmatic Habitat Assessment
4‐99
“Shorelands” or “shoreland areas” means those lands extending landward for two hundred feet in all directions as measured on a horizontal plane from the ordinary high water mark; floodways and contiguous floodplain areas landward two hundred feet from such floodways; and all wetlands and river deltas associated with the streams, lakes, and tidal waters which are subject to the provisions of this chapter.
Shoreline jurisdiction. King County’s shoreline jurisdiction consists of the combination of shorelines, shorelines of statewide significance, and shorelands. The SMA gives King County the option of extending shoreline jurisdiction to include one-hundred year floodplains:
Any county or city may determine that portion of a one-hundred-year-floodplain to be included in its master program as long as such portion includes, as a minimum, the floodway and the adjacent land extending landward two hundred feet therefrom. (RCW 90.58.030(2)(f)(i))
In its original SMP adopted in 1977, King County included the one-hundred year floodplain. King County continued this regulation of the one-hundred year floodplain under the SMP in its proposed update. General Policy Goals The SMA policies of protecting shoreline ecological processes and functions, fostering reasonable use, and maintaining the public right of navigation and corollary uses result in certain mandatory policy goals for the shoreline jurisdiction. These policies apply to both shorelines and shorelines of statewide significance. The policies are not ranked in a specific order. King County reserves the right to balance these general policies based on the unique circumstances, location and physical condition of the shoreline. King County adopted the following policy goals to apply to all of the shoreline jurisdiction. The goals are not ranked in importance and have been assigned a number for identification purposes only. 1. The use of the shoreline jurisdiction for those economically productive uses that are
particularly dependent on shoreline location or use. 2. The use of the shoreline jurisdiction for public access and recreation. 3. Protection and restoration of the ecological processes and functions of shoreline natural
resources. 4. Protection of the public right of navigation and corollary uses of waters of the state. 5. The protection and restoration of buildings and sites having historic, cultural, and
educational value. 6. Planning for public facilities and utilities correlated with other shorelines uses. 7. Prevention and minimization of flood damage. 8. Recognizing and protecting private property rights. 9. Preferential accommodation of single-family residential uses. 10. Coordination of shoreline management with other relevant local, state and federal programs.

King County National Flood Insurance Program Biological Opinion . Compliance Submittal and Programmatic Habitat Assessment
4‐100
Shorelines of Statewide Significance Policy Goals The SMA identifies certain shorelines as "shorelines of statewide significance" and raises their status by setting use priorities and by calling for a higher level of effort in implementing the SMP. The state legislature has declared that the interest of all people shall be paramount in the management of shorelines of statewide significance. The legislature has established policy goals that govern shorelines of statewide significance. Significantly, these policy goals are ranked in order of preference, i.e., the first goal must be given priority over all subsequent goals:
1. Recognize and protect the statewide interest over local interest; 2. Preserve the natural character of the shoreline; 3. Result in long-term over short-term benefit; 4. Protect the resources and ecology of the shoreline; 5. Increase public access to publicly owned areas of the shorelines; 6. Increase recreational opportunities for the public in the shoreline; and 7. Provide for any other element as defined in RCW 90.58.100.
Critical areas located within shorelines are regulated under the SMA and implemented through local SMPs. The GMA requires that SMPs provide a level of protection for shoreline critical areas that assures no net loss of shoreline ecological functions necessary to sustain shoreline natural resources. Shoreline Critical Areas. King County’s SMP requires that its implementing regulations shall provide a level of protection for critical areas in the shoreline jurisdiction that assures no net loss of shoreline ecological functions necessary to sustain shoreline natural resources. King County accomplishes this by including its critical area regulations, described elsewhere in this document, into its SMP. Zoning, Clearing and Grading, and Stormwater Regulations. As described elsewhere in this document, King County has adopted a wide array of development regulations that protect various aspects of the environment and implement other King County policies. These regulations generally include King County’s surface water management regulations, clearing and grading regulations, and zoning. In the shoreline jurisdiction, the SMP may impose additional requirements. Under the SMA, shoreline development regulations must:
1. Be sufficient in scope and detail to ensure implementation of the SMA statewide
shoreline management policies, this chapter, and the King County Comprehensive Plan and functional plans adopted to implement the Comprehensive Plan;
2. Include regulations that apply to the environmental designations classified under WAC 173-26-211;
3. Include general regulations, specific use regulations that address issues of concern in regard to specific uses, and modification regulations;
4. Include clearing and grading and stormwater regulations that protect the ecological processes and functions of the shorelines; and
5. Design and implement regulations and mitigation standards in a manner consistent with all relevant constitutional and other legal limitations on the regulation of private property (RCW 90.58.100).
King County National Flood Insurance Program Biological Opinion . Compliance Submittal and Programmatic Habitat Assessment
4‐101
However, to the extent that it can, consistent with requirements of the SMA, King County is relying on its existing regulations to meet the requirements of the SMA. These include its surface water management regulations, clearing and grading regulations, and zoning. Flood Hazard Management Plan. The King County Flood Hazard Management Plan directs floodplain management within King County. This plan was developed in coordination with incorporated cities within King County as directed by RCW 86.12.210 and is binding on each jurisdiction located within King County. The goals of the King County Flood Hazard Management Plan are:
1. To reduce the risks from flood and channel migration hazards. 2. To avoid or minimize the environmental impacts of flood hazard management. 3. To reduce the long-term costs of flood hazard management.
Flood hazard regulations are implemented within unincorporated King County. Each jurisdiction within King County is required under the Flood Hazard Management Plan to adopt flood hazard management regulations that meet the minimum requirements of the National Flood Insurance Program. In 2007, the King County Council approved the formation of a countywide flood control zone district under the authority in RCW 86.15.025. The overarching countywide strategies and objectives include:
1. Improving levee protection through major commercial, industrial and residential areas; 2. Improving flood water conveyance and capacity; 3. Reducing hazards by removing flood, erosion, and landslide prone residential structures; 4. Providing safe access to homes and businesses by protecting key transportation routes; 5. Minimizing creation of new risks to public safety from development pressure.
The King County Flood Control Zone District (FCZD) is governed by a District Board of Supervisors that consists of the members of the King County Council. An advisory committee advises the board of supervisors of the FCZD on regional flood protection issues by providing recommendations to the board of supervisors on the district's work program and budget, including capital improvement program projects. King County is relying on the Flood Hazard Management Plan and the FCZD to meet the general SMP provisions for flood hazard reduction in WAC 173-26-221(3). Shoreline environment designations. Shoreline management addresses a wide range of physical conditions and development settings. The SMP classifies shoreline reaches into defined environment designations, based on the existing use pattern, the current biological and physical character of the shoreline, and the goals and aspirations of the community. King County prescribes environmental protection measures, allowable use provisions, and development standards for each shoreline environment designation.
King County National Flood Insurance Program Biological Opinion . Compliance Submittal and Programmatic Habitat Assessment
4‐102
King County has established eight shoreline environment designations: A. High Intensity Shoreline B. Residential Shoreline C. Rural Shoreline D. Conservancy Shoreline E. Resource Shoreline F. Forestry Shoreline G. Natural Shoreline H. Aquatic
Environment Designation Criteria. King County has a long history of comprehensive planning and basin planning. Beginning in the 1980s, basin plans were developed throughout the county and helped identify fragile aquatic resources. Relying on these plans, King County has assigned zoning that is appropriate given the nature of the resources that need protection. As a result, fragile resources generally have zoning classifications that permit only low intensity development. King County's zoning regulations limit high intensity development to urban areas designated under the County-Wide Planning Policies and the King County Comprehensive Plan. King County recognizes, however, that zoning by itself is insufficient to determine the shoreline environment designations. Other factors are also important in assuring that the shoreline environment designations help King County achieve the goals of the SMA. These factors include, for a given shoreline:
Existing development patterns together with zoning, the King County Comprehensive Plan land use designations and other officially adopted plans;
Existing shoreline ecological processes and functions and the degree of human alteration;
Whether the reach has a restoration priority that demonstrates it has both basin conditions and existing shoreline condition that support extra efforts to maintain shoreline ecological processes and functions and the length of such reaches;
Federal, State, County, Tribal and municipal watershed ownership status; The goals of King County citizens for their shorelines as set forth in this chapter; Pursuant to RCW 90.58.100(4), for state-owned shorelines the public demand for
wilderness beaches and other recreational activities and for ecological study areas; and Other state policies in the SMA and the Ecology's guidelines (RCW 90.58.020 and WAC
173-26, respectively). The following figure depicts the decision making process that is used to determine the appropriate shoreline environment designation for a given shoreline.

King County National Flood Insurance Program Biological Opinion . Compliance Submittal and Programmatic Habitat Assessment
4‐103
The shoreline environment designations take into account several elements. Areas currently meeting the criteria for high levels of protection are given greater levels of protection. The determination of whether an area deserves a greater level of protection is based either on its current ownership and condition, e.g. publicly owned natural areas or wilderness areas, or on its restoration rating. The restoration rating is discussed in more detail below. Zoning is also an important criterion. King County has for years implemented zoning as a means to protect more sensitive areas from intense development. Shoreline environment designations also take into account whether a reach is located within a floodway and severe channel migration hazard area and gives greater protection to these areas due to their importance in maintaining shoreline ecological processes and functions and because of public health and safety concerns. The restoration rating (see King County Shoreline Protection and Restoration Plan (September 2010)) is included in the designation as a way to incorporate more strongly the current degree of alteration along the shoreline, the biological importance of the reach in a watershed context, and the restoration priorities associated with the combination of the two analyses. The restoration ratings are largely concerned with whether it is most appropriate to implement measures to protect or conserve a site, restore it to a previous condition, or undertake projects to enhance its current condition or to create new features with shoreline ecological processes and functions. These ratings also provide guidance on areas where it is important to protect existing shoreline ecological processes and functions.

King County National Flood Insurance Program Biological Opinion . Compliance Submittal and Programmatic Habitat Assessment
4‐104
Restoration ratings combine the reach characterization based on the results from an alterations analysis with the context of basin analyses. The reach or drift cell characterization is an assessment of the extent to which ecosystem structure, processes, and, ultimately, functions for a reach or drift cell are affected by anthropogenic factors. Scores resulting from this assessment are indicative of the degree to which shoreline ecological processes have been altered and impaired. The reach characterizations are found in King County Shoreline Inventory and Characterization: Methodology and Results (May 2007). The basin analysis is based on the Basin Condition Map adopted by the King County Council in K.C.C. 21A.24.065.
Restoration Score
Basin Condition
Reach Condition Actions
A High High Conserve, Preserve
B High Moderate Conserve, Preserve, Restore, Enhance
C High Low Restore, Enhance
D Moderate High Conserve, Enhance, Restore, Preserve
E Moderate Moderate Conserve, Enhance, Restore
F Moderate Low Enhance, Restore
G Low High Enhance, Conserve
H Low Moderate Enhance, Create
I Low Low Enhance, Create
Each designation has specific restoration goals associated with it, based on the conditions observed onsite and in the basin. Depending on condition, as indicated by the degree of alteration, reaches and drift cells were placed into one of nine categories of preferred actions. These range from preservation and conservation under the highest conditions (high basin and reach conditions, i.e., the least altered from natural) to enhancement and creation under the poorest condition (low basin and reach conditions, the most altered from natural). The various actions are defined as follows:
Preserve – To protect intact processes, often through acquiring lands or easements to exclude activities that may negatively affect the environment.
Conserve – To maintain biodiversity by protecting or increasing the natural potential of landscapes to support multiple native species. Typically, this is accomplished through
King County National Flood Insurance Program Biological Opinion . Compliance Submittal and Programmatic Habitat Assessment
4‐105
financial incentives for landowners intended to offset any economic loss resulting from managing the land for conservation.
Restore – To transform degraded conditions to a close approximation of historical conditions. Restoration generally involves more intense and extensive modification and manipulation of site conditions than would occur with enhancement projects. Example actions include levee breaching, removal, or setback.
Enhance – To improve a targeted ecological attribute and/or process. Example actions may include culvert replacement, riparian plantings and fencing, invasive species removal, and streambank stabilization.
Create – To construct or place habitat features where they did not previously exist in order to foster development of a functioning ecosystem. Examples include tidal channel excavation and the placement of dredge material intended to create marsh or other habitat. Creation represents the most experimental approach and, therefore, may have a lower degree of success, particularly when landscape-scale ecological processes are not sufficient to support the created habitat type.
The marine shoreline, which in unincorporated King County occurs only around Vashon/Maury Island, is treated a little differently than freshwater shorelines in the designation strategy. This is in recognition of both the differing character of marine shorelines, which are subject to tidal influences, wakes from large commercial vessels, and some variation in the ecological processes affecting them, as well as the creation of the Maury Island Environmental Aquatic Reserve along Maury Island and Quartermaster Harbor shorelines by WDNR. More protection by shoreline designation was afforded to marine shorelines with active feeder bluffs and little alteration to processes. As a result, in these areas, areas with a restoration rating of A or B were designated natural in recognition of the importance of conserving existing shoreline ecological functions and processes in this area. General Environmental Protection Policy Goals Ecology’s guidelines recognize that shoreline ecological processes and functions may be impaired not only by shoreline developments that are required to obtain shoreline substantial development permits, but also by past actions, unregulated activities, and developments that are exempt from the shoreline substantial development permit requirements. The loss or degradation of shoreline ecological processes and functions from any of these activities can significantly impact shoreline natural resources and may also adversely impact human health and safety. The concept of ecological processes and functions recognizes that any ecological system is composed of a wide variety of interacting physical, chemical, and biological processes. These processes are interdependent in varying degrees and at different scales, and that result in the landscape, habitats and species as they exist at any time. Ecological functions are the work performed or roles played individually or collectively within ecosystems by these processes.
Cumulative Impacts and "No Net Loss" of Ecological Processes and Functions. Nearly all shoreline areas, even substantially developed or degraded areas, retain important ecological processes and functions that contribute to the survival and successful reproduction of plants and animals. For example, an intensely developed harbor area may also have an important function as a fish migration corridor and feeding area critical to species survival. In addition, ecosystems are interconnected and many species may depend on the functioning of multiple systems for critical resources. As examples, anadromous fish depend upon the viability of
King County National Flood Insurance Program Biological Opinion . Compliance Submittal and Programmatic Habitat Assessment
4‐106
freshwater, marine, and terrestrial shoreline ecosystems, and many wildlife species associated with shorelines depend on the functioning of both terrestrial and aquatic environments. Therefore, the policies for protecting and restoring ecological processes and functions should apply to the maximum extent practical to all shoreline areas, not just those that remain relatively unaltered. The SMA requires that King County's SMP achieve no net loss of shoreline ecological processes and functions from new uses or development, and that it address the cumulative impacts on shoreline ecology that would result from future shoreline development. The SMA also requires local governments to plan for restoration of shoreline ecological processes and functions where they have been impaired, thus working towards actual improvement in shoreline ecological processes and functions. King County has adopted policies that address the cumulative impacts of existing and proposed shoreline development and work towards improving shoreline ecological processes and functions. These policies include:
Ensuring that new uses, development and redevelopment within the shoreline jurisdiction do not cause a net loss of shoreline ecological processes and functions.
Protecting shorelines and conducting restoration in areas that have been previously degraded.
Requiring shoreline uses and modifications to be designed and managed to prevent degradation of water quality and alteration of natural hydrographic conditions to the maximum extent practical.
Adopting regulations and mitigation standards to ensure that permitted and exempt developments in the aggregate will not cause a net loss of shoreline ecological processes and functions.
Shoreline Vegetation Conservation. A major intent of vegetation conservation is to protect and restore the ecological processes and functions performed by stands of vegetation along shorelines. Vegetation conservation can also be undertaken to protect human safety and property, to increase the stability of river banks and coastal bluffs, to reduce the need for structural shoreline stabilization measures, to improve the visual and aesthetic qualities of the shoreline, to protect particular plant and animal species and their habitats, and to enhance shoreline uses. In King County, aquatic environments, as well as their associated upland and wetland vegetated areas, provide significant habitat for a wide variety of fish and wildlife species. Healthy environments for aquatic species are inseparably linked with the ecological integrity of the surrounding terrestrial ecosystems. For example, nearly continuous stretches of mature forest characterize the natural riparian conditions of the Pacific Northwest. Riparian areas along marine shorelines provide the same or similar functions as their freshwater counterparts. The most commonly recognized functions of the shoreline vegetation include, but are not limited to:
Providing shade necessary to maintain cool water temperatures required by salmonids, spawning forage fish, and other aquatic biota.
Providing external organic inputs critical for some aquatic life. Providing food for various insects and other benthic macro invertebrates, which are in
turn food sources for fish, birds, and other wildlife. Stabilizing banks, minimizing erosion, and reducing the occurrence of landslides. The
roots of trees and other riparian vegetation provide the bulk of this function.

King County National Flood Insurance Program Biological Opinion . Compliance Submittal and Programmatic Habitat Assessment
4‐107
Reducing fine sediment input into the aquatic environment through stormwater retention and vegetative filtering.
Filtering and vegetative uptake of nutrients and pollutants from groundwater and surface runoff.
Providing a source of large woody debris for introduction into the aquatic system. Large woody debris is a primary structural component in streams that functions as a hydraulic roughness element to moderate flows and store sediment. Large woody debris also serves a pool-forming function, providing critical salmonid rearing and refuge habitat. Abundant large woody debris increases aquatic diversity and stabilizes systems.
Regulating microclimates in the lake and stream-riparian and intertidal corridors. Providing critical wildlife habitat, including migration corridors and feeding, watering,
rearing, and refuge areas. The length, width, and species composition of a shoreline vegetation community all contribute substantively to aquatic ecological functions. Likewise, the biological communities of the aquatic environment are essential to ecological functions of the adjacent upland vegetation. The ability of vegetated areas to provide critical ecological functions diminishes as the length and width of the vegetated area along shorelines is reduced. When shoreline vegetation is removed, there is a greater risk that important ecological functions will not be provided. Sustaining different ecological functions requires varying widths, compositions, and densities of vegetation. The importance of the different functions, in turn, varies with the type of shoreline setting. For example, in forested shoreline settings, periodic introduction of fallen trees, especially conifers, into the stream channel is an important attribute that is critical to natural stream channel maintenance. Vegetation conservation includes activities to protect and restore vegetation that contributes to the ecological functions of shoreline areas along or near marine and freshwater shorelines. Vegetation conservation provisions generally include the prohibiting or limiting plant clearing and earth grading, restoring vegetation, and controlling invasive weeds and nonnative species. King County’s policies for regulating vegetation within the shoreline jurisdiction include the following:
Working to assure no net loss of shoreline ecological processes and functions, to avoid adverse impacts to soil hydrology, and to reduce the hazard of slope failures or accelerated erosion.
Applying vegetation conservation provisions to all shoreline uses and developments, whether or not the use or development requires a shoreline substantial development permit.
Identifying the ecological processes and functions that are important to the local aquatic and terrestrial ecology and conserve sufficient vegetation to maintain these functions.
Adopting development regulations for vegetated areas along streams to include buffers of sufficient width to facilitate the growth of mature trees and periodic recruitment of woody vegetation into the water body to support vegetation-related shoreline functions.
Chapter 5
Non‐regulatory and Non‐floodplain
Regulatory Protection and Restoration Actions


King County National Flood Insurance Program Biological Opinion . Compliance Submittal and Programmatic Habitat Assessment
5-i
Chapter 5 Contents
Background .................................................................................................................................... 5-1
Non-regulatory restoration and protection efforts .......................................................................... 5-1
Current Use Taxation ................................................................................................................. 5-1
Forestland (RCW 84.33) ............................................................................................................ 5-1
Farm and Agricultural Land (RCW 84.34) .................................................................................. 5-2
Public Benefit Rating System and Timber Land Programs ........................................................ 5-2
Public Benefit Rating System - Open Space Taxation Program (RCW 84.34) .......................... 5-2
Timber Land Program (RCW 84.34) .......................................................................................... 5-2
Transfer of Development Rights ................................................................................................. 5-2
Farmland Preservation Program ................................................................................................ 5-3
Open Space Charter Amendment .............................................................................................. 5-4
Lands in Public Ownership ......................................................................................................... 5-6
Capital Improvement Projects .................................................................................................... 5-6
Land-use Overlays ..................................................................................................................... 5-6
Livestock Program ...................................................................................................................... 5-7
Stewardship Planning ................................................................................................................. 5-7
Protected Areas Adjacent to or Upstream of FEMA-Mapped Floodplains ..................................... 5-7
Tables Table 5-1 Key habitat protection programs and selected attributes .............................................5-5
Table 5-2 Lands in public ownership ...........................................................................................5-6
Table 5-3 Area (acres) of critical areas and regulatory buffers .................................................... 5-9

King County National Flood Insurance Program Biological Opinion . Compliance Submittal and Programmatic Habitat Assessment
5-ii
King County National Flood Insurance Program Biological Opinion . Compliance Submittal and Programmatic Habitat Assessment
5-1
Chapter 5 – Non‐regulatory and Non‐floodplain Regulatory Protection and Restoration Actions Background
Other sections of this assessment address King County’s regulatory system and discuss how King County avoids, minimizes, and where necessary mitigates for the adverse impacts of development in the floodplain. In addition to the regulatory structure already discussed, King County has focused significant financial resources on conserving floodplains and upland habitat through acquisition of property interests and the development of conservation programs that provide landowners with incentives for going beyond regulatory requirements to act as stewards of valuable natural resources. In addition to the programs listed below that aim to provide habitat protection (whether permanent or for a defined period of time), King County has undertaken habitat capital improvement projects (CIPs) that reconnect rivers to their floodplains. Appendix C includes the list of completed King County CIP projects along with the FCD's 6-year CIP; these projects demonstrate the County's financial commitment in the form of Council-adopted appropriations to reconnecting floodplains as part of public safety and habitat restoration efforts. In addition to non-regulatory actions and regulatory actions that apply in the FEMA-mapped floodplain, King County also provides for considerable protection of critical areas such as streams, wetlands, steep slopes and aquifers that are adjacent to or upstream of mapped floodplains. Protections of these non-mapped floodplains contribute to the protection and health of the County’s mapped floodplains that are subject of this Biological Opinion.
Nonregulatory Restoration and Protection Efforts
King County’s non-regulatory restoration and protection efforts can be placed into three broad categories: (1) land conservation acquisitions (fee simple and easements); (2) conservation tax incentive programs; and (3) habitat capital improvement projects.
Current Use Taxation State law provides for agricultural land, timber land and other open space to be assessed at its current use, rather than its highest and best use—hence the name “current use taxation,” or CUT.
Forestland (RCW 84.33) State law exempts all standing timber on privately and federally owned land from property taxes, although excise taxes are paid at the time of harvest. Forest land is subject to property tax, assessed at its highest and best use. However, qualifying forest land can be exempt from the "highest and best use" standard. To qualify, a parcel must have a minimum of 20 acres devoted to the growing, managing and harvesting of timber. An application must be submitted by the owner of the parcel(s). Property is subject to a compensating tax if the use changes or the designation is removed by either the owner or the Assessor. This program is administered by the King County Assessor's Office (see Table 5-1).
King County National Flood Insurance Program Biological Opinion . Compliance Submittal and Programmatic Habitat Assessment
5-2
Farm and Agricultural Land (RCW 84.34) Farm and Agricultural Lands Current-use Taxation is for property used for the production of livestock or agricultural commodities for commercial purposes. The financial requirements are dependent on the size of the land and the gross annual revenue received for the land for three out of the past five years. This program is also administered by the King County Assessor's Office (see Table 5-1).
Public Benefit Rating System and Timber Land Programs The Public Benefit Rating System (PBRS) and the Timber Land programs provide incentives to encourage landowners to voluntarily conserve and protect land resources, open space and timber. In return for preserving and managing resources, the land is assessed at a value consistent with its "current use" rather than the "highest and best use." The reduction in assessed land value is greater than 50 percent and as much as 90 percent for the portion of the land participating in the program. Over 1,330 landowners and 13,400 acres are presently participating in these two programs (see Table 5-1). Additional information on both programs is provided below.
Public Benefit Rating System Open Space Taxation Program (RCW 84.34) PBRS for property qualifying for one or more of the defined resources in the PBRS Resource Information document. Examples of open space resources include stream buffers, ground water protection areas, threatened or endangered wildlife, farmland, forestland, public recreation, historic property and others. King County monitors the participating portion of the property to evaluate its current use and the continuing compliance with the conditions under which open space classification was granted. Monitoring includes scheduled, physical inspections of the property.
Timber Land Program (RCW 84.34) The Timber Land Program offers an incentive to preserve forestland on private property in King County by providing a tax reduction. A participating property is assessed at a “current use” value, which is lower than the “highest and best use” assessment value that would otherwise apply to the property. The land participating in this program must be devoted primarily to the growth, harvest, and management of forest crops for commercial purposes. It must be managed according to an approved forest stewardship plan. A landowner’s objectives may be more than just timber production and might include management for aesthetics, wildlife and other natural resources. The participating land must be between five (5) to twenty (20) acres of contiguous forestland or potential forestland and be in a rural, agricultural, or forest zone.
Transfer of Development Rights The Transfer of Development Rights (TDR) program is a voluntary, incentive-based, and market-driven approach to preserve land and steer development growth away from rural and resource lands into King County’s Urban Area. The program is based on free-market principles and prices that would motivate landowner and developer participation. Rural landowners realize economic return through the sale of development rights to private developers who are able to build more compactly in designated unincorporated urban areas and partner cities. To date, the program has protected 141,500 acres of rural/resource land (see Table 5-1).
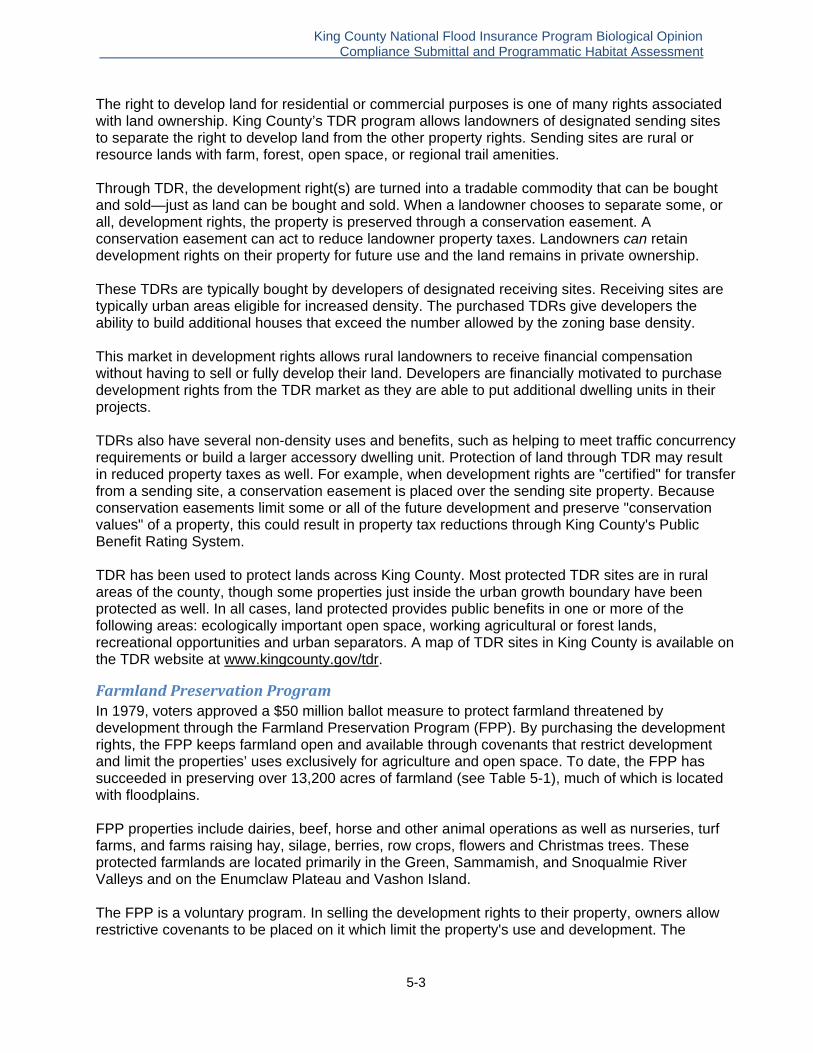
King County National Flood Insurance Program Biological Opinion . Compliance Submittal and Programmatic Habitat Assessment
5-3
The right to develop land for residential or commercial purposes is one of many rights associated with land ownership. King County’s TDR program allows landowners of designated sending sites to separate the right to develop land from the other property rights. Sending sites are rural or resource lands with farm, forest, open space, or regional trail amenities. Through TDR, the development right(s) are turned into a tradable commodity that can be bought and sold—just as land can be bought and sold. When a landowner chooses to separate some, or all, development rights, the property is preserved through a conservation easement. A conservation easement can act to reduce landowner property taxes. Landowners can retain development rights on their property for future use and the land remains in private ownership. These TDRs are typically bought by developers of designated receiving sites. Receiving sites are typically urban areas eligible for increased density. The purchased TDRs give developers the ability to build additional houses that exceed the number allowed by the zoning base density. This market in development rights allows rural landowners to receive financial compensation without having to sell or fully develop their land. Developers are financially motivated to purchase development rights from the TDR market as they are able to put additional dwelling units in their projects. TDRs also have several non-density uses and benefits, such as helping to meet traffic concurrency requirements or build a larger accessory dwelling unit. Protection of land through TDR may result in reduced property taxes as well. For example, when development rights are "certified" for transfer from a sending site, a conservation easement is placed over the sending site property. Because conservation easements limit some or all of the future development and preserve "conservation values" of a property, this could result in property tax reductions through King County's Public Benefit Rating System. TDR has been used to protect lands across King County. Most protected TDR sites are in rural areas of the county, though some properties just inside the urban growth boundary have been protected as well. In all cases, land protected provides public benefits in one or more of the following areas: ecologically important open space, working agricultural or forest lands, recreational opportunities and urban separators. A map of TDR sites in King County is available on the TDR website at www.kingcounty.gov/tdr.
Farmland Preservation Program In 1979, voters approved a $50 million ballot measure to protect farmland threatened by development through the Farmland Preservation Program (FPP). By purchasing the development rights, the FPP keeps farmland open and available through covenants that restrict development and limit the properties’ uses exclusively for agriculture and open space. To date, the FPP has succeeded in preserving over 13,200 acres of farmland (see Table 5-1), much of which is located with floodplains. FPP properties include dairies, beef, horse and other animal operations as well as nurseries, turf farms, and farms raising hay, silage, berries, row crops, flowers and Christmas trees. These protected farmlands are located primarily in the Green, Sammamish, and Snoqualmie River Valleys and on the Enumclaw Plateau and Vashon Island. The FPP is a voluntary program. In selling the development rights to their property, owners allow restrictive covenants to be placed on it which limit the property's use and development. The
King County National Flood Insurance Program Biological Opinion . Compliance Submittal and Programmatic Habitat Assessment
5-4
covenants restrict the property to agriculture or open space uses, limit the number of residences permitted, require that 95 percent of the property be kept open and available for cultivation, require a minimum lot size if the property is subdivided, and restrict activities that would impair the agricultural capability of the property. The restrictive covenants are contained in a conveyance instrument called the Deed of Agreement Relating to Development Rights. King County anticipates that these FPP properties will remain in agricultural production with little opportunity or incentive for conversion to higher density development.
Open Space Charter Amendment In 2009, King County voters approved an amendment to the County Charter that provides enhanced protection in perpetuity to a wide array of county-owned lands as well as private lands where the County holds a permanent conservation easement. In King County, over 150,000 acres are protected by the amendment (see Table 5-1). Specific properties protected by the amendment were chosen for their high value in safeguarding the county’s many natural resources, habitat, recreation opportunities, and rural economy. In the future, that protection can only be removed by a super-majority of the County Council that requires seven out of nine votes.

King County National Flood Insurance Program Biological Opinion . Compliance Submittal and Programmatic Habitat Assessment
5-5
Table 5-1. Key habitat protection programs and selected attributes.
Program Focal Areas Purpose Permanent protection
Total Acres in King Co.
Notes
Current Use Taxation - Forestland
Forested, > 20 acres Tax incentive to preserve land in forestry.
No. Can be reversed with payment of back taxes and penalties.
253,036 Majority also in TDR and Open Space Charter Amendment Programs
Current Use Taxation - Agriculture
Agricultural lands Tax incentive to preserve land in agriculture.
No. Can be reversed with payment of back taxes and penalties.
29,115 Majority also in Farmland Preservation Program
Timberland Forested, 5 to 20 acres. Small-lot forests on land zoned Rural Residential
Tax incentive to preserve land in forestry.
No. Can be reversed with payment of back taxes and penalties.
3,469
Public Benefit Rating System
Primarily areas zoned as Rural Residential
Points-based tax incentives to preserve and manage land for variety of benefits, such as stream buffers, ground water protection areas, threatened or endangered wildlife, public recreation and historic property.
No. Can be reversed with payment of back taxes and penalties.
9,993
Transfer of Development Rights
Primarily Forest Production District and areas zoned residential in Rural Forest Focus Areas
Prevent future development or change in land use.
Yes. Development rights permanently removed.
141,534 Majority also in CUT Forestland and Open Space Charter Amendment Programs
Farmland Preservation Program
Agricultural lands Preserve agricultural lands. Prevent change in land use.
Yes. Development rights permanently removed.
13,101 Majority also in CUT Agriculture program
Open Space Charter Amendment
County-owned lands and private forest lands that have permanent conservation easements
Strengthen protection of designated open space lands by requiring supermajority of County Council to authorize any future changes in use.
Nearly, subject to super-majority vote of County Council.
154,393 Majority also in CUT Forestland and TDR Programs

King County National Flood Insurance Program Biological Opinion . Compliance Submittal and Programmatic Habitat Assessment
5-6
Lands in Public Ownership Additional lands in King County’s inventory are managed as natural areas but are not covered under the Open Space Charter Amendment. Public lands comprise over 670,000 acres (45 percent) of King County, with the vast majority under federal and state ownership. These lands range from designated Wilderness Areas that are highly protected to lands designated for active forestry. The City of Seattle owns over 100,000 acres in the upper Cedar River Watershed and the South Fork Tolt River basin as protection for its water-supply reservoirs. The county owns a variety of natural lands, working forests, and park lands, while each city also maintains parks and open space. In general, while the level of ecological protection varies dramatically depending on the designated purpose of public land, it is fairly unlikely to be sold or converted to an entirely different use. Since 2005, the county’s Department of Natural Resources and Parks has purchased more than 815 acres of land primarily for their ecological value, and an additional 177 acres of properties repeatedly damaged by flooding. These flood-prone sites along rivers will provide many future opportunities for habitat restoration. Table 5-2. Lands in Public Ownership. Landowner Acres Examples of types of lands Federal Agency 356,171 Wilderness Areas, National Forest State Agency 114,484 Parks, Natural Resource Conservation Areas, State
Forest, road rights-of-way King County 30,472 Natural Areas, Parks, and Multiuse Lands Other local jurisdictions 167,399 Parks and Open Space Various 1,789 UW Campus; other developed publicly owned land
Capital Improvement Projects King County’s floodplain management philosophy is to limit flood risk by working with—rather than against—natural floodplain processes. Since 1990, King County has focused on reducing risk by removing frequently-flooded homes from the floodplain and setting back or removing levees to reconnect rivers to floodplains. Between 1990 and 2005 the River and Floodplain Management Program completed over 100 levee repair and rehabilitation projects, acquired over 90 floodplain properties, and elevated 10 homes. Since the formation of the King County Flood Control Zone District in 2007, King County has completed 70 levee improvement projects and has acquired over 180 acres. The adopted capital program commits over $260,000,000 to flood risk reduction actions over the next six years, including levee setback projects that will reconnect over 430 acres of floodplain along King County’s major rivers. More information about completed and proposed capital projects is included as an appendix to this document.
Landuse Overlays In some cases, local governments apply special land-use overlays on top of existing designations to further emphasize policy objectives. For example, the vast majority of land designated for agriculture in the Snoqualmie Valley watershed is within the Snoqualmie Valley Agricultural Production District (APD). The designation limits the type and intensity of allowable activities in the APD, but also affects surrounding uses. According to the county’s comprehensive plan, rural residential areas within one quarter mile of an APD shall not be developed at a density greater than one home per ten acres. While the intent of this provision is to minimize land-use conflicts, it
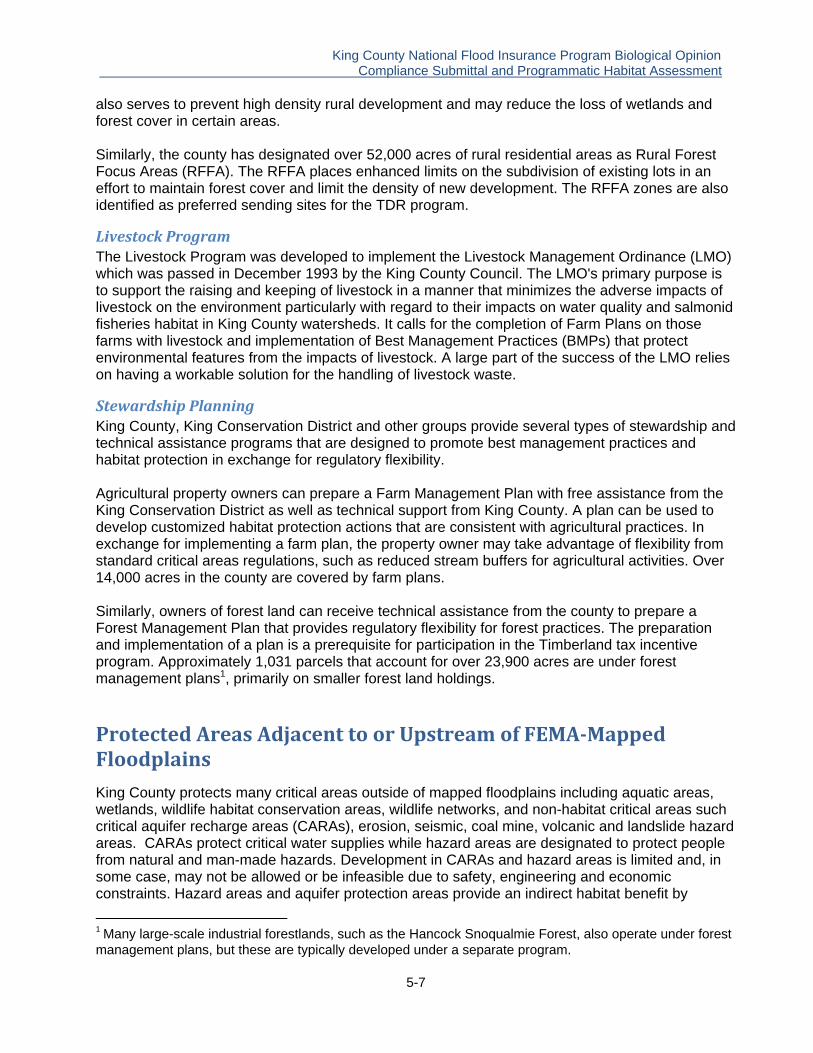
King County National Flood Insurance Program Biological Opinion . Compliance Submittal and Programmatic Habitat Assessment
5-7
also serves to prevent high density rural development and may reduce the loss of wetlands and forest cover in certain areas. Similarly, the county has designated over 52,000 acres of rural residential areas as Rural Forest Focus Areas (RFFA). The RFFA places enhanced limits on the subdivision of existing lots in an effort to maintain forest cover and limit the density of new development. The RFFA zones are also identified as preferred sending sites for the TDR program.
Livestock Program The Livestock Program was developed to implement the Livestock Management Ordinance (LMO) which was passed in December 1993 by the King County Council. The LMO's primary purpose is to support the raising and keeping of livestock in a manner that minimizes the adverse impacts of livestock on the environment particularly with regard to their impacts on water quality and salmonid fisheries habitat in King County watersheds. It calls for the completion of Farm Plans on those farms with livestock and implementation of Best Management Practices (BMPs) that protect environmental features from the impacts of livestock. A large part of the success of the LMO relies on having a workable solution for the handling of livestock waste.
Stewardship Planning King County, King Conservation District and other groups provide several types of stewardship and technical assistance programs that are designed to promote best management practices and habitat protection in exchange for regulatory flexibility. Agricultural property owners can prepare a Farm Management Plan with free assistance from the King Conservation District as well as technical support from King County. A plan can be used to develop customized habitat protection actions that are consistent with agricultural practices. In exchange for implementing a farm plan, the property owner may take advantage of flexibility from standard critical areas regulations, such as reduced stream buffers for agricultural activities. Over 14,000 acres in the county are covered by farm plans. Similarly, owners of forest land can receive technical assistance from the county to prepare a Forest Management Plan that provides regulatory flexibility for forest practices. The preparation and implementation of a plan is a prerequisite for participation in the Timberland tax incentive program. Approximately 1,031 parcels that account for over 23,900 acres are under forest management plans1, primarily on smaller forest land holdings.
Protected Areas Adjacent to or Upstream of FEMAMapped Floodplains
King County protects many critical areas outside of mapped floodplains including aquatic areas, wetlands, wildlife habitat conservation areas, wildlife networks, and non-habitat critical areas such critical aquifer recharge areas (CARAs), erosion, seismic, coal mine, volcanic and landslide hazard areas. CARAs protect critical water supplies while hazard areas are designated to protect people from natural and man-made hazards. Development in CARAs and hazard areas is limited and, in some case, may not be allowed or be infeasible due to safety, engineering and economic constraints. Hazard areas and aquifer protection areas provide an indirect habitat benefit by
1 Many large-scale industrial forestlands, such as the Hancock Snoqualmie Forest, also operate under forest management plans, but these are typically developed under a separate program.
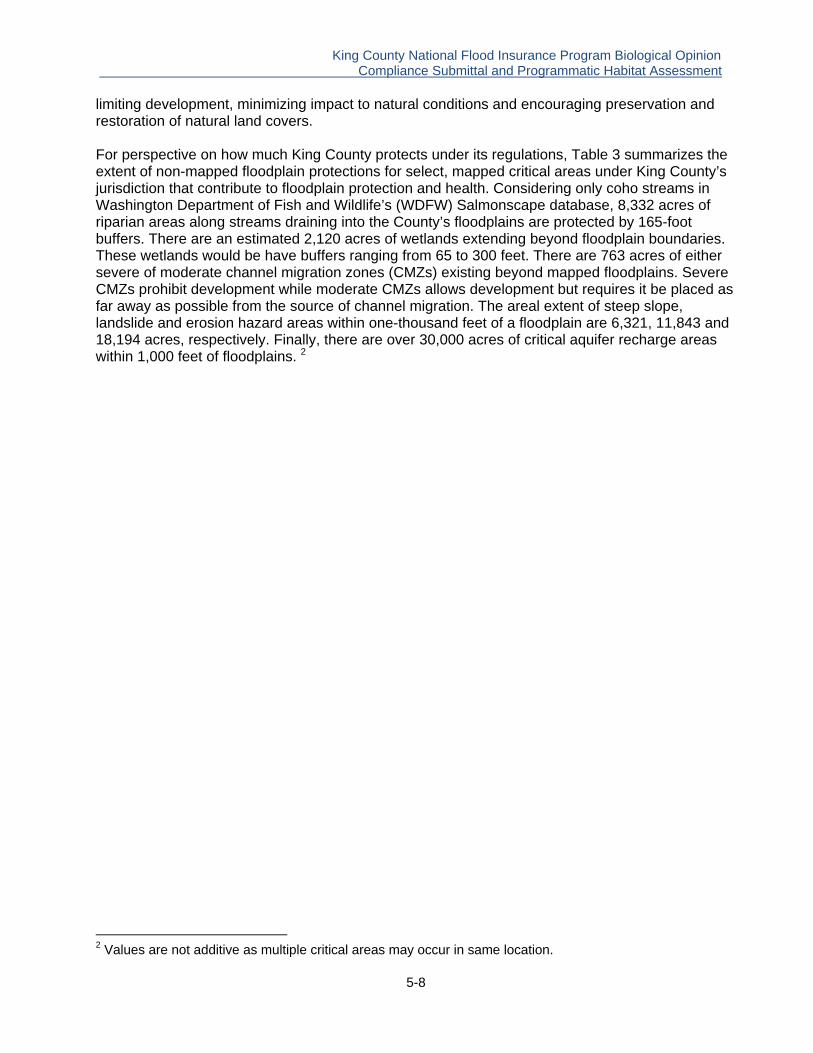
King County National Flood Insurance Program Biological Opinion . Compliance Submittal and Programmatic Habitat Assessment
5-8
limiting development, minimizing impact to natural conditions and encouraging preservation and restoration of natural land covers. For perspective on how much King County protects under its regulations, Table 3 summarizes the extent of non-mapped floodplain protections for select, mapped critical areas under King County’s jurisdiction that contribute to floodplain protection and health. Considering only coho streams in Washington Department of Fish and Wildlife’s (WDFW) Salmonscape database, 8,332 acres of riparian areas along streams draining into the County’s floodplains are protected by 165-foot buffers. There are an estimated 2,120 acres of wetlands extending beyond floodplain boundaries. These wetlands would be have buffers ranging from 65 to 300 feet. There are 763 acres of either severe of moderate channel migration zones (CMZs) existing beyond mapped floodplains. Severe CMZs prohibit development while moderate CMZs allows development but requires it be placed as far away as possible from the source of channel migration. The areal extent of steep slope, landslide and erosion hazard areas within one-thousand feet of a floodplain are 6,321, 11,843 and 18,194 acres, respectively. Finally, there are over 30,000 acres of critical aquifer recharge areas within 1,000 feet of floodplains. 2
2 Values are not additive as multiple critical areas may occur in same location.
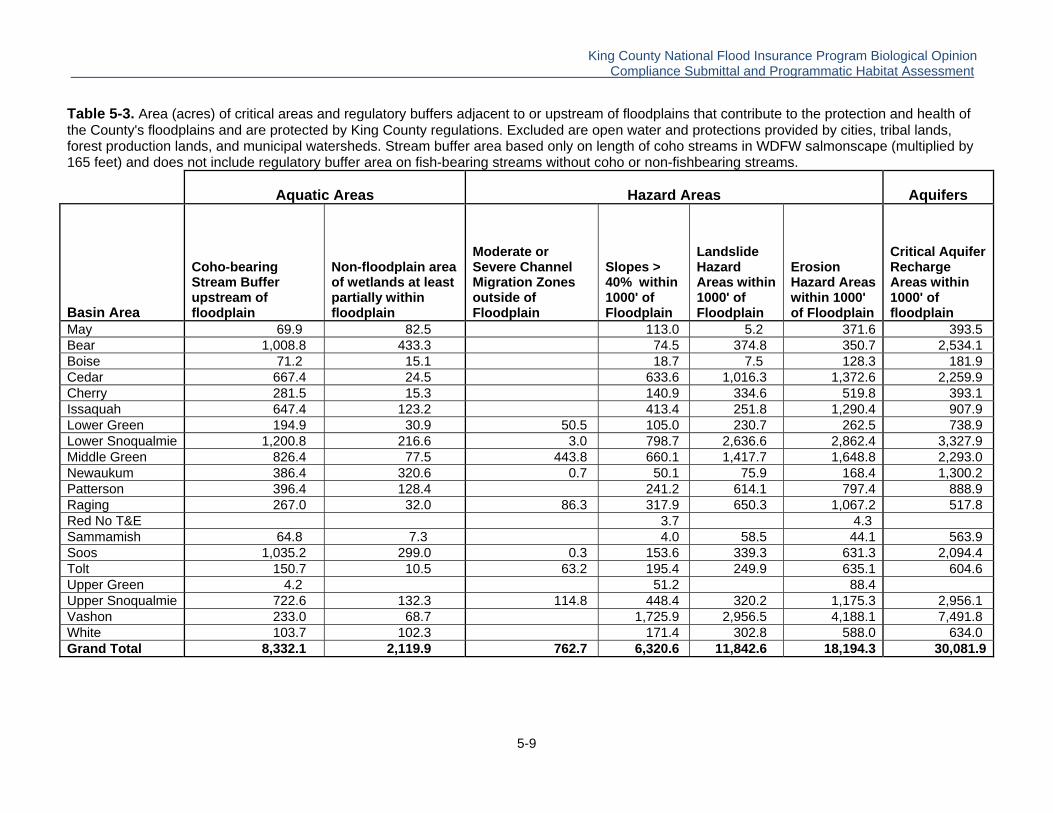
King County National Flood Insurance Program Biological Opinion . Compliance Submittal and Programmatic Habitat Assessment
5-9
Table 5-3. Area (acres) of critical areas and regulatory buffers adjacent to or upstream of floodplains that contribute to the protection and health of the County's floodplains and are protected by King County regulations. Excluded are open water and protections provided by cities, tribal lands, forest production lands, and municipal watersheds. Stream buffer area based only on length of coho streams in WDFW salmonscape (multiplied by 165 feet) and does not include regulatory buffer area on fish-bearing streams without coho or non-fishbearing streams.
Aquatic Areas Hazard Areas Aquifers
Basin Area
Coho-bearing Stream Buffer upstream of floodplain
Non-floodplain area of wetlands at least partially within floodplain
Moderate or Severe Channel Migration Zones outside of Floodplain
Slopes > 40% within 1000' of Floodplain
Landslide Hazard Areas within 1000' of Floodplain
Erosion Hazard Areas within 1000' of Floodplain
Critical Aquifer Recharge Areas within 1000' of floodplain
May 69.9 82.5 113.0 5.2 371.6 393.5 Bear 1,008.8 433.3 74.5 374.8 350.7 2,534.1 Boise 71.2 15.1 18.7 7.5 128.3 181.9 Cedar 667.4 24.5 633.6 1,016.3 1,372.6 2,259.9 Cherry 281.5 15.3 140.9 334.6 519.8 393.1 Issaquah 647.4 123.2 413.4 251.8 1,290.4 907.9 Lower Green 194.9 30.9 50.5 105.0 230.7 262.5 738.9 Lower Snoqualmie 1,200.8 216.6 3.0 798.7 2,636.6 2,862.4 3,327.9 Middle Green 826.4 77.5 443.8 660.1 1,417.7 1,648.8 2,293.0 Newaukum 386.4 320.6 0.7 50.1 75.9 168.4 1,300.2 Patterson 396.4 128.4 241.2 614.1 797.4 888.9 Raging 267.0 32.0 86.3 317.9 650.3 1,067.2 517.8 Red No T&E 3.7 4.3 Sammamish 64.8 7.3 4.0 58.5 44.1 563.9 Soos 1,035.2 299.0 0.3 153.6 339.3 631.3 2,094.4 Tolt 150.7 10.5 63.2 195.4 249.9 635.1 604.6 Upper Green 4.2 51.2 88.4 Upper Snoqualmie 722.6 132.3 114.8 448.4 320.2 1,175.3 2,956.1 Vashon 233.0 68.7 1,725.9 2,956.5 4,188.1 7,491.8 White 103.7 102.3 171.4 302.8 588.0 634.0 Grand Total 8,332.1 2,119.9 762.7 6,320.6 11,842.6 18,194.3 30,081.9

Chapter 6
Land Cover and Land Use Assessment


King County National Flood Insurance Program Biological Opinion . Compliance Submittal and Programmatic Habitat Assessment
6‐i
Chapter 6 Contents
Introduction ................................................................................................................................ 6-1
Methods ..................................................................................................................................... 6-1
Current Land Cover Conditions .............................................................................................. 6-1
Potential Future Conditions .................................................................................................... 6-4
Potential Future Total Impervious Area ............................................................................. 6-8
Potential Future Forest Cover Scenarios .......................................................................... 6-9
Estimating Potential for New or Regenerated Forest Cover within Regulatory Buffers ........ 6-10
Estimating Potential Reasonable Use Exceptions ................................................................ 6-10
Results and Discussion ............................................................................................................ 6-13
Floodplain and Delta Area Land Use and Land Cover ......................................................... 6-13
Watershed Condition Context............................................................................................... 6-14
Potential Future Change in Floodplain Condition ................................................................. 6-15
Potential Future Change in Floodplain Delta Condition ........................................................ 6-16
New or Regenerated Forest Cover Potential within Regulatory Buffers ............................... 6-17
Potential Reasonable Use Exceptions ................................................................................. 6-17
Limitations and Sources of Error .......................................................................................... 6-18
Summary and Conclusion ........................................................................................................ 6-20
References ............................................................................................................................... 6-21
Tables
Table 6-1 Accounting of parcels in the FEMA floodplain and floodplain Deltas ..................... 6-22 Table 6-2 Breakout of FEMA floodplain parcels .................................................................... 6-23 Table 6-3 Breakout of floodplain Delta parcels ...................................................................... 6-24 Table 6-4 Watershed-scale impervious and forest cover ....................................................... 6-25 Table 6-5 Current and estimated future forest cover and impervious land cover .................. 6-26 Table 6-6 Floodplain and regulatory buffer potential for conversion of existing
non-forest land covers to forest .............................................................................. 6-28 Table 6-7 Number of potential reasonable use exceptions .................................................... 6-31
King County National Flood Insurance Program Biological Opinion . Compliance Submittal and Programmatic Habitat Assessment
6‐ii
Figures
Figure 6-1 Watershed areas used to estimate forest cover and effective impervious area for King County floodplains ............................................................................. 6-2 Figure 6-2 Reasonable Use Exception Candidates ............................................................... 6-12
King County National Flood Insurance Program Biological Opinion . Compliance Submittal and Programmatic Habitat Assessment
6-1
Chapter 6: Land Cover and Land Use Assessment Introduction Historically, all of King County’s mapped FEMA floodplains have been affected by clearing and development activities ranging from timber harvest and agriculture to rural and urban residential, commercial and industrial development. Initially all areas were logged, and the most suitable areas for farming were converted to agriculture many decades ago. Today, the broad, flat floodplains of the Snoqualmie and Green Rivers in unincorporated King County are dominated by farming. Most areas suitable for agriculture are fully developed as farms and expected to stay in that use due to zoning and farmland preservation programs. Significant portions of the remaining floodplains in each of the County’s four Water Resource Inventory Areas (WRIAs) are in low density rural residential use and much smaller amounts are in high density urban land uses. In recent decades, an increasing amount of floodplain area has been acquired by King County and others as permanent open space for flood risk reduction, salmon recovery, water quality improvement and low impact recreational (see Chapter 5 and Appendix C for an accounting of King County’s many non-regulatory actions that protect the environment and complement floodplain regulations). Loss of forest cover and increase in impervious surface will likely result from the development of currently undeveloped private residential parcels. Off-setting these changes to some degree are improvements in the condition of previously developed open space areas through restoration projects that include removal of impervious surfaces, setting back of levees and revetments to restore floodplains, and reforestation.
This chapter assesses change in land covers and land uses that may result from the combined effect of new development under King County’s land use regulations and changes on permanent open space lands in mapped floodplains. The analysis is based on readily available information in King County’s Geographical Information Systems (GIS) database including aerial photographs, satellite imagery, parcel-based data, zoning maps, and the National Land Cover Database (NLCD) to assess current and potential future conditions. The results of this analysis support the biological effects determinations in Chapter 7.
Methods
Current Land Cover Conditions Existing forest cover and total impervious area (TIA) were assessed for each major floodplain area and sub-area of King County (Figure 6-1) at the watershed, mapped FEMA floodplain and floodplain “Delta” area scales. The floodplain Delta area is the difference between the NOAA NFIP BiOp protected area, consisting of whatever is the greater extent of the FEMA floodway, the channel migration zone (CMZ) plus 50 feet, or a set of variable width riparian buffers zones ranging from 150 to 250 feet versus what King County protects with the FEMA floodway, mapped CMZs, and aquatic areas, wetlands and steep slopes and their respective regulatory buffers. The County’s CMZ includes the present channel and, where present, severe and moderate channel migration hazard areas (CMHAs).
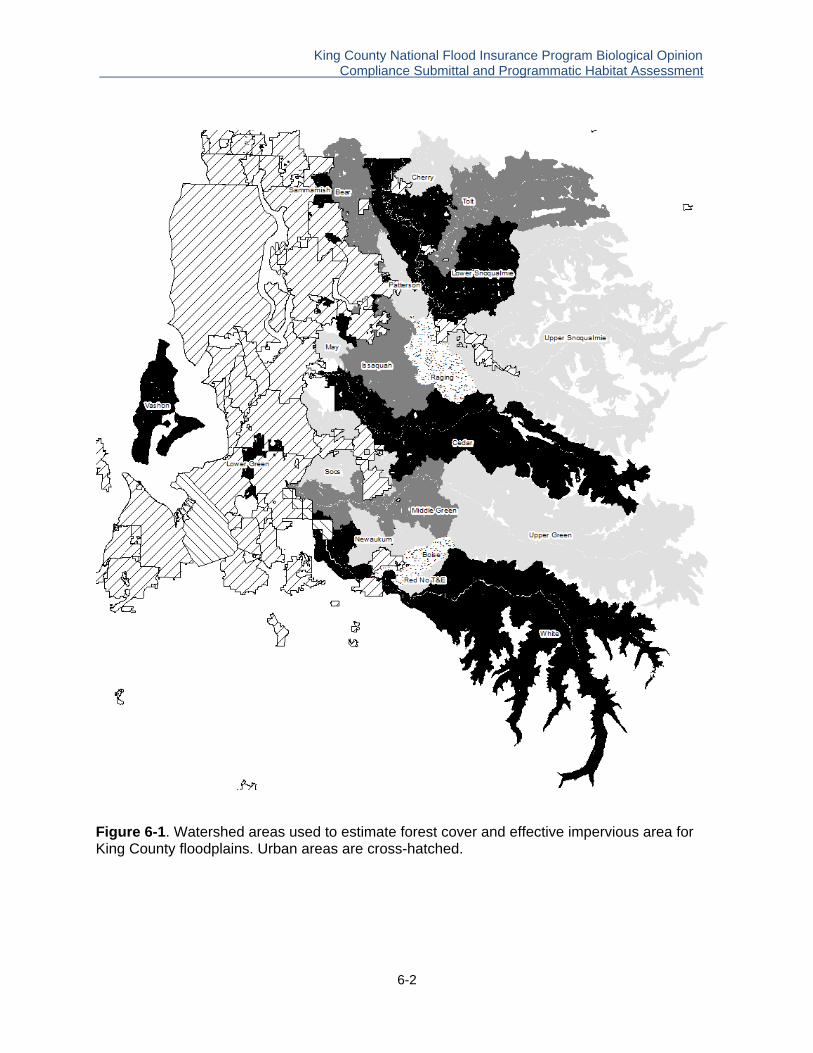
King County National Flood Insurance Program Biological Opinion . Compliance Submittal and Programmatic Habitat Assessment
6-2
Figure 6-1. Watershed areas used to estimate forest cover and effective impervious area for King County floodplains. Urban areas are cross-hatched.
King County National Flood Insurance Program Biological Opinion . Compliance Submittal and Programmatic Habitat Assessment
6-3
Virtually all of the County’s aquatic area buffers within mapped floodplains are expected to be at least 165 feet wide1 because this is the minimum buffer width required for aquatic areas with fish or fish-bearing potential. It is highly likely that the large majority—if not all—of aquatic areas and wetlands in the floodplain would have at least fish-bearing potential due to flat gradients and current or historic connectivity to fish-bearing waters. The County’s protected areas are less extensive than those called for in the BiOp along waters under jurisdiction of the Washington State Shoreline Management Act (SMA), where BiOp buffers are 250-foot wide, and along streams that are not under SMA jurisdiction but are fish-bearing and larger than five feet wide, where the BiOp buffers are 200 feet. The BiOp also calls for 50-foot buffers along CMZs. The County does not require a specified buffer for CMZs, but in many areas has mapped both severe and moderate CMHAs. In moderate CMHAs new residential structures are allowed only on lots created before February 16, 1995 and only if there is no feasible on-site alternative outside the channel migration area. Furthermore, new structures in moderate CMHAs must be located as far away as possible from the severe CMHA, thus providing additional, but variable, amounts of buffering of the severe CMHA in many places. To date, CMHAs have been mapped for the lower Tolt and Raging Rivers, the middle Green River and the Three Forks Reach of the Snoqualmie (above Snoqualmie Falls), which is outside of the area assessed for this report (see Chapter 4 for more detail on CMZs and CMHAs). In any event, as per the BiOp protected area criteria, where CMZs have not been mapped, the protected area extends beyond the floodway and the County’s aquatic area and wetland buffers to the edge of the floodplain. The County’s regulatory buffers are wider than the 150-foot BiOp buffers along streams less than five feet wide and along lake and marine shorelines including Vashon Island. The BiOp calls for 150-foot buffers along fish-bearing streams less than “5 foot wide,” but does not provide specific guidance for delineating those streams. Given the lack of specific criteria, it was assumed that the BiOp intended to provide protection for relatively small streams and, thus, for this assessment, was assumed to mean stream channels less than five feet in active channel width. No local small stream width database exists, so the judgment of a King County senior environmental scientist familiar with many such streams in the County’s floodplains was used to identify and map them. The resulting set of streams are clearly “small” but no field work was done to assess accuracy due to time and staff constraints and the uncertainty of what was meant by the BIOP’s criterion. Finally, wetland buffers, which are different than those required for aquatic areas, were applied around the many small, isolated ponds shown in the County’s GIS database that are presumed to be non-fish-bearing. King County’s variable-width wetland buffer rating criteria were used to assign these waterbodies a generic 65-foot buffer width that reflects the moderately degraded condition of these small wetlands in the context of low intensity development. These wetlands would receive the larger aquatic area buffer if they are found to be fish bearing. For each floodplain, the watershed forest cover and impervious area was estimated from the downstream end of the floodplain. Open water and areas above 4,000 feet in elevation, were excluded to omit naturally non-forested areas including river channels, lakes, ponds and oxbows and sub-alpine meadows, exposed rock, snow fields and glaciers (Washington Department of Fish and Wildlife and National Wildlife Federation 2011). To assess the effect of non-county-regulated lands, the analysis was done with and without city and tribal reservation and off-reservation tribally owned lands.
1 Buffers expand to include associated wetlands and steep slopes.

King County National Flood Insurance Program Biological Opinion . Compliance Submittal and Programmatic Habitat Assessment
6-4
Because of its wide availability and explicit estimates of impervious and forest covers, the 2006 National Land Cover Database (NLCD) (http://www.epa.gov/mrlc/nlcd-2006.html) was used to characterize current TIA and forest cover. The 2006 NLCD likely underestimates 2011 forest and impervious land covers somewhat, because of what little development has occurred since the time images used to derive NLCD’s photos were taken. It is known, however, that rural land development has slowed considerably since 2006 due to the combined effects of land use policies that have focused growth in urban areas as well as a severe economic recession that began in 2007. For example, for the Lake Washington/Cedar/Sammamish watershed (WRIA 8), Vanderhoof et al. (2011) found that within 165-foot wide riparian areas adjacent to Type S waters impervious area increased and forest cover decreased in three of eight sub-basins assessed between 2005 and 2009. However, these changes occurred in or adjacent to urban areas, reflecting prioritization of growth in those areas in accordance with policy mandates set forth in the Growth Management Act of Act of 1990. In rural areas of the Green/Duwamish and Central Puget Sound watershed (WRIA 9), forest cover and impervious area increased by 1.21 percent and 0.01 percent, respectively, between 2001 and 2006 (Latterell et al. 2012) indicating relatively little change in either value. These results suggest that King County’s zoning and land use regulations were effective in protecting rural areas from adverse changes related to growth during this time period. Furthermore, they indicate that relatively little development-related land-cover change occurred in the County’s floodplains since 2006, and that the 2006 NLCD is thus an appropriate data source for characterizing current conditions (ca. 2011). Nevertheless, to be conservative in the face of uncertainty, the following analysis applies to somewhat larger than expected development footprints, and somewhat smaller than expected future gains in forest cover, and no reductions in impervious area resulting from future restoration of permanent open space (POS) lands. Estimates of TIA were converted to effective impervious area (EIA) using ratios described by Dinicola (1990). This was done because the 2006 NLCD provides total impervious estimates, but the NOAA BiOp threshold references a 10 percent impervious standard, which presumably is effective impervious area due to the BiOp’s reliance on Booth et al. (1992). To estimate EIA for rural development densities, which are less than Dinicola’s “low density development” (one unit per two to five acres), Dinicola’s low density development conversion factor of 0.4 was applied. For the urban lower Green, Dinicola’s urban factor of 0.8 was applied. As a result, EIA is likely overestimated because the large majority (94 percent; Chapter 8, Table 8-1) of King County’s lands are rural, resource or non-buildable and zoned at densities no greater than one unit per five acres. Additional factors affecting the percent of TIA that is EIA, such as slope and soils, were not considered in the analysis. Moreover, floodplains are flat and typically have relatively pervious soils, further indicating that use of Dinicola’s “low density” conversion factor may result in overestimates of the actual EIA for floodplains.
Potential Future Conditions An assessment of floodplain development potential was needed to characterize future land covers to compare them with current conditions and estimate potential future change. Toward that end, a database of private undeveloped parcels with development potential in the floodplain was created through a series of steps. First, all parcels that are at least partially in the floodplain were identified. From these, parcels in cities, on tribal lands and in tribal ownership were removed because they are not under King County jurisdiction. Parcels above natural barriers to anadromous fish on the upper Snoqualmie River (above Snoqualmie Falls) and Red Creek (a fish-impassable tributary to the White River) were removed because they are not known to support ESA or MSA listed species. Additionally, although used by ESA-listed salmonids through a long-standing trap-and-haul fish passage facility, areas above Sunset Falls on the South Fork Skykomish River were excluded from this analysis because there is relatively little
King County National Flood Insurance Program Biological Opinion . Compliance Submittal and Programmatic Habitat Assessment
6-5
private land in this watershed under the County’s jurisdiction, and it is a very sparsely populated area. The only incorporated area, the Town of Skykomish, the population of which was 198 as of the 2010 census, is not in King County’s jurisdiction. The large majority of the South Fork Skykomish watershed, riparian corridor and floodplain is on US Forest Service lands and managed in large part by the Pacific Northwest Forest Plan (see http://www.fs.fed.us/pnw/pfp.pdf), which prioritizes relatively low impact forestry and recreation as well as wilderness, water quality and quantity, and fish and wildlife resources in riparian corridors, floodplains and critical watersheds. Using the King County Assessor’s database, the remaining parcels were first screened for development using the FEMA Community Rating System’s criterion of improvements of $10,000 or more. Parcels with less than this value in improvements were initially classified as undeveloped parcels. However, examination of a small sub-set of these parcels using recent (2009 and 2010) aerial photographs revealed houses or other substantial improvements (garages, roads, parking areas) that appeared equivalent to the footprint of a house on some of these parcels. Thus, from an environmental impact perspective, such parcels were already in a largely developed condition. Therefore, 2009 and 2010 aerial photos of these parcels were individually viewed by a senior environmental scientist and a master GIS analyst to determine whether each was actually undeveloped or not. Parcels judged to be functionally “developed” contained either a house, or a combination of roads, paved/compacted parking areas, and/or structures such as garages or major sheds that appeared equivalent in total area to the footprint of a house. The presence of minor structures such as small sheds and/or cleared areas was not considered sufficient to designate a parcel as developed. As part of this visual inspection, 59 parcels within waterbodies or on gravel bars with no potential for future development were identified and excluded. An additional 349 parcels comprising a total parcel area of 1,549 acres and 44 floodplain acres, were found to contain only very small amounts of floodplain. On average, these parcels were 4.4 acres and contained 0.13 acres (3.5% of parcel area) of floodplain and the most likely developable area was outside of these small amounts of land. As a result, these parcels were excluded from the future floodplain development analysis. Table 6-1 shows the number and area of parcels excluded from subsequent analysis because they were 1) determined to be functionally developed through visual examination of aerial photos, 2) in water or on gravel bars, or 3) predominately outside of the floodplain and judged to have little likelihood of being developed in the floodplain. Although not summarized in Table 6-1, parcels that were all or mostly within GIS-mapped landslide hazard areas were noted and mapped (but not excluded) because location in a landslide hazard area may limit or prevent development. Also not shown in Table 6-1 is the relatively small area of rights-of-way (ROW) because they are not represented as discrete parcels in the County’s database. These ROWs are mostly, if not entirely, already developed and not expected to change. The area of ROW was included in estimating subsequent land cover estimates, however. Lastly, parcels were screened for having sufficient area for development outside of floodways and severe CMHAs, within which no buildings, except minor agricultural structures and appurtenances, can be constructed2. For this, an estimate of the development footprint area
2 Under reasonable use exception, a residence could potentially be built in a severe CMHA. However, it would likely only be allowed under very restricted conditions, such as where the parcel is surrounding by relatively dense, existing, development in an area of relatively small parcels. To date, only two or three expansions of

King County National Flood Insurance Program Biological Opinion . Compliance Submittal and Programmatic Habitat Assessment
6-6
was needed for urban and rural parcels. Urban parcels would need only to accommodate a house, access and setbacks, as they would already be served by sewer systems and water. For urban and rural zoned parcels, a nominal building footprint of 5,000 square feet (sf) large enough to accommodate a house (40 feet by 50 feet = 2,000 sf3), a driveway (12 feet by 50 feet = 600 sf) and 15-foot building setbacks (2,445 sf) was used. Rural parcels also need additional space for an onsite septic system (OSS) and water supply requiring a 100-foot radius sanitary setback area (SSA)4. The area required for an OSS depends on several factors including number of bedrooms and site conditions such as soils, topography and location of trees, the removal of which should be minimized. A King County Public Health Department staff member (Koperski, 2011, pers. comm.) estimated the minimum area required for an OSS (including a reserve septic field area equal to the footprint of the original) under ideal soil and topographic conditions as follows:
Gravels (sand-lined bed): 1,372 square feet for three bedrooms and 1,708 square feet for four bedrooms
Coarse sands (conventional trench): 1,900 square feet for three bedrooms and 2,800 square feet for four bedrooms
Sandy loam (predominant KC soil texture): 4,158 square feet for three bedrooms and 5,280 square feet for four bedrooms
Loamy sands or sandy loams (subsurface drip): 1,000 square feet for four bedrooms and 1,300 square feet for four bedrooms
The King County Health Department could not provide an average value for OSS size. Therefore, for the purpose of this assessment, it was conservatively assumed that 10,000 square feet would be needed for an OSS, roughly twice the required area needed under ideal conditions for a septic field and reserve area for sandy loam, the predominate soil texture in King County. For a water supply, a well with a 100-foot radius SSA from a building, driveway and OSS must be provided if no off-site water supply is available. When configured as a circle with a radius of 100 feet, the SSA equals 31,400 square feet (0.72 acres). During site planning, the well site, SSA and OSS are typically located and designed in concert to ensure there is adequate space and suitable locations for both. Although a well and OSS can be in a severe CMHA and floodway if no feasible alternative exists, siting them in these critical areas is rarely allowed (P. Klein, King County, 2011). The SSA, however, can use adjacent buffers and hazard areas to the fullest extent possible. Therefore, an area of 7,850 square feet equal to one-quarter of the required area for an SSA was used. A somewhat smaller SSA value was used because it was assumed that in order to maximize potential buildable area and minimize the constraining effect of accommodating an SSA, a landowner would locate as much as possible (assumed three-quarters for this assessment) of the SSA, but not the wellhead, in an aquatic area buffer, floodway or severe CMHA. If a landowner needed to accommodate more of the SSA on the buildable portion of the parcel, then the minimum parcel size required for development would
existing use are known to have been allowed in the severe CMHA (Greg Wessel, King County, 2012, pers. comm.). 3 The average per parcel footprint area of structures on rural parcels is 1,967 sf based on King County Assessor data. 4 Where a parcel has access to an off-site water supply, such as a community well, the SSA is not required.
King County National Flood Insurance Program Biological Opinion . Compliance Submittal and Programmatic Habitat Assessment
6-7
increase, and the number of parcels that could be developed would be reduced accordingly, or possibly require permitting under a reasonable use exception, as discussed later in this chapter. For those parcels identified as private and undeveloped with development potential in the floodplain, the potential future change in forest and impervious cover was then assessed by comparing current condition (based on 2006 NLCD, see earlier discussion) with an estimate of the potential future condition. For some floodplain areas, little or no substantive change in land use or land cover is expected because their condition is generally established and therefore unlikely to change. Lands zoned for agriculture, for example, are not expected to change in the future because, as noted earlier, most of the County’s agricultural lands have already been cleared and farmed for many decades, and County programs and regulations either prohibit or severely restrict their expansion or conversion to non-agricultural uses. It is recognized that while almost all existing farms already have substantial agricultural infrastructure and appurtenances in place, some additional barns, small farm-field access roads and elevated farm pads for livestock and equipment protection during floods will be built in the future. King County requires a zero-rise analysis and compensatory storage for any activity in the floodplain that obstructs flow or causes loss of floodwater storage. The potential number and area of new features such as barns and farm pads is limited in several ways5 (Clint Loper, King County, 2012, pers. comm.). Agriculture structures are allowed, but must in nearly all cases be elevated above the base flood elevation (100-year). If that elevation involves fill, then the fill is evaluated for zero rise and floodplain storage to ensure no measurable increase in Base Flood Elevation (BFE) anywhere in the floodplain. In some cases such structures can be built at grade and subject to flooding if they are “wet flood-proofed.”6 Additionally, due to zero-rise and compensatory storage requirements, the capacity for new fill (e.g., farm pads) and non-elevated structures (e.g., barns built on fill or ground level foundations) is limited. Where fill is allowed at all, it is restricted to an amount that does not compromise overall floodplain storage or flow conveyance by creating a measurable increase in base flood elevation, calculated as equal to or greater than 0.01 foot. This evaluation of fill is done on a cumulative basis, such that the review to ensure that there is no measurable increase in base flood elevation considers all structures and farm pads that have been constructed since 2007. These limitations are already having an effect. For example, in the lowermost portion of the Snoqualmie floodplain downstream from the Snoqualmie Falls, requests for new farm pads have been denied because they exceeded zero-rise thresholds, or required redesigns so as not to trigger floodplain hydraulic thresholds. Furthermore, if built, future barns, farm-field roads and farm pads must be sited so they do not impact other critical areas coincident with floodplains, such as jurisdictional wetlands and any fish-bearing habitat, and built on existing impervious surfaces or cleared areas. In addition, any impervious areas resulting from these facilities will be subject to clearing and grading and stormwater controls. In any event, they will likely have inherently low effective imperviousness, because agricultural lands are very flat with relatively pervious soils and extensive areas for
5 Note that no new residential structures are allowed in the floodway. 6 Where wet flood-proofing is allowed, it is used for areas of buildings that are below the base flood (100-year) elevation. These areas must allow for the entry and egress of floodwaters while being constructed of flood-resistant materials. Typically this type of treatment is only allowed for uses such as limited storage, parking, building access, etc. (C. Loper, King County, 2012, pers. comm.).

King County National Flood Insurance Program Biological Opinion . Compliance Submittal and Programmatic Habitat Assessment
6-8
stormwater infiltration and/or dispersion and treatment. Finally, the area encompassed by new fill features in the floodplain will almost certainly be small because farm pads are typically less than one-half acre in size. Thus the potential for new features is highly limited in number and area, and the impacts associated with temporary (days or weeks) of standing floodwaters that could otherwise function as salmon rearing habitat when fields are flooded are also very small. For public lands not otherwise designated as permanent open space, no change in forest cover or impervious area was projected as they are mostly already developed for infrastructure and other public uses. To our knowledge, there are no plans for major new public facilities, such as roads, bridges, flood control structures, etc., in King County’s mapped FEMA floodplains. To the extent such projects may occur, they will likely have a federal nexus, and therefore their ESA- and MSA-listed species effects will be further evaluated under separate biological assessments. Parcels zoned for mining were not included in this analysis, as they constitute an extremely small fraction (0.06%) of the floodplain, and are likely to require federal permits and analysis of ESA and MSA effects under separate biological assessments. POS lands are often degraded or developed when acquired, and thus likely to experience future increases in forest cover and reductions in impervious surfaces due to active and passive restoration and reforestation. For example, Chinook Bend on the Snoqualmie River was recently a farm field adjacent to an armored segment of the Snoqualmie River. Rainbow Bend on the Cedar River recently contained single family residences, a mobile home park and a levee. These and several other floodplain areas are currently being restored and will have more forest cover and less (or no) impervious surface in the future. Nevertheless, this analysis attempts to somewhat underestimate future forest cover and overestimates future TIA on POS lands by assuming a future condition of only 50 percent forest cover and no change in impervious surface for such lands. Although many POS lands are managed for natural conditions, some may contain trails and other cleared areas in the future, and are therefore unlikely to become fully forested. This analysis does not pertain to lands that may be acquired as permanent open space in the future, even though the County’s flood hazard management and salmon recovery plans recommend many more acquisition and restoration actions (See Chapter 5 and Appendix C). For all other parcels, potential future TIA (later converted to EIA using process described above) and forest cover were calculated using the 2006 NLCD data to estimate current condition, followed by application of the following nominally-sized residential development scenarios, which are considered to be based on somewhat conservative (larger than expected) development footprints, to estimate future condition:
Potential future TIA ‐ Urban Small (< 0.25 acre) parcels: Future TIA = 90% of parcel area. Where current
TIA is LT 90% of parcel area, compute and show difference in area as TIA increase. Where current TIA is >= 90% of parcel area, use current TIA as future TIA (i.e., no change).
Urban Medium and Large (> 0.25 acre) parcels: Future TIA = 75% of parcel area.
Where current TIA is LT 75% of parcel area, compute and show difference in area between current and future area as TIA increase. Where current TIA is >= 75% of parcel area, use current TIA as future TIA (i.e., no change).
King County National Flood Insurance Program Biological Opinion . Compliance Submittal and Programmatic Habitat Assessment
6-9
Rural and Forest Small (< or = 1 acre) parcels: Future TIA = 7,000 sf TIA (=5,000 sf development footprint + 2,000 sf roads and other). Where current TIA is < 7,000 sf, compute and show difference between current and future area as TIA increase. Where current TIA is >= 7,000 TIA, use current TIA as future TIA (i.e., no change).
Rural and Forest Medium (> 1 acre, <= 10 acre) parcels: Future TIA = 7,500 TIA
(=5,000 sf development footprint + 2,500 sf roads and other). Where current TIA is LT 7,500 s, compute and show difference between current and future area as TIA increase. Where current TIA is >= 7,500 TIA, use current TIA as future TIA (i.e., no change).
Rural and Forest Large (> 10 acre) Future TIA = 8,500 sf TIA (=5,000 sf
development footprint + 3,500 sf roads and other). Where current TIA is < 8,500 sf, compute and show difference between current and future area as TIA increase (i.e., no change).
Potential future forest cover (FC) scenarios Urban Small (< 0.25 acre) parcels: Future FC = 10% of parcel area. Where current
FC is > 10% of parcel area, compute and show difference between current and future area as FC decrease. Where current FC is <= 10% of parcel area, use current FC as future FC (i.e., no change).
Urban Medium and Large (> 0.25) parcels: Future FC = 25% of parcel area. Where
current FC is > 25% of parcel area, compute and show difference in area as FC decrease. Where current FC is <= 25% of parcel area, use current FC as future FC (i.e., no change).
Rural and Forest Small (< or = 1 acre) parcels: Future FC = 10% of parcel. Where
current FC is > 10%, compute and show difference between current and future area as FC decrease. Where current FC is <= 10%, use current FC as future FC (i.e., no change).
Rural and Forest Medium (> 1 acre, <= 10 acre) parcels: Future FC = 50% of parcel
area. Where current FC is > 50%, compute and show difference between current and future area as FC decrease. Where current FC is <= 50%, use current FC as future FC (i.e., no change).
Rural and Forest Large (> 10 acre) parcels: Future FC = parcel size minus 5
acres/parcel. Where current FC is > parcel size minus 5 acres, compute and show difference between current and future area as FC decrease. Where current FC is <= parcel size minus 5 acres, use area of current FC as area of future FC (i.e., no change).
Using the above criteria, land covers were calculated at the parcel-scale and multiplied by percentage of parcel in either the floodplain or floodplain Delta area, respectively, to obtain land cover values for floodplain and floodplain Delta areas.

King County National Flood Insurance Program Biological Opinion . Compliance Submittal and Programmatic Habitat Assessment
6-10
Estimating Potential for New or Regenerated Forest Cover within Regulatory Buffers The potential for increased forest cover within regulatory aquatic area buffers was assessed using 2007 Landsat data. Three land covers with potential for growing mature trees were assessed: immature conifer, scrub-shrub and herbaceous. In some cases, such as Christmas tree farms, immature conifer cover is an intended condition that is unlikely to convert to mature forest cover in the future. Similarly, lands currently vegetated with sub-climax scrub/shrub and herbaceous vegetation and subject to frequent flooding and/or unimpeded channel migration are unlikely to become mature forest in the future. On the other hand, herbaceous and scrub-shrub land covers within previously logged areas reflect early stages in vegetative succession prior to regeneration of forest cover. It is also reasonable to assume that lands vegetated with immature conifers have the highest propensity to become mature coniferous forest in the future.
Estimating Potential Reasonable Use Exceptions Where a parcel is large enough to accommodate development but highly constrained by critical area buffers or setbacks, alterations to the critical area may be permitted under the King County Critical Area Code through a reasonable use exception (RUE), or a critical area buffer alteration exception (CAAE). Because the criteria used to approve these exceptions are similar, the term RUE refers to both types of exceptions. The RUE process determines the development footprint and location and the maximum amount of allowed critical area buffer or setback impact to accommodate reasonable use consistent with impact minimization and other mitigation requirements. Eligibility for an RUE depends on several factors including parcel size and configuration, natural constraints (e.g., topography and soils), location and area of critical areas and buffers, critical areas, setbacks and availability of water and sewer systems. Ultimately, to be developed, a parcel must be large enough to accommodate buildings, driveways, building setbacks, and water and septic systems. This area can be reduced where off-site water supply or sewer systems are available. To assess the extent to which a parcel’s development could encroach into an aquatic area buffer and thus potentially qualify for an RUE, the aforementioned estimates for building footprint, OSS and SSA were applied. Therefore, urban zoned parcels with less than 5,000 square feet of developable land outside of the aquatic buffer would potentially quality for a RUE. For rural parcels, the developable area would vary depending on whether a well and SSA are required. Where an off-site water supply is available, the area needed to accommodate an OSS would be the determining factor, because parcels outside urban growth boundaries are not allowed to connect to a sewer line, whereas rural parcels can be served by an off-site water supply. Where an off-site water supply is unavailable, the total area needed for an SSA and a width of least 200 feet at the wellhead would be the major factors determining parcel size needs. The minimum area needed for development of a rural parcel with an off-site water supply was estimated to be 15,000 square feet or 0.34 acre, comprising an OSS, building footprint and setbacks. To account for topographic and other potential site constraints, the area was rounded up to 0.5 acre. For rural parcels without an off-site water supply, it was assumed that a parcel had to be at least one acre in total area (SSA + OSS + building footprint and setbacks) and at least 200 feet wide at the wellhead site.

King County National Flood Insurance Program Biological Opinion . Compliance Submittal and Programmatic Habitat Assessment
6-11
Because water supply availability and parcel configuration cannot be readily determined using straightforward GIS analysis, an individual visual assessment of potentially developable parcels was conducted to determine which: a) were large enough to support development, b) had insufficient area outside the 165-foot wide aquatic area buffer to accommodate development and thus would likely trigger encroachment into the buffer, and c) had enough area outside a floodway or severe CMHA to support reasonable use. Agriculture and mining zoned parcels were excluded as they were unlikely to have residential development. This produced two categories of rural, private, undeveloped candidate parcels with development potential in the floodplain that meet the following criteria:
Category 1: Parcel size > 0.5 acre with < 0.5 acre outside the 165-foot aquatic area buffer and > 0.5 acre outside the FEMA floodway or severe CMHA, or Category 2: Parcel size > 1 acre, with < 0.75 acre outside the 165-foot aquatic area buffer and >0.75 acre outside the FEMA floodway or severe CMHA.
Category 1 parcels include those where no SSA is required, but where encroachment into a regulatory buffer is likely due to insufficient space for both the development footprint and an OSS outside the King County regulatory buffer. Category 2 parcels include those that likely need an SSA. For Category 2 parcels it is further assumed that half of the SSA will be co-located in the buffer. Figure 2 shows the combinations of parcel size, regulatory aquatic area buffer, FEMA floodway and severe CMHA constraints considered for developable parcels. For comparison, data are presented for all rural zoned lands except for agriculture and mining zoned lands. Each parcel meeting these categorical criteria was then visually assessed to determine if: a) it has an existing water supply, or b) an SSA would be required in order to accommodate an on-site water supply. For those parcels identified as needing an SSA, the parcel was further examined to determine if it was wide enough (at least 200 feet) to accommodate a 100-foot radius circle representing the circumference of an SSA, where the center (i.e., the wellhead) was outside a FEMA floodway or a severe CMHA, and at least 15,000 square feet of contiguous area existed outside both a FEMA floodway and severe CMHA that could also accommodate buildings, driveways and an OSS outside the circle representing the SSA. Availability of an off-site water supply was assessed from a map of water districts and Group A and B wellheads posted here: http://your.kingcounty.gov/dnrp/library/vcgis/maps/county/0606kcWATERutilSERVareas.pdf . An off-site water supply was assumed to be available if a parcel was either in a water supply district (except for Vashon Water District 19 and the Heights Water District, which are currently closed to new connections), or within approximately 500 feet of either a Group A or Group B wellhead.
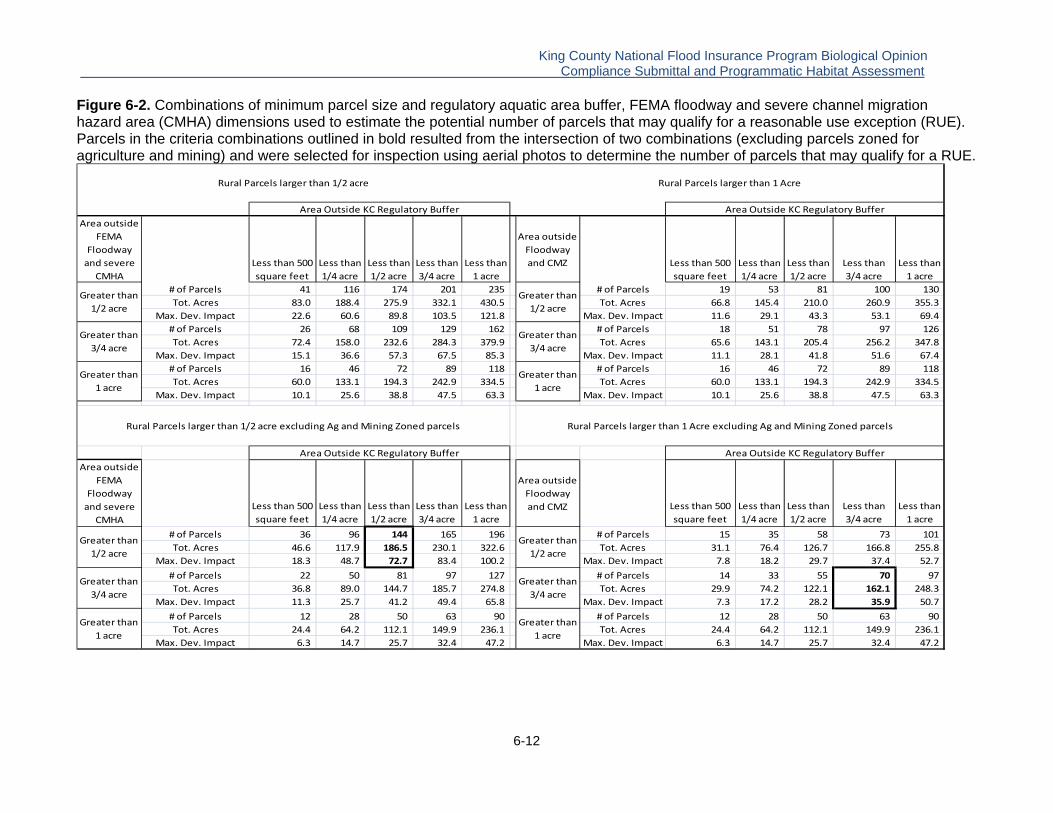
King County National Flood Insurance Program Biological Opinion . Compliance Submittal and Programmatic Habitat Assessment
6-12
Figure 6-2. Combinations of minimum parcel size and regulatory aquatic area buffer, FEMA floodway and severe channel migration hazard area (CMHA) dimensions used to estimate the potential number of parcels that may qualify for a reasonable use exception (RUE). Parcels in the criteria combinations outlined in bold resulted from the intersection of two combinations (excluding parcels zoned for agriculture and mining) and were selected for inspection using aerial photos to determine the number of parcels that may qualify for a RUE.
Area outside
FEMA
Floodway
and severe
CMHA
Less than 500
square feet
Less than
1/4 acre
Less than
1/2 acre
Less than
3/4 acre
Less than
1 acre
Area outside
Floodway
and CMZ Less than 500
square feet
Less than
1/4 acre
Less than
1/2 acre
Less than
3/4 acre
Less than
1 acre
# of Parcels 41 116 174 201 235 # of Parcels 19 53 81 100 130
Tot. Acres 83.0 188.4 275.9 332.1 430.5 Tot. Acres 66.8 145.4 210.0 260.9 355.3
Max. Dev. Impact 22.6 60.6 89.8 103.5 121.8 Max. Dev. Impact 11.6 29.1 43.3 53.1 69.4
# of Parcels 26 68 109 129 162 # of Parcels 18 51 78 97 126
Tot. Acres 72.4 158.0 232.6 284.3 379.9 Tot. Acres 65.6 143.1 205.4 256.2 347.8
Max. Dev. Impact 15.1 36.6 57.3 67.5 85.3 Max. Dev. Impact 11.1 28.1 41.8 51.6 67.4
# of Parcels 16 46 72 89 118 # of Parcels 16 46 72 89 118
Tot. Acres 60.0 133.1 194.3 242.9 334.5 Tot. Acres 60.0 133.1 194.3 242.9 334.5
Max. Dev. Impact 10.1 25.6 38.8 47.5 63.3 Max. Dev. Impact 10.1 25.6 38.8 47.5 63.3
Area outside
FEMA
Floodway
and severe
CMHA
Less than 500
square feet
Less than
1/4 acre
Less than
1/2 acre
Less than
3/4 acre
Less than
1 acre
Area outside
Floodway
and CMZ Less than 500
square feet
Less than
1/4 acre
Less than
1/2 acre
Less than
3/4 acre
Less than
1 acre
# of Parcels 36 96 144 165 196 # of Parcels 15 35 58 73 101
Tot. Acres 46.6 117.9 186.5 230.1 322.6 Tot. Acres 31.1 76.4 126.7 166.8 255.8
Max. Dev. Impact 18.3 48.7 72.7 83.4 100.2 Max. Dev. Impact 7.8 18.2 29.7 37.4 52.7
# of Parcels 22 50 81 97 127 # of Parcels 14 33 55 70 97
Tot. Acres 36.8 89.0 144.7 185.7 274.8 Tot. Acres 29.9 74.2 122.1 162.1 248.3
Max. Dev. Impact 11.3 25.7 41.2 49.4 65.8 Max. Dev. Impact 7.3 17.2 28.2 35.9 50.7
# of Parcels 12 28 50 63 90 # of Parcels 12 28 50 63 90
Tot. Acres 24.4 64.2 112.1 149.9 236.1 Tot. Acres 24.4 64.2 112.1 149.9 236.1
Max. Dev. Impact 6.3 14.7 25.7 32.4 47.2 Max. Dev. Impact 6.3 14.7 25.7 32.4 47.2
Greater than
1/2 acre
Greater than
3/4 acre
Greater than
1 acre
Rural Parcels larger than 1/2 acre
Area Outside KC Regulatory Buffer
Rural Parcels larger than 1/2 acre excluding Ag and Mining Zoned parcels
Area Outside KC Regulatory Buffer
Greater than
1/2 acre
Greater than
3/4 acre
Greater than
1 acre
Rural Parcels larger than 1 Acre
Area Outside KC Regulatory Buffer
Greater than
1/2 acre
Greater than
3/4 acre
Greater than
1 acre
Rural Parcels larger than 1 Acre excluding Ag and Mining Zoned parcels
Area Outside KC Regulatory Buffer
Greater than
1/2 acre
Greater than
3/4 acre
Greater than
1 acre

King County National Flood Insurance Program Biological Opinion . Compliance Submittal and Programmatic Habitat Assessment
6-13
Results and Discussion
Floodplain and Floodplain Delta Area Land Use and Land Cover Excluding cities and tribal reservations, King County’s total area of mapped FEMA floodplains is 28,173 acres with 8,980 parcels containing at least some amount of floodplain (Table 6-1).7 After excluding duplicate records, lands in tribal ownership but not on reservations, and areas above three natural barriers to anadromous salmonids for reasons outlined previously, the total area of FEMA floodplains evaluated for this assessment was 23,796 acres contained in 6,991 parcels. The assessed floodplain Delta area was 5,440 acres—23 percent of total area evaluated—contained in 2,797 parcels. The Delta area is relatively large due to a lack of mapped CMZs in many floodplains, resulting in the Delta area extending beyond regulatory aquatic area buffers and floodways to the edge of the floodplain. Table 6-1 shows the number and area of floodplain and floodplain Delta parcels identified at each step of the process used to ultimately identify the subset of private, undeveloped parcels with development potential in the floodplain, i.e., developable parcels.8 Maps in Appendix D show the location of FEMA floodplains, King County regulated areas (FEMA floodway, regulatory buffers and mapped severe CMZs), floodplain Delta areas and the location of developable parcels within them for all areas assessed. Across all assessed FEMA floodplains, 516 developable parcels were identified as private and undeveloped with development potential. These parcels contained 1,420 floodplain acres, or about 6 percent of the total floodplain area assessed. POS and public ownership parcels comprised 4,580 acres and 209 floodplain acres, respectively, across all assessed floodplains. Across all floodplain Delta areas, 296 developable parcels were identified as private and undeveloped with development potential. These parcels contain 445 floodplain Delta acres, about eight percent of the total floodplain Delta area. Across all floodplain Delta areas, POS and public ownership parcels comprised 1295 acres and 31 acres, respectively. Table 6-2 shows the number and area of parcels used for estimating change in forest and impervious cover for the seven major floodplain areas and fifteen sub-areas assessed in this report. Overall, 32 urban parcels and 484 rural/forest zoned developable parcels were identified comprising 31 and 1,389 floodplain acres, respectively. The highest amount of urban development potential is concentrated in the already heavily developed Lower Green floodplain sub-area. The number and floodplain area of developable rural/forest floodplain parcels ranged from 93 parcels and 445 acres in the Snoqualmie below the Snoqualmie Falls to 18 parcels and 51 acres in the May Creek floodplain. Restoration potential ranged from 217 POS parcels comprising 1,809 floodplain acres in the Lower Snoqualmie to two parcels totaling three floodplain acres in the May Creek floodplain. Large areas of the Snoqualmie (2,541 acres), Green (713 acres), White (502 acres) and the Sammamish (258 acres) floodplains are
7 There is an additional small area of developed rights-of-way that is not in the parcel-based accounting because it is not a discrete set of parcels in the County’s GIS database. 8 As noted earlier, agriculture and mining zoned parcels were not assessed in the analysis of future development related change in land cover because the County’s agricultural lands have already been cleared and farmed for many decades and programs and regulations either prohibit or severely restrict their expansion or conversion to non-agricultural uses. Parcels zoned for mining were not included in this analysis, as they constitute an extremely small fraction (0.06%) of the floodplain and, due to the nature of mining, are likely to require federal permits and therefore separate analysis of ESA and MSA effects through individual biological assessments.
King County National Flood Insurance Program Biological Opinion . Compliance Submittal and Programmatic Habitat Assessment
6-14
committed to agriculture, and are considered not likely to change in any substantive way from current condition for reasons noted previously. Conversely, the May Creek, Cedar River and Vashon Island floodplains have very little or no agriculturally zoned lands. Table 6-3 shows the number and area of parcels used for estimating change in forest and impervious cover for floodplain Delta areas. Overall, there are 3,060 floodplain Delta acres spanning 935 parcels. Of these, 22 urban and 274 rural/forest zoned parcels were identified as developable comprising three and 442 floodplain Delta acres, respectively. As at the floodplain scale, the greatest amount of urban development potential is largely (17 of 22 parcels) in one sub-area, the already heavily developed Lower Green. The number and floodplain Delta areas of developable rural/forest zoned floodplain parcels ranged from 67 parcels totaling 129 floodplain Delta area acres in the Snoqualmie below the Snoqualmie Falls, to 17 parcels totaling 18 floodplain Delta acres in the May Creek floodplain. There were 358 POS parcels covering 1,295 acres contributing to the restoration potential across all floodplain Delta areas assessed. Among discrete floodplain areas, parcels contributing to restoration potential ranged from a high of 86 parcels with 367 acres in the Snoqualmie and 67 parcels with 411 acres in the White to a low of one parcel and one acre in May Creek. Floodplain Delta areas committed to agriculture and considered not likely to change in any substantive way from current condition for reasons noted previously totaled 1,280 acres, ranging from 161 acres in the Green River to 674 acres in the Snoqualmie. Conversely, the May Creek, Cedar River and Vashon Island floodplains have very little or no agriculture zoned lands. Of the developable floodplain parcels, 115 (22.2%) were identified as being all or mostly in mapped landslide hazard areas. The total area of landslide mapped parcels constitutes 473.3 acres, of which 402.8 acres (85.1%) were in mapped landslide hazard areas. The mere presence in a GIS mapped landslide hazard area does not limit development as these areas were mapped using GIS data that may not accurately portray site-specific conditions. Furthermore, development in a landslide hazard area is possible where stability and erosion concerns can be addressed through geotechnical engineering. Regardless, presence in a confirmed landslide hazard area may limit development and, where very steep slopes and highly unstable soils are in fact present, clearing and development footprint limits may be required to mitigate hazard risks. In some instances, parcels may be unbuildable due to extremely hazardous conditions. As a result, development on at least some of these parcels is likely to be limited compared to parcels outside these hazard areas. Watershed Condition Context The NOAA BiOp recommends the “65/10” percent forest to percent EIA threshold for parcel scale floodplain development described by Booth et al. (2002). It should be noted that this threshold standard was derived from analysis at the watershed scale, and was intended for application at the watershed rather than at the floodplain scale (Hartley, 2011, pers. comm.). The applicability of the 65/10 standard for parcel-scale effects in floodplains has not been assessed. Nonetheless, watershed-scale forest cover and EIA are presented for both floodplains and contributing watershed areas, though the latter scale is consistent with its original derivation. Table 6-4 summarizes watershed-scale forest cover, TIA and EIA for mapped floodplains. Across all of the county’s mapped floodplains, the watershed-scale ratio of percent forest cover to percent EIA is 62/1.7 including urban and tribal areas, and 65/0.9 when urban and tribal areas are excluded. Of the six major floodplain areas (Cedar, Green, Snoqualmie, Sammamish, Vashon and the White) and excluding urban areas and tribal lands,

King County National Flood Insurance Program Biological Opinion . Compliance Submittal and Programmatic Habitat Assessment
6-15
the Green, Sammamish and Vashon overall contributing watersheds had forest covers less than 65 percent9. Of the eighteen sub-areas, however, twelve had less than 65 percent forest cover. Among the six major floodplain areas, those along the Green and Cedar Rivers are highly affected by flow regulation from upstream water supply/flood control dams, and therefore the forest cover/impervious area relationships in those watersheds are probably not valid indicators of floodplain condition. Within the Lower Snoqualmie basin, the Tolt River is the second largest sub-area and its floodplain is also affected by a water supply dam, although probably to a much lesser extent than those of the Green and Cedar Rivers because the Tolt River reservoir is located higher in the watershed and impounds only a single fork of the river. Similarly, Mud Mountain Dam on the White River impounds water only during major flood events and the river flows freely through it at other times. Thus its impact on land use and land cover is different from those of the dams on the Cedar and Green Rivers. Of the County’s three major floodplains not heavily affected by dams, effects of upstream development on the Sammamish River floodplain are heavily moderated by Lake Sammamish, Washington State’s sixth largest lake, while the Vashon Island floodplain is part of Puget Sound’s nearshore ecosystem, and thus its hydrology is much more strongly influenced by tidal fluctuations and storm-generated wave conditions than by land use changes. As a result, for the Sammamish River and Vashon marine near-shore floodplains, the significance of the forest cover/impervious relationship as originally conceived is uncertain. The free-flowing Snoqualmie River (discounting the relatively minor influence of the South Fork Tolt River water supply dam), where the threshold may be most applicable, is at or above the nominal 65/10 threshold, even though considerable upstream areas of federal, state and private forests lands, the management of which is guided by either the Pacific Northwest Forest Plan in the case of federal lands, or the Forest and Fish Agreement for lands under state regulatory control, have less than the BiOp’s recommended 65 percent forest cover.10 Potential Future Change in Floodplain Condition The current and estimated future area and proportions of forest cover and total and effective impervious area (TIA, EIA) for the County’s FEMA floodplains and floodplain Deltas are presented in Table 6-5. The future condition reflects the condition if all currently private, undeveloped parcels with development potential in the floodplain (see above for process for identifying these parcels) and all permanent open space parcels are built-out or restored to the nominal future conditions described earlier. Although not directly used by Booth et al. (2002) in their land cover hydrology threshold, TIA is presented because impervious covers have effects beyond their hydrologic impact. For example, conversion of land covers from vegetation to impervious increases potential pollution generating surfaces, particularly from roads, and eliminates the many potential functions of vegetation, such as pollution filtration, terrestrial food base (insects) for salmonids (King County 2004). Across all floodplains assessed, forest cover is projected to increase from 5,737 to 6,429 acres a potential net increase in forest cover of 692 acres or about three percent of the total assessed floodplain area. As a percentage of floodplain area, percent forest cover would increase from
9 For rivers, this was measured from the downstream end of the floodplain. 10 Although not directly relevant to this assessment, it is interesting to note that when the “Four Hs” (hydro/dams, harvest, hatcheries and habitat) were assessed for their relative effects on Chinook salmon, Hoekstra et al. (2007) found that the presence of dams most strongly affected variation in population density. They also found that harvest and hatcheries most strongly influenced variation in population trend. In their analysis, habitat was the weakest of the “Four Hs” in driving population density or trend.
King County National Flood Insurance Program Biological Opinion . Compliance Submittal and Programmatic Habitat Assessment
6-16
22.9 percent currently to 25.7 percent if all currently undeveloped parcels were developed and POS lands were restored to the nominal conditions described earlier. Of the seven discrete floodplain areas assessed, six are projected to have an increase in forest cover ranging from 0.2 acres in May Creek to 388.2 acres in the Snoqualmie. The exception is Vashon Island, where floodplain forest cover is projected to decline by 12.5 acres, or about 2.4 percent of the Island’s total floodplain area. Of the fifteen sub-areas, twelve are projected to have an increase in forest cover ranging from 0.2 acres in the Raging River floodplain to 272 acres in the lower Snoqualmie. The three areas projected to have a decrease in forest cover range from 0.4 acres in the Tolt River and Boise Creek floodplains to 2.8 acres in the upper Green. Forest cover changes reflect the interaction between active and passive reforestation of permanent open space and development of private, undeveloped land with development potential remaining in the floodplain. Total impervious area (TIA) is projected to increase from 757.1 to 794.8 acres, a potential increase of 37.7 acres, about 0.15 percent of total floodplain area, across all floodplains. As a percentage of floodplain area, TIA would change from 3.0 percent under current conditions to 3.2 percent under full build-out. Among the six major floodplain areas, TIA increases range from 1.2 acres in the Cedar (0.1% change) to about 22 acres in the Green River (0.4% change). Within sub-areas, TIA increases range from a low of 0.5 acres in the Middle Green River to slightly over 18 acres in the highly urbanized lower Green River sub-basin. Increases in EIA are generally lower than TIA by 60 percent (TIAX0.4) except in the lower Green where an urban conversion factor of 0.8 was applied. Estimated future percentages of EIA under full build-out would fall well below the 10 percent threshold identified in the NOAA BiOp for all floodplain areas, with the lower Green River projected to have the highest level (5.8%) under full build-out. Potential Future Change in Floodplain Delta Condition Across all floodplain Delta areas, forest cover is projected to increase from 1,331.7 to 1,553.4 acres, a net increase of 221.7 acres or about four percent of the total Delta area (Table 6-5). As a percentage of floodplain Delta area, forest cover would increase from 23.6 to 27.5 percent under full build-out. An increase in forest cover is anticipated for six of the seven discrete floodplain Delta areas. The exception is Vashon Island where a decline from 28.9 to 23.5 percent forested (loss of 2.4 acres) is projected. Among the fifteen sub-areas assessed, forest cover in the floodplain Delta areas is projected to increase in thirteen sub-areas and decrease in two. Decrease in percent forest cover in the two declining floodplains are small ranging from a 0.3 acre loss (change from 46.8 to 44.1%) in the Upper Green to 0.4 acre (change from 11.3 to 11.1%) for Boise Creek. Total impervious area across all delta areas under full build out is projected to increase from 222.5 to 228.9 acres, a net increase of 6.4 acres or about 0.1 percent of the total Delta area. As a percentage of the floodplain Delta area, TIA would change from 3.9 to 4.1 percent under full build-out. An increase of between 0.2 acres (Vashon) to 3.1 acres (Green) of TIA is anticipated for six of the seven discrete floodplain Delta areas; the lone exception being May Creek where an increase of less than 0.1 acre—not enough to raise the TIA percentage by one-tenth percent—is projected. For sub-areas, TIA is projected to potentially increase less than one acre in any given Delta area except the urbanized lower Green where it is projected to increase by 1.7 acres. Most floodplains would see less than a one percent change in TIA percentage from current to projected future condition, the exception being a change of 1.7 percent (2.1 to 3.9%) in the Raging River sub-area. Increases in EIA are generally 60 percent lower than increases of TIA (TIAX0.4) except in the lower Green sub-watershed, where an urban TIA/EIA conversion factor of 0.8 was applied. Expressed as a percentage of the floodplain Delta area, future

King County National Flood Insurance Program Biological Opinion . Compliance Submittal and Programmatic Habitat Assessment
6-17
percentages of EIA under full build-out would fall well below the 10 percent threshold identified in the NOAA BiOp for all floodplain Delta areas except for the urbanized lower Green River, where current EIA is 12.6 percent, already beyond the nominal 10 percent threshold, and is not projected to rise appreciably beyond that level under full build-out. New or Regenerated Forest Cover Potential within Regulatory Buffers King County’s regulatory buffers along fish-bearing aquatic habitats are a minimum of 165 feet in width measured from the ordinary high water mark (OHWM). This is equivalent to slightly more than one site potential tree height (Appendix A). Buffer widths expand where floodplains adjoin steep slopes and wetlands. Where regulatory buffers are not currently forested and in a condition that would allow forest development (e.g., are not actively farmed or maintained for legally permitted uses), there is potential for mature forests to grow either passively over time, or as the result of plantings undertaken by landowners independently or through cost-sharing and other cooperative ventures with government agencies and non-profit organizations. Table 6-6 summarizes immature conifer, scrub/shrub and herbaceous land covers within regulatory buffers for: a) all rural zoned lands (Table 6-6a), b) rural lands excluding agricultural lands (Table 6-6b) and c) lands zoned only for agriculture (Table 6-6c). Most areas of existing immature conifers—the land cover considered to have the highest potential for conversion to forest cover over time—are found outside of agricultural areas. Across all floodplains with rural zoning, there are 594 acres of immature conifers, of which most (374 acres, 63 percent of the FEMA floodplain) are within regulatory buffers outside of agriculturally zoned areas. In contrast, agriculturally zoned lands have relatively small amounts of immature conifers at the floodplain (16 acres) and regulatory buffer scale (nine acres). Across all land use zones, buffer area with scrub/shrub cover totaled 182 acres, with about 100 acres in non-agriculturally zoned buffers and 82 acres in agriculturally-zoned buffers. Agriculturally zoned lands had the most herbaceous land covers (2,043 acres, 77 percent of total herbaceous land covers) within regulatory buffers. The relatively high proportion of herbaceous land cover in agricultural buffers reflects historic conversion of these lands to active farming. As a result, these lands are unlikely to revert to forest or scrub-shrub vegetation unless agricultural activity ceases. Potential Reasonable Use Exceptions (RUEs) Regulations could restrict a private landowner’s use of property to the point where constitutionally protected property rights are diminished. In these situations, King County provides a RUE process that allows development in a critical area or its buffer. Chapter 4 defines RUEs and conditions under which they may be granted. It is important to note that under a RUE, development is limited to the minimum necessary to meet reasonable use, and that even when a RUE is granted, mitigation is required for impacts to critical areas and buffers. Additionally, landowners must meet septic, water and safety requirements. As a result, development under a RUE typically entails significant added cost and permitting complexity. Between 1998 and 2010, King County issued a total of 55 RUEs. Of these, only seven were in a FEMA floodplain, including five issued primarily to bypass steep slope protections along Vashon Island and Lake Sammamish, and one that allowed impacts to a wetland along Bear Creek. The reason for which one additional RUE was granted was not stated in the permit file. It should be noted that these RUEs were granted during a period when King County’s economy was very strong and land development rates were relatively high. Table 6-7 summarizes the buildability and RUE potential for parcels determined to have reasonable use potential. In all, of the 158 parcels examined, 71 (45%) appeared to be likely candidates because they lack enough buildable area outside King County’s regulatory buffers to

King County National Flood Insurance Program Biological Opinion . Compliance Submittal and Programmatic Habitat Assessment
6-18
support conventionally permitted development, but have enough buildable area for development outside a floodway, severe CMHA and SSA. Twenty-nine parcels (18%) were considered unlikely to require a RUE because they appear to contain sufficient space for development outside a regulatory buffer, floodway and severe CMHA. Fifty-eight parcels (37% of total) were considered undevelopable with or without a RUE due to constraints posed by SSA requirements and/or flood hazard areas, or insufficient contiguous buildable area for development. This analysis may overestimate the number of potential RUEs that could be issued in the future for several reasons, including: a) small-scale topographic and legal constraints that may prevent access or construction, b) some parcels will be intentionally left undeveloped for privacy and/or aesthetic reasons, or will be only marginally developed for low impact activities, such as lawns or gardens, c) parcels are already used or reserved for purposes that preclude development, such as a group well site or SSA, and d) the added expense for access, construction and mitigation effectively precludes development in spite of the potential applicability of the RUE process. Conversely, there are mechanisms that could reduce parcel area requirements and confer development potential to some otherwise undevelopable parcels. These include use of rainwater harvesting, which would eliminate SSA and 200-foot parcel-width requirements, and acquisition of easements for all or portions of an adjacent parcel that allow off-site access to a SSA or OSS. Rainwater harvesting was recently approved by the King County Board of Health, but only for single family residential houses with an existing septic system where the landowner can show that connecting to an existing water supply or drilling a new well would cause “undue hardship.” There are significant complications related to reliance on rainwater harvesting including high construction costs and seasonal supply limitations that make this water source a difficult option for many landowners. In an unlikely worst case, where the nominally-sized development footprint (15,000 square feet of clearing and 2,600 square feet of impervious, not counting setbacks) of all 71 parcels with RUE potential is placed fully in the regulatory buffer, the net amount of new impervious would total about four acres, and the net amount of new clearing would be 24 acres, across all regulatory aquatic area buffers in the County’s floodplains. In reality, the impacts are likely to be much less because landowners will be required to place as much of the development as possible outside the critical area buffer and, as noted above, some portion of the RUE parcels are unlikely to ever be developed. Limitations and Sources of Error “All models are wrong but some are useful.” – George Box. By necessity, the foregoing assessment of current and future conditions simplifies a highly complicated set of regulations in order to assess the adequacy of King County’s regulations for the protection of ESA and MSA-listed species from adverse impacts of land development in the County’s FEMA floodplains. Specific values for forest cover and impervious area change are presented to provide a sense of the direction and magnitude of potential future land use and land cover changes. The estimates of future conditions are projections that rely on assumptions and interpretations of how regulations will be implemented at the parcel scale. As the future plays out, it is likely that land cover values will vary from those presented in this report due to the many environmental and socioeconomic factors that are the ultimate determinants of development on a given parcel. To be precautionary and minimize the potential for Type II Error, i.e., a “false negative,” where an adverse impact is not predicted but in fact occurs, this analysis is conservative in favor of ESA-listed species protection by somewhat overestimating the
King County National Flood Insurance Program Biological Opinion . Compliance Submittal and Programmatic Habitat Assessment
6-19
amount of future development and underestimating the countervailing effects of future protection and restoration. Examples of how the analysis may be precautionary, i.e., biased conservatively in favor of protecting species and their habitats, include:
1) Assuming 50 percent as future forest cover for permanent open space lands when it is more likely that at least some if not most open space will be well in excess of that, perhaps closer to 90 percent forested; 2) Not including the likely effects of at least some of the many future land acquisition and restoration projects proposed for floodplain hazard reduction and salmon recovery outlined in Appendix D. While it is unlikely all of these projects will be implemented, it is also highly likely that many of the projects will be implemented in some form barring a dramatic change in the County’s and the Puget Sound region’s priorities, funding and ESA legal requirements; 3) Assuming that every parcel that could be developed will eventually be so to its highest legal use, mainly for single family residential use. It is more likely, however, that at least some parcels identified as private and undeveloped with development potential in the floodplain may ultimately be less developed, or never developed, for reasons including: a) use as a dedicated wellhead protection area, b) landowner preferences, such as privacy, aesthetic and conservation, c) site limitations related to topography and slope stability (e.g., 115 parcels comprising 473 acres are 85 percent in landslide hazard areas, mostly along Vashon Island), and d) lack of legal or safe access. 4) For developable parcels only partially in the floodplain, the same proportion of forest cover loss and impervious increase was allocated to the floodplain and non-floodplain portions of a parcel. This likely overestimates the development effects because it is more likely that clearing and impervious areas will be concentrated outside the floodplain. 5) For POS parcels there was no accounting for reduction in impervious surface even though houses and access roads are being routinely removed. 6) EIA estimates use a conversion factor for rural lands that was developed for higher density lands. As a result, the estimate of EIA is probably much higher than would be the case for urban lands. Additionally, floodplain EIA would likely be low relative to other rural EIA values because floodplain topography is generally flat (notable exceptions are the steep slopes of Vashon Island) and have relatively pervious soils. 7) OSS area requirements were doubled from those under ideal conditions, thereby creating larger development footprints than would occur if OSS footprints were smaller. 8) Lack of accounting for the added protective value of the moderate CMHA, where many development activities are allowed only when there is no feasible option. In such cases, the development footprint must be placed as far from the migration area as possible. 9) As per the BiOp criteria for protected area, Delta areas extend beyond floodway and aquatic area buffers to the edge of the floodplain in areas that do not currently have mapped CMZs. Mapped CMZs exist only for the Toll, Raging and Middle Green River floodplains. For all other floodplains, the Deltas are larger—probably much larger—than they likely would be if CMZs were mapped as CMZs are not likely occupy the entire floodplain.
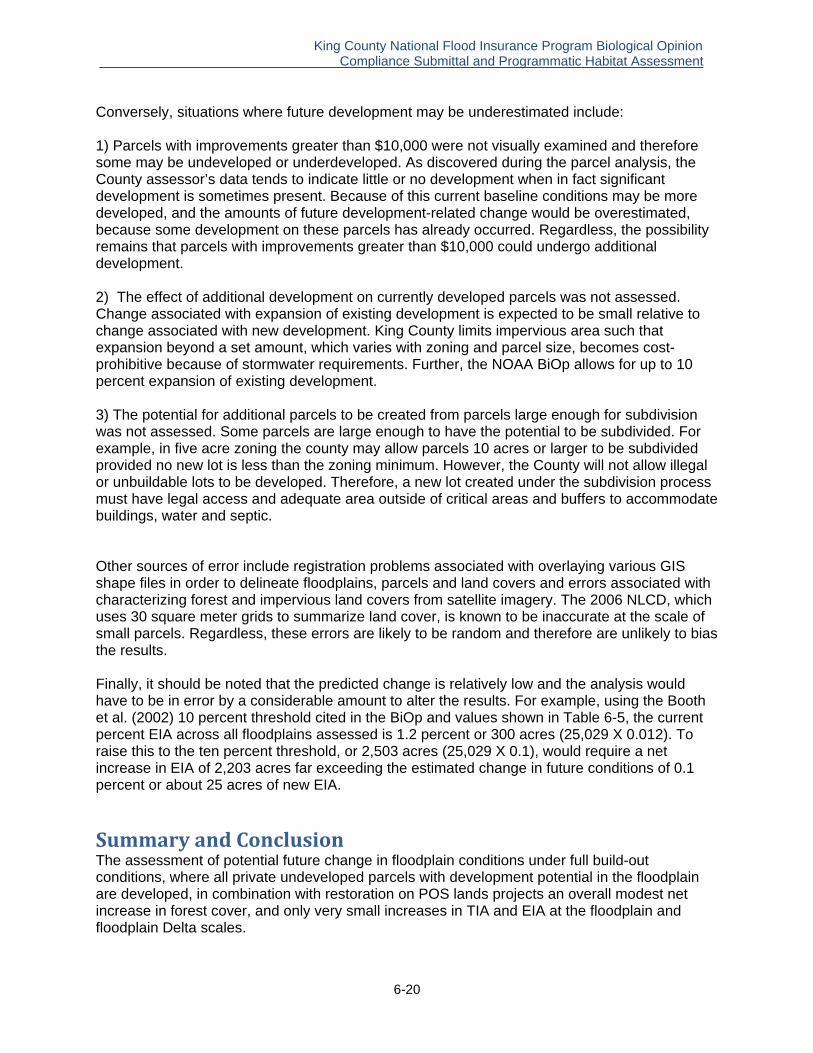
King County National Flood Insurance Program Biological Opinion . Compliance Submittal and Programmatic Habitat Assessment
6-20
Conversely, situations where future development may be underestimated include: 1) Parcels with improvements greater than $10,000 were not visually examined and therefore some may be undeveloped or underdeveloped. As discovered during the parcel analysis, the County assessor’s data tends to indicate little or no development when in fact significant development is sometimes present. Because of this current baseline conditions may be more developed, and the amounts of future development-related change would be overestimated, because some development on these parcels has already occurred. Regardless, the possibility remains that parcels with improvements greater than $10,000 could undergo additional development. 2) The effect of additional development on currently developed parcels was not assessed. Change associated with expansion of existing development is expected to be small relative to change associated with new development. King County limits impervious area such that expansion beyond a set amount, which varies with zoning and parcel size, becomes cost-prohibitive because of stormwater requirements. Further, the NOAA BiOp allows for up to 10 percent expansion of existing development. 3) The potential for additional parcels to be created from parcels large enough for subdivision was not assessed. Some parcels are large enough to have the potential to be subdivided. For example, in five acre zoning the county may allow parcels 10 acres or larger to be subdivided provided no new lot is less than the zoning minimum. However, the County will not allow illegal or unbuildable lots to be developed. Therefore, a new lot created under the subdivision process must have legal access and adequate area outside of critical areas and buffers to accommodate buildings, water and septic. Other sources of error include registration problems associated with overlaying various GIS shape files in order to delineate floodplains, parcels and land covers and errors associated with characterizing forest and impervious land covers from satellite imagery. The 2006 NLCD, which uses 30 square meter grids to summarize land cover, is known to be inaccurate at the scale of small parcels. Regardless, these errors are likely to be random and therefore are unlikely to bias the results. Finally, it should be noted that the predicted change is relatively low and the analysis would have to be in error by a considerable amount to alter the results. For example, using the Booth et al. (2002) 10 percent threshold cited in the BiOp and values shown in Table 6-5, the current percent EIA across all floodplains assessed is 1.2 percent or 300 acres (25,029 X 0.012). To raise this to the ten percent threshold, or 2,503 acres (25,029 X 0.1), would require a net increase in EIA of 2,203 acres far exceeding the estimated change in future conditions of 0.1 percent or about 25 acres of new EIA.
Summary and Conclusion The assessment of potential future change in floodplain conditions under full build-out conditions, where all private undeveloped parcels with development potential in the floodplain are developed, in combination with restoration on POS lands projects an overall modest net increase in forest cover, and only very small increases in TIA and EIA at the floodplain and floodplain Delta scales.

King County National Flood Insurance Program Biological Opinion . Compliance Submittal and Programmatic Habitat Assessment
6-21
The number of situations in which RUE would allow development in critical areas and buffers regulatory buffers is likely to be low and the net effect on forest cover or impervious surface negligible. Implementation of King County’s regulations, when considered in the context of the current baseline and land use regulations (ca 2011) and the County’s many other actions that protect floodplains can be considered consistent with an ESA precautionary approach.
References Booth, D.B., D. Hartley and R. Jackson, 2002. Forest cover, impervious surface area, and the
mitigation of stormwater impacts. Am. Wat. Res. Ass. 38(3): 835-845. Dinicola, R.S. 1990. Characterization and simulation of rainfall-runoff relations for headwater
basins in western King and Snohomish Counties, Washington. U.S. Geological Survey Water-Resources Investigations Report 89-4052, 58 p.
Hartley, David. 2011, Northwest Hydraulics, pers. comm. Hoekstra, J.M., K.K. Bartz, M.H. Ruckleshaus, J.M. Moslemi and T. K. Harms. 2007.
Quantitative threat analysis for management of an imperiled species: Chinook salmon (Oncorhynchus tshawytscha). Ecological Applications 17(7): 2061-2073.
King County. 2004. King County Best Available Science, Volume I: Review of Science
Literature. King County Department of Natural Resources and Parks, Seattle, Washington.
Koperski, David. King County Public Health Department, email, 10/26/2011. Latterell, J., K. Higgins, K. Lynch, K. Bergeron, T. Patterson, E. Ostergaard, and M. Knox. 2012.
WRIA 9 status and trends monitoring report. Report for WRIA 9 Watershed Ecosystem Forum prepared by WRIA 9 Implementation Technical Committee, February, 2012, p. 144.
Vanderhoof, J.S., S. Stolnack, K. Rauscher and K. Higgins. Lake Washington/Cedar
River/Sammamish Watershed (WRIA 8) land cover change analysis. Prepared for WRIA 8 Technical Committee by King County Water and Land Resources Division, Department of Natural Resources and Parks, Seattle, Washington.
Washington Department of Fish and Wildlife and National Wildlife Federation. 2011. Climate
change effects on forest, alpine and western prairie habitats in Washington State. http://wdfw.wa.gov/publications/01202/wdfw01202.pdf
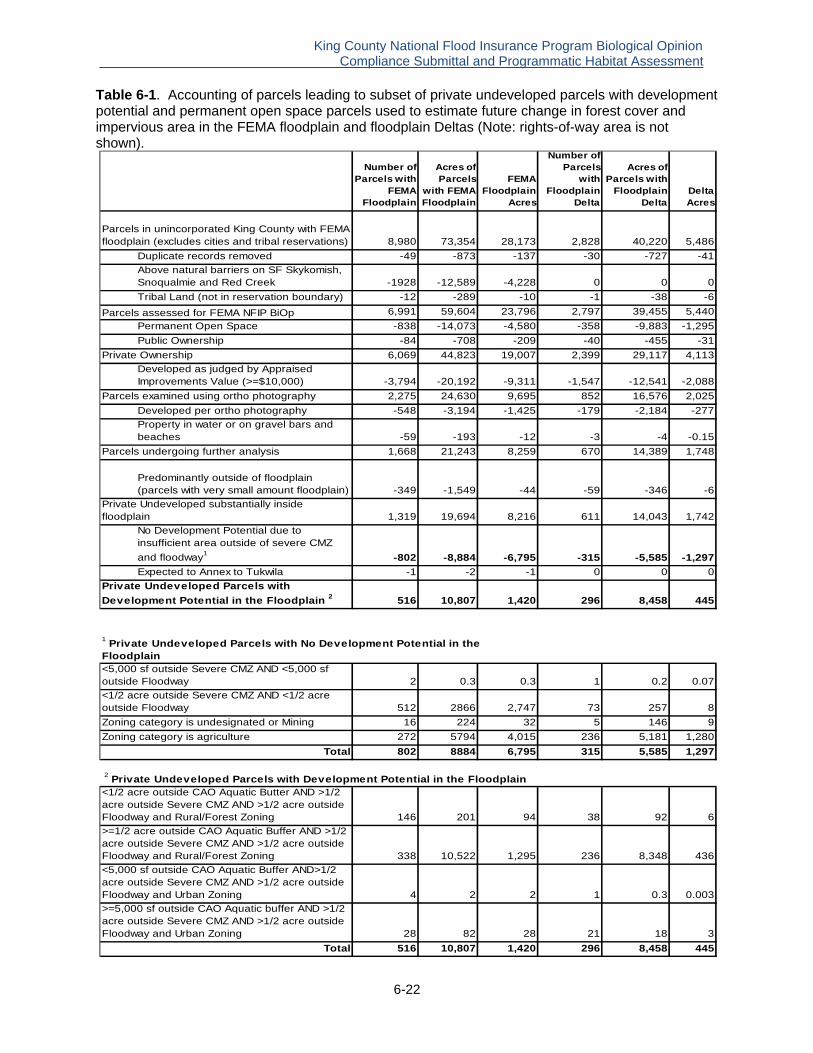
King County National Flood Insurance Program Biological Opinion . Compliance Submittal and Programmatic Habitat Assessment
6-22
Table 6-1. Accounting of parcels leading to subset of private undeveloped parcels with development potential and permanent open space parcels used to estimate future change in forest cover and impervious area in the FEMA floodplain and floodplain Deltas (Note: rights-of-way area is not shown).
Number of Parcels with
FEMA Floodplain
Acres of Parcels
with FEMA Floodplain
FEMA Floodplain
Acres
Number of Parcels
with Floodplain
Delta
Acres of Parcels with
Floodplain Delta
Delta Acres
Parcels in unincorporated King County with FEMA floodplain (excludes cities and tribal reservations) 8,980 73,354 28,173 2,828 40,220 5,486
Duplicate records removed -49 -873 -137 -30 -727 -41
Above natural barriers on SF Skykomish, Snoqualmie and Red Creek -1928 -12,589 -4,228 0 0 0
Tribal Land (not in reservation boundary) -12 -289 -10 -1 -38 -6
Parcels assessed for FEMA NFIP BiOp 6,991 59,604 23,796 2,797 39,455 5,440
Permanent Open Space -838 -14,073 -4,580 -358 -9,883 -1,295
Public Ownership -84 -708 -209 -40 -455 -31
Private Ownership 6,069 44,823 19,007 2,399 29,117 4,113
Developed as judged by Appraised Improvements Value (>=$10,000) -3,794 -20,192 -9,311 -1,547 -12,541 -2,088
Parcels examined using ortho photography 2,275 24,630 9,695 852 16,576 2,025
Developed per ortho photography -548 -3,194 -1,425 -179 -2,184 -277
Property in water or on gravel bars and beaches -59 -193 -12 -3 -4 -0.15
Parcels undergoing further analysis 1,668 21,243 8,259 670 14,389 1,748
Predominantly outside of floodplain (parcels with very small amount floodplain) -349 -1,549 -44 -59 -346 -6
Private Undeveloped substantially inside floodplain 1,319 19,694 8,216 611 14,043 1,742
No Development Potential due to insufficient area outside of severe CMZ
and floodway1-802 -8,884 -6,795 -315 -5,585 -1,297
Expected to Annex to Tukwila -1 -2 -1 0 0 0
Private Undeveloped Parcels with
Development Potential in the Floodplain 2 516 10,807 1,420 296 8,458 445
<5,000 sf outside Severe CMZ AND <5,000 sf outside Floodway 2 0.3 0.3 1 0.2 0.07
<1/2 acre outside Severe CMZ AND <1/2 acre outside Floodway 512 2866 2,747 73 257 8
Zoning category is undesignated or Mining 16 224 32 5 146 9
Zoning category is agriculture 272 5794 4,015 236 5,181 1,280
Total 802 8884 6,795 315 5,585 1,297
<1/2 acre outside CAO Aquatic Butter AND >1/2 acre outside Severe CMZ AND >1/2 acre outside Floodway and Rural/Forest Zoning 146 201 94 38 92 6
>=1/2 acre outside CAO Aquatic Buffer AND >1/2 acre outside Severe CMZ AND >1/2 acre outside Floodway and Rural/Forest Zoning 338 10,522 1,295 236 8,348 436
<5,000 sf outside CAO Aquatic Buffer AND>1/2 acre outside Severe CMZ AND >1/2 acre outside Floodway and Urban Zoning 4 2 2 1 0.3 0.003
>=5,000 sf outside CAO Aquatic buffer AND >1/2 acre outside Severe CMZ AND >1/2 acre outside Floodway and Urban Zoning 28 82 28 21 18 3
Total 516 10,807 1,420 296 8,458 445
1 Private Undeveloped Parcels with No Development Potential in the
Floodplain
2 Private Undeveloped Parcels with Development Potential in the Floodplain

King County National Flood Insurance Program Biological Opinion . Compliance Submittal and Programmatic Habitat Assessment
6-23
Table 6‐2. Breakout of FEMA floodplain parcels assessed for future change in forest and impervious land covers due to new development on private, undeveloped parcels with development potential in the floodplain or restoration of forest cover on permanent open space parcels and parcels where no change is computed.
Floodplain Area # of Parcels
Acres in Floodplain
# of Parcels
Acres in Floodplain
# of Parcels
Acres in Floodplain
# of Parcels
Acres in Floodplain
# of Parcels
Acres in Floodplain
# of Parcels
Acres in Floodplain
# of Parcels
Acres in Floodplain
May 18 51 2 3 3 8 23 62
Cedar 39 99 165 312 6 4 3 20 213 436
SammamishIssaquah 35 75 46 380 4 27 85 482
Big Bear 41 169 42 93 15 29 98 291
Sammamish 3 3 15 332 2 0 6 258 26 594
Sub‐Total 3 3 76 244 103 805 21 56 ‐ ‐ 6 258 209 1,367
SnoqualmieRaging 2 0 14 13 45 80 2 1 2 2 65 96
Patterson 19 104 16 133 2 8 37 245
Tolt 14 114 67 128 1 0 1 28 83 270
Cherry 7 25 3 324 8 145 18 495
Lower Snoqualmie 2 0 39 189 86 1,145 9 28 1 1 96 2,360 233 3,723
Sub‐Total 4 1 93 445 217 1,809 12 29 3 2 107 2,541 436 4,828
GreenUpper Green 7 13 9 26 1 1 17 40
Newaukum 26 71 6 32 9 48 54 256 95 406
Soos 1 1 28 85 29 122 5 11 63 218
Middle Green 3 7 62 555 6 1 34 271 105 834
Lower Green 24 26 18 181 11 33 12 186 65 426
Sub‐Total 25 26 64 175 124 915 31 92 1 1 100 713 345 1,923
WhiteBoise 2 27 6 16 3 2 15 45 26 90
White 34 250 63 612 2 16 2 8 43 457 144 1,343
Sub‐Total ‐ ‐ 36 276 69 628 5 19 2 8 58 502 170 1,432
Vashon 158 99 158 108 6 1 7 1 1 0 330 210
Grand Total 32 31 484 1,389 838 4,580 84 209 16 32 272 4,015 1,726 10,257
Development
Area Totals
Restoration No Change
Urban Parcels w/ Dev. Pot.
Rural/Forest Parcels w/ Dev. Pot.
Permanent Open Space Parcels
Public Ownership Parcels
Mining & Misc. Parcels Agriculture Parcels

King County National Flood Insurance Program Biological Opinion . Compliance Submittal and Programmatic Habitat Assessment
6-24
Table 6‐3. Breakout of FEMA floodplain Delta parcels assessed for future change in forest and impervious land covers due to new development on private, undeveloped parcels with development potential in the floodplain or restoration of forest cover on permanent open space parcels and parcels where no change is computed.
Floodplain Area # of Parcels
Acres in Delta Area
# of Parcels
Acres in Delta Area
# of Parcels
Acres in Delta Area
# of Parcels
Acres in Delta Area
# of Parcels
Acres in Delta Area
# of Parcels
Acres in Delta Area
# of Parcels
Acres in Delta Area
May 17 18 1 1 2 2 20 21
Cedar 32 44 83 66 3 2 2 5 120 116
SammamishIssaquah 21 15 26 131 2 2 49 148
Big Bear 35 89 20 25 8 3 63 117
Sammamish 7 190 1 0 6 220 14 410
Sub‐Total ‐ ‐ 56 103 53 346 11 6 ‐ ‐ 6 220 126 675
SnoqualmieRaging 2 0 5 1 10 4 1 0 18 6
Patterson 17 30 16 55 2 1 35 86
Tolt 9 25 30 11 1 0 1 21 41 57
Cherry 6 7 3 181 8 91 17 279
Lower Snoqualmie 2 0 30 66 27 115 4 3 90 562 153 746
Sub‐Total 4 0 67 129 86 367 5 3 1 0 101 674 264 1,173
GreenUpper Green 5 2 8 6 13 8
Newaukum 25 25 6 10 8 9 54 119 93 162
Soos 1 0 23 44 20 29 3 2 47 75
Middle Green 26 18 20 13 46 30
Lower Green 17 3 6 34 4 0 3 29 30 66
Sub‐Total 18 3 53 70 66 97 15 11 ‐ ‐ 77 161 229 342
WhiteBoise 2 5 4 4 1 1 14 21 21 30
White 25 62 49 407 2 7 2 4 38 204 116 685
Sub‐Total ‐ ‐ 27 67 53 411 3 8 2 4 52 225 137 715
Vashon 22 10 16 7 1 0 39 18
Grand Total 22 3 274 442 358 1,295 40 31 5 9 236 1,280 935 3,060
Development
Area Totals Urban Parcels w/
Dev. Pot. Rural/Forest Parcels
w/ Dev. Pot. Mining & Misc.
Parcels Agriculture Parcels
Restoration No Change
Permanent Open Space Parcels
Public Ownership Parcels
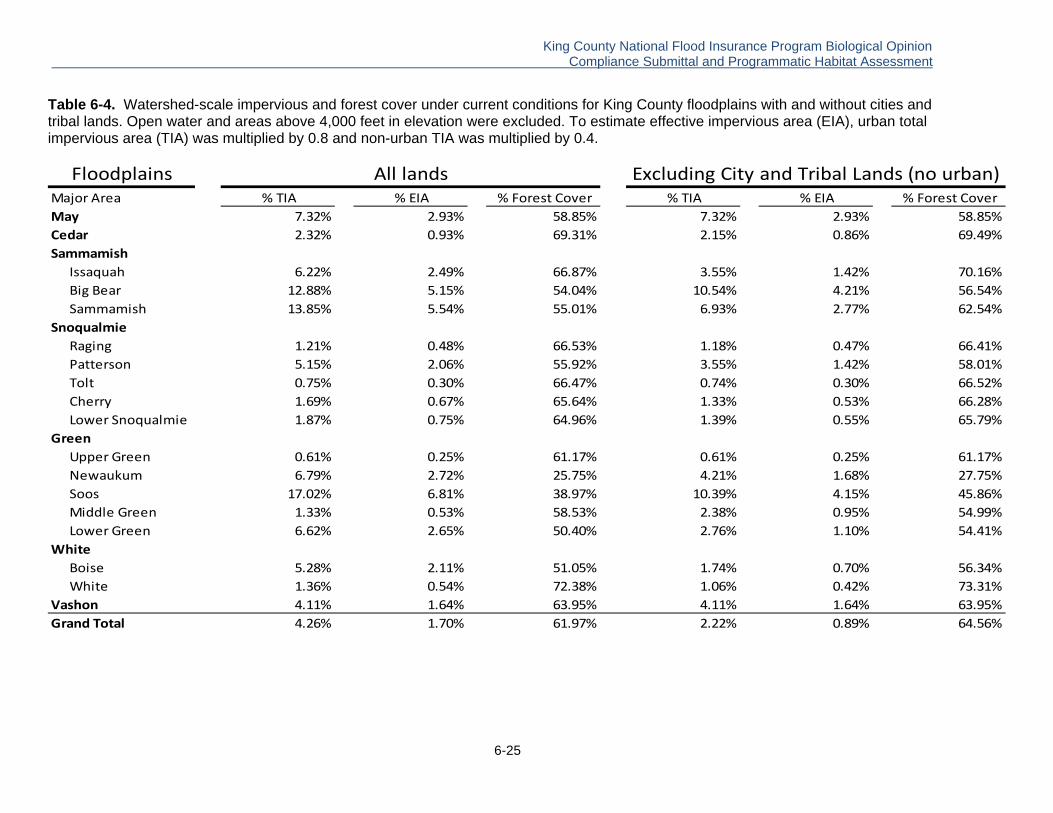
King County National Flood Insurance Program Biological Opinion . Compliance Submittal and Programmatic Habitat Assessment
6-25
Table 6-4. Watershed-scale impervious and forest cover under current conditions for King County floodplains with and without cities and tribal lands. Open water and areas above 4,000 feet in elevation were excluded. To estimate effective impervious area (EIA), urban total impervious area (TIA) was multiplied by 0.8 and non-urban TIA was multiplied by 0.4.
FloodplainsMajor Area % TIA % EIA % Forest Cover % TIA % EIA % Forest Cover
May 7.32% 2.93% 58.85% 7.32% 2.93% 58.85%
Cedar 2.32% 0.93% 69.31% 2.15% 0.86% 69.49%
SammamishIssaquah 6.22% 2.49% 66.87% 3.55% 1.42% 70.16%
Big Bear 12.88% 5.15% 54.04% 10.54% 4.21% 56.54%
Sammamish 13.85% 5.54% 55.01% 6.93% 2.77% 62.54%
SnoqualmieRaging 1.21% 0.48% 66.53% 1.18% 0.47% 66.41%
Patterson 5.15% 2.06% 55.92% 3.55% 1.42% 58.01%
Tolt 0.75% 0.30% 66.47% 0.74% 0.30% 66.52%
Cherry 1.69% 0.67% 65.64% 1.33% 0.53% 66.28%
Lower Snoqualmie 1.87% 0.75% 64.96% 1.39% 0.55% 65.79%
GreenUpper Green 0.61% 0.25% 61.17% 0.61% 0.25% 61.17%
Newaukum 6.79% 2.72% 25.75% 4.21% 1.68% 27.75%
Soos 17.02% 6.81% 38.97% 10.39% 4.15% 45.86%
Middle Green 1.33% 0.53% 58.53% 2.38% 0.95% 54.99%
Lower Green 6.62% 2.65% 50.40% 2.76% 1.10% 54.41%
WhiteBoise 5.28% 2.11% 51.05% 1.74% 0.70% 56.34%
White 1.36% 0.54% 72.38% 1.06% 0.42% 73.31%
Vashon 4.11% 1.64% 63.95% 4.11% 1.64% 63.95%
Grand Total 4.26% 1.70% 61.97% 2.22% 0.89% 64.56%
All lands Excluding City and Tribal Lands (no urban)
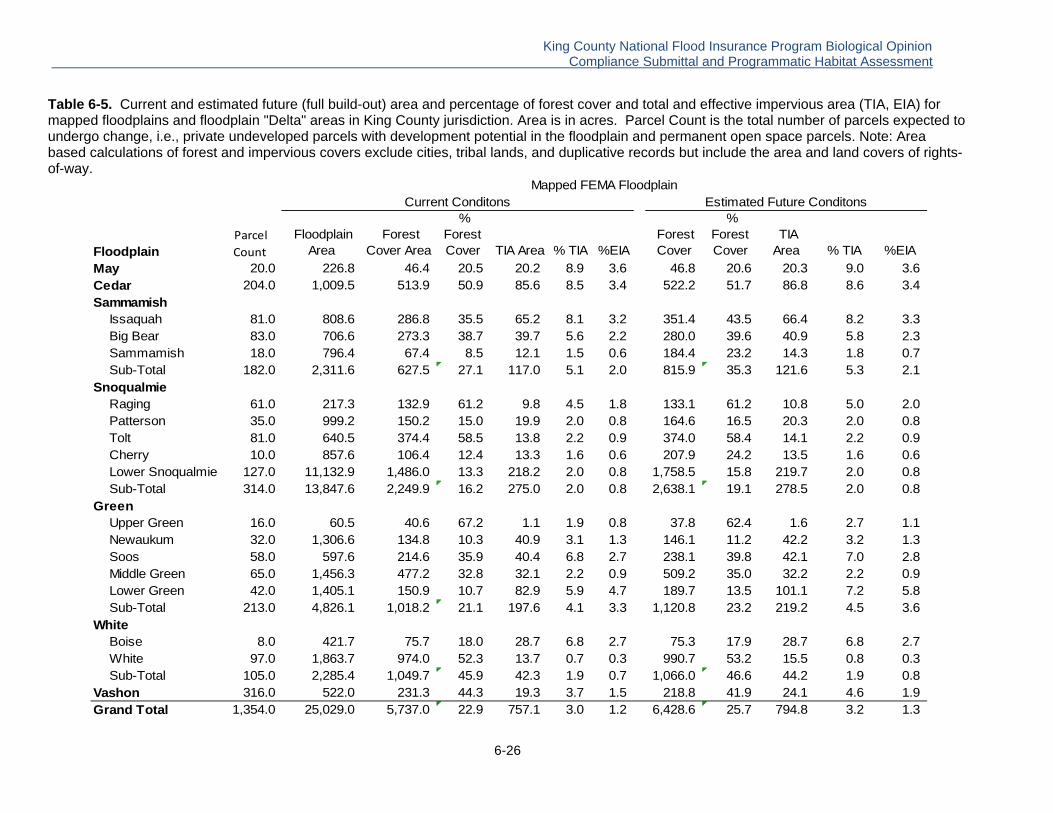
King County National Flood Insurance Program Biological Opinion . Compliance Submittal and Programmatic Habitat Assessment
6-26
Table 6-5. Current and estimated future (full build-out) area and percentage of forest cover and total and effective impervious area (TIA, EIA) for mapped floodplains and floodplain "Delta" areas in King County jurisdiction. Area is in acres. Parcel Count is the total number of parcels expected to undergo change, i.e., private undeveloped parcels with development potential in the floodplain and permanent open space parcels. Note: Area based calculations of forest and impervious covers exclude cities, tribal lands, and duplicative records but include the area and land covers of rights-of-way.
Floodplain Parcel
Count
Floodplain Area
Forest Cover Area
% Forest Cover TIA Area % TIA %EIA
Forest Cover
% Forest Cover
TIA Area % TIA %EIA
May 20.0 226.8 46.4 20.5 20.2 8.9 3.6 46.8 20.6 20.3 9.0 3.6 Cedar 204.0 1,009.5 513.9 50.9 85.6 8.5 3.4 522.2 51.7 86.8 8.6 3.4 Sammamish
Issaquah 81.0 808.6 286.8 35.5 65.2 8.1 3.2 351.4 43.5 66.4 8.2 3.3 Big Bear 83.0 706.6 273.3 38.7 39.7 5.6 2.2 280.0 39.6 40.9 5.8 2.3 Sammamish 18.0 796.4 67.4 8.5 12.1 1.5 0.6 184.4 23.2 14.3 1.8 0.7 Sub-Total 182.0 2,311.6 627.5 27.1 117.0 5.1 2.0 815.9 35.3 121.6 5.3 2.1
SnoqualmieRaging 61.0 217.3 132.9 61.2 9.8 4.5 1.8 133.1 61.2 10.8 5.0 2.0 Patterson 35.0 999.2 150.2 15.0 19.9 2.0 0.8 164.6 16.5 20.3 2.0 0.8 Tolt 81.0 640.5 374.4 58.5 13.8 2.2 0.9 374.0 58.4 14.1 2.2 0.9 Cherry 10.0 857.6 106.4 12.4 13.3 1.6 0.6 207.9 24.2 13.5 1.6 0.6 Lower Snoqualmie 127.0 11,132.9 1,486.0 13.3 218.2 2.0 0.8 1,758.5 15.8 219.7 2.0 0.8 Sub-Total 314.0 13,847.6 2,249.9 16.2 275.0 2.0 0.8 2,638.1 19.1 278.5 2.0 0.8
GreenUpper Green 16.0 60.5 40.6 67.2 1.1 1.9 0.8 37.8 62.4 1.6 2.7 1.1 Newaukum 32.0 1,306.6 134.8 10.3 40.9 3.1 1.3 146.1 11.2 42.2 3.2 1.3 Soos 58.0 597.6 214.6 35.9 40.4 6.8 2.7 238.1 39.8 42.1 7.0 2.8 Middle Green 65.0 1,456.3 477.2 32.8 32.1 2.2 0.9 509.2 35.0 32.2 2.2 0.9 Lower Green 42.0 1,405.1 150.9 10.7 82.9 5.9 4.7 189.7 13.5 101.1 7.2 5.8 Sub-Total 213.0 4,826.1 1,018.2 21.1 197.6 4.1 3.3 1,120.8 23.2 219.2 4.5 3.6
WhiteBoise 8.0 421.7 75.7 18.0 28.7 6.8 2.7 75.3 17.9 28.7 6.8 2.7 White 97.0 1,863.7 974.0 52.3 13.7 0.7 0.3 990.7 53.2 15.5 0.8 0.3 Sub-Total 105.0 2,285.4 1,049.7 45.9 42.3 1.9 0.7 1,066.0 46.6 44.2 1.9 0.8
Vashon 316.0 522.0 231.3 44.3 19.3 3.7 1.5 218.8 41.9 24.1 4.6 1.9 Grand Total 1,354.0 25,029.0 5,737.0 22.9 757.1 3.0 1.2 6,428.6 25.7 794.8 3.2 1.3
Mapped FEMA FloodplainCurrent Conditons Estimated Future Conditons

King County National Flood Insurance Program Biological Opinion . Compliance Submittal and Programmatic Habitat Assessment
6-27
Floodplain Parcel
Count
Delta Area
Forest Cover Area
% Forest Cover
TIA Area % TIA %EIA
Forest Cover Area
% Forest Cover
TIA Area % TIA %EIA
May 18 74.8 13.2 17.7 6.8 9.1 3.6 13.5 18.0 6.8 9.1 3.6 Cedar 115 309.1 104.2 33.7 36.5 11.8 4.7 107.4 34.7 37.1 12.0 4.7 Sammamish
Issaquah 47 240.8 57.1 23.7 23.7 9.8 3.9 87.8 36.5 23.9 9.9 3.9 Big Bear 55 234.7 75.8 32.3 11.1 4.7 1.9 77.9 33.2 11.8 5.0 1.9 Sammamish 7 527.8 37.4 7.1 3.7 0.7 0.3 99.7 18.9 3.7 0.7 0.3 Sub-Total 109 1,003.2 170.3 17.0 38.5 3.8 1.5 265.4 26.5 39.5 3.9 1.6
SnoqualmieRaging 9 11.0 7.1 64.5 0.2 2.1 0.9 7.4 67.4 0.4 3.9 0.9 Patterson 39 227.4 64.7 28.4 6.5 2.9 1.2 68.6 30.2 6.6 2.9 1.2 Tolt 59 125.1 39.3 31.4 2.9 2.3 0.9 39.7 31.8 2.9 2.3 0.9 Cherry 17 487.5 52.0 10.7 8.9 1.8 0.7 109.6 22.5 9.0 1.8 0.7 Lower Snoqualmie 33 1,316.9 229.8 17.5 39.6 3.0 1.2 251.8 19.1 40.1 3.0 1.2 Sub-Total 157 2,167.8 392.9 18.1 58.2 2.7 1.1 477.1 22.0 59.1 2.7 1.1
GreenUpper Green 13 10.3 4.8 46.8 0.1 0.7 0.3 4.5 44.1 0.1 0.7 0.3 Newaukum 31 556.9 35.2 6.3 17.9 3.2 1.3 38.2 6.9 18.5 3.3 1.3 Soos 44 203.1 58.2 28.7 16.4 8.1 3.2 65.9 32.4 17.1 8.4 3.2 Middle Green 26 50.9 10.5 20.7 1.7 3.4 1.4 12.2 23.9 1.7 3.4 1.4 Lower Green 23 174.6 11.1 6.4 27.5 15.7 12.6 25.5 14.6 29.2 16.7 12.6 Sub-Total 137 995.8 119.9 12.0 63.5 6.4 2.6 146.3 14.7 66.6 6.7 2.7
WhiteBoise 6 184.3 20.9 11.3 13.5 7.3 2.9 20.5 11.1 13.5 7.3 2.9 White 74 860.3 497.6 57.8 4.6 0.5 0.2 512.9 59.6 5.2 0.6 0.2 Sub-Total 80 1,044.6 518.4 49.6 18.1 1.7 0.7 533.4 51.1 18.7 1.8 0.7
Vashon 38 44.0 12.7 28.9 0.9 2.1 0.8 10.3 23.5 1.1 2.4 0.8 Grand Total 654 5,639.4 1,331.7 23.6 222.5 3.9 1.6 1,553.4 27.5 228.9 4.1 1.6
Current Conditons Estimated Future ConditonsNOAA BO Floodplain Delta

King County National Flood Insurance Program Biological Opinion . Compliance Submittal and Programmatic Habitat Assessment
6-28
Table 6-6. Area (acres) of three land covers (immature conifer, scrub-shrub and herbaceous) with potential for conversion to forest cover at the floodplain and regulatory buffer scales. Table 6-7a is for all rural-zoned lands. Table 6-7b shows land covers with agriculture-zoned land removed and Table 6-7c shows land covers for agriculture-zoned lands only, respectively.
6‐6a
Basin Immature Conifer Scrub/Shrub Herbaceous Flood Plain Total Immature Conifer Scrub/Shrub Herbaceous Reg. Buffer TotalMay 1.2 7.1 64.9 73.2 0.3 5.3 41.0 46.6
Bear 14.5 14.0 152.1 180.5 13.0 7.1 90.4 110.5
Boise 21.6 9.8 123.1 154.5 16.5 5.7 59.8 81.9
Cedar 31.8 35.8 98.2 165.8 21.6 10.3 28.5 60.3
Cherry 1.6 7.1 348.2 356.8 0.9 4.4 167.6 172.8
Issaquah 52.9 20.6 89.2 162.7 42.7 6.8 38.4 87.8
Lower Green 1.6 8.4 210.3 220.3 1.1 5.3 88.1 94.5
Lower Snoqualmie 70.5 171.3 4,270.9 4,512.7 35.1 66.5 1,439.2 1,540.8
Middle Green 9.6 8.6 238.3 256.4 5.9 1.9 60.6 68.4
Newaukum 8.4 38.4 477.7 524.6 6.7 23.7 256.8 287.3
Patterson 13.3 13.1 333.4 359.8 5.5 6.7 112.7 124.9
Raging 26.5 2.3 4.4 33.2 25.5 1.8 3.8 31.0
Sammamish 1.1 5.1 273.7 279.9 1.1 1.7 63.0 65.8
Soos 16.0 17.7 60.1 93.8 6.0 7.2 35.2 48.4
Tolt 130.1 6.5 33.5 170.0 89.9 3.0 8.6 101.4
Upper Green 14.9 0.8 0.3 16.0 11.8 0.8 0.3 12.9
Vashon 3.2 11.0 39.9 54.1 2.6 9.7 34.8 47.0
White 175.1 22.7 239.1 436.9 87.9 14.4 134.4 236.7
Grand Total 593.7 400.3 7,057.2 8,051.2 373.8 182.1 2,663.2 3,219.2
Flood Plain Scale KC Regulatory Buffer Scale

King County National Flood Insurance Program Biological Opinion . Compliance Submittal and Programmatic Habitat Assessment
6-29
6‐6b
Basin Immature Conifer Scrub/Shrub Herbaceous Grand Total Immature Conifer Scrub/Shrub Herbaceous Grand TotalMay 1.2 7.1 64.9 73.2 0.3 5.3 41.0 46.6
Bear 14.5 14.0 152.1 180.5 13.0 7.1 90.4 110.5
Boise 21.5 8.6 17.3 47.4 16.3 5.0 10.9 32.2
Cedar 31.4 35.1 95.5 162.0 21.6 10.3 28.4 60.2
Cherry 1.1 0.5 15.7 17.3 0.9 0.4 10.7 12.0
Issaquah 52.9 20.6 89.2 162.7 42.7 6.8 38.4 87.8
Lower Green 1.5 7.1 48.5 57.2 1.0 4.2 23.3 28.5
Lower Snoqualmie 62.5 50.1 457.6 570.2 31.4 17.2 129.7 178.3
Middle Green 8.1 4.4 24.0 36.6 4.6 0.6 7.0 12.3
Newaukum 6.3 14.9 101.6 122.8 5.4 8.3 62.8 76.5
Patterson 12.8 2.7 59.2 74.6 5.1 1.8 38.0 45.0
Raging 26.5 2.3 4.4 33.2 25.5 1.8 3.8 31.0
Sammamish 1.1 4.6 140.1 145.8 1.1 1.3 42.8 45.3
Soos 16.0 17.7 59.6 93.3 6.0 7.2 34.9 48.0
Tolt 129.5 5.1 13.3 147.8 89.7 2.6 4.6 96.9
Upper Green 14.9 0.8 0.3 16.0 11.8 0.8 0.3 12.9
Vashon 3.2 11.0 39.9 54.1 2.6 9.7 34.8 47.0
White 173.1 16.1 62.0 251.2 86.4 9.8 18.4 114.6
Grand Total 578.0 222.9 1,445.2 2,246.0 365.3 101.1 620.3 1,085.6
Flood Plain Scale ‐ Ag Zone Removed KC Regulatory Buffer Scale ‐ Ag Zone Removed
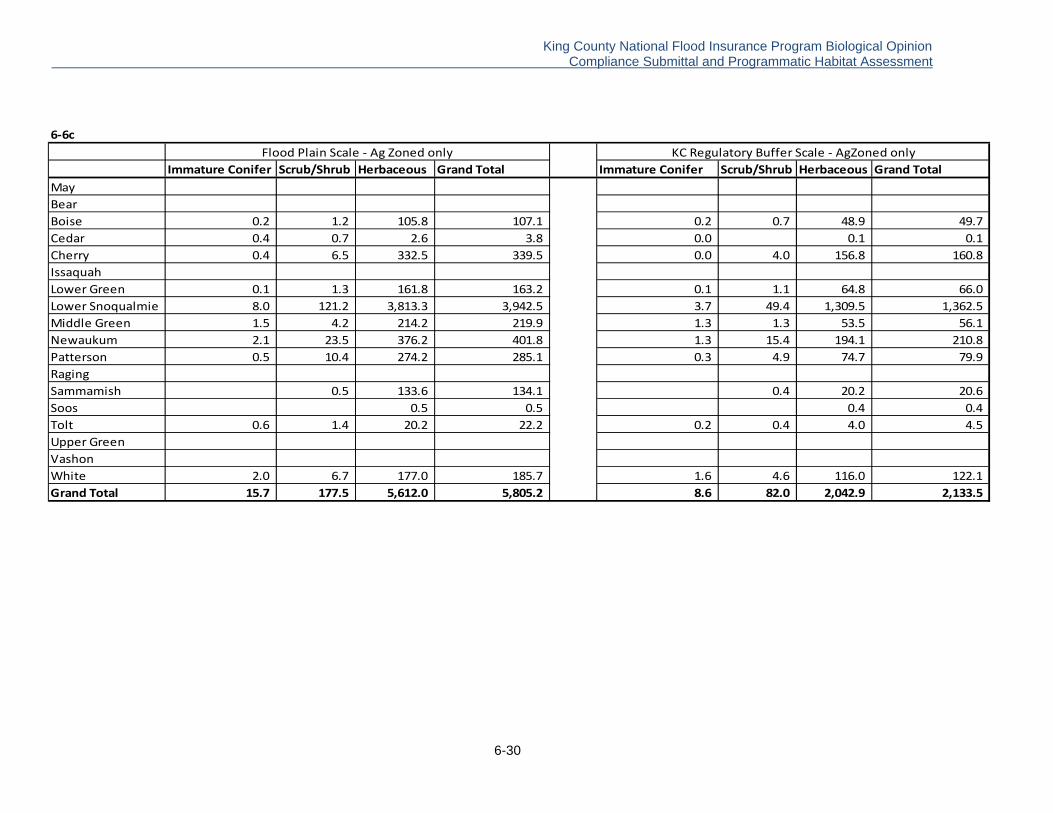
King County National Flood Insurance Program Biological Opinion . Compliance Submittal and Programmatic Habitat Assessment
6-30
6‐6c
Immature Conifer Scrub/Shrub Herbaceous Grand Total Immature Conifer Scrub/Shrub Herbaceous Grand TotalMay
Bear
Boise 0.2 1.2 105.8 107.1 0.2 0.7 48.9 49.7
Cedar 0.4 0.7 2.6 3.8 0.0 0.1 0.1
Cherry 0.4 6.5 332.5 339.5 0.0 4.0 156.8 160.8
Issaquah
Lower Green 0.1 1.3 161.8 163.2 0.1 1.1 64.8 66.0
Lower Snoqualmie 8.0 121.2 3,813.3 3,942.5 3.7 49.4 1,309.5 1,362.5
Middle Green 1.5 4.2 214.2 219.9 1.3 1.3 53.5 56.1
Newaukum 2.1 23.5 376.2 401.8 1.3 15.4 194.1 210.8
Patterson 0.5 10.4 274.2 285.1 0.3 4.9 74.7 79.9
Raging
Sammamish 0.5 133.6 134.1 0.4 20.2 20.6
Soos 0.5 0.5 0.4 0.4
Tolt 0.6 1.4 20.2 22.2 0.2 0.4 4.0 4.5
Upper Green
Vashon
White 2.0 6.7 177.0 185.7 1.6 4.6 116.0 122.1
Grand Total 15.7 177.5 5,612.0 5,805.2 8.6 82.0 2,042.9 2,133.5
Flood Plain Scale ‐ Ag Zoned only KC Regulatory Buffer Scale ‐ AgZoned only
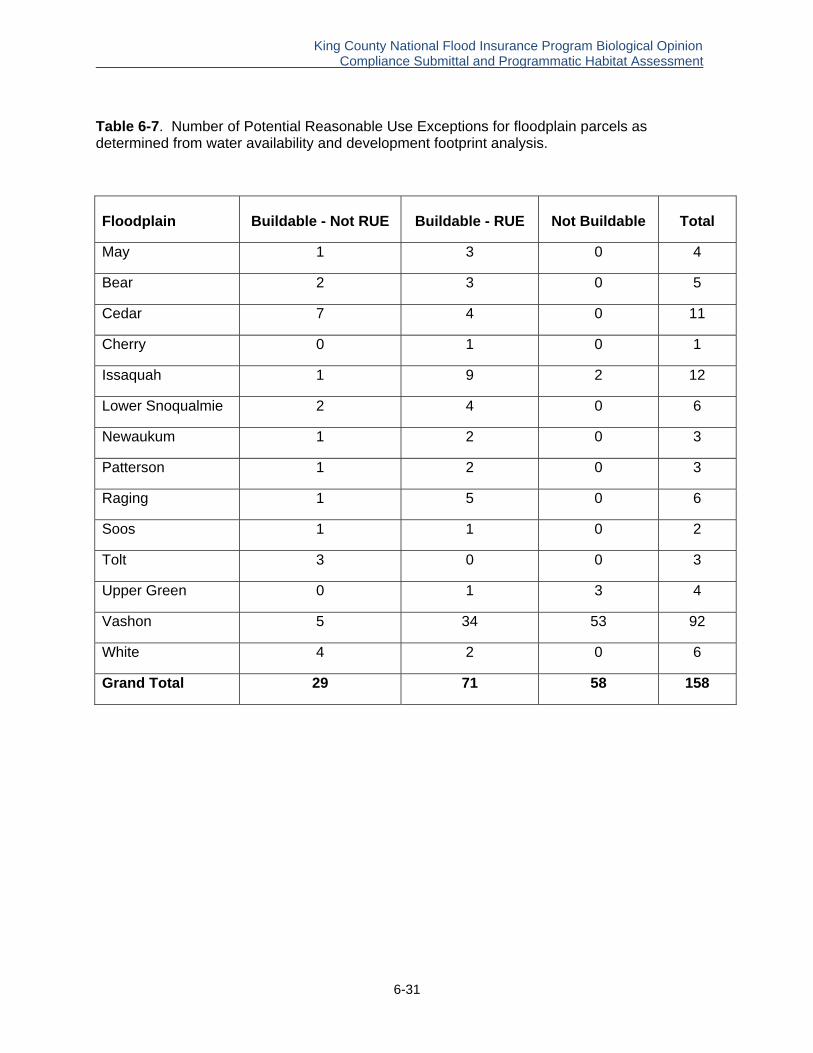
King County National Flood Insurance Program Biological Opinion Compliance Submittal and Programmatic Habitat Assessment
6-31
Table 6-7. Number of Potential Reasonable Use Exceptions for floodplain parcels as determined from water availability and development footprint analysis.
Floodplain Buildable - Not RUE Buildable - RUE Not Buildable Total
May 1 3 0 4
Bear 2 3 0 5
Cedar 7 4 0 11
Cherry 0 1 0 1
Issaquah 1 9 2 12
Lower Snoqualmie 2 4 0 6
Newaukum 1 2 0 3
Patterson 1 2 0 3
Raging 1 5 0 6
Soos 1 1 0 2
Tolt 3 0 0 3
Upper Green 0 1 3 4
Vashon 5 34 53 92
White 4 2 0 6
Grand Total 29 71 58 158

Chapter 7
Effects of Actions

King County National Flood Insurance Program Biological Opinion . Compliance Submittal and Programmatic Habitat Assessment
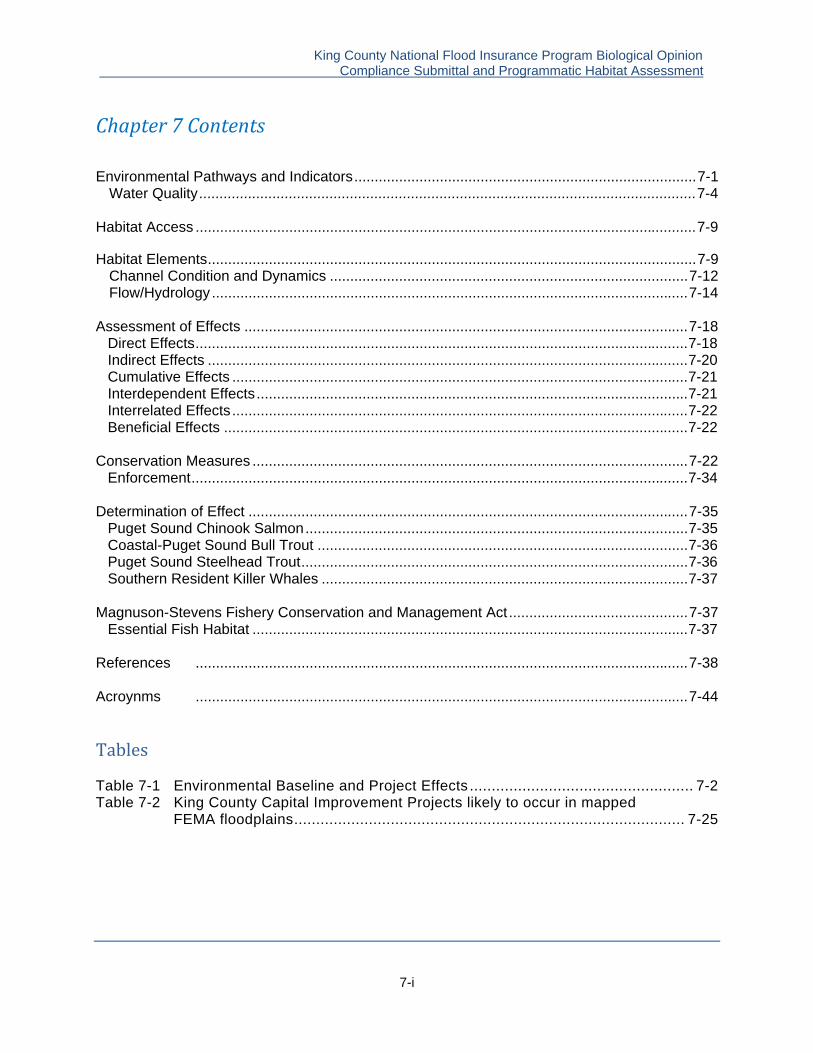
King County National Flood Insurance Program Biological Opinion . Compliance Submittal and Programmatic Habitat Assessment
7-i
Chapter 7 Contents Environmental Pathways and Indicators .................................................................................... 7-1
Water Quality .......................................................................................................................... 7-4 Habitat Access ........................................................................................................................... 7-9 Habitat Elements ........................................................................................................................ 7-9
Channel Condition and Dynamics ........................................................................................ 7-12 Flow/Hydrology ..................................................................................................................... 7-14
Assessment of Effects ............................................................................................................. 7-18
Direct Effects ......................................................................................................................... 7-18 Indirect Effects ...................................................................................................................... 7-20 Cumulative Effects ................................................................................................................ 7-21 Interdependent Effects .......................................................................................................... 7-21 Interrelated Effects ................................................................................................................ 7-22 Beneficial Effects .................................................................................................................. 7-22
Conservation Measures ........................................................................................................... 7-22
Enforcement .......................................................................................................................... 7-34 Determination of Effect ............................................................................................................ 7-35
Puget Sound Chinook Salmon .............................................................................................. 7-35 Coastal-Puget Sound Bull Trout ........................................................................................... 7-36 Puget Sound Steelhead Trout ............................................................................................... 7-36 Southern Resident Killer Whales .......................................................................................... 7-37
Magnuson-Stevens Fishery Conservation and Management Act ............................................ 7-37
Essential Fish Habitat ........................................................................................................... 7-37 References ......................................................................................................................... 7-38 Acroynms ......................................................................................................................... 7-44
Tables Table 7-1 Environmental Baseline and Project Effects ................................................... 7-2 Table 7-2 King County Capital Improvement Projects likely to occur in mapped
FEMA floodplains ......................................................................................... 7-25

King County National Flood Insurance Program Biological Opinion . Compliance Submittal and Programmatic Habitat Assessment
7-ii

King County National Flood Insurance Program Biological Opinion . Compliance Submittal and Programmatic Habitat Assessment
7-1
Chapter 7: EFFECTS OF ACTIONS The effects of implementing King County’s land use regulations in combination with the County’s many protective and restorative actions on baseline environmental conditions in Federal Emergency Management Agency (FEMA) mapped floodplains were evaluated for Puget Sound Chinook salmon, Puget Sound steelhead trout, coastal-Puget Sound bull trout, and Southern Resident Killer Whale (SRKW) populations in accordance with guidance documents provided by the National Marine Fisheries Service (NMFS) and the U.S. Fish and Wildlife Service (USFWS). These documents included: "Making Endangered Species Act Determinations of Effect for Individual or Grouped Actions at the Watershed Scale" (NMFS 1996), "A Guide to Biological Assessments" (NMFS 1999), and “A Framework to Assist in Making Endangered Species Act Determinations of Effect for Individual or Grouped Actions at the Bull Trout Subpopulation Watershed Scale" (USFWS 1998). Environmental criteria measured by the pathways identified by NMFS and USFWS to identify baseline environmental conditions within the project area are summarized in Table 7.1. As part of its permitting authority, King County issues permits for a wide range of actions, including some, such as construction, repair or replacement of levees, revetments, culverts, and bridges, that may occur in or near the water where an Endangered Species Act (ESA)-listed species or its habitat may be affected directly, indirectly, or as the result of cumulative effects. Some of these activities, particularly the larger, more impacting ones on navigable waters or that involve fill in a wetland, are likely to have a federal nexus (i.e., requires a federal permit and/or is federally funded), and a more detailed, project-level ESA review would be conducted prior to federal permit issuance. King County is cognizant of other agencies’ permit authority, but conducts its own permit review under various King County codes pertaining to land use planning and development, surface water and floodplain management, health and sanitation, etc. Where possible, the County coordinates permit conditions with State agencies, such as Washington Departments of Fish and Wildlife (WDFW) and Washington Department of Ecology (WDOE), but is not allowed to hold up issuance of permits for this purpose (P. Klein, King County, 2012, pers. comm.). Because of different timelines and approaches to permitting, the County generally does not hold up or coordinate with federal agencies. The following assessment pertains to all actions covered under the Counties land use codes described in Chapter 4 except for those projects requiring special use permits and for mining activities. For those, a separate assessment of ESA species’ effects will be required.
Environmental Pathways and Indicators The NMFS has prepared a matrix of pathways and indicators designed to summarize important environmental parameters affecting ESA-listed salmonids and levels of condition of each parameter (NMFS 1996). Each of the six overall pathways (major rows in the matrix) listed in Table 7-1 represents a significant pathway by which actions can potentially affect anadromous salmonids and their habitats. The original matrix divided the pathways into two types of indicators: (1) recommended general metrics with associated numeric values (e.g., "six pools per mile"), and (2) narrative descriptions of an overall condition (e.g., "adequate habitat refugia do not exist") for those indicators for which numeric data are unavailable or unreliable.
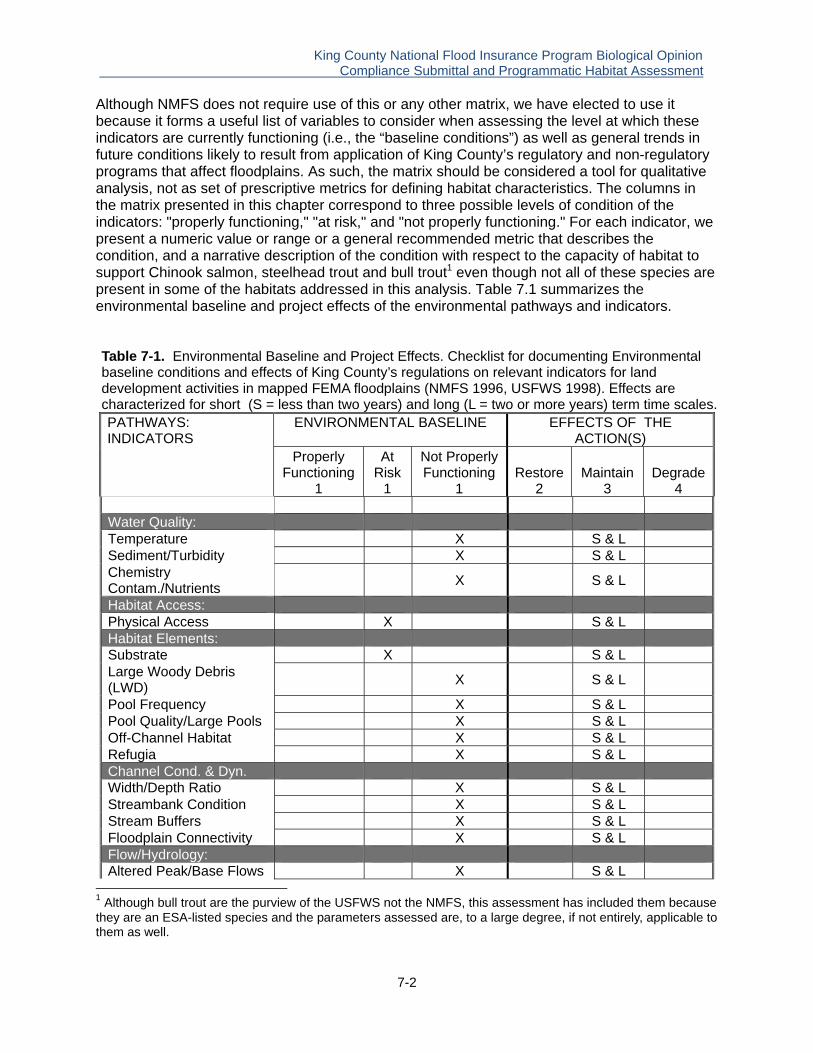
King County National Flood Insurance Program Biological Opinion . Compliance Submittal and Programmatic Habitat Assessment
7-2
Although NMFS does not require use of this or any other matrix, we have elected to use it because it forms a useful list of variables to consider when assessing the level at which these indicators are currently functioning (i.e., the “baseline conditions”) as well as general trends in future conditions likely to result from application of King County’s regulatory and non-regulatory programs that affect floodplains. As such, the matrix should be considered a tool for qualitative analysis, not as set of prescriptive metrics for defining habitat characteristics. The columns in the matrix presented in this chapter correspond to three possible levels of condition of the indicators: "properly functioning," "at risk," and "not properly functioning." For each indicator, we present a numeric value or range or a general recommended metric that describes the condition, and a narrative description of the condition with respect to the capacity of habitat to support Chinook salmon, steelhead trout and bull trout1 even though not all of these species are present in some of the habitats addressed in this analysis. Table 7.1 summarizes the environmental baseline and project effects of the environmental pathways and indicators. Table 7-1. Environmental Baseline and Project Effects. Checklist for documenting Environmental baseline conditions and effects of King County’s regulations on relevant indicators for land development activities in mapped FEMA floodplains (NMFS 1996, USFWS 1998). Effects are characterized for short (S = less than two years) and long (L = two or more years) term time scales. PATHWAYS: INDICATORS
ENVIRONMENTAL BASELINE EFFECTS OF THE ACTION(S)
Properly Functioning
1
At Risk
1
Not Properly Functioning
1
Restore
2
Maintain
3
Degrade
4 Water Quality: Temperature X S & L Sediment/Turbidity X S & L Chemistry Contam./Nutrients
X S & L
Habitat Access: Physical Access X S & L Habitat Elements: Substrate X S & L Large Woody Debris (LWD)
X S & L
Pool Frequency X S & L Pool Quality/Large Pools X S & L Off-Channel Habitat X S & L Refugia X S & L Channel Cond. & Dyn. Width/Depth Ratio X S & L Streambank Condition X S & L Stream Buffers X S & L Floodplain Connectivity X S & L Flow/Hydrology: Altered Peak/Base Flows X S & L
1 Although bull trout are the purview of the USFWS not the NMFS, this assessment has included them because they are an ESA-listed species and the parameters assessed are, to a large degree, if not entirely, applicable to them as well.

King County National Flood Insurance Program Biological Opinion . Compliance Submittal and Programmatic Habitat Assessment
7-3
PATHWAYS: INDICATORS
ENVIRONMENTAL BASELINE EFFECTS OF THE ACTION(S)
Properly Functioning
1
At Risk
1
Not Properly Functioning
1
Restore
2
Maintain
3
Degrade
4 Drainage Network Increase
X S & L
Watershed Conditions: Road Density/Location X S & L Disturbance History X S & L Riparian Reserves X S & L
1. These three categories of function and their thresholds are defined for each indicator in the Matrix of
Pathways and Indicators (NMFS 1996). 2. For the purposes of this checklist, "restore" means to change the function of an "at risk" indicator to
"properly functioning," or to change the function of a "not properly functioning" indicator to "at risk" or "properly functioning" (i.e., it does not apply to "properly functioning" indicators).
3. For the purposes of this checklist, "maintain" means that the function of an indicator does not change (i.e., it applies to all indicators regardless of functional level).
4. For the purposes of this checklist, "degrade" means to change the function of an indicator for the worse (i.e., it applies to all indicators regardless of functional level). In some cases, a "not properly functioning" indicator may be further worsened, and this should be noted.
The following discussion explains the rationale for scoring each of the indicators with respect to the environmental baseline conditions and the effects of the actions caused by implementation of King County’s land use regulations and non-regulatory programs in mapped FEMA floodplains. Depending on the environmental variable being assessed, the following effects determinations are based in part on land cover and land use future change analyses in Chapter 6 and on environmental benefits summarized in Chapter 5 and Appendix C of County programs that seek to protect and restore floodplains and their contributing watersheds. For example, it is expected that forest cover in regulatory buffers will gradually increase in height, biomass, and structural complexity through passive and active reforestation in areas currently vegetated with immature conifers, scrub/shrub vegetation and herbaceous land cover. As noted in Chapter 6, regulatory buffers in non-agricultural areas have the potential to provide 374 acres of new or regenerated forest cover based on the amount of existing immature conifer cover, and even more forest cover—potentially an additional 264 acres—if a portion of the areas that currently exhibit scrub-shrub and herbaceous land covers become forested in the future. Reforestation and a concomitant increase in the quality of existing forest cover in regulatory buffers contribute to the gradual improvement of many of the conditions represented by the pathways and indicators evaluated in the following discussion. Similarly, Chapter 5 summarizes King County’s major actions that contribute to the protection and restoration of the County’s floodplains over and above the regulatory program summarized in Chapter 4. These include Transfer of Development Rights (TDR) and open space acquisition programs that protect high ecological value lands in their natural condition. Where these lands were developed in the past, it is expected that conditions should gradually improve as vegetation grows and matures. Other programs, such as Current Use Taxation, Farmland Preservation, and the Public Benefits Rating System, help to prevent future impacts from high
King County National Flood Insurance Program Biological Opinion . Compliance Submittal and Programmatic Habitat Assessment
7-4
impact land uses by preserving existing relatively low impact land uses, such as forestry and farming. These programs sometimes include stewardship, restoration activities and best management practices (BMPs) to reduce the impact of the existing use, but in many cases the baseline conditions within individual parcels are unlikely to change in a substantial way because existing land uses such as farming will continue in perpetuity. King County has a substantial program for implementing Capital Improvement Projects (CIPs) specifically aimed at aquatic habitat and floodplain protection and restoration. In many cases these non-regulatory actions combined with the County’s regulatory protections for critical areas extending beyond mapped floodplains will likely provide additional protective and restorative benefits for floodplains, but these benefits may not be apparent for years or decades because of the persistent legacy of past land uses. Because of this, the baseline condition of all of the indicators has been assessed as “not properly functioning” or “at risk.” In order to make this assessment as realistic as possible, we postulate that these conditions will be maintained over the short term, and in some cases the long term. Even though the general trend for future habitat conditions is modestly positive, it will likely take many years or decades for conditions to change to the point where they could definitely be considered “restored.”
Water Quality Temperature. Water temperature is perhaps the most studied physical parameter related to fish ecology and physiology. Intact river ecosystems are typically highly structurally diverse in terms of mainstem, off-channel and riparian habitats that exhibit numerous contiguous patches of cold water, especially in the summer months. Highly altered river systems lack structural complexity and contain relatively small and infrequent patches of cold water (McIntosh et al. 1995). Several recent reviews describe methodologies for determining optimal temperatures for a variety of fish species, including salmonids (Oregon DEQ 1995, Spence et al. 1996, Berman 1998, McCullough 1999, NMFS 1999). Natural and anthropogenic fluctuations in water temperature can induce a wide variety of behavioral and physiological responses in salmonids, including those involving feeding, growth, resistance to disease, reproductive success, competitive behavior, predator avoidance and migration. Temperature also influences the productivity of lower trophic level algal and macroinvertebrate communities that support higher trophic level organisms, including fish (Bestcha et al. 1987). While water temperature varies both spatially and temporally in natural river systems, habitat heterogeneity allows fish to adapt to temperature changes by seeking out and occupying temperature refugia. Bjornn and Reiser (1991) have compiled information on the general range of upper, lower and preferred temperatures for several salmonid species. Chinook, coho, sockeye and chum salmon prefer temperature within the 12 to 14o C range, while steelhead trout and bull trout prefer somewhat cooler water, ranging from 10 to 13o C and 9 to 13o C, respectively. Lower lethal, upper lethal and preferred temperatures for rearing salmonids have been reviewed by a number of workers (Bell 1986, Bjornn and Reiser 1991, McCullough 1999). Low lethal temperatures for salmonid species range from 0o C for steelhead to 3.1o C for sockeye; high lethal temperatures range from 22.8o C for cutthroat trout to 28.8o C for coho. Selong et al. (2001) reported lethal temperatures for bull trout of 20.98o C and 23.58o C for 60-day and seven-day exposures, respectively. Dunham et al. (2003) modeled the effects of temperature on bull trout, and predicted that although bull trout may be present at potentially lethal temperatures, the probability of occurrence is relatively low. There is ample evidence that water temperature is not properly functioning for listed salmonids in many if not most of the County’s mapped FEMA floodplains. In the mainstem Snoqualmie River, for example, high temperature during late summer is the most prevalent
King County National Flood Insurance Program Biological Opinion . Compliance Submittal and Programmatic Habitat Assessment
7-5
water quality problem, and high summer temperatures extend well upstream of intensively developed areas in nearly all of the major tributaries to the Snoqualmie, even though these subwatersheds are largely forested (Kaje 2009). During mid- to late summer, water temperatures in the lower Green River frequently exceed the temperature criteria for Class A waters set forth in the state water quality standards (Chapter 173-201A WAC), and sometimes climb into the upper lethal range for salmonids. Staff of the Muckleshoot Indian Tribe and King County Surface Water Management Division have recorded daily high temperatures ranging from 22 to 24.5o C at Bicentennial Park at Rivermile (RM) 13.1 in Tukwila over a several day period during mid-July in 1995. Temperatures during the same time period were between 20 and 22.5o C at North Green River Park at RM 27.0 (H. Coccoli, pers. comm.). Similar exceedences of state water quality standards in the lower Green River are reported in Grette and Salo (1986), and Fishery Sciences, Inc. (1984). For both Soos and Newaukum Creeks, the two major Green River tributaries with mapped FEMA floodplain, a recent assessment found many violations of Washington State’s temperature standard (Latterell et al. 2012). The reasons for high temperatures appear to be a combination of natural summer low flow conditions compounded by artificial surface and ground water withdrawals within the basin and lack of shade along many mainstem and tributary channels from the headwaters to the estuary. Further, most floodplains and associated channels are inherently more prone to elevated temperature due to their low elevation, low gradient and, for the Sammamish River, draining Lake Sammamish’s warm surface waters. The effect of past land use and regulations on current riparian conditions and resulting effect on temperature may be offset somewhat through implementation of the County’s most recent (2005) set of aquatic area buffers which, for waters with fish or fish-bearing potential, include a minimum buffer width of 165-foot, measured from the Ordinary High Water Mark (OHWM) and which expand to include associated wetlands and steep slopes. Visual inspection of the Washington Department of Natural Resources’ (WDNR) tree growth site class maps (site class assesses local conditions to estimate the potential height of a 100-year old tree, see http://fortress.wa.gov/dnr/app1/fpars/viewer.htm) indicates the County’s floodplains are roughly equal proportions Class II and III sites. Based on 100-year potential, this would result in an average site potential tree height (SPTH) of 155 feet (see Appendix A of this report for more discussion of the SPTH concept, effectiveness of various buffers widths and basis for the County’s buffer widths). The SPTH within the County’s floodplains is likely somewhat less than 155 feet because the County floodplains have no Class I sites (Bill Loeber, King County Forester, pers. comm.), where much larger trees would be expected, and also because the county’s floodplains often have a high proportion of non-coniferous trees, such as red alder, black cottonwood and big leaf maple, which do not grow as tall as conifers. In any event, to the extent mature riparian forest vegetation can provide shade, the County’s aquatic area buffers are wide enough to grow and support large mature trees and, therefore, to provide the full potential for vegetation-based shading to occur. For the county’s largest rivers, such as the lower Snoqualmie and Green Rivers, which are hundreds of feet wide in places, the height of a mature tree equivalent to one SPTH is likely insufficient to fully shade the channel. Furthermore, in pre-settlement times the riparian zone along these larger rivers was a mosaic of coniferous and deciduous trees, often dominated by the latter (Collins et al. 2003), so naturally they would not have been as shaded as smaller channels where conifers would have dominated. For smaller channels, however, a SPTH would be expected to be sufficiently wide to support forest vegetation to provide 100 percent shading for protection of water temperature based on vegetation effectiveness curves (King County 2004).
King County National Flood Insurance Program Biological Opinion . Compliance Submittal and Programmatic Habitat Assessment
7-6
In many places both inside and upstream of mapped floodplains, King County’s regulatory 165-foot wide buffers, which expand to include steep slopes and associated wetlands, are vegetated with immature coniferous, scrub-shrub and herbaceous land covers, that in many areas, have at least some potential to become mature forest cover, thereby providing increased shade and temperature relief for associated aquatic areas beyond current conditions. A notable exception to this generalization is agricultural and other developed lands where existing riparian land uses are unlikely to change in the foreseeable future. Across all rural zoned floodplain lands, there are 594 acres of immature conifer, of which 374 acres (63 percent of total) are outside agricultural zoned lands (Chapter 6, Table 6-6). Upstream of floodplains there are extensive amounts of riparian buffer with potential for increased forest cover and shade. Considering only mapped coho streams (from WDFW Salmonscape database) upstream of mapped floodplains, there are some 8,000 acres of regulatory 165-foot wide buffer along streams that empty into and contribute to the condition of mapped floodplains. Many if not most of these riparian areas are in an immature forest condition due to past timber harvesting and other activities. The County’s regulations will require these riparian areas to grow and reach their full potential as mature forest where natural conditions allow and where existing uses do not preclude. Furthermore, forest practices are now guided by the National Oceanic and Atmospheric Administration (NOAA)-WDNR Forest and Fish Habitat Conservation Plan (HCP), which has recovery of ESA-listed species and salmon recovery as a primary goal. As a result, conditions should improve on those lands as well. Additionally, the County has permanently protected many timber lands for water quality, fish and wildlife, low impact recreation and sustainable timber production (see Chapter 5). The County also requires substantial, but narrower (65 feet versus 165 feet) buffers on many small (less than two-foot wide) non-fish-bearing streams for protection of many small, but cumulatively important headwater streams. In addition, King County variable-width wetland buffers that in some cases extend up to 300 feet in width provide additional potential for future increases in shade due to growth of riparian vegetation over time. The cumulative effect of these actions represents additional potential for growth and maturation of riparian forests that should provide temperature relief for streams that flow into the County’s regulated floodplains. However, these immature riparian buffers will not likely grow tall enough to provide a significant amount of shade to attenuate stream temperatures for a decade or more, depending on age and height of existing trees. Therefore, while there is trajectory (over decades) of improving riparian condition that should result in improved water temperatures, temperatures are expected to be maintained over the short and long term. Sediment/Turbidity. In a properly functioning system, gravelly sediment provides suitable substrate for salmonid incubation, food source production and cover from predators in moderate-gradient river reaches. The beds of most of King County’s floodplain streams and marine nearshore areas are naturally composed of a mix of coarse gravels and fine sediments (small gravels, sand, silt and organic particles). When sediment regimes are altered by excessive inputs of fines such as from landslides, damaging forest practices, sloppy construction practices and urbanization; or by disruption of sediment transport due to dam construction, water diversions and large scale water withdrawals, fish habitat degradation results. Fine sediment deposition into gravelly riffle areas can reduce salmonid reproductive success by decreasing oxygen penetration into the interstitial spaces within redds, and/or by physically trapping incubating salmonid eggs and alevins. Fine sediment may also fill pools, thereby decreasing the available volume of pool rearing habitat. Excessive fine sediment deposition can also disrupt benthic invertebrate production, thereby reducing the available food supply for salmonids. Finally, fine sediment can adversely affect the delicate gill surfaces of
King County National Flood Insurance Program Biological Opinion . Compliance Submittal and Programmatic Habitat Assessment
7-7
salmonids, interfering with respiration, as well as decrease light penetration into the water column, making it harder for juvenile fish to locate and successfully prey upon food resources. Sediment and turbidity conditions in many if not most of King County’s streams, rivers and marine shorelines within floodplains are not properly functioning. In addition to extensive historic land clearing and development, sediment and turbidity have been altered by diversions, dams, bank hardening and construction of levees, revetments, groins and bulkheads. For example, the lower Green-Duwamish River was heavily altered by the diversion of 75 percent of the historic sediment supply from the White and Black/Cedar Rivers in the early 20th century and, more recently, by construction and operation of the Howard A. Hanson Dam (HHD), which was completed in 1961. Spawning sized gravels that used to exist down to at least RM 27.0 and in an alluvial fan that used to exist at the mouth of the Black River at RM 11.0 are diminished or degraded because of disruption of coarse sediment supply and siltation due to lower water volumes and velocities resulting from these diversions. Hence, spawning and rearing habitat has decreased in quantity and quality compared to historic levels. Comparable dam and diversion-related impacts have occurred in the lower Cedar River because of construction of Seattle Public Utilities water supply infrastructure upstream from Landsburg, and the diversion of the lower four miles of the river away from its former outlet, the Duwamish River, into the constructed channel that conveys it into Lake Washington in Renton. Since the listing of Puget Sound Chinook salmon in 1999, King County has required mitigation to prevent adverse impacts of impervious surfaces, thereby helping maintain stream and wetland hydrology, and prevent sedimentation and turbidity within floodplains. To help ensure proper application of these protective measures, drainage review is required for any allowed activity within or adjacent to a floodplain, stream, lake, wetland, closed depression or other critical area as defined in K.C. 21A.24. Additionally, King County prohibits or severely limits development in erosion, steep slope and landslide hazard areas. To the extent that these hazard areas are within or adjacent to the floodplain, strict limits to their development potential provides added floodplain protection. As the County’s regulations and other protections and restoration efforts are implemented, it is expected that development-related sedimentation and turbidity problems will gradually decrease as forest vegetation grows in vegetated buffers and geomorphic surfaces upslope from floodplains. Although the direction (trajectory) is toward a better condition, the rate and magnitude of change are uncertain and may not shift conditions sufficiently to meet the criteria for being considered “restored.” Therefore, sediment and turbidity are expected to be maintained in both the short and long term. Chemical Contamination/Nutrients. Properly functioning riverine ecosystems do not exhibit chemical contamination and are characterized by low to moderate levels of nutrients. High levels of chemical contaminants such as metals, hydrocarbons and pesticides reduce egg and alevin survival and are toxic to juvenile and adult salmonids. Even low concentrations of such substances can induce physiological stress, alter primary and secondary production and reduce biodiversity (Seiler 1989, Karr 1991, Nelson et al. 1991, Norris et al. 1991). High nutrient loads can cause eutrophication of sluggish or stagnant waters, and increase primary and secondary production, leading to anoxia during extreme algal blooms (Warren et al. 1964, Bothwell 1989). Non-ionized ammonia is possibly toxic to eggs and juveniles at high concentrations (Triska et al. 1984, Gregory et al. 1987, Bisson et al. 1992). King County’s floodplains are subject to numerous sources of chemical contamination and nutrients, including stormwater runoff from urban, suburban and rural landscapes, and nutrients

King County National Flood Insurance Program Biological Opinion . Compliance Submittal and Programmatic Habitat Assessment
7-8
(especially phosphorus and nitrogen) from lawns, golf courses and agricultural areas. In addition, positively charged ionic compounds such as phosphates and nitrates can adhere to fine soil particles that enter the river from slumping and eroded riverbank surfaces. As a result, many if not most of King County’s floodplain waterbodies are at risk for chemical contamination/nutrients and not properly functioning. The potential for significant chemical contamination and nutrient inputs is avoided or minimized and mitigated through regulations that directly address erosion, sediment and stormwater impacts and storage of chemicals. In addition, added protection is provided by filtration from buffers greater than one SPTH, a distance generally sufficient to effectively filter most chemical contamination/nutrients effects (King County 2004). As noted earlier, buffer effectiveness can be compromised where buffer slopes are steep and flows can become concentrated and short-circuit the buffer (Liquori et al. 2008). King County’s floodplains and their buffers are generally on flat or gently undulating terrain, thus floodplain buffers would be expected to more effective than buffers on steeper slopes. The filtration benefit of vegetated buffers is expected to increase as vegetation matures and biomass increases over time. Furthermore, as mentioned above, since the listing of Puget Sound Chinook salmon in 1999, King County has required mitigation to decrease adverse impacts of runoff from impervious surfaces. In addition to regulatory actions, King County also operates a Flood Buyout and Elevation Program that involves two approaches to reducing public health and safety risks to residents and property owners living in flood hazard areas of unincorporated King County. Buyouts entail the voluntary sale to King County of flood-prone properties and structures. Buyouts are appropriate in areas of deep, fast-moving water, such as those in the floodway, and areas threatened by serious bank erosion. Buyouts provide a permanent solution to the risks and damages of repetitive flooding and significantly reduce the public costs of the County, state and federal agencies associated with evacuations, providing emergency shelters, temporary housing and debris removal. Buyouts also expand flood storage and conveyance, attenuate water velocities and restore permanently protected, vegetated open space within floodplains. Elevations involve assisting property owners with the costs of raising the finished floor of a home above the 100-year elevation, substantially reducing the threat of future damage and the release of toxic chemicals and nutrients. Elevation projects are more appropriate in areas that experience slower moving floodwaters. Since 1990, King County has elevated 43 houses in floodplains, thereby reducing the risk of agricultural and household chemicals being swept into floodwaters and reducing chemical and nutrient contamination. Approximately 25 additional homes will be elevated in the near future through approved or pending flood mitigation grants from FEMA. The combination of King County’s regulations and CIPs is expected to improve the trajectory (i.e., decrease over time) of chemical contamination and nutrients due to (1) decreases in soil erosion and deposition of river-borne sediments (2) fewer releases of household and agricultural chemicals during floods and (3) increased filtering and uptake of nutrients and chemical contaminants by maturing riparian vegetation within wide protected buffers, although buffers in areas of on-going agriculture will typically not be restored fully. Although the direction toward a better condition is likely, the rate and magnitude of change are uncertain and may not shift conditions sufficiently to meet the criteria for being considered “restored.” Thus chemical contamination and nutrients are expected to be maintained in both the short and long term.
King County National Flood Insurance Program Biological Opinion . Compliance Submittal and Programmatic Habitat Assessment
7-9
Habitat Access Physical Access. Physical access is considered at risk due to past actions that have left a legacy of artificial blockages such as culverts and flapgates. Actions that may block or impede fish movement in and out of habitats are prohibited by King County’s and Washington State’s regulations. Washington State hydraulic project approvals (HPAs) and, in most cases, federal permits are required for in-water projects that potentially affect fish habitat and access such as bridges and culverts. King County has invested tens of millions of dollars on repair and replacement of undersized culverts and bridges, typically done at the same time as public facilities, such as roads or flood control structures, are replaced or repaired. Where feasible, such projects are designed to also restore or enhance the natural flow of water, sediment and woody debris thereby restoring ecological processes as well. The King County Roads Maintenance Program prioritizes endangered salmon and in its culvert maintenance and modification program. Between 1999 and 2010, they have removed or modified over 95 roads crossings and restored or improved fish passage to almost 77 miles of stream throughout the county (R, Fritz, King County, pers. comm., 2011). Despite the many improvements in providing physical access, there still exists a range of impediments that will take time to repair. Therefore, although the trajectory is toward a better condition, the rate and magnitude of change is uncertain and may not shift conditions sufficiently to meet the criteria for being considered “restored.” Thus physical access is expected to be maintained in both the short and long term.
Habitat Elements
Substrate. In a properly functioning river or marine nearshore ecosystem, storage, transport and deposition of sediment is an important habitat sustaining process. In rivers and streams, suitably sized, clean gravel provides a quality substrate for salmon egg incubation, food source production and cover from predators. In marine nearshore environments, proper sediment regimes support the reproduction and feeding of forage fishes that are a critical prey base for salmonids. When sediment recruitment and transport is disrupted or perturbed by impoundments, channel diversions, mass wasting and pervasive bank erosion, or bank armoring, habitat degradation results. Chronic bank erosion of fine sediments and their instream deposition can reduce egg and alevin survival, reduce primary and secondary productivity, and interfere with feeding, behavioral avoidance and social organization (Bisson and Bilby 1982, Berg and Northcote 1985, Everest et al. 1987, Chapman 1988). Sediment from mass failures and landslides can result in these same effects, as well as fill in pools and induce channel migration (Beschta 1978, Cederholm et al. 1981, Everest et al. 1987, Swanson et al. 1987, Chapman 1988). Substrate is currently at risk within most mapped floodplains because of a wide range of historic land development activities as well as placement of flood control facilities, armoring of marine shorelines and construction of major dams (e.g., the HHD, South Fork Tolt, Cedar Masonry Dam) and diversions (e.g., White River from the Green into the Puyallup, and the Cedar River from the Black and Duwamish Rivers into Lake Washington). These actions have altered the availability and routing of sediment as well as hydrologic regimes and vegetation patterns that affect the transport and storage of sediments. Substrate is also at risk in floodplains because of fine sediment from past logging, land development and agricultural practices. These actions tend to increase proportion of fines while decreasing the proportion of the larger gravel and cobble sized particles in sediment.
King County National Flood Insurance Program Biological Opinion . Compliance Submittal and Programmatic Habitat Assessment
7-10
Except in limited locations where needed during flood emergencies or for the protection of public safety, critical infrastructure such as roads and utilities, primary dwelling units, accessory dwelling units and accessory living quarters, King County’s regulations generally prohibit new bank armoring or facilities that could further degrade substrates. Furthermore, many flood protection CIPs entail removal of large volumes of rock armoring and its replacement with bio-engineered treatments including vegetation and large wood. Additionally, hydrologic regimes should also be restored somewhat due to stormwater and erosion and sediment controls and wider buffers than have ever been required historically. Despite many improvements, there still exists a range of impediments that will take time to remove or repair to achieving properly functioning conditions for sediments. Therefore, although the trajectory is toward a better condition, the rate and magnitude of change is uncertain and may not shift conditions sufficiently to meet the criteria for being considered “restored.” Thus substrate is expected to be maintained in both the short and long term. Large Woody Debris (LWD). LWD is considered not properly functioning in the County’s floodplains due to a history of removal and loss of riparian forest. LWD is a critical component of salmonid habitat (Swanson and Leinkaemper 1978, Bryant 1983, Harmon et al. 1986, Bisson et al. 1987, Van Sickle and Gregory 1990, Bilby and Ward 1991, Gregory et al. 1991, Peters et al. 1998). As a result of a long history of logging and wood removal from streams and beaches, large wood volumes in the County’s streams and marine shorelines is greatly reduced compared to pre-settlement conditions. For example, while the middle Green River contains much more LWD than the lower river; it is deficient of LWD compared to less-altered river systems (Elosegi and Johnson 2003). A survey in the early 1990s of the middle Green River between the SR-18 and SR-169 bridges, found only 376 pieces (29.6 pieces per mile) of LWD and three logjams (Fuerstenberg et al. 1994) within the survey reach. A survey conducted in 2003 of the lower Green River from RM 6.5 to RM 32 found a total of 429 pieces (16.5 pieces per mile), approximately 75 percent of which had been installed during levee and revetment repair projects (King County 2004). It has been estimated that up to 80 percent of the riverbanks below SR-18 (Fuerstenberg et al. 1996) have been developed, with attendant removal of LWD sources. Due to the relative paucity of LWD further upstream in the system, and the pervasive lack of riparian forests along the lower Green River, current recruitment of LWD into the lower river is negligible. Although the middle Green River is among the County’s more managed and degraded aquatic habitats with respect to LWD, many other reaches of King County’s large rivers and marine nearshore environments exhibit similar low levels of large wood. A significant goal of King County’s buffers along fish-bearing waterbodies is to provide for the long term growth and recruitment of LWD. King County’s regulations require a combination of buffers and building setbacks that are greater than one SPTH from the OHWM. A buffer width of one SPTH is sufficient to provide for LWD recruitment (King County 2004). Therefore, as trees grow and mature in regulatory buffers, LWD should accumulate in floodplains and associated aquatic areas. Concerns with LWD management include impacts to property and recreational uses. As LWD is recruited, transported and accumulated it creates the potential for banks to erode and shorelines to move, at times impacting developed private property or critical public infrastructure such as roads and utilities. More recently, concern over safety of river recreationists has become an issue, particularly in several large rivers in King County that are frequently used by river recreationists. In these places, on occasion LWD, both naturally recruited and artificially placed, is sometimes repositioned or removed in accordance with WDFW permit conditions and mitigation requirements to protect public safety and prevent damage to critical public
King County National Flood Insurance Program Biological Opinion . Compliance Submittal and Programmatic Habitat Assessment
7-11
infrastructure or private property. In contrast to historic river management programs that removed LWD in a wholesale fashion following major storms, or when property or public facilities were even remotely threatened, King County’s current approach is to retain natural wood to the maximum extent practicable where it can safely co-exist with other uses. Despite many efforts to restore LWD since the early 1990s, there is a considerable LWD deficit that will likely take many years or many decades to restore to the levels considered to meet properly functioning conditions. Therefore, although the trajectory is toward a better condition, the rate and magnitude of change is uncertain and may not shift conditions sufficiently to meet the criteria for being considered “restored” within the short or long term. Thus LWD is expected to be maintained in both the short and long term. Pool Frequency. Pool frequency within most of King County’s rivers and streams is not properly functioning as a result of a combination of factors including a lack of natural pool-forming elements such as LWD that contribute to the formation and maintenance of deep, structurally complex pools, as well as the effects of bank armoring and alteration of flow and sediment regimes by land development, dams and diversions. Where channels and banks are constrained by existing development, bank armored flood control facilities, etc., it is likely that the County’s regulations will have little or no net effect on pool frequency. Along natural, unarmored, undeveloped, and newly restored stream and river banks it is likely that the county’s regulations will increase pool frequency as LWD is recruited and banks and channels respond. While many of King County’s river channels are extensively armored, many others are not. Furthermore, King County has recently completed several projects to remove or set back bank armored levees and revetments, thereby increasing the potential for improving pool frequency. Despite these actions, there remain many impediments that will likely take years or many decades to remove in order to restore to pool frequency to properly functioning conditions. Therefore, although the trajectory is toward a better condition, the rate and magnitude is uncertain and may not shift conditions sufficiently to meet the criteria for being considered “restored.” Thus pool frequency is expected to be maintained in both the short and long term. Pool Quality. Pool quality is not properly functioning in most of King County’s floodplain streams largely because of extensive areas of riprap lining stream and river channels and lack of complex instream and riparian cover normally provided by LWD and overhanging vegetation in well-functioning river systems. In addition, where sediment loads are high, pool depths are reduced. For example, in the low-gradient, lower Green River, pools are lined with riprap covered by a thick layer of fine sediment and flocculent organic material (Anchor Environmental 2004). King County’s regulations and habitat CIPs which employ bioengineering techniques, including incorporation of LWD, to improve fish habitat are expected to improve pool quality due to increases in LWD, reductions in release of fine sediment into stream and river channels, and habitat restoration resulting from removal or setting back of flood control facilities, such as in the Cedar Rapids natural area on the lower Cedar River, the mouth of the Tolt River and at Chinook Bend on the Snoqualmie River directly downstream of the Tolt River confluence. Regardless, there remain many impediments that will likely take years or decades to remove in order to restore pool quality to properly functioning conditions. Therefore, although the trajectory is toward a better condition, the rate and magnitude of change is uncertain and may not shift conditions sufficiently to meet the criteria for being considered “restored.” Thus pool quality is expected to be maintained in both the short and long term. Off-Channel Habitat. Off-channel habitat is currently not properly functioning in most mapped floodplains in King County because of extensive historic channelization, bank hardening by flood control facilities and bulkheads, blockages of tributaries by flapgates, and the filling and conversion of off-channel habitats to developed land uses. King County’s current regulations
King County National Flood Insurance Program Biological Opinion . Compliance Submittal and Programmatic Habitat Assessment
7-12
prohibit loss or adverse modification of off-channel habitats. Existing off-channel habitats are further protected by King County’s clearing and grading regulations, stormwater controls and 165-foot-wide buffers. Where they are part of a larger high-value wetland complex, off-channel habitats may receive even wider buffers—up to 300 feet—than would be required for salmonid presence alone. A considerable number of habitat CIPs have been accomplished within the past two decades, and many similar projects that will restore or reconnect off-channel floodplain habitats are included in adopted King County budgets and six-year capital programs. Despite these actions to reconnect and restore off-channel habitats, there remain many impediments that will likely take years or decades to remove in order to restore off-channel habitats to properly functioning conditions. Therefore, although the trajectory is toward a better condition, the rate and magnitude of change is uncertain and may not shift conditions sufficiently to meet the criteria for being considered “restored.” Thus off-channel habitat is expected to be maintained in both the short and long term. Refugia. Refugia are habitats or environmental factors that convey spatial and temporal resistance and resilience to biotic communities impacted by biophysical disturbances (Berman 1998). Landscape features associated with refugia operate at various spatial and temporal scales and may include localized micro-habitats and zones generated by riparian structure, floodplain features, hyporheic zones, and ground water input as well as macro-habitat features such as spatially relevant reaches, tributaries, and subbasins (Sedell et al.1990, Berman and Quinn 1991). Existing refugia are currently not properly functioning because many riparian and off-channel habitats within mapped floodplains are highly disturbed or absent. King County’s regulations protect refugia to a higher degree than has ever existed in the past. Additionally, a number of habitat CIPs have restored salmonid access to off-channel refuge areas, or enhanced the structural complexity of nearby mainstem habitats. Furthermore, many additional fish passage and habitat restoration projects in floodplains are planned and funded as part of salmon recovery actions. Despite these actions to protect and provide refugia, there remain many impediments that will likely take years or decades to remove in order to restore to pool frequency to properly functioning conditions. Therefore, although the trajectory is toward a better condition, the rate and magnitude of change is uncertain and may not shift conditions sufficiently to meet the criteria for being considered “restored.” Thus refugia are expected to be maintained in both the short and long term.
Channel Condition and Dynamics Width/Depth Ratio. Width-to-depth (W/D) is considered not properly functioning in most floodplains of King County. W/D ratios reflect a balance between flow, sediment, vegetation and reach-scale controls such as channel gradient and confinement. Land uses that increase sediment loads, decrease interactions with vegetation or increase flows will tend to widen channels, decreasing depth and increasing their W/D ratios. In turn, this makes streams and rivers more susceptible to temperature problems and reduces substrate quality for spawning and benthic invertebrate (food) production. Conversely, if channel confinement increases, or increases in flow energy are not accompanied by increases in sediment supply, channels may incise causing W/D ratios to decrease until a stable bed is reached, at which time channels will widen to accommodate the new flow and sediment regime. While the generic recommended numeric criterion of 10 established by NMFS (in the Matrix of Pathways and Indicators) for this indicator appears to be appropriate for moderate gradient streams, it seems less so for large, low-gradient alluvial streams, such as the lower Green and Snoqualmie Rivers. Well-functioning riverine habitats in low-gradient alluvial reaches such as these in pre-settlement times likely had a much higher W/D ratios than under present conditions (King County 2004). For example, the Green River valley was described by an early geographer as follows: “Prior to 1906, the larger
King County National Flood Insurance Program Biological Opinion . Compliance Submittal and Programmatic Habitat Assessment
7-13
portion [of the White River] flowed closely along the north side of the valley for two miles, when it turned sharply to the north. After flowing north for about a mile, during normal runoff it was divided into two or three channels but in flood time it was divided into a multitude of channels. These channels seemed to wander aimlessly over the valley….” (Thomas and Thompson 1936). Thus the proper consideration of W/D ratios requires an assessment of the type of channel and its regime relative to flow, sediment, and reach-scale variables. King County’s regulations are unlikely to adversely affect natural W/D ratios. Many of the habitat CIPs undertaken to date in floodplains, as well as those planned and funded for future construction (see Appendix C), will reduce or remove artificial channel constraints by setting back levees and revetments, thus allowing for the natural expression of W/D ratios within broader meander belts that are more consistent with the natural potential of the restored reaches. Despite these actions to restore channel conditions like W/D ratios—or the potential for them to exist—there remain many impediments that will likely take years or decades to remove in order to restore to W/D ratios to properly functioning conditions. Therefore, although the trajectory is toward a better condition, the rate and magnitude of change is uncertain and may not shift conditions sufficiently to meet the criteria for being considered “restored.” Thus W/D ratios are expected to be maintained in both the short and long term. Streambank Condition. Streambank stability is considered not properly functioning in most floodplain areas of King County due to lack of riparian vegetation and extensive bank armoring. In concert with CIPs that restore banks and floodplains, King County’s regulations are expected to improve conditions over time and allow for establishment of vegetation in protected buffers within one SPTH from the OHWM. Buffer widths of one SPTH provide for bank stability and reduce erosion and sedimentation (King County 2004). Regardless, there remain many impediments that will likely take years or decades to remedy in order to restore streambanks to properly functioning conditions. Therefore, although the trajectory is toward a better condition, the rate and magnitude of change is uncertain and may not shift conditions sufficiently to meet the criteria for being considered “restored.” Thus streambank conditions are expected to be maintained in both the short and long term.
Stream Buffers. Vegetated riparian areas, especially riparian forests, influence numerous processes such as flood routing, sediment trapping, nutrient intake, allochthonous inputs, LWD inputs, shade, stream temperature and structural bank integrity (Naiman et al. 2000, Gregory et al. 1991, King County 2004). Because of historic alterations and wholesale removal of riparian forests, many floodplain habitats are not properly functioning in terms of stream buffer conditions. For example, over 80 percent of the banks along the lower Green River have been devegetated during conversion of riparian lands to agricultural, residential and industrial uses that currently preclude restoration of riparian forests. In many floodplain areas, when levees and revetments were constructed, numerous active and historic meander bends were permanently cut off, and in some cases these facilities were built on top of gravel bars in the active channel of the river. These construction methods entailed the wholesale removal of all riparian vegetation and included placement of a thick blanket of riprap on the newly constructed facilities, which was replenished as needed during and following major floods. Some facilities remained relatively unvegetated due to aggressive maintenance involving active removal of colonizing native and non-native vegetation, while others underwent gradual deposition of fine alluvium that became colonized mostly by aggressive non-native species such as blackberries and reed canarygrass. With the recent discontinuation of maintenance practices involving systematic devegetation, dense mats of mostly non-native herbaceous vegetation became securely entrenched along most of the

King County National Flood Insurance Program Biological Opinion . Compliance Submittal and Programmatic Habitat Assessment
7-14
flood control facilities along the lower segments of the Green and Snoqualmie Rivers and some segments of the County’s smaller rivers. While reed canarygrass and blackberries are able to trap fine sediments to some degree, their shallow root structure makes these species ineffective in preventing saturation slump failures which contribute large pulses of fine sediment to the lower river. In addition, the presence of these species in monocultural or bicultural stands inhibits succession processes that would otherwise lead to reestablishment of riparian forests that even in narrow strips alongside roadways and developed properties would help shade the river, contribute LWD to the channel, and modestly function as fish and wildlife habitat. King County’s regulatory buffers, which exceed one SPTH in width and include an additional 15-foot building set-back, are intended, over time, to allow for the regeneration of mature riparian forests. Additionally, King County conducts small and large scale habitat restoration projects that include tree planting wherever appropriate (see Appendix C). Regardless, there remain many impediments that will likely take years or decades to remedy in order to restore stream buffers to properly functioning conditions. Therefore, although the trajectory is toward a better condition, the rate and magnitude of change are uncertain and may not shift conditions sufficiently to meet the criteria for being considered “restored.” Thus streambank conditions are expected to be maintained in both the short and long term. A major exception to this will be on river bank segments where federal and non-federal levees are enrolled in U.S. Army Corps of Engineers (Corps) programs that help fund flood damage repairs, where aggressive vegetation removal is required in order to maintain eligibility for these programs. On these levees current (poor) streambank conditions will be even worse and thus, despite efforts to improve conditions elsewhere, there likely will be degradation in the short term (while maintaining existing poor condition in the long term) in these areas unless the Corps’ vegetation maintenance policies are changed in the future. Floodplain Connectivity. Most King County’s floodplains are not properly functioning for floodplain connectivity. Logging, systematic removal of LWD, roads, levees, revetments that have eliminated or cut-off floodplains and dams that have altered flow and sediment regimes and conversion of floodplains to other uses including agriculture, residential, commercial and industrial uses, have reduced secondary channels, off-channel ponds and tributary channels that formerly protected salmonids from damaging flood flows in the winter and provided cold water refugia in the warmer months. King County’s current regulations prohibit loss of floodplain connectivity. In addition, King County constructs habitat CIPs that increase floodplain connectivity for habitat and flood risk reduction purposes. Regardless, there remain many impediments that will likely take years or decades to remedy in order to restore floodplain connectivity to properly functioning conditions. Therefore, although the trajectory is toward a better condition, the rate and magnitude of change are uncertain and may not shift conditions sufficiently to meet the criteria for being considered “restored.” Thus floodplain connectivity is expected to be maintained in both the short and long term.
Flow/Hydrology Altered Peak/Base Flows. Many of the County’s riverine floodplain habitats are not properly functioning in terms of peak and base flow conditions. Flows are affected by a variety of activities that convert natural forest cover and soils to impervious or less pervious surfaces as well as dams and diversions. The headwaters of King County’s larger rivers are located in higher elevation forested lands managed by the U.S. Forest Service (USFS), WDNR, and private timber companies subject to WDNR forest practices rules. As part of the federal Pacific Northwest Forest Management Plan, the USFS has severely curtailed and modified its logging practices in the past 20 years to better manage for multiple values including protection of ESA-

King County National Flood Insurance Program Biological Opinion . Compliance Submittal and Programmatic Habitat Assessment
7-15
listed species such as spotted owls, marbled murrelets, and various salmonids. The WDNR and private timber lands subject to the state, Forest Practices Act administered by WDNR, are required to comply with federally-approved habitat conservation plans (HCPs). As a result, the headwaters of most of the county’s rivers are presumed to be restoring natural peak and base flow regimes consistent with recovery of ESA-listed species2. Dams and diversions on the Green, Cedar and Tolt Rivers are major modifiers of flow regimes. The lower Green River was profoundly altered early this century by the permanent diversion of the White River into the Puyallup River for flood control purposes, and by diversion of the Cedar/Black Rivers to Lake Washington to facilitate construction of the Ship Canal for navigational purposes. Flow from the White and Cedar/Black Rivers formed 75 percent of the mean annual flow of the Green River, and up to 60 percent of the flow during the late summer. Following these historic diversions and prior to construction of the HHD in 1962, the highest flow ever recorded on the Green River was 28,100 cfs on November 23, 1959 at the Auburn gage (USGS 1996). Operation of HHD has altered the natural flow regime by limiting peak flows to 12,000 cfs, essentially truncating the historic peak flood peaks by impounding flood flows and releasing stored floodwater over unnaturally longer durations following floods than descending hydrograph limbs before construction of the dam. In addition, the HHD reservoir provides augmentation of late summer low flows, in effect dampening summer low flows as well as winter peak flows. At least a portion of this dampening effect, however, is offset by withdrawals of water at the City of Tacoma's headworks at Palmer. Less dramatically altered than the Green River, the Cedar River also has a highly altered flow regime due to City of Seattle water supply operations. Water supply dams and operations have significantly contributed to downstream changes in floodplain and channel conditions on the lower 21 miles of the Cedar River below Landsburg (King County 1993b, Perkins 1994). For example, the 1990 Thanksgiving Day flood was roughly one-third smaller than would have occurred without these impoundments (King County 1993b). Regardless, the Cedar River’s current flow regime has been approved as being consistent with recovery of ESA-listed species by NOAA and USFWS through an HCP. On both the Green and Cedar Rivers, it is likely that these hydrologic alterations have adversely altered the timing of discharge-related salmonid life cycle cues (e.g., migrations), as well as changed the abundance and availability of food organisms related to timing of emergence and recovery after disturbance. In addition, where relatively intact riparian forests are still present, changes in the flow regime may have altered forest succession processes, including patterns of establishment and growth rates of cottonwoods and other important riparian species. Urbanization in some lower elevation headwater areas has resulted in increases in stormwater runoff from small tributary streams, increasing peak flows during the winter and reducing recharge of shallow aquifers that formerly sustained flows during the late summer and early fall. Urbanization has also increased consumption of river flows used for water supply, especially in the summer low flow period. Tacoma Public Utilities presently diverts up to 113 cfs to supply domestic and industrial water users in Tacoma. The Department of Ecology has set minimum instream flows of 150 cfs and 300 cfs for the Palmer and Auburn U.S. Geological Survey (USGS) gages, respectively, but modeling indicates that these minimum flows are unlikely to be 2 As mentioned in Chapter 6, headwaters in forest production may not be meeting the 65 percent forest cover condition required by local governments for floodplain protection under the NOAA NFIP BiOp even though many if not all of those areas are subject to timber harvesting guidelines under ESA-approved agreements, including the Federal Pacific Northwest Forest Management Plan and the Washington State Forest and Fish agreement.

King County National Flood Insurance Program Biological Opinion . Compliance Submittal and Programmatic Habitat Assessment
7-16
met during drought years in spite of late summer flow augmentation from the HHD reservoir. Significant decreases in summer low flows have also been documented on Soos and Newaukum Creeks due to groundwater withdrawals, loss of floodplain storage and loss of groundwater recharge areas (WDOE et al. 1995).
Stormwater controls promote as much onsite dispersal or infiltration of stormwater as is practical. And, in virtually every watershed, King County protects a large amount of land in an undeveloped forested condition through in fee simple acquisitions or easements, and applies other mechanisms that promote retention of forest cover or less hydrologically impacting land uses such as agriculture. As previously noted, King County has an extensive network of habitat conservation areas and wetland buffers as well as protected steep slopes and landslide hazard areas, most of which are forested and unlikely to be significantly altered. Therefore, depending on the extent to which floodplain hydrology is buffered by well managed forested lands in high elevation headwater areas and dam operations following long-term HCP agreements, King County’s regulations in combination with land acquisitions, protected critical areas and stormwater CIPs are likely to be setting peak and baseflows on a trajectory of better condition. Regardless, there remain many impediments that will likely take years or decades to remedy in order to restore peak and base flows to properly functioning conditions. Therefore, although the trajectory is toward a better condition, the rate and magnitude of change are uncertain and may not shift conditions sufficiently to meet the criteria for being considered “restored.” Thus peak and base flows are expected to be maintained in both the short and long term.
Drainage Network Increase. King County’s floodplains are not properly functioning for drainage density due to presence of many roadside and agricultural drainage ditches, culverts, retention/detention ponds, stormwater pipes, flapgates, etc. While King County's regulations are intended to facilitate environmentally-sound land development, this typically entails construction of at least some driveways, access roads and associated drainage ditches. Therefore, some incremental increase in drainage density may occur. However, it is likely that this will be minimal as most floodplains have existing roads sufficient for accessing developed or developable land. New roads are required to minimize and fully mitigate for impacts to floodplains and other critical areas. Additionally, new roads are considered pollution generating and require treatment for both water quantity and quality.
Higher drainage densities could also potentially result from construction of new agricultural drainage ditches. However, in King County, virtually all of the agricultural zoned lands suitable for agriculture are actively farmed and contain a network of drainage ditches and modified waterways constructed many years ago. As a result, it is unlikely that new drainage ditches will be excavated in mapped floodplains. Furthermore, construction of new drainage ditches will require federal permits and so will receive detailed scrutiny during ESA Section 7 and Clean Water Act (CWA) 401 water quality certification review. For the existing agricultural drainage network, it is likely that conditions will improve over time as BMPs, including riparian plantings after conducting ditch maintenance, prescribed by King County’s Agricultural Drainage Assistance Program (ADAP), are implemented. Therefore, drainage network conditions are expected to be maintained in the short and long term.
Road Density/Location. Road densities within the County’s floodplains are generally at rural levels. Still, there are a moderate number of valley bottom roadways in unincorporated King County, especially near the cities. As a result, road density is considered to be at risk. It is unlikely that road density will increase in King County’s mapped floodplains because there is an existing network of roads that is likely adequate to serve rural development densities, and because current regulations minimize placement of fill in floodplains. Construction of new roads
King County National Flood Insurance Program Biological Opinion . Compliance Submittal and Programmatic Habitat Assessment
7-17
that impact wetlands and most streams require federal permits and so will receive detailed scrutiny during ESA Section 7 and CWA 401 water quality certification review. Where new roads are permitted, compensatory flood storage must be created nearby in order to achieve zero rise of floodwaters. Therefore, road density is expected to be maintained in the short and long term.
Disturbance History. King County’s floodplains have been subject to over 150 years of logging, agriculture, residential, commercial and industrial development. Few if any of the county’s mapped floodplains are undisturbed. As a result, disturbance history is considered not properly functioning. Over the past 20 years, King County has undertaken extensive efforts to acquire and protect floodplains to reduce flood risks and costs, and to promote recovery of ESA-listed species and their habitat. Today, a considerable amount of land in floodplains is permanently protected as open space or zoned for low density development. In addition, King County’s wide regulatory buffers should result in reduced floodplain disturbance and restoration of floodplains over time. Regardless, there remain many impediments that will likely take years or decades to remedy in order to restore the disturbance ecology of floodplains to their properly functioning conditions. Therefore, although the trajectory is toward a better condition, the rate and magnitude of change are uncertain and may not shift conditions sufficiently to meet the criteria for being considered “restored.” Thus disturbance history is expected to be maintained in both the short and long term. Riparian Reserves. The floodplain riparian reserve system is considered not properly functioning due to fragmentation. Recently acquired floodplains include the 59-acre Chinook Bend and 190-acre Carnation Marsh in the Snoqualmie valley; the 52-acre Raging River Natural Area near Fall City; the Cavenaugh Pond, Cedar Rapids, Jones, Cedar Grove, Lions Club, Rainbow Bend, Belmondo, Wetland 79 and Big Bend/Landsburg Natural Areas totaling almost 300 acres on the Cedar River; the 107-acre Auburn Narrows reach of the lower Green River; the Hatchery, Green River and Neely Bridge Natural Areas totaling over 1,200 acres on the middle Green River, and the soon-to-be-restored 120-acre Countyline to A Street reach of the White River have been acquired for protection and floodplain restoration. It should be noted that this brief account of permanently protected King County Natural Areas situated in mapped FEMA floodplains does not include similar future acquisitions that are likely as the result of continued implementation of salmon recovery plans and other land conservation programs that affect the large rivers of King County. Through active and passive restoration, these areas will gradually recover from past disturbance and eventually regain properly functioning riparian conditions. All of these sites are benefiting from deliberate and natural revegetation that provides cover, shade, habitat for aquatic and terrestrial animals, and future LWD recruitment into many miles of mainstem and off-channel habitats. Additionally, many of King County’s broad regulatory buffers along all fish-bearing waters, including those with salmonid-bearing potential, will eventually become forested over time except on lands that have on-going agriculture. Nonetheless, reestablishment of mature riparian corridors as a result of these acquisitions and restoration projects will require many years or decades in order to restore riparian reserves to properly functioning conditions. Therefore, although the trajectory is toward better conditions within these open space lands, the rate and magnitude of change are uncertain and may not shift conditions sufficiently to meet the criteria for being considered “restored.” Thus riparian reserves are expected to be maintained in both the short and long term.
King County National Flood Insurance Program Biological Opinion . Compliance Submittal and Programmatic Habitat Assessment
7-18
Assessment of Effects As per the Endangered Species Consultation Handbook (USFWS and NMFS 1998), the following section assesses “the direct and indirect effects of an action on the species or critical habitat, together with the effects of other activities that are interrelated or interdependent with that action. These effects are considered along with the environmental baseline and the predicted cumulative effects to determine the overall effects to the species for purposes of preparing a biological opinion on the proposed action. [50 CFR §402.02].” In this assessment the proposed action is implementation of King County’s land use regulations in combination with protective and restorative actions taken by the County as they affect the baseline condition in the FEMA floodplain including the NOAA Biological Opinion (BiOp) protected area and the floodplain “Delta” area. (The Delta area is the difference between the NOAA BiOp protected area and the area protected by the County’s regulatory buffers, floodway and channel migration zones.) The County’s land use regulations facilitate land development while protecting fish and wildlife habitats and other critical areas from the near and long-term effects of land development and land use activities. The primary effects of land development and land use are reduction and replacement of natural soils and vegetation, especially mature forest, with compacted soils or impervious surfaces and landscaped or farmed vegetation, which in turn can alter natural processes and structures that regulate key environmental variables such as hydrology, water quality, sediment, large woody debris that create and sustain aquatic habitats. When development occurs in the water (including pathway of floodwaters), it can affect the natural passage of fish as well as water, sediment, and woody debris if not properly managed. The near-term, temporary effects of development often include clearing, grading and construction, which if not adequately managed, can create erosion, water quality and hydrology problems. In compliance with the Washington State Growth Management Act (GMA), the current regulations were formulated using best available science (King County 2004 and Appendix A) and are intended to avoid or minimize and mitigate for the potential effects of land development and land use on critical areas. The County’s Best Available Science was formally peer-reviewed and, ultimately, tested and affirmed through high level legal review in the Washington State Courts (see http://www.kingcounty.gov/property/permits/codes/CAO/CourtRulingsQA.aspx ). The County’s approach recognizes that regulations alone may not be fully effective at protecting the environment and that both regulatory and non-regulatory actions applied at multiple scales are likely needed to fully and effectively protect and restore critical areas and watershed conditions for human health and safety and fish and wildlife. Given this, the County’s land use regulations are part of a larger comprehensive approach that includes protection and restoration as well as programmatic and stewardship actions. The County’s Comprehensive Plan provides high-level guidance and strong policy support for environmental protection and restoration and prioritizes recovery of ESA-listed species, including the environments that sustain them. Direct Effects Direct effects are caused by the proposed action and occur at the same time and place (WSDOT 2011). Inevitably, to the extent portions of the floodplain are undeveloped and zoning and regulations allow, implementation of King County’s land use regulations will alter floodplain conditions relative to the current baseline. When considered in the context of the County’s other protective and restorative actions (see Chapters 5 and 6 and Appendix C) and evaluated somewhat conservatively (i.e., somewhat overstating potential impacts and somewhat
King County National Flood Insurance Program Biological Opinion . Compliance Submittal and Programmatic Habitat Assessment
7-19
understating potential beneficial changes) the estimated likely net effect across the FEMA floodplain, floodplain Delta and the County’s regulatory aquatic area buffers is a modest increase in the quantity and quality of forest cover and creation of very small amounts of new imperviousness (see Chapter 6 for details and data). Furthermore, the large majority of allowed land development activities will occur at a minimum distance of 165 feet (slightly greater than one site potential tree height and increasing to include associated wetlands and steep slopes) from the OHWM of the nearest fish-bearing waterbody. Within the FEMA floodplain, designated FEMA floodways and channel migration zones composed of severe and moderate channel migration hazard areas (CMHAs) further limit the location, extent and type of development. Finally, when development occurs, clearing and grading and stormwater runoff regulations avoid or minimize and mitigate for potential erosion, sediment and water quality effects associated with construction and change in land covers at the development site. A small number of reasonable use exceptions (RUEs) allowing some encroachment into critical areas and their buffers to protect constitutionally protected property rights might be allowed in the future. As described in more detail in Chapter 6, between 1998 and 2010, King County allowed a total of 55 RUEs, of which seven were in the FEMA floodplain. Of those, five were issued to bypass steep slope requirements along Vashon Island and Lake Sammamish. Using a conservative approach, there are an estimated 71 private, undeveloped floodplain parcels with RUE potential in the FEMA floodplain (Chapter 6, Table 6-7). In a highly unlikely, worst-case scenario, if all 71 parcels with RUE potential were to locate all of their development in the aquatic area buffer the net amount of new clearing and new impervious is estimated as 24 and 4 acres, respectively. This is a very small amount when compared to the overall area of the floodplain and floodplain Delta and the positive effects over time of the above-mentioned floodplain buyout and restoration projects. In any event, the RUE process requires avoidance and minimization of impact and full mitigation of all unavoidable impacts to critical areas and their buffers. Projects that are federally funded or entail issuance of federal permits for placement of dredge and fill material in waters (including wetlands) of the United States will trigger detailed scrutiny during ESA Section 7 and CWA 401 water quality certification review and thus provide additional assessment of impacts and, potentially, additional protective measures. An exception is the County’s ADAP program, which allows in-water work for maintenance of agricultural drainage systems, and thus has potential for direct effects on fish and habitat. ADAP is limited, however, to work in existing highly modified or artificial channels under low flow conditions during the mid-summer to early-fall construction season where ESA-listed Chinook salmon, steelhead trout or bull trout are absent or only rarely present.. To the extent fish are present, these projects also entail fish removal using the same methods and crews trained and authorized to work under the King County Department of Transportation Roads Maintenance 4(d) rule, which provides avoidance and minimization measures of impacts on listed species as well. Extensive erosion and sediment control measures and de-watering procedures are combined with on-site monitoring to minimize construction impacts. When completed, the ADAP project sites are stabilized and replanted with two to three rows of native woody riparian plantings to improve the ecological functioning of these ADAP sites. Given the above, the potential for King County’s land use regulations to cause direct effects on endangered species and their habitats is very low and probably not detectable.

King County National Flood Insurance Program Biological Opinion . Compliance Submittal and Programmatic Habitat Assessment
7-20
Indirect Effects Indirect effects are those effects that are caused or will result from the proposed action and are later in time, but are still reasonably certain to occur [CFR §402.02]. Indirect effects may include growth-inducing effects and other effects related to induced changes in the pattern of land use, population density or growth rate, and related effects on air and water and other natural systems, including ecosystems (WSDOT 2011). King County's land use patterns, growth rates and other land development and growth-inducing activities are guided by its Comprehensive Plan. The County’s Comprehensive Plan provides strong policy guidance for maintaining low density zoning on natural resource lands, as defined under the GMA. These zoned land uses include agriculture, forestry and mining and comprise 57.76 percent of the floodplain. Additional policy direction requires that King County maintain low density zoning on the Rural Area (RA) zoned lands for protection of rural character, as required by the GMA. Rural area (RA) zoning makes up an additional 29.81 percent of the County’s floodplain, and these lands will never be allowed to be up-zoned to a density greater than one lot per five acres. The small portion of the floodplain zoned for Urban Reserve (UR) (2.72%) will remain in five-acre zoning until annexed by cities, at which time these municipal jurisdictions will presumably be required to re-assess the biological effects of their floodplain annexations, and any proposed changes to higher density zoning would have on ESA- and Magnuson-Stevens Fishery Conservation and Management Act (MSA)-listed species. The 2.75 percent of the floodplain zoned urban is not likely to exceed one-acre zoning. If King County’s Comprehensive Plan’s strong policy guidance and zoning do not change, the County’s land use regulations should not allow development beyond what is already allowed under current zoning in mapped FEMA floodplains. Based on analysis in Chapter 6, implementation of the country’s land use regulations on currently undeveloped private floodplain parcels in combination with forest re-growth potential on restored permanent open space lands could potentially increase forest cover by 692 and 222 acres across all floodplain and all floodplain Delta areas, respectively (Tables 6-5). Counting only immature conifer cover, there are an estimated 374 acres of protected aquatic area buffers with potential to become mature forest across all floodplains (Table 6-6). Furthermore, where mature conifer trees currently exist in protected aquatic areas, they are most likely second growth and therefore have some potential to grow and increase in biomass and complexity over time, thus enhancing their hydrologic and ecologic functioning. This is against a backdrop where only small amounts of new impervious is being created, mostly beyond 165 feet from the OHWM and outside of floodways and severe CMHAs. As described in Chapter 5, Appendix C and earlier in this chapter, there exist a range of additional regulatory and on-regulatory actions as well as many (likely) future protective and restorative actions for flood hazard reduction and salmon recovery that will provide added protection and restoration of floodplain conditions. These include open space acquisitions and CIPs that reconnect formerly armored river channels to the floodplain in order to remove impervious surfaces, restore channel forming processes and promote the regeneration of floodplain forest cover. For these reasons, to the extent they occur, indirect effects are likely to be beneficial for ESA- and MSA-listed salmonids, when compared with the current baseline.

King County National Flood Insurance Program Biological Opinion . Compliance Submittal and Programmatic Habitat Assessment
7-21
Cumulative Effects Cumulative effects under the ESA are those effects of future State or private activities, not involving Federal activities, that are reasonably certain to occur within the action area of the Federal action subject to consultation [CFR §402.02]. As noted above, King County's land use regulations facilitate land development in a manner that protects the environment. They prevent or severely limit the location, type and amount of development in floodplains, including floodways, severe and moderate CMHAs, and a range of other critical areas such as landslide, steep slope and erosion hazard areas, and aquatic area and wetland buffers, thereby increasing floodplain protection either directly or cumulatively at the watershed or reach scales. Avoidance and minimization and mitigation procedures addressing impacts to habitat, water quantity and quality are required for almost any new or expanded land disturbing activity beyond very small activity thresholds. Furthermore, with exception of ADAP and projects that occur entirely within the footprint of existing uses, these activities must be conducted at least one SPTH landward of the OHWM of any water with fish-bearing potential, which includes almost all aquatic areas in mapped floodplains. As a result, while new development is likely to occur, it is expected to do so in a manner that will avoid or minimize the likelihood of significant adverse cumulative effects. In addition to the regulatory protections described above, the County also protects a large amount of area both in and upstream of mapped FEMA floodplains. For example, as described in Chapter 5, tens of thousands of acres of floodplain and adjacent land have been protected from further development through a combination of open space, forest and farmland preservation, and current use taxation programs (Table 5-1). King County alone has over 30,000 acres of natural area, parks and multiuse lands (Table 5-2). Since 2005, the County has purchased more than 815 acres of land primarily for their ecological value, and an additional 177 acres of properties repeatedly damaged by flooding. These flood-prone sites along rivers will provide many future opportunities for habitat restoration. Furthermore, as described extensively in Appendix C, there are many additional protective and restorative actions planned for flood hazard reduction and salmon recovery. It is likely that at least some, if not a large proportion, of the capital projects in Appendix C will be implemented. For these reasons, the combined, cumulative effect of land development and land protection and restorations programs in the floodplain on ESA-listed salmonids is anticipated to be positive.
Interdependent Effects Interdependent effects are actions having no independent utility apart from the proposed action [CFR §402.02]. This relates to the effects of actions that would not exist “but for” the proposed action3. Presumably this would mean actions beyond those covered in the County’s regulations. However, since the King County code covers a large number of actions, ranging from modification and expansion of existing structures, roads, and trails to new such facilities and also the management of certain actions such as tilling, grazing and many other farming activities, it is hard to know what would exist “but for” the County’s regulations. For this reason, the proposed action is not expected to precipitate any actions, or at most only a few minor 3 From the USFWS and NMFS ESA Consultation Handbook (1998), the analysis of whether other activities are interrelated to, or interdependent with, the proposed action under consultation should be conducted by applying a “but for” test. The biologist should ask whether another activity in question would occur “but for” the proposed action under consultation. If the answer is “no,” that the activity in question would not occur but for the proposed action, then the activity is interrelated or interdependent and should be analyzed with the effects of the action. If the answer is “yes,” that the activity in question would occur regardless of the proposed action under consultation, then the activity is not interdependent or interrelated and would not be analyzed with the effects of the action under consultation.

King County National Flood Insurance Program Biological Opinion . Compliance Submittal and Programmatic Habitat Assessment
7-22
unforeseen actions, that would otherwise not occur and that could have additional effects on listed, proposed, or candidate species. For this reason no interdependent effects are foreseen for salmonid species.
Interrelated Effects Interrelated effects are part of a larger action and depend on the larger action for their justification [CFR §402.02]. As with interdependent effects, it is not clear what an interrelated effect would be in the context of implementing a set of comprehensive land use regulations that cover almost every conceivable aspect of development. For this reason, the proposed projects are not expected to result in additional actions or conditions that could have effects on listed, proposed, or candidate species and no interrelated effects are foreseen for salmonid species.
Beneficial Effects King County’s current land use regulations were implemented at the start of 2005. Since then, land development and land use activities beyond small amounts of disturbance have been subject to the most stringent and protective regulations that have ever existed in King County. These protections include requirements for avoidance, minimization and compensatory mitigation for the effects of a wide range of activities. The implementation of these regulations will reduce stream bank erosion, allow for diverse native riparian vegetation, and recruitment of LWD to channels and floodplains. Vegetation will mature and biomass will accumulate in expansive buffers, and the water quality and quantity effects of land uses should stabilize and perhaps reverse somewhat over time. Revegetation will modestly improve instream water quality by reducing non-point source inputs of fine sediment and runoff from adjacent properties. It will also modestly increase sediment deposition along bank lines as well as nutrient uptake and denitrification, and will improve habitat for birds and small mammals that utilize the riparian area. These changes are expected to improve salmonid migration, spawning, rearing and refuge habitat. The main long-term benefits of the completed projects will be protection and enhancement of ecosystem processes resulting in improved or restored habitats for ESA- and MSA- listed salmonids.
Conservation Measures Conservation measures include actions that would eliminate or minimize and mitigate any adverse impacts associated with development under the County’s regulations. As noted above and in detail in Chapters 5 and 6 and Appendix C, the County implements many protection and restoration programs and projects that complement the protective value of its regulations and that serve as conservation measures by restoring or enhancing habitat. These actions are extensive and work at watershed, reach and site scales to protect and restore environmental conditions. Some actions, such as CIPs (see below) and programs such as those that preserve agricultural lands from further development, are often implemented in or in close proximity to mapped FEMA floodplains and thus provide direct benefit. Other actions, such as protection of upland forest lands from further development through TDR and forest acquisition and stewardship programs, benefit floodplains indirectly by protecting forest cover and associated hydrologic and sediment processes at the watershed scale. CIPs are a significant part of the County’s overall effort to protect and restore the environment. Table 7-2 identifies King County CIPs that will protect or restore habitat for ESA-listed salmonids and that have been or likely will be implemented between 2010 and 2016. The list
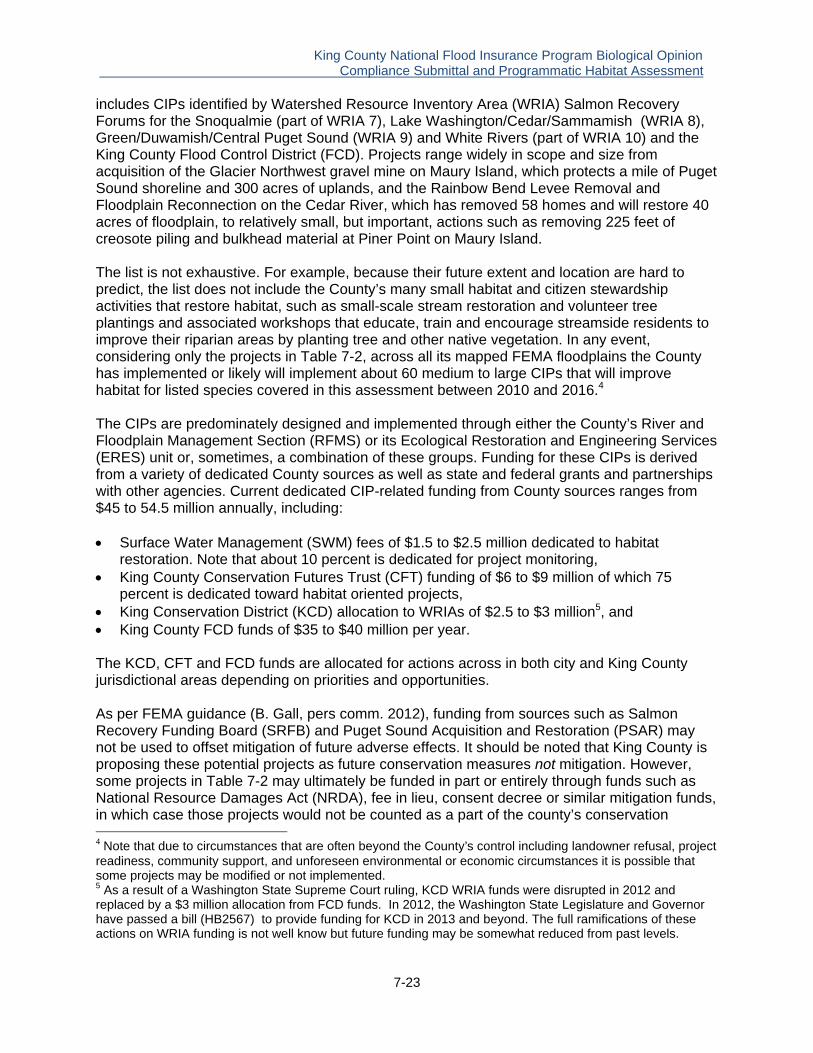
King County National Flood Insurance Program Biological Opinion . Compliance Submittal and Programmatic Habitat Assessment
7-23
includes CIPs identified by Watershed Resource Inventory Area (WRIA) Salmon Recovery Forums for the Snoqualmie (part of WRIA 7), Lake Washington/Cedar/Sammamish (WRIA 8), Green/Duwamish/Central Puget Sound (WRIA 9) and White Rivers (part of WRIA 10) and the King County Flood Control District (FCD). Projects range widely in scope and size from acquisition of the Glacier Northwest gravel mine on Maury Island, which protects a mile of Puget Sound shoreline and 300 acres of uplands, and the Rainbow Bend Levee Removal and Floodplain Reconnection on the Cedar River, which has removed 58 homes and will restore 40 acres of floodplain, to relatively small, but important, actions such as removing 225 feet of creosote piling and bulkhead material at Piner Point on Maury Island. The list is not exhaustive. For example, because their future extent and location are hard to predict, the list does not include the County’s many small habitat and citizen stewardship activities that restore habitat, such as small-scale stream restoration and volunteer tree plantings and associated workshops that educate, train and encourage streamside residents to improve their riparian areas by planting tree and other native vegetation. In any event, considering only the projects in Table 7-2, across all its mapped FEMA floodplains the County has implemented or likely will implement about 60 medium to large CIPs that will improve habitat for listed species covered in this assessment between 2010 and 2016.4 The CIPs are predominately designed and implemented through either the County’s River and Floodplain Management Section (RFMS) or its Ecological Restoration and Engineering Services (ERES) unit or, sometimes, a combination of these groups. Funding for these CIPs is derived from a variety of dedicated County sources as well as state and federal grants and partnerships with other agencies. Current dedicated CIP-related funding from County sources ranges from $45 to 54.5 million annually, including: Surface Water Management (SWM) fees of $1.5 to $2.5 million dedicated to habitat
restoration. Note that about 10 percent is dedicated for project monitoring, King County Conservation Futures Trust (CFT) funding of $6 to $9 million of which 75
percent is dedicated toward habitat oriented projects, King Conservation District (KCD) allocation to WRIAs of $2.5 to $3 million5, and King County FCD funds of $35 to $40 million per year. The KCD, CFT and FCD funds are allocated for actions across in both city and King County jurisdictional areas depending on priorities and opportunities. As per FEMA guidance (B. Gall, pers comm. 2012), funding from sources such as Salmon Recovery Funding Board (SRFB) and Puget Sound Acquisition and Restoration (PSAR) may not be used to offset mitigation of future adverse effects. It should be noted that King County is proposing these potential projects as future conservation measures not mitigation. However, some projects in Table 7-2 may ultimately be funded in part or entirely through funds such as National Resource Damages Act (NRDA), fee in lieu, consent decree or similar mitigation funds, in which case those projects would not be counted as a part of the county’s conservation 4 Note that due to circumstances that are often beyond the County’s control including landowner refusal, project readiness, community support, and unforeseen environmental or economic circumstances it is possible that some projects may be modified or not implemented. 5 As a result of a Washington State Supreme Court ruling, KCD WRIA funds were disrupted in 2012 and replaced by a $3 million allocation from FCD funds. In 2012, the Washington State Legislature and Governor have passed a bill (HB2567) to provide funding for KCD in 2013 and beyond. The full ramifications of these actions on WRIA funding is not well know but future funding may be somewhat reduced from past levels.
King County National Flood Insurance Program Biological Opinion . Compliance Submittal and Programmatic Habitat Assessment
7-24
measures and the previously dedicated capital funds for restoration will be redirected to other projects on WRIA or FCD priority lists. King County uses a relatively small proportion of SRFB and PSAR funds for its capital projects. As noted above, WRIA salmon recovery acquisition and restoration CIPs are largely funded through a combination of the dedicated local sources noted above and augmented by SRFB and PSAR funds. For example, for WRIA 8, from 2006 to 2011 and not counting contribution from SWM fees, capital expenditures were $29.3 million of which $6.9 million (23%) were a combination of SRFB and PSAR funds, including a large one-time allocation from PSAR of over $2 million in 2007 which was the funds’ initial year (J. Mulvihill-Kuntz, pers. comm. 2012); PSAR funds for WRIA 8 have generally been much less, ranging from $0.345 million to $0.875 million annually. For WRIA 7 for the 2005 to 2010 time period the proportion of SRFB and PSAR averaged 9 percent, including a large allocation of $22.5 million for development rights on the Snoqualmie Tree Farm. Excluding the one-time tree farm allocation, the average proportion of SRFB and PSAR funds between 2005 and 2010 for WRIA 7 was slightly under 20 percent. Funding for King County FCD projects are largely self-generated through a local taxing district, although additional dollars from other sources are sometimes used. The King County Flood District’s 2012 capital improvement program plans to spend $260 million over the next six years (2012 through 2017). Of this, $244 million (94%) is generated through the aforementioned flood district property tax levy while $11 million and $5 million are funds from the Washington State Department of Ecology and Natural Resource Damage Assessment, respectively (S. Klusman, email, May 29, 2012). It should be noted that in cases where property is already owned by the County, the land value is not included in project costs.
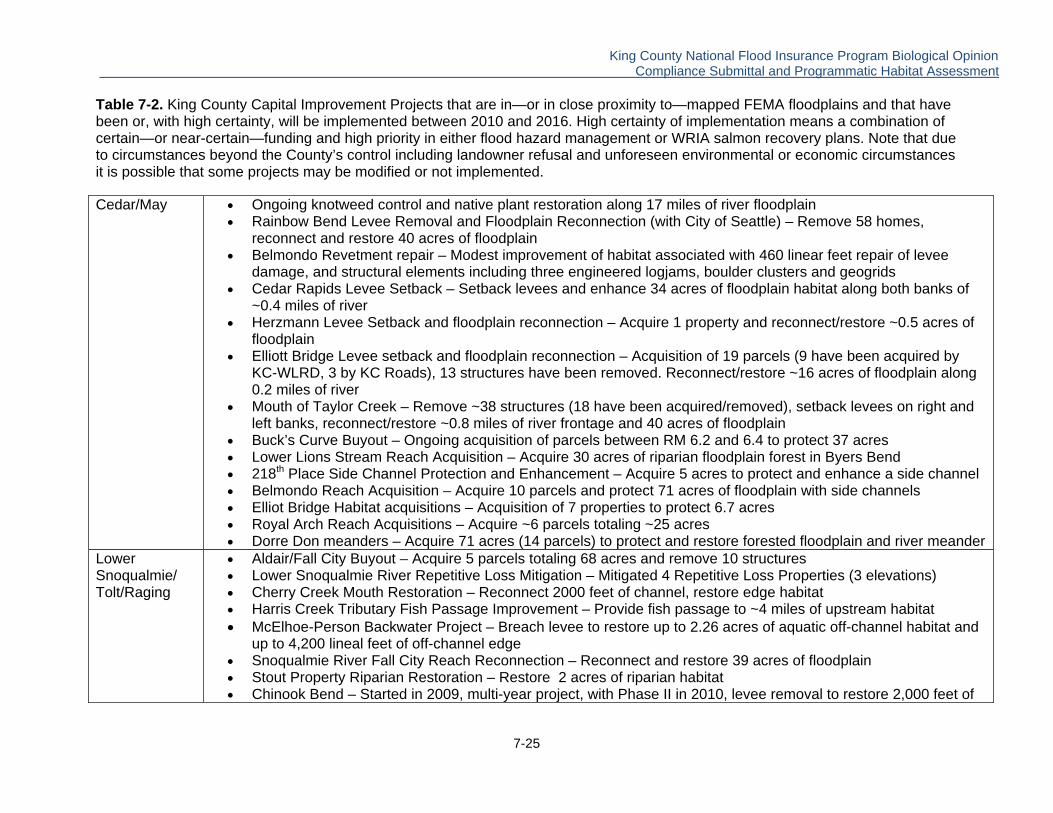
King County National Flood Insurance Program Biological Opinion . Compliance Submittal and Programmatic Habitat Assessment
7-25
Table 7-2. King County Capital Improvement Projects that are in—or in close proximity to—mapped FEMA floodplains and that have been or, with high certainty, will be implemented between 2010 and 2016. High certainty of implementation means a combination of certain—or near-certain—funding and high priority in either flood hazard management or WRIA salmon recovery plans. Note that due to circumstances beyond the County’s control including landowner refusal and unforeseen environmental or economic circumstances it is possible that some projects may be modified or not implemented. Cedar/May Ongoing knotweed control and native plant restoration along 17 miles of river floodplain
Rainbow Bend Levee Removal and Floodplain Reconnection (with City of Seattle) – Remove 58 homes, reconnect and restore 40 acres of floodplain
Belmondo Revetment repair – Modest improvement of habitat associated with 460 linear feet repair of levee damage, and structural elements including three engineered logjams, boulder clusters and geogrids
Cedar Rapids Levee Setback – Setback levees and enhance 34 acres of floodplain habitat along both banks of ~0.4 miles of river
Herzmann Levee Setback and floodplain reconnection – Acquire 1 property and reconnect/restore ~0.5 acres of floodplain
Elliott Bridge Levee setback and floodplain reconnection – Acquisition of 19 parcels (9 have been acquired by KC-WLRD, 3 by KC Roads), 13 structures have been removed. Reconnect/restore ~16 acres of floodplain along 0.2 miles of river
Mouth of Taylor Creek – Remove ~38 structures (18 have been acquired/removed), setback levees on right and left banks, reconnect/restore ~0.8 miles of river frontage and 40 acres of floodplain
Buck’s Curve Buyout – Ongoing acquisition of parcels between RM 6.2 and 6.4 to protect 37 acres Lower Lions Stream Reach Acquisition – Acquire 30 acres of riparian floodplain forest in Byers Bend 218th Place Side Channel Protection and Enhancement – Acquire 5 acres to protect and enhance a side channel Belmondo Reach Acquisition – Acquire 10 parcels and protect 71 acres of floodplain with side channels Elliot Bridge Habitat acquisitions – Acquisition of 7 properties to protect 6.7 acres Royal Arch Reach Acquisitions – Acquire ~6 parcels totaling ~25 acres Dorre Don meanders – Acquire 71 acres (14 parcels) to protect and restore forested floodplain and river meander
Lower Snoqualmie/ Tolt/Raging
Aldair/Fall City Buyout – Acquire 5 parcels totaling 68 acres and remove 10 structures Lower Snoqualmie River Repetitive Loss Mitigation – Mitigated 4 Repetitive Loss Properties (3 elevations) Cherry Creek Mouth Restoration – Reconnect 2000 feet of channel, restore edge habitat Harris Creek Tributary Fish Passage Improvement – Provide fish passage to ~4 miles of upstream habitat McElhoe-Person Backwater Project – Breach levee to restore up to 2.26 acres of aquatic off-channel habitat and
up to 4,200 lineal feet of off-channel edge Snoqualmie River Fall City Reach Reconnection – Reconnect and restore 39 acres of floodplain Stout Property Riparian Restoration – Restore 2 acres of riparian habitat Chinook Bend – Started in 2009, multi-year project, with Phase II in 2010, levee removal to restore 2,000 feet of

King County National Flood Insurance Program Biological Opinion . Compliance Submittal and Programmatic Habitat Assessment
7-26
river frontage, reconnect and restore 58 acres of floodplain and 5 acres of off-channel habitat Lower Tolt Floodplain Reconnection – Started in 2009, multi-year project to setback ~2,500 of levee, reconnect
and restore 48 acres of floodplain, river edge habitat and 12 acres of off-channel habitat; recent work includes removal of additional, recently exposed, rock.
Tolt River – Lower Tolt River Acquisition – Acquire 6.7 acres (2 parcels) of floodplain Tolt River – Sans Souci Neighborhood Buyout – 37 parcels totaling 41 acres; acquisition includes 3400 feet of
river frontage and could lead to reconnection of 3700 feet of off-channel habitat. Tolt River – Tolt River Natural Area Floodplain Reconnection – Acquire 12 parcels (53.5 acres) and reconnect
and restore 1.5 acres of floodplain Tolt River – SR 203 to Trail Bridge Floodplain Reconnection – Setback 2800 feet of levee setback to reconnect
30 acres of floodplain and restore river edge habitat Tolt River – River Mile 1.1 Levee Setback – Setback 2700 feet of levee to reconnect 14 acres of floodplain and
restore river edge habitat Raging River – Alpine Manor Mobile Home Park Neighborhood Buyout - Remove all or only floodplain portions of
a mobile home park (potentially about 30 to 40 residences) and restore floodplain Raging River – Kerriston Reach LWD addition – Enhance habitat by adding LWD to reach that had previous
(2008/2009) LWD additions Sammamish/ Big Bear/ Issaquah
Willowmoor – Restore ~10 acres of wetland and associated small tributary stream channels in the transition zone between the outlet of Lake Sammamish and the start of the Sammamish River
Big Bear – Protect headwaters of Bear and Cottage Lake Creeks by acquiring 40 to 60 acres of forest property, development rights/conservation easements, or providing enhanced incentives
Big Bear – Bear Creek Forest Cover Protection - Protect 24 acres of forest through development rights/conservation easements or providing enhanced incentives in vicinity of 116th and Avondale Road
Big Bear Creek – Reach 9 Bear Creek Waterways Program – Acquire ~50 acres of best remaining habitat identified in Waterways Program
Issaquah – Holder/Carey Creek Confluence – Acquire 120 acres of development rights, remove bank armoring and restore ~35 acres of riparian area
White River County Line to A-Street Levee Setback – Remove extensive levee/revetment complex and reconnect and restore 85 acres of riparian floodplain along 1.2 miles of river frontage
Pacific Right Bank Acquisition and Setback Berm – Between 2009 and 2011, acquired ~9 acres (removed 11 houses), along 880 linear feet of White River; in 2012 will acquire at least three more parcels/houses; and by 2016 acquire as many as 20 plus more parcels (depending on feasibility study results) and reconnect and restore ~20 acres of floodplain
Pinnacle Peak Acquisitions – Acquire and restore approximately 40 acres, including 5 parcels and at least two residences..
White-Greenwater Acquisition – Acquire 2 parcels (1.8 acres) with 4 structures. Reduce impervious surface by
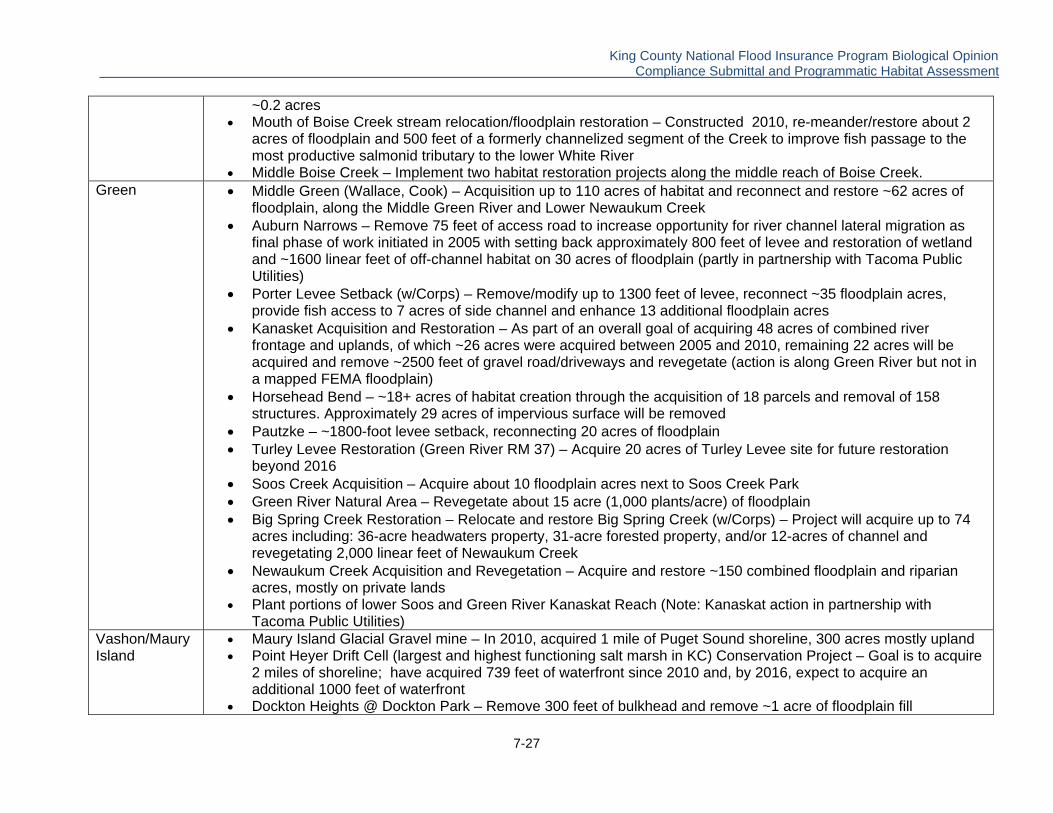
King County National Flood Insurance Program Biological Opinion . Compliance Submittal and Programmatic Habitat Assessment
7-27
~0.2 acres Mouth of Boise Creek stream relocation/floodplain restoration – Constructed 2010, re-meander/restore about 2
acres of floodplain and 500 feet of a formerly channelized segment of the Creek to improve fish passage to the most productive salmonid tributary to the lower White River
Middle Boise Creek – Implement two habitat restoration projects along the middle reach of Boise Creek. Green Middle Green (Wallace, Cook) – Acquisition up to 110 acres of habitat and reconnect and restore ~62 acres of
floodplain, along the Middle Green River and Lower Newaukum Creek Auburn Narrows – Remove 75 feet of access road to increase opportunity for river channel lateral migration as
final phase of work initiated in 2005 with setting back approximately 800 feet of levee and restoration of wetland and ~1600 linear feet of off-channel habitat on 30 acres of floodplain (partly in partnership with Tacoma Public Utilities)
Porter Levee Setback (w/Corps) – Remove/modify up to 1300 feet of levee, reconnect ~35 floodplain acres, provide fish access to 7 acres of side channel and enhance 13 additional floodplain acres
Kanasket Acquisition and Restoration – As part of an overall goal of acquiring 48 acres of combined river frontage and uplands, of which ~26 acres were acquired between 2005 and 2010, remaining 22 acres will be acquired and remove ~2500 feet of gravel road/driveways and revegetate (action is along Green River but not in a mapped FEMA floodplain)
Horsehead Bend – ~18+ acres of habitat creation through the acquisition of 18 parcels and removal of 158 structures. Approximately 29 acres of impervious surface will be removed
Pautzke – ~1800-foot levee setback, reconnecting 20 acres of floodplain Turley Levee Restoration (Green River RM 37) – Acquire 20 acres of Turley Levee site for future restoration
beyond 2016 Soos Creek Acquisition – Acquire about 10 floodplain acres next to Soos Creek Park Green River Natural Area – Revegetate about 15 acre (1,000 plants/acre) of floodplain Big Spring Creek Restoration – Relocate and restore Big Spring Creek (w/Corps) – Project will acquire up to 74
acres including: 36-acre headwaters property, 31-acre forested property, and/or 12-acres of channel and revegetating 2,000 linear feet of Newaukum Creek
Newaukum Creek Acquisition and Revegetation – Acquire and restore ~150 combined floodplain and riparian acres, mostly on private lands
Plant portions of lower Soos and Green River Kanaskat Reach (Note: Kanaskat action in partnership with Tacoma Public Utilities)
Vashon/Maury Island
Maury Island Glacial Gravel mine – In 2010, acquired 1 mile of Puget Sound shoreline, 300 acres mostly upland Point Heyer Drift Cell (largest and highest functioning salt marsh in KC) Conservation Project – Goal is to acquire
2 miles of shoreline; have acquired 739 feet of waterfront since 2010 and, by 2016, expect to acquire an additional 1000 feet of waterfront
Dockton Heights @ Dockton Park – Remove 300 feet of bulkhead and remove ~1 acre of floodplain fill
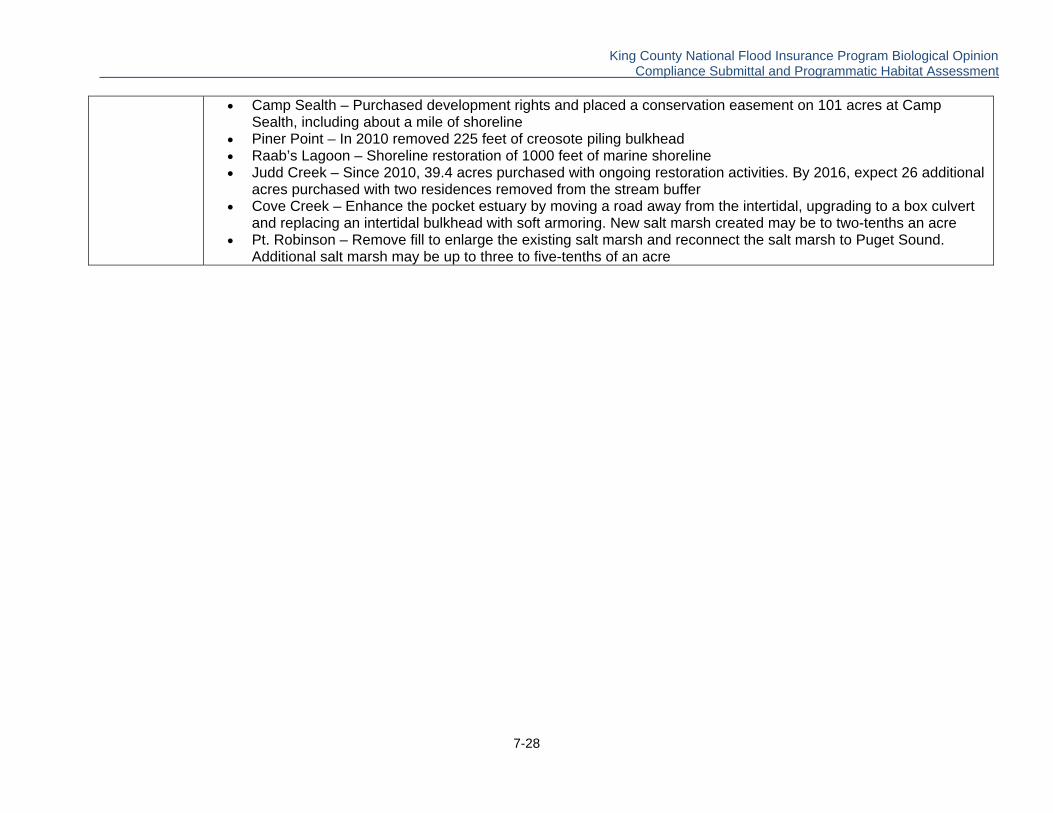
King County National Flood Insurance Program Biological Opinion . Compliance Submittal and Programmatic Habitat Assessment
7-28
Camp Sealth – Purchased development rights and placed a conservation easement on 101 acres at Camp Sealth, including about a mile of shoreline
Piner Point – In 2010 removed 225 feet of creosote piling bulkhead Raab’s Lagoon – Shoreline restoration of 1000 feet of marine shoreline Judd Creek – Since 2010, 39.4 acres purchased with ongoing restoration activities. By 2016, expect 26 additional
acres purchased with two residences removed from the stream buffer Cove Creek – Enhance the pocket estuary by moving a road away from the intertidal, upgrading to a box culvert
and replacing an intertidal bulkhead with soft armoring. New salt marsh created may be to two-tenths an acre Pt. Robinson – Remove fill to enlarge the existing salt marsh and reconnect the salt marsh to Puget Sound.
Additional salt marsh may be up to three to five-tenths of an acre
King County National Flood Insurance Program Biological Opinion . Compliance Submittal and Programmatic Habitat Assessment
7-29
Monitoring of CIPs is an important and major activity of the County. Monitoring is done partly in response to permit requirements but also (more importantly) to help ensure that limited funds are well-spent and to learn from past results. The County has an extensive documented history of monitoring its CIPs. Beginning in 1995, the County’s SMW CIP unit and, later, ERES, has produced annual habitat CIP monitoring reports for projects constructed since 1994.6 Depending on the type of project, reports typically documented pre- and post-construction conditions, including vegetation planting success, stability of structural features such as log weirs and, later, log jams and natural log placements and fish utilization. More recently, with increasing need for improved, science-based understanding of the biological as well as physical effectiveness of its actions, both the County’s RFMS and ERES units have developed draft effectiveness monitoring protocols for their respective CIPs (Josh Latterell and Kate Akyuz, pers. comm. 2012). Even relatively small projects, such as levee repairs, are monitored annually as required under the County’s shoreline exemption program for conditions stipulated in Washington State’s Hydraulic Project Approvals (HPA) permits, including structural stability as well as success of plantings, erosion, stability and fish utilization. The County’s RFMS is in process of completing 32 monitoring reports as required for 2011 projects (L. Brandt, pers. comm. 2012). Furthermore, many if not most river flood facilities are assessed on an annual basis, typically in spring, fall and/or under low water conditions, in order to document of their condition in advance of storm seasons and potential storm-related damage claims. Funding for RFMS CIPs is secured through FCD funds while ERES habitat projects receive, at minimum, a dedicated portion (currently about 10% or $250 to 300K annually) of SWM CIP funds. For specific activities allowed under its land use regulations and covered under this PHA, King County requires extensive avoidance, minimization and mitigation procedures for actions that may impact fish and wildlife habitat including: Avoiding impacts by not taking a certain action; Minimizing impacts by limiting the degree or magnitude of the actions by using appropriate
technology or by taking affirmative steps to avoid or reduce the impact; Rectifying or eliminating the impact over time by preservation or maintenance operations
during the life of the proposal; Compensating for the impact by replacing, enhancing or providing substitute sensitive areas
or environments; Monitoring the impact and taking appropriate corrective measures. During construction phase of a land development project, a project site is monitored by inspectors to ensure all permit conditions are followed. Inspections are driven by project stage (e.g., timing of clearing and grading, construction of foundations, installation of temporary erosion and sediment control facilities, etc.) which in turn are determined by the applicant’s activity and progress. When a permit is finalized (in case of residence, approved for final occupancy) additional site inspection is done for certain elements like bonded mitigation plans. Most mitigation elements require bonding the value, which is determined through a standardized equation. Bonding generally is for three to five years (in some instances as much as ten years)7. In a large majority of cases, bonds have been returned because mitigations have been installed 6 The majority of these CIPs were identified through the King County Surface Water Management (ca 1990s) Basin Planning Program, a precursor to current WRIA salmon recovery planning. 7 As of time of this assessment (ca. April 2012), there are currently 287 outstanding bonds, of which 138 have been installed and are being annually reviewed; the remainder have not yet been installed because projects are in various stages of completion (B. MacWhinney, King County, 2012, pers. comm.).
King County National Flood Insurance Program Biological Opinion . Compliance Submittal and Programmatic Habitat Assessment
7-30
and are performing as per permit requirements. There have been a relatively small number of bonds that have been forfeited due to non-compliance with permit requirements. In these few instances, these forfeited bonds are typically used for other mitigation reserve programs. Management of stormwater runoff is a major concern for protecting floodplains and ESA species and King County implements a comprehensive stormwater management program. To ensure stormwater runoff controls required by the Surface Water Design Manual (SWDM) are properly designed and constructed on new development and redevelopment projects, King County has a drainage review and construction inspection program as part of its review of applications for building and land development permits. This program, housed in King County’s Department of Development and Environmental Services (DDES), reviews stormwater design plans submitted by permit applicants for project compliance with the SWDM. Upon approval of the plans, DDES conducts inspections during project construction to ensure stormwater controls are properly implemented. As per its National Pollutant Discharge Elimination System (NPDES) permit, to ensure stormwater runoff controls for developments are properly operated and maintained in perpetuity after construction, King County’s Department of Natural Resources and Parks (DNRP), Water and Land Resources Division (WLRD) either accepts this responsibility or holds the property owner responsible. For subdivision developments, King County’s DNRP typically accepts this responsibility and has a program for regular inspection and maintenance of the stormwater controls if the controls are located in tracts owned by King County or on easements dedicated to King County. In general, the County’s inspection program is as follows: (1) public facilities inspections are phased, based on their maintenance records, so some may only be inspected every third year, (2) private facilities are inspected annually with fifty-percent inspected by King County staff annually and the balance inspected and reported by the owner using a self certification program (i.e., every facility gets inspected every other year), and (3) private Low Impact Development (LID) BMPs, like roof downspouts, at a rate of about one-quarter per year, or every fourth year (D. Navetski, King County, 2012, pers. comm.). Details of the Stormwater Management Plan, including implementation and effectiveness monitoring, inspection and enforcement, are outline in the 2012 Stormwater Management Plan (http://your.kingcounty.gov/dnrp/library/water-and-land/stormwater/stormwater-management-program/King-County-2012-SWMP-Final-wt-Apps.pdf ). Agriculture is a longstanding and dominant use in several of the County’s floodplains. King County’s Critical Areas Ordinance (CAO) allows existing agriculture to operate under a flexible regulatory approach that is based on sound agricultural practices, and protects critical areas including floodplains, fish and wildlife habitat, and water quality. Floodplain areas within agricultural lands are protected through a combination of regulatory and non-regulatory approaches including (1) large lot zoning with restrictions on the maximum allowable impervious surface on agriculturally zoned lands, (2) the Farmland Preservation Program (FPP), which has limited development of and placed restrictive covenants on 13, 200 acres of farmland, (3) implementation of farm management plans (FMPs) (4) technical and financial assistance to encourage voluntary stewardship activities and (5) the King County ADAP. Agricultural Zoning and Impervious Area Limits: The amount of impervious surface allowed on agriculturally zoned land ranges from five to 15 percent. Almost one third of the 42,000 acres of the agriculturally zoned land in King County is enrolled in the King County FPP. The FPP covenants do not allow non-farm uses and restrict non-tillable surface to 5 percent of the farm acreage. This restriction applies across the entire farm, regardless of the number of parcels. King County actively monitors property in the FPP and ensures that the maximum amount of
King County National Flood Insurance Program Biological Opinion . Compliance Submittal and Programmatic Habitat Assessment
7-31
non-tillable surface does not exceed five percent of the total farm acreage, even if the farm is divided into smaller parcels and sold to separate owners. Agricultural zoning also restricts subdivision and impervious surface on farms. In the A-35 zone, properties cannot be divided into lots smaller than 35 acres, and the maximum impervious surface allowed is 10 percent. In the A-10 zone, the allowed lot size is 10 acres, and impervious surface is limited to 15 percent of the parcel. Agricultural land in the Snoqualmie floodplain and the Newaukum Creek floodplain is zoned A-35. The agricultural land along the lower and middle Green River is zoned A-10. The prohibition on new residences in the floodway is a further limitation to the subdivision of agricultural parcels into smaller parcels. Farm Management Plans: FMPs identify resource concerns on farms and recommend BMPs to address them. They are prepared by the King Conservation District (KCD) at no expense to the landowner. The BMPs include agricultural infrastructure such as compost bins, farm roads, farm pads, confinement areas, as well as stream and wetland buffers, manure management practices, surface water runoff management, pasture management and riparian revegetation. For many activities, FMPs use Natural Resources Conservation Service (NRCS) standards, such as soil and slope specifications that govern the width of grass filter strips. Whenever a FMP is used to gain regulatory flexibility for construction in critical area buffers, the farm planners meet with DDES staff, who decide on the actual siting of a building or a farm pad, in consultation with the farm planner. Farm planners are typically trained through the NRCS certification program, and collectively have a broad range of expertise in agronomy, botany, ecology, natural resource management, wetland science, and engineering. FMPs with regulatory elements are reviewed and approved by King County Agriculture Program staff. For activities other than buildings, such as confinement areas, small manure storage facilities, farm field access roads, and livestock bridges, the standards for BMPs have been jointly developed and approved by DDES, KCD, and DNRP. King County and other organizations provide cost-sharing to livestock owners to help fund implementation of BMPs contained in FMPs. Through outreach, linking to funding sources, and partnerships with other organizations, landowners are encouraged to plant riparian buffers and make other improvements to fish habitat and other environmental conditions on their farms.
Existing Agricultural Operations: FMPs are not required for ongoing agricultural practices in place prior to January 1, 2005 where farming operations are not expanded. Farmers are, however, encouraged to develop FMPs on a voluntary basis. New or Expanded Agricultural Operations: New or expanded agricultural operations are allowed in previously cleared and historically farmed areas outside of critical areas and critical area buffers without any special requirements. In wetlands and aquatic area buffers, new or expanded agricultural operations are allowed only in accordance with an FMP that includes performance standards and BMPs that serve as the regulatory standard. New Agricultural Structures within Wetlands and Critical Area Buffers: With a FMP, farmers may place new farm buildings and unpaved field access roads in grazed or tilled wet meadows (also called palustrine emergent wetlands) and critical area buffers. New Agricultural Residential Buildings: New residential buildings (farm houses) are allowed in grazed wet meadows and critical area buffers, but only if no other alternative is available. Residential buildings are prohibited in the floodway.
King County National Flood Insurance Program Biological Opinion . Compliance Submittal and Programmatic Habitat Assessment
7-32
Livestock Management: King County's Livestock Management Ordinance has been in effect since the mid-1990s. This ordinance sets forth requirements for allowable animal densities and manure management, among other provisions. In some cases, FMPs may provide more flexibility with respect to livestock operations than would be allowed under the ordinance if an FMP is not implemented. In general, livestock may only be kept on properties larger than 20,000 square feet. A livestock management plan is not required for animal densities less than one large animal (a cow or horse) per two acres, although compliance with livestock management standards including limiting access of animals to streams and wetlands, fencing and manure management, is required. Manure piles must be set back a minimum of 100 feet from the nearest stream or wetland (excluding grazed/tilled wet meadows), and surface water runoff must be directed away from manure storage areas. Manure storage facilities must be covered during the winter months if located within 200 feet uphill of any Type S or F aquatic area or a Category I, II or III wetland. Manure may be spread only during the growing season and never when the ground is saturated or frozen. A property with one or more Type S or F aquatic areas, or a Category I, II, or III wetland and livestock densities greater than one large animal per two acres must provide appropriate critical area buffers. If an FMP is implemented, livestock densities may increase to a maximum of six animals per acre, and a 25-foot buffer is generally required. If an FMP is not implemented, adherence to the Livestock Management Ordinance standards is required, including a 50-foot buffer and animal densities no greater than three animals per acre. Commercial dairies must comply with the Washington State Dairy Nutrient Management Act (Chapter 90.64 RCW). King County Agriculture Drainage Assistance Program (ADAP): The King County ADAP program was developed to accommodate the need for maintaining drainage of agricultural waterways to support productive agriculture in existing agricultural areas. It is limited to certain waterways and provides detailed guidance for avoiding impacts to fish, construction impacts to water quality, and post-construction restoration. The program is explained in detail in Appendix B. Most ADAP projects require a FMP and a permit (HPA) from WDFW. Climate change is a concern that King County has been assessing and preparing for since before 2005 when it hosted a regional climate change conference that included presentations on a wide range of topics, including potential effects on fish and shellfish and sea level rise (http://www.kingcounty.gov/exec/globalwarming/environmental/2005-climate-change-conference/fish-shellfish.aspx). In response to Executive Orders on Global Warming Preparedness of March 2006 and King County Council Motion 12362 of October 2006, the County developed its initial climate response plan in 2007 (http://your.kingcounty.gov/exec/news/2007/pdf/ClimatePlan.pdf). Among several key issues, this initial plan highlighted the need for preparedness to address likely climate change effects including sea level rise and increases in air and water temperatures and fall and winter flooding, on marine shorelines, river floodplains, salmon and biodiversity. King County subsequently produced a 2009 Climate Change Action Report highlighting many initial steps that the County had already taken by that time, including reductions in greenhouse gas emissions associated with County facilities and vehicles, reducing flood risk by repairing levees and revetments, acquiring at risk floodplain properties, and improving flood warning and prediction capacity, planning for the impacts that projected sea level rise on county infrastructure, and assessing threats to the habitat value of its ecological lands (http://your.kingcounty.gov/dnrp/climate/documents/2009_King_County_Climate_Report.pdf).

King County National Flood Insurance Program Biological Opinion . Compliance Submittal and Programmatic Habitat Assessment
7-33
The County assessed the general effect of sea level rise on coastal flooding in 2005 (http://green.kingcounty.gov/wlr/science/seminar/pdfs/PDF41.pdf). In 2010, climate change impacts on river flooding were modeled and evidence was found that bigger and more frequent floods were likely although it was uncertain how many years before these changes would become significant or how large the changes may be (King County 2010). In 2011, an initial, detailed modeling of coastal flood hazard modeling and mapping using existing conditions and future climate change scenarios was completed for Vashon and Maury Island shorelines (King County 2011; http://your.kingcounty.gov/dnrp/library/water-and-land/flooding/Mapping/Vashon/VMI_Public_Meeting.pdf). King County responded to the concern for climate change in 2009 under Ordinance 16686 by updating flood regulations in its critical areas code in K.C.C. chapter 21A.24. This code change requires the lowest finished floor of new residential and non-residential structures to be elevated to the “flood protection elevation.” K.C.C. 21A.06.490 defines flood protection elevation as “an elevation that is three feet above the base flood elevation.” The code previously read “one foot above the base flood elevation.” This added freeboard standard builds in a factor of safety to accommodate higher flood levels as a result of climate change. The County has implemented numerous floodplain and coastal shoreline projects, including the many floodplain buyouts, levee setbacks or removals and restoration noted elsewhere in this PHA, that will reduce future flood damages while increasing capacity for future change. The County has developed institutional, management and technical mechanisms to track and adapt to climate change to extent feasible and consistent with recommendations of the Joint Institute for the Study of Atmosphere and Ocean (JISAO) Climate Impacts Group (Whitely et al. 2010). Given the County’s past record, it is likely that it will continue to adapt and respond as necessary to the effects of climate. King County has developed and maintains a comprehensive program of monitoring and assessment to support and guide management of its many environmental programs, including river and floodplain management, stormwater and agricultural, forest and rural land use activities, CIPs, and climate change response and adaptation described above. At the broad scale, the County has developed KingStat, a combination of high-level environmental indicators and performance measures that explain and convey the goals of its environmental programs to citizens, elected officials, managers and technical staff while also providing a series of targets and associated measures to track performance (http://your.kingcounty.gov/dnrp/measures/). KingStat includes indicators and associated performance measures for the aquatic environment, land and natural resources, health and safety, resource consumption and the atmosphere. Specific biological indictors are (notably for this PHA) the strength of ESA-listed Chinook runs and indices of biotic integrity using benthic invertebrates. Water quality indicators for fresh and marine waters include temperature, nutrients and a water quality index. The condition of shorelines is tracked and indicated by extent of armoring along marine shorelines and condition of freshwater riparian buffers within the County’s regulatory buffers. Climate change is tracked through greenhouse gas emissions and air temperatures. These indicators are paired with targets and performance measures of activities that King County can affect. Of high relevance to this PHA, the performance measure for Chinook salmon is the completion of projects identified under salmon recovery plans. For climate change performance measures include the extent to which greenhouse gases are reduced or mitigated for and the County’s precautionary adaptive responses.
King County National Flood Insurance Program Biological Opinion . Compliance Submittal and Programmatic Habitat Assessment
7-34
To inform KingStat and many other aspects of land and water management, the County regularly tracks and assesses change in a wide range of key environmental parameters such as flow, water quality, fish and benthic invertebrate species (see http://www.kingcounty.gov/environment/data-and-trends/monitoring-data.aspx) and maintains a comprehensive geographic information system containing land use and natural resource information and maps, including spatial distribution and, in many cases, extensive time series of key variables including land covers, land uses, zoning, parcels, fish, wildlife, soils, vegetation, stream, wetland, shoreline and floodplains for both marine and freshwaters. These data provide an extensive base of knowledge of environmental conditions throughout the County and allow conditions to be assessed and tracked over time. The County also conducts or participates in a wide array of specific studies to address particularly important questions. For example, the County is currently conducting a study, funded in part by the US Environmental Protection Agency, to assess effectiveness of its land use regulations. The study uses a treatment-control study design to monitor a series of six treatment and three control watersheds where detailed changes in watershed land cover and land uses and response variables are being tracked over time. The study will conclude in 2012 and no results were available at the time of this assessment. Other grant-funded monitoring and assessment projects relevant to this PHA include habitat status and trend monitoring in WRIA 8, assessments of salmon pre-spawn mortality in urban streams, nutrient loading in Quartermaster Harbor and improved understanding of benthic invertebrate response to land use changes. This PHA relies, in part, on land cover/land use analyses that project estimates of future land covers and land uses (See Chapter 6). Under the Washington State GMA, King County is required to evaluate its Comprehensive Plan and development regulations on an eight year cycle to ensure that the plan and regulations comply with the GMA. One of the GMA’s requirements is that critical area regulations must, in accordance with Chapter 365-195 WAC, include “the best available science . . . to protect the functions and values of critical areas” and that the county “shall give special consideration to conservation or protection measures necessary to preserve or enhance anadromous fisheries.” RCW 36.70A.172. As part of this periodic review of its development regulations, King County will re-assess its development regulations and policies to determine if they remain consistent with best available science and are consistent with salmon recovery mandates. Additionally, the County will track and report to FEMA permits issued in floodplains on an annual basis and, depending on the amount of floodplain development, will re-assess land covers and land use consistent with methods used in Chapter 6 at no less than five and no more than ten year intervals. A common concern with managing land use is unpermitted land development which may escape notice unless otherwise reported by a citizen. Such unpermitted actions are subject to enforcement with required remediation, mitigation or removal. Examples include major clearing and grading and construction of new buildings. When such actions are detected through complaints they are documented and rectified as described below.
Enforcement The King County Code makes it a civil violation to fail to comply with any county codes or rules that protect or regulate the environment or to fail to comply with any permit condition or code enforcement order. K.C.C. 23.02.030. See also, K.C.C. 21A.50.030. The King County Code prescribes a series of steps of escalating enforcement actions when King County determines that a code violation may have occurred. K.C.C. Title 23. These include a voluntary compliance agreement, citation, notice and order, and a stop work order. If a person is determined to be in
King County National Flood Insurance Program Biological Opinion . Compliance Submittal and Programmatic Habitat Assessment
7-35
violation, they are required to bring the property into compliance with the King County Code. K.C.C. 23.02.130. This includes a requirement to apply for all permits that are required to make any corrective actions. In the case of critical areas, the King County Code requires a violator to undertake corrective work to bring the property into compliance. K.C.C. 21A.50.035. This includes restoring any critical area or buffer that has been illegally altered. Restoration of streams, wetlands, and their buffers must comply with the relevant restoration standards for those critical areas. A work plan is required and includes monitoring to ensure that the restoration measures have been installed and that they are being maintained. The County maintains a database (“Permits Plus”) of enforcement actions (which are citizen-complaint-driven), including problem statement and resolution. The enforcement action does not get closed out until resolution. For stormwater, privately owned and maintained facilities and other BMPs are recorded on a property’s title, which allows King County access to inspect and enforce maintenance on them. This inspection occurs at least once every three years, and any required maintenance is conducted within one year of being identified. For all other development projects (e.g., commercial and residential projects), King County WLRD has a program for regular inspection of privately-maintained stormwater controls. This inspection occurs at least once every two years, and the property owner is notified of any required maintenance. If the property owner does not maintain the controls as directed, WLRD has a program to enforce compliance with the maintenance standards in the SWDM (see http://your.kingcounty.gov/dnrp/library/water-and-land/stormwater/stormwater-management-program/King-County-2012-SWMP-Final-wt-Apps.pdf). For agricultural operations, since 2004 the KCD’s protocol for effectiveness monitoring is to visit at least 50 percent of their farm plan sites each year for the first three years of a farm plan’s existence in order to identify the need for corrective actions and encourage complete FMP implementation. King County is officially responsible for compliance monitoring. FMPs used to gain flexibility from King County code are reviewed and approved by King County DNRP. Code enforcement can be undertaken if one or more BMPs contained in an FMP have not been implemented, leading to a natural resource impact issue at variance with the King County Livestock Management Ordinance or some other King County code pertaining to FMPs. DNRP does not conduct compliance monitoring on a routine basis. However, if a complaint is received about lack of FMP implementation, DDES has the authority to conduct enforcement actions. Since 1999 there have been approximately 150 code enforcement actions related to violations of the Livestock Management Ordinance, but very few of these have been in the floodplain. Violations have included improper manure management, unlimited livestock access to streams and wetlands, improper roof runoff management, unpermitted livestock structures and improper livestock densities. At the present time, the rate of compliance after an enforcement action is approaching 90 percent.
Determination of Effect
Puget Sound Chinook Salmon A determination of May Affect, Is Not Likely to Adversely Affect is made for Puget Sound Chinook salmon. King County’s land use regulations May Affect, but are Not Likely to Adversely Modify Critical Habitat for Puget Sound Chinook salmon. While King County’s regulations facilitate a range of allowed land uses and land development activity in floodplains,
King County National Flood Insurance Program Biological Opinion . Compliance Submittal and Programmatic Habitat Assessment
7-36
they do so in an environmentally-sound manner founded on peer-reviewed best available science. It is expected that associated impacts will be avoided or minimized and mitigated such that effects are likely at a level that is un-measurable and therefore insignificant. King County’s regulations are expected to have maintain existing conditions resulting from stringent regulation of land development activities These regulations are implemented against a backdrop of extensive recent and ongoing efforts to protect and restore lands and habitats while simultaneously maintaining low density rural development and agricultural and forestry land uses, rather than high density development (see Chapter 5). To the extent factors not addressed by these regulations will allow (e.g., future climate change), it is expected that habitats and the ecological processes that sustain them will be restored relative to current conditions.
CoastalPuget Sound Bull Trout A determination of May Affect, Is Not Likely to Adversely Affect is made for Coastal-Puget Sound bull trout. King County’s land use regulations May Affect, but are Not Likely to Adversely Modify Critical Habitat for Coastal-Puget Sound bull trout. While King County’s regulations facilitate a range of allowed land uses and land development activity in floodplains, they do so in an environmentally-sound manner founded on peer-reviewed best available science. It is expected that associated impacts will be avoided or minimized and mitigated such that effects are likely at a level that is un-measurable and therefore insignificant. King County’s regulations are expected to maintain existing conditions resulting from stringent regulation of land development activities. These regulations are implemented against a backdrop of extensive recent and ongoing efforts to protect and restore lands and habitats while simultaneously maintaining low density rural development and agricultural and forestry land uses, rather than high density development (see Chapter 5). To the extent factors not addressed by these regulations will allow (e.g., future climate change), it is expected that habitats and the ecological processes that sustain them will be restored relative to current conditions.
Puget Sound Steelhead Trout A determination of May Affect, Is Not Likely to Adversely Affect is made for Puget Sound steelhead trout. King County’s land use regulations May Affect, but Are Not Likely to Adversely Affect or modify habitat for these listed species. While King County’s regulations facilitate a range of allowed land uses and land development activity in floodplains, they do so in an environmentally-sound manner founded on peer-reviewed best available science. It is expected that associated impacts will be avoided or minimized and mitigated such that effects are likely at a level that is un-measurable and therefore insignificant. King County’s regulations are expected to maintain existing conditions resulting from stringent regulation of land development activities. These regulations are implemented against a backdrop of extensive recent and ongoing efforts to protect and restore lands and habitats while simultaneously maintaining low density rural development and agricultural and forestry land uses, rather than high density development (see Chapter 5). To the extent factors not addressed by these regulations will allow (e.g., future climate change), it is expected that habitats and the ecological processes that sustain them will be restored relative to current conditions.
King County National Flood Insurance Program Biological Opinion . Compliance Submittal and Programmatic Habitat Assessment
7-37
Southern Resident Killer Whales A determination of May Affect, Is Not Likely to Adversely Affect is made for SRKWs. King County’s land use regulations May Affect, but are Not Likely to Adversely Modify Critical Habitat for SRKWs or their key prey species, mainly Chinook salmon. While King County’s regulations facilitate a range of allowed land uses and land development activity in floodplains, they do so in an environmentally-sound manner founded on peer-reviewed best available science. It is expected that associated impacts to the food base of SRKW will be avoided or minimized and mitigated such that effects are likely at a level that is un-measurable and therefore insignificant. King County’s regulations are expected to maintain existing conditions resulting from stringent regulation of land development activities. These regulations are implemented against a backdrop of extensive recent and ongoing efforts to protect and restore lands and habitats while simultaneously maintaining low density rural development and agricultural and forestry land uses, rather than high density development (see Chapter 5). To the extent factors not addressed by these regulations will allow (e.g., future climate change), it is expected that habitats and the ecological processes that sustain them will be restored relative to current conditions.
MagnusonStevens Fishery Conservation and Management Act The Magnuson-Stevens Fishery Conservation and Management Act (MSA), as amended by the Sustainable Fisheries Act of 1996 (Public law 104-267), requires Federal agencies to consult with NMFS on activities that may adversely affect designated Essential Fish Habitat (EFH) for the relevant species. According to the MSA, EFH means “those waters and substrate necessary to fish for spawning, breeding, feeding, or growth to maturity.” For the Pacific West Coast, the Pacific Fisheries Management Council (Council) has designated EFH for federally managed groundfish (PFMC 2011), coastal pelagic species (PFMC 12006), and Pacific salmon species (PFMC 2007). The designated EFH for groundfish and coastal pelagic species encompasses all waters from the mean high water line, and upriver extent of saltwater intrusion in river mouths, along the coasts of Washington, Oregon, and California, seaward to the boundary of the U.S. exclusive economic zone (370.4 km) (PFMC 2011, 2006). The designated EFH in estuarine and marine areas for Pacific salmon species extends from the nearshore and tidal submerged environments within state territorial water out to the full extent of the exclusive economic zone (370.4 km) offshore of Washington, Oregon, and California north of Point Conception to the Canadian border (PFMC 2007). Freshwater EFH for Pacific salmon includes all those streams, lakes, ponds, wetlands, and other water bodies currently, or historically accessible to salmon in Washington, Oregon, Idaho, and California, except areas upstream of certain impassable man-made barriers, and longstanding, naturally-impassable barriers.
Essential Fish Habitat The effects of King County’s regulations described in this assessment on designated EFH will have no short or long-term effects for EFH designated MSA species and therefore will not adversely affect EFH.
King County National Flood Insurance Program Biological Opinion . Compliance Submittal and Programmatic Habitat Assessment
7-38
These are the appropriate conclusions when effects on the species and their critical habitat are expected to be beneficial, discountable, or insignificant. Limitations on allowed floodplain development activities in combination with appropriate avoidance and minimization and mitigation procedures, extensive conservation measures, and significant investments in habitat protection and restoration and the acquisition and maintenance of low density forestry or agricultural land uses within floodplains and in contributing watershed areas will reduce direct impacts on the listed species and their critical habitat.
References Anchor Environmental, L.L.C. 2004. Lower Green River Baseline Habitat Survey Report. Report
prepared for WRIA 9 Technical Committee and King County Department of Natural Resources.
Bell, M.C. 1973, 1986, and 1990. Fisheries handbook of engineering requirements and
biological criteria. US Army Corps of Engineers, North Pacific Division, Portland, Oregon.
Berg, L. and T.G. Northcote. 1985. Changes in territorial, gill-flaring, and feeding behavior in
juvenile coho salmon (Oncorhynchus kisutch) following short-term pulses of suspended sediment. Canadian Journal of Fisheries and Aquatic Sciences. 42:1410-1417.
Berman, C.H. 1998. Oregon Temperature Standard Review. U.S. Environmental Protection
Agency Region, Region 10, Seattle, Washington. Berman, C.H. and T.P. Quinn. 1991. Behavioral thermoregulation and homing in spring chinook
salmon, Oncorhynchus tshawytscha (Walbaum), in the Yakima River. Journal of Fisheries Biology 39: 301-312.
Beschta, R.L. 1978. Long-term patterns of sediment production following road construction and logging in the Oregon Coast Range. Water Resources Research 14: 1011-1016. Beschta, R.L., Bilby, R.E., Brown, G.W., Holtby, L.B. and T.D. Hofstra. 1987. Stream
temperature and aquatic habitat: fisheries and forestry interactions, pp. 191-232. In Proceedings of a Symposium on Streamside Management: Forestry and Fishery Interactions (Salo, E.O. and T.W. Cundy, eds.), Seattle, University of Washington, Feb. 12-14, 1986.
Bilby, R.E., J.W. Ward. 1991. Characteristics and function of large woody debris in streams
draining old growth, clear-cut and second-growth forests in southwestern Washington. Canadian Journal of Fisheries & Aquatic Sciences 48: 2499-2508.

King County National Flood Insurance Program Biological Opinion . Compliance Submittal and Programmatic Habitat Assessment
7-39
Bisson, P.A. and R.E. Bilby. 1982. Avoidance of suspended sediment by juvenile coho salmon. North American Journal of Fisheries Management 2: 371-374.
Bisson, P. A., Bilby, R. E., Bryant, M.D., Dolloff, C.A., Grette, G.B., House, R.A., Murphy, M.L.,
Koski, K.V. and J.R. Sedell. 1987. Large woody debris in forested streams in the Pacific Northwest: past, present, and future. Pages 143-190 in. O. E. Salo and T. W. Cundy, Eds. Streamside management: forestry and fish interactions. College of Forest Resources University of Washington. Seattle, Washington.
Bisson, P.A., Ice, G.G., Perrin, C.J., and Bilby, R.E., 1992, Effects of forest fertilization on water
quality and aquatic resources in the Douglas-fir region, in Chappell, H.N., Weetman, G.F., and Miller, R.E. eds., Forest fertilization—Sustaining and improving nutrition and growth of western forests, Contribution No. 73, p. 179-193. University of Washington, Institute of Forest Resources, Seattle, Washington.
Bjornn, T.C. and D.W. Reiser. 1991. Habitat requirements of salmonids in streams, p. 83-138.
In. Influences of Forest and Rangeland Management on Salmonid Fishes and Their Habitats (Meehan, W.R., ed.). Bethesda: American Fisheries Society.
Bothwell, M.L. 1989. Phosphorus-limited growth dynamics of lotic periphytic diatom community:
aerial biomass and cellular growth rate responses. Canadian Journal of Fisheries and Aquatic Sciences 46: 1293-1301.
Bryant, M.D. 1983. The role and management of woody debris in west coast salmonid nursery
streams. North American Journal of Fisheries Management 3: 322-330. Cederholm, C.J., Reid, L.M. and E.O. Salo. 1981. Cumulative effects of logging road sediment
on salmonid populations in the Clearwater River, Jefferson County, Washington, p. 38-74. In: Proceedings of a Conference on Salmon Spawning Graven: A Renewable Resource in the Pacific Northwest. Report 39. State of Washington Water Resource Center. Washington State University, Pullman, Washington.
Chapman, D. W. 1988. Critical review of variables used to define effects of fines in redds of
large salmonids. Transactions of the American Fisheries Society 117: 1-21. Coccoli, Holly. 1996-2000. Personal communication. MIT, Auburn, Washington. Collins, B.D, D.R. Montgomery, and A.J. Sheikh. Reconstructing the historical riverine
landscape of Puget Sound Lowland. In Montgomery, D.R., S. Bolton, D.B. Booth, and L. Wall (eds.) Restoration of Puget Sound Rivers. University of Washington Press, Seattle, WA.
Dunham, J., Rieman, B, and G. Chandler. 2003. Influences of Temperature and Environmental
Variables on the Distribution of Bull Trout within Streams at the Southern Margin of Its Range. North American Journal of Fisheries Management 23:894-904, 2003.
Elosegi, A., and L.B. Johnson. 2003. Wood in streams and rivers in developed landscapes.
Pages 337-353. In S.V. Gregory et al. (ed.) Ecology and management of wood in world rivers. Symposium 37. Am. Fisheries Soc., Bethesda, Maryland.
King County National Flood Insurance Program Biological Opinion . Compliance Submittal and Programmatic Habitat Assessment
7-40
Everest, F.H., Beschta, R.L., Scrivener, Koski, K.V., Sedell, J.R. and C.J. Cederholm. 1987. Fine sediment and salmonid production: a paradox, P. 98-142. In Salo, E.O. and T.W. Cundy (eds.). Streamside Management: Forestry and Fisheries Interactions. Contribution no. 57, Institute of Forest Resources, University of Washington, Seattle, Washington.
Fisheries Sciences, Inc. 1984. Green River water temperature characteristics. Seattle: Fishery
Sciences, Inc., Report to the Muckleshoot Indian Tribe, Auburn, Washington. Fritz, Rob, King County Department of Transportation, personal communication, 2011. Fuerstenberg et al. 1996. Ecological Conditions and Limitations to Salmonid Diversity in the
Green River. King County Department of Natural Resources, Surface Water Management Division, Seattle, WA.
Gregory, S.V., G.A. Lambertti, D.C. Erman, [and others]. 1987. Influence of forest practices on
aquatic production. In: Streamside Management: Forestry and Fishery Interactions; E.O. Salo and T.W. Cundy, eds., pp. 233-256. Contribution 57, University of Washington, Institute of Forest Resources, Seattle, Washington.
Gregory, S.V., F.J. Swanson, W.A. McKee and K.W. Cummins. 1991. An ecosystem
perspective of riparian zones. Bioscience 41: 540-551. Grette, G.B. and E.O. Salo. 1986. The status of anadromous fishes of the Green/Duwamish
River system. Seattle: Evans-Hamilton, Inc. 138 p. Harmon, M.E., Franklin, J.F., Swanson, F.J., Sollins, P., Gregory, S.V., Lattin, J.D., Anderson,
N.H., Cline, S.P., Aumen, N.G., Sedell, J.R., Lienkaemper, G.W., Cromack, K., Jr., and K.W. Cummins. 1986. Ecology of coarse woody debris in temperate ecosystems. Advances in Ecological Research 15: 133-302.
Kaje, J. 2009. Snoqualmie Watershed Water Quality Synthesis Report. King County Water and
Land Resources Division, Seattle, Washington. Karr, J. 1991. Biological integrity: a long-neglected aspect of water resource management.
Ecological Applications 1: 66-84. King County. 1993b. Cedar River current and future conditions report. King County Surface
Water Management Division, Department of Public Works, Seattle, Washington. King County. 2004. King County Best Available Science, Volume I: Review of Science
Literature. King County Department of Natural Resources and Parks, Seattle, Washington.
King County. 2010. Climate change impacts on river flooding: State-of-the-science and
evidence of local impacts. Prepared by Curtis DeGasperi, Water and Land Resources Division, Seattle, Washington.
King County National Flood Insurance Program Biological Opinion . Compliance Submittal and Programmatic Habitat Assessment
7-41
King County. 2011. Coastal flood hazard study technical documentation for Vashon-Maury
Island, King County, WA. Prepared by Northwest Hydraulic Consultants Inc, for King County Water and Land Resources Division, Department of Natural Resources and Parks, Seattle, WA.
Latterell, J., K. Higgins, K. Lynch, K. Bergeron, T. Patterson, E. Ostergaard, and M. Knox. 2012.
WRIA 9 status and trends monitoring report. Report for WRIA 9 Watershed Ecosystem Forum prepared by WRIA 9 Implementation Technical Committee, February, 2012, p. 144.
Liquori, M., D. Martin, L. Benda, R. Coats and D. Gantz. 2008. Scientific Literature Review of
Forest Management Effects on Riparian Functions for Anadromous Salmonids. The California State Board of Forestry and Fire Protection, Sacramento, California.
McCullough, D. 1999. A Review and Synthesis of Effects of Alterations to the Water
Temperature Regime on Freshwater Life Stages of Salmonids, with Special Reference to Chinook Salmon. Columbia Intertribal Fisheries Commission, Portland, OR. Prepared for the U.S. Environmental Protection Agency Region 10. Published as EPA 910-R-99-010.
McIntosh, B.A., C.E. Torgersen, D.M. Price, and H.W. Li. 1995. Distribution and habitat
utilization, movement patterns, and the use of thermal refugia by spring chinook in the Grande Ronde, Imnaha, and John Day Basins. Annual report to the Bonneville Power Administration. Project Number 93-7000.
Naiman, R.J., Bilby, R.E. and P.A. Bisson. 2000. Riparian Ecology and Management in the
Pacific Coastal Rain Forest. Bioscience 50: 996-1010. National Marine Fisheries Service. 1996. Making Endangered Species Act Determinations of
Effect for Individual or Grouped Actions at the Watershed Scale. National Marine Fisheries Service Environmental and Technical Services Division, Habitat Conservation Branch, Portland, Oregon.
National Marine Fisheries Service. 1999. A guide to biological assessments. National Marine
Fisheries Service, Washington Habitat Conservation Branch, Lacey, Washington. Nelson, R.L., M.L. McHenry and W.S. Platts. 1991. Mining, p. 425-467. In Meehan, W.R. (ed.),
Influences of Forest and Rangeland Management on Salmonid Fishes and Their Habitats. Bethesda: American Fisheries Society, Special Publication 19.
Norris, L.A., Lorz, H.W. and S.V. Gregory. 1991. Forest chemicals, p. 207-196. In Meehan,
W.R. (ed.), Influences of Forest and Rangeland Management on Salmonid Fishes and Their Habitats. Bethesda: American Fisheries Society, Special Publication 19.
Oregon Department of Environmental Quality (DEQ) (1995), 1992-1994 Water Quality
Standards Review-Temperature, Oregon Department of Environmental Quality, Portland, Oregon.

King County National Flood Insurance Program Biological Opinion . Compliance Submittal and Programmatic Habitat Assessment
7-42
Pacific Fishery Management Council (PFMC). 2006. Coastal Pelagic Species: Fishery Management Plan and Amendments. 2006, As Amended Through Amendment 12. Pacific Fishery Management Council, Portland, Oregon.
Pacific Fishery Management Council (PFMC). 2007. Pacific Salmon Fishery Management Plan
and Amendments: Adopted/Approved Amendments, As Amended Through Amendment 15. Pacific Fishery Management Council, Portland, Oregon.
Pacific Fishery Management Council (PFMC). 2011. Pacific Coast Groundfish Fishery
Management Plan for the California, Oregon, and Washington Groundfish Fishery, As Amended Through Amendment 23, Including Secretarial Amendment 1. Pacific Fishery Management Council, Portland, Oregon.
Perkins, S.J. 1994. The Shrinking Cedar River—Channel Changes following flow regulation and
bank armoring. From: Effects of human-induced changes on hydrologic systems. American Water Resources Association pp 649-659.
Peters, R.J., B.R. Missildine and D.L. Low. 1998. Seasonal fish densities near river banks
stabilized with various stabilization methods: first year report of the flood technical assistance project. U.S. Fish and Wildlife Service, Olympia, Washington.
Sedell, J.R., G.H. Reeves, F.R. Hauer, J.A. Stanford, and C.P. Hawkins. 1990. Role of refugia
in recovery from disturbance: modern fragmented and disconnected river systems. Environmental Management 14: 711-724.
Seiler, D. 1989. Differential survival of Grays Harbor basin anadromous salmonids: water quality
implications. pp. 123-135 In Levings, C.D., Holtby, L.B. and M.A. Henderson (eds.), Proceedings of the National Workshop on Effects of Habitat Alteration on Salmonid Stocks. Canadian Special Publication of Fisheries and Aquatic Sciences 105.
Selong, J. H., T.E. McMahon, A.V. Zale, and F.T. Barrows. 2001. Effect of temperature on
growth and survival of bull trout, with application of an improved method for determining thermal tolerance for fishes. Transactions of the American Fisheries Society 130:1026-1037.
Spence, B.C., G.A. Lomnicky, R.M. Hughes, R.P. Novitzki. 1996. An ecosystem approach to
salmonid conservation. TR-4501-96-6057. ManTech Environmental Research Services Corporation, Corvallis, Oregon.
Swanson, F.J. and G.W. Leinkaemper. 1978. Physical consequences of large organic debris in
Pacific Northwest Streams. General Technical Report PNW-69, USDA Forest Service, Pacific Northwest Forest and Range Experiment Station, Portland, Oregon.
Swanson, F.J., Benda, L.E., Duncan, S.H., Grant, G.E., Megahan, W.F., Reid, L.M. and R.R.
Ziemer. 1987. Mass failures and other sediment production in Pacific Northwest landscapes, p. 9-38. In Proceedings of a Symposium on Streamside Management: Forestry and Fishery Interactions (Salo, E.O. and T.W. Cundy, eds.), Seattle, University of Washington, Feb. 12-14, 1986.
Thomas, B.P. and R.H. Thompson. 1936. Inter-county river improvement. Annual report of the
engineers. Huntley and Rowe Inc., Tacoma, Washington, 31 p.

King County National Flood Insurance Program Biological Opinion . Compliance Submittal and Programmatic Habitat Assessment
7-43
Triska, F.J., Sedell, J.R., Cromack, K., Jr., Gregory, S.V. and F.M. McCorison. 1984. Nitrogen
budget for a small coniferous forest stream. Ecological Monographs 54: 119-140. U.S. Fish and Wildlife Service (USFWS). 1999. A Framework to Assist in Making Endangered
Species Act Determinations of Effect for Individual or Grouped Actions at the Bull Trout Subpopulation Watershed Scale.
U.S. Fish and Wildlife Service (USFWS). 1998. Bull trout interim conservation guidance,
December 9, 1998. U.S. Fish and Wildlife Service Western Washington Office, Lacey, Washington.
U.S. Fish and Wildlife Service (USFWS) and National Marine Fisheries Service (NMFS). 1998.
Endangered Species Consultation handbook: procedures for conducting consultation and conference activities under Section 7 of the Endangered Species Act. March, 1998.
U.S. Geological Survey (USGS). The “100-Year Flood”: Fact Sheet 229-96. U.S. Geological
Survey, Tacoma, Washington.
Van Sickle, J., and S.V. Gregory. 1990. Modeling inputs of large woody debris to streams from falling trees. Can. J. For. Res. 20:1593-1601. Warren, C.E., Wales, J.H., Davis, G.E. and P. Doudoroff. 1964. Trout production in an
experimental stream enriched with sucrose. J. Wildlife Management 28: 617-660. Washington Department of Ecology (WDOE), Science Applications International Corporation,
Shapiro and Associates, Taylor Associates and Environmental Systems Research Institute. 1995. Amendments to: Initial Watershed Assessment, Water Resources Inventory Area 9, Green-Duwamish Watershed. Bellevue, Washington: Washington Department of Ecology Northwest Regional Office, Water Resources Program.
Washington State Department of Transportation (WSDOT). 2011. Environmental procedures
manual M31-11. June 2011. see http://www.wsdot.wa.gov/Publications/Manuals/M31-11.htm
Whitely Binder, L.C., J. Krencicki Barcelos, D.B. Booth, M. Darzen, M.M. Elsner, R.A. Fenske,
T.F. Graham, A.F. Hamlet, J. Hodges-Howell, J.E. Jackson, C. Karr, P.W. Keys, J.S. Littell, N.J. Mantua, J. Marlow, D. McKenzie, M. Robinson-Dorn, E.A. Rosenberg, C. Stöckle, and J.A. Vano. 2010. Preparing for climate change in Washington State. Climatic Change 102(1-2): 351-376

King County National Flood Insurance Program Biological Opinion . Compliance Submittal and Programmatic Habitat Assessment
7-44
Acronyms ADAP Agriculture Drainage Assistance Program BiOp Biological Opinion BMP(s) Best management practice(s) CAO Critical Areas Ordinance CIP Capital improvement project CWA Clean Water Act EFH Essential fish habitat ESA Endangered Species Act FEMA Federal Emergency Management Agency FMP Farm management plan FPP Farmland Preservation Program GMA Growth Management Act HCP Habitat Conservation Plan HHD Howard Hanson Dam KCD King Conservation District LID Low impact development LWD Large woody debris MSA Magnuson-Stevens Fishery Conservation and Management Act NMFS National Marine Fisheries Service NOAA National Oceanic and Atmospheric Administration NPDES National Pollutant Discharge Elimination System NRCS National Resources Conservation Service OHWM Ordinary high water mark
King County National Flood Insurance Program Biological Opinion . Compliance Submittal and Programmatic Habitat Assessment
7-45
RM Rivermile SPTH Site potential tree height SRKW Southern Resident Killer Whale SWDM Surface Water Design Manual USFS United States Forest Service USFWS United States Fish and Wildlife Service USGS United States Geological Survey W/D Width-depth (ratio) WDFW Washington Department of Fish and Wildlife WDNR Washington Department of Natural Resources WDOE Washington Department of Ecology WLRD Water and Land Resources Division (King County) WRIA Water Resource Inventory Area
Chapter 8
Response to FEMA on King County’s
September 2010 Checklist


King County National Flood Insurance Program Biological Opinion . Compliance Submittal and Programmatic Habitat Assessment
8‐i
Chapter 8 Contents
Response to FEMA on King County’s September 22, 2010 Checklist ............................ 8-1
Provision 2 – Mapping Criteria ..................................................................................... 8-1
Provision 3 – Administrative Procedures...................................................................... 8-2
Provision 4 – General Development Standards ........................................................... 8-3
Provision 5 – Habitat Protection Standards.................................................................. 8-6
Tables
Table 8-1. Zoning Densities in King County, Washington 100-year Floodplains .......... 8-9

King County National Flood Insurance Program Biological Opinion . Compliance Submittal and Programmatic Habitat Assessment
8‐ii

King County National Flood Insurance Program Biological Opinion . Compliance Submittal and Programmatic Habitat Assessment
8-1
Chapter 8 ‐ Response to FEMA on King County’s September 22, 2010 Checklist
Response to FEMA on King County’s September 22, 2010 Checklist This chapter includes a written response to the comments FEMA provided to King County’s September 22, 2010 checklist submittal. King County met with FEMA Region 10 staff along with staff from NMFS on April 18, 2011 to clarify the questions and comments contained in the February 18, 2011 letter. Following that meeting, King County proceeded with the preparation of this Programmatic Habitat Assessment.
Provision 2 – Mapping Criteria FEMA Comment: Provision 2.a.1 re Riparian Habitat Zones Please provide a justification for using buffer widths below the buffers recommended in Appendix 4 of the RPA, especially in the context of the Urban Growth Areas where the buffers appear to be substantially less than those required in Appendix 4 of the Biological Opinion. Response: See Appendix A: King County’s justification for less than NOAA-recommended Biological Opinion buffers. FEMA Comment: Provision 2.b re New Mapping Please provide an explanation for when future conditions are required. The section of King County Code that is referenced to (21A.24.358) says “if a basin plan or hydrologic study included projected flows under future dev conditions has been completed and approved by King County, the department shall use these future projections.” It does not state when/if such studies will be written nor what modeling would be conducted, nor how/if/when cumulative effects will be assessed. Response: The RPA says that FEMA will revise map modeling methods to consider future conditions. At this time King County uses the mapping methods FEMA requires the County to use to create a Flood Insurance Rate Map. At such time FEMA amends the mapping methods, King County will follow those mapping methods when updating or creating new maps. KCC 21A.24.358 says King County will use these future projections when a study has included projected flows under future development conditions.
King County National Flood Insurance Program Biological Opinion . Compliance Submittal and Programmatic Habitat Assessment
8-2
Provision 3 – Administrative Procedures FEMA Comment: Provision 3.b “The applicant must record a Notice of Title that the property contains land within the RHZ and/or 100-year floodplain before a permit may be issued.” The King County Code cited (21A.24.170) does not appear to include language specific to “Notice on Title.” Please explain how the provisions of this code provide a notice to a property owner or buyer that the property is in a 100-year floodplain. Response: “Flood hazard areas” and "aquatic areas" are defined as critical areas under the King County Code. See, K.C.C. 21A.06.254. KCC 21A.24.170 requires the owner of a property that contains critical areas or buffers on their property on which they are developing to file a notice recorded on title of the existence of critical areas on the property. The applicant is required to provide proof that the notice has been filed for public record before the permit is issued. The details and specific notice text are contained in the “Sensitive Areas: Notice on Title” Public Rule that is available at http://your.kingcounty.gov/ddes/pub_rule/acrobat/21a-24n-title.pdf. “Sensitive areas” is the term King County used prior to amending the code to use the term “critical areas.” Sensitive areas and critical areas are basically the same. The Public Rule has not yet been updated to use the term “critical areas.” In addition, KCC 21A.24.240D5c requires the following notice be placed on the face of the recorded subdivision, short-subdivision, urban planned development, or binding site plan in a flood hazard area:
“Lots and structures located within flood hazard areas may be inaccessible by emergency vehicles during flood events. Residents and property owners should take appropriate advance precautions.”
FEMA Comment: Provision 3.c “Communities that permit dev outside the Protect Area must track the projects for which they issue floodplain dev permit, including effects to flood storage and fish habitat and mit provided.” Please explain how the King County code cited (21A.24.100) establishes tracking and monitoring as described in the Biological Opinion. Response: KCC 21A.24.100 requires a critical area review before any clearing, grading or site preparation is performed to determine whether there are any critical areas on the property. If critical areas are identified, the applicant is required to prepare a critical areas report to evaluate the proposal and the probably impacts. K.C.C. 21A.24.110. “Flood hazard areas” are defined as a critical area under K.C.C. 21A.06.254. Any development within the 100-year floodplain is required to go through a critical areas review. K.C.C. 21A.24.125 requires an application to go through mitigation sequencing, with the highest priority consideration to be avoidance of critical area impacts. If a development proposal requires mitigation, K.C.C. 21A.24.130 requires monitoring of the mitigation. If the monitoring shows a significant deviation from the predicted impact, the application must implement a contingency plan to address those impacts. In addition, King County has established a review process through an Administrative Policy and Procedure called “Flood Hazard Certification.”These policies and procedures require the completion of a Flood hazard Certification worksheet for all development located on a site that is

King County National Flood Insurance Program Biological Opinion . Compliance Submittal and Programmatic Habitat Assessment
8-3
wholly or partially within a special flood hazard area. The certification is a joint review between two King County Departments: Department of Development and Environmental Services and Department of Natural Resources and Parks. Engineers from both departments must agree that a development proposal is in compliance with the relevant flood hazard code requirements. Copies of all Flood Hazard Certifications are maintained for tracking and monitoring. Finally, King County has established a separate permit called a “Flood Miscellaneous” permit that must be signed off before any permit can be issued for a development proposal located within a special flood hazard area. These “Flood Miscellaneous” permits are maintained in King County’s electronic permit tracking system from which reports can be generated for tracking purposes.
Provision 4 – General Development Standards FEMA Comment: Provision 4.b – Stormwater and drainage feature shall incorporate low impact dev. Techniques that mimic pre-dev hydrologic conditions, when tech feasible.” The King County code cited (21A.24.240.D4) states “A dev proposal shall provide adequate drainage in accordance with the King County Storm Water Design Manual (KCSWDM) to reduce exposure to flood damage.” The above language does not overtly require incorporating low-impact development techniques. Please explain how the KCSWDM meets the goal of this performance standard. Response: King County codes allow, encourage, and require the use of Low Impact Development (LID) BMPs where feasible, including specific measures used to minimize the disturbance of soils and vegetation. The SWDM requires the use of a minimum amount of LID BMPs (referred to as flow control BMPs) on nearly all projects and allows LID BMPs to be used as the sole means of managing stormwater for many projects. The LID BMPs allowed include preserving native vegetation and limiting impervious surface as well as a whole host of more structural BMPs such as permeable pavement, vegetated roofs, rain gardens, rainwater harvesting, infiltration systems, and dispersion devices. Examples of the LID BMPs used in rural areas include, but are not limited to, forest retention, fencing livestock out of streams, stream buffers, manure lagoons, and native plantings in stream buffers. In rural areas where LID flow and water quality control BMPs are used, forest, farm, and rural stewardship plans are developed by individual property owners, with support from King County or the King Conservation District (KCD), to establish, among other things, the customized maintenance standards for those BMPs. The County meets this performance requirement as follows: KCC 9.04 and the SWDM require the application of LID flow control BMP techniques on
nearly all new development and redevelopment projects that are subject to drainage review. These required flow control BMPs include both non-structural BMPs (e.g., native vegetation retention and reduced footprint, etc.) and structural BMPs (e.g., infiltration trenches, dispersion trenches, rain gardens, etc.).
KCC 16.82.100 requires that clearing and grading activities minimize removal of the duff layer and native top soil and that disturbed soils be amended with compost or other organic matter to mitigate loss of soil moisture-holding capacity.
King County has an inspection program for privately owned flow control BMPs to determine the execution of the activities necessary to ensure the performance measures described.
Additionally, King County’s Critical Areas Ordinance allows modification of standard aquatic, wetland and wildlife habitat conservation area buffers on properties zoned Rural Area residential
King County National Flood Insurance Program Biological Opinion . Compliance Submittal and Programmatic Habitat Assessment
8-4
(RA) when landowners submit an approved Rural Stewardship Plan that includes LID strategies. Rural Stewardship Plans promote minimal disturbance of native soils and vegetation. They decrease hydrologic changes by reducing development footprints and carefully siting developed areas, and by using on-site infiltration and dispersion techniques. The grading code requires that where soil is disturbed, a minimum of 8 inches of soil having an organic content of 8-13 percent must be provided. The zoning code prohibits clearing in stream and wetland buffers and limits clearing on steep slopes. King County was involved with the LID committee enacted to address the LID issues raised as part of the Pollution Control Hearing Board’s ruling on the appeal of the 2007 Permit. FEMA Comment: Provision 4.c – Creation of new impervious surfaces shall not exceed 10% of the surface area of the portion of the lot in the floodplain unless mitigation is provided.” Please justify the determination that an allowance of maximum of 15% of new impervious surface is adequate to meet the performance standard. Response: Core Requirement #3: Flow Control, Section 1.2.3 (page 1-34) of the 2009 KCSWDM requires proposed projects, including redevelopment projects to mitigate the impacts of storm and surface water runoff generated by new impervious surface, new pervious surface, and replaced impervious surfaces targeted for flow mitigation as specified in subsequent sections. The threshold above which mitigation is required is 2,000 square feet or more of new plus replaced impervious surface created or 35,000 square feet or more of new pervious surface added. Especially on larger lots, these thresholds are much more protective than the 10 percent threshold included in Provision 4.c. FEMA Comment: Provision 4.e “Uses that are not permitted in the Protected Area unless shown not to adversely affect water quality, habitat, [etc.]…include septic tanks and drain fields, dumping of any materials, haz or sanitary waste landfills, receiving areas for toxic or hazardous waste or other contaminants.” King County cites 4 ordinances that may meet these performance standards; however, it is unclear how these ordinances in part or whole meet these performance standards. Please provide documentation and clarification as to why King County believes these ordinances meet the performance standards. Response: Septic tanks and drainfields KCC 21A.24.240I requires that utilities be dry flood-proofed or elevated to or above the 100-year flood elevation. Consequently, if they are not subject to flood water there is limited chance of contamination. In addition, under KCC 21A.24.045, a new on-site sewage disposal system (e.g. septic tank and drainfield) is not allowed within any of the following critical areas: 1. Landslide hazard and buffer 2. Steep slope hazard and buffer 3. Wetland and buffer 4. Aquatic area and buffer 5. Severe channel migration hazard area 6. Wildlife area and network

King County National Flood Insurance Program Biological Opinion . Compliance Submittal and Programmatic Habitat Assessment
8-5
An existing on-site sewage disposal system may be maintained and repaired, but in the wildlife area and network this repair and maintenance is allowed only if no clearing, external construction or other disturbance occurs during the breeding season of certain species identified in KCC 21A.24.382. Maintenance and repair within the aquatic area and buffer and severe channel migration hazard area is allowed only if the disturbed area is not expanded, clearing is limited to the maximum extent practical and no hazardous substances, pesticides or fertilizers are applied. Dumping of any materials It is unlawful to dump anything except in an approved disposal site. KCC 10.04.080 Littering and unlawful dumping.
A. It is unlawful to place, throw, deposit or otherwise dispose of solid waste other than in a receptacle provided for that purpose, in any public place, public road, public park, on any private property or in the waters within King County, except as specifically authorized by this title or at the official solid waste facilities provided for that purpose by King County.
B. It is unlawful for the owners or occupants of private property to deposit or accumulate, or to permit the deposit or accumulation of solid waste upon the private property. However, this shall not prohibit the storage of solid waste or recyclable materials in public or private receptacles, in solid waste containers or other approved receptacle or in securely tied bundles when the receptacles or bundles are for immediate or approved periodic disposal. Additionally:
1. The use of a compost pile or bin shall not be prohibited if the use and maintenance thereof is in such a manner as to prevent the attraction, breeding, harboring, or any combination thereof, of insects and rodents; and
2. Any recycling operation shall not be affected if it is operating in accordance with all applicable rules, laws or other permit requirements. Any such use permitted under this subsection B.2. shall not be construed to permit a nuisance as defined by state law.
C.1. It is unlawful for any person to haul solid waste on publicly maintained streets, roads or highways in King County unless the load is secured.
2. Fees for a person arriving at a staffed solid waste facility with an unsecured load are in K.C.C. 10.12.040. (Ord. 15912 § 4, 2007: Ord. 8891 § 8, 1989). Hazardous or sanitary waste landfills Hazardous or sanitary waste landfills are allowed in King County only through a Special Use Permit, which is approved by the King County Council rather than the building department. The use is only allowed if it meets specified standards. The Special Use Permit requires the highest level of review in King County and must meet the requirements of KCC 21A.24.050 in addition to all other protection standards in King County Code. These uses are not allowed in any of the critical areas governed by K.C.C. 21A.24.045, such as aquatic areas, wetlands, or their buffers. In addition, these uses, which are defined as critical facilities under K.C.C. 21A.06.260, not allowed in the zero-rise floodway or the FEMA floodway. KCC 21A.44.050 Special use permit. A special use permit shall be granted by the county, only if the applicant demonstrates that:
A. The characteristics of the special use will not be unreasonably incompatible with the types of uses permitted in surrounding areas;
B. The special use will not materially endanger the health, safety and welfare of the community;
C. The special use is such that pedestrian and vehicular traffic associated with the use will not be hazardous or conflict with existing and anticipated traffic in the neighborhood;
King County National Flood Insurance Program Biological Opinion . Compliance Submittal and Programmatic Habitat Assessment
8-6
D. The special use will be supported by adequate public facilities or services and will not adversely affect public services to the surrounding area or conditions can be established to mitigate adverse impacts;
E. The location, size and height of buildings, structures, walls and fences, and screening vegetation for the special use shall not hinder or discourage the appropriate development or use of neighboring properties; and
F. The special use is not in conflict with the policies of the Comprehensive Plan or the basic purposes of this title. (Ord. 10870 § 626, 1993). Receiving areas for hazardous waste or other contaminants A receiving area for hazardous waste or other contaminants would be classified as a transfer station in King County Code, which requires a Special Use permit. See discussion above regarding Special Use Permits. Transfer stations are not allowed within any of the critical areas governed by K.C.C. 21A.24.045, including, wetlands, aquatic areas, and their buffers.
Provision 5 – Habitat Protection Standards FEMA Comment: Provision 5.a “Any improvement or repairs to existing structures that result in greater than 10% increase of the structure foot-print must mitigate for any adverse effect.” The King County Code that is cited (21A.24.045C) which refers to a 3-page table of activities and the accompanying Part D that lists 60 conditions that apply to the various activities listed in the 3-page table appears to indicate that within the “severe CMZ” that no expansion is allowed that extends towards a channel migration hazard area and, that a structure cannot be added to by more than 1000 square feet. For projects outside of the severe CMZ, but still within a wet meadow or buffer, you can’t add more than 1000 square feet. Please provide an explanation of how limiting expansion of a structure to 1000 square feet equates to limiting expansions to not more than 10%. Additionally, please provide information on how this performance standard is met in the remaining Special Flood Hazard Area. Response: King County requires mitigation for the impacts of any expansion, whether it is a 100 square foot expansion or a 1,000 square foot expansion. See, K.C.C. 21A.24.045B which provides that the alterations in the table are allowed only if they comply with the conditions in that section, the development standards for the different critical areas, the impact avoidance and mitigation requirements of the chapter, and any other applicable requirements of the chapter. The 1,000 square feet is a limit on when an expansion may be permitted as an allowed alteration. An expansion that exceeds 1,000 square feet would require an alteration exception, which requires among other factors, a demonstration that there is no feasible alternative, the alteration is the minimum necessary, and that there is not an unreasonable risk to public health and safety. FEMA Comment: Provision 5.b “Removal of native veg. must leave 65% of the surface area of the portion of the property in the floodplain in an undeveloped state.” Please provide information on how King County is addressing the requirement to retain native vegetation in light of the court ruling. This provision is a performance standard that must be addressed. If the performance standard cannot be met then a habitat assessment indicating no adverse effect and/or concurrence from the services must be provided that demonstrates that the

King County National Flood Insurance Program Biological Opinion . Compliance Submittal and Programmatic Habitat Assessment
8-7
vegetation removal does not cause an adverse effect or has been provided a permit for the incidental taking of species. Response: Clearing within an aquatic area, wetland, and their buffers is generally not allowed. See K.C.C. 21A.24.045. Core Requirement #3: Flow Control, Section 1.2.3 (page 1-34) of the 2009 KCSWDM requires proposed projects, including redevelopment projects to mitigate the impacts of storm and surface water runoff generated by new impervious surface, new pervious surface, and replaced impervious surfaces targeted for flow mitigation as specified in subsequent sections. The threshold above which mitigation is required is 2,000 square feet or more of new plus replaced impervious surface created or 35,000 square feet or more of new pervious surface added. The practical effect of these provisions is that native vegetation must be retained unless the applicant is willing to install a flow control facility, an expensive option most applicants are not willing or able to consider. When projected potential forest cover loss from development are combined with somewhat conservatives estimates of potential forest cover gain from increasing forest cover on permanent open space parcels, a net increase in forest cover is projected for floodplains overall and for Delta areas. Furthermore, when assessed at the watershed scale, for which “65/10” standard was developed, the County’s two major floodplains where this standard is most applicable are at or above the 65% level of forest cover. In any event, except for very small loss on Vashon Island floodplain, floodplains are likely to see an increase rather than loss of forest cover. This is consistent with information showing that between 2001 and 2006, a time period of relatively high rates of land development, WRIA 9 (Green River) saw negligible change in forest cover suggesting that King County’s King County’s zoning and land use regulations were relatively effective in protecting these areas FEMA Comment: Provision 5.d “Any development outside the Protected Area must mitigate for adverse indirect effects in stormwater, riparian vegetation, bank stability, channel migration, hyporheic zone, wetland and large woody debris functions.” Please provide an explanation of when mitigation is required. The King County codes that are cited (21A.21.100, 21A.24.125, 21A.24.130), along with the KCSWDM, appear to provide partial compliance with the provision; however, additional clarification is needed. Response: As described in earlier, any development proposal anywhere in King County requires a critical area review to determine whether there are critical areas on the property. See K.C.C. 21A.24.100. If there are critical areas, the applicant must prepare a critical areas report describing the impacts of the proposal on critical areas. See K.C.C. 21A.24.110. K.C.C. 21A.24.125 requires an applicant to go through mitigation sequencing, with avoidance of impacts as the highest priority. If mitigation is required as a result of the sequencing, monitoring is required to ensure the impacts are in fact mitigated. In addition, as described above, any development adding more than 2,000 square feet of new or replaced impervious surface and more than 35,000 square feet of impervious surface is subject to drainage review. FEMA Comment: Provision 5.e “In the SFHA outside the Protected Area, requiring zoning to maintain a low density of floodplain development.” The King County Code that is cited (21A.12) points to a table that lists densities and dimensions. Please provide an explanation of how this table demonstrates that King County is able to maintain a low density of floodplain development.

King County National Flood Insurance Program Biological Opinion . Compliance Submittal and Programmatic Habitat Assessment
8-8
Additionally, King County Code 24A.38.240 appears to only address the RA5 zoning. Please provide an explanation of how this performance standard is met in other types of zoning. King County also cites SO-230; please provide a copy (or internet address for) of SO-230 as a copy was not provided in the original submittal. Response: A GIS analysis was conducted that calculated the number of acres in the King County floodplain and the amount of floodplain within each of King County’s zoning classifications. Only 2.75 percent of King County’s floodplains would allow a density that is greater than one dwelling unit per five acres. The table below contains the results of this GIS analysis. In addition the Special District Overly (SDO) SO-230 was established for the lower Snoqualmie River basin, which is the largest portion of King County’s floodplain. This SDO establishes a lower density of development than the underlying zoning would allow on property zoned RA-5 (Rural Area). Instead of one dwelling per 5 acres, only one dwelling unit per 10 acres is allowed in the area subject to this SDO. The web site below provides the text of the SDO and maps showing where it applies. The areas were selected as being outside the agricultural production district which already has low density zoning and in areas that are subject to severe flooding. The SDO can be found at K.C.C. 21A.38.240. http://cf.kingcounty.gov/www6/ddes/new_direct.cfm
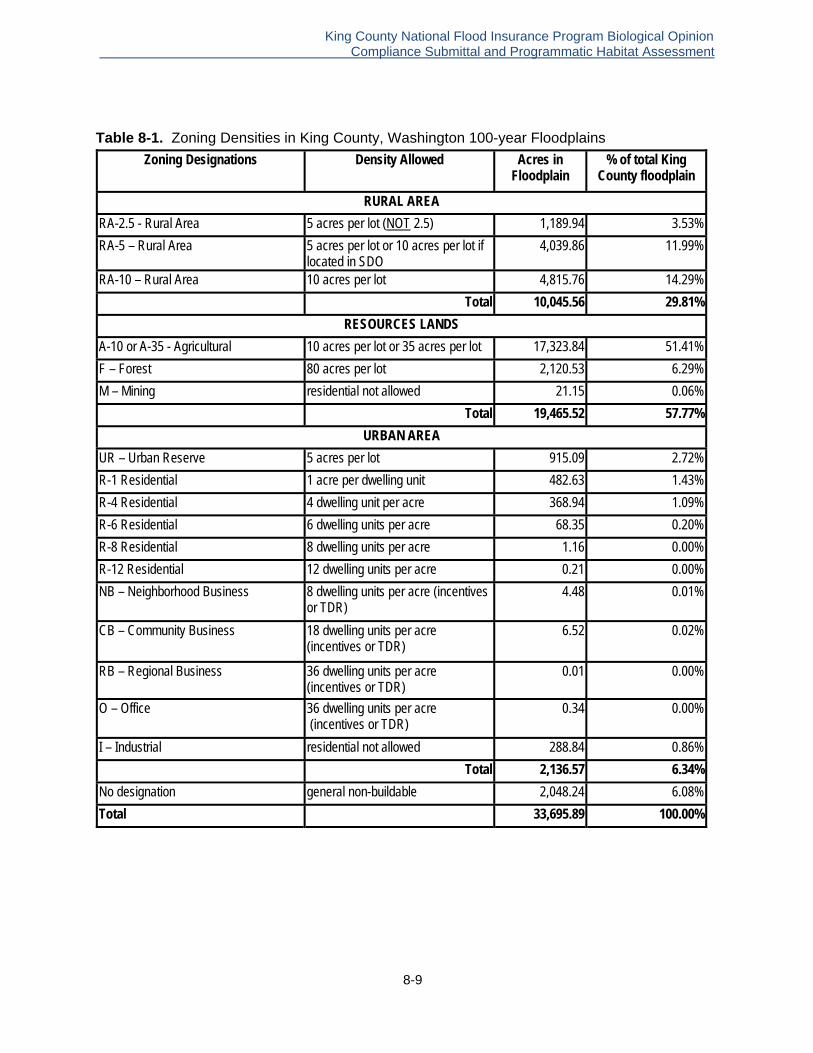
King County National Flood Insurance Program Biological Opinion . Compliance Submittal and Programmatic Habitat Assessment
8-9
Table 8-1. Zoning Densities in King County, Washington 100-year Floodplains
Zoning Designations Density Allowed Acres in Floodplain
% of total King County floodplain
RURAL AREA
RA-2.5 - Rural Area 5 acres per lot (NOT 2.5) 1,189.94 3.53%
RA-5 – Rural Area 5 acres per lot or 10 acres per lot if located in SDO
4,039.86 11.99%
RA-10 – Rural Area 10 acres per lot 4,815.76 14.29%
Total 10,045.56 29.81%
RESOURCES LANDS
A-10 or A-35 - Agricultural 10 acres per lot or 35 acres per lot 17,323.84 51.41%
F – Forest 80 acres per lot 2,120.53 6.29%
M – Mining residential not allowed 21.15 0.06%
Total 19,465.52 57.77%
URBAN AREA
UR – Urban Reserve 5 acres per lot 915.09 2.72%
R-1 Residential 1 acre per dwelling unit 482.63 1.43%
R-4 Residential 4 dwelling unit per acre 368.94 1.09%
R-6 Residential 6 dwelling units per acre 68.35 0.20%
R-8 Residential 8 dwelling units per acre 1.16 0.00%
R-12 Residential 12 dwelling units per acre 0.21 0.00%
NB – Neighborhood Business 8 dwelling units per acre (incentives or TDR)
4.48 0.01%
CB – Community Business 18 dwelling units per acre (incentives or TDR)
6.52 0.02%
RB – Regional Business 36 dwelling units per acre (incentives or TDR)
0.01 0.00%
O – Office 36 dwelling units per acre (incentives or TDR)
0.34 0.00%
I – Industrial residential not allowed 288.84 0.86%
Total 2,136.57 6.34%
No designation general non-buildable 2,048.24 6.08%
Total 33,695.89 100.00%
King County National Flood Insurance Program Biological Opinion . Compliance Submittal and Programmatic Habitat Assessment
8-10
FEMA Comment: Provision 5.g “The proposed action must be designed and located so that new structural flood protection is not needed (e.g. levees).” Please provide an explanation of how the King County code cited (21A.24.240) ensures that no new flood control structures are going to be needed in the future. Response: King County has updated the County’s Shoreline Master Plan and is working with the Washington State Department of Ecology to initiate Ecology's review. King County’s shoreline regulations that have been approved by the King County Council read as follows regarding shoreline stabilization:
K.C.C. 21A.25.200 Channel migration zone - new development to avoid future shoreline stabilization. In the channel migration zone in the shoreline jurisdiction, to the maximum extent practical, new development shall be located and designed to avoid the need for future shoreline stabilization.
Under King County’s Shoreline Master Program update, the channel migration zone is either (1) on channel migration zone maps prepared and adopted by King County or (2) the 100-year floodplain in those areas where no CMZ mapping has been completed. See K.C.C. 21A.06.182.