kinetics study and modelling of steam methane reforming...
TRANSCRIPT
ww.sciencedirect.com
i n t e r n a t i o n a l j o u r n a l o f h y d r o g e n en e r g y 4 2 ( 2 0 1 7 ) 2 8 8 9e2 9 0 3
Available online at w
ScienceDirect
journal homepage: www.elsevier .com/locate/he
Kinetics study and modelling of steam methanereforming process over a NiO/Al2O3 catalyst in anadiabatic packed bed reactor
S.Z. Abbas*, V. Dupont, T. Mahmud
School of Chemical and Process Engineering, The University of Leeds, LS2 9JT, UK
a r t i c l e i n f o
Article history:
Received 7 August 2016
Received in revised form
27 October 2016
Accepted 13 November 2016
Available online 9 December 2016
Keywords:
Mathematical modelling
Steam methane reforming
gPROMS MODELBUILDER 4.1.0®
Simulation
Diffusion limitation
* Corresponding author.E-mail address: [email protected] (S.Z.
http://dx.doi.org/10.1016/j.ijhydene.2016.11.093
0360-3199/© 2016 The Authors. Published by Elsevie
(http://creativecommons.org/licenses/by/4.0/).
a b s t r a c t
Kinetic rate data for steam methane reforming (SMR) coupled with water gas shift (WGS)
over an 18 wt. % NiO/a-Al2O3 catalyst are presented in the temperature range of 300e700 �C
at 1 bar. The experiments were performed in a plug flow reactor under the conditions of
diffusion limitations and away from the equilibrium conditions. The kinetic model was
implemented in a one-dimensional heterogeneous mathematical model of catalytic
packed bed reactor, developed on gPROMS model builder 4.1.0®. The mathematical model
of SMR process was simulated, and the model was validated by comparing the results with
the experimental values. The simulation results were in excellent agreement with the
experimental results. The effect of various operating parameters such as temperature,
pressure and steam to carbon ratio on fuel and water conversion (%), H2 yield (wt. % of CH4)
and H2 purity was modelled and compared with the equilibrium values.
© 2016 The Authors. Published by Elsevier Ltd on behalf of Hydrogen Energy Publications
LLC. This is an open access article under the CC BY license (http://creativecommons.org/
licenses/by/4.0/).
Introduction
Increasing energy demand, depletion of fossil fuel reserves
and pollution threats make hydrogen (H2) an attractive
alternative energy carrier. H2 is widely considered as the fuel
of the future due to its capability to drive the generation of
electricity without emitting harmful pollutants [1]. More
significantly, at present H2 is the basic raw material for fer-
tilizer industries especially for ammonia production as well
as a necessary co-reactant for many refinery processes [2e5].
The oil refineries use a large quantity of H2 in hydrocracking,
hydrotreating, lubrication and isomerization processes [6].
With the passage of time it may become a general purpose
carrier of energy for electricity, power generation and in
Abbas).
r Ltd on behalf of Hydrogen En
vehicles as a transportation fuel [7e9]. When H2 is burnt, the
only product is water vapour, without greenhouse gas or any
pollutant such as SOx, soot and particular matters emitted in
the environment [10e12].
Steam reforming of hydrocarbons, gasification of coal,
enzymatic decomposition of sugar, conversion of glucose
and alcohol are the few important processes of H2 production
[13]. At present, almost 90% of the worldwide H2 originates
from the fossil fuels [1]. Natural gas, naphtha and coal are the
most common feedstocks for the production of H2, but
currently natural gas is the major source of H2 production
[14,15]. There are various options available for the produc-
tion of H2 by using natural gas as feedstock. Steam reform-
ing, partial oxidation and auto-thermal reforming are the
ergy Publications LLC. This is an open access article under the CC BY license
i n t e rn a t i o n a l j o u r n a l o f h y d r o g e n en e r g y 4 2 ( 2 0 1 7 ) 2 8 8 9e2 9 0 32890
primary methods used for the production of H2 by using
hydrocarbons source [16].
Amongst all the available processes steam methane
reforming (SMR) is the most established and commonly used
process to produce syngas on a large scale [17]. Over 50% of the
world's H2 production comes from the SMR process [13]. The
conventional SMR process used in industries consists of two
main steps: in the first step endothermic SMR reaction (reac-
tion (R1)) takes place at a high temperature (~800e1000 �C) andmedium pressure (at 20e35 atm) and in the second step, the
exothermic water gas shift (WGS) reaction (reaction (R2)) runs
at a lower temperature (~200e400 �C) and medium pressure
(10e15 atm) [18e20].
CH4ðgÞ þH2OðgÞ4COðgÞ þ 3H2ðgÞ DH298 K ¼ þ206 kJ mol�1 (R1)
COðgÞ þH2OðgÞ4CO2ðgÞ þH2ðgÞ DH298 K ¼ �41 kJ mol�1 (R2)
This two-step process of SMR enhances the H2 production
by shifting the reaction (R1) in the forward direction at a high
temperature followed by reaction (R2) at a lower temperature.
The overall SMR process is endothermic in nature and re-
quires additional heat to proceed. The global SMR reaction is
given as;
CH4ðgÞ þ 2H2OðgÞ4CO2ðgÞ þ 4H2ðgÞ DH298 K ¼ þ165 kJ mol�1
(R3)
The conventional steam methane reformer consists of a
furnace that contains tubes in it, with catalyst loaded in these
tubes to speed up the rate of the reaction (R1) [21].
The catalytic SMR is a complex process. It involves the
diffusion of reactants through bulk of gases to the surface of
the catalyst particles and within the porous particles as well.
Many side reactions may take place as well. Considerable
work has been done to generate the kinetics of SMR process by
using different catalysts [22e26]. Many efforts have been
made in the past to develop the most suitable catalyst for this
process. There are many active metals used to promote the
SMR process but nickel (Ni) is themost abundantly usedmetal
because of its high reactivity and low attrition during set of
experiments [27,28]. Ni is expensive as compared to few other
available options, such as Mn, Fe and Cu, but this is
compensated by using a lower percentage of Ni in the catalyst.
Ni based catalyst can withstand very high temperature
(900e1100 �C) and exhibits goodmechanical strength. The use
of alumina based supporting material has been investigated
extensively in literature. It has been found that a-Al2O3
showed good reactivity and no agglomeration [29]. Depending
upon the feed used, differentmetals and supports are used for
steam reforming process [5,23,30e34].
The first kinetic study of the SMR was performed over Ni
catalyst in the temperature range of 609e911 K [25]. In this
kinetic study, the rate controlling step was the surface
decomposition of methane. Later on, kinetics of SMR were
derived on 12%Ni/Al2O3 at a slightly higher temperature range
(823e953 K) [35].
Xu and Froment [22] presented the most widely used ki-
netic model for SMR. In their model they considered carbon
dioxide (CO2) as non-adsorbing gas on the surface of the
catalyst. The reaction kinetics depend upon the partial
pressure of the steam. According to Elnashaie et al. [35] partial
pressure of steam has a negative effect on the reaction rate.
Elnashaie et al. [35] presented different conclusions. Accord-
ing to their findings, partial pressure of steam has positive
effect on the reaction kinetic. Xu and Froment's model in-
cludes both the positive and negative effect of the partial
pressure of steam on the reaction kinetics, as it covered both
the ranges of partial pressure of steam presented in the pre-
vious research. Later on, many authors demonstrated that Xu
and Froment's model is more general than other models.
Therefore, in this paper the kinetic model of Xu and Froment
[22] will be used to describe the reaction kinetics.
Among the large numbers of reaction schemes, Xu et al.
came up with a scheme, which considered all the reactions
taking place during the SMR process [22]. This reaction
scheme helped in formulating the rate of reactions of SMR
process. The corresponding rate equations for reaction
(R1)e(R3) are given in Appendix A.
The objective of this paper is to study the kinetics of the
SMR process over 18 wt. % Ni/a-Al2O3 catalyst, and implement
these kinetics in a 1-dimensional non-ideal plug flow hetero-
geneous model of the process in a laboratory-scale adiabatic
packed bed reactor. Ni/a-Al2O3 catalyst is the most widely
used catalyst in the industrial SMR process. The kinetic pa-
rameters (activation energy and pre-exponential coefficient)
of the SMR process over 18 wt. % Ni/a-Al2O3 catalyst is not
reported in the literature. In this study, the kinetic parameters
of SMR process are developed and compared with the values
reported by Xu and Froment [22] in their work by using Ni/
MgAl2O4 catalyst. The 1-D heterogeneous model of SMR by
using gPROMS model builder is also not reported in the liter-
ature. The developed kinetic parameters over Ni/a-Al2O3
catalyst are used in the gPROMS reactor model to study the
process of SMR.
In this model only axial variation of process variables will
be discussed. The choice of the catalyst was based on, ac-
cording to our previous research, its ability to perform well
under the cyclic redox conditions of chemical looping steam
reforming [36,37], as well as in tandemwith high temperature
in-situ CO2 capture by a solid sorbent, in a process called
sorption enhanced steam reforming [38,39], using a wide
range of organic feedstocks. The ultimate aim of obtaining the
kinetic parameters for the SMR process with this particular
catalyst in the present study is to build a realistic model of
sorption enhanced chemical looping steam reforming of
methane in packed bed configuration, and to be able to later
adapt it to other, more sustainable organic feedstocks, with
the aim of achieving sustainable and economical H2 produc-
tion with medium output, adaptable to remote sites using
unconventional sources of feedstock.
Equipment and materials
The schematic diagram of the set-up used for the experi-
mentation is shown in Fig. 1. This unit is divided into three
sections relevant to feed, reformer reactor and analysis
respectively. The feed section consists of gas cylinders for
CH4, N2, H2 and CO. MKS mass flow controllers were used to
control the flow of gases going into the reactor. The N2 mass
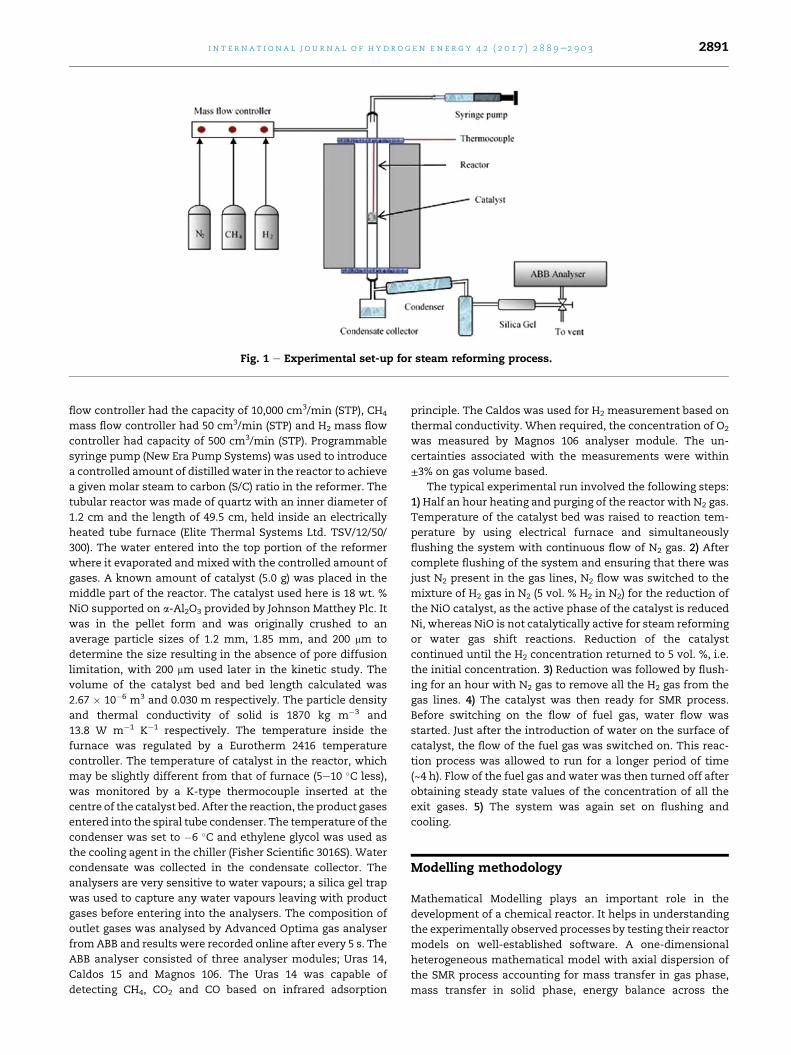
Fig. 1 e Experimental set-up for steam reforming process.
i n t e r n a t i o n a l j o u r n a l o f h y d r o g e n en e r g y 4 2 ( 2 0 1 7 ) 2 8 8 9e2 9 0 3 2891
flow controller had the capacity of 10,000 cm3/min (STP), CH4
mass flow controller had 50 cm3/min (STP) and H2 mass flow
controller had capacity of 500 cm3/min (STP). Programmable
syringe pump (New Era Pump Systems) was used to introduce
a controlled amount of distilledwater in the reactor to achieve
a given molar steam to carbon (S/C) ratio in the reformer. The
tubular reactor was made of quartz with an inner diameter of
1.2 cm and the length of 49.5 cm, held inside an electrically
heated tube furnace (Elite Thermal Systems Ltd. TSV/12/50/
300). The water entered into the top portion of the reformer
where it evaporated andmixed with the controlled amount of
gases. A known amount of catalyst (5.0 g) was placed in the
middle part of the reactor. The catalyst used here is 18 wt. %
NiO supported on a-Al2O3 provided by Johnson Matthey Plc. It
was in the pellet form and was originally crushed to an
average particle sizes of 1.2 mm, 1.85 mm, and 200 mm to
determine the size resulting in the absence of pore diffusion
limitation, with 200 mm used later in the kinetic study. The
volume of the catalyst bed and bed length calculated was
2.67 � 10�6 m3 and 0.030 m respectively. The particle density
and thermal conductivity of solid is 1870 kg m�3 and
13.8 W m�1 K�1 respectively. The temperature inside the
furnace was regulated by a Eurotherm 2416 temperature
controller. The temperature of catalyst in the reactor, which
may be slightly different from that of furnace (5e10 �C less),
was monitored by a K-type thermocouple inserted at the
centre of the catalyst bed. After the reaction, the product gases
entered into the spiral tube condenser. The temperature of the
condenser was set to �6 �C and ethylene glycol was used as
the cooling agent in the chiller (Fisher Scientific 3016S). Water
condensate was collected in the condensate collector. The
analysers are very sensitive to water vapours; a silica gel trap
was used to capture any water vapours leaving with product
gases before entering into the analysers. The composition of
outlet gases was analysed by Advanced Optima gas analyser
fromABB and results were recorded online after every 5 s. The
ABB analyser consisted of three analyser modules; Uras 14,
Caldos 15 and Magnos 106. The Uras 14 was capable of
detecting CH4, CO2 and CO based on infrared adsorption
principle. The Caldos was used for H2 measurement based on
thermal conductivity. When required, the concentration of O2
was measured by Magnos 106 analyser module. The un-
certainties associated with the measurements were within
±3% on gas volume based.
The typical experimental run involved the following steps:
1)Half an hour heating and purging of the reactor with N2 gas.
Temperature of the catalyst bed was raised to reaction tem-
perature by using electrical furnace and simultaneously
flushing the system with continuous flow of N2 gas. 2) After
complete flushing of the system and ensuring that there was
just N2 present in the gas lines, N2 flow was switched to the
mixture of H2 gas in N2 (5 vol. % H2 in N2) for the reduction of
the NiO catalyst, as the active phase of the catalyst is reduced
Ni, whereas NiO is not catalytically active for steam reforming
or water gas shift reactions. Reduction of the catalyst
continued until the H2 concentration returned to 5 vol. %, i.e.
the initial concentration. 3) Reduction was followed by flush-
ing for an hour with N2 gas to remove all the H2 gas from the
gas lines. 4) The catalyst was then ready for SMR process.
Before switching on the flow of fuel gas, water flow was
started. Just after the introduction of water on the surface of
catalyst, the flow of the fuel gas was switched on. This reac-
tion process was allowed to run for a longer period of time
(~4 h). Flow of the fuel gas and water was then turned off after
obtaining steady state values of the concentration of all the
exit gases. 5) The system was again set on flushing and
cooling.
Modelling methodology
Mathematical Modelling plays an important role in the
development of a chemical reactor. It helps in understanding
the experimentally observed processes by testing their reactor
models on well-established software. A one-dimensional
heterogeneous mathematical model with axial dispersion of
the SMR process accounting for mass transfer in gas phase,
mass transfer in solid phase, energy balance across the
i n t e rn a t i o n a l j o u r n a l o f h y d r o g e n en e r g y 4 2 ( 2 0 1 7 ) 2 8 8 9e2 9 0 32892
reactor system and reaction kinetics was constructed. In this
model it was assumed that,
a) Operation is adiabatic in nature
b) Ideal gas law is applicable
c) Concentration and temperature gradients along the radial
direction are negligible. So, only one-dimensional variation
in concentration and temperature i.e. in the axial direction
is considered.
d) No temperature gradient is considered in the catalyst
particles
e) Porosity of the bed is constant
To reduce the complexity in the modelling of the reaction
kinetics, only those reactions which play a significant role in
the overall process were considered. The chemical reactions
used in the reactor modelling are (R1)e(R3) and their rate
equations (A1)e(A3) are given in Appendix A. These rate ex-
pressions are based on LangmuireHinshelwood methodology
as described and employed by Xu and Froment [22]. Mathe-
matical model is composed of mass and energy balance
equations both in the gas and solid phase. The mass, energy
and momentum balance equations are given by:
Mass and Energy balance in the gas phase;
εb
�vCi
vt
�þ vðuCiÞ
vzþ kg;iav
�Ci � Ci;s
� ¼ εbDzv2Ci
vz2(1)
εbrgCpg
�vTvt
�þ urgCpg
vðTÞvz
¼ hfavðTs � TÞ þ lfzv2Tvz2
(2)
Mass and Energy balance in the solid phase;
kg;iav
�Ci � Ci;s
�þ �vCi;s
vt
�¼ ð1� εbÞrcat ri (3)
rbedCp;bed
�vTs
vt
�þ hfavðTs � TÞ ¼ ð1� εbÞrcat
X�DHrxn;jhjRj
(4)
Pressure drop across the bed of reactor;
DPgc
L¼ 150
d2p
"ð1� εÞ2
ε3
#muþ
�1:75dp
��1� ε
ε3
�rgu
2 (5)
Boundary conditions;
At the reactor inlet (z ¼ 0)
Ci ¼ Ci;0; T ¼ To; Ts ¼ Ts;o; P ¼ Po
At the reactor outlet (z ¼ L)
vCi
vz¼ 0;
vTvz
¼ 0;vTs
vz¼ 0
Initial conditions;
Ci ¼ Ci;0; T ¼ To; Ts ¼ Ts;o
The rates of the SMR reactions are highly dependent upon
the temperature of the system and concentration of the gases.
The equilibrium constants and the kinetic rate constants in
the rate equations [22] are given in Appendix A. The values
for the pre-exponential factor and activation energy were
obtained from the experiments performed in the laboratory
(described in Section “Preliminary experiments”). The rate of
formation or consumption of each component was obtained
by combining reaction rate equations. The reaction rates for
the species are given in Appendix A.
In mathematical modelling many physical properties are
used like thermal conductivity, dispersion coefficient, mass
transfer coefficient etc. The empirical correlations used to
determine these properties are listed below.
Axial mass dispersion coefficient is given as [40];
Dz ¼ 0:73Dm þ 0:5udp
1þ 9:49Dm
�udp
(6)
Effective thermal conductivity is given by the following
relations [41];
lfzlg
¼ loz
lgþ 0:75PrRep (7)
loz
lg¼ εb þ 1� εb
0:139εb � 0:0339þ ð23Þlgls
(8)
Mass transfer coefficient is given as [42];
kg;i ¼ jD;iReSc1=3i
Di
dp(9)
εbjD;i ¼ 0:765Re�0:82 þ 0:365Sc�0:398i (10)
Dimensionless numbers are given as;
Re ¼ rgudp
m; 0:01<Re< 1500 (11)
Sci ¼ m
rgDi; 0:6<Sc<7000; 0:25< εb <0:96 (12)
Similarly, to determine the heat transfer coefficient and its
dimensional numbers, following relations were used in the
model formulation [42,43];
hf ¼ jHCpgGs
Pr2=3(13)
here,
jH ¼ 0:91Re�0:51j ; 0:01<Re<50 (14)
jH ¼ 0:61Re�0:41j; 50<Re<1000 (15)
Pr ¼ Cpgmg
lg(16)
In the reactor model linear and non-linear partial differ-
ential equations (PDEs), algebraic equations, and initial and
boundary conditions are involved, and gPROMS was used to
solve these equations. The sensitivity of the model was first
checked for discretization ranging from 10 to 1000 intervals
and model was found independent of discretization. Finally,
the laboratory reactor was axially discretized by 100 uniform
intervals for this paper and output results were reported after
every one second. The first order backward finite difference
method (BFDM) of was used to solve the PDEs and algebraic
equations using initial and boundary conditions asmentioned

i n t e r n a t i o n a l j o u r n a l o f h y d r o g e n en e r g y 4 2 ( 2 0 1 7 ) 2 8 8 9e2 9 0 3 2893
above. The model of the adiabatic packed bed reactor was
assumed to follow the non-ideal plug flow behaviour. In
gPROMS differential algebraic solver (DASOLV) was used to
solve the ordinary differential equation (ODEs). DASOLV con-
verts the PDEs into ODEs, and 4th order Runge-Kutta tech-
nique was used to solve the system.
In order to compare the modelling results with an inde-
pendent model, the chemical equilibrium and applications
(CEA) software was used to generate the equilibrium data
[44,45]. This software is based on minimization of Gibbs free
energy (G) [46]; Equation (A15) in Appendix A. The thermo-
dynamic analysis was done by considering the gas species
involved in the reactant and product streams are CH4, H2, CO,
CO2, H2O and N2. The calculations were performed on the
basis of N2 balance. To study the effect of temperature, 1 bar
and S/C of 3.0 was fixed. The thermodynamic calculations
were allowed to run and outlet mole fraction data of product
gases was collected for the calculations. Similarly to study
the pressure effect, temperature and S/C conditions were
fixed.
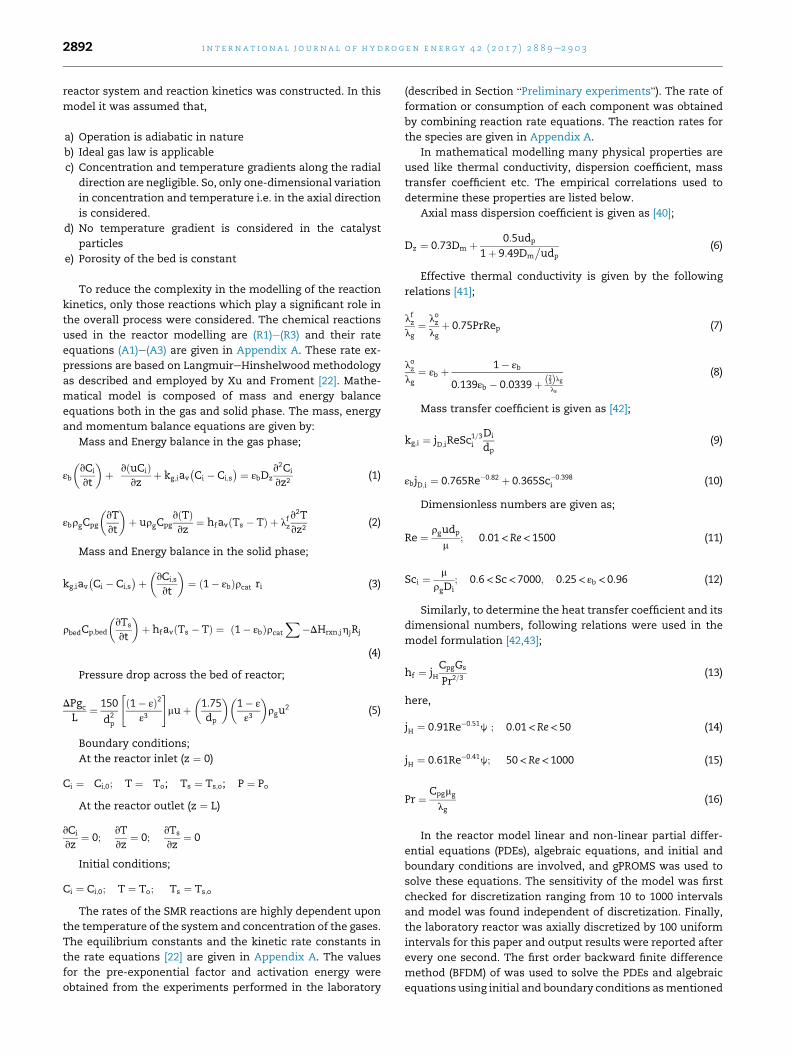
Fig. 2 e Effect of particle size and pseudo contact time on
the conversion of CH4 at constant S/C (3.12) and constant
operating temperature (700 �C).
Preliminary experiments
Prior to the design of experiments for the derivation of kinetic
rate parameters, preliminary experiments were performed to
find out the size of the catalyst required to virtually eliminate
the diffusion control limitations, a condition necessary to
obtain true reaction kinetics. In general, the size of the particle
is reduced to such a size where there are no diffusion effects.
To this aim, the Weisz-Prater (WP) criterion was used to
determine the required size of the particle [47,48], expressed
as;
CWP ¼ h∅21 (17)
With;
CWP ¼ �r0AðobsÞrcatR2p
DeCAs
(18)
If CWP << 1, then there are no internal diffusion limitations
and ultimately no concentration gradient exists within the
catalyst particle. In order to find out how small the size of
particle should be to avoid internal diffusion limitations, the
Thiele Modulus ð∅Þ and the effectiveness factor ðhÞ need to be
calculated. The effectiveness factor is the measure of how far
the reactant diffuses into the pellet before reacting. The Thiele
modulus and the effectiveness factors are related to each
other as follow:
h ¼ 3
∅21
ð∅1 coth∅1 � 1Þ (19)
h∅21 ¼ 3ð∅1 coth∅1 � 1Þ (20)
The reaction rate will be diffusion limited if the Thiele
Modulus ð∅Þ is very large, i.e. if h≪1.A first set of the experiments was performed by consid-
ering the size of particle (dp) ¼ 1.2 mm, to find out the size of
the catalyst for which hy1. Data for methane conversion
ðXCH4 Þ was obtained and plotted against pseudo contact time
defined by W=FCH4 ;o; to determine the rate of the reaction for
this set of experiments. Weight (W) of the catalyst was kept
constant in all of the experiments i.e. 5.0 g.
As expected, it was observed that as the flow rate of feed
increased, keeping all the other parameters constant, con-
version of CH4 decreased due to the diminishing residence
time. While keeping every parameter and operating condi-
tions constant, except the size of the catalyst (dp ¼ 1.85 mm),
for the second set of experiments, data for CH4 conversion at
different W/FCH4,0 was obtained. As the size of the particle
reduced, it increased the contact area and hence the conver-
sion of CH4 increased. Fig. 2 shows the effect of particle size
and pseudo contact time on CH4 conversion, and results were
compared with equilibrium values as well.
The slope of both CH4 conversion curves gives the rate of
reaction of methane (rCH4 in mol hr�1 kgcat�1). Values for the
Thiele modulus and the effectiveness factor for both sets of
experiment were used to determine the size of the catalyst
required for the kinetic study. As the size of catalyst reduced,
the effectiveness factor approached unity. Calculated values
for the Thiele modulus and effectiveness factor are shown in
Table 1.
Table 1 shows that a particle size of 0.2 mm (200 mm) is
required to virtually eliminate diffusion control (i.e. h ¼ 0.92).
Results and discussion
Derivation of the kinetics of three SMR reactions
To ensure that the experiments were carried out in the region
of intrinsic kinetics, the size of the catalyst particle was ob-
tained in preliminary experiments. The experimental condi-
tions used for the generation of kinetic parameters are listed
in Table 2.
Typical curves of conversion of CH4 against pseudo contact
time are shown in Fig. 3 for a temperatures range between
550 �C and 700 �C. As expected for an endothermic process,
increasing temperature and pseudo contact time has a
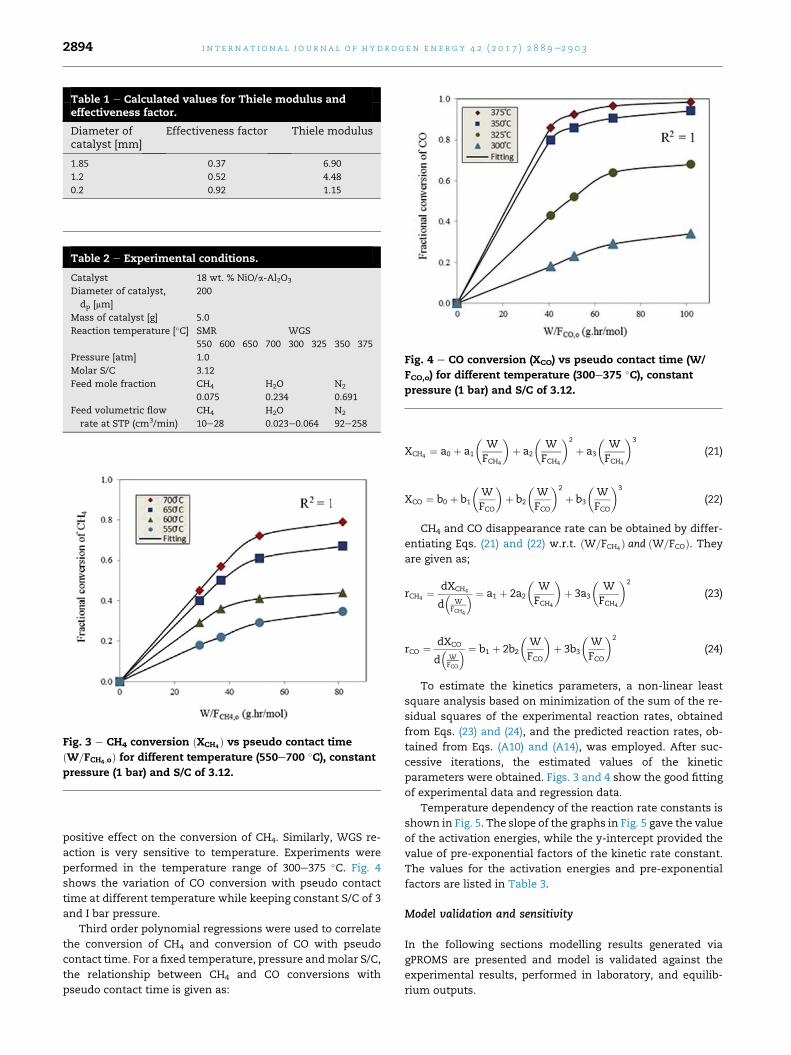
Table 2 e Experimental conditions.
Catalyst 18 wt. % NiO/a-Al2O3
Diameter of catalyst,
dp [mm]
200
Mass of catalyst [g] 5.0
Reaction temperature [�C] SMR WGS
550 600 650 700 300 325 350 375
Pressure [atm] 1.0
Molar S/C 3.12
Feed mole fraction CH4 H2O N2
0.075 0.234 0.691
Feed volumetric flow
rate at STP (cm3/min)
CH4 H2O N2
10e28 0.023e0.064 92e258
Fig. 3 e CH4 conversion ðXCH4 Þ vs pseudo contact time
ðW=FCH4 ;oÞ for different temperature (550e700 �C), constantpressure (1 bar) and S/C of 3.12.
Fig. 4 e CO conversion (XCO) vs pseudo contact time (W/
FCO,o) for different temperature (300e375 �C), constantpressure (1 bar) and S/C of 3.12.
Table 1 e Calculated values for Thiele modulus andeffectiveness factor.
Diameter ofcatalyst [mm]
Effectiveness factor Thiele modulus
1.85 0.37 6.90
1.2 0.52 4.48
0.2 0.92 1.15
i n t e rn a t i o n a l j o u r n a l o f h y d r o g e n en e r g y 4 2 ( 2 0 1 7 ) 2 8 8 9e2 9 0 32894
positive effect on the conversion of CH4. Similarly, WGS re-
action is very sensitive to temperature. Experiments were
performed in the temperature range of 300e375 �C. Fig. 4
shows the variation of CO conversion with pseudo contact
time at different temperature while keeping constant S/C of 3
and I bar pressure.
Third order polynomial regressions were used to correlate
the conversion of CH4 and conversion of CO with pseudo
contact time. For a fixed temperature, pressure andmolar S/C,
the relationship between CH4 and CO conversions with
pseudo contact time is given as:
XCH4¼ a0 þ a1
�WFCH4
�þ a2
�WFCH4
�2
þ a3
�WFCH4
�3
(21)
XCO ¼ b0 þ b1
�WFCO
�þ b2
�WFCO
�2
þ b3
�WFCO
�3
(22)
CH4 and CO disappearance rate can be obtained by differ-
entiating Eqs. (21) and (22) w.r.t. ðW=FCH4 Þ and ðW=FCOÞ. Theyare given as;
rCH4 ¼dXCH4
d�
WFCH4
� ¼ a1 þ 2a2
�WFCH4
�þ 3a3
�WFCH4
�2
(23)
rCO ¼ dXCO
d�
WFCO
� ¼ b1 þ 2b2
�WFCO
�þ 3b3
�WFCO
�2
(24)
To estimate the kinetics parameters, a non-linear least
square analysis based on minimization of the sum of the re-
sidual squares of the experimental reaction rates, obtained
from Eqs. (23) and (24), and the predicted reaction rates, ob-
tained from Eqs. (A10) and (A14), was employed. After suc-
cessive iterations, the estimated values of the kinetic
parameters were obtained. Figs. 3 and 4 show the good fitting
of experimental data and regression data.
Temperature dependency of the reaction rate constants is
shown in Fig. 5. The slope of the graphs in Fig. 5 gave the value
of the activation energies, while the y-intercept provided the
value of pre-exponential factors of the kinetic rate constant.
The values for the activation energies and pre-exponential
factors are listed in Table 3.
Model validation and sensitivity
In the following sections modelling results generated via
gPROMS are presented and model is validated against the
experimental results, performed in laboratory, and equilib-
rium outputs.
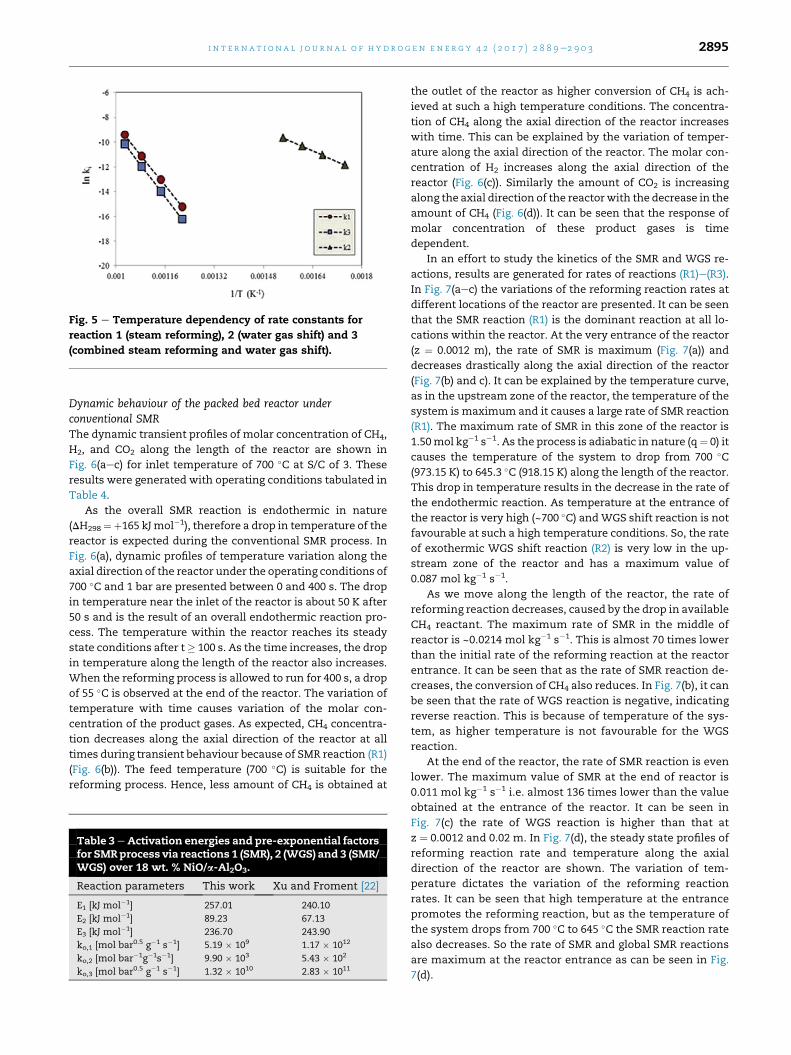
Fig. 5 e Temperature dependency of rate constants for
reaction 1 (steam reforming), 2 (water gas shift) and 3
(combined steam reforming and water gas shift).
i n t e r n a t i o n a l j o u r n a l o f h y d r o g e n en e r g y 4 2 ( 2 0 1 7 ) 2 8 8 9e2 9 0 3 2895
Dynamic behaviour of the packed bed reactor underconventional SMRThe dynamic transient profiles of molar concentration of CH4,
H2, and CO2 along the length of the reactor are shown in
Fig. 6(aec) for inlet temperature of 700 �C at S/C of 3. These
results were generated with operating conditions tabulated in
Table 4.
As the overall SMR reaction is endothermic in nature
(DH298¼þ165 kJmol�1), therefore a drop in temperature of the
reactor is expected during the conventional SMR process. In
Fig. 6(a), dynamic profiles of temperature variation along the
axial direction of the reactor under the operating conditions of
700 �C and 1 bar are presented between 0 and 400 s. The drop
in temperature near the inlet of the reactor is about 50 K after
50 s and is the result of an overall endothermic reaction pro-
cess. The temperature within the reactor reaches its steady
state conditions after t� 100 s. As the time increases, the drop
in temperature along the length of the reactor also increases.
When the reforming process is allowed to run for 400 s, a drop
of 55 �C is observed at the end of the reactor. The variation of
temperature with time causes variation of the molar con-
centration of the product gases. As expected, CH4 concentra-
tion decreases along the axial direction of the reactor at all
times during transient behaviour because of SMR reaction (R1)
(Fig. 6(b)). The feed temperature (700 �C) is suitable for the
reforming process. Hence, less amount of CH4 is obtained at
Table 3eActivation energies and pre-exponential factorsfor SMRprocess via reactions 1 (SMR), 2 (WGS) and 3 (SMR/WGS) over 18 wt. % NiO/a-Al2O3.
Reaction parameters This work Xu and Froment [22]
E1 [kJ mol�1] 257.01 240.10
E2 [kJ mol�1] 89.23 67.13
E3 [kJ mol�1] 236.70 243.90
ko,1 [mol bar0.5 g�1 s�1] 5.19 � 109 1.17 � 1012
ko,2 [mol bar�1g�1s�1] 9.90 � 103 5.43 � 102
ko,3 [mol bar0.5 g�1 s�1] 1.32 � 1010 2.83 � 1011
the outlet of the reactor as higher conversion of CH4 is ach-
ieved at such a high temperature conditions. The concentra-
tion of CH4 along the axial direction of the reactor increases
with time. This can be explained by the variation of temper-
ature along the axial direction of the reactor. The molar con-
centration of H2 increases along the axial direction of the
reactor (Fig. 6(c)). Similarly the amount of CO2 is increasing
along the axial direction of the reactorwith the decrease in the
amount of CH4 (Fig. 6(d)). It can be seen that the response of
molar concentration of these product gases is time
dependent.
In an effort to study the kinetics of the SMR and WGS re-
actions, results are generated for rates of reactions (R1)e(R3).
In Fig. 7(aec) the variations of the reforming reaction rates at
different locations of the reactor are presented. It can be seen
that the SMR reaction (R1) is the dominant reaction at all lo-
cations within the reactor. At the very entrance of the reactor
(z ¼ 0.0012 m), the rate of SMR is maximum (Fig. 7(a)) and
decreases drastically along the axial direction of the reactor
(Fig. 7(b) and c). It can be explained by the temperature curve,
as in the upstream zone of the reactor, the temperature of the
system is maximum and it causes a large rate of SMR reaction
(R1). The maximum rate of SMR in this zone of the reactor is
1.50mol kg�1 s�1. As the process is adiabatic in nature (q¼ 0) it
causes the temperature of the system to drop from 700 �C(973.15 K) to 645.3 �C (918.15 K) along the length of the reactor.
This drop in temperature results in the decrease in the rate of
the endothermic reaction. As temperature at the entrance of
the reactor is very high (~700 �C) andWGS shift reaction is not
favourable at such a high temperature conditions. So, the rate
of exothermic WGS shift reaction (R2) is very low in the up-
stream zone of the reactor and has a maximum value of
0.087 mol kg�1 s�1.
As we move along the length of the reactor, the rate of
reforming reaction decreases, caused by the drop in available
CH4 reactant. The maximum rate of SMR in the middle of
reactor is ~0.0214 mol kg�1 s�1. This is almost 70 times lower
than the initial rate of the reforming reaction at the reactor
entrance. It can be seen that as the rate of SMR reaction de-
creases, the conversion of CH4 also reduces. In Fig. 7(b), it can
be seen that the rate of WGS reaction is negative, indicating
reverse reaction. This is because of temperature of the sys-
tem, as higher temperature is not favourable for the WGS
reaction.
At the end of the reactor, the rate of SMR reaction is even
lower. The maximum value of SMR at the end of reactor is
0.011 mol kg�1 s�1 i.e. almost 136 times lower than the value
obtained at the entrance of the reactor. It can be seen in
Fig. 7(c) the rate of WGS reaction is higher than that at
z ¼ 0.0012 and 0.02 m. In Fig. 7(d), the steady state profiles of
reforming reaction rate and temperature along the axial
direction of the reactor are shown. The variation of tem-
perature dictates the variation of the reforming reaction
rates. It can be seen that high temperature at the entrance
promotes the reforming reaction, but as the temperature of
the system drops from 700 �C to 645 �C the SMR reaction rate
also decreases. So the rate of SMR and global SMR reactions
are maximum at the reactor entrance as can be seen in Fig.
7(d).
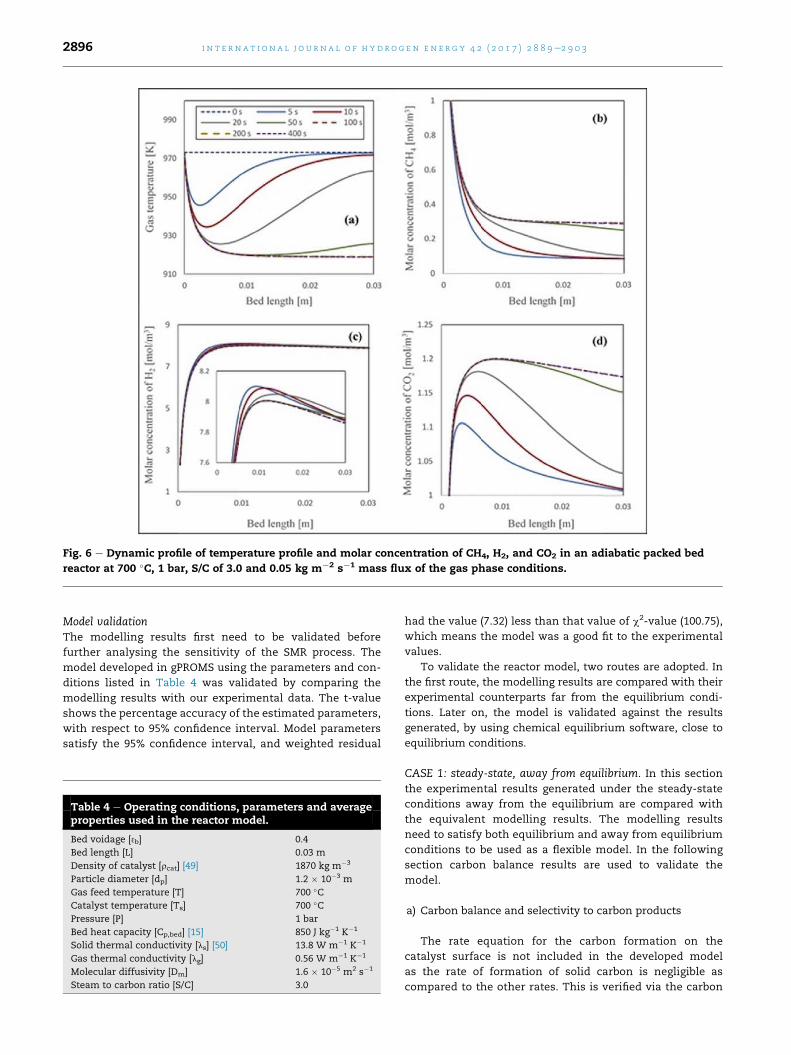
Fig. 6 e Dynamic profile of temperature profile and molar concentration of CH4, H2, and CO2 in an adiabatic packed bed
reactor at 700 �C, 1 bar, S/C of 3.0 and 0.05 kg m¡2 s¡1 mass flux of the gas phase conditions.
i n t e rn a t i o n a l j o u r n a l o f h y d r o g e n en e r g y 4 2 ( 2 0 1 7 ) 2 8 8 9e2 9 0 32896
Model validationThe modelling results first need to be validated before
further analysing the sensitivity of the SMR process. The
model developed in gPROMS using the parameters and con-
ditions listed in Table 4 was validated by comparing the
modelling results with our experimental data. The t-value
shows the percentage accuracy of the estimated parameters,
with respect to 95% confidence interval. Model parameters
satisfy the 95% confidence interval, and weighted residual
Table 4 e Operating conditions, parameters and averageproperties used in the reactor model.
Bed voidage [ 3b] 0.4
Bed length [L] 0.03 m
Density of catalyst [rcat] [49] 1870 kg m�3
Particle diameter [dp] 1.2 � 10�3 m
Gas feed temperature [T] 700 �CCatalyst temperature [Ts] 700 �CPressure [P] 1 bar
Bed heat capacity [Cp,bed] [15] 850 J kg�1 K�1
Solid thermal conductivity [ls] [50] 13.8 W m�1 K�1
Gas thermal conductivity [lg] 0.56 W m�1 K�1
Molecular diffusivity [Dm] 1.6 � 10�5 m2 s�1
Steam to carbon ratio [S/C] 3.0
had the value (7.32) less than that value of c2-value (100.75),
which means the model was a good fit to the experimental
values.
To validate the reactor model, two routes are adopted. In
the first route, the modelling results are compared with their
experimental counterparts far from the equilibrium condi-
tions. Later on, the model is validated against the results
generated, by using chemical equilibrium software, close to
equilibrium conditions.
CASE 1: steady-state, away from equilibrium. In this section
the experimental results generated under the steady-state
conditions away from the equilibrium are compared with
the equivalent modelling results. The modelling results
need to satisfy both equilibrium and away from equilibrium
conditions to be used as a flexible model. In the following
section carbon balance results are used to validate the
model.
a) Carbon balance and selectivity to carbon products
The rate equation for the carbon formation on the
catalyst surface is not included in the developed model
as the rate of formation of solid carbon is negligible as
compared to the other rates. This is verified via the carbon
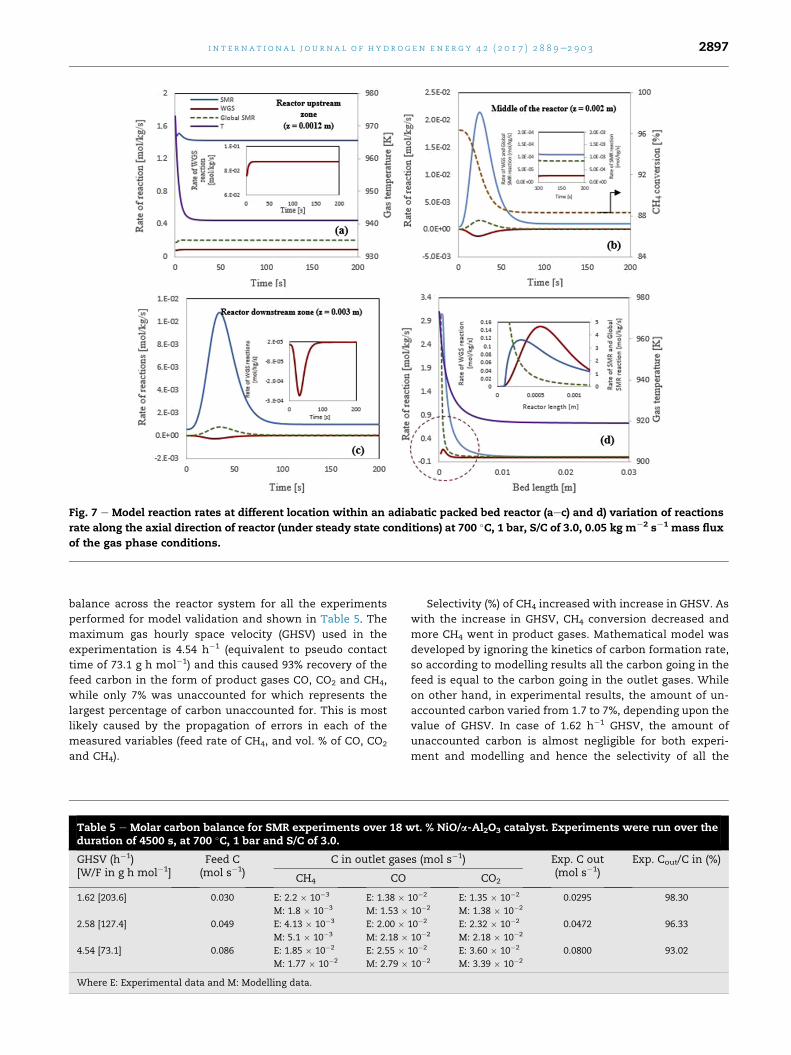
Fig. 7 e Model reaction rates at different location within an adiabatic packed bed reactor (aec) and d) variation of reactions
rate along the axial direction of reactor (under steady state conditions) at 700 �C, 1 bar, S/C of 3.0, 0.05 kg m¡2 s¡1 mass flux
of the gas phase conditions.
i n t e r n a t i o n a l j o u r n a l o f h y d r o g e n en e r g y 4 2 ( 2 0 1 7 ) 2 8 8 9e2 9 0 3 2897
balance across the reactor system for all the experiments
performed for model validation and shown in Table 5. The
maximum gas hourly space velocity (GHSV) used in the
experimentation is 4.54 h�1 (equivalent to pseudo contact
time of 73.1 g h mol�1) and this caused 93% recovery of the
feed carbon in the form of product gases CO, CO2 and CH4,
while only 7% was unaccounted for which represents the
largest percentage of carbon unaccounted for. This is most
likely caused by the propagation of errors in each of the
measured variables (feed rate of CH4, and vol. % of CO, CO2
and CH4).
Table 5 e Molar carbon balance for SMR experiments over 18 wduration of 4500 s, at 700 �C, 1 bar and S/C of 3.0.
GHSV (h�1)[W/F in g h mol�1]
Feed C(mol s�1)
C in outlet gase
CH4 CO
1.62 [203.6] 0.030 E: 2.2 � 10�3 E: 1.38 �M: 1.8 � 10�3 M: 1.53 �
2.58 [127.4] 0.049 E: 4.13 � 10�3 E: 2.00 �M: 5.1 � 10�3 M: 2.18 �
4.54 [73.1] 0.086 E: 1.85 � 10�2 E: 2.55 �M: 1.77 � 10�2 M: 2.79 �
Where E: Experimental data and M: Modelling data.
Selectivity (%) of CH4 increased with increase in GHSV. As
with the increase in GHSV, CH4 conversion decreased and
more CH4 went in product gases. Mathematical model was
developed by ignoring the kinetics of carbon formation rate,
so according to modelling results all the carbon going in the
feed is equal to the carbon going in the outlet gases. While
on other hand, in experimental results, the amount of un-
accounted carbon varied from 1.7 to 7%, depending upon the
value of GHSV. In case of 1.62 h�1 GHSV, the amount of
unaccounted carbon is almost negligible for both experi-
ment and modelling and hence the selectivity of all the
t. % NiO/a-Al2O3 catalyst. Experiments were run over the
s (mol s�1) Exp. C out(mol s�1)
Exp. Cout/C in (%)
CO2
10�2 E: 1.35 � 10�2 0.0295 98.30
10�2 M: 1.38 � 10�2
10�2 E: 2.32 � 10�2 0.0472 96.33
10�2 M: 2.18 � 10�2
10�2 E: 3.60 � 10�2 0.0800 93.02
10�2 M: 3.39 � 10�2
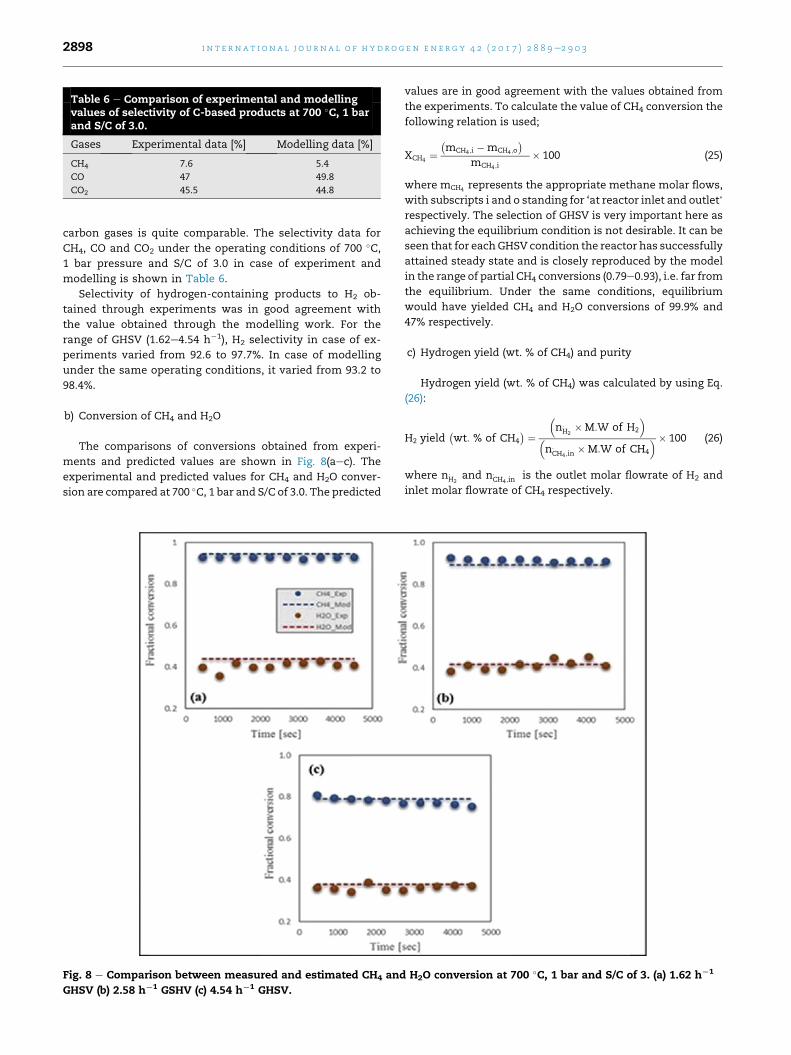
Table 6 e Comparison of experimental and modellingvalues of selectivity of C-based products at 700 �C, 1 barand S/C of 3.0.
Gases Experimental data [%] Modelling data [%]
CH4 7.6 5.4
CO 47 49.8
CO2 45.5 44.8
i n t e rn a t i o n a l j o u r n a l o f h y d r o g e n en e r g y 4 2 ( 2 0 1 7 ) 2 8 8 9e2 9 0 32898
carbon gases is quite comparable. The selectivity data for
CH4, CO and CO2 under the operating conditions of 700 �C,1 bar pressure and S/C of 3.0 in case of experiment and
modelling is shown in Table 6.
Selectivity of hydrogen-containing products to H2 ob-
tained through experiments was in good agreement with
the value obtained through the modelling work. For the
range of GHSV (1.62e4.54 h�1), H2 selectivity in case of ex-
periments varied from 92.6 to 97.7%. In case of modelling
under the same operating conditions, it varied from 93.2 to
98.4%.
b) Conversion of CH4 and H2O
The comparisons of conversions obtained from experi-
ments and predicted values are shown in Fig. 8(aec). The
experimental and predicted values for CH4 and H2O conver-
sion are compared at 700 �C, 1 bar and S/C of 3.0. The predicted
Fig. 8 e Comparison between measured and estimated CH4 and
GHSV (b) 2.58 h¡1 GSHV (c) 4.54 h¡1 GHSV.
values are in good agreement with the values obtained from
the experiments. To calculate the value of CH4 conversion the
following relation is used;
XCH4 ¼�mCH4 ;i �mCH4 ;o
�mCH4 ;i
� 100 (25)
where mCH4 represents the appropriate methane molar flows,
with subscripts i and o standing for ‘at reactor inlet and outlet’
respectively. The selection of GHSV is very important here as
achieving the equilibrium condition is not desirable. It can be
seen that for eachGHSV condition the reactor has successfully
attained steady state and is closely reproduced by the model
in the range of partial CH4 conversions (0.79e0.93), i.e. far from
the equilibrium. Under the same conditions, equilibrium
would have yielded CH4 and H2O conversions of 99.9% and
47% respectively.
c) Hydrogen yield (wt. % of CH4) and purity
Hydrogen yield (wt. % of CH4) was calculated by using Eq.
(26):
H2 yield�wt: % of CH4
� ¼�n:
H2�M:W of H2
��n:
CH4 ;in�M:W of CH4
�� 100 (26)
where n:H2
and n:CH4 ;in
is the outlet molar flowrate of H2 and
inlet molar flowrate of CH4 respectively.
H2O conversion at 700 �C, 1 bar and S/C of 3. (a) 1.62 h¡1
i n t e r n a t i o n a l j o u r n a l o f h y d r o g e n en e r g y 4 2 ( 2 0 1 7 ) 2 8 8 9e2 9 0 3 2899
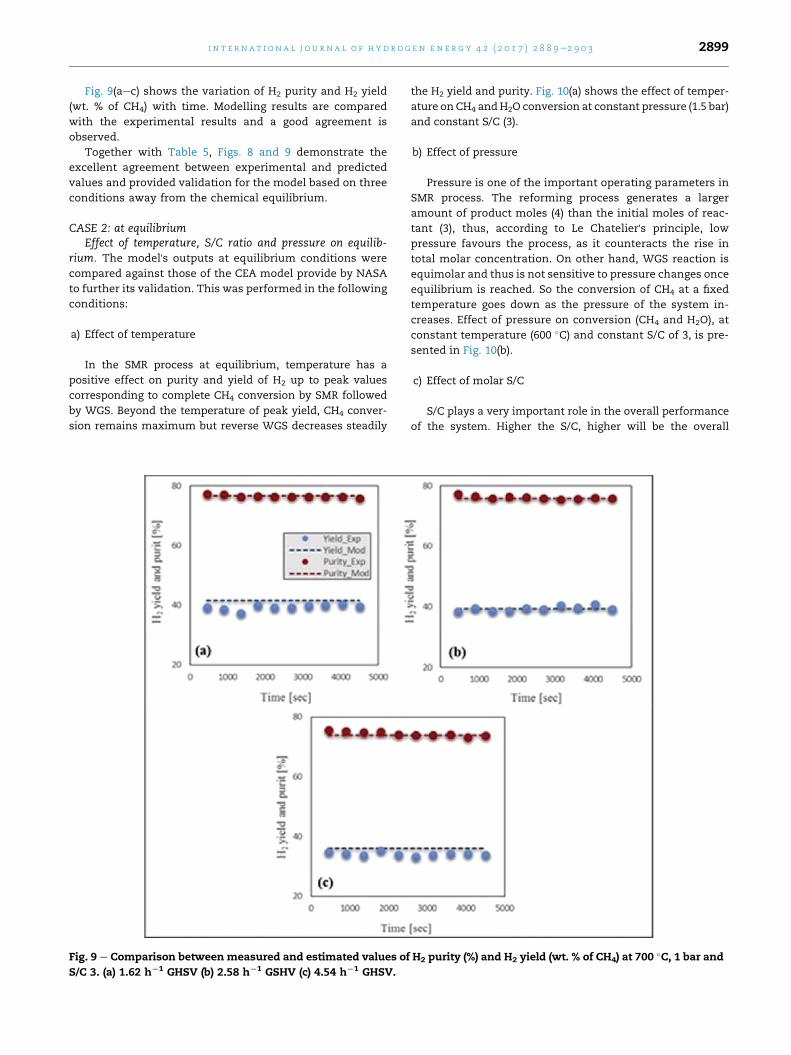
Fig. 9(aec) shows the variation of H2 purity and H2 yield
(wt. % of CH4) with time. Modelling results are compared
with the experimental results and a good agreement is
observed.
Together with Table 5, Figs. 8 and 9 demonstrate the
excellent agreement between experimental and predicted
values and provided validation for the model based on three
conditions away from the chemical equilibrium.
CASE 2: at equilibriumEffect of temperature, S/C ratio and pressure on equilib-
rium. The model's outputs at equilibrium conditions were
compared against those of the CEA model provide by NASA
to further its validation. This was performed in the following
conditions:
a) Effect of temperature
In the SMR process at equilibrium, temperature has a
positive effect on purity and yield of H2 up to peak values
corresponding to complete CH4 conversion by SMR followed
by WGS. Beyond the temperature of peak yield, CH4 conver-
sion remains maximum but reverse WGS decreases steadily
Fig. 9 e Comparison between measured and estimated values of
S/C 3. (a) 1.62 h¡1 GHSV (b) 2.58 h¡1 GSHV (c) 4.54 h¡1 GHSV.
the H2 yield and purity. Fig. 10(a) shows the effect of temper-
ature on CH4 andH2O conversion at constant pressure (1.5 bar)
and constant S/C (3).
b) Effect of pressure
Pressure is one of the important operating parameters in
SMR process. The reforming process generates a larger
amount of product moles (4) than the initial moles of reac-
tant (3), thus, according to Le Chatelier's principle, low
pressure favours the process, as it counteracts the rise in
total molar concentration. On other hand, WGS reaction is
equimolar and thus is not sensitive to pressure changes once
equilibrium is reached. So the conversion of CH4 at a fixed
temperature goes down as the pressure of the system in-
creases. Effect of pressure on conversion (CH4 and H2O), at
constant temperature (600 �C) and constant S/C of 3, is pre-
sented in Fig. 10(b).
c) Effect of molar S/C
S/C plays a very important role in the overall performance
of the system. Higher the S/C, higher will be the overall
H2 purity (%) and H2 yield (wt. % of CH4) at 700 �C, 1 bar and
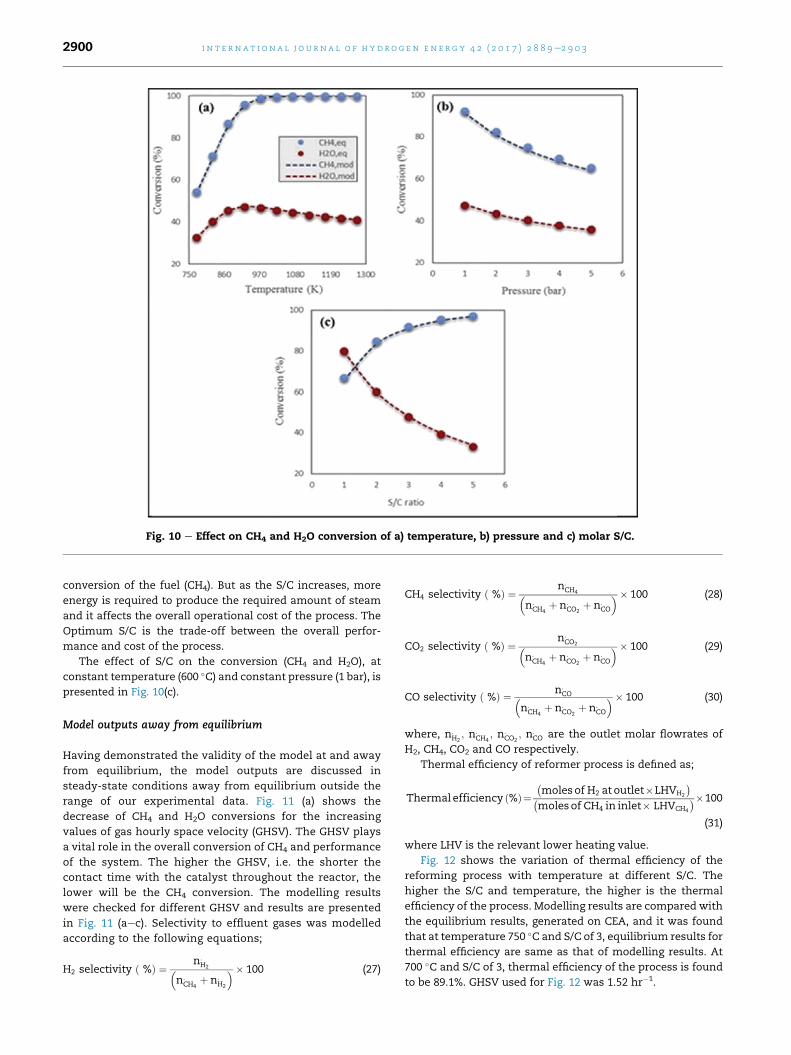
Fig. 10 e Effect on CH4 and H2O conversion of a) temperature, b) pressure and c) molar S/C.
i n t e rn a t i o n a l j o u r n a l o f h y d r o g e n en e r g y 4 2 ( 2 0 1 7 ) 2 8 8 9e2 9 0 32900
conversion of the fuel (CH4). But as the S/C increases, more
energy is required to produce the required amount of steam
and it affects the overall operational cost of the process. The
Optimum S/C is the trade-off between the overall perfor-
mance and cost of the process.
The effect of S/C on the conversion (CH4 and H2O), at
constant temperature (600 �C) and constant pressure (1 bar), is
presented in Fig. 10(c).
Model outputs away from equilibrium
Having demonstrated the validity of the model at and away
from equilibrium, the model outputs are discussed in
steady-state conditions away from equilibrium outside the
range of our experimental data. Fig. 11 (a) shows the
decrease of CH4 and H2O conversions for the increasing
values of gas hourly space velocity (GHSV). The GHSV plays
a vital role in the overall conversion of CH4 and performance
of the system. The higher the GHSV, i.e. the shorter the
contact time with the catalyst throughout the reactor, the
lower will be the CH4 conversion. The modelling results
were checked for different GHSV and results are presented
in Fig. 11 (aec). Selectivity to effluent gases was modelled
according to the following equations;
H2 selectivity ð %Þ ¼ n:H2�
n:CH4
þ n:H2
�� 100 (27)
CH4 selectivity ð %Þ ¼ n:CH4�
n:CH4
þ n:CO2
þ n:CO
�� 100 (28)
CO2 selectivity ð %Þ ¼ n:CO2�
n:CH4
þ n:CO2
þ n:CO
�� 100 (29)
CO selectivity ð %Þ ¼ n:CO�
n:CH4
þ n:CO2
þ n:CO
�� 100 (30)
where, n:H2; n:
CH4; n:
CO2; n:
CO are the outlet molar flowrates of
H2, CH4, CO2 and CO respectively.
Thermal efficiency of reformer process is defined as;
Thermal efficiency ð%Þ¼�molesof H2 at outlet�LHVH2
��molesof CH4 in inlet� LHVCH4
��100
(31)
where LHV is the relevant lower heating value.
Fig. 12 shows the variation of thermal efficiency of the
reforming process with temperature at different S/C. The
higher the S/C and temperature, the higher is the thermal
efficiency of the process. Modelling results are compared with
the equilibrium results, generated on CEA, and it was found
that at temperature 750 �C and S/C of 3, equilibrium results for
thermal efficiency are same as that of modelling results. At
700 �C and S/C of 3, thermal efficiency of the process is found
to be 89.1%. GHSV used for Fig. 12 was 1.52 hr�1.
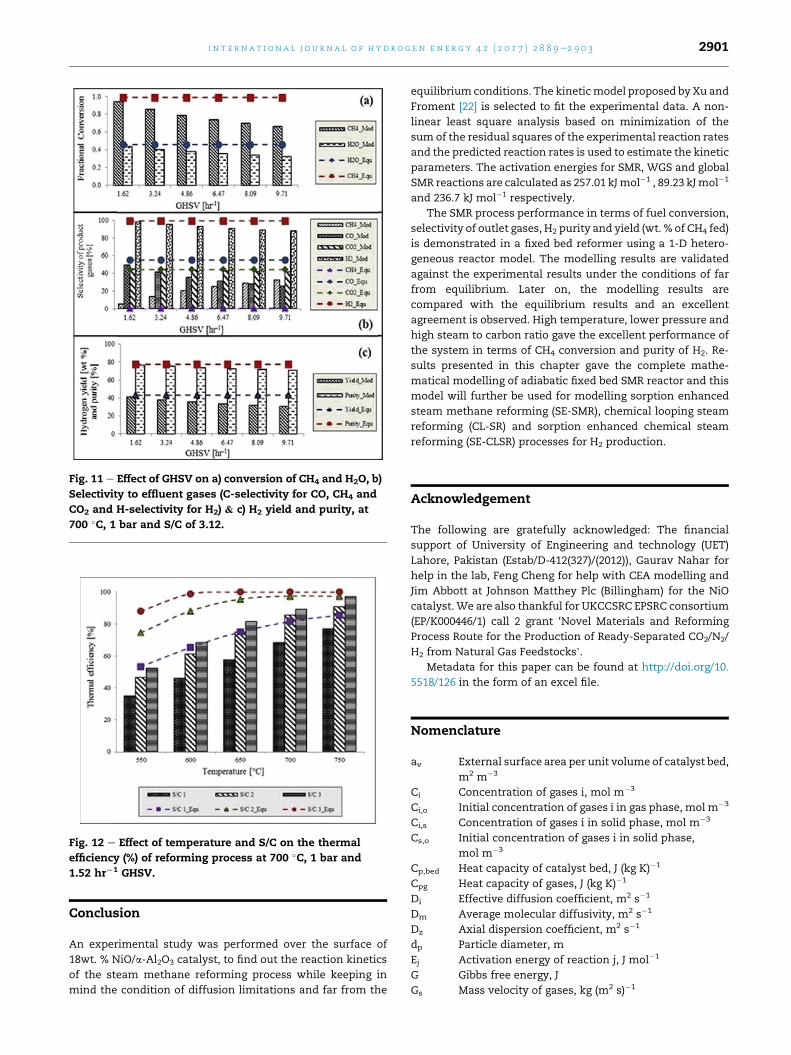
Fig. 11 e Effect of GHSV on a) conversion of CH4 and H2O, b)
Selectivity to effluent gases (C-selectivity for CO, CH4 and
CO2 and H-selectivity for H2) & c) H2 yield and purity, at
700 �C, 1 bar and S/C of 3.12.
Fig. 12 e Effect of temperature and S/C on the thermal
efficiency (%) of reforming process at 700 �C, 1 bar and
1.52 hr¡1 GHSV.
i n t e r n a t i o n a l j o u r n a l o f h y d r o g e n en e r g y 4 2 ( 2 0 1 7 ) 2 8 8 9e2 9 0 3 2901
Conclusion
An experimental study was performed over the surface of
18wt. % NiO/a-Al2O3 catalyst, to find out the reaction kinetics
of the steam methane reforming process while keeping in
mind the condition of diffusion limitations and far from the
equilibrium conditions. The kineticmodel proposed by Xu and
Froment [22] is selected to fit the experimental data. A non-
linear least square analysis based on minimization of the
sum of the residual squares of the experimental reaction rates
and the predicted reaction rates is used to estimate the kinetic
parameters. The activation energies for SMR, WGS and global
SMR reactions are calculated as 257.01 kJmol�1 , 89.23 kJmol�1
and 236.7 kJ mol�1 respectively.
The SMR process performance in terms of fuel conversion,
selectivity of outlet gases, H2 purity and yield (wt. % of CH4 fed)
is demonstrated in a fixed bed reformer using a 1-D hetero-
geneous reactor model. The modelling results are validated
against the experimental results under the conditions of far
from equilibrium. Later on, the modelling results are
compared with the equilibrium results and an excellent
agreement is observed. High temperature, lower pressure and
high steam to carbon ratio gave the excellent performance of
the system in terms of CH4 conversion and purity of H2. Re-
sults presented in this chapter gave the complete mathe-
matical modelling of adiabatic fixed bed SMR reactor and this
model will further be used for modelling sorption enhanced
steam methane reforming (SE-SMR), chemical looping steam
reforming (CL-SR) and sorption enhanced chemical steam
reforming (SE-CLSR) processes for H2 production.
Acknowledgement
The following are gratefully acknowledged: The financial
support of University of Engineering and technology (UET)
Lahore, Pakistan (Estab/D-412(327)/(2012)), Gaurav Nahar for
help in the lab, Feng Cheng for help with CEA modelling and
Jim Abbott at Johnson Matthey Plc (Billingham) for the NiO
catalyst.We are also thankful for UKCCSRC EPSRC consortium
(EP/K000446/1) call 2 grant ‘Novel Materials and Reforming
Process Route for the Production of Ready-Separated CO2/N2/
H2 from Natural Gas Feedstocks’.
Metadata for this paper can be found at http://doi.org/10.
5518/126 in the form of an excel file.
Nomenclature
av External surface area per unit volume of catalyst bed,
m2 m�3
Ci Concentration of gases i, mol m�3
Ci,o Initial concentration of gases i in gas phase, mol m�3
Ci,s Concentration of gases i in solid phase, mol m�3
Cs,o Initial concentration of gases i in solid phase,
mol m�3
Cp,bed Heat capacity of catalyst bed, J (kg K)�1
Cpg Heat capacity of gases, J (kg K)�1
Di Effective diffusion coefficient, m2 s�1
Dm Average molecular diffusivity, m2 s�1
Dz Axial dispersion coefficient, m2 s�1
dp Particle diameter, m
Ej Activation energy of reaction j, J mol�1
G Gibbs free energy, J
Gs Mass velocity of gases, kg (m2 s)�1
i n t e rn a t i o n a l j o u r n a l o f h y d r o g e n en e r g y 4 2 ( 2 0 1 7 ) 2 8 8 9e2 9 0 32902
DHi Heat of adsorption of i specie, J mol�1
Hrxn,j Heat of reaction of j reaction, J mol�1
hf Gas to solid heat transfer coefficient, W (m2 s)�1
jD, jH Chilton-Colburn factor for mass and heat transfer
kg,i Gas to solidmass transfer coefficient of component i,
m3 (m2 s)�1
kj Kinetic rate constant of reaction j
koj Reference temperature dependent kinetic rate
constant of reaction j
Kj Thermodynamic equilibrium constant
Ki Adsorption constant of species i
Koi Reference adsorption constant of species i
KD Viscous loss term in pressure drop calculations,
Pa s m�2
Kv Kinetic loss term in pressure drop calculations,
Pa s2 m�3
Pi Partial pressure of species i, bar
P Total gas pressure, bar
Po Initial pressure of the system, bar
Pr Prandtl number
ri Rate of formation or consumption of species i,
mol (kgcat s)�1
Rj Rate of reaction j, mol (kgcat s)�1
Rg Ideal gas constant, J (mol K)�1
Re Reynolds number
s Active site of the catalyst
Sci Schmidt number
T Gas temperature, K
To Gas inlet temperature, K
Ts Catalyst temperature, K
Ts,o Initial catalyst temperature, K
u Superficial velocity of the gases, m s�1
z Axial dimension, m
Greek letters
U Unit less term used in reaction kinetics
3b Bed porosity
hj Effectiveness factor of reaction j
lg Average gas thermal conductivity, W (m K)�1
ls solid thermal conductivity, W (m K)�1
lfz Effective thermal conductivity, W (m K)�1
mg Average gas viscosity, kg (m s)�1
mi Chemical potential of component i, J mol�1
rbed Bed density, kg m�3
rcat Catalyst density, kg m�3
rf Fluid density, kg m�3
∅ Thiele Modulus
Appendix A
R1 ¼ k1
p2:5H
pCH4
pH2O� p3
H2pCO
KI
!�1
U2
�(A1)
2
R2 ¼ k3
pH2
�pCOpH2O
� pH2pCO2
KII
��1
U2
�(A2)
R3 ¼ k2
p3:5H2
pCH4
p2H2O
� p4H2pCO2
KIII
!�1
U2
�(A3)
U ¼ 1þ KCOpCO þ KH2pH2
þ KCH4pCH4þ KH2O
pH2O
pH2
(A4)
Equilibrium constants for steam methane reforming pro-
cess, Arrhenius expression for kinetic parameters and
adsorption equation are given as:
KI ¼ exp
��26830Ts
þ 30:114
�(A5)
KII ¼ exp
�4400Ts
� 4:036
�(A6)
KIII ¼ KIKII (A7)
kj ¼ kojexp
��Ej
RgT
�(A8)
Ki ¼ Koiexp
��DHi
RgT
�(A9)
Reaction rate for all species involved in the reactor
system:
rCH4¼ �h1R1 � h3R3 (A10)
rCO2¼ h2R2 þ h3R3 (A11)
rH2O¼ �h1R1 � h2R2 � 2h3R3 (A12)
rH2¼ 3h1R1 þ h2R2 þ 4h3R3 (A13)
rCO ¼ h1R1 � h2R2 (A14)
Gibbs free energy:
dG ¼XNi¼1
m idni ¼ 0 (A15)
r e f e r e n c e s
[1] Chiron F-X, Patience GS, Rifflart S. Hydrogen productionthrough chemical looping using NiO/NiAl2O4 as oxygencarrier. Chem Eng Sci 2011;66:6324e30.
[2] Harrison DP, Peng Z. Low-carbon monoxide hydrogen bysorption-enhanced reaction. Int J Chem React Eng2003;1:1055.
[3] Ogden JM. Developing an infrastructure for hydrogenvehicles: a Southern California case study. Int J HydrogenEnergy 1999;24:709e30.
[4] Balasubramanian B, Lopez Ortiz A, Kaytakoglu S, Harrison D.Hydrogen from methane in a single-step process. Chem EngSci 1999;54:3543e52.
[5] Allen D, Gerhard E, Likins Jr M. Kinetics of the methane-steam reaction. Ind Eng Chem Process Des Dev1975;14:256e9.
[6] Alves JJ, Towler GP. Analysis of refinery hydrogendistribution systems. Ind Eng Chem Res 2002;41:5759e69.
[7] Abrardo J, Khurana V. Hydrogen technologies to meetrefiners' future needs: fuels management. Hydrocarb Process1995;74:43e9.
[8] Liguras DK, Kondarides DI, Verykios XE. Production ofhydrogen for fuel cells by steam reforming of ethanol over
i n t e r n a t i o n a l j o u r n a l o f h y d r o g e n en e r g y 4 2 ( 2 0 1 7 ) 2 8 8 9e2 9 0 3 2903
supported noble metal catalysts. Appl Catal B Environ2003;43:345e54.
[9] Winter C-J. Into the hydrogen energy economydmilestones.Int J Hydrogen Energy 2005;30:681e5.
[10] Ryd�en M, Ramos P. H2 production with CO2 capture bysorption enhanced chemical-looping reforming using NiO asoxygen carrier and CaO as CO2 sorbent. Fuel Process Technol2012;96:27e36.
[11] Ritter J, Ebner A. Separation technology R&D needs forhydrogen production in the chemical and petrochemicalindustries. US DOE Office of Industrial Technologies ProgramReport. 2005.
[12] Momirlan M, Veziroglu TN. The properties of hydrogen asfuel tomorrow in sustainable energy system for a cleanerplanet. Int J Hydrogen Energy 2005;30:795e802.
[13] Cortright R, Davda R, Dumesic J. Hydrogen from catalyticreforming of biomass-derived hydrocarbons in liquid water.Nature 2002;418:964e7.
[14] Joensen F, Rostrup-Nielsen JR. Conversion of hydrocarbonsand alcohols for fuel cells. J Power Sources2002;105:195e201.
[15] Ding Y, Alpay E. Adsorption-enhanced steamemethanereforming. Chem Eng Sci 2000;55:3929e40.
[16] Ersoz A, Olgun H, Ozdogan S. Reforming options forhydrogen production from fossil fuels for PEM fuel cells. JPower Sources 2006;154:67e73.
[17] Rostrup-Nielsen JR, Sehested J, Nørskov JK. Hydrogen andsynthesis gas by steam- and CO2 reforming. Advances inCatalysis. Academic Press; 2002. p. 65e139.
[18] Adris A, Pruden B, Lim C, Grace J. On the reported attempts toradically improve the performance of the steam methanereforming reactor. Can J Chem Eng 1996;74:177e86.
[19] Fern�andez JR, Abanades JC, Murillo R, Grasa G. Conceptualdesign of a hydrogen production process from natural gaswith CO2 capture using a CaeCu chemical loop. Int J GreenhGas Control 2012;6:126e41.
[20] Rosen M. Thermodynamic investigation of hydrogenproduction by steam-methane reforming. Int J HydrogenEnergy 1991;16:207e17.
[21] Kumar RV, Lyon RK, Cole JA. Unmixed reforming: a novelautothermal cyclic steam reforming process. Advances inHydrogen Energy. Springer; 2002. p. 31e45.
[22] Xu J, Froment GF. Methane steam reforming, methanationand water-gas shift: I. intrinsic kinetics. AIChE J1989;35:88e96.
[23] Hou K, Hughes R. The kinetics of methane steam reformingover a Ni/a-Al2O catalyst. Chem Eng J 2001;82:311e28.
[24] Van Hook JP. Methane-steam reforming. Catal Rev Sci Eng1980;21:1e51.
[25] Akers W, Camp D. Kinetics of the methane-steam reaction.AIChE J 1955;1:471e5.
[26] Berman A, Karn R, Epstein M. Kinetics of steam reforming ofmethane on Ru/Al2O3 catalyst promoted with Mn oxides.Appl Catal A General 2005;282:73e83.
[27] Rostrup-Nielsen JR. Catalytic steam reforming. Springer;1984.
[28] Twigg MV, Twigg M. Catalyst handbook. CSIRO; 1989.[29] Ryd�en M, Lyngfelt A, Mattisson T. Chemical-looping
combustion and chemical-looping reforming in a circulatingfluidized-bed reactor using Ni-based oxygen carriers. Energy& Fuels 2008;22:2585e97.
[30] Dirksen H, Riesz C. Equilibrium in the steam reforming ofnatural gas. Ind Eng Chem 1953;45:1562e5.
[31] Amphlett J, Evans M, Mann R, Weir R. Hydrogen productionby the catalytic steam reforming of methanol: Part 2: kineticsof methanol decomposition using girdler G66B catalyst. Can JChem Eng 1985;63:605e11.
[32] Cavallaro S, Freni S. Ethanol steam reforming in a moltencarbonate fuel cell. A preliminary kinetic investigation. Int JHydrogen Energy 1996;21:465e9.
[33] Wang D, Dewaele O, Froment GF. Methane adsorption on Rh/Al2O3. J Mol Catal A, Chem 1998;136:301e9.
[34] Peppley BA, Amphlett JC, Kearns LM, Mann RF.Methanolesteam reforming on Cu/ZnO/Al2O3. Part 1: thereaction network. Appl Catal A General 1999;179:21e9.
[35] Elnashaie S, Adris A, Al-Ubaid A, Soliman M. On the non-monotonic behaviour of methanedsteam reformingkinetics. Chem Eng Sci 1990;45:491e501.
[36] Pimenidou P, Rickett G, Dupont V, Twigg M. Chemicallooping reforming of waste cooking oil in packed bed reactor.Bioresour Technol 2010;101:6389e97.
[37] Dupont V, Ross A, Hanley I, Twigg M. Unmixed steamreforming of methane and sunflower oil: a single-reactorprocess for H2-rich gas. Int J Hydrogen Energy 2007;32:67e79.
[38] Dou B, Rickett GL, Dupont V, Williams PT, Chen H, Ding Y,et al. Steam reforming of crude glycerol with in situ CO2
sorption. Bioresour Technol 2010;101:2436e42.[39] Dou B, Dupont V, Rickett G, Blakeman N, Williams PT,
Chen H, et al. Hydrogen production by sorption-enhancedsteam reforming of glycerol. Bioresour Technol2009;100:3540e7.
[40] Edwards M, Richardson J. Gas dispersion in packed beds.Chem Eng Sci 1968;23:109e23.
[41] Yagi S, Kunii D, Wakao N. Studies on axial effective thermalconductivities in packed beds. AIChE J 1960;6:543e6.
[42] Geankoplis CJ. Transport processes and unit operations.1993.
[43] Handley D, Heggs PJ. The effect of thermal conductivity ofthe packing material on transient heat transfer in a fixedbed. Int J Heat Mass Transf 1969;12:549e70.
[44] Gordon S, McBride BJ. Computer program for calculation ofcomplex chemical equilibrium compositions andapplications. Citeseer; 1996.
[45] McBride BJ, Gordon S. Computer program for calculation ofcomplex chemical equilibrium compositions andapplications II. Users manual and program description. 2;Users manual and program description. 1996.
[46] Kee RJ, Rupley FM, Miller JA. Chemkin-II: a Fortran chemicalkinetics package for the analysis of gas-phase chemicalkinetics. Livermore, CA (USA): Sandia National Labs.; 1989.
[47] Weisz P, Prater C. Interpretation of measurements inexperimental catalysis. Adv Catal 1954;6:60390e9.
[48] Fogler HS. Elements of chemical reaction engineering. 1999.[49] De Smet C, De Croon M, Berger R, Marin G, Schouten J. Design
of adiabatic fixed-bed reactors for the partial oxidation ofmethane to synthesis gas. Application to production ofmethanol and hydrogen-for-fuel-cells. Chem Eng Sci2001;56:4849e61.
[50] Halabi M, De Croon M, Van der Schaaf J, Cobden P,Schouten J. Modeling and analysis of autothermal reformingof methane to hydrogen in a fixed bed reformer. Chem Eng J2008;137:568e78.