kinetics of pip2 metabolism and kcnq2/3 channel regulation
TRANSCRIPT

A r t i c l e
The Rockefeller University Press $30.00J. Gen. Physiol. Vol. 135 No. 2 99–114www.jgp.org/cgi/doi/10.1085/jgp.200910345 99
I N T R O D U C T I O N
Phosphoinositides are minority phospholipids of bio-logical membranes that are central in cellular signaling and as anchors for peripheral membrane proteins (e.g., De Matteis and Godi, 2004; Wenk and De Camilli, 2004). The phosphoinositide phosphatidylinositol 4,5-bisphos-phate (PIP2), localized mainly in the cytoplasmic leaflet of the plasma membrane, is required for function of many ion channels and transporters (Hilgemann and Ball, 1996; Hilgemann et al., 2001; Suh and Hille, 2002, 2008). It is also important in exocytosis, endocytosis, cell adhesion, and motility (e.g., Di Paolo and De Camilli, 2006; Mao and Yin, 2007). Additionally, PIP2 is the im-mediate precursor for three major second messengers, inositol 1,4,5-trisphosphate (IP3), diacylglycerol (DAG), and phosphatidylinositol 3,4,5-trisphosphate, which are generated by activation of plasma membrane receptors. Here, we determine the kinetics of production of PIP2 and its regulation of KCNQ2/3 (Kv7.2/7.3) potassium channels.
We have previously investigated signaling to KCNQ channels by the M1 muscarinic receptor (M1R). These studies established the requirements (Suh et al., 2004;
Correspondence to Bertil Hille: hille@u.washington.eduAbbreviations used in this paper: CFP, cyan fluorescent protein; Ci-VSP,
voltage-sensitive phosphatase from Ciona intestinalis; DAG, diacylglycerol; Dr-VSP, voltage-sensitive phosphatase from Danio rerio; FRET, Förster reso-nance energy transfer; IP3, inositol 1,4,5-trisphosphate; IRES, internal ri-bosome entry site; M1R, M1 muscarinic receptor; Oxo-M, oxotremorine-M; PH, pleckstrin homology; PI, phosphatidylinositol; PIP, phosphatidylinosi-tol 4-phosphate; PIP2, phosphatidylinositol 4,5-bisphosphate; VSP, voltage-sensitive phosphatase; YFP, yellow fluorescent protein.
Horowitz et al., 2005), timing (Jensen et al., 2009), and rate constants (see Falkenburger et al. in this issue) of individual steps in the M1R signaling cascade: the bind-ing of the muscarinic agonist oxotremorine-M (Oxo-M), the processing of G proteins on receptors, G protein dissociation/rearrangement, the binding of Gq sub-units to PLC, and PLC-mediated hydrolysis of PIP2. The PIP2 depletion turns off KCNQ2/3 potassium channels (diagramed in Fig. 1, A and B).
Recovery of current after M1R activation requires re-generation of PIP2. Wortmannin sensitivity and an ATP requirement implicate a type III phosphatidylinositol (PI) 4-kinase in the recovery (Suh and Hille, 2002; Zhang et al., 2003). The PI 4-kinases phosphorylate PI at the inositol 4 position to produce PI(4)P, which is then phosphorylated by phosphatidylinositol 4-phosphate (PIP) 5-kinases at the 5 position to yield PIP2 (Fig. 1 E). These two steps are required for the maintenance of the “hormone-sensitive” pool of PIP2 at the plasma membrane (Nakanishi et al., 1995; Wang et al., 2004) and for its recovery after receptor activation.
Here, we seek a quantitative description of the lipid kinases and phosphatases that govern plasma mem-brane PIP2. Most interesting is PIP 5-kinase, the enzyme producing PIP2, which also mediates the effects of Rho family GTPases on actin organization (Chong et al., 1994;
Kinetics of PIP2 metabolism and KCNQ2/3 channel regulation studied with a voltage-sensitive phosphatase in living cells
Björn H. Falkenburger, Jill B. Jensen, and Bertil Hille
Department of Physiology and Biophysics, University of Washington, Seattle, WA 98195
The signaling phosphoinositide phosphatidylinositol 4,5-bisphosphate (PIP2) is synthesized in two steps from phosphatidylinositol by lipid kinases. It then interacts with KCNQ channels and with pleckstrin homology (PH) domains among many other physiological protein targets. We measured and developed a quantitative description of these metabolic and protein interaction steps by perturbing the PIP2 pool with a voltage-sensitive phosphatase (VSP). VSP can remove the 5-phosphate of PIP2 with a time constant of <300 ms and fully inhibits KCNQ currents in a similar time. PIP2 was then resynthesized from phosphatidylinositol 4-phosphate (PIP) quickly, = 11 s. In con-trast, resynthesis of PIP2 after activation of phospholipase C by muscarinic receptors took 130 s. These kinetic ex-periments showed that (1) PIP2 activation of KCNQ channels obeys a cooperative square law, (2) the PIP2 residence time on channels is <10 ms and the exchange time on PH domains is similarly fast, and (3) the step synthesizing PIP2 by PIP 5-kinase is fast and limited primarily by a step(s) that replenishes the pool of plasma membrane PI(4)P. We extend the kinetic model for signaling from M1 muscarinic receptors, presented in our companion paper in this issue (Falkenburger et al. 2010. J. Gen. Physiol. doi:10.1085/jgp.200910344), with this new information on PIP2 synthesis and KCNQ interaction.
© 2010 Falkenburger et al. This article is distributed under the terms of an Attribution–Noncommercial–Share Alike–No Mirror Sites license for the first six months after the publi-cation date (see http://www.jgp.org/misc/terms.shtml). After six months it is available under a Creative Commons License (Attribution–Noncommercial–Share Alike 3.0 Unported li-cense, as described at http://creativecommons.org/licenses/by-nc-sa/3.0/).
The
Jour
nal o
f G
ener
al P
hysi
olo
gy
on April 7, 2018jgp.rupress.org Downloaded from http://doi.org/10.1085/jgp.200910345Published Online: 25 January, 2010 | Supp Info:

100 Kinetics of PIP2 metabolism
(as in Hossain et al., 2008); and linear leak and capacitive tran-sients were subtracted by a p/5 procedure (five repetitions of 0.2 of the test pulse amplitude from a holding potential of 120 mV after the test pulse).
KCNQ2/3 current was measured in two ways. One was to hold the membrane potential at 20 mV continuously. Endogenous currents in tsA201 cells are small at 20 mV (26 pA ± 5 pA; n = 16 cells; see Fig. S2, A and C). The second method used tail cur-rents. Every 0.5 or 1 s, the membrane potential was depolarized to 20 mV for 200 or 300 ms and repolarized to 60 mV. KCNQ2/3 current activates slowly upon depolarization and deactivates slowly upon repolarization (see Fig. S2 B). In contrast, endogenous currents deactivate too fast to be seen at the sampling frequency used. KCNQ2/3 tail currents were measured by comparing cur-rent at 20 and 200 ms after repolarization to 60 mV.
Photometric measurement of PH domain Förster resonance energy transfer (FRET)We used epifluorescence photometry to measure the FRET of PH domains simultaneously with measurement of KCNQ2/3 current. The photometry setup was different from that used previously (Jensen et al., 2009; Falkenburger et al., 2010). A monochroma-tor (Polychrome IV; TILL Photonics) provided excitation light, and a three-color dichroic mirror in the microscope reflected at 440, 500, and 580 nm (CFP, YFP, and mCherry; 89006bs; Chroma Technology Corp.). The dichroic mirror is transparent at 460–480 and 520–560 nm. Fluorescence was detected by a photometry system consisting of a ViewFinderIII with two photodiodes con-nected to an FDU-2 detection unit (TILL Photonics). Light was split between the two photodiodes by a dichroic mirror (DCLP505). In addition, the short-wavelength channel contained a D480/40 emission filter, and the long-wavelength channel con-tained an ET535/30 filter (Chroma Technology Corp.). For near-simultaneous acquisition of CFPC (440-nm excitation and 480-nm emission), YFPC (440-nm excitation and 535-nm emission), and YFPY (500-nm excitation and 535-nm emission), the excitation wavelength was scanned from 300 to 500 nm in 200 ms. Both pho-todiodes were sampled every 0.1 ms. A shutter was opened 10 ms before scanning and closed 100 ms after scanning. To measure KCNQ2/3 current at the same time, the membrane potential was depolarized to 20 mV for 300 ms and held at 60 mV for the re-mainder of the time. This protocol was repeated every 500 ms. After recording from each cell, an area of the coverslip without cells was measured as background. This background fluorescence was small and depended little on the excitation wavelength. The light intensity in the illuminated 139 × 158.5 µm2 area was 45 µW at 430 nm and 35 µW at 500 nm (0.2 W/cm2).
Data were analyzed offline in IGOR Pro 6.0 (WaveMetrics). To calculate FRET, we extracted three values from each wavelength scan, similar to a three-cube FRET approach. We denote them CFPC, raw YFPC, and YFPY, with the first part referring to the emis-sion wavelength and the subscript referring to the excitation wavelength. For the CFPC value, emission in the short-wavelength channel (460–480-nm emission) was integrated over the time when excitation was 360–460 nm. For the raw YFPC value, the long-wavelength channel (535/30-nm emission) was integrated over the same time. For the YFPY value, the long-wavelength channel was integrated over the time where excitation was 490–500 nm. The units for all three values were set as arbitrary fluorescence units (AFU). Background was subtracted from each. The raw YFPC value had to be corrected for cyan fluorescent protein (CFP) emission collected in the long-wavelength channel and for direct excitation of yellow fluorescent protein (YFP) by 440-nm light by subtracting 0.834*CFPC and 0.065*YFPY. The corrected value is referred to as YFPC from now on. The correction factors were de-termined by measuring cells expressing only CFP or YFP. The spectral window for collection of CFP emission was smaller than
Oude Weernink et al., 2004). To perturb the system, we characterized and exploited a PIP2 5-phosphatase that can be activated by depolarization of the membrane potential, the voltage-sensitive phosphatase (VSP). VSP contains a voltage sensor domain homologous to those of voltage-gated ion channels and a phosphatase domain homologous to PTEN, a polyphosphoinosit-ide phosphatase (Fig. 1, C and D) (Okamura et al., 2009). VSP can dephosphorylate PI(4,5)P2 to PI(4)P (Iwasaki et al., 2008; Halaszovich et al., 2009). Recovery after VSP activation is then mediated by the endoge-nous PIP 5-kinases at the plasma membrane. As VSP- induced changes in PIP2 were not accompanied by the generation of other second messengers that might modulate KCNQ2/3 current, this intervention also pro-vided an opportunity to learn more about the interac-tion of PIP2 with KCNQ2/3 channels, and about PIP2 reporting by the pleckstrin homology (PH) domain probe we use.
M AT E R I A L S A N D M E T H O D S
Cell culture and plasmidsCells (tsA201) cultured in DMEM (Invitrogen) with 10% serum and 2% penicillin/streptomycin were passaged once a week. Cells were transfected at 75% confluency, plated on polylysine-coated glass chips 24 h after transfection, and used for experiments the next day. Cells were transfected with Lipofectamine 2000 (10 µl for a 3-cm dish; Invitrogen) and 0.5–1.2 µg DNA per plasmid: mouse M1R (provided by N. Nathanson, University of Washing-ton, Seattle, WA); human eCFP-PH(PLC1) and eYFP-PH(PLC1; provided by K. Jalink, The Netherlands Cancer Institute, Amster-dam, Netherlands); human KCNQ2 and rat KCNQ3 (provided by D. McKinnon, State University of New York, Stony Brook, NY); PIP 5-kinase type I (provided by Y. Aikawa and T.F. Martin, Uni-versity of Wisconsin, Madison, WI); and Ci-VSP-IRES-GFP (Ci-VSP, VSP from Ciona intestinalis; internal ribosome reentry site [IRES]) and Dr-VSP-IRES-GFP (Dr-VSP) from zebrafish (Danio rerio; both provided by Y. Okamura, Osaka University, Osaka, Japan). “Dark” Dr-VSP (without IRES-GFP) was generated by subcloning the Dr-VSP cassette into pcDNA3.0 using HindIII and XhoI.
ElectrophysiologyCells were continuously superfused with Ringer’s solution con-taining (in mM): 160 NaCl, 2.5 KCl, 2 CaCl2, 1 MgCl2, 10 HEPES, and 8 glucose, pH 7.4 (NaOH). 10 µM Oxo-M was applied via a two-barrel theta tube. Cells were recorded by whole cell gigaseal voltage clamp using borosilicate glass pipettes with a resistance of 1.6–2.2 MΩ. Internal solution was (in mM): 175 KCl, 5 MgCl2, 5 HEPES, 0.1 K4BAPTA, 3 Na2ATP, and 0.1 Na3GTP, pH 7.4 (KOH). Recordings used an EPC9 amplifier with either Patch-master 2.35 or Pulse 8.53 software (HEKA). Holding potential was 60 mV. Voltage protocols are given in the figures and legends. Currents were filtered at 2.9 kHz. Sample intervals ranged from 0.1 ms for tail currents to 50 ms for 30-s records at 20 mV. Series resistance was compensated by 70% after compensation of fast and slow capacitance. Except where stated, leak was not sub-tracted. For measuring VSP “sensing currents,” we changed three conditions: the internal solution was (in mM) 100 HEPES, 65 NMDG, 3 MgCl2, and 1 EGTA; the external solution was (in mM) 180 HEPES, 75 NMDG, 1 CaCl2, 1 MgCl2, and 10 glucose, pH 7.4

Falkenburger et al. 101
Online supplemental materialFig. S1 shows VSP-sensing currents in tsA201 cells. Fig. S2 illus-trates endogenous ion currents in tsA cells compared with cur-rents in KCNQ2/3-transfected cells. Fig. S3 shows the theoretical prediction of the density of PH probes at the membrane for dif-ferent amounts of PIP2, and a description of the dependence of FRET efficiency and FRETr for CFP/YFP-labeled PH probes on plasma membrane PIP2. Table S1 lists the model differential equa-tions. The online supplemental material is available at http://www.jgp.org/cgi/content/full/jgp.200910345/DC1.
R E S U LT S
Our laboratory has already formulated a preliminary ki-netic description of the signaling steps from muscarinic receptor excitation to PIP2 turnover and channel modula-tion (Suh et al., 2004). It was based on plausible estimates knowing the final modulation of KCNQ2/3 channels. Then, a second-generation model for the steps from re-ceptor activation to turning on PLC was formulated in our companion paper (Falkenburger et al., 2010) based on our recent more complete set of kinetic measurements with FRET (Jensen et al., 2009). In this paper, to extend our model to include the steps of PIP2 metabolism and the action of PIP2 on channels, we have made extensive use of PH domains as indicators of PIP2, of a VSP to deplete PIP2 rapidly, and of KCNQ2/3 channels to report their own activation by PIP2. We start by characterizing VSP.
The voltage sensor of VSP responds rapidlyAs in voltage-gated ion channels, positive charges in the S4 segment of the voltage sensor of VSP (Fig. 1, C and D,
in our previous work (Jensen et al., 2009). Therefore CFPC had to be multiplied by a larger factor in correcting the long-wavelength channel for bleedthrough of CFP emission. The lower values for CFPC also affected the values of the FRET ratio, FRETr (see be-low). FRET was expressed as the ratio FRETr = YFPC/CFPC. This ratio is related to FRET efficiency, with two differences. A FRET efficiency of 20% means that 20% of CFP excitation is reemitted by YFP instead of CFP, thus CFP emission is reduced to 80%. If the short-wavelength detector (CFPC) and the long-wavelength detec-tor (YFPC and YFPY) had the same photon sensitivity, a FRET effi-ciency of 20% would correspond to a FRETr of 20/80 = 0.25. However, in the photometry setup used here, the absolute changes in YFPC were approximately threefold larger than the accompany-ing changes in CFPC (both in AFU; compare Fig. 2, D with E). A true FRET efficiency of 20% would therefore correspond to a FRETr of 3*20/80 = 0.75. We report FRETr in arbitrary units be-cause the absolute values will differ between setups.
The YFPY value should be unaffected by FRET. It showed a gradual decline over time, reflecting dialysis of the PH probes from the cell into the much larger patch pipette. The time con-stant of decline (5 min) was similar to that for CFP protein dif-fusing from the patch pipette into the cell. The same decline was seen in the CFPC channel. Finally, as a consequence of the in-creasing distance between donors and acceptors, their FRET in-teraction also showed some decline.
ModelingA kinetic model of phosphoinositide metabolism was formulated as a compartmental model in the Virtual Cell framework (Uni-versity of Connecticut). The Virtual Cell Model “Falkenburger JGP2010” is publicly available at http://www.vcell.org/ under shared models/hillelab.
StatisticsSummarized data include one data point per cell. Bars and mark-ers represent mean ± SEM.
Figure 1. M1R signaling and phosphoinositide metabo-lism. (A) Neuronal M current is mediated by KCNQ2/3 potassium channels (yellow), which require membrane depolarization and PIP2 to open. (B) Binding of the M1R agonist Oxo-M facilitates binding of G proteins to the receptor. This binding induces “activation” of G pro-teins, i.e., nucleotide exchange at the Gq subunit from GDP to GTP, and dissociation of Gq from G. Gq-GTP activates PLC, which cleaves PIP2 into DAG and IP3. The absence of PIP2 prevents KCNQ2/3 channels from opening. (C) Voltage-gated ion channels are tetramers. Each subunit consists of a four-segment (S1-S4) voltage sensor domain (green and yellow) and a pore-forming domain (dark red). The S4 segment (yellow) contains positive charges, which move upon depolarization. (D) VSPs are monomers. They contain a four-segment voltage sensor and a phosphatase domain. The phos-phatase is activated by depolarization and dephosphor-ylates PIP2 to PI(4)P. (E) Phosphoinositide metabolism. PI is phosphorylated first by a PI 4-kinase and then by a PIP 5-kinase to yield PI(4,5)P2. A 4-phosphatase and a 5-phosphatase mediate the reverse reactions. VSP is a 5-phosphatase.
102 Kinetics of PIP2 metabolism
than the concentration that we chose for its substrate PIP2 in our model.
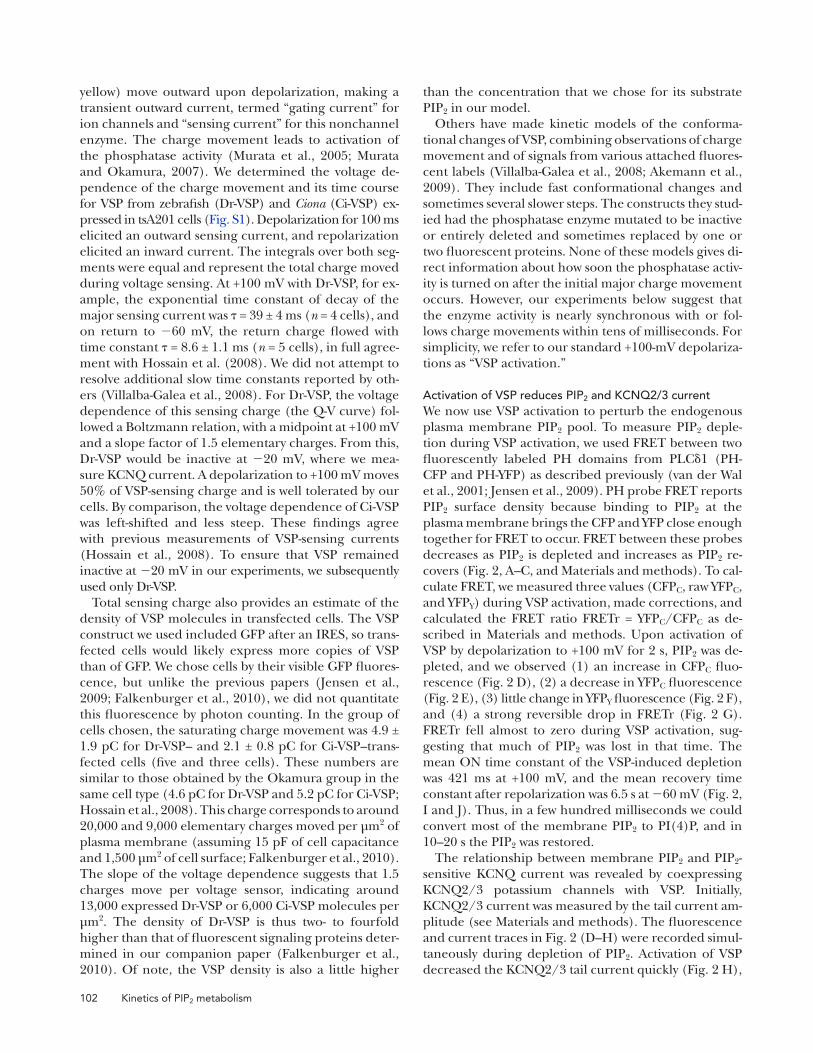
Others have made kinetic models of the conforma-tional changes of VSP, combining observations of charge movement and of signals from various attached fluores-cent labels (Villalba-Galea et al., 2008; Akemann et al., 2009). They include fast conformational changes and sometimes several slower steps. The constructs they stud-ied had the phosphatase enzyme mutated to be inactive or entirely deleted and sometimes replaced by one or two fluorescent proteins. None of these models gives di-rect information about how soon the phosphatase activ-ity is turned on after the initial major charge movement occurs. However, our experiments below suggest that the enzyme activity is nearly synchronous with or fol-lows charge movements within tens of milliseconds. For simplicity, we refer to our standard +100-mV depolariza-tions as “VSP activation.”
Activation of VSP reduces PIP2 and KCNQ2/3 currentWe now use VSP activation to perturb the endogenous plasma membrane PIP2 pool. To measure PIP2 deple-tion during VSP activation, we used FRET between two fluorescently labeled PH domains from PLC1 (PH-CFP and PH-YFP) as described previously (van der Wal et al., 2001; Jensen et al., 2009). PH probe FRET reports PIP2 surface density because binding to PIP2 at the plasma membrane brings the CFP and YFP close enough together for FRET to occur. FRET between these probes decreases as PIP2 is depleted and increases as PIP2 re-covers (Fig. 2, A–C, and Materials and methods). To cal-culate FRET, we measured three values (CFPC, raw YFPC, and YFPY) during VSP activation, made corrections, and calculated the FRET ratio FRETr = YFPC/CFPC as de-scribed in Materials and methods. Upon activation of VSP by depolarization to +100 mV for 2 s, PIP2 was de-pleted, and we observed (1) an increase in CFPC fluo-rescence (Fig. 2 D), (2) a decrease in YFPC fluorescence (Fig. 2 E), (3) little change in YFPY fluorescence (Fig. 2 F), and (4) a strong reversible drop in FRETr (Fig. 2 G). FRETr fell almost to zero during VSP activation, sug-gesting that much of PIP2 was lost in that time. The mean ON time constant of the VSP-induced depletion was 421 ms at +100 mV, and the mean recovery time constant after repolarization was 6.5 s at 60 mV (Fig. 2, I and J). Thus, in a few hundred milliseconds we could convert most of the membrane PIP2 to PI(4)P, and in 10–20 s the PIP2 was restored.
The relationship between membrane PIP2 and PIP2-sensitive KCNQ current was revealed by coexpressing KCNQ2/3 potassium channels with VSP. Initially, KCNQ2/3 current was measured by the tail current am-plitude (see Materials and methods). The fluorescence and current traces in Fig. 2 (D–H) were recorded simul-taneously during depletion of PIP2. Activation of VSP decreased the KCNQ2/3 tail current quickly (Fig. 2 H),
yellow) move outward upon depolarization, making a transient outward current, termed “gating current” for ion channels and “sensing current” for this nonchannel enzyme. The charge movement leads to activation of the phosphatase activity (Murata et al., 2005; Murata and Okamura, 2007). We determined the voltage de-pendence of the charge movement and its time course for VSP from zebrafish (Dr-VSP) and Ciona (Ci-VSP) ex-pressed in tsA201 cells (Fig. S1). Depolarization for 100 ms elicited an outward sensing current, and repolarization elicited an inward current. The integrals over both seg-ments were equal and represent the total charge moved during voltage sensing. At +100 mV with Dr-VSP, for ex-ample, the exponential time constant of decay of the major sensing current was = 39 ± 4 ms (n = 4 cells), and on return to 60 mV, the return charge flowed with time constant = 8.6 ± 1.1 ms (n = 5 cells), in full agree-ment with Hossain et al. (2008). We did not attempt to resolve additional slow time constants reported by oth-ers (Villalba-Galea et al., 2008). For Dr-VSP, the voltage dependence of this sensing charge (the Q-V curve) fol-lowed a Boltzmann relation, with a midpoint at +100 mV and a slope factor of 1.5 elementary charges. From this, Dr-VSP would be inactive at 20 mV, where we mea-sure KCNQ current. A depolarization to +100 mV moves 50% of VSP-sensing charge and is well tolerated by our cells. By comparison, the voltage dependence of Ci-VSP was left-shifted and less steep. These findings agree with previous measurements of VSP-sensing currents (Hossain et al., 2008). To ensure that VSP remained inactive at 20 mV in our experiments, we subsequently used only Dr-VSP.
Total sensing charge also provides an estimate of the density of VSP molecules in transfected cells. The VSP construct we used included GFP after an IRES, so trans-fected cells would likely express more copies of VSP than of GFP. We chose cells by their visible GFP fluores-cence, but unlike the previous papers (Jensen et al., 2009; Falkenburger et al., 2010), we did not quantitate this fluorescence by photon counting. In the group of cells chosen, the saturating charge movement was 4.9 ± 1.9 pC for Dr-VSP– and 2.1 ± 0.8 pC for Ci-VSP–trans-fected cells (five and three cells). These numbers are similar to those obtained by the Okamura group in the same cell type (4.6 pC for Dr-VSP and 5.2 pC for Ci-VSP; Hossain et al., 2008). This charge corresponds to around 20,000 and 9,000 elementary charges moved per µm2 of plasma membrane (assuming 15 pF of cell capacitance and 1,500 µm2 of cell surface; Falkenburger et al., 2010). The slope of the voltage dependence suggests that 1.5 charges move per voltage sensor, indicating around 13,000 expressed Dr-VSP or 6,000 Ci-VSP molecules per µm2. The density of Dr-VSP is thus two- to fourfold higher than that of fluorescent signaling proteins deter-mined in our companion paper (Falkenburger et al., 2010). Of note, the VSP density is also a little higher

Falkenburger et al. 103
steps to +100 mV, a perturbation that also increased the driving force for K+ and, in cells without VSP, increased current through KCNQ2/3 and endogenous channels (Fig. 3 A). When Dr-VSP was coexpressed (Fig. 3 B), KCNQ2/3 current decayed during the +100-mV depo-larization. Current was much reduced upon return to 20 mV and recovered thereafter. We compared cur-rents at 20 mV before and after varying lengths of VSP activation to track the onset of the VSP effect (Fig. 3, C and D). The effect on KCNQ2/3 was maximal after a 1-s activation pulse. A half-maximal effect required
as reported previously (Murata and Okamura, 2007). When VSP was turned off again, the recovery of current was slower than recovery of PH probe FRETr (compare Fig. 2, H with G).
To quantitate the kinetics of VSP actions on KCNQ2/3 current, we switched to measuring current by holding continuously at 20 mV, where noninactivating KCNQ2/3 current can be maintained for a long time and other endogenous K+ currents in tsA201 cells are minimally activated (Fig. S2, A and D). PH probes were not ex-pressed in these experiments. VSP was activated by brief
Figure 2. Activation of VSP (Dr-VSP) reduces PH probe FRET. (A) Cells were transfected with PIP2-binding PH probes (PH-PLC1) fused to CFP or YFP, Dr-VSP, and KCNQ2 and KCNQ3 channel subunits and recorded in whole cell voltage clamp. (B) Principle of PIP2 measurement by PH probe FRET (see Results and Fig. S3). (C) Photometry setup. Excitation light was scanned from 300 to 500 nm in 200 ms, every 500 ms, and reflected by a dichroic mirror around 440 and 500 nm. Emission light was separated into channels for CFP emission (480/40 nm) and YFP emission (535/30 nm). Time courses (D, E, F, and H) were acquired simultaneously. (D) CFP emis-sion with 440-nm excitation (CFPC). (E) YFP emission with 440-nm excitation, corrected for CFP emission at 535/30 nm and for direct excitation of YFP by 440-nm excitation light (YFPC). (F) YFP emission with 500-nm excitation (YFPY). (G) FRETr = YFPC/CFPC. (H) Tail current amplitude. Membrane was held at 60 mV and depolarized to 20 mV for 300 ms every 500 ms, except for shaded area where membrane was held at +100 mV for 2 s. Tail currents were measured during slow channel deactivation at 60 mV. (I) Time constants of single-exponential fits to FRETr while membrane was held at +100 mV (onset of VSP effect). A summary of 14 cells is shown. (J) Time constant of single-exponential fits to recovery of FRETr after 2 s at +100 mV. A summary of 12 cells is shown.

104 Kinetics of PIP2 metabolism
explains why the onset of VSP action on current is faster than that on FRETr. If the decay of FRETr followed an ex-ponential time course with time constant , the square of this function would decay exponentially with a time con-stant of /2. It also explains why recovery of current is S shaped and slower than FRETr when fitted with a single exponential (Fig. 4 D). If FRETr recovery followed y = 1 exp(t/), current recovery would follow y2 = 1 2exp(t/) + exp(2t/), which is S shaped. As pre-dicted by that equation, our recovery data fitted with the double-exponential equation gave mean time con-stants of 3.1 s for the positive term and 6.8 s for the negative term (Fig. 4 C, inset; 30 cells). This relation-ship allows us to predict the dependence of KCNQ2/3 current on PIP2 density from the known PIP2 affinity of PH probes (Fig. 4 G; for details see Fig. S3), and suggests that more than one PIP2 molecule binds to activate a KCNQ2/3 channel.
Interestingly, in a few cases (7/31 cells) KCNQ2/3 cur-rent recovered after VSP activation to values 10% higher than the steady-state value before VSP activation. Such over-recovery was observed both with holding at 20 mV and with tail currents. We have so far not investigated what underlies this phenomenon.
Recovery after VSP activation reflects PIP 5-kinase activityThe observations so far might be interpreted in two ways. The straightforward model would be that while VSP is converting PIP2 into PIP, the depletion of PIP2 turns off the KCNQ2/3 channels, with a corollary that
120 ms, and significant effect was already evident with only 40 ms of VSP activation, just enough time for 63% movement of the voltage sensor charge (Fig. S1 A). Thus, the coupling of the VSP voltage sensor to the phosphatase activity and the reporting of PIP2 deple-tion by KCNQ2/3 current are both fast (<40 ms). Fit-ting exponentials to the decline of whole cell current at +100 mV (Fig. 4 A) gave a time course for the action of VSP consistent with that of Fig. 3 D, even though this measure would be contaminated by the slow activation of KCNQ2/3 current and the inactivation of endogenous currents at +100 mV (Fig. S2, A and B).
KCNQ2/3 current is proportional to the square of PH domain FRETNow we can consider the relationship between PIP2 and current. During and after VSP activation, the changes of KCNQ2/3 current and those of the PH domain FRETr were not linearly related to each other. First, their exponential time constants differed systematically. For the onset of inhibition, current decayed faster than FRET, whereas for the recovery, current returned more slowly than FRETr (Fig. 4, A and B). The recovery of cur-rent followed an S-shaped time course (Figs. 2 H, 3 B, and 4 C), and when current was plotted against FRETr, the relationship was fitted better by a square law than by a straight line or cubic curve (Fig. 4 E). The same relationship was seen during recovery after M1R activation (Fig. 4 F, data taken from Jensen et al., 2009). This dependence of KCNQ2/3 current on the square of PH probe FRETr
Figure 3. Activation of VSP (Dr-VSP) inhibits KCNQ2/3 current. (A) Cur-rents recorded in cells transfected with KCNQ2/3 alone. (B) Currents in cells transfected with KCNQ2/3 and Dr-VSP. Note the reduction of current at 20 mV after depolarization to +100 mV. (C) Responses in the same cell as in B to a family of stimuli with increas-ing duration at +100 mV. Magnified time scale as compared with B also shows reduction of current at +100 mV. (D) Summary of normalized outward current at 20 mV (after/before step to +100 mV) for different durations at +100 mV (note log scale of x axis) for 5–12 cells.

Falkenburger et al. 105
and PI(4)P and the activity of cellular PIP 5-kinase(s) are needed after VSP activation to restore PIP2 and full channel activity.
Phosphorylation of PI(4)P by PIP 5-kinase is faster than PI(4)P supply by PI 4-kinaseIn contrast to VSP, PLC degrades PIP2 to DAG and IP3 and also leads to quick PI(4)P depletion (Willars et al., 1998; Horowitz et al., 2005). Recovery after PLC activa-tion needs two steps for PIP2 resynthesis: first, phosphory-lation of PI by a PI 4-kinase, and then phosphorylation of PI(4)P by a PIP 5-kinase. We find that recovery of KCNQ2/3 current after VSP activation (Fig. 6 A) is 5–10-fold faster than recovery after M1R activation (Fig. 6 E), even when the extent of KCNQ2/3 current inhibition was similar (Fig. 6, C and G). Mean recovery time con-stants for current were 11 s after VSP activation and 130 s after M1R activation (Fig. 6, D and H). PH probes were not expressed in either case. The slower recovery after receptor activation cannot be attributed to slow turn
PI(4)P is unable to support activity of the channels. An alternative model would be that channels are directly inhibited by the accumulating pool of PI(4)P rather than by depletion of PIP2. These possibilities might be distinguished by overexpressing an exogenous PIP 5- kinase to increase tonic PIP2 levels. In the first model, the increased PIP2 would make it harder for VSP to de-plete PIP2 quickly and to turn off channels. In the second model, increased PIP2 might even result in intensified channel inhibition by providing a larger precursor pool for production of inhibitory PI(4)P. As predicted in the first model, we found that the transfected 5-kinase made activation of VSP much less effective at suppressing KCNQ2/3 current (Fig. 5). The relation between the duration of VSP activation and current inhibition was slowed eightfold (Fig. 5, A and B), whereas recovery after VSP activation was speeded fivefold (Fig. 5, A and C). PH probes were not expressed in these experiments. These findings support the concepts that PIP2 is essen-tial, PI(4)P does not inhibit or permit channel activity,
Figure 4. KCNQ2/3 current behaves like the square of PH probe FRET. (A) In four cells, single exponentials were fitted to simultane-ously acquired KCNQ2/3 current and PH probe FRETr during VSP activation (2 s of +100 mV). Measurements from the same cell are connected by a line. (B) In five cells, single exponentials were fitted to simultaneously acquired KCNQ2/3 current and PH probe FRETr during recovery after VSP activation. KCNQ2/3 current was measured as tail current amplitude. (C) VSP effect on KCNQ current with voltage protocol as in Fig. 3 B. Recovery of KCNQ2/3 current at 20 mV was fitted with a double exponential: y = a b*exp(c*t) + d*exp(f*t). (Inset) Summary of time constants from 31 cells. Time constant of the positive term (pos.) is 1/f, and that of the negative term (neg.) is 1/c. (D) Illustration of the consequence of squaring an exponential of the form y = 1 exp(t/). (E) Plot of KCNQ2/3 current at 20 mV (black) versus PH probe FRETr at the same time during recovery after VSP activation in the cell depicted in Fig. 2. Similar observations were made for three other cells. Red curve corresponds to the equation given. (F) Averaged KCNQ2/3 current at 20 mV versus averaged FRETr at the same time after M1R activation, measured in separate cells (data from Figs. 5 D and 7 B in Jensen et al., 2009). (G) Illustration of the dependence of FRETr (approximated by PH_PIP2; see Fig. S3) and KCNQ current on PIP2 concentra-tion as predicted by the model outlined in Fig. 7 and Tables I and II: Kd of PH probe is 2,000 µm2 for PIP2 and 0.1 µM for IP3 (0.16 µM IP3); Kd of KCNQ is 2,000 µm2 for PIP2. KCNQ current = (KCNQ_PIP2)2.

106 Kinetics of PIP2 metabolism
Modeling of phosphoinositide metabolism, VSP, and PLCWe now return to a quantitative description of the sig-naling kinetics. For our model of phosphoinositide metabolism (Fig. 7, Tables I and II, and Table S1), we assumed that all phosphoinositide reactions take place in one compartment, and that the relevant kinases and phosphatases obey nonsaturating linear kinetics. For
off of PLC after agonist wash off because the measured interaction of Gq with PLC falls by 95% in only 2 s (Jensen et al., 2009; Falkenburger et al., 2010). Appar-ently, the production of PI(4)P by PI 4-kinase is rate lim-iting for recovery after M1R stimulation, and the endogenous PIP 5-kinase is many-fold faster than the PI 4-kinase.
Figure 5. PIP 5-kinase overexpression antagonizes VSP effects. (A) Traces from two cells with similar current amplitudes transfected with Dr-VSP and KCNQ2/3 (ctrl., black trace) or with Dr-VSP, KCNQ2/3, and PIP 5-kinase I (+5K, red trace). (B) Dependence of cur-rent inhibition on the duration of VSP activation. Baseline-normalized currents at 20 mV immediately after VSP activation are plotted for control (from Fig. 3 D) and +5K (three cells). (C) Time constants of single-exponential fits to current recovery after VSP activation. Summary of 16 cells for control and 4 cells for +5K.
Figure 6. PIP 5-kinase is faster than PI 4-kinase. Tail current amplitudes were used to measure current inhibition by Dr-VSP or M1R activation and its recovery. (A) Time course of tail current amplitude in a cell transfected with Dr-VSP and KCNQ2/3 (2 points s1). (B) Superimposed currents at time points before VSP activation (a), after VSP activation (b), and during recovery (c). (C) Summary of tail current amplitudes relative to baseline after VSP activation (b/a) and after recovery (c/a). (D) Time constant of a single-exponen-tial fit to the recovery time course (time b to c). (C and D) Summaries of 19 cells. (E) Time course of tail current amplitudes in a cell transfected with M1R and KCNQ2/3 (1 point s1). (F) Superimposed currents at time points a, b, and c indicated in E. (G) Tail current inhibition by M1R activation (summary of 10 cells). (H) Time constant of an exponential fit of recovery (summary of seven cells).

Falkenburger et al. 107
by M1Rs was determined by the model described in our companion paper (Falkenburger et al., 2010), which among other things reproduces time course and Oxo-M concentration–response curves for the interaction of Gq with PLC as measured by FRET (Jensen et al., 2009). As before, our model does not include the well-known contribution of Ca2+ as a necessary cofactor in PLC stimulation by Gq (Horowitz et al., 2005).
We began with VSP. It was simple to pick a rate con-stant for VSP activity that reproduced the rapid time course of KCNQ current inhibition during VSP activa-tion (Fig. 8 A). Then, it was straightforward to set the rate of the endogenous PIP 5-kinase to reproduce cur-rent recovery from VSP, which takes 11 s (Fig. 8 B). This gave us two rate constants and good agreement with the VSP experiments. Fig. 8 C illustrates the de-cline in PIP2 and parallel rise in PI(4)P during VSP acti-vation and their recovery hereafter. The choice of PIP 5-kinase rate constant did depend on the uncertain size of the resting PI(4)P pool relative to the PIP2 pool. If the resting PI(4)P pool was relatively small, the PIP 5- kinase rate constant would have to be a little faster than if the pool was of comparable size to PIP2 (see Discus-sion). The new experiments (Fig. 3) also showed that the interaction of PIP2 with KCNQ channels must be more rapid than we assumed previously.
We then considered strong activation of PLC by M1R activation. Again, we could easily pick a rate constant for PLC acting on PIP2 to match the rate of current in-hibition by 10 µM Oxo-M (Fig. 9 A, red solid line). Given a target pool size for PI(4)P and the rate constant for the PIP 5-kinase, we could also pick a rate constant for the PI 4-kinase to match the slow recovery from Oxo-M (Fig. 9 B, red solid line). This gave us two more rate constants and a reasonable fit.
Next, we turned to weaker activation of PLC by M1R activation with subsaturating agonist concentrations.
phosphoinositide kinases and phosphatases, we do not know the number of enzyme molecules and so assign a bulk activity rather than a molecular-specific activity. For regulation of KCNQ2/3 current by PIP2, we imple-mented a square law as suggested by Fig. 4: KCNQ2/3 subunits bind PIP2 with the same dissociation constant Kd as PH probes, and KCNQ2/3 current is proportional to the square of the number of PIP2-bound channel sub-units (Fig. 4 G). This implementation closely resembles our earlier model (Suh et al., 2004), where we had a Kd for PIP2 binding of 1,000 PIP2 per µm2 (instead of 2,000) and an exponent of 1.8 (instead of 2). Activation of PLC
Figure 7. Schematic of the kinetic model. Model species are denoted by Roman letters, and reactions are in italics. Initial conditions and rate constants are listed in Tables I and II, and differential equations are in Table S1. For PIP2 and IP3 binding to KCNQ and PH, the association reactions are referred to as forward reactions, and dissociation reactions are referred to as reverse reactions. KCNQ2/3 current depends on the square of PIP2-bound KCNQ2/3 subunits (PIP2_KCNQ2/3).
TA B L E I
Initial conditions
Species Amount Rationale
R 500 µm2 From fluorescencea
G 40 µm2 To fit concentration–response curve of currenta
PLC 10 µm2 To fit concentration–response curve of currenta
PI 140,000 µm2b Xu et al. (2003); Suh et al. (2004)
PIP 4,000 µm2 Suh et al. (2004); ratio to PIP2 as in Willars et al. (1998); Winks et al. (2005)
PIP2 5,000 µm2 To have 50% PH probes at the membrane, as in Horowitz et al. (2005), similar to Xu et al. (2003)
PH domainsc (membrane)
3,000 µm2 From fluorescencea, similar to Xu et al. (2003)
PH domainsc (cytosol) 3 µM 1 µM free, 2 µM PH_IP3; see Fig. S3, similar to Xu et al. (2003)
KCNQ2/3 channels 4 µm2 From whole cell current, open probability, and single-channel conductance; consistent with Zaika et al. (2008)
IP3 0.16 µM Fink et al. (1999); Xu et al. (2003); Winks et al. (2005)
aSee Falkenburger et al. (2010).bAmount of PI is clamped at 140,000 µm2.cNot present in all experiments.

108 Kinetics of PIP2 metabolism
green dashed line in Fig. 9 (A–C). In this simulation, the synthesis of new PIP2 is accelerated several-fold dur-ing the Oxo-M application as several authors have already suggested (see Discussion and legend to Fig. 9). Acceler-ated synthesis counters the PIP2 depletion catalyzed by weak activation of PLC.
Finally, we considered the actions of Oxo-M on FRET from PH domain probes. The unchanged model (red solid lines) simulates the decrease of FRETr with 10 µM Oxo-M well (Fig. 9 D), and the concentration–response curve moderately well (Fig. 9 F), but it predicts much slower FRETr recovery than is actually seen (Fig. 9 E). Note that these calculations include the effects of 6,000 µm2
This revealed difficulties. Consider the concentration–response relations for Oxo-M inhibition of KCNQ cur-rent (data points in Fig. 9 C). The model for G protein activation by receptors and for G protein interaction with PLC is already known to give appropriate concen-tration–response relations for the early signaling steps (Falkenburger et al., 2010). Hence, it was unexpected that the model did very poorly with the low-concentra-tion responses of the later signaling steps. For KCNQ current, it predicted too much suppression at low Oxo-M concentrations (0.001–1 µM; Fig. 9 C, red solid line). We discuss possible reasons for this discrepancy in the Discussion and show one possible solution here as the
TA B L E I I
Rate constants for phosphoinositide metabolism
Parameter Value Units Rationale
k_PLC 0.1 µm2 s1 Oxo-M onset of current inhibition
k_PLConPIP 0.14 * k_PLC µm2 s1 See Horowitz et al. (2005)
k_PLCbasal 0.0025 s1 To keep resting IP3 at 0.16 µM
k_4K 2.6 × 10⁴ s1 Current recovery after Oxo-M
k_4P 0.006 s1 To keep PI(4)P levels stable at rest
k_5K 0.02 s1 Current recovery after VSP
k_5P 0.014 s1 To keep PIP2 levels stable at rest
k_VSPa 11.3 * f(V) s1 Fit to VSP onset, see Fig. S1
speed _KCNQ _PIP2 0.05 µm2 s1 Rate limiting if <0.05
KD_KCNQ _PIP2 2,000 µm2 As for PH probes
I_KCNQb a * (PIP2_KCNQ)2 pA See Fig. 4
speed_PH_PIP2 1 µM1 s1 Affects timing if <1
KD_PH_PIP2 2 µM Lemmon et al. (1995); Hirose et al. (1999); as in Xu et al. (2003); Winks et al. (2005)
speed_PH_IP3 10 µM1 s1 To not be rate limiting, from Xu et al. (2003)
KD_PH_IP3 0.1 µM Hirose et al. (1999); Lemmon et al. (1995), as in Winks et al. (2005); Xu et al. (2003)
k_IP3ase 0.08 s1 From Xu et al. (2003)
Forward reactions of PIP2 binding are speed_, and reverse reactions are speed_ * KD_; see Table S1.af(V) = 1/(1+exp((1.5*qe/kBT*(V0.1)))) with qe/kBT = 25 mV.ba = channel number * open probability * single-channel current.
Figure 8. Modeling related to PIP 5-kinase and VSP. Traces are model predictions, and symbols are data. (A) Model current during VSP activation superimposed with the time course of current inhibition from Fig. 3 D. (B) Model current recovery superimposed with aver-aged time courses as in Fig. 6 A (n = 11 cells). (C) Model predictions for PI(4)P and PIP2 during VSP activation and recovery.

Falkenburger et al. 109
pal among them are: (1) PIP2 interaction with KCNQ channels occurs in the millisecond timescale, (2) more than one bound PIP2 is needed for optimal activation of KCNQ channels, and (3) PIP2 recovery after VSP activa-tion is much faster than after PLC activation.
Gating of KCNQ2/3 current by PIP2
Activation of Dr-VSP reduces PIP2 rapidly. KCNQ2/3 current responds to VSP activations as short as 40 ms, even before the sensing charge movement has finished. The rapidity of the inhibition means that PIP2 exchange at KCNQ2/3 channels is fast. In our earlier models (e.g., Suh et al., 2004), the residence time of PIP2 on a chan-nel subunit was set at 4 s, but we had little evidence to go on. The VSP result here shows that 4 s is much too long because channel inhibition reaches a new steady level within tens of milliseconds after each VSP activa-tion (Fig. 3 C). In the revised model, the residence time of PIP2 is 10 ms. It could be made shorter but not much longer. Apparently, the turnover time of PIP2 lipids on KCNQ subunits is shorter than the macroscopic gating times of the channel and is more on a timescale appro-priate to underlie open–close transitions at the single-channel level, as was assumed by Park et al. (2005). This conclusion is predicated on the assumption that PIP2
of PH domains (Falkenburger et al., 2010) that are buff-ering the PIP2 as fast as it is made. It is our working hy-pothesis that in these cells that have been overexpressing PH domain probes as PIP2 buffers for 2 d, the activity of phosphoinositide-metabolizing enzymes has become augmented by compensatory gene expression. The blue dotted lines show much improvement in fitting the data from assuming that the 4- and 5-kinases and -phospha-tases of these cells are augmented 10-fold. Such elevated rates are not appropriate for cells without PH domain expression and, for example, would predict recovery of current after Oxo-M in <20 s.
D I S C U S S I O N
We have completed a kinetic model of M1R signaling, spanning from the binding of agonist to receptor through G proteins and PLC to PIP2 depletion and resynthesis. The steps involving receptor and G proteins are de-scribed in our companion paper (Falkenburger et al., 2010), and this work adds phosphoinositide metabolism and the gating of KCNQ2/3 current by PIP2, with aspects of kinase regulation still unresolved. Our experiments lead to several model-independent conclusions. Princi-
Figure 9. Modeling of PIP2 depletion by M1R activation. Symbols are data from Jensen et al. (2009), and lines are model predictions. (A–C) KCNQ2/3 current. (D–F) PH probe FRET. (A and D) Time course of current/FRET inhibition by 10 µM Oxo-M. (B and E) Time course of recovery after M1R activation. (C and F) Concentration–response curves. Parameters for the red, solid curves are as listed in Tables I and II. For the blue, dotted curves, PI kinases and phosphatases were sped up by 10-fold (k_4K, 2.6 × 10³ s1; k_4P, 0.08 s1; k_5K, 0.2 s1; k_5P, 0.14 s1). For the green, dashed curves, the PI 4-kinase was sped up during Oxo-M (but not during recovery) in a manner depending on Oxo-M concentration (2.6 × 10⁴ s1 for 0.001 µM, 5 × 10⁴ s1 for 0.01 µM, and 2.6 × 10³ s1 for 0.1 µM and above). k_5K was 0.2 s1 during Oxo-M and 0.02 s1 during recovery. k_4P and k_5P were not accelerated. k_PLC was 0.2 µm2 s1 to fit onset. PLConPIP was 0.

110 Kinetics of PIP2 metabolism
Phosphoinositide poolsFull interpretation of phosphoinositide kinetics is lim-ited by uncertainty about the absolute endogenous lev-els of different phosphoinositide lipids and the enzymes that act on them at the plasma membrane and in other membranes. We begin with the lipids.
Even for PIP2, the density at the plasma membrane remains uncertain. McLaughlin et al. (2002) and Gole-biewska et al. (2008) suggest an effective free concen-tration of 10 µM referred to total cell volume, which is equivalent to 10,000 µm2 at the membrane for the 10-µm diameter cell they had in mind. Xu et al. (2003) give 4,000 µm2, and Hilgemann (2007) suggests values of 20,000–60,000 µm2. These estimates include poten-tial errors in determining the total lipid content of a sample, the count of cells in the sample, and the plasma membrane area of each cell. According to measure-ments of PIP2 diffusion by fluorescence correlation spectroscopy (Golebiewska et al., 2008), only one third of all PIP2 (the 10 µM above) is free, and two thirds is reversibly bound to membrane proteins with an ex-change time of 10 ms. In all our calculations, we as-sume that reactions of probes and enzymes like PIP2 5-phosphatase and PLC are restricted to free PIP2 mole-cules. Here and before (Suh et al., 2004), we have as-sumed 5,000 free PIP2 µm2 in our modeling. This number would be compatible with the observation that 50% of PH domains are bound to the plasma mem-brane and 50% are in the cytosol (Stauffer et al., 1998; van der Wal et al., 2001; Xu et al., 2003; Horowitz et al., 2005; Winks et al., 2005), with the following two assump-tions: the in vitro dissociation constants for the binding of PIP2 and of IP3 to PH domains are valid, and the rest-ing IP3 concentration in the cell is 0.16 µM (Fink et al., 1999; Xu et al., 2003; Winks et al., 2005; see Fig. S3 A). Had we assumed a high PIP2 density (20,000–60,000 µm2), the expression of a pair of PH probes at 1,700–3,000 µm2 each would have had little impact on PIP2 dynam-ics, so we consider this discrepancy as an argument against such high densities.
Biochemical measurements of PI and PI(4)P are even more difficult to interpret. Where are the pools of these PIP2 precursors, how big are they, and where are the en-zymes that act on them? The total cellular content of PI(4)P is similar to that of PIP2 (Willars et al., 1998; Na-suhoglu et al., 2002; Horowitz et al., 2005). We have sug-gested before that the pool of PI(4)P that is accessible to PLC during a 60-s M1R activation (88% of the total) might all be at the plasma membrane (Horowitz et al., 2005). However, lipid trafficking from cytosolic vesicles to the plasma membrane might be fast enough (t1/2 = 2 min; Maxfield and McGraw, 2004) to confound this concept. Some studies support the assumption that the majority of PI(4)P is at the plasma membrane (Hammond et al., 2009), but this could contradict the notion that PI(4)P is the characteristic phosphoinositide
must dissociate from channel subunits before VSP can cleave the 5-phosphate. Given that the PIP2 binding site at VSP is buried in the enzyme molecule (Okamura et al., 2009), this assumption appears reasonable.
Recovery of PIP2 and current after VSP activation was slow enough (10–20 s) to assume that KCNQ2/3 chan-nels remain near equilibrium with PIP2 throughout as the PIP2 is restored gradually. The nonlinear relation-ship of KCNQ2/3 current to PH probe FRETr indicates that current behaves like the square of the PH probe FRETr and explains why KCNQ2/3 current turns off faster than PH probe FRETr during PIP2 depletion. Such an accelerated turn-off might be biologically rele-vant as a way to speed the loss of KCNQ2/3 current and the increase of neuronal excitability in response to re-ceptor activation. The cooperativity in PIP2 activation of KCNQ2/3 channels seen here in intact cells is consis-tent with Hill coefficients in the range of 1.35 to 1.9 for current activation obtained by application of (short-chain) diC8-PIP2 to excised inside-out membrane patches (Zhang et al., 2003; Li et al., 2005).
Very few KCNQ2/3 channels are needed to measure PIP2—only around four channels µm2 in our cells, based on whole cell current, open probability, and single-channel conductance (see also Zaika et al. 2008). That small number would not perturb the cellular PIP2 pools; however, Zaika et al. (2008) report that for every elec-trophysiologically functional KCNQ channel, there can be many additional channels in the plasma membrane that do not contribute to current. Quite likely they would also bind PIP2. In contrast, PH probes require a high density to work as FRET reporters (Fig. S3 B): 1,700–3,000 µm2 for each PH probe (PH-CFP and PH-YFP) as determined by FRET efficiency and fluores-cence intensity (Falkenburger et al., 2010). The pool of PIP2 bound to the two PH probes is thus significant as compared with the pool of free PIP2, which we take to be 5,000 µm2. This can alter phosphoinositide dynam-ics, as we and others find (Holz et al., 2000; Raucher et al., 2000; Lei et al., 2001; Várnai et al., 2002; Gamper et al., 2004; Szentpetery et al., 2009). The inhibition of KCNQ2/3 current by M1R activation was slower, and the recovery faster, in cells with PH probe expression (Fig. 7 in Jensen et al., 2009). The slower onset of current inhi-bition with PH probe expression is reproduced by the model (not depicted). It is explained by buffering of PIP2 by PH probes providing a reserve of PIP2 to be hy-drolyzed; however, our model does not predict a faster recovery of KCNQ2/3 current with PH probe expres-sion unless the rates of some steps are modified. It also does not reproduce a relatively fast recovery of PH probe FRETr seen after M1R activation (Jensen et al., 2009). Such deviations from our simple predictions sug-gest that chronic expression of PH probes induces com-pensatory changes in phosphoinositide metabolism (see below).
Falkenburger et al. 111
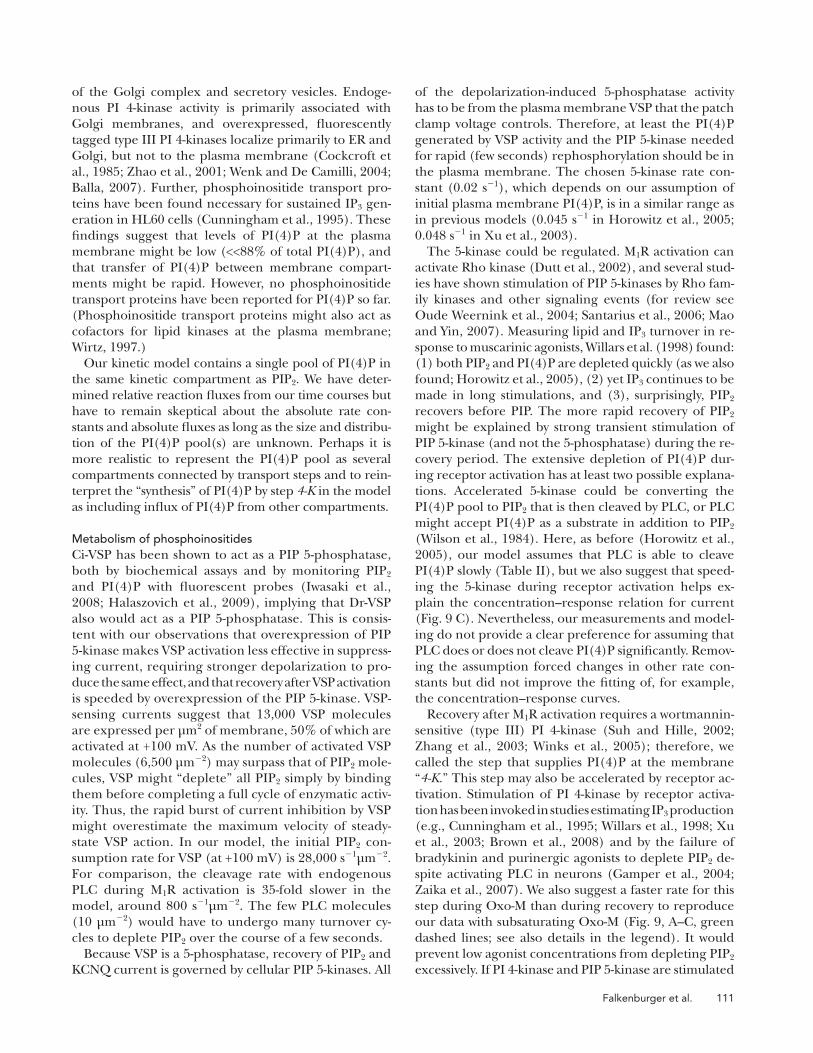
of the depolarization-induced 5-phosphatase activity has to be from the plasma membrane VSP that the patch clamp voltage controls. Therefore, at least the PI(4)P generated by VSP activity and the PIP 5-kinase needed for rapid (few seconds) rephosphorylation should be in the plasma membrane. The chosen 5-kinase rate con-stant (0.02 s1), which depends on our assumption of initial plasma membrane PI(4)P, is in a similar range as in previous models (0.045 s1 in Horowitz et al., 2005; 0.048 s1 in Xu et al., 2003).
The 5-kinase could be regulated. M1R activation can activate Rho kinase (Dutt et al., 2002), and several stud-ies have shown stimulation of PIP 5-kinases by Rho fam-ily kinases and other signaling events (for review see Oude Weernink et al., 2004; Santarius et al., 2006; Mao and Yin, 2007). Measuring lipid and IP3 turnover in re-sponse to muscarinic agonists, Willars et al. (1998) found: (1) both PIP2 and PI(4)P are depleted quickly (as we also found; Horowitz et al., 2005), (2) yet IP3 continues to be made in long stimulations, and (3), surprisingly, PIP2 recovers before PIP. The more rapid recovery of PIP2 might be explained by strong transient stimulation of PIP 5-kinase (and not the 5-phosphatase) during the re-covery period. The extensive depletion of PI(4)P dur-ing receptor activation has at least two possible explana-tions. Accelerated 5-kinase could be converting the PI(4)P pool to PIP2 that is then cleaved by PLC, or PLC might accept PI(4)P as a substrate in addition to PIP2 (Wilson et al., 1984). Here, as before (Horowitz et al., 2005), our model assumes that PLC is able to cleave PI(4)P slowly (Table II), but we also suggest that speed-ing the 5-kinase during receptor activation helps ex-plain the concentration–response relation for current (Fig. 9 C). Nevertheless, our measurements and model-ing do not provide a clear preference for assuming that PLC does or does not cleave PI(4)P significantly. Remov-ing the assumption forced changes in other rate con-stants but did not improve the fitting of, for example, the concentration–response curves.
Recovery after M1R activation requires a wortmannin-sensitive (type III) PI 4-kinase (Suh and Hille, 2002; Zhang et al., 2003; Winks et al., 2005); therefore, we called the step that supplies PI(4)P at the membrane “4-K.” This step may also be accelerated by receptor ac-tivation. Stimulation of PI 4-kinase by receptor activa-tion has been invoked in studies estimating IP3 production (e.g., Cunningham et al., 1995; Willars et al., 1998; Xu et al., 2003; Brown et al., 2008) and by the failure of bradykinin and purinergic agonists to deplete PIP2 de-spite activating PLC in neurons (Gamper et al., 2004; Zaika et al., 2007). We also suggest a faster rate for this step during Oxo-M than during recovery to reproduce our data with subsaturating Oxo-M (Fig. 9, A–C, green dashed lines; see also details in the legend). It would prevent low agonist concentrations from depleting PIP2 excessively. If PI 4-kinase and PIP 5-kinase are stimulated
of the Golgi complex and secretory vesicles. Endoge-nous PI 4-kinase activity is primarily associated with Golgi membranes, and overexpressed, fluorescently tagged type III PI 4-kinases localize primarily to ER and Golgi, but not to the plasma membrane (Cockcroft et al., 1985; Zhao et al., 2001; Wenk and De Camilli, 2004; Balla, 2007). Further, phosphoinositide transport pro-teins have been found necessary for sustained IP3 gen-eration in HL60 cells (Cunningham et al., 1995). These findings suggest that levels of PI(4)P at the plasma membrane might be low (<<88% of total PI(4)P), and that transfer of PI(4)P between membrane compart-ments might be rapid. However, no phosphoinositide transport proteins have been reported for PI(4)P so far. (Phosphoinositide transport proteins might also act as cofactors for lipid kinases at the plasma membrane; Wirtz, 1997.)
Our kinetic model contains a single pool of PI(4)P in the same kinetic compartment as PIP2. We have deter-mined relative reaction fluxes from our time courses but have to remain skeptical about the absolute rate con-stants and absolute fluxes as long as the size and distribu-tion of the PI(4)P pool(s) are unknown. Perhaps it is more realistic to represent the PI(4)P pool as several compartments connected by transport steps and to rein-terpret the “synthesis” of PI(4)P by step 4-K in the model as including influx of PI(4)P from other compartments.
Metabolism of phosphoinositidesCi-VSP has been shown to act as a PIP 5-phosphatase, both by biochemical assays and by monitoring PIP2 and PI(4)P with fluorescent probes (Iwasaki et al., 2008; Halaszovich et al., 2009), implying that Dr-VSP also would act as a PIP 5-phosphatase. This is consis-tent with our observations that overexpression of PIP 5-kinase makes VSP activation less effective in suppress-ing current, requiring stronger depolarization to pro-duce the same effect, and that recovery after VSP activation is speeded by overexpression of the PIP 5-kinase. VSP-sensing currents suggest that 13,000 VSP molecules are expressed per µm2 of membrane, 50% of which are activated at +100 mV. As the number of activated VSP molecules (6,500 µm2) may surpass that of PIP2 mole-cules, VSP might “deplete” all PIP2 simply by binding them before completing a full cycle of enzymatic activ-ity. Thus, the rapid burst of current inhibition by VSP might overestimate the maximum velocity of steady-state VSP action. In our model, the initial PIP2 con-sumption rate for VSP (at +100 mV) is 28,000 s1µm2. For comparison, the cleavage rate with endogenous PLC during M1R activation is 35-fold slower in the model, around 800 s1µm2. The few PLC molecules (10 µm2) would have to undergo many turnover cy-cles to deplete PIP2 over the course of a few seconds.
Because VSP is a 5-phosphatase, recovery of PIP2 and KCNQ current is governed by cellular PIP 5-kinases. All
112 Kinetics of PIP2 metabolism
pendence is omitted. At low agonist concentrations, the IP3 and Ca2+ positive feedback should be much less, so our model will overestimate the stimulation of PLC there. This defect cannot be modeled until we study how IP3 production, Ca2+ elevation, and feedback to PLC depend on receptor activation. At high agonist concentrations, the time it takes to produce a full Ca2+ elevation might also contribute to a small delay we see in the onset of current suppression after agonist appli-cation (Table I in Jensen et al., 2009).
ConclusionsWe have constructed a kinetic model of phosphoinosit-ide metabolism informed by new kinetic studies after rapid dephosphorylation of PIP2 by Dr-VSP. Although this model represents a substantial advance from the previous one, it also shows clearly where we have to learn more. We need better estimates of phosphoinosit-ide amounts in different membrane compartments and to determine the extent to which compartments other than the plasma membrane are involved in M1R signal-ing and lipid dynamics. In particular, the step supplying PI(4)P at the plasma membrane remains elusive. It is possible that events other than phosphorylation of PI at the plasma membrane contribute to the timing. We have shown that the step synthesizing PIP2 from PIP is much faster than the preceding step that supplies PIP, and we have advanced understanding of how PIP2 bind-ing allows KCNQ2/3 channels to open. More than one PIP2 is needed per channel, and the residence time on a channel subunit is <10 ms. This insight is valuable for using KCNQ2/3 current to monitor cellular PIP2 levels and might generalize to other PIP2-regulated ion chan-nels. Finally, we have shown that the voltage regulation of VSP activity is fast and makes VSP a powerful tool for investigating and perturbing phosphoinositide physiol-ogy and metabolism.
We thank Yasushi Okamura for providing Ci-VSP and Dr-VSP, Erwin Neher and William Zagotta for commenting on the manu-script, Sharona E. Gordon for use of equipment, and Lea Miller for technical help.
The Virtual Cell is supported by National Institutes of Health (NIH) grant P41RR013186 from the National Center for Re-search Resources. Our work was supported by NIH grants R01 NS08174, R01 GM83913, and T32 GM07108, and the Human Frontier Science Program.
Edward N. Pugh Jr. served as editor.
Submitted: 14 October 2009Accepted: 18 December 2009
R E F E R E N C E SAkemann, W., A. Lundby, H. Mutoh, and T. Knöpfel. 2009. Effect
of voltage sensitive fluorescent proteins on neuronal excitability. Biophys. J. 96:3959–3976. doi:10.1016/j.bpj.2009.02.046
Balla, T. 2007. Imaging and manipulating phosphoinositides in living cells. J. Physiol. 582:927–937. doi:10.1113/jphysiol.2007.132795
by receptor activation, we do not know how long that effect lasts after agonist is removed. Hence, our esti-mates of their rates after agonist removal may be imper-fect. (We expect no acceleration of kinases by VSP activation.) Current recovery from agonist was faster after overexpression of PLC or PH probes (Jensen et al., 2009). In these cases, however, the speeding might rep-resent compensatory gene expression.
What is the mechanism of receptor-induced stimula-tion of PI(4)P synthesis? The speeding of PI 4-kinase by bradykinin requires IP3-mediated calcium release and neuronal calcium sensor 1 (Gamper et al., 2004; Zaika et al., 2007). Calmodulin-like neuronal calcium sensor 1 binds to PI 4-kinase (in the Golgi) and stimulates the 4-kinase activity when calcium is increased by receptor activation (Zhao et al., 2001; Koizumi et al., 2002; Pan et al., 2002; Winks et al., 2005). The stimulation can be so strong that PIP2 is not depleted despite PLC activation. It is possible that M1R activation, which makes a Ca2+ tran-sient in tsA201 cells, stimulates PI 4-kinase by a similar mechanism, but to a lesser extent. There might also be other messengers. If type III PI 4-kinases are located in the Golgi complex, it is possible that not the PI 4-kinase but the PI(4)P transport to the plasma membrane might be rate limiting and stimulated by receptor activation. Our model would not discriminate between the stimula-tion of PI 4-kinases and any other event that transiently increases plasma membrane PI(4)P. One such possibility is exocytosis. Secretory vesicles are thought to bear PI(4)P formed by PI 4-kinases in Golgi and by 5-phosphatases during endocytosis (De Matteis and Godi, 2004; Wenk and De Camilli, 2004; Balla et al., 2005). Exocytosis can increase upon stimulation of Gq-coupled receptors both by Ca2+ release and by activating PKC (e.g., Hille et al., 1999), and vesicle fusion with the plasma membrane would deliver PI(4)P to the plasma membrane.
The time course of Oxo-M effects on PH probe FRET was well reproduced with increased rates for PIP2 syn-thesis (Fig. 9, D–F, dotted traces). Interestingly, the ac-celeration had little effect on the depression of PH probe FRET by Oxo-M (Fig. 9, D and F, dotted line vs. solid line). The reason is that PH probe FRET also re-sponds to production of a second ligand, IP3, whereas current depends only on PIP2.
We proposed receptor-induced acceleration of PIP2 synthesis in part to correct a discrepancy in the pre-dicted agonist concentration–response curve and in part because it is frequently invoked in the literature. The discrepancy was that low concentrations of agonist suppressed currents too much in the model as if PLC were activated too strongly there. Now we suggest a sec-ond factor that is likely to contribute to this discrepancy as well. Strong stimulation of M1Rs in tsA cells invokes a Ca2+ transient (via IP3) that accelerates PLC strongly in a positive feedback loop (Horowitz et al., 2005). In our model, PLC activity depends on Gq, but the Ca2+ de-

Falkenburger et al. 113
Hilgemann, D.W., S. Feng, and C. Nasuhoglu. 2001. The complex and intriguing lives of PIP2 with ion channels and transporters. Sci. STKE. 2001:re19. doi:10.1126/stke.2001.111.re19
Hille, B., J. Billiard, D.F. Babcock, T. Nguyen, and D.S. Koh. 1999. Stimulation of exocytosis without a calcium signal. J. Physiol. 520:23–31. doi:10.1111/j.1469-7793.1999.00023.x
Hirose, K., S. Kadowaki, M. Tanabe, H. Takeshima, and M. Iino. 1999. Spatiotemporal dynamics of inositol 1,4,5-trisphosphate that underlies complex Ca2+ mobilization patterns. Science. 284:1527–1530. doi:10.1126/science.284.5419.1527
Holz, R.W., M.D. Hlubek, S.D. Sorensen, S.K. Fisher, T. Balla, S. Ozaki, G.D. Prestwich, E.L. Stuenkel, and M.A. Bittner. 2000. A pleckstrin homology domain specific for phosphatidylinositol 4, 5-bisphos-phate (PtdIns-4,5-P2) and fused to green fluorescent protein identi-fies plasma membrane PtdIns-4,5-P2 as being important in exocytosis. J. Biol. Chem. 275:17878–17885. doi:10.1074/jbc.M000925200
Horowitz, L.F., W. Hirdes, B.C. Suh, D.W. Hilgemann, K. Mackie, and B. Hille. 2005. Phospholipase C in living cells: activation, in-hibition, Ca2+ requirement, and regulation of M current. J. Gen. Physiol. 126:243–262. doi:10.1085/jgp.200509309
Hossain, M.I., H. Iwasaki, Y. Okochi, M. Chahine, S. Higashijima, K. Nagayama, and Y. Okamura. 2008. Enzyme domain affects the movement of the voltage sensor in ascidian and zebrafish voltage-sensing phosphatases. J. Biol. Chem. 283:18248–18259. doi:10.1074/ jbc.M706184200
Iwasaki, H., Y. Murata, Y. Kim, M.I. Hossain, C.A. Worby, J.E. Dixon, T. McCormack, T. Sasaki, and Y. Okamura. 2008. A voltage-sensing phosphatase, Ci-VSP, which shares sequence identity with PTEN, dephosphorylates phosphatidylinositol 4,5-bisphosphate. Proc. Natl. Acad. Sci. USA. 105:7970–7975. doi:10.1073/pnas.0803936105
Jensen, J.B., J.S. Lyssand, C. Hague, and B. Hille. 2009. Fluorescence changes reveal kinetic steps of muscarinic receptor–mediated mod-ulation of phosphoinositides and Kv7.2/7.3 K+ channels. J. Gen. Physiol. 133:347–359. doi:10.1085/jgp.200810075
Koizumi, S., P. Rosa, G.B. Willars, R.A. Challiss, E. Taverna, M. Francolini, M.D. Bootman, P. Lipp, K. Inoue, J. Roder, and A. Jeromin. 2002. Mechanisms underlying the neuronal calcium sensor-1-evoked enhancement of exocytosis in PC12 cells. J. Biol. Chem. 277:30315–30324. doi:10.1074/jbc.M201132200
Lei, Q., E.M. Talley, and D.A. Bayliss. 2001. Receptor-mediated inhibition of G protein-coupled inwardly rectifying potassium channels involves Gq family subunits, phospholipase C, and a readily diffusible messenger. J. Biol. Chem. 276:16720–16730. doi:10. 1074/jbc.M100207200
Lemmon, M.A., K.M. Ferguson, R. O’Brien, P.B. Sigler, and J. Schlessinger. 1995. Specific and high-affinity binding of inositol phosphates to an isolated pleckstrin homology domain. Proc. Natl. Acad. Sci. USA. 92:10472–10476. doi:10.1073/pnas.92.23.10472
Li, Y., N. Gamper, D.W. Hilgemann, and M.S. Shapiro. 2005. Regula-tion of Kv7 (KCNQ) K+ channel open probability by phosphatidy-linositol 4,5-bisphosphate. J. Neurosci. 25:9825–9835. doi:10.1523/ JNEUROSCI.2597-05.2005
Mao, Y.S., and H.L. Yin. 2007. Regulation of the actin cytoskeleton by phosphatidylinositol 4-phosphate 5 kinases. Pflugers Arch. 455:5–18. doi:10.1007/s00424-007-0286-3
Maxfield, F.R., and T.E. McGraw. 2004. Endocytic recycling. Nat. Rev. Mol. Cell Biol. 5:121–132. doi:10.1038/nrm1315
McLaughlin, S., J. Wang, A. Gambhir, and D. Murray. 2002. PIP2 and proteins: interactions, organization, and information flow. Annu. Rev. Biophys. Biomol. Struct. 31:151–175. doi:10.1146/annurev.biophys.31 .082901.134259
Murata, Y., and Y. Okamura. 2007. Depolarization activates the phos-phoinositide phosphatase Ci-VSP, as detected in Xenopus oocytes coexpressing sensors of PIP2. J. Physiol. 583:875–889. doi:10.1113/ jphysiol.2007.134775
Balla, A., G. Tuymetova, A. Tsiomenko, P. Várnai, and T. Balla. 2005. A plasma membrane pool of phosphatidylinositol 4- phosphate is generated by phosphatidylinositol 4-kinase type-III alpha: studies with the PH domains of the oxysterol binding protein and FAPP1. Mol. Biol. Cell. 16:1282–1295. doi:10.1091/mbc.E04-07-0578
Brown, S.A., F. Morgan, J. Watras, and L.M. Loew. 2008. Analysis of phosphatidylinositol-4,5-bisphosphate signaling in cerebellar Purkinje spines. Biophys. J. 95:1795–1812.
Chong, L.D., A. Traynor-Kaplan, G.M. Bokoch, and M.A. Schwartz. 1994. The small GTP-binding protein Rho regulates a phos-phatidylinositol 4-phosphate 5-kinase in mammalian cells. Cell. 79:507–513. doi:10.1016/0092-8674(94)90259-3
Cockcroft, S., J.A. Taylor, and J.D. Judah. 1985. Subcellular locali-sation of inositol lipid kinases in rat liver. Biochim. Biophys. Acta. 845:163–170. doi:10.1016/0167-4889(85)90173-9
Corry, B., D. Jayatilaka, and P. Rigby. 2005. A flexible approach to the calculation of resonance energy transfer efficiency between multiple donors and acceptors in complex geometries. Biophys. J. 89:3822–3836. doi:10.1529/biophysj.105.069351
Cunningham, E., G.M. Thomas, A. Ball, I. Hiles, and S. Cockcroft. 1995. Phosphatidylinositol transfer protein dic-tates the rate of inositol trisphosphate production by promot-ing the synthesis of PIP2. Curr. Biol. 5:775–783. doi:10.1016/ S0960-9822(95)00154-0
De Matteis, M.A., and A. Godi. 2004. PI-loting membrane traffic. Nat. Cell Biol. 6:487–492. doi:10.1038/ncb0604-487
Di Paolo, G., and P. De Camilli. 2006. Phosphoinositides in cell regulation and membrane dynamics. Nature. 443:651–657. doi: 10.1038/nature05185
Dutt, P., L. Kjoller, M. Giel, A. Hall, and D. Toksoz. 2002. Activated Gq family members induce Rho GTPase activation and Rho-dependent actin filament assembly. FEBS Lett. 531:565–569. doi:10.1016/S0014-5793(02)03625-6
Falkenburger, B.H., J.B. Jensen, and B. Hille. 2010. Kinetics of M1 muscarinic receptor signaling to phospholipase C in living cells. J. Gen. Physiol. 135:81–97.
Fink, C.C., B. Slepchenko, and L.M. Loew. 1999. Determination of time-dependent inositol-1,4,5-trisphosphate concentrations dur-ing calcium release in a smooth muscle cell. Biophys. J. 77:617–628. doi:10.1016/S0006-3495(99)76918-3
Fung, B.K., and L. Stryer. 1978. Surface density determination in mem-branes by fluorescence energy transfer. Biochemistry. 17:5241–5248. doi:10.1021/bi00617a025
Gamper, N., V. Reznikov, Y. Yamada, J. Yang, and M.S. Shapiro. 2004. Phosphatidylinositol 4,5-bisphosphate signals underlie receptor-spe-cific Gq/11-mediated modulation of N-type Ca2+ channels. J. Neurosci. 24:10980–10992. doi:10.1523/JNEUROSCI.3869-04.2004
Golebiewska, U., M. Nyako, W. Woturski, I. Zaitseva, and S. McLaughlin. 2008. Diffusion coefficient of fluorescent phospha-tidylinositol 4,5-bisphosphate in the plasma membrane of cells. Mol. Biol. Cell. 19:1663–1669. doi:10.1091/mbc.E07-12-1208
Halaszovich, C.R., D.N. Schreiber, and D. Oliver. 2009. Ci-VSP is a de-polarization-activated phosphatidylinositol-4,5-bisphosphate and phosphatidylinositol-3,4,5-trisphosphate 5-phosphatase. J. Biol. Chem. 284:2106–2113. doi:10.1074/jbc.M803543200
Hammond, G.R., G. Schiavo, and R.F. Irvine. 2009. Immunocyto- chemical techniques reveal multiple, distinct cellular pools of PtdIns4P and PtdIns(4,5)P2. Biochem. J. 422:23–35. doi:10.1042/ BJ20090428
Hilgemann, D.W. 2007. Local PIP2 signals: when, where, and how? Pflugers Arch. 455:55–67. doi:10.1007/s00424-007-0280-9
Hilgemann, D.W., and R. Ball. 1996. Regulation of cardiac Na+,Ca2+ exchange and KATP potassium channels by PIP2. Science. 273:956–959. doi:10.1126/science.273.5277.956

114 Kinetics of PIP2 metabolism
van der Wal, J., R. Habets, P. Várnai, T. Balla, and K. Jalink. 2001. Monitoring agonist-induced phospholipase C activation in live cells by fluorescence resonance energy transfer. J. Biol. Chem. 276:15337–15344. doi:10.1074/jbc.M007194200
Várnai, P., X. Lin, S.B. Lee, G. Tuymetova, T. Bondeva, A. Spät, S.G. Rhee, G. Hajnóczky, and T. Balla. 2002. Inositol lipid bind-ing and membrane localization of isolated pleckstrin homology (PH) domains. Studies on the PH domains of phospholipase C delta 1 and p130. J. Biol. Chem. 277:27412–27422. doi:10.1074/jbc.M109672200
Villalba-Galea, C.A., W. Sandtner, D.M. Starace, and F. Bezanilla. 2008. S4-based voltage sensors have three major conforma-tions. Proc. Natl. Acad. Sci. USA. 105:17600–17607. doi:10.1073/ pnas.0807387105
Wang, Y.J., W.H. Li, J. Wang, K. Xu, P. Dong, X. Luo, and H.L. Yin. 2004. Critical role of PIP5KI87 in InsP3-mediated Ca2+ signaling. J. Cell Biol. 167:1005–1010. doi:10.1083/jcb.200408008
Wenk, M.R., and P. De Camilli. 2004. Protein-lipid interactions and phosphoinositide metabolism in membrane traffic: insights from vesicle recycling in nerve terminals. Proc. Natl. Acad. Sci. USA. 101:8262–8269. doi:10.1073/pnas.0401874101
Willars, G.B., S.R. Nahorski, and R.A. Challiss. 1998. Differential regulation of muscarinic acetylcholine receptor-sensitive poly-phosphoinositide pools and consequences for signaling in human neuroblastoma cells. J. Biol. Chem. 273:5037–5046. doi:10.1074/ jbc.273.9.5037
Wilson, D.B., T.E. Bross, S.L. Hofmann, and P.W. Majerus. 1984. Hydrolysis of polyphosphoinositides by purified sheep seminal ves-icle phospholipase C enzymes. J. Biol. Chem. 259:11718–11724.
Winks, J.S., S. Hughes, A.K. Filippov, L. Tatulian, F.C. Abogadie, D.A. Brown, and S.J. Marsh. 2005. Relationship between membrane phosphatidylinositol-4,5-bisphosphate and receptor-mediated in-hibition of native neuronal M channels. J. Neurosci. 25:3400–3413. doi:10.1523/JNEUROSCI.3231-04.2005
Wirtz, K.W. 1997. Phospholipid transfer proteins revisited. Biochem. J. 324:353–360.
Xu, C., J. Watras, and L.M. Loew. 2003. Kinetic analysis of recep-tor-activated phosphoinositide turnover. J. Cell Biol. 161:779–791. doi:10.1083/jcb.200301070
Zaika, O., G.P. Tolstykh, D.B. Jaffe, and M.S. Shapiro. 2007. Inositol triphosphate-mediated Ca2+ signals direct purinergic P2Y recep-tor regulation of neuronal ion channels. J. Neurosci. 27:8914–8926. doi:10.1523/JNEUROSCI.1739-07.2007
Zaika, O., C.C. Hernandez, M. Bal, G.P. Tolstykh, and M.S. Shapiro. 2008. Determinants within the turret and pore-loop domains of KCNQ3 K+ channels governing functional activity. Biophys. J. 95:5121–5137. doi:10.1529/biophysj.108.137604
Zhang, H., L.C. Craciun, T. Mirshahi, T. Rohács, C.M. Lopes, T. Jin, and D.E. Logothetis. 2003. PIP2 activates KCNQ channels, and its hydrolysis underlies receptor-mediated inhibition of M currents. Neuron. 37:963–975. doi:10.1016/S0896- 6273(03)00125-9
Zhao, X., P. Várnai, G. Tuymetova, A. Balla, Z.E. Tóth, C. Oker-Blom, J. Roder, A. Jeromin, and T. Balla. 2001. Interaction of neuronal calcium sensor-1 (NCS-1) with phosphatidylinositol 4-kinase stimulates lipid kinase activity and affects membrane trafficking in COS-7 cells. J. Biol. Chem. 276:40183–40189.
Murata, Y., H. Iwasaki, M. Sasaki, K. Inaba, and Y. Okamura. 2005. Phosphoinositide phosphatase activity coupled to an intrinsic voltage sensor. Nature. 435:1239–1243. doi:10.1038/nature03650
Nakanishi, S., K.J. Catt, and T. Balla. 1995. A wortmannin-sensitive phosphatidylinositol 4-kinase that regulates hormone-sensitive pools of inositolphospholipids. Proc. Natl. Acad. Sci. USA. 92:5317–5321. doi:10.1073/pnas.92.12.5317
Nasuhoglu, C., S. Feng, J. Mao, M. Yamamoto, H.L. Yin, S. Earnest, B. Barylko, J.P. Albanesi, and D.W. Hilgemann. 2002. Nonradioactive analysis of phosphatidylinositides and other an-ionic phospholipids by anion-exchange high-performance liquid chromatography with suppressed conductivity detection. Anal. Biochem. 301:243–254. doi:10.1006/abio.2001.5489
Okamura, Y., Y. Murata, and H. Iwasaki. 2009. Voltage-sensing phos-phatase: actions and potentials. J. Physiol. 587:513–520. doi:10.1113/ jphysiol.2008.163097
Oude Weernink, P.A., M. Schmidt, and K.H. Jakobs. 2004. Regulation and cellular roles of phosphoinositide 5-kinases. Eur. J. Pharmacol. 500:87–99. doi:10.1016/j.ejphar.2004.07.014
Pan, C.Y., A. Jeromin, K. Lundstrom, S.H. Yoo, J. Roder, and A.P. Fox. 2002. Alterations in exocytosis induced by neuronal Ca2+ sensor-1 in bovine chromaffin cells. J. Neurosci. 22:2427–2433.
Park, K.-H., J. Piron, S. Dahimene, J. Mérot, I. Baró, D. Escande, and G. Loussouarn. 2005. Impaired KCNQ1-KCNE1 and phos-phatidylinositol-4,5-bisphosphate interaction underlies the long QT syndrome. Circ. Res. 96:730–739. doi:10.1161/01.RES .0000161451.04649.a8
Patterson, G., R.N. Day, and D. Piston. 2001. Fluorescent protein spectra. J. Cell Sci. 114:837–838.
Raucher, D., T. Stauffer, W. Chen, K. Shen, S. Guo, J.D. York, M.P. Sheetz, and T. Meyer. 2000. Phosphatidylinositol 4,5-bisphos-phate functions as a second messenger that regulates cytoskel-eton-plasma membrane adhesion. Cell. 100:221–228. doi:10.1016/ S0092-8674(00)81560-3
Santarius, M., C.H. Lee, and R.A. Anderson. 2006. Supervised mem-brane swimming: small G-protein lifeguards regulate PIPK signal-ling and monitor intracellular PtdIns(4,5)P2 pools. Biochem. J. 398:1–13. doi:10.1042/BJ20060565
Stauffer, T.P., S. Ahn, and T. Meyer. 1998. Receptor-induced tran-sient reduction in plasma membrane PtdIns(4,5)P2 concentra-tion monitored in living cells. Curr. Biol. 8:343–346. doi:10.1016/ S0960-9822(98)70135-6
Suh, B.C., and B. Hille. 2002. Recovery from muscarinic modu-lation of M current channels requires phosphatidylinositol 4,5-bisphosphate synthesis. Neuron. 35:507–520. doi:10.1016/ S0896-6273(02)00790-0
Suh, B.C., and B. Hille. 2008. PIP2 is a necessary cofactor for ion channel function: how and why? Annu Rev Biophys. 37:175–195. doi:10.1146/annurev.biophys.37.032807.125859
Suh, B.C., L.F. Horowitz, W. Hirdes, K. Mackie, and B. Hille. 2004. Regulation of KCNQ2/KCNQ3 current by G protein cycling: the kinetics of receptor-mediated signaling by Gq. J. Gen. Physiol. 123:663–683. doi:10.1085/jgp.200409029
Szentpetery, Z., A. Balla, Y.J. Kim, M.A. Lemmon, and T. Balla. 2009. Live cell imaging with protein domains capable of recognizing phosphatidylinositol 4,5-bisphosphate; a comparative study. BMC Cell Biol. 10:67. doi:10.1186/1471-2121-10-67