kinetics of drop breakup during emulsification in turbulent flow n. vankova, s. tcholakova, n....
TRANSCRIPT
Kinetics of drop breakup during
emulsification in turbulent flow
N. Vankova, S. Tcholakova,
N. Denkov, I. B. Ivanov, and T. Danner*
Faculty of Chemistry, Sofia University,Sofia, Bulgaria,
and *2BASF Aktiengesellschaft, Ludwigshafen, Germany

Aims
2. Formulation of kinetic scheme, which accounts for:
• Generation of drops with given size from larger ones
• Their breakage into smaller drops
1. To elucidate the effects of drop size, oil viscosity, and hydrodynamic conditions on drop breakage process:
• Breakage rate constant
• “Daughter” drop size distribution
3. Analysis of the process of drop breakage (comparison of the experimental results with theoretical models)
• Drop-eddy collision frequency
• Breakage efficiency
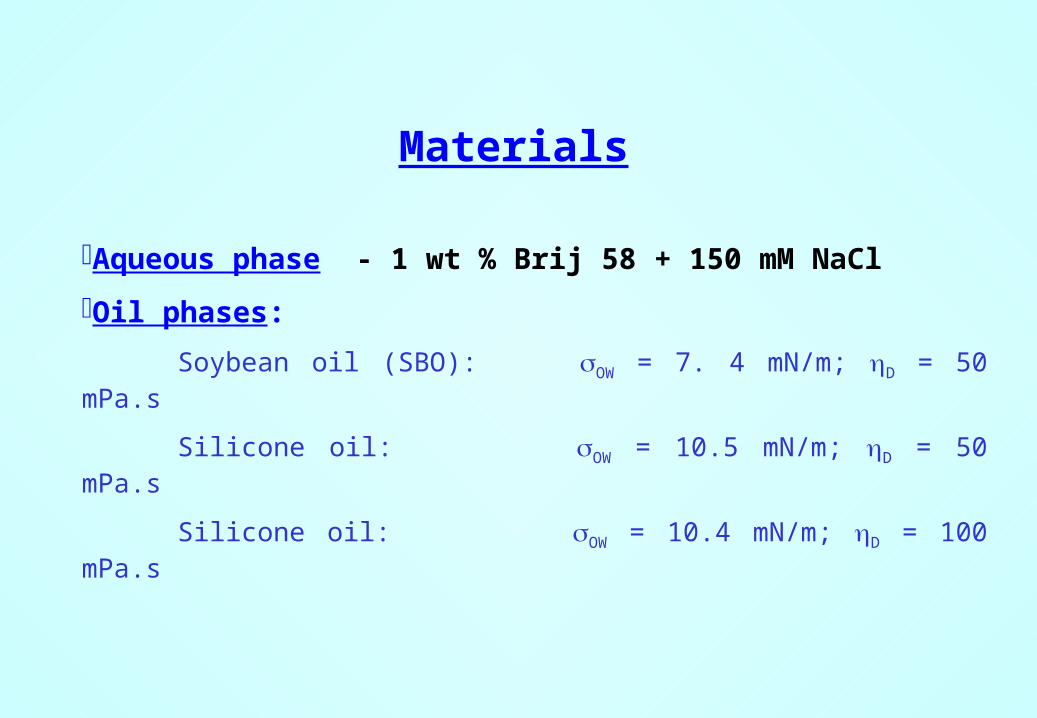
Materials
Aqueous phase - 1 wt % Brij 58 + 150 mM NaCl
Oil phases:
Soybean oil (SBO): OW = 7. 4 mN/m; D = 50 mPa.s
Silicone oil: OW = 10.5 mN/m; D = 50 mPa.s
Silicone oil: OW = 10.4 mN/m; D = 100 mPa.s

Experimental method
Narrow-gap homogenizer
Hydrodynamic conditions
Oil phase p105,
Pa
Q10-3,
m3/s
108,
J/(m3.s)
10-3,
s
SBO 0.98 0.086 0.49 2.0
SBO 2.20 0.15 1.92 1.1
Silicone oil 1.00 0.092 0.53 1.9
Silicone oil 1.01 0.096 0.56 1.8
Initial premix
Final emulsion
Prepared by membrane emulsification

Mean drop size vs number of passesEffect of oil viscosity
Number of passes, u0 10 20 30 40 50 60 70 80 90 100
d3
2,
m
0
5
10
15
20
25
30
35
401 wt % Brij 58 + 150 mM NaCl + silicone oil
D = 50 mPa.s
D = 96 mPa.s
dK = 12.8 m
dK = 13.6 m
The mean drop size decreases more rapidlyfor oils with lower viscosity

Mean drop size vs number of passesEffect of hydrodynamic conditions
Number of passes, u
0 10 20 30 40 50 60 70 80 90 100
d 32,
m
0
5
10
15
20
25
30
35
401 wt % Brij 58 (150 mM NaCl) + SBO
p = 0.98*105 Pa= 0.49*108 kg/(m.s3)
p = 2.2*105 Pa= 1.92*108 kg/(m.s3)
dK = 11.2 m
dK = 6.4 m
The mean drop size decreases more rapidlywhen the emulsification is performed at higher applied pressure.

Formulation of a kinetic scheme for data analysis
System under consideration
Discrete set of sizes in the system
v0 - volume of the smallest drops; vN - volume of the largest drops
vS = 2Sv0
•Drops with vN - only break into smaller drops
•Drops with vK < v < vN - break and form from larger drops
•Drops with v vK - only form from larger drops
Product of drop breakage
ps,m - fraction of volume of the “mother” drop, ds, which is transformed into
daughter drops with diameter dm
2s-mps,m - average number of drops with diameter dm, formed after breakage of
drop with diameter dS1
,0
1q
S qq
p
Mass balance

Kinetic Scheme
For largest drops, steady-state
For drops having volume vN-1 = vN/2
1N
N N
dn xV k n x
dx 0
1expN N Nx L
n n k 0 expN N Nn u n uk
11 1 1 , 12N
N N N N N N
dn xV k n x p k n x
dx
0 0
, 1 , 101 1 1
1 1
2 2exp expN N N N N N N N
N N N NN N N N
p k n p k nn u n uk uk
k k k k
V1 - linear velocity of the fluid
Processing element
inlet outlet
0 xL1
After 1 pass After u passes
1 ,1
2N
S q SS S q S q q
q S
dn xV k n x p k n x
dx

n x
10-1
0 , m-3
0 10 20 30 40 500
200
400
600
800
1000
1200
Drop diameter, m
Pass 1001 wt % Brij 58 + Silicone oil
u = 100
Experimental Results
Drop diameter, m0 10 20 30 40 50
0
20
40
60
80
100Pass 2
1 wt % Brij 58 + Silicone oil
n x
10-1
0 , m-3
u = 2
Premix1 wt % Brij 58 + Silicone oil
Drop diameter, m0 10 20 30 40 50
n x
10-1
0 , m-3
0
5
10
15
20
25
u = 0nN-1(0)
nN-1(u = 2)
nN-1(u = 100)

Experimental results - interpretation with binary breakage
Number of passes, u0 10 20 30 40 50
nN
-1x1
0-10 , m
-3
0
5
10
15
20
2531.45 m < d < 39.63m
dN-1 = 35.54 m
Theoretical fitkN-1 = 144 s-1
Number of passes, u
0 10 20 30 40 50
n N-2
x 10-1
0 , m
-3
0
10
20
30
40
25 m < d < 31.4 m
dN-2 = 28.2 m
kN-2 = 24 s-1
kN-2 = 50 s-1 kN-2 = 75 s-1
(C)
+dS dS-1 dS-1kS
Drop breakage is not a binary breakage

Experimental Results - interpretation with equal number probability for drop formation
Number of passes, u0 20 40 60 80 100
nN
-3x1
0-10 , m
-3
0
10
20
30
40
5019.8 m < d < 25 m
dN-3 = 22.4 m
kN-3 = 8 s-1
Theoretical fit
,
11 1
2S q S qp for q s
,0 1
1
2S Sp
Number of passes, u
0 20 40 60 80 100
n N-5
x 10-1
0 , m-3
0
20
40
60
80
100
120
140
12.5 m < d < 15.7 m
dN-5 = dK = 14.1 m
(D)
Kolmogorov-sized drops
+dS dS-1 dS-2
d0
+ +kS

Experimental results - interpretation by assuming self-similarity
,S S qp •The value of depends only from s-q
dM3/dS
3
2 4 6 8 10 12 14 16
2m-s
p M,S
0.2
0.4
0.6
0.8
1.0
1.2
1.4
Very good agreement of the fits with all experimental data
dM3/dS
3
2 4 6 8 10 12 14 16
p M,S
0.0
0.1
0.2
0.3
0.4
0.5

Breakage rate constant vs drop diameter
Drop diameter, m
10 15 20 25 30 35 40 45 50
k BR, s
ec-1
0
50
100
150
200
250
300
350Silicone oilDmPa.s
dK = 13.6 m
The breakage rate constant rapidly decreases with the decrease of drop diameter and becomes virtually zero at d dK

Breakage rate constant vs drop diameter
Effect of oil viscosity
The breakage rate constant decreases more than 3 times when the oil viscosity increases 2 times.
Drop diameter, m
10 15 20 25 30 35 40 45 50
Bre
aka
ge
ra
te c
on
sta
nt,
se
c-1
0
50
100
150
200
250
300
350
Silicone oilmPa.s
SBOmPa.s
Silicone oilmPa.s

Breakage rate constant vs drop diameter
Effect of hydrodynamic conditions
Drop diameter, m5 10 15 20 25 30 35 40
k BR, s
ec-1
1
10
100
1000
10000
= 2x10⁸ J/m3.s
= 0.5x10⁸ J/m3.s
SBO + 1 wt % Brij 58
The breakage rate constant increases more than 40 times with a 4-fold increase of the rate of energy dissipation.

Interpretation of kBR - model byCoulaloglou and Tavlarides, 1977
1 1expBR
BREAKAGE
Efraction ofk drops breakingbreakage time E
Breakage efficiency
2 2 2 3 2 3~ ( ) ~TE d P d d d 2
2~ ~ OWCAP
dE d P
d
2 3 5 3exp ~ exp OWE
dE
Breakage rate constant
Unviscid drops, ReDR > 1
Viscid drops, ReDR < 1
1 3
2 3 2 3 5 3exp OW
BRk d
d d
2 3 2 3
2 3 5 3expC OW
BR
D
dk d
d
Re DR DDR
D
U d
and

Comparison of the experimental data with the expression for visccous drops
2 3 2 3
0 1 2 3 5 3expC OW
BR
D
dk d A A
d
(dk/d)5/3
0.0 0.2 0.4 0.6 0.8 1.0
ln(k
BR D
/( C
d2/
3 2/
3 ))
-19
-18
-17
-16
-15
-14
-13
-12 Silicone oil, D = 50 mPa.s, p = 1 atm
Silicone oil, D = 96 mPa.s, p = 1 atm
SBO, D = 50 mPa.s, p = 2 atm
SBO, D = 50 mPa.s, p = 1 atm
5 3
0 12 3 2 3ln BR D K
C
k d dA A
d d
This model does not describe the dependence of kBR on oil viscosityand on the rate of energy dissipation

Model for kBR byPrince and Blanch, 1990
BRk eddy drop collision frequency breakage efficiency
Eddy-drop collision frequency – similar to kinetic theory of gases
1 22 2
e
eq e d d e
n
h d S u u n dn Breakage efficiency
2 3 5 3exp ~ exp OWE
dE
Breakage efficiency including the energy dissipation inside the drop (following the idea of Calabrese, 1986):
1 3 1 3
2 3 5 3
9.3 0.166
exp ~ exp
COW D
DDISS
C
dE E
dE

Comparison of the experimental data with the theoretical expression
5 3 4 32 3
1 28 3 2 30 11 3
ln ln 0.166BR K KD K C D
k d d d dA A d
d d
(dk/d)5/3-f(D, )x(dk/d)4/3
0.0 0.2 0.4 0.6 0.8 1.0 1.2
ln(k
BRd2/
3 /1/
3 )
-1
0
1
2
3
4
5
6 SBO, D = 50 mPa.s, p = 1 atm
SBO, D = 50 mPa.s, p = 2 atm
Silicone oil, D = 96 mPa.s, p = 1 atm
Silicone oil, D = 50 mPa.s, p = 1 atm

Comparison of the experimental data with the theoretical expression
Drop diameter, m0 10 20 30 40 50
Bre
akag
e ra
te c
onst
ant,
sec
-1
0
50
100
150
200
250
300 D, mPa.s
OW
mN/m
105
J/(kg.s)A0 A1
50SBO
7.4 0.49 0.08 0.03 1.2 0.2
50SBO
7.4 1.92 0.1 0.02 1 0.09
50silicone oil
10.9 0.53 0.1 0.01 1.0 0.05
96silicone oil
10.3 0.56 0.1 0.05 1.1 0.02
Average 0.1 0.05 1.1 0.1
All experimental data are described reasonably well under the assumption that the breakage rate is determined by:
•Drop-eddy collision frequency
•Breakage efficiency, accounting for (i) dissipated energy inside the drops and (ii) surface expansion energy.

Main Results
Experimental results for the mean drop size
• The mean drop size decreases much faster for emulsions prepared at
larger .
• The increased viscosity of the dispersed phase leads to much slower decrease of mean drop size.
Formulation of kinetic scheme for drop breakage
• The breakage process is considered as an irreversible reaction of first order
• A discrete set of drop sizes is considered
• The drop generation and drop breakage are taken into account
• The processing element is considered as a reactor with ideal displacement
• The formulated kinetic scheme allow us to determine KBR(d) and the probability for formation of smaller drops

Main results from the data interpretation with the kinetic scheme
1. The breakage process is not a binary breakage .
2. The probability for generation of smaller drops is determined.
3. KBR decreases with the decrease of drop diameter and approaches 0, when d approaches the Kolmogorov size.
4. KBR depends significantly on the hydrodynamic conditions and viscosity of the oil phase.
Main conclusions from the comparison of the experimental data and the theoretical models for kBR
All experimental data are described reasonably well under the assumption that the breakage probability is given by:
•Drop-eddy collision frequency
•Breakage efficiency, accounting for (i) the dissipated energy inside the drops and (ii) surface expansion energy.