kinetic study of oil shale conversion - dspace at...
TRANSCRIPT

March 12th, 2008
Kinetic Study of Oil Shale Conversion
Pankaj TiwariDr. Milind Deo
Dr. Eric Eddings
Chemical Engineering Dept, University of Utah

March 12th, 2008
Table of contents
• Background• Previous studies
– Surface retorting– Shell’s ICP
• Study plan• Experiments
– TGA results– Retorting studies
• Conclusions

March 12th, 2008
Oil shale•Older than petroleum
•There is no oil in the shale.• Organic matter
– Bitumen (soluble in organic solvent)
– Kerogen (significant portion of TOC)
• Mineral constitutes:- Carbonates: calcite, dolomite
3

March 12th, 2008
Oil shale: “Source of unconventional energy”
• Organic matter – Kerogen, A chemically immature hydrocarbon -essentially, oil's geological ancestor
• Chemical decomposition- Released petroleum-like substance
• Pyrolysis (retorting)– In-Situ retorting– Surface retorting
• Products include – Synthetic crude oil liquid– Gases– Residual solid
4Oil Shale Shale Oil

March 12th, 2008
Major world oil shale resources
5
Oil recovery varies depending upon the process and source material
March 12th, 2008
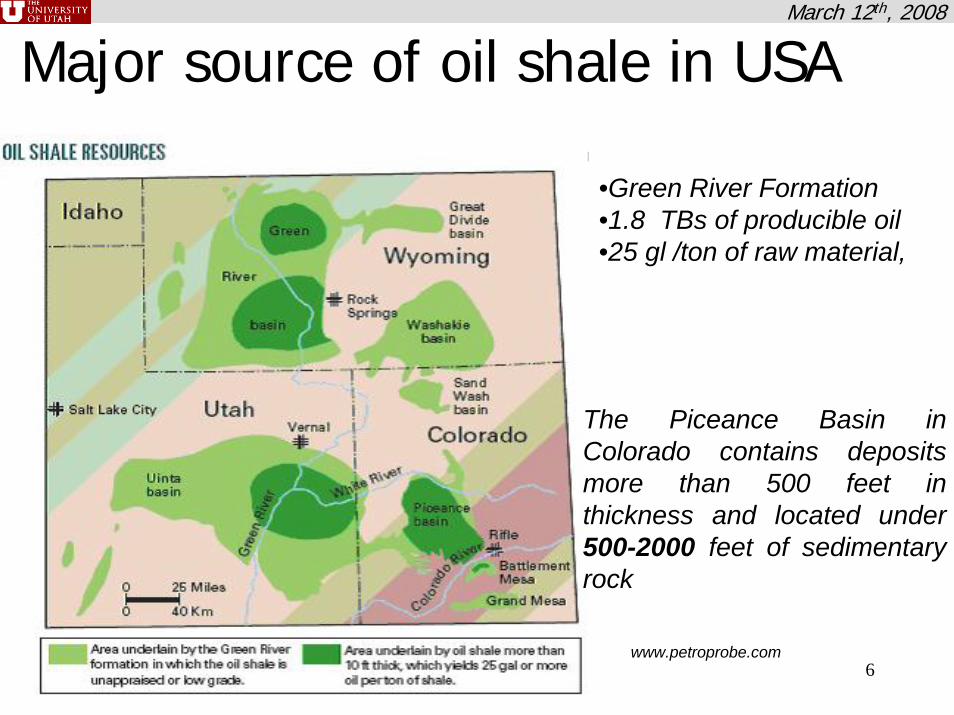
Major source of oil shale in USA
6
•Green River Formation•1.8 TBs of producible oil •25 gl /ton of raw material,
The Piceance Basin in Colorado contains deposits more than 500 feet in thickness and located under 500-2000 feet of sedimentary rock
www.petroprobe.com

March 12th, 2008
Generalized process
Mining Crushing Retorting
Fracturing Retorting ProductRecovery
RefiningLiquid Fuels
By-Product
ATPGas combustion (Bureau, Petrosix)UnionToscoHydrogen AtmosphereKiviter Galoter
In-Formation
NaturalHydraulicExplosiveElectocarbonizationDrilling &Dewatering
CombustionHot gasesSteamGradual HeatingPyrolysis
Gas DriveArtificial Lift
Kerogen OilHydrocarbon Gases
Spent Shale
Underground Room & PillarCut and FillBlock Carving
Open-Pit
Thermal & Chemical TreatingHydrogenation
Mild-cat crackingHydrocracking
UtilizeDispose
Mine FillRevegetateDump
Source: Strategic Significance of America’s Oil Shale resources, Vol II, 2004
Control on Operational Parameter
Popcorn Process
Ex-Situ
In-Situ

March 12th, 2008
Pyrolysis Drum
Oil Shale Trommel Product
Spent Shale
Heater
RecycleCeramic
Ball
Air
GasHot Gas
FlueGas
TOSCO II (Surface process)
Source: An Assessment of Oil Shale Technology, 1980

March 12th, 2008
ProductCooling
Retorting
Combustion
HeatRecovery
Oil Shale
Spent Shale
Product Oil
Recycle Gas
Air
Gas combustion retort(Surface process)
Source: An Assessment of Oil Shale Technology, 1980

March 12th, 2008
PreheatFeed(Oil Shale) Retort Hydrocarbon
Vapors
Cooling Combustion Air
Spent ShaleHeat Exchange Heat
Flue Gas
Condensation
Steam Gas
Coked Solids
OilRecovery
Product
SulfurWater
Flue Gas
ATP Processor
Alberta taciuk processor (ATP)(Surface process)
Source: UMATEC and ATP, 2006

March 12th, 2008
Lean shale / Fracture porosityRich shale
Heaters
Producer
Tight overburdenLean shale / Fracture porosityRich shaleLean shale / Fracture porosityRich shaleLean shale / Fracture porosityRich shale
Freezing wall
Shell’s ICP
Source: www.shell.com

March 12th, 2008
In-situ product - Better feedstock for upgrading?
Tar Like Solid
Carbon Number
Wei
ght %
0 5 10
12
10
8
6
4
2
015 20 25 30 35 40 45 50 100 120
In Situ
800°CSurfaceRetort
SHALE OIL EXAMPLE
Naphtha - 30%Diesel - 30%Jet - 30%Resid - 10%
NAPHTHA JET DIESEL RESID
Source: www.shell.com (Stephen Mut, 2005)
March 12th, 2008
O/C (atomic ratio)
H/C
(ato
mic
ratio
)
0.1 0.2 0.3 0.4 0.5
0.5
1.0
1.5
2.0
III
III
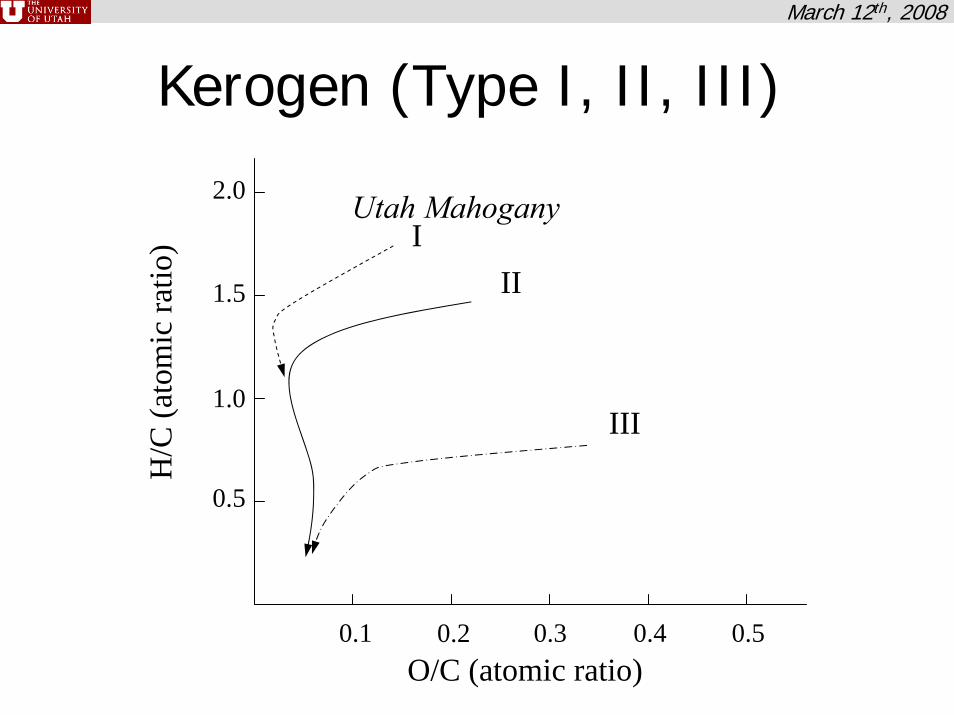
Kerogen (Type I, II, III)
Utah Mahogany

March 12th, 2008
Previous studies: Mechanism
• Proposed model• Kerogen Bitumen Oil +Gas + Residue• Kerogen Bitumen + Oil +Gas + Residue
Bitumen Oil +Gas + Residue• Free radical mechanism• And many others
14
First order reaction with respect to decomposition of the kerogen

March 12th, 2008
Experimental plan• Comprehensive thermogravimetric analyses (TGA)• Reactors
– Experiments with crushed oil shale samples– Oil generation from shale cores– Effect of retorting on rock samples (stress and permeability creation)
• Pretreatment and analysis of raw material• Pyrolysis at different reaction conditions
– Temperatures (250oC – 500oC)– Pressure (atm -2500 psi) – Heating Rate (100o C/ hours to 1oC/hours)– Types of Gas ( Inert, hydrogen donor, combination)– Sweep gas flow rate (low to high??)– Pyrolysis time (5 hours to few weeks or months)
• Products analysis15
March 12th, 2008
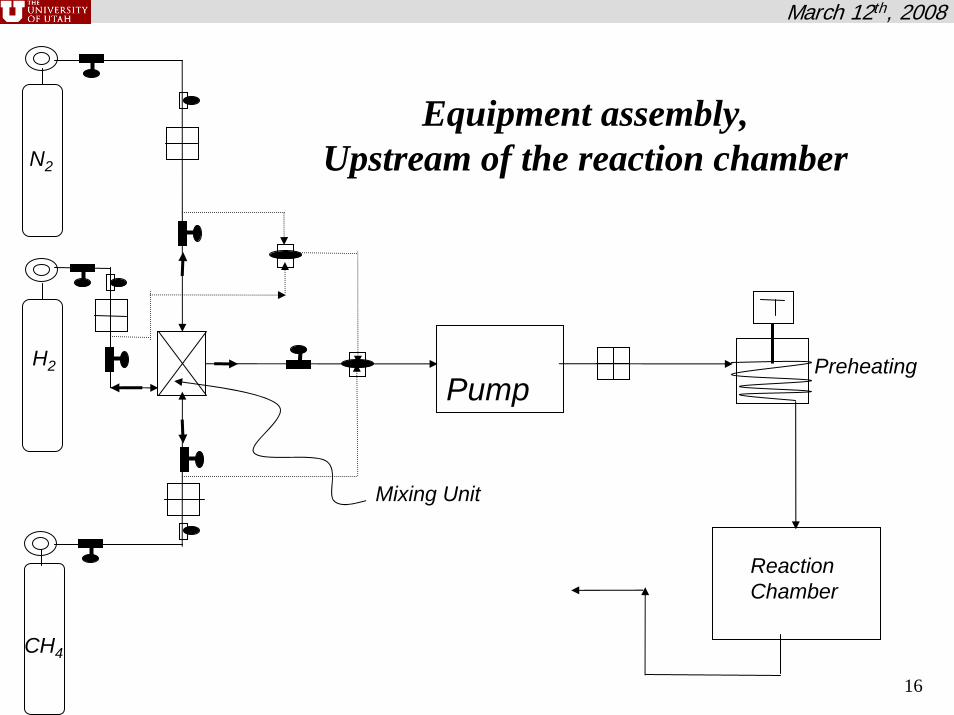
Pump
Mixing Unit
Reaction Chamber
N2
H2
CH4
Preheating
Equipment assembly, Upstream of the reaction chamber
16

March 12th, 2008
Reactor-1: Pyrolysis study of the crushed oil shale and shale core
17

March 12th, 2008
12’’7.5’’ 5.5’’5.0’’2.0’’1.5’’
Piston Cylinder 1.5’’ OD, 12’’ L
Gas diffusion plate
Gas diffusion plate
Core sample
Pressure sleeve
Pressure chamber
Heater element
Thermal insulation
Cylindrical rods
Top plate with holes
Gas outlet
Gas inlet
Thermocouple
Reactor-2: To measure the stresses induced during heating

March 12th, 2008
Gas
Condenser-2
Condenser-1
BPR
Vent Line
Pr Gauge
ReceiverProduct collector
Cleaning
Reactor Outlet
Gas Analyzer
Gas Sample
19
Equipments assembly, downstream of the reaction chamber

March 12th, 2008
Experimental systemTemperature controller
Condensers
Reactor-1
Reactor-2

March 12th, 2008
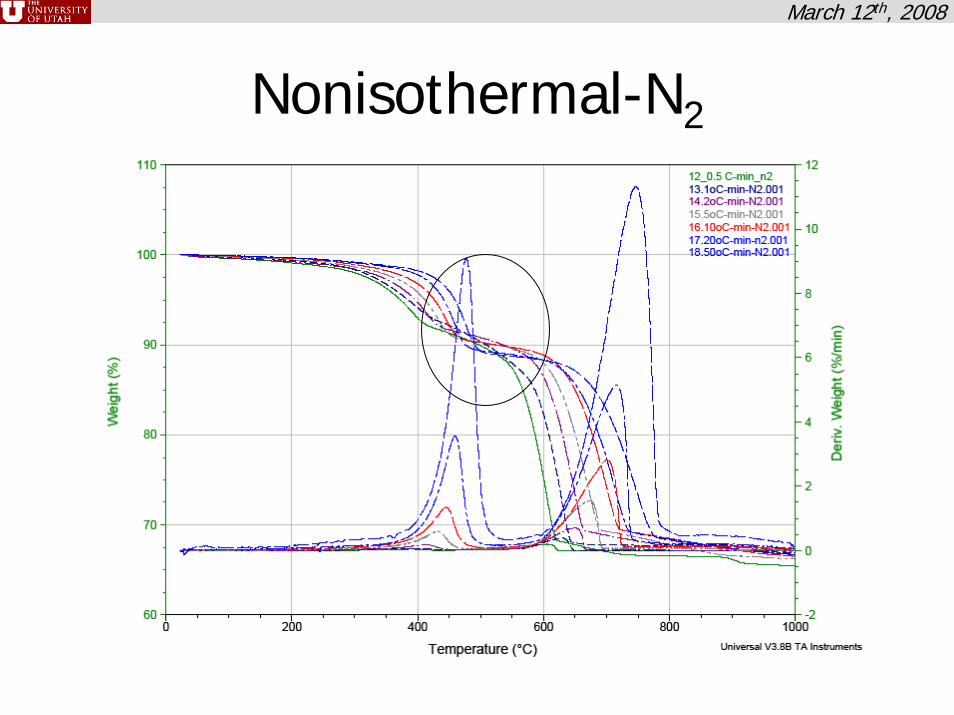
Results: TGA analyses of oil shaleWeight loss/derivative versus Time/Temperature
Purge gas – 60ml/minWeight --~ 25 mgParticle size – ~100 mesh size
Non Isothermal- 1000oCIsothermal- 100oC/min
Purge Gas N2 AirTemperature/Ti
me300oC 720 min 240350 240 240400 240 240450 240 180500 240550 180600 30
Purge Gas- N2 AirHeating Rate
0.5oC/min1 Yes2 Yes-R Yes5 Yes10 Yes-R20 Yes-R50 Yes-R Yes

March 12th, 2008
TGA-reproducibility of data
Organic
Mineral
Data quite reproducible

March 12th, 2008
Isothermal-N2
600C
300C
•Weight loss increased as temperature increased•10-12% weight loss (TOC) at around 400-450 C

March 12th, 2008
600C
300C
Isothermal-N2 (with derivatives)
Mineral decomposition!

March 12th, 2008
600C
300C
Isothermal-N2 (versus temperature)

March 12th, 2008
Isothermal-Air
More weight loss compared to nitrogenat the same temperatures
Increasing temperatures

March 12th, 2008
Isothermal-Air
March 12th, 2008
Nonisothermal-N2

March 12th, 2008
Nonisothermal-N2

March 12th, 2008
Nonisothermal-Air

March 12th, 2008
Kinetic studyConversion –
α =
W0 = Initial weight of the sample, mgWt = Weight of the sample at time’ t’, mgW∞ = Weight of the sample at the end of the pyrolysis, mg
Arrhenius dependency : K = A. exp(-Ea/RT)
First order assumption
(W0 - Wt) / (Wo - W∞) = (W0 - Wt) / (Wo*x )

March 12th, 2008
Kinetic study for isothermal pyrolysis
IsothermalEnd
Integral MethodDifferential Method
300 C

March 12th, 2008
TstartTend
Rmax
Kinetic study for non-isothermal pyrolysis
Direct Arrhenius PlotChen & NuttallCoats & RedfernAnthony & Howard

March 12th, 2008
Ln(1-X) Vs. Time,min
K,/min ToC T, K 1000/T,K ln(K) R2
0.009 300 573.5 1.743679 -4.71053 0.623
0.019 350 623.5 1.603849 -4.13517 0.972
0.034 400 673.5 1.484781 -3.38139 0.984
0.303 450 723.5 1.38217 -1.19402 0.719
Ea/1000R 9.144ln(A) 10.85
A 51534.15 min-1R 8.314 J/molKEa 76.02322 KJ/mol
Isothermal N2- First order- Integral method

March 12th, 2008
P
Pyrolysis of oil shale - Setup
Gas Cylinder
Back Pressure Regulator
Vent line-1
Heater
Temperature Controller
Pressure GaugeCheck valve
Relief valve
Waste Container
PPressure GaugeSeparation unit
Product 1
Condenser-1
CoolingUnitCondenser-2
Gas Sampler
Product 2Product 3
Product 4
Vent line-2
Vent line-3
Flow meter
Insulation
March 12th, 2008
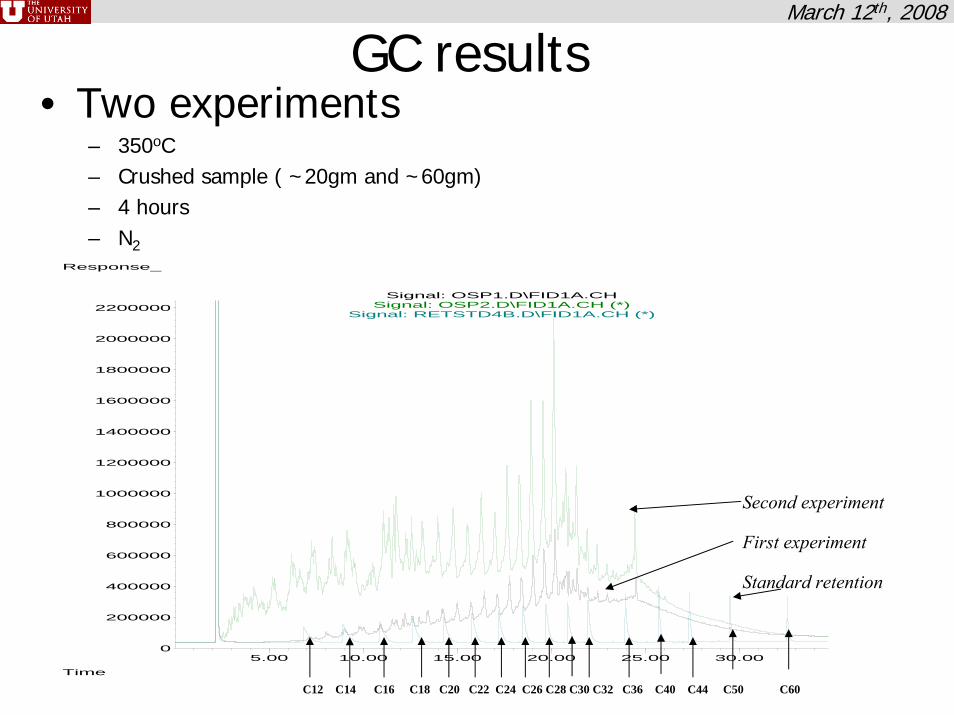
GC results• Two experiments
– 350oC – Crushed sample ( ~20gm and ~60gm)– 4 hours– N2
5.00 10.00 15.00 20.00 25.00 30.000
200000
400000
600000
800000
1000000
1200000
1400000
1600000
1800000
2000000
2200000
Time
Response_
Signal: OSP1.D\FID1A.CHSignal: OSP2.D\FID1A.CH (*)
Signal: RETSTD4B.D\FID1A.CH (*)
C12 C14 C16 C18 C20 C22 C24 C26 C28 C30 C32 C36 C40 C44 C50 C60
Standard retention
First experiment
Second experiment

March 12th, 2008
GC results(Mountain West Energy Samples
Courtesy: Dr Shurtleff
Experiment_CH4
Second experiment_N2
5.00 10.00 15.00 20.00 25.00 30.00 35.000
200000
400000
600000
800000
1000000
1200000
1400000
1600000
1800000
2000000
2200000
2400000
Time
Response_
Signal: OSP2.D\FID1A.CHSignal: OS1A.D\FID1A.CH (*) White river shale

March 12th, 2008
Conclusions and status
• TGA analyses– Consistent sets of isothermal and non-isothermal data– Kinetic parameters comparable to those found in the
literature• Retorting experiments
– Good product quality– Similar in quality to methane retorting environment
• Variety of reactors designed and built to study kinetics, diffusion, mass transfer and stress effects

March 12th, 2008
Acknowledgement
• DOE Department of Energy• UHOP• PERC• Dr. Kyeongseok Oh • Dr. Kaushik Gandhi• Dr. Kevin Shurtleff
39

March 12th, 2008
Thank You