kinetic modeling of low temperature water-gas shift...
TRANSCRIPT
American Journal of Oil and Chemical Technologies: Volume 4. Issue 2. April 2016
Petrotex Library Archive
American Journal of Oil and Chemical Technologies
Journal Website: http://www.petrotex.us/
Kinetic Modeling of Low Temperature Water-Gas Shift Reaction
using gPROMS
Mohammady Maklavany, Davood1; Shariati, Ahmad
2* ; Roozbehani, Behrooz
1; Khosravi Nikou, Mohammad Reza
2
1Department of Chemical Engineering, Petroleum University of Technology, Abadan, Iran.
2Department of Gas Engineering, Petroleum University of Technology, Ahwaz, Iran.
Abstract:
The kinetics of water gas shift reaction was studied over commercial CuO/ZnO/Al2O3 in an integral fixed bed reactor. The
experimental data were collected from literature. The CO conversion data in the temperature ranging from 180 ºC to 300 ºC were
used for kinetic modeling. Surface redox and the Langmuir-Hinshelwood models as well as two empirical rate equation models,
namely Moe and power law, were proposed to fit the experimental data. Using non-linear programming parameter estimation in
gPROMS software, rate expressions were fitted to experimental data. The judgment among models was based on the statistical
results. The surface redox mechanism was found to be the best model with apparent activation energy of 11.87 (kJ/mol). Also fitting
of empirical models to experimental data showed that power law rate equation has a good fit in partial reaction order of 2.57, 2.02,
-0.59 and -3.4 for CO, H2O, CO2 and H2 respectively with activation energy of 39.48 (kJ/mol). Using surface redox kinetic model
as well as power law kinetic rate equation, the reactor was simulated to validate the results by comparison of experimental and
predicted CO outlet conversion rates. The simulation results validated the model predictions of power law and surface redox
models.
Keyword: WGSR, Kinetic Parameter Estimation, Cu-based Catalyst, gPROMS
1. Introduction
Water gas shift (WGS) reaction refers to an industrially important reaction in which carbon monoxide reacts with steam to produce
hydrogen and carbon dioxide [1]:
↔
(1)
It is a catalytically reversible, exothermic chemical reaction [2]. The water-gas shift reaction is a step used in production of
ammonia, hydrogen, methanol and hydrocarbons. It is also utilized in petroleum refineries for several operations, namely
hydrotreating and hydrocracking of petroleum fractions as well as recently in fuel cell applications, such as power generation and
transportation. Considering the aforementioned industrial significance, the kinetic modeling of this reaction has been the subject of
many investigations [3-5].
The WGS reaction is moderately exothermic (equation 1) and conversions are equilibrium-controlled. The equilibrium constant
decreases with increasing temperature. Therefore, the reaction is thermodynamically favored at low temperatures. On the other
hand, the reaction rate constant is increases with increasing temperature concluding that the reaction is kinetically favored at high
temperatures. Accordingly, high conversions are favored at low temperatures and are not affected, significantly, by changes in total
pressure[6, 7].

Mohammady et al /American Journal of Oil and Chemical Technologies 4 (2016) 70-80
71
The exothermic nature of the WGS reaction leads the industrial shift reactors to be generally designed adiabatic, in which the
temperature is increasing along the catalyst bed. These reactors are usually arranged in two stages if high purity hydrogen is needed.
The first stage is run at high temperature called high temperature shift reaction (HTS). It is followed by cooling of the gases, steam
is then added to the second stage and the residual CO is shifted over a low temperature shift (LTS) reaction [2, 8].
There are number of materials capable of catalyzing the water-gas shift reaction, which are divided in two main classes – that is –
the iron-based catalysts and the copper-based catalysts. The iron-based catalysts, operating from about 320 to 450 ºC, are the so-
called high temperature shift (HTS) catalysts. There are quite a few of other catalysts investigated for HTS reaction, such as gold-
based catalysts, platinum-based catalysts and ruthenium-based catalysts. Copper-based shift catalysts, having now acquired a wide
acceptance in industries, are a more recent development. These are the so-called low temperature shift (LTS) catalysts
approximately operated in the temperature ranges of 200 to 250 ºC. Other catalysts such as nickel-based catalysts and iridium-based
catalysts were investigated for LTS reaction. A further material receiving a considerable attention as an industrial water-gas shift
catalyst is sulfided cobalt oxide-molybdenum oxide on alumina. It is reported that the activities of this catalyst at both high and low
temperature ranges is pleasant [2, 9, 10].
Despite studying Cu-based catalysts for years as industrial LTS catalysts, the reaction mechanism and associated kinetic equations
are still a heated controversy. In order to illuminate the behavior of the reaction over common industrial catalysts, many researchers
have investigated the reaction mechanism and developed various models. The following four specific mechanisms were proposed
for the WGS reaction: (1) the surface redox mechanism [11-18], (2) the associative mechanism[8, 19, 20], (3) the formate
mechanism [11, 13, 21-23]and (4) more recently, the carbonate mechanism[17, 18, 24-27].
To shed more light on this controversial issue, this paper aims to investigate the kinetic modeling of Cu-based catalyst in low
temperature water gas shift reaction using gPROMS. Accordingly, two mechanistic models which have caught more attentions are
proposed. In addition to mechanistic models, two practical empirical models are developed. Different models are implemented in
gPROMS and their parameters are estimated using maximum likelihood estimation algorithm. Then, in order to validate parameter
estimation statistical results, the experimental data are compared to model prediction result of ideal plug flow fixed bed reactor
simulation. Backward finite difference approach is used for simulation tasks. Unlike the conventional software, gPROMS package -
an equation-oriented modeling system - includes several features for parameter estimation and simulation tasks.
2. Model Development
The easiest method of illustrating the reaction in order for finding out the reaction rate and designing the reactors is provided by the
kinetic models. Fundamentally, micro-kinetic approach and the empirical method are the two classes of kinetic expressions. The
knowledge of elementary steps for the reaction and its energetics are the basics of the micro-kinetic method which can be applied
for discovering the chemistry of the reaction in detail and estimating the surface coverage, reaction order and activation enthalpy.
Furthermore, in spite of its computational intensity, the precise pathway and prediction of the reaction can be given by this method.
Conversely, the experimental results are the basics of the empirical models which are not only commonly expressed in the
Arrhenius model, but they can lay the ground for a comfortable computational method of predicting the reaction rate as well. In this
study, the WGS reaction is discussed according to micro-kinetic approach as well as the empirical one [3].
Studying the reaction mechanisms of the WGS reaction is still on progress after more than one century of investigation. Associative
and regenerative mechanisms are two main reaction pathways that have been proposed. The associative mechanism of the
Langmuir-Hinshelwood (LH) type, proposed by Armstrong and Hilditch [28] in 1920 using a cop-per chromite based catalyst,
consists of the adsorption of CO and H2O on a catalyst surface to produce an unspecified intermediate structure that subsequently
decomposes into the reaction products. The regenerative mechanism of the Eley-Rideal type, also known as the surface redox (SR)
mechanism, was originally described by Armstrong and Hilditch. The surface redox mechanism involves a catalytic cycle in which
surface is oxidized by H2O and then reduced by CO to produce H2 and CO2, respectively [8].
There are many kinetic rate expressions published since the use of WGS reaction in the ammonia process. Literature results shows
that some authors [29-32] proposed Langmuir-Hinshelwood model as appropriate mechanistic model while some others [13, 14, 33]
proposed surface redox model as appropriate model for low temperature water gas shift reaction over commercial CuO/ZnO/Al2O3.
Despite this disunity, the proposed mechanisms in this work is on the basis of Ayastuy et al.’s studies [30] who examined different
mechanistic models concluding various rate equations for the low temperature WGS reaction over commercial CuO/ZnO/Al2O3
catalyst. In this work, two rival rate equations which have shown good fit between the experimental results and predictions of many
studies are selected, namely Langmuir-Hinshelwood (LH) mechanism and surface redox (SR) mechanism.
The pathway of Langmuir-Hinshelwood (LH) mechanism is described via the following equations [30]:
↔ (2)
↔ (3)
Mohammady et al /American Journal of Oil and Chemical Technologies 4 (2016) 70-80
72
↔ (4)
↔ (5)
↔ (6)
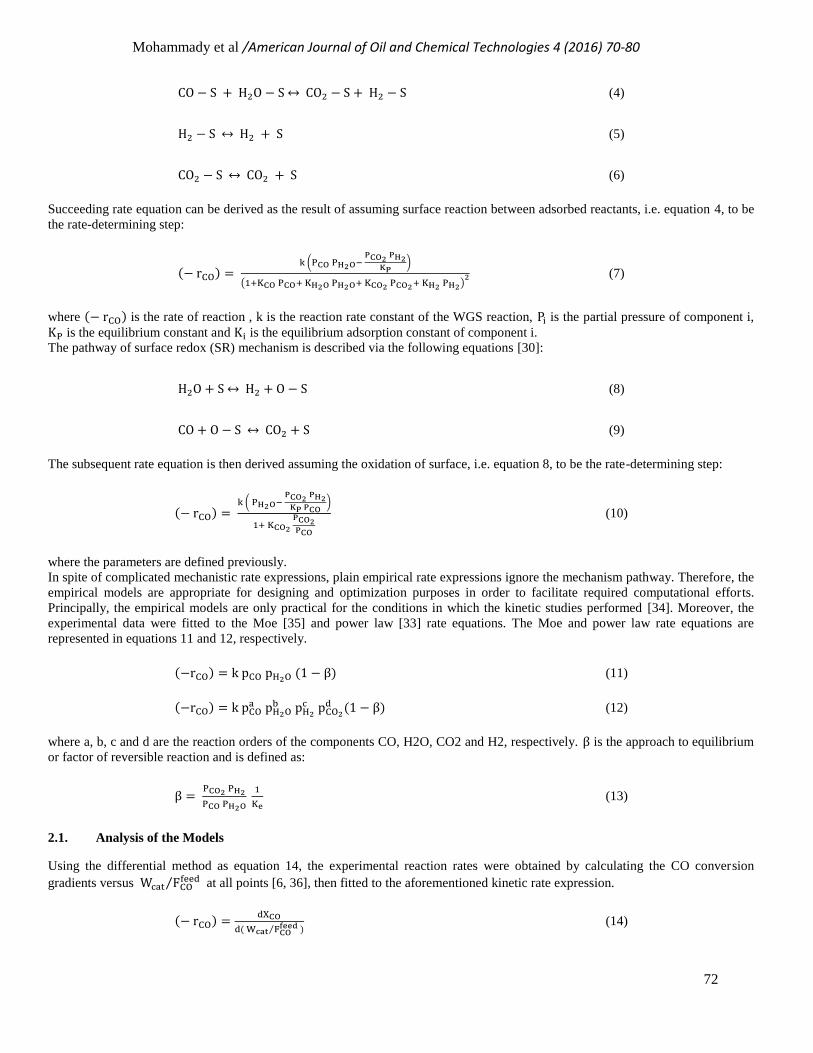
Succeeding rate equation can be derived as the result of assuming surface reaction between adsorbed reactants, i.e. equation 4, to be
the rate-determining step:
( ) (
)
( ) (7)
where ( ) is the rate of reaction , k is the reaction rate constant of the WGS reaction, is the partial pressure of component i,
is the equilibrium constant and is the equilibrium adsorption constant of component i.
The pathway of surface redox (SR) mechanism is described via the following equations [30]:
↔ (8)
↔ (9)
The subsequent rate equation is then derived assuming the oxidation of surface, i.e. equation 8, to be the rate-determining step:
( ) (
)
(10)
where the parameters are defined previously.
In spite of complicated mechanistic rate expressions, plain empirical rate expressions ignore the mechanism pathway. Therefore, the
empirical models are appropriate for designing and optimization purposes in order to facilitate required computational efforts.
Principally, the empirical models are only practical for the conditions in which the kinetic studies performed [34]. Moreover, the
experimental data were fitted to the Moe [35] and power law [33] rate equations. The Moe and power law rate equations are
represented in equations 11 and 12, respectively.
( ) ( ) (11)
( )
( ) (12)
where a, b, c and d are the reaction orders of the components CO, H2O, CO2 and H2, respectively. is the approach to equilibrium
or factor of reversible reaction and is defined as:
(13)
2.1. Analysis of the Models
Using the differential method as equation 14, the experimental reaction rates were obtained by calculating the CO conversion
gradients versus ⁄ at all points [6, 36], then fitted to the aforementioned kinetic rate expression.
( )
( ⁄ )
(14)
Mohammady et al /American Journal of Oil and Chemical Technologies 4 (2016) 70-80
73
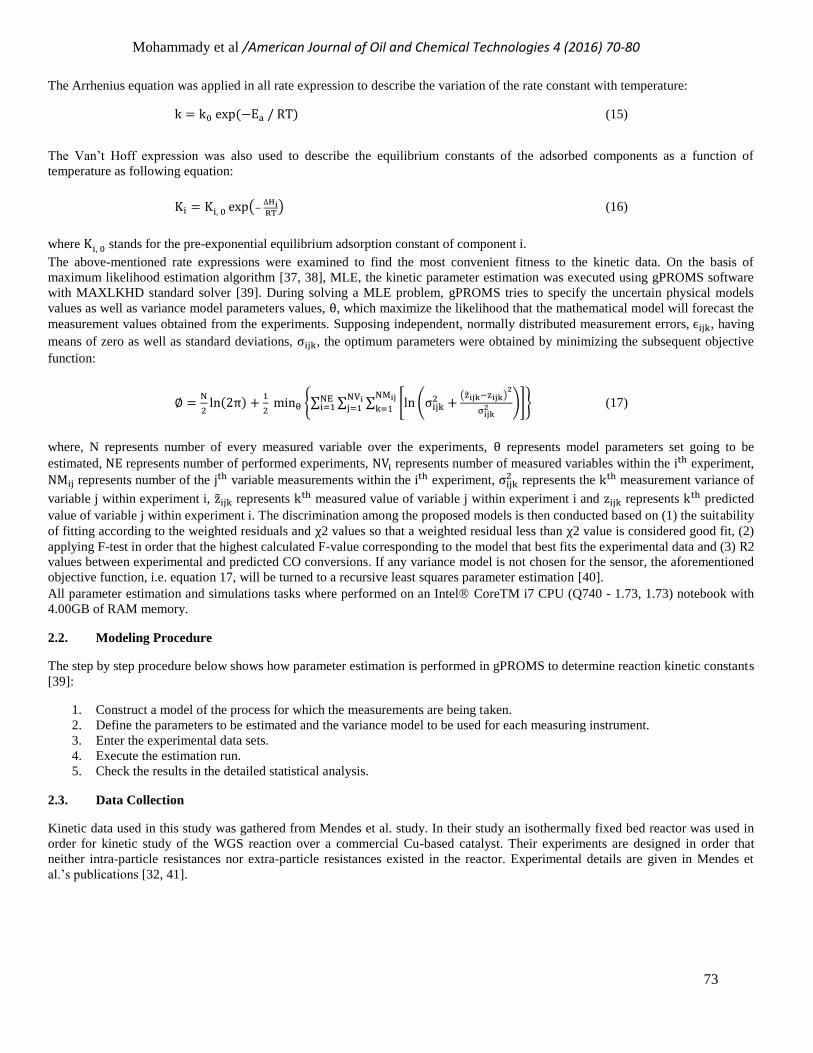
The Arrhenius equation was applied in all rate expression to describe the variation of the rate constant with temperature:
( ) (15)
The Van’t Hoff expression was also used to describe the equilibrium constants of the adsorbed components as a function of
temperature as following equation:
( ) (16)
where stands for the pre-exponential equilibrium adsorption constant of component i.
The above-mentioned rate expressions were examined to find the most convenient fitness to the kinetic data. On the basis of
maximum likelihood estimation algorithm [37, 38], MLE, the kinetic parameter estimation was executed using gPROMS software
with MAXLKHD standard solver [39]. During solving a MLE problem, gPROMS tries to specify the uncertain physical models
values as well as variance model parameters values, , which maximize the likelihood that the mathematical model will forecast the
measurement values obtained from the experiments. Supposing independent, normally distributed measurement errors, , having
means of zero as well as standard deviations, , the optimum parameters were obtained by minimizing the subsequent objective
function:
( )
{∑ ∑ ∑ [ (
( )
)]
} (17)
where, N represents number of every measured variable over the experiments, represents model parameters set going to be
estimated, represents number of performed experiments, represents number of measured variables within the experiment,
represents number of the variable measurements within the experiment, represents the measurement variance of
variable j within experiment i, represents measured value of variable j within experiment i and represents predicted
value of variable j within experiment i. The discrimination among the proposed models is then conducted based on (1) the suitability
of fitting according to the weighted residuals and 2 values so that a weighted residual less than 2 value is considered good fit, (2)
applying F-test in order that the highest calculated F-value corresponding to the model that best fits the experimental data and (3) 2
values between experimental and predicted CO conversions. If any variance model is not chosen for the sensor, the aforementioned
objective function, i.e. equation 17, will be turned to a recursive least squares parameter estimation [40].
All parameter estimation and simulations tasks where performed on an Intel CoreTM i7 CPU (Q740 - 1.73, 1.73) notebook with
4.00GB of RAM memory.
2.2. Modeling Procedure
The step by step procedure below shows how parameter estimation is performed in gPROMS to determine reaction kinetic constants
[39]:
1. Construct a model of the process for which the measurements are being taken.
2. Define the parameters to be estimated and the variance model to be used for each measuring instrument.
3. Enter the experimental data sets.
4. Execute the estimation run.
5. Check the results in the detailed statistical analysis.
2.3. Data Collection
Kinetic data used in this study was gathered from Mendes et al. study. In their study an isothermally fixed bed reactor was used in
order for kinetic study of the WGS reaction over a commercial Cu-based catalyst. Their experiments are designed in order that
neither intra-particle resistances nor extra-particle resistances existed in the reactor. Experimental details are given in Mendes et
al.’s publications [32, 41].
Mohammady et al /American Journal of Oil and Chemical Technologies 4 (2016) 70-80
74
3. Results and Discussion 3.1. Reaction Kinetic Parameter Estimation
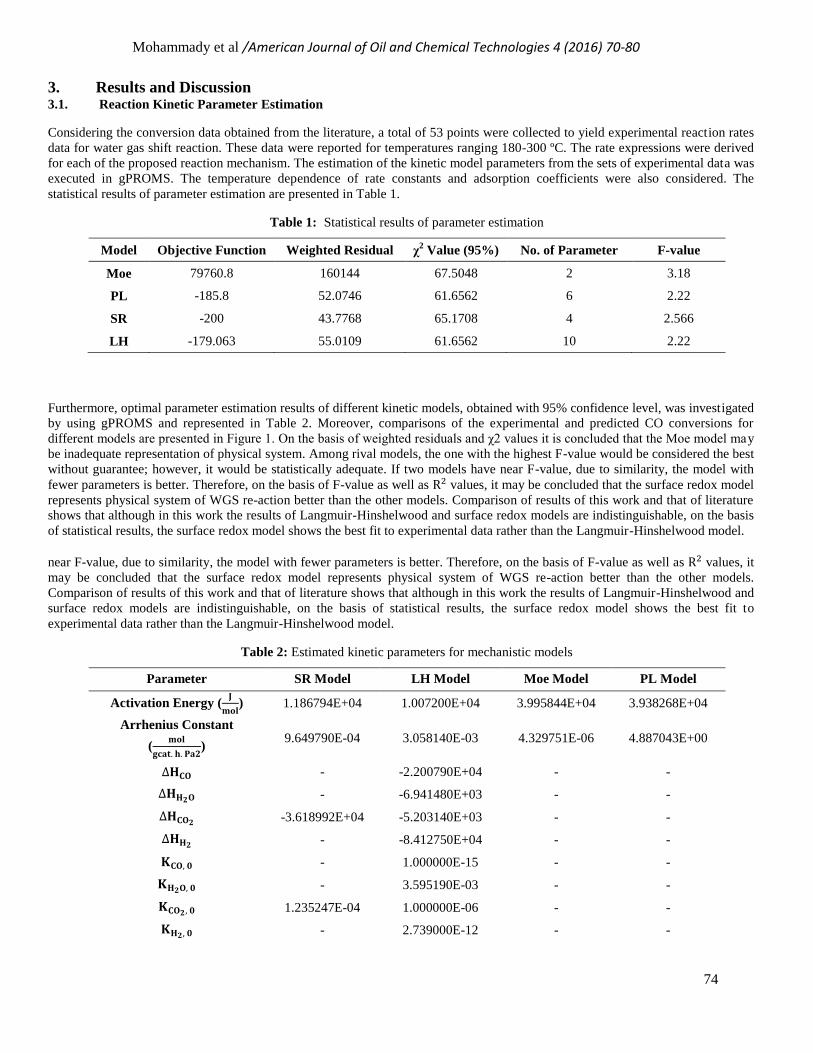
Considering the conversion data obtained from the literature, a total of 53 points were collected to yield experimental reaction rates
data for water gas shift reaction. These data were reported for temperatures ranging 180-300 ºC. The rate expressions were derived
for each of the proposed reaction mechanism. The estimation of the kinetic model parameters from the sets of experimental data was
executed in gPROMS. The temperature dependence of rate constants and adsorption coefficients were also considered. The
statistical results of parameter estimation are presented in Table 1.
Table 1: Statistical results of parameter estimation
Model Objective Function Weighted Residual χ2 Value (95%) No. of Parameter F-value
Moe 79760.8 160144 67.5048 2 3.18
PL -185.8 52.0746 61.6562 6 2.22
SR -200 43.7768 65.1708 4 2.566
LH -179.063 55.0109 61.6562 10 2.22
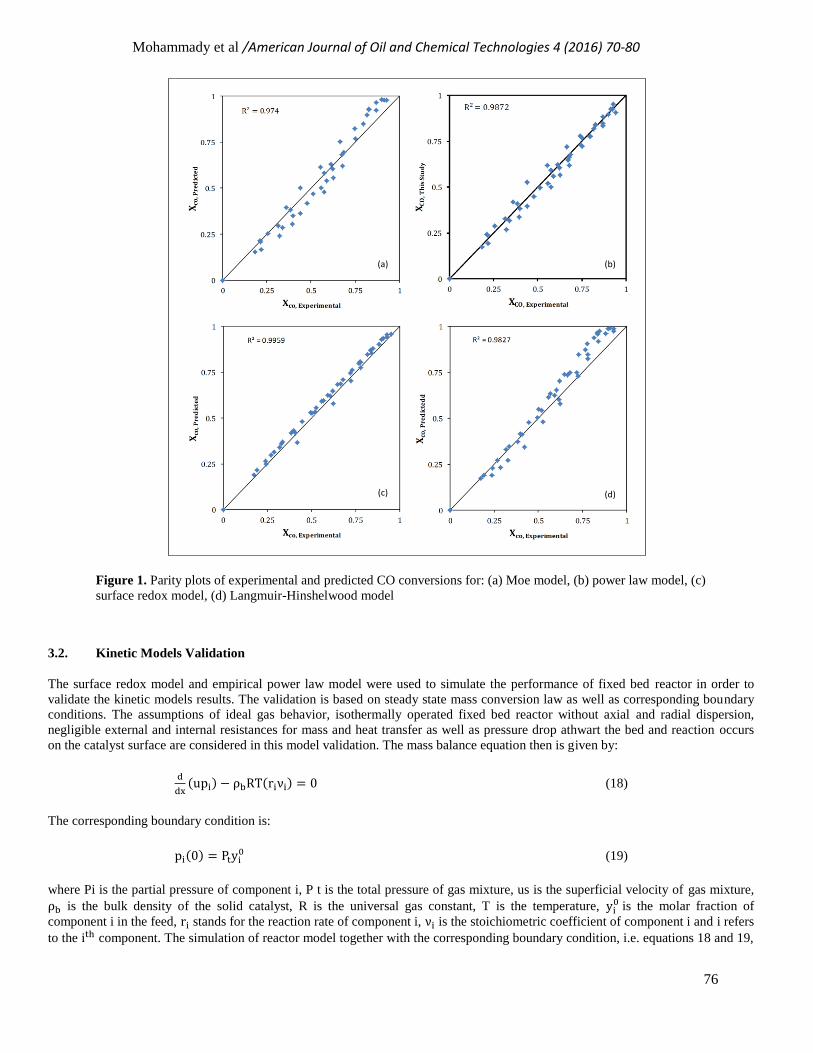
Furthermore, optimal parameter estimation results of different kinetic models, obtained with 95% confidence level, was investigated
by using gPROMS and represented in Table 2. Moreover, comparisons of the experimental and predicted CO conversions for
different models are presented in Figure 1. On the basis of weighted residuals and χ2 values it is concluded that the Moe model may
be inadequate representation of physical system. Among rival models, the one with the highest F-value would be considered the best
without guarantee; however, it would be statistically adequate. If two models have near F-value, due to similarity, the model with
fewer parameters is better. Therefore, on the basis of F-value as well as values, it may be concluded that the surface redox model
represents physical system of WGS re-action better than the other models. Comparison of results of this work and that of literature
shows that although in this work the results of Langmuir-Hinshelwood and surface redox models are indistinguishable, on the basis
of statistical results, the surface redox model shows the best fit to experimental data rather than the Langmuir-Hinshelwood model.
near F-value, due to similarity, the model with fewer parameters is better. Therefore, on the basis of F-value as well as values, it
may be concluded that the surface redox model represents physical system of WGS re-action better than the other models.
Comparison of results of this work and that of literature shows that although in this work the results of Langmuir-Hinshelwood and
surface redox models are indistinguishable, on the basis of statistical results, the surface redox model shows the best fit to
experimental data rather than the Langmuir-Hinshelwood model.
Table 2: Estimated kinetic parameters for mechanistic models
Parameter SR Model LH Model Moe Model PL Model
Activation Energy (
) 1.186794E+04 1.007200E+04 3.995844E+04 3.938268E+04
Arrhenius Constant
(
)
9.649790E-04 3.058140E-03 4.329751E-06 4.887043E+00
- -2.200790E+04 - -
- -6.941480E+03 - -
-3.618992E+04 -5.203140E+03 - -
- -8.412750E+04 - -
- 1.000000E-15 - -
- 3.595190E-03 - -
1.235247E-04 1.000000E-06 - -
- 2.739000E-12 - -
Mohammady et al /American Journal of Oil and Chemical Technologies 4 (2016) 70-80
75
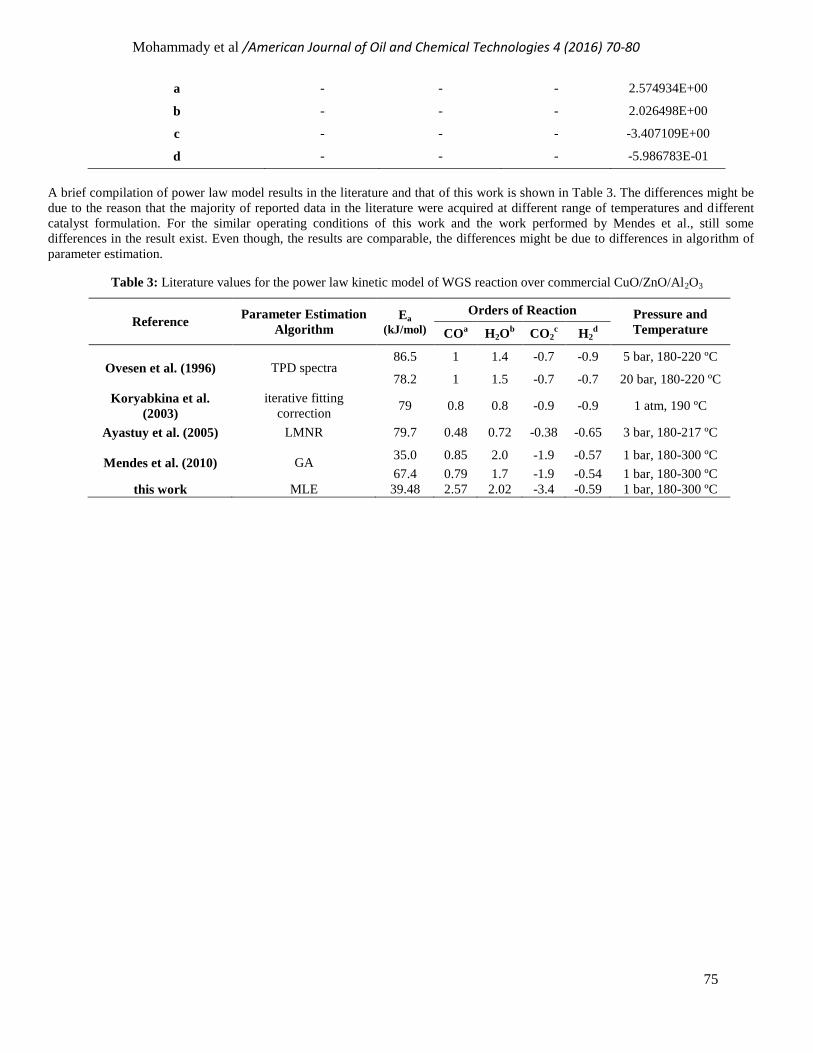
a - - - 2.574934E+00
b - - - 2.026498E+00
c - - - -3.407109E+00
d - - - -5.986783E-01
A brief compilation of power law model results in the literature and that of this work is shown in Table 3. The differences might be
due to the reason that the majority of reported data in the literature were acquired at different range of temperatures and different
catalyst formulation. For the similar operating conditions of this work and the work performed by Mendes et al., still some
differences in the result exist. Even though, the results are comparable, the differences might be due to differences in algorithm of
parameter estimation.
Table 3: Literature values for the power law kinetic model of WGS reaction over commercial CuO/ZnO/Al2O3
Reference Parameter Estimation
Algorithm Ea
(kJ/mol)
Orders of Reaction Pressure and
Temperature COa H2O
b CO2
c H2
d
Ovesen et al. (1996) TPD spectra 86.5 1 1.4 -0.7 -0.9 5 bar, 180-220 ºC
78.2 1 1.5 -0.7 -0.7 20 bar, 180-220 ºC
Koryabkina et al.
(2003)
iterative fitting
correction 79 0.8 0.8 -0.9 -0.9 1 atm, 190 ºC
Ayastuy et al. (2005) LMNR 79.7 0.48 0.72 -0.38 -0.65 3 bar, 180-217 ºC
Mendes et al. (2010) GA 35.0 0.85 2.0 -1.9 -0.57 1 bar, 180-300 ºC
67.4 0.79 1.7 -1.9 -0.54 1 bar, 180-300 ºC
this work MLE 39.48 2.57 2.02 -3.4 -0.59 1 bar, 180-300 ºC
Mohammady et al /American Journal of Oil and Chemical Technologies 4 (2016) 70-80
76
Figure 1. Parity plots of experimental and predicted CO conversions for: (a) Moe model, (b) power law model, (c)
surface redox model, (d) Langmuir-Hinshelwood model
3.2. Kinetic Models Validation
The surface redox model and empirical power law model were used to simulate the performance of fixed bed reactor in order to
validate the kinetic models results. The validation is based on steady state mass conversion law as well as corresponding boundary
conditions. The assumptions of ideal gas behavior, isothermally operated fixed bed reactor without axial and radial dispersion,
negligible external and internal resistances for mass and heat transfer as well as pressure drop athwart the bed and reaction occurs
on the catalyst surface are considered in this model validation. The mass balance equation then is given by:
( ) ( ) (18)
The corresponding boundary condition is:
( ) (19)
where Pi is the partial pressure of component i, P t is the total pressure of gas mixture, us is the superficial velocity of gas mixture,
is the bulk density of the solid catalyst, R is the universal gas constant, T is the temperature, is the molar fraction of
component i in the feed, stands for the reaction rate of component i, is the stoichiometric coefficient of component i and i refers
to the component. The simulation of reactor model together with the corresponding boundary condition, i.e. equations 18 and 19,
(a)
(c) (d)
(b)
Mohammady et al /American Journal of Oil and Chemical Technologies 4 (2016) 70-80
77
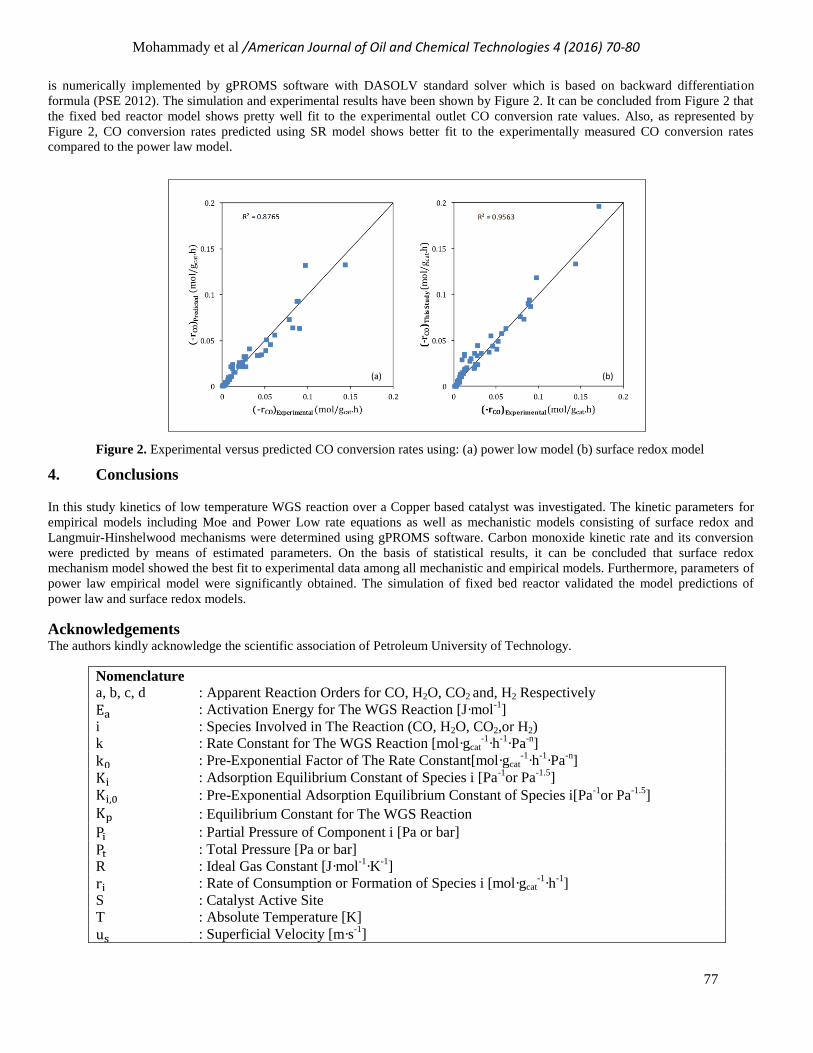
is numerically implemented by gPROMS software with DASOLV standard solver which is based on backward differentiation
formula (PSE 2012). The simulation and experimental results have been shown by Figure 2. It can be concluded from Figure 2 that
the fixed bed reactor model shows pretty well fit to the experimental outlet CO conversion rate values. Also, as represented by
Figure 2, CO conversion rates predicted using SR model shows better fit to the experimentally measured CO conversion rates
compared to the power law model.
Figure 2. Experimental versus predicted CO conversion rates using: (a) power low model (b) surface redox model
4. Conclusions
In this study kinetics of low temperature WGS reaction over a Copper based catalyst was investigated. The kinetic parameters for
empirical models including Moe and Power Low rate equations as well as mechanistic models consisting of surface redox and
Langmuir-Hinshelwood mechanisms were determined using gPROMS software. Carbon monoxide kinetic rate and its conversion
were predicted by means of estimated parameters. On the basis of statistical results, it can be concluded that surface redox
mechanism model showed the best fit to experimental data among all mechanistic and empirical models. Furthermore, parameters of
power law empirical model were significantly obtained. The simulation of fixed bed reactor validated the model predictions of
power law and surface redox models.
Acknowledgements The authors kindly acknowledge the scientific association of Petroleum University of Technology.
Nomenclature a, b, c, d : Apparent Reaction Orders for CO, H2O, CO2 and, H2 Respectively
: Activation Energy for The WGS Reaction [J·mol-1
]
i : Species Involved in The Reaction (CO, H2O, CO2,or H2)
k : Rate Constant for The WGS Reaction [mol·gcat-1
·h-1
·Pa-n
]
: Pre-Exponential Factor of The Rate Constant[mol·gcat-1
·h-1
·Pa-n
]
: Adsorption Equilibrium Constant of Species i [Pa-1
or Pa-1.5
]
: Pre-Exponential Adsorption Equilibrium Constant of Species i[Pa-1
or Pa-1.5
]
: Equilibrium Constant for The WGS Reaction
: Partial Pressure of Component i [Pa or bar]
: Total Pressure [Pa or bar]
R : Ideal Gas Constant [J·mol-1
·K-1
]
: Rate of Consumption or Formation of Species i [mol·gcat-1
·h-1
]
S : Catalyst Active Site
T : Absolute Temperature [K]
: Superficial Velocity [m·s-1
]
(a) (b)

Mohammady et al /American Journal of Oil and Chemical Technologies 4 (2016) 70-80
78
⁄ : Space Time [gcat·h·mol
-1]
x : Axial Coordinate of The Reactor [m]
: Conversion of Component i
: Feed Molar Fraction of Component
Greek letter
: Term for The Backward Reaction or Approach to Equilibrium
: Heat of Adsorption of Component i [J·mol-1
]
: Standard Heat of Reaction [J·mol
-1]
: Stoichiometric Coefficient of Species i
: Catalyst Bulk Density [kg·m-3
]
Statistical Acronyms
: Parameter Estimation Objective Function
: Statistical Chi Squared
: Difference Between The Experimental and The Model Predicted Values
: Model Predicted Value in Parameter Estimation
: The Experimental Values
: Standard Deviation
N : Number of Experimental Data Points
NE : number of experiments performed
NMij : number of measurements of the jth variable in the i
th experiment
NVi : number of variables measured in the ith
experiment
: Statistical R Squared
Abbreviations GA : Genetic Algorithm
HTS : High Temperature Shift
LTS : Low Temperature Shift
LH : Langmuir-Hinshelwood
MLE : Maximum Likelihood Estimation
PL : Power Law
SR : Surface Regeneration or Surface Redox
WGS : Water-Gas Shift
WR : Weighted Residuals
5. References:
[1] S. Lee, Encyclopedia of chemical processing. New York: Taylor & Francis, 2006.
[2] D. S. Newsome, "The water-gas shift reaction," Catalysis Reviews Science and Engineering, vol. 21, pp. 275-318, 1980.
[3] R. Smith, M. Loganathan, and M. S. Shantha, "A review of the water gas shift reaction kinetics," International Journal of
Chemical Reactor Engineering, vol. 8, 2010.
[4] J. Zou, J. Huang, and W. W. Ho, "CO2-selective water gas shift membrane reactor for fuel cell hydrogen processing," Industrial
& engineering chemistry research, vol. 46, pp. 2272-2279, 2007.
[5] V. Kirillov, V. Meshcheryakov, O. Brizitskii, and V. Y. Terent’ev, "Analysis of a power system based on low-temperature fuel
cells and a fuel processor with a membrane hydrogen separator," Theoretical Foundations of Chemical Engineering, vol. 44, pp.
227-235, 2010.
[6] O. Levenspiel, Chemical reaction engineering: John Wiley & Sons 1999.
[7] R. H. Perry, D. W. Green, J. O. Maloney, M. M. Abbott, C. M. Ambler, and R. C. Amero, Perry's chemical engineers' handbook
vol. 7: McGraw-hill New York, 1997.
[8] C. Rhodes, G. Hutchings, and A. Ward, "Water-gas shift reaction: finding the mechanistic boundary," Catalysis Today, vol. 23,
pp. 43-58, 1995.
[9] D. Mendes, A. Mendes, L. Madeira, A. Iulianelli, J. Sousa, and A. Basile, "The water-gas shift reaction: from conventional
catalytic systems to Pd‐based membrane reactors-a review," Asia‐Pacific Journal of Chemical Engineering, vol. 5, pp. 111-137,
2010.
[10] C. Ratnasamy and J. P. Wagner, "Water gas shift catalysis," Catalysis Reviews, vol. 51, pp. 325-440, 2009.
Mohammady et al /American Journal of Oil and Chemical Technologies 4 (2016) 70-80
79
[11] C. T. Campbell and K. Daube, "A surface science investigation of the water-gas shift reaction on Cu (111)," Journal of
Catalysis, vol. 104, pp. 109-119, 1987.
[12] J. Nakamura, J. M. Campbell, and C. T. Campbell, "Kinetics and mechanism of the water-gas shift reaction catalysed by the
clean and Cs-promoted Cu (110) surface: A comparison with Cu (111)," J. Chem. Soc., Faraday Trans., vol. 86, pp. 2725-2734,
1990.
[13] C. Ovesen, B. Clausen, B. Hammershøi, G. Steffensen, T. Askgaard, I. Chorkendorff, et al., "A microkinetic analysis of the
water–gas shift reaction under industrial conditions," Journal of catalysis, vol. 158, pp. 170-180, 1996.
[14] C. Ovesen, P. Stoltze, J. Nørskov, and C. Campbell, "A kinetic model of the water gas shift reaction," Journal of catalysis, vol.
134, pp. 445-468, 1992.
[15] N. Schumacher, A. Boisen, S. Dahl, A. A. Gokhale, S. Kandoi, L. C. Grabow, et al., "Trends in low-temperature water–gas shift
reactivity on transition metals," Journal of Catalysis, vol. 229, pp. 265-275, 2005.
[16] M. Temkin, "The kinetics of some industrial heterogeneous catalytic reactions," Advances in Catalysis, vol. 28, pp. 173-291,
1979.
[17] E. Tserpe and K. Waugh, "A microkinetic analysis of the reverse water gas shift reaction," Studies in Surface Science and
Catalysis, vol. 109, pp. 401-416, 1997.
[18] K. C. Waugh, "Prediction of global reaction kinetics by solution of the Arrhenius parameterised component elementary
reactions: microkinetic analysis," Catalysis today, vol. 53, pp. 161-176, 1999.
[19] C. Callaghan, I. Fishtik, R. Datta, M. Carpenter, M. Chmielewski, and A. Lugo, "An improved microkinetic model for the water
gas shift reaction on copper," Surface Science, vol. 541, pp. 21-30, 2003.
[20] I. Fishtik and R. Datta, "A UBI–QEP microkinetic model for the water–gas shift reaction on Cu (111)," Surface Science, vol.
512, pp. 229-254, 2002.
[21] T. Askgaard, J. Norskov, C. Ovesen, and P. Stoltze, "A kinetic model of methanol synthesis," Journal of Catalysis, vol. 156, pp.
229-242, 1995.
[22] T. Shido and Y. Iwasawa, "The effect of coadsorbates in reverse water-gas shift reaction on ZnO, in relation to reactant-
promoted reaction mechanism," Journal of Catalysis, vol. 140, pp. 575-584, 1993.
[23] T. Van Herwijnen and W. De Jong, "Kinetics and mechanism of the CO shift on CuZnO: 1. Kinetics of the forward and reverse
CO shift reactions," Journal of Catalysis, vol. 63, pp. 83-93, 1980.
[24] C. R. Lund, "Water-gas shift kinetics over iron oxide catalysts at membrane reactor conditions," Final Rep. Chem. Eng. Dep.
Univ. Buffalo, pp. 14260-14200, 2002.
[25] C. R. Lund and D. Ma, "Water gas shift kinetics at membrane reactor conditions," in Presentation in university coal contractors
review meeting, Pittsburgh, PA, 2002.
[26] D. Ma and C. R. Lund, "Assessing high-temperature water-gas shift membrane reactors," Industrial & engineering chemistry
research, vol. 42, pp. 711-717, 2003.
[27] G. J. Millar, C. H. Rochester, C. Howe, and K. C. Waugh, "A combined infrared, temperature programmed desorption and
temperature programmed reaction spectroscopy study of CO2 and H2 interactions on reduced and oxidized silica-supported
copper catalysts," Molecular Physics, vol. 76, pp. 833-849, 1992.
[28] E. Armstrong and T. Hilditch, "A study of catalytic actions at solid surfaces. IV. the interaction of carbon monoxide and steam
as conditioned by iron oxide and by copper," Proceedings of the Royal Society of London. Series A, Containing Papers of a
Mathematical and Physical Character, vol. 97, pp. 265-273, 1920.
[29] N. Amadeo and M. Laborde, "Hydrogen production from the low-temperature water-gas shift reaction: kinetics and simulation
of the industrial reactor," International journal of hydrogen energy, vol. 20, pp. 949-956, 1995.
[30] J. Ayastuy, M. Gutiérrez-Ortiz, J. González-Marcos, A. Aranzabal, and J. Gonzalez-Velasco, "Kinetics of the low-temperature
WGS reaction over a CuO/ZnO/Al2O3 catalyst," Industrial & engineering chemistry research, vol. 44, pp. 41-50, 2005.
[31] Y. Choi and H. G. Stenger, "Water gas shift reaction kinetics and reactor modeling for fuel cell grade hydrogen," Journal of
Power Sources, vol. 124, pp. 432-439, 2003.
[32] D. Mendes, V. Chibante, A. Mendes, and L. M. Madeira, "Determination of the Low-Temperature Water− Gas Shift Reaction
Kinetics Using a Cu-Based Catalyst," Industrial & Engineering Chemistry Research, vol. 49, pp. 11269-11279, 2010.
[33] N. Koryabkina, A. Phatak, W. Ruettinger, R. Farrauto, and F. Ribeiro, "Determination of kinetic parameters for the water–gas
shift reaction on copper catalysts under realistic conditions for fuel cell applications," Journal of Catalysis, vol. 217, pp. 233-
239, 2003.
[34] T. Salmi and R. Hakkarainen, "Kinetic Study of the Low-Temperature Water-Gas Shift Reaction over a Cu—ZnO Catalyst,"
Applied catalysis, vol. 49, pp. 285-306, 1989.
[35] J. M. Moe, "Design of water-gas shift reactors," Chemical Engineering Progress, vol. 58, pp. 33-36, 1962.
[36] G. F. Froment, K. B. Bischoff, and J. De Wilde, Chemical Reactor-Analysis and Design, Third ed. New York: John Wiley, 2011.
[37] I. J. Myung, "Tutorial on maximum likelihood estimation," Journal of mathematical Psychology, vol. 47, pp. 90-100, 2003.
[38] F. Scholz, "Maximum likelihood estimation," Encyclopedia of Statistical Sciences, 1985.
[39] PSE, gPROMS Model Validation Guide: Process System Enterprise Ltd., 2012.

Mohammady et al /American Journal of Oil and Chemical Technologies 4 (2016) 70-80
80
[40] M. Koutinas, A. Kiparissides, M.-C. Lam, R. Silva-Rocha, M. Godinho, V. De Lorenzo, et al., "Improving the prediction of
Pseudomonas putida mt-2 growth kinetics with the use of a gene expression regulation model of the TOL plasmid," Biochemical
Engineering Journal, vol. 55, pp. 108-118, 2011.
[41] D. Mendes, H. Garcia, V. Silva, A. Mendes, and L. M. Madeira, "Comparison of nanosized gold-based and copper-based
catalysts for the low-temperature water− gas shift reaction," Industrial & Engineering Chemistry Research, vol. 48, pp. 430-439,
2008.