kimberly wise, ph. d - national toxicology program · 06-12-2012 · kimberly wise, ph. d...
TRANSCRIPT

Kimberly Wise, Ph. D
Regulatory and Scientific Affairs
1220 L Street, NW
Washington, DC 20005-4070
Phone: 202-682-8473
Email: [email protected]
April 27, 2010
Office of Environmental Information (OEI) Docket
(Mail Code: 2822T)
U.S. Environmental Protection Agency
1200 Pennsylvania Ave., NW
Washington, DC 20460
Submitted via email to [email protected] and online via www.regulations.gov
Re: Submission of Comments for Docket ID No. EPA–HQ–ORD– 2010–0047, Development of a Relative Potency Factor (RPF) Approach for
Polycyclic Aromatic Hydrocarbon (PAH) Mixtures
The American Coke and Coal Chemicals Institute1, the American Petroleum Institute
2, the
Asphalt Institute3, the Association of American Railroads
4, the National Petrochemical &
Refiners Association5
and the Pavement Coatings Technology Council6
provide the attached set
of comments and four appendix documents in response to Docket ID No. EPA–HQ–ORD– 2010–0047, Development of a Relative Potency Factor (RPF) Approach for Polycyclic Aromatic
Hydrocarbon (PAH) Mixtures
We hope you will give full consideration to the information provided. Please contact me by
telephone (202-682-8473) or email ([email protected]) with questions or requests for additional
information.
Respectfully submitted,
American Coke and Coal Chemicals Institute
American Petroleum Institute
Asphalt Institute
Association of American Railroads
National Petrochemical & Refiners Association
Pavement Coatings Technology Council
ATTACHMENTS
A. Comments on Docket ID No. EPA-HQ-ORD-2010-0047, Development of a Relative
Potency Factor (RPF) Approach for Polycyclic Aromatic Hydrocarbon (PAH) Mixtures
B. Comments on Charge Questions (Appendix A)
C. Validation Exercises (Appendix B)
D. Benchmark Dose Modeling Results, Spot Checking of EPA (2010) Conclusions (Appendix C)
E. Benchmark Dose Modeling Results, Cancer Slope Factor Derivations, Benzo[a]pyrene
and Coal Tar Mixtures (Appendix D)

1The American Coke & Coal Chemicals Institute (ACCCI) represents companies
accounting for 100% of the metallurgical coke and coal chemicals production in the U.S.
2The American Petroleum Institute (API) is the primary trade association for the oil
and natural gas industry in the United States. Representing one of the most
technologically advanced industries in the world, its membership includes more than 400
companies engaged in all aspects of the oil and gas industry, including the exploration,
production, refining, transportation and marketing of crude petroleum and petroleum
products. API is a major research institute that advances public policy positions based
upon scientific, technical and economic research, and it develops standards and quality
certification programs used throughout the world. API’s public policy positions reflect a
commitment to ensure a strong, viable U.S. oil and natural gas industry capable of
meeting the energy needs of our nation and providing consumers a reliable source of
products in an efficient and environmentally responsible manner.
3The Asphalt Institute (AI) is the international trade association of petroleum asphalt
producers, manufacturers and affiliated businesses. The Asphalt Institute's mission is to
promote the use, benefits, and quality performance of petroleum asphalt, through
environmental, marketing, research, engineering and technical development, and through
the resolution of issues affecting the industry.
4The Association of American Railroads (AAR) is a trade association whose
membership includes freight railroads that operate 72 percent of the line-haul mileage,
employ 92 percent of the workers, and account for 95 percent of the freight revenue of all
railroads in the United States; and passenger railroads that operate intercity passenger
trains and provide commuter rail service.
5National Petrochemical & Refiners Association (NPRA) members comprise more
than 450 companies, including virtually all U.S. refiners and petrochemical
manufacturers. Our members supply consumers with a wide variety of products and
services that are used daily in homes and businesses. These products include gasoline,
diesel, fuel, home heating oil, jet fuel, asphalt products, and the chemicals that serve as
“building blocks” in making plastics, clothing, medicine and computers.
6The Pavement Coating Technology Council (PCTC) network of manufacturers and
applicators are dedicated to extending the life of asphalt through maintaining highest
quality manufacturing and application standards.

Comments on Docket ID No. EPA-HQ-ORD-2010-
0047, Development of a Relative Potency Factor
(RPF) Approach for Polycyclic Aromatic
Hydrocarbon (PAH) Mixtures
Submitted by the Following:
American Coke and Coal Chemicals Institute American Petroleum Institute Asphalt Institute Association of American Railroads National Petrochemical & Refiners Association Pavement Coatings Technology Council
April 27, 2010

Table of Contents
Executive Summary vii
I. Scientific Recommendations 1
1. Assumption that PAHs Pose Carcinogenic Risk to Humans 1
1.1 Hazard Assessment of Individual PAHs in Humans 1
1.2 EPA (2010) “Weight of Evidence” Evaluation 2
2. BaP as Index Chemical 3
3. Cancer Slope Factor (CSF) for Benzo[a]pyrene 3
4. Omission of Studies Not Including BaP 4
4.1 Wood et al. (1980) 4
4.2 Cavalieri et al. (1989) 4
4.3 Van Duuren et al. (1970) 5
4.4 Chang et al. (1982) 5
5. Protocol Issues 6
5.1 Mouse Skin Assay 6
5.2 A/J Mouse Lung Adenoma Model 7
5.3 Lung Implantation Model 8
5.4 Numerical Methodology 8
5.5 Transparency of Data Used 10
5.6 Dependence of RPFs of “Low” Confidence or Few Studies 10
5.7 Point Estimate Methodology and Benchmark Dose Model Fits 13
5.7.1 Benchmark Dose Model Fit Validation 13
5.7.2 Mass et al. (1993) 13
5.7.3 Nesnow et al. (1984) 14
5.7.4 Habs et al. (1980) 15
5.7.5 LaVoie et al. (1982) 15
5.7.6 Rice et al. (1988) 15
5.7.7 Busby et al. (1984) 15
Comments on Development of a Relative Potency Factor (RPF) Approach for PAH Mixtures i

Table of Contents
5.7.8 Nesnow et al. (1998) 16
5.7.9 Conclusion 16
5.8 Exclusion of Data from Studies Showing Tumor Incidence of 90% or Higher16
5.9 Role of Cancer-related Endpoints 17
5.10 Concurrent BaP Control 18
5.11 Suitability of Data Sets for Dose-Response Modeling 19
6. Exceedance of Maximum Tolerated Dose 20
6.1 Mortality 21
6.2 Significant Skin Toxicity 23
6.2.1 Cyclopenta[c,d]pyrene (Cavalieri et al. 1981b) 24
6.2.2 Dibenzo[a,l]pyrene (Cavalieri et al. 1991) 24
6.2.3 Benzo[j]fluoranthene (Weyand et al. 1992) 24
6.2.4 Dibenzo[a,e]pyrene (Hoffmann and Wynder 1966) 25
7. Identity and Purity of Test Article 25
7.1 Benzo[c]fluorene 25
7.2 Benz[l]aceanthrylene and benz[e]aceanthrylene 26
7.3 Benz[j]aceanthrylene 26
7.4 Dibenzo[a,l]pyrene 26
7.5 Cyclopenta[d,e,f]chrysene, 4H- 27
7.6 Benz[b,c]aceanthrylene, 11H- 27
7.7 Dibenzo[a,e]fluoranthene 28
8. Substance-Specific Comments 28
8.1 Benzo[g,h,i]perylene 28
8.2 Dibenz[a,c]anthracene 29
8.3 Cyclopenta[c,d]pyrene 30
9. Whole Mixtures Approach vs. Component Approach 30
10. Age-Dependent Adjustment Factors 31
Comments on Development of a Relative Potency Factor (RPF) Approach for PAH Mixtures ii

Table of Contents
11. Bioavailability 31
12. Factual Errors 33
13. Documentation 35
13.1 Use of Graphical Data 35
13.2 Use of Undocumented Data 35
13.3 Calculation of Incidence 35
II. References 36
Appendix A. Comments on Charge Questions
Appendix B. Validation Exercises
Appendix C. Benchmark Dose Modeling Results, Spot Checking of EPA (2010) Conclusions
Appendix D. Benchmark Dose Modeling Results, Cancer Slope Factor Derivations, Benzo[a]pyrene and Coal Tar Mixtures
Comments on Development of a Relative Potency Factor (RPF) Approach for PAH Mixtures iii

Table of Contents
Tables
Table 1. Carcinogen Classifications of Individual PAHs
Table 2. Effect of Wood et al. (1980) Data on RPF Derivation
Table 3. Effect of Cavalieri et al. (1989) Data on RPF Derivation
Table 4. Recalculation of Select RPFs Using Alternative Methodology
Table 5. PAHs and RPFs with Low Confidence Ratings
Table 6. Number of Dose Groups for EPA Data Sets
Table 7. High Mortality Rates in Studies Used to Calculate RPFs in EPA (2010)
Table 8. Select Physical and Chemical Properties of PAHs with EPA (2010) RPFs
Table B-1. Comparison of BaP-TE Values for Coal Tar Mixture 1 (Culp et al. 1998) Using Current and Proposed RPFs
Table B-2. Comparison of BaP-TE Values for Coal Tar Mixture 2 (Culp et al. 1998) Using Current and Proposed RPFs
Table B-3. Comparison of Risk Estimates for Coal Tar Using the Derived Coal Tar CSF, the Outdated IRIS Benzo[a]pyrene CSF and Current or Proposed RPFs
Table B-4. Comparison of Risk Estimates for Coal Tar Using the Derived Coal Tar CSF, the NCTR Benzo[a]pyrene CSF, and Current or Proposed RPFs
Table B-5. Comparison of Risk Estimates for Coal Tar Using the Derived Coal Tar CSF, the Outdated IRIS Benzo[a]pyrene CSF, Proposed RPFs and Assumed Concentrations of 100 ppm for Non-Quantitated PAHs
Table B-6. Comparison of Risk Estimates for Coal Tar Using the Derived Coal Tar CSF, the NCTR Benzo[a]pyrene CSF, Proposed RPFs, and Assumed Concentrations of 100 ppm for Non-Quantitated PAHs
Table B-7. Inhibition of Laboratory PAH Carcinogenesis by other PAHs
Table B-8. Data of Schmahl et al. (1977)
Table B-9. Validation of Assumption of Additivity – Data of Pfeiffer et al. (1977) Two Component Mixture
Table B-10. Validation of Assumption of Additivity – Data of Pfeiffer et al. (1977) Twelve Component Mixture
Table B-11. Validation of EPA (2010) RPFs Using Tumor Date of Pfeiffer (1977)
Comments on Development of a Relative Potency Factor (RPF) Approach for PAH Mixtures iv

Abbreviations and
Acronyms
1,2-MBA 11H-benz[b,c]aceanthrylene
3-MC 3-methylchloanthrene
4,5-MC 4H-cyclopenta[d,e,f]chrysene
AA anthanthrene
ADAF age-dependent adjustment factor
Ah Aryl hydrocarbon receptor
AhrR Aryl hydrocarbon receptor
AIC Akaike's Information Criterion
AUC area under the curve
BaA benz[a]anthracene
BaP benzo[a]pyrene
BaP-TE benzo[a]pyrene toxic equivalent
BbcAC benz[b,c]aceanthrylene, 11H
BbF benzo[b]fluoranthene
BeAC benz[e]aceanthrylene
BeP benzo[e]pyrene
BghiP benzo(g,h,i)perylene
BIAC benz[l]aceanthrylene
BjAC benz[j]aceanthrylene
BjF benzo[j]fluoranthene
BkF benzo[k]fluoranthene
BMD benchmark dose
BMDL benchmark dose lower confidence limit
BMDS Benchmark Dose Modeling Software
BMR benchmark response
CH chrysene
CPcdP cyclopenta[c,d]pyrene
CSF Cancer Slope Factor
DahA dibenz[a,h]anthracene
DBA dibenzanthracene
DBacA dibenz[a,c]anthracene
DBaeF dibenzo[a,e]fluoranthene
DBahA dibenz[a,h]anthracene
DBaeP dibenzo[a,e]pyrene
DBahP dibenzo[a,h]pyrene
Comments on Development of a Relative Potency Factor (RPF) Approach for PAH Mixtures v

Abbreviations and
Acronyms
DBaiP dibenzo[a,i]pyrene
DBalP dibenzo[a,l]pyrene
DBelP dibenzo[e,l]pyrene
DMBA 7,12-dimethyl-benz[a]anthracene
EPA United States Environmental Protection Agency
EPRI Electric Power Research Institute
DNA deoxyribonucleic acid
FA fluoranthene
GLP Good Laboratory Practice
HPLC high-performance liquid chromatography
I123cdP indeno[1,2,3-cd]pyrene
IARC International Agency for Research on Cancer
IR Infrared
IP intraperitoneal
IRIS Integrated Risk Information System
mg/kg milligrams per kilogram
mg/kg/day milligrams per kilogram per day
mM millimolar
mol mole
MTD maximum tolerated dose
N23eP naphtho[2,3-e]pyrene
NCTR National Center for Toxicological Research
nmol nanomole
NMR Nuclear Magnetic Resonance
NRC National Research Council
PAH polycyclic aromatic hydrocarbon
r 2
Correlation coefficient
RFP Relative Potency Factor
ug microgram
umol micromole
UV ultraviolet
WHO World Health Organization
Comments on Development of a Relative Potency Factor (RPF) Approach for PAH Mixtures vi

Executive Summary
The American Coke and Coal Chemicals Institute, the American Petroleum Institute, the Asphalt
Institute, the Association of American Railroads, the National Petrochemical & Refiners
Association and the Pavement Coatings Technology Council have reviewed the Docket ID No.
EPA–HQ–ORD–2010–0047, Development of a Relative Potency Factor (RPF) Approach for
Polycyclic Aromatic Hydrocarbon (PAH) Mixtures and provide the following comments. Detailed
scientific comments are presented first. Responses to the EPA Charge Questions are then
presented in Appendix A. Finally, technical details that support the scientific comments are
documented in Appendices B -D.
The U.S. Environmental Protection Agency (EPA) has not effectively documented the basic
scientific principles underlying the RPF approach. According to IRIS document (EPA 2010) "The
EPA RPF approach involves two key assumptions (1) a similar toxicological action of PAH
components in the mixture and (2) interactions among PAH mixture components do not occur at
low levels of exposure typically encountered in the environment" (p. iv). However, upon review
of the IRIS assessment, we conclude that EPA did not provide adequate scientific evidence or
quantitative data to support the above hypotheses (i.e., the similar mode of action of PAHs ).
Our assessment supports comments submitted by the National Aeronautics and Space
Administration (NASA)1 to EPA on 10/28/2009. In those comments NASA states a "Review of the
current draft found extensive discussion of mode of action but little to no substantiation for EPA's
actual determination of the primary mode of carcinogenic action". The commenters share NASA’s
concerns that "The current draft actively narrows data use to only those experiments performed at
the same lab and does not consider the range of available data, especially for a diverse group of
chemicals, such as PAH mixtures. Of particular concern is the EPA approach to limit the use to
only 'positive results', a concern that NASA previously identified in its review of the draft TCE risk
assessment under IRIS. Overall, this limitation of data raises the potential for skewed results, the
appearance of “cherry picking” data for a desired results and would exclude much of the literature
or data sources used consistently in other EPA risk assessments"
Subsequently, comments submitted by the Department of Defense2 to this EPA on 10/28/2009
echo similar concerns "... if EPA believes that there are specific mutations required for the
carcinogenicity, it would seem hard to assert that a stochastic process is occurring, which is one
of the assumptions for response additivity"
In addition to the above points, we note the following:
EPA has not performed a Weight of Evidence Evaluation as called for in its Guidelines for
Carcinogen Risk Assessment (EPA, 2005). The weight of evidence assessment
presented ignored the question of human carcinogenic risk and instead determined if the
substance was positive in any short term assay in which benzo[a]pyrene was tested. EPA
considered a single positive result to be adequate weight of evidence to conclude that a
PAH should be included in the RPF scheme. EPA’s weight of evidence analysis was
scientifically inadequate, and EPA should not derive RPFs for PAHs unless a formal
Comments on Development of a Relative Potency Factor (RPF) Approach for PAH Mixtures vii

weight of evidence evaluation has resulted in a weight of evidence narrative that there is,
at a minimum, suggestive evidence of carcinogenic potential in humans.
EPA assumed that all PAHs act by a similar mode of action. Specifically, EPA stated that a
common mutagenic mode of action for carcinogenic PAHs is hypothesized based on
information available for the indicator chemical, benzo[a]pyrene (U.S. EPA, 2005b).
However, after stating this, EPA contradicts their own assumption by stating “the
carcinogenic process for individual PAHs is likely to be related to some unique
combination of multiple molecular events resulting from formation of several reactive
species.” Unique action argues against the same mode of action. EPA’s support for their
proposed mode of action assumption is that many PAHs are metabolized similarly and
many PAHs form DNA adducts. However, PAHs that are metabolically activated and form
DNA adducts in human skin do not cause tumors in human skin as they do in mouse skin.
The mode of action for PAHs is complex and EPA has not demonstrated that the mode of
action is the same for all PAHs for which RPFs were derived.
EPA makes an assumption of dose additivity however, little information was presented to
support this assumption. Subsequently, a great deal of scientific data on PAH antagonistic
interactions was not addressed. Some antagonism data contradicting this key assumption
is presented in the detailed comments below.
The criteria EPA used in developing the RPF approach excluded valuable data and at
times EPA failed to follow the set criteria. For example, EPA selected benzo[a]pyrene as
the index chemical and excluded literature with other index PAHs. As well, no studies were
included unless benzo[a]pyrene positive controls were run in the experiment concurrently.
However, certain exceptions were made that are not adequately justified. Another criteria,
regarding how data were excluded if the tumor incidence was 90% or greater at the lowest
dose tested, was selectively applied by EPA. EPA also stated that studies were excluded
from the RPF approach if the purity of the test chemical was in question, but a majority of
the studies contained no information about the identity and purity of the test chemicals.
These and other scientific topics are discussed in the detailed comments below.
There were also several technical problems identified that are discussed below. For
example, data from several studies that exceeded the maximum tolerated dose were used
for RPF derivation. However, EPA should have excluded such data. As well, EPA’s RPFs
were in many cases based on a single test result, and many of these derived from a small
number of scientific studies of questionable quality. Another issue identified by the
commenters was the use of slope factors derived from single data points, versus the use
of slope factors derived from multidose dose-response curves.
EPA also failed to validate the derived RPFs using cancer response data from real world
complex mixtures. As noted in “Supplemental Guidance for Conducting Health Risk
Assessment of Chemical Mixtures (EPA, 2000),” data from whole mixtures are preferable
to data from mixture components. The commenters have performed validation exercises
Comments on Development of a Relative Potency Factor (RPF) Approach for PAH Mixtures viii

that demonstrate that EPA’s RPFs overestimate the carcinogenic risk observed when the
interactions between components is inherently taken into account.
1 Wennerberg, L. S., "PAH mixtures NASA comments 10-28-09", aspub.epa.gov/eims/eimscomm.getfile?p_download_id=494551
2 Department of Defense Comments on the Development of a Relative Potency Factor (RPF) Approach for Polycyclic Aromatic
Hydrocarbon (PAH) Mixtures ,oaspub.epa.gov/eims/eimscomm.getfile?p_download_id=494554
Comments on Development of a Relative Potency Factor (RPF) Approach for PAH Mixtures ix

I. Scientific Recommendations
The undersigned have reviewed the Docket ID No. EPA–HQ–ORD–2010–0047, Development of
a Relative Potency Factor (RPF) Approach for Polycyclic Aromatic Hydrocarbon (PAH) Mixtures
and provide the following detailed comments. Some of these comments have also been
discussed briefly in the responses to the charge questions.
1. Assumption that PAHs Pose Carcinogenic Risk to Humans
1.1 Hazard Assessment of Individual PAHs in Humans
Recommendation: The U.S. Environmental Protection Agency (EPA) should ensure there is
correlation between cancer classifications and RPF values. There is insufficient human evidence
for all 27 PAHs classified by EPA or International Agency for Research on Cancer (IARC) with the
exception of benzo[a]pyrene (BaP). BaP is the only PAH that IARC has classified as Group 1. It
has an EPA-proposed RPF of 1, by definition. However, several PAHs that IARC has not
classified have RPFs that exceed BaP’s. In addition, several PAHs that IARC has classified as
only “possibly” carcinogenic in humans have RPFs that exceed 1.
EPA’s Integrated Risk Information System (IRIS) weight-of-evidence classifications for
individual PAHs are restricted to seven PAHs. However, IARC (2010) has classified 60 PAH
compounds as to their potential to cause cancer in humans, including BaP and the 27 PAHs
with proposed RPFs in EPA (2010). The following table summarizes both the EPA and the
IARC classifications.
As noted in the table, there is insufficient human evidence for all 27 PAHs classified by one or
both of these organizations with the exception of BaP.
Table 1. Carcinogenic Classifications of Individual PAHs
PAH
Anthanthrene
Proposed RPF IARC EPA
Classification Classification
0.4 3 NC
Anthracene 0 3 D
Benz[a]anthracene 0.2 2B B2
Benz[b,c]aceanthrylene, 11H 0.05 3 NC
Benzo[a]pyrene 1 1 B2
Benzo[b]fluoranthene 0.8 2B B2
Benzo[c]fluorene 20 3 NC
Benz[e]aceanthrylene 0.8 NC NC
Benzo[g,h,i]perylene 0.009 3 D
Benz[j]aceanthrylene 60 2B NC
Benzo[j]fluoranthene 0.3 2B NC
Comments on Development of a Relative Potency Factor (RPF) Approach for PAH Mixtures 1

Table 1. Carcinogenic Classifications of Individual PAHs
PAH
Benzo[k]fluoranthene
Proposed RPF IARC EPA
Classification Classification
0.03 2B B2
Benz[l]aceanthrylene 5 3 NC
Chrysene 0.1 2B B2
Cyclopenta[c,d]pyrene 0.4 2A NC
Cyclopenta[d,e,f]chrysene, 4H 0.3 3 NC
Dibenzo[a,e]fluoranthene 0.9 3 NC
Dibenzo[a,e]pyrene 0.4 3 NC
Dibenz[a,h]anthracene 10 2A B2
Dibenzo[a,h]pyrene 0.9 2B NC
Dibenzo[a,i]pyrene 0.6 2B NC
Dibenzo[a,l]pyrene 30 2A NC
Fluoranthene 0.08 3 D
Indeno[1,2,3-c,d]pyrene 0.07 2B B2
Naphtho[2,3-e]pyrene 0.3 3 NC
Phenanthrene 0 3 D
Pyrene 0 3 D
Notes: NC = not classified by Agency IARC Classification:
Group 1: The agent is carcinogenic to humans Group 2A: The agent is probably carcinogenic to humans Group 2B: The agent is possibly carcinogenic to humans Group 3: The agent is not classifiable as to its carcinogenicity to humans
EPA Classification: A: Known human carcinogen B1: Probable human carcinogen - indicates sufficient evidence in animals and limited evidence in
humans B2: Probable human carcinogen – indicates sufficient evidence in animals and inadequate or no
evidence in humans C: Possible human carcinogen D: Not classified as to human carcinogenicity based on no human data and inadequate animal data
1.2 EPA (2010) “Weight of Evidence” Evaluation
Recommendation: The rationale for each RPF proposed for each PAH should also include a
“weight of evidence for the carcinogenic hazard potential” evaluation as described with the 2005
Cancer Guidelines (e.g., “Likely to be Carcinogenic to Humans” or “Suggestive Evidence of
Carcinogenic Potential”). Examples of where this would add clarity and scientific credibility to the
proposed approach include the following:
Comments on Development of a Relative Potency Factor (RPF) Approach for PAH Mixtures 2

EPA indicates PAHs selected for inclusion in the RPF approach were initially chosen based on
an “evaluation of whether the available data were adequate to assess the carcinogenicity of
each compound.” (Chapter 6, page 113, paragraph 1). Based on this, 35 PAHs were identified
for further evaluation. EPA should clearly define “carcinogenicity” for this step within the
context of the relevant potential to be carcinogenic to humans with consideration of EPA’s
2005 Cancer Guidelines.
For example, EPA’s Cancer Guidelines state that chemicals classified as “Suggestive
Evidence of Carcinogenic Potential” generally do not have adequate data for a dose-response
assessment (Section 3. Dose Response Assessment). However, EPA notes in this section
that if there is a “well conducted” study, a quantitative assessment may be completed.
Including the classification may identify chemicals where study data may require greater
scrutiny before being used to determine the RPF or where data indicate that the proposed
RPF should be modified to reflect uncertainty
2. BaP as Index Chemical
Recommendation: EPA should update the toxicology risk assessment for BaP prior to finalizing
the PAH mixtures IRIS. At a minimum it should be consistent with current EPA 2005 Cancer
Guidelines before being used as a point of reference for the proposed RPF approach.
The proposed RPF approach appears to rely on the 1994 IRIS toxicological assessment for
benzo(a)pyrene. EPA states that PAHs included in the RPF weight of evidence “were
assumed to be carcinogenic due to toxicological similarity to the indicator compound,
benzo[a]pyrene.” (page iv and vii). Data do not support this assumption for all 35 PAHs
included in the analysis. The rationale should be justified within the context of study data and
the “weight of evidence for the carcinogenic hazard potential” to humans should be completed
and consistent with the 2005 Cancer guidelines for each PAH. A detailed analysis of data for
each PAH supporting and demonstrating the assumed “toxicological similarity” would add
clarity and credibility to the document.
3. Cancer Slope Factor (CSF) for Benzo[a]pyrene
Recommendation: EPA should update the current CSF of 7.3 (mg/kg/day)-1 using the Beland
and Culp (1998) and Culp et al. (1998) data as summarized by Gaylor et al. (2000).
The BaP CSF is the geometric mean of several cancer slope factors derived from two,
outdated studies, Neal and Rigdon (1967) and Brune et al. (1981). According to the current
IRIS profile for BaP, “The data are considered to be less than optimal, but acceptable.” In
addition, EPA (2010) states: “These studies were not conducted using standard, modern
toxicological methods and have several limitations, including inconsistent dosing
protocols; varying ages of the animals; use of benzene as a solvent; small numbers of
animals; and evaluation of only a limited number of tissues.”
There are several more recent studies available such as a Good Laboratory Practices (GLP)
study conducted at the National Center for Toxicological Research under EPA oversight
Comments on Development of a Relative Potency Factor (RPF) Approach for PAH Mixtures 3

=
(Beland and Culp 1998; Culp et al. 1998). As well Gaylor et al. (2000) derived a CSF using
multistage modeling for benzo[a]pyrene based on forestomach tumors, which was the most
sensitive toxicological endpoint. The CSF was 1.2 (mg/kg/day)-1 .
4. Omission of Studies Not Including BaP
Recommendation: EPA should include studies which contain pertinent PAH toxicology data
regardless of whether the studied PAH was tested in conjunction with BaP.
One of EPA’s selection criteria for inclusion of a scientific study in the RPF analysis was:
“Benzo[a]pyrene was tested simultaneously with another PAH.” Several papers excluded
because of this criterion which could provide useful information are discussed below for
illustrative purposes.
4.1 Wood et al. (1980)
[Wood, A.W., W. Levin, R.L. Chang, et al. 1980. Mutagenicity and tumor-initiating activity of
cyclopenta[c,d]pyrene and structurally related compounds. Cancer Res 40:642–649.]
In Wood et al. (1980) the tumorigenicity of CPcdP, BaA and CH were studied. Also in the
paper is a study of BaP. This study has utility despite that BaP was not concurrently tested
with the PAHs, because: (a) CPcdP was run concurrently with BaP in the paper’s Table 1
experiment, and (b) one can determine the relative potencies relative to another PAH, such as
chrysene, for which EPA assigns a RPF of 1.0.
Table 2. Effect of Wood et al. (1980) Data on RPF Derivation
EPA RPFs with Wood et al. (1980) Wood et al. (1980)
Chrysene 1 Incidence (2.5 umol) Multiplicity (2.5 umol)
CH 1 1 1
BaA 2 0.4 0.2
CPcdP 4 0.4 0.3
As noted above, EPA’s proposed RPFs conclude that the relative potency of these PAHs is
CPcdP > BaA > CH. However, Wood et al. (1980)’s relative potency is CH > BaA, CPcdP.
Clearly, this study yielded different results from the other papers that EPA relied on to derive
RPFs for these three PAHs.
4.2 Cavalieri et al. (1989)
[Cavalieri, E.L., E.G. Rogan, S. Higginbotham, et al. 1989. Tumor-initiating activity in mouse
skin and carcinogenicity in rat mammary gland of dibenzo[a]pyrenes: the very potent
environmental carcinogen dibenzo[a,l]pyrene. J Cancer Res Clin Oncol 115:67–72.]
Comments on Development of a Relative Potency Factor (RPF) Approach for PAH Mixtures 4

In Cavaleri et al. (1989), a tumorigenesis study with five PAHs of interest but not BaP. Both
incidence and multiplicity results are provided. EPA (2010) has rated dibenzo[a,h]pyrene very
similar in potency to BaP with a RPF of 0.9. Accordingly, all of the PAHs included in the study
can be normalized to dibenzo[a,h]pyrene to determine if the results from Cavaleri et al. (1989)
are similar to the EPA proposed RPFs. As noted below, the results for several PAHs are not
wholly inconsistent with EPA’s RPFs, but the results for dibenzo[a,l]pyrene (see bold font) are
inconsistent with the EPA’s reported results. If results from Cavaleri et al. (1989) were used in
the RPF derivation, the mean RPF would drop considerably from the proposed value of 30.
The results for AA were also inconsistent with the EPA-derived RPF of 0.4.
Table 3. Effect of Cavalieri et al. (1989) Data on RPF Derivation
PAH EPA RPF EPA RPF assuming
DB[a,h]P were 1.0
Cavaleri et al.
(1989) Incidence
Cavaleri et al. (1989)
Multiplicity
AA 0.4 0.4 0.03 0
DB[a,l]P 30 33 1.3 0.7
DB[a,h]P 0.9 1 1 1
DB[a,i]P 0.6 0.7 0.8 0.5
DB[a,e]P 0.4 0.4 0.2 0.04
4.3 Van Duuren et al. (1970)
[Van Duuren, B.L., A. Sivak, B.M. Goldschmidt, et al. 1970. Initiating activity of aromatic
hydrocarbons in two-stage carcinogenesis. J Natl Cancer Inst 44:1167–1173.]
In Van Duuren et al. (1970), tumorigenesis was studied with four PAHs of interest but not BaP.
The PAHs studied include DBacA, BaA, BghiP, and CH. EPA’s relative potency order is BaA >
CH > BghiP > DBacA. Van Duuren et al. (1970) showed a different order of relative potency:
DBacA > BaA > BghiP and in another experiment: CH > BaA > DBacA. It is also important to
note that EPA did not derive a RPF for DBacA because no animal tumorigenicity studies were
identified that passed EPA’s inclusion criteria. This study could have been used to derive a
RPF for this PAH.
4.4 Chang et al. (1982)
[Chang, R.L., W. Levin, A.W. Wood, et al. 1982. Tumorigenicity of bay-region diol-epoxides
and other benzo-ring derivatives of dibenzo[a,h]pyrene and dibenzo[a,i]pyrene on mouse skin
and in newborn mice. Cancer Res 42:25–29.]
In Chang et al. (1982), tumorigenesis was studied with two PAHs of interest but not BaP. The
PAHs are DBahP and DBaiP. These two PAHs are ones that have EPA-derived RPFs based
on a single study (Hoffmann and Wynder 1966). EPA’s RPFs are 0.9 for DBahP and 0.6 for
DBaiP from Hoffmann and Wynder’s study. Thus, DBahP is classified as 1.5 times more
potent than DBaiP.
Comments on Development of a Relative Potency Factor (RPF) Approach for PAH Mixtures 5

Chang et al. (1982) provides three dose groups for the mouse skin assay for the two PAHs
and one intraperitoneal (IP) dose group in the newborn mouse model. At the lowest dose, this
study would indicate that DBahP is 2 times more potent than DBaiP using incidence data and
1.9 times more potent using multiplicity data. These results are similar to EPA’s results from
the Hoffman and Wynder (1966) data and would be useful to present.
5. Protocol Issues
Recommendation: EPA should derive RFPs separately for each route of exposure based on the
available scientific data. However, EPA (2010) should not establish RFPs based on IP and lung
implantation studies because they have no relevance to human health.
Schneider et al. (2002) performed a comparison of relative potency factors derived from
various studies using different routes of exposure and found that cross route extrapolation is
not scientifically justified: “Evaluation of several studies with various PAH mixtures revealed
that the potency ratio between pure BAP and the PAH mixture in the same assay is highly
dependent on the exposure pathway and the target organ, therefore potency estimates for
PAH mixtures should be derived separately for oral, dermal and inhalation exposure using
data from studies with the relevant pathway.
5.1 Mouse Skin Assay
EPA (2010) has relied extensively on screening models for the source of the data that it used
for quantitative dose-response assessment and in particular it has relied extensively on
screening level mouse skin tumorigenicity studies quantitatively for RPF derivation. However,
according to the National Research Council (NRC 1993), the typical two-year rodent
carcinogenesis bioassay was designed to be a qualitative screening tool and was not
designed for quantitative dose-response modeling. Specifically, NRC (1993) states: “The
long-term animal bioassay for carcinogenicity was developed during the 1960s and early
1970s primarily as a qualitative screen for carcinogenic potential. Long-term animal bioassays
are now used regularly to determine whether chemical agents are capable of inducing cancer
in exposed animals. The bioassays are also commonly used as a basis for making qualitative
inferences about the likelihood that an agent poses a carcinogenic hazard for humans as well
(IARC, 1991).”
McKee et al. (1990) compared the dose-response curves two materials (10 assays of
benzo(a)pyrene and 12 assays of catalytically cracked clarified oil) and showed they were not
parallel. They concluded that if one is attempting to derive relative potency estimates between
and among PAHs, one should determine the slopes of the dose-response curves of both the
reference material and the test material. “If the experimentally determined dose-response
curves are not parallel, then the relative potency estimations will be dose-specific (i.e., the
ratio of the relative potencies of the two material will vary with dose).”
McKee et al. (1990) also showed that variations occur from dermal bioassay to dermal
bioassay for a single constituent (e.g., benzo(a)pyrene) that were much greater than variations
observed within a given assay. This variability may be attributable to a number of things and
Comments on Development of a Relative Potency Factor (RPF) Approach for PAH Mixtures 6

has the potential to significantly contribute to experimental error. Factors known to affect the
response in dermal bioassays include: application frequency (shown for coal liquids which are
severe dermal irritants); different vehicles have be associated with differences in tumor
responses in benzo(a)pyrene assays; housing conditions (such as number of animals per
cage, type of caging, and the temperature); and changes in animal sensitivity appear to occur
over time.
McKee et al. (1990) concluded: “Considerable uncertainty would be associated with any risk
estimate based on an extrapolation from experimental data obtained in epidermal
carcinogenesis studies.” EPA (1988) has also noted that background tumor rate and skin
toxicity must both be carefully considered during the design and execution of any
carcinogenesis study via the dermal route.
5.2 A/J Mouse Lung Adenoma Model
Another screening model that EPA (2010) used was the Strain A mouse lung adenoma assay
in which mice with extremely high spontaneous lung adenoma rates are employed. In this
screening assay, mice derived from Strain A, such as the A/J mouse, are given a high, IP
dose at the maximally tolerated dose level, and animals are observed for increases in
adenoma rates over the already high background rates.
Such an assay should not be used for quantitative dose-response assessment for several
reasons. The Strain A mice have high spontaneous rates of lung adenoma formation and are
very sensitive to carcinogenic agents. Humans have no similar tumor type, and the IP route of
administration has no relevance to human health.
According to Robinson et al. (1986), the A/J mouse strain, which was used for many of the
RPF derivations, is the most sensitive strain available for this type of assay: “…the A/J strain
is the most susceptible model for lung adenomas.” When they tested four mouse strains in
their laboratory for lung adenoma formation with several known animal carcinogens, they
confirmed that the A/J mouse strain was more sensitive than any other tested strain.
Adkins et al. (1986) reported that the background pulmonary adenoma rate in control Strain
A/J mice was 41.7% and that this spontaneous tumor rate was similar to the rates reported in
the literature. Adkins et al. (1986) also reported inconsistency in the results of the assay in
their hands. In Stoner’s laboratory over ten years Stoner (1991), the historical spontaneous
tumor rate in control animals varied from 25% to 32%.
Also, the mouse lung adenoma bioassay is carried out at extremely high doses that can cause
toxicity, including mortality. According to Stoner (1991), the Strain A lung tumor bioassay calls
for animals to be dosed at “the maximum single dose that all five mice tolerate (survive) for a
period of two weeks after receiving six i.p. injections (three injections per week).” After the
maximum tolerated dose (MTD) is established, the assay should be carried out with three
dose levels, the MTD, 50% MTD and 20% MTD with 30 mice per group. EPA (2010) used
both multiplicity and incidence data from such studies, although according to Stoner (1991),
Comments on Development of a Relative Potency Factor (RPF) Approach for PAH Mixtures 7

only tumor multiplicity should be used to determine if a chemical is carcinogenic in Strain A
mice.
In addition, the Strain A lung adenoma bioassay does not predict carcinogenicity well. As
stated in Maronpot (1991): “Fifty-nine chemicals that had completed National Cancer Institute
rat and mouse two-year carcinogenicity tests were tested in the Strain A mouse pulmonary
tumor assay…. The Strain A results were generally not predictive of the 2-year rat and mouse
carcinogenicity test results.”.” Based on such data, toxicologists have concluded that this
bioassay is a not a reliable predictor of carcinogenicity in humans. Clayson (1988) has stated
that “a number of bioassay systems for the identification of carcinogens are no longer
considered reliable indicators of possible carcinogenicity for humans. These include the lung
adenoma test in Strain A mice (8), the induction of bladder tumors in the presence of urinary
calculus (9), and bladder implantation (10,11).”
Similarly, Stoner (1991) also noted that this bioassay is not routinely used for carcinogenesis
testing stating: “In the past few years, the Strain A mouse lung tumor bioassay has come into
disfavor as a routine test for chemical carcinogens. This stems largely from the fact that, in a
National Cancer Institute sponsored study, the assay failed to detect the carcinogenic activity
of numerous compounds that were active in 2-year rodent bioassays…”
5.3 Lung Implantation Model
EPA (2010) derived RPFs for eight PAHs based on data from two lung implantation studies
from a single researcher. The papers are cited as Deutsch-Wenzel et al. (1983) and Wenzel-
Hartung et al. (1990). The implantation technique used in the study does not appear to reflect
the normal exposure pattern for humans. While it is possible for PAHs to be inhaled into the
human lung, the relevance of using the implantation technique noted in the study (i.e. injecting
a hot mixture of PAH-beeswax-triotanoin directly into the lung) is not evident. Deutsch-Wenzel
et al. (1983) noted that the “… the implantation of pellets containing environmental
carcinogens as an experimental model for studying pulmonary carcinogenesis also has
disadvantages...”
EPA’s Guidelines for Carcinogen Risk Assessment (EPA 2005) state that route of exposure
is an important consideration when assessing scientific data and making weight-of-evidence
judgments about the potential of substances to cause cancer in humans. EPA (2010)
acknowledges that route of exposure and site-of-entry tumor formation are important issues
and notes in the document that “”… cross-route extrapolation of RPFs is a significant source
of uncertainty in this approach.”
5.4 Numerical Methodology
Recommendation: EPA should not use the highest average RPFs from multiple target organs in
order to determine a final RPF, as this introduces a bias to the calculation.
EPA (2010) states that the range and average RPF for each PAH was calculated using the
following strategy. First, within a given animal study group (i.e. the same sex, route of
Comments on Development of a Relative Potency Factor (RPF) Approach for PAH Mixtures 8

administration and reference), if RPFs were calculated for multiple target organs, the highest
of the RPFs was chosen for inclusion in calculations. Then, if applicable, the higher of RPF
values calculated using incidence and multiplicity data for the study group was chosen. Lastly,
RPFs were arithmetically averaged across the various study groups to one significant figure.
This method appears to bias the calculation of the RPFs by choosing only the highest value.
EPA (2010) addressed the issue by performing a regression analysis relating paired incidence
and multiplicity RPFs, which resulted in an r2 value of 0.76. EPA concluded that the
relationship between incidence and multiplicity RPFs was adequate to justify using the higher
of the two for a given animal study group. However, there is little scientific justification in favor
of using the higher of RPFs from incidence and multiplicity data. Consequently, by using a
neutral numerical methodology, either incidence would be given more weight based on the
greater historical use of incidence data or the mean value from the two metrics would be used.
Of 23 PAHs assigned non-zero RPFs based on in vivo bioassay data, 12 were based on more
than two study groups (Table 7-1 in EPA 2010). In order to test the bias of the EPA method,
RPFs for these 12 PAHs were recalculated according to the following method:
For a given route of administration and reference, average incidence and multiplicity
RPFs for the same sex and target organ
Average RPFs for males and females for the same target organ
Average RPFs for all target organs
Average across routes of administration and references to one significant figure
Using this methodology, RPFs for benzo[k]fluoranthene, chrysene, cyclopenta[c,d]pyrene, and
dibenzo[a,l]pyrene remained the same, and RPFs for the other eight PAHs were slightly lower
than reported. As mentioned above, EPA (2010) determined that incidence and multiplicity
RPFs were similar for a given study group. In addition, only four PAHs had RPFs based on
studies in which data for multiple sexes or target organs for a single study group were
reported. Thus, the reduction in RPF using the new method above was generally small. The
exception is benzo[c]fluorene, which dropped from the proposed value of 20 to 10. This large
reduction is a result of the order-of-magnitude difference between incidence and multiplicity
RPFs calculated from the Weyand et al. (2004) oral bioassay, in which the incidence RPF was
5 while the multiplicity RPF (calculated from a point estimate) was 50.
Comments on Development of a Relative Potency Factor (RPF) Approach for PAH Mixtures 9

Table 4. Recalculation of Select RPFs Using Alternative Methodology
Analyte EPA (2010)
Range RPFs EPA (2010)
Average RPF Recalculation1 Change in
RPF
Benz[a]anthracene 0.02–0.4 0.2 0.1 Lower
Benzo[b]fluoranthene 0.1–2 0.8 0.6 Lower
Benzo[c]fluorene 1–50 20 10 Lower
Benz[e]aceanthrylene 0.6–0.9 0.8 0.7 Lower
Benzo[j]fluoranthene 0.01–1 0.3 0.2 Lower
Benzo[k]fluoranthene 0.03–0.03 0.03 0.03 Same
Benz[l]aceanthrylene 4–7 5 4 Lower
Chrysene 0.04–0.2 0.1 0.1 Same
Cyclopenta[c,d]pyrene 0.07–1 0.4 0.4 Same
Dibenz[a,h]anthracene 1–40 10 9 Lower
Dibenzo[a,l]pyrene 10–40 30 30 Same
Fluoranthene 0.009–0.2 0.08 0.07 Lower
Notes: 1 See text. RPFs are rounded to one significant figure per EPA (2010) procedures.
5.5 Transparency of Data Used
Recommendation: EPA should clearly document which RPFs are averaged to derive the final
RPF values.
EPA (2010) presents all derived RPFs in chemical-specific histogram figures, but not all of the
RPFs shown in those figures are averaged to derive the final RPF presented in Table 1 of
EPA 2010.
For instance, benzo(c)fluorene is reported as 20. Figure 6-9 (EPA 2010) show 4 RPFs from
one study, Weyand et al. (2004). According to Appendix E tables, the values are:
Oral multiplicity 48.9 IP multiplicity 0.56
Oral incidence 5.48 IP incidence 1.05
The total average of these four RPFs is 14.00. The combined average of the oral average and
the IP average is 14.01. However, EPA did not use all of the data when deriving the final
proposed RPF. They instead used the higher of the two oral values and the higher of the two
IP values. This is misleading and EPA should note on the histograms which RPFs are actually
averaged to derive the final RPF values.
5.6 Dependence of RPFs of “Low” Confidence or Few Studies
Recommendation: EPA should not finalize a RPF for any PAH that receives a “low confidence
or very low confidence rating.”
Comments on Development of a Relative Potency Factor (RPF) Approach for PAH Mixtures 10

According to EPA (2010), “Once a final RPF was derived for a given PAH, the resulting value
was assigned a relative confidence rating of high, medium, or low confidence. The relative
confidence rating characterized the nature of the database upon which the final RPF was
based. Confidence rankings were based on the robustness of the database. For final RPFs
based on tumor bioassay data, confidence ratings considered both the available tumor
bioassays and the availability of supporting data for cancer-related endpoints. The most
important factors that were considered included the availability of in vivo data and whether
multiple exposure routes were represented. Other database characteristics that were
considered included the availability of more than one in vivo study, and whether effects were
evident in more than one sex or species. Very low relative confidence was reserved for final
RPFs based on cancer-related endpoint data only (e.g., dibenz[a,c]anthracene). An RPF of
zero was only applied if the data implied high or medium relative confidence.”
EPA (2010) has rated 12 RPFs as low confidence and one as very low confidence. Ten of the
low confidences RPFs were derived from data from a single publication each. One publication,
(Hoffmann and Wynder 1966) was solely responsible for five RPFs and another publication
(Deutsch-Wenzel et al. 1983) was responsible for two RPFs. Thus, five specific publications
(Mass et al. 1993; Rice et al. 1988; Hoffmann and Wynder 1966; Deutsch-Wenzel et al. 1983;
and Nesnow et al. 1984) are solely responsible for ten RPFs.
Table 5. PAHs and RPFs with Low Confidence Ratings
Number Relative
PAH References (Positive Studies Only) of Confidence
Datasets
Benz[b,c]aceanthrylene, 11H Low 1 Rice et al. (1988)
Benz[e]aceanthrylene Low 2 Nesnow et al. (1984)
Benzo[g,h,i]perylene Low 1 Deutsch-Wenzel et al. (1983)
Benz[j]aceanthrylene Low 1 Mass et al. (1993)
Benz[l]aceanthrylene Low 2 Nesnow et al. (1984)
Cyclopenta[d,e,f]chrysene, 4H Low 2 Rice et al. (1985), Rice et al. (1988)
Dibenzo[a,e]fluoranthene Low 2 Hoffmann and Wynder (1966)
Dibenzo[a,e]pyrene Low 2 Hoffmann and Wynder (1966)
Dibenzo[a,h]pyrene Low 1 Hoffmann and Wynder (1966)
Dibenzo[a,i]pyrene Low 2 Hoffmann and Wynder (1966)
Fluoranthene Low 5 Busby et al. (1984), LaVoie et al. (1994), Busby et al. (1989)
Indeno[1,2,3-c,d]pyrene Low 1 Deutsch-Wenzel et al. (1983)
Naphtho[2,3-e]pyrene Low 1 Hoffmann and Wynder (1966)
Comments on Development of a Relative Potency Factor (RPF) Approach for PAH Mixtures 11
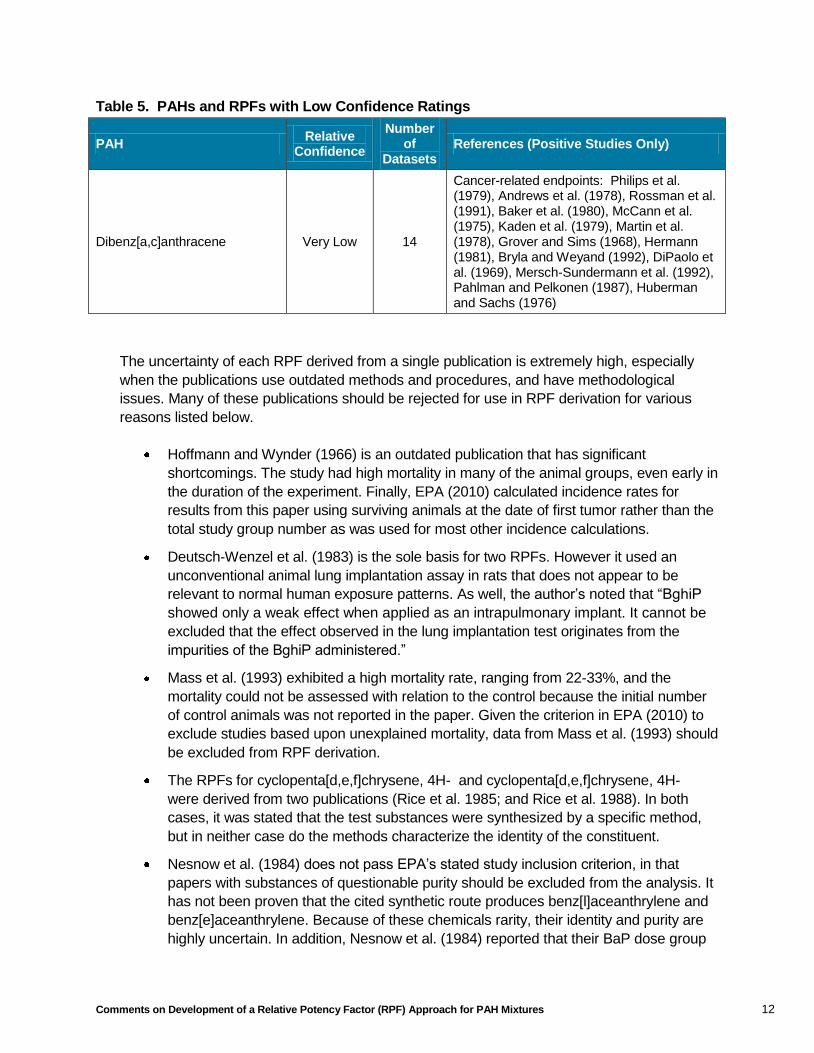
Table 5. PAHs and RPFs with Low Confidence Ratings
Number Relative
PAH References (Positive Studies Only) of Confidence
Datasets
Dibenz[a,c]anthracene Very Low 14
Cancer-related endpoints: Philips et al. (1979), Andrews et al. (1978), Rossman et al. (1991), Baker et al. (1980), McCann et al. (1975), Kaden et al. (1979), Martin et al. (1978), Grover and Sims (1968), Hermann (1981), Bryla and Weyand (1992), DiPaolo et al. (1969), Mersch-Sundermann et al. (1992), Pahlman and Pelkonen (1987), Huberman and Sachs (1976)
The uncertainty of each RPF derived from a single publication is extremely high, especially
when the publications use outdated methods and procedures, and have methodological
issues. Many of these publications should be rejected for use in RPF derivation for various
reasons listed below.
Hoffmann and Wynder (1966) is an outdated publication that has significant
shortcomings. The study had high mortality in many of the animal groups, even early in
the duration of the experiment. Finally, EPA (2010) calculated incidence rates for
results from this paper using surviving animals at the date of first tumor rather than the
total study group number as was used for most other incidence calculations.
Deutsch-Wenzel et al. (1983) is the sole basis for two RPFs. However it used an
unconventional animal lung implantation assay in rats that does not appear to be
relevant to normal human exposure patterns. As well, the author’s noted that “BghiP
showed only a weak effect when applied as an intrapulmonary implant. It cannot be
excluded that the effect observed in the lung implantation test originates from the
impurities of the BghiP administered.”
Mass et al. (1993) exhibited a high mortality rate, ranging from 22-33%, and the
mortality could not be assessed with relation to the control because the initial number
of control animals was not reported in the paper. Given the criterion in EPA (2010) to
exclude studies based upon unexplained mortality, data from Mass et al. (1993) should
be excluded from RPF derivation.
The RPFs for cyclopenta[d,e,f]chrysene, 4H- and cyclopenta[d,e,f]chrysene, 4H
were derived from two publications (Rice et al. 1985; and Rice et al. 1988). In both
cases, it was stated that the test substances were synthesized by a specific method,
but in neither case do the methods characterize the identity of the constituent.
Nesnow et al. (1984) does not pass EPA’s stated study inclusion criterion, in that
papers with substances of questionable purity should be excluded from the analysis. It
has not been proven that the cited synthetic route produces benz[l]aceanthrylene and
benz[e]aceanthrylene. Because of these chemicals rarity, their identity and purity are
highly uncertain. In addition, Nesnow et al. (1984) reported that their BaP dose group
Comments on Development of a Relative Potency Factor (RPF) Approach for PAH Mixtures 12

had incidence and multiplicity rates that were “low compared to previously published
reports.” Similarly for tumor multiplicity, the observed multiplicity was 1.4
tumors/mouse for males and 1.5 tumors/mouse for females compared to a historical
range of 1.5-8.4 tumors/mouse.
5.7 Point Estimate Methodology and Benchmark Dose Model Fits
Recommendation: EPA should document the criteria for defining a “poor fit” or a “good fit” of the
data in the Benchmark Dose Modeling.
When Benchmark Dose Modeling of multi-dose results provided a “poor fit,” EPA’s protocol
required that “point estimates” from single dose groups be used for RPF derivation instead of
slope factors using modeling of the entire dataset. This protocol is noted in Section 5.4 of EPA
2010. However, EPA does not provide criteria for defining a “good fit” of the data. The
Benchmark Dose Software generates three goodness-of-fit metrics to guide in the selection of
the optimal model. There is no identified criterion to judge “fitness,” and EPA’s decision
strategy is not documented. Tables in EPA’s Appendix E report in some cases that there was
“no model fit,” but the criteria for making this determination are not provided, nor are the
BMDS outputs.
5.7.1 Benchmark Dose Model Fit Validation
EPA (2010) used the Benchmark Dose Modeling Software (BMDS) to calculate benchmark
doses (BMDs). In many cases, the point estimate approach instead of the BMD approach
because EPA (2010) reported that a good fit to the data was not found. A validation exercise
was undertaken by the undersigned to determine if the lack of a “good fit” was due to EPA’s
protocol, which used the multistage model for quantal data sets and the linear model for
continuous data sets. Consistent with EPA guidance on model selection, all relevant fit criteria
were evaluated including visual inspection of the dose-response curve, the range of BMD
estimates among candidate models, inspection of the maximum scaled residual (particularly
among the low dose group), p-value of the chi-square test, AIC values, and hypothesis test
results (p-values) for continuous datasets (i.e., Tests 1 to 4). This validation found that EPA
excluded acceptable model fits with other models available in the BMDS and instead used the
point estimate approach. Use of this approach ignores a full dose-response curve for those
experiments with multiple dose groups. In several cases this affected the calculated RPFs.
Some examples of validated model fits to determine if it was possible to derive RPFs based
on BMDs noted below and BMDS outputs are presented in Appendix C.
5.7.2 Mass et al. (1993)
EPA (2010) used the point estimate approach for modeling BaP and BjAC data from Mass et
al. (1993) because they stated that there was “no model fit.” A validation exercise of BMDS
modeling found that the data for BaP acceptably fit three models, including Hill, exponential 5,
and linear. The average BMD at BMR=0.1 from the three models was 40.3 mg/kg/day. For
BjAC, BMDS revealed acceptable fits for four models, including exponential 4, linear,
polynomial, and power. The average BMD at BMR=0.1 from the four models was 4
mg/kg/day. The RPF for BjAC using the BMDS modeling would be 10, instead of EPA’s RPF
Comments on Development of a Relative Potency Factor (RPF) Approach for PAH Mixtures 13
of 59. This is a significant difference in RPF. By using the full dataset and comparing two full
dose-response curves, the RPF is 10. When EPA defaulted to comparing two points on the
dose-response curves, the derived RPF was 59.
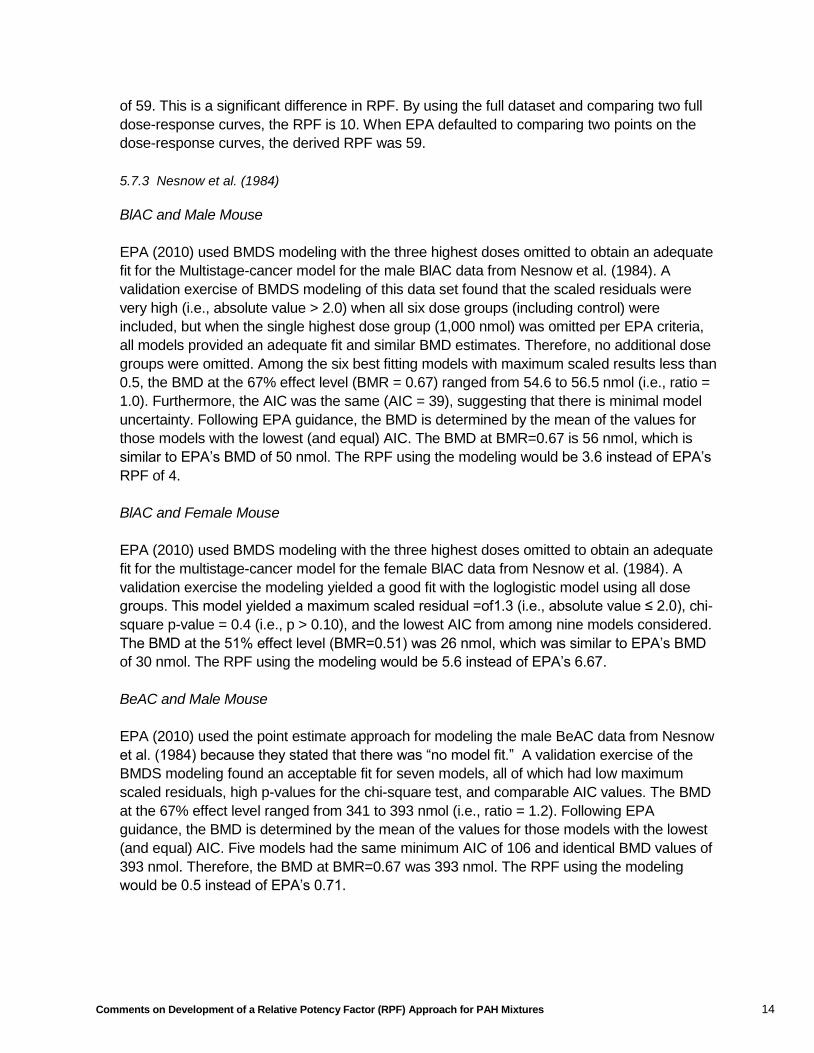
5.7.3 Nesnow et al. (1984)
BlAC and Male Mouse
EPA (2010) used BMDS modeling with the three highest doses omitted to obtain an adequate
fit for the Multistage-cancer model for the male BlAC data from Nesnow et al. (1984). A
validation exercise of BMDS modeling of this data set found that the scaled residuals were
very high (i.e., absolute value > 2.0) when all six dose groups (including control) were
included, but when the single highest dose group (1,000 nmol) was omitted per EPA criteria,
all models provided an adequate fit and similar BMD estimates. Therefore, no additional dose
groups were omitted. Among the six best fitting models with maximum scaled results less than
0.5, the BMD at the 67% effect level (BMR = 0.67) ranged from 54.6 to 56.5 nmol (i.e., ratio =
1.0). Furthermore, the AIC was the same (AIC = 39), suggesting that there is minimal model
uncertainty. Following EPA guidance, the BMD is determined by the mean of the values for
those models with the lowest (and equal) AIC. The BMD at BMR=0.67 is 56 nmol, which is
similar to EPA’s BMD of 50 nmol. The RPF using the modeling would be 3.6 instead of EPA’s
RPF of 4.
BlAC and Female Mouse
EPA (2010) used BMDS modeling with the three highest doses omitted to obtain an adequate
fit for the multistage-cancer model for the female BlAC data from Nesnow et al. (1984). A
validation exercise the modeling yielded a good fit with the loglogistic model using all dose
groups. This model yielded a maximum scaled residual =of1.3 (i.e., absolute value ≤ 2.0), chi-
square p-value = 0.4 (i.e., p > 0.10), and the lowest AIC from among nine models considered.
The BMD at the 51% effect level (BMR=0.51) was 26 nmol, which was similar to EPA’s BMD
of 30 nmol. The RPF using the modeling would be 5.6 instead of EPA’s 6.67.
BeAC and Male Mouse
EPA (2010) used the point estimate approach for modeling the male BeAC data from Nesnow
et al. (1984) because they stated that there was “no model fit.” A validation exercise of the
BMDS modeling found an acceptable fit for seven models, all of which had low maximum
scaled residuals, high p-values for the chi-square test, and comparable AIC values. The BMD
at the 67% effect level ranged from 341 to 393 nmol (i.e., ratio = 1.2). Following EPA
guidance, the BMD is determined by the mean of the values for those models with the lowest
(and equal) AIC. Five models had the same minimum AIC of 106 and identical BMD values of
393 nmol. Therefore, the BMD at BMR=0.67 was 393 nmol. The RPF using the modeling
would be 0.5 instead of EPA’s 0.71.
Comments on Development of a Relative Potency Factor (RPF) Approach for PAH Mixtures 14

BeAC and Female Mouse
EPA (2010) used BMDS modeling with the two highest doses omitted to obtain an adequate fit
for the multistage-cancer model for the female BeAC data from Nesnow et al. (1984). A
validation exercise of the BMDS modeling found an acceptable fit for eight models, all of which
had low maximum scaled residuals, high p-values for the chi-square test, and comparable AIC
values. The BMD was relatively consistent among these models, ranging from 297 to 537
nmol (ratio = 1.8). The loglogistic model, with the lowest AIC of 126, yielded a BMD at
BMR=0.51 of 297 nmol. The RPF using the modeling would be 0.67 instead of EPA’s 0.88.
5.7.4 Habs et al. (1980)
EPA (2010) used the point estimate approach for modeling BaP data from Habs et al. (1980)
because they stated that there was “no model fit.” A validation exercise of the BMDS
modeling found an acceptable fit for eight models when the highest dose was omitted per EPA
criteria. The best fits were with the gamma, loglogistic, logprobit, and Weibull models, because
they had the lowest maximum scaled residuals, low AICs, and the highest p-values on the chi-
squared test. Thus, the full dose-response curve could have been used for RPF derivation.
5.7.5 LaVoie et al. (1982)
EPA (2010) used the point estimate approach for modeling BbF and BjF data from LaVoie et
al. (1982), because they stated that there was “no model fit.” A validation exercise of the
BMDS modeling found a model fit for both PAHs with the loglogistic model. With the highest
dose removed from the analysis, the model fit was acceptable with eight models for BbF and
with seven models for BjF. Thus, the full dose-response curve could have been used for RPF
derivation.
5.7.6 Rice et al. (1988)
EPA (2010) used the point estimate approach for modeling CH and BbcAC data from Rice et
al. (1988) because they stated that there was “no model fit.” A validation exercise of the
BMDS modeling found that the data for CH provide an acceptable fit for the loglogistic model.
With the highest dose omitted, BDMS provides an acceptable fit for eight models including the
multistage model. The BMD for CH varied from 0.09 to 0.1 umol/animal among the model
results showing acceptable fit. For BbcAC, an acceptable fit was found with the loglogistic
model. Thus, the full dose-response curve could have been used for RPF derivation for these
two PAHs.
5.7.7 Busby et al. (1984)
EPA (2010) used the point estimate approach for modeling BaP and FA data from Busby et al.
(1984) because they stated that there was “no model fit.” A validation exercise of the BMDS
modeling found for both the male and female groups that BaP data was acceptably fit by the
Exponential 4 and Polynomial models. For FA, BMDS showed an acceptable fit for six models
including the linear model in males. For females, there was an acceptable fit for six models
Comments on Development of a Relative Potency Factor (RPF) Approach for PAH Mixtures 15
including the linear model. Thus, the full dose-response curve could have been used for RPF
derivation for these two PAHs.
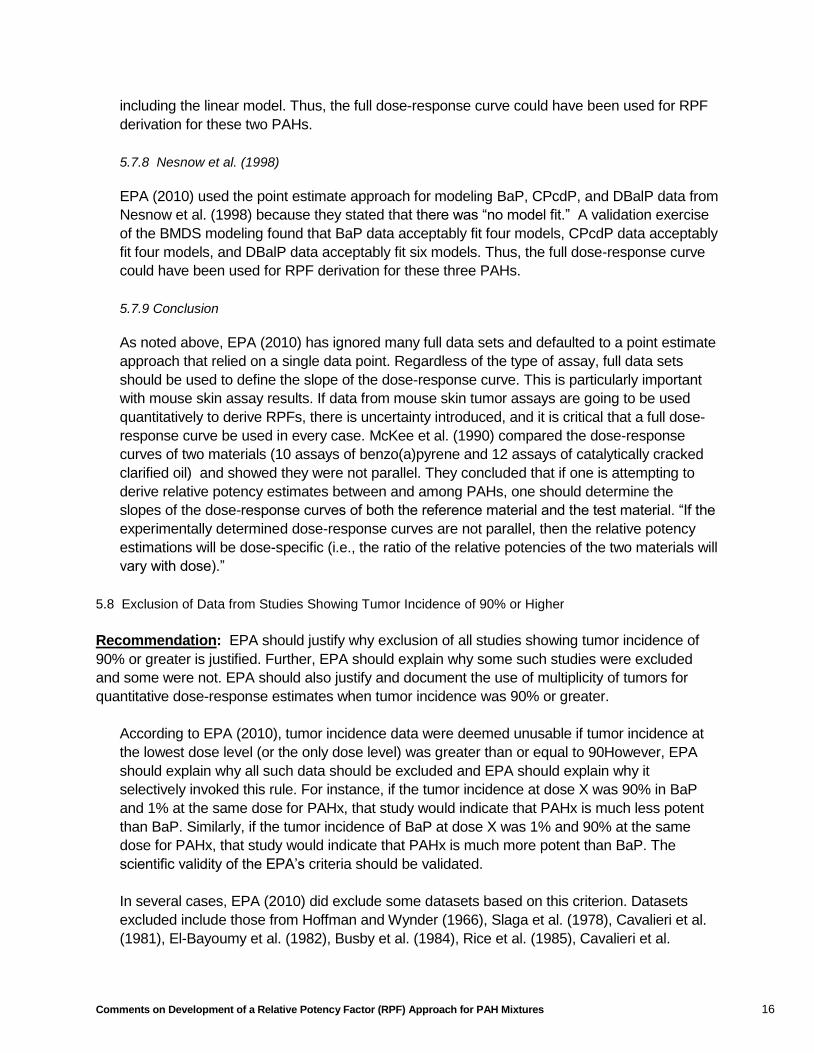
5.7.8 Nesnow et al. (1998)
EPA (2010) used the point estimate approach for modeling BaP, CPcdP, and DBalP data from
Nesnow et al. (1998) because they stated that there was “no model fit.” A validation exercise
of the BMDS modeling found that BaP data acceptably fit four models, CPcdP data acceptably
fit four models, and DBalP data acceptably fit six models. Thus, the full dose-response curve
could have been used for RPF derivation for these three PAHs.
5.7.9 Conclusion
As noted above, EPA (2010) has ignored many full data sets and defaulted to a point estimate
approach that relied on a single data point. Regardless of the type of assay, full data sets
should be used to define the slope of the dose-response curve. This is particularly important
with mouse skin assay results. If data from mouse skin tumor assays are going to be used
quantitatively to derive RPFs, there is uncertainty introduced, and it is critical that a full dose-
response curve be used in every case. McKee et al. (1990) compared the dose-response
curves of two materials (10 assays of benzo(a)pyrene and 12 assays of catalytically cracked
clarified oil) and showed they were not parallel. They concluded that if one is attempting to
derive relative potency estimates between and among PAHs, one should determine the
slopes of the dose-response curves of both the reference material and the test material. “If the
experimentally determined dose-response curves are not parallel, then the relative potency
estimations will be dose-specific (i.e., the ratio of the relative potencies of the two materials will
vary with dose).”
5.8 Exclusion of Data from Studies Showing Tumor Incidence of 90% or Higher
Recommendation: EPA should justify why exclusion of all studies showing tumor incidence of
90% or greater is justified. Further, EPA should explain why some such studies were excluded
and some were not. EPA should also justify and document the use of multiplicity of tumors for
quantitative dose-response estimates when tumor incidence was 90% or greater.
According to EPA (2010), tumor incidence data were deemed unusable if tumor incidence at
the lowest dose level (or the only dose level) was greater than or equal to 90However, EPA
should explain why all such data should be excluded and EPA should explain why it
selectively invoked this rule. For instance, if the tumor incidence at dose X was 90% in BaP
and 1% at the same dose for PAHx, that study would indicate that PAHx is much less potent
than BaP. Similarly, if the tumor incidence of BaP at dose X was 1% and 90% at the same
dose for PAHx, that study would indicate that PAHx is much more potent than BaP. The
scientific validity of the EPA’s criteria should be validated.
In several cases, EPA (2010) did exclude some datasets based on this criterion. Datasets
excluded include those from Hoffman and Wynder (1966), Slaga et al. (1978), Cavalieri et al.
(1981), El-Bayoumy et al. (1982), Busby et al. (1984), Rice et al. (1985), Cavalieri et al.
Comments on Development of a Relative Potency Factor (RPF) Approach for PAH Mixtures 16

(1991), and Weyand et al. (1992). Use of this criterion truncated the available datasets for
benz[a]anthracene, benzo[j]fluoranthene, chrysene, cyclopenta[c,d]pyrene, 4H
cyclopenta[d,e,f]chrysene, dibenzo[a,h]pyrene, dibenzo[a,l]pyrene, and fluoranthene.
Furthermore, EPA should explain why they did not use the criterion for data on
benzo[c]fluorene from Weyand et al. (2004). Incidence data from an intraperitoneal study in
Weyand et al. (2004) were included in the RPF calculations for benzo[c]fluorene even though
the tumor incidence of benzo[a]pyrene at the only dose level, 100 mg/kg, was 90% and the
tumor incidence for benzo[c]fluorene was 92%.
As noted above, EPA included the use of tumor incidence data in quite a few cases when
tumor incidence is 90% or greater, but in the same cases, EPA made use of the multiplicity
data. It is not clear that multiplicity of tumors is informative in these cases.
5.9 Role of Cancer-related Endpoints
Recommendation: EPA should not use derived RPFs from cancer-related endpoints when
deriving a final RPF value, as was the case in generating the RPF for dibenz[a,c]anthracene.
EPA (2010) has derived quantitative RPFs from a variety of cancer-related endpoints.
However, using DNA adduct, DNA damage, mutagenicity and cell transformation studies, is
inappropriate for quantitative dose-response assessment and the use of RPFs derived from
cancer-related are not suitable for use in quantitative human health risk assessment.
Consequently, EPA has not used RPFs derived from cancer-related endpoints to calculate
the final RPF except for one substance, dibenz[a,c]anthracene.
According to EPA, DBacA has no tumorigenicity assays and EPA has derived an RPF of 4
based entirely on DNA adduct, DNA damage, mutagenicity and cell transformation studies.
The range of calculated RPFs was 0.04 to 50 and EPA rated the confidence “very low.” Of
the 14 studies reviewed, eight were single dose studies and of the six multiple dose studies,
all were in vitro studies (bacterial mutagenicity, DNA damage, and DNA adduct formation).
Slaga et al. (1980) studied DBacA and found it to be negative for mouse skin tumors. This
study met EPA’s inclusion criteria and is listed on EPA’s Table 4-1. Results from this study
were used for CH and DBahA. Table 4-1 lists BeP and DBacA as “nonpositive.” However,
neither negative result is reported in EPA’s figures, Figure 6-11 for BeP or Figure 6-22 for
DBacA.
As well, EPA 2010 states “There were 15 datasets for dibenz[a,c]anthracene that met
selection criteria and included benzo[a]pyrene (Figure 6-22).” “In at least one study,
benzo[k]fluoranthene, benz[l]aceanthrylene, 4 benz[e]aceanthrylene, naphtho[2,3-e]pyrene,
dibenz[a,h]anthracene, dibenz[a,c]anthracene, and 5 benz[b,c]aceanthrylene showed
positive initiating activity. Nonpositive results were reported for pyrene, perylene,
benzo[g,h,i]fluoranthene, fluoranthene, anthanthrene, dibenzo[e,l]pyrene,
benzo[g,h,i]perylene, indeno[1,2,3-c,d]pyrene, benzo[e]pyrene, anthracene, 2,3-acepyrene,
and phenanthrene.” However, DBacA was negative in dermal bioassays and the above
quotation fails to take into account the three negative mouse skin bioassay results that EPA
Comments on Development of a Relative Potency Factor (RPF) Approach for PAH Mixtures 17

notes as “Conflicting results were reported in three dermal initiation bioassays of
dibenz[a,c]anthracene in which benzo[a]pyrene was not included.”
It is unjustified to use in vitro mutagenicity, DNA damage and other cancer “related”
bioassay results to conclude that a substance is carcinogenic to humans when at least four
studies reported by EPA have shown that the substance is not tumorigenic in the mouse
skin bioassay. Thus, EPA has ignored four in vivo negative studies in the mouse and
derived RPFs exclusively from cancer-related endpoints.
5.10 Concurrent BaP Control
Recommendation: EPA should be diligent about following any criteria it sets to determine
studies for inclusion in the RFP approach, and it should apply its criteria equally across all data
sets.
According to EPA (2010), the first criterion for study selection was that “benzo[a]pyrene was
tested simultaneously with another PAH.” Simultaneity was defined as testing in the same
laboratory with the same protocol at the same time. Thus, for most studies in EPA’s Tables 4
1 through 4-5, which summarize bioassays involving benzo[a]pyrene and at least one other
PAH, studies with comments indicating that reviewers could not be sure whether
benzo[a]pyrene was tested concurrently with another PAH failed to meet selection criteria.
However, when calculating RPFs, EPA made exceptions to its criterion for Slaga et al. (1980)
and Rice et al. (1988):
“In a number of reports, it appears that bioassays were done in batches and reported in a
single publication. In these cases, it appears that benzo[a]pyrene treatment may not have
been undertaken concurrently with all of the compounds in the report. For some of these
studies (Horton and Christian, 1974; Bingham and Falk, 1969), there are differences in the
choice of vehicle or promoter, or other issues that argue against using the benzo[a]pyrene
data for direct comparison. In several other studies, however (Rice et al., 1988; Slaga et
al., 1980; Van Duuren and Goldschmidt, 1976; Wynder and Hoffmann, 1959), the
protocols (including vehicle and promoting agent) appear to have been the same.”
Slaga et al. (1980) reported the results of dermal initiation experiments in mice in several
different tables. While there was only one protocol described in the materials and methods
section, implying that all work was performed the same way in the same laboratory, results for
benzo[a]pyrene, chrysene, and dibenz[a,h]anthracene were each reported in a separate table
with a separate control. Whether the results for the three PAHs meet EPA selection criteria
then depends on a subjective interpretation of testing simultaneity – the same time or the
same approximate time period. The PAHs were tested in three different batches and were
compared to different controls which, implies that the batches were considered separate
and/or were not tested at the exact same time. Such a circumstance would preclude use of
the study data for the calculation of RPFs for chrysene and dibenz[a,h]anthracene.
Rice et al. (1988) reported the results of dermal initiation experiments in mice in a single table.
However, the results state that 11H-benz[b,c]aceanthrylene (designated 1,12-MBA) was
Comments on Development of a Relative Potency Factor (RPF) Approach for PAH Mixtures 18

evaluated in a different bioassay than chrysene and 4H-cyclopenta[d,e,f]chrysene (designated
4,5-MC). In Table 1 of Rice et al. (1988), separate acetone controls were reported for each
bioassay, and benzo[a]pyrene was only reported with 11H-benz[b,c]aceanthrylene. As with
Slaga et al. (1980), results for chrysene and 4H-cyclopenta[d,e,f]chrysene may not strictly
meet EPA selection criteria and should not be used to calculate RPFs if they were tested in a
different batch than benzo[a]pyrene and compared to a different control, which implies that
they were not tested at the same time as benzo[a]pyrene.
5.11 Suitability of Data Sets for Dose-Response Modeling
Recommendation: EPA should only use data sets for RPF derivation which are suitable for dose-response slope factor derivation.
EPA (2010) derived the RPFs by comparing the tumorigenic potency of two PAHs in the form
of a ratio of two slopes of two dose-response curves from screening levels bioassays, such as
the mouse two-stage skin model. Out of 43 data sets, 16 (37%) had multiple doses for both
BaP and the PAH of interest. In these cases, assuming that there were “good model fits,” two
dose-response curve slopes could be compared. However, out of these 43 data sets, 12
(28%) had a single BaP dose group and a single dose group for one or more PAHs of interest.
15 (35%) had multiple dose groups for PAHs of interest but only a single dose group for BaP.
So, fully 63% of the data sets EPA used for RPF derivation were unsuitable for dose-response
slope factor derivation. In these cases either one or both of the slope factors was derived
using a single data point and assuming that the dose-response curve was linear to the origin,
regardless of whether the tumor incidence at that single dose was 1%, 50% or 85%.
Taking EPA’s actual protocol into account, a review of the data sets finds that of the 43 data
sets:
18 (42%) used a single BaP dose and single doses for other PAHs
13 (30%) used a single BaP dose and a dose-response curve for other PAHs
12 (28%) used a dose-response curve for BaP dose and a dose-response curve for
other PAHs
Thus, EPA based 72% of the RPFs on ratios of “slopes” that were derived using a single data
point for one or both of the PAHs being compared.
Table 6. Number of Dose Groups for EPA Data Sets
Study
Number
of BaP
Doses
Number
of Doses
for Other
PAHs
Study
Number
of BaP
Doses
Number
of Doses
for Other
PAHs
Habs et al. 1980 3 3 Rice et al. 1985 1 1
Cavalieri et al. 1983 3 3 Cavalieri et al. 1991 3 3
Hoffmann and Wynder 1966 2 2 Cavalieri et al. 1991 3 3
Comments on Development of a Relative Potency Factor (RPF) Approach for PAH Mixtures 19

Table 6. Number of Dose Groups for EPA Data Sets
Study
Number
of BaP
Doses
Number
of Doses
for Other
PAHs
Study
Number
of BaP
Doses
Number
of Doses
for Other
PAHs
Cavalieri et al. 1977 1 1 Wood et al. 1980 2 2
LaVoie et al. 1982 1 3 Hoffmann et al. 1972 1 1
Hecht et al. 1974 1 1 Nesnow et al. 1984 1 1
Nesnow et al. 1984 1 4 Busby et al. 1989 1 2
Slaga et al. 1980 1 1 LaVoie et al. 1987 1 1
Raveh et al. 1982 5 3 LaVoie et al. 1994 1 2
Hoffmann and Wynder 1966 1 3 Nesnow et al. 1998 5 5
Cavalieri et al. 1981b 1 3 Wislocki et al. 1986 1 2
Rice et al. 1988 1 3 Busby et al. 1989 1 2
Cavalieri et al. 1983 3 3 LaVoie et al. 1994 1 2
Cavalieri et al. 1981b 3 3 Wislocki et al. 1986 1 3
LaVoie et al. 1982 1 3 Busby et al. 1984 2 2
Hecht et al. 1974 1 1 Nesnow et al. 1998 5 5
Slaga et al. 1980 1 1 Mass et al. 1993 3 3
Raveh et al. 1982 5 3 Weyand et al. 2004 1 1
Cavalieri et al. 1981 1 3
Slaga et al. 1978 1 1 Deutsch-Wenzel et al. 1983 3 3
Weyand et al. 1992 1 3 Wenzel-Hartung et al. 1990 3 3
El-Bayoumy et al. 1982 1 1 Weyand et al. 2004 1 2
Notes: Red = data sets evaluated with one dose of BaP and one dose of other PAHs (Total of 12) Blue = data sets evaluated with one dose of BaP and more than one dose of other PAHs (Total of 15) Black = data sets evaluated with more than one dose of BaP and more than one dose of other PAHs
(Total of 16)
6. Exceedance of Maximum Tolerated Dose
Recommendation: EPA should exclude data sets data from experiments performed above the
maximum tolerated dose (MTD) from quantitative dose-response assessments.
Many of the studies were carried out at doses that exceeded the MTD. In accordance with
EPA (2005) policy, data from experiments performed above the MTD should be excluded from
quantitative dose-response assessment. Specifically, EPA (2005) states:
“In general, while effects seen at the highest dose tested are assumed to be appropriate
for assessment, it is necessary that the experimental conditions be scrutinized. Animal
studies are conducted at high doses in order to provide statistical power, the highest dose
Comments on Development of a Relative Potency Factor (RPF) Approach for PAH Mixtures 20
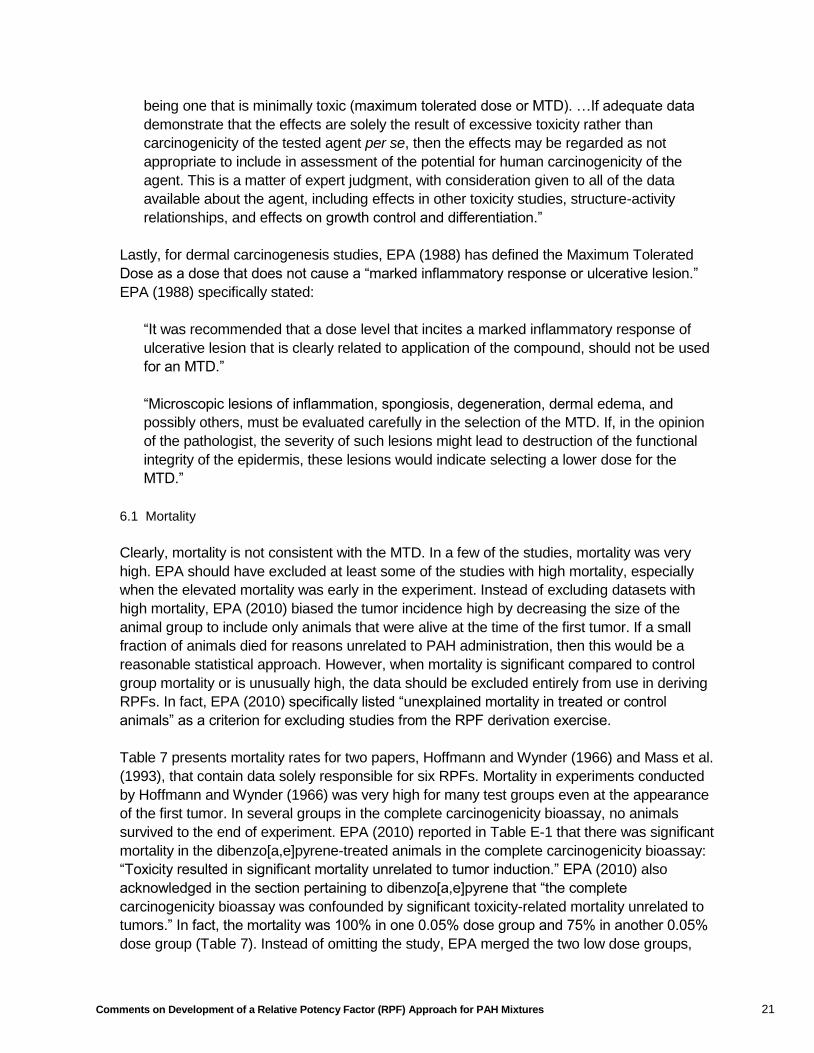
being one that is minimally toxic (maximum tolerated dose or MTD). …If adequate data
demonstrate that the effects are solely the result of excessive toxicity rather than
carcinogenicity of the tested agent per se, then the effects may be regarded as not
appropriate to include in assessment of the potential for human carcinogenicity of the
agent. This is a matter of expert judgment, with consideration given to all of the data
available about the agent, including effects in other toxicity studies, structure-activity
relationships, and effects on growth control and differentiation.”
Lastly, for dermal carcinogenesis studies, EPA (1988) has defined the Maximum Tolerated
Dose as a dose that does not cause a “marked inflammatory response or ulcerative lesion.”
EPA (1988) specifically stated:
“It was recommended that a dose level that incites a marked inflammatory response of
ulcerative lesion that is clearly related to application of the compound, should not be used
for an MTD.”
“Microscopic lesions of inflammation, spongiosis, degeneration, dermal edema, and
possibly others, must be evaluated carefully in the selection of the MTD. If, in the opinion
of the pathologist, the severity of such lesions might lead to destruction of the functional
integrity of the epidermis, these lesions would indicate selecting a lower dose for the
MTD.”
6.1 Mortality
Clearly, mortality is not consistent with the MTD. In a few of the studies, mortality was very
high. EPA should have excluded at least some of the studies with high mortality, especially
when the elevated mortality was early in the experiment. Instead of excluding datasets with
high mortality, EPA (2010) biased the tumor incidence high by decreasing the size of the
animal group to include only animals that were alive at the time of the first tumor. If a small
fraction of animals died for reasons unrelated to PAH administration, then this would be a
reasonable statistical approach. However, when mortality is significant compared to control
group mortality or is unusually high, the data should be excluded entirely from use in deriving
RPFs. In fact, EPA (2010) specifically listed “unexplained mortality in treated or control
animals” as a criterion for excluding studies from the RPF derivation exercise.
Table 7 presents mortality rates for two papers, Hoffmann and Wynder (1966) and Mass et al.
(1993), that contain data solely responsible for six RPFs. Mortality in experiments conducted
by Hoffmann and Wynder (1966) was very high for many test groups even at the appearance
of the first tumor. In several groups in the complete carcinogenicity bioassay, no animals
survived to the end of experiment. EPA (2010) reported in Table E-1 that there was significant
mortality in the dibenzo[a,e]pyrene-treated animals in the complete carcinogenicity bioassay:
“Toxicity resulted in significant mortality unrelated to tumor induction.” EPA (2010) also
acknowledged in the section pertaining to dibenzo[a,e]pyrene that “the complete
carcinogenicity bioassay was confounded by significant toxicity-related mortality unrelated to
tumors.” In fact, the mortality was 100% in one 0.05% dose group and 75% in another 0.05%
dose group (Table 7). Instead of omitting the study, EPA merged the two low dose groups,
Comments on Development of a Relative Potency Factor (RPF) Approach for PAH Mixtures 21

which yielded a pooled mortality of 88%, and used the data anyway to calculate an RPF. This
procedure is suspect and does not diminish the high uncertainty surrounding the RPF for this
substance due to high experimental mortality. Mortality in the initiation bioassay was also high
for the control group, which suggests a noncarcinogenic cause of mortality.
As well the mortality data in Mass et al. (1993) appears high but could not be assessed with
relation to the controls because the initial number of control animals was not reported in the
paper. Given the criterion in EPA (2010) to exclude studies based upon unexplained mortality,
data from neither Hoffmann and Wynder (1966) nor Mass et al. (1993) should be used to
derive RPFs for any PAH.
Table 7. High Mortality Rates in Studies Used to Calculate RPFs in EPA (2010)
Reference PAH1
Units
Initial Number
of Animals
Mortality at Appearance
of First Tumor (%)
Final Number
of Animals
Mortality Overall
(%)
Length of Experiment
Hoffmann and Wynder 1966
Dermal-CC Control 20 NA 12 40% 15 months
Dermal-CC DBaeP 0.05 % 20 70% 0 100% 15 months
Dermal-CC DBaeP 0.05 % 20 30% 5 75% 15 months
Dermal-CC DBaeP 0.1 % 20 55% 4 80% 15 months
Dermal-CC DBahP 0.05 % 20 15% 0 100% 15 months
Dermal-CC DBahP 0.1 % 20 10% 0 100% 15 months
Dermal-CC DBaiP 0.05 % 20 5% 2 90% 15 months
Dermal-CC DBaiP 0.1 % 20 5% 2 90% 15 months
Dermal-CC DBaeF 0.05 % 20 10% 0 100% 15 months
Dermal-CC DBaeF 0.1 % 20 10% 0 100% 15 months
Hoffmann and Wynder 1966
Dermal-Init Control 30 0% 26 13% 6 months
Dermal-Init DBaeP 0.25 mg 28 4% 26 7% 6 months
Dermal-Init DBahP 0.25 mg 29 0% 26 10% 6 months
Dermal-Init DBaiP 0.25 mg 30 0% 27 10% 6 months
Dermal-Init DBaeF 0.25 mg 30 0% 28 7% 6 months
Dermal-Init AA 0.25 mg 30 10% 25 17% 6 months
Dermal-Init BghiP 0.25 mg 30 10% 27 10% 6 months
Dermal-Init N23eP 0.25 mg 30 0% 27 10% 6 months
Dermal-Init I123cdP 0.25 mg 30 0% 29 3% 6 months
Exposure Route
Dose Level
Comments on Development of a Relative Potency Factor (RPF) Approach for PAH Mixtures 22

Table 7. High Mortality Rates in Studies Used to Calculate RPFs in EPA (2010)
Reference Exposure
Route PAH
1 Units
Initial Number
of Animals
Mortality at Appearance
of First Tumor (%)
Final Number
of Animals
Mortality Overall
(%)
Length of Experiment
Mass et al. 1993
2
IP Control NS NS 34 NC 8 months
IP BjAC 20 mg/kg 18 NS 12 33% 8 months
IP BjAC 50 mg/kg 18 NS 13 28% 8 months
IP BjAC 100 mg/kg 18 NS 14 22% 8 months
Notes: 1 LaCassagne et al. (1968) and Cavalieri et al. (1991) state that the compound thought to be DBalP prior to 1968 was actually DBaeF.
2 Initial group size was 27; nine animals (three each at three times) were killed for DNA adduct analysis. Incidence data were not used to calculate RPFs due to saturation (tumor incidence greater than or equal to 90% at the lowest dose.)
AA = anthanthrene Dermal-CC = dermal, complete carcinogenicity Dermal-Init = dermal, initiation IP = intraperitoneal mg = milligram mg/kg = milligrams per kilogram NA = not applicable NC = not calculable NS = not stated in text PAH = polycyclic aromatic hydrocarbon RPF = relative potency factor EPA = United States Environmental Protection Agency Yellow highlight = mortality greater than or equal to 10%
BghiP = benzo[g,h,i]perylene BjAC = benz[j]aceanthrylene DBaeP = dibenzo[a,e]pyrene DBahP = dibenzo[a,h]pyrene DBaiP = dibenzo[a,i]pyrene DBaeF = dibenzo[a,e]fluoranthene N23eP = naphtho[2,3-e]pyrene I123cdP = indeno[1,2,3-cd]pyrene
Dose Level
6.2 Significant Skin Toxicity
Most of the studies in which PAHs were tested in mouse skin assays did not address the
structural integrity of the skin. Thus, there is no way to determine if the MTD was exceeded or
not. However, several studies did specifically note that the MTD was exceeded. All results
from such studies should be omitted from the RPF derivation process. In addition, EPA (2002)
has stated that skin toxicity in a mouse skin assay is an indication that the MTD has been
exceeded. Specifically, EPA (2002) stated: “Production of papillomas by dermally
administered phenol (in the absence of an initiator) was observed only at a concentration that
caused ulceration, and hence was above the MTD.” More importantly, EPA (1988) has
defined the Maximum Tolerated Dose in dermal carcinogenesis studies as a dose that does
not cause a “marked inflammatory response or ulcerative lesion.” EPA (1988) specifically
stated:
“It was recommended that a dose level that incites a marked inflammatory response of
ulcerative lesion that is clearly related to application of the compound, should not be used
for an MTD.”
“Microscopic lesions of inflammation, spongiosis, degeneration, dermal edema, and
possibly others, must be evaluated carefully in the selection of the MTD. If, in the opinion
Comments on Development of a Relative Potency Factor (RPF) Approach for PAH Mixtures 23

of the pathologist, the severity of such lesions might lead to destruction of the functional
integrity of the epidermis, these lesions would indicate selecting a lower dose for the
MTD.”
Additionally, McKee et al. (1990) reported that when substances that are severe dermal
irritants, such as coal liquids, are tested in mouse skin, the test article application frequency
affected both time to tumor onset and tumor incidence. Examples of some studies that note
the significance of skin toxicity are listed below
6.2.1 Cyclopenta[c,d]pyrene (Cavalieri et al. 1981b)
“CPAP was virtually inactive, while CPEP elicited skin tumors at the three dose levels with
a response inversely proportional to the treatment dose. These results can be attributed to
the relatively high toxicity of CPEP, since this compound, especially at the high dose,
produced ulcerative skin lesions at the site of treatment.”
6.2.2 Dibenzo[a,l]pyrene (Cavalieri et al. 1991)
“The mice treated with DB[a,/]P developed erythemas after the first TPA treatment due to
the toxicity of the DB[a,[]P. The severity of the reaction was directly proportional to the
initiating dose of DB[a,/]P. Due to this skin reaction, promotion of all mice was stopped
until the fourth experimental week. It was then resumed and continued twice-weekly for 12
weeks. The mice initiated with DB[a,/]P or DB[a,/]P 11,12-dihydrodiol exhibited erythemas
similar to those described above. The number of skin tumors was charted weekly.”
“Fig. 4. Time course of tumor appearance in mouse skin expressed as percentage of
tumor-bearing mice. Because erythemas developed in mice treated with DB[a,/]P and
DB[a,/]P 11,12-dihydrodiol, promotion of all groups was not begun until the third
experimental week.”
“For both DB[a,/]P and DB[a,/]P 11,12-dihydrodiol at doses ranging from 4 to 100 nmol,
tumorigenic activity in mouse skin was inversely proportional to the dose (Table II and
Figures 4-6). At the high dose, DB[a,/]P elicited tumors earlier than DMBA; however, the
tumor multiplicity of DMBA was much higher than that of DB[a,/]P. At the low dose,
DB[a,/]P and DMBA exhibited similar tumor-initiating activity. These results indicate that
toxicity interfered with the initiation of tumors by DB[a,/]P, and experiments with lower
initiating doses are necessary to learn which compound has the higher tumorigenic
potency.”
6.2.3 Benzo[j]fluoranthene (Weyand et al. 1992)
“Initiation commenced during the early part of the second telogen phase of the hair cycle
(50-55 days old). Each of the non-alternant PAH evaluated in this study were administered
at a total initiation dose ranging from 0.3 to 2.0/umol per mouse. Solutions of these
hydrocarbons were applied topically in 100/uL acetone every other day to the shaved
backs of the mice using a biopipette. Evidence of skin irritation required that at certain
Comments on Development of a Relative Potency Factor (RPF) Approach for PAH Mixtures 24

doses the number of applications to be limited. For a total initiation dose of 2.0 umol, five
applications of a 4.0 mM solution of each non-alternant hydrocarbon was applied. Ten
applications of a 1.0 mM solution of each non-alternant hydrocarbon was used for
providing a total initiating dose of 1.0/umol. Skin irritation was noted for several of the
treated mice at this dose, particularly those receiving 4F-B[j]F. Because of skin irritation
observed in a few mice receiving 0.4 mM 4F-B[j]F, only seven applications were made to
the mice receiving a total initiating dose of 0.3 umol of each non-alternant hydrocarbon.”
6.2.4 Dibenzo[a,e]pyrene (Hoffmann and Wynder 1966)
EPA (2010) reported in Table E-1 that there was significant mortality in the
dibenzo[a,e]pyrene-treated animals. Specifically, EPA (2010) stated: “Toxicity resulted in
significant mortality unrelated to tumor induction.” In fact, the mortality was 100% in one 0.05%
dose group and 75% in another 0.05% dose group. Instead of omitting the entire study as
would be called for with the EPA (2010) criterion to omit studies with 90% or greater mortality
in the low dose group, EPA merged the two low dose groups, which yielded a pooled mortality
of 88%. This practice introduces significant uncertainty in the RPF for this substance.
7. Identity and Purity of Test Article
Recommendation: EPA should exclude studies from the RPF approach if the identity and purity
of the test article cannot be verified.
Many of the papers inadequately address the identity and purity of the test articles used.
According to EPA (2010), studies in which the purity of the PAHs was “questionable,” should
have been excluded from the analysis. There is considerable uncertainty surrounding the
relevance of any study used for RPF derivation unless there is certainty of the test article
identity. EPA did not specifically state that there needed to be a positive identity of the test
object, but clearly identity is important. A few examples are listed below:
7.1 Benzo[c]fluorene
RPFs for benzo[c]fluorene are derived from Weyand et al. (2004), which states: “7H
Benzo[c]fluorene was synthesized by the method previously reported and purity was ≥98% as
determined by high-performance liquid chromatography (HPLC) analysis (23)” The paper
provides no discussion on the manner in which the purity of the test article was actually
determined and no information on confirmation of the test article identity.
Weyand et al. (2004) provides no discussion of the melting point of the synthesized
compound, the NMR spectrum, or the mass spectrum. In fact, no information is presented to
confirm the identity of the compound that was synthesized. Purity was tested by HPLC, but
HPLC can only confirm that the area under the curve (AUC) of the major peak was 98% of the
total AUC of all discernable peaks under the specific column, solvent, flow and temperature
conditions of the analysis. HPLC cannot confirm the identity of the substance tested. There is
no mention of isolating the HPLC peak and confirming the substance’s identity by mass
spectrometry or other methods.
Comments on Development of a Relative Potency Factor (RPF) Approach for PAH Mixtures 25

7.2 Benz[l]aceanthrylene and benz[e]aceanthrylene
RPFs for benz[l]aceanthrylene and benz[e]aceanthrylene are derived from Nesnow et al.
(1984), which states: “B[e]A and B[l]A were synthesized according to the method of Sangaiah
et al. [10].” The paper provides no citation to a synthesis method, no discussion on the purity
of the test article, and no information on confirmation of the test article identity. In addition,
Johnsen et al. (1997) studied benz[l]aceanthrylene and stated: “The CP-PAH [3H]B[j]A, B[j]A
and B[l]A were synthesized and purified according to published methods (27), and kindly
provided by Dr S.Nesnow United States Environmental Protection Agency, NC, USA.” Again,
no information was provided on purity and positive identification. Citation (27) is the same
Sangaiah et al. (1983) paper.
Nesnow et al. (1984) provides no discussion of the melting point of the synthesized
compound, the NMR spectrum, or the mass spectrum. In fact, no information is presented to
confirm the identity of the compound that was synthesized. No testing of purity was performed.
The paper of Sangaiah et al. (1983) was obtained. The synthesis of both benz[l]aceanthrylene
and benz[e]aceanthrylene were described, and the authors presented melting points, UV
spectral maxima, and NMR spectral features. No information on purity was except for melting
point. As above, the melting points and spectral features describe the two materials that they
produced, but there is no confirmation in the paper that the two PAHs of interest were, in fact,
the synthetic products. It appears that this study does not pass EPA’s stated study inclusion
criterion that papers with substances of questionable purity should be excluded from the
analysis. It has not been proven that the cited synthetic route produces benz[l]aceanthrylene
and benz[e]aceanthrylene.
7.3 Benz[j]aceanthrylene
RPFs for benz[j]aceanthrylene are derived from Mass et al. (1993), which states that B[j]A was
“synthesized by Dr. Avram Gold, University of North Carolina School of Public Health.” The
paper provides no citation to a synthesis method, no discussion on the purity of the test article,
and no information on confirmation of the test article identity. In addition, Johnsen et al. (1997)
studied benz[j]aceanthrylene and stated: “The CP-PAH [3H]B[j]A, B[j]A and B[l]A were
synthesized and purified according to published methods (27), and kindly provided by Dr
S.Nesnow United States Environmental Protection Agency, NC, USA.” Again, no information
was provided on purity and positive identification. Citation (27) is the Sangaiah et al. (1983)
paper.
7.4 Dibenzo[a,l]pyrene
RPFs for dibenzo[a,l]pyrene are derived from Cavalieri et al. (1991) and Nesnow et al. (1998).
Cavalieri, et al. (1991) states: “B[a]P and DMBA were available in our laboratory, whereas
DB[a,/]P was obtained from the National Cancer Institute Chemical Carcinogen Repository
(Bethesda, MD).” The paper provides no citation to a synthesis method and no information on
confirmation of the test article identity. It is stated that the purity of the PAHs was determined
to be 99+% by HPLC methods, but, as noted above, HPLC cannot confirm identity, and there
Comments on Development of a Relative Potency Factor (RPF) Approach for PAH Mixtures 26
no mention of co-chromatography of authentic standards. Data from Cavalieri, et al. (1991)
and Nesnow et al. (1998) on dibenzo[a,l]pyrene should be rejected in accordance with EPA’s
study inclusion criteria.
7.5 Cyclopenta[d,e,f]chrysene, 4H
The RPF for cyclopenta[d,e,f]chrysene, 4H- was derived from two papers by the same
laboratory (Rice et al. 1985; and Rice et al. 1988) stated that cyclopenta[d,e,f]chrysene, 4H
was synthesized by the method of Lee-Ruff et al. (1984). The Rice papers make no mention of
any determination of identity. Rice et al. (1985) states that purity was tested by gas
chromatography, and Rice et al. (1988) states that purity was tested by HPLC. In neither case
do the methods characterize the identity of the constituent.
Lee-Ruff et al. (1984) report a synthesis of cyclopenta[d,e,f]chrysene, 4H- and the residue was
cleaned up on preparative thin layer chromatography. The material that was eluted was
characterized by melting point, IR, NMR and UV. The melting point was reported as 174-176
degrees C, whereas the literature value was reported as 171-173 degrees C. No tests of purity
or identity were performed, and as discussed above, the publication of spectral information
does nothing to confirm the identity or the purity of the substance produced by the synthesis.
Data from (Rice et al. 1985; Rice et al. 1988) on cyclopenta[d,e,f]chrysene, 4H- should be
rejected in accordance with EPA’s study inclusion criteria.
7.6 Benz[b,c]aceanthrylene, 11H
The RPF for benz[b,c]aceanthrylene, 11H-was derived from a single paper (Rice et al. (1988).
Rice et al. (1988) stated that the benz[b,c]aceanthrylene, 11H- was synthesized by the
method of Rice and Hussain (1988). Purity was determined by HPLC analysis. However, no
mention was made of substance identity.
Rice et al. (1988) cites their synthesis as “Rice, J.E. and Hussain, N. (1988) J. Org. Chem., in
press.” No such scientific article was ever published in the Journal of Organic Chemistry. ’
librarian searched this journal and other journals and did find any papers by these authors that
describe the synthesis of benz[b,c]aceanthrylene, 11H- .
Nesnow et al. (1998) states: “DB[a,l]P and B[j]A were obtained from Midwest Research
Institute (Kansas City, KA).” There is no mention in this paper about tests of purity or identity
of the test articles.
Because there is no information at all on the identity this PAH, both papers should be rejected
as not meeting EPA’s study inclusion criteria.
Comments on Development of a Relative Potency Factor (RPF) Approach for PAH Mixtures 27

7.7 Dibenzo[a,e]fluoranthene
The RPF for dibenzo[a,e]fluoranthene is based on a single paper by Hoffmann and Wynder
(1966). There is considerable uncertainty surrounding the identity of this substance. According
to Table 4-1 of EPA (2010), the authors mis-identified the substance as dibenzo[a,l]pyrene:
“Paper in German. Paper reports compound as DBalP; LaCassagne et al. (1968) state
that it is actually DBaeF.”
EPA is relying on results from a 1966 paper in which the authors reported tumorigenicity data
for dibenzo[a,l]pyrene. However, EPA designates the data to dibenzo[a,e]fluoranthene
because another author states the true identity of the substance is not dibenzo[a,l]pyrene.
8. Substance-Specific Comments
Recommendation: EPA should clearly identify the uncertainties associated with a derived RPF
(i.e. RPF is based on a single study or based on only on non-cancer endpoints).
In some cases, major issues may be identified with regard to the RPF(s) for individual
substance, perhaps due to scientific issues with regard to the selected scientific papers or the
particulars of EPA’s modeling treatment of data for that substance.
8.1 Benzo[g,h,i]perylene
The RPF for benzo[g,h,i]perylene is based on a single result from Deutsch-Wenzel, et al.
(1983). The study authors did not give strong weight to their weak finding in this study as
noted below:
“BghiP showed only a weak effect when applied as an intrapulmonary implant. It cannot
be excluded that the effect observed in the lung implantation test originates from the
impurities of the BghiP administered.”
In addition, when IARC (1983) evaluated this study, they noted that the authors of the study
reported that the weak effect observed after intrapulmonary administration of the test
compound might have been caused by impurities in the benzo[g,h,i]perylene used. Thus, it
is inappropriate to conclude that this is a positive study. Further, IARC (1983) evaluated
additional information on benzo[g,h,i]perylene, all of which was negative. According to IARC
(1983), there is inadequate data to permit an evaluation of the carcinogenicity of
benzo[g,h,i])perylene to experimental animals and humans. No carcinogenic effects were
observed when benzo[g,h,i]perylene was tested in two mouse-skin studies with female mice.
It also gave negative results in three mouse-skin initiation-promotion studies. In two
subcutaneous injection studies in mice, no injection site tumors were observed. The results
of a test using intrapulmonary injection in rats were inadequate for evaluation (the Deutsch-
Wenzel et al. 1983 study).
Comments on Development of a Relative Potency Factor (RPF) Approach for PAH Mixtures 28
Deutsch-Wenzel, et al. (1983) calculated their own RPFs from their study, and the 95th
confidence interval for the RPF for benzo[g,h,i]perylene was 0.00 to 0.06. Thus, the authors
had very low confidence that a non-zero RPF could be derived from their experiment. It is
also noted that in 1993 EPA reviewed this same dataset for benzo[g,h,i]perylene and
concluded that an RPF for benzo[g,h,i]perylene could not be derived. The 1983 study has
the same limitations today as it did in 1993.
8.2 Dibenz[a,c]anthracene
Dibenz[a,c]anthracene was mistakenly stated as having no tumorigenicity assays, and EPA
(2010) derived an RPF of 4 based entirely on DNA adduct, DNA damage, mutagenicity and
cell transformation studies. The range of calculated RPFs was 0.04 to 50 and EPA rated the
confidence “very low.” Of the 14 studies reviewed, 8 were single dose studies and of the 6
multiple dose studies, all were in vitro studies (bacterial mutagenicity, DNA damage, and
DNA adduct formation).
As noted above, EPA (2010) has incorrectly reported data on DBacA, because there was at
least one mouse skin bioassay with a concurrent BaP control (Slaga et al. (1980)) and three
negative mouse skin bioassays without concurrent BaP controls. Slaga et al. (1980) studied
DBacA and found it to be negative for mouse skin tumors. Slaga et al. (1980) met EPA’s
study inclusion criteria and is listed on Table 4-1. Results from this study were used for CH
and DBahA. Table 4-1 lists BeP and DBacA as “nonpositive.” However, DBacA and BeP did
have negative results in this study. Neither negative result is reported in EPA’s figures,
Figure 6-11 for BeP or Figure 6-22 for DBacA.
EPA also incorrectly reported the data for DBacA in the text. It states:
“There were 15 datasets for dibenz[a,c]anthracene that met selection criteria and
included benzo[a]pyrene (Figure 6-22).”
“In at least one study, benzo[k]fluoranthene, benz[l]aceanthrylene, 4
benz[e]aceanthrylene, naphtho[2,3-e]pyrene, dibenz[a,h]anthracene,
dibenz[a,c]anthracene, and 5 benz[b,c]aceanthrylene showed positive initiating activity.
Nonpositive results were reported for pyrene, perylene, benzo[g,h,i]fluoranthene,
fluoranthene, anthanthrene, dibenzo[e,l]pyrene, benzo[g,h,i]perylene, indeno[1,2,3
c,d]pyrene, benzo[e]pyrene, anthracene, 2,3-acepyrene, and phenanthrene.”
However, this is incorrect because DBacA was negative in dermal bioassays. The above
quotation also fails to take into account the three negative mouse skin bioassay results that
EPA notes as “Conflicting results were reported in three dermal initiation bioassays of
dibenz[a,c]anthracene in which benzo[a]pyrene was not included.”
It is unjustified to use in vitro mutagenicity, DNA damage and other cancer “related”
bioassay results to conclude that a substance is carcinogenic to humans when at least four
studies reported by EPA have shown that the substance is not tumorigenic in the exquisitely
Comments on Development of a Relative Potency Factor (RPF) Approach for PAH Mixtures 29

sensitive mouse skin bioassay. Thus, EPA has ignored four in vivo negative studies in the
mouse and derived RPFs exclusively from cancer-related endpoints.
8.3 Cyclopenta[c,d]pyrene
Cavalieri et al. (1981) is the source of one RPF derivation for cyclopenta[c,d]pyrene. EPA
(2010) did not follow its own protocol when assessing data from this study. For multi-dose
studies, EPA (2010) derived RPFs using data the following statistical criteria:
“Statistical analyses were performed on tumor bioassay data to determine whether the
tumor incidence or multiplicity observed at a particular dose represented a statistically
significant increase over controls. If statistical analyses were not described in the original
report, incidence data were analyzed using Fisher’s exact test and the Cochran-Armitage
trend test. Positive findings were indicated by a significant (p < 0.05) difference for at least
one dose group by comparison to control (in Fisher’s exact or an equivalent test) or a
significant dose-response trend (Cochran-Armitage or equivalent) for multidose studies.”
EPA (2010) determined during data assessment that in the dermal initiation experiment
conducted by Cavalieri et al. (1981), the lowest and highest of three doses of
cyclopenta[c,d]pyrene were not statistically significantly elevated over controls, nor was the
trend significant. However, the middle dose was borderline significant (i.e. p=0.05 rather than
p<0.05), and EPA (2010) derived an RPF for cyclopenta[c,d]pyrene based on a point estimate
at that middle dose. However, the data from both the lower and higher doses were not
statistically significantly different from control data. Thus, Cavalieri et al. (1981) should not be
used to derive a RPF for cyclopenta[c,d]pyrene, since the data do not meet EPA (2010)
statistical qualifications.
9. Whole Mixtures Approach vs. Component Approach
Recommendation: EPA should use cancer slope factors which are derived from whole mixtures
instead of RPFs to assess human risk.
EPA (2010) reports that EPA favors toxicity evaluations on whole mixtures, as noted below.
“The Supplemental Guidance for Conducting Health Risk Assessment of Chemical
Mixtures (U.S. EPA, 2000) indicates that approaches based on whole mixtures are
preferred to component approaches, such as the RPF approach. Risk assessment
approaches based on toxicity evaluations of whole mixtures inherently address specific
interactions among PAHs and account for the toxicity of unidentified components of PAH
mixtures. They also do not require assumptions regarding the toxicity of individual
components (e.g., dose additivity or response additivity).”
As noted in Appendix B, a validation of the proposed RPFs against CSFs derived from whole
mixture studies demonstrates that the tumorigenicity of the mixture is less than the
tumorigenicity predicted by the application of the RPFs.
Comments on Development of a Relative Potency Factor (RPF) Approach for PAH Mixtures 30

10. Age-Dependent Adjustment Factors
Recommendation: EPA should not use age-dependent adjustment factors in this PAH RPF
approach.
EPA (2010) uses the RPF document as another platform to present the age-dependent
adjustment factors (ADAFs) however, the specific ADAFs proposed by EPA are scientifically
inappropriate for use with PAHs. In EPA (2005), EPA provides guidance for assessing early-
life exposures to carcinogens and derives default ADAFs of 3 for 2-16 year-old children and
10 for 0-2 year-old children for all chemical substances that have a mutagenic mode of action.
According to EPA (2005), “Default adjustment factors are meant to be used only when no
chemical-specific data are available to assess directly cancer susceptibility from early-life
exposure to a carcinogen acting through a mutagenic mode of action.”
The default adjustment factors were derived based on scientific data on 12 chemicals
described by EPA as having mutagenic modes of action. Of the 12 substances, one is a PAH
occurring in the environment, benzo[a]pyrene, and two are experimental PAHs that do not
occur in nature, dibenz[a,h]anthracene and 3-methylchloanthrene.
Given that the Supplemental Guidance in 2005 clearly states that chemical-specific ADAFs
are superior to generic ones, and EPA (2005) provides chemical-specific ADAFs for three
PAHs, the RPF document (EPA 2010) should focus on PAH-specific ADAFs and not generic
ones that were calculated for nine chemicals that are not PAHs, such as vinyl chloride.
Further, because RPFs derived by EPA (2010) have not taken in consideration all
tumorigenicity test results for dibenz[a,h]anthracene and 3-methylchloanthrene, PAH-
specific ADAFs for use with BaP and BaP-TE should employ only data for BaP.
11. Bioavailability
Recommendation: EPA’s RPF approach should take into consideration differential bioavailability
of PAHs in human risk assessment.
PAHs are highly bound to environmental matrices and are not highly bioavailable to humans.
RPFs have been derived using studies in which PAHs were administered via IP injections in
oily vehicles, lung implants that are designed to maintain high localized doses, and mouse
skin painting in solvent vehicles. EPA (2010) has derived RPFs for many PAHs that are
instructed to be used to derive a BaP-toxic equivalent (BaP-TE) concentration that takes into
account a large number of PAHs present in an environmental sample. Then, human health
risk assessment will be performed with the single BaP-TE concentration as if the entire
summed concentration behaves all like BaP. The RPFs and the manner in which they are
intended to be implemented have not taken into consideration differential bioavailability.
EPA’s Guidelines for Carcinogen Risk Assessment (EPA 2005) states that bioavailability is a
major issue when considering a substance’s carcinogenic potential. Specifically, EPA (2010)
states:
Comments on Development of a Relative Potency Factor (RPF) Approach for PAH Mixtures 31

“Physicochemical properties affect an agent’s absorption, tissue distribution
(bioavailability), biotransformation, and degradation in the body and are important
determinants of hazard potential (and dose-response analysis).”
“Determining bioavailability via different routes of exposure by analyzing uptake processes
under various exposure conditions. This analysis supports identification of hazards for
untested routes. In addition, use of physicochemical data (e.g., octanol-water partition
coefficient information) can support an inference about the likelihood of dermal absorption
(Flynn, 1990).”
When using the EPA (1993) RPFs, the issue of differential bioavailability is present but less
pronounced. This is because the six PAHs with RPFs under the 1993 scheme are similar in
chemical properties to BaP and might be logically expected to have similar bioavailability in,
for instance, soil or sediment. However, the current proposed RPFs include RPFs for smaller
PAHs, such as FA, and many larger PAHs, such as AA, BghiP. DBaeF. DBaeP, DBahP,
DBaiP, DBalP, DBelP, and N23eP. These PAHs are significantly larger and heavier than BaP
and would be expected to have lower bioavailabilities from soil and sediment. With lower
bioavailability, the use of RPFs that do not take such an important factor into account will
overestimate tissue doses and thus overestimate human health risk.
Table 8. Select Physical and Chemical Properties of PAHs with EPA (2010) RPFs
Number of Molecular
PAH Log Kow Koc (L/kg) Aromatic Weight (g/mol)
Rings
Benzo[a]pyrene 252 5 6.13 5.87E+05
Anthanthrene 276 6 NA NA
Anthracene 178 3 4.45 1.64E+04
Benz[a]anthracene 228 4 5.76 1.77E+05
Benz[b,c]aceanthrylene, 11-H 240 4 NA NA
Benzo[b]fluoranthene 252 4 5.78 5.99E+05
Benzo[c]fluorene 216 3 NA NA
Benz[e]aceanthrylene 252 4 NA NA
Benzo[g,h,i]perylene 276 6 6.63 1.95E+06
Benz[j]aceanthrylene 252 4 NA NA
Benzo[j]fluoranthene 252 4 6.11 5.99E+05
Benzo[k]fluoranthene 252 4 6.11 5.87E+05
Benz[l]aceanthrylene 252 4 NA NA
Chrysene 228 4 5.81 1.81E+05
Cyclopenta[c,d]pyrene 226 4 NA NA
Cyclopenta[d,e,f]chrysene, 4H 240 4 NA NA
Dibenz[a,c]anthracene 278 5 NA NA
Dibenzo[a,e]fluoranthene 302 5 NA NA
Dibenzo[a,e]pyrene 302 6 7.71 6.48E+06
Comments on Development of a Relative Potency Factor (RPF) Approach for PAH Mixtures 32

Table 8. Select Physical and Chemical Properties of PAHs with EPA (2010) RPFs
Number of Molecular
PAH Log Kow Koc (L/kg) Aromatic Weight (g/mol)
Rings
Dibenz[a,h]anthracene 278 5 6.75 1.91E+06
Dibenzo[a,h]pyrene 302 6 7.28 6.35E+06
Dibenzo[a,i]pyrene 302 6 7.28 6.35E+06
Dibenzo[a,l]pyrene 302 6 7.71 6.48E+06
Fluoranthene 202 3 5.16 5.55E+04
Indeno[1,2,3-cd]pyrene 276 5 6.70 1.95E+06
Naphtho[2,3-e]pyrene 302 6 NA NA
Phenanthrene 178 3 4.46 1.67E+04
Pyrene 202 4 4.88 5.43E+04
Notes: Data from EPA's Estimation Program Interface (EPI) Suite via the Risk Assessment Information
System (RAIS; http://rais.ornl.gov/home/about.html). NA = value not available Kow = octanol-water partition coefficient Koc = organic carbon partition coefficient
12. Factual Errors
Recommendation: EPA should review the EPA 2010 document for factual errors.
Errors identified include the following:
a. Benz[j]aceanthrylene: EPA’s Table 4-2 incorrectly reports that Mass et al. (1993) reiterates
data presented in Nesnow et al. (1998).
b. Nesnow et al. (1998) states that the background tumor multiplicity was 0.6 tumors/animal,
but the BMD modeling was done using a control rate of 0.67 tumors/animal according to
EPA’s Appendix C tables. Figure 2 in Nesnow et al. (1998) mis-identified DBA and
DB[a,l]P on the graph, making it difficult for reviewers to compare EPA’s tabular data to
the data presented in the original paper.
c. Table 4-1 does not list that benzo[g,h,i]perylene, indeno[1,2,3-c,d]pyrene, anthanthrene,
and naphtho[2,3-e]pyrene were all nonpositive results in Hoffmann and Wynder (1966).
EPA also reports in this table that “DBahP incidence ≥90% at lowest dose.” This is an
error. The incidence at the lowest dose was 85%.The table also reports only data for
papillomas, but the study provided data on papillomas and epitheliomas.
d. EPA’s Table 4-1 lists the Nesnow et al. (1984)’s study was performed for 30 weeks;
however, the results were also reported at 15 weeks.
Comments on Development of a Relative Potency Factor (RPF) Approach for PAH Mixtures 33

e. Hoffman and Wynder (1966) Data Used: Data in EPA (2010) Appendix C tables were
checked against the original data tables from the published report and several errors were
found in the data EPA used to derive RPFs. These errors include:
Complete carcinogenesis study: DBaeP has two low dose (0.05%) study groups, each
with 20 animals. One group had 100% mortality, and the other had 75% mortality. Instead
of omitting the entire study for RPF derivation or omitting the 100% mortality group, EPA
merged the data for the two groups to obtain a pooled low dose group.
Initiation/Promotion Study: EPA (2010) incorrectly states that the control group had 7%
tumor incidence based on 2 animals with tumors. This is an error. The 2 refers to BaP, not
to the control group, and it represents the number of BaP-treated animals that developed
epitheliomas.
f. Figure 6-11 for BeP and Figure 6-22 for DBacA do not show the nonpositive bioassay
from Slaga et al. (1980), which met EPA’s study inclusion criteria and is listed on EPA’s
Table 4-1.
EPA also incorrectly reports the data for DBacA in the text. EPA also erroneously states:
“There were 15 datasets for dibenz[a,c]anthracene that met selection criteria and included benzo[a]pyrene (Figure 6-22).”
“In at least one study, benzo[k]fluoranthene, benz[l]aceanthrylene, 4
benz[e]aceanthrylene, naphtho[2,3-e]pyrene, dibenz[a,h]anthracene,
dibenz[a,c]anthracene, and 5 benz[b,c]aceanthrylene showed positive initiating activity.
Nonpositive results were reported for pyrene, perylene, benzo[g,h,i]fluoranthene,
fluoranthene, anthanthrene, dibenzo[e,l]pyrene, benzo[g,h,i]perylene, indeno[1,2,3
c,d]pyrene, benzo[e]pyrene, anthracene, 2,3-acepyrene, and phenanthrene.”
g. Results of Schmähl et al. (1977) are incorrectly reported. EPA (2010) states:
“Additivity has been observed in carcinogenicity studies of complex mixtures of PAHs.
Schmähl et al. (1977) evaluated the production of skin tumors following combined dermal
treatment with 11 PAHs found as constituents of automobile exhaust. Tumor findings were
presented separately for two groups of PAHs. High potency carcinogens (Group 1)
included benzo[a]pyrene, dibenz[a,h]anthracene, benz[a]anthracene, and
benzo[b]fluoranthene. Lower potency PAHs (Group 2) included anthracene,
benzo[e]pyrene, benzo[g,h,i]perylene, chrysene, fluoranthene, phenanthrene, and pyrene.
Chronic dermal exposure to PAHs in both groups resulted in an additive response when
compared to the tumor response for each group alone.”
This was not reported by Schmähl et al. (1977) found nor what Clement Associates (1988)
reported concerning the same study. Clement Associates (1988) did find a reasonable
additive result for Mixture 1 with 1993-vintage RPFs, but inhibition, not additivity was seen
Comments on Development of a Relative Potency Factor (RPF) Approach for PAH Mixtures 34

with Mixture 2. With the proposed RPFs, inhibition is seen in both cases, and there is no
support for the additivity assumption.
13. Documentation
Recommendation: EPA should provide greater utility and transparency of the data for review by
the public.
EPA (2010) has provided a large amount of data that does to a great extent allow peer
reviewers to evaluate in detail how EPA derived its RPFs. However, there are several issues
to need to be discussed that do not allow the document to be fully reviewed.
13.1 Use of Graphical Data
According to EPA (2010), data that were presented graphically and not tabularly, were used
by EPA. Specifically, EPA (2010) states: “For studies that reported results graphically,
individual data points were extracted using digitizing software.” Because this software is not
identified, a reviewer cannot check the accuracy of the digitization.
13.2 Use of Undocumented Data
Nesnow et al. (1998) provides data for RPFs for BbF, CPcdP, DBahA, and DBalP. Although
the citation is given as Nesnow et al. (1998), the data used by EPA was, in fact, listed as “Data
provided by S. Nesnow.” Specifically, numerical data for tumor multiplicity were provided that
were only graphically presented in the publication. More importantly, EPA used tumor incidence data on these substances that were not presented or discussed at all in the publication. The data were provided by the author, but they are not provided in a peer-reviewed journal that is accessible to the public.
13.3 Calculation of Incidence
In most cases, tumor incidence was calculated based on the number of total treated animals.
However, EPA (2010) calculated incidence in a different manner for the data of Hoffmann and
Wynder (1966) and a few other papers. Specifically, EPA (2010) states:
“For a few PAHs tested in older dermal bioassays, the authors reported mortality prior to
the appearance of the first tumor. For these data sets, an assumption was made that the
number of animals at risk for tumor development was equal to the total number of animals
alive at the time of the appearance of the first tumor. This approach ensures that the
incidence is not underestimated by including animals that did not survive long enough to
develop tumors. As this assumption applied to a small number of RPFs (specifically,
individual RPFs for chrysene, dibenzo[a,e]pyrene, dibenzo[a,e]fluoranthene, and
dibenzo[a,h]pyrene calculated from data reported by Hecht et al. [1974] and Hoffmann and
Wynder [1966]), it had little impact on the overall analysis.”
Comments on Development of a Relative Potency Factor (RPF) Approach for PAH Mixtures 35

As noted above, Hoffmann and Wynder (1966) is the sole source of data for the RPFs for
dibenzo[a,e]pyrene, dibenzo[a,e]fluoranthene, and dibenzo[a,h]pyrene, so the use of a
different way of calculating incidence does not have “little impact on the overall analysis.” In
fact, it has a major impact on the overall analysis, because this is the only analysis done for
these three substances.
II. References
Adkins, B. Jr., E.W. Van Stee, J.E. Simmons and S.L. Eustis. 1986. Oncogenic response of strain
A/J mice to inhaled chemicals J Toxicol Environ Health, Part A, 17(2 & 3):311-322.
Alworth, W.L., A. Viaje, A. Sandoval, B.S. Warren and T.J. Slaga. 1991. Potent inhibitory effects
of suicide inhibitors of P450 isozymes on 7,12-dimethylbenz[a]anthracene and
benzo[a]pyrene initiated skin tumors. Carcinogenesis 12:1209-1215
Andrews, A.W., L.H. Thibault and W. Lijinsky. 1978. The relationship between carcinogenicity and
mutagenicity of some polynuclear hydrocarbons. Mutat Res 51:311-318.
Baird, W.M., C.P. Salmon and L. Diamond. 1984. Benzo[e]pyrene-induced alternations in the
metabolic activation of benzo[a]pyrene and 7,12-dimethylbenz[a]anthracene by hamster
embryo cells. Cancer Res 44:1445-1452.
Baker, R.S., A.M Bonin, I. Stupans et al. 1980. Comparison of rat and guinea pig as sources of
the S9 fraction in the Salmonella/mammalian microsome mutagenicity test. Mutat Res 71:43
52.
Beland, F. and S. Culp. 1998. Chronic bioassay of two composite samples from selected
manufactured gas plant waste sites. Division of Biochemical Toxicology, National Center for
Toxicological Research, Jefferson, Arkansas. Technical Report 6722.02. Unpublished report.
Brune, H., R.P. Deutsch-Wenzel, M. Habs, S. Ivankovic and D. Schmahl. 1981. Investigation of
the tumorigenic response to benzo(a)pyrene in aqueous caffeine solution applied orally to
Sprague-Dawley Rats. J Cancer Res Clin Oncol 102:153-157.
Bryla, P., and E.H. Weyand. 1992. Detection of PAH:DNA adducts from auto-oxidation using 32P
postlabeling. Cancer Lett 65:35-41.
Busby, W.F.J., M.E. Goldman, P.M. Newberne et al. 1984. Tumorigenicity of fluoranthene in a
newborn mouse lung adenoma bioassay. Carcinogenesis 5:13111316.
Busby, W.F.J., E.K. Stevens, C.N. Martin et al. 1989. Comparative lung tumorigenicity of parent
and mononitro-polynuclear aromatic hydrocarbons in the BLU:Ha newborn mouse assay.
Toxicol Appl Pharmacol 99:555-563.
Cavalieri, E.L., P. Mailander and A. Pelfrene. 1977 Carcinogenic activity of anthanthrene on
mouse skin. Z Krebsforsch Klin Onkol Cancer Res Clin Oncol 89:113–118.
Comments on Development of a Relative Potency Factor (RPF) Approach for PAH Mixtures 36

Cavalieri, E., E. Rogan, B. Toth et al. 1981b. Carcinogenicity of the environmental pollutants
cyclopenteno-[cd]pyrene and cyclopentano[cd]pyrene in mouse skin. Carcinogenesis 2:277
281.
Cavalieri, E., A. Munhall, E. Rogan et al. 1983. Syncarcinogenic effect of the environmental
pollutants cyclopenteno[cd]pyrene and benzo[a]pyrene in mouse skin. Carcinogenesis 4:393
397.
Cavalieri, E.L., E.G. Rogan, S. Higginbotham, et al. 1989. Tumor-initiating activity in mouse skin
and carcinogenicity in rat mammary gland of dibenzo[a]pyrenes: the very potent
environmental carcinogen dibenzo[a,l]pyrene. J Cancer Res Clin Oncol 115:67-72.
Cavalieri, E.L., S. Higginbotham, N.V. RamaKrishna et al. 1991. Comparative dose-response
tumorigenicity studies of dibenzo[a,l]pyrene versus 7,12-dimethylbenz[a]anthracene,
benzo[a]pyrene and two dibenzo[a,l]pyrene dihydrodiols in mouse skin and rat mammary
gland. Carcinogenesis 12:1939-1944.
Chang, R.L., W. Levin, A.W. Wood et al. 1982. Tumorigenicity of bay-region diol-epoxides and
other benzo-ring derivatives of dibenzo[a,h]pyrene and dibenzo[a,i]pyrene on mouse skin and
in newborn mice. Cancer Res 42:25-29.
Clayson, D.B. 1988. Needs for biological risk assessment in interspecies extrapolation.
Environmental Health Perspectives 77:93-97.
Courter, L.A., T. Musafia-Jeknic, M. Ciganek, M. Machala and W.M. Baird. 2007a. Inhibition of
CYP1A1 and CYP1B1 enzymes by aromatic compounds adsorbed on urban dust particulate
matter. Polycyclic Aromatic Compounds 27:185-196.
Courter, L.A., T. Musafia-Jeknic, K. Fischer, R. Bildfell, J. Giovanini, C. Pereira and W.M. Baird.
2007b. Urban dust particulate matter alters PAH-induced carcinogenesis by inhibition of
CYP1A1 and CYP1B1. Toxicological Sciences 95(1):63-73.
Courter L.A., A. Luch, T. Musafia-Jeknic, V.M. Arlt, K. Fischer, R. Bildfell, C. Pereira, D.H. Phillips,
M.C. Poirier, and W.M. Baird. 2008. The influence of diesel exhaust on polycyclic aromatic
hydrocarbon-induced DNA damage, gene expression, and tumor initiation in Sencar mice in
vivo. Cancer Lett 265(1):135-47.
Crabtree, H.G. 1946. Some effects of aromatic hydrocarbons on sulfur metabolism and tumor
induction in mice. Can Res 6:553-559.
Culp, S.J., D.W. Gaylor, W.G. Sheldon et al. 1998. A comparison of the tumors induced by coal
tar and benzo[a]pyrene in a 2-year bioassay. Carcinogenesis 19:117-124.
Dankovic, D.A., B.L. Thomas, R.C. Zangar, D.W. Later and D.L. Springer. 1989. Inhibition of
benzo[a]pyrene-7,8-diol formation in vitro by complex organic mixtures. Toxicology 55:93-102.
Comments on Development of a Relative Potency Factor (RPF) Approach for PAH Mixtures 37

Deutsch-Wenzel, R.P. H. Brune, G. Grimmer et al. 1983. Experimental studies in rat lungs on the
carcinogenicity and dose- response relationships of eight frequently occurring environmental
polycyclic aromatic hydrocarbons. J Natl Cancer Inst 71:539-544.
DiGiovannia, J., T.J. Slaga, D.L. Berry and M.R. Juchau. 1980. Inhibitory Effects of Environmental
Chemicals on Polycyclic Aromatic Hydrocarbon Carcinogenesis. in Slaga, T.J. (ed.)
Carcinogenesis, Vol. 5: Modifiers of Chemical Carcinogenesis. Raven, New York. pp 145
168.
DiGiovanni, J., J. Rymer, T.J. Slaga, and R.K. Boutwell. 1982. Anticarcinogenic and
cocarcinogenic effects of benzo[e]pyrene and dibenz[a,c]anthracene on skin tumor initiation
by polycyclic hydrocarbons. Carcinogenesis 3:371-375.
DiPaolo, J.A.. J.P. Donovan and R.L. Nelson. 1969. Quantitative studies of in vitro transformation
by chemical carcinogens. J Natl Cancer Inst 42:867-874.
El-Bayoumy, K., S.S. Hecht and D. Hoffmann. 1982. Comparative tumor initiating activity on
mouse skin of 6-nitrobenzo[a]pyrene, 6-nitrochrysene, 3-nitroperylene, 1-nitropyrene and their
parent hydrocarbons. Cancer Lett 16:333-337.
EPA 2010. Development of a Relative Potency Factor (RPF) Approach for Polycyclic Aromatic
Hydrocarbon (PAH) Mixtures In Support of Summary Information on the Integrated Risk
Information System (IRIS). February 2010
Falk, H.L., P. Kotin and S. Thompson. 1964. Inhibition of Carcinogenesis. Arch Environ Health
9:169-179.
Finzi, C., P. Daudel and G.Prodi. 1968. Interference among polycyclic hydrocarbons in
experimental skin carcinogenesis. Europ J Cancer 3:497-501.
Gaylor, D.W., S.J. Culp, L.S. Goldstein and F.A. Beland. 2000. Cancer risk estimation for mixtures
of coal tars and benzo(a)pyrene. Risk Analysis 20(1):82-85.
Grover, P.L. and P. Sims P. 1968. Enzyme-catalysed reactions of polycyclic hydrocarbons with
deoxyribonucleic acid and protein in vitro. Biochem J 110:159-160.
Habs, M., D. Schmähl and J. Misfeld. 1980. Local carcinogenicity of some environmentally
relevant polycyclic aromatic hydrocarbons after lifelong topical application to mouse skin. Arch
Geschwulstforsch 50:266-274.
Hass B.S., E.E. Brooks, K.E. Schumann and S.S. Dornfeld. 1981. Synergistic, additive, and
antagonistic mutagenic responses to binary mixtures of benzo(a)pyrene and benzo(e)pyrene
as detected by strains TA98 and TA100 in the Salmonella/microsome assay. Environ Mutagen
3(2):159-66.
Comments on Development of a Relative Potency Factor (RPF) Approach for PAH Mixtures 38

Haugen, D.A. and M. J. Peak. 1983. Mixtures of polycyclic aromatic compounds inhibit
mutagenesis in the Salmonella/microsome assay by inhibition of metabolic activation. Mut Res
116:257-269.
Hecht, S.S., W.E. Bondinell and D. Hoffman. 1974. Chrysene and methylchrysenes: presence on
tobacco smoke and carcinogenicity. J Natl Cancer Inst 53:1121-1133.
Hermann, M., O. Chaude, N. Weill, H. Bedouelle and M. Hofnung. 1980. Adaptation of the
salmonella/mammalian microsome test to the determination of the mutagenic properties of
mineral oils. Mut Res 77:327-339.
Hermann, M. 1981. Synergistic effects of individual polycyclic aromatic hydrocarbons on the
mutagenicity of their mixtures. Mutat Res 90:399-409.
Hill, W.T., D. W. Stanger, A. Pizzo, B. Riegel, P. Shubik and W. B. Wartman. 1951. Inhibition of
9,10-dimethyl-1,2-benzanthracene skin carcinogenesis in mice by polycyclic hydrocarbons.
Can Res 11:892-897.
Hill, W.T., D.W. Stanger, A. Pizzo, B. Riegel and W.B. Wartman. 1952. Inhibition of skin
carcinogenesis in mice by mixtures of strong carcinogens. Can Res 12:270-271.
Hoffmann, D. and E.L. Wynder. 1966. [Contribution on the carcinogenic effect of dibenzopyrenes].
Z Krebsforsch 68:137-149.
Hoffmann, D., G. Rathkamp, S. Nesnow et al. 1972. Fluoranthenes: quantitative determination in
cigarette smoke, formation by pyrolysis and tumor initiating activity. J Natl Cancer Inst
49:1165-1175.
Huberman, E. and L. Sachs. 1976. Mutability of different genetic loci in mammalian cells by
metabolically activated carcinogenic polycyclic hydrocarbons. Proc Natl Acad Sci USA 73:188
192.
Huggins, C., L. Grand and R. Fukunishi. 1964. Aromatic influences on the yields of mammary
cancers following administration of 7,12-dimethylbenz(a)anthracene. Proc Nat Acad Sci
51:737-742.
Hughes N.C. and D.H. Phillips. 1990. Covalent binding of dibenzpyrenes and benzo[a]pyrene to
DNA: evidence for synergistic and inhibitory interactions when applied in combination to
mouse skin. Carcinogenesis 11(9):1611-9.
Huh, T. and J.A. McCarter. 1960. Phenanthrene as an anti-initiating agent. Br J Cancer 14:591
595.
International Agency for Research on Cancer (IARC). 1983. IARC Monograph on the Evaluation
of the Carcinogenic Risk of Chemicals to Humans, Volume 32: Polynuclear Aromatic
Compounds, Part 1, Chemical, Environmental and Experimental Data. IARC: Lyon.
Comments on Development of a Relative Potency Factor (RPF) Approach for PAH Mixtures 39

International Agency for Research on Cancer (IARC). 2010. IARC Monographs on the Evaluation
of Carcinogenic Risks to Humans, Volume 92: Some Non-heterocyclic Polycyclic Aromatic
Hydrocarbons and Some Related Exposure.
Johnsen, N.M., P.E. Schwarze, S.H. Nyholm et al. 1997. Genotoxic effects of cyclopenta-fused
polycyclic aromatic hydrocarbons in different types of isolated rat lung cells. Carcinogenesis
18:193-199.
Kaden, D.A., R.A. Hites and W.G. Thilly. 1979. Mutagenicity of soot and associated polycyclic
aromatic hydrocarbons to Salmonella typhimurium. Cancer Res 39:4152-4159.
Kotin, P., H.L. Falk, W. Lijinsky and L. Zechmeister. 1956. Inhibition of the effect of some
carcinogens by their partially hydrogenated derivatives. Science 123:102.
Lacassagne, A., N.P. Buu-Hoi and G. Rudali. 1945. Inhibition of the carcinogenic action produced
by a weakly carcinogenic hydrocarbon on a highly active carcinogenic hydrocarbon. Brit J
Expt Path 26:5-12.
Lacassagne, A., N.P. Buu-Hoi and F. Zajdela et al. 1968. The true dibenzo[a,l]pyrene, a new,
potent carcinogen. Naturwissenschaften 55:43.
LaVoie, E.J., S. Amin, S.S. Hecht et al. 1982. Tumour initiating activity of dihydrodiols of
benzo[b]fluoranthene, benzo[j]fluoranthene, and benzo[k]fluoranthene. Carcinogenesis 3:49
52.
LaVoie, E.J., J. Braley, J.E. Rice et al. 1987. Tumorigenic activity of non-alternant polynuclear
aromatic hydrocarbons in newborn mice. Cancer Lett 34:15-20.
LaVoie, E.J., Z.W. Cai, C.L. Meschter et al. 1994. Tumorigenic activity of fluoranthene, 2
methylfluoranthene and 3-methylfluoranthene in newborn CD-1 mice. Carcinogenesis
15:2131-2135.
LaVoie, E.J., Z.M. He, Y. Wu et al. 1994. Tumorigenic activity of the 4,5- and 9,10-dihydrodiols of
benzo[j]fluoranthene and their syn- and anti-diol epoxides in newborn mice. Cancer Res
54:962-968.
Lee-Ruff, E., H. Kruk and M. Katz. 1984. A short synthesis of 4,5-methanochrysene and 6-oxo-7
oxabenzo[a]pyrene, two benzo[a]pyrene analogues. J Org Chem 49:553-555.
Mahadevan, B., C.P. Marston, A. Luch, W.M. Dashwood, E. Brooks, C. Pereira, J. Doehmer and
W.M. Baird. 2007. Competitive inhibition of carcinogen-activating CYP1A1 and CYP1B1
enzymes by a standardized complex mixture of PAH extracted from coal tar. Int J Cancer
120(6):1161-1168.
Maronpot, R.R. 1991. Correlation of data from the strain A mouse bioassay with long-term
bioassays. Exp Lung Res 17: 425-431.
Comments on Development of a Relative Potency Factor (RPF) Approach for PAH Mixtures 40
Martin, C.N., A.C. McDermid and R.C. Garner. 1978. Testing of known carcinogens and
noncarcinogens for their ability to induce unscheduled DNA synthesis in HeLa cells. Cancer
Res 38:2621-2627.
Mass, M.J., A.J. Jeffers, J.A. Ross et al. 1993. Ki-ras oncogene mutations in tumors and DNA
adducts formed by benz[j]aceanthrylene and benzo[a]pyrene in the lungs of strain A/J mice.
Mol Carcinog 8:186-192.
McCann, J., E. Choi, E. Yamasaki et al. 1975. Detection of carcinogens as mutagens in the
salmonella/microsome test: assay of 300 chemicals. Proc Natl Acad Sci USA 72:5135-5139.
McKee, R.H., M.J. Nicolich, R.A. Scala and S.C. Lewis. 1990. Estimation of Epidermal
Carcinogenic Potency. Fund Appl Toxicol 15: 320-328.
Mersch-Sundermann, V., H.S. Rosenkranz and G. Klopman. 1992. Structural basis of the
genotoxicity of polycyclic aromatic hydrocarbons. Mutagenesis 7:211-218.
META Environmental, Inc. 2001. Memo from Larry Craig, Laboratory Director, to Dr. Lawrence
Goldstein, EPRI, Re: GC/MS Method Verification for 7H-Benzo(c)fluorene. August 27.
Miller, E.C., J.A. Miller, R.R. Brown and J.C. MacDonald. 1958. On the protective action of certain
polycyclic aromatic hydrocarbons against carcinogenesis by aminoazo dyes and 2
acetylaminofluorene. Can Res 18:469-477.
National Research Council (NRC). 1993. Issues in Risk Assessment. National Academy Press,
Washington D.C.
Neal, J. and R.H. Rigdon. 1967. Gastric tumors in mice fed benzo(a)pyrene: a quantitative study.
Tex Rep Biol Med 25(4):553-557.
Nesnow, S., A. Gold, R. Sangaiah et al. 1984. Mouse skin tumor-initiating activity of
benz[e]aceanthrylene and benz[l]aceanthrylene in Sencar mice. Cancer Lett 22:263-268.
Nesnow, S., J.A. Ross, M.J. Mass et al. 1998. Mechanistic relationships between DNA adducts,
oncogene mutations, and lung tumorigenesis in strain A mice. Exp Lung Res 24:395-405.
Nesnow, S., M.J. Mass, J.A. Ross, A.J. Galati, G.R. Lambert, C. Gennings, W.H. Carter Jr., and
G.D. Stoner, 1998a. Lung Tumorigenic Interactions in Strain A/J Mice of Five Environmental
Polycyclic Aromatic Hydrocarbons. Environmental Health Perspectives. 106:Supplement 6.
December 1998
Pahlman, R. and O. Pelkonen. 1987. Mutagenicity studies of different polycyclic aromatic
hydrocarbons: the significance of enzymatic factors and molecular structure. Carcinogenesis
8:773-778.
Comments on Development of a Relative Potency Factor (RPF) Approach for PAH Mixtures 41

Pelroy, R.A. and M.R. Petersen. 1979. Use of Ames test in evaluation of shale oil fractions. Env.
Health. Perspectives 30:191-203.
Petrilli, F.L., G.P. DeRenzi, and S. De Flora. 1980. Interaction between polycyclic aromatic
hydrocarbons, crude oil, and oil dispersants in the Salmonella mutagenesis assay.
Carcinogenesis 1:51-56.
Pfeiffer, E.H.. 1973. Investigations on the carcinogenic burden ay air pollution in man. VII. Studies
on the oncogenic interaction of polycyclic aromatic hydrocarbons. Abl Bakt Hyg 158(B):69-83.
Pfeiffer, E.H. 1977. Oncogenic Interaction of Carcinogenic and Non-Carcinogenic Polycyclic
Aromatic Hydrocarbons in Mice. Hygiene Institute, Johannes Gutenberg University, Mainz,
Federal Republic of Germany, pp. 69-77.
Raveh, D., T.J. Slaga and E. Huberman. 1982. Cell-mediated mutagenesis and tumor-initiating
activity of the ubiquitous polycyclic hydrocarbon, cyclopenta[c,d]pyrene. Carcinogenesis
3:763-766.
Rice, J.E., G.S. Makowski, T.J. Hosted, Jr. et al. 1985. Methylene-bridged bay region chrysene
and phenanthrene derivatives and their keto-analogs: mutagenicity in Salmonella typhimurium
and tumor-initiating activity on mouse skin. Cancer Lett 27:199-206.
Rice, J.E., K. Jordan, P. Little et al. 1988. Comparative tumor-initiating activity of methylene
bridged and bay-region methylated derivatives of benz[a]anthracene and chrysene.
Carcinogenesis 9:2275-2278.
Robinson, M., R.J. Bull, G.L. Knutsen, R.P. Shields and J. Stober. 1986. A combined carcinogen
bioassay utilizing both the lung adenoma and skin papilloma protocols. Environ Health
Perspect 68:141-145.
Rossman, T.G., M. Molina L. Meyer et al. 1991. Performance of 133 compounds in the lambda
prophage induction endpoint of the microscreen assay and a comparison with Salmonella
typhimurium mutagenicity and rodent carcinogenicity assays. Mutat Res 260:349-367.
Sangaiah R., A. Gold, G.E. Toney et al. 1983. Benz[j]aceanthrylene: A novel polycyclic aromatic
hydrocarbon with bacterial mutagenic activity. Mutat Res 119:259-266.
Schmähl, D., K.G. Schmidt and M. Habs. 1977. Syncarcinogenic action of polycyclic
hydrocarbons in automobile exhaust gas condensates. IARC Sci Publ 16:53-59.
Schmeltz, I., J. Tosk, J.Hilfrich, N. Horotam D. Hoffmann and E.L. Wynder. 1978. Bioassays for
naphthalene and alkylnaphthalenes for co-carcinogenic activity, relation to tobacco
carcinogenesis. Carcinogenesis 3:47-60.
Schneider, K., M. Roller, F. Kalberlah, U. Schuhmacher-Wolz. 2002. Cancer risk assessment for
oral exposure to PAH mixtures. J App Toxicol 22:73-83.
Comments on Development of a Relative Potency Factor (RPF) Approach for PAH Mixtures 42

Schoket, B., A. Hewer, P.l. Grover and D.H. Phillips. 1989. 32P-Postlabeling analysis of DNA
adducts in the skin of mice treated with petrol and diesel engine lubricating oils and exhaust
condensates. Carcinogenesis 10:1485-1490.
Shahin, M.M. and F. Fournier. 1978. Suppression of Mutation Induction and Failure to Detect
Mutagenic Activity with Athabasca Sand Fractions. Mut Res 58:29-34.
Slaga, T.J., E. Hubermann, J.K. Selkirk et al. 1978. Carcinogenicity and mutagenicity of
benz[a]anthracene diols and diol-epoxides. Cancer Res 38:1699-1704.
Slaga, T.J., L. Jecker, W.M. Bracken and C.E. Weeks. 1979. The effects of weak or non
carcinogenic polycyclic hydrocarbons on 7,12-dimethylbenz[a]anthracene and benzo[a]pyrene
skin tumor-initiation. Cancer Letters 7:51-59.
Slaga, T.J., R.P. Iyer, W. Lyga et al. 1980. Comparison of the skin tumor-initiating activities of
dihydrodiols, diol-epoxides, and methylated derivatives of various polycyclic aromatic
hydrocarbons. In: Bjorseth, A. and A.J. Dennis, eds. Polynuclear Aromatic Hydrocarbons:
Chemistry and Biological effects. Battelle Press, Columbus, Ohio. pp. 753–769.
Slaga, T.J. 1983. Overview of Tumor Promotion in Animals. Environ Health Perspectives 50:3-14.
Slaga, T.J. and R.K. Boutwell. 1977. Inhibition of the tumor-initiating ability of the potent
carcinogen 7,12-dimethylbenz(a)anthracene by the weak tumor initiator 1,2,3,4
dibenzanthracene. Cancer Res 37: 128-133.
Smolarek, T.A., W.M. Baird, E.P. Fisher and J. DiGiovanni. 1987. Benzo(e)pyrene-induced
Alterations in the Binding of Benzo(a)pyrene and 7,12-dimethylbenz(a)anthracene to DNA in
Sencar Mouse Epidermis. Can Res 47:3701-3706.
Smolarek, T.A. and W.M. Baird. 1984. Benzo[e]pyrene-induced alterations in the binding of
benzo[a]pyrene to DNA in hamster embryo cell cultures. Carcinogenesis 5:1065-1069.
Steiner, P.F. and H.L. Falk. 1951. Summation and inhibition effects of weak and strong
carcinogenic hydrocarbons: 1:2-Benzanthracene, chrysene, 1:2:5:6-dibenzanthracene, and
20-methylcholanthrene. Cancer Res 11:56-63.
Stanger, D.W., W.T. Hill, A. Pizzo, B. Riegel and W.B. Wartman. 1952. The effect of varying
concentrations on the inhibition of chemical skin carcinogenesis in mice. Abstract Cancer Res
12(4):299.
Stoner, G.D. 1991. Lung Tumors in Strain A Mice as a Bioassay for Carcinogenicity of
Environmental Chemicals. Experimental Lung Research 17(2):405-423.
U.S. Environmental Protection Agency (EPA). 1988. Summary of the Second EPA Workshop on
Carcinogenesis Bioassay via the Dermal Route. EPA560/6-89-003. Research Triangle Park,
North Carolina. May.
Comments on Development of a Relative Potency Factor (RPF) Approach for PAH Mixtures 43

U.S. Environmental Protection Agency (EPA). 1993. Provisional Guidance for Quantitative Risk
Assessment of Polycyclic Aromatic Hydrocarbons. Office of Health and Environmental
Assessment, Environmental Criteria and Assessment Office, Cincinnati, Ohio.
U.S. Environmental Protection Agency (EPA). 2000. Supplementary Guidance for Conducting
Health Risk Assessment of Chemical Mixtures. EPA/630/R-00/002. Risk Assessment Forum
Technical Panel. August.
U.S. Environmental Protection Agency (EPA). 2002. Toxicological Review of Phenol (CAS No.
108-95-2) In Support of Summary Information on the Integrated Risk Information System.
Washington, DC. September.
U.S. Environmental Protection Agency (EPA). 2005. Guidelines for Carcinogen Risk Assessment.
Risk Assessment. EPA/630/P-03/001B. March.
Environmental Protection Agency (EPA). 2010. Development of a Relative Potency Factor (RPF)
Approach for Polycyclic Aromatic Hydrocarbon (PAH) Mixtures – In Support of Summary
Information on the Integrated Risk Information System (IRIS). EPA/635/R-08/012A. February.
Van Duuren, B.L., A. Sivak, B.M. Goldschmidt et al. 1970. Initiating activity of aromatic
hydrocarbons in two-stage carcinogenesis. J Natl Cancer Inst 44:1167-1173.
Viaje, A., J.L. Lu, N. E. Hopkins, A. N. Nettikumara, J. DiGiovannia, W.L. Alworth and T.J. Slaga.
1990. Inhibition of the binding of 7,12-dimethylbenz[a]anthracene and benzo[a]pyrene to DNA
in mouse skin epidermis by 1-ethynylpyrene. Carcinogenesis 11:1139-1143.
Wartman, W.B., P. Shubik, W.T. Hill, B.B. Reeb, D. W. Stanger and B. Riegel. 1950. Delay of
Methylcholanthrene Carcinogenesis by 1,2,5,6-Dibenzofluorene. Can Res 10:247.
Wattenberg, L.W. 1985. Chemoprevention of Cancer. Can Res 45:1-8.
Wenzel-Hartung, R., H. Brune, G. Grimmer et al. 1990. Evaluation of the carcinogenic potency of
four environmental polycyclic aromatic compounds following intrapulmonary application in
rats. Exp Pathol 40:221-227.
Weyand, E.H., Z.M. He, F. Ghodrati et al. 1992. Effect of fluorine substitution on
benzo[j]fluoranthene genotoxicity. Chem Biol Interact 84:37-53.
Weyand, E.H., B. Parimoo, K.R. Reuhl, L.S. Goldstein, J.Q. Wang and R.G. Harvey. 2004. 7H
benzo[c]fluorene: a potent systemic lung carcinogen. Polycyclic Aromatic Compounds 24:1
20.
Wheatly, D.N. 1988. Enhancement and Inhibition of the Induction by 7,12
dimethylbenz(a)anthracene of mammary tumours in female sprague-dawley rats. Br J Cancer
22:787-792.
Comments on Development of a Relative Potency Factor (RPF) Approach for PAH Mixtures 44

Wislocki, P.G., E.S. Bagan, A.Y. Lu et al. 1986. Tumorigenicity of nitrated derivatives of pyrene,
benz[a]anthracene, chrysene and benzo[a]pyrene in the newborn mouse assay.
Carcinogenesis 7:1317-1322.
Wood, A.W., W. Levin, R.L. Chang et al. 1980. Mutagenicity and tumor-initiating activity of
cyclopenta[c,d]pyrene and structurally related compounds. Cancer Res 40:642–649.
Comments on Development of a Relative Potency Factor (RPF) Approach for PAH Mixtures 45

1
Appendix A
Comments on Charge Questions
Comments on Development of a Relative Potency Factor (RPF) Approach for PAH Mixtures

1
Appendix B
Validation Exercises
Comments on Development of a Relative Potency Factor (RPF) Approach for PAH Mixtures

1
Appendix C
Benchmark Dose Modeling
Results, Spot Checking of EPA
(2010) Conclusions
Comments on Development of a Relative Potency Factor (RPF) Approach for PAH Mixtures

1
Appendix D
Benchmark Dose Modeling
Results, Cancer Slope Factor
Derivations, Benzo[a]pyrene and
Coal Tar Mixtures
Comments on Development of a Relative Potency Factor (RPF) Approach for PAH Mixtures

Appendix A. Comments on Charge Questions
The commenters have reviewed the “Proposed Draft Charge to External Reviewers for the
Development of a Relative Potency Factor (RPF) Approach for Polycyclic Aromatic Hydrocarbon
(PAH) Mixtures for the IRIS Program, February 2010” and provide the following comments on
some of those charge questions.
General Charge Questions
1. Please comment on whether the report is logical, clear and concise. Please comment on
whether EPA has clearly synthesized the scientific evidence for the derivation of relative
potency factors for individual PAHs.
Comment: EPA (2010) has summarized a large number of studies on PAHs but it has not
presented a logical, clear and concise report. Specifically, the document:
Does not address the scientific appropriateness of using animal bioassay results from
tests that were designed for hazard identification and not quantitative dose-response
modeling.
EPA has not performed a weight-of-evidence assessment in accordance with EPA
(2005) criteria.
EPA has derived RPFs for many PAHs that are relative to an outdated Cancer Slope
Factor (CSF) for benzo[a]pyrene (BaP).
EPA has not adequately assessed the data quality of the studies, such as whether
there is a reasonable degree of certainty about the identity and purity of the test
substance studied in the individual scientific reports.
EPA has derived dose-response curve slopes for a majority of the PAH data sets with
data in which only one dose group was tested, thus generating slope factors with
extremely high uncertainties.
EPA has excluded information in studies that compared the tumorigenic potency of
multiple PAHs unless BaP was concurrently tested.
EPA has used its Benchmark Dose Modeling Software (BMDS) for dose-response
modeling, but only tested the model fits to one model, multistage for tumor incidence
results and linear for tumor multiplicity results.
2. Please comment on whether the report provides adequate context for how the proposed RPF
approach could be used in a PAH mixtures risk assessment.

Comment: The EPA (2010) draft implies that the RPFs will be used to assess each PAH
using a CSF for BaP, but the CSF for BaP is not discussed in detail except in an example
calculation and is based on an outdated BaP CSF. The CSF for BaP needs to be updated with
current, robust animal toxicology studies.
Chapter 2. Rationale for Recommending an RPF Approach
2a. Please comment on whether the report provides adequate justification for using an RPF
approach as a scientifically defensible method to assess the cancer risk associated with
exposure to PAH mixtures.
Comment: EPA’s The Supplemental Guidance for Conducting Health Risk Assessment of
Chemical Mixtures (EPA 2000), states: “Whenever possible, the preferred approach to the
health risk evaluation of chemical mixtures is to perform the assessment using health effects
and exposure data on the whole mixture.” EPA (2010) acknowledges this by stating: “The
Supplemental Guidance for Conducting Health Risk Assessment of Chemical Mixtures (U.S.
EPA, 2000) indicates that approaches based on whole mixtures are preferred to component
approaches, such as the RPF approach. Risk assessment approaches based on toxicity
evaluations of whole mixtures inherently address specific interactions among PAHs and
account for the toxicity of unidentified components of PAH mixtures. They also do not require
assumptions regarding the toxicity of individual components (e.g., dose additivity or response
additivity).” However, EPA (2010) states that while preferred, this whole mixture approach is
not practical and proceeds to develop the RPF approach. The whole mixtures approach to
PAHs is practical in that:
There are toxicity data available on numerous PAH-containing mixtures.
Epidemiological studies and health surveys have been performed over the years on
workers exposed to PAH-containing mixtures.
Chemical analyses of the mixtures that have been well studied are more
comprehensive than the analyses of typical environmental media for which the RPF
approach is intended for use.
2b. Please comment on whether the choice of benzo[a]pyrene as the index compound is
scientifically justified and appropriately described. Please identify and provide the rationale for
any alternative index compound(s) that should be considered.
Comment: EPA (2010) states that BaP is the logical choice to be the index PAH for a PAH
RPF approach. However, many studies have used 3-methylchloanthrene (3-MC) or 7,12-
dimethyl-benz[a]anthracene (DMBA) as positive controls instead of or in addition to BaP.
EPA should fully evaluate the utility of studies with these two alternate PAHs.

2c. Please comment on whether the weight of evidence indicating that PAHs, as a chemical class,
have a similar mode of carcinogenic action has been adequately described and is scientifically
justified.
Comment: EPA has not adequately described and scientifically justified that all PAHs have the
same mode of action and in EPA (2010), Section 2.4 it asserts that there may be many modes
of action for PAHs. EPA should review the assumption that PAHs, as a chemical class, have a
similar mode of action using EPA’s 2005 Cancer Guidelines section on determining a mode of
action for carcinogenesis and present the data in accord with their MOA framework.
2d. Please comment on whether the assumption that interactions among PAH mixture
components do not occur at low levels of exposure typically encountered in the environment
has been adequately described and is scientifically justified.
Comment: EPA (2010) has not adequately described or scientifically justified the presence or
absence of interactions among PAH mixture components at levels of exposure encountered in
the environment. Specifically inhibitory interactions, have been seen among PAHs at doses
similar to those typically encountered in the environment, EPA’s assumption that interactions
will not occur is not supported by the scientific literature.
Chapter 3. Discussion of Previously Published RPF Approaches
3. Please comment on whether the discussion provides a meaningful background on how RPFs
have been derived in the past, and the advantages and disadvantages of previous methods.
Comment: EPA (2010) does provide a few citations and a comprehensive table of a dozen or
so previous RPF schemes. EPA presents little text that criticizes any of these approaches or
discusses in depth the uncertainties involved in any RPF scheme. In fact, EPA (2010)
concludes that all of these approaches are reasonable and yield similar results:
“In summary, several approaches are available for the determination of RPFs for PAHs. RPF
values are proposed in at least one study for a total of 27 PAHs (see Table 3-1). Because
these approaches generally rely on similar bioassay data and modeling methods, the resulting
RPF values are fairly comparable for most PAHs across studies.”
EPA’s conclusion is not consistent with the actual RPF values presented. Table 3-1 clearly
indicates that there is vast variability and uncertainty associated with the RPF derivation
process. RPFs vary by 10-100 fold among investigators and sometimes even higher. For
instance, the RPFs for chrysene vary from 0.001 to 0.9. For anthanthrene, they vary from 0-
.01. Benzo[j]fluoranthene RPFs vary from 0.05 to 0.5, For benzo[a]anthrene, the RPFs vary
from 0.004 to 0.15. For indeno[123,cd]pyrene, the RPFs vary from 0.006 to 0.1.

Chapter 4. Evaluation of the Carcinogenicity of Individual PAHs
4a. Please comment on whether the list of 74 PAHs (Table 2-1) included in the initial literature
search is complete. Please comment on whether the rationale for the choice of PAHs included
in the literature search has been appropriately described. Please identify other databases or
resources that should be included.
Comment: Restricting the PAH list to include only “unsubstituted PAHs with three or more
fused aromatic rings containing only carbon and hydrogen atoms,” is scientifically justified as
these are the most widely studied members of the PAH chemical class.”
4b. Chapter 4 includes a description of how studies were selected for use in dose-response
assessment. Please comment on whether the choices and assumptions in making the
selection have been adequately described. Please comment on whether the information in
Tables 4-1 through 4-14 provides adequate information to inform how decisions were made.
Please comment on whether studies were rejected or included appropriately. Please comment
on whether positive and nonpositive studies have been considered appropriately.
Comment: EPA should review and refine the selection criteria. Specifically, EPA required that
“Benzo[a]pyrene was tested simultaneously with another PAH” and that “The carcinogenic
response observed in either the benzo[a]pyrene- or other PAH-treated animals at the lowest
dose level was not saturated (i.e., tumor incidence at the lowest dose was <90%), with the
exception of tumor multiplicity findings”. The use of these two criteria eliminated numerous
relevant studies from consideration.
Chapter 5. Methods for Dose Response Assessment and RPF Calculation
5a. Please comment on whether the scientific rationale for the dose-response modeling
approaches used in the derivation of RPFs is adequately described. Please comment on
whether there are other appropriate modeling approaches for estimating the relative potencies
of PAHs. Please describe alternative approaches (e.g., other model forms) that could be
considered.
Comment: EPA (2010) does not provide criteria for defining a “good fit” of the data. When
Benchmark Dose Modeling of multi-dose results provided a “poor fit,” EPA’s protocol required
that “point estimates” from single dose groups be used for RPF derivation instead of slope
factors using modeling of the entire dataset. The Benchmark Dose Software generates three
goodness-of-fit metrics to guide in the selection of the optimal model however, EPA’s judgment
of “fitness” were not documented. Tables in EPA’s Appendix E report in some cases that there
was “no model fit,” but the criteria for making this determination are not provided, nor are the
Benchmark Dose Modeling outputs.
Consequently, when EPA defaulted to the “point estimate” approach because of a “poor model
fit,” EPA defaulted to a “point estimate” approach that required a slope factor be developed
from a dose-response “curve” defined by a single dose group. EPA’s modeling approach as
executed has a major impact on the RPF derivation process because only 28% of the data
sets were modeled using slope factors based on more than one data point for both PAHs.
Most of the data sets used slopes derived from a single data point, which introduces a
significant uncertainty. Specifically, of the 43 data sets listed in EPA’s tables:
18 (42%) used a single BaP dose and single doses for other PAHs
13 (30%) used a single BaP dose and a dose-response curve for other PAHs
12 (28%) used a dose-response curve for BaP dose and a dose-response curve for
other PAHs
Thus, EPA based 72% of the RPFs on ratios of “slopes” that were derived using a single data
point for one or both of the PAHs being compared.
5b. For each individual dataset considered in the assessment, the B[a]P dose-response was
calculated from the study-specific data. Please comment on whether this approach has been
appropriately described. If there are additional approaches using the available data that should
be considered, please describe how the approach could lead to a better estimate of cancer
risk.
Comment: EPA presented all of the quantitative data in EPA’s Appendix C tables, but the key
summary Tables listed here could be improved by adding additional data about dose groups.
Specifically, some data sets were marked ”no model fit” which resulted in the use of the
reported point estimate approach. In other cases, the point estimate approach was used
without any reference to modeling.
5c. The point of departure for slope estimation that has been used for the derivation of RPFs is the
benchmark dose (BMD) estimate rather than the lower confidence limit on the benchmark dose
(BMDL). Please comment on whether this approach is scientifically justified and adequately
described. Please comment on whether alternative approaches should be considered.
Comment: EPA’s decision to base the ratios on the estimate of the BMD rather than the
BMDL is valid.
Chapter 6. Selection of PAHs for Inclusion in the Relative Potency Approach
6a. Please comment on whether the rationale for the weight-of-evidence evaluation is scientifically
justified and adequately described. Please comment on whether the approach adequately
considers the available information. Please comment on whether other information (e.g.,

additional structure-activity) could contribute further to the weight-of-evidence evaluation and
how this information could be utilized in the analysis.
Comment: Carcinogenic potential should be evaluated within the current EPA Cancer
Guidelines (EPA 2005) and clearly presented and weighted in the RPF approach. Examples of
where this would add clarity and scientific credibility to the proposed approach include the
following:
1. EPA indicates PAHs selected for inclusion in the RPF approach were initially chosen based
on an “evaluation of whether the available data were adequate to assess the
carcinogenicity of each compound.” (Chapter 6, page 113, paragraph 1). Based on this, 35
PAHs were identified for further evaluation. EPA should clearly define “carcinogenicity” for
this step within the context of the relevance to potential to be carcinogenic to humans with
consideration of EPA’s 2005 Cancer Guidelines.
2. The proposed RPF approach appears to rely on the 1994 IRIS toxicological assessment
for benzo(a)pyrene and seems to assume that the weight of evidence for carcinogenic
potential for benzo(a)pyrene (“Classification - B2; probable human carcinogen”) is relevant
to all of the PAHs included in the proposed RPF approach. The rationale should be justified
within the context of study data and the “weight of evidence for the carcinogenic hazard
potential” to humans should be consistent with the 2005 Cancer guidelines for each PAH.
6b. The weight-of-evidence analysis does not include data related to Ah-receptor binding,
cytotoxicity or tumor promotion. Please comment on whether the scientific rationale for this
decision is appropriate. If these data should be considered in the derivation of RPFs, please
describe how they should be incorporated into the analysis.
Comment: The presented weight of evidence analysis appears to be inconsistent by not
including data related to AhrR binding. In section 2.6 of the EPA (2010) discusses that the
receptor binding correlates better than mutagenicity with the cancer bioassays.
6d. Graphic arrays of the calculated RPFs (Figures 6-2 through 6-35) are presented as a means of
representing the variability in RPFs from different data sources, the weight-of-evidence for
carcinogenic potential, and the basis for the selected RPF. Please comment on whether the
figures are informative and adequately described. Please comment on whether there is other
information that should be included in the figures. Please comment on whether the narratives
are informative and complete.
Comment: The graphic arrays provide misleading information and should be improved. EPA
(2010) presents all derived RPFs in the graphical arrays, but not all of these RPFs are
averaged to derive the final RPF presented in Table 1, as noted in the draft document
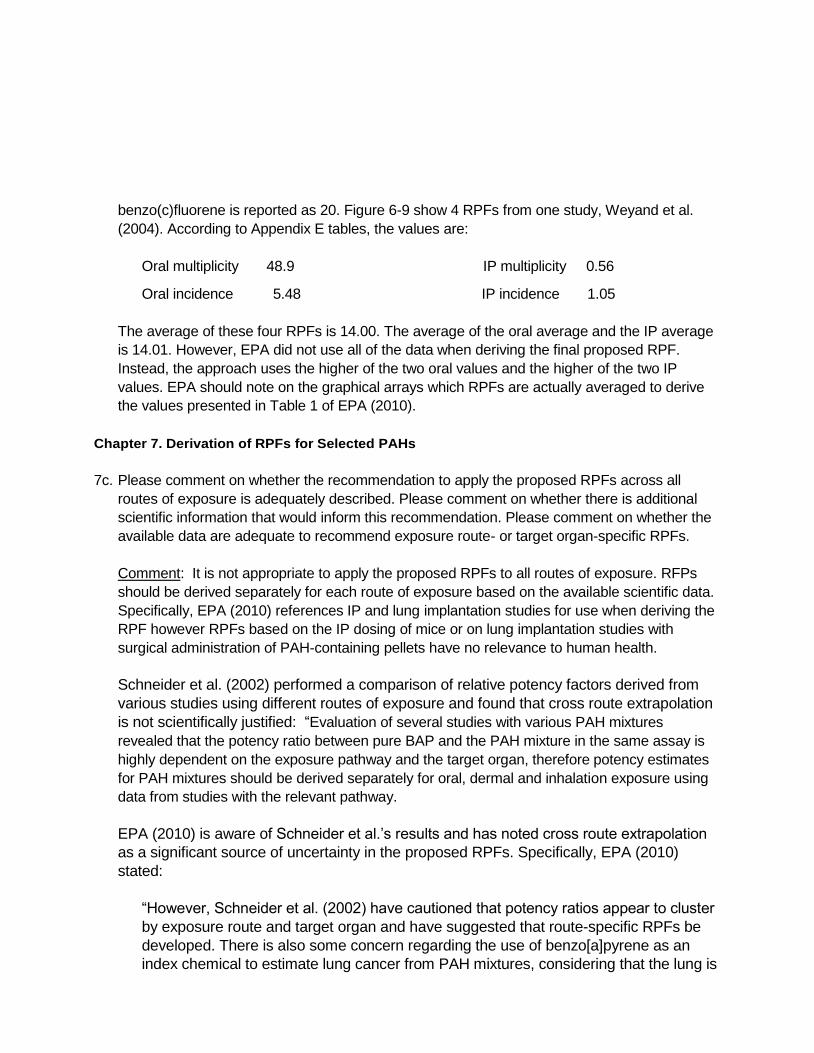
benzo(c)fluorene is reported as 20. Figure 6-9 show 4 RPFs from one study, Weyand et al.
(2004). According to Appendix E tables, the values are:
Oral multiplicity 48.9 IP multiplicity 0.56
Oral incidence 5.48 IP incidence 1.05
The average of these four RPFs is 14.00. The average of the oral average and the IP average
is 14.01. However, EPA did not use all of the data when deriving the final proposed RPF.
Instead, the approach uses the higher of the two oral values and the higher of the two IP
values. EPA should note on the graphical arrays which RPFs are actually averaged to derive
the values presented in Table 1 of EPA (2010).
Chapter 7. Derivation of RPFs for Selected PAHs
7c. Please comment on whether the recommendation to apply the proposed RPFs across all
routes of exposure is adequately described. Please comment on whether there is additional
scientific information that would inform this recommendation. Please comment on whether the
available data are adequate to recommend exposure route- or target organ-specific RPFs.
Comment: It is not appropriate to apply the proposed RPFs to all routes of exposure. RFPs
should be derived separately for each route of exposure based on the available scientific data.
Specifically, EPA (2010) references IP and lung implantation studies for use when deriving the
RPF however RPFs based on the IP dosing of mice or on lung implantation studies with
surgical administration of PAH-containing pellets have no relevance to human health.
Schneider et al. (2002) performed a comparison of relative potency factors derived from
various studies using different routes of exposure and found that cross route extrapolation
is not scientifically justified: “Evaluation of several studies with various PAH mixtures
revealed that the potency ratio between pure BAP and the PAH mixture in the same assay is
highly dependent on the exposure pathway and the target organ, therefore potency estimates
for PAH mixtures should be derived separately for oral, dermal and inhalation exposure using
data from studies with the relevant pathway.
EPA (2010) is aware of Schneider et al.’s results and has noted cross route extrapolation
as a significant source of uncertainty in the proposed RPFs. Specifically, EPA (2010)
stated:
“However, Schneider et al. (2002) have cautioned that potency ratios appear to cluster
by exposure route and target organ and have suggested that route-specific RPFs be
developed. There is also some concern regarding the use of benzo[a]pyrene as an
index chemical to estimate lung cancer from PAH mixtures, considering that the lung is

relatively insensitive to benzo[a]pyrene-induced tumorigenicity following oral exposure
(Gaylor et al., 1998).”
7d. Please comment on whether the scientific rationale for the assignment of an RPF of zero for
some PAHs is adequately described. Please comment on whether there are other data that
should be considered to assess whether an RPF of zero is appropriate. Please comment on
whether the scientific rationale for assigning no RPF based on inadequate data for some PAHs
is adequately described. Please comment on whether there are alternative methods for
assigning RPFs to these PAHs. Please comment on whether the text provides adequate
distinction between PAHs with RPFs of zero and PAHs with no selected RPF and whether this
distinction is useful for describing uncertainty in determining the cancer risk associated with
PAH exposure.
Comment: EPA (2010) states that PAHs with adequate evidence to suggest they have little or
no carcinogenic potential are assigned an RPF of 0. It would be useful to have the RPF rating
correlate with cancer weight of evidence descriptors and as such the assignment of RPFs of 0
would indicate that those PAHs do not pose carcinogenic risk to humans.
7e. The final RPFs are characterized with confidence ratings. Please comment on whether the
rationale for the confidence ratings is appropriately described. Please comment on whether
there are other approaches for describing confidence using the available data that could be
applied in either a qualitative or quantitative manner that would be more useful for risk
assessment.
Comment: EPA should include other factors in rating the confidence of RPF, such as:
How many RPF estimates are available
The availability of identify confirmation and purity data on each study
The relevance of the bioassays used to human health risk assessment
The relevance of the route of administration used to human health risk assessment
The incidence of background tumor rates
The mortality rate of animals in the studies used
The presence of significant toxicity, such as skin lesions, in the studies used
Chapter 8. Uncertainties and Limitations Associated with the RPF Approach
8. Please comment on whether, overall, the document describes the uncertainties and limitations
in the methodology used to derive RPFs in a transparent manner. Please comment on whether
the most important uncertainties and limitations are identified. Please comment on whether

there is existing information that could be used to evaluate the accuracy or validity of the RPF
values to predict the cancer risk associated with exposure to PAH mixtures.
Comment: RPFs that are ranked as having low or very low confidence should be omitted from
the final document. The document should provide examples of validation that demonstrate if
the propose RPFs significantly overestimates or underestimates the actual tumor responses
seen in studies in which animals were doses with PAH-containing mixtures.
Appendices
9. Please comment on whether the information in the Appendices is adequate to allow
independent verification of the calculated RPFs. If not, please comment on what additional
information would be useful.
Comment: Much useful information is presented in the appendices. However, EPA should
provide BMDS output for model runs for which it determined that there was not a good model
fit plus the criteria for making said determination.

Table A-1. Calculation of Human Equivalent Dose (mg/kg-day) for BMDS Input File
Mass Coal Tar Average Feed % ppm (μg/g) μg/day grams/day BW (kg)4 μg/kg-day mg/kg-day BW (kg) Scaling Factor5 mg/kg-day
0.01 100 0.8 b 435 4.4 0.030 14,516 15 70 7.0 2.1 0.03 300 2.4 b 1,306 4.4 0.030 43,549 44 70 7.0 6.3 0.10 1,000 8.0 a 4,355 4.4 0.030 145,164 145 70 7.0 21 0.30 3,000 23.7 a 12,901 4.3 0.030 430,049 430 70 7.0 62 0.60 6,000 47.4 b 25,803 4.3 0.030 860,098 860 70 7.0 124 1.00 10,000 63.0 a 34,295 3.4 0.030 1,143,168 1,143 70 7.0 164 0.03 300 4.0 b 1,449 4.8 0.030 48,309 48.3 70 7.0 7.0 0.10 1,000 13.2 a 4,783 4.8 0.030 159,420 159 70 7.0 23 0.30 3,000 36.3 a 13,152 4.4 0.030 438,406 438 70 7.0 63
0.0005 5 20.5 a NA 4.1 0.030 683 0.68 70 7.0 0.098 0.00 25 104 a NA 4.2 0.030 3,467 3.47 70 7.0 0.499 0.01 100 430 a NA 4.3 0.030 14,333 14.33 70 7.0 2.062
Study Mixture Coal Tar Mixture 1 BaP = 0.1837%2
Coal Tar Mixture 2 BaP = 0.2760%2
Benzo(a)pyrene
Dose Group Concentration in Feed1 Mass BaP3 Administered Dose Human Equivalent Dose
μg/day
Notes: 1. % by mass (coal tar in feed)
2. % by mass (benzo(a)pyrene in coal tar) 3. Mass of BaP equals mass daily feed x % by mass coal tar x % by mass BaP. (a) reported in Culp et al. 1998 pages 121-122; (b) estimated as a proportion of concentrations with
reported mass BaP. Daily food consumption ranges from 2 to 4 g/day.
4. Culp et al. 1998, Figure 1; average body weight ranges from 15 to 40 g during the course of 2 year study, with time-weighted mean of approximately 30 g (or 0.030 kg) 5. Human equivalent dose (D2) = Administered dose (D1) divided by scaling factor. Scaling factor = (BW_human/BW_mouse) 1/4
A1/BW13/4 = A2/BW2
3/4
since 1/BW3/4 = BW1/4/BW (A1/BW1) BW1
1/4 = (A2/BW2) BW21/4
1/4 1/4D1BW1 = D 2BW2
D2 = D1(BW11/4/BW2
1/4) = D1 / (BW2/BW1)1/4

Table A-2. Coal Tar Mixture 1 Dose-response Models and Benchmark Dose Estimates at 10% Effect Levels Applied to Study Results Effect Endpoint Dose-Response
Model (1, 2)
Parameters (2) Goodness-of-Fit POD (%
Effect)
Dose (mg/kg-day) Human CSF
(mg/kg-day)-1 NotesSource Animal Tissue β0 β1 β2 p-value (3) AIC (4) Maximum
Residual (5) BMD BMDL
Culp, 1998 Table III
female B6C3F1 mouse
Liver (hepatocellular adenomas and/or carcinomas) multistage cancer 0.062 0.00061 0 0 196 4.9 10% 171.5 78.9 --
BMDL is out of the three times range of dose for some BMR in BMDL curve computation.
Culp, 1998 Table III
female B6C3F1 mouse
Lung (alveolar/bronchiolar adenomas and/or carcinomas) multistage cancer 0.049 0.0056 0 0.0016 308 3.6 10% 18.8 15.2 6.58E-03
Culp, 1998 Table III, without highest 2 doses
female B6C3F1 mouse
Lung (alveolar/bronchiolar adenomas and/or carcinomas) multistage cancer 0.053 0 0.00020 0.65 164 -1.0 10% 23.2 14.2 7.05E-03
Culp, 1998 Table III
female B6C3F1 mouse
Forestomach (papillomas and/or carcinomas) multistage cancer 0.053 0.0021 0 0.0012 248 2.5 10% 51.0 35.3 2.83E-03
Culp, 1998 Table III, without highest 2 doses
female B6C3F1 mouse
Forestomach (papillomas and/or carcinomas) multistage cancer 0.025 0.0052 0 0.049 143 2.2 10% 20.1 13.0 7.68E-03
Culp, 1998 Table III
female B6C3F1 mouse
Small intestine (adenocarcinomas) multistage cancer 0 0 5.53E-05 0.031 104 -3.1 10% 43.6 38.9 2.57E-03
Culp, 1998 Table III
female B6C3F1 mouse Hemangiosarcomas multistage cancer 0.012 0.0017 0 0 190 -3.6 10% 60.5 44.0 2.27E-03
Culp, 1998 Table III
female B6C3F1 mouse Histiocytic sarcomas multistage cancer 0.012 5.80E-04 0 0.0034 115 3.2 10% 181.7 102.7 9.74E-04
BMDL is out of the three times range of dose for some BMR in BMDL curve computation.
Culp, 1998 Table III
female B6C3F1 mouse Sarcomas multistage cancer 0.060 0 0 0.13 153 2.5 10% -- -- --
BMD computation failed. BMD is larger than three times maximum input doses. BMDL is out of the three times range of dose for some BMR in BMDL curve computation.
Abbreviations AIC = Akaike's Information Criterion CSF = cancer slope factor BMD = benchmark dose POD = point of departure BMDL = 1-sided 95% lower confidence limit for the benchmark dose
Notes 1. USEPA's BMDS v.2.1.1 was used to determine dose-response dichotomous data. 2. Dose response functions for multistage cancer: P[response] = β0 + (1-β0)*[1-EXP( -β1*dose^1-β2*dose^2)];
Dose response function for Hill Model: y + ( v * d n ) / ( k n + d n ), where v=sign, n=power, and k=slope. 3. For dichotomous data, Chi-square test is a hypothesis test in which the null hypothesis is that data fit the dose-response function. Higher p-values indicate better fits.
For continuous data, there are four Maximum Likelihood tests performed by BMDS that test the null hypothesis that the model fits the data as well as the "true" model. Test 1. Tests the hypothesis that response and variance don't differ among dose levels. If this test accepts, there may not be a dose-response. P-values less than 0.1 indicate a model fit.
Test 2. Tests the hypothesis that variances are homogeneous. If this test accepts, the simpler constant variance model may be appropriate. P-values less than 0.1 indicate a model fit.
Test 3. (non-constant variance model) Test the h ypothesis that the variances are adequately modeled. If this test accepts, it may be appropriate to conclude that the variances have been modeled
Test 4. (non-constant variance model). Tests the hypothesis that the model for the mean fits the data. If this tests accepts, the user has support for the selected model. P-values greater than 0.1 indicate a model fit.
4. For each dataset, models with relatively low AIC are indicative of better fits. 5. A scaled residual is the difference between the observed and predicted effect (i.e., percent response) divided by the standard deviation. Absolute value less than 2.0 is indicative of a good fit.
Values in bold are >2.0 References
Culp, S.J. et al. 1998. Carcinogenesis 19(1):117-124; Table III and Table IV.

Table A-3. Coal Tar Mixture 2 Dose-response Models and Benchmark Dose Estimates at 10% Effect Levels Applied to Study Results Effect Endpoint Dose-Response
Model (1, 2)
Parameters (2) Goodness-of-Fit POD (%
Effect)
Dose (mg/kg-day) Human CSF
(mg/kg-day)-1 NotesSource Animal Tissue β0 β1 β2 p-value (3) AIC (4) Maximum
Residual (5) BMD BMDL Culp, 1998
Table III female B6C3F1
mouse Liver (hepatocellular adenomas and/or carcinomas) multistage cancer 0.041 0.003573 0 0.018 127 2.4 10% 29.5 16.5 6.07E-03
Culp, 1998 Table III
female B6C3F1 mouse
Lung (alveolar/bronchiolar adenomas and/or carcinomas) multistage cancer 0.041 0.006972 4.85E-05 0.86 164 -0.13 10% 13.8 8.3 1.20E-02
Culp, 1998 Table III
female B6C3F1 mouse
Forestomach (papillomas and/or carcinomas) multistage cancer 0 0.00389 2.04E-05 0.15 100 1.5 10% 24.1 15.3 6.55E-03
Culp, 1998 Table III
female B6C3F1 mouse
Small intestine (adenocarcinomas) multistage cancer 0 0 5.8E-06 0.98 12 -0.38 10% 135 70.5 1.42E-03
BMDL is out of the three times range of dose for some BMR in BMDL curve computation.
Culp, 1998 Table III
female B6C3F1 mouse Hemangiosarcomas multistage cancer 0.019 3.76E-04 1.00E-04 0.76 115 -0.22 10% 30.6 17.8 5.62E-03
Culp, 1998 Table III
female B6C3F1 mouse Histiocytic sarcomas multistage cancer 0.035 0 5.41E-05 0.48 106 0.93 10% 44.1 22.2 4.51E-03
Culp, 1998 Table III
female B6C3F1 mouse Sarcomas multistage cancer 0.014 0.00174 0 0.29 77 -1.1 10% 60.6 33.0 3.03E-03
BMDL is out of the three times range of dose for some BMR in BMDL curve computation.
Abbreviations AIC = Akaike's Information Criterion CSF = cancer slope factor BMD = benchmark dose POD = point of departure BMDL = 1-sided 95% lower confidence limit for the benchmark dose
Notes 1. USEPA's BMDS v.2.1.1 was used to determine dose-response dichotomous data. 2. Dose response functions for multistage cancer: P[response] = β0 + (1-β0)*[1-EXP( -β1*dose^1-β2*dose^2)];
Dose response function for Hill Model: y + ( v * d n ) / ( k n + d n ), where v=sign, n=power, and k=slope. 3. For dichotomous data, Chi-square test is a hypothesis test in which the null hypothesis is that data fit the dose-response function. Higher p-values indicate better fits.
For continuous data, there are four Maximum Likelihood tests performed by BMDS that test the null hypothesis that the model fits the data as well as the "true" model. Test 1. Tests the hypothesis that response and variance don't differ among dose levels. If this test accepts, there may not be a dose-response. P-values less than 0.1 indicate a model fit.
Test 2. Tests the hypothesis that variances are homogeneous. If this test accepts, the simpler constant variance model may be appropriate. P-values less than 0.1 indicate a model fit.
Test 3. (non-constant variance model) Test the h ypothesis that the variances are adequately modeled. If this test accepts, it may be appropriate to conclude that the variances have been modeled appropriately
Test 4. (non-constant variance model). Tests the hypothesis that the model for the mean fits the data. If this tests accepts, the user has support for the selected model. P-values greater than 0.1 indicate a model fit.
4. For each dataset, models with relatively low AIC are indicative of better fits. 5. A scaled residual is the difference between the observed and predicted effect (i.e., percent response) divided by the standard deviation. Absolute value less than 2.0 is indicative of a good fit.
Values in bold are >2.0 References
Culp, S.J. et al. 1998. Carcinogenesis 19(1):117-124; Table III and Table IV.

Table A-4. Benzo(a)pyrene and Benz(j)aceanthrylene Dose-response Models and Benchmark Dose Estimates at 10% Effect Levels Applied to Study Results Effect Endpoint Dose-Response
Model (1, 2)
Parameters (2) Goodness-of-Fit POD (%
Effect)
Dose (mg/kg-day) Human CSF
(mg/kg-day)-1 NotesSource Animal Tissue β0 β1 β2 p-value (3) AIC (4) Maximum
Residual (5) BMD BMDL Culp, 1998
Table IV female B6C3F1
mouse Liver (hepatocellular adenomas) multistage cancer 0.074 0 0 0.035 102 -1.9 10% -- -- -- BMD computation failed. BMD is larger than three times maximum input doses.
Culp, 1998 Table IV
female B6C3F1 mouse
Lung (alveolar/bronchiolar adenomas and/or carcinomas) multistage cancer 0.048 0 0 0.020 74 1.8 10% -- -- -- BMD computation failed. BMD is larger than
three times maximum input doses.
Culp, 1998 Table IV
without 100ppm Dose
female B6C3F1 mouse
Lung (alveolar/bronchiolar adenomas and/or carcinomas) multistage cancer 0.053 0 0.14 0.022 70 -1.7 10% 0.9 0.4 0.23
Culp, 1998 Table IV
female B6C3F1 mouse
Forestomach (papillomas and/or carcinomas) multistage cancer 0.014 2.2 0 0.011 105 -2.4 10% 0.049 0.038 2.61
Culp, 1998 Table IV
without 100ppm Dose
female B6C3F1 mouse
Forestomach (papillomas and/or carcinomas) multistage cancer 0.019 0 6.0 0.77 84 -0.26 10% 0.133 0.081 1.23
Culp, 1998 Table IV
female B6C3F1 mouse
Esophagus (papillomas and/or carcinomas) multistage cancer 0 0 0.21 0.99 81 -0.31 10% 0.72 0.52 0.19
Culp, 1998 Table IV
female B6C3F1 mouse
Tongue (papillomas and/or carcinomas) multistage cancer 0 0 0.15 0.99 85 -0.27 10% 0.83 0.55 0.18
Culp, 1998 Table IV
female B6C3F1 mouse
Larynx (papillomas and/or carcinomas) multistage cancer 0 0.09 0 0.50 54 1.3 10% 1.2 0.72 0.14
Culp, 1998 Table IV
female B6C3F1 mouse Hemangiosarcomas multistage cancer 0.031 0 0 0.32 55 1.3 10% -- -- -- BMD computation failed. BMD is larger than
three times maximum input doses.
Culp, 1998 Table IV
female B6C3F1 mouse Histiocytic sarcomas multistage cancer 0.026 0 0 0.52 48 -1.14 10% -- -- -- BMD computation failed. BMD is larger than
three times maximum input doses.
Culp, 1998 Table IV
female B6C3F1 mouse Sarcomas multistage cancer 0.053 0 0 0.0059 80 3.0 10% -- -- -- BMD computation failed. BMD is larger than
three times maximum input doses.
Abbreviations AIC = Akaike's Information Criterion CSF = cancer slope factor BMD = benchmark dose POD = point of departure BMDL = 1-sided 95% lower confidence limit for the benchmark dose
Notes 1. USEPA's BMDS v.2.1.1 was used to determine dose-response dichotomous data. 2. Dose response functions for multistage cancer: P[response] = β0 + (1-β0)*[1-EXP( -β1*dose^1-β2*dose^2)];
Dose response function for Hill Model: y + ( v * d n ) / ( k n + d n ), where v=sign, n=power, and k=slope. 3. For dichotomous data, Chi-square test is a hypothesis test in which the null hypothesis is that data fit the dose-response function. Higher p-values indicate better fits.
For continuous data, there are four Maximum Likelihood tests performed by BMDS that test the null hypothesis that the model fits the data as well as the "true" model. Test 1. Tests the hypothesis that response and variance don't differ among dose levels. If this test accepts, there may not be a dose-response. P-values less than 0.1 indicate a model fit.
Test 2. Tests the hypothesis that variances are homogeneous. If this test accepts, the simpler constant variance model may be appropriate. P-values less than 0.1 indicate a model fit.
Test 3. (non-constant variance model) Test the hypothesis that the variances are adequately modeled. If this test accepts, it may be appropriate to conclude that the variances have been modeled
Test 4. (non-constant variance model). Tests the hypothesis that the model for the mean fits the data. If this tests accepts, the user has support for the selected model. P-values greater than 0.1 indicate a model fit.
4. For each dataset, models with relatively low AIC are indicative of better fits. 5. A scaled residual is the difference between the observed and predicted effect (i.e., percent response) divided by the standard deviation. Absolute value less than 2.0 is indicative of a good fit.
Values in bold are >2.0 References
Culp, S.J. et al. 1998. Carcinogenesis 19(1):117-124; Table III and Table IV.

0.5
0.6
0.7
Multistage Cancer Model with 0.95 Confidence Level
Multistage CancerLinear extrapolationBMD Lower Bound
Figure A-1. Coal Tar Mixture 1 BMDS Results for Lung Tumors, Two Highest Doses Removed
Material: Mixture 1 Test animal: Female B6C3F1 Mice Effect: Lung (alveolar/bronchiolar adenomas and/or carcinomas)
Dose % in feed
Human EqvtDose mg/kg-day N Effect
0 0 47 2 0.01 2.1 48 3 0.03 6.3 48 4 0.10 20.9 48 4 0.30 61.9 47 27
Multistage Cancer Model with 0.95 Confidence Level
0
0.1
0.2
0.3
0.4
0.5
0.6
0.7
Frac
tion
Affe
cted
BMDBMDL
Multistage Cancer Linear extrapolation BMD Lower Bound
0 10 20 30 40 50 60
dose 13:54 04/14 2010

0.3
0.4
0.5
d
Multistage Cancer Model with 0.95 Confidence Level
Multistage CancerLinear extrapolation
Figure A-2. Coal Tar Mixture 1 BMDS Results for Forestomach Tumors, Two Highest Doses Removed
Material: Mixture 1 Test animal: Female B6C3F1 Mice Effect: Forestomach (papillomas and/or carcinomas)
Dose % in feed
Human EqvtDose mg/kg-day N Effect
0 0 47 0 0.01 2.1 47 2 0.03 6.3 45 6 0.10 20.9 47 3 0.30 61.9 46 14
Multistage Cancer Model with 0.95 Confidence Level
0
0.1
0.2
0.3
0.4
0.5
Frac
tion
Affe
cted
BMDBMDL
Multistage Cancer Linear extrapolation
0 10 20 30 40 50 60
dose 15:07 04/14 2010

0.4
0.5
0.6
0.7
fect
ed
Multistage Cancer Model with 0.95 Confidence Level
Multistage CancerLinear extrapolationBMD Lower Bound
Figure A-3. Coal Tar Mixture 2 BMDS Results for Lung Tumors
Material: Mixture 2 Test animal: Female B6C3F1 Mice Effect: Lung (alveolar/bronchiolar adenomas and/or carcinomas)
Dose % in feed
Human EqvtDose mg/kg-day N Effect
0 0 47 2 0.03 7.0 48 4 0.10 22.9 48 10 0.30 63.1 47 23
Multistage Cancer Model with 0.95 Confidence Level
0.7
0.6
0.5
0.4
0.3
0.2
0.1
0BMDBMDL
Multistage Cancer Linear extrapolation BMD Lower Bound
fFr
actio
n A
ffect
ed
0 10 20 30 40 50 60
dose 08:53 04/08 2010

0.3
0.4
0.5
ecte
d
Multistage Cancer Model with 0.95 Confidence Level
Multistage CancerLinear extrapolationBMD Lower Bound
fFr
actio
n A
ffect
ed
Figure A-4. Coal Tar Mixture 2 BMDS Results for Forestomach Tumors
Material: Mixture 2 Test animal: Female B6C3F1 Mice Effect: Forestomach (papillomas and/or carcinomas)
Dose % in feed
Human EqvtDose mg/kg-day N Effect
0 0 47 0 0.03 7.0 47 3 0.10 22.9 47 2 0.30 63.1 44 13
Multistage Cancer Model with 0.95 Confidence Level 0.5
0.4
0.3
0.2
0.1
0
BMDBMDL
Multistage Cancer Linear extrapolation BMD Lower Bound
0 10 20 30 40 50 60
dose 08:53 04/08 2010

0.15
0.2
0.25
Affe
cted
Multistage Cancer Model with 0.95 Confidence Level
Multistage CancerLinear extrapolation
Figure A-5. Benzo(a)Pyrene BMDS Results for Lung Tumors, 100 ppm Dose RemovedFr
actio
n A
ffect
ed
Material: Benzo[a]pyrene Test animal: Female B6C3F1 Mice Effect: Lung (alveolar/bronchiolar adenomas and/or carcinomas)
Dose ppm
Human EqvtDose mg/kg-day Total Effect
0 0 48 5 5 0.0983 48 0
25 0.4988 45 4
Multistage Cancer Model with 0.95 Confidence Level
0.25
0.2
0.15
0.1
0.05
0
BMDBMDL
Multistage Cancer Linear extrapolation
0 0.1 0.2 0.3 0.4 0.5 0.6 0.7 0.8 0.9
dose 14:24 04/14 2010

0.6
0.8
Affe
cted
Multistage Cancer Model with 0.95 Confidence Level
Multistage CancerLinear extrapolationBMD Lower Bound
Frac
tion
Affe
cted
Figure A-6. Benzo(a)Pyrene BMDS Results for Forestomach Tumors, 100 ppm Dose Removed
Material: Benzo[a]pyrene Test animal: Female B6C3F1 Mice Effect: Forestomach (papillomas and/or carcinomas)
Dose ppm
Human EqvtDose mg/kg-day Total Effect
0 0 48 1 5 0.0983 47 3
25 0.4988 46 36
Multistage Cancer Model with 0.95 Confidence Level
0.8
0.6
0.4
0.2
0
BMDBMDL
Multistage Cancer Linear extrapolation BMD Lower Bound
0 0.1 0.2 0.3 0.4 0.5
dose 08:58 04/09 2010

Appendix B. Validation Exercises
Recommendation: EPA should perform an independent validation of RPFs derived using the
proposed approach.
EPA (2010) refers to studies that attempted to validate the RPFs developed by others, but they
have not performed any sort of validation on the RPFs proposed in EPA (2010). Scientifically,
no models have any value unless and until they are validated with real world data. EPA has a
duty to check the real world accuracy of the proposed RPFs and perform validation exercises
in the documents in which new models are proposed. De novo validations have been
performed, and these exercises directly test the validity of both the assumption of additivity
among PAHs and more importantly they directly test the validity of the RPFs themselves. As
shown below, the exercises demonstrate that the 2010-proposed RPFs are not valid when
compared to data from real world mixtures.
1. Validation of Proposed RPFs Using Guideline-Compliant Two-Year Feeding Study
Results from NCTR
EPA (2010) has issued a proposed set of RPFs without performing any validation exercise to
determine if they are predictive of the tumorigenicity of real world mixtures. A good study for
such a validation exercise is the two-year dietary study performed on two well-characterized
coal tar samples. The tumorigenicity of two coal tar mixtures and benzo[a]pyrene was studied
at NCTR in a two-year dietary administration study in female B6C3F1 mice (Beland et al.,
1998; Culp et al., 1998). Groups of mice were fed 0, 5, 25, and 100 ppm benzo[a]pyrene in
their diet. Other animals were fed one of two coal tar samples. Mixture 1 was a composite of
coal tar from seven coal gasification plant waste sites. Forty-eight animals per group were fed
coal tar #1 at doses of 0.0, 0.01, 0.03, 0.1, 0.3, 0.6, and 1.0% in their diet. Mixture 2 was a
composite of coal tar from two of the seven waste sites and another site having a high
benzo[a]pyrene content. Forty-eight animals per group were fed coal tar #2 at doses of 0.0,
0.03, 0.1, and 0.3% in their diet.
Gaylor et al. (2000) derived CSFs using multistage modeling for benzo[a]pyrene and both coal
tar mixtures. The CSF for benzo[a]pyrene was based on forestomach tumors. CSFs were
derived for both forestomach tumors and lung tumors in the mice. The coal tar mixtures were
more potent in causing lung tumors than in causing forestomach tumors:
Substance/Mixture Cancer Slope Factor Endpoint
Benzo[a]pyrene 1.2 (mg/kg/day) -1 Forestomach
Coal tar # 1 0.006 (mg/kg/day) -1 Lung
Coal tar #2 0.013 (mg/kg/day) -1 Lung

CSFs have been independently calculated from the Beland et al. (1998) study using EPA’s
Benchmark Dose Software (BMDS) in order to use EPA’s current approach and the approach
used in EPA (2010). The BMDS model results are documented in Appendix D. CSFs derived
from the BMDS show good model fits, and the results are nearly identical to the results
presented by Gaylor et al. (2000):
Substance/Mixture Cancer Slope Factor Endpoint
Benzo[a]pyrene 1.2 (mg/kg/day) -1 Forestomach
Coal tar # 1 0.007 (mg/kg/day) -1 Lung
Coal tar #2 0.012 (mg/kg/day) -1 Lung
The CSFs for whole coal tars resulting from the study performed at NCTR can serve as the
basis for an instructive validation exercise. The validation calculations were performed with
both the current IRIS benzo[a]pyrene CSF of 7.3 (mg/kg/day)-1 and the new CSF of 1.2
(mg/kg/day)-1 because the validation must be done in conjunction with a specified estimate of
benzo[a]pyrene’s potency.
The validation exercise requires that the PAH content of the tested coal tar mixtures be known.
The coal tar samples were characterized with respect to the content of each of the standard
PAHs but not the full list of PAHs for which EPA (2010) is proposing RPFs. Culp et al. (1998)
documented the concentrations of these standard PAH analytes. However, after
benzo[c]fluorene was discovered in a coal tar sample in the early 2000’s, the Electric Power
Research Institute (EPRI) requested META Environmental, Inc. (2001) to separate and
quantitate benzo[c]fluorene in coal tar samples that made up the composite samples that were
tested by NCTR in 1998. The average benzo[c]fluorene concentration in ten coal tar samples
was 629 mg/kg. As a reasonable estimate of the benzo[c]fluorene content of the two coal tar
samples used in the two-year dietary study, 629 mg/kg was used as a surrogate concentration.
The BaP-TE for the coal tar samples was then calculated using the EPA (1993) RPFs and the
RPFs proposed in EPA (2010).

-
Table B-1. Comparison of BaP-TE Values for Coal Tar Mixture 1 (Culp et al. 1998) Using Current and Proposed RPFs
EPA EPA (2010) Coal Tar (1993) Average Mixture 1 RPF RPF (mg/kg)
Anthanthrene 0.4
Anthracene 0 2524
Benz[a]anthracene 0.1 0.2 2374
Benz[b,c]aceanthrylene, 11H 0.05
Benzo[b]fluoranthene 0.1 0.8 2097
Benzo[c]fluorene1
20 629
Benz[e]aceanthrylene 0.8
Benzo[g,h,i]perylene 0.009 1493
Benz[j]aceanthrylene 60
Benzo[j]fluoranthene 0.3
Benzo[k]fluoranthene 0.01 0.03 699
Benz[l]aceanthrylene 5
Chrysene 0.001 0.1 2379
Cyclopenta[c,d]pyrene 0.4
Cyclopenta[d,e,f]chrysene, 4H 0.3
Dibenzo[a,e]fluoranthene 0.9
Dibenzo[a,e]pyrene 0.4
Dibenz[a,h]anthracene 1 10 267
Dibenzo[a,h]pyrene 0.9
Dibenzo[a,i]pyrene 0.6
Dibenzo[a,l]pyrene 30
Fluoranthene 0.08 4965
Indeno[1,2,3-c,d]pyrene 0.1 0.07 1353
Naphtho[2,3-e]pyrene 0.3
Phenanthrene 0 7640
Pyrene 0 5092
Dibenz[a,c]anthracene 4
Benzo[a]pyrene 1 1 1837
Total
Notes: Data from Culp et al. (1998)
BaP TE (mg/kg)
EPA (1993) EPA (2010) RPFs RPFs
0 0
0 0
237.4 474.8
0 0
209.7 1677.6
0 12580
0 0
0 13.437
0 0
0 0
6.99 20.97
0 0
2.379 237.9
0 0
0 0
0 0
0 0
267 2670
0 0
0 0
0 0
0 397.2
135.3 94.71
0 0
0 0
0 0
0 0
1837 1837
2,696 20,004
1 Benzo[c]fluorene data from Meta Environmental (2001): average of concentrations in ten coal tar samples
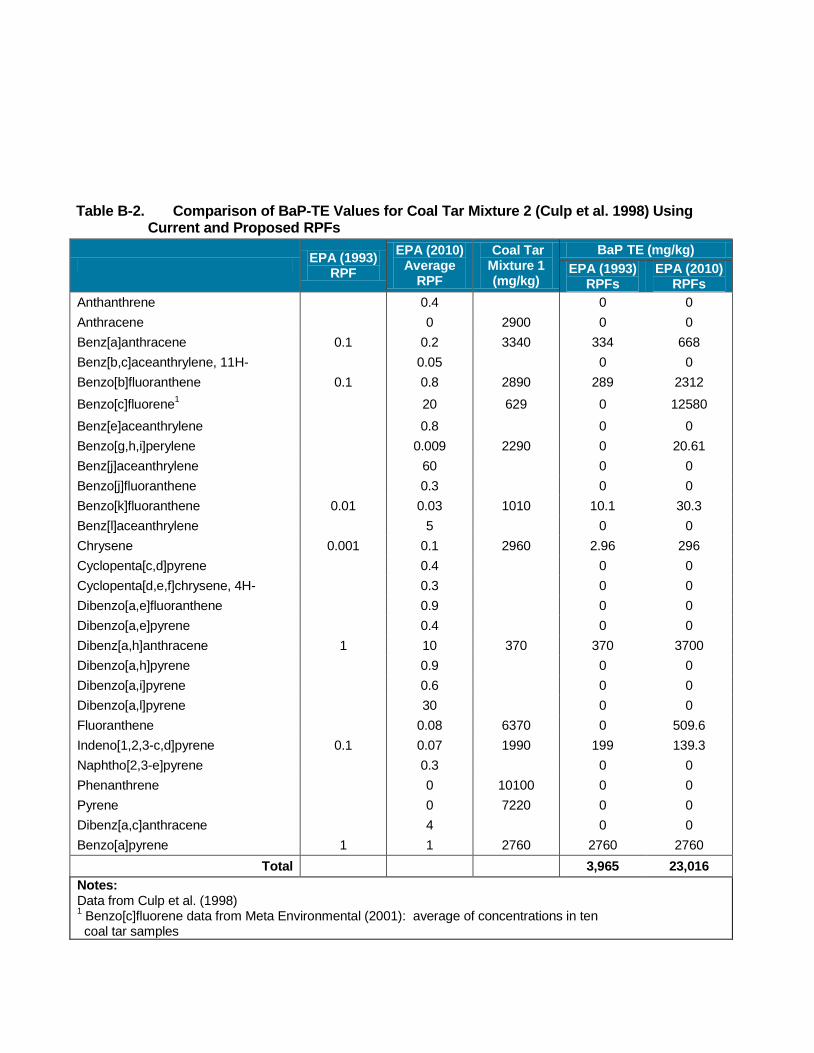
-
Table B-2. Comparison of BaP-TE Values for Coal Tar Mixture 2 (Culp et al. 1998) Using Current and Proposed RPFs
Benzo[c]fluorene data from Meta Environmental (2001): average of concentrations in ten
EPA (1993) RPF
Anthanthrene
EPA (2010) Average
RPF
0.4
Coal Tar Mixture 1 (mg/kg)
BaP TE (mg/kg)
EPA (1993) RPFs
EPA (2010) RPFs
0 0
Anthracene 0 2900 0 0
Benz[a]anthracene 0.1 0.2 3340 334 668
Benz[b,c]aceanthrylene, 11H 0.05 0 0
Benzo[b]fluoranthene 0.1 0.8 2890 289 2312
Benzo[c]fluorene1
20 629 0 12580
Benz[e]aceanthrylene 0.8 0 0
Benzo[g,h,i]perylene 0.009 2290 0 20.61
Benz[j]aceanthrylene 60 0 0
Benzo[j]fluoranthene 0.3 0 0
Benzo[k]fluoranthene 0.01 0.03 1010 10.1 30.3
Benz[l]aceanthrylene 5 0 0
Chrysene 0.001 0.1 2960 2.96 296
Cyclopenta[c,d]pyrene 0.4 0 0
Cyclopenta[d,e,f]chrysene, 4H 0.3 0 0
Dibenzo[a,e]fluoranthene 0.9 0 0
Dibenzo[a,e]pyrene 0.4 0 0
Dibenz[a,h]anthracene 1 10 370 370 3700
Dibenzo[a,h]pyrene 0.9 0 0
Dibenzo[a,i]pyrene 0.6 0 0
Dibenzo[a,l]pyrene 30 0 0
Fluoranthene 0.08 6370 0 509.6
Indeno[1,2,3-c,d]pyrene 0.1 0.07 1990 199 139.3
Naphtho[2,3-e]pyrene 0.3 0 0
Phenanthrene 0 10100 0 0
Pyrene 0 7220 0 0
Dibenz[a,c]anthracene 4 0 0
Benzo[a]pyrene 1 1 2760 2760 2760
Total 3,965 23,016
Notes: Data from Culp et al. (1998) 1
coal tar samples

-
-
-
-
-
-
-
-
-
-
Table B-3. Comparison of Risk Estimates for Coal Tar Using the Derived Coal Tar CSF, the
Outdated IRIS Benzo[a]pyrene CSF and Current or Proposed RPFs
Coal Tar CSF
(mg/kg/day) 1
106
x Coal
Tar
CSF2
BaP TE
EPA
(1993)
RPFs
BaP TE x
IRIS CSF1
RPFs /
Whole
Mixture
BaP TE
EPA
(2010)
RPFs
BaP TE
x IRIS
CSF1
RPFs /
Whole
Mixture
Coal Tar #1
0.007 7,000 2,696 ppm 19,681
19,681 /
7,000 =
2.8
20,004 ppm
146,029
146,029 /
7,000 =
21
Coal Tar #2
0.012 12,000 3,965 ppm 28,945
28,945 /
12,000 =
2.4
23,016 ppm
168,017
168,017 /
12,000 =
14
Notes: 1
IRIS benzo[a]pyrene CSF = 7.3 (mg/kg/day) -1
2 Coal tar concentration x coal tar CSF
Table B-4. Comparison of Risk Estimates for Coal Tar Using the Derived Coal Tar CSF, the NCTR
Benzo[a]pyrene CSF, and Current or Proposed RPFs
106
x Coal
Tar
CSF2
BaP TE
EPA
(1993)
RPFs
BaP TE x
NCTR
CSF1
RPFs /
Whole
Mixture
BaP TE
EPA
(2010)
RPFs
BaP TE
x NCTR
CSF1
RPFs /
Whole
Mixture
Coal Tar #1
0.007 7,000 2,696 ppm 3,235
3,235 /
7,000 =
0.46
20,004 ppm
24,005
24,005 /
7,000 =
3.4
Coal Tar #2
0.012 12,000 3,965 ppm 4,758
4,758 /
12,000 =
0.40
23,016 ppm
27,619
27,619 /
12,000 =
2.3
Notes: 1 NCTR benzo[a]pyrene CSF = 1.2 (mg/kg/day)
-1
2 Coal tar concentration x coal tar CSF
Coal Tar CSF
(mg/kg/day) 1
As shown above, when using the outdated CSF for benzo[a]pyrene, the RPF approach
overestimates the true carcinogenic potencies of the coal tar mixtures using either current or
proposed RPFs. When the proposed RPFs are used, the overestimation of risk increases from
2 to 3-fold to 14 to 21-fold. It must be noted that this overestimation is the minimal
overestimation of potency, because only one additional, non-standard PAH is incorporated into
the estimate of BaP-TE. If the concentrations of the other PAHs for which EPA is proposing
RPFs were added in to the calculation, the overestimations would rise considerably.

-
-
-
-
-
-
When using the newly derived CSF based on the 1998 NCTR study, the old EPA (1993) RPFs
underestimate coal tar potency. However, the proposed EPA (2010) RPFs still overestimate
the tumorigenic potency of coal tar.
As a theoretical exercise, the BaP-TE for the two coal tar samples were recalculated making
the conservative assumption that all other PAHs for which EPA is proposing RPFs are present
in coal tar at a low level of 100 ppm each. Under this assumption, the results of the validation
exercise are as noted below.
Table B-5. Comparison of Risk Estimates for Coal Tar Using the Derived Coal Tar CSF,
the Outdated IRIS Benzo[a]pyrene CSF, Proposed RPFs and Assumed
Concentrations of 100 ppm for Non-Quantitated PAHs
Coal Tar CSF
(mg/kg/day) 1
106
x Coal Tar
CSF2
BaP TE
EPA (2010)
RPFs
BaP TE x
IRIS CSF1 RPFs / Whole Mixture
Coal Tar #1 0.007 7,000 30,439 ppm 222,205 222,205 / 7,000 = 32
Coal Tar #2 0.012 12,000 33,451 ppm 244,192 244,192 / 12,000 = 20
Notes: 1
IRIS CSF = 7.3 (mg/kg/day) -1
2 Coal tar concentration x coal tar CSF
Table B-6. Comparison of Risk Estimates for Coal Tar Using the Derived Coal Tar CSF,
the NCTR Benzo[a]pyrene CSF, Proposed RPFs, and Assumed
Concentrations of 100 ppm for Non-Quantitated PAHs
Coal Tar CSF
(mg/kg/day) 1
106
x Coal Tar
CSF2
BaP TE
EPA (2010)
RPFs
BaP TE x
NCTR CSF1 RPFs / Whole Mixture
Coal Tar #1 0.007 7,000 30,439 ppm 36,527 36,527 / 7,000 = 5.2
Coal Tar #2 0.012 12,000 33,451 ppm 40,141 40,141 / 12,000 = 3.3
Notes: 1 NCTR CSF = 1.2 (mg/kg/day)
-1
2 Coal tar concentration x coal tar CSF
As shown above, when using the outdated CSF for benzo[a]pyrene, the RPF approach
overestimates the true carcinogenic potencies of the coal tar mixtures by 20 to 32-fold using
the proposed RPFs and assuming that PAHs not quantitatively identified are present at 100
ppm each. When using the newly derived CSF based on the 1998 NCTR study, the proposed
RPFs overestimate coal tar potency by 3 to 5-fold.

2. Validation of Additivity Assumption, Existing Studies Showing PAH Inhibition
EPA (2010) assumes as a basis for deriving RPFs that individual PAH components act in an
additive manner. This assumption is not required when toxicological data on whole mixtures
are derived. There are some reports in the literature of dose additivity, but there are also a
multitude of scientific studies that show that PAHs inhibit the carcinogenic effect of other PAHs
in animal bioassays.
Table B-7 lists some of these studies. The intent of this table is to demonstrate that many examples of inhibition can be found in the literature. Examples of potentiation can also be found in the literature, but these studies are not reported here.
Table B-7. Inhibition of Laboratory PAH Carcinogenesis by other PAHs
Animal Carcinogen Inhibitor Effect Species Reference
methylcholanthrene dibenzofluorene skin tumor mouse LaCassagne et al. 1945
dibenz (a,h) anthracene
1,2,5,6-dibenzacridine skin tumor mouse LaCassagne et al. 1945
methylchloranthrene chrysene skin tumor mouse LaCassagne et al. 1945
dibenz(a,h) anthracene
benz(a)anthracene injection tumors
mouse Steiner and Falk 1951
benzo(a)pyrene 1,2,3,4benzanthracene
skin tumor mouse Finzi et al. 1968
benzo(a)pyrene perylene skin tumor mouse Finzi et al. 1968
DMBA dibenz(a,c)
anthracene skin tumor mouse
DiGiovanni et al. 1980; DiGiovanni et al. 1982; Slaga 1983
DMBA benzo(e)pyrene skin tumor mouse
DiGiovanni et al. 1980; DiGiovanni et al. 1982; Slaga 1983; Slaga et al. 1979
DMBA pyrene skin tumor mouse DiGiovanni et al. 1980; Slaga et al. 1979
DMBA fluoranthene skin tumor mouse DiGiovanni et al. 1980; Slaga et al. 1979
7,12-DMBA benz(a)anthracene breast tumor rat Huggins et al. 1964

Table B-7. Inhibition of Laboratory PAH Carcinogenesis by other PAHs
Animal Carcinogen Inhibitor Effect Species Reference
7,12-DMBA 3,9-DMBA breast tumor rat Huggins et al. 1964
7,12-DMBA 6,8-DMBA breast tumor rat Huggins et al. 1964
7,12-DMBA chrysene breast tumor rat Huggins et al. 1964
9,10-dimethyl-1,2
benzanthracene phenanthrene skin tumor mouse
Huh and McCarter 1960
20-methylcholanthrene 6,7-dihydro
methylcholanthrene subcut. tumor mouse
Kotin et al. 1956; Falk et al. 1964
20
methylcholanthrene
hexahydro
methylcholanthrene subcut. tumor mouse
Kotin et al. 1956; Falk et al. 1964
20methylcholanthrene
perhydro
methylcholanthrene
subcut.
tumor mouse
Kotin et al. 1956; Falk et al. 1964
dibenz(a,h,)
anthracene
dihydro-dibenz
(a,h)anthracene subcut. tumor mouse
Kotin et al. 1956; Falk et al. 1964
dibenz (a,h)
anthracene
decahydro-dibenz
(a,h)anthracene
subcut.
tumor mouse
Kotin et al. 1956; Falk et al. 1964
dibenz(a,h)
anthracene
perhydro-dibenz
(a,h)anthracene subcut. tumor mouse
Kotin et al. 1956; Falk et al. 1964
7,12 DMBA 1-ethynylpyrene DNA binding mouse skin Viaje et al. 1990
benzo(a)pyrene 1-ethynylpyrene DNA binding mouse skin Viaje et al. 1990
7,12 DMBA 1-ethynylpyrene skin tumor mouse Alworth et al. 1991
benzo(a)pyrene 1-ethynylpyrene skin tumor mouse Alworth et al. 1991
dibenz(a,h)
anthracene phenanthrene skin tumor mouse Falk et al. 1964
DMBA 1,2,3,4dibenzanthracene
skin tumor mouse Slaga and Boutwell 1977
dibenz(a,h)
anthracene benzo(e)pyrene skin tumor mouse
DiGiovanni et al. 1982
dibenz(a,h)
anthracene
dibenz(a,c)
anthracene skin tumor mouse
DiGiovanni et al. 1982
3 - methyl
cholanthrene
dibenz(a,h)
anthracene skin tumor mouse
DiGiovanni et al. 1982
DMBA dibenz(a,c)
anthracene skin tumor mouse Slaga 1978
benzo(a)pyrene benzo(a)fluorene skin tumor mouse Falk et al. 1964
benzo(a)pyrene perylene skin tumor mouse Falk et al. 1964

Table B-7. Inhibition of Laboratory PAH Carcinogenesis by other PAHs
Animal Carcinogen Inhibitor Effect Species Reference
benzo(a)pyrene benz(a)carbazole skin tumor mouse Falk et al. 1964
benzo(a)pyrene chrysene skin tumor mouse Falk et al. 1964
benzo(a)pyrene benzo(h)
fluoranthene skin tumor mouse Falk et al. 1964
benzo(a)pyrene benz(m,n,o)
fluoranthene skin tumor mouse Falk et al. 1964
benzo(a)pyrene anthracene + pyrene
+ phenanthrene skin tumor mouse Falk et al. 1964
benzo(a)pyrene
carcinogenic oxyneutral air pollution
fractions
skin tumor mouse Falk et al. 1964
DMBA benzo(e)pyrene mutagenicity hamster embryo cells
Baird et al. 1984
benzo(a)pyrene benzo(e)pyrene mutagenicity Salmonella Hass et al. 1981
benzo(a)pyrene benzo(e)pyrene metabolic
activation
Syrian hamster
embryo cultures
Smolarek and Baird 1984
benzo(a)pyrene anthracene skin tumor mouse Crabtree 1946
benzo(a)pyrene naphthalene skin tumor mouse Crabtree 1946
benzo(a)pyrene phenanthrene skin tumor mouse Crabtree 1946
20-methylcholanthrene anthracene skin tumor mouse Crabtree 1946
20-methylcholanthrene naphthalene skin tumor mouse Crabtree 1946
20-methylcholanthrene phenanthrene skin tumor mouse Crabtree 1946
20-methylcholanthrene 1,2,5,6dibenzofluorene
skin tumor mouse Wartman et al. 1950
9,10-dimethyl
1,2-benzanthracene
8-methyl
1,2-benzanthracene skin tumor mouse Stanger et al. 1952
9,10-dimethyl
1,2-benzanthracene
1,2,5,6dibenzofluorene
skin tumor mouse Hill et al. 1951
9,10-dimethyl
1,2-benzanthracene
6,8-dimethyl
1,2-benzanthracene skin tumor mouse Hill et al. 1951
benzo(a)pyrene dibenzo(a,l)pyrene +
dibenzo(a,e)pyrene
skin DNA adducts
mouse Hughes and Phillips 1990
DMBA benzo(e)pyrene in vivo DNA adducts
mouse Smolarek et al. 1987
benzo(a)pyrene crude oil mutagenicity Salmonella Petrilli et al. 1980

Table B-7. Inhibition of Laboratory PAH Carcinogenesis by other PAHs
Animal Carcinogen Inhibitor Effect Species Reference
benzo(a)pyrene DMSO extract of crude oil
mutagenicity Salmonella Petrilli et al. 1980
benzo(a)pyrene PNA fraction Shale oil mutagenicity Salmonella Pelroy and Petersen 1979
benzanthracene PNA fraction Shale oil mutagenicity Salmonella Pelroy and Petersen 1979
dimethyl-benzacridine PNA fraction Shale oil mutagenicity Salmonella Pelroy and Petersen 1979
2-aminoanthracene PAH fraction of Athabasca tar sand
mutagenicity Salmonella Shahin and Fournier 1978
9,10-dimethyl
1,2-benzanthracene
1,2,5,6benzanthracene
skin tumor mouse Hill et al. 1952
methylcholanthrene 1,2,5,6benzanthracene
skin tumor mouse Hill et al. 1952
benzo(a)pyrene high boiling mutagenic COM
mutagenesis Salmonella Dankovic et al. 1989
benzo(a)pyrene solvent refined coal liquid (426-454 deg)
mutagenesis Salmonella Dankovic et al. 1989
benzo(a)pyrene solvent refined coal liquid (454 deg)
mutagenesis Salmonella Dankovic et al. 1989
benzo(a)pyrene 4 carcinogenic COM skin tumors mouse Dankovic et al. 1989
benzo(a)pyrene 5 carcinogenic COM metabolic activation
mouse Dankovic et al. 1989
DMBA 3-methyl
cholanthrene
breast
tumors rats Wheatley 1988
benzo(a)pyrene naphthalene skin tumors mouse Schmetlz et al. 1978
benzo(a)pyrene 1-methylnaphthalene skin tumors mouse Schmetlz et al. 1978
benzo(a)pyrene 2-methylnaphthalene skin tumors mouse Schmetlz et al. 1978
benzo(a)pyrene 1-ethylnaphthalene skin tumors mouse Schmetlz et al. 1978
benzo(a)pyrene 2-ethylnaphthalene skin tumors mouse Schmetlz et al. 1978
benzo(a)pyrene 1,2-dimethylnaphthalene
skin tumors mouse Schmetlz et al. 1978
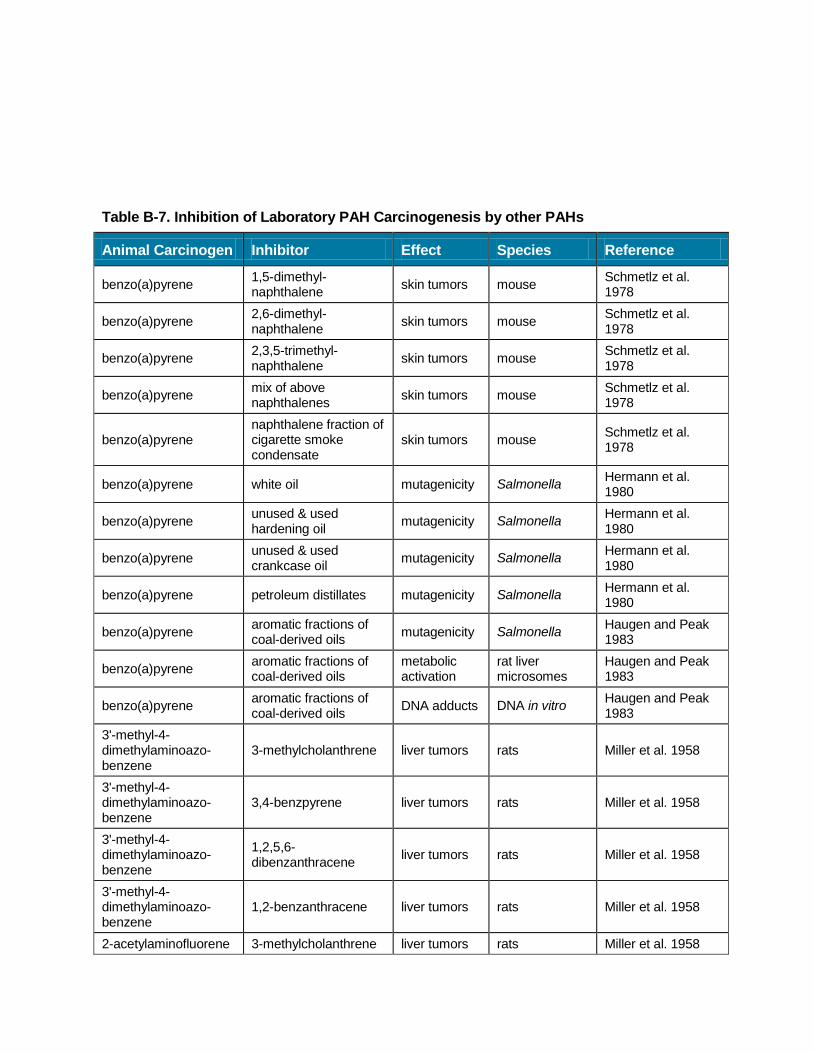
Table B-7. Inhibition of Laboratory PAH Carcinogenesis by other PAHs
Animal Carcinogen Inhibitor Effect Species Reference
benzo(a)pyrene 1,5-dimethylnaphthalene
skin tumors mouse Schmetlz et al. 1978
benzo(a)pyrene 2,6-dimethylnaphthalene
skin tumors mouse Schmetlz et al. 1978
benzo(a)pyrene 2,3,5-trimethylnaphthalene
skin tumors mouse Schmetlz et al. 1978
benzo(a)pyrene mix of above naphthalenes
skin tumors mouse Schmetlz et al. 1978
benzo(a)pyrene naphthalene fraction of cigarette smoke condensate
skin tumors mouse Schmetlz et al. 1978
benzo(a)pyrene white oil mutagenicity Salmonella Hermann et al. 1980
benzo(a)pyrene unused & used hardening oil
mutagenicity Salmonella Hermann et al. 1980
benzo(a)pyrene unused & used crankcase oil
mutagenicity Salmonella Hermann et al. 1980
benzo(a)pyrene petroleum distillates mutagenicity Salmonella Hermann et al. 1980
benzo(a)pyrene aromatic fractions of coal-derived oils
mutagenicity Salmonella Haugen and Peak 1983
benzo(a)pyrene aromatic fractions of coal-derived oils
metabolic activation
rat liver microsomes
Haugen and Peak 1983
benzo(a)pyrene aromatic fractions of coal-derived oils
DNA adducts DNA in vitro Haugen and Peak 1983
3'-methyl-4dimethylaminoazobenzene
3-methylcholanthrene liver tumors rats Miller et al. 1958
3'-methyl-4dimethylaminoazobenzene
3,4-benzpyrene liver tumors rats Miller et al. 1958
3'-methyl-4dimethylaminoazobenzene
1,2,5,6dibenzanthracene
liver tumors rats Miller et al. 1958
3'-methyl-4dimethylaminoazobenzene
1,2-benzanthracene liver tumors rats Miller et al. 1958
2-acetylaminofluorene 3-methylcholanthrene liver tumors rats Miller et al. 1958

Table B-7. Inhibition of Laboratory PAH Carcinogenesis by other PAHs
Animal Carcinogen Inhibitor Effect Species Reference
benzo(a)pyrene gasoline & diesel exhaust condensates
BaP-DNA adducts
mouse Schoket et al. 1989
Dibenz(a,l)pyrene Diesel exhaust Skin tumors mouse Courter et al. 2008
Benzo(a)pyrene Urban dust particulate matter
Skin tumors mouse Courter et al. 2007a,b
Dibenz(a,l)pyrene Urban dust particulate matter
Skin tumors mouse Courter et al. 2007a,b
Benzo(a)pyrene Coal tar extract DNA adducts Chinese hamster cells
Mahadevan et al. 2007
Dibenz(a,l)pyrene Coal tar extract DNA adducts Chinese hamster cells
Mahadevan et al. 2007
Benzo(a)pyrene Dibenz[a,h]anthracene Skin tumors Mouse Pfeiffer 1973, 1977
In fact, the issue of interactions between individual PAHs is complicated and experimental
results make it difficult to predict the effect, if any, of selected PAHs in humans. For instance,
the effects of benzo(e)pyrene are species-specific. In mouse skin, benzo(e)pyrene inhibits the
carcinogenic effects of DMBA but potentiates the effects of benzo(a)pyrene. However, in a
hamster embryo cell-mediated assay, benzo(e)pyrene has no effect on benzo(a)pyrene- or
DMBA-induced mutagenesis. Similarly, phenanthrene inhibited mouse skin tumor formation
caused by dibenz(a,h)anthracene when given in ethyl laurate as vehicle. However, when given
in triethylene glycol as vehicle, phenanthrene potentiated the effects of dibenz(a,h)anthracene.
The weight of evidence from the literature on interactions between individual PAHs given as
pure chemicals does not support a conclusion that all PAHs act in a dose-additive fashion.
3. Validation of Assumption of Additivity, Existing Studies
The Schmahl et al. (1977) study is presented by EPA (2010) as supportive of the assumption
of additivity of effects among a mixture of PAHs. In fact, this study shows that certain PAHs
inhibit the carcinogenic effects of other PAHs known to be carcinogenic in animals.
Specifically, EPA (2010) has incorrectly reported the results of Schmähl et al. (1977). EPA
(2010) states:
“Additivity has been observed in carcinogenicity studies of complex mixtures of PAHs.
Schmähl et al. (1977) evaluated the production of skin tumors following combined dermal
treatment with 11 PAHs found as constituents of automobile exhaust. Tumor findings were
presented separately for two groups of PAHs. High potency carcinogens (Group 1)

included benzo[a]pyrene, dibenz[a,h]anthracene, benz[a]anthracene, and
benzo[b]fluoranthene. Lower potency PAHs (Group 2) included anthracene,
benzo[e]pyrene, benzo[g,h,i]perylene, chrysene, fluoranthene, phenanthrene, and pyrene.
Chronic dermal exposure to PAHs in both groups resulted in an additive response when
compared to the tumor response for each group alone.”
Using the proposed RPFs, all three dose groups of PAH Mixture #1 (carcinogenic PAH
mixture) would be expected to have 100% cancer incidence if the assumption of additivity is
correct and the RPFs are valid estimators of the potency of the three additional PAHs in this
mixture. In fact, BaP appears to be responsible for 40-80% of the observed tumorigenicity
despite that fact that BaP is responsible for only 11% of the BaP-TE (by experimental design).
PAH Mixture #2 was labeled a noncarcinogenic mixture, but it contains fluoranthene, chrysene,
and benzo[ghi]perylene. If EPA’s proposed RPFs are correct and the additivity assumption is
correct, the expected tumor incidences based on BaP-TE would be 14%, 56%, 100%, and
100%, but the observed tumor incidences are 1%, 0%, 1%, and 19%. Clearly, the RPFs
overestimate comparative potency or the assumption of additivity is not correct, or both. It is
noted that Mixture #2 does not contain any BaP, but its BaP-TE using the proposed RPFs is
equal in the first two dose groups to dose groups which were administered BaP at the same
dose. If the RPFs were correct, the tumor incidence would be expected to be 14% and 56%,
but the actual tumor incidences were 1% and 0%. This demonstrates that the RPFs are not
correct.

-
Table B-8. Data of Schmahl et al. (1977)
Test Group Total Dose
ug/treatment
BAP TE Dose
ug/treatment1
Expected
Cancer
Incidence 2
Observed
Cancer
Incidence
Benzo(a)pyrene
1.0
1.7
3.0
1.0
1.7
3.0
14%
28%
56%
PAH Mixture #1
(cPAH)
4.0
6.8
12.0
9
15.4
27
100%
100%
100%
36%
65%
72%
PAH Mixture #2
(ncPAH)
65
195
585
1755
1
3
9.1
27.3
14%
56%
100%
100%
1%
0%
1%
19%
PAH Mixtures 1 + 2
(cPAH + ncPAH)
69
117
207
10.0
17.1
30
100%
100%
100%
52%
61%
70%
Notes: 1
EPA (2010) proposed RPFs 2
Expected incidence was estimated from observed BaP response at nearest BaP-TE dose assuming linear dose-response curve. BaP-TE = benzo(a)pyrene toxic equivalents ug = microgram
Schmähl et al. (1977) also dosed three groups of animals with Mixtures 1 and 2
simultaneously. The BaP-TE of the first group is 10 ug/treatment. This BaP-TE dose of 9-10
ug/treatment gave the following tumor incidences, as noted in Table B-8.
PAH Mixture 1 (cPAH) 36%
PAH Mixture 2 (ncPAH) 1%
PAH Mixtures 1+2 (cPAH + ncPAH) 52%
Similarly, three groups were doses with total BaP-TE of 27-30 ug/treatment. This BaP-TE dose
of 27-30 ug/treatment gave the following tumor incidences, as noted in Table B-8.
PAH Mixture 1 (cPAH) 72%
PAH Mixture 2 (ncPAH) 19%
PAH Mixtures 1+2 (cPAH + ncPAH) 70%

In both of these cases, the results of the mixture experiments do not support an assumption of
additivity, and they do not support the proposed RPFs.
An evaluation of the data of Pfeiffer et al. (1977) also can be used to validate the assumption
of additivity among PAHs. EPA (2010) erroneously excluded this study from the RPF
derivation process and from the summary of experimental results that support or refute its
assumption of additivity for the RPF scheme. It has done so, because there was 90% mortality
reported in the control group before sacrifice. What EPA fails to report is that the experimental
data reported in Pfeiffer et al. (1973) at 56 weeks was almost identical to that see at 144
weeks. In Pfeiffer et al. (1977) it is stated that the experiment was terminated at 114 weeks
because of high mortality in the control group and “because during the preceding weeks no
increase in the number of tumour-bearing mice had occurred.” Comparison of data from 56
weeks to that from 114 weeks demonstrates that the data from 58 weeks earlier when mortality
was not presumably an issue would yield essentially the same results as those presented here.
The presence or absence of tumors in the control animals does not affect the validity of the
following analysis.
In Table B-9, the data for mixtures benzo(a)pyrene and dibenz(a,h)anthracene are presented.
In this experiment, Pfeiffer et al. (1977) merely dosed animals with BaP alone, with DahA
alone, and then with a binary mixture of the two. If the assumption of additivity is correct, the
tumor incidence of the binary mixture would simply be the sum of the two individual results.
The data clearly show that the animal carcinogenicity of the two chemicals is not additive. It is
possible that nonlinearities may occur in the dose-response curve at high doses. Thus, one
should perhaps not expect that a chemical giving a 50% tumor incidence would strictly add
with a chemical giving a 50% incidence so that the mixture would yield exactly 100%
incidence. However, the observed results demonstrate that the assumption of additivity does
not hold and that inhibition was occurring. In the two highest dose groups, for instance, the
addition of dibenz(a,h)anthracene caused the tumor incidence of the mixture to be less than
the incidence seen when benzo(a)pyrene alone was administered, thus showing that the
presence of other PAHs inhibited the action of BaP.

-
-
-
-
-
Table B-9. Validation of Assumption of Additivity Data of Pfeiffer et al. (1977) Two Component Mixture
Dose Group Cancer
Incidence BaP Cancer
Incidence D(ah)A
Expected Incidence for
Mixture1
Observed Incidence
1 9% 37% 46% 48%
2 35% 39% 74% 44%
3 51% 44% 95% 61%
4 57% 56% 100% 68%
5 77% 65% 100% 69%
6 83% 69% 100% 79%
Notes: 1
Sum of incidence of BaP-dosed animals and D(ah)A-dosed animals.
Table B-10 shows the data for the twelve component mixture, where the researchers added a
mixture of 10 PAHs (including benz[a]anthracene, fluoranthene, chrysene, and
benzo[ghi]perylene, to benzo(a)pyrene and dibenz(a,h)anthracene. Again, additivity was not
seen. In two cases, doses 5 and 6, the addition of dibenz(a,h)anthracene and the mixture of 10
PAHs caused the tumor incidence of the mixture to be less than the incidence seen when
benzo(a)pyrene alone was administered, thus showing that the presence of other PAHs
inhibited the action of BaP.
Table B-10. Validation of Assumption of Additivity Data of Pfeiffer et al. (1977) Twelve Component Mixture
Dose Group Cancer
Incidence BaP
Cancer Incidence
D(ah)A
Cancer Incidence 10
PAHs
Expected Incidence for
Mixture1
Observed Incidence
9% 37% 6% 52% 41%
35% 39% 8% 82% 55%
51% 44% 6% 100% 61%
57% 56% 4% 100% 72%
77% 65% 13% 100% 68%
83% 69% 5% 100% 82%
Sum of incidence of BaP-dosed animals and D(ah)A-dosed animals.
1
2
3
4
5
6
Notes: 1
In Table B-11, the data on the five animal groups are shown along with their BaP-TE doses using the proposed RPFs. As noted in the table, the expected incidence in all cases exceeded the observed tumor incidence. Expected tumor incidence was estimated by simply assuming

-
the EPA’s proposed RPFs are correct and that the dose-response curve was linear as was assumed by EPA (2010).
Table B-11. Validation of EPA (2010) RPFs Using Tumor Data of Pfeiffer (1977)
Test Group
Benzo[a]pyrene
Dibenz[a,h]-anthracene
Mixture of 2 PAHs
Mixture of 10 PAHs
Mixture of 12 PAHs
Notes:
Total Dose (ug/treatment)
3.12
6.25
12.5
25
50
100
2.35
4.7
9.3
18.7
37.5
75
5.5
11
22
44
88
175
270
550
1100
2200
4400
8800
280
560
1100
2200
4500
9000
BaP TE Dose EPA (2010) RPFs
(ug/treatment)
3.12
6.25
12.5
25
50
100
23.5
47
93
187
375
750
27
53
100
210
430
850
3.3
6.6
13.2
26
53
100
30
60
120
240
480
960
Observed Expected 1
Incidence Incidence
9%
35%
51%
57%
77%
83%
37% 54%
39% 72%
44% 77%
56% 100%
65% 100%
69% 100%
48% 62%
44% 82%
61% 83%
68% 100%
69% 100%
79% 100%
6% 10%
8% 37%
6% 54%
4% 59%
13% 82%
5% 83%
41% 68%
55% 92%
61% 100%
72% 100%
68% 100%
82% 100%
Expected incidence was estimated from observed BaP response at nearest BaP-TE dose assuming linear dose-response curve. Red indicates RPFs overestimate observed potency.
1

One can also compare the tumor incidence directly for several different animal groups that received similar doses of BaP-TE assuming the RPFs are correct.
Group BaP-TE (ug) Observed Tumor Incidence
BaP 12.5 51%
Mixture of 10 13.2 6%
BaP 25 57%
DahA 23.5 37%
Mixture of 2 27 48%
Mixture of 10 26 4%
Mixture of 12 30 41%
All of the above comparisons demonstrate that either the RPFs are incorrect estimates of
relative potency or the assumption of additivity is incorrect, or both.
In a 1998 publication, Nesnow et al. presented quantitative results for other mixture
experiments. Nesnow et al. (1998a) concluded “Comparison of observed lung adenoma
formation with that expected from additivity identified both greater than additive and less than
additive interactions that were dose related i.e., greater than additive at lower doses and less
than additive at higher doses.” Thus, EPA (2010) has presented little to no evidence that an
assumption of additivity is correct.

Appendix B – Benchmark Dose Modeling
EPA’s Benchmark Dose Software (BMDS) version 2.1.1 (www.epa.gov/ncea/bmds/index.html) was used to assess dose-response relationships for a variety of relevant health endpoints reported in various studies in the published literature. Compared to the use of NOAEL/LOAELs and cancer potency estimates, the benchmark dose (BMD) approach provides a more quantitative alternative for determining the point of departure (POD) to calculate the toxicity value used in cancer and noncancer risk assessments (EPA 2000). Specifically, the POD is applied in one of two ways, consistent with EPA (2005) guidance : (1) a linear extrapolation method that yields a cancer slope factor (CSF) calculated as the ratio between the chosen benchmark response rate (BMR) or POD and the one-side 95% lower confidence limit of the benchmark dose (BMDL) converted to a human-equivalent external dose (HED); and (2) a nonlinear approach that yields a reference dose (RfD) calculated as the ratio between the benchmark dose (BMD) at the chosen BMR/POD and the product of several extrapolation/adjustment factors.
BMDS can accommodate categorical (including dichotomous) and continuous response variables. A toxicity study yields categorical data when responses are grouped into one or more categories, such as the severity of effect (e.g., mild, moderate, or severe histological change). Dichotomous data can be viewed as a special case in which there is one effect category and the possible response is binary (e.g., effect or no effect) (EPA 2000). For BMD modeling of dichotomous data, both the number of animals showing response and the total number of subjects in the group are included in the input file along with the dose. Categorical regression models can also be used to derive a BMD by estimating the probability of effects of different levels of severity (EPA 2000). Continuous data are reported as a measurement of the effect, such as body weights, or number of tumors per animal in control and exposed groups. The input file consists of either individual results or the number of subjects, mean response, and variance in response for each dose group.
BMDS generates goodness-of-fit metrics to guide in the selection of the optimal model. EPA’s technical guidance for BMDS (EPA 2000) provides additional criteria for selecting the optimal models for the final determination of the BMD and BMDL.
References
EPA. 2000. Benchmark Dose Technical Guidance Document, Draft. Risk Assessment Forum. EPA/630/R-00/001. October. Available online: http://www.epa.gov/nceawww1/pdfs/bmds/BMD-External_10_13_2000.pdf.
EPA. 2005. Guidelines for Carcinogen Risk Assessment. EPA/630/P:-03/001F.

Table B1. Mass et al. (1993), benzo[a]pyrene, A/J mouse. Continuous dose-response goodness-of-fit tests and benchmark dose estimates at 10% effect levels applied to study results.
Source Substance
Effect Endpoint Continuous
Dose-Response Model (1)
Goodness-of-Fit POD
Benchmark Response (BMR) (5)
Dose (mg/kg)
Notes
p-value for Maximum Likelihood Tests (2)
AIC (3)
Residuals (4)
Animal Tissue Test 1 Test 2 Test 3 Test 4
Scaled Residual of
Interest
Maximum Scaled
Residual BMD BMDL
Mass, 1993 BaP A/J Mice lung tumors Hill <.0001 <.0001 <.0001 NA 198 -4E-07 -4E-07 1 SD 41.0 29.1 Best Fit: Hill model has the lowest scaled residuals and the lowest AIC
Mass, 1993 BaP A/J Mice lung tumors Exponential 2 < 0.0001 < 0.0001 < 0.0001 0.0147 203 2.3 2.3 1 SD 61.4 55.0
Mass, 1993 BaP A/J Mice lung tumors Exponential 3 < 0.0001 < 0.0001 < 0.0001 0.0147 203 2.3 2.3 1 SD 61.4 55.0
Mass, 1993 BaP A/J Mice lung tumors Exponential 4 < 0.0001 < 0.0001 < 0.0001 0.052 200 1.0 -1.5 1 SD 36.84 24.13
Mass, 1993 BaP A/J Mice lung tumors Exponential 5 < 0.0001 < 0.0001 < 0.0001 N/A 198 7.5E-08 -4E-07 1 SD 42.2 29.9 Best Fit: Exponential 5 model has the lowest scaled residuals and the lowest AIC
Mass, 1993 BaP A/J Mice lung tumors Linear <.0001 <.0001 <.0001 0.15 198 1.1 -1.5 1 SD 37.7 30.6 Acceptable Fit
Mass, 1993 BaP A/J Mice lung tumors Polynomial <.0001 <.0001 <.0001 0.052 200 0.99 -1.6 1 SD 36.70 24.04
Mass, 1993 BaP A/J Mice lung tumors Power <.0001 <.0001 <.0001 0.05 200 1.2 -1.4 1 SD 39.9 30.7
Abbreviations AIC = Akaike's Information Criterion POD = point of departure BMD = benchmark dose BMDL = 1-sided 95% lower confidence limit for the benchmark dose
Notes 1. USEPA's BMDS v.2.1.1 was used to determine dose-response continuous data. 2. There are four Maximum Likelihood tests performed by BMDS that test the null hypothesis that the model fits the data as well as the "true" model.
Test 1. Tests the hypothesis that response and variance don't differ among dose levels. If this test accepts, there may not be a dose-response. P-values less than 0.1 indicate a model fit.
Test 2. Tests the hypothesis that variances are homogeneous. If this test accepts, the simpler constant variance model may be appropriate. P-values less than 0.1 indicate a model fit.
Test 3. (non-constant variance model) Test the hypothesis that the variances are adequately modeled. If this test accepts, it may be appropriate to conclude that the variances have been modeled appropriately.
Test 4. (non-constant variance model). Tests the hypothesis that the model for the mean fits the data. If this tests accepts, the user has support for the selected model. P-values greater than 0.1 indicate a model fit.
3. For each dataset, models with relatively low AIC are indicative of better fits. 4. A scaled residual is the difference between the observed and predicted effect (i.e., percent response) divided by the standard deviation. Scaled Residual of Interest is a summary output parameter of the BMDS model, while the Maximum Scaled Residual is the maximum of the scaled residuals of each of the individual dose groups. Absolute value less than 2.0 is indicative of a good fit. Values in bold are >2.0. 5. For multidose continuous data, the BMR used in estimating the point of departure was a change of 1 standard deviation (1 SD) from the control mean.
References
Mass, M.J., A. Abu-Shakra, B.C. Roop et al. 1996. Benzo[b]fluoranthene: tumorigenicity in strain A/J mouse lungs, DNA adducts and mutations in the Ki-ras oncogene. Carcinogenesis 17:1701–1704.

4 4 4 4 4 4 4
5 5 5 5 5 5 5
4 4 4
A: Hill_Mass93_BaP_Cont_Hill B: Exponential2_Mass93_BaP_Cont_ExpHill Model with 0.95 Confidence LevelHill Model with 0.95 Confidence LevelHill Model with 0.95 Confidence LevelHill Model with 0.95 Confidence LevelHill Model with 0.95 Confidence LevelHill Model with 0.95 Confidence LevelHill Model with 0.95 Confidence LevelHill Model with 0.95 Confidence Level Exponential Model 2 with 0.95 Confidence LevelExponential Model 2 with 0.95 Confidence LevelExponential Model 2 with 0.95 Confidence LevelExponential Model 2 with 0.95 Confidence LevelExponential Model 2 with 0.95 Confidence LevelExponential Model 2 with 0.95 Confidence LevelExponential Model 2 with 0.95 Confidence LevelExponential Model 2 with 0.95 Confidence Level
88888888HillHillHillHillHillHillHillHill
88888888ExponentialExponentialExponentialExponentialExponentialExponentialExponentialExponential
77777777 77777777
6666666 6666666
Mea
n R
espo
nse
Mea
n R
espo
nse
Mea
n R
espo
nse
Mea
n R
espo
nse
Mea
n R
espo
nse
Mea
n R
espo
nse
Mea
n R
espo
nse 5555555
4444444
3333333 3333333
222222 222222
111111 111111
000000
000000
17:03 04/13 201017:03 04/13 201017:03 04/13 201017:03 04/13 201017:03 04/13 2010
202020202020
BMDLBMDLBMDLBMDLBMDLBMDL
404040404040dosedosedosedosedose
BMDBMDBMDBMDBMDBMD
606060606060 808080808080 100100100100100100
000000
000000
17:03 04/13 201017:03 04/13 201017:03 04/13 201017:03 04/13 201017:03 04/13 2010
202020202020 404040404040dosedosedosedosedose
BMDLBMDLBMDLBMDLBMDLBMDL
606060606060
BMDBMDBMDBMDBMDBMD
808080808080 100100100100100100
C: Exponential3_Mass93_BaP_Cont_Exp
8888
Exponential Model 3 with 0.95 Confidence LevelExponential Model 3 with 0.95 Confidence LevelExponential Model 3 with 0.95 Confidence LevelExponential Model 3 with 0.95 Confidence LevelExponential Model 3 with 0.95 Confidence Level
ExponentialExponentialExponentialExponentialExponential
D: Exponential4_Mass93_BaP_Cont_Exp
8888
Exponential Model 4 with 0.95 Confidence LevelExponential Model 4 with 0.95 Confidence LevelExponential Model 4 with 0.95 Confidence LevelExponential Model 4 with 0.95 Confidence LevelExponential Model 4 with 0.95 Confidence Level
ExponentialExponentialExponentialExponentialExponential
7777 7777
6666 6666
5555
Mea
n R
espo
nse
Mea
n R
espo
nse
Mea
n R
espo
nsee 5555
444
333 333
222 222
11 11
00
00
17:03 04/13 201017:03 04/13 2010
2020 4040
BMDLBMDL
dosedose
BMDBMD
6060 8080 100100
00
00
17:03 04/13 201017:03 04/13 2010
BMDLBMDL
2020
BMDBMD
4040dosedose
6060 8080 100100
MMMea
n R
espo
nse
ean
Res
pons
eea
n R
espo
nsee
MMMMMMMea
n R
espo
nse
ean
Res
pons
eea
n R
espo
nse
ean
Res
pons
eea
n R
espo
nse
ean
Res
pons
eea
n R
espo
nse

4 4 4 4 4 4
5 5 5 5 5 5
4 4
5 5 5
E: Exponential5_Mass93_BaP_Cont_Exp F: Linear_Mass93_BaP_Cont_Lin Exponential Model 5 with 0.95 Confidence LevelExponential Model 5 with 0.95 Confidence LevelExponential Model 5 with 0.95 Confidence LevelExponential Model 5 with 0.95 Confidence LevelExponential Model 5 with 0.95 Confidence LevelExponential Model 5 with 0.95 Confidence LevelExponential Model 5 with 0.95 Confidence Level Linear Model with 0.95 Confidence LevelLinear Model with 0.95 Confidence LevelLinear Model with 0.95 Confidence LevelLinear Model with 0.95 Confidence LevelLinear Model with 0.95 Confidence LevelLinear Model with 0.95 Confidence LevelLinear Model with 0.95 Confidence Level
8888888ExponentialExponentialExponentialExponentialExponentialExponentialExponential
8888888LinearLinearLinearLinearLinearLinearLinear
BMD Lower BoundBMD Lower BoundBMD Lower BoundBMD Lower BoundBMD Lower BoundBMD Lower BoundBMD Lower Bound
7777777 7777777
666666 666666
Mea
n R
espo
nse
Mea
n R
espo
nse
Mea
n R
espo
nse
Mea
n R
espo
nse
Mea
n R
espo
nse
Mea
n R
espo
nse 555555
444444
333333 333333
22222 22222
11111 11111
00000
00000
17:03 04/13 201017:03 04/13 201017:03 04/13 201017:03 04/13 2010
2020202020
BMDLBMDLBMDLBMDLBMDL
4040404040dosedosedosedose
BMDBMDBMDBMDBMD
6060606060 8080808080 100100100100100
00000
00000
17:03 04/13 201017:03 04/13 201017:03 04/13 201017:03 04/13 2010
2020202020
BMDLBMDLBMDLBMDLBMDL
4040404040
BMDBMDBMDBMDBMD
dosedosedosedose 6060606060 8080808080 100100100100100
G: Polynomial_Mass93_BaP_Cont_Poly
888
Polynomial Model with 0.95 Confidence LevelPolynomial Model with 0.95 Confidence LevelPolynomial Model with 0.95 Confidence LevelPolynomial Model with 0.95 Confidence Level
PolynomialPolynomialPolynomial BMD Lower BoundBMD Lower BoundBMD Lower Bound
H: Power_Mass93_BaP_Cont_Pow
777
Power Model with 0.95 Confidence LevelPower Model with 0.95 Confidence LevelPower Model with 0.95 Confidence LevelPower Model with 0.95 Confidence Level
PowerPowerPower
777 666
666 555
Mea
n R
espo
nse
Mea
n R
espo
nsese
44
33
22
22 1
1
0
0 BMDL BMD BMDL BMD
0 20 40 60 80 100 0 20 40 60 80 100
dose dose 17:03 04/13 2010 17:03 04/13 2010
seMM
ean
Res
pons
eea
n R
espo
nse
MMMMMMea
n R
espo
nse
ean
Res
pons
eea
n R
espo
nse
ean
Res
pons
eea
n R
espo
nse
ean
Res
pons
e
3 3

Table B-2. Mass et al. (1993), benz[j]aceanthrylene, A/J mouse. Continuous dose-response goodness-of-fit tests and benchmark dose estimates at 10% effect levels applied to study results. (6)
Source Substance
Effect Endpoint Continuous
Dose-Response Model (1)
Goodness-of-Fit POD
Benchmark Response (BMR) (5)
Dose (mg/kg)
Notes
p-value for Maximum Likelihood Tests (2)
AIC (3)
Residuals (4)
Animal Tissue Test 1 Test 2 Test 3 Test 4
Scaled Residual of
Interest
Maximum Scaled
Residual BMD BMDL
Busby, 1984 without highest dose (100 mg/kg) BjA A/J Mice lung tumors Hill 1 SD Hill model not applicable
Busby, 1984 without highest dose (100 mg/kg) BjA A/J Mice lung tumors Exponential 2 < 0.0001 < 0.0001 < 0.0001 < 0.0001 412 4.5 4.5 1 SD 18.4 16.4
Busby, 1984 without highest dose (100 mg/kg) BjA A/J Mice lung tumors Exponential 3 < 0.0001 < 0.0001 < 0.0001 < 0.0001 412 4.0E-08 4.5 1 SD 18.4 16.4
Busby, 1984 without highest dose (100 mg/kg) BjA A/J Mice lung tumors Exponential 4 < 0.0001 < 0.0001 < 0.0001 N/A 356 1.6E-08 -1.2E-07 1 SD 3.8 3.1 Best Fit: Exponential 4 model has lowest max scaled
residuals and low AIC
Busby, 1984 without highest dose (100 mg/kg) BjA A/J Mice lung tumors Exponential 5 < 0.0001 < 0.0001 < 0.0001 N/A 524 0.83 3.9 1 SD 17.1 9.2
Busby, 1984 without highest dose (100 mg/kg) BjA A/J Mice lung tumors Linear <.0001 <.0001 <.0001 3.5E-01 355 -1.7E-13 0.83 1 SD 4.2 3.6 Acceptable Fit
Busby, 1984 without highest dose (100 mg/kg) BjA A/J Mice lung tumors Polynomial <.0001 <.0001 <.0001 NA 356 -0.30 -1.3E-12 1 SD 3.8 3.1 Best Fit: Polynomial model has lowest max scaled
residuals and low AIC
Busby, 1984 without highest dose (100 mg/kg) BjA A/J Mice lung tumors Power <.0001 <.0001 <.0001 3.5E-01 355 0 0.83 1 SD 4.2 3.6 Acceptable Fit
Abbreviations AIC = Akaike's Information Criterion POD = point of departure BMD = benchmark dose BMDL = 1-sided 95% lower confidence limit for the benchmark dose
Notes 1. USEPA's BMDS v.2.1.1 was used to determine dose-response continuous data. 2. There are four Maximum Likelihood tests performed by BMDS that test the null hypothesis that the model fits the data as well as the "true" model.
Test 1. Tests the hypothesis that response and variance don't differ among dose levels. If this test accepts, there may not be a dose-response. P-values less than 0.1 indicate a model fit.
Test 2. Tests the hypothesis that variances are homogeneous. If this test accepts, the simpler constant variance model may be appropriate. P-values less than 0.1 indicate a model fit.
Test 3. (non-constant variance model) Test the hypothesis that the variances are adequately modeled. If this test accepts, it may be appropriate to conclude that the variances have been modeled appropriately.
Test 4. (non-constant variance model). Tests the hypothesis that the model for the mean fits the data. If this tests accepts, the user has support for the selected model. P-values greater than 0.1 indicate a model fit.
3. For each dataset, models with relatively low AIC are indicative of better fits. 4. A scaled residual is the difference between the observed and predicted effect (i.e., percent response) divided by the standard deviation. Scaled Residual of Interest is a summary output parameter of the BMDS model, while the Maximum Scaled Residual is the maximum of the scaled residuals of each of the individual dose groups. Absolute value less than 2.0 is indicative of a good fit. Values in bold are >2.0.
5. For multidose continuous data, the BMR used in estimating the point of departure was a change of 1 standard deviation (1 SD) from the control mean. 6. Highest dose level of 100 mg/kg was omitted.
References
Mass, M.J., A. Abu-Shakra, B.C. Roop et al. 1996. Benzo[b]fluoranthene: tumorigenicity in strain A/J mouse lungs, DNA adducts and mutations in the Ki-ras oncogene. Carcinogenesis 17:1701–1704.

60 60 60 60 60 60 60
80 80 80 80 80 80 80
100 100 100 100 100 100 100
60 60 60
80 80 80
100 100 100 100
A: Hill_Mass93_BjA_3doses_Cont_Hill B: Exponential2_Mass93_BjA_3doses_Cont_ExpHill Model with 0.95 Confidence LevelHill Model with 0.95 Confidence LevelHill Model with 0.95 Confidence LevelHill Model with 0.95 Confidence LevelHill Model with 0.95 Confidence LevelHill Model with 0.95 Confidence LevelHill Model with 0.95 Confidence LevelHill Model with 0.95 Confidence Level Exponential Model 2 with 0.95 Confidence LevelExponential Model 2 with 0.95 Confidence LevelExponential Model 2 with 0.95 Confidence LevelExponential Model 2 with 0.95 Confidence LevelExponential Model 2 with 0.95 Confidence LevelExponential Model 2 with 0.95 Confidence LevelExponential Model 2 with 0.95 Confidence LevelExponential Model 2 with 0.95 Confidence Level
160160160160160160160160HillHillHillHillHillHillHillHill
160160160160160160160160ExponentialExponentialExponentialExponentialExponentialExponentialExponentialExponential
140140140140140140140140 140140140140140140140140
120120120120120120120 120120120120120120120
Mea
n R
espo
nse
Mea
n R
espo
nse
Mea
n R
espo
nse
Mea
n R
espo
nse
Mea
n R
espo
nse
Mea
n R
espo
nse
Mea
n R
espo
nse 100100100100100100100
80808080808080
60606060606060
202020202020
404040404040
202020202020
404040404040
000000
000000
17:20 04/13 201017:20 04/13 201017:20 04/13 201017:20 04/13 201017:20 04/13 2010
BMDLBMDLBMDLBMDLBMDLBMDL
202020202020
BMDBMDBMDBMDBMDBMD
404040404040dosedosedosedosedose
606060606060 808080808080 100100100100100100
000000
000000
17:20 04/13 201017:20 04/13 201017:20 04/13 201017:20 04/13 201017:20 04/13 2010
101010101010
BMDLBMDLBMDLBMDLBMDLBMDL
202020202020
BMDBMDBMDBMDBMDBMD
dosedosedosedosedose
303030303030 404040404040 505050505050
C: Exponential3_Mass93_BjA_3doses_Cont_Exp
160160160160
Exponential Model 3 with 0.95 Confidence LevelExponential Model 3 with 0.95 Confidence LevelExponential Model 3 with 0.95 Confidence LevelExponential Model 3 with 0.95 Confidence LevelExponential Model 3 with 0.95 Confidence Level
ExponentialExponentialExponentialExponentialExponential
D: Exponential4_Mass93_BjA_3doses_Cont_Exp
160160160160
Exponential Model 4 with 0.95 Confidence LevelExponential Model 4 with 0.95 Confidence LevelExponential Model 4 with 0.95 Confidence LevelExponential Model 4 with 0.95 Confidence LevelExponential Model 4 with 0.95 Confidence Level
ExponentialExponentialExponentialExponentialExponential
140140140140 140140140140
120120120120 120120120120
Mea
n R
espo
nse
Mea
n R
espo
nse
Mea
n R
espo
nsee 100100100100
808080
606060
404040 404040
202020 202020
00 00BMDLBMDL BMDBMD BMDBMDLBMDL BMD
00 1010 2020 3030 4040 5050 00 1010 2020 3030 4040 5050 dosedose dosedose
17:20 04/13 201017:20 04/13 2010 17:20 04/13 201017:20 04/13 2010
MMMea
n R
espo
nse
ean
Res
pons
eea
n R
espo
nsee
MMMMMMMea
n R
espo
nse
ean
Res
pons
eea
n R
espo
nse
ean
Res
pons
eea
n R
espo
nse
ean
Res
pons
eea
n R
espo
nse

60 60 60 60 60 60
80 80 80 80 80 80
100 100 100 100 100 100
60 60
80 80
100 100 100
E: Exponential5_Mass93_BjA_3doses_Cont_Exp F: Linear_Mass93_BjA_3doses_Cont_Lin Exponential Model 5 with 0.95 Confidence LevelExponential Model 5 with 0.95 Confidence LevelExponential Model 5 with 0.95 Confidence LevelExponential Model 5 with 0.95 Confidence LevelExponential Model 5 with 0.95 Confidence LevelExponential Model 5 with 0.95 Confidence LevelExponential Model 5 with 0.95 Confidence Level Linear Model with 0.95 Confidence LevelLinear Model with 0.95 Confidence LevelLinear Model with 0.95 Confidence LevelLinear Model with 0.95 Confidence LevelLinear Model with 0.95 Confidence LevelLinear Model with 0.95 Confidence LevelLinear Model with 0.95 Confidence Level
ExponentialExponentialExponentialExponentialExponentialExponentialExponential LinearLinearLinearLinearLinearLinearLinear160160160160160160160 160160160160160160160 BMD Lower BoundBMD Lower BoundBMD Lower BoundBMD Lower BoundBMD Lower BoundBMD Lower BoundBMD Lower Bound
140140140140140140140 140140140140140140140
120120120120120120120 120120120120120120120
seMM
ean
Res
pons
eea
n R
espo
nse
MMMMMMea
n R
espo
nse
ean
Res
pons
eea
n R
espo
nse
ean
Res
pons
eea
n R
espo
nse
ean
Res
pons
e
Mea
n R
espo
nse
Mea
n R
espo
nse
Mea
n R
espo
nse
Mea
n R
espo
nse
Mea
n R
espo
nse
Mea
n R
espo
nse 100100100100100100
808080808080
606060606060
4040404040 4040404040
2020202020 2020202020
00000 00000BMDBMDBMDBMDBMDBMDLBMDLBMDLBMDLBMDL BMDBMDL BMDBMDLBMDLBMDLBMDL BMDBMDBMD
00000 2020202020 4040404040 6060606060 8080808080 100100100100100 00000 1010101010 2020202020 3030303030 4040404040 5050505050 dosedosedosedose dosedosedosedose
17:20 04/13 201017:20 04/13 201017:20 04/13 201017:20 04/13 2010 17:20 04/13 201017:20 04/13 201017:20 04/13 201017:20 04/13 2010
G: Polynomial_Mass93_BjA_3doses_Cont_Poly H: Power_Mass93_BjA_3doses_Cont_PowPolynomial Model with 0.95 Confidence LevelPolynomial Model with 0.95 Confidence LevelPolynomial Model with 0.95 Confidence LevelPolynomial Model with 0.95 Confidence Level Power Model with 0.95 Confidence LevelPower Model with 0.95 Confidence LevelPower Model with 0.95 Confidence LevelPower Model with 0.95 Confidence Level
160160160PolynomialPolynomialPolynomial
BMD Lower BoundBMD Lower BoundBMD Lower Bound 160160160 PowerPowerPower
140140140 140140140
120120120 120120120
100100100M
ean
Res
pons
eM
ean
Res
pons
ese
8080
6060
4040 4040
0
20
BMDL BMD
0
20
BMDL BMD
0 10 20 30 40 50 0 10 20 30 40 50
dose dose 17:20 04/13 2010 17:20 04/13 2010
Table B-3. Nesnow et al. (1984), benz[l]aceanthrylene, male mice. Dichotomous dose-response goodness-of-fit tests and benchmark dose estimates at 10% and 67% effect levels applied to study results. (5)
Source Substance
Effect Endpoint Dichotomous Dose-Response
Model (1)
Goodness-of-Fit
POD (% Effect)
Dose (nmol) Alternative
POD (% Effect)
Dose (nmol)
Notes
p-value for Chi-Square
Test (2) AIC (3)
Residuals (4)
Animal Tissue
Scaled Residual of
Interest
Maximum Scaled
Residual BMD BMDL BMD BMDL Nesnow, 1984 without highest
dose (1000 nmol) BlAC male mouse Papilloma Gamma 1.0 39 0 0.030 10% 17.0 3.6 67% 56 38 Acceptable Fit
Nesnow, 1984 without highest
dose (1000 nmol) BlAC male mouse Papilloma Logistic 0.59 41 -0.80 -1.0 10% 21.2 13.0 67% 58 49 Acceptable Fit
Nesnow, 1984 without highest
dose (1000 nmol) BlAC male mouse Papilloma LogLogistic 1.0 39 0 0.21 10% 24.4 8.7 67% 55 41 Acceptable Fit
Nesnow, 1984 without highest
dose (1000 nmol) BlAC male mouse Papilloma LogProbit 1.0 39 0 0.093 10% 22.5 7.2 67% 55 40 Acceptable Fit
Nesnow, 1984 without highest
dose (1000 nmol) BlAC male mouse Papilloma Multistage 1.0 39 0 0.0030 10% 10.2 3.6 67% 56 38 Acceptable Fit
Nesnow, 1984 without highest
dose (1000 nmol) BlAC male mouse Papilloma Multistage-Cancer 1.0 39 0 0.0030 10% 10.2 3.6 67% 56 38
Best Fit: Multi-Stage model has the lowest maxmimum scaled residual, low AIC, and highest p-value
Nesnow, 1984 without highest
dose (1000 nmol) BlAC male mouse Papilloma Probit 0.57 41 -0.78 -0.89 10% 19.4 12.3 67% 61 52 Acceptable Fit
Nesnow, 1984 without highest
dose (1000 nmol) BlAC male mouse Papilloma Weibull 1.0 39 0 0.0080 10% 13.3 3.6 67% 56 38 Acceptable Fit
Nesnow, 1984 without highest
dose (1000 nmol) BlAC male mouse Papilloma Quantal-Linear 0.91 38 0 -0.71 10% 4.7 3.4 67% 49 35 Acceptable Fit
Abbreviations AIC = Akaike's Information Criterion POD = point of departure BMD = benchmark dose BMDL = 1-sided 95% lower confidence limit for the benchmark dose
Notes 1. USEPA's BMDS v.2.1.1 was used to determine dose-response dichotomous data. 2. Chi-square test is a hypothesis test in which the null hypothesis is that data fit the dose-response function. Higher p-values indicate better fits. 3. For each dataset, models with relatively low AIC are indicative of better fits. 4. A scaled residual is the difference between the observed and predicted effect (i.e., percent response) divided by the standard deviation. Scaled Residual of Interest is a summary output parameter of the BMDS model, while the Maximum Scaled Residual is the maximum of the scaled residuals of each of the individual dose groups. Absolute value less than 2.0 is indicative of a good fit. Values in bold are >2.0. 5. Highest dose of 1000 nmol was omitted.
References
Nesnow, S., A. Gold, R. Sangaiah et al. 1984. Mouse skin tumor-initiating activity of benz[e]aceanthrylene and benz[l]aceanthrylene in Sencar mice. Cancer Lett 22:263–268.
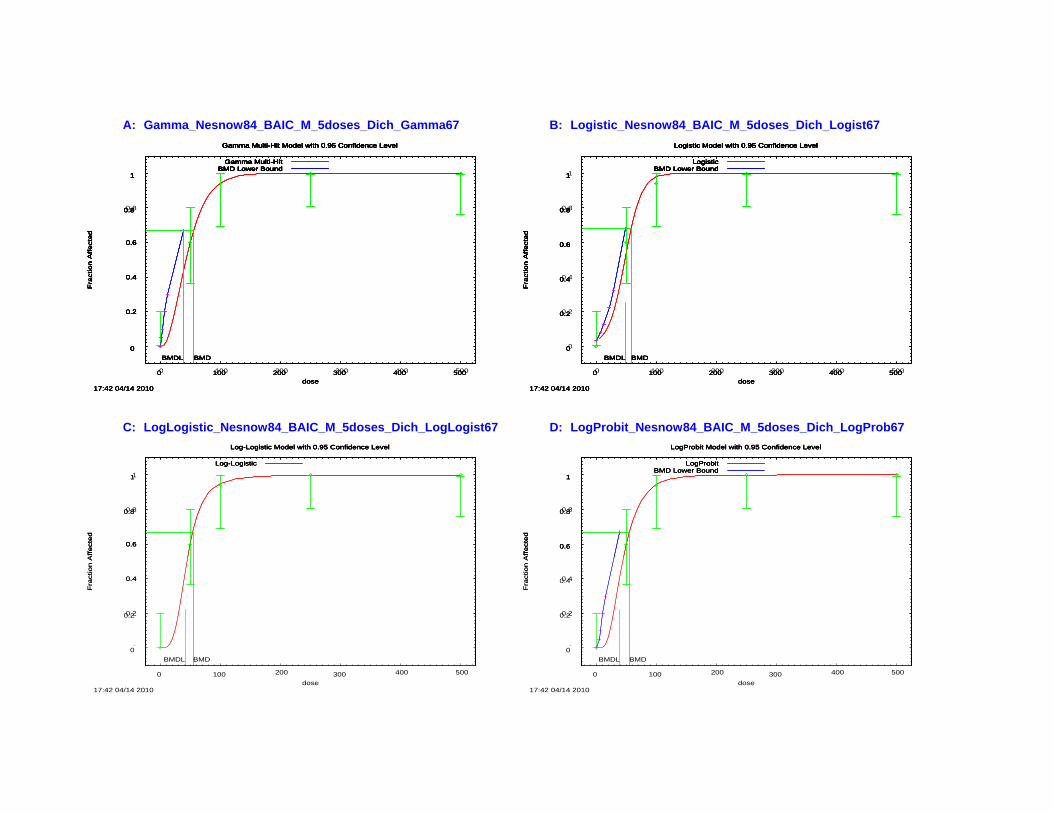
A A
0.2 0.2 0.2 0.2 0.2
0.4 0.4 0.4 0.4 0.4
0.6 0.6 0.6 0.6 0.6 0.6
0.4 0.4
0.6 0.6 0.6
A: Gamma_Nesnow84_BAIC_M_5doses_Dich_Gamma67 B: Logistic_Nesnow84_BAIC_M_5doses_Dich_Logist67 Gamma Multi-Hit Model with 0.95 Confidence LevelGamma Multi-Hit Model with 0.95 Confidence LevelGamma Multi-Hit Model with 0.95 Confidence LevelGamma Multi-Hit Model with 0.95 Confidence LevelGamma Multi-Hit Model with 0.95 Confidence LevelGamma Multi-Hit Model with 0.95 Confidence LevelGamma Multi-Hit Model with 0.95 Confidence Level Logistic Model with 0.95 Confidence LevelLogistic Model with 0.95 Confidence LevelLogistic Model with 0.95 Confidence LevelLogistic Model with 0.95 Confidence LevelLogistic Model with 0.95 Confidence LevelLogistic Model with 0.95 Confidence LevelLogistic Model with 0.95 Confidence Level
Gamma Multi-HitGamma Multi-HitGamma Multi-HitGamma Multi-HitGamma Multi-HitGamma Multi-HitGamma Multi-Hit LogisticLogisticLogisticLogisticLogisticLogisticLogistic BMD Lower BoundBMD Lower BoundBMD Lower BoundBMD Lower BoundBMD Lower BoundBMD Lower BoundBMD Lower Bound BMD Lower BoundBMD Lower BoundBMD Lower BoundBMD Lower BoundBMD Lower BoundBMD Lower BoundBMD Lower Bound
1111111 1111111
0.80.80.80.80.80.8 0.80.80.80.80.80.8
ffe
cte
dF
rac
Fra
cF
rac
Fra
cF
ract
ititititiff
ec
on
Aff
ec
on
Ao
n A
on
Ao
n A
ffe
cff
ec
ffe
cff
ectttttt
ed
ed
ed
ed
ed
ed
on
AF
rac
Fra
ctitio
n A
on
Aff
ec
ffe
ctte
de
d
00000BMDLBMDLBMDLBMDLBMDL BMDBMDBMDBMDBMD
0000 100100100100 200200200200 300300300300 400400400400 500500500500 dosedosedosedose
17:42 04/14 201017:42 04/14 201017:42 04/14 201017:42 04/14 2010
C: LogLogistic_Nesnow84_BAIC_M_5doses_Dich_LogLogist67 Log-Logistic Model with 0.95 Confidence LevelLog-Logistic Model with 0.95 Confidence LevelLog-Logistic Model with 0.95 Confidence LevelLog-Logistic Model with 0.95 Confidence Level
Log-LogisticLog-LogisticLog-LogisticLog-Logistic
111
0.80.80.8
ff
ect
ed
Fra
cF
rac
Fra
cF
rac
Fra
ctititititi
ffe
co
n A
ffe
co
n A
on
Ao
n A
on
Aff
ec
ffe
cff
ec
ffe
ctttttte
de
de
de
de
de
do
n A
Fra
cF
ract
ition
Ao
n A
ffe
cff
ectt
ed
ed
0.60.60.60.60.60.6
0.40.40.40.40.4
0.20.20.20.20.2
00000BMDLBMDLBMDLBMDLBMDL BMDBMDBMDBMDBMD
0000 100100100100 200200200200 300300300300 400400400400 500500500500 dosedosedosedose
17:42 04/14 201017:42 04/14 201017:42 04/14 201017:42 04/14 2010
D: LogProbit_Nesnow84_BAIC_M_5doses_Dich_LogProb67LogProbit Model with 0.95 Confidence LevelLogProbit Model with 0.95 Confidence LevelLogProbit Model with 0.95 Confidence LevelLogProbit Model with 0.95 Confidence Level
LogProbitLogProbitLogProbitLogProbit BMD Lower BoundBMD Lower BoundBMD Lower Bound
111
0.80.80.8
0.60.60.6
0.40.4
0.20.2 0.20.2
00
17:42 04/14 2010
0
BMDL
100
BMD
200
dose 300 400 500
00
17:42 04/14 2010
0
BMDL
100
BMD
200
dose 300 400 500

0.2 0.2 0.2 0.2 0.2
0.4 0.4 0.4 0.4 0.4
0.6 0.6 0.6 0.6 0.6 0.6
0.4 0.4
0.6 0.6 0.6
E: Multistage_Nesnow84_BAIC_M_5doses_Dich_Multi67 F: Multistage-Cancer_Nesnow84_BAIC_M_5doses_Dich_MultiCanc67Multistage Model with 0.95 Confidence LevelMultistage Model with 0.95 Confidence LevelMultistage Model with 0.95 Confidence LevelMultistage Model with 0.95 Confidence LevelMultistage Model with 0.95 Confidence LevelMultistage Model with 0.95 Confidence LevelMultistage Model with 0.95 Confidence Level Multistage Cancer Model with 0.95 Confidence LevelMultistage Cancer Model with 0.95 Confidence LevelMultistage Cancer Model with 0.95 Confidence LevelMultistage Cancer Model with 0.95 Confidence LevelMultistage Cancer Model with 0.95 Confidence LevelMultistage Cancer Model with 0.95 Confidence LevelMultistage Cancer Model with 0.95 Confidence Level
MultistageMultistageMultistageMultistageMultistageMultistageMultistage Multistage CancerMultistage CancerMultistage CancerMultistage CancerMultistage CancerMultistage CancerMultistage Cancer BMD Lower BoundBMD Lower BoundBMD Lower BoundBMD Lower BoundBMD Lower BoundBMD Lower BoundBMD Lower Bound Linear extrapolationLinear extrapolationLinear extrapolationLinear extrapolationLinear extrapolationLinear extrapolationLinear extrapolation
1111111 1111111 BMD Lower BoundBMD Lower BoundBMD Lower BoundBMD Lower BoundBMD Lower BoundBMD Lower BoundBMD Lower Bound
0.80.80.80.80.80.8 0.80.80.80.80.80.8
Aff
ect
ed
Fra
cF
rac
Fra
cF
rac
Fra
co
n A
tion
Atitititio
n A
on
Ao
n A
on
Aff
ec
ffe
cff
ec
ffe
cff
ec
ffe
ctttttte
de
de
de
de
de
dF
rac
Fra
ctitio
n A
on
Aff
ec
ffe
ctte
de
d
00000BMDLBMDLBMDLBMDLBMDL BMDBMDBMDBMDBMD
0000 100100100100 200200200200 300300300300 400400400400 500500500500 dosedosedosedose
17:42 04/14 201017:42 04/14 201017:42 04/14 201017:42 04/14 2010
G: Probit_Nesnow84_BAIC_M_5doses_Dich_Probit67 Probit Model with 0.95 Confidence LevelProbit Model with 0.95 Confidence LevelProbit Model with 0.95 Confidence LevelProbit Model with 0.95 Confidence Level
ProbitProbitProbit BMD Lower BoundBMD Lower BoundBMD Lower Bound
111
0.80.80.8
A
ffe
cte
dF
rac
Fra
cF
rac
Fra
cF
rac
on
Atio
n A
tititition
Ao
n A
on
Ao
n A
ffe
cff
ec
ffe
cff
ec
ffe
cff
ectttttt
ed
ed
ed
ed
ed
ed
Fra
cF
ract
ition
Ao
n A
ffe
cff
ectt
ed
ed
0.60.60.60.60.60.6
0.40.40.40.40.4
0.20.20.20.20.2
00000BMDLBMDLBMDLBMDLBMDL BMDBMDBMDBMDBMD
0000 100100100100 200200200200 300300300300 400400400400 500500500500 dosedosedosedose
17:42 04/14 201017:42 04/14 201017:42 04/14 201017:42 04/14 2010
H: Weibull_Nesnow84_BAIC_M_5doses_Dich_Weibull67Weibull Model with 0.95 Confidence LevelWeibull Model with 0.95 Confidence LevelWeibull Model with 0.95 Confidence LevelWeibull Model with 0.95 Confidence Level
WeibullWeibullWeibull BMD Lower BoundBMD Lower BoundBMD Lower Bound
111
0.80.80.8
0.60.60.6
0.40.4
0.20.2
00 00BMDL BMD BMDL BMD
0 100 200 300 400 500 0 100 200 300 400 500
dose dose 17:42 04/14 2010 17:42 04/14 2010
0.2 0.2

I: Quantal-Linear_Nesnow84_BAIC_M_5doses_Dich_QntLin67Quantal Linear Model with 0.95 Confidence LevelQuantal Linear Model with 0.95 Confidence LevelQuantal Linear Model with 0.95 Confidence Level
0.8
1
Quantal LinearBMD Lower Bound
0.2
0.4
0.6
0.8
1
Fra
ctio
n A
ffe
cte
d
Quantal LinearBMD Lower Bound
0
0.2
0.4
0.6
0.8
1
Fra
ctio
n A
ffe
cte
d
BMDL BMD
Quantal Linear BMD Lower Bound
0 100 200 300 400 500
dose 17:42 04/14 2010
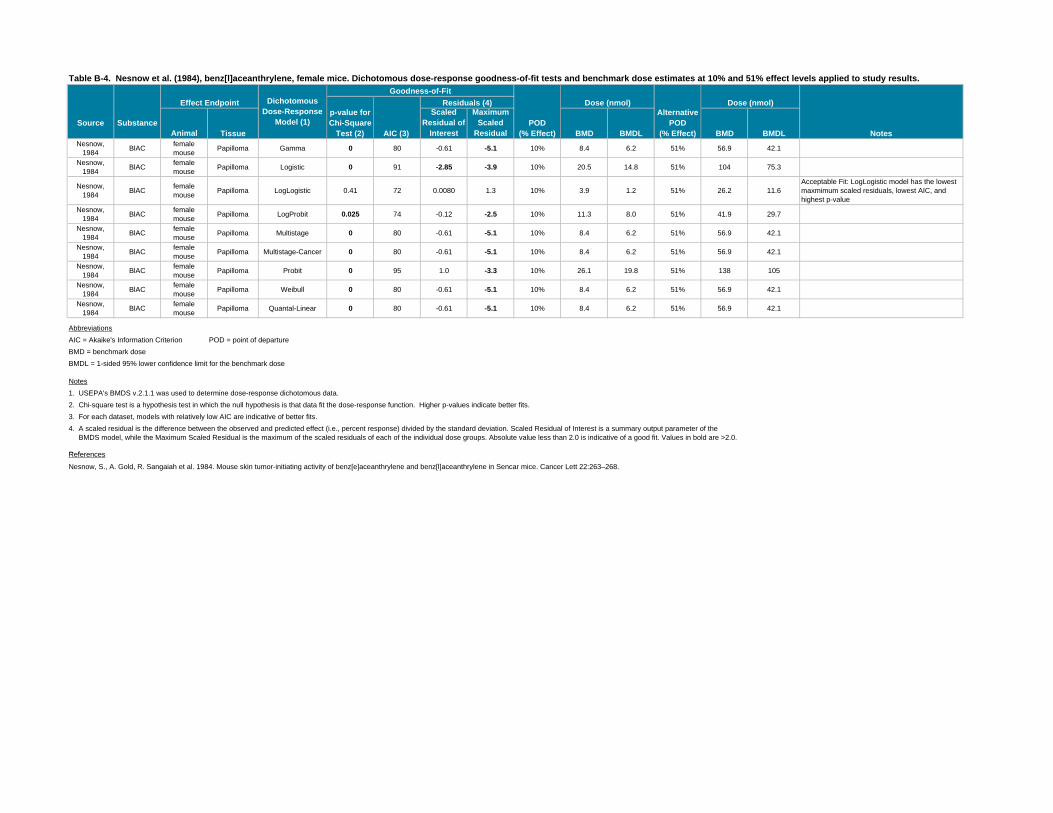
Table B-4. Nesnow et al. (1984), benz[l]aceanthrylene, female mice. Dichotomous dose-response goodness-of-fit tests and benchmark dose estimates at 10% and 51% effect levels applied to study results.
Source Substance
Effect Endpoint Dichotomous Dose-Response
Model (1)
Goodness-of-Fit
POD (% Effect)
Dose (nmol) Alternative
POD (% Effect)
Dose (nmol)
Notes
p-value for Chi-Square
Test (2) AIC (3)
Residuals (4)
Animal Tissue
Scaled Residual of
Interest
Maximum Scaled
Residual BMD BMDL BMD BMDL Nesnow,
1984 BlAC female mouse Papilloma Gamma 0 80 -0.61 -5.1 10% 8.4 6.2 51% 56.9 42.1
Nesnow, 1984 BlAC female
mouse Papilloma Logistic 0 91 -2.85 -3.9 10% 20.5 14.8 51% 104 75.3
Nesnow, 1984 BlAC female
mouse Papilloma LogLogistic 0.41 72 0.0080 1.3 10% 3.9 1.2 51% 26.2 11.6 Acceptable Fit: LogLogistic model has the lowest maxmimum scaled residuals, lowest AIC, and highest p-value
Nesnow, 1984 BlAC female
mouse Papilloma LogProbit 0.025 74 -0.12 -2.5 10% 11.3 8.0 51% 41.9 29.7
Nesnow, 1984 BlAC female
mouse Papilloma Multistage 0 80 -0.61 -5.1 10% 8.4 6.2 51% 56.9 42.1
Nesnow, 1984 BlAC female
mouse Papilloma Multistage-Cancer 0 80 -0.61 -5.1 10% 8.4 6.2 51% 56.9 42.1
Nesnow, 1984 BlAC female
mouse Papilloma Probit 0 95 1.0 -3.3 10% 26.1 19.8 51% 138 105
Nesnow, 1984 BlAC female
mouse Papilloma Weibull 0 80 -0.61 -5.1 10% 8.4 6.2 51% 56.9 42.1
Nesnow, 1984 BlAC female
mouse Papilloma Quantal-Linear 0 80 -0.61 -5.1 10% 8.4 6.2 51% 56.9 42.1
Abbreviations AIC = Akaike's Information Criterion POD = point of departure BMD = benchmark dose BMDL = 1-sided 95% lower confidence limit for the benchmark dose
Notes 1. USEPA's BMDS v.2.1.1 was used to determine dose-response dichotomous data. 2. Chi-square test is a hypothesis test in which the null hypothesis is that data fit the dose-response function. Higher p-values indicate better fits. 3. For each dataset, models with relatively low AIC are indicative of better fits. 4. A scaled residual is the difference between the observed and predicted effect (i.e., percent response) divided by the standard deviation. Scaled Residual of Interest is a summary output parameter of the BMDS model, while the Maximum Scaled Residual is the maximum of the scaled residuals of each of the individual dose groups. Absolute value less than 2.0 is indicative of a good fit. Values in bold are >2.0.
R fReferences
Nesnow, S., A. Gold, R. Sangaiah et al. 1984. Mouse skin tumor-initiating activity of benz[e]aceanthrylene and benz[l]aceanthrylene in Sencar mice. Cancer Lett 22:263–268.

0.4 0.4 0.4 0.4 0.4 0.4
0.4 0.4
0.6 0.6
A: Gamma_Nesnow84_BAIC_F_Dich_Gamma51 B: Logistic_Nesnow84_BAIC_F_Dich_Logist51Gamma Multi-Hit Model with 0.95 Confidence LevelGamma Multi-Hit Model with 0.95 Confidence LevelGamma Multi-Hit Model with 0.95 Confidence LevelGamma Multi-Hit Model with 0.95 Confidence LevelGamma Multi-Hit Model with 0.95 Confidence LevelGamma Multi-Hit Model with 0.95 Confidence LevelGamma Multi-Hit Model with 0.95 Confidence Level Logistic Model with 0.95 Confidence LevelLogistic Model with 0.95 Confidence LevelLogistic Model with 0.95 Confidence LevelLogistic Model with 0.95 Confidence LevelLogistic Model with 0.95 Confidence LevelLogistic Model with 0.95 Confidence LevelLogistic Model with 0.95 Confidence Level
Gamma Multi-HitGamma Multi-HitGamma Multi-HitGamma Multi-HitGamma Multi-HitGamma Multi-HitGamma Multi-Hit LogisticLogisticLogisticLogisticLogisticLogisticLogistic BMD Lower BoundBMD Lower BoundBMD Lower BoundBMD Lower BoundBMD Lower BoundBMD Lower BoundBMD Lower Bound BMD Lower BoundBMD Lower BoundBMD Lower BoundBMD Lower BoundBMD Lower BoundBMD Lower BoundBMD Lower Bound
1111111 1111111
0.80.80.80.80.80.8 0.80.80.80.80.80.8
ed
r
Fr
FFFFrrrra
cta
cta
cta
cta
cta
ctiiiiiio
n A
fo
n A
fo
n A
fo
n A
fo
n A
fo
n A
fffffffeeeeee
ctctctctctcte
de
de
de
de
de
dFF
rract
act
iion
Af
on
Afffee
ctcte
de
d
0.60.60.60.60.60.6
0.20.20.20.20.2
00000BMDLBMDLBMDLBMDLBMDL BMDBMDBMDBMDBMD
00000 200200200200200 400400400400400 600600600600600 800800800800800 10001000100010001000 dosedosedosedose
17:47 04/14 201017:47 04/14 201017:47 04/14 201017:47 04/14 2010
C: LogLogistic_Nesnow84_BAIC_F_Dich_LogLogist51 Log-Logistic Model with 0.95 Confidence LevelLog-Logistic Model with 0.95 Confidence LevelLog-Logistic Model with 0.95 Confidence LevelLog-Logistic Model with 0.95 Confidence Level
Log-LogisticLog-LogisticLog-Logistic
111
0.80.80.8
ed
rF
rFFFF
rrrract
act
act
act
act
act
iiiiiion
Af
on
Af
on
Af
on
Af
on
Af
on
Afffffffeeeeee
ctctctctctcte
de
de
de
de
de
dFF
rract
act
iion
Af
on
Afffee
ctcte
de
d
0.60.60.60.60.60.6
0.40.40.40.40.40.4
0.20.20.20.20.2
00000BMDLBMDLBMDLBMDLBMDL BMDBMDBMDBMDBMD
00000 200200200200200 400400400400400 600600600600600 800800800800800 10001000100010001000 dosedosedosedose
17:47 04/14 201017:47 04/14 201017:47 04/14 201017:47 04/14 2010
D: LogProbit_Nesnow84_BAIC_F_Dich_LogProb51LogProbit Model with 0.95 Confidence LevelLogProbit Model with 0.95 Confidence LevelLogProbit Model with 0.95 Confidence LevelLogProbit Model with 0.95 Confidence Level
LogProbitLogProbitLogProbit BMD Lower BoundBMD Lower BoundBMD Lower Bound
111
0.80.80.8
0.60.6
0.40.4
0.20.2
0 0
BMDL BMD BMDL BMD
0 200 400 600 800 1000 0 200 400 600 800 1000
dose dose 17:47 04/14 2010 17:47 04/14 2010
0.2 0.2

0.4 0.4 0.4 0.4 0.4 0.4
0.4 0.4
0.6 0.6 0.6
E: Multistage_Nesnow84_BAIC_F_Dich_Multi51 F: Multistage-Cancer_Nesnow84_BAIC_F_Dich_MultiCanc51 Multistage Model with 0.95 Confidence LevelMultistage Model with 0.95 Confidence LevelMultistage Model with 0.95 Confidence LevelMultistage Model with 0.95 Confidence LevelMultistage Model with 0.95 Confidence LevelMultistage Model with 0.95 Confidence LevelMultistage Model with 0.95 Confidence Level Multistage Cancer Model with 0.95 Confidence LevelMultistage Cancer Model with 0.95 Confidence LevelMultistage Cancer Model with 0.95 Confidence LevelMultistage Cancer Model with 0.95 Confidence LevelMultistage Cancer Model with 0.95 Confidence LevelMultistage Cancer Model with 0.95 Confidence LevelMultistage Cancer Model with 0.95 Confidence Level
MultistageMultistageMultistageMultistageMultistageMultistageMultistage Multistage CancerMultistage CancerMultistage CancerMultistage CancerMultistage CancerMultistage CancerMultistage Cancer BMD Lower BoundBMD Lower BoundBMD Lower BoundBMD Lower BoundBMD Lower BoundBMD Lower BoundBMD Lower Bound Linear extrapolationLinear extrapolationLinear extrapolationLinear extrapolationLinear extrapolationLinear extrapolationLinear extrapolation
1111111 1111111 BMD Lower BoundBMD Lower BoundBMD Lower BoundBMD Lower BoundBMD Lower BoundBMD Lower BoundBMD Lower Bound
0.80.80.80.80.80.8 0.80.80.80.80.80.8
0.60.60.60.60.60.6
FFrra
cta
ctiio
n A
fo
n A
fffee
ctcte
de
d
Fra
ctio
n A
fA
ffe
cte
dFFFFF
rrrrract
act
act
act
act
iiiiif
on
Aff
on
Af
on
Af
on
Af
on
Afffffeeeeee
ctctctctctcte
de
de
de
de
de
d
0.60.60.60.60.60.6
0.40.40.40.40.40.4
0.20.20.20.20.2 0.20.20.20.20.2
00000 00000
BMDBMDL BMDBMDLBMDLBMDLBMDL BMDBMDBMD BMDBMDL BMDBMDLBMDLBMDLBMDL BMDBMDBMD
00000 200200200200200 400400400400400 600600600600600 800800800800800 10001000100010001000 00000 200200200200200 400400400400400 600600600600600 800800800800800 10001000100010001000 dosedosedosedose dosedosedosedose
17:47 04/14 201017:47 04/14 201017:47 04/14 201017:47 04/14 2010 17:47 04/14 201017:47 04/14 201017:47 04/14 201017:47 04/14 2010
G: Probit_Nesnow84_BAIC_F_Dich_Probit51 H: Weibull_Nesnow84_BAIC_F_Dich_Weibull51Probit Model with 0.95 Confidence LevelProbit Model with 0.95 Confidence LevelProbit Model with 0.95 Confidence LevelProbit Model with 0.95 Confidence Level Weibull Model with 0.95 Confidence LevelWeibull Model with 0.95 Confidence LevelWeibull Model with 0.95 Confidence LevelWeibull Model with 0.95 Confidence Level
ProbitProbitProbitProbit WeibullWeibullWeibullWeibull BMD Lower BoundBMD Lower BoundBMD Lower Bound BMD Lower BoundBMD Lower BoundBMD Lower Bound
111 111
0.80.80.8 0.80.80.8
0.60.60.6
0.40.4
0.20.2
FFrra
cta
ctiio
n A
fo
n A
fffee
ctcte
de
d
Fra
ctio
n A
fA
ffe
cte
dFFFFF
rrrrract
act
act
act
act
iiiiif
on
Aff
on
Af
on
Af
on
Af
on
Afffffeeeeee
ctctctctctcte
de
de
de
de
de
d
0 0
BMDL BMD BMDL BMD
0 200 400 600 800 1000 0 200 400 600 800 1000
dose dose 17:47 04/14 2010 17:47 04/14 2010
0.2 0.2

FFFrrra
cta
cta
ctiiio
n A
fo
n A
fo
n A
ffffeee
ctctcte
de
de
d
I: Quantal-LinearQuantal-Linear_Nesnow84Nesnow84_BAICBAIC_FF_DichDich_QntLin51QntLin51I: Quantal Linear Model with 0.95 Confidence LevelQuantal Linear Model with 0.95 Confidence LevelQuantal Linear Model with 0.95 Confidence LevelQuantal Linear Model with 0.95 Confidence Level
1111
0.80.80.80.8
0.60.60.6
0.40.40.4
0.20.20.2
00
dosedose 17:47 04/14 201017:47 04/14 2010
Quantal LinearBMD Lower Bound
Quantal LinearBMD Lower Bound
BMDL BMD
Quantal LinearBMD Lower Bound
BMDL BMD
Quantal Linear BMD Lower Bound
00 200200 400400 600600 800800 1000 1000

Table B-5. Nesnow et al. (1984), benz[e]aceanthrylene, male mice. Dichotomous dose-response goodness-of-fit tests and benchmark dose estimates at 10% and 67% effect levels applied to study results.
Source Substance
Effect Endpoint Dichotomous Dose-Response
Model (1)
Goodness-of-Fit
POD (% Effect)
Dose (nmol) Alternative
POD (% Effect)
Dose (nmol)
Notes
p-value for Chi-Square
Test (2) AIC (3)
Residuals (4)
Animal Tissue
Scaled Residual of
Interest
Maximum Scaled
Residual BMD BMDL BMD BMDL Nesnow,
1984 BeAC male mouse Papilloma Gamma 0.76 106 0.90 -0.93 10% 37.3 29.0 67% 393 306 Acceptable Fit
Nesnow, 1984 BeAC male mouse Papilloma Logistic 0.025 119 -0.36 -1.9 10% 105.8 81.7 67% 517 412
Nesnow, 1984 BeAC male mouse Papilloma LogLogistic 0.85 107 0.69 -0.89 10% 35.6 16.7 67% 357 257
Best Fit: LogLogistic model has the lowest maxmimum scaled residuals, low AIC, and highest p-value.
Nesnow, 1984 BeAC male mouse Papilloma LogProbit 0.33 110 1.68 1.7 10% 61.0 44.8 67% 341 251 Acceptable Fit
Nesnow, 1984 BeAC male mouse Papilloma Multistage 0.76 106 0.90 -0.93 10% 37.3 29.0 67% 393 306 Acceptable Fit
Nesnow, 1984 BeAC male mouse Papilloma Multistage-Cancer 0.76 106 0.90 -0.93 10% 37.3 29.0 67% 393 306 Acceptable Fit
Nesnow, 1984 BeAC male mouse Papilloma Probit 0.020 120 -0.4 2.0 10% 107.5 85.5 67% 565 464
Nesnow, 1984 BeAC male mouse Papilloma Weibull 0.76 106 0.90 -0.93 10% 37.3 29.0 67% 393 306 Acceptable Fit
Nesnow, 1984 BeAC male mouse Papilloma Quantal-Linear 0.76 106 0.90 -0.93 10% 37.3 29.0 67% 393 306 Acceptable Fit
Abbreviations AIC = Akaike's Information Criterion POD = point of departure BMD = benchmark dose BMDL = 1-sided 95% lower confidence limit for the benchmark dose
Notes 1. USEPA's BMDS v.2.1.1 was used to determine dose-response dichotomous data. 2. Chi-square test is a hypothesis test in which the null hypothesis is that data fit the dose-response function. Higher p-values indicate better fits. 3. For each dataset, models with relatively low AIC are indicative of better fits. 4. A scaled residual is the difference between the observed and predicted effect (i.e., percent response) divided by the standard deviation. Scaled Residual of Interest is a summary output parameter of the BMDS model, while the Maximum Scaled Residual is the maximum of the scaled residuals of each of the individual dose groups. Absolute value less than 2.0 is indicative of a good fit. Values in bold are >2.0.
R fReferences
Nesnow, S., A. Gold, R. Sangaiah et al. 1984. Mouse skin tumor-initiating activity of benz[e]aceanthrylene and benz[l]aceanthrylene in Sencar mice. Cancer Lett 22:263–268.

0.4 0.4 0.4 0.4 0.4 0.4
0.6 0.6 0.6 0.6 0.6 0.6
0.4 0.4
0.6 0.6 0.6
A: Gamma_Nesnow84_BeAC_M_Dich_Gamma67 B: Logistic_Nesnow84_BeAC_M_Dich_Logist67Gamma Multi-Hit Model with 0.95 Confidence LevelGamma Multi-Hit Model with 0.95 Confidence LevelGamma Multi-Hit Model with 0.95 Confidence LevelGamma Multi-Hit Model with 0.95 Confidence LevelGamma Multi-Hit Model with 0.95 Confidence LevelGamma Multi-Hit Model with 0.95 Confidence LevelGamma Multi-Hit Model with 0.95 Confidence Level Logistic Model with 0.95 Confidence LevelLogistic Model with 0.95 Confidence LevelLogistic Model with 0.95 Confidence LevelLogistic Model with 0.95 Confidence LevelLogistic Model with 0.95 Confidence LevelLogistic Model with 0.95 Confidence LevelLogistic Model with 0.95 Confidence Level
Gamma Multi-HitGamma Multi-HitGamma Multi-HitGamma Multi-HitGamma Multi-HitGamma Multi-HitGamma Multi-Hit LogisticLogisticLogisticLogisticLogisticLogisticLogistic BMD Lower BoundBMD Lower BoundBMD Lower BoundBMD Lower BoundBMD Lower BoundBMD Lower BoundBMD Lower Bound BMD Lower BoundBMD Lower BoundBMD Lower BoundBMD Lower BoundBMD Lower BoundBMD Lower BoundBMD Lower Bound1111111 1111111
0.80.80.80.80.80.8 0.80.80.80.80.80.8
0.20.20.20.20.2 0.20.20.20.20.2
00000 00000
BMDLBMDLBMDLBMDLBMDL BMDBMDBMDBMDBMD BMDLBMDLBMDLBMDLBMDL BMDBMDBMDBMDBMD
00000 200200200200200 400400400400400 600600600600600 800800800800800 10001000100010001000 00000 200200200200200 400400400400400 600600600600600 800800800800800 10001000100010001000 dosedosedosedose dosedosedosedose
17:54 04/14 201017:54 04/14 201017:54 04/14 201017:54 04/14 2010 17:54 04/14 201017:54 04/14 201017:54 04/14 201017:54 04/14 2010
C: LogLogistic_Nesnow84_BeAC_M_Dich_LogLogist67 D: LogProbit_Nesnow84_BeAC_M_Dich_LogProb67Log-Logistic Model with 0.95 Confidence LevelLog-Logistic Model with 0.95 Confidence LevelLog-Logistic Model with 0.95 Confidence LevelLog-Logistic Model with 0.95 Confidence Level LogProbit Model with 0.95 Confidence LevelLogProbit Model with 0.95 Confidence LevelLogProbit Model with 0.95 Confidence LevelLogProbit Model with 0.95 Confidence Level
Log-LogisticLog-LogisticLog-LogisticLog-Logistic LogProbitLogProbitLogProbitLogProbit 111 BMD Lower BoundBMD Lower BoundBMD Lower Bound111
0.80.80.8 0.80.80.8
A
ffe
cte
dFF
rract
act
iion
Af
on
Afffee
ctctr
Fr
Fr
FFe
de
d
rrF
ract
act
act
act
act
act
iiiiiion
Af
on
Af
on
Af
on
Af
on
Af
on
Afffffffeeeeee
ctctctctctcte
de
de
de
de
de
d
0.60.60.60.60.60.6
0.40.40.40.40.40.4
0.60.60.6
0.40.4
0.20.2
Affe
cte
dFF
rract
act
iion
Af
on
Afffee
ctctr
Fr
Fr
FFe
de
d
rrF
ract
act
act
act
act
act
iiiiiion
Af
on
Af
on
Af
on
Af
on
Af
on
Afffffffeeeeee
ctctctctctcte
de
de
de
de
de
d
0 0
BMDL BMD BMDL BMD
0 200 400 600 800 1000 0 200 400 600 800 1000
dose dose 17:54 04/14 2010 17:54 04/14 2010
0.2 0.2

0.4 0.4 0.4 0.4 0.4 0.4
0.6 0.6 0.6 0.6 0.6 0.6
0.4 0.4
0.6 0.6 0.6
E: Multistage_Nesnow84_BeAC_M_Dich_Multi67 F: Multistage-Cancer_Nesnow84_BeAC_M_Dich_MultiCanc67 Multistage Model with 0.95 Confidence LevelMultistage Model with 0.95 Confidence LevelMultistage Model with 0.95 Confidence LevelMultistage Model with 0.95 Confidence LevelMultistage Model with 0.95 Confidence LevelMultistage Model with 0.95 Confidence LevelMultistage Model with 0.95 Confidence Level Multistage Cancer Model with 0.95 Confidence LevelMultistage Cancer Model with 0.95 Confidence LevelMultistage Cancer Model with 0.95 Confidence LevelMultistage Cancer Model with 0.95 Confidence LevelMultistage Cancer Model with 0.95 Confidence LevelMultistage Cancer Model with 0.95 Confidence LevelMultistage Cancer Model with 0.95 Confidence Level
MultistageMultistageMultistageMultistageMultistageMultistageMultistage Multistage CancerMultistage CancerMultistage CancerMultistage CancerMultistage CancerMultistage CancerMultistage Cancer 1111111 BMD Lower BoundBMD Lower BoundBMD Lower BoundBMD Lower BoundBMD Lower BoundBMD Lower BoundBMD Lower Bound Linear extrapolationLinear extrapolationLinear extrapolationLinear extrapolationLinear extrapolationLinear extrapolationLinear extrapolation
BMD Lower BoundBMD Lower BoundBMD Lower BoundBMD Lower BoundBMD Lower BoundBMD Lower BoundBMD Lower Bound 1111111
0.80.80.80.80.80.8 0.80.80.80.80.80.8
0.20.20.20.20.2 0.20.20.20.20.2
00000 00000
BMDBMDL BMDBMDLBMDLBMDLBMDL BMDBMDBMD BMDBMDL BMDBMDLBMDLBMDLBMDL BMDBMDBMD
00000 200200200200200 400400400400400 600600600600600 800800800800800 10001000100010001000 00000 200200200200200 400400400400400 600600600600600 800800800800800 10001000100010001000 dosedosedosedose dosedosedosedose
17:54 04/14 201017:54 04/14 201017:54 04/14 201017:54 04/14 2010 17:54 04/14 201017:54 04/14 201017:54 04/14 201017:54 04/14 2010
G: Probit_Nesnow84_BeAC_M_Dich_Probit67 H: Weibull_Nesnow84_BeAC_M_Dich_Weibull67Probit Model with 0.95 Confidence LevelProbit Model with 0.95 Confidence LevelProbit Model with 0.95 Confidence LevelProbit Model with 0.95 Confidence Level Weibull Model with 0.95 Confidence LevelWeibull Model with 0.95 Confidence LevelWeibull Model with 0.95 Confidence LevelWeibull Model with 0.95 Confidence Level
ProbitProbitProbitProbit WeibullWeibullWeibullWeibull 111 BMD Lower BoundBMD Lower BoundBMD Lower Bound BMD Lower BoundBMD Lower BoundBMD Lower Bound111
0.80.80.8 0.80.80.8
FFrra
cta
ctiio
n A
fo
n A
fffee
ctcte
de
d
Fra
ctio
n A
fA
ffe
cte
dFFFFF
rrrrract
act
act
act
act
iiiiif
on
Aff
on
Af
on
Af
on
Af
on
Afffffeeeeee
ctctctctctcte
de
de
de
de
de
d
0.60.60.60.60.60.6
0.40.40.40.40.40.4
0.60.60.6
0.40.4
0.20.2
FFrra
cta
ctiio
n A
fo
n A
fffee
ctcte
de
d
Fra
ctio
n A
fA
ffe
cte
dFFFFF
rrrrract
act
act
act
act
iiiiif
on
Aff
on
Af
on
Af
on
Af
on
Afffffeeeeee
ctctctctctcte
de
de
de
de
de
d
00 00BMDL BMD BMDL BMD
0 200 400 600 800 1000 0 200 400 600 800 1000
dose dose 17:54 04/14 2010 17:54 04/14 2010
0.2 0.2
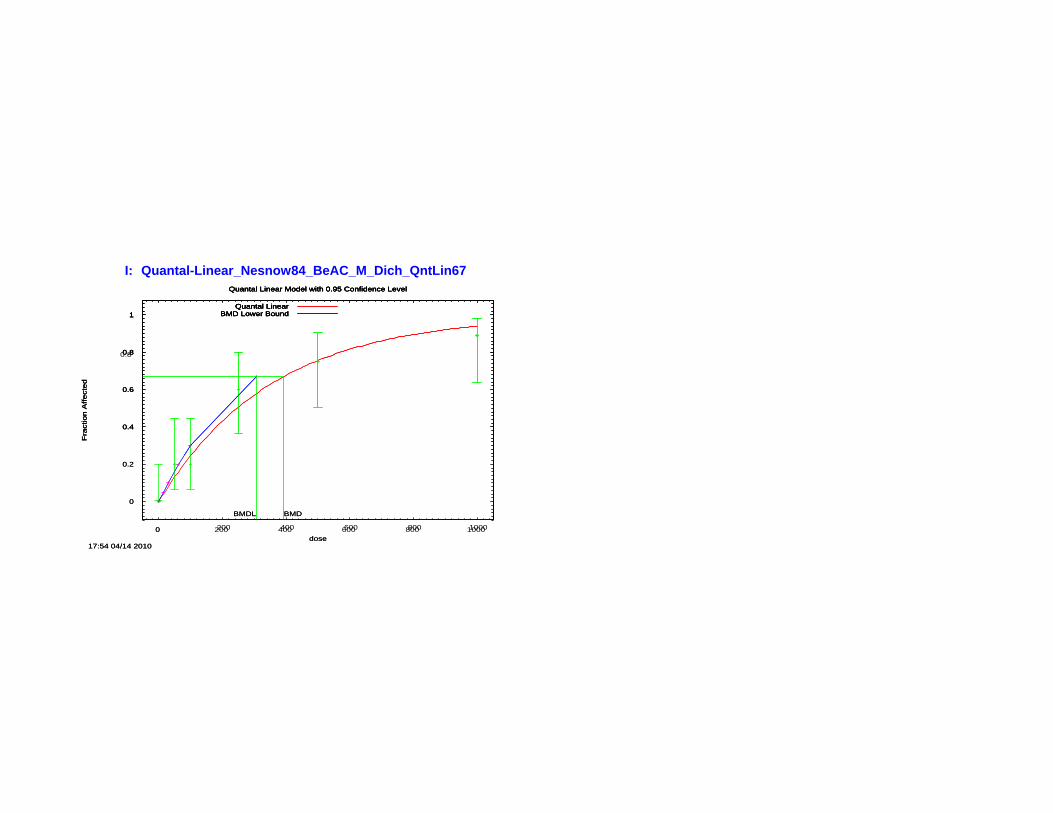
I: Quantal-Linear_Nesnow84_BeAC_M_Dich_QntLin67Quantal Linear Model with 0.95 Confidence LevelQuantal Linear Model with 0.95 Confidence LevelQuantal Linear Model with 0.95 Confidence LevelQuantal Linear Model with 0.95 Confidence Level
0.8
1Quantal Linear
BMD Lower Bound
0.4
0.6
0.8
1
Fra
ctio
n A
ffe
cte
d
Quantal LinearBMD Lower Bound
0
0.2
0.4
0.6
0.8
1
Fra
ctio
n A
ffe
cte
d
BMDL BMD
Quantal LinearBMD Lower Bound
0
0.2
0.4
0.6
0.8
1
Fra
ctio
n A
ffe
cte
d
BMDL BMD
Quantal Linear BMD Lower Bound
00 200200 400400 600600 800800 10001000 dosedose
17:54 04/14 201017:54 04/14 2010

Table B-6. Nesnow et al. (1984), benz[e]aceanthrylene, female mice. Dichotomous dose-response goodness-of-fit tests and benchmark dose estimates at 10% and 51% effect levels applied to study results.
Source Substance
Effect Endpoint Dichotomous Dose-Response
Model (1)
Goodness-of-Fit
POD (% Effect)
Dose (nmol) Alternative
POD (% Effect)
Dose (nmol)
Notes
p-value for Chi-Square
Test (2) AIC (3)
Residuals (4)
Animal Tissue
Scaled Residual of
Interest
Maximum Scaled
Residual BMD BMDL BMD BMDL Nesnow,
1984 BeAC female mouse Papilloma Gamma 0.20 127 0.19 -1.8 10% 56.6 40.3 51% 383 273 Acceptable Fit
Nesnow, 1984 BeAC female
mouse Papilloma Logistic 0.12 129 1.16 -1.5 10% 130 99.9 51% 530 416 Acceptable Fit
Nesnow, 1984 BeAC female
mouse Papilloma LogLogistic 0.24 126 0.0070 -1.9 10% 31.8 20.3 51% 297 190 Best Fit: Log-logistic model has the lowest maxmimum scaled residuals, low AIC, and highest p-value.
Nesnow, 1984 BeAC female
mouse Papilloma LogProbit 0.08 129 1.40 -2.0 10% 108 71.8 51% 399 265
Nesnow, 1984 BeAC female
mouse Papilloma Multistage 0.20 127 0.19 -1.8 10% 56.6 40.3 51% 383 273 Acceptable Fit
Nesnow, 1984 BeAC female
mouse Papilloma Multistage-Cancer 0.20 127 0.19 -1.8 10% 56.6 40.3 51% 383 273 Acceptable Fit
Nesnow, 1984 BeAC female
mouse Papilloma Probit 0.13 129 1.2 -1.5 10% 126 99.7 51% 537 431 Acceptable Fit
Nesnow, 1984 BeAC female
mouse Papilloma Weibull 0.20 127 0.19 -1.8 10% 56.6 40.3 51% 383 273 Acceptable Fit
Nesnow, 1984 BeAC female
mouse Papilloma Quantal-Linear 0.20 127 0.19 -1.8 10% 56.6 40.3 51% 383 273 Acceptable Fit
Abbreviations AIC = Akaike's Information Criterion POD = point of departure BMD = benchmark dose BMDL = 1-sided 95% lower confidence limit for the benchmark dose
Notes 1. USEPA's BMDS v.2.1.1 was used to determine dose-response dichotomous data. 2. Chi-square test is a hypothesis test in which the null hypothesis is that data fit the dose-response function. Higher p-values indicate better fits. 3. For each dataset, models with relatively low AIC are indicative of better fits. 4. A scaled residual is the difference between the observed and predicted effect (i.e., percent response) divided by the standard deviation. Scaled Residual of Interest is a summary output parameter of the BMDS model, while the Maximum Scaled Residual is the maximum of the scaled residuals of each of the individual dose groups. Absolute value less than 2.0 is indicative of a good fit. Values in bold are >2.0.
R fReferences
Nesnow, S., A. Gold, R. Sangaiah et al. 1984. Mouse skin tumor-initiating activity of benz[e]aceanthrylene and benz[l]aceanthrylene in Sencar mice. Cancer Lett 22:263–268.

A A
0.2 0.2 0.2 0.2 0.2
0.4 0.4 0.4 0.4 0.4
0.4 0.4
0.6 0.6 0.6
A: Gamma_Nesnow84_BeAC_F_Dich_Gamma51 B: Logistic_Nesnow84_BeAC_F_Dich_Logist51 Gamma Multi-Hit Model with 0.95 Confidence LevelGamma Multi-Hit Model with 0.95 Confidence LevelGamma Multi-Hit Model with 0.95 Confidence LevelGamma Multi-Hit Model with 0.95 Confidence LevelGamma Multi-Hit Model with 0.95 Confidence LevelGamma Multi-Hit Model with 0.95 Confidence LevelGamma Multi-Hit Model with 0.95 Confidence Level Logistic Model with 0.95 Confidence LevelLogistic Model with 0.95 Confidence LevelLogistic Model with 0.95 Confidence LevelLogistic Model with 0.95 Confidence LevelLogistic Model with 0.95 Confidence LevelLogistic Model with 0.95 Confidence LevelLogistic Model with 0.95 Confidence Level
Gamma Multi-HitGamma Multi-HitGamma Multi-HitGamma Multi-HitGamma Multi-HitGamma Multi-HitGamma Multi-Hit LogisticLogisticLogisticLogisticLogisticLogisticLogistic BMD Lower BoundBMD Lower BoundBMD Lower BoundBMD Lower BoundBMD Lower BoundBMD Lower BoundBMD Lower Bound BMD Lower BoundBMD Lower BoundBMD Lower BoundBMD Lower BoundBMD Lower BoundBMD Lower BoundBMD Lower Bound1111111 1111111
0.80.80.80.80.80.8 0.80.80.80.80.80.8
ffe
cte
dFFFFF
rrrrract
ion
Aff
ect
ed
act
ion
Aff
ect
ed
act
ion
Aff
ect
ed
act
ion
Aff
ect
ed
act
ion
Aff
ect
ed
on
Aff
ect
ed
FFrra
ctio
n A
ffe
cte
da
ctio
n A
ffe
cte
d
0.60.60.60.60.60.6
00000BMDLBMDLBMDLBMDLBMDL BMDBMDBMDBMDBMD
0000 200200200200 400400400400 600600600600 800800800800 1000100010001000 dosedosedosedose
18:01 04/14 201018:01 04/14 201018:01 04/14 201018:01 04/14 2010
C: LogLogistic_Nesnow84_BeAC_F_Dich_LogLogist51 Log-Logistic Model with 0.95 Confidence LevelLog-Logistic Model with 0.95 Confidence LevelLog-Logistic Model with 0.95 Confidence LevelLog-Logistic Model with 0.95 Confidence Level
Log-LogisticLog-LogisticLog-LogisticLog-Logistic 111
0.80.80.8
ffe
cte
dFFFFF
rrrrract
ion
Aff
ect
ed
act
ion
Aff
ect
ed
act
ion
Aff
ect
ed
act
ion
Aff
ect
ed
act
ion
Aff
ect
ed
on
Aff
ect
ed
FFrra
ctio
n A
ffe
cte
da
ctio
n A
ffe
cte
d
0.60.60.60.60.60.6
0.40.40.40.40.4
0.20.20.20.20.2
00000BMDLBMDLBMDLBMDLBMDL BMDBMDBMDBMDBMD
0000 200200200200 400400400400 600600600600 800800800800 1000100010001000 dosedosedosedose
18:01 04/14 201018:01 04/14 201018:01 04/14 201018:01 04/14 2010
D: LogProbit_Nesnow84_BeAC_F_Dich_LogProb51LogProbit Model with 0.95 Confidence LevelLogProbit Model with 0.95 Confidence LevelLogProbit Model with 0.95 Confidence LevelLogProbit Model with 0.95 Confidence Level
LogProbitLogProbitLogProbitLogProbit BMD Lower BoundBMD Lower BoundBMD Lower Bound111
0.80.80.8
0.60.60.6
0.40.4
0.20.2
00 00BMDL BMD BMDL BMD
0 200 400 600 800 1000 0 200 400 600 800 1000
dose dose 18:01 04/14 2010 18:01 04/14 2010
0.2 0.2

0.4 0.4 0.4 0.4 0.4 0.4
0.4 0.4
E: Multistage_Nesnow84_BeAC_F_Dich_Multi51 F: Multistage-Cancer_Nesnow84_BeAC_F_Dich_MultiCanc51 Multistage Model with 0.95 Confidence LevelMultistage Model with 0.95 Confidence LevelMultistage Model with 0.95 Confidence LevelMultistage Model with 0.95 Confidence LevelMultistage Model with 0.95 Confidence LevelMultistage Model with 0.95 Confidence LevelMultistage Model with 0.95 Confidence Level Multistage Cancer Model with 0.95 Confidence LevelMultistage Cancer Model with 0.95 Confidence LevelMultistage Cancer Model with 0.95 Confidence LevelMultistage Cancer Model with 0.95 Confidence LevelMultistage Cancer Model with 0.95 Confidence LevelMultistage Cancer Model with 0.95 Confidence LevelMultistage Cancer Model with 0.95 Confidence Level
MultistageMultistageMultistageMultistageMultistageMultistageMultistage Multistage CancerMultistage CancerMultistage CancerMultistage CancerMultistage CancerMultistage CancerMultistage Cancer
1111111 BMD Lower BoundBMD Lower BoundBMD Lower BoundBMD Lower BoundBMD Lower BoundBMD Lower BoundBMD Lower Bound Linear extrapolationLinear extrapolationLinear extrapolationLinear extrapolationLinear extrapolationLinear extrapolationLinear extrapolation BMD Lower BoundBMD Lower BoundBMD Lower BoundBMD Lower BoundBMD Lower BoundBMD Lower BoundBMD Lower Bound
1111111
0.80.80.80.80.80.8 0.80.80.80.80.80.8
FFrra
ctio
n A
ffe
cte
da
ctio
n A
ffe
cte
d
F a
ctio
n A
ffe
cte
dte
dr
Fr
FFFFrrrra
ctio
n A
ffe
cte
da
ctio
n A
ffe
cte
da
ctio
n A
ffe
cte
da
ctio
n A
ffe
cte
da
ctio
n A
ffe
cte
d
0.60.60.60.60.60.6
0.20.20.20.20.2
00000BMDBMDL BMDBMDLBMDLBMDLBMDL BMDBMDBMD
00000 200200200200200 400400400400400 600600600600600 800800800800800 10001000100010001000 dosedosedosedose
18:01 04/14 201018:01 04/14 201018:01 04/14 201018:01 04/14 2010
G: Probit_Nesnow84_BeAC_F_Dich_Probit51 Probit Model with 0.95 Confidence LevelProbit Model with 0.95 Confidence LevelProbit Model with 0.95 Confidence LevelProbit Model with 0.95 Confidence Level
ProbitProbitProbitProbit BMD Lower BoundBMD Lower BoundBMD Lower Bound111
0.80.80.8
0 60.60.6 FF
rract
ion
Aff
ect
ed
act
ion
Aff
ect
ed
F
act
ion
Aff
ect
ed
ted
rF
rFFFF
rrrract
ion
Aff
ect
ed
act
ion
Aff
ect
ed
act
ion
Aff
ect
ed
act
ion
Aff
ect
ed
act
ion
Aff
ect
ed
0.60.60.60.60.60.6
0.40.40.40.40.40.4
0.20.20.20.20.2
00000BMDBMDL BMDBMDLBMDLBMDLBMDL BMDBMDBMD
00000 200200200200200 400400400400400 600600600600600 800800800800800 10001000100010001000 dosedosedosedose
18:01 04/14 201018:01 04/14 201018:01 04/14 201018:01 04/14 2010
H: Weibull_Nesnow84_BeAC_F_Dich_Weibull51Weibull Model with 0.95 Confidence LevelWeibull Model with 0.95 Confidence LevelWeibull Model with 0.95 Confidence LevelWeibull Model with 0.95 Confidence Level
WeibullWeibullWeibullWeibull BMD Lower BoundBMD Lower BoundBMD Lower Bound111
0.80.80.8
0 60.60.6
0.40.4
0.20.2
0 0
BMDL BMD BMDL BMD
0 200 400 600 800 1000 0 200 400 600 800 1000
dose dose 18:01 04/14 2010 18:01 04/14 2010
0.2 0.2

t t
FFFrrra
ctio
n A
ffe
cte
da
ctio
n A
ffe
cte
da
ctio
n A
ffe
cte
d
I Q l Li N 84 B AC F Di h Q Li 51I: Quantal-Linear_Nesnow84_BeAC_F_Dich_QntLin51Quantal Linear Model with 0.95 Confidence LevelQuantal Linear Model with 0.95 Confidence LevelQuantal Linear Model with 0.95 Confidence LevelQuantal Linear Model with 0.95 Confidence Level
1111
0.80.80.80.8
0.60.60.6
0.40.40.4
0.20.2
00
Quantal LinearBMD Lower Bound
Quantal LinearBMD Lower Bound
BMDL BMD
Quantal LinearBMD Lower Bound
BMDL BMD
Quantal Linear BMD Lower Bound
00 200200 400400 600600 800800 10001000 dosedose
18:01 04/14 201018:01 04/14 2010

Table B-7. Habs et al. (1980), benzo[a]pyrene, female mice. Dichotomous dose-response goodness-of-fit tests and benchmark dose estimates at 10% effect levels applied to study results.
Source Substance
Effect Endpoint Dichotomous Dose-Response
Model (1)
Goodness-of-Fit
POD (% Effect)
Dose (µg)
Notes
p-value for Chi-Square
Test (2) AIC (3)
Residuals (4)
Animal Tissue
Scaled Residual of
Interest
Maximum Scaled
Residual BMD BMDL
Habs, 1980 without highest dose (4.6 µg/animal) BaP female
mouse Sum of Papilloma,
carcinoma, sarcoma Gamma 1.0 85 0 0 10% 1.31 0.78 Best Fit: Gamma, LogLogistic, LogProbit, and Weibull models have the lowest maxmimum scaled residuals, low AIC, and highest p-values.
Habs, 1980 without highest dose (4.6 µg/animal) BaP female
mouse Sum of Papilloma,
carcinoma, sarcoma Logistic 0.48 85 0.36 -0.58 10% 1.30 0.96 Acceptable Fit
Habs, 1980 without highest dose (4.6 µg/animal) BaP female
mouse Sum of Papilloma,
carcinoma, sarcoma LogLogistic 1.0 85 0 0 10% 1.31 0.84 Best Fit; Gamma, LogLogistic, LogProbit, and Weibull models have the lowest maxmimum scaled residuals, low AIC, and highest p-values.
Habs, 1980 without highest dose (4.6 µg/animal) BaP female
mouse Sum of Papilloma,
carcinoma, sarcoma LogProbit 1.0 85 0 0 10% 1.35 0.90 Best Fit: Gamma, LogLogistic, LogProbit, and Weibull models have the lowest maxmimum scaled residuals, low AIC, and highest p-values.
Habs, 1980 without highest dose (4.6 µg/animal) BaP female
mouse Sum of Papilloma,
carcinoma, sarcoma Multistage 0.53 84 -0.92 -0.92 10% 0.91 0.48 Acceptable Fit
Habs, 1980 without highest dose (4.6 µg/animal) BaP female
mouse Sum of Papilloma,
carcinoma, sarcoma Multistage-Cancer 0.53 84 -0.92 -0.92 10% 0.91 0.48 Acceptable Fit
Habs, 1980 without highest dose (4.6 µg/animal) BaP female
mouse Sum of Papilloma,
carcinoma, sarcoma Probit 0.69 85 0.20 -0.33 10% 1.27 0.91 Acceptable Fit
Habs, 1980 without highest dose (4.6 µg/animal) BaP female
mouse Sum of Papilloma,
carcinoma, sarcoma Weibull 1.0 85 0 0 10% 1.24 0.72 Best Fit: Gamma, LogLogistic, LogProbit, and Weibull models have the lowest maxmimum scaled residuals, low AIC, and highest p-values.
Habs, 1980 without highest dose (4.6 µg/animal) BaP female
mouse Sum of Papilloma,
carcinoma, sarcoma Quantal-Linear 0.056 89 0 -1.8 10% 0.36 0.27
Abbreviations AIC = Akaike's Information Criterion POD = point of departure BMD = benchmark dose BMDL = 1-sided 95% lower confidence limit for the benchmark dose
Notes 1. USEPA's BMDS v.2.1.1 was used to determine dose-response dichotomous data. 2. Chi-square test is a hypothesis test in which the null hypothesis is that data fit the dose-response function. Higher p-values indicate better fits. 3. For each dataset, models with relatively low AIC are indicative of better fits. 4. A scaled residual is the difference between the observed and predicted effect (i.e., percent response) divided by the standard deviation. Scaled Residual of Interest is a summary output parameter of the BMDS model, while the Maximum Scaled Residual is the maximum of the scaled residuals of each of the individual dose groups. Absolute value less than 2.0 is indicative of a good fit. Values in bold are >2.0. 5. Highest dose group of 4.6 ug/animal was omitted in order to obtain a model fit with maximum residuals less than 2 and greater than -2.
References
Habs, M., D. Schmähl, J. Misfeld. 1980. Local carcinogenicity of some environmentally relevant polycyclic aromatic hydrocarbons after lifelong topical application to mouse skin. Arch Geschwulstforsch 50:266-274.

0.4 0.4 0.4 0.4 0.4 0.4
0.5 0.5 0.5 0.5 0.5 0.5
0.3 0.3
0.4 0.4
0.5 0.5
A: Gamma_Habs1980_BaP_3doses_Dich_Gamma B: Logistic_Habs1980_BaP_3doses_Dich_Logist Gamma Multi-Hit Model with 0.95 Confidence LevelGamma Multi-Hit Model with 0.95 Confidence LevelGamma Multi-Hit Model with 0.95 Confidence LevelGamma Multi-Hit Model with 0.95 Confidence LevelGamma Multi-Hit Model with 0.95 Confidence LevelGamma Multi-Hit Model with 0.95 Confidence LevelGamma Multi-Hit Model with 0.95 Confidence Level Logistic Model with 0.95 Confidence LevelLogistic Model with 0.95 Confidence LevelLogistic Model with 0.95 Confidence LevelLogistic Model with 0.95 Confidence LevelLogistic Model with 0.95 Confidence LevelLogistic Model with 0.95 Confidence LevelLogistic Model with 0.95 Confidence Level
0.90.90.90.90.90.90.9 Gamma Multi-HitGamma Multi-HitGamma Multi-HitGamma Multi-HitGamma Multi-HitGamma Multi-HitGamma Multi-Hit BMD Lower BoundBMD Lower BoundBMD Lower BoundBMD Lower BoundBMD Lower BoundBMD Lower BoundBMD Lower Bound
0.90.90.90.90.90.90.9 LogisticLogisticLogisticLogisticLogisticLogisticLogistic BMD Lower BoundBMD Lower BoundBMD Lower BoundBMD Lower BoundBMD Lower BoundBMD Lower BoundBMD Lower Bound
0.80.80.80.80.80.80.8 0.80.80.80.80.80.80.8
0.70.70.70.70.70.7 0.70.70.70.70.70.7
0.60.60.60.60.60.6 0.60.60.60.60.60.6
0 30.30.30.30.30.3
0.50.50.50.50.50.5
0.40.40.40.40.40.4
0 30.30.30.30.30.3
0.20.20.20.20.2 0.20.20.20.20.2
0.10.10.10.10.1 0.10.10.10.10.1
00000 00000
BMDLBMDLBMDLBMDLBMDL BMDBMDBMDBMDBMD BMDLBMDLBMDLBMDLBMDL BMDBMDBMDBMDBMD
00000 0.50.50.50.50.5 11111 1.51.51.51.51.5 22222 2.52.52.52.52.5 00000 0.50.50.50.50.5 11111 1.51.51.51.51.5 22222 2.52.52.52.52.5 dosedosedosedose dosedosedosedose
13:29 04/13 201013:29 04/13 201013:29 04/13 201013:29 04/13 2010 13:29 04/13 201013:29 04/13 201013:29 04/13 201013:29 04/13 2010
C: LogLogistic_Habs1980_BaP_3doses_Dich_LogLogist D: LogProbit_Habs1980_BaP_3doses_Dich_LogProbLog-Logistic Model with 0.95 Confidence LevelLog-Logistic Model with 0.95 Confidence LevelLog-Logistic Model with 0.95 Confidence LevelLog-Logistic Model with 0.95 Confidence Level LogProbit Model with 0.95 Confidence LevelLogProbit Model with 0.95 Confidence LevelLogProbit Model with 0.95 Confidence LevelLogProbit Model with 0.95 Confidence Level
0.90.90.90.9 0.90.90.90.9Log-LogisticLog-LogisticLog-LogisticLog-Logistic LogProbitLogProbitLogProbitLogProbit BMD Lower BoundBMD Lower BoundBMD Lower Bound
0.80.80.8 0.80.80.8
0.70.70.7 0.70.70.7
0.60.60.6 0.60.60.6
ed
Frac
tFr
act
Frac
tiion
Af
on A
fffeectct
iFr
acti
Frac
tiFr
act
Frac
teded
ii
Frac
tion
Af
on A
fon
Af
on A
fon
Af
on A
fffffffeeeeeectctctctctct
edededededed
0.50.5
0.40.4
0.30.3
0.20.2 0.20.2
0.10.1 0.10.1
0
13:29 04/13 2010
0 0.5
BMDL
1 1.5
dose
BMD
2 2.5
0
13:29 04/13 2010
0 0.5
BMDL
1 1.5
dose
BMD
2 2.5
ed
Frac
FrFracac
ttiion
Af
on A
fffeecctt
FrFrFrFreded
Fr
tac
tacacacac
ttttiiiiiion
Af
on A
fon
Af
on A
fon
Af
on A
fffffffeeeeeecccccctttttt
edededededed

0.3 0.3 0.3 0.3 0.3
0.4 0.4 0.4 0.4 0.4 0.4
0.5 0.5 0.5 0.5 0.5 0.5
0.3 0.3
0.4 0.4
0.5 0.5 0.5
E: Multistage_Habs1980_BaP_3doses_Dich_Multi F: Multistage-Cancer_Habs1980_BaP_3doses_Dich_MultiCanc Multistage Model with 0.95 Confidence LevelMultistage Model with 0.95 Confidence LevelMultistage Model with 0.95 Confidence LevelMultistage Model with 0.95 Confidence LevelMultistage Model with 0.95 Confidence LevelMultistage Model with 0.95 Confidence LevelMultistage Model with 0.95 Confidence Level Multistage Cancer Model with 0.95 Confidence LevelMultistage Cancer Model with 0.95 Confidence LevelMultistage Cancer Model with 0.95 Confidence LevelMultistage Cancer Model with 0.95 Confidence LevelMultistage Cancer Model with 0.95 Confidence LevelMultistage Cancer Model with 0.95 Confidence LevelMultistage Cancer Model with 0.95 Confidence Level
0 80.80.80.80.80.80.8
0.90.90.90.90.90.90.9 MultistageMultistageMultistageMultistageMultistageMultistageMultistage BMD Lower BoundBMD Lower BoundBMD Lower BoundBMD Lower BoundBMD Lower BoundBMD Lower BoundBMD Lower Bound
0 80.80.80.80.80.80.8
0.90.90.90.90.90.90.9
BMD Lower Bound
Multistage CancerMultistage CancerMultistage CancerMultistage CancerMultistage CancerMultistage CancerMultistage Cancer Linear extrapolationLinear extrapolationLinear extrapolationLinear extrapolationLinear extrapolationLinear extrapolationLinear extrapolation BMD Lower BoundBMD Lower BoundBMD Lower BoundBMD Lower BoundBMD Lower BoundBMD Lower Bound
0.70.70.70.70.70.7 0.70.70.70.70.70.7
0.60.60.60.60.60.6 0.60.60.60.60.60.6
0.50.50.50.50.50.5
0.40.40.40.40.40.4
0.30.30.30.30.3
0.20.20.20.20.2 0.20.20.20.20.2
0.10.10.10.10.1 0.10.10.10.10.1
00000 00000
BMDBMDL BMDBMDLBMDLBMDLBMDL BMDBMDBMD BMDL BMDBMDBMDBMDBMDBMDLBMDLBMDLBMDL
0000 0.50.50.50.5 1111 1.51.51.51.5 2222 2.52.52.52.5 0000 0.50.50.50.5 1111 1.51.51.51.5 2222 2.52.52.52.5 dosedosedosedose dosedosedosedose
13:29 04/13 201013:29 04/13 201013:29 04/13 201013:29 04/13 2010 13:29 04/13 201013:29 04/13 201013:29 04/13 201013:29 04/13 2010
G: Probit_Habs1980_BaP_3doses_Dich_Probit H: Weibull_Habs1980_BaP_3doses_Dich_WeibullProbit Model with 0.95 Confidence LevelProbit Model with 0.95 Confidence LevelProbit Model with 0.95 Confidence LevelProbit Model with 0.95 Confidence Level Weibull Model with 0.95 Confidence LevelWeibull Model with 0.95 Confidence LevelWeibull Model with 0.95 Confidence LevelWeibull Model with 0.95 Confidence Level
0.90.90.90.9 0.90.90.90.9ProbitProbitProbitProbit WeibullWeibullWeibullWeibull BMD Lower BoundBMD Lower BoundBMD Lower Bound BMD Lower BoundBMD Lower BoundBMD Lower Bound
0.80.80.8 0.80.80.8
0.70.70.7 0.70.70.7
0.60.60.6 0.60.60.6
Affe
cted
Frac
tFr
actiio
n A
fon
Afffee
ctcti
Frac
tiFr
acti
Frac
tFr
act
eded
iiFr
actio
n A
fon
Af
on A
fon
Af
on A
fon
Afffffffeeeeee
ctctctctctctedededededed
0.50.50.5
0.40.4
0.30.3
0.20.2 0.20.2
0.10.1 0.10.1
00
13:29 04/13 2010
0 0.5
BMDL
1 1.5
dose
BMD
2 2.5
00
13:29 04/13 2010
0 0.5
BMDL
1 1.5
dose
BMD
2 2.5
Affe
ted
FrFracac
ttiion
Af
on A
fffceecctt
FrFrFrFreded
Fr
acacacacacitittttiiiio
n A
fon
Af
on A
fon
Af
on A
fon
Afffffffeeeeee
ccccccttttttedededededed

I:I: Quantal-Linear Habs1980 BaP 3doses Dich QntLinQuantal-Linear_Habs1980_BaP_3doses_Dich_QntLinQuantal Linear Model with 0.95 Confidence LevelQuantal Linear Model with 0.95 Confidence LevelQuantal Linear Model with 0.95 Confidence LevelQuantal Linear Model with 0.95 Confidence Level
0.6
0.7
0.8
0.9 Quantal LinearBMD Lower Bound
0.2
0.3
0.4
0.5
0.6
0.7
0.8
0.9
Frac
tion
Affe
cted
Quantal LinearBMD Lower Bound
0
0.1
0.2
0.3
0.4
0.5
0.6
0.7
0.8
0.9
Frac
tion
Affe
cted
BMDL BMD
Quantal LinearBMD Lower Bound
0
0.1
0.2
0.3
0.4
0.5
0.6
0.7
0.8
0.9
Frac
tion
Affe
cted
BMDL BMD
Quantal Linear BMD Lower Bound
00 0.50.5 11 1.51.5 22 2.52.5 dosedose
13:29 04/13 201013:29 04/13 2010
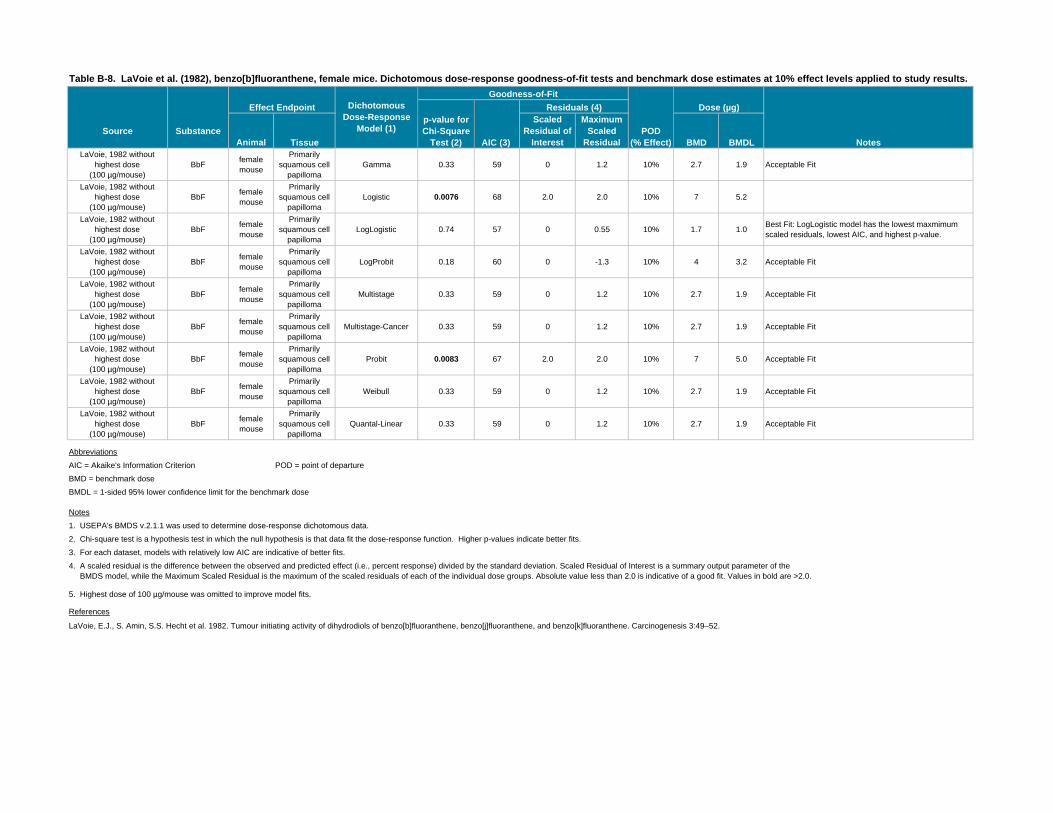
Table B-8. LaVoie et al. (1982), benzo[b]fluoranthene, female mice. Dichotomous dose-response goodness-of-fit tests and benchmark dose estimates at 10% effect levels applied to study results.
Source Substance
Effect Endpoint Dichotomous Dose-Response
Model (1)
Goodness-of-Fit
POD (% Effect)
Dose (µg)
Notes
p-value for Chi-Square
Test (2) AIC (3)
Residuals (4)
Animal Tissue
Scaled Residual of
Interest
Maximum Scaled
Residual BMD BMDL LaVoie, 1982 without
highest dose (100 µg/mouse)
BbF female mouse
Primarily squamous cell
papilloma Gamma 0.33 59 0 1.2 10% 2.7 1.9 Acceptable Fit
LaVoie, 1982 without highest dose
(100 µg/mouse) BbF female
mouse
Primarily squamous cell
papilloma Logistic 0.0076 68 2.0 2.0 10% 7 5.2
LaVoie, 1982 without highest dose
(100 µg/mouse) BbF female
mouse
Primarily squamous cell
papilloma LogLogistic 0.74 57 0 0.55 10% 1.7 1.0 Best Fit: LogLogistic model has the lowest maxmimum
scaled residuals, lowest AIC, and highest p-value.
LaVoie, 1982 without highest dose
(100 µg/mouse) BbF female
mouse
Primarily squamous cell
papilloma LogProbit 0.18 60 0 -1.3 10% 4 3.2 Acceptable Fit
LaVoie, 1982 without highest dose
(100 µg/mouse) BbF female
mouse
Primarily squamous cell
papilloma Multistage 0.33 59 0 1.2 10% 2.7 1.9 Acceptable Fit
LaVoie, 1982 without highest dose
(100 µg/mouse) BbF female
mouse
Primarily squamous cell
papilloma Multistage-Cancer 0.33 59 0 1.2 10% 2.7 1.9 Acceptable Fit
LaVoie, 1982 without highest dose
(100 µg/mouse) BbF female
mouse
Primarily squamous cell
papilloma Probit 0.0083 67 2.0 2.0 10% 7 5.0 Acceptable Fit
LaVoie, 1982 without highest dose
(100 µg/mouse) BbF female
mouse
Primarily squamous cell
papilloma Weibull 0.33 59 0 1.2 10% 2.7 1.9 Acceptable Fit
LaVoie, 1982 without highest dose
(100 µg/mouse) BbF female
mouse
Primarily squamous cell
papilloma Quantal-Linear 0.33 59 0 1.2 10% 2.7 1.9 Acceptable Fit
Abbreviations
AIC = Akaike's Information Criterion POD = point of departure
BMD = benchmark dose
BMDL = 1-sided 95% lower confidence limit for the benchmark dose
Notes
1. USEPA's BMDS v.2.1.1 was used to determine dose-response dichotomous data.
2. Chi-square test is a hypothesis test in which the null hypothesis is that data fit the dose-response function. Higher p-values indicate better fits.
3. For each dataset, models with relatively low AIC are indicative of better fits.
4. A scaled residual is the difference between the observed and predicted effect (i.e., percent response) divided by the standard deviation. Scaled Residual of Interest is a summary output parameter of the BMDS model, while the Maximum Scaled Residual is the maximum of the scaled residuals of each of the individual dose groups. Absolute value less than 2.0 is indicative of a good fit. Values in bold are >2.0.
5. Highest dose of 100 µg/mouse was omitted to improve model fits.
References
LaVoie, E.J., S. Amin, S.S. Hecht et al. 1982. Tumour initiating activity of dihydrodiols of benzo[b]fluoranthene, benzo[j]fluoranthene, and benzo[k]fluoranthene. Carcinogenesis 3:49–52.

0.2 0.2 0.2 0.2 0.2
0.3 0.3 0.3 0.3 0.3 0.3
0.4 0.4 0.4 0.4 0.4 0.4
0.5 0.5 0.5 0.5 0.5 0.5
0.3 0.3
0.4 0.4
A: Gamma_LaVoie82_BbF_3doses_Dich_Gamma B: Logistic_LaVoie82_BbF_3doses_Dich_Logist Gamma Multi-Hit Model with 0.95 Confidence LevelGamma Multi-Hit Model with 0.95 Confidence LevelGamma Multi-Hit Model with 0.95 Confidence LevelGamma Multi-Hit Model with 0.95 Confidence LevelGamma Multi-Hit Model with 0.95 Confidence LevelGamma Multi-Hit Model with 0.95 Confidence LevelGamma Multi-Hit Model with 0.95 Confidence Level Logistic Model with 0.95 Confidence LevelLogistic Model with 0.95 Confidence LevelLogistic Model with 0.95 Confidence LevelLogistic Model with 0.95 Confidence LevelLogistic Model with 0.95 Confidence LevelLogistic Model with 0.95 Confidence LevelLogistic Model with 0.95 Confidence Level
0.80.80.80.80.80.80.8
Gamma Multi-HitGamma Multi-HitGamma Multi-HitGamma Multi-HitGamma Multi-HitGamma Multi-HitGamma Multi-Hit BMD Lower BoundBMD Lower BoundBMD Lower BoundBMD Lower BoundBMD Lower BoundBMD Lower BoundBMD Lower Bound
0.80.80.80.80.80.80.8
LogisticLogisticLogisticLogisticLogisticLogisticLogistic BMD Lower BoundBMD Lower BoundBMD Lower BoundBMD Lower BoundBMD Lower BoundBMD Lower BoundBMD Lower Bound
0 70.70.70.70.70.70.7 0 70.70.70.70.70.70.7
0.60.60.60.60.60.6 0.60.60.60.60.60.6
0.50.50.50.50.50.5
0.40.40.40.40.40.4
0.30.30.30.30.30.3
0.20.20.20.20.2
0.10.10.10.10.1 0.10.10.10.10.1
00000 00000
BMDLBMDLBMDLBMDLBMDL BMDBMDBMDBMDBMD BMDLBMDLBMDLBMDLBMDL BMDBMDBMDBMDBMD
00000 55555 1010101010 1515151515 2020202020 2525252525 3030303030 00000 55555 1010101010 1515151515 2020202020 2525252525 3030303030 dosedosedosedose dosedosedosedose
14:01 04/13 201014:01 04/13 201014:01 04/13 201014:01 04/13 2010 14:01 04/13 201014:01 04/13 201014:01 04/13 201014:01 04/13 2010
C: LogLogistic_LaVoie82_BbF_3doses_Dich_LogLogist D: LogProbit_LaVoie82_BbF_3doses_Dich_LogProbLoLog-Logistic Model with 0.95 Confidence LevelLog-Logistic Model with 0.95 Confidence LevelLog-Logistic Model with 0.95 Confidence Levelg-Logistic Model with 0.95 Confidence Level LogProbit Model with 0.95 Confidence LevelLogProbit Model with 0.95 Confidence LevelLogProbit Model with 0.95 Confidence LevelLogProbit Model with 0.95 Confidence Level
Log-LogisticLog-LogisticLog-Logistic LogProbitLogProbitLogProbit BMD Lower BoundBMD Lower BoundBMD Lower Bound
0.80.80.8 0.80.80.8
0.70.70.7 0.70.70.7
0.60.60.6 0.60.60.6
edFr
actio
n A
ffect
edFr
actio
n A
ffect
edFr
actio
n A
ffect
edFr
actio
n A
ffect
edFr
actio
n A
ffect
edFr
actio
n A
ffect
edFr
actio
n A
ffect
ed
Frac
tion
Affe
cted
0 50.50.5 0 50.50.5
0.40.4
0.30.3
0.20.2 0.20.2
0.10.1 0.10.1
0
0
14:01 04/13 2010
BMDL BMD
5 10 15
dose 20 25 30
0
14:01 04/13 2010
0
BMDL
5
BMD
10 15
dose 20 25 30
FrFrac
tac
tiion
Af
on A
fffeectct
edededFrFrFrFrFr
act
act
act
act
actiiiii
fon
Aff
on A
fon
Af
on A
fon
Afffffeeeeee
ctctctctctctedededededed
Frac
tion
Af

0.3 0.3 0.3 0.3 0.3 0.3
0.4 0.4 0.4 0.4 0.4 0.4
0.5 0.5 0.5 0.5 0.5 0.5
0.3 0.3
0.4 0.4
E: Multistage_LaVoie82_BbF_3doses_Dich_Multi F: Multistage-Cancer_LaVoie82_BbF_3doses_Dich_MultiCanc Multistage Model with 0.95 Confidence LevelMultistage Model with 0.95 Confidence LevelMultistage Model with 0.95 Confidence LevelMultistage Model with 0.95 Confidence LevelMultistage Model with 0.95 Confidence LevelMultistage Model with 0.95 Confidence LevelMultistage Model with 0.95 Confidence Level Multistage Cancer Model with 0.95 Confidence LevelMultistage Cancer Model with 0.95 Confidence LevelMultistage Cancer Model with 0.95 Confidence LevelMultistage Cancer Model with 0.95 Confidence LevelMultistage Cancer Model with 0.95 Confidence LevelMultistage Cancer Model with 0.95 Confidence LevelMultistage Cancer Model with 0.95 Confidence Level
0.80.80.80.80.80.80.8
MultistageMultistageMultistageMultistageMultistageMultistageMultistage BMD Lower BoundBMD Lower BoundBMD Lower BoundBMD Lower BoundBMD Lower BoundBMD Lower BoundBMD Lower Bound
0.80.80.80.80.80.80.8
Multistage CancerMultistage CancerMultistage CancerMultistage CancerMultistage CancerMultistage CancerMultistage Cancer Linear extrapolationLinear extrapolationLinear extrapolationLinear extrapolationLinear extrapolationLinear extrapolationLinear extrapolation BMD Lower BoundBMD Lower BoundBMD Lower BoundBMD Lower BoundBMD Lower BoundBMD Lower BoundBMD Lower Bound
0 70.70.70.70.70.70.7 0 70.70.70.70.70.70.7
0.60.60.60.60.60.6 0.60.60.60.60.60.6
0.50.50.50.50.50.5
0.40.40.40.40.40.4
0.30.30.30.30.30.3
0.20.20.20.20.2 0.20.20.20.20.2
0.10.10.10.10.1 0.10.10.10.10.1
00000 00000BMDBMDL BMDBMDLBMDLBMDLBMDL BMDBMDBMD BMDBMDL BMDBMDLBMDLBMDLBMDL BMDBMDBMD
00000 55555 1010101010 1515151515 2020202020 2525252525 3030303030 00000 55555 1010101010 1515151515 2020202020 2525252525 3030303030 dosedosedosedose dosedosedosedose
14:01 04/13 201014:01 04/13 201014:01 04/13 201014:01 04/13 2010 14:01 04/13 201014:01 04/13 201014:01 04/13 201014:01 04/13 2010
G: Probit_LaVoie82_BbF_3doses_Dich_Probit H: Weibull_LaVoie82_BbF_3doses_Dich_WeibullProbit Model with 0.95 Confidence LevelProbit Model with 0.95 Confidence LevelProbit Model with 0.95 Confidence LevelProbit Model with 0.95 Confidence Level Weibull Model with 0.95 Confidence LevelWeibull Model with 0.95 Confidence LevelWeibull Model with 0.95 Confidence LevelWeibull Model with 0.95 Confidence Level
ProbitProbitProbit WeibullWeibullWeibull BMD Lower BoundBMD Lower BoundBMD Lower Bound BMD Lower BoundBMD Lower BoundBMD Lower Bound
0.80.80.8 0.80.80.8
0.70.70.7 0.70.70.7
0.60.60.6 0.60.60.6
ed
Frac
tion
Affe
cted
Frac
tion
Affe
cted
Frac
tion
Affe
cted
Frac
tion
Affe
cted
Frac
tion
Affe
cted
Frac
tion
Affe
cted
Frac
tion
Affe
cted
Frac
tion
Affe
cted0.50.50.5 0.50.50.5
0.40.4
0.30.3
0.20.2 0.20.2
0.10.1 0.10.1
0
0
14:01 04/13 2010
5
BMDL BMD
10 15
dose 20 25 30
0
0
14:01 04/13 2010
BMDL
5
BMD
10 15
dose 20 25 30
ed
FrFrFrFrFrFrac
tac
tac
tac
tac
tac
tiiiiiion
Af
on A
fon
Af
on A
fon
Af
on A
fffffffeeeeeectctctctctct
ededededededFrFr
act
actiio
n A
fon
Afffee
ctcteded

I: Quantal-Linear LaVoie82 BbF 3doses Dich QntLinI: Quantal Linear_LaVoie82_BbF_3doses_Dich_QntLinQuantal Linear Model with 0.95 Confidence LevelQuantal Linear Model with 0.95 Confidence LevelQuantal Linear Model with 0.95 Confidence LevelQuantal Linear Model with 0.95 Confidence Level
0.6
0.7
0.8
Quantal LinearBMD Lower Bound
0.2
0.3
0.4
0.5
0.6
0.7
0.8
Frac
tion
Affe
cted
Quantal LinearBMD Lower Bound
0
0.1
0.2
0.3
0.4
0.5
0.6
0.7
0.8
Frac
tion
Affe
cted
BMDL BMD
Quantal LinearBMD Lower Bound
0
0.1
0.2
0.3
0.4
0.5
0.6
0.7
0.8
Frac
tion
Affe
cted
BMDL BMD
Quantal Linear BMD Lower Bound
00 55 1010 1515 2020 2525 3030 dosedose
14:01 04/13 201014:01 04/13 2010

Table B-9. LaVoie et al. (1982), benzo[j]fluoranthene, female mice. Dichotomous dose-response goodness-of-fit tests and benchmark dose estimates at 10% effect levels applied to study results.
Source Substance
Effect Endpoint Dichotomous Dose-Response
Model (1)
Goodness-of-Fit
POD (% Effect)
Dose (µg)
Notes
p-value for Chi-Square
Test (2) AIC (3)
Residuals (4)
Animal Tissue
Scaled Residual of
Interest
Maximum Scaled
Residual BMD BMDL LaVoie, 1982 without
highest dose (1000 µg/mouse)
BjF female mouse
Primarily squamous cell
papilloma Gamma 0.74 55 0 0.65 10% 11.6 7.9 Acceptable Fit
LaVoie, 1982 without highest dose
(1000 µg/mouse) BjF female
mouse
Primarily squamous cell
papilloma Logistic 0.042 62 1.5 1.5 10% 30.5 21.8
LaVoie, 1982 without highest dose
(1000 µg/mouse) BjF female
mouse
Primarily squamous cell
papilloma LogLogistic 0.97 54 0 0.17 10% 8.5 4.9
Acceptable Fit: LogLogistic model has the lowest maxmimum scaled residuals, lowest AIC, and highest p-value.
LaVoie, 1982 without highest dose
(1000 µg/mouse) BjF female
mouse
Primarily squamous cell
papilloma LogProbit 0.38 56 1.0 1.0 10% 18.9 13.4 Acceptable Fit
LaVoie, 1982 without highest dose
(1000 µg/mouse) BjF female
mouse
Primarily squamous cell
papilloma Multistage 0.74 55 0 0.65 10% 11.6 7.9 Acceptable Fit
LaVoie, 1982 without highest dose
(1000 µg/mouse) BjF female
mouse
Primarily squamous cell
papilloma Multistage-Cancer 0.74 55 0 0.65 10% 11.6 7.9 Acceptable Fit
LaVoie, 1982 without highest dose
(1000 µg/mouse) BjF female
mouse
Primarily squamous cell
papilloma Probit 0.048 61 1.5 1.5 10% 28.3 20.6
LaVoie, 1982 without highest dose
(1000 µg/mouse) BjF female
mouse
Primarily squamous cell
papilloma Weibull 0.74 55 0 0.65 10% 11.6 7.9 Acceptable Fit
LaVoie, 1982 without highest dose
(1000 µg/mouse) BjF female
mouse
Primarily squamous cell
papilloma Quantal-Linear 0.74 55 0 0.65 10% 11.6 7.9 Acceptable Fit
Abbreviations
AIC = Akaike's Information Criterion POD = point of departure
BMD = benchmark dose
BMDL = 1-sided 95% lower confidence limit for the benchmark dose
Notes
1. USEPA's BMDS v.2.1.1 was used to determine dose-response dichotomous data.
2. Chi-square test is a hypothesis test in which the null hypothesis is that data fit the dose-response function. Higher p-values indicate better fits.
3. For each dataset, models with relatively low AIC are indicative of better fits.
4. A scaled residual is the difference between the observed and predicted effect (i.e., percent response) divided by the standard deviation. Scaled Residual of Interest is a summary output parameter of the BMDS model, while the Maximum Scaled Residual is the maximum of the scaled residuals of each of the individual dose groups. Absolute value less than 2.0 is indicative of a good fit. Values in bold are >2.0.
5. Highest dose of 1000 µg/mouse was omitted to improve model fits.
References
LaVoie, E.J., S. Amin, S.S. Hecht et al. 1982. Tumour initiating activity of dihydrodiols of benzo[b]fluoranthene, benzo[j]fluoranthene, and benzo[k]fluoranthene. Carcinogenesis 3:49–52.

0.3 0.3 0.3 0.3 0.3 0.3
0.4 0.4 0.4 0.4 0.4 0.4
0.3 0.3
0.4 0.4
A: Gamma_LaVoie82_BjF_3doses_Dich_Gamma B: Logistic_LaVoie82_BjF_3doses_Dich_Logist Gamma Multi-Hit Model with 0.95 Confidence LevelGamma Multi-Hit Model with 0.95 Confidence LevelGamma Multi-Hit Model with 0.95 Confidence LevelGamma Multi-Hit Model with 0.95 Confidence LevelGamma Multi-Hit Model with 0.95 Confidence LevelGamma Multi-Hit Model with 0.95 Confidence LevelGamma Multi-Hit Model with 0.95 Confidence Level Logistic Model with 0.95 Confidence LevelLogistic Model with 0.95 Confidence LevelLogistic Model with 0.95 Confidence LevelLogistic Model with 0.95 Confidence LevelLogistic Model with 0.95 Confidence LevelLogistic Model with 0.95 Confidence LevelLogistic Model with 0.95 Confidence Level
0.80.80.80.80.80.80.8Gamma Multi-HitGamma Multi-HitGamma Multi-HitGamma Multi-HitGamma Multi-HitGamma Multi-HitGamma Multi-Hit
BMD Lower BoundBMD Lower BoundBMD Lower BoundBMD Lower BoundBMD Lower BoundBMD Lower BoundBMD Lower Bound 0.80.80.80.80.80.80.8LogisticLogisticLogisticLogisticLogisticLogisticLogistic
BMD Lower BoundBMD Lower BoundBMD Lower BoundBMD Lower BoundBMD Lower BoundBMD Lower BoundBMD Lower Bound
0.70.70.70.70.70.70.7 0.70.70.70.70.70.70.7
0.60.60.60.60.60.6 0.60.60.60.60.60.6
0.50.50.50.50.50.5 0.50.50.50.50.50.5
Frac
tion
Affe
cted
Frac
tion
Affe
cteded
Frac
tion
Affe
cted
Frac
tion
Affe
cted
Frac
tion
Affe
cted
Frac
tion
Affe
cted
Frac
tion
Affe
cted
Frac
tion
Affe
cted
0.20.20.20.20.2
0.10.10.10.10.1
00000BMDLBMDLBMDLBMDLBMDL BMDBMDBMDBMDBMD
00000 2020202020 4040404040 6060606060 8080808080 100100100100100 dosedosedosedose
13:11 04/15 201013:11 04/15 201013:11 04/15 201013:11 04/15 2010
C: LogLogistic_LaVoie82_BjF_3doses_Dich_LogLogist Log-Logistic Model with 0.95 Confidence LevelLog-Logistic Model with 0.95 Confidence LevelLog-Logistic Model with 0.95 Confidence LevelLog-Logistic Model with 0.95 Confidence Level
Log-LogisticLog-LogisticLog-Logistic0.80.80.8
0.70.70.7
0.60.60.6
0.50.50.5
Frac
tion
AFr
actio
n A
ffect
edffe
ctedd
ffect
edFr
actio
n A
ffect
edFr
actio
n A
Frac
tion
AFr
actio
n A
Frac
tion
Affe
cted
ffect
edffe
cted
ffect
edFr
actio
n A 0.40.40.40.40.40.4
0.30.30.30.30.30.3
0.20.20.20.20.2
0.10.10.10.10.1
00000BMDLBMDLBMDLBMDLBMDL BMDBMDBMDBMDBMD
00000 2020202020 4040404040 6060606060 8080808080 100100100100100 dosedosedosedose
13:11 04/15 201013:11 04/15 201013:11 04/15 201013:11 04/15 2010
D: LogProbit_LaVoie82_BjF_3doses_Dich_LogProbLogProbit Model with 0.95 Confidence LeveLogProbit Model with 0.95 Confidence LevelLogProbit Model with 0.95 Confidence LevelLogProbit Model with 0.95 Confidence Level
LogProbitLogProbitLogProbit0.80.80.8 BMD Lower BoundBMD Lower BoundBMD Lower Bound
0.70.70.7
0.60.60.6
0.50.50.5
0.40.4
0.30.3
0.20.2 0.20.2
0.10.1 0.10.1
0
0
13:11 04/15 2010
BMDL BMD
20 40
dose 60 80 100
0
0
13:11 04/15 2010
BMDL
20
BMD
40
dose 60 80 100

0.3 0.3 0.3 0.3 0.3 0.3
0.4 0.4 0.4 0.4 0.4 0.4
0.3 0.3
0.4 0.4
E: Multistage_LaVoie82_BjF_3doses_Dich_Multi F: Multistage-Cancer_LaVoie82_BjF_3doses_Dich_MultiCanc Multistage Model with 0.95 Confidence LevelMultistage Model with 0.95 Confidence LevelMultistage Model with 0.95 Confidence LevelMultistage Model with 0.95 Confidence LevelMultistage Model with 0.95 Confidence LevelMultistage Model with 0.95 Confidence LevelMultistage Model with 0.95 Confidence Level Multistage Cancer Model with 0.95 Confidence LevelMultistage Cancer Model with 0.95 Confidence LevelMultistage Cancer Model with 0.95 Confidence LevelMultistage Cancer Model with 0.95 Confidence LevelMultistage Cancer Model with 0.95 Confidence LevelMultistage Cancer Model with 0.95 Confidence LevelMultistage Cancer Model with 0.95 Confidence Level
0.80.80.80.80.80.80.8MultistageMultistageMultistageMultistageMultistageMultistageMultistage
BMD Lower BoundBMD Lower BoundBMD Lower BoundBMD Lower BoundBMD Lower BoundBMD Lower BoundBMD Lower Bound 0.80.80.80.80.80.80.8Multistage CancerMultistage CancerMultistage CancerMultistage CancerMultistage CancerMultistage CancerMultistage Cancer
Linear extrapolationLinear extrapolationLinear extrapolationLinear extrapolationLinear extrapolationLinear extrapolationLinear extrapolation BMD Lower BoundBMD Lower BoundBMD Lower BoundBMD Lower BoundBMD Lower BoundBMD Lower BoundBMD Lower Bound
0.70.70.70.70.70.70.7 0.70.70.70.70.70.70.7
0.60.60.60.60.60.6 0.60.60.60.60.60.6
0.50.50.50.50.50.5 0.50.50.50.50.50.5
0.40.40.40.40.40.4
0.30.30.30.30.30.3
0.20.20.20.20.2 0.20.20.20.20.2
0.10.10.10.10.1 0.10.10.10.10.1
00000 00000BMDBMDL BMDBMDLBMDLBMDLBMDL BMDBMDBMD BMDBMDL BMDBMDLBMDLBMDLBMDL BMDBMDBMD
00000 2020202020 4040404040 6060606060 8080808080 100100100100100 00000 2020202020 4040404040 6060606060 8080808080 100100100100100 dosedosedosedose dosedosedosedose
13:11 04/15 201013:11 04/15 201013:11 04/15 201013:11 04/15 2010 13:11 04/15 201013:11 04/15 201013:11 04/15 201013:11 04/15 2010
G: Probit_LaVoie82_BjF_3doses_Dich_Probit H: Weibull_LaVoie82_BjF_3doses_Dich_WeibullProbit Model with 0.95 Confidence LevelProbit Model with 0.95 Confidence LevelProbit Model with 0.95 Confidence LevelProbit Model with 0.95 Confidence Level Weibull Model with 0.95 Confidence LevelWeibull Model with 0.95 Confidence LevelWeibull Model with 0.95 Confidence LevelWeibull Model with 0.95 Confidence Level
ProbitProbitProbit WeibullWeibullWeibull0.80.80.8 0.80.80.8BMD Lower BoundBMD Lower BoundBMD Lower Bound BMD Lower BoundBMD Lower BoundBMD Lower Bound
0.70.70.7 0.70.70.7
0.60.60.6 0.60.60.6
0.50.50.5 0.50.50.5
ed
Frac
tion
AFr
actio
n A
Frac
tion
AFr
actio
n A
Frac
tion
AFr
actio
n A
ffect
edffe
cted
ffect
edffe
cted
ffect
edffe
cted
Frac
tion
AFr
actio
n A
ffect
edffe
cted
0.40.4
0.30.3
0.20.2
0.20.2
0.10.1 0.10.1
0BMDL BMD
0
BMDL BMD
0
13:11 04/15 2010
20 40
dose 60 80 100 0
13:11 04/15 2010
20 40
dose 60 80 100
ed
Frac
tion
Affe
cted
Frac
tion
Affe
cted
Frac
tion
Affe
cted
Frac
tion
Affe
cted
Frac
tion
Affe
cted
Frac
tion
Affe
cted
Frac
tion
Affe
cted
Frac
tion
Affe
cted
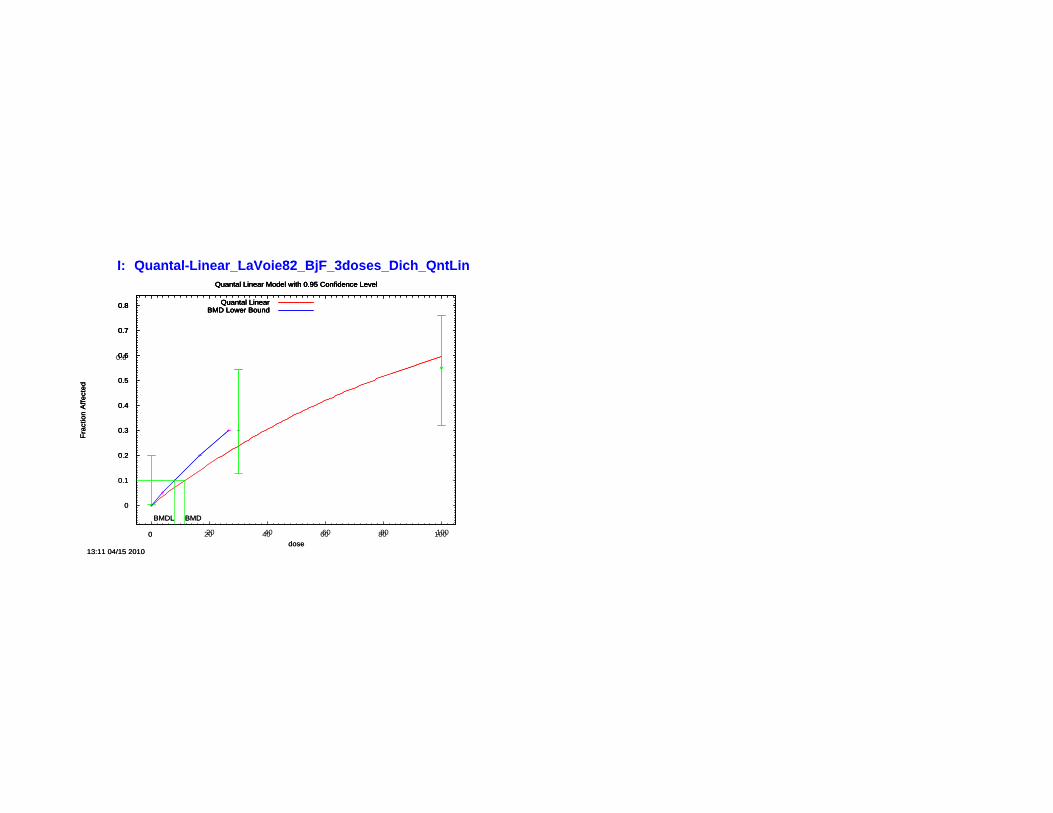
I: Quantal LinearQuantal-Linear_LaVoie82_BjFBjF_3d3dosesoses_DichDich_QntLinI: LaVoie82 QntLin Quantal Linear Model with 0.95 Confidence LevelQuantal Linear Model with 0.95 Confidence LevelQuantal Linear Model with 0.95 Confidence LevelQuantal Linear Model with 0.95 Confidence Level
0.6
0.7
0.8 Quantal LinearBMD Lower Bound
0 2
0.3
0.4
0.5
0.6
0.7
0.8
Frac
tion
Affe
cted
Quantal LinearBMD Lower Bound
0
0.1
0.2
0.3
0.4
0.5
0.6
0.7
0.8
Frac
tion
Affe
cted
BMDL BMD
Quantal LinearBMD Lower Bound
0
0.1
0.2
0.3
0.4
0.5
0.6
0.7
0.8
Frac
tion
Affe
cted
BMDL BMD
Quantal Linear BMD Lower Bound
00 2020 4040 6060 8080 100100 dosedose
13:11 04/15 201013:11 04/15 2010

sq are a n response p a es
Table B-10. Rice et al. (1988), chrysene, female mice. Dichotomous dose-response goodness-of-fit tests and benchmark dose estimates at 10% effect levels applied to study results.
Source Substance
Effect Endpoint Dichotomous Dose-Response
Model (1)
Goodness-of-Fit
POD (% Effect)
Dose (µmol)
Notes
p-value for Chi-Square
Test (2) AIC (3)
Residuals (4)
Animal Tissue
Scaled Residual of
Interest
Maximum Scaled
Residual BMD BMDL Rice, 1988 without
highest dose (1.5 µmol) CH female mouse
Unspecified tumor Gamma NA 49 0 0 10% 0.10 0.040 Acceptable Fit
Rice, 1988 without highest dose (1.5 µmol) CH female
mouse Unspecified
tumor Logistic 1 48 0.21 -0.2 10% 0.10 0.069 Acceptable Fit
Rice, 1988 without highest dose (1.5 µmol) CH female
mouse Unspecified
tumor LogLogistic NA 49 0 0 10% 0.11 0.06 Acceptable Fit
Rice, 1988 without highest dose (1.5 µmol) CH female
mouse Unspecified
tumor LogProbit NA 49 0 0 10% 0.11 0.060 Acceptable Fit
Rice, 1988 without highest dose (1.5 µmol) CH female
mouse Unspecified
tumor Multistage NA 49 0 0 10% 0.095 0.034 Acceptable Fit
Rice, 1988 without highest dose (1.5 µmol) CH female
mouse Unspecified
tumor Multistage-Cancer NA 49 0 0 10% 0.095 0.034 Acceptable Fit
Rice, 1988 without highest dose (1.5 µmol) CH female
mouse Unspecified
tumor Probit 1 47 0.13 -0.1 10% 0.10 0.066 Acceptable Fit
Rice, 1988 without highest dose (1.5 µmol) CH female
mouse Unspecified
tumor Weibull NA 49 0 0 10% 0.097 0.038 Acceptable Fit
Rice, 1988 without highest dose (1.5 µmol) CH female
mouse Unspecified
tumor Quantal-Linear 0.074 51 0.24 -1.4 10% 0.033 0.023
Abbreviations
AIC = Akaike's Information Criterion POD = point of departure
BMD = benchmark dose
BMDL = 1-sided 95% lower confidence limit for the benchmark dose
Notes
1. USEPA's BMDS v.2.1.1 was used to determine dose-response dichotomous data.
2 Chi test is h pothesis test in hich the ll h pothesis is that data fit the dose f nction Higher l indicate better fits 2. Chi-square test is a hypothesis test in which the null hypothesis is that data fit the dose-response function. Higher p-values indicate better fits.
3. For each dataset, models with relatively low AIC are indicative of better fits.
4. A scaled residual is the difference between the observed and predicted effect (i.e., percent response) divided by the standard deviation. Scaled Residual of Interest is a summary output parameter of the BMDS model, while the Maximum Scaled Residual is the maximum of the scaled residuals of each of the individual dose groups. Absolute value less than 2.0 is indicative of a good fit. Values in bold are >2.0.
5. Highest dose of 1.5 µmol omitted to improve model fits.
References
Rice, J.E., K. Jordan, P. Little et al. 1988. Comparative tumor-initiating activity of methylene-bridged and bay-region methylated derivatives of benz[a]anthracene and chrysene. Carcinogenesis 9:2275–2278.

0.2 0.2 0.2 0.2 0.2
0.4 0.4 0.4 0.4 0.4 0.4
0.6 0.6 0.6 0.6 0.6 0.6
0.4 0.4
A: Gamma_Rice88_CH_3doses_Dich_Gamma B: Logistic_Rice88_CH_3doses_Dich_Logist Gamma Multi-Hit Model with 0.95 Confidence LevelGamma Multi-Hit Model with 0.95 Confidence LevelGamma Multi-Hit Model with 0.95 Confidence LevelGamma Multi-Hit Model with 0.95 Confidence LevelGamma Multi-Hit Model with 0.95 Confidence LevelGamma Multi-Hit Model with 0.95 Confidence LevelGamma Multi-Hit Model with 0.95 Confidence Level Logistic Model with 0.95 Confidence LevelLogistic Model with 0.95 Confidence LevelLogistic Model with 0.95 Confidence LevelLogistic Model with 0.95 Confidence LevelLogistic Model with 0.95 Confidence LevelLogistic Model with 0.95 Confidence LevelLogistic Model with 0.95 Confidence Level
Gamma Multi-HitGamma Multi-HitGamma Multi-HitGamma Multi-HitGamma Multi-HitGamma Multi-HitGamma Multi-Hit LogisticLogisticLogisticLogisticLogisticLogisticLogistic BMD Lower BoundBMD Lower BoundBMD Lower BoundBMD Lower BoundBMD Lower BoundBMD Lower BoundBMD Lower Bound BMD Lower BoundBMD Lower BoundBMD Lower BoundBMD Lower BoundBMD Lower BoundBMD Lower BoundBMD Lower Bound1111111 1111111
0.80.80.80.80.80.8 0.80.80.80.80.80.8
Frac
tion
Affe
cted
Frac
tion
Affe
cteded
Fr
actio
n A
ffect
edFr
actio
n A
ffect
edFr
actio
n A
ffect
edFr
actio
n A
ffect
edFr
actio
n A
ffect
edFr
actio
n A
ffect
ed
00000BMDLBMDLBMDLBMDLBMDL BMDBMDBMDBMDBMD
00000 0.10.10.10.10.1 0.20.20.20.20.2 0.30.30.30.30.3 0.40.40.40.40.4 0.50.50.50.50.5 dosedosedosedose
14:41 04/15 201014:41 04/15 201014:41 04/15 201014:41 04/15 2010
C: LogLogistic_Rice88_CH_3doses_Dich_LogLogist Log-Logistic Model with 0.95 Confidence LevelLog-Logistic Model with 0.95 Confidence LevelLog-Logistic Model with 0.95 Confidence LevelLog-Logistic Model with 0.95 Confidence Level
Log-LogisticLog-LogisticLog-Logistic 111
0.80.80.8
0 60.60.6
Frac
tion
AFr
actio
n A
ffect
edffe
ctedd
ffect
edFr
actio
n A
ffect
edFr
actio
n A
Frac
tion
AFr
actio
n A
Frac
tion
Affe
cted
ffect
edffe
cted
ffect
edFr
actio
n A
0.60.60.60.60.60.6
0.40.40.40.40.40.4
0.20.20.20.20.2
00000BMDLBMDLBMDLBMDLBMDL BMDBMDBMDBMDBMD
00000 0.10.10.10.10.1 0.20.20.20.20.2 0.30.30.30.30.3 0.40.40.40.40.4 0.50.50.50.50.5 dosedosedosedose
14:41 04/15 201014:41 04/15 201014:41 04/15 201014:41 04/15 2010
D: LogProbit_Rice88_CH_3doses_Dich_LogProbLogProbit Model with 0.95 Confidence LeveLogProbit Model with 0.95 Confidence LevelLogProbit Model with 0.95 Confidence LevelLogProbit Model with 0.95 Confidence Level
LogProbitLogProbitLogProbit BMD Lower BoundBMD Lower BoundBMD Lower Bound111
0.80.80.8
0 60.60.6
0.40.4
0.20.2
0.20.2
0
0
14:41 04/15 2010
BMDL
0.1
BMD
0.2
dose 0.3 0.4 0.5
0
0
14:41 04/15 2010
BMDL
0.1
BMD
0.2
dose 0.3 0.4 0.5

0.4 0.4 0.4 0.4 0.4 0.4
0.6 0.6 0.6 0.6 0.6 0.6
0.4 0.4
E: Multistage_Rice88_CH_3doses_Dich_Multi F: Multistage-Cancer_Rice88_CH_3doses_Dich_MultiCanc Multistage Model with 0.95 Confidence LevelMultistage Model with 0.95 Confidence LevelMultistage Model with 0.95 Confidence LevelMultistage Model with 0.95 Confidence LevelMultistage Model with 0.95 Confidence LevelMultistage Model with 0.95 Confidence LevelMultistage Model with 0.95 Confidence Level Multistage Cancer Model with 0.95 Confidence LevelMultistage Cancer Model with 0.95 Confidence LevelMultistage Cancer Model with 0.95 Confidence LevelMultistage Cancer Model with 0.95 Confidence LevelMultistage Cancer Model with 0.95 Confidence LevelMultistage Cancer Model with 0.95 Confidence LevelMultistage Cancer Model with 0.95 Confidence Level
MultistageMultistageMultistageMultistageMultistageMultistageMultistage Multistage CancerMultistage CancerMultistage CancerMultistage CancerMultistage CancerMultistage CancerMultistage Cancer 1111111 BMD Lower BoundBMD Lower BoundBMD Lower BoundBMD Lower BoundBMD Lower BoundBMD Lower BoundBMD Lower Bound Linear extrapolationLinear extrapolationLinear extrapolationLinear extrapolationLinear extrapolationLinear extrapolationLinear extrapolation
BMD Lower BoundBMD Lower BoundBMD Lower BoundBMD Lower BoundBMD Lower BoundBMD Lower BoundBMD Lower Bound 1111111
0.80.80.80.80.80.8 0.80.80.80.80.80.8
ed
Frac
tion
Affe
cted
Frac
tion
Affe
cted
Frac
tion
Affe
cted
Frac
tion
Affe
cted
Frac
tion
Affe
cted
Frac
tion
Affe
cted
Frac
tion
Affe
cted
Frac
tion
Affe
cted
0.20.20.20.20.2
00000
BMDBMDL BMDBMDLBMDLBMDLBMDL BMDBMDBMD
00000 0.10.10.10.10.1 0.20.20.20.20.2 0.30.30.30.30.3 0.40.40.40.40.4 0.50.50.50.50.5 dosedosedosedose
14:41 04/15 201014:41 04/15 201014:41 04/15 201014:41 04/15 2010
G: Probit_Rice88_CH_3doses_Dich_Probit Probit Model with 0.95 Confidence LevelProbit Model with 0.95 Confidence LevelProbit Model with 0.95 Confidence LevelProbit Model with 0.95 Confidence Level
ProbitProbitProbit BMD Lower BoundBMD Lower BoundBMD Lower Bound111
0.80.80.8
0 60.60.6 ed
Frac
tion
AFr
actio
n A
Frac
tion
AFr
actio
n A
Frac
tion
AFr
actio
n A
ffect
edffe
cted
ffect
edffe
cted
ffect
edffe
cted
Frac
tion
AFr
actio
n A
ffect
edffe
cted
0.60.60.60.60.60.6
0.40.40.40.40.40.4
0.20.20.20.20.2
00000
BMDBMDL BMDBMDLBMDLBMDLBMDL BMDBMDBMD
00000 0.10.10.10.10.1 0.20.20.20.20.2 0.30.30.30.30.3 0.40.40.40.40.4 0.50.50.50.50.5 dosedosedosedose
14:41 04/15 201014:41 04/15 201014:41 04/15 201014:41 04/15 2010
H: Weibull_Rice88_CH_3doses_Dich_WeibullWeibull Model with 0.95 Confidence LevelWeibull Model with 0.95 Confidence LevelWeibull Model with 0.95 Confidence LevelWeibull Model with 0.95 Confidence Level
WeibullWeibullWeibull BMD Lower BoundBMD Lower BoundBMD Lower Bound111
0.80.80.8
0 60.60.6
0.40.4
0.20.2
0.20.2
0BMDL BMD
0
BMDL BMD
14:41 04/15 2010
0 0.1 0.2
dose 0.3 0.4 0.5
14:41 04/15 2010
0 0.1 0.2
dose 0.3 0.4 0.5

I: Quantal-Linear Rice88 CH 3doses Dich QntLinI: Quantal Linear_Rice88_CH_3doses_Dich_QntLinQuantal Linear Model with 0.95 Confidence LevelQuantal Linear Model with 0.95 Confidence LevelQuantal Linear Model with 0.95 Confidence LevelQuantal Linear Model with 0.95 Confidence Level
0.8
1Quantal Linear
BMD Lower Bound
0.2
0.4
0.6
0.8
1
Frac
tion
Affe
cted
Quantal LinearBMD Lower Bound
0
0.2
0.4
0.6
0.8
1
Frac
tion
Affe
cted
BMDL BMD
Quantal LinearBMD Lower Bound
0
0.2
0.4
0.6
0.8
1
Frac
tion
Affe
cted
BMDL BMD
Quantal Linear BMD Lower Bound
00 0.10.1 0.20.2 0.30.3 0.40.4 0.50.5 dosedose
14:41 04/15 201014:41 04/15 2010

Table B-11. Rice et al. (1988), benz[b,c]aceanthrylene, female mice. Dichotomous dose-response goodness-of-fit tests and benchmark dose estimates at 10% effect levels applied to study results.
Source Substance
Effect Endpoint Dichotomous Dose-Response
Model (1)
Goodness-of-Fit
POD (% Effect)
Dose (µmol)
Notes
p-value for Chi-Square
Test (2) AIC (3)
Residuals (4)
Animal Tissue
Scaled Residual of
Interest
Maximum Scaled
Residual BMD BMDL
Rice, 1988 BbcAC female mouse
Unspecified tumor Gamma 0.00020 72 -0.86 -3.1 10% 0.10 0.074
Rice, 1988 BbcAC female mouse
Unspecified tumor Logistic 0.00010 81 2.5 -2.7 10% 0.26 0.19
Rice, 1988 BbcAC female mouse
Unspecified tumor LogLogistic 0.55 61 -0.021 -1.0 10% 0.026 0.013 Acceptable Fit:LogLogistic model has the lowest maxmimum scaled
residuals, lowest AIC, and highest p-value.
Rice, 1988 BbcAC female mouse
Unspecified tumor LogProbit 0.0011 68 -0.25 -3.2 10% 0.13 0.087
Rice, 1988 BbcAC female mouse
Unspecified tumor Multistage 0.00020 72 -0.86 -3.1 10% 0.10 0.074
Rice, 1988 BbcAC female mouse
Unspecified tumor Multistage-Cancer 0.00020 72 -0.86 -3.1 10% 0.10 0.074
Rice, 1988 BbcAC female mouse
Unspecified tumor Probit 0 82 2.5 -2.9 10% 0.30 0.23
Rice, 1988 BbcAC female mouse
Unspecified tumor Weibull 0.00020 72 -0.86 -3.1 10% 0.10 0.074
Rice, 1988 BbcAC female mouse
Unspecified tumor Quantal-Linear 0.00020 72 -0.86 -3.1 10% 0.10 0.074
Abbreviations
AIC = Akaike's Information Criterion POD = point of departure
BMD = benchmark dose
BMDL = 1-sided 95% lower confidence limit for the benchmark dose
Notes
1. USEPA's BMDS v.2.1.1 was used to determine dose-response dichotomous data. 1. USEPA s BMDS v.2.1.1 was used to determine dose-response dichotomous data.
2. Chi-square test is a hypothesis test in which the null hypothesis is that data fit the dose-response function. Higher p-values indicate better fits.
3. For each dataset, models with relatively low AIC are indicative of better fits.
4. A scaled residual is the difference between the observed and predicted effect (i.e., percent response) divided by the standard deviation. Scaled Residual of Interest is a summary output parameter of the BMDS model, while the Maximum Scaled Residual is the maximum of the scaled residuals of each of the individual dose groups. Absolute value less than 2.0 is indicative of a good fit. Values in bold are >2.0.
References
Rice, J.E., K. Jordan, P. Little et al. 1988. Comparative tumor-initiating activity of methylene-bridged and bay-region methylated derivatives of benz[a]anthracene and chrysene. Carcinogenesis 9:2275–2278.
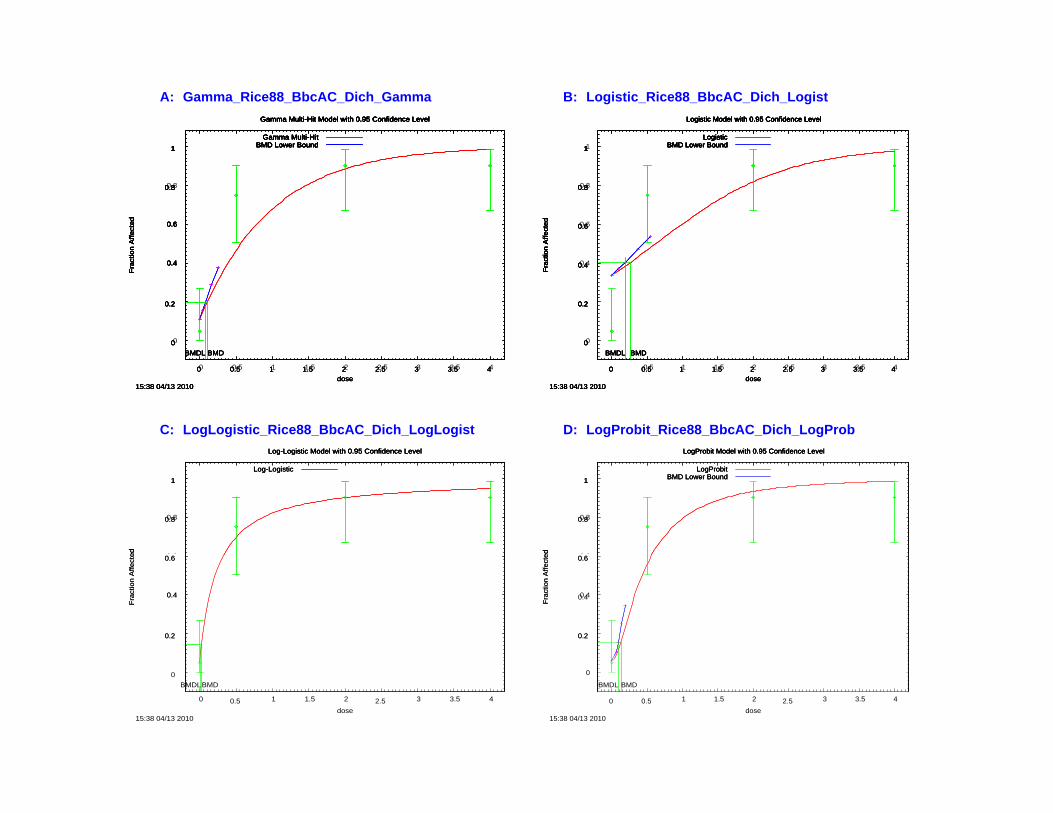
0.4 0.4 0.4 0.4 0.4 0.4
0.6 0.6 0.6 0.6 0.6 0.6
0.4 0.4
A: Gamma_Rice88_BbcAC_Dich_Gamma B: Logistic_Rice88_BbcAC_Dich_Logist Gamma Multi-Hit Model with 0.95 Confidence LevelGamma Multi-Hit Model with 0.95 Confidence LevelGamma Multi-Hit Model with 0.95 Confidence LevelGamma Multi-Hit Model with 0.95 Confidence LevelGamma Multi-Hit Model with 0.95 Confidence LevelGamma Multi-Hit Model with 0.95 Confidence LevelGamma Multi-Hit Model with 0.95 Confidence Level Logistic Model with 0.95 Confidence LevelLogistic Model with 0.95 Confidence LevelLogistic Model with 0.95 Confidence LevelLogistic Model with 0.95 Confidence LevelLogistic Model with 0.95 Confidence LevelLogistic Model with 0.95 Confidence LevelLogistic Model with 0.95 Confidence Level
Gamma Multi-HitGamma Multi-HitGamma Multi-HitGamma Multi-HitGamma Multi-HitGamma Multi-HitGamma Multi-Hit LogisticLogisticLogisticLogisticLogisticLogisticLogistic BMD Lower BoundBMD Lower BoundBMD Lower BoundBMD Lower BoundBMD Lower BoundBMD Lower BoundBMD Lower Bound BMD Lower BoundBMD Lower BoundBMD Lower BoundBMD Lower BoundBMD Lower BoundBMD Lower BoundBMD Lower Bound1111111 1111111
0.80.80.80.80.80.8 0.80.80.80.80.80.8
0.60.60.60.60.60.6
0.40.40.40.40.40.4
0.20.20.20.20.2 0.20.20.20.20.2
00000 00000
BMDLBMDLBMDLBMDLBMDL BMDBMDBMDBMDBMD BMDLBMDLBMDLBMDLBMDL BMDBMDBMDBMDBMD
00000 0.50.50.50.50.5 11111 1.51.51.51.51.5 22222 2.52.52.52.52.5 33333 3.53.53.53.53.5 44444 00000 0.50.50.50.50.5 11111 1.51.51.51.51.5 22222 2.52.52.52.52.5 33333 3.53.53.53.53.5 44444 dosedosedosedose dosedosedosedose
15:38 04/13 201015:38 04/13 201015:38 04/13 201015:38 04/13 2010 15:38 04/13 201015:38 04/13 201015:38 04/13 201015:38 04/13 2010
C: LogLogistic_Rice88_BbcAC_Dich_LogLogist D: LogProbit_Rice88_BbcAC_Dich_LogProbLoLog-Logistic Model with 0.95 Confidence LevelLog-Logistic Model with 0.95 Confidence LevelLog-Logistic Model with 0.95 Confidence Levelg-Logistic Model with 0.95 Confidence Level LogProbit Model with 0.95 Confidence LeveLogProbit Model with 0.95 Confidence LevelLogProbit Model with 0.95 Confidence LevelLogProbit Model with 0.95 Confidence Level
Log-LogisticLog-LogisticLog-Logistic LogProbitLogProbitLogProbit 111 BMD Lower BoundBMD Lower BoundBMD Lower Bound111
0.80.80.8 0.80.80.8
Frac
tion
AFr
actio
n A
ffect
edffe
ctedd
ffe
cted
Frac
tion
Affe
cted
Frac
tion
AFr
actio
n A
Frac
tion
AFr
actio
n A
ffect
edffe
cted
ffect
edffe
cted
Frac
tion
A0 60.60.6 0 60.60.6
0.40.4
0.20.2
0.20.2
0BMDLBMD
0
BMDL BMD
0
15:38 04/13 2010
0.5 1 1.5 2
dose 2.5 3 3.5 4 0
15:38 04/13 2010
0.5 1 1.5 2
dose 2.5 3 3.5 4
Frac
tion
Affe
cted
Frac
tion
Affe
cteded
Fr
actio
n A
ffect
edFr
actio
n A
ffect
edFr
actio
n A
ffect
edFr
actio
n A
ffect
edFr
actio
n A
ffect
edFr
actio
n A
ffect
ed

0.4 0.4 0.4 0.4 0.4 0.4
0.6 0.6 0.6 0.6 0.6 0.6
E: Multistage_Rice88_BbcAC_Dich_Multi F: Multistage-Cancer_Rice88_BbcAC_Dich_MultiCanc Multistage Model with 0.95 Confidence LevelMultistage Model with 0.95 Confidence LevelMultistage Model with 0.95 Confidence LevelMultistage Model with 0.95 Confidence LevelMultistage Model with 0.95 Confidence LevelMultistage Model with 0.95 Confidence LevelMultistage Model with 0.95 Confidence Level Multistage Cancer Model with 0.95 Confidence LevelMultistage Cancer Model with 0.95 Confidence LevelMultistage Cancer Model with 0.95 Confidence LevelMultistage Cancer Model with 0.95 Confidence LevelMultistage Cancer Model with 0.95 Confidence LevelMultistage Cancer Model with 0.95 Confidence LevelMultistage Cancer Model with 0.95 Confidence Level
MultistageMultistageMultistageMultistageMultistageMultistageMultistage Multistage CancerMultistage CancerMultistage CancerMultistage CancerMultistage CancerMultistage CancerMultistage Cancer 1111111 BMD Lower BoundBMD Lower BoundBMD Lower BoundBMD Lower BoundBMD Lower BoundBMD Lower BoundBMD Lower Bound Linear extrapolationLinear extrapolationLinear extrapolationLinear extrapolationLinear extrapolationLinear extrapolationLinear extrapolation
BMD Lower BoundBMD Lower BoundBMD Lower BoundBMD Lower BoundBMD Lower BoundBMD Lower BoundBMD Lower Bound 1111111
0.80.80.80.80.80.8 0.80.80.80.80.80.8
ed
Frac
tion
Affe
cted
Frac
tion
Affe
cted
Frac
tion
Affe
cted
Frac
tion
Affe
cted
Frac
tion
Affe
cted
Frac
tion
Affe
cted
Frac
tion
Affe
cted
Frac
tion
Affe
cted
0.20.20.20.20.2
00000
BMDBMDL BMDBMDLBMDLBMDLBMDL BMDBMDBMD
00000 0.50.50.50.50.5 11111 1.51.51.51.51.5 22222 2.52.52.52.52.5 33333 3.53.53.53.53.5 44444 dosedosedosedose
15:38 04/13 201015:38 04/13 201015:38 04/13 201015:38 04/13 2010
G: Probit_Rice88_BbcAC_Dich_Probit Probit Model with 0.95 Confidence LevelProbit Model with 0.95 Confidence LevelProbit Model with 0.95 Confidence LevelProbit Model with 0.95 Confidence Level
ProbitProbitProbit BMD Lower BoundBMD Lower BoundBMD Lower Bound111
0.80.80.8
0 60.60.6
0.40.4
ed
Frac
tion
AFr
actio
n A
Frac
tion
AFr
actio
n A
Frac
tion
AFr
actio
n A
ffect
edffe
cted
ffect
edffe
cted
ffect
edffe
cted
Frac
tion
AFr
actio
n A
ffect
edffe
cted
0.60.60.60.60.60.6
0.40.40.40.40.40.4
0.20.20.20.20.2
00000
BMDBMDL BMDBMDLBMDLBMDLBMDL BMDBMDBMD
00000 0.50.50.50.50.5 11111 1.51.51.51.51.5 22222 2.52.52.52.52.5 33333 3.53.53.53.53.5dosedosedosedose
15:38 04/13 201015:38 04/13 201015:38 04/13 201015:38 04/13 2010
H: Weibull_Rice88_BbcAC_Dich_WeibullWeibull Model with 0.95 Confidence LevelWeibull Model with 0.95 Confidence LevelWeibull Model with 0.95 Confidence LevelWeibull Model with 0.95 Confidence Level
WeibullWeibullWeibull BMD Lower BoundBMD Lower BoundBMD Lower Bound111
0.80.80.8
0 60.60.6
0.40.4
0.20.2
0 0
BMDL BMD BMDL BMD
0 0.5 1 1.5 2 2.5 3 3.5 4 0 0.5 1 1.5 2 2.5 3 3.5 4
dose dose 15:38 04/13 2010 15:38 04/13 2010
4 4 4 4 4
0.2 0.2

Frac
tion
Affe
cted
Frac
tion
Affe
cted
Frac
tion
Affe
cted
I:I: Quantal Linear Rice88 BbcAC Dich QntLinQuantal-Linear_Rice88_BbcAC_Dich_QntLinQuantal Linear Model with 0.95 Confidence LevelQuantal Linear Model with 0.95 Confidence LevelQuantal Linear Model with 0.95 Confidence LevelQuantal Linear Model with 0.95 Confidence Level
1111
0.80.80.80.8
0.60.60.6
0.40.40.4
0.20.2
00
Quantal LinearBMD Lower Bound
Quantal LinearBMD Lower Bound
BMDL BMD
Quantal LinearBMD Lower Bound
BMDL BMD
Quantal Linear BMD Lower Bound
00 0.50.5 11 1.51.5 22 2.52.5 33 3.53.5dosedose
15:38 04/13 201015:38 04/13 2010
4 4

- -
Table B-12. Busby et al. (1984), benzo[a]pyrene, male mouse. Continuous dose-response goodness-of-fit tests and benchmark dose estimates at 10% effect levels applied to study results.
Source Substance
Effect Endpoint Continuous Dose-
Response Model (1)
Goodness of Fit POD
Benchmark Response (BMR) (5)
Dose (mg-total)
Notes
p-value for Maximum Likelihood Tests (2)
AIC (3)
Residuals (4)
Animal Tissue Test 1 Test 2 Test 3 Test 4
Scaled Residual of
Interest
Maximum Scaled
Residual BMD BMDL
Busby, 1984 BaP male mouse
Adenoma + carcinoma Hill 1 SD Hill model not applicable
Busby, 1984 BaP male mouse
Adenoma + carcinoma Exponential 2 < 0.0001 < 0.0001 < 0.0001 0.0712 361 -0.1 -1.3 1 SD 1.3 1.1
Busby, 1984 BaP male mouse
Adenoma + carcinoma Exponential 3 < 0.0001 < 0.0001 < 0.0001 0.0712 361 -0.1 -1.3 1 SD 1.3 1.1
Busby, 1984 BaP male mouse
Adenoma + carcinoma Exponential 4 < 0.0001 < 0.0001 < 0.0001 NA 360 4.9E-07 6.7E-07 1 SD 0.57 0.30 Acceptable Fit: Exponential 4 model has the lowest
residuals and low AIC.
Busby, 1984 BaP male mouse
Adenoma + carcinoma Exponential 5 1 SD Exponential 5 model not applicable
Busby, 1984 BaP male mouse
Adenoma + carcinoma Linear <.0001 <.0001 <.0001 0.21 359 -0.22 1.0 1 SD 1.0 0.8
Busby, 1984 BaP male mouse
Adenoma + carcinoma Polynomial <.0001 <.0001 <.0001 NA 360 9.8E-11 5.5E-10 1 SD 0.51 0.26 Acceptable Fit: Polynomial model has the lowest
residuals and low AIC.
Busby, 1984 BaP male mouse
Adenoma + carcinoma Power <.0001 <.0001 <.0001 0.21 359 -0.22 0.97 1 SD 1.0 0.8
Abbreviations AIC = Akaike's Information Criterion POD = point of departure BMD = benchmark dose BMDL = 1-sided 95% lower confidence limit for the benchmark dose
Notes 1. USEPA's BMDS v.2.1.1 was used to determine dose-response continuous data. 2. There are four Maximum Likelihood tests performed by BMDS that test the null hypothesis that the model fits the data as well as the "true" model.
Test 1. Tests the hypothesis that response and variance don't differ among dose levels. If this test accepts, there may not be a dose-response. P-values less than 0.1 indicate a model fit.
Test 2. Tests the hypothesis that variances are homogeneous. If this test accepts, the simpler constant variance model may be appropriate. P-values less than 0.1 indicate a model fit.
Test 3. (non-constant variance model) Test the hypothesis that the variances are adequately modeled. If this test accepts, it may be appropriate to conclude that the variances have been modeled appropriately.
Test 4. (non-constant variance model). Tests the hypothesis that the model for the mean fits the data. If this tests accepts, the user has support for the selected model. P-values greater than 0.1 indicate a model fit.
3. For each dataset, models with relatively low AIC are indicative of better fits.4. A scaled residual is the difference between the observed and predicted effect (i.e., percent response) divided by the standard deviation. Scaled Residual of Interest is a summary output parameter of the
BMDS model while the Maximum Scaled Residual is the maximum of the scaled residuals of each of the individual dose groups Absolute value less than 2 0 is indicative of a good fit Values in bold are >2 0BMDS model, while the Maximum Scaled Residual is the maximum of the scaled residuals of each of the individual dose groups. Absolute value less than 2.0 is indicative of a good fit. Values in bold are >2.0. 5. For multidose continuous data, the BMR used in estimating the point of departure was a change of 1 standard deviation (1 SD) from the control mean.
References
Busby, W.F.J., M.E. Goldman, P.M. Newberne et al. 1984. Tumorigenicity of fluoranthene in a newborn mouse lung adenoma bioassay. Carcinogenesis 5:1311–1316.

6 6 6 6 6 6
8 8 8 8 8 8
10 10 10 10 10 10
6 6
8 8
Mea
n R
Mea
n R
eespo
nse
spon
seeM
ean
Re
Mea
n R
eM
ean
RM
ean
RM
ean
RM
ean
Reeees
pons
esp
onse
spon
sesp
onse
spon
sesp
onse
A: Exponential2_Busby84_BaP_M_Cont_Exp B: Exponential3_Busby84_BaP_M_Cont_Exp Exponential Model 2 with 0.95 Confidence LevelExponential Model 2 with 0.95 Confidence LevelExponential Model 2 with 0.95 Confidence LevelExponential Model 2 with 0.95 Confidence LevelExponential Model 2 with 0.95 Confidence LevelExponential Model 2 with 0.95 Confidence LevelExponential Model 2 with 0.95 Confidence Level Exponential Model 3 with 0.95 Confidence LevelExponential Model 3 with 0.95 Confidence LevelExponential Model 3 with 0.95 Confidence LevelExponential Model 3 with 0.95 Confidence LevelExponential Model 3 with 0.95 Confidence LevelExponential Model 3 with 0.95 Confidence LevelExponential Model 3 with 0.95 Confidence Level
ExponentialExponentialExponentialExponentialExponentialExponentialExponential ExponentialExponentialExponentialExponentialExponentialExponentialExponential
16161616161616 16161616161616
141414141414 141414141414
121212121212 121212121212
MMMMMMea
n R
ean
Rea
n R
ean
Rea
n R
ean
Reeeeees
pons
esp
onse
spon
sesp
onse
spon
sesp
onse 101010101010
888888
666666
44444 44444
22222 22222
00000
00000
16:10 04/13 201016:10 04/13 201016:10 04/13 201016:10 04/13 2010
0.20.20.20.20.2 0.40.40.40.40.4 0.60.60.60.60.6dosedosedosedose
0.80.80.80.80.8 11111
BMDLBMDLBMDLBMDLBMDL
1.21.21.21.21.2 1.41.41.41.41.4
BMDBMDBMDBMDBMD 00000
00000
16:10 04/13 201016:10 04/13 201016:10 04/13 201016:10 04/13 2010
0.20.20.20.20.2 0.40.40.40.40.4 0.60.60.60.60.6dosedosedosedose
0.80.80.80.80.8 11111
BMDLBMDLBMDLBMDLBMDL
1.21.21.21.21.2 1.41.41.41.41.4
BMDBMDBMDBMDBMD
C: Exponential4_Busby84_BaP_M_Cont_Exp Exponential Model 4 with 0.95 Confidence Level
161616
Exponential Model 4 with 0.95 Confidence LevelExponential Model 4 with 0.95 Confidence LevelExponential Model 4 with 0.95 Confidence Level
ExponentialExponentialExponential
D: Linear_Busby84_BaP_M_Cont_LinLinear Model with 0.95 Confidence Level
161616
Linear Model with 0.95 Confidence LevelLinear Model with 0.95 Confidence LevelLinear Model with 0.95 Confidence Level
LinearLinearLinear BMD Lower BoundBMD Lower BoundBMD Lower Bound
141414 141414
121212 121212
101010
MMea
n R
ean
Rees
pons
esp
onsee 101010
88
66
44 44
22 22
0
0
16:10 04/13 2010
BMDL
0.2 0.4
BMD
0.6dose
0.8 1 1.2 1.4
0
0
16:10 04/13 2010
0.2 0.4 0.6
BMDL
0.8
dose 1
BMD
1.2 1.4
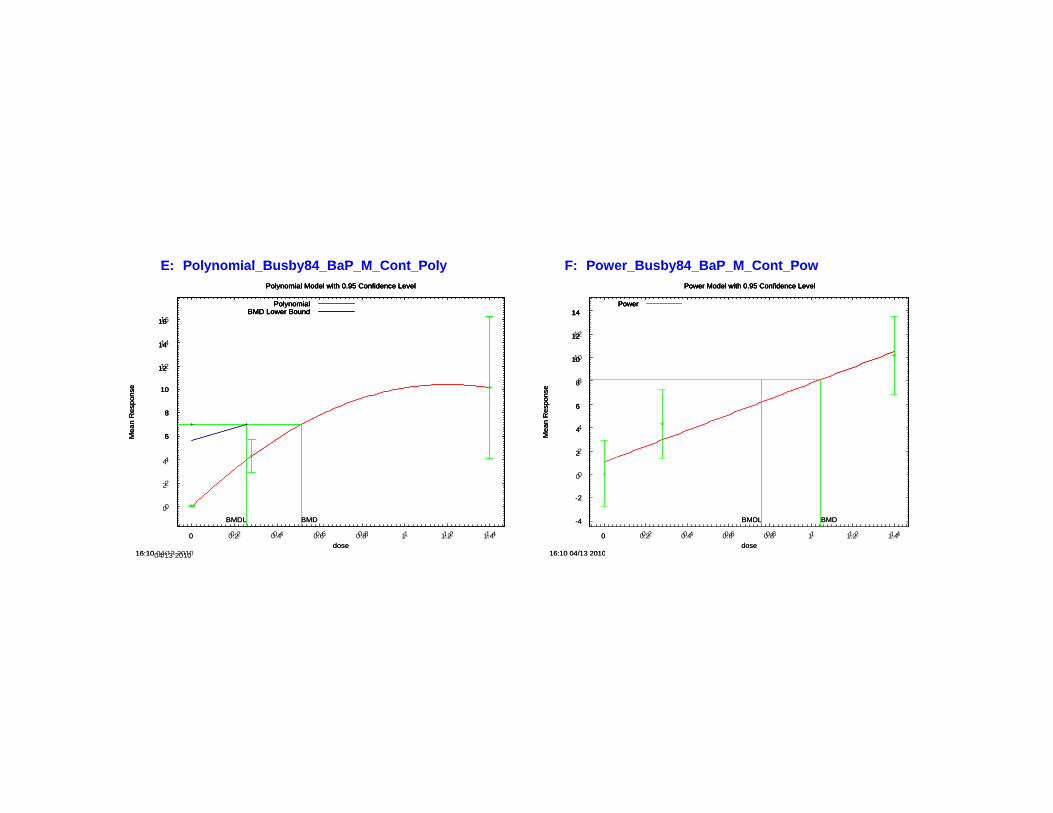
6 6 6
8 8 8
10 10 10
Mea
n R
Mea
n R
Mea
n R
eeespo
nse
spon
sesp
onse
E:E: Polynomial Busby84 BaP M Cont Poly F:F: Power Busby84 BaP M Cont PowPolynomial_Busby84_BaP_M_Cont_Poly Power_Busby84_BaP_M_Cont_Pow Polynomial Model with 0.95 Confidence LevelPolynomial Model with 0.95 Confidence LevelPolynomial Model with 0.95 Confidence LevelPolynomial Model with 0.95 Confidence Level Power Model with 0.95 Confidence LevelPower Model with 0.95 Confidence LevelPower Model with 0.95 Confidence LevelPower Model with 0.95 Confidence Level
PolynomialBMD Lower Bound
PolynomialBMD Lower Bound
BMDBMDL
PolynomialBMD Lower Bound
BMDBMDL
Polynomial BMD Lower Bound
00 0.20.2 0.40.4 0.60.6 0.80.8 11 1.21.2 1.41.4
PowerPower
BMDBMDL
Power
BMDBMDL
Power 14141414
16161616
12121212 14141414
10101010 12121212
888
MMMea
n R
ean
Rea
n R
eeespo
nse
spon
sesp
onse
666
444
222 44
00 22
-2-2 00
-4-4
00 0.20.2 0.40.4 0.60.6 0.80.8 11 1.21.2 1.41.4 dosedose dosedose
16:1016:10 04/13 201004/13 2010 16:10 04/13 201016:10 04/13 2010

Table B-13. Busby et al. (1984), benzo[a]pyrene, female mouse. Continuous dose-response goodness-of-fit tests and benchmark dose estimates at 10% effect levels applied to study results.
Source Substance
Effect Endpoint Continuous
Dose-Response Model (1)
Goodness-of-Fit POD
Benchmark Response (BMR) (5)
Dose (mg-total)
Notes
p-value for Maximum Likelihood Tests (2)
AIC (3)
Residuals (4)
Animal Tissue Test 1 Test 2 Test 3 Test 4
Scaled Residual of
Interest
Maximum Scaled
Residual BMD BMDL Busby, 1984 BaP female
mouse Adenoma + carcinoma Hill 1 SD Hill model not applicable
Busby, 1984 BaP female
mouse Adenoma + carcinoma Exponential 2 < 0.0001 < 0.0001 < 0.0001 0.0002 277 -0.25 2.5 1 SD 1.6 1.3
Busby, 1984 BaP female
mouse Adenoma + carcinoma Exponential 3 < 0.0001 < 0.0001 < 0.0001 0.0002 277 -0.25 2.5 1 SD 1.6 1.3
Busby, 1984 BaP female
mouse Adenoma + carcinoma Exponential 4 < 0.0001 < 0.0001 < 0.0001 N/A 266 3.4E-06 5.9E-06 1 SD 0.20 0.0010 Acceptable Fit; Exponential 4 model has the lowest
residuals and low AIC. Busby, 1984 BaP female
mouse Adenoma + carcinoma Exponential 5 1 SD Exponential 5 model not applicable
Busby, 1984 BaP female
mouse Adenoma + carcinoma Linear <.0001 <.0001 <.0001 6.2E-04 276 -0.54 2.6 1 SD 1.46 0.99
Busby, 1984 BaP female
mouse Adenoma + carcinoma Polynomial <.0001 <.0001 <.0001 NA 266 4.3E-10 1.6E-09 1 SD 0.24 0.16 Acceptable Fit:Polynomial model has the lowest
residuals and low AIC. Busby, 1984 BaP female
mouse Adenoma + carcinoma Power <.0001 <.0001 <.0001 6.2E-04 276 -0.54 2.56 1 SD 1.46 0.99
Abbreviations AIC = Akaike's Information Criterion POD = point of departure BMD = benchmark dose BMDL = 1-sided 95% lower confidence limit for the benchmark dose
Notes 1. USEPA's BMDS v.2.1.1 was used to determine dose-response continuous data. 2. There are four Maximum Likelihood tests performed by BMDS that test the null hypothesis that the model fits the data as well as the "true" model.
Test 1. Tests the hypothesis that response and variance don't differ among dose levels. If this test accepts, there may not be a dose-response. P-values less than 0.1 indicate a model fit.
Test 2. Tests the hypothesis that variances are homogeneous. If this test accepts, the simpler constant variance model may be appropriate. P-values less than 0.1 indicate a model fit.
Test 3. (non-constant variance model) Test the hypothesis that the variances are adequately modeled. If this test accepts, it may be appropriate to conclude that the variances have been modeled appropriately.
Test 4. (non-constant variance model). Tests the hypothesis that the model for the mean fits the data. If this tests accepts, the user has support for the selected model. P-values greater than 0.1 indicate a model fit.
3. For each dataset, models with relatively low AIC are indicative of better fits., y 4. A scaled residual is the difference between the observed and predicted effect (i.e., percent response) divided by the standard deviation. Scaled Residual of Interest is a summary output parameter of the BMDS model, while the Maximum Scaled Residual is the maximum of the scaled residuals of each of the individual dose groups. Absolute value less than 2.0 is indicative of a good fit. Values in bold are >2.0. 5. For multidose continuous data, the BMR used in estimating the point of departure was a change of 1 standard deviation (1 SD) from the control mean.
References
Busby, W.F.J., M.E. Goldman, P.M. Newberne et al. 1984. Tumorigenicity of fluoranthene in a newborn mouse lung adenoma bioassay. Carcinogenesis 5:1311–1316.

3 3 3 3 3 3
4 4 4 4 4 4
3 3
4 4 4
A: Exponential2_Busby84_BaP_F_Cont_Exp B: Exponential3_Busby84_BaP_F_Cont_Exp Exponential Model 2 with 0.95 Confidence LevelExponential Model 2 with 0.95 Confidence LevelExponential Model 2 with 0.95 Confidence LevelExponential Model 2 with 0.95 Confidence LevelExponential Model 2 with 0.95 Confidence LevelExponential Model 2 with 0.95 Confidence LevelExponential Model 2 with 0.95 Confidence Level Exponential Model 3 with 0.95 Confidence LevelExponential Model 3 with 0.95 Confidence LevelExponential Model 3 with 0.95 Confidence LevelExponential Model 3 with 0.95 Confidence LevelExponential Model 3 with 0.95 Confidence LevelExponential Model 3 with 0.95 Confidence LevelExponential Model 3 with 0.95 Confidence Level
ExponentialExponentialExponentialExponentialExponentialExponentialExponential ExponentialExponentialExponentialExponentialExponentialExponentialExponential
6666666 6666666
555555 555555
Mea
n R
Mea
n R
eespo
nse
spon
seeM
ean
Re
Mea
n R
eM
ean
RM
ean
RM
ean
RM
ean
Reeees
pons
esp
onse
spon
sesp
onse
spon
sesp
onse
MMMMMMea
n R
ean
Rea
n R
ean
Rea
n R
ean
Reeeeees
pons
esp
onse
spon
sesp
onse
spon
sesp
onse 444444
333333
22222
11111
00000
00000
16:29 04/13 201016:29 04/13 201016:29 04/13 201016:29 04/13 2010
0.20.20.20.20.2 0.40.40.40.40.4 0.60.60.60.60.6 0.80.80.80.80.8dosedosedosedose
11111 1.21.21.21.21.2
BMDLBMDLBMDLBMDLBMDL
1.41.41.41.41.4 1.61.61.61.61.6
BMDBMDBMDBMDBMD
C: Exponential4_Busby84_BaP_F_Cont_Exp Exponential Model 4 with 0.95 Confidence Level
666
Exponential Model 4 with 0.95 Confidence LevelExponential Model 4 with 0.95 Confidence LevelExponential Model 4 with 0.95 Confidence Level
ExponentialExponentialExponential
555
22222
11111
00000
00000
16:29 04/13 201016:29 04/13 201016:29 04/13 201016:29 04/13 2010
0.20.20.20.20.2 0.40.40.40.40.4 0.60.60.60.60.6 0.80.80.80.80.8dosedosedosedose
11111 1.21.21.21.21.2
BMDLBMDLBMDLBMDLBMDL
1.41.41.41.41.4 1.61.61.61.61.6
BMDBMDBMDBMDBMD
D: Linear_Busby84_BaP_F_Cont_Lin Linear Model with 0.95 Confidence Level
666
Linear Model with 0.95 Confidence LevelLinear Model with 0.95 Confidence LevelLinear Model with 0.95 Confidence Level
LinearLinearLinear BMD Lower BoundBMD Lower BoundBMD Lower Bound
555
MMea
n R
ean
Rees
pons
esp
onsee 444
33
22
11
0 0
BMDL BMD BMDL BMD
0 0.2 0.4 0.6 0.8 1 1.2 1.4 0 0.2 0.4 0.6 0.8 1 1.2 1.4
dose dose 16:29 04/13 2010 16:29 04/13 2010
1 1
2 2

3 3 3
4 4 4
Mea
n R
Mea
n R
Mea
n R
eeespo
nse
spon
sesp
onse
E: PolPolynomialynomial Busb_Busby84y84 BaP F Cont Pol_BaP_F_Cont_Polyy F: PowerPower_BusbBusby84y84 BaP F Cont Pow_BaP_F_Cont_PowE: F: Polynomial Model with 0.95 Confidence LevelPolynomial Model with 0.95 Confidence LevelPolynomial Model with 0.95 Confidence LevelPolynomial Model with 0.95 Confidence Level Power Model with 0.95 Confidence LevelPower Model with 0.95 Confidence LevelPower Model with 0.95 Confidence LevelPower Model with 0.95 Confidence Level
PolynomialBMD Lower Bound
PolynomialBMD Lower Bound
BMDBMDL
PolynomialBMD Lower Bound
BMDBMDL
Polynomial BMD Lower Bound
00 0.20.2 0.40.4 0.60.6 0.80.8 11 1.21.2 1.41.4
PowerPower
BMDBMDL
Power
BMDBMDL
Power6666
6666 5555
5555 4444
MMMea
n R
ean
Rea
n R
eeespo
nse
spon
sesp
onse 333
222
222 111
0011
-1-100
00 0.20.2 0.40.4 0.60.6 0.80.8 11 1.21.2 1.41.4 dosedose dosedose
16:29 04/13 201016:29 04/13 2010 16:30 04/13 201016:30 04/13 2010

Table B-14. Busby et al. (1984), fluoranthene, male mouse. Continuous dose-response goodness-of-fit tests and benchmark dose estimates at 10% effect levels applied to study results.
Source Substance
Effect Endpoint Continuous
Dose-Response Model (1)
Goodness-of-Fit POD
Benchmark Response (BMR) (5)
Dose (mg-total)
Notes
p-value for Maximum Likelihood Tests (2)
AIC (3)
Residuals (4)
Animal Tissue Test 1 Test 2 Test 3 Test 4
Scaled Residual of
Interest
Maximum Scaled
Residual BMD BMDL Busby, 1984 FA male
mouse Adenoma + carcinoma Hill Hill model not applicable
Busby, 1984 FA male
mouse Adenoma + carcinoma Exponential 2 < 0.0001 < 0.0001 < 0.0001 0.55 100 -0.011 -0.49 1 SD 3.1 2.9 Acceptable Fit
Busby, 1984 FA male
mouse Adenoma + carcinoma Exponential 3 < 0.0001 < 0.0001 < 0.0001 0.55 100 -0.011 -0.49 1 SD 3.1 2.9 Acceptable Fit
Busby, 1984 FA male
mouse Adenoma + carcinoma Exponential 4 < 0.0001 < 0.0001 < 0.0001 N/A 102 2.9E-02 -0.14 1 SD 2.5 1.9 Acceptable Fit
Busby, 1984 FA male
mouse Adenoma + carcinoma Exponential 5 Exponential 5 model not applicable
Busby, 1984 FA male
mouse Adenoma + carcinoma Linear <.0001 <.0001 <.0001 0.86 100 0.029 -0.14 1 SD 2.5 1.9 Acceptable Fit
Busby, 1984 FA male
mouse Adenoma + carcinoma Polynomial <.0001 <.0001 <.0001 NA 102 8.0E-11 8.0E-11 1 SD 2.6 1.1 Acceptable Fit
Busby, 1984 FA male
mouse Adenoma + carcinoma Power <.0001 <.0001 <.0001 NA 102 0 0 1 SD 2.6 1.9 Acceptable Fit:Power model has the lowest residuals.
Abbreviations AIC = Akaike's Information Criterion POD = point of departure BMD = benchmark dose BMDL = 1-sided 95% lower confidence limit for the benchmark dose
Notes 1. USEPA's BMDS v.2.1.1 was used to determine dose-response continuous data. 2. There are four Maximum Likelihood tests performed by BMDS that test the null hypothesis that the model fits the data as well as the "true" model.
Test 1. Tests the hypothesis that response and variance don't differ among dose levels. If this test accepts, there may not be a dose-response. P-values less than 0.1 indicate a model fit.
Test 2. Tests the hypothesis that variances are homogeneous. If this test accepts, the simpler constant variance model may be appropriate. P-values less than 0.1 indicate a model fit.
Test 3. (non-constant variance model) Test the hypothesis that the variances are adequately modeled. If this test accepts, it may be appropriate to conclude that the variances have been modeled appropriately.
Test 4. (non-constant variance model). Tests the hypothesis that the model for the mean fits the data. If this tests accepts, the user has support for the selected model. P-values greater than 0.1 indicate a model fit.
3. For each dataset, models with relatively low AIC are indicative of better fits.3. For each dataset, models with relatively low AIC are indicative of better fits. 4. A scaled residual is the difference between the observed and predicted effect (i.e., percent response) divided by the standard deviation. Scaled Residual of Interest is a summary output parameter of the BMDS model, while the Maximum Scaled Residual is the maximum of the scaled residuals of each of the individual dose groups. Absolute value less than 2.0 is indicative of a good fit. Values in bold are >2.0. 5. For multidose continuous data, the BMR used in estimating the point of departure was a change of 1 standard deviation (1 SD) from the control mean.
References
Busby, W.F.J., M.E. Goldman, P.M. Newberne et al. 1984. Tumorigenicity of fluoranthene in a newborn mouse lung adenoma bioassay. Carcinogenesis 5:1311–1316.

1 1 1 1 1 1
1 1
A: Exponential2_Busby84_FA_M_Cont_Exp B: Exponential3_Busby84_FA_M_Cont_Exp Exponential Model 2 with 0.95 Confidence LevelExponential Model 2 with 0.95 Confidence LevelExponential Model 2 with 0.95 Confidence LevelExponential Model 2 with 0.95 Confidence LevelExponential Model 2 with 0.95 Confidence LevelExponential Model 2 with 0.95 Confidence LevelExponential Model 2 with 0.95 Confidence Level Exponential Model 3 with 0.95 Confidence LevelExponential Model 3 with 0.95 Confidence LevelExponential Model 3 with 0.95 Confidence LevelExponential Model 3 with 0.95 Confidence LevelExponential Model 3 with 0.95 Confidence LevelExponential Model 3 with 0.95 Confidence LevelExponential Model 3 with 0.95 Confidence Level
ExponentialExponentialExponentialExponentialExponentialExponentialExponential ExponentialExponentialExponentialExponentialExponentialExponentialExponential
2222222 2222222
1.51.51.51.51.51.5 1.51.51.51.51.51.5
Mea
n R
Mea
n R
eespo
nse
spon
seeM
ean
Re
Mea
n R
eM
ean
RM
ean
RM
ean
RM
ean
Reeees
pons
esp
onse
spon
sesp
onse
spon
sesp
onse
MMMMMMea
n R
ean
Rea
n R
ean
Rea
n R
ean
Reeeeees
pons
esp
onse
spon
sesp
onse
spon
sesp
onse
111111
0.50.50.50.50.5
00000
BMDBMDL BMDBMDLBMDLBMDLBMDL BMDBMDBMD
00000 0.50.50.50.50.5 11111 1.51.51.51.51.5 22222 2.52.52.52.52.5 33333 3.53.53.53.53.5 dosedosedosedose
11:42 04/15 201011:42 04/15 201011:42 04/15 201011:42 04/15 2010
C: Exponential4_Busby84_FA_M_Cont_Exp Exponential Model 4 with 0.95 Confidence LevelExponential Model 4 with 0.95 Confidence LevelExponential Model 4 with 0.95 Confidence LevelExponential Model 4 with 0.95 Confidence Level
ExponentialExponentialExponential
222
1.51.51.5
0.50.50.50.50.5
00000
BMDBMDL BMDBMDLBMDLBMDLBMDL BMDBMDBMD
00000 0.50.50.50.50.5 11111 1.51.51.51.51.5 22222 2.52.52.52.52.5 33333 3.53.53.53.53.5 dosedosedosedose
11:42 04/15 201011:42 04/15 201011:42 04/15 201011:42 04/15 2010
D: Linear_Busby84_FA_M_Cont_Lin Linear Model with 0.95 Confidence LevelLinear Model with 0.95 Confidence LevelLinear Model with 0.95 Confidence LevelLinear Model with 0.95 Confidence Level
LinearLinearLinear BMD Lower BoundBMD Lower BoundBMD Lower Bound
222
1.51.51.5
MMea
n R
ean
Rees
pons
esp
onsee
11
0.50.5
0
BMDL BMD BMDL BMD
0 0.5 1 1.5 2 2.5 3 3.5 0 0.5 1 1.5 2 2.5 3 3.5
dose dose 11:42 04/15 2010 11:42 04/15 2010
0
0.5 0.5

1 1 1
Mea
n R
Mea
n R
Mea
n R
eeespo
nse
spon
sesp
onse
E: PolPolynomialynomial Busb_Busby84y84 FA M Cont Pol_FA_M_Cont_Polyy F: PowerPower_BusbBusby84y84 FA M Cont Pow_FA_M_Cont_PowE: F: Polynomial Model with 0.95 Confidence LevelPolynomial Model with 0.95 Confidence LevelPolynomial Model with 0.95 Confidence LevelPolynomial Model with 0.95 Confidence Level Power Model with 0.95 Confidence LevelPower Model with 0.95 Confidence LevelPower Model with 0.95 Confidence LevelPower Model with 0.95 Confidence Level
PolynomialBMD Lower Bound
PolynomialBMD Lower Bound
BMDBMDL
PolynomialBMD Lower Bound
BMDBMDL
Polynomial BMD Lower Bound
00 0.50.5 11 1.51.5 22 2.52.5 33 3.53.5
2222PowerPower
BMDBMDL
Power
BMDBMDL
Power
2222
1.51.51.51.5
1 51.51.51.5
MMMea
n R
ean
Rea
n R
eeespo
nse
spon
sesp
onse
111
0.50.50.5
0.50.50.5
00
00-0.5-0.5
00 0.50.5 11 1.51.5 22 2.52.5 33 3.53.5 dosedose dosedose
11:42 04/15 201011:42 04/15 2010 11:42 04/15 201011:42 04/15 2010

Table B-15. Busby et al. (1984), fluoranthene, female mouse. Continuous dose-response goodness-of-fit tests and benchmark dose estimates at 10% effect levels applied to study results.
Source Substance
Effect Endpoint Continuous
Dose-Response Model (1)
Goodness-of-Fit POD
Benchmark Response (BMR) (5)
Dose (mg-total)
Notes
p-value for Maximum Likelihood Tests (2)
AIC (3)
Residuals (4)
Animal Tissue Test 1 Test 2 Test 3 Test 4
Scaled Residual of
Interest
Maximum Scaled
Residual BMD BMDL Busby, 1984 FA female
mouse Adenoma + carcinoma Hill Hill model not applicable
Busby, 1984 FA female
mouse Adenoma + carcinoma Exponential 2 1.9E-04 3.7E-04 3.7E-04 0.85 -4.8 0.0089 -0.14 1 SD 4.2 3.3 Acceptable Fit
Busby, 1984 FA female
mouse Adenoma + carcinoma Exponential 3 1.9E-04 3.7E-04 3.7E-04 N/A -2.8 9.9E-10 2.8E-09 1 SD 3.9 3.3 Acceptable Fit
Busby, 1984 FA female
mouse Adenoma + carcinoma Exponential 4 1.9E-04 3.7E-04 3.7E-04 N/A -2.6 0.069 -0.35 1 SD 5.0 3.0 Acceptable Fit
Busby, 1984 FA female
mouse Adenoma + carcinoma Exponential 5 Exponential 5 model not applicable
Busby, 1984 FA female
mouse Adenoma + carcinoma Linear 1.9E-04 3.7E-04 3.7E-04 0.67 -4.6 0.069 -0.35 1 SD 5.0 3.0 Acceptable Fit
Busby, 1984 FA female
mouse Adenoma + carcinoma Polynomial 1.9E-04 3.7E-04 3.7E-04 NA -2.8 5.5E-11 5.5E-11 1 SD 4.2 2.0 Acceptable Fit
Busby, 1984 FA female
mouse Adenoma + carcinoma Power 1.9E-04 3.7E-04 3.7E-04 NA -2.8 0 0 1 SD 4.2 3.0 Acceptable Fit
Abbreviations AIC = Akaike's Information Criterion POD = point of departure BMD = benchmark dose BMDL = 1-sided 95% lower confidence limit for the benchmark dose
Notes 1. USEPA's BMDS v.2.1.1 was used to determine dose-response continuous data. 2. There are four Maximum Likelihood tests performed by BMDS that test the null hypothesis that the model fits the data as well as the "true" model.
Test 1. Tests the hypothesis that response and variance don't differ among dose levels. If this test accepts, there may not be a dose-response. P-values less than 0.1 indicate a model fit.
Test 2. Tests the hypothesis that variances are homogeneous. If this test accepts, the simpler constant variance model may be appropriate. P-values less than 0.1 indicate a model fit.
Test 3. (non-constant variance model) Test the hypothesis that the variances are adequately modeled. If this test accepts, it may be appropriate to conclude that the variances have been modeled appropriately.
Test 4. (non-constant variance model). Tests the hypothesis that the model for the mean fits the data. If this tests accepts, the user has support for the selected model. P-values greater than 0.1 indicate a model fit.
3. For each dataset, models with relatively low AIC are indicative of better fits.3. For each dataset, models with relatively low AIC are indicative of better fits. 4. A scaled residual is the difference between the observed and predicted effect (i.e., percent response) divided by the standard deviation. Scaled Residual of Interest is a summary output parameter of the BMDS model, while the Maximum Scaled Residual is the maximum of the scaled residuals of each of the individual dose groups. Absolute value less than 2.0 is indicative of a good fit. Values in bold are >2.0. 5. For multidose continuous data, the BMR used in estimating the point of departure was a change of 1 standard deviation (1 SD) from the control mean.
References
Busby, W.F.J., M.E. Goldman, P.M. Newberne et al. 1984. Tumorigenicity of fluoranthene in a newborn mouse lung adenoma bioassay. Carcinogenesis 5:1311–1316.

0.4 0.4 0.4 0.4 0.4 0.4
0.4 0.4
Mea
n R
Mea
n R
eespo
nse
spon
seeM
ean
Re
Mea
n R
eM
ean
RM
ean
RM
ean
RM
ean
Reeees
pons
esp
onse
spon
sesp
onse
spon
sesp
onse
A: Exponential2_Busby84_FA_F_Cont_Exp B: Exponential3_Busby84_FA_F_Cont_Exp
Exponential Model 2 with 0.95 Confidence LevelExponential Model 2 with 0.95 Confidence LevelExponential Model 2 with 0.95 Confidence LevelExponential Model 2 with 0.95 Confidence LevelExponential Model 2 with 0.95 Confidence LevelExponential Model 2 with 0.95 Confidence LevelExponential Model 2 with 0.95 Confidence Level Exponential Model 3 with 0.95 Confidence LevelExponential Model 3 with 0.95 Confidence LevelExponential Model 3 with 0.95 Confidence LevelExponential Model 3 with 0.95 Confidence LevelExponential Model 3 with 0.95 Confidence LevelExponential Model 3 with 0.95 Confidence LevelExponential Model 3 with 0.95 Confidence Level
ExponentialExponentialExponentialExponentialExponentialExponentialExponential ExponentialExponentialExponentialExponentialExponentialExponentialExponential
0.80.80.80.80.80.80.8 0.80.80.80.80.80.80.8
0.60.60.60.60.60.6 0.60.60.60.60.60.6
MMMMMMea
n R
ean
Rea
n R
ean
Rea
n R
ean
Reeeeees
pons
esp
onse
spon
sesp
onse
spon
sesp
onse
0.40.40.40.40.40.4
0.20.20.20.20.2 0.20.20.20.20.2
00000 00000
00000
11:59 04/15 201011:59 04/15 201011:59 04/15 201011:59 04/15 2010
0.50.50.50.50.5 11111 1.51.51.51.51.5 22222dosedosedosedose
2.52.52.52.52.5 33333
BMDLBMDLBMDLBMDLBMDL
3.53.53.53.53.5 44444
BMDBMDBMDBMDBMD
00000
11:59 04/15 201011:59 04/15 201011:59 04/15 201011:59 04/15 2010
0.50.50.50.50.5 11111 1.51.51.51.51.5 22222dosedosedosedose
2.52.52.52.52.5 33333
BMDLBMDLBMDLBMDLBMDL
3.53.53.53.53.5 44444
BMDBMDBMDBMDBMD
C: Exponential4_Busby84_FA_F_Cont_Exp Exponential Model 4 with 0.95 Confidence LevelExponential Model 4 with 0.95 Confidence LevelExponential Model 4 with 0.95 Confidence LevelExponential Model 4 with 0.95 Confidence Level
ExponentialExponentialExponentialExponential
D: Linear_Busby84_FA_F_Cont_Lin Linear Model with 0.95 Confidence LevelLinear Model with 0.95 Confidence LevelLinear Model with 0.95 Confidence LevelLinear Model with 0.95 Confidence Level
LinearLinearLinearLinear BMD Lower BoundBMD Lower BoundBMD Lower Bound
0.80.80.8 0.80.80.8
0.60.60.6 0.60.60.6
MMea
n R
ean
Rees
pons
esp
onsee
0.40.4
0.20.2
0
BMDL BMD BMDL BMD
0 1 2 3 4 5 0 1 2 3 4 5
dose dose 11:59 04/15 2010 11:59 04/15 2010
0
0.2 0.2

0.4 0.4 0.4
Mea
n R
Mea
n R
Mea
n R
eeespo
nse
spon
sesp
onse
E: PolPolynomialynomial Busb_Busby84y84 FA F Cont Pol_FA_F_Cont_Polyy F: PowerPower_BusbBusby84y84 FA F Cont Pow_FA_F_Cont_PowE: F: Polynomial Model with 0.95 Confidence LevelPolynomial Model with 0.95 Confidence LevelPolynomial Model with 0.95 Confidence LevelPolynomial Model with 0.95 Confidence Level Power Model with 0.95 Confidence LevelPower Model with 0.95 Confidence LevelPower Model with 0.95 Confidence LevelPower Model with 0.95 Confidence Level
PolynomialBMD Lower Bound
PolynomialBMD Lower Bound
BMDBMDL
PolynomialBMD Lower Bound
BMDBMDL
Polynomial BMD Lower Bound
00 0.50.5 11 1.51.5 22 2.52.5 33 3.53.5 44
PowerPower
BMDBMDL
Power
BMDBMDL
Power 0.80.80.80.8
0.80.80.80.8
0.60.60.60.6
0 60.60.60.6
MMMea
n R
ean
Rea
n R
eeespo
nse
spon
sesp
onse
0.40.40.4
0.20.20.2 0.20.20.2
00 00
-0.2-0.2 00 0.50.5 11 1.51.5 22 2.52.5 33 3.53.5
dosedose dosedose 11:59 04/15 201011:59 04/15 2010 11:59 04/15 201011:59 04/15 2010
4 4

Table B-16. Nesnow et al. (1998), benzo[a]pyrene. Continuous dose-response goodness-of-fit tests and benchmark dose estimates at 10% effect levels applied to study results.
Source Substance
Effect Endpoint Continuous
Dose-Response Model (1)
Goodness-of-Fit POD Benchmar
k Response (BMR) (5)
Dose (mg/kg)
Notes
p-value for Maximum Likelihood Tests (2)
AIC (3)
Residuals (4)
Animal Tissue Test 1 Test 2 Test 3 Test 4
Scaled Residual of
Interest
Maximum Scaled
Residual BMD BMDL Nesnow,
1998 BaP mouse Lung tumors Hill <.0001 <.0001 <.0001 1.0 497 0.026 0.10 1 SD 57.3 42.6 Best Fit: Hill model has the lowest residuals, the highest p-value in test 4, and the 2nd lowest AIC.
Nesnow, 1998 BaP mouse Lung tumors Exponential 2 < 0.0001 < 0.0001 < 0.0001 0.0013 511 3.0 3.0 1 SD 89.9 82.6
Nesnow, 1998 BaP mouse Lung tumors Exponential 3 < 0.0001 < 0.0001 < 0.0001 0.0013 511 3.0 3.0 1 SD 89.9 82.6
Nesnow, 1998 BaP mouse Lung tumors Exponential 4 < 0.0001 < 0.0001 < 0.0001 < 0.0001 518 -4.5 23 1 SD 32.8 28.3
Nesnow, 1998 BaP mouse Lung tumors Exponential 5 < 0.0001 < 0.0001 < 0.0001 0.87 498 -0.34 -0.34 1 SD 53.6 43.0 Acceptable Fit
Nesnow, 1998 BaP mouse Lung tumors Linear <.0001 <.0001 <.0001 0.010 507 -2.2 -2.2 1 SD 31.9 28.3
Nesnow, 1998 BaP mouse Lung tumors Polynomial <.0001 <.0001 <.0001 0.85 496 -0.54 -0.54 1 SD 50.4 38.6 Acceptable Fit
Nesnow, 1998 BaP mouse Lung tumors Power <.0001 <.0001 <.0001 0.96 496 -0.34 -0.34 1 SD 53.6 42.0 Acceptable Fit
Abbreviations AIC = Akaike's Information Criterion POD = point of departure BMD = benchmark dose SD = standard deviation BMDL = 1-sided 95% lower confidence limit for the benchmark dose
Notes 1. USEPA's BMDS v.2.1.1 was used to determine dose-response continuous data. 2. There are four Maximum Likelihood tests performed by BMDS that test the null hypothesis that the model fits the data as well as the "true" model.
Test 1. Tests the hypothesis that response and variance don't differ among dose levels. If this test accepts, there may not be a dose-response. P-values less than 0.1 indicate a model fit. Test 2. Tests the hypothesis that variances are homogeneous. If this test accepts, the simpler constant variance model may be appropriate. P-values less than 0.1 indicate a model fit.
Test 3. (non-constant variance model) Test the hypothesis that the variances are adequately modeled. If this test accepts, it may be appropriate to conclude that the variances have been modeled appropriately.
Test 4. (non-constant variance model). Tests the hypothesis that the model for the mean fits the data. If this tests accepts, the user has support for the selected model. P-values greater than 0.1 indicate a model fit.
3. For each dataset, models with relatively low AIC are indicative of better fits.4. A scaled residual is the difference between the observed and predicted effect (i.e., percent response) divided by the standard deviation. Scaled Residual of Interest is a summary output parameter of the p ( , p p ) y y p p BMDS model, while the Maximum Scaled Residual is the maximum of the scaled residuals of each of the individual dose groups. Absolute value less than 2.0 is indicative of a good fit. Values in bold are >2.0. 5. For multidose continuous data, the BMR used in estimating the point of departure was a change of 1 standard deviation (1 SD) from the control mean.
References
Nesnow, S., J.A. Ross, M.J. Mass et al. 1998. Mechanistic relationships between DNA adducts, oncogene mutations, and lung tumorigenesis in strain A mice. Exp Lung Res 24:395-405.
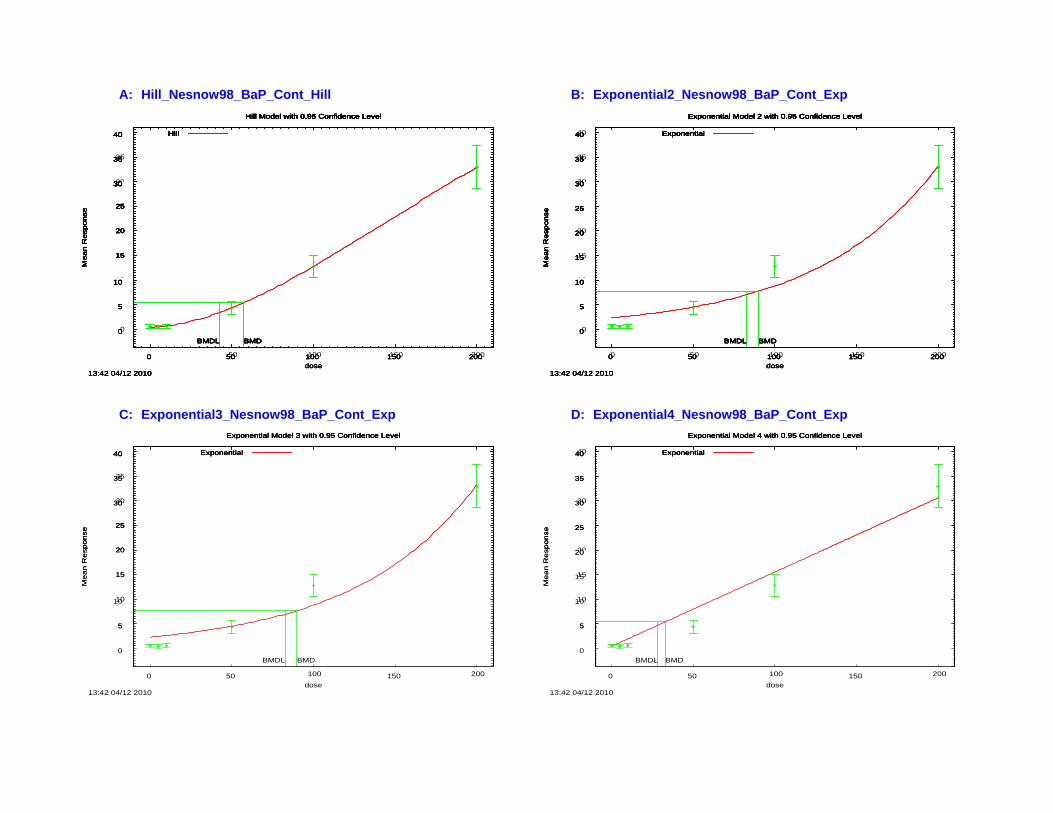
15 15 15 15 15 15
20 20 20 20 20 20
25 25 25 25 25 25
15 15
20 20 20
25 25 25
A: Hill_Nesnow98_BaP_Cont_Hill B: Exponential2_Nesnow98_BaP_Cont_Exp Hill Model with 0.95 Confidence LevelHill Model with 0.95 Confidence LevelHill Model with 0.95 Confidence LevelHill Model with 0.95 Confidence LevelHill Model with 0.95 Confidence LevelHill Model with 0.95 Confidence LevelHill Model with 0.95 Confidence Level Exponential Model 2 with 0.95 Confidence LevelExponential Model 2 with 0.95 Confidence LevelExponential Model 2 with 0.95 Confidence LevelExponential Model 2 with 0.95 Confidence LevelExponential Model 2 with 0.95 Confidence LevelExponential Model 2 with 0.95 Confidence LevelExponential Model 2 with 0.95 Confidence Level
40404040404040 HillHillHillHillHillHillHill 40404040404040 ExponentialExponentialExponentialExponentialExponentialExponentialExponential
35353535353535 35353535353535
30303030303030 30303030303030
spo
nse
Me
an
Re
spo
nse
Me
an
Re
spo
nse
M
ea
n R
esp
on
seM
ea
n R
esp
on
seM
ea
n R
esp
on
seM
ea
n R
esp
on
seM
ea
n R
esp
on
seM
ea
n R
esp
on
se
Me
an
Re
spo
nse
Me
an
Re
spo
nse
Me
an
Re
spo
nse
Me
an
Re
spo
nse
Me
an
Re
spo
nse
Me
an
Re
spo
nse
252525252525
202020202020
151515151515
101010101010
55555
00000BMDLBMDLBMDLBMDLBMDL BMDBMDBMDBMDBMD
00000 5050505050 100100100100100 150150150150150dosedosedosedose
13:42 04/12 201013:42 04/12 201013:42 04/12 201013:42 04/12 2010
C: Exponential3_Nesnow98_BaP_Cont_Exp Exponential Model 3 with 0.95 Confidence LevelExponential Model 3 with 0.95 Confidence LevelExponential Model 3 with 0.95 Confidence LevelExponential Model 3 with 0.95 Confidence Level
40404040 ExponentialExponentialExponentialExponential
353535
303030
101010101010
55555
00000BMDBMDL BMDBMDLBMDLBMDLBMDL BMDBMDBMD
200200200200200 00000 5050505050 100100100100100 150150150150150 200200200200200 dosedosedosedose
13:42 04/12 201013:42 04/12 201013:42 04/12 201013:42 04/12 2010
D: Exponential4_Nesnow98_BaP_Cont_ExpExponential Model 4 with 0.95 Confidence LevelExponential Model 4 with 0.95 Confidence LevelExponential Model 4 with 0.95 Confidence LevelExponential Model 4 with 0.95 Confidence Level
40404040 ExponentialExponentialExponentialExponential
353535
303030
spo
nse
Me
an
Re
spo
nse
Me
an
Re
spo
nse
252525
202020
1515
55
1010
55
1010
00BMDL BMD
00BMDL BMD
0
13:42 04/12 2010
50 100
dose 150 200 0
13:42 04/12 2010
50 100
dose 150 200

15 15 15 15 15 15
20 20 20 20 20 20
25 25 25 25 25 25
15 15
20 20 20
25 25 25
E: Exponential5_Nesnow98_BaP_Cont_Exp F: Linear_Nesnow98_BaP_Cont_Lin Exponential Model 5 with 0.95 Confidence LevelExponential Model 5 with 0.95 Confidence LevelExponential Model 5 with 0.95 Confidence LevelExponential Model 5 with 0.95 Confidence LevelExponential Model 5 with 0.95 Confidence LevelExponential Model 5 with 0.95 Confidence LevelExponential Model 5 with 0.95 Confidence Level Linear Model with 0.95 Confidence LevelLinear Model with 0.95 Confidence LevelLinear Model with 0.95 Confidence LevelLinear Model with 0.95 Confidence LevelLinear Model with 0.95 Confidence LevelLinear Model with 0.95 Confidence LevelLinear Model with 0.95 Confidence Level
40404040404040 ExponentialExponentialExponentialExponentialExponentialExponentialExponential 40404040404040 LinearLinearLinearLinearLinearLinearLinear
35353535353535 35353535353535
303030303030 303030303030
Me
an
Re
spo
nse
Me
an
Re
spo
nse
Me
an
Re
spo
nse
Me
an
Re
spo
nse
Me
an
Re
spo
nse
Me
an
Re
spo
nse
252525252525
202020202020
151515151515
1010101010 1010101010
55555 55555
00000
00000
13:42 04/12 201013:42 04/12 201013:42 04/12 201013:42 04/12 2010
BMDLBMDLBMDLBMDLBMDL
5050505050
BMDBMDBMDBMDBMD
100100100100100dosedosedosedose
150150150150150 200200200200200
00000
00000
13:42 04/12 201013:42 04/12 201013:42 04/12 201013:42 04/12 2010
BMDBMDBMDBMDBMDBMDLBMDLBMDLBMDLBMDL
5050505050 100100100100100dosedosedosedose
150150150150150 200200200200200
G: Polynomial_Nesnow98_BaP_Cont_Poly
Polynomial
303030
353535
40404040
Polynomial Model with 0.95 Confidence LevelPolynomial Model with 0.95 Confidence LevelPolynomial Model with 0.95 Confidence LevelPolynomial Model with 0.95 Confidence Level
PolynomialPolynomialPolynomial BMD Lower BoundBMD Lower BoundBMD Lower Bound
H: Power_Nesnow98_BaP_Cont_Pow
Power
252525
303030
353535
Power Model with 0.95 Confidence LevelPower Model with 0.95 Confidence LevelPower Model with 0.95 Confidence LevelPower Model with 0.95 Confidence Level
PowerPowerPower
spo
nse
Me
an
Re
spo
nse
Me
an
Re
spo
nse
202020
1515
1010 1010
55
55
0000
BMDL BMD -5 BMDL BMD
0 50 100 150 200 0 50 100 150 200
dose dose 13:42 04/12 2010 13:42 04/12 2010
spo
nse
Me
an
Re
spo
nse
Me
an
Re
spo
nse
M
ea
n R
esp
on
seM
ea
n R
esp
on
seM
ea
n R
esp
on
seM
ea
n R
esp
on
seM
ea
n R
esp
on
seM
ea
n R
esp
on
se

Table B-17. Nesnow et al. (1998), cyclopenta[c,d]pyrene. Continuous dose-response goodness-of-fit tests and benchmark dose estimates at 10% effect levels applied to study results.
Source Substance
Effect Endpoint Continuous
Dose-Response Model (1)
Goodness-of-Fit POD Benchmar
k Response (BMR) (5)
Dose (mg/kg)
Notes
p-value for Maximum Likelihood Tests (2)
AIC (3)
Residuals (4)
Animal Tissue Test 1 Test 2 Test 3 Test 4
Scaled Residual of
Interest
Maximum Scaled
Residual BMD BMDL Nesnow,
1998 CPcdP mouse Lung tumors Hill <.0001 <.0001 <.0001 1.0 624 8.43E-06 0.00042 1 SD 73.9 58.0 Best Fit: Hill model has the lowest residuals, the highest p-value in Test 4, and the lowest AIC.
Nesnow, 1998 CPcdP mouse Lung tumors Exponential 2 < 0.0001 < 0.0001 < 0.0001 0.0008 637 2.8 2.8 1 SD 93.0 84.9
Nesnow, 1998 CPcdP mouse Lung tumors Exponential 3 < 0.0001 < 0.0001 < 0.0001 0.0008 637 2.8 2.8 1 SD 93.0 84.9
Nesnow, 1998 CPcdP mouse Lung tumors Exponential 4 < 0.0001 < 0.0001 < 0.0001 < 0.0001 680 -6.9 22 1 SD 32.1 29.8
Nesnow, 1998 CPcdP mouse Lung tumors Exponential 5 < 0.0001 < 0.0001 < 0.0001 0.12 627 -1.32 -1.32 1 SD 65.2 55.9 Acceptable Fit
Nesnow, 1998 CPcdP mouse Lung tumors Linear <.0001 <.0001 <.0001 <.0001 651 -3.2 -3.2 1 SD 33.0 28.9
Nesnow, 1998 CPcdP mouse Lung tumors Polynomial <.0001 <.0001 <.0001 0.20 626 -1.36 -1.36 1 SD 63.1 48.6 Acceptable Fit
Nesnow, 1998 CPcdP mouse Lung tumors Power <.0001 <.0001 <.0001 0.31 625 -1.24 -1.24 1 SD 63.6 51.7 Acceptable Fit
Abbreviations AIC = Akaike's Information Criterion POD = point of departure BMD = benchmark dose BMDL = 1-sided 95% lower confidence limit for the benchmark dose
Notes 1. USEPA's BMDS v.2.1.1 was used to determine dose-response continuous data. 2. There are four Maximum Likelihood tests performed by BMDS that test the null hypothesis that the model fits the data as well as the "true" model.
Test 1. Tests the hypothesis that response and variance don't differ among dose levels. If this test accepts, there may not be a dose-response. P-values less than 0.1 indicate a model fit. Test 2. Tests the hypothesis that variances are homogeneous. If this test accepts, the simpler constant variance model may be appropriate. P-values less than 0.1 indicate a model fit.
Test 3. (non-constant variance model) Test the hypothesis that the variances are adequately modeled. If this test accepts, it may be appropriate to conclude that the variances have been modeled appropriately.
Test 4. (non-constant variance model). Tests the hypothesis that the model for the mean fits the data. If this tests accepts, the user has support for the selected model. P-values greater than 0.1 indicate a model fit.
3. For each dataset, models with relatively low AIC are indicative of better fits. 4. A scaled residual is the difference between the observed and predicted effect (i.e., percent response) divided by the standard deviation. Scaled Residual of Interest is a summary output parameter of the p ( , p p ) y y p p BMDS model, while the Maximum Scaled Residual is the maximum of the scaled residuals of each of the individual dose groups. Absolute value less than 2.0 is indicative of a good fit. Values in bold are >2.0. 5. For multidose continuous data, the BMR used in estimating the point of departure was a change of 1 standard deviation (1 SD) from the control mean.
References
Nesnow, S., J.A. Ross, M.J. Mass et al. 1998. Mechanistic relationships between DNA adducts, oncogene mutations, and lung tumorigenesis in strain A mice. Exp Lung Res 24:395-405.

40 40 40 40 40 40
60 60 60 60 60 60
40 40
60 60 60spo
nse
Me
an
Re
spo
nse
Me
an
Re
spo
nse
M
ea
n R
esp
on
seM
ea
n R
esp
on
seM
ea
n R
esp
on
seM
ea
n R
esp
on
seM
ea
n R
esp
on
seM
ea
n R
esp
on
se
A: Hill_Nesnow98_CPcdP_Cont_Hill B: Exponential2_Nesnow98_CPcdP_Cont_Exp Hill Model with 0.95 Confidence LevelHill Model with 0.95 Confidence LevelHill Model with 0.95 Confidence LevelHill Model with 0.95 Confidence LevelHill Model with 0.95 Confidence LevelHill Model with 0.95 Confidence LevelHill Model with 0.95 Confidence Level Exponential Model 2 with 0.95 Confidence LevelExponential Model 2 with 0.95 Confidence LevelExponential Model 2 with 0.95 Confidence LevelExponential Model 2 with 0.95 Confidence LevelExponential Model 2 with 0.95 Confidence LevelExponential Model 2 with 0.95 Confidence LevelExponential Model 2 with 0.95 Confidence Level
120120120120120120120 HillHillHillHillHillHillHill 120120120120120120120 ExponentialExponentialExponentialExponentialExponentialExponentialExponential
100100100100100100100 100100100100100100100
808080808080 808080808080
Me
an
Re
spo
nse
Me
an
Re
spo
nse
Me
an
Re
spo
nse
Me
an
Re
spo
nse
Me
an
Re
spo
nse
Me
an
Re
spo
nse
606060606060
404040404040
2020202020 2020202020
00000
00000
16:10 04/12 201016:10 04/12 201016:10 04/12 201016:10 04/12 2010
5050505050
BMDLBMDLBMDLBMDLBMDL BMDBMDBMDBMDBMD
100100100100100dosedosedosedose
150150150150150 200200200200200
00000
00000
16:10 04/12 201016:10 04/12 201016:10 04/12 201016:10 04/12 2010
5050505050
BMDLBMDLBMDLBMDLBMDL
100100100100100dosedosedosedose
BMDBMDBMDBMDBMD
150150150150150 200200200200200
C: Exponential3_Nesnow98_CPcdP_Cont_Exp
120120120120
Exponential Model 3 with 0.95 Confidence LevelExponential Model 3 with 0.95 Confidence LevelExponential Model 3 with 0.95 Confidence LevelExponential Model 3 with 0.95 Confidence Level
ExponentialExponentialExponentialExponential
D: Exponential4_Nesnow98_CPcdP_Cont_Exp
120120120120
Exponential Model 4 with 0.95 Confidence LevelExponential Model 4 with 0.95 Confidence LevelExponential Model 4 with 0.95 Confidence LevelExponential Model 4 with 0.95 Confidence Level
ExponentialExponentialExponentialExponential
100100100 100100100
808080 808080
spo
nse
Me
an
Re
spo
nse
Me
an
Re
spo
nse
606060
4040
2020 2020
00
16:10 04/12 2010
0 50
BMDL
100dose
BMD
150 200
00
16:10 04/12 2010
0
BMDL BMD
50 100
dose 150 200

40 40 40 40 40 40
60 60 60 60 60 60
40 40
spo
nse
Me
an
Re
spo
nse
Me
an
Re
spo
nse
M
ea
n R
esp
on
seM
ea
n R
esp
on
seM
ea
n R
esp
on
seM
ea
n R
esp
on
seM
ea
n R
esp
on
seM
ea
n R
esp
on
se
E: Exponential5_Nesnow98_CPcdP_Cont_Exp F: Linear_Nesnow98_CPcdP_Cont_Lin Exponential Model 5 with 0.95 Confidence LevelExponential Model 5 with 0.95 Confidence LevelExponential Model 5 with 0.95 Confidence LevelExponential Model 5 with 0.95 Confidence LevelExponential Model 5 with 0.95 Confidence LevelExponential Model 5 with 0.95 Confidence LevelExponential Model 5 with 0.95 Confidence Level Linear Model with 0.95 Confidence LevelLinear Model with 0.95 Confidence LevelLinear Model with 0.95 Confidence LevelLinear Model with 0.95 Confidence LevelLinear Model with 0.95 Confidence LevelLinear Model with 0.95 Confidence LevelLinear Model with 0.95 Confidence Level
120120120120120120120 120120120120120120120ExponentialExponentialExponentialExponentialExponentialExponentialExponential LinearLinearLinearLinearLinearLinearLinear
100100100100100100100 100100100100100100100
808080808080 808080808080
Me
an
Re
spo
nse
Me
an
Re
spo
nse
Me
an
Re
spo
nse
Me
an
Re
spo
nse
Me
an
Re
spo
nse
Me
an
Re
spo
nse
606060606060
404040404040
00000
2020202020
16:10 04/12 201016:10 04/12 201016:10 04/12 201016:10 04/12 2010
00000 5050505050
BMDLBMDLBMDLBMDLBMDL BMDBMDBMDBMDBMD
100100100100100dosedosedosedose
150150150150150 200200200200200
00000
2020202020
16:10 04/12 201016:10 04/12 201016:10 04/12 201016:10 04/12 2010
00000
BMDLBMDLBMDLBMDLBMDL BMDBMDBMDBMDBMD
5050505050 100100100100100dosedosedosedose
150150150150150 200200200200200
G: Polynomial_Nesnow98_CPcdP_Cont_Poly
Polynomial120120120120
Polynomial Model with 0.95 Confidence LevelPolynomial Model with 0.95 Confidence LevelPolynomial Model with 0.95 Confidence LevelPolynomial Model with 0.95 Confidence Level
PolynomialPolynomialPolynomial
H: Power_Nesnow98_CPcdP_Cont_Pow
Power
Power Model with 0.95 Confidence LevelPower Model with 0.95 Confidence LevelPower Model with 0.95 Confidence LevelPower Model with 0.95 Confidence Level
PowerPowerPower
100100100
100100100
808080
808080
606060 spo
nse
Me
an
Re
spo
nse
Me
an
Re
spo
nse
606060
4040
2020 2020
0000
BMDL BMD BMDL BMD
0 50 100 150 200 0 50 100 150 200
dose dose 16:10 04/12 2010 16:10 04/12 2010

Table B-18. Nesnow et al. (1998), dibenz[a,l]pyrene. Continuous dose-response goodness-of-fit tests and benchmark dose estimates at 10% effect levels applied to study results.
Source Substance
Effect Endpoint Continuous
Dose-Response Model (1)
Goodness-of-Fit POD Benchmar
k Response (BMR) (5)
Dose (mg/kg)
Notes
p-value for Maximum Likelihood Tests (2)
AIC (3)
Residuals (4)
Animal Tissue Test 1 Test 2 Test 3 Test 4
Scaled Residual of
Interest
Maximum Scaled
Residual BMD BMDL Nesnow,
1998 DBalP mouse Lung tumors Hill <.0001 <.0001 <.0001 0.2 604 0.75 -0.82 1 SD 1.6 1.2 Acceptable fit.
Nesnow, 1998 DBalP mouse Lung tumors Exponential 2 < 0.0001 < 0.0001 < 0.0001 0.00020 619 2.3 -2.8 1 SD 3.1 2.9
Nesnow, 1998 DBalP mouse Lung tumors Exponential 3 < 0.0001 < 0.0001 < 0.0001 0.00020 619 2.3 -2.8 1 SD 3.1 2.9
Nesnow, 1998 DBalP mouse Lung tumors Exponential 4 < 0.0001 < 0.0001 < 0.0001 0.36 603 0.4 0.80 1 SD 1.4 1.3 Acceptable fit.
Nesnow, 1998 DBalP mouse Lung tumors Exponential 5 < 0.0001 < 0.0001 < 0.0001 0.21 604 0.74 -0.82 1 SD 1.6 1.3 Acceptable fit.
Nesnow, 1998 DBalP mouse Lung tumors Linear <.0001 <.0001 <.0001 0.56 601 0.4 0.81 1 SD 1.4 1.3
Acceptable fit: Linear model has the lowest residuals, the highest p-value in Test 4, and the lowest AIC.
Nesnow, 1998 DBalP mouse Lung tumors Polynomial <.0001 <.0001 <.0001 0.45 602 0.67 -0.88 1 SD 1.6 1.2 Acceptable fit.
Nesnow, 1998 DBalP mouse Lung tumors Power <.0001 <.0001 <.0001 0.45 602 0.74 -0.82 1 SD 1.6 1.3 Acceptable fit.
Abbreviations AIC = Akaike's Information Criterion POD = point of departure BMD = benchmark dose BMDL = 1-sided 95% lower confidence limit for the benchmark dose
Notes 1. USEPA's BMDS v.2.1.1 was used to determine dose-response continuous data. 2. There are four Maximum Likelihood tests performed by BMDS that test the null hypothesis that the model fits the data as well as the "true" model.
Test 1. Tests the hypothesis that response and variance don't differ among dose levels. If this test accepts, there may not be a dose-response. P-values less than 0.1 indicate a model fit.
Test 2. Tests the hypothesis that variances are homogeneous. If this test accepts, the simpler constant variance model may be appropriate. P-values less than 0.1 indicate a model fit.
Test 3. (non-constant variance model) Test the hypothesis that the variances are adequately modeled. If this test accepts, it may be appropriate to conclude that the variances have been modeled appropriately.
Test 4. (non-constant variance model). Tests the hypothesis that the model for the mean fits the data. If this tests accepts, the user has support for the selected model. P-values greater than 0.1 indicate a model fit.
3. For each dataset, models with relatively low AIC are indicative of better fits. 4. A scaled residual is the difference between the observed and predicted effect (i.e., percent response) divided by the standard deviation. Scaled Residual of Interest is a summary output parameter of the BMDS model, while the Maximum Scaled Residual is the maximum of the scaled residuals of each of the individual dose groups. Absolute value less than 2.0 is indicative of a good fit. Values in bold are >2.0. 5. For multidose continuous data, the BMR used in estimating the point of departure was a change of 1 standard deviation (1 SD) from the control mean.
References
Nesnow, S., J.A. Ross, M.J. Mass et al. 1998. Mechanistic relationships between DNA adducts, oncogene mutations, and lung tumorigenesis in strain A mice. Exp Lung Res 24:395-405.

10 10 10 10 10 10
5 5
A: Hill_Nesnow98_DBalP_Cont_Hill B: Exponential2_Nesnow98_DBalP_Cont_Exp Hill Model with 0.95 Confidence LevelHill Model with 0.95 Confidence LevelHill Model with 0.95 Confidence LevelHill Model with 0.95 Confidence LevelHill Model with 0.95 Confidence LevelHill Model with 0.95 Confidence LevelHill Model with 0.95 Confidence Level Exponential Model 2 with 0.95 Confidence LevelExponential Model 2 with 0.95 Confidence LevelExponential Model 2 with 0.95 Confidence LevelExponential Model 2 with 0.95 Confidence LevelExponential Model 2 with 0.95 Confidence LevelExponential Model 2 with 0.95 Confidence LevelExponential Model 2 with 0.95 Confidence Level
HillHillHillHillHillHillHill ExponentialExponentialExponentialExponentialExponentialExponentialExponential20202020202020 20202020202020
15151515151515 15151515151515
spo
nse
Me
an
Re
spo
nse
Me
an
Re
spo
nse
M
ea
n R
esp
on
seM
ea
n R
esp
on
seM
ea
n R
esp
on
seM
ea
n R
esp
on
seM
ea
n R
esp
on
seM
ea
n R
esp
on
se
Me
an
Re
spo
nse
Me
an
Re
spo
nse
Me
an
Re
spo
nse
Me
an
Re
spo
nse
Me
an
Re
spo
nse
Me
an
Re
spo
nse
101010101010
55555
00000BMDBMDL BMDBMDLBMDLBMDLBMDL BMDBMDBMD
00000 11111 22222 33333 44444 55555 66666 dosedosedosedose
10:14 04/13 201010:14 04/13 201010:14 04/13 201010:14 04/13 2010
C: Exponential3_Nesnow98_DBalP_Cont_Exp Exponential Model 3 with 0.95 Confidence LevelExponential Model 3 with 0.95 Confidence LevelExponential Model 3 with 0.95 Confidence LevelExponential Model 3 with 0.95 Confidence Level
ExponentialExponentialExponentialExponential20202020
151515
55555
00000BMDBMDL BMDBMDLBMDLBMDLBMDL BMDBMDBMD
00000 11111 22222 33333 44444 55555dosedosedosedose
10:14 04/13 201010:14 04/13 201010:14 04/13 201010:14 04/13 2010
D: Exponential4_Nesnow98_DBalP_Cont_Exp Exponential Model 4 with 0.95 Confidence LevelExponential Model 4 with 0.95 Confidence LevelExponential Model 4 with 0.95 Confidence LevelExponential Model 4 with 0.95 Confidence Level
ExponentialExponentialExponentialExponential20202020
151515
spo
nse
Me
an
Re
spo
nse
Me
an
Re
spo
nse
101010 101010
55
0 0BMDL BMD BMDL BMD
0 1 2 3 4 5 6 0 1 2 3 4 5 6
dose dose 10:14 04/13 2010 10:14 04/13 2010
6 6 6 6 6

10 10 10 10 10 10
15 15 15 15 15 15
20 20 20 20 20 20 20
10 10 10
E: Exponential5_Nesnow98_DBalP_Cont_Exp F: Linear_Nesnow98_DBalP_Cont_Lin Exponential Model 5 with 0.95 Confidence LevelExponential Model 5 with 0.95 Confidence LevelExponential Model 5 with 0.95 Confidence LevelExponential Model 5 with 0.95 Confidence LevelExponential Model 5 with 0.95 Confidence LevelExponential Model 5 with 0.95 Confidence LevelExponential Model 5 with 0.95 Confidence Level Linear Model with 0.95 Confidence LevelLinear Model with 0.95 Confidence LevelLinear Model with 0.95 Confidence LevelLinear Model with 0.95 Confidence LevelLinear Model with 0.95 Confidence LevelLinear Model with 0.95 Confidence LevelLinear Model with 0.95 Confidence Level
ExponentialExponentialExponentialExponentialExponentialExponentialExponential LinearLinearLinearLinearLinearLinearLinear BMD Lower BoundBMD Lower BoundBMD Lower BoundBMD Lower BoundBMD Lower BoundBMD Lower BoundBMD Lower Bound
20202020202020
spo
nse
Me
an
Re
spo
nse
Me
an
Re
spo
nse
M
ea
n R
esp
on
seM
ea
n R
esp
on
seM
ea
n R
esp
on
seM
ea
n R
esp
on
seM
ea
n R
esp
on
seM
ea
n R
esp
on
se
151515151515
Me
an
Re
spo
nse
Me
an
Re
spo
nse
Me
an
Re
spo
nse
Me
an
Re
spo
nse
Me
an
Re
spo
nse
Me
an
Re
spo
nse
101010101010
55555
55555
00000
00000
10:14 04/13 201010:14 04/13 201010:14 04/13 201010:14 04/13 2010
11111
BMDLBMDLBMDLBMDLBMDL
22222
BMDBMDBMDBMDBMD
33333dosedosedosedose
44444 55555 66666
00000
00000
10:14 04/13 201010:14 04/13 201010:14 04/13 201010:14 04/13 2010
11111
BMDLBMDLBMDLBMDLBMDL BMDBMDBMDBMDBMD
22222 33333dosedosedosedose
44444 55555 66666
G: Polynomial_Nesnow98_DBalP_Cont_Poly
Polynomial20202020
Polynomial Model with 0.95 Confidence LevelPolynomial Model with 0.95 Confidence LevelPolynomial Model with 0.95 Confidence LevelPolynomial Model with 0.95 Confidence Level
PolynomialPolynomialPolynomial BMD Lower BoundBMD Lower BoundBMD Lower Bound
H: Power_Nesnow98_DBalP_Cont_Pow
Power
Power Model with 0.95 Confidence LevelPower Model with 0.95 Confidence LevelPower Model with 0.95 Confidence LevelPower Model with 0.95 Confidence Level
PowerPowerPower
151515
151515
spo
nse
Me
an
Re
spo
nse
Me
an
Re
spo
nse
101010
55 55
0000
BMDL BMD BMDL BMD
0 1 2 3 4 5 6 0 1 2 3 4 5 6
dose dose 10:14 04/13 2010 10:14 04/13 2010

Appendix C – Benchmark Dose Modeling
EPA’s Benchmark Dose Software (BMDS) version 2.1.1 (www.epa.gov/ncea/bmds/index.html) was used to assess dose-response relationships for a variety of relevant health endpoints reported in various studies in the published literature. Compared to the use of NOAEL/LOAELs and cancer potency estimates, the benchmark dose (BMD) approach provides a more quantitative alternative for determining the point of departure (POD) to calculate the toxicity value used in cancer and noncancer risk assessments (EPA 2000). Specifically, the POD is applied in one of two ways, consistent with EPA (2005) guidance : (1) a linear extrapolation method that yields a cancer slope factor (CSF) calculated as the ratio between the chosen benchmark response rate (BMR) or POD and the one-side 95% lower confidence limit of the benchmark dose (BMDL) converted to a human-equivalent external dose (HED); and (2) a nonlinear approach that yields a reference dose (RfD) calculated as the ratio between the benchmark dose (BMD) at the chosen BMR/POD and the product of several extrapolation/adjustment factors.
BMDS can accommodate categorical (including dichotomous) and continuous response variables. A toxicity study yields categorical data when responses are grouped into one or more categories, such as the severity of effect (e.g., mild, moderate, or severe histological change). Dichotomous data can be viewed as a special case in which there is one effect category and the possible response is binary (e.g., effect or no effect) (EPA 2000). For BMD modeling of dichotomous data, both the number of animals showing response and the total number of subjects in the group are included in the input file along with the dose. Categorical regression models can also be used to derive a BMD by estimating the probability of effects of different levels of severity (EPA 2000). Continuous data are reported as a measurement of the effect, such as body weights, or number of tumors per animal in control and exposed groups. The input file consists of either individual results or the number of subjects, mean response, and variance in response for each dose group.
BMDS generates goodness-of-fit metrics to guide in the selection of the optimal model. EPA’s technical guidance for BMDS (EPA 2000) provides additional criteria for selecting the optimal models for the final determination of the BMD and BMDL.
References
EPA. 2000. Benchmark Dose Technical Guidance Document, Draft. Risk Assessment Forum. EPA/630/R-00/001. October. Available online: http://www.epa.gov/nceawww1/pdfs/bmds/BMD-External_10_13_2000.pdf.
EPA. 2005. Guidelines for Carcinogen Risk Assessment. EPA/630/P:-03/001F.

Table C1. Mass et al. (1993), benzo[a]pyrene, A/J mouse. Continuous dose-response goodness-of-fit tests and benchmark dose estimates at 10% effect levels applied to study results.
Source Substance
Effect Endpoint Continuous
Dose-Response Model (1)
Goodness-of-Fit POD
Benchmark Response (BMR) (5)
Dose (mg/kg)
Notes
p-value for Maximum Likelihood Tests (2)
AIC (3)
Residuals (4)
Animal Tissue Test 1 Test 2 Test 3 Test 4
Scaled Residual of
Interest
Maximum Scaled
Residual BMD BMDL
Mass, 1993 BaP A/J Mice lung tumors Hill <.0001 <.0001 <.0001 NA 198 -4E-07 -4E-07 1 SD 41.0 29.1 Best Fit: Hill model has the lowest scaled residuals and the lowest AIC
Mass, 1993 BaP A/J Mice lung tumors Exponential 2 < 0.0001 < 0.0001 < 0.0001 0.0147 203 2.3 2.3 1 SD 61.4 55.0
Mass, 1993 BaP A/J Mice lung tumors Exponential 3 < 0.0001 < 0.0001 < 0.0001 0.0147 203 2.3 2.3 1 SD 61.4 55.0
Mass, 1993 BaP A/J Mice lung tumors Exponential 4 < 0.0001 < 0.0001 < 0.0001 0.052 200 1.0 -1.5 1 SD 36.84 24.13
Mass, 1993 BaP A/J Mice lung tumors Exponential 5 < 0.0001 < 0.0001 < 0.0001 N/A 198 7.5E-08 -4E-07 1 SD 42.2 29.9 Best Fit: Exponential 5 model has the lowest scaled residuals and the lowest AIC
Mass, 1993 BaP A/J Mice lung tumors Linear <.0001 <.0001 <.0001 0.15 198 1.1 -1.5 1 SD 37.7 30.6 Acceptable Fit
Mass, 1993 BaP A/J Mice lung tumors Polynomial <.0001 <.0001 <.0001 0.052 200 0.99 -1.6 1 SD 36.70 24.04
Mass, 1993 BaP A/J Mice lung tumors Power <.0001 <.0001 <.0001 0.05 200 1.2 -1.4 1 SD 39.9 30.7
Abbreviations AIC = Akaike's Information Criterion POD = point of departure BMD = benchmark dose BMDL = 1-sided 95% lower confidence limit for the benchmark dose
Notes 1. USEPA's BMDS v.2.1.1 was used to determine dose-response continuous data. 2. There are four Maximum Likelihood tests performed by BMDS that test the null hypothesis that the model fits the data as well as the "true" model.
Test 1. Tests the hypothesis that response and variance don't differ among dose levels. If this test accepts, there may not be a dose-response. P-values less than 0.1 indicate a model fit.
Test 2. Tests the hypothesis that variances are homogeneous. If this test accepts, the simpler constant variance model may be appropriate. P-values less than 0.1 indicate a model fit.
Test 3. (non-constant variance model) Test the hypothesis that the variances are adequately modeled. If this test accepts, it may be appropriate to conclude that the variances have been modeled appropriately.
Test 4. (non-constant variance model). Tests the hypothesis that the model for the mean fits the data. If this tests accepts, the user has support for the selected model. P-values greater than 0.1 indicate a model fit.
3. For each dataset, models with relatively low AIC are indicative of better fits. 4. A scaled residual is the difference between the observed and predicted effect (i.e., percent response) divided by the standard deviation. Scaled Residual of Interest is a summary output parameter of the BMDS model, while the Maximum Scaled Residual is the maximum of the scaled residuals of each of the individual dose groups. Absolute value less than 2.0 is indicative of a good fit. Values in bold are >2.0. 5. For multidose continuous data, the BMR used in estimating the point of departure was a change of 1 standard deviation (1 SD) from the control mean.
References
Mass, M.J., A. Abu-Shakra, B.C. Roop et al. 1996. Benzo[b]fluoranthene: tumorigenicity in strain A/J mouse lungs, DNA adducts and mutations in the Ki-ras oncogene. Carcinogenesis 17:1701–1704.

4 4 4 4 4 4 4
5 5 5 5 5 5 5
4 4 4
A: Hill_Mass93_BaP_Cont_Hill B: Exponential2_Mass93_BaP_Cont_ExpHill Model with 0.95 Confidence LevelHill Model with 0.95 Confidence LevelHill Model with 0.95 Confidence LevelHill Model with 0.95 Confidence LevelHill Model with 0.95 Confidence LevelHill Model with 0.95 Confidence LevelHill Model with 0.95 Confidence LevelHill Model with 0.95 Confidence Level Exponential Model 2 with 0.95 Confidence LevelExponential Model 2 with 0.95 Confidence LevelExponential Model 2 with 0.95 Confidence LevelExponential Model 2 with 0.95 Confidence LevelExponential Model 2 with 0.95 Confidence LevelExponential Model 2 with 0.95 Confidence LevelExponential Model 2 with 0.95 Confidence LevelExponential Model 2 with 0.95 Confidence Level
88888888HillHillHillHillHillHillHillHill
88888888ExponentialExponentialExponentialExponentialExponentialExponentialExponentialExponential
77777777 77777777
6666666 6666666
Mea
n R
espo
nse
Mea
n R
espo
nse
Mea
n R
espo
nse
Mea
n R
espo
nse
Mea
n R
espo
nse
Mea
n R
espo
nse
Mea
n R
espo
nse 5555555
4444444
3333333 3333333
222222 222222
111111 111111
000000
000000
17:03 04/13 201017:03 04/13 201017:03 04/13 201017:03 04/13 201017:03 04/13 2010
202020202020
BMDLBMDLBMDLBMDLBMDLBMDL
404040404040dosedosedosedosedose
BMDBMDBMDBMDBMDBMD
606060606060 808080808080 100100100100100100
000000
000000
17:03 04/13 201017:03 04/13 201017:03 04/13 201017:03 04/13 201017:03 04/13 2010
202020202020 404040404040dosedosedosedosedose
BMDLBMDLBMDLBMDLBMDLBMDL
606060606060
BMDBMDBMDBMDBMDBMD
808080808080 100100100100100100
C: Exponential3_Mass93_BaP_Cont_Exp
8888
Exponential Model 3 with 0.95 Confidence LevelExponential Model 3 with 0.95 Confidence LevelExponential Model 3 with 0.95 Confidence LevelExponential Model 3 with 0.95 Confidence LevelExponential Model 3 with 0.95 Confidence Level
ExponentialExponentialExponentialExponentialExponential
D: Exponential4_Mass93_BaP_Cont_Exp
8888
Exponential Model 4 with 0.95 Confidence LevelExponential Model 4 with 0.95 Confidence LevelExponential Model 4 with 0.95 Confidence LevelExponential Model 4 with 0.95 Confidence LevelExponential Model 4 with 0.95 Confidence Level
ExponentialExponentialExponentialExponentialExponential
7777 7777
6666 6666
5555
Mea
n R
espo
nse
Mea
n R
espo
nse
Mea
n R
espo
nsee 5555
444
333 333
222 222
11 11
00
00
17:03 04/13 201017:03 04/13 2010
2020 4040
BMDLBMDL
dosedose
BMDBMD
6060 8080 100100
00
00
17:03 04/13 201017:03 04/13 2010
BMDLBMDL
2020
BMDBMD
4040dosedose
6060 8080 100100
MMMea
n R
espo
nse
ean
Res
pons
eea
n R
espo
nsee
MMMMMMMea
n R
espo
nse
ean
Res
pons
eea
n R
espo
nse
ean
Res
pons
eea
n R
espo
nse
ean
Res
pons
eea
n R
espo
nse

4 4 4 4 4 4
5 5 5 5 5 5
4 4
5 5 5
E: Exponential5_Mass93_BaP_Cont_Exp F: Linear_Mass93_BaP_Cont_Lin Exponential Model 5 with 0.95 Confidence LevelExponential Model 5 with 0.95 Confidence LevelExponential Model 5 with 0.95 Confidence LevelExponential Model 5 with 0.95 Confidence LevelExponential Model 5 with 0.95 Confidence LevelExponential Model 5 with 0.95 Confidence LevelExponential Model 5 with 0.95 Confidence Level Linear Model with 0.95 Confidence LevelLinear Model with 0.95 Confidence LevelLinear Model with 0.95 Confidence LevelLinear Model with 0.95 Confidence LevelLinear Model with 0.95 Confidence LevelLinear Model with 0.95 Confidence LevelLinear Model with 0.95 Confidence Level
8888888ExponentialExponentialExponentialExponentialExponentialExponentialExponential
8888888LinearLinearLinearLinearLinearLinearLinear
BMD Lower BoundBMD Lower BoundBMD Lower BoundBMD Lower BoundBMD Lower BoundBMD Lower BoundBMD Lower Bound
7777777 7777777
666666 666666
Mea
n R
espo
nse
Mea
n R
espo
nse
Mea
n R
espo
nse
Mea
n R
espo
nse
Mea
n R
espo
nse
Mea
n R
espo
nse 555555
444444
333333 333333
22222 22222
11111 11111
00000
00000
17:03 04/13 201017:03 04/13 201017:03 04/13 201017:03 04/13 2010
2020202020
BMDLBMDLBMDLBMDLBMDL
4040404040dosedosedosedose
BMDBMDBMDBMDBMD
6060606060 8080808080 100100100100100
00000
00000
17:03 04/13 201017:03 04/13 201017:03 04/13 201017:03 04/13 2010
2020202020
BMDLBMDLBMDLBMDLBMDL
4040404040
BMDBMDBMDBMDBMD
dosedosedosedose 6060606060 8080808080 100100100100100
G: Polynomial_Mass93_BaP_Cont_Poly
888
Polynomial Model with 0.95 Confidence LevelPolynomial Model with 0.95 Confidence LevelPolynomial Model with 0.95 Confidence LevelPolynomial Model with 0.95 Confidence Level
PolynomialPolynomialPolynomial BMD Lower BoundBMD Lower BoundBMD Lower Bound
H: Power_Mass93_BaP_Cont_Pow
777
Power Model with 0.95 Confidence LevelPower Model with 0.95 Confidence LevelPower Model with 0.95 Confidence LevelPower Model with 0.95 Confidence Level
PowerPowerPower
777 666
666 555
Mea
n R
espo
nse
Mea
n R
espo
nsese
44
33
22
22 1
1
0
0 BMDL BMD BMDL BMD
0 20 40 60 80 100 0 20 40 60 80 100
dose dose 17:03 04/13 2010 17:03 04/13 2010
seMM
ean
Res
pons
eea
n R
espo
nse
MMMMMMea
n R
espo
nse
ean
Res
pons
eea
n R
espo
nse
ean
Res
pons
eea
n R
espo
nse
ean
Res
pons
e
3 3

Table C-2. Mass et al. (1993), benz[j]aceanthrylene, A/J mouse. Continuous dose-response goodness-of-fit tests and benchmark dose estimates at 10% effect levels applied to study results. (6)
Source Substance
Effect Endpoint Continuous
Dose-Response Model (1)
Goodness-of-Fit POD
Benchmark Response (BMR) (5)
Dose (mg/kg)
Notes
p-value for Maximum Likelihood Tests (2)
AIC (3)
Residuals (4)
Animal Tissue Test 1 Test 2 Test 3 Test 4
Scaled Residual of
Interest
Maximum Scaled
Residual BMD BMDL
Busby, 1984 without highest dose (100 mg/kg) BjA A/J Mice lung tumors Hill 1 SD Hill model not applicable
Busby, 1984 without highest dose (100 mg/kg) BjA A/J Mice lung tumors Exponential 2 < 0.0001 < 0.0001 < 0.0001 < 0.0001 412 4.5 4.5 1 SD 18.4 16.4
Busby, 1984 without highest dose (100 mg/kg) BjA A/J Mice lung tumors Exponential 3 < 0.0001 < 0.0001 < 0.0001 < 0.0001 412 4.0E-08 4.5 1 SD 18.4 16.4
Busby, 1984 without highest dose (100 mg/kg) BjA A/J Mice lung tumors Exponential 4 < 0.0001 < 0.0001 < 0.0001 N/A 356 1.6E-08 -1.2E-07 1 SD 3.8 3.1 Best Fit: Exponential 4 model has lowest max scaled
residuals and low AIC
Busby, 1984 without highest dose (100 mg/kg) BjA A/J Mice lung tumors Exponential 5 < 0.0001 < 0.0001 < 0.0001 N/A 524 0.83 3.9 1 SD 17.1 9.2
Busby, 1984 without highest dose (100 mg/kg) BjA A/J Mice lung tumors Linear <.0001 <.0001 <.0001 3.5E-01 355 -1.7E-13 0.83 1 SD 4.2 3.6 Acceptable Fit
Busby, 1984 without highest dose (100 mg/kg) BjA A/J Mice lung tumors Polynomial <.0001 <.0001 <.0001 NA 356 -0.30 -1.3E-12 1 SD 3.8 3.1 Best Fit: Polynomial model has lowest max scaled
residuals and low AIC
Busby, 1984 without highest dose (100 mg/kg) BjA A/J Mice lung tumors Power <.0001 <.0001 <.0001 3.5E-01 355 0 0.83 1 SD 4.2 3.6 Acceptable Fit
Abbreviations AIC = Akaike's Information Criterion POD = point of departure BMD = benchmark dose BMDL = 1-sided 95% lower confidence limit for the benchmark dose
Notes 1. USEPA's BMDS v.2.1.1 was used to determine dose-response continuous data. 2. There are four Maximum Likelihood tests performed by BMDS that test the null hypothesis that the model fits the data as well as the "true" model.
Test 1. Tests the hypothesis that response and variance don't differ among dose levels. If this test accepts, there may not be a dose-response. P-values less than 0.1 indicate a model fit.
Test 2. Tests the hypothesis that variances are homogeneous. If this test accepts, the simpler constant variance model may be appropriate. P-values less than 0.1 indicate a model fit.
Test 3. (non-constant variance model) Test the hypothesis that the variances are adequately modeled. If this test accepts, it may be appropriate to conclude that the variances have been modeled appropriately.
Test 4. (non-constant variance model). Tests the hypothesis that the model for the mean fits the data. If this tests accepts, the user has support for the selected model. P-values greater than 0.1 indicate a model fit.
3. For each dataset, models with relatively low AIC are indicative of better fits. 4. A scaled residual is the difference between the observed and predicted effect (i.e., percent response) divided by the standard deviation. Scaled Residual of Interest is a summary output parameter of the BMDS model, while the Maximum Scaled Residual is the maximum of the scaled residuals of each of the individual dose groups. Absolute value less than 2.0 is indicative of a good fit. Values in bold are >2.0.
5. For multidose continuous data, the BMR used in estimating the point of departure was a change of 1 standard deviation (1 SD) from the control mean. 6. Highest dose level of 100 mg/kg was omitted.
References
Mass, M.J., A. Abu-Shakra, B.C. Roop et al. 1996. Benzo[b]fluoranthene: tumorigenicity in strain A/J mouse lungs, DNA adducts and mutations in the Ki-ras oncogene. Carcinogenesis 17:1701–1704.

60 60 60 60 60 60 60
80 80 80 80 80 80 80
100 100 100 100 100 100 100
60 60 60
80 80 80
100 100 100 100
A: Hill_Mass93_BjA_3doses_Cont_Hill B: Exponential2_Mass93_BjA_3doses_Cont_ExpHill Model with 0.95 Confidence LevelHill Model with 0.95 Confidence LevelHill Model with 0.95 Confidence LevelHill Model with 0.95 Confidence LevelHill Model with 0.95 Confidence LevelHill Model with 0.95 Confidence LevelHill Model with 0.95 Confidence LevelHill Model with 0.95 Confidence Level Exponential Model 2 with 0.95 Confidence LevelExponential Model 2 with 0.95 Confidence LevelExponential Model 2 with 0.95 Confidence LevelExponential Model 2 with 0.95 Confidence LevelExponential Model 2 with 0.95 Confidence LevelExponential Model 2 with 0.95 Confidence LevelExponential Model 2 with 0.95 Confidence LevelExponential Model 2 with 0.95 Confidence Level
160160160160160160160160HillHillHillHillHillHillHillHill
160160160160160160160160ExponentialExponentialExponentialExponentialExponentialExponentialExponentialExponential
140140140140140140140140 140140140140140140140140
120120120120120120120 120120120120120120120
Mea
n R
espo
nse
Mea
n R
espo
nse
Mea
n R
espo
nse
Mea
n R
espo
nse
Mea
n R
espo
nse
Mea
n R
espo
nse
Mea
n R
espo
nse 100100100100100100100
80808080808080
60606060606060
202020202020
404040404040
202020202020
404040404040
000000
000000
17:20 04/13 201017:20 04/13 201017:20 04/13 201017:20 04/13 201017:20 04/13 2010
BMDLBMDLBMDLBMDLBMDLBMDL
202020202020
BMDBMDBMDBMDBMDBMD
404040404040dosedosedosedosedose
606060606060 808080808080 100100100100100100
000000
000000
17:20 04/13 201017:20 04/13 201017:20 04/13 201017:20 04/13 201017:20 04/13 2010
101010101010
BMDLBMDLBMDLBMDLBMDLBMDL
202020202020
BMDBMDBMDBMDBMDBMD
dosedosedosedosedose
303030303030 404040404040 505050505050
C: Exponential3_Mass93_BjA_3doses_Cont_Exp
160160160160
Exponential Model 3 with 0.95 Confidence LevelExponential Model 3 with 0.95 Confidence LevelExponential Model 3 with 0.95 Confidence LevelExponential Model 3 with 0.95 Confidence LevelExponential Model 3 with 0.95 Confidence Level
ExponentialExponentialExponentialExponentialExponential
D: Exponential4_Mass93_BjA_3doses_Cont_Exp
160160160160
Exponential Model 4 with 0.95 Confidence LevelExponential Model 4 with 0.95 Confidence LevelExponential Model 4 with 0.95 Confidence LevelExponential Model 4 with 0.95 Confidence LevelExponential Model 4 with 0.95 Confidence Level
ExponentialExponentialExponentialExponentialExponential
140140140140 140140140140
120120120120 120120120120
Mea
n R
espo
nse
Mea
n R
espo
nse
Mea
n R
espo
nsee 100100100100
808080
606060
404040 404040
202020 202020
00 00BMDLBMDL BMDBMD BMDBMDLBMDL BMD
00 1010 2020 3030 4040 5050 00 1010 2020 3030 4040 5050 dosedose dosedose
17:20 04/13 201017:20 04/13 2010 17:20 04/13 201017:20 04/13 2010
MMMea
n R
espo
nse
ean
Res
pons
eea
n R
espo
nsee
MMMMMMMea
n R
espo
nse
ean
Res
pons
eea
n R
espo
nse
ean
Res
pons
eea
n R
espo
nse
ean
Res
pons
eea
n R
espo
nse

60 60 60 60 60 60
80 80 80 80 80 80
100 100 100 100 100 100
60 60
80 80
100 100 100
E: Exponential5_Mass93_BjA_3doses_Cont_Exp F: Linear_Mass93_BjA_3doses_Cont_Lin Exponential Model 5 with 0.95 Confidence LevelExponential Model 5 with 0.95 Confidence LevelExponential Model 5 with 0.95 Confidence LevelExponential Model 5 with 0.95 Confidence LevelExponential Model 5 with 0.95 Confidence LevelExponential Model 5 with 0.95 Confidence LevelExponential Model 5 with 0.95 Confidence Level Linear Model with 0.95 Confidence LevelLinear Model with 0.95 Confidence LevelLinear Model with 0.95 Confidence LevelLinear Model with 0.95 Confidence LevelLinear Model with 0.95 Confidence LevelLinear Model with 0.95 Confidence LevelLinear Model with 0.95 Confidence Level
ExponentialExponentialExponentialExponentialExponentialExponentialExponential LinearLinearLinearLinearLinearLinearLinear160160160160160160160 160160160160160160160 BMD Lower BoundBMD Lower BoundBMD Lower BoundBMD Lower BoundBMD Lower BoundBMD Lower BoundBMD Lower Bound
140140140140140140140 140140140140140140140
120120120120120120120 120120120120120120120
seMM
ean
Res
pons
eea
n R
espo
nse
MMMMMMea
n R
espo
nse
ean
Res
pons
eea
n R
espo
nse
ean
Res
pons
eea
n R
espo
nse
ean
Res
pons
e
Mea
n R
espo
nse
Mea
n R
espo
nse
Mea
n R
espo
nse
Mea
n R
espo
nse
Mea
n R
espo
nse
Mea
n R
espo
nse 100100100100100100
808080808080
606060606060
4040404040 4040404040
2020202020 2020202020
00000 00000BMDBMDBMDBMDBMDBMDLBMDLBMDLBMDLBMDL BMDBMDL BMDBMDLBMDLBMDLBMDL BMDBMDBMD
00000 2020202020 4040404040 6060606060 8080808080 100100100100100 00000 1010101010 2020202020 3030303030 4040404040 5050505050 dosedosedosedose dosedosedosedose
17:20 04/13 201017:20 04/13 201017:20 04/13 201017:20 04/13 2010 17:20 04/13 201017:20 04/13 201017:20 04/13 201017:20 04/13 2010
G: Polynomial_Mass93_BjA_3doses_Cont_Poly H: Power_Mass93_BjA_3doses_Cont_PowPolynomial Model with 0.95 Confidence LevelPolynomial Model with 0.95 Confidence LevelPolynomial Model with 0.95 Confidence LevelPolynomial Model with 0.95 Confidence Level Power Model with 0.95 Confidence LevelPower Model with 0.95 Confidence LevelPower Model with 0.95 Confidence LevelPower Model with 0.95 Confidence Level
160160160PolynomialPolynomialPolynomial
BMD Lower BoundBMD Lower BoundBMD Lower Bound 160160160 PowerPowerPower
140140140 140140140
120120120 120120120
100100100M
ean
Res
pons
eM
ean
Res
pons
ese
8080
6060
4040 4040
0
20
BMDL BMD
0
20
BMDL BMD
0 10 20 30 40 50 0 10 20 30 40 50
dose dose 17:20 04/13 2010 17:20 04/13 2010

Table C-3. Nesnow et al. (1984), benz[l]aceanthrylene, male mice. Dichotomous dose-response goodness-of-fit tests and benchmark dose estimates at 10% and 67% effect levels applied to study results. (5)
Source Substance
Effect Endpoint Dichotomous Dose-Response
Model (1)
Goodness-of-Fit
POD (% Effect)
Dose (nmol) Alternative
POD (% Effect)
Dose (nmol)
Notes
p-value for Chi-Square
Test (2) AIC (3)
Residuals (4)
Animal Tissue
Scaled Residual of
Interest
Maximum Scaled
Residual BMD BMDL BMD BMDL Nesnow, 1984 without highest
dose (1000 nmol) BlAC male mouse Papilloma Gamma 1.0 39 0 0.030 10% 17.0 3.6 67% 56 38 Acceptable Fit
Nesnow, 1984 without highest
dose (1000 nmol) BlAC male mouse Papilloma Logistic 0.59 41 -0.80 -1.0 10% 21.2 13.0 67% 58 49 Acceptable Fit
Nesnow, 1984 without highest
dose (1000 nmol) BlAC male mouse Papilloma LogLogistic 1.0 39 0 0.21 10% 24.4 8.7 67% 55 41 Acceptable Fit
Nesnow, 1984 without highest
dose (1000 nmol) BlAC male mouse Papilloma LogProbit 1.0 39 0 0.093 10% 22.5 7.2 67% 55 40 Acceptable Fit
Nesnow, 1984 without highest
dose (1000 nmol) BlAC male mouse Papilloma Multistage 1.0 39 0 0.0030 10% 10.2 3.6 67% 56 38 Acceptable Fit
Nesnow, 1984 without highest
dose (1000 nmol) BlAC male mouse Papilloma Multistage-Cancer 1.0 39 0 0.0030 10% 10.2 3.6 67% 56 38
Best Fit: Multi-Stage model has the lowest maxmimum scaled residual, low AIC, and highest p-value
Nesnow, 1984 without highest
dose (1000 nmol) BlAC male mouse Papilloma Probit 0.57 41 -0.78 -0.89 10% 19.4 12.3 67% 61 52 Acceptable Fit
Nesnow, 1984 without highest
dose (1000 nmol) BlAC male mouse Papilloma Weibull 1.0 39 0 0.0080 10% 13.3 3.6 67% 56 38 Acceptable Fit
Nesnow, 1984 without highest
dose (1000 nmol) BlAC male mouse Papilloma Quantal-Linear 0.91 38 0 -0.71 10% 4.7 3.4 67% 49 35 Acceptable Fit
Abbreviations AIC = Akaike's Information Criterion POD = point of departure BMD = benchmark dose BMDL = 1-sided 95% lower confidence limit for the benchmark dose
Notes 1. USEPA's BMDS v.2.1.1 was used to determine dose-response dichotomous data. 2. Chi-square test is a hypothesis test in which the null hypothesis is that data fit the dose-response function. Higher p-values indicate better fits. 3. For each dataset, models with relatively low AIC are indicative of better fits. 4. A scaled residual is the difference between the observed and predicted effect (i.e., percent response) divided by the standard deviation. Scaled Residual of Interest is a summary output parameter of the BMDS model, while the Maximum Scaled Residual is the maximum of the scaled residuals of each of the individual dose groups. Absolute value less than 2.0 is indicative of a good fit. Values in bold are >2.0. 5. Highest dose of 1000 nmol was omitted.
References
Nesnow, S., A. Gold, R. Sangaiah et al. 1984. Mouse skin tumor-initiating activity of benz[e]aceanthrylene and benz[l]aceanthrylene in Sencar mice. Cancer Lett 22:263–268.

A A
0.2 0.2 0.2 0.2 0.2
0.4 0.4 0.4 0.4 0.4
0.6 0.6 0.6 0.6 0.6 0.6
0.4 0.4
0.6 0.6 0.6
A: Gamma_Nesnow84_BAIC_M_5doses_Dich_Gamma67 B: Logistic_Nesnow84_BAIC_M_5doses_Dich_Logist67 Gamma Multi-Hit Model with 0.95 Confidence LevelGamma Multi-Hit Model with 0.95 Confidence LevelGamma Multi-Hit Model with 0.95 Confidence LevelGamma Multi-Hit Model with 0.95 Confidence LevelGamma Multi-Hit Model with 0.95 Confidence LevelGamma Multi-Hit Model with 0.95 Confidence LevelGamma Multi-Hit Model with 0.95 Confidence Level Logistic Model with 0.95 Confidence LevelLogistic Model with 0.95 Confidence LevelLogistic Model with 0.95 Confidence LevelLogistic Model with 0.95 Confidence LevelLogistic Model with 0.95 Confidence LevelLogistic Model with 0.95 Confidence LevelLogistic Model with 0.95 Confidence Level
Gamma Multi-HitGamma Multi-HitGamma Multi-HitGamma Multi-HitGamma Multi-HitGamma Multi-HitGamma Multi-Hit LogisticLogisticLogisticLogisticLogisticLogisticLogistic BMD Lower BoundBMD Lower BoundBMD Lower BoundBMD Lower BoundBMD Lower BoundBMD Lower BoundBMD Lower Bound BMD Lower BoundBMD Lower BoundBMD Lower BoundBMD Lower BoundBMD Lower BoundBMD Lower BoundBMD Lower Bound
1111111 1111111
0.80.80.80.80.80.8 0.80.80.80.80.80.8
ffe
cte
dF
rac
Fra
cF
rac
Fra
cF
ract
ititititiff
ec
on
Aff
ec
on
Ao
n A
on
Ao
n A
ffe
cff
ec
ffe
cff
ectttttt
ed
ed
ed
ed
ed
ed
on
AF
rac
Fra
ctitio
n A
on
Aff
ec
ffe
ctte
de
d
00000BMDLBMDLBMDLBMDLBMDL BMDBMDBMDBMDBMD
0000 100100100100 200200200200 300300300300 400400400400 500500500500 dosedosedosedose
17:42 04/14 201017:42 04/14 201017:42 04/14 201017:42 04/14 2010
C: LogLogistic_Nesnow84_BAIC_M_5doses_Dich_LogLogist67 Log-Logistic Model with 0.95 Confidence LevelLog-Logistic Model with 0.95 Confidence LevelLog-Logistic Model with 0.95 Confidence LevelLog-Logistic Model with 0.95 Confidence Level
Log-LogisticLog-LogisticLog-LogisticLog-Logistic
111
0.80.80.8
ff
ect
ed
Fra
cF
rac
Fra
cF
rac
Fra
ctititititi
ffe
co
n A
ffe
co
n A
on
Ao
n A
on
Aff
ec
ffe
cff
ec
ffe
ctttttte
de
de
de
de
de
do
n A
Fra
cF
ract
ition
Ao
n A
ffe
cff
ectt
ed
ed
0.60.60.60.60.60.6
0.40.40.40.40.4
0.20.20.20.20.2
00000BMDLBMDLBMDLBMDLBMDL BMDBMDBMDBMDBMD
0000 100100100100 200200200200 300300300300 400400400400 500500500500 dosedosedosedose
17:42 04/14 201017:42 04/14 201017:42 04/14 201017:42 04/14 2010
D: LogProbit_Nesnow84_BAIC_M_5doses_Dich_LogProb67LogProbit Model with 0.95 Confidence LevelLogProbit Model with 0.95 Confidence LevelLogProbit Model with 0.95 Confidence LevelLogProbit Model with 0.95 Confidence Level
LogProbitLogProbitLogProbitLogProbit BMD Lower BoundBMD Lower BoundBMD Lower Bound
111
0.80.80.8
0.60.60.6
0.40.4
0.20.2 0.20.2
00
17:42 04/14 2010
0
BMDL
100
BMD
200
dose 300 400 500
00
17:42 04/14 2010
0
BMDL
100
BMD
200
dose 300 400 500

0.2 0.2 0.2 0.2 0.2
0.4 0.4 0.4 0.4 0.4
0.6 0.6 0.6 0.6 0.6 0.6
0.4 0.4
0.6 0.6 0.6
E: Multistage_Nesnow84_BAIC_M_5doses_Dich_Multi67 F: Multistage-Cancer_Nesnow84_BAIC_M_5doses_Dich_MultiCanc67Multistage Model with 0.95 Confidence LevelMultistage Model with 0.95 Confidence LevelMultistage Model with 0.95 Confidence LevelMultistage Model with 0.95 Confidence LevelMultistage Model with 0.95 Confidence LevelMultistage Model with 0.95 Confidence LevelMultistage Model with 0.95 Confidence Level Multistage Cancer Model with 0.95 Confidence LevelMultistage Cancer Model with 0.95 Confidence LevelMultistage Cancer Model with 0.95 Confidence LevelMultistage Cancer Model with 0.95 Confidence LevelMultistage Cancer Model with 0.95 Confidence LevelMultistage Cancer Model with 0.95 Confidence LevelMultistage Cancer Model with 0.95 Confidence Level
MultistageMultistageMultistageMultistageMultistageMultistageMultistage Multistage CancerMultistage CancerMultistage CancerMultistage CancerMultistage CancerMultistage CancerMultistage Cancer BMD Lower BoundBMD Lower BoundBMD Lower BoundBMD Lower BoundBMD Lower BoundBMD Lower BoundBMD Lower Bound Linear extrapolationLinear extrapolationLinear extrapolationLinear extrapolationLinear extrapolationLinear extrapolationLinear extrapolation
1111111 1111111 BMD Lower BoundBMD Lower BoundBMD Lower BoundBMD Lower BoundBMD Lower BoundBMD Lower BoundBMD Lower Bound
0.80.80.80.80.80.8 0.80.80.80.80.80.8
Aff
ect
ed
Fra
cF
rac
Fra
cF
rac
Fra
co
n A
tion
Atitititio
n A
on
Ao
n A
on
Aff
ec
ffe
cff
ec
ffe
cff
ec
ffe
ctttttte
de
de
de
de
de
dF
rac
Fra
ctitio
n A
on
Aff
ec
ffe
ctte
de
d
00000BMDLBMDLBMDLBMDLBMDL BMDBMDBMDBMDBMD
0000 100100100100 200200200200 300300300300 400400400400 500500500500 dosedosedosedose
17:42 04/14 201017:42 04/14 201017:42 04/14 201017:42 04/14 2010
G: Probit_Nesnow84_BAIC_M_5doses_Dich_Probit67 Probit Model with 0.95 Confidence LevelProbit Model with 0.95 Confidence LevelProbit Model with 0.95 Confidence LevelProbit Model with 0.95 Confidence Level
ProbitProbitProbit BMD Lower BoundBMD Lower BoundBMD Lower Bound
111
0.80.80.8
A
ffe
cte
dF
rac
Fra
cF
rac
Fra
cF
rac
on
Atio
n A
tititition
Ao
n A
on
Ao
n A
ffe
cff
ec
ffe
cff
ec
ffe
cff
ectttttt
ed
ed
ed
ed
ed
ed
Fra
cF
ract
ition
Ao
n A
ffe
cff
ectt
ed
ed
0.60.60.60.60.60.6
0.40.40.40.40.4
0.20.20.20.20.2
00000BMDLBMDLBMDLBMDLBMDL BMDBMDBMDBMDBMD
0000 100100100100 200200200200 300300300300 400400400400 500500500500 dosedosedosedose
17:42 04/14 201017:42 04/14 201017:42 04/14 201017:42 04/14 2010
H: Weibull_Nesnow84_BAIC_M_5doses_Dich_Weibull67Weibull Model with 0.95 Confidence LevelWeibull Model with 0.95 Confidence LevelWeibull Model with 0.95 Confidence LevelWeibull Model with 0.95 Confidence Level
WeibullWeibullWeibull BMD Lower BoundBMD Lower BoundBMD Lower Bound
111
0.80.80.8
0.60.60.6
0.40.4
0.20.2
00 00BMDL BMD BMDL BMD
0 100 200 300 400 500 0 100 200 300 400 500
dose dose 17:42 04/14 2010 17:42 04/14 2010
0.2 0.2

I: Quantal-Linear_Nesnow84_BAIC_M_5doses_Dich_QntLin67Quantal Linear Model with 0.95 Confidence LevelQuantal Linear Model with 0.95 Confidence LevelQuantal Linear Model with 0.95 Confidence Level
0.8
1
Quantal LinearBMD Lower Bound
0.2
0.4
0.6
0.8
1
Fra
ctio
n A
ffe
cte
d
Quantal LinearBMD Lower Bound
0
0.2
0.4
0.6
0.8
1
Fra
ctio
n A
ffe
cte
d
BMDL BMD
Quantal Linear BMD Lower Bound
0 100 200 300 400 500
dose 17:42 04/14 2010

Table C-4. Nesnow et al. (1984), benz[l]aceanthrylene, female mice. Dichotomous dose-response goodness-of-fit tests and benchmark dose estimates at 10% and 51% effect levels applied to study results.
Source Substance
Effect Endpoint Dichotomous Dose-Response
Model (1)
Goodness-of-Fit
POD (% Effect)
Dose (nmol) Alternative
POD (% Effect)
Dose (nmol)
Notes
p-value for Chi-Square
Test (2) AIC (3)
Residuals (4)
Animal Tissue
Scaled Residual of
Interest
Maximum Scaled
Residual BMD BMDL BMD BMDL Nesnow,
1984 BlAC female mouse Papilloma Gamma 0 80 -0.61 -5.1 10% 8.4 6.2 51% 56.9 42.1
Nesnow, 1984 BlAC female
mouse Papilloma Logistic 0 91 -2.85 -3.9 10% 20.5 14.8 51% 104 75.3
Nesnow, 1984 BlAC female
mouse Papilloma LogLogistic 0.41 72 0.0080 1.3 10% 3.9 1.2 51% 26.2 11.6 Acceptable Fit: LogLogistic model has the lowest maxmimum scaled residuals, lowest AIC, and highest p-value
Nesnow, 1984 BlAC female
mouse Papilloma LogProbit 0.025 74 -0.12 -2.5 10% 11.3 8.0 51% 41.9 29.7
Nesnow, 1984 BlAC female
mouse Papilloma Multistage 0 80 -0.61 -5.1 10% 8.4 6.2 51% 56.9 42.1
Nesnow, 1984 BlAC female
mouse Papilloma Multistage-Cancer 0 80 -0.61 -5.1 10% 8.4 6.2 51% 56.9 42.1
Nesnow, 1984 BlAC female
mouse Papilloma Probit 0 95 1.0 -3.3 10% 26.1 19.8 51% 138 105
Nesnow, 1984 BlAC female
mouse Papilloma Weibull 0 80 -0.61 -5.1 10% 8.4 6.2 51% 56.9 42.1
Nesnow, 1984 BlAC female
mouse Papilloma Quantal-Linear 0 80 -0.61 -5.1 10% 8.4 6.2 51% 56.9 42.1
Abbreviations AIC = Akaike's Information Criterion POD = point of departure BMD = benchmark dose BMDL = 1-sided 95% lower confidence limit for the benchmark dose
Notes 1. USEPA's BMDS v.2.1.1 was used to determine dose-response dichotomous data. 2. Chi-square test is a hypothesis test in which the null hypothesis is that data fit the dose-response function. Higher p-values indicate better fits. 3. For each dataset, models with relatively low AIC are indicative of better fits. 4. A scaled residual is the difference between the observed and predicted effect (i.e., percent response) divided by the standard deviation. Scaled Residual of Interest is a summary output parameter of the BMDS model, while the Maximum Scaled Residual is the maximum of the scaled residuals of each of the individual dose groups. Absolute value less than 2.0 is indicative of a good fit. Values in bold are >2.0.
R fReferences
Nesnow, S., A. Gold, R. Sangaiah et al. 1984. Mouse skin tumor-initiating activity of benz[e]aceanthrylene and benz[l]aceanthrylene in Sencar mice. Cancer Lett 22:263–268.

0.4 0.4 0.4 0.4 0.4 0.4
0.4 0.4
0.6 0.6
A: Gamma_Nesnow84_BAIC_F_Dich_Gamma51 B: Logistic_Nesnow84_BAIC_F_Dich_Logist51Gamma Multi-Hit Model with 0.95 Confidence LevelGamma Multi-Hit Model with 0.95 Confidence LevelGamma Multi-Hit Model with 0.95 Confidence LevelGamma Multi-Hit Model with 0.95 Confidence LevelGamma Multi-Hit Model with 0.95 Confidence LevelGamma Multi-Hit Model with 0.95 Confidence LevelGamma Multi-Hit Model with 0.95 Confidence Level Logistic Model with 0.95 Confidence LevelLogistic Model with 0.95 Confidence LevelLogistic Model with 0.95 Confidence LevelLogistic Model with 0.95 Confidence LevelLogistic Model with 0.95 Confidence LevelLogistic Model with 0.95 Confidence LevelLogistic Model with 0.95 Confidence Level
Gamma Multi-HitGamma Multi-HitGamma Multi-HitGamma Multi-HitGamma Multi-HitGamma Multi-HitGamma Multi-Hit LogisticLogisticLogisticLogisticLogisticLogisticLogistic BMD Lower BoundBMD Lower BoundBMD Lower BoundBMD Lower BoundBMD Lower BoundBMD Lower BoundBMD Lower Bound BMD Lower BoundBMD Lower BoundBMD Lower BoundBMD Lower BoundBMD Lower BoundBMD Lower BoundBMD Lower Bound
1111111 1111111
0.80.80.80.80.80.8 0.80.80.80.80.80.8
ed
r
Fr
FFFFrrrra
cta
cta
cta
cta
cta
ctiiiiiio
n A
fo
n A
fo
n A
fo
n A
fo
n A
fo
n A
fffffffeeeeee
ctctctctctcte
de
de
de
de
de
dFF
rract
act
iion
Af
on
Afffee
ctcte
de
d
0.60.60.60.60.60.6
0.20.20.20.20.2
00000BMDLBMDLBMDLBMDLBMDL BMDBMDBMDBMDBMD
00000 200200200200200 400400400400400 600600600600600 800800800800800 10001000100010001000 dosedosedosedose
17:47 04/14 201017:47 04/14 201017:47 04/14 201017:47 04/14 2010
C: LogLogistic_Nesnow84_BAIC_F_Dich_LogLogist51 Log-Logistic Model with 0.95 Confidence LevelLog-Logistic Model with 0.95 Confidence LevelLog-Logistic Model with 0.95 Confidence LevelLog-Logistic Model with 0.95 Confidence Level
Log-LogisticLog-LogisticLog-Logistic
111
0.80.80.8
ed
rF
rFFFF
rrrract
act
act
act
act
act
iiiiiion
Af
on
Af
on
Af
on
Af
on
Af
on
Afffffffeeeeee
ctctctctctcte
de
de
de
de
de
dFF
rract
act
iion
Af
on
Afffee
ctcte
de
d
0.60.60.60.60.60.6
0.40.40.40.40.40.4
0.20.20.20.20.2
00000BMDLBMDLBMDLBMDLBMDL BMDBMDBMDBMDBMD
00000 200200200200200 400400400400400 600600600600600 800800800800800 10001000100010001000 dosedosedosedose
17:47 04/14 201017:47 04/14 201017:47 04/14 201017:47 04/14 2010
D: LogProbit_Nesnow84_BAIC_F_Dich_LogProb51LogProbit Model with 0.95 Confidence LevelLogProbit Model with 0.95 Confidence LevelLogProbit Model with 0.95 Confidence LevelLogProbit Model with 0.95 Confidence Level
LogProbitLogProbitLogProbit BMD Lower BoundBMD Lower BoundBMD Lower Bound
111
0.80.80.8
0.60.6
0.40.4
0.20.2
0 0
BMDL BMD BMDL BMD
0 200 400 600 800 1000 0 200 400 600 800 1000
dose dose 17:47 04/14 2010 17:47 04/14 2010
0.2 0.2

0.4 0.4 0.4 0.4 0.4 0.4
0.4 0.4
0.6 0.6 0.6
E: Multistage_Nesnow84_BAIC_F_Dich_Multi51 F: Multistage-Cancer_Nesnow84_BAIC_F_Dich_MultiCanc51 Multistage Model with 0.95 Confidence LevelMultistage Model with 0.95 Confidence LevelMultistage Model with 0.95 Confidence LevelMultistage Model with 0.95 Confidence LevelMultistage Model with 0.95 Confidence LevelMultistage Model with 0.95 Confidence LevelMultistage Model with 0.95 Confidence Level Multistage Cancer Model with 0.95 Confidence LevelMultistage Cancer Model with 0.95 Confidence LevelMultistage Cancer Model with 0.95 Confidence LevelMultistage Cancer Model with 0.95 Confidence LevelMultistage Cancer Model with 0.95 Confidence LevelMultistage Cancer Model with 0.95 Confidence LevelMultistage Cancer Model with 0.95 Confidence Level
MultistageMultistageMultistageMultistageMultistageMultistageMultistage Multistage CancerMultistage CancerMultistage CancerMultistage CancerMultistage CancerMultistage CancerMultistage Cancer BMD Lower BoundBMD Lower BoundBMD Lower BoundBMD Lower BoundBMD Lower BoundBMD Lower BoundBMD Lower Bound Linear extrapolationLinear extrapolationLinear extrapolationLinear extrapolationLinear extrapolationLinear extrapolationLinear extrapolation
1111111 1111111 BMD Lower BoundBMD Lower BoundBMD Lower BoundBMD Lower BoundBMD Lower BoundBMD Lower BoundBMD Lower Bound
0.80.80.80.80.80.8 0.80.80.80.80.80.8
0.60.60.60.60.60.6
FFrra
cta
ctiio
n A
fo
n A
fffee
ctcte
de
d
Fra
ctio
n A
fA
ffe
cte
dFFFFF
rrrrract
act
act
act
act
iiiiif
on
Aff
on
Af
on
Af
on
Af
on
Afffffeeeeee
ctctctctctcte
de
de
de
de
de
d
0.60.60.60.60.60.6
0.40.40.40.40.40.4
0.20.20.20.20.2 0.20.20.20.20.2
00000 00000
BMDBMDL BMDBMDLBMDLBMDLBMDL BMDBMDBMD BMDBMDL BMDBMDLBMDLBMDLBMDL BMDBMDBMD
00000 200200200200200 400400400400400 600600600600600 800800800800800 10001000100010001000 00000 200200200200200 400400400400400 600600600600600 800800800800800 10001000100010001000 dosedosedosedose dosedosedosedose
17:47 04/14 201017:47 04/14 201017:47 04/14 201017:47 04/14 2010 17:47 04/14 201017:47 04/14 201017:47 04/14 201017:47 04/14 2010
G: Probit_Nesnow84_BAIC_F_Dich_Probit51 H: Weibull_Nesnow84_BAIC_F_Dich_Weibull51Probit Model with 0.95 Confidence LevelProbit Model with 0.95 Confidence LevelProbit Model with 0.95 Confidence LevelProbit Model with 0.95 Confidence Level Weibull Model with 0.95 Confidence LevelWeibull Model with 0.95 Confidence LevelWeibull Model with 0.95 Confidence LevelWeibull Model with 0.95 Confidence Level
ProbitProbitProbitProbit WeibullWeibullWeibullWeibull BMD Lower BoundBMD Lower BoundBMD Lower Bound BMD Lower BoundBMD Lower BoundBMD Lower Bound
111 111
0.80.80.8 0.80.80.8
0.60.60.6
0.40.4
0.20.2
FFrra
cta
ctiio
n A
fo
n A
fffee
ctcte
de
d
Fra
ctio
n A
fA
ffe
cte
dFFFFF
rrrrract
act
act
act
act
iiiiif
on
Aff
on
Af
on
Af
on
Af
on
Afffffeeeeee
ctctctctctcte
de
de
de
de
de
d
0 0
BMDL BMD BMDL BMD
0 200 400 600 800 1000 0 200 400 600 800 1000
dose dose 17:47 04/14 2010 17:47 04/14 2010
0.2 0.2

FFFrrra
cta
cta
ctiiio
n A
fo
n A
fo
n A
ffffeee
ctctcte
de
de
d
I: Quantal-LinearQuantal-Linear_Nesnow84Nesnow84_BAICBAIC_FF_DichDich_QntLin51QntLin51I: Quantal Linear Model with 0.95 Confidence LevelQuantal Linear Model with 0.95 Confidence LevelQuantal Linear Model with 0.95 Confidence LevelQuantal Linear Model with 0.95 Confidence Level
1111
0.80.80.80.8
0.60.60.6
0.40.40.4
0.20.20.2
00
dosedose 17:47 04/14 201017:47 04/14 2010
Quantal LinearBMD Lower Bound
Quantal LinearBMD Lower Bound
BMDL BMD
Quantal LinearBMD Lower Bound
BMDL BMD
Quantal Linear BMD Lower Bound
00 200200 400400 600600 800800 1000 1000

Table C-5. Nesnow et al. (1984), benz[e]aceanthrylene, male mice. Dichotomous dose-response goodness-of-fit tests and benchmark dose estimates at 10% and 67% effect levels applied to study results.
Source Substance
Effect Endpoint Dichotomous Dose-Response
Model (1)
Goodness-of-Fit
POD (% Effect)
Dose (nmol) Alternative
POD (% Effect)
Dose (nmol)
Notes
p-value for Chi-Square
Test (2) AIC (3)
Residuals (4)
Animal Tissue
Scaled Residual of
Interest
Maximum Scaled
Residual BMD BMDL BMD BMDL Nesnow,
1984 BeAC male mouse Papilloma Gamma 0.76 106 0.90 -0.93 10% 37.3 29.0 67% 393 306 Acceptable Fit
Nesnow, 1984 BeAC male mouse Papilloma Logistic 0.025 119 -0.36 -1.9 10% 105.8 81.7 67% 517 412
Nesnow, 1984 BeAC male mouse Papilloma LogLogistic 0.85 107 0.69 -0.89 10% 35.6 16.7 67% 357 257
Best Fit: LogLogistic model has the lowest maxmimum scaled residuals, low AIC, and highest p-value.
Nesnow, 1984 BeAC male mouse Papilloma LogProbit 0.33 110 1.68 1.7 10% 61.0 44.8 67% 341 251 Acceptable Fit
Nesnow, 1984 BeAC male mouse Papilloma Multistage 0.76 106 0.90 -0.93 10% 37.3 29.0 67% 393 306 Acceptable Fit
Nesnow, 1984 BeAC male mouse Papilloma Multistage-Cancer 0.76 106 0.90 -0.93 10% 37.3 29.0 67% 393 306 Acceptable Fit
Nesnow, 1984 BeAC male mouse Papilloma Probit 0.020 120 -0.4 2.0 10% 107.5 85.5 67% 565 464
Nesnow, 1984 BeAC male mouse Papilloma Weibull 0.76 106 0.90 -0.93 10% 37.3 29.0 67% 393 306 Acceptable Fit
Nesnow, 1984 BeAC male mouse Papilloma Quantal-Linear 0.76 106 0.90 -0.93 10% 37.3 29.0 67% 393 306 Acceptable Fit
Abbreviations AIC = Akaike's Information Criterion POD = point of departure BMD = benchmark dose BMDL = 1-sided 95% lower confidence limit for the benchmark dose
Notes 1. USEPA's BMDS v.2.1.1 was used to determine dose-response dichotomous data. 2. Chi-square test is a hypothesis test in which the null hypothesis is that data fit the dose-response function. Higher p-values indicate better fits. 3. For each dataset, models with relatively low AIC are indicative of better fits. 4. A scaled residual is the difference between the observed and predicted effect (i.e., percent response) divided by the standard deviation. Scaled Residual of Interest is a summary output parameter of the BMDS model, while the Maximum Scaled Residual is the maximum of the scaled residuals of each of the individual dose groups. Absolute value less than 2.0 is indicative of a good fit. Values in bold are >2.0.
R fReferences
Nesnow, S., A. Gold, R. Sangaiah et al. 1984. Mouse skin tumor-initiating activity of benz[e]aceanthrylene and benz[l]aceanthrylene in Sencar mice. Cancer Lett 22:263–268.

0.4 0.4 0.4 0.4 0.4 0.4
0.6 0.6 0.6 0.6 0.6 0.6
0.4 0.4
0.6 0.6 0.6
A: Gamma_Nesnow84_BeAC_M_Dich_Gamma67 B: Logistic_Nesnow84_BeAC_M_Dich_Logist67Gamma Multi-Hit Model with 0.95 Confidence LevelGamma Multi-Hit Model with 0.95 Confidence LevelGamma Multi-Hit Model with 0.95 Confidence LevelGamma Multi-Hit Model with 0.95 Confidence LevelGamma Multi-Hit Model with 0.95 Confidence LevelGamma Multi-Hit Model with 0.95 Confidence LevelGamma Multi-Hit Model with 0.95 Confidence Level Logistic Model with 0.95 Confidence LevelLogistic Model with 0.95 Confidence LevelLogistic Model with 0.95 Confidence LevelLogistic Model with 0.95 Confidence LevelLogistic Model with 0.95 Confidence LevelLogistic Model with 0.95 Confidence LevelLogistic Model with 0.95 Confidence Level
Gamma Multi-HitGamma Multi-HitGamma Multi-HitGamma Multi-HitGamma Multi-HitGamma Multi-HitGamma Multi-Hit LogisticLogisticLogisticLogisticLogisticLogisticLogistic BMD Lower BoundBMD Lower BoundBMD Lower BoundBMD Lower BoundBMD Lower BoundBMD Lower BoundBMD Lower Bound BMD Lower BoundBMD Lower BoundBMD Lower BoundBMD Lower BoundBMD Lower BoundBMD Lower BoundBMD Lower Bound1111111 1111111
0.80.80.80.80.80.8 0.80.80.80.80.80.8
0.20.20.20.20.2 0.20.20.20.20.2
00000 00000
BMDLBMDLBMDLBMDLBMDL BMDBMDBMDBMDBMD BMDLBMDLBMDLBMDLBMDL BMDBMDBMDBMDBMD
00000 200200200200200 400400400400400 600600600600600 800800800800800 10001000100010001000 00000 200200200200200 400400400400400 600600600600600 800800800800800 10001000100010001000 dosedosedosedose dosedosedosedose
17:54 04/14 201017:54 04/14 201017:54 04/14 201017:54 04/14 2010 17:54 04/14 201017:54 04/14 201017:54 04/14 201017:54 04/14 2010
C: LogLogistic_Nesnow84_BeAC_M_Dich_LogLogist67 D: LogProbit_Nesnow84_BeAC_M_Dich_LogProb67Log-Logistic Model with 0.95 Confidence LevelLog-Logistic Model with 0.95 Confidence LevelLog-Logistic Model with 0.95 Confidence LevelLog-Logistic Model with 0.95 Confidence Level LogProbit Model with 0.95 Confidence LevelLogProbit Model with 0.95 Confidence LevelLogProbit Model with 0.95 Confidence LevelLogProbit Model with 0.95 Confidence Level
Log-LogisticLog-LogisticLog-LogisticLog-Logistic LogProbitLogProbitLogProbitLogProbit 111 BMD Lower BoundBMD Lower BoundBMD Lower Bound111
0.80.80.8 0.80.80.8
A
ffe
cte
dFF
rract
act
iion
Af
on
Afffee
ctctr
Fr
Fr
FFe
de
d
rrF
ract
act
act
act
act
act
iiiiiion
Af
on
Af
on
Af
on
Af
on
Af
on
Afffffffeeeeee
ctctctctctcte
de
de
de
de
de
d
0.60.60.60.60.60.6
0.40.40.40.40.40.4
0.60.60.6
0.40.4
0.20.2
Affe
cte
dFF
rract
act
iion
Af
on
Afffee
ctctr
Fr
Fr
FFe
de
d
rrF
ract
act
act
act
act
act
iiiiiion
Af
on
Af
on
Af
on
Af
on
Af
on
Afffffffeeeeee
ctctctctctcte
de
de
de
de
de
d
0 0
BMDL BMD BMDL BMD
0 200 400 600 800 1000 0 200 400 600 800 1000
dose dose 17:54 04/14 2010 17:54 04/14 2010
0.2 0.2
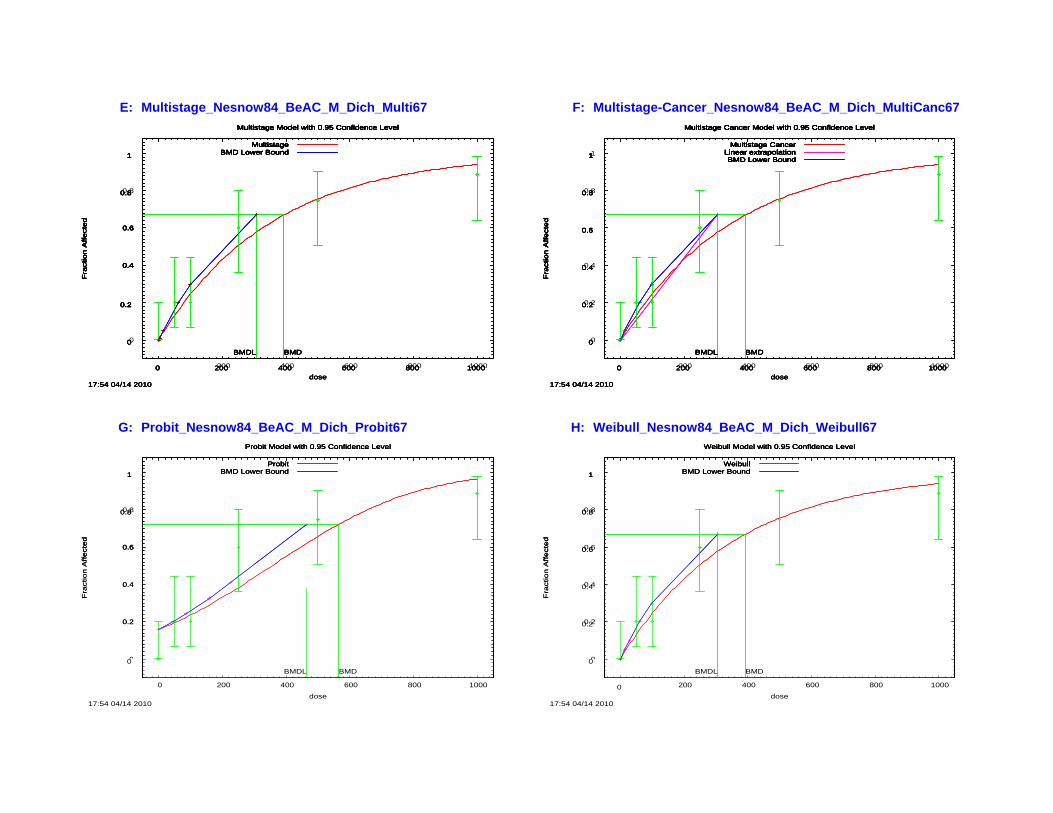
0.4 0.4 0.4 0.4 0.4 0.4
0.6 0.6 0.6 0.6 0.6 0.6
0.4 0.4
0.6 0.6 0.6
E: Multistage_Nesnow84_BeAC_M_Dich_Multi67 F: Multistage-Cancer_Nesnow84_BeAC_M_Dich_MultiCanc67 Multistage Model with 0.95 Confidence LevelMultistage Model with 0.95 Confidence LevelMultistage Model with 0.95 Confidence LevelMultistage Model with 0.95 Confidence LevelMultistage Model with 0.95 Confidence LevelMultistage Model with 0.95 Confidence LevelMultistage Model with 0.95 Confidence Level Multistage Cancer Model with 0.95 Confidence LevelMultistage Cancer Model with 0.95 Confidence LevelMultistage Cancer Model with 0.95 Confidence LevelMultistage Cancer Model with 0.95 Confidence LevelMultistage Cancer Model with 0.95 Confidence LevelMultistage Cancer Model with 0.95 Confidence LevelMultistage Cancer Model with 0.95 Confidence Level
MultistageMultistageMultistageMultistageMultistageMultistageMultistage Multistage CancerMultistage CancerMultistage CancerMultistage CancerMultistage CancerMultistage CancerMultistage Cancer 1111111 BMD Lower BoundBMD Lower BoundBMD Lower BoundBMD Lower BoundBMD Lower BoundBMD Lower BoundBMD Lower Bound Linear extrapolationLinear extrapolationLinear extrapolationLinear extrapolationLinear extrapolationLinear extrapolationLinear extrapolation
BMD Lower BoundBMD Lower BoundBMD Lower BoundBMD Lower BoundBMD Lower BoundBMD Lower BoundBMD Lower Bound 1111111
0.80.80.80.80.80.8 0.80.80.80.80.80.8
0.20.20.20.20.2 0.20.20.20.20.2
00000 00000
BMDBMDL BMDBMDLBMDLBMDLBMDL BMDBMDBMD BMDBMDL BMDBMDLBMDLBMDLBMDL BMDBMDBMD
00000 200200200200200 400400400400400 600600600600600 800800800800800 10001000100010001000 00000 200200200200200 400400400400400 600600600600600 800800800800800 10001000100010001000 dosedosedosedose dosedosedosedose
17:54 04/14 201017:54 04/14 201017:54 04/14 201017:54 04/14 2010 17:54 04/14 201017:54 04/14 201017:54 04/14 201017:54 04/14 2010
G: Probit_Nesnow84_BeAC_M_Dich_Probit67 H: Weibull_Nesnow84_BeAC_M_Dich_Weibull67Probit Model with 0.95 Confidence LevelProbit Model with 0.95 Confidence LevelProbit Model with 0.95 Confidence LevelProbit Model with 0.95 Confidence Level Weibull Model with 0.95 Confidence LevelWeibull Model with 0.95 Confidence LevelWeibull Model with 0.95 Confidence LevelWeibull Model with 0.95 Confidence Level
ProbitProbitProbitProbit WeibullWeibullWeibullWeibull 111 BMD Lower BoundBMD Lower BoundBMD Lower Bound BMD Lower BoundBMD Lower BoundBMD Lower Bound111
0.80.80.8 0.80.80.8
FFrra
cta
ctiio
n A
fo
n A
fffee
ctcte
de
d
Fra
ctio
n A
fA
ffe
cte
dFFFFF
rrrrract
act
act
act
act
iiiiif
on
Aff
on
Af
on
Af
on
Af
on
Afffffeeeeee
ctctctctctcte
de
de
de
de
de
d
0.60.60.60.60.60.6
0.40.40.40.40.40.4
0.60.60.6
0.40.4
0.20.2
FFrra
cta
ctiio
n A
fo
n A
fffee
ctcte
de
d
Fra
ctio
n A
fA
ffe
cte
dFFFFF
rrrrract
act
act
act
act
iiiiif
on
Aff
on
Af
on
Af
on
Af
on
Afffffeeeeee
ctctctctctcte
de
de
de
de
de
d
00 00BMDL BMD BMDL BMD
0 200 400 600 800 1000 0 200 400 600 800 1000
dose dose 17:54 04/14 2010 17:54 04/14 2010
0.2 0.2

I: Quantal-Linear_Nesnow84_BeAC_M_Dich_QntLin67Quantal Linear Model with 0.95 Confidence LevelQuantal Linear Model with 0.95 Confidence LevelQuantal Linear Model with 0.95 Confidence LevelQuantal Linear Model with 0.95 Confidence Level
0.8
1Quantal Linear
BMD Lower Bound
0.4
0.6
0.8
1
Fra
ctio
n A
ffe
cte
d
Quantal LinearBMD Lower Bound
0
0.2
0.4
0.6
0.8
1
Fra
ctio
n A
ffe
cte
d
BMDL BMD
Quantal LinearBMD Lower Bound
0
0.2
0.4
0.6
0.8
1
Fra
ctio
n A
ffe
cte
d
BMDL BMD
Quantal Linear BMD Lower Bound
00 200200 400400 600600 800800 10001000 dosedose
17:54 04/14 201017:54 04/14 2010

Table C-6. Nesnow et al. (1984), benz[e]aceanthrylene, female mice. Dichotomous dose-response goodness-of-fit tests and benchmark dose estimates at 10% and 51% effect levels applied to study results.
Source Substance
Effect Endpoint Dichotomous Dose-Response
Model (1)
Goodness-of-Fit
POD (% Effect)
Dose (nmol) Alternative
POD (% Effect)
Dose (nmol)
Notes
p-value for Chi-Square
Test (2) AIC (3)
Residuals (4)
Animal Tissue
Scaled Residual of
Interest
Maximum Scaled
Residual BMD BMDL BMD BMDL Nesnow,
1984 BeAC female mouse Papilloma Gamma 0.20 127 0.19 -1.8 10% 56.6 40.3 51% 383 273 Acceptable Fit
Nesnow, 1984 BeAC female
mouse Papilloma Logistic 0.12 129 1.16 -1.5 10% 130 99.9 51% 530 416 Acceptable Fit
Nesnow, 1984 BeAC female
mouse Papilloma LogLogistic 0.24 126 0.0070 -1.9 10% 31.8 20.3 51% 297 190 Best Fit: Log-logistic model has the lowest maxmimum scaled residuals, low AIC, and highest p-value.
Nesnow, 1984 BeAC female
mouse Papilloma LogProbit 0.08 129 1.40 -2.0 10% 108 71.8 51% 399 265
Nesnow, 1984 BeAC female
mouse Papilloma Multistage 0.20 127 0.19 -1.8 10% 56.6 40.3 51% 383 273 Acceptable Fit
Nesnow, 1984 BeAC female
mouse Papilloma Multistage-Cancer 0.20 127 0.19 -1.8 10% 56.6 40.3 51% 383 273 Acceptable Fit
Nesnow, 1984 BeAC female
mouse Papilloma Probit 0.13 129 1.2 -1.5 10% 126 99.7 51% 537 431 Acceptable Fit
Nesnow, 1984 BeAC female
mouse Papilloma Weibull 0.20 127 0.19 -1.8 10% 56.6 40.3 51% 383 273 Acceptable Fit
Nesnow, 1984 BeAC female
mouse Papilloma Quantal-Linear 0.20 127 0.19 -1.8 10% 56.6 40.3 51% 383 273 Acceptable Fit
Abbreviations AIC = Akaike's Information Criterion POD = point of departure BMD = benchmark dose BMDL = 1-sided 95% lower confidence limit for the benchmark dose
Notes 1. USEPA's BMDS v.2.1.1 was used to determine dose-response dichotomous data. 2. Chi-square test is a hypothesis test in which the null hypothesis is that data fit the dose-response function. Higher p-values indicate better fits. 3. For each dataset, models with relatively low AIC are indicative of better fits. 4. A scaled residual is the difference between the observed and predicted effect (i.e., percent response) divided by the standard deviation. Scaled Residual of Interest is a summary output parameter of the BMDS model, while the Maximum Scaled Residual is the maximum of the scaled residuals of each of the individual dose groups. Absolute value less than 2.0 is indicative of a good fit. Values in bold are >2.0.
R fReferences
Nesnow, S., A. Gold, R. Sangaiah et al. 1984. Mouse skin tumor-initiating activity of benz[e]aceanthrylene and benz[l]aceanthrylene in Sencar mice. Cancer Lett 22:263–268.
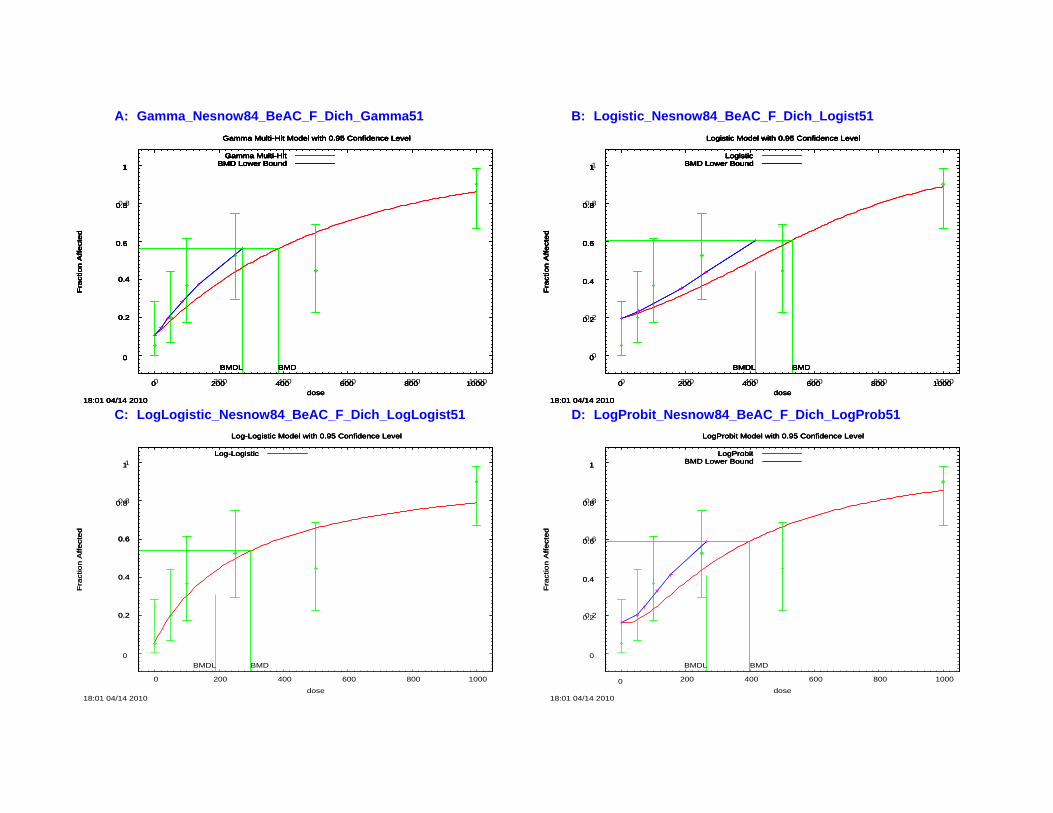
A A
0.2 0.2 0.2 0.2 0.2
0.4 0.4 0.4 0.4 0.4
0.4 0.4
0.6 0.6 0.6
A: Gamma_Nesnow84_BeAC_F_Dich_Gamma51 B: Logistic_Nesnow84_BeAC_F_Dich_Logist51 Gamma Multi-Hit Model with 0.95 Confidence LevelGamma Multi-Hit Model with 0.95 Confidence LevelGamma Multi-Hit Model with 0.95 Confidence LevelGamma Multi-Hit Model with 0.95 Confidence LevelGamma Multi-Hit Model with 0.95 Confidence LevelGamma Multi-Hit Model with 0.95 Confidence LevelGamma Multi-Hit Model with 0.95 Confidence Level Logistic Model with 0.95 Confidence LevelLogistic Model with 0.95 Confidence LevelLogistic Model with 0.95 Confidence LevelLogistic Model with 0.95 Confidence LevelLogistic Model with 0.95 Confidence LevelLogistic Model with 0.95 Confidence LevelLogistic Model with 0.95 Confidence Level
Gamma Multi-HitGamma Multi-HitGamma Multi-HitGamma Multi-HitGamma Multi-HitGamma Multi-HitGamma Multi-Hit LogisticLogisticLogisticLogisticLogisticLogisticLogistic BMD Lower BoundBMD Lower BoundBMD Lower BoundBMD Lower BoundBMD Lower BoundBMD Lower BoundBMD Lower Bound BMD Lower BoundBMD Lower BoundBMD Lower BoundBMD Lower BoundBMD Lower BoundBMD Lower BoundBMD Lower Bound1111111 1111111
0.80.80.80.80.80.8 0.80.80.80.80.80.8
ffe
cte
dFFFFF
rrrrract
ion
Aff
ect
ed
act
ion
Aff
ect
ed
act
ion
Aff
ect
ed
act
ion
Aff
ect
ed
act
ion
Aff
ect
ed
on
Aff
ect
ed
FFrra
ctio
n A
ffe
cte
da
ctio
n A
ffe
cte
d
0.60.60.60.60.60.6
00000BMDLBMDLBMDLBMDLBMDL BMDBMDBMDBMDBMD
0000 200200200200 400400400400 600600600600 800800800800 1000100010001000 dosedosedosedose
18:01 04/14 201018:01 04/14 201018:01 04/14 201018:01 04/14 2010
C: LogLogistic_Nesnow84_BeAC_F_Dich_LogLogist51 Log-Logistic Model with 0.95 Confidence LevelLog-Logistic Model with 0.95 Confidence LevelLog-Logistic Model with 0.95 Confidence LevelLog-Logistic Model with 0.95 Confidence Level
Log-LogisticLog-LogisticLog-LogisticLog-Logistic 111
0.80.80.8
ffe
cte
dFFFFF
rrrrract
ion
Aff
ect
ed
act
ion
Aff
ect
ed
act
ion
Aff
ect
ed
act
ion
Aff
ect
ed
act
ion
Aff
ect
ed
on
Aff
ect
ed
FFrra
ctio
n A
ffe
cte
da
ctio
n A
ffe
cte
d
0.60.60.60.60.60.6
0.40.40.40.40.4
0.20.20.20.20.2
00000BMDLBMDLBMDLBMDLBMDL BMDBMDBMDBMDBMD
0000 200200200200 400400400400 600600600600 800800800800 1000100010001000 dosedosedosedose
18:01 04/14 201018:01 04/14 201018:01 04/14 201018:01 04/14 2010
D: LogProbit_Nesnow84_BeAC_F_Dich_LogProb51LogProbit Model with 0.95 Confidence LevelLogProbit Model with 0.95 Confidence LevelLogProbit Model with 0.95 Confidence LevelLogProbit Model with 0.95 Confidence Level
LogProbitLogProbitLogProbitLogProbit BMD Lower BoundBMD Lower BoundBMD Lower Bound111
0.80.80.8
0.60.60.6
0.40.4
0.20.2
00 00BMDL BMD BMDL BMD
0 200 400 600 800 1000 0 200 400 600 800 1000
dose dose 18:01 04/14 2010 18:01 04/14 2010
0.2 0.2
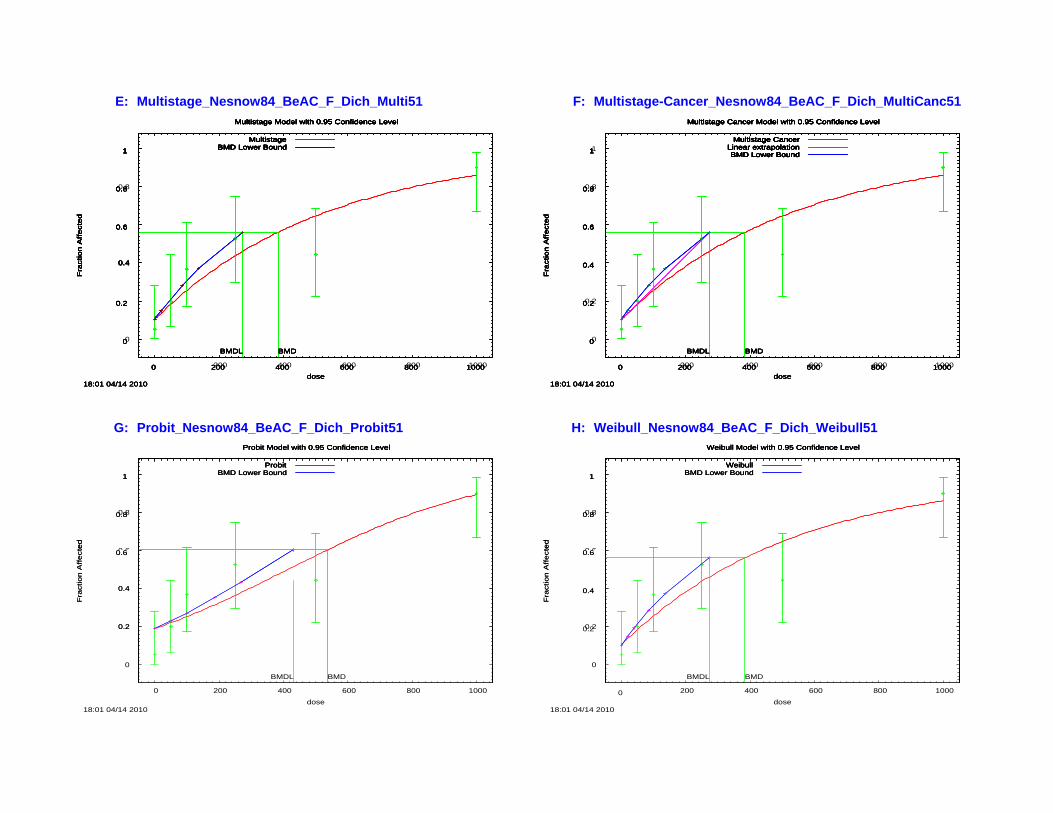
0.4 0.4 0.4 0.4 0.4 0.4
0.4 0.4
E: Multistage_Nesnow84_BeAC_F_Dich_Multi51 F: Multistage-Cancer_Nesnow84_BeAC_F_Dich_MultiCanc51 Multistage Model with 0.95 Confidence LevelMultistage Model with 0.95 Confidence LevelMultistage Model with 0.95 Confidence LevelMultistage Model with 0.95 Confidence LevelMultistage Model with 0.95 Confidence LevelMultistage Model with 0.95 Confidence LevelMultistage Model with 0.95 Confidence Level Multistage Cancer Model with 0.95 Confidence LevelMultistage Cancer Model with 0.95 Confidence LevelMultistage Cancer Model with 0.95 Confidence LevelMultistage Cancer Model with 0.95 Confidence LevelMultistage Cancer Model with 0.95 Confidence LevelMultistage Cancer Model with 0.95 Confidence LevelMultistage Cancer Model with 0.95 Confidence Level
MultistageMultistageMultistageMultistageMultistageMultistageMultistage Multistage CancerMultistage CancerMultistage CancerMultistage CancerMultistage CancerMultistage CancerMultistage Cancer
1111111 BMD Lower BoundBMD Lower BoundBMD Lower BoundBMD Lower BoundBMD Lower BoundBMD Lower BoundBMD Lower Bound Linear extrapolationLinear extrapolationLinear extrapolationLinear extrapolationLinear extrapolationLinear extrapolationLinear extrapolation BMD Lower BoundBMD Lower BoundBMD Lower BoundBMD Lower BoundBMD Lower BoundBMD Lower BoundBMD Lower Bound
1111111
0.80.80.80.80.80.8 0.80.80.80.80.80.8
FFrra
ctio
n A
ffe
cte
da
ctio
n A
ffe
cte
d
F a
ctio
n A
ffe
cte
dte
dr
Fr
FFFFrrrra
ctio
n A
ffe
cte
da
ctio
n A
ffe
cte
da
ctio
n A
ffe
cte
da
ctio
n A
ffe
cte
da
ctio
n A
ffe
cte
d
0.60.60.60.60.60.6
0.20.20.20.20.2
00000BMDBMDL BMDBMDLBMDLBMDLBMDL BMDBMDBMD
00000 200200200200200 400400400400400 600600600600600 800800800800800 10001000100010001000 dosedosedosedose
18:01 04/14 201018:01 04/14 201018:01 04/14 201018:01 04/14 2010
G: Probit_Nesnow84_BeAC_F_Dich_Probit51 Probit Model with 0.95 Confidence LevelProbit Model with 0.95 Confidence LevelProbit Model with 0.95 Confidence LevelProbit Model with 0.95 Confidence Level
ProbitProbitProbitProbit BMD Lower BoundBMD Lower BoundBMD Lower Bound111
0.80.80.8
0 60.60.6 FF
rract
ion
Aff
ect
ed
act
ion
Aff
ect
ed
F
act
ion
Aff
ect
ed
ted
rF
rFFFF
rrrract
ion
Aff
ect
ed
act
ion
Aff
ect
ed
act
ion
Aff
ect
ed
act
ion
Aff
ect
ed
act
ion
Aff
ect
ed
0.60.60.60.60.60.6
0.40.40.40.40.40.4
0.20.20.20.20.2
00000BMDBMDL BMDBMDLBMDLBMDLBMDL BMDBMDBMD
00000 200200200200200 400400400400400 600600600600600 800800800800800 10001000100010001000 dosedosedosedose
18:01 04/14 201018:01 04/14 201018:01 04/14 201018:01 04/14 2010
H: Weibull_Nesnow84_BeAC_F_Dich_Weibull51Weibull Model with 0.95 Confidence LevelWeibull Model with 0.95 Confidence LevelWeibull Model with 0.95 Confidence LevelWeibull Model with 0.95 Confidence Level
WeibullWeibullWeibullWeibull BMD Lower BoundBMD Lower BoundBMD Lower Bound111
0.80.80.8
0 60.60.6
0.40.4
0.20.2
0 0
BMDL BMD BMDL BMD
0 200 400 600 800 1000 0 200 400 600 800 1000
dose dose 18:01 04/14 2010 18:01 04/14 2010
0.2 0.2
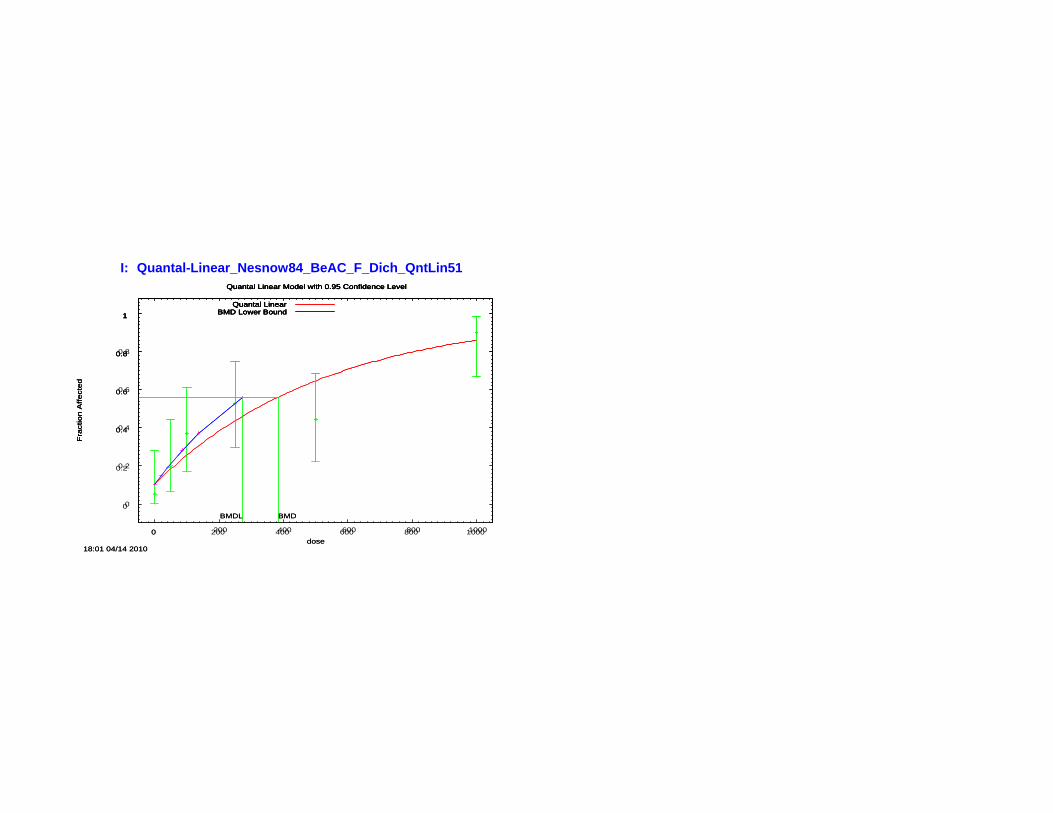
t t
FFFrrra
ctio
n A
ffe
cte
da
ctio
n A
ffe
cte
da
ctio
n A
ffe
cte
d
I Q l Li N 84 B AC F Di h Q Li 51I: Quantal-Linear_Nesnow84_BeAC_F_Dich_QntLin51Quantal Linear Model with 0.95 Confidence LevelQuantal Linear Model with 0.95 Confidence LevelQuantal Linear Model with 0.95 Confidence LevelQuantal Linear Model with 0.95 Confidence Level
1111
0.80.80.80.8
0.60.60.6
0.40.40.4
0.20.2
00
Quantal LinearBMD Lower Bound
Quantal LinearBMD Lower Bound
BMDL BMD
Quantal LinearBMD Lower Bound
BMDL BMD
Quantal Linear BMD Lower Bound
00 200200 400400 600600 800800 10001000 dosedose
18:01 04/14 201018:01 04/14 2010
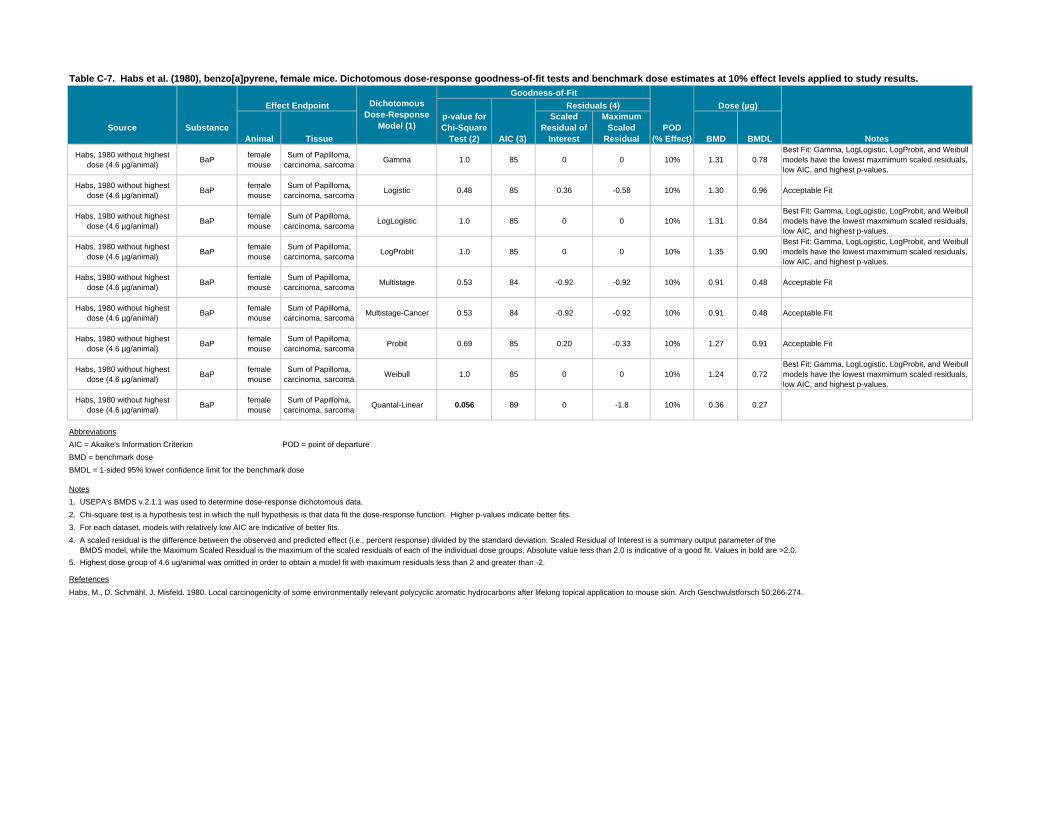
Table C-7. Habs et al. (1980), benzo[a]pyrene, female mice. Dichotomous dose-response goodness-of-fit tests and benchmark dose estimates at 10% effect levels applied to study results.
Source Substance
Effect Endpoint Dichotomous Dose-Response
Model (1)
Goodness-of-Fit
POD (% Effect)
Dose (µg)
Notes
p-value for Chi-Square
Test (2) AIC (3)
Residuals (4)
Animal Tissue
Scaled Residual of
Interest
Maximum Scaled
Residual BMD BMDL
Habs, 1980 without highest dose (4.6 µg/animal) BaP female
mouse Sum of Papilloma,
carcinoma, sarcoma Gamma 1.0 85 0 0 10% 1.31 0.78 Best Fit: Gamma, LogLogistic, LogProbit, and Weibull models have the lowest maxmimum scaled residuals, low AIC, and highest p-values.
Habs, 1980 without highest dose (4.6 µg/animal) BaP female
mouse Sum of Papilloma,
carcinoma, sarcoma Logistic 0.48 85 0.36 -0.58 10% 1.30 0.96 Acceptable Fit
Habs, 1980 without highest dose (4.6 µg/animal) BaP female
mouse Sum of Papilloma,
carcinoma, sarcoma LogLogistic 1.0 85 0 0 10% 1.31 0.84 Best Fit; Gamma, LogLogistic, LogProbit, and Weibull models have the lowest maxmimum scaled residuals, low AIC, and highest p-values.
Habs, 1980 without highest dose (4.6 µg/animal) BaP female
mouse Sum of Papilloma,
carcinoma, sarcoma LogProbit 1.0 85 0 0 10% 1.35 0.90 Best Fit: Gamma, LogLogistic, LogProbit, and Weibull models have the lowest maxmimum scaled residuals, low AIC, and highest p-values.
Habs, 1980 without highest dose (4.6 µg/animal) BaP female
mouse Sum of Papilloma,
carcinoma, sarcoma Multistage 0.53 84 -0.92 -0.92 10% 0.91 0.48 Acceptable Fit
Habs, 1980 without highest dose (4.6 µg/animal) BaP female
mouse Sum of Papilloma,
carcinoma, sarcoma Multistage-Cancer 0.53 84 -0.92 -0.92 10% 0.91 0.48 Acceptable Fit
Habs, 1980 without highest dose (4.6 µg/animal) BaP female
mouse Sum of Papilloma,
carcinoma, sarcoma Probit 0.69 85 0.20 -0.33 10% 1.27 0.91 Acceptable Fit
Habs, 1980 without highest dose (4.6 µg/animal) BaP female
mouse Sum of Papilloma,
carcinoma, sarcoma Weibull 1.0 85 0 0 10% 1.24 0.72 Best Fit: Gamma, LogLogistic, LogProbit, and Weibull models have the lowest maxmimum scaled residuals, low AIC, and highest p-values.
Habs, 1980 without highest dose (4.6 µg/animal) BaP female
mouse Sum of Papilloma,
carcinoma, sarcoma Quantal-Linear 0.056 89 0 -1.8 10% 0.36 0.27
Abbreviations AIC = Akaike's Information Criterion POD = point of departure BMD = benchmark dose BMDL = 1-sided 95% lower confidence limit for the benchmark dose
Notes 1. USEPA's BMDS v.2.1.1 was used to determine dose-response dichotomous data. 2. Chi-square test is a hypothesis test in which the null hypothesis is that data fit the dose-response function. Higher p-values indicate better fits. 3. For each dataset, models with relatively low AIC are indicative of better fits. 4. A scaled residual is the difference between the observed and predicted effect (i.e., percent response) divided by the standard deviation. Scaled Residual of Interest is a summary output parameter of the BMDS model, while the Maximum Scaled Residual is the maximum of the scaled residuals of each of the individual dose groups. Absolute value less than 2.0 is indicative of a good fit. Values in bold are >2.0. 5. Highest dose group of 4.6 ug/animal was omitted in order to obtain a model fit with maximum residuals less than 2 and greater than -2.
References
Habs, M., D. Schmähl, J. Misfeld. 1980. Local carcinogenicity of some environmentally relevant polycyclic aromatic hydrocarbons after lifelong topical application to mouse skin. Arch Geschwulstforsch 50:266-274.

0.4 0.4 0.4 0.4 0.4 0.4
0.5 0.5 0.5 0.5 0.5 0.5
0.3 0.3
0.4 0.4
0.5 0.5
A: Gamma_Habs1980_BaP_3doses_Dich_Gamma B: Logistic_Habs1980_BaP_3doses_Dich_Logist Gamma Multi-Hit Model with 0.95 Confidence LevelGamma Multi-Hit Model with 0.95 Confidence LevelGamma Multi-Hit Model with 0.95 Confidence LevelGamma Multi-Hit Model with 0.95 Confidence LevelGamma Multi-Hit Model with 0.95 Confidence LevelGamma Multi-Hit Model with 0.95 Confidence LevelGamma Multi-Hit Model with 0.95 Confidence Level Logistic Model with 0.95 Confidence LevelLogistic Model with 0.95 Confidence LevelLogistic Model with 0.95 Confidence LevelLogistic Model with 0.95 Confidence LevelLogistic Model with 0.95 Confidence LevelLogistic Model with 0.95 Confidence LevelLogistic Model with 0.95 Confidence Level
0.90.90.90.90.90.90.9 Gamma Multi-HitGamma Multi-HitGamma Multi-HitGamma Multi-HitGamma Multi-HitGamma Multi-HitGamma Multi-Hit BMD Lower BoundBMD Lower BoundBMD Lower BoundBMD Lower BoundBMD Lower BoundBMD Lower BoundBMD Lower Bound
0.90.90.90.90.90.90.9 LogisticLogisticLogisticLogisticLogisticLogisticLogistic BMD Lower BoundBMD Lower BoundBMD Lower BoundBMD Lower BoundBMD Lower BoundBMD Lower BoundBMD Lower Bound
0.80.80.80.80.80.80.8 0.80.80.80.80.80.80.8
0.70.70.70.70.70.7 0.70.70.70.70.70.7
0.60.60.60.60.60.6 0.60.60.60.60.60.6
0 30.30.30.30.30.3
0.50.50.50.50.50.5
0.40.40.40.40.40.4
0 30.30.30.30.30.3
0.20.20.20.20.2 0.20.20.20.20.2
0.10.10.10.10.1 0.10.10.10.10.1
00000 00000
BMDLBMDLBMDLBMDLBMDL BMDBMDBMDBMDBMD BMDLBMDLBMDLBMDLBMDL BMDBMDBMDBMDBMD
00000 0.50.50.50.50.5 11111 1.51.51.51.51.5 22222 2.52.52.52.52.5 00000 0.50.50.50.50.5 11111 1.51.51.51.51.5 22222 2.52.52.52.52.5 dosedosedosedose dosedosedosedose
13:29 04/13 201013:29 04/13 201013:29 04/13 201013:29 04/13 2010 13:29 04/13 201013:29 04/13 201013:29 04/13 201013:29 04/13 2010
C: LogLogistic_Habs1980_BaP_3doses_Dich_LogLogist D: LogProbit_Habs1980_BaP_3doses_Dich_LogProbLog-Logistic Model with 0.95 Confidence LevelLog-Logistic Model with 0.95 Confidence LevelLog-Logistic Model with 0.95 Confidence LevelLog-Logistic Model with 0.95 Confidence Level LogProbit Model with 0.95 Confidence LevelLogProbit Model with 0.95 Confidence LevelLogProbit Model with 0.95 Confidence LevelLogProbit Model with 0.95 Confidence Level
0.90.90.90.9 0.90.90.90.9Log-LogisticLog-LogisticLog-LogisticLog-Logistic LogProbitLogProbitLogProbitLogProbit BMD Lower BoundBMD Lower BoundBMD Lower Bound
0.80.80.8 0.80.80.8
0.70.70.7 0.70.70.7
0.60.60.6 0.60.60.6
ed
Frac
tFr
act
Frac
tiion
Af
on A
fffeectct
iFr
acti
Frac
tiFr
act
Frac
teded
ii
Frac
tion
Af
on A
fon
Af
on A
fon
Af
on A
fffffffeeeeeectctctctctct
edededededed
0.50.5
0.40.4
0.30.3
0.20.2 0.20.2
0.10.1 0.10.1
0
13:29 04/13 2010
0 0.5
BMDL
1 1.5
dose
BMD
2 2.5
0
13:29 04/13 2010
0 0.5
BMDL
1 1.5
dose
BMD
2 2.5
ed
Frac
FrFracac
ttiion
Af
on A
fffeecctt
FrFrFrFreded
Fr
tac
tacacacac
ttttiiiiiion
Af
on A
fon
Af
on A
fon
Af
on A
fffffffeeeeeecccccctttttt
edededededed

0.3 0.3 0.3 0.3 0.3
0.4 0.4 0.4 0.4 0.4 0.4
0.5 0.5 0.5 0.5 0.5 0.5
0.3 0.3
0.4 0.4
0.5 0.5 0.5
E: Multistage_Habs1980_BaP_3doses_Dich_Multi F: Multistage-Cancer_Habs1980_BaP_3doses_Dich_MultiCanc Multistage Model with 0.95 Confidence LevelMultistage Model with 0.95 Confidence LevelMultistage Model with 0.95 Confidence LevelMultistage Model with 0.95 Confidence LevelMultistage Model with 0.95 Confidence LevelMultistage Model with 0.95 Confidence LevelMultistage Model with 0.95 Confidence Level Multistage Cancer Model with 0.95 Confidence LevelMultistage Cancer Model with 0.95 Confidence LevelMultistage Cancer Model with 0.95 Confidence LevelMultistage Cancer Model with 0.95 Confidence LevelMultistage Cancer Model with 0.95 Confidence LevelMultistage Cancer Model with 0.95 Confidence LevelMultistage Cancer Model with 0.95 Confidence Level
0 80.80.80.80.80.80.8
0.90.90.90.90.90.90.9 MultistageMultistageMultistageMultistageMultistageMultistageMultistage BMD Lower BoundBMD Lower BoundBMD Lower BoundBMD Lower BoundBMD Lower BoundBMD Lower BoundBMD Lower Bound
0 80.80.80.80.80.80.8
0.90.90.90.90.90.90.9
BMD Lower Bound
Multistage CancerMultistage CancerMultistage CancerMultistage CancerMultistage CancerMultistage CancerMultistage Cancer Linear extrapolationLinear extrapolationLinear extrapolationLinear extrapolationLinear extrapolationLinear extrapolationLinear extrapolation BMD Lower BoundBMD Lower BoundBMD Lower BoundBMD Lower BoundBMD Lower BoundBMD Lower Bound
0.70.70.70.70.70.7 0.70.70.70.70.70.7
0.60.60.60.60.60.6 0.60.60.60.60.60.6
0.50.50.50.50.50.5
0.40.40.40.40.40.4
0.30.30.30.30.3
0.20.20.20.20.2 0.20.20.20.20.2
0.10.10.10.10.1 0.10.10.10.10.1
00000 00000
BMDBMDL BMDBMDLBMDLBMDLBMDL BMDBMDBMD BMDL BMDBMDBMDBMDBMDBMDLBMDLBMDLBMDL
0000 0.50.50.50.5 1111 1.51.51.51.5 2222 2.52.52.52.5 0000 0.50.50.50.5 1111 1.51.51.51.5 2222 2.52.52.52.5 dosedosedosedose dosedosedosedose
13:29 04/13 201013:29 04/13 201013:29 04/13 201013:29 04/13 2010 13:29 04/13 201013:29 04/13 201013:29 04/13 201013:29 04/13 2010
G: Probit_Habs1980_BaP_3doses_Dich_Probit H: Weibull_Habs1980_BaP_3doses_Dich_WeibullProbit Model with 0.95 Confidence LevelProbit Model with 0.95 Confidence LevelProbit Model with 0.95 Confidence LevelProbit Model with 0.95 Confidence Level Weibull Model with 0.95 Confidence LevelWeibull Model with 0.95 Confidence LevelWeibull Model with 0.95 Confidence LevelWeibull Model with 0.95 Confidence Level
0.90.90.90.9 0.90.90.90.9ProbitProbitProbitProbit WeibullWeibullWeibullWeibull BMD Lower BoundBMD Lower BoundBMD Lower Bound BMD Lower BoundBMD Lower BoundBMD Lower Bound
0.80.80.8 0.80.80.8
0.70.70.7 0.70.70.7
0.60.60.6 0.60.60.6
Affe
cted
Frac
tFr
actiio
n A
fon
Afffee
ctcti
Frac
tiFr
acti
Frac
tFr
act
eded
iiFr
actio
n A
fon
Af
on A
fon
Af
on A
fon
Afffffffeeeeee
ctctctctctctedededededed
0.50.50.5
0.40.4
0.30.3
0.20.2 0.20.2
0.10.1 0.10.1
00
13:29 04/13 2010
0 0.5
BMDL
1 1.5
dose
BMD
2 2.5
00
13:29 04/13 2010
0 0.5
BMDL
1 1.5
dose
BMD
2 2.5
Affe
ted
FrFracac
ttiion
Af
on A
fffceecctt
FrFrFrFreded
Fr
acacacacacitittttiiiio
n A
fon
Af
on A
fon
Af
on A
fon
Afffffffeeeeee
ccccccttttttedededededed

I:I: Quantal-Linear Habs1980 BaP 3doses Dich QntLinQuantal-Linear_Habs1980_BaP_3doses_Dich_QntLinQuantal Linear Model with 0.95 Confidence LevelQuantal Linear Model with 0.95 Confidence LevelQuantal Linear Model with 0.95 Confidence LevelQuantal Linear Model with 0.95 Confidence Level
0.6
0.7
0.8
0.9 Quantal LinearBMD Lower Bound
0.2
0.3
0.4
0.5
0.6
0.7
0.8
0.9
Frac
tion
Affe
cted
Quantal LinearBMD Lower Bound
0
0.1
0.2
0.3
0.4
0.5
0.6
0.7
0.8
0.9
Frac
tion
Affe
cted
BMDL BMD
Quantal LinearBMD Lower Bound
0
0.1
0.2
0.3
0.4
0.5
0.6
0.7
0.8
0.9
Frac
tion
Affe
cted
BMDL BMD
Quantal Linear BMD Lower Bound
00 0.50.5 11 1.51.5 22 2.52.5 dosedose
13:29 04/13 201013:29 04/13 2010

Table C-8. LaVoie et al. (1982), benzo[b]fluoranthene, female mice. Dichotomous dose-response goodness-of-fit tests and benchmark dose estimates at 10% effect levels applied to study results.
Source Substance
Effect Endpoint Dichotomous Dose-Response
Model (1)
Goodness-of-Fit
POD (% Effect)
Dose (µg)
Notes
p-value for Chi-Square
Test (2) AIC (3)
Residuals (4)
Animal Tissue
Scaled Residual of
Interest
Maximum Scaled
Residual BMD BMDL LaVoie, 1982 without
highest dose (100 µg/mouse)
BbF female mouse
Primarily squamous cell
papilloma Gamma 0.33 59 0 1.2 10% 2.7 1.9 Acceptable Fit
LaVoie, 1982 without highest dose
(100 µg/mouse) BbF female
mouse
Primarily squamous cell
papilloma Logistic 0.0076 68 2.0 2.0 10% 7 5.2
LaVoie, 1982 without highest dose
(100 µg/mouse) BbF female
mouse
Primarily squamous cell
papilloma LogLogistic 0.74 57 0 0.55 10% 1.7 1.0 Best Fit: LogLogistic model has the lowest maxmimum
scaled residuals, lowest AIC, and highest p-value.
LaVoie, 1982 without highest dose
(100 µg/mouse) BbF female
mouse
Primarily squamous cell
papilloma LogProbit 0.18 60 0 -1.3 10% 4 3.2 Acceptable Fit
LaVoie, 1982 without highest dose
(100 µg/mouse) BbF female
mouse
Primarily squamous cell
papilloma Multistage 0.33 59 0 1.2 10% 2.7 1.9 Acceptable Fit
LaVoie, 1982 without highest dose
(100 µg/mouse) BbF female
mouse
Primarily squamous cell
papilloma Multistage-Cancer 0.33 59 0 1.2 10% 2.7 1.9 Acceptable Fit
LaVoie, 1982 without highest dose
(100 µg/mouse) BbF female
mouse
Primarily squamous cell
papilloma Probit 0.0083 67 2.0 2.0 10% 7 5.0
aVoie, 1982 without highest dose
(100 µg/mouse) BbF female
mouse
Primarily squamous cell
papilloma Weibull 0.33 59 0 1.2 10% 2.7 1.9 Acceptable Fit
LaVoie, 1982 without highest dose
(100 µg/mouse) BbF female
mouse
Primarily squamous cell
papilloma Quantal-Linear 0.33 59 0 1.2 10% 2.7 1.9 Acceptable Fit
Abbreviations
AIC = Akaike's Information Criterion POD = point of departure
BMD = benchmark dose
BMDL = 1-sided 95% lower confidence limit for the benchmark dose
Notes
1. USEPA's BMDS v.2.1.1 was used to determine dose-response dichotomous data.
2. Chi-square test is a hypothesis test in which the null hypothesis is that data fit the dose-response function. Higher p-values indicate better fits.
3. For each dataset, models with relatively low AIC are indicative of better fits.
4. A scaled residual is the difference between the observed and predicted effect (i.e., percent response) divided by the standard deviation. Scaled Residual of Interest is a summary output parameter of the BMDS model, while the Maximum Scaled Residual is the maximum of the scaled residuals of each of the individual dose groups. Absolute value less than 2.0 is indicative of a good fit. Values in bold are >2.0.
5. Highest dose of 100 µg/mouse was omitted to improve model fits.
References
LaVoie, E.J., S. Amin, S.S. Hecht et al. 1982. Tumour initiating activity of dihydrodiols of benzo[b]fluoranthene, benzo[j]fluoranthene, and benzo[k]fluoranthene. Carcinogenesis 3:49–52.

0.2 0.2 0.2 0.2 0.2
0.3 0.3 0.3 0.3 0.3 0.3
0.4 0.4 0.4 0.4 0.4 0.4
0.5 0.5 0.5 0.5 0.5 0.5
0.3 0.3
0.4 0.4
A: Gamma_LaVoie82_BbF_3doses_Dich_Gamma B: Logistic_LaVoie82_BbF_3doses_Dich_Logist Gamma Multi-Hit Model with 0.95 Confidence LevelGamma Multi-Hit Model with 0.95 Confidence LevelGamma Multi-Hit Model with 0.95 Confidence LevelGamma Multi-Hit Model with 0.95 Confidence LevelGamma Multi-Hit Model with 0.95 Confidence LevelGamma Multi-Hit Model with 0.95 Confidence LevelGamma Multi-Hit Model with 0.95 Confidence Level Logistic Model with 0.95 Confidence LevelLogistic Model with 0.95 Confidence LevelLogistic Model with 0.95 Confidence LevelLogistic Model with 0.95 Confidence LevelLogistic Model with 0.95 Confidence LevelLogistic Model with 0.95 Confidence LevelLogistic Model with 0.95 Confidence Level
0.80.80.80.80.80.80.8
Gamma Multi-HitGamma Multi-HitGamma Multi-HitGamma Multi-HitGamma Multi-HitGamma Multi-HitGamma Multi-Hit BMD Lower BoundBMD Lower BoundBMD Lower BoundBMD Lower BoundBMD Lower BoundBMD Lower BoundBMD Lower Bound
0.80.80.80.80.80.80.8
LogisticLogisticLogisticLogisticLogisticLogisticLogistic BMD Lower BoundBMD Lower BoundBMD Lower BoundBMD Lower BoundBMD Lower BoundBMD Lower BoundBMD Lower Bound
0 70.70.70.70.70.70.7 0 70.70.70.70.70.70.7
0.60.60.60.60.60.6 0.60.60.60.60.60.6
0.50.50.50.50.50.5
0.40.40.40.40.40.4
0.30.30.30.30.30.3
0.20.20.20.20.2
0.10.10.10.10.1 0.10.10.10.10.1
00000 00000
BMDLBMDLBMDLBMDLBMDL BMDBMDBMDBMDBMD BMDLBMDLBMDLBMDLBMDL BMDBMDBMDBMDBMD
00000 55555 1010101010 1515151515 2020202020 2525252525 3030303030 00000 55555 1010101010 1515151515 2020202020 2525252525 3030303030 dosedosedosedose dosedosedosedose
14:01 04/13 201014:01 04/13 201014:01 04/13 201014:01 04/13 2010 14:01 04/13 201014:01 04/13 201014:01 04/13 201014:01 04/13 2010
C: LogLogistic_LaVoie82_BbF_3doses_Dich_LogLogist D: LogProbit_LaVoie82_BbF_3doses_Dich_LogProbLoLog-Logistic Model with 0.95 Confidence LevelLog-Logistic Model with 0.95 Confidence LevelLog-Logistic Model with 0.95 Confidence Levelg-Logistic Model with 0.95 Confidence Level LogProbit Model with 0.95 Confidence LevelLogProbit Model with 0.95 Confidence LevelLogProbit Model with 0.95 Confidence LevelLogProbit Model with 0.95 Confidence Level
Log-LogisticLog-LogisticLog-Logistic LogProbitLogProbitLogProbit BMD Lower BoundBMD Lower BoundBMD Lower Bound
0.80.80.8 0.80.80.8
0.70.70.7 0.70.70.7
0.60.60.6 0.60.60.6
edFr
actio
n A
ffect
edFr
actio
n A
ffect
edFr
actio
n A
ffect
edFr
actio
n A
ffect
edFr
actio
n A
ffect
edFr
actio
n A
ffect
edFr
actio
n A
ffect
ed
Frac
tion
Affe
cted
0 50.50.5 0 50.50.5
0.40.4
0.30.3
0.20.2 0.20.2
0.10.1 0.10.1
0
0
14:01 04/13 2010
BMDL BMD
5 10 15
dose 20 25 30
0
14:01 04/13 2010
0
BMDL
5
BMD
10 15
dose 20 25 30
FrFrac
tac
tiion
Af
on A
fffeectct
edededFrFrFrFrFr
act
act
act
act
actiiiii
fon
Aff
on A
fon
Af
on A
fon
Afffffeeeeee
ctctctctctctedededededed
Frac
tion
Af

0.3 0.3 0.3 0.3 0.3 0.3
0.4 0.4 0.4 0.4 0.4 0.4
0.5 0.5 0.5 0.5 0.5 0.5
0.3 0.3
0.4 0.4
E: Multistage_LaVoie82_BbF_3doses_Dich_Multi F: Multistage-Cancer_LaVoie82_BbF_3doses_Dich_MultiCanc Multistage Model with 0.95 Confidence LevelMultistage Model with 0.95 Confidence LevelMultistage Model with 0.95 Confidence LevelMultistage Model with 0.95 Confidence LevelMultistage Model with 0.95 Confidence LevelMultistage Model with 0.95 Confidence LevelMultistage Model with 0.95 Confidence Level Multistage Cancer Model with 0.95 Confidence LevelMultistage Cancer Model with 0.95 Confidence LevelMultistage Cancer Model with 0.95 Confidence LevelMultistage Cancer Model with 0.95 Confidence LevelMultistage Cancer Model with 0.95 Confidence LevelMultistage Cancer Model with 0.95 Confidence LevelMultistage Cancer Model with 0.95 Confidence Level
0.80.80.80.80.80.80.8
MultistageMultistageMultistageMultistageMultistageMultistageMultistage BMD Lower BoundBMD Lower BoundBMD Lower BoundBMD Lower BoundBMD Lower BoundBMD Lower BoundBMD Lower Bound
0.80.80.80.80.80.80.8
Multistage CancerMultistage CancerMultistage CancerMultistage CancerMultistage CancerMultistage CancerMultistage Cancer Linear extrapolationLinear extrapolationLinear extrapolationLinear extrapolationLinear extrapolationLinear extrapolationLinear extrapolation BMD Lower BoundBMD Lower BoundBMD Lower BoundBMD Lower BoundBMD Lower BoundBMD Lower BoundBMD Lower Bound
0 70.70.70.70.70.70.7 0 70.70.70.70.70.70.7
0.60.60.60.60.60.6 0.60.60.60.60.60.6
0.50.50.50.50.50.5
0.40.40.40.40.40.4
0.30.30.30.30.30.3
0.20.20.20.20.2 0.20.20.20.20.2
0.10.10.10.10.1 0.10.10.10.10.1
00000 00000BMDBMDL BMDBMDLBMDLBMDLBMDL BMDBMDBMD BMDBMDL BMDBMDLBMDLBMDLBMDL BMDBMDBMD
00000 55555 1010101010 1515151515 2020202020 2525252525 3030303030 00000 55555 1010101010 1515151515 2020202020 2525252525 3030303030 dosedosedosedose dosedosedosedose
14:01 04/13 201014:01 04/13 201014:01 04/13 201014:01 04/13 2010 14:01 04/13 201014:01 04/13 201014:01 04/13 201014:01 04/13 2010
G: Probit_LaVoie82_BbF_3doses_Dich_Probit H: Weibull_LaVoie82_BbF_3doses_Dich_WeibullProbit Model with 0.95 Confidence LevelProbit Model with 0.95 Confidence LevelProbit Model with 0.95 Confidence LevelProbit Model with 0.95 Confidence Level Weibull Model with 0.95 Confidence LevelWeibull Model with 0.95 Confidence LevelWeibull Model with 0.95 Confidence LevelWeibull Model with 0.95 Confidence Level
ProbitProbitProbit WeibullWeibullWeibull BMD Lower BoundBMD Lower BoundBMD Lower Bound BMD Lower BoundBMD Lower BoundBMD Lower Bound
0.80.80.8 0.80.80.8
0.70.70.7 0.70.70.7
0.60.60.6 0.60.60.6
ed
Frac
tion
Affe
cted
Frac
tion
Affe
cted
Frac
tion
Affe
cted
Frac
tion
Affe
cted
Frac
tion
Affe
cted
Frac
tion
Affe
cted
Frac
tion
Affe
cted
Frac
tion
Affe
cted0.50.50.5 0.50.50.5
0.40.4
0.30.3
0.20.2 0.20.2
0.10.1 0.10.1
0
0
14:01 04/13 2010
5
BMDL BMD
10 15
dose 20 25 30
0
0
14:01 04/13 2010
BMDL
5
BMD
10 15
dose 20 25 30
ed
FrFrFrFrFrFrac
tac
tac
tac
tac
tac
tiiiiiion
Af
on A
fon
Af
on A
fon
Af
on A
fffffffeeeeeectctctctctct
ededededededFrFr
act
actiio
n A
fon
Afffee
ctcteded

I: Quantal-Linear LaVoie82 BbF 3doses Dich QntLinI: Quantal Linear_LaVoie82_BbF_3doses_Dich_QntLinQuantal Linear Model with 0.95 Confidence LevelQuantal Linear Model with 0.95 Confidence LevelQuantal Linear Model with 0.95 Confidence LevelQuantal Linear Model with 0.95 Confidence Level
0.6
0.7
0.8
Quantal LinearBMD Lower Bound
0.2
0.3
0.4
0.5
0.6
0.7
0.8
Frac
tion
Affe
cted
Quantal LinearBMD Lower Bound
0
0.1
0.2
0.3
0.4
0.5
0.6
0.7
0.8
Frac
tion
Affe
cted
BMDL BMD
Quantal LinearBMD Lower Bound
0
0.1
0.2
0.3
0.4
0.5
0.6
0.7
0.8
Frac
tion
Affe
cted
BMDL BMD
Quantal Linear BMD Lower Bound
00 55 1010 1515 2020 2525 3030 dosedose
14:01 04/13 201014:01 04/13 2010

Table C-9. LaVoie et al. (1982), benzo[j]fluoranthene, female mice. Dichotomous dose-response goodness-of-fit tests and benchmark dose estimates at 10% effect levels applied to study results.
Source Substance
Effect Endpoint Dichotomous Dose-Response
Model (1)
Goodness-of-Fit
POD (% Effect)
Dose (µg)
Notes
p-value for Chi-Square
Test (2) AIC (3)
Residuals (4)
Animal Tissue
Scaled Residual of
Interest
Maximum Scaled
Residual BMD BMDL LaVoie, 1982 without
highest dose (1000 µg/mouse)
BjF female mouse
Primarily squamous cell
papilloma Gamma 0.74 55 0 0.65 10% 11.6 7.9 Acceptable Fit
LaVoie, 1982 without highest dose
(1000 µg/mouse) BjF female
mouse
Primarily squamous cell
papilloma Logistic 0.042 62 1.5 1.5 10% 30.5 21.8
LaVoie, 1982 without highest dose
(1000 µg/mouse) BjF female
mouse
Primarily squamous cell
papilloma LogLogistic 0.97 54 0 0.17 10% 8.5 4.9
Acceptable Fit: LogLogistic model has the lowest maxmimum scaled residuals, lowest AIC, and highest p-value.
LaVoie, 1982 without highest dose
(1000 µg/mouse) BjF female
mouse
Primarily squamous cell
papilloma LogProbit 0.38 56 1.0 1.0 10% 18.9 13.4 Acceptable Fit
LaVoie, 1982 without highest dose
(1000 µg/mouse) BjF female
mouse
Primarily squamous cell
papilloma Multistage 0.74 55 0 0.65 10% 11.6 7.9 Acceptable Fit
LaVoie, 1982 without highest dose
(1000 µg/mouse) BjF female
mouse
Primarily squamous cell
papilloma Multistage-Cancer 0.74 55 0 0.65 10% 11.6 7.9 Acceptable Fit
LaVoie, 1982 without highest dose
(1000 µg/mouse) BjF female
mouse
Primarily squamous cell
papilloma Probit 0.048 61 1.5 1.5 10% 28.3 20.6
LaVoie, 1982 without highest dose
(1000 µg/mouse) BjF female
mouse
Primarily squamous cell
papilloma Weibull 0.74 55 0 0.65 10% 11.6 7.9 Acceptable Fit
LaVoie, 1982 without highest dose
(1000 µg/mouse) BjF female
mouse
Primarily squamous cell
papilloma Quantal-Linear 0.74 55 0 0.65 10% 11.6 7.9 Acceptable Fit
Abbreviations
AIC = Akaike's Information Criterion POD = point of departure
BMD = benchmark dose
BMDL = 1-sided 95% lower confidence limit for the benchmark dose
Notes
1. USEPA's BMDS v.2.1.1 was used to determine dose-response dichotomous data.
2. Chi-square test is a hypothesis test in which the null hypothesis is that data fit the dose-response function. Higher p-values indicate better fits.
3. For each dataset, models with relatively low AIC are indicative of better fits.
4. A scaled residual is the difference between the observed and predicted effect (i.e., percent response) divided by the standard deviation. Scaled Residual of Interest is a summary output parameter of the BMDS model, while the Maximum Scaled Residual is the maximum of the scaled residuals of each of the individual dose groups. Absolute value less than 2.0 is indicative of a good fit. Values in bold are >2.0.
5. Highest dose of 1000 µg/mouse was omitted to improve model fits.
References
LaVoie, E.J., S. Amin, S.S. Hecht et al. 1982. Tumour initiating activity of dihydrodiols of benzo[b]fluoranthene, benzo[j]fluoranthene, and benzo[k]fluoranthene. Carcinogenesis 3:49–52.

0.3 0.3 0.3 0.3 0.3 0.3
0.4 0.4 0.4 0.4 0.4 0.4
0.3 0.3
0.4 0.4
A: Gamma_LaVoie82_BjF_3doses_Dich_Gamma B: Logistic_LaVoie82_BjF_3doses_Dich_Logist Gamma Multi-Hit Model with 0.95 Confidence LevelGamma Multi-Hit Model with 0.95 Confidence LevelGamma Multi-Hit Model with 0.95 Confidence LevelGamma Multi-Hit Model with 0.95 Confidence LevelGamma Multi-Hit Model with 0.95 Confidence LevelGamma Multi-Hit Model with 0.95 Confidence LevelGamma Multi-Hit Model with 0.95 Confidence Level Logistic Model with 0.95 Confidence LevelLogistic Model with 0.95 Confidence LevelLogistic Model with 0.95 Confidence LevelLogistic Model with 0.95 Confidence LevelLogistic Model with 0.95 Confidence LevelLogistic Model with 0.95 Confidence LevelLogistic Model with 0.95 Confidence Level
0.80.80.80.80.80.80.8Gamma Multi-HitGamma Multi-HitGamma Multi-HitGamma Multi-HitGamma Multi-HitGamma Multi-HitGamma Multi-Hit
BMD Lower BoundBMD Lower BoundBMD Lower BoundBMD Lower BoundBMD Lower BoundBMD Lower BoundBMD Lower Bound 0.80.80.80.80.80.80.8LogisticLogisticLogisticLogisticLogisticLogisticLogistic
BMD Lower BoundBMD Lower BoundBMD Lower BoundBMD Lower BoundBMD Lower BoundBMD Lower BoundBMD Lower Bound
0.70.70.70.70.70.70.7 0.70.70.70.70.70.70.7
0.60.60.60.60.60.6 0.60.60.60.60.60.6
0.50.50.50.50.50.5 0.50.50.50.50.50.5
Frac
tion
Affe
cted
Frac
tion
Affe
cteded
Frac
tion
Affe
cted
Frac
tion
Affe
cted
Frac
tion
Affe
cted
Frac
tion
Affe
cted
Frac
tion
Affe
cted
Frac
tion
Affe
cted
0.20.20.20.20.2
0.10.10.10.10.1
00000BMDLBMDLBMDLBMDLBMDL BMDBMDBMDBMDBMD
00000 2020202020 4040404040 6060606060 8080808080 100100100100100 dosedosedosedose
13:11 04/15 201013:11 04/15 201013:11 04/15 201013:11 04/15 2010
C: LogLogistic_LaVoie82_BjF_3doses_Dich_LogLogist Log-Logistic Model with 0.95 Confidence LevelLog-Logistic Model with 0.95 Confidence LevelLog-Logistic Model with 0.95 Confidence LevelLog-Logistic Model with 0.95 Confidence Level
Log-LogisticLog-LogisticLog-Logistic0.80.80.8
0.70.70.7
0.60.60.6
0.50.50.5
Frac
tion
AFr
actio
n A
ffect
edffe
ctedd
ffect
edFr
actio
n A
ffect
edFr
actio
n A
Frac
tion
AFr
actio
n A
Frac
tion
Affe
cted
ffect
edffe
cted
ffect
edFr
actio
n A 0.40.40.40.40.40.4
0.30.30.30.30.30.3
0.20.20.20.20.2
0.10.10.10.10.1
00000BMDLBMDLBMDLBMDLBMDL BMDBMDBMDBMDBMD
00000 2020202020 4040404040 6060606060 8080808080 100100100100100 dosedosedosedose
13:11 04/15 201013:11 04/15 201013:11 04/15 201013:11 04/15 2010
D: LogProbit_LaVoie82_BjF_3doses_Dich_LogProbLogProbit Model with 0.95 Confidence LeveLogProbit Model with 0.95 Confidence LevelLogProbit Model with 0.95 Confidence LevelLogProbit Model with 0.95 Confidence Level
LogProbitLogProbitLogProbit0.80.80.8 BMD Lower BoundBMD Lower BoundBMD Lower Bound
0.70.70.7
0.60.60.6
0.50.50.5
0.40.4
0.30.3
0.20.2 0.20.2
0.10.1 0.10.1
0
0
13:11 04/15 2010
BMDL BMD
20 40
dose 60 80 100
0
0
13:11 04/15 2010
BMDL
20
BMD
40
dose 60 80 100

0.3 0.3 0.3 0.3 0.3 0.3
0.4 0.4 0.4 0.4 0.4 0.4
0.3 0.3
0.4 0.4
E: Multistage_LaVoie82_BjF_3doses_Dich_Multi F: Multistage-Cancer_LaVoie82_BjF_3doses_Dich_MultiCanc Multistage Model with 0.95 Confidence LevelMultistage Model with 0.95 Confidence LevelMultistage Model with 0.95 Confidence LevelMultistage Model with 0.95 Confidence LevelMultistage Model with 0.95 Confidence LevelMultistage Model with 0.95 Confidence LevelMultistage Model with 0.95 Confidence Level Multistage Cancer Model with 0.95 Confidence LevelMultistage Cancer Model with 0.95 Confidence LevelMultistage Cancer Model with 0.95 Confidence LevelMultistage Cancer Model with 0.95 Confidence LevelMultistage Cancer Model with 0.95 Confidence LevelMultistage Cancer Model with 0.95 Confidence LevelMultistage Cancer Model with 0.95 Confidence Level
0.80.80.80.80.80.80.8MultistageMultistageMultistageMultistageMultistageMultistageMultistage
BMD Lower BoundBMD Lower BoundBMD Lower BoundBMD Lower BoundBMD Lower BoundBMD Lower BoundBMD Lower Bound 0.80.80.80.80.80.80.8Multistage CancerMultistage CancerMultistage CancerMultistage CancerMultistage CancerMultistage CancerMultistage Cancer
Linear extrapolationLinear extrapolationLinear extrapolationLinear extrapolationLinear extrapolationLinear extrapolationLinear extrapolation BMD Lower BoundBMD Lower BoundBMD Lower BoundBMD Lower BoundBMD Lower BoundBMD Lower BoundBMD Lower Bound
0.70.70.70.70.70.70.7 0.70.70.70.70.70.70.7
0.60.60.60.60.60.6 0.60.60.60.60.60.6
0.50.50.50.50.50.5 0.50.50.50.50.50.5
0.40.40.40.40.40.4
0.30.30.30.30.30.3
0.20.20.20.20.2 0.20.20.20.20.2
0.10.10.10.10.1 0.10.10.10.10.1
00000 00000BMDBMDL BMDBMDLBMDLBMDLBMDL BMDBMDBMD BMDBMDL BMDBMDLBMDLBMDLBMDL BMDBMDBMD
00000 2020202020 4040404040 6060606060 8080808080 100100100100100 00000 2020202020 4040404040 6060606060 8080808080 100100100100100 dosedosedosedose dosedosedosedose
13:11 04/15 201013:11 04/15 201013:11 04/15 201013:11 04/15 2010 13:11 04/15 201013:11 04/15 201013:11 04/15 201013:11 04/15 2010
G: Probit_LaVoie82_BjF_3doses_Dich_Probit H: Weibull_LaVoie82_BjF_3doses_Dich_WeibullProbit Model with 0.95 Confidence LevelProbit Model with 0.95 Confidence LevelProbit Model with 0.95 Confidence LevelProbit Model with 0.95 Confidence Level Weibull Model with 0.95 Confidence LevelWeibull Model with 0.95 Confidence LevelWeibull Model with 0.95 Confidence LevelWeibull Model with 0.95 Confidence Level
ProbitProbitProbit WeibullWeibullWeibull0.80.80.8 0.80.80.8BMD Lower BoundBMD Lower BoundBMD Lower Bound BMD Lower BoundBMD Lower BoundBMD Lower Bound
0.70.70.7 0.70.70.7
0.60.60.6 0.60.60.6
0.50.50.5 0.50.50.5
ed
Frac
tion
AFr
actio
n A
Frac
tion
AFr
actio
n A
Frac
tion
AFr
actio
n A
ffect
edffe
cted
ffect
edffe
cted
ffect
edffe
cted
Frac
tion
AFr
actio
n A
ffect
edffe
cted
0.40.4
0.30.3
0.20.2
0.20.2
0.10.1 0.10.1
0BMDL BMD
0
BMDL BMD
0
13:11 04/15 2010
20 40
dose 60 80 100 0
13:11 04/15 2010
20 40
dose 60 80 100
ed
Frac
tion
Affe
cted
Frac
tion
Affe
cted
Frac
tion
Affe
cted
Frac
tion
Affe
cted
Frac
tion
Affe
cted
Frac
tion
Affe
cted
Frac
tion
Affe
cted
Frac
tion
Affe
cted

I: Quantal LinearQuantal-Linear_LaVoie82_BjFBjF_3d3dosesoses_DichDich_QntLinI: LaVoie82 QntLin Quantal Linear Model with 0.95 Confidence LevelQuantal Linear Model with 0.95 Confidence LevelQuantal Linear Model with 0.95 Confidence LevelQuantal Linear Model with 0.95 Confidence Level
0.6
0.7
0.8 Quantal LinearBMD Lower Bound
0 2
0.3
0.4
0.5
0.6
0.7
0.8
Frac
tion
Affe
cted
Quantal LinearBMD Lower Bound
0
0.1
0.2
0.3
0.4
0.5
0.6
0.7
0.8
Frac
tion
Affe
cted
BMDL BMD
Quantal LinearBMD Lower Bound
0
0.1
0.2
0.3
0.4
0.5
0.6
0.7
0.8
Frac
tion
Affe
cted
BMDL BMD
Quantal Linear BMD Lower Bound
00 2020 4040 6060 8080 100100 dosedose
13:11 04/15 201013:11 04/15 2010

sq are a n response p es
Table C-10. Rice et al. (1988), chrysene, female mice. Dichotomous dose-response goodness-of-fit tests and benchmark dose estimates at 10% effect levels applied to study results.
Source Substance
Effect Endpoint Dichotomous Dose-Response
Model (1)
Goodness-of-Fit
POD (% Effect)
Dose (µmol)
Notes
p-value for Chi-Square
Test (2) AIC (3)
Residuals (4)
Animal Tissue
Scaled Residual of
Interest
Maximum Scaled
Residual BMD BMDL Rice, 1988 without
highest dose (1.5 µmol) CH female mouse
Unspecified tumor Gamma NA 49 0 0 10% 0.10 0.040 Acceptable Fit
Rice, 1988 without highest dose (1.5 µmol) CH female
mouse Unspecified
tumor Logistic 1 48 0.21 -0.2 10% 0.10 0.069 Acceptable Fit
Rice, 1988 without highest dose (1.5 µmol) CH female
mouse Unspecified
tumor LogLogistic NA 49 0 0 10% 0.11 0.06 Acceptable Fit
Rice, 1988 without highest dose (1.5 µmol) CH female
mouse Unspecified
tumor LogProbit NA 49 0 0 10% 0.11 0.060 Acceptable Fit
Rice, 1988 without highest dose (1.5 µmol) CH female
mouse Unspecified
tumor Multistage NA 49 0 0 10% 0.095 0.034 Acceptable Fit
Rice, 1988 without highest dose (1.5 µmol) CH female
mouse Unspecified
tumor Multistage-Cancer NA 49 0 0 10% 0.095 0.034 Acceptable Fit
Rice, 1988 without highest dose (1.5 µmol) CH female
mouse Unspecified
tumor Probit 1 47 0.13 -0.1 10% 0.10 0.066 Acceptable Fit
Rice, 1988 without highest dose (1.5 µmol) CH female
mouse Unspecified
tumor Weibull NA 49 0 0 10% 0.097 0.038 Acceptable Fit
Rice, 1988 without highest dose (1.5 µmol) CH female
mouse Unspecified
tumor Quantal-Linear 0.074 51 0.24 -1.4 10% 0.033 0.023
Abbreviations
AIC = Akaike's Information Criterion POD = point of departure
BMD = benchmark dose
BMDL = 1-sided 95% lower confidence limit for the benchmark dose
Notes
1. USEPA's BMDS v.2.1.1 was used to determine dose-response dichotomous data.
2 Chi test is h pothesis test in hich the ll h pothesis is that data fit the dose f nction Higher al indicate better fits 2. Chi-square test is a hypothesis test in which the null hypothesis is that data fit the dose-response function. Higher p-values indicate better fits.
3. For each dataset, models with relatively low AIC are indicative of better fits.
4. A scaled residual is the difference between the observed and predicted effect (i.e., percent response) divided by the standard deviation. Scaled Residual of Interest is a summary output parameter of the BMDS model, while the Maximum Scaled Residual is the maximum of the scaled residuals of each of the individual dose groups. Absolute value less than 2.0 is indicative of a good fit. Values in bold are >2.0.
5. Highest dose of 1.5 µmol omitted to improve model fits.
References
Rice, J.E., K. Jordan, P. Little et al. 1988. Comparative tumor-initiating activity of methylene-bridged and bay-region methylated derivatives of benz[a]anthracene and chrysene. Carcinogenesis 9:2275–2278.

0.2 0.2 0.2 0.2 0.2
0.4 0.4 0.4 0.4 0.4 0.4
0.6 0.6 0.6 0.6 0.6 0.6
0.4 0.4
A: Gamma_Rice88_CH_3doses_Dich_Gamma B: Logistic_Rice88_CH_3doses_Dich_Logist Gamma Multi-Hit Model with 0.95 Confidence LevelGamma Multi-Hit Model with 0.95 Confidence LevelGamma Multi-Hit Model with 0.95 Confidence LevelGamma Multi-Hit Model with 0.95 Confidence LevelGamma Multi-Hit Model with 0.95 Confidence LevelGamma Multi-Hit Model with 0.95 Confidence LevelGamma Multi-Hit Model with 0.95 Confidence Level Logistic Model with 0.95 Confidence LevelLogistic Model with 0.95 Confidence LevelLogistic Model with 0.95 Confidence LevelLogistic Model with 0.95 Confidence LevelLogistic Model with 0.95 Confidence LevelLogistic Model with 0.95 Confidence LevelLogistic Model with 0.95 Confidence Level
Gamma Multi-HitGamma Multi-HitGamma Multi-HitGamma Multi-HitGamma Multi-HitGamma Multi-HitGamma Multi-Hit LogisticLogisticLogisticLogisticLogisticLogisticLogistic BMD Lower BoundBMD Lower BoundBMD Lower BoundBMD Lower BoundBMD Lower BoundBMD Lower BoundBMD Lower Bound BMD Lower BoundBMD Lower BoundBMD Lower BoundBMD Lower BoundBMD Lower BoundBMD Lower BoundBMD Lower Bound1111111 1111111
0.80.80.80.80.80.8 0.80.80.80.80.80.8
Frac
tion
Affe
cted
Frac
tion
Affe
cteded
Fr
actio
n A
ffect
edFr
actio
n A
ffect
edFr
actio
n A
ffect
edFr
actio
n A
ffect
edFr
actio
n A
ffect
edFr
actio
n A
ffect
ed
00000BMDLBMDLBMDLBMDLBMDL BMDBMDBMDBMDBMD
00000 0.10.10.10.10.1 0.20.20.20.20.2 0.30.30.30.30.3 0.40.40.40.40.4 0.50.50.50.50.5 dosedosedosedose
14:41 04/15 201014:41 04/15 201014:41 04/15 201014:41 04/15 2010
C: LogLogistic_Rice88_CH_3doses_Dich_LogLogist Log-Logistic Model with 0.95 Confidence LevelLog-Logistic Model with 0.95 Confidence LevelLog-Logistic Model with 0.95 Confidence LevelLog-Logistic Model with 0.95 Confidence Level
Log-LogisticLog-LogisticLog-Logistic 111
0.80.80.8
0 60.60.6
Frac
tion
AFr
actio
n A
ffect
edffe
ctedd
ffect
edFr
actio
n A
ffect
edFr
actio
n A
Frac
tion
AFr
actio
n A
Frac
tion
Affe
cted
ffect
edffe
cted
ffect
edFr
actio
n A
0.60.60.60.60.60.6
0.40.40.40.40.40.4
0.20.20.20.20.2
00000BMDLBMDLBMDLBMDLBMDL BMDBMDBMDBMDBMD
00000 0.10.10.10.10.1 0.20.20.20.20.2 0.30.30.30.30.3 0.40.40.40.40.4 0.50.50.50.50.5 dosedosedosedose
14:41 04/15 201014:41 04/15 201014:41 04/15 201014:41 04/15 2010
D: LogProbit_Rice88_CH_3doses_Dich_LogProbLogProbit Model with 0.95 Confidence LeveLogProbit Model with 0.95 Confidence LevelLogProbit Model with 0.95 Confidence LevelLogProbit Model with 0.95 Confidence Level
LogProbitLogProbitLogProbit BMD Lower BoundBMD Lower BoundBMD Lower Bound111
0.80.80.8
0 60.60.6
0.40.4
0.20.2
0.20.2
0
0
14:41 04/15 2010
BMDL
0.1
BMD
0.2
dose 0.3 0.4 0.5
0
0
14:41 04/15 2010
BMDL
0.1
BMD
0.2
dose 0.3 0.4 0.5

0.4 0.4 0.4 0.4 0.4 0.4
0.6 0.6 0.6 0.6 0.6 0.6
0.4 0.4
E: Multistage_Rice88_CH_3doses_Dich_Multi F: Multistage-Cancer_Rice88_CH_3doses_Dich_MultiCanc Multistage Model with 0.95 Confidence LevelMultistage Model with 0.95 Confidence LevelMultistage Model with 0.95 Confidence LevelMultistage Model with 0.95 Confidence LevelMultistage Model with 0.95 Confidence LevelMultistage Model with 0.95 Confidence LevelMultistage Model with 0.95 Confidence Level Multistage Cancer Model with 0.95 Confidence LevelMultistage Cancer Model with 0.95 Confidence LevelMultistage Cancer Model with 0.95 Confidence LevelMultistage Cancer Model with 0.95 Confidence LevelMultistage Cancer Model with 0.95 Confidence LevelMultistage Cancer Model with 0.95 Confidence LevelMultistage Cancer Model with 0.95 Confidence Level
MultistageMultistageMultistageMultistageMultistageMultistageMultistage Multistage CancerMultistage CancerMultistage CancerMultistage CancerMultistage CancerMultistage CancerMultistage Cancer 1111111 BMD Lower BoundBMD Lower BoundBMD Lower BoundBMD Lower BoundBMD Lower BoundBMD Lower BoundBMD Lower Bound Linear extrapolationLinear extrapolationLinear extrapolationLinear extrapolationLinear extrapolationLinear extrapolationLinear extrapolation
BMD Lower BoundBMD Lower BoundBMD Lower BoundBMD Lower BoundBMD Lower BoundBMD Lower BoundBMD Lower Bound 1111111
0.80.80.80.80.80.8 0.80.80.80.80.80.8
ed
Frac
tion
Affe
cted
Frac
tion
Affe
cted
Frac
tion
Affe
cted
Frac
tion
Affe
cted
Frac
tion
Affe
cted
Frac
tion
Affe
cted
Frac
tion
Affe
cted
Frac
tion
Affe
cted
0.20.20.20.20.2
00000
BMDBMDL BMDBMDLBMDLBMDLBMDL BMDBMDBMD
00000 0.10.10.10.10.1 0.20.20.20.20.2 0.30.30.30.30.3 0.40.40.40.40.4 0.50.50.50.50.5 dosedosedosedose
14:41 04/15 201014:41 04/15 201014:41 04/15 201014:41 04/15 2010
G: Probit_Rice88_CH_3doses_Dich_Probit Probit Model with 0.95 Confidence LevelProbit Model with 0.95 Confidence LevelProbit Model with 0.95 Confidence LevelProbit Model with 0.95 Confidence Level
ProbitProbitProbit BMD Lower BoundBMD Lower BoundBMD Lower Bound111
0.80.80.8
0 60.60.6 ed
Frac
tion
AFr
actio
n A
Frac
tion
AFr
actio
n A
Frac
tion
AFr
actio
n A
ffect
edffe
cted
ffect
edffe
cted
ffect
edffe
cted
Frac
tion
AFr
actio
n A
ffect
edffe
cted
0.60.60.60.60.60.6
0.40.40.40.40.40.4
0.20.20.20.20.2
00000
BMDBMDL BMDBMDLBMDLBMDLBMDL BMDBMDBMD
00000 0.10.10.10.10.1 0.20.20.20.20.2 0.30.30.30.30.3 0.40.40.40.40.4 0.50.50.50.50.5 dosedosedosedose
14:41 04/15 201014:41 04/15 201014:41 04/15 201014:41 04/15 2010
H: Weibull_Rice88_CH_3doses_Dich_WeibullWeibull Model with 0.95 Confidence LevelWeibull Model with 0.95 Confidence LevelWeibull Model with 0.95 Confidence LevelWeibull Model with 0.95 Confidence Level
WeibullWeibullWeibull BMD Lower BoundBMD Lower BoundBMD Lower Bound111
0.80.80.8
0 60.60.6
0.40.4
0.20.2
0.20.2
0BMDL BMD
0
BMDL BMD
14:41 04/15 2010
0 0.1 0.2
dose 0.3 0.4 0.5
14:41 04/15 2010
0 0.1 0.2
dose 0.3 0.4 0.5

I: Quantal-Linear Rice88 CH 3doses Dich QntLinI: Quantal Linear_Rice88_CH_3doses_Dich_QntLinQuantal Linear Model with 0.95 Confidence LevelQuantal Linear Model with 0.95 Confidence LevelQuantal Linear Model with 0.95 Confidence LevelQuantal Linear Model with 0.95 Confidence Level
0.8
1Quantal Linear
BMD Lower Bound
0.2
0.4
0.6
0.8
1
Frac
tion
Affe
cted
Quantal LinearBMD Lower Bound
0
0.2
0.4
0.6
0.8
1
Frac
tion
Affe
cted
BMDL BMD
Quantal LinearBMD Lower Bound
0
0.2
0.4
0.6
0.8
1
Frac
tion
Affe
cted
BMDL BMD
Quantal Linear BMD Lower Bound
00 0.10.1 0.20.2 0.30.3 0.40.4 0.50.5 dosedose
14:41 04/15 201014:41 04/15 2010

Table C-11. Rice et al. (1988), benz[b,c]aceanthrylene, female mice. Dichotomous dose-response goodness-of-fit tests and benchmark dose estimates at 10% effect levels applied to study results.
Source Substance
Effect Endpoint Dichotomous Dose-Response
Model (1)
Goodness-of-Fit
POD (% Effect)
Dose (µmol)
Notes
p-value for Chi-Square
Test (2) AIC (3)
Residuals (4)
Animal Tissue
Scaled Residual of
Interest
Maximum Scaled
Residual BMD BMDL
Rice, 1988 BbcAC female mouse
Unspecified tumor Gamma 0.00020 72 -0.86 -3.1 10% 0.10 0.074
Rice, 1988 BbcAC female mouse
Unspecified tumor Logistic 0.00010 81 2.5 -2.7 10% 0.26 0.19
Rice, 1988 BbcAC female mouse
Unspecified tumor LogLogistic 0.55 61 -0.021 -1.0 10% 0.026 0.013 Acceptable Fit:LogLogistic model has the lowest maxmimum scaled
residuals, lowest AIC, and highest p-value.
Rice, 1988 BbcAC female mouse
Unspecified tumor LogProbit 0.0011 68 -0.25 -3.2 10% 0.13 0.087
Rice, 1988 BbcAC female mouse
Unspecified tumor Multistage 0.00020 72 -0.86 -3.1 10% 0.10 0.074
Rice, 1988 BbcAC female mouse
Unspecified tumor Multistage-Cancer 0.00020 72 -0.86 -3.1 10% 0.10 0.074
Rice, 1988 BbcAC female mouse
Unspecified tumor Probit 0 82 2.5 -2.9 10% 0.30 0.23
Rice, 1988 BbcAC female mouse
Unspecified tumor Weibull 0.00020 72 -0.86 -3.1 10% 0.10 0.074
Rice, 1988 BbcAC female mouse
Unspecified tumor Quantal-Linear 0.00020 72 -0.86 -3.1 10% 0.10 0.074
Abbreviations
AIC = Akaike's Information Criterion POD = point of departure
BMD = benchmark dose
BMDL = 1-sided 95% lower confidence limit for the benchmark dose
Notes
1. USEPA's BMDS v.2.1.1 was used to determine dose-response dichotomous data. 1. USEPA s BMDS v.2.1.1 was used to determine dose-response dichotomous data.
2. Chi-square test is a hypothesis test in which the null hypothesis is that data fit the dose-response function. Higher p-values indicate better fits.
3. For each dataset, models with relatively low AIC are indicative of better fits.
4. A scaled residual is the difference between the observed and predicted effect (i.e., percent response) divided by the standard deviation. Scaled Residual of Interest is a summary output parameter of the BMDS model, while the Maximum Scaled Residual is the maximum of the scaled residuals of each of the individual dose groups. Absolute value less than 2.0 is indicative of a good fit. Values in bold are >2.0.
References
Rice, J.E., K. Jordan, P. Little et al. 1988. Comparative tumor-initiating activity of methylene-bridged and bay-region methylated derivatives of benz[a]anthracene and chrysene. Carcinogenesis 9:2275–2278.

0.4 0.4 0.4 0.4 0.4 0.4
0.6 0.6 0.6 0.6 0.6 0.6
0.4 0.4
A: Gamma_Rice88_BbcAC_Dich_Gamma B: Logistic_Rice88_BbcAC_Dich_Logist Gamma Multi-Hit Model with 0.95 Confidence LevelGamma Multi-Hit Model with 0.95 Confidence LevelGamma Multi-Hit Model with 0.95 Confidence LevelGamma Multi-Hit Model with 0.95 Confidence LevelGamma Multi-Hit Model with 0.95 Confidence LevelGamma Multi-Hit Model with 0.95 Confidence LevelGamma Multi-Hit Model with 0.95 Confidence Level Logistic Model with 0.95 Confidence LevelLogistic Model with 0.95 Confidence LevelLogistic Model with 0.95 Confidence LevelLogistic Model with 0.95 Confidence LevelLogistic Model with 0.95 Confidence LevelLogistic Model with 0.95 Confidence LevelLogistic Model with 0.95 Confidence Level
Gamma Multi-HitGamma Multi-HitGamma Multi-HitGamma Multi-HitGamma Multi-HitGamma Multi-HitGamma Multi-Hit LogisticLogisticLogisticLogisticLogisticLogisticLogistic BMD Lower BoundBMD Lower BoundBMD Lower BoundBMD Lower BoundBMD Lower BoundBMD Lower BoundBMD Lower Bound BMD Lower BoundBMD Lower BoundBMD Lower BoundBMD Lower BoundBMD Lower BoundBMD Lower BoundBMD Lower Bound1111111 1111111
0.80.80.80.80.80.8 0.80.80.80.80.80.8
0.60.60.60.60.60.6
0.40.40.40.40.40.4
0.20.20.20.20.2 0.20.20.20.20.2
00000 00000
BMDLBMDLBMDLBMDLBMDL BMDBMDBMDBMDBMD BMDLBMDLBMDLBMDLBMDL BMDBMDBMDBMDBMD
00000 0.50.50.50.50.5 11111 1.51.51.51.51.5 22222 2.52.52.52.52.5 33333 3.53.53.53.53.5 44444 00000 0.50.50.50.50.5 11111 1.51.51.51.51.5 22222 2.52.52.52.52.5 33333 3.53.53.53.53.5 44444 dosedosedosedose dosedosedosedose
15:38 04/13 201015:38 04/13 201015:38 04/13 201015:38 04/13 2010 15:38 04/13 201015:38 04/13 201015:38 04/13 201015:38 04/13 2010
C: LogLogistic_Rice88_BbcAC_Dich_LogLogist D: LogProbit_Rice88_BbcAC_Dich_LogProbLoLog-Logistic Model with 0.95 Confidence LevelLog-Logistic Model with 0.95 Confidence LevelLog-Logistic Model with 0.95 Confidence Levelg-Logistic Model with 0.95 Confidence Level LogProbit Model with 0.95 Confidence LeveLogProbit Model with 0.95 Confidence LevelLogProbit Model with 0.95 Confidence LevelLogProbit Model with 0.95 Confidence Level
Log-LogisticLog-LogisticLog-Logistic LogProbitLogProbitLogProbit 111 BMD Lower BoundBMD Lower BoundBMD Lower Bound111
0.80.80.8 0.80.80.8
Frac
tion
AFr
actio
n A
ffect
edffe
ctedd
ffe
cted
Frac
tion
Affe
cted
Frac
tion
AFr
actio
n A
Frac
tion
AFr
actio
n A
ffect
edffe
cted
ffect
edffe
cted
Frac
tion
A0 60.60.6 0 60.60.6
0.40.4
0.20.2
0.20.2
0BMDLBMD
0
BMDL BMD
0
15:38 04/13 2010
0.5 1 1.5 2
dose 2.5 3 3.5 4 0
15:38 04/13 2010
0.5 1 1.5 2
dose 2.5 3 3.5 4
Frac
tion
Affe
cted
Frac
tion
Affe
cteded
Fr
actio
n A
ffect
edFr
actio
n A
ffect
edFr
actio
n A
ffect
edFr
actio
n A
ffect
edFr
actio
n A
ffect
edFr
actio
n A
ffect
ed

0.4 0.4 0.4 0.4 0.4 0.4
0.6 0.6 0.6 0.6 0.6 0.6
E: Multistage_Rice88_BbcAC_Dich_Multi F: Multistage-Cancer_Rice88_BbcAC_Dich_MultiCanc Multistage Model with 0.95 Confidence LevelMultistage Model with 0.95 Confidence LevelMultistage Model with 0.95 Confidence LevelMultistage Model with 0.95 Confidence LevelMultistage Model with 0.95 Confidence LevelMultistage Model with 0.95 Confidence LevelMultistage Model with 0.95 Confidence Level Multistage Cancer Model with 0.95 Confidence LevelMultistage Cancer Model with 0.95 Confidence LevelMultistage Cancer Model with 0.95 Confidence LevelMultistage Cancer Model with 0.95 Confidence LevelMultistage Cancer Model with 0.95 Confidence LevelMultistage Cancer Model with 0.95 Confidence LevelMultistage Cancer Model with 0.95 Confidence Level
MultistageMultistageMultistageMultistageMultistageMultistageMultistage Multistage CancerMultistage CancerMultistage CancerMultistage CancerMultistage CancerMultistage CancerMultistage Cancer 1111111 BMD Lower BoundBMD Lower BoundBMD Lower BoundBMD Lower BoundBMD Lower BoundBMD Lower BoundBMD Lower Bound Linear extrapolationLinear extrapolationLinear extrapolationLinear extrapolationLinear extrapolationLinear extrapolationLinear extrapolation
BMD Lower BoundBMD Lower BoundBMD Lower BoundBMD Lower BoundBMD Lower BoundBMD Lower BoundBMD Lower Bound 1111111
0.80.80.80.80.80.8 0.80.80.80.80.80.8
ed
Frac
tion
Affe
cted
Frac
tion
Affe
cted
Frac
tion
Affe
cted
Frac
tion
Affe
cted
Frac
tion
Affe
cted
Frac
tion
Affe
cted
Frac
tion
Affe
cted
Frac
tion
Affe
cted
0.20.20.20.20.2
00000
BMDBMDL BMDBMDLBMDLBMDLBMDL BMDBMDBMD
00000 0.50.50.50.50.5 11111 1.51.51.51.51.5 22222 2.52.52.52.52.5 33333 3.53.53.53.53.5 44444 dosedosedosedose
15:38 04/13 201015:38 04/13 201015:38 04/13 201015:38 04/13 2010
G: Probit_Rice88_BbcAC_Dich_Probit Probit Model with 0.95 Confidence LevelProbit Model with 0.95 Confidence LevelProbit Model with 0.95 Confidence LevelProbit Model with 0.95 Confidence Level
ProbitProbitProbit BMD Lower BoundBMD Lower BoundBMD Lower Bound111
0.80.80.8
0 60.60.6
0.40.4
ed
Frac
tion
AFr
actio
n A
Frac
tion
AFr
actio
n A
Frac
tion
AFr
actio
n A
ffect
edffe
cted
ffect
edffe
cted
ffect
edffe
cted
Frac
tion
AFr
actio
n A
ffect
edffe
cted
0.60.60.60.60.60.6
0.40.40.40.40.40.4
0.20.20.20.20.2
00000
BMDBMDL BMDBMDLBMDLBMDLBMDL BMDBMDBMD
00000 0.50.50.50.50.5 11111 1.51.51.51.51.5 22222 2.52.52.52.52.5 33333 3.53.53.53.53.5dosedosedosedose
15:38 04/13 201015:38 04/13 201015:38 04/13 201015:38 04/13 2010
H: Weibull_Rice88_BbcAC_Dich_WeibullWeibull Model with 0.95 Confidence LevelWeibull Model with 0.95 Confidence LevelWeibull Model with 0.95 Confidence LevelWeibull Model with 0.95 Confidence Level
WeibullWeibullWeibull BMD Lower BoundBMD Lower BoundBMD Lower Bound111
0.80.80.8
0 60.60.6
0.40.4
0.20.2
0 0
BMDL BMD BMDL BMD
0 0.5 1 1.5 2 2.5 3 3.5 4 0 0.5 1 1.5 2 2.5 3 3.5 4
dose dose 15:38 04/13 2010 15:38 04/13 2010
4 4 4 4 4
0.2 0.2
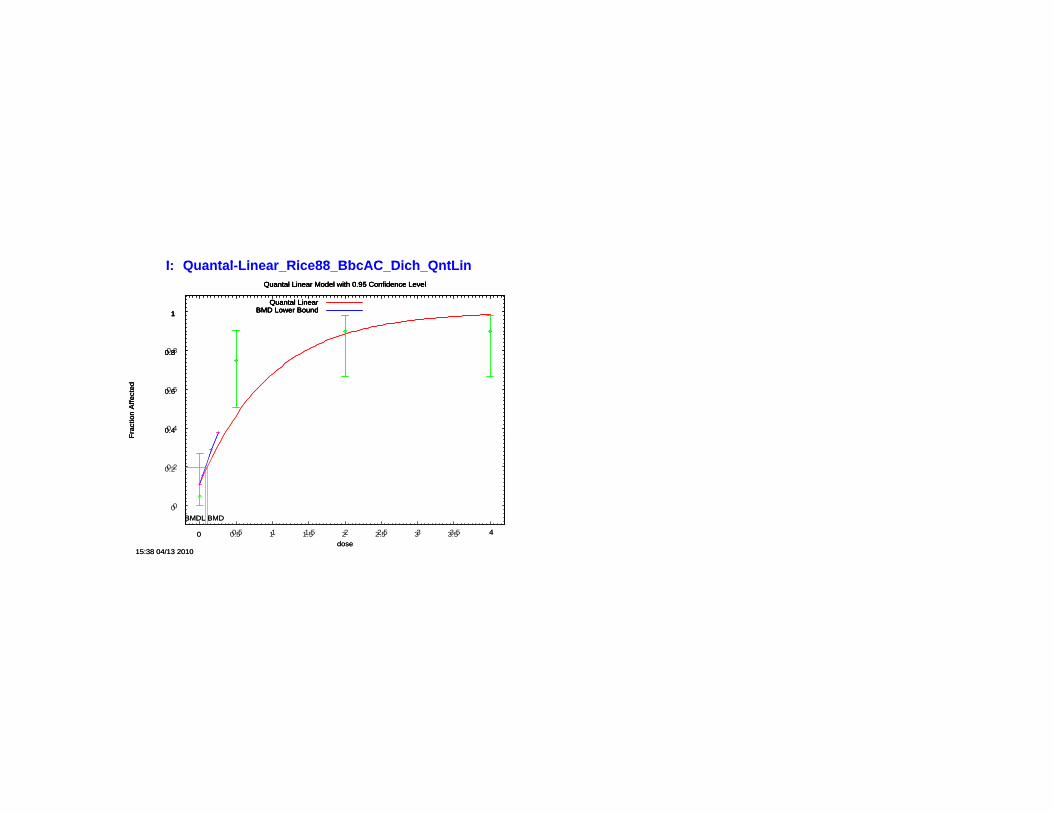
Frac
tion
Affe
cted
Frac
tion
Affe
cted
Frac
tion
Affe
cted
I:I: Quantal Linear Rice88 BbcAC Dich QntLinQuantal-Linear_Rice88_BbcAC_Dich_QntLinQuantal Linear Model with 0.95 Confidence LevelQuantal Linear Model with 0.95 Confidence LevelQuantal Linear Model with 0.95 Confidence LevelQuantal Linear Model with 0.95 Confidence Level
1111
0.80.80.80.8
0.60.60.6
0.40.40.4
0.20.2
00
Quantal LinearBMD Lower Bound
Quantal LinearBMD Lower Bound
BMDL BMD
Quantal LinearBMD Lower Bound
BMDL BMD
Quantal Linear BMD Lower Bound
00 0.50.5 11 1.51.5 22 2.52.5 33 3.53.5dosedose
15:38 04/13 201015:38 04/13 2010
4 4

- -
Source Substance
Effect Endpoint Continuous Dose-
Response Model (1)
POD Benchmark Response (BMR) (5)
Dose (mg-total)
Notes
p-value for Maximum Likelihood Tests (2)
AIC (3)
Residuals (4)
Animal Tissue Test 1 Test 2 Test 3 Test 4
Scaled Residual of
Interest
Maximum Scaled
Residual BMD BMDL
Busby, 1984 BaP male mouse
Adenoma + carcinoma Hill 1 SD Hill model not applicable
Busby, 1984 BaP male mouse
Adenoma + carcinoma Exponential 2 < 0.0001 < 0.0001 < 0.0001 0.0712 361 -0.1 -1.3 1 SD 1.3 1.1
Busby, 1984 BaP male mouse
Adenoma + carcinoma Exponential 3 < 0.0001 < 0.0001 < 0.0001 0.0712 361 -0.1 -1.3 1 SD 1.3 1.1
Busby, 1984 BaP male mouse
Adenoma + carcinoma Exponential 4 < 0.0001 < 0.0001 < 0.0001 NA 360 4.9E-07 6.7E-07 1 SD 0.57 0.30 Acceptable Fit: Exponential 4 model has the lowest
residuals and low AIC.
Busby, 1984 BaP male mouse
Adenoma + carcinoma Exponential 5 1 SD Exponential 5 model not applicable
Busby, 1984 BaP male mouse
Adenoma + carcinoma Linear <.0001 <.0001 <.0001 0.21 359 -0.22 1.0 1 SD 1.0 0.8
Busby, 1984 BaP male mouse
Adenoma + carcinoma Polynomial <.0001 <.0001 <.0001 NA 360 9.8E-11 5.5E-10 1 SD 0.51 0.26 Acceptable Fit: Polynomial model has the lowest
residuals and low AIC.
Busby, 1984 BaP male mouse
Adenoma + carcinoma Power <.0001 <.0001 <.0001 0.21 359 -0.22 0.97 1 SD 1.0 0.8
Table C-12. Busby et al. (1984), benzo[a]pyrene, male mouse. Continuous dose-response goodness-of-fit tests and benchmark dose estimates at 10% effect levels applied to study results.Goodness of Fit
Abbreviations AIC = Akaike's Information Criterion POD = point of departure BMD = benchmark dose BMDL = 1-sided 95% lower confidence limit for the benchmark dose
Notes 1. USEPA's BMDS v.2.1.1 was used to determine dose-response continuous data. 2. There are four Maximum Likelihood tests performed by BMDS that test the null hypothesis that the model fits the data as well as the "true" model.
Test 1. Tests the hypothesis that response and variance don't differ among dose levels. If this test accepts, there may not be a dose-response. P-values less than 0.1 indicate a model fit.
Test 2. Tests the hypothesis that variances are homogeneous. If this test accepts, the simpler constant variance model may be appropriate. P-values less than 0.1 indicate a model fit.
Test 3. (non-constant variance model) Test the hypothesis that the variances are adequately modeled. If this test accepts, it may be appropriate to conclude that the variances have been modeled appropriately.
Test 4. (non-constant variance model). Tests the hypothesis that the model for the mean fits the data. If this tests accepts, the user has support for the selected model. P-values greater than 0.1 indicate a model fit.
3. For each dataset, models with relatively low AIC are indicative of better fits.4. A scaled residual is the difference between the observed and predicted effect (i.e., percent response) divided by the standard deviation. Scaled Residual of Interest is a summary output parameter of the
model while the Maximum Scaled Residual is the maximum of the scaled residuals of each of the individual dose groups Absolute value less than 2 0 i indicative of a good Values in bold are >2BMDSBMDS model, while the Maximum Scaled Residual is the maximum of the scaled residuals of each of the individual dose groups. Absolute value less than 2.0 iss indicative of a good fitfit. Values in bold are >2.00. 5. For multidose continuous data, the BMR used in estimating the point of departure was a change of 1 standard deviation (1 SD) from the control mean.
References
Busby, W.F.J., M.E. Goldman, P.M. Newberne et al. 1984. Tumorigenicity of fluoranthene in a newborn mouse lung adenoma bioassay. Carcinogenesis 5:1311–1316.

6 6 6 6 6 6
8 8 8 8 8 8
10 10 10 10 10 10
6 6
8 8
Mea
n R
Mea
n R
eespo
nse
spon
seeM
ean
Re
Mea
n R
eM
ean
RM
ean
RM
ean
RM
ean
Reeees
pons
esp
onse
spon
sesp
onse
spon
sesp
onse
A: Exponential2_Busby84_BaP_M_Cont_Exp B: Exponential3_Busby84_BaP_M_Cont_Exp Exponential Model 2 with 0.95 Confidence LevelExponential Model 2 with 0.95 Confidence LevelExponential Model 2 with 0.95 Confidence LevelExponential Model 2 with 0.95 Confidence LevelExponential Model 2 with 0.95 Confidence LevelExponential Model 2 with 0.95 Confidence LevelExponential Model 2 with 0.95 Confidence Level Exponential Model 3 with 0.95 Confidence LevelExponential Model 3 with 0.95 Confidence LevelExponential Model 3 with 0.95 Confidence LevelExponential Model 3 with 0.95 Confidence LevelExponential Model 3 with 0.95 Confidence LevelExponential Model 3 with 0.95 Confidence LevelExponential Model 3 with 0.95 Confidence Level
ExponentialExponentialExponentialExponentialExponentialExponentialExponential ExponentialExponentialExponentialExponentialExponentialExponentialExponential
16161616161616 16161616161616
141414141414 141414141414
121212121212 121212121212
MMMMMMea
n R
ean
Rea
n R
ean
Rea
n R
ean
Reeeeees
pons
esp
onse
spon
sesp
onse
spon
sesp
onse 101010101010
888888
666666
44444 44444
22222 22222
00000
00000
16:10 04/13 201016:10 04/13 201016:10 04/13 201016:10 04/13 2010
0.20.20.20.20.2 0.40.40.40.40.4 0.60.60.60.60.6dosedosedosedose
0.80.80.80.80.8 11111
BMDLBMDLBMDLBMDLBMDL
1.21.21.21.21.2 1.41.41.41.41.4
BMDBMDBMDBMDBMD 00000
00000
16:10 04/13 201016:10 04/13 201016:10 04/13 201016:10 04/13 2010
0.20.20.20.20.2 0.40.40.40.40.4 0.60.60.60.60.6dosedosedosedose
0.80.80.80.80.8 11111
BMDLBMDLBMDLBMDLBMDL
1.21.21.21.21.2 1.41.41.41.41.4
BMDBMDBMDBMDBMD
C: Exponential4_Busby84_BaP_M_Cont_Exp Exponential Model 4 with 0.95 Confidence Level
161616
Exponential Model 4 with 0.95 Confidence LevelExponential Model 4 with 0.95 Confidence LevelExponential Model 4 with 0.95 Confidence Level
ExponentialExponentialExponential
D: Linear_Busby84_BaP_M_Cont_LinLinear Model with 0.95 Confidence Level
161616
Linear Model with 0.95 Confidence LevelLinear Model with 0.95 Confidence LevelLinear Model with 0.95 Confidence Level
LinearLinearLinear BMD Lower BoundBMD Lower BoundBMD Lower Bound
141414 141414
121212 121212
101010
MMea
n R
ean
Rees
pons
esp
onsee 101010
88
66
44 44
22 22
0
0
16:10 04/13 2010
BMDL
0.2 0.4
BMD
0.6dose
0.8 1 1.2 1.4
0
0
16:10 04/13 2010
0.2 0.4 0.6
BMDL
0.8
dose 1
BMD
1.2 1.4

6 6 6
8 8 8
10 10 10
Mea
n R
Mea
n R
Mea
n R
eeespo
nse
spon
sesp
onse
E:E: Polynomial Busby84 BaP M Cont Poly F:F: Power Busby84 BaP M Cont PowPolynomial_Busby84_BaP_M_Cont_Poly Power_Busby84_BaP_M_Cont_Pow Polynomial Model with 0.95 Confidence LevelPolynomial Model with 0.95 Confidence LevelPolynomial Model with 0.95 Confidence LevelPolynomial Model with 0.95 Confidence Level Power Model with 0.95 Confidence LevelPower Model with 0.95 Confidence LevelPower Model with 0.95 Confidence LevelPower Model with 0.95 Confidence Level
PolynomialBMD Lower Bound
PolynomialBMD Lower Bound
BMDBMDL
PolynomialBMD Lower Bound
BMDBMDL
Polynomial BMD Lower Bound
00 0.20.2 0.40.4 0.60.6 0.80.8 11 1.21.2 1.41.4
PowerPower
BMDBMDL
Power
BMDBMDL
Power 14141414
16161616
12121212 14141414
10101010 12121212
888
MMMea
n R
ean
Rea
n R
eeespo
nse
spon
sesp
onse
666
444
222 44
00 22
-2-2 00
-4-4
00 0.20.2 0.40.4 0.60.6 0.80.8 11 1.21.2 1.41.4 dosedose dosedose
16:1016:10 04/13 201004/13 2010 16:10 04/13 201016:10 04/13 2010

Table C-13. Busby et al. (1984), benzo[a]pyrene, female mouse. Continuous dose-response goodness-of-fit tests and benchmark dose estimates at 10% effect levels applied to study results.
Source Substance
Effect Endpoint Continuous
Dose-Response Model (1)
Goodness-of-Fit POD
Benchmark Response (BMR) (5)
Dose (mg-total)
Notes
p-value for Maximum Likelihood Tests (2)
AIC (3)
Residuals (4)
Animal Tissue Test 1 Test 2 Test 3 Test 4
Scaled Residual of
Interest
Maximum Scaled
Residual BMD BMDL Busby, 1984 BaP female
mouse Adenoma + carcinoma Hill 1 SD Hill model not applicable
Busby, 1984 BaP female
mouse Adenoma + carcinoma Exponential 2 < 0.0001 < 0.0001 < 0.0001 0.0002 277 -0.25 2.5 1 SD 1.6 1.3
Busby, 1984 BaP female
mouse Adenoma + carcinoma Exponential 3 < 0.0001 < 0.0001 < 0.0001 0.0002 277 -0.25 2.5 1 SD 1.6 1.3
Busby, 1984 BaP female
mouse Adenoma + carcinoma Exponential 4 < 0.0001 < 0.0001 < 0.0001 N/A 266 3.4E-06 5.9E-06 1 SD 0.20 0.0010 Acceptable Fit; Exponential 4 model has the lowest
residuals and low AIC. Busby, 1984 BaP female
mouse Adenoma + carcinoma Exponential 5 1 SD Exponential 5 model not applicable
Busby, 1984 BaP female
mouse Adenoma + carcinoma Linear <.0001 <.0001 <.0001 6.2E-04 276 -0.54 2.6 1 SD 1.46 0.99
Busby, 1984 BaP female
mouse Adenoma + carcinoma Polynomial <.0001 <.0001 <.0001 NA 266 4.3E-10 1.6E-09 1 SD 0.24 0.16 Acceptable Fit:Polynomial model has the lowest
residuals and low AIC. Busby, 1984 BaP female
mouse Adenoma + carcinoma Power <.0001 <.0001 <.0001 6.2E-04 276 -0.54 2.56 1 SD 1.46 0.99
Abbreviations AIC = Akaike's Information Criterion POD = point of departure BMD = benchmark dose BMDL = 1-sided 95% lower confidence limit for the benchmark dose
Notes 1. USEPA's BMDS v.2.1.1 was used to determine dose-response continuous data. 2. There are four Maximum Likelihood tests performed by BMDS that test the null hypothesis that the model fits the data as well as the "true" model.
Test 1. Tests the hypothesis that response and variance don't differ among dose levels. If this test accepts, there may not be a dose-response. P-values less than 0.1 indicate a model fit.
Test 2. Tests the hypothesis that variances are homogeneous. If this test accepts, the simpler constant variance model may be appropriate. P-values less than 0.1 indicate a model fit.
Test 3. (non-constant variance model) Test the hypothesis that the variances are adequately modeled. If this test accepts, it may be appropriate to conclude that the variances have been modeled appropriately.
Test 4. (non-constant variance model). Tests the hypothesis that the model for the mean fits the data. If this tests accepts, the user has support for the selected model. P-values greater than 0.1 indicate a model fit.
3. For each dataset, models with relatively low AIC are indicative of better fits., y 4. A scaled residual is the difference between the observed and predicted effect (i.e., percent response) divided by the standard deviation. Scaled Residual of Interest is a summary output parameter of the BMDS model, while the Maximum Scaled Residual is the maximum of the scaled residuals of each of the individual dose groups. Absolute value less than 2.0 is indicative of a good fit. Values in bold are >2.0. 5. For multidose continuous data, the BMR used in estimating the point of departure was a change of 1 standard deviation (1 SD) from the control mean.
References
Busby, W.F.J., M.E. Goldman, P.M. Newberne et al. 1984. Tumorigenicity of fluoranthene in a newborn mouse lung adenoma bioassay. Carcinogenesis 5:1311–1316.

3 3 3 3 3 3
4 4 4 4 4 4
3 3
4 4 4
A: Exponential2_Busby84_BaP_F_Cont_Exp B: Exponential3_Busby84_BaP_F_Cont_Exp Exponential Model 2 with 0.95 Confidence LevelExponential Model 2 with 0.95 Confidence LevelExponential Model 2 with 0.95 Confidence LevelExponential Model 2 with 0.95 Confidence LevelExponential Model 2 with 0.95 Confidence LevelExponential Model 2 with 0.95 Confidence LevelExponential Model 2 with 0.95 Confidence Level Exponential Model 3 with 0.95 Confidence LevelExponential Model 3 with 0.95 Confidence LevelExponential Model 3 with 0.95 Confidence LevelExponential Model 3 with 0.95 Confidence LevelExponential Model 3 with 0.95 Confidence LevelExponential Model 3 with 0.95 Confidence LevelExponential Model 3 with 0.95 Confidence Level
ExponentialExponentialExponentialExponentialExponentialExponentialExponential ExponentialExponentialExponentialExponentialExponentialExponentialExponential
6666666 6666666
555555 555555
Mea
n R
Mea
n R
eespo
nse
spon
seeM
ean
Re
Mea
n R
eM
ean
RM
ean
RM
ean
RM
ean
Reeees
pons
esp
onse
spon
sesp
onse
spon
sesp
onse
MMMMMMea
n R
ean
Rea
n R
ean
Rea
n R
ean
Reeeeees
pons
esp
onse
spon
sesp
onse
spon
sesp
onse 444444
333333
22222
11111
00000
00000
16:29 04/13 201016:29 04/13 201016:29 04/13 201016:29 04/13 2010
0.20.20.20.20.2 0.40.40.40.40.4 0.60.60.60.60.6 0.80.80.80.80.8dosedosedosedose
11111 1.21.21.21.21.2
BMDLBMDLBMDLBMDLBMDL
1.41.41.41.41.4 1.61.61.61.61.6
BMDBMDBMDBMDBMD
C: Exponential4_Busby84_BaP_F_Cont_Exp Exponential Model 4 with 0.95 Confidence Level
666
Exponential Model 4 with 0.95 Confidence LevelExponential Model 4 with 0.95 Confidence LevelExponential Model 4 with 0.95 Confidence Level
ExponentialExponentialExponential
555
22222
11111
00000
00000
16:29 04/13 201016:29 04/13 201016:29 04/13 201016:29 04/13 2010
0.20.20.20.20.2 0.40.40.40.40.4 0.60.60.60.60.6 0.80.80.80.80.8dosedosedosedose
11111 1.21.21.21.21.2
BMDLBMDLBMDLBMDLBMDL
1.41.41.41.41.4 1.61.61.61.61.6
BMDBMDBMDBMDBMD
D: Linear_Busby84_BaP_F_Cont_Lin Linear Model with 0.95 Confidence Level
666
Linear Model with 0.95 Confidence LevelLinear Model with 0.95 Confidence LevelLinear Model with 0.95 Confidence Level
LinearLinearLinear BMD Lower BoundBMD Lower BoundBMD Lower Bound
555
MMea
n R
ean
Rees
pons
esp
onsee 444
33
22
11
0 0
BMDL BMD BMDL BMD
0 0.2 0.4 0.6 0.8 1 1.2 1.4 0 0.2 0.4 0.6 0.8 1 1.2 1.4
dose dose 16:29 04/13 2010 16:29 04/13 2010
1 1
2 2

3 3 3
4 4 4
Mea
n R
Mea
n R
Mea
n R
eeespo
nse
spon
sesp
onse
E: PolPolynomialynomial Busb_Busby84y84 BaP F Cont Pol_BaP_F_Cont_Polyy F: PowerPower_BusbBusby84y84 BaP F Cont Pow_BaP_F_Cont_PowE: F: Polynomial Model with 0.95 Confidence LevelPolynomial Model with 0.95 Confidence LevelPolynomial Model with 0.95 Confidence LevelPolynomial Model with 0.95 Confidence Level Power Model with 0.95 Confidence LevelPower Model with 0.95 Confidence LevelPower Model with 0.95 Confidence LevelPower Model with 0.95 Confidence Level
PolynomialBMD Lower Bound
PolynomialBMD Lower Bound
BMDBMDL
PolynomialBMD Lower Bound
BMDBMDL
Polynomial BMD Lower Bound
00 0.20.2 0.40.4 0.60.6 0.80.8 11 1.21.2 1.41.4
PowerPower
BMDBMDL
Power
BMDBMDL
Power6666
6666 5555
5555 4444
MMMea
n R
ean
Rea
n R
eeespo
nse
spon
sesp
onse 333
222
222 111
0011
-1-100
00 0.20.2 0.40.4 0.60.6 0.80.8 11 1.21.2 1.41.4 dosedose dosedose
16:29 04/13 201016:29 04/13 2010 16:30 04/13 201016:30 04/13 2010

Table C-14. Busby et al. (1984), fluoranthene, male mouse. Continuous dose-response goodness-of-fit tests and benchmark dose estimates at 10% effect levels applied to study results.
Source Substance
Effect Endpoint Continuous
Dose-Response Model (1)
Goodness-of-Fit POD
Benchmark Response (BMR) (5)
Dose (mg-total)
Notes
p-value for Maximum Likelihood Tests (2)
AIC (3)
Residuals (4)
Animal Tissue Test 1 Test 2 Test 3 Test 4
Scaled Residual of
Interest
Maximum Scaled
Residual BMD BMDL Busby, 1984 FA male
mouse Adenoma + carcinoma Hill Hill model not applicable
Busby, 1984 FA male
mouse Adenoma + carcinoma Exponential 2 < 0.0001 < 0.0001 < 0.0001 0.55 100 -0.011 -0.49 1 SD 3.1 2.9 Acceptable Fit
Busby, 1984 FA male
mouse Adenoma + carcinoma Exponential 3 < 0.0001 < 0.0001 < 0.0001 0.55 100 -0.011 -0.49 1 SD 3.1 2.9 Acceptable Fit
Busby, 1984 FA male
mouse Adenoma + carcinoma Exponential 4 < 0.0001 < 0.0001 < 0.0001 N/A 102 2.9E-02 -0.14 1 SD 2.5 1.9 Acceptable Fit
Busby, 1984 FA male
mouse Adenoma + carcinoma Exponential 5 Exponential 5 model not applicable
Busby, 1984 FA male
mouse Adenoma + carcinoma Linear <.0001 <.0001 <.0001 0.86 100 0.029 -0.14 1 SD 2.5 1.9 Acceptable Fit
Busby, 1984 FA male
mouse Adenoma + carcinoma Polynomial <.0001 <.0001 <.0001 NA 102 8.0E-11 8.0E-11 1 SD 2.6 1.1 Acceptable Fit
Busby, 1984 FA male
mouse Adenoma + carcinoma Power <.0001 <.0001 <.0001 NA 102 0 0 1 SD 2.6 1.9 Acceptable Fit:Power model has the lowest residuals.
Abbreviations AIC = Akaike's Information Criterion POD = point of departure BMD = benchmark dose BMDL = 1-sided 95% lower confidence limit for the benchmark dose
Notes 1. USEPA's BMDS v.2.1.1 was used to determine dose-response continuous data. 2. There are four Maximum Likelihood tests performed by BMDS that test the null hypothesis that the model fits the data as well as the "true" model.
Test 1. Tests the hypothesis that response and variance don't differ among dose levels. If this test accepts, there may not be a dose-response. P-values less than 0.1 indicate a model fit.
Test 2. Tests the hypothesis that variances are homogeneous. If this test accepts, the simpler constant variance model may be appropriate. P-values less than 0.1 indicate a model fit.
Test 3. (non-constant variance model) Test the hypothesis that the variances are adequately modeled. If this test accepts, it may be appropriate to conclude that the variances have been modeled appropriately.
Test 4. (non-constant variance model). Tests the hypothesis that the model for the mean fits the data. If this tests accepts, the user has support for the selected model. P-values greater than 0.1 indicate a model fit.
For each dataset, models with relatively low AIC are indicative of better fits.3.3. For each dataset, models with relatively low AIC are indicative of better fits. 4. A scaled residual is the difference between the observed and predicted effect (i.e., percent response) divided by the standard deviation. Scaled Residual of Interest is a summary output parameter of the
BMDS model, while the Maximum Scaled Residual is the maximum of the scaled residuals of each of the individual dose groups. Absolute value less than 2.0 is indicative of a good fit. Values in bold are >2.0.
5. For multidose continuous data, the BMR used in estimating the point of departure was a change of 1 standard deviation (1 SD) from the control mean.
References
Busby, W.F.J., M.E. Goldman, P.M. Newberne et al. 1984. Tumorigenicity of fluoranthene in a newborn mouse lung adenoma bioassay. Carcinogenesis 5:1311–1316.

1 1 1 1 1 1
1 1
A: Exponential2_Busby84_FA_M_Cont_Exp B: Exponential3_Busby84_FA_M_Cont_Exp Exponential Model 2 with 0.95 Confidence LevelExponential Model 2 with 0.95 Confidence LevelExponential Model 2 with 0.95 Confidence LevelExponential Model 2 with 0.95 Confidence LevelExponential Model 2 with 0.95 Confidence LevelExponential Model 2 with 0.95 Confidence LevelExponential Model 2 with 0.95 Confidence Level Exponential Model 3 with 0.95 Confidence LevelExponential Model 3 with 0.95 Confidence LevelExponential Model 3 with 0.95 Confidence LevelExponential Model 3 with 0.95 Confidence LevelExponential Model 3 with 0.95 Confidence LevelExponential Model 3 with 0.95 Confidence LevelExponential Model 3 with 0.95 Confidence Level
ExponentialExponentialExponentialExponentialExponentialExponentialExponential ExponentialExponentialExponentialExponentialExponentialExponentialExponential
2222222 2222222
1.51.51.51.51.51.5 1.51.51.51.51.51.5
Mea
n R
Mea
n R
eespo
nse
spon
seeM
ean
Re
Mea
n R
eM
ean
RM
ean
RM
ean
RM
ean
Reeees
pons
esp
onse
spon
sesp
onse
spon
sesp
onse
MMMMMMea
n R
ean
Rea
n R
ean
Rea
n R
ean
Reeeeees
pons
esp
onse
spon
sesp
onse
spon
sesp
onse
111111
0.50.50.50.50.5
00000
BMDBMDL BMDBMDLBMDLBMDLBMDL BMDBMDBMD
00000 0.50.50.50.50.5 11111 1.51.51.51.51.5 22222 2.52.52.52.52.5 33333 3.53.53.53.53.5 dosedosedosedose
11:42 04/15 201011:42 04/15 201011:42 04/15 201011:42 04/15 2010
C: Exponential4_Busby84_FA_M_Cont_Exp Exponential Model 4 with 0.95 Confidence LevelExponential Model 4 with 0.95 Confidence LevelExponential Model 4 with 0.95 Confidence LevelExponential Model 4 with 0.95 Confidence Level
ExponentialExponentialExponential
222
1.51.51.5
0.50.50.50.50.5
00000
BMDBMDL BMDBMDLBMDLBMDLBMDL BMDBMDBMD
00000 0.50.50.50.50.5 11111 1.51.51.51.51.5 22222 2.52.52.52.52.5 33333 3.53.53.53.53.5 dosedosedosedose
11:42 04/15 201011:42 04/15 201011:42 04/15 201011:42 04/15 2010
D: Linear_Busby84_FA_M_Cont_Lin Linear Model with 0.95 Confidence LevelLinear Model with 0.95 Confidence LevelLinear Model with 0.95 Confidence LevelLinear Model with 0.95 Confidence Level
LinearLinearLinear BMD Lower BoundBMD Lower BoundBMD Lower Bound
222
1.51.51.5
MMea
n R
ean
Rees
pons
esp
onsee
11
0.50.5
0
BMDL BMD BMDL BMD
0 0.5 1 1.5 2 2.5 3 3.5 0 0.5 1 1.5 2 2.5 3 3.5
dose dose 11:42 04/15 2010 11:42 04/15 2010
0
0.5 0.5

1 1 1
Mea
n R
Mea
n R
Mea
n R
eeespo
nse
spon
sesp
onse
E: PolPolynomialynomial Busb_Busby84y84 FA M Cont Pol_FA_M_Cont_Polyy F: PowerPower_BusbBusby84y84 FA M Cont Pow_FA_M_Cont_PowE: F: Polynomial Model with 0.95 Confidence LevelPolynomial Model with 0.95 Confidence LevelPolynomial Model with 0.95 Confidence LevelPolynomial Model with 0.95 Confidence Level Power Model with 0.95 Confidence LevelPower Model with 0.95 Confidence LevelPower Model with 0.95 Confidence LevelPower Model with 0.95 Confidence Level
PolynomialBMD Lower Bound
PolynomialBMD Lower Bound
BMDBMDL
PolynomialBMD Lower Bound
BMDBMDL
Polynomial BMD Lower Bound
00 0.50.5 11 1.51.5 22 2.52.5 33 3.53.5
2222PowerPower
BMDBMDL
Power
BMDBMDL
Power
2222
1.51.51.51.5
1 51.51.51.5
MMMea
n R
ean
Rea
n R
eeespo
nse
spon
sesp
onse
111
0.50.50.5
0.50.50.5
00
00-0.5-0.5
00 0.50.5 11 1.51.5 22 2.52.5 33 3.53.5 dosedose dosedose
11:42 04/15 201011:42 04/15 2010 11:42 04/15 201011:42 04/15 2010

Table C-15. Busby et al. (1984), fluoranthene, female mouse. Continuous dose-response goodness-of-fit tests and benchmark dose estimates at 10% effect levels applied to study results.
Source Substance
Effect Endpoint Continuous
Dose-Response Model (1)
Goodness-of-Fit POD
Benchmark Response (BMR) (5)
Dose (mg-total)
Notes
p-value for Maximum Likelihood Tests (2)
AIC (3)
Residuals (4)
Animal Tissue Test 1 Test 2 Test 3 Test 4
Scaled Residual of
Interest
Maximum Scaled
Residual BMD BMDL Busby, 1984 FA female
mouse Adenoma + carcinoma Hill Hill model not applicable
Busby, 1984 FA female
mouse Adenoma + carcinoma Exponential 2 1.9E-04 3.7E-04 3.7E-04 0.85 -4.8 0.0089 -0.14 1 SD 4.2 3.3 Acceptable Fit
Busby, 1984 FA female
mouse Adenoma + carcinoma Exponential 3 1.9E-04 3.7E-04 3.7E-04 N/A -2.8 9.9E-10 2.8E-09 1 SD 3.9 3.3 Acceptable Fit
Busby, 1984 FA female
mouse Adenoma + carcinoma Exponential 4 1.9E-04 3.7E-04 3.7E-04 N/A -2.6 0.069 -0.35 1 SD 5.0 3.0 Acceptable Fit
Busby, 1984 FA female
mouse Adenoma + carcinoma Exponential 5 Exponential 5 model not applicable
Busby, 1984 FA female
mouse Adenoma + carcinoma Linear 1.9E-04 3.7E-04 3.7E-04 0.67 -4.6 0.069 -0.35 1 SD 5.0 3.0 Acceptable Fit
Busby, 1984 FA female
mouse Adenoma + carcinoma Polynomial 1.9E-04 3.7E-04 3.7E-04 NA -2.8 5.5E-11 5.5E-11 1 SD 4.2 2.0 Acceptable Fit
Busby, 1984 FA female
mouse Adenoma + carcinoma Power 1.9E-04 3.7E-04 3.7E-04 NA -2.8 0 0 1 SD 4.2 3.0 Acceptable Fit
Abbreviations AIC = Akaike's Information Criterion POD = point of departure BMD = benchmark dose BMDL = 1-sided 95% lower confidence limit for the benchmark dose
Notes 1. USEPA's BMDS v.2.1.1 was used to determine dose-response continuous data. 2. There are four Maximum Likelihood tests performed by BMDS that test the null hypothesis that the model fits the data as well as the "true" model.
Test 1. Tests the hypothesis that response and variance don't differ among dose levels. If this test accepts, there may not be a dose-response. P-values less than 0.1 indicate a model fit.
Test 2. Tests the hypothesis that variances are homogeneous. If this test accepts, the simpler constant variance model may be appropriate. P-values less than 0.1 indicate a model fit.
Test 3. (non-constant variance model) Test the hypothesis that the variances are adequately modeled. If this test accepts, it may be appropriate to conclude that the variances have been modeled appropriately.
Test 4. (non-constant variance model). Tests the hypothesis that the model for the mean fits the data. If this tests accepts, the user has support for the selected model. P-values greater than 0.1 indicate a model fit.
For each dataset, models with relatively low AIC are indicative of better fits.3.3. For each dataset, models with relatively low AIC are indicative of better fits. 4. A scaled residual is the difference between the observed and predicted effect (i.e., percent response) divided by the standard deviation. Scaled Residual of Interest is a summary output parameter of the
BMDS model, while the Maximum Scaled Residual is the maximum of the scaled residuals of each of the individual dose groups. Absolute value less than 2.0 is indicative of a good fit. Values in bold are >2.0.
5. For multidose continuous data, the BMR used in estimating the point of departure was a change of 1 standard deviation (1 SD) from the control mean.
References
Busby, W.F.J., M.E. Goldman, P.M. Newberne et al. 1984. Tumorigenicity of fluoranthene in a newborn mouse lung adenoma bioassay. Carcinogenesis 5:1311–1316.

0.4 0.4 0.4 0.4 0.4 0.4
0.4 0.4
Mea
n R
Mea
n R
eespo
nse
spon
seeM
ean
Re
Mea
n R
eM
ean
RM
ean
RM
ean
RM
ean
Reeees
pons
esp
onse
spon
sesp
onse
spon
sesp
onse
A: Exponential2_Busby84_FA_F_Cont_Exp B: Exponential3_Busby84_FA_F_Cont_Exp
Exponential Model 2 with 0.95 Confidence LevelExponential Model 2 with 0.95 Confidence LevelExponential Model 2 with 0.95 Confidence LevelExponential Model 2 with 0.95 Confidence LevelExponential Model 2 with 0.95 Confidence LevelExponential Model 2 with 0.95 Confidence LevelExponential Model 2 with 0.95 Confidence Level Exponential Model 3 with 0.95 Confidence LevelExponential Model 3 with 0.95 Confidence LevelExponential Model 3 with 0.95 Confidence LevelExponential Model 3 with 0.95 Confidence LevelExponential Model 3 with 0.95 Confidence LevelExponential Model 3 with 0.95 Confidence LevelExponential Model 3 with 0.95 Confidence Level
ExponentialExponentialExponentialExponentialExponentialExponentialExponential ExponentialExponentialExponentialExponentialExponentialExponentialExponential
0.80.80.80.80.80.80.8 0.80.80.80.80.80.80.8
0.60.60.60.60.60.6 0.60.60.60.60.60.6
MMMMMMea
n R
ean
Rea
n R
ean
Rea
n R
ean
Reeeeees
pons
esp
onse
spon
sesp
onse
spon
sesp
onse
0.40.40.40.40.40.4
0.20.20.20.20.2 0.20.20.20.20.2
00000 00000
00000
11:59 04/15 201011:59 04/15 201011:59 04/15 201011:59 04/15 2010
0.50.50.50.50.5 11111 1.51.51.51.51.5 22222dosedosedosedose
2.52.52.52.52.5 33333
BMDLBMDLBMDLBMDLBMDL
3.53.53.53.53.5 44444
BMDBMDBMDBMDBMD
00000
11:59 04/15 201011:59 04/15 201011:59 04/15 201011:59 04/15 2010
0.50.50.50.50.5 11111 1.51.51.51.51.5 22222dosedosedosedose
2.52.52.52.52.5 33333
BMDLBMDLBMDLBMDLBMDL
3.53.53.53.53.5 44444
BMDBMDBMDBMDBMD
C: Exponential4_Busby84_FA_F_Cont_Exp Exponential Model 4 with 0.95 Confidence LevelExponential Model 4 with 0.95 Confidence LevelExponential Model 4 with 0.95 Confidence LevelExponential Model 4 with 0.95 Confidence Level
ExponentialExponentialExponentialExponential
D: Linear_Busby84_FA_F_Cont_Lin Linear Model with 0.95 Confidence LevelLinear Model with 0.95 Confidence LevelLinear Model with 0.95 Confidence LevelLinear Model with 0.95 Confidence Level
LinearLinearLinearLinear BMD Lower BoundBMD Lower BoundBMD Lower Bound
0.80.80.8 0.80.80.8
0.60.60.6 0.60.60.6
MMea
n R
ean
Rees
pons
esp
onsee
0.40.4
0.20.2
0
BMDL BMD BMDL BMD
0 1 2 3 4 5 0 1 2 3 4 5
dose dose 11:59 04/15 2010 11:59 04/15 2010
0
0.2 0.2

0.4 0.4 0.4
Mea
n R
Mea
n R
Mea
n R
eeespo
nse
spon
sesp
onse
E: PolPolynomialynomial Busb_Busby84y84 FA F Cont Pol_FA_F_Cont_Polyy F: PowerPower_BusbBusby84y84 FA F Cont Pow_FA_F_Cont_PowE: F: Polynomial Model with 0.95 Confidence LevelPolynomial Model with 0.95 Confidence LevelPolynomial Model with 0.95 Confidence LevelPolynomial Model with 0.95 Confidence Level Power Model with 0.95 Confidence LevelPower Model with 0.95 Confidence LevelPower Model with 0.95 Confidence LevelPower Model with 0.95 Confidence Level
PolynomialBMD Lower Bound
PolynomialBMD Lower Bound
BMDBMDL
PolynomialBMD Lower Bound
BMDBMDL
Polynomial BMD Lower Bound
00 0.50.5 11 1.51.5 22 2.52.5 33 3.53.5 44
PowerPower
BMDBMDL
Power
BMDBMDL
Power 0.80.80.80.8
0.80.80.80.8
0.60.60.60.6
0 60.60.60.6
MMMea
n R
ean
Rea
n R
eeespo
nse
spon
sesp
onse
0.40.40.4
0.20.20.2 0.20.20.2
00 00
-0.2-0.2 00 0.50.5 11 1.51.5 22 2.52.5 33 3.53.5
dosedose dosedose 11:59 04/15 201011:59 04/15 2010 11:59 04/15 201011:59 04/15 2010
4 4

Table C-16. Nesnow et al. (1998), benzo[a]pyrene. Continuous dose-response goodness-of-fit tests and benchmark dose estimates at 10% effect levels applied to study results.
Source Substance
Effect Endpoint Continuous
Dose-Response Model (1)
Goodness-of-Fit POD Benchmar
k Response (BMR) (5)
Dose (mg/kg)
Notes
p-value for Maximum Likelihood Tests (2)
AIC (3)
Residuals (4)
Animal Tissue Test 1 Test 2 Test 3 Test 4
Scaled Residual of
Interest
Maximum Scaled
Residual BMD BMDL Nesnow,
1998 BaP mouse Lung tumors Hill <.0001 <.0001 <.0001 1.0 497 0.026 0.10 1 SD 57.3 42.6 Best Fit: Hill model has the lowest residuals, the highest p-value in test 4, and the 2nd lowest AIC.
Nesnow, 1998 BaP mouse Lung tumors Exponential 2 < 0.0001 < 0.0001 < 0.0001 0.0013 511 3.0 3.0 1 SD 89.9 82.6
Nesnow, 1998 BaP mouse Lung tumors Exponential 3 < 0.0001 < 0.0001 < 0.0001 0.0013 511 3.0 3.0 1 SD 89.9 82.6
Nesnow, 1998 BaP mouse Lung tumors Exponential 4 < 0.0001 < 0.0001 < 0.0001 < 0.0001 518 -4.5 23 1 SD 32.8 28.3
Nesnow, 1998 BaP mouse Lung tumors Exponential 5 < 0.0001 < 0.0001 < 0.0001 0.87 498 -0.34 -0.34 1 SD 53.6 43.0 Acceptable Fit
Nesnow, 1998 BaP mouse Lung tumors Linear <.0001 <.0001 <.0001 0.010 507 -2.2 -2.2 1 SD 31.9 28.3
Nesnow, 1998 BaP mouse Lung tumors Polynomial <.0001 <.0001 <.0001 0.85 496 -0.54 -0.54 1 SD 50.4 38.6 Acceptable Fit
Nesnow, 1998 BaP mouse Lung tumors Power <.0001 <.0001 <.0001 0.96 496 -0.34 -0.34 1 SD 53.6 42.0 Acceptable Fit
Abbreviations AIC = Akaike's Information Criterion POD = point of departure BMD = benchmark dose SD = standard deviation BMDL = 1-sided 95% lower confidence limit for the benchmark dose
Notes 1. USEPA's BMDS v.2.1.1 was used to determine dose-response continuous data. 2. There are four Maximum Likelihood tests performed by BMDS that test the null hypothesis that the model fits the data as well as the "true" model.
Test 1. Tests the hypothesis that response and variance don't differ among dose levels. If this test accepts, there may not be a dose-response. P-values less than 0.1 indicate a model fit. Test 2. Tests the hypothesis that variances are homogeneous. If this test accepts, the simpler constant variance model may be appropriate. P-values less than 0.1 indicate a model fit.
Test 3. (non-constant variance model) Test the hypothesis that the variances are adequately modeled. If this test accepts, it may be appropriate to conclude that the variances have been modeled appropriately.
Test 4. (non-constant variance model). Tests the hypothesis that the model for the mean fits the data. If this tests accepts, the user has support for the selected model. P-values greater than 0.1 indicate a model fit.
3. For each dataset, models with relatively low AIC are indicative of better fits.4. A scaled residual is the difference between the observed and predicted effect (i.e., percent response) divided by the standard deviation. Scaled Residual of Interest is a summary output parameter of the p ( , p p ) y y p p BMDS model, while the Maximum Scaled Residual is the maximum of the scaled residuals of each of the individual dose groups. Absolute value less than 2.0 is indicative of a good fit. Values in bold are >2.0. 5. For multidose continuous data, the BMR used in estimating the point of departure was a change of 1 standard deviation (1 SD) from the control mean.
References
Nesnow, S., J.A. Ross, M.J. Mass et al. 1998. Mechanistic relationships between DNA adducts, oncogene mutations, and lung tumorigenesis in strain A mice. Exp Lung Res 24:395-405.

15 15 15 15 15 15
20 20 20 20 20 20
25 25 25 25 25 25
15 15
20 20 20
25 25 25
A: Hill_Nesnow98_BaP_Cont_Hill B: Exponential2_Nesnow98_BaP_Cont_Exp Hill Model with 0.95 Confidence LevelHill Model with 0.95 Confidence LevelHill Model with 0.95 Confidence LevelHill Model with 0.95 Confidence LevelHill Model with 0.95 Confidence LevelHill Model with 0.95 Confidence LevelHill Model with 0.95 Confidence Level Exponential Model 2 with 0.95 Confidence LevelExponential Model 2 with 0.95 Confidence LevelExponential Model 2 with 0.95 Confidence LevelExponential Model 2 with 0.95 Confidence LevelExponential Model 2 with 0.95 Confidence LevelExponential Model 2 with 0.95 Confidence LevelExponential Model 2 with 0.95 Confidence Level
40404040404040 HillHillHillHillHillHillHill 40404040404040 ExponentialExponentialExponentialExponentialExponentialExponentialExponential
35353535353535 35353535353535
30303030303030 30303030303030
spo
nse
Me
an
Re
spo
nse
Me
an
Re
spo
nse
M
ea
n R
esp
on
seM
ea
n R
esp
on
seM
ea
n R
esp
on
seM
ea
n R
esp
on
seM
ea
n R
esp
on
seM
ea
n R
esp
on
se
Me
an
Re
spo
nse
Me
an
Re
spo
nse
Me
an
Re
spo
nse
Me
an
Re
spo
nse
Me
an
Re
spo
nse
Me
an
Re
spo
nse
252525252525
202020202020
151515151515
101010101010
55555
00000BMDLBMDLBMDLBMDLBMDL BMDBMDBMDBMDBMD
00000 5050505050 100100100100100 150150150150150dosedosedosedose
13:42 04/12 201013:42 04/12 201013:42 04/12 201013:42 04/12 2010
C: Exponential3_Nesnow98_BaP_Cont_Exp Exponential Model 3 with 0.95 Confidence LevelExponential Model 3 with 0.95 Confidence LevelExponential Model 3 with 0.95 Confidence LevelExponential Model 3 with 0.95 Confidence Level
40404040 ExponentialExponentialExponentialExponential
353535
303030
101010101010
55555
00000BMDBMDL BMDBMDLBMDLBMDLBMDL BMDBMDBMD
200200200200200 00000 5050505050 100100100100100 150150150150150 200200200200200 dosedosedosedose
13:42 04/12 201013:42 04/12 201013:42 04/12 201013:42 04/12 2010
D: Exponential4_Nesnow98_BaP_Cont_ExpExponential Model 4 with 0.95 Confidence LevelExponential Model 4 with 0.95 Confidence LevelExponential Model 4 with 0.95 Confidence LevelExponential Model 4 with 0.95 Confidence Level
40404040 ExponentialExponentialExponentialExponential
353535
303030
spo
nse
Me
an
Re
spo
nse
Me
an
Re
spo
nse
252525
202020
1515
55
1010
55
1010
00BMDL BMD
00BMDL BMD
0
13:42 04/12 2010
50 100
dose 150 200 0
13:42 04/12 2010
50 100
dose 150 200

15 15 15 15 15 15
20 20 20 20 20 20
25 25 25 25 25 25
15 15
20 20 20
25 25 25
E: Exponential5_Nesnow98_BaP_Cont_Exp F: Linear_Nesnow98_BaP_Cont_Lin Exponential Model 5 with 0.95 Confidence LevelExponential Model 5 with 0.95 Confidence LevelExponential Model 5 with 0.95 Confidence LevelExponential Model 5 with 0.95 Confidence LevelExponential Model 5 with 0.95 Confidence LevelExponential Model 5 with 0.95 Confidence LevelExponential Model 5 with 0.95 Confidence Level Linear Model with 0.95 Confidence LevelLinear Model with 0.95 Confidence LevelLinear Model with 0.95 Confidence LevelLinear Model with 0.95 Confidence LevelLinear Model with 0.95 Confidence LevelLinear Model with 0.95 Confidence LevelLinear Model with 0.95 Confidence Level
40404040404040 ExponentialExponentialExponentialExponentialExponentialExponentialExponential 40404040404040 LinearLinearLinearLinearLinearLinearLinear
35353535353535 35353535353535
303030303030 303030303030
Me
an
Re
spo
nse
Me
an
Re
spo
nse
Me
an
Re
spo
nse
Me
an
Re
spo
nse
Me
an
Re
spo
nse
Me
an
Re
spo
nse
252525252525
202020202020
151515151515
1010101010 1010101010
55555 55555
00000
00000
13:42 04/12 201013:42 04/12 201013:42 04/12 201013:42 04/12 2010
BMDLBMDLBMDLBMDLBMDL
5050505050
BMDBMDBMDBMDBMD
100100100100100dosedosedosedose
150150150150150 200200200200200
00000
00000
13:42 04/12 201013:42 04/12 201013:42 04/12 201013:42 04/12 2010
BMDBMDBMDBMDBMDBMDLBMDLBMDLBMDLBMDL
5050505050 100100100100100dosedosedosedose
150150150150150 200200200200200
G: Polynomial_Nesnow98_BaP_Cont_Poly
Polynomial
303030
353535
40404040
Polynomial Model with 0.95 Confidence LevelPolynomial Model with 0.95 Confidence LevelPolynomial Model with 0.95 Confidence LevelPolynomial Model with 0.95 Confidence Level
PolynomialPolynomialPolynomial BMD Lower BoundBMD Lower BoundBMD Lower Bound
H: Power_Nesnow98_BaP_Cont_Pow
Power
252525
303030
353535
Power Model with 0.95 Confidence LevelPower Model with 0.95 Confidence LevelPower Model with 0.95 Confidence LevelPower Model with 0.95 Confidence Level
PowerPowerPower
spo
nse
Me
an
Re
spo
nse
Me
an
Re
spo
nse
202020
1515
1010 1010
55
55
0000
BMDL BMD -5 BMDL BMD
0 50 100 150 200 0 50 100 150 200
dose dose 13:42 04/12 2010 13:42 04/12 2010
spo
nse
Me
an
Re
spo
nse
Me
an
Re
spo
nse
M
ea
n R
esp
on
seM
ea
n R
esp
on
seM
ea
n R
esp
on
seM
ea
n R
esp
on
seM
ea
n R
esp
on
seM
ea
n R
esp
on
se

Table C-17. Nesnow et al. (1998), cyclopenta[c,d]pyrene. Continuous dose-response goodness-of-fit tests and benchmark dose estimates at 10% effect levels applied to study results.
Source Substance
Effect Endpoint Continuous
Dose-Response Model (1)
Goodness-of-Fit POD Benchmar
k Response (BMR) (5)
Dose (mg/kg)
Notes
p-value for Maximum Likelihood Tests (2)
AIC (3)
Residuals (4)
Animal Tissue Test 1 Test 2 Test 3 Test 4
Scaled Residual of
Interest
Maximum Scaled
Residual BMD BMDL Nesnow,
1998 CPcdP mouse Lung tumors Hill <.0001 <.0001 <.0001 1.0 624 8.43E-06 0.00042 1 SD 73.9 58.0 Best Fit: Hill model has the lowest residuals, the highest p-value in Test 4, and the lowest AIC.
Nesnow, 1998 CPcdP mouse Lung tumors Exponential 2 < 0.0001 < 0.0001 < 0.0001 0.0008 637 2.8 2.8 1 SD 93.0 84.9
Nesnow, 1998 CPcdP mouse Lung tumors Exponential 3 < 0.0001 < 0.0001 < 0.0001 0.0008 637 2.8 2.8 1 SD 93.0 84.9
Nesnow, 1998 CPcdP mouse Lung tumors Exponential 4 < 0.0001 < 0.0001 < 0.0001 < 0.0001 680 -6.9 22 1 SD 32.1 29.8
Nesnow, 1998 CPcdP mouse Lung tumors Exponential 5 < 0.0001 < 0.0001 < 0.0001 0.12 627 -1.32 -1.32 1 SD 65.2 55.9 Acceptable Fit
Nesnow, 1998 CPcdP mouse Lung tumors Linear <.0001 <.0001 <.0001 <.0001 651 -3.2 -3.2 1 SD 33.0 28.9
Nesnow, 1998 CPcdP mouse Lung tumors Polynomial <.0001 <.0001 <.0001 0.20 626 -1.36 -1.36 1 SD 63.1 48.6 Acceptable Fit
Nesnow, 1998 CPcdP mouse Lung tumors Power <.0001 <.0001 <.0001 0.31 625 -1.24 -1.24 1 SD 63.6 51.7 Acceptable Fit
Abbreviations AIC = Akaike's Information Criterion POD = point of departure BMD = benchmark dose BMDL = 1-sided 95% lower confidence limit for the benchmark dose
Notes 1. USEPA's BMDS v.2.1.1 was used to determine dose-response continuous data. 2. There are four Maximum Likelihood tests performed by BMDS that test the null hypothesis that the model fits the data as well as the "true" model.
Test 1. Tests the hypothesis that response and variance don't differ among dose levels. If this test accepts, there may not be a dose-response. P-values less than 0.1 indicate a model fit. Test 2. Tests the hypothesis that variances are homogeneous. If this test accepts, the simpler constant variance model may be appropriate. P-values less than 0.1 indicate a model fit.
Test 3. (non-constant variance model) Test the hypothesis that the variances are adequately modeled. If this test accepts, it may be appropriate to conclude that the variances have been modeled appropriately.
Test 4. (non-constant variance model). Tests the hypothesis that the model for the mean fits the data. If this tests accepts, the user has support for the selected model. P-values greater than 0.1 indicate a model fit.
3. For each dataset, models with relatively low AIC are indicative of better fits. 4. A scaled residual is the difference between the observed and predicted effect (i.e., percent response) divided by the standard deviation. Scaled Residual of Interest is a summary output parameter of the p ( , p p ) y y p p BMDS model, while the Maximum Scaled Residual is the maximum of the scaled residuals of each of the individual dose groups. Absolute value less than 2.0 is indicative of a good fit. Values in bold are >2.0. 5. For multidose continuous data, the BMR used in estimating the point of departure was a change of 1 standard deviation (1 SD) from the control mean.
References
Nesnow, S., J.A. Ross, M.J. Mass et al. 1998. Mechanistic relationships between DNA adducts, oncogene mutations, and lung tumorigenesis in strain A mice. Exp Lung Res 24:395-405.

40 40 40 40 40 40
60 60 60 60 60 60
40 40
60 60 60spo
nse
Me
an
Re
spo
nse
Me
an
Re
spo
nse
M
ea
n R
esp
on
seM
ea
n R
esp
on
seM
ea
n R
esp
on
seM
ea
n R
esp
on
seM
ea
n R
esp
on
seM
ea
n R
esp
on
se
A: Hill_Nesnow98_CPcdP_Cont_Hill B: Exponential2_Nesnow98_CPcdP_Cont_Exp Hill Model with 0.95 Confidence LevelHill Model with 0.95 Confidence LevelHill Model with 0.95 Confidence LevelHill Model with 0.95 Confidence LevelHill Model with 0.95 Confidence LevelHill Model with 0.95 Confidence LevelHill Model with 0.95 Confidence Level Exponential Model 2 with 0.95 Confidence LevelExponential Model 2 with 0.95 Confidence LevelExponential Model 2 with 0.95 Confidence LevelExponential Model 2 with 0.95 Confidence LevelExponential Model 2 with 0.95 Confidence LevelExponential Model 2 with 0.95 Confidence LevelExponential Model 2 with 0.95 Confidence Level
120120120120120120120 HillHillHillHillHillHillHill 120120120120120120120 ExponentialExponentialExponentialExponentialExponentialExponentialExponential
100100100100100100100 100100100100100100100
808080808080 808080808080
Me
an
Re
spo
nse
Me
an
Re
spo
nse
Me
an
Re
spo
nse
Me
an
Re
spo
nse
Me
an
Re
spo
nse
Me
an
Re
spo
nse
606060606060
404040404040
2020202020 2020202020
00000
00000
16:10 04/12 201016:10 04/12 201016:10 04/12 201016:10 04/12 2010
5050505050
BMDLBMDLBMDLBMDLBMDL BMDBMDBMDBMDBMD
100100100100100dosedosedosedose
150150150150150 200200200200200
00000
00000
16:10 04/12 201016:10 04/12 201016:10 04/12 201016:10 04/12 2010
5050505050
BMDLBMDLBMDLBMDLBMDL
100100100100100dosedosedosedose
BMDBMDBMDBMDBMD
150150150150150 200200200200200
C: Exponential3_Nesnow98_CPcdP_Cont_Exp
120120120120
Exponential Model 3 with 0.95 Confidence LevelExponential Model 3 with 0.95 Confidence LevelExponential Model 3 with 0.95 Confidence LevelExponential Model 3 with 0.95 Confidence Level
ExponentialExponentialExponentialExponential
D: Exponential4_Nesnow98_CPcdP_Cont_Exp
120120120120
Exponential Model 4 with 0.95 Confidence LevelExponential Model 4 with 0.95 Confidence LevelExponential Model 4 with 0.95 Confidence LevelExponential Model 4 with 0.95 Confidence Level
ExponentialExponentialExponentialExponential
100100100 100100100
808080 808080
spo
nse
Me
an
Re
spo
nse
Me
an
Re
spo
nse
606060
4040
2020 2020
00
16:10 04/12 2010
0 50
BMDL
100dose
BMD
150 200
00
16:10 04/12 2010
0
BMDL BMD
50 100
dose 150 200

40 40 40 40 40 40
60 60 60 60 60 60
40 40
spo
nse
Me
an
Re
spo
nse
Me
an
Re
spo
nse
M
ea
n R
esp
on
seM
ea
n R
esp
on
seM
ea
n R
esp
on
seM
ea
n R
esp
on
seM
ea
n R
esp
on
seM
ea
n R
esp
on
se
E: Exponential5_Nesnow98_CPcdP_Cont_Exp F: Linear_Nesnow98_CPcdP_Cont_Lin Exponential Model 5 with 0.95 Confidence LevelExponential Model 5 with 0.95 Confidence LevelExponential Model 5 with 0.95 Confidence LevelExponential Model 5 with 0.95 Confidence LevelExponential Model 5 with 0.95 Confidence LevelExponential Model 5 with 0.95 Confidence LevelExponential Model 5 with 0.95 Confidence Level Linear Model with 0.95 Confidence LevelLinear Model with 0.95 Confidence LevelLinear Model with 0.95 Confidence LevelLinear Model with 0.95 Confidence LevelLinear Model with 0.95 Confidence LevelLinear Model with 0.95 Confidence LevelLinear Model with 0.95 Confidence Level
120120120120120120120 120120120120120120120ExponentialExponentialExponentialExponentialExponentialExponentialExponential LinearLinearLinearLinearLinearLinearLinear
100100100100100100100 100100100100100100100
808080808080 808080808080
Me
an
Re
spo
nse
Me
an
Re
spo
nse
Me
an
Re
spo
nse
Me
an
Re
spo
nse
Me
an
Re
spo
nse
Me
an
Re
spo
nse
606060606060
404040404040
00000
2020202020
16:10 04/12 201016:10 04/12 201016:10 04/12 201016:10 04/12 2010
00000 5050505050
BMDLBMDLBMDLBMDLBMDL BMDBMDBMDBMDBMD
100100100100100dosedosedosedose
150150150150150 200200200200200
00000
2020202020
16:10 04/12 201016:10 04/12 201016:10 04/12 201016:10 04/12 2010
00000
BMDLBMDLBMDLBMDLBMDL BMDBMDBMDBMDBMD
5050505050 100100100100100dosedosedosedose
150150150150150 200200200200200
G: Polynomial_Nesnow98_CPcdP_Cont_Poly
Polynomial120120120120
Polynomial Model with 0.95 Confidence LevelPolynomial Model with 0.95 Confidence LevelPolynomial Model with 0.95 Confidence LevelPolynomial Model with 0.95 Confidence Level
PolynomialPolynomialPolynomial
H: Power_Nesnow98_CPcdP_Cont_Pow
Power
Power Model with 0.95 Confidence LevelPower Model with 0.95 Confidence LevelPower Model with 0.95 Confidence LevelPower Model with 0.95 Confidence Level
PowerPowerPower
100100100
100100100
808080
808080
606060 spo
nse
Me
an
Re
spo
nse
Me
an
Re
spo
nse
606060
4040
2020 2020
0000
BMDL BMD BMDL BMD
0 50 100 150 200 0 50 100 150 200
dose dose 16:10 04/12 2010 16:10 04/12 2010

Table C-18. Nesnow et al. (1998), dibenz[a,l]pyrene. Continuous dose-response goodness-of-fit tests and benchmark dose estimates at 10% effect levels applied to study results.
Source Substance
Effect Endpoint Continuous
Dose-Response Model (1)
Goodness-of-Fit POD Benchmar
k Response (BMR) (5)
Dose (mg/kg)
Notes
p-value for Maximum Likelihood Tests (2)
AIC (3)
Residuals (4)
Animal Tissue Test 1 Test 2 Test 3 Test 4
Scaled Residual of
Interest
Maximum Scaled
Residual BMD BMDL Nesnow,
1998 DBalP mouse Lung tumors Hill <.0001 <.0001 <.0001 0.2 604 0.75 -0.82 1 SD 1.6 1.2 Acceptable fit.
Nesnow, 1998 DBalP mouse Lung tumors Exponential 2 < 0.0001 < 0.0001 < 0.0001 0.00020 619 2.3 -2.8 1 SD 3.1 2.9
Nesnow, 1998 DBalP mouse Lung tumors Exponential 3 < 0.0001 < 0.0001 < 0.0001 0.00020 619 2.3 -2.8 1 SD 3.1 2.9
Nesnow, 1998 DBalP mouse Lung tumors Exponential 4 < 0.0001 < 0.0001 < 0.0001 0.36 603 0.4 0.80 1 SD 1.4 1.3 Acceptable fit.
Nesnow, 1998 DBalP mouse Lung tumors Exponential 5 < 0.0001 < 0.0001 < 0.0001 0.21 604 0.74 -0.82 1 SD 1.6 1.3 Acceptable fit.
Nesnow, 1998 DBalP mouse Lung tumors Linear <.0001 <.0001 <.0001 0.56 601 0.4 0.81 1 SD 1.4 1.3
Acceptable fit: Linear model has the lowest residuals, the highest p-value in Test 4, and the lowest AIC.
Nesnow, 1998 DBalP mouse Lung tumors Polynomial <.0001 <.0001 <.0001 0.45 602 0.67 -0.88 1 SD 1.6 1.2 Acceptable fit.
Nesnow, 1998 DBalP mouse Lung tumors Power <.0001 <.0001 <.0001 0.45 602 0.74 -0.82 1 SD 1.6 1.3 Acceptable fit.
Abbreviations AIC = Akaike's Information Criterion POD = point of departure BMD = benchmark dose BMDL = 1-sided 95% lower confidence limit for the benchmark dose
Notes 1. USEPA's BMDS v.2.1.1 was used to determine dose-response continuous data. 2. There are four Maximum Likelihood tests performed by BMDS that test the null hypothesis that the model fits the data as well as the "true" model.
Test 1. Tests the hypothesis that response and variance don't differ among dose levels. If this test accepts, there may not be a dose-response. P-values less than 0.1 indicate a model fit.
Test 2. Tests the hypothesis that variances are homogeneous. If this test accepts, the simpler constant variance model may be appropriate. P-values less than 0.1 indicate a model fit.
Test 3. (non-constant variance model) Test the hypothesis that the variances are adequately modeled. If this test accepts, it may be appropriate to conclude that the variances have been modeled appropriately.
Test 4. (non-constant variance model). Tests the hypothesis that the model for the mean fits the data. If this tests accepts, the user has support for the selected model. P-values greater than 0.1 indicate a model fit.
3. For each dataset, models with relatively low AIC are indicative of better fits. 4. A scaled residual is the difference between the observed and predicted effect (i.e., percent response) divided by the standard deviation. Scaled Residual of Interest is a summary output parameter of the BMDS model, while the Maximum Scaled Residual is the maximum of the scaled residuals of each of the individual dose groups. Absolute value less than 2.0 is indicative of a good fit. Values in bold are >2.0. 5. For multidose continuous data, the BMR used in estimating the point of departure was a change of 1 standard deviation (1 SD) from the control mean.
References
Nesnow, S., J.A. Ross, M.J. Mass et al. 1998. Mechanistic relationships between DNA adducts, oncogene mutations, and lung tumorigenesis in strain A mice. Exp Lung Res 24:395-405.

10 10 10 10 10 10
5 5
A: Hill_Nesnow98_DBalP_Cont_Hill B: Exponential2_Nesnow98_DBalP_Cont_Exp Hill Model with 0.95 Confidence LevelHill Model with 0.95 Confidence LevelHill Model with 0.95 Confidence LevelHill Model with 0.95 Confidence LevelHill Model with 0.95 Confidence LevelHill Model with 0.95 Confidence LevelHill Model with 0.95 Confidence Level Exponential Model 2 with 0.95 Confidence LevelExponential Model 2 with 0.95 Confidence LevelExponential Model 2 with 0.95 Confidence LevelExponential Model 2 with 0.95 Confidence LevelExponential Model 2 with 0.95 Confidence LevelExponential Model 2 with 0.95 Confidence LevelExponential Model 2 with 0.95 Confidence Level
HillHillHillHillHillHillHill ExponentialExponentialExponentialExponentialExponentialExponentialExponential20202020202020 20202020202020
15151515151515 15151515151515
spo
nse
Me
an
Re
spo
nse
Me
an
Re
spo
nse
M
ea
n R
esp
on
seM
ea
n R
esp
on
seM
ea
n R
esp
on
seM
ea
n R
esp
on
seM
ea
n R
esp
on
seM
ea
n R
esp
on
se
Me
an
Re
spo
nse
Me
an
Re
spo
nse
Me
an
Re
spo
nse
Me
an
Re
spo
nse
Me
an
Re
spo
nse
Me
an
Re
spo
nse
101010101010
55555
00000BMDBMDL BMDBMDLBMDLBMDLBMDL BMDBMDBMD
00000 11111 22222 33333 44444 55555 66666 dosedosedosedose
10:14 04/13 201010:14 04/13 201010:14 04/13 201010:14 04/13 2010
C: Exponential3_Nesnow98_DBalP_Cont_Exp Exponential Model 3 with 0.95 Confidence LevelExponential Model 3 with 0.95 Confidence LevelExponential Model 3 with 0.95 Confidence LevelExponential Model 3 with 0.95 Confidence Level
ExponentialExponentialExponentialExponential20202020
151515
55555
00000BMDBMDL BMDBMDLBMDLBMDLBMDL BMDBMDBMD
00000 11111 22222 33333 44444 55555dosedosedosedose
10:14 04/13 201010:14 04/13 201010:14 04/13 201010:14 04/13 2010
D: Exponential4_Nesnow98_DBalP_Cont_Exp Exponential Model 4 with 0.95 Confidence LevelExponential Model 4 with 0.95 Confidence LevelExponential Model 4 with 0.95 Confidence LevelExponential Model 4 with 0.95 Confidence Level
ExponentialExponentialExponentialExponential20202020
151515
spo
nse
Me
an
Re
spo
nse
Me
an
Re
spo
nse
101010 101010
55
0 0BMDL BMD BMDL BMD
0 1 2 3 4 5 6 0 1 2 3 4 5 6
dose dose 10:14 04/13 2010 10:14 04/13 2010
6 6 6 6 6
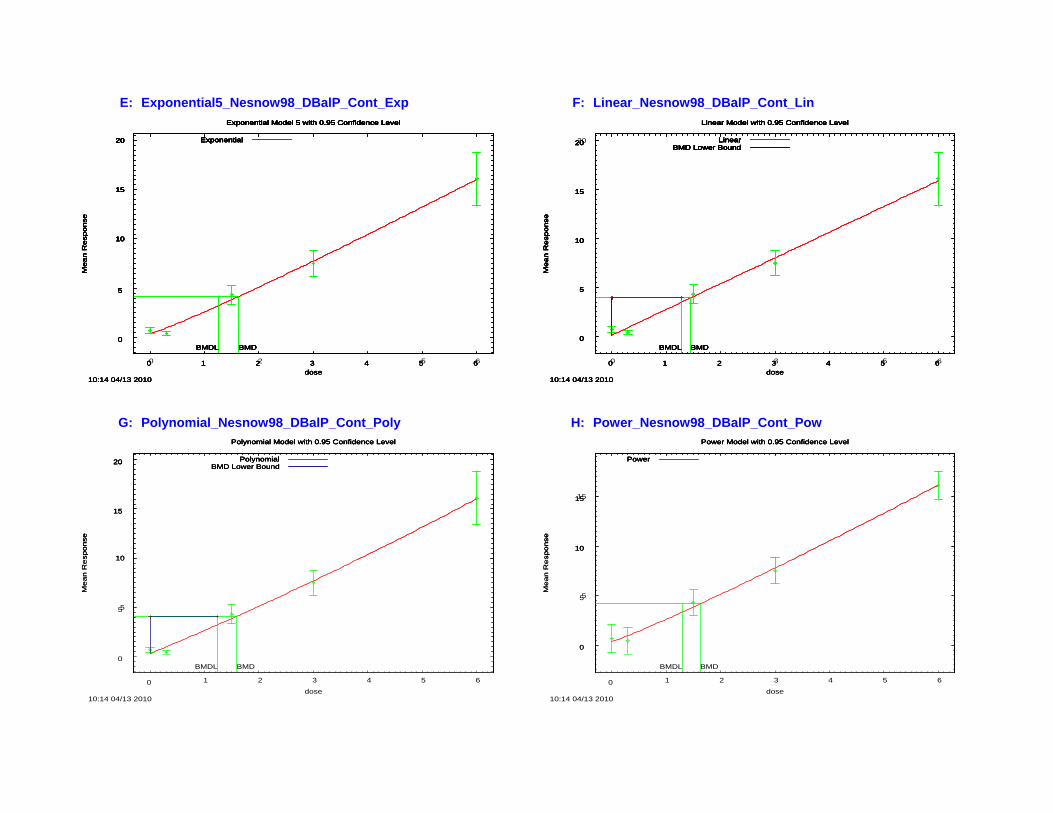
10 10 10 10 10 10
15 15 15 15 15 15
20 20 20 20 20 20 20
10 10 10
E: Exponential5_Nesnow98_DBalP_Cont_Exp F: Linear_Nesnow98_DBalP_Cont_Lin Exponential Model 5 with 0.95 Confidence LevelExponential Model 5 with 0.95 Confidence LevelExponential Model 5 with 0.95 Confidence LevelExponential Model 5 with 0.95 Confidence LevelExponential Model 5 with 0.95 Confidence LevelExponential Model 5 with 0.95 Confidence LevelExponential Model 5 with 0.95 Confidence Level Linear Model with 0.95 Confidence LevelLinear Model with 0.95 Confidence LevelLinear Model with 0.95 Confidence LevelLinear Model with 0.95 Confidence LevelLinear Model with 0.95 Confidence LevelLinear Model with 0.95 Confidence LevelLinear Model with 0.95 Confidence Level
ExponentialExponentialExponentialExponentialExponentialExponentialExponential LinearLinearLinearLinearLinearLinearLinear BMD Lower BoundBMD Lower BoundBMD Lower BoundBMD Lower BoundBMD Lower BoundBMD Lower BoundBMD Lower Bound
20202020202020
spo
nse
Me
an
Re
spo
nse
Me
an
Re
spo
nse
M
ea
n R
esp
on
seM
ea
n R
esp
on
seM
ea
n R
esp
on
seM
ea
n R
esp
on
seM
ea
n R
esp
on
seM
ea
n R
esp
on
se
151515151515
Me
an
Re
spo
nse
Me
an
Re
spo
nse
Me
an
Re
spo
nse
Me
an
Re
spo
nse
Me
an
Re
spo
nse
Me
an
Re
spo
nse
101010101010
55555
55555
00000
00000
10:14 04/13 201010:14 04/13 201010:14 04/13 201010:14 04/13 2010
11111
BMDLBMDLBMDLBMDLBMDL
22222
BMDBMDBMDBMDBMD
33333dosedosedosedose
44444 55555 66666
00000
00000
10:14 04/13 201010:14 04/13 201010:14 04/13 201010:14 04/13 2010
11111
BMDLBMDLBMDLBMDLBMDL BMDBMDBMDBMDBMD
22222 33333dosedosedosedose
44444 55555 66666
G: Polynomial_Nesnow98_DBalP_Cont_Poly
Polynomial20202020
Polynomial Model with 0.95 Confidence LevelPolynomial Model with 0.95 Confidence LevelPolynomial Model with 0.95 Confidence LevelPolynomial Model with 0.95 Confidence Level
PolynomialPolynomialPolynomial BMD Lower BoundBMD Lower BoundBMD Lower Bound
H: Power_Nesnow98_DBalP_Cont_Pow
Power
Power Model with 0.95 Confidence LevelPower Model with 0.95 Confidence LevelPower Model with 0.95 Confidence LevelPower Model with 0.95 Confidence Level
PowerPowerPower
151515
151515
spo
nse
Me
an
Re
spo
nse
Me
an
Re
spo
nse
101010
55 55
0000
BMDL BMD BMDL BMD
0 1 2 3 4 5 6 0 1 2 3 4 5 6
dose dose 10:14 04/13 2010 10:14 04/13 2010

Table D-1. Calculation of Human Equivalent Dose (mg/kg-day) for BMDS Input File
Mass Coal Tar Average Feed % ppm (μg/g) μg/day grams/day BW (kg)4 μg/kg-day mg/kg-day BW (kg) Scaling Factor5 mg/kg-day
0.01 100 0.8 b 435 4.4 0.030 14,516 15 70 7.0 2.1 0.03 300 2.4 b 1,306 4.4 0.030 43,549 44 70 7.0 6.3 0.10 1,000 8.0 a 4,355 4.4 0.030 145,164 145 70 7.0 21 0.30 3,000 23.7 a 12,901 4.3 0.030 430,049 430 70 7.0 62 0.60 6,000 47.4 b 25,803 4.3 0.030 860,098 860 70 7.0 124 1.00 10,000 63.0 a 34,295 3.4 0.030 1,143,168 1,143 70 7.0 164 0.03 300 4.0 b 1,449 4.8 0.030 48,309 48.3 70 7.0 7.0 0.10 1,000 13.2 a 4,783 4.8 0.030 159,420 159 70 7.0 23 0.30 3,000 36.3 a 13,152 4.4 0.030 438,406 438 70 7.0 63
0.0005 5 20.5 a NA 4.1 0.030 683 0.68 70 7.0 0.098 0.00 25 104 a NA 4.2 0.030 3,467 3.47 70 7.0 0.499 0.01 100 430 a NA 4.3 0.030 14,333 14.33 70 7.0 2.062
Study Mixture Coal Tar Mixture 1 BaP = 0.1837%2
Coal Tar Mixture 2 BaP = 0.2760%2
Benzo(a)pyrene
Dose Group Concentration in Feed1 Mass BaP3 Administered Dose Human Equivalent Dose
μg/day
Notes: 1. % by mass (coal tar in feed)
2. % by mass (benzo(a)pyrene in coal tar) 3. Mass of BaP equals mass daily feed x % by mass coal tar x % by mass BaP. (a) reported in Culp et al. 1998 pages 121-122; (b) estimated as a proportion of concentrations with
reported mass BaP. Daily food consumption ranges from 2 to 4 g/day.
4. Culp et al. 1998, Figure 1; average body weight ranges from 15 to 40 g during the course of 2 year study, with time-weighted mean of approximately 30 g (or 0.030 kg) 5. Human equivalent dose (D2) = Administered dose (D1) divided by scaling factor. Scaling factor = (BW_human/BW_mouse) 1/4
A1/BW13/4 = A2/BW2
3/4
since 1/BW3/4 = BW1/4/BW (A1/BW1) BW1
1/4 = (A2/BW2) BW21/4
1/4 1/4D1BW1 = D 2BW2
D2 = D1(BW11/4/BW2
1/4) = D1 / (BW2/BW1)1/4

Table D-2. Coal Tar Mixture 1 Dose-response Models and Benchmark Dose Estimates at 10% Effect Levels Applied to Study Results Effect Endpoint Dose-Response
Model (1, 2)
Parameters (2) Goodness-of-Fit POD (%
Effect)
Dose (mg/kg-day) Human CSF
(mg/kg-day)-1 NotesSource Animal Tissue β0 β1 β2 p-value (3) AIC (4) Maximum
Residual (5) BMD BMDL
Culp, 1998 Table III
female B6C3F1 mouse
Liver (hepatocellular adenomas and/or carcinomas) multistage cancer 0.062 0.00061 0 0 196 4.9 10% 171.5 78.9 --
BMDL is out of the three times range of dose for some BMR in BMDL curve computation.
Culp, 1998 Table III
female B6C3F1 mouse
Lung (alveolar/bronchiolar adenomas and/or carcinomas) multistage cancer 0.049 0.0056 0 0.0016 308 3.6 10% 18.8 15.2 6.58E-03
Culp, 1998 Table III, without highest 2 doses
female B6C3F1 mouse
Lung (alveolar/bronchiolar adenomas and/or carcinomas) multistage cancer 0.053 0 0.00020 0.65 164 -1.0 10% 23.2 14.2 7.05E-03
Culp, 1998 Table III
female B6C3F1 mouse
Forestomach (papillomas and/or carcinomas) multistage cancer 0.053 0.0021 0 0.0012 248 2.5 10% 51.0 35.3 2.83E-03
Culp, 1998 Table III, without highest 2 doses
female B6C3F1 mouse
Forestomach (papillomas and/or carcinomas) multistage cancer 0.025 0.0052 0 0.049 143 2.2 10% 20.1 13.0 7.68E-03
Culp, 1998 Table III
female B6C3F1 mouse
Small intestine (adenocarcinomas) multistage cancer 0 0 5.53E-05 0.031 104 -3.1 10% 43.6 38.9 2.57E-03
Culp, 1998 Table III
female B6C3F1 mouse Hemangiosarcomas multistage cancer 0.012 0.0017 0 0 190 -3.6 10% 60.5 44.0 2.27E-03
Culp, 1998 Table III
female B6C3F1 mouse Histiocytic sarcomas multistage cancer 0.012 5.80E-04 0 0.0034 115 3.2 10% 181.7 102.7 9.74E-04
BMDL is out of the three times range of dose for some BMR in BMDL curve computation.
Culp, 1998 Table III
female B6C3F1 mouse Sarcomas multistage cancer 0.060 0 0 0.13 153 2.5 10% -- -- --
BMD computation failed. BMD is larger than three times maximum input doses. BMDL is out of the three times range of dose for some BMR in BMDL curve computation.
Abbreviations AIC = Akaike's Information Criterion CSF = cancer slope factor BMD = benchmark dose POD = point of departure BMDL = 1-sided 95% lower confidence limit for the benchmark dose
Notes 1. USEPA's BMDS v.2.1.1 was used to determine dose-response dichotomous data. 2. Dose response functions for multistage cancer: P[response] = β0 + (1-β0)*[1-EXP( -β1*dose^1-β2*dose^2)];
Dose response function for Hill Model: y + ( v * d n ) / ( k n + d n ), where v=sign, n=power, and k=slope. 3. For dichotomous data, Chi-square test is a hypothesis test in which the null hypothesis is that data fit the dose-response function. Higher p-values indicate better fits.
For continuous data, there are four Maximum Likelihood tests performed by BMDS that test the null hypothesis that the model fits the data as well as the "true" model. Test 1. Tests the hypothesis that response and variance don't differ among dose levels. If this test accepts, there may not be a dose-response. P-values less than 0.1 indicate a model fit.
Test 2. Tests the hypothesis that variances are homogeneous. If this test accepts, the simpler constant variance model may be appropriate. P-values less than 0.1 indicate a model fit.
Test 3. (non-constant variance model) Test the hypothesis that the variances are adequately modeled. If this test accepts, it may be appropriate to conclude that the variances have been modeled
Test 4. (non-constant variance model). Tests the hypothesis that the model for the mean fits the data. If this tests accepts, the user has support for the selected model. P-values greater than 0.1 indicate a model fit.
4. For each dataset, models with relatively low AIC are indicative of better fits. 5. A scaled residual is the difference between the observed and predicted effect (i.e., percent response) divided by the standard deviation. Absolute value less than 2.0 is indicative of a good fit.
Values in bold are >2.0 References
Culp, S.J. et al. 1998. Carcinogenesis 19(1):117-124; Table III and Table IV.

Table D-3. Coal Tar Mixture 2 Dose-response Models and Benchmark Dose Estimates at 10% Effect Levels Applied to Study Results Effect Endpoint Dose-Response
Model (1, 2)
Parameters (2) Goodness-of-Fit POD (%
Effect)
Dose (mg/kg-day) Human CSF
(mg/kg-day)-1 NotesSource Animal Tissue β0 β1 β2 p-value (3) AIC (4) Maximum
Residual (5) BMD BMDL Culp, 1998
Table III female B6C3F1
mouse Liver (hepatocellular adenomas and/or carcinomas) multistage cancer 0.041 0.003573 0 0.018 127 2.4 10% 29.5 16.5 6.07E-03
Culp, 1998 Table III
female B6C3F1 mouse
Lung (alveolar/bronchiolar adenomas and/or carcinomas) multistage cancer 0.041 0.006972 4.85E-05 0.86 164 -0.13 10% 13.8 8.3 1.20E-02
Culp, 1998 Table III
female B6C3F1 mouse
Forestomach (papillomas and/or carcinomas) multistage cancer 0 0.00389 2.04E-05 0.15 100 1.5 10% 24.1 15.3 6.55E-03
Culp, 1998 Table III
female B6C3F1 mouse
Small intestine (adenocarcinomas) multistage cancer 0 0 5.8E-06 0.98 12 -0.38 10% 135 70.5 1.42E-03
BMDL is out of the three times range of dose for some BMR in BMDL curve computation.
Culp, 1998 Table III
female B6C3F1 mouse Hemangiosarcomas multistage cancer 0.019 3.76E-04 1.00E-04 0.76 115 -0.22 10% 30.6 17.8 5.62E-03
Culp, 1998 Table III
female B6C3F1 mouse Histiocytic sarcomas multistage cancer 0.035 0 5.41E-05 0.48 106 0.93 10% 44.1 22.2 4.51E-03
Culp, 1998 Table III
female B6C3F1 mouse Sarcomas multistage cancer 0.014 0.00174 0 0.29 77 -1.1 10% 60.6 33.0 3.03E-03
BMDL is out of the three times range of dose for some BMR in BMDL curve computation.
Abbreviations AIC = Akaike's Information Criterion CSF = cancer slope factor BMD = benchmark dose POD = point of departure BMDL = 1-sided 95% lower confidence limit for the benchmark dose
Notes 1. USEPA's BMDS v.2.1.1 was used to determine dose-response dichotomous data. 2. Dose response functions for multistage cancer: P[response] = β0 + (1-β0)*[1-EXP( -β1*dose^1-β2*dose^2)];
Dose response function for Hill Model: y + ( v * d n ) / ( k n + d n ), where v=sign, n=power, and k=slope. 3. For dichotomous data, Chi-square test is a hypothesis test in which the null hypothesis is that data fit the dose-response function. Higher p-values indicate better fits.
For continuous data, there are four Maximum Likelihood tests performed by BMDS that test the null hypothesis that the model fits the data as well as the "true" model. Test 1. Tests the hypothesis that response and variance don't differ among dose levels. If this test accepts, there may not be a dose-response. P-values less than 0.1 indicate a model fit.
Test 2. Tests the hypothesis that variances are homogeneous. If this test accepts, the simpler constant variance model may be appropriate. P-values less than 0.1 indicate a model fit.
Test 3. (non-constant variance model) Test the hypothesis that the variances are adequately modeled. If this test accepts, it may be appropriate to conclude that the variances have been modeled appropriately
Test 4. (non-constant variance model). Tests the hypothesis that the model for the mean fits the data. If this tests accepts, the user has support for the selected model. P-values greater than 0.1 indicate a model fit.
4. For each dataset, models with relatively low AIC are indicative of better fits. 5. A scaled residual is the difference between the observed and predicted effect (i.e., percent response) divided by the standard deviation. Absolute value less than 2.0 is indicative of a good fit.
Values in bold are >2.0 References
Culp, S.J. et al. 1998. Carcinogenesis 19(1):117-124; Table III and Table IV.

Table D-4. Benzo(a)pyrene Dose-response Models and Benchmark Dose Estimates at 10% Effect Levels Applied to Study Results Effect Endpoint Dose-Response
Model (1, 2)
Parameters (2) Goodness-of-Fit POD (%
Effect)
Dose (mg/kg-day) Human CSF
(mg/kg-day)-1 NotesSource Animal Tissue β0 β1 β2 p-value (3) AIC (4) Maximum
Residual (5) BMD BMDL Culp, 1998
Table IV female B6C3F1
mouse Liver (hepatocellular adenomas) multistage cancer 0.074 0 0 0.035 102 -1.9 10% -- -- -- BMD computation failed. BMD is larger than three times maximum input doses.
Culp, 1998 Table IV
female B6C3F1 mouse
Lung (alveolar/bronchiolar adenomas and/or carcinomas) multistage cancer 0.048 0 0 0.020 74 1.8 10% -- -- -- BMD computation failed. BMD is larger than
three times maximum input doses.
Culp, 1998 Table IV
without 100ppm Dose
female B6C3F1 mouse
Lung (alveolar/bronchiolar adenomas and/or carcinomas) multistage cancer 0.053 0 0.14 0.022 70 -1.7 10% 0.9 0.4 0.23
Culp, 1998 Table IV
female B6C3F1 mouse
Forestomach (papillomas and/or carcinomas) multistage cancer 0.014 2.2 0 0.011 105 -2.4 10% 0.049 0.038 2.61
Culp, 1998 Table IV
without 100ppm Dose
female B6C3F1 mouse
Forestomach (papillomas and/or carcinomas) multistage cancer 0.019 0 6.0 0.77 84 -0.26 10% 0.133 0.081 1.23
Culp, 1998 Table IV
female B6C3F1 mouse
Esophagus (papillomas and/or carcinomas) multistage cancer 0 0 0.21 0.99 81 -0.31 10% 0.72 0.52 0.19
Culp, 1998 Table IV
female B6C3F1 mouse
Tongue (papillomas and/or carcinomas) multistage cancer 0 0 0.15 0.99 85 -0.27 10% 0.83 0.55 0.18
Culp, 1998 Table IV
female B6C3F1 mouse
Larynx (papillomas and/or carcinomas) multistage cancer 0 0.09 0 0.50 54 1.3 10% 1.2 0.72 0.14
Culp, 1998 Table IV
female B6C3F1 mouse Hemangiosarcomas multistage cancer 0.031 0 0 0.32 55 1.3 10% -- -- -- BMD computation failed. BMD is larger than
three times maximum input doses.
Culp, 1998 Table IV
female B6C3F1 mouse Histiocytic sarcomas multistage cancer 0.026 0 0 0.52 48 -1.14 10% -- -- -- BMD computation failed. BMD is larger than
three times maximum input doses.
Culp, 1998 Table IV
female B6C3F1 mouse Sarcomas multistage cancer 0.053 0 0 0.0059 80 3.0 10% -- -- -- BMD computation failed. BMD is larger than
three times maximum input doses.
Abbreviations AIC = Akaike's Information Criterion CSF = cancer slope factor BMD = benchmark dose POD = point of departure BMDL = 1-sided 95% lower confidence limit for the benchmark dose
Notes 1. USEPA's BMDS v.2.1.1 was used to determine dose-response dichotomous data. 2. Dose response functions for multistage cancer: P[response] = β0 + (1-β0)*[1-EXP( -β1*dose^1-β2*dose^2)];
Dose response function for Hill Model: y + ( v * d n ) / ( k n + d n ), where v=sign, n=power, and k=slope. 3. For dichotomous data, Chi-square test is a hypothesis test in which the null hypothesis is that data fit the dose-response function. Higher p-values indicate better fits.
For continuous data, there are four Maximum Likelihood tests performed by BMDS that test the null hypothesis that the model fits the data as well as the "true" model. Test 1. Tests the hypothesis that response and variance don't differ among dose levels. If this test accepts, there may not be a dose-response. P-values less than 0.1 indicate a model fit.
Test 2. Tests the hypothesis that variances are homogeneous. If this test accepts, the simpler constant variance model may be appropriate. P-values less than 0.1 indicate a model fit.
Test 3. (non-constant variance model) Test the hypothesis that the variances are adequately modeled. If this test accepts, it may be appropriate to conclude that the variances have been modeled
Test 4. (non-constant variance model). Tests the hypothesis that the model for the mean fits the data. If this tests accepts, the user has support for the selected model. P-values greater than 0.1 indicate a model fit.
4. For each dataset, models with relatively low AIC are indicative of better fits. 5. A scaled residual is the difference between the observed and predicted effect (i.e., percent response) divided by the standard deviation. Absolute value less than 2.0 is indicative of a good fit.
Values in bold are >2.0 References
Culp, S.J. et al. 1998. Carcinogenesis 19(1):117-124; Table III and Table IV.

0.5
0.6
0.7
Multistage Cancer Model with 0.95 Confidence Level
Multistage CancerLinear extrapolationBMD Lower Bound
Figure D-1. Coal Tar Mixture 1 BMDS Results for Lung Tumors, Two Highest Doses Removed
Material: Mixture 1 Test animal: Female B6C3F1 Mice Effect: Lung (alveolar/bronchiolar adenomas and/or carcinomas)
Dose % in feed
Human EqvtDose mg/kg-day N Effect
0 0 47 2 0.01 2.1 48 3 0.03 6.3 48 4 0.10 20.9 48 4 0.30 61.9 47 27
Multistage Cancer Model with 0.95 Confidence Level
0
0.1
0.2
0.3
0.4
0.5
0.6
0.7
Frac
tion
Affe
cted
BMDBMDL
Multistage Cancer Linear extrapolation BMD Lower Bound
0 10 20 30 40 50 60
dose 13:54 04/14 2010
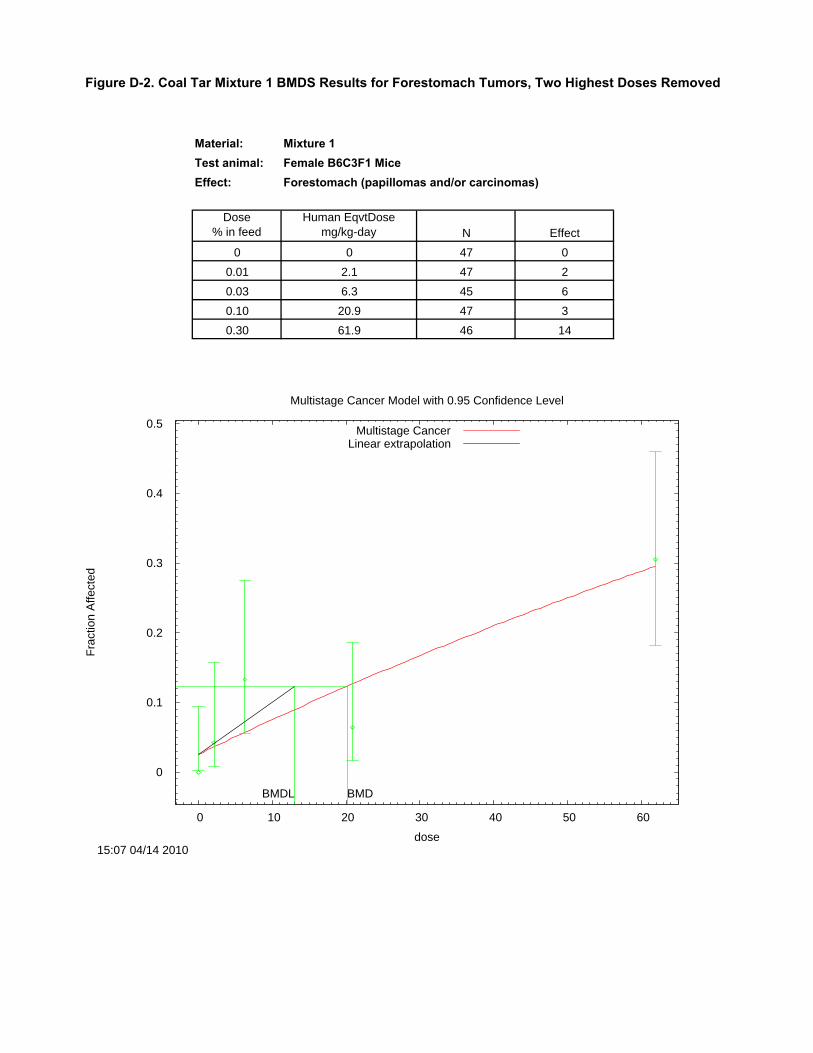
0.3
0.4
0.5
d
Multistage Cancer Model with 0.95 Confidence Level
Multistage CancerLinear extrapolation
Figure D-2. Coal Tar Mixture 1 BMDS Results for Forestomach Tumors, Two Highest Doses Removed
Material: Mixture 1 Test animal: Female B6C3F1 Mice Effect: Forestomach (papillomas and/or carcinomas)
Dose % in feed
Human EqvtDose mg/kg-day N Effect
0 0 47 0 0.01 2.1 47 2 0.03 6.3 45 6 0.10 20.9 47 3 0.30 61.9 46 14
Multistage Cancer Model with 0.95 Confidence Level
0
0.1
0.2
0.3
0.4
0.5
Frac
tion
Affe
cted
BMDBMDL
Multistage Cancer Linear extrapolation
0 10 20 30 40 50 60
dose 15:07 04/14 2010

0.4
0.5
0.6
0.7
fect
ed
Multistage Cancer Model with 0.95 Confidence Level
Multistage CancerLinear extrapolationBMD Lower Bound
Figure D-3. Coal Tar Mixture 2 BMDS Results for Lung Tumors
Material: Mixture 2 Test animal: Female B6C3F1 Mice Effect: Lung (alveolar/bronchiolar adenomas and/or carcinomas)
Dose % in feed
Human EqvtDose mg/kg-day N Effect
0 0 47 2 0.03 7.0 48 4 0.10 22.9 48 10 0.30 63.1 47 23
Multistage Cancer Model with 0.95 Confidence Level
0.7
0.6
0.5
0.4
0.3
0.2
0.1
0BMDBMDL
Multistage Cancer Linear extrapolation BMD Lower Bound
fFr
actio
n A
ffect
ed
0 10 20 30 40 50 60
dose 08:53 04/08 2010

0.3
0.4
0.5
ecte
d
Multistage Cancer Model with 0.95 Confidence Level
Multistage CancerLinear extrapolationBMD Lower Bound
fFr
actio
n A
ffect
ed
Figure D-4. Coal Tar Mixture 2 BMDS Results for Forestomach Tumors
Material: Mixture 2 Test animal: Female B6C3F1 Mice Effect: Forestomach (papillomas and/or carcinomas)
Dose % in feed
Human EqvtDose mg/kg-day N Effect
0 0 47 0 0.03 7.0 47 3 0.10 22.9 47 2 0.30 63.1 44 13
Multistage Cancer Model with 0.95 Confidence Level 0.5
0.4
0.3
0.2
0.1
0
BMDBMDL
Multistage Cancer Linear extrapolation BMD Lower Bound
0 10 20 30 40 50 60
dose 08:53 04/08 2010

0.15
0.2
0.25
Affe
cted
Multistage Cancer Model with 0.95 Confidence Level
Multistage CancerLinear extrapolation
Figure D-5. Benzo(a)Pyrene BMDS Results for Lung Tumors, 100 ppm Dose RemovedFr
actio
n A
ffect
ed
Material: Benzo[a]pyrene Test animal: Female B6C3F1 Mice Effect: Lung (alveolar/bronchiolar adenomas and/or carcinomas)
Dose ppm
Human EqvtDose mg/kg-day Total Effect
0 0 48 5 5 0.0983 48 0
25 0.4988 45 4
Multistage Cancer Model with 0.95 Confidence Level
0.25
0.2
0.15
0.1
0.05
0
BMDBMDL
Multistage Cancer Linear extrapolation
0 0.1 0.2 0.3 0.4 0.5 0.6 0.7 0.8 0.9
dose 14:24 04/14 2010
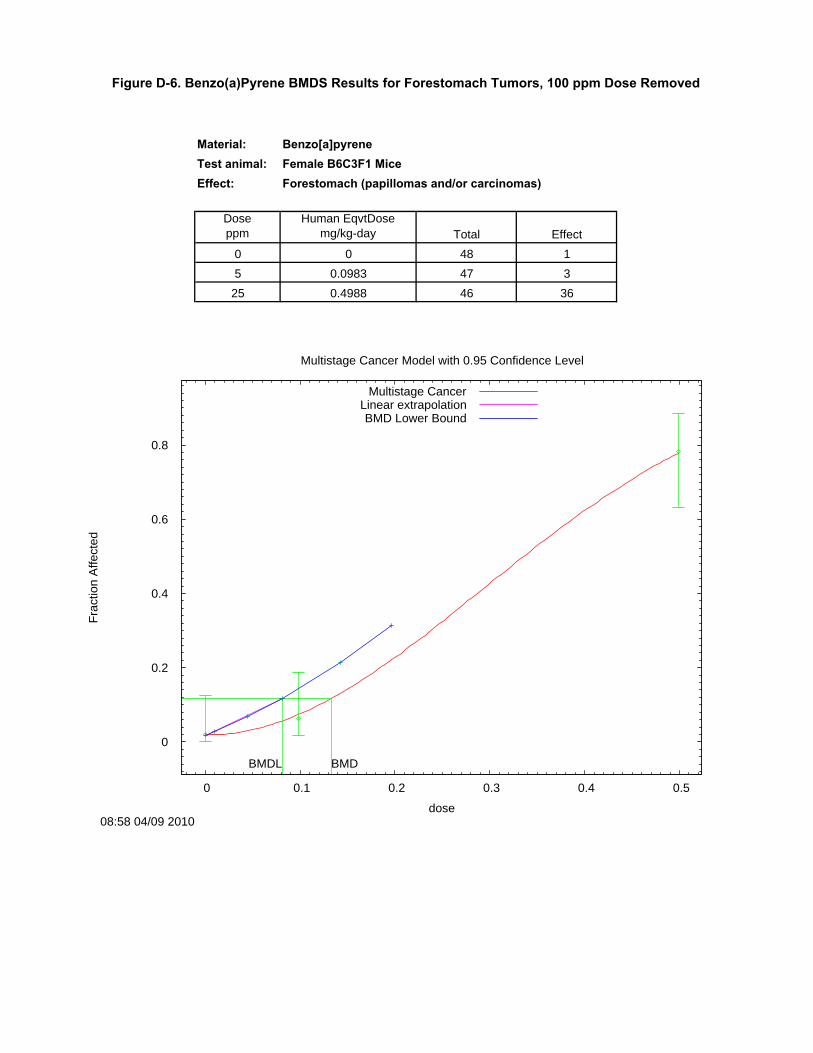
0.6
0.8
Affe
cted
Multistage Cancer Model with 0.95 Confidence Level
Multistage CancerLinear extrapolationBMD Lower Bound
Frac
tion
Affe
cted
Figure D-6. Benzo(a)Pyrene BMDS Results for Forestomach Tumors, 100 ppm Dose Removed
Material: Benzo[a]pyrene Test animal: Female B6C3F1 Mice Effect: Forestomach (papillomas and/or carcinomas)
Dose ppm
Human EqvtDose mg/kg-day Total Effect
0 0 48 1 5 0.0983 47 3
25 0.4988 46 36
Multistage Cancer Model with 0.95 Confidence Level
0.8
0.6
0.4
0.2
0
BMDBMDL
Multistage Cancer Linear extrapolation BMD Lower Bound
0 0.1 0.2 0.3 0.4 0.5
dose 08:58 04/09 2010