kimberley training institute | 2013 annual report 2 · kimberley training institute is the major...
TRANSCRIPT

Kimberley Training Institute | 2013 Annual Report 2
Contacts
Kimberley Training Institute P O Box 1380 68 Cable Beach Road BROOME WA 6725 Website: www.kti.wa.edu.au Email: [email protected] Phone: 1300 996 573 Front Cover: Boab Trees at sunset near Derby Source: Tourism Western Australia

Kimberley Training Institute | 2013 Annual Report 3
Contents
Statement of compliance ............................................................................................ 5
A summary of our year’s activities .............................................................................. 6
A snapshot of our performance .................................................................................. 8
Our training outcomes ............................................................................................... 8
Our awards ................................................................................................................ 8
Our resources ............................................................................................................ 9
Our 2013 summary .................................................................................................... 9
Our operating environment ....................................................................................... 10
The Kimberley region ............................................................................................... 10
Delivery by campus ................................................................................................. 10
Our organisational environment ............................................................................... 12
Governing Council ................................................................................................... 12
Senior officers .......................................................................................................... 13
Our organisational structure ..................................................................................... 13
Our planning environment ........................................................................................ 15
Vision, mission and values ....................................................................................... 15
Kimberley Training Institute Strategic Plan .............................................................. 16
Performance management framework ..................................................................... 16
Government strategic plans ..................................................................................... 16
Changes to outcome based management framework .............................................. 17
Shared responsibilities with other agencies ............................................................. 17
Our legislative environment ...................................................................................... 17
Key operational legislation ....................................................................................... 17
Additional State legislation ....................................................................................... 17
Commonwealth legislation ....................................................................................... 18
Responsible Minister ............................................................................................... 18
Our significant issues ............................................................................................... 19
Strategic goal 1: Providing an outstanding student experience ................................ 20
Student satisfaction ................................................................................................. 20
Employment outcomes ............................................................................................ 20
Open Learning Centres ........................................................................................... 21
Aboriginal Training Services .................................................................................... 21
Strategic goal 2: Developing strong industry relationships and partnerships ........... 22
Priority industry training ........................................................................................... 22
Ertech civil construction ........................................................................................... 22
Regional Jobs and Communities Program (RJCP) providers ................................... 23
Strategic goal 3: Ensuring the sustainability, capability and capacity of our Institute 24
Business systems .................................................................................................... 24
Facilities .................................................................................................................. 24
Quality Management System ................................................................................... 24
Regional STP alliance ............................................................................................. 24
Professional development ........................................................................................ 25
Strategic goal 4: Focusing on community and social responsibility .......................... 26
Rural and Remote Aged Care program.................................................................... 26
Workplace English Language and Literacy (WELL) projects .................................... 26
Youth Corps program Derby .................................................................................... 26
Kimberley Training Institute | 2013 Annual Report 4
Youth Access Re-engagement Program (YARP) ..................................................... 27
VETiS ...................................................................................................................... 27
Wyndham Work Camp ............................................................................................. 28
Strategic goal 5: Growing our business .................................................................... 29
Fast-track management skills .................................................................................. 29
Traineeship and apprenticeship delivery .................................................................. 29
Gubinge project ....................................................................................................... 29
Disclosure of legal compliance ................................................................................. 31
Financial statements ................................................................................................ 34
Statement of comprehensive income (For the year ended 31 December 2013) ..... 35
Statement of financial position (As at 31 December 2013) ...................................... 36
Statement of changes in equity (For the year ended 31 December 2013) .............. 37
Statement of cash flows (For the year ended 31 December 2013) ......................... 38
Notes to the financial statements (For the year ended 31 December 2013) ........... 39
S40 Submission - Statement of comprehensive income .......................................... 83
S40 Submission – Balance sheet ............................................................................. 84
S40 Submission – Changes in equity statement ...................................................... 85
S40 Submission – Cash flow statement ................................................................... 86
Additional key performance indicator information ..................................................... 87
Performance outcomes ............................................................................................ 88
KPI 1: Overall student satisfaction .......................................................................... 88
KPI 2: Graduate employment .................................................................................. 88
KPI 3: Student outcomes – achievement of main reason for studying ..................... 89
KPI 4: Achievement of Institute profile .................................................................... 90
KPI 5: Cost per Student Curriculum Hour ............................................................... 92
Ministerial directives ................................................................................................. 93
Other financial disclosures ....................................................................................... 93
Pricing policies ......................................................................................................... 93
Major capital projects ............................................................................................... 93
Employee profile ...................................................................................................... 94
Learning and development ...................................................................................... 94
Industrial relations ................................................................................................... 95
Governance disclosures ........................................................................................... 95
Other legal reporting requirements ........................................................................... 95
Expenditure on advertising, market research, polling and direct mail ....................... 95
Disability access and inclusion plan outcomes ......................................................... 96
Compliance with Public Sector Standards and ethical codes ................................... 97
Public interest disclosure ......................................................................................... 98
Freedom of information ............................................................................................ 98
Record keeping plans .............................................................................................. 99
Government policy requirements ........................................................................... 100
Substantive equality ............................................................................................... 100
Occupational safety and health and injury management ........................................ 100
Attachment 1: Feedback form ................................................................................ 102

Kimberley Training Institute | 2013 Annual Report 5
Statement of compliance
For year ended 31 December 2013
Hon Dr Kim Hames MLA Minister for Training and Workforce Development
In accordance with Section 63 of the Financial Management Act 2006, we hereby submit for your information and presentation to Parliament, the Annual Report of Kimberley Training Institute for the calendar year ended 31 December 2013.
This Annual Report has been prepared in accordance with the provisions of the Financial Management Act 2006 and the Vocational Education and Training Act 1996.
Karen Dickinson Managing Director and Accountable Officer
10 March 2014
Niegel Grazia Chairman, Governing Council
10 March 2014
Kimberley Training Institute | 2013 Annual Report 6
A summary of our year’s activities
2013 was a year of mixed results for Kimberley Training Institute. There were many wonderful successes in the critical measures of training awards, graduate outcomes and student satisfaction, and these outcomes reinforced the efficacy of our training in one of the most challenging training environments in Australia.
On the overwhelmingly positive side, the Institute was the Western Australian Large Training Provider of the Year and one of our lecturers, Jacky Cheng, was the WA Trainer of the Year. We were also one of three finalists in the Australian Training Awards for the category of Large Training Provider of the Year, and more importantly Jacky Cheng was awarded the accolade of Australian Trainer of the Year. These awards were a public acknowledgement of our capacity to deliver innovative training solutions in the face of sometimes intractable barriers.
Our graduate outcomes (measured in 2012) were outstanding, with KTI graduates ranking us almost eight percentage points (89.3%) above the state average (81.4%) for being in employment after studying.
The Institute’s student satisfaction results in 2013 were equally exceptional with 91.7% of our students satisfied with their training, compared with a state-wide average of 85.9%.
The Institute has enjoyed four sustained years of growth but did not achieve the target it had set for 2013 with lower Student Curriculum Hours (SCH), and a lower level of commercial income than anticipated. There were a range of factors in our external environment which contributed to this result and these are addressed later in this report.
In 2013 Kimberley Training Institute continued to be a very significant business and contributor to social capital in the Kimberley. We employed over 200 staff and we contributed more than $30 million to the local economy. We trained over 4,000 people, which is possibly the highest participation level per head of population in Australia. We delivered nearly 750,000 hours of government-funded training and we taught around 86,000 hours of commercial short courses. We made a significant contribution to the development of the Kimberley Workforce Development Plan, and we were identified as significant partners in a range of strategies to develop the skills of our community in areas of skills demand in the Kimberley.
Our delivery to Aboriginal people increased to over 500,000 hours and our delivery to Aboriginal students studying at the higher levels (Certificate IV and above) also increased. We continued our commitment to the youth of our region by engaging with all the major Kimberley secondary schools for VET in Schools delivery, and by expanding our programs for disengaged youth
Language, Literacy and Foundation Skills programs continued to underpin our training delivery and are a major contributor to our successful outcomes.

Kimberley Training Institute | 2013 Annual Report 7
We achieved these results in an environment that was changing rapidly and presenting us with challenges at every turn. Our gratitude goes to our committed and supportive staff who worked tirelessly to ensure that the Institute continues to be the leading provider of vocational education and training in the region. We also thank our community and industry partners who continue to look to us for leadership in skills development. Our place as a key player in workforce development in the region is deeply entrenched and well-supported by our key stakeholders.
And finally, we are pleased to report that the business improvements that were put in place in 2013 will equip us for meeting the challenges of the future and ensure that Kimberley Training Institute will continue to be a major contributor to community and economic development in our region.

Kimberley Training Institute | 2013 Annual Report 8
A snapshot of our performance
Our training outcomes
Student satisfaction (WA State average 85.9%) Source: WA State Student Satisfaction Survey 2013, DTWD
91.7%
Graduates finding employment after study * (WA State average 81.4%) Source: Student Outcomes Survey 2013, National Centre for Vocational Education Research
89.3%
Number of students enrolled (9.2% decrease from 2012) Source: Unified Enrolments system (DTWD) 4,254
Total Student Curriculum Hours (SCH) delivered (5.5% increase from 2012) Source: Unified Enrolments system (DTWD) 830,949
SCH delivery in skills shortage areas (10% decrease from 2012) Source: Unified Enrolments system (DTWD) 328,593
SCH delivery at Foundation Skill level (39% decrease from 2012) Source: Unified Enrolments system (DTWD) 53,448
SCH delivery to Aboriginal students (8.5% increase from 2012) Source: Unified Enrolments system (DTWD) – all funding sources; AVETMISS data 548,170
Apprentices and trainees in training (7% increase from 2012) Source: Unified Enrolments system (DTWD) 267
SCH delivery at Certificate IV and above (4% increase from 2012) Source: Unified Enrolments system (DTWD) 161,807
SCH delivery to Aboriginal students at Certificate IV and above (23% increase from 2012) Source: Unified Enrolments system (DTWD) – all funding sources; AVETMISS data
23,435
SCH delivery to students under 18 years (13% increase from 2012) Source: Unified Enrolments system (DTWD) 109,621
Number of students identifying with a disability (24% increase from 2012) Source: Unified Enrolments system (DTWD) – all funding sources; AVETMISS data 252
Module Load Completion Rate (MLCR) (8.5% decrease from 2012) Source: Unified Enrolments system (DTWD) 69.5%
* derived from 2012 data
Our awards
WA Training Awards Winner – Large Training Provider of the Year
WA Training Awards Winner – WA Trainer of the Year: Jacky Cheng
National Training Awards Finalist – Large Training Provider of the Year
National Training Awards Winner – National Trainer of the Year: Jacky Cheng
Master Builders Association Winner – Regional Apprentice of the Year: Jonathon Falconer

Kimberley Training Institute | 2013 Annual Report 9
Employment Based Training
6%
Institutional Based Training
94%
Total Students by Training Type
90%
1%
7%
1%
1%
Total SCH by Funding Source
Profile
International FFS
Domestic FFS
CommonwealthFunded
CAT
Our resources
Income: $32,793,858
DPA income $28,214,092
Grants and subsidies $846,087
Fee for service $1,297,125
Student fees and charges $1,068,281
Expenditure: $34,127,991
Employee costs $23,981,661
Supplies and services $6,920,919
Employees 213 (169.6 FTE)
Leave liability (includes Annual Leave and Long Service Leave) $2,382,785
Our 2013 summary
512,350
557,390
775,436 787,359
830,949
400,000
500,000
600,000
700,000
800,000
900,000
2009 2010 2011 2012 2013
Total SCH delivered (all funding sources)

Kimberley Training Institute | 2013 Annual Report 10
Our operating environment
Kimberley Training Institute is the major provider of post-secondary education in the north-west of Australia. The Kimberley region covers over 420,000 square kilometres, representing approximately 16.3% of the state’s total area.1 The regional population is around 35,000 and the majority of people live in the six regional towns of Broome, Derby, Fitzroy Crossing, Halls Creek, Kununurra and Wyndham, which coincide with the Institute’s six campuses. Broome and Kununurra are the two largest towns and are sub-regional centre hubs in the West Kimberley and East Kimberley areas respectively.
The Kimberley region
Source: Australia’s North West
Delivery by campus
More than half the Institute’s delivery (56%) is from the Broome campus, with Derby (15%) and Kununurra (11%) together delivering another quarter of our SCH.
Given the small delivery at the other campuses it is an ongoing challenge to keep these campuses viable. To this end we have reviewed and continue to improve our service delivery models to ensure we meet community needs for training in the most effective and efficient way. The introduction of online studies to supplement face to
1 Western Australian Regional Profile Kimberley, Department of Training and Workforce Development, June
2012

Kimberley Training Institute | 2013 Annual Report 11
face training is a key strategy along with strengthening the larger centres in Broome, Derby and Kununurra. KTI continues to work closely with community organisations to find ways in which greater collaboration may result in better outcomes for clients.
BROOME 56%
DERBY 15%
FITZROY CROSSING
9%
HALLS CREEK 5%
KUNUNURRA 11%
WYNDHAM 4%
Total SCH by Campus
Broome 51%
Derby 14%
Fitzroy Crossing
4%
Halls Creek 6%
Kununurra 19%
Wyndham 6%
Student Population by Location

Kimberley Training Institute | 2013 Annual Report 12
Our organisational environment
The Institute’s overall strategy and direction is set by its Governing Council, while operational management of the Institute is delegated to its Senior Officers.
Governing Council
The Institute’s Governing Council consists of 11 members representing national and local industry and community. The 2013 members of the Governing Council were as follows:
Name Commenced Profile
Niegel Grazia, Chair 1/7/2011 Vice-President, Kimberley Woodside Energy Ltd,
B Business
Mick Unger, Deputy Chair 15/8/2011
General Manager, Infrastructure and xxx, President Civil Construction Federation (WA Branch), B Engineering – Civil (Hons)
Christopher Mitchell 3/6/2008
Executive Officer, Regional Development Australia Kimberley, GAICD, JP, Broome Shire Councillor (21 years)
Greg Moore 13/7/2009
Teacher Sacred Heart School Beagle Bay B Education Art, Grad Dip in Prof Art Studies, Cert IV Assessment and Workplace Training, Cert IV in Training and Assessment
Antoine Bloemen 13/7/2009 Retired. Previously Magistrate for the Kimberley and
Pilbara, LLB, B Juris
Anthony Proctor 13/7/2009 Chartered Accountant, Company Director B Juris FCA FCPA
Glennis Bibra 17/10/2011 Senior Program Manager, Arup MDM, Grad Dip Ed, Grad Dip FA, B Arch Sc, Dip Fine Art, Cert ID
Glen Chidlow 17/10/2011 Chief Executive Officer, Australia’s North West Tourism, GAICD, MBA
Lisa Spackman 5/11/2012
Managing Director Kimberley Croc Lodge, Managing Director Kununurra Commercial Laundry and Dry-cleaning, Managing Director Kimberley Croc Backpackers YHA
Harold Tracey 5/11/2012 Director, H & M Tracey Construction Pty Ltd Registered Builder No 10699
Karen Dickinson 29/6/2009
Managing Director, Kimberley Training Institute B Health Science, Graduate Diploma in OSH, Masters in Health Services Management
Kimberley Training Institute | 2013 Annual Report 13
Senior officers
The following executive staff directed and monitored the Institute’s performance in 2013.
Karen Dickinson, Managing Director
Karen Dickinson commenced in her role as Managing Director at Kimberley Training Institute in 2009 and since that time the Institute has grown over 80%. For the past 15 years Karen has held a variety of senior management roles in State and Australian Government agencies in Perth and the Northern Territory. Karen has a Master of Health Services Management, Graduate Diploma in Occupational Health and Safety and a Bachelor of Health Science (Nursing).
Lindsay Gassman, Corporate Services Director
Lindsay Gassman has more than 30 years management and executive experience, mainly in the Government Sector (Federal and State), complemented by four years as a manager in the Private Health Sector. He commenced as Corporate Services Director at Kimberley Training Institute in January 2000 and has a Master of Business Administration.
Markus Beuke, Director Training
Markus Beuke has spent over 15 years in the VET sector, which includes managing a private hospitality and tourism college and leading the hospitality and tourism division of a large WA state training provider. He joined Kimberley Training Institute in 2012. Preceding his VET career, Markus had many years of global experience in the hospitality and tourism industry in which he managed sizeable hospitality and tourism operations throughout Australasia. Markus has a Bachelor of Business.
Julie Kean, Director Organisational Performance and Planning
Julie Kean has over 30 years’ experience in the VET sector, and joined the Institute in January 2013. Prior to this Julie spent ten years as Executive Director of Organisational Development at a regional Institute in Victoria and then worked in the VET sector in the Pacific region for three years in roles related to VET planning and administration. She has a Master of Education, and post-graduate Diplomas in Education and Computer Education.
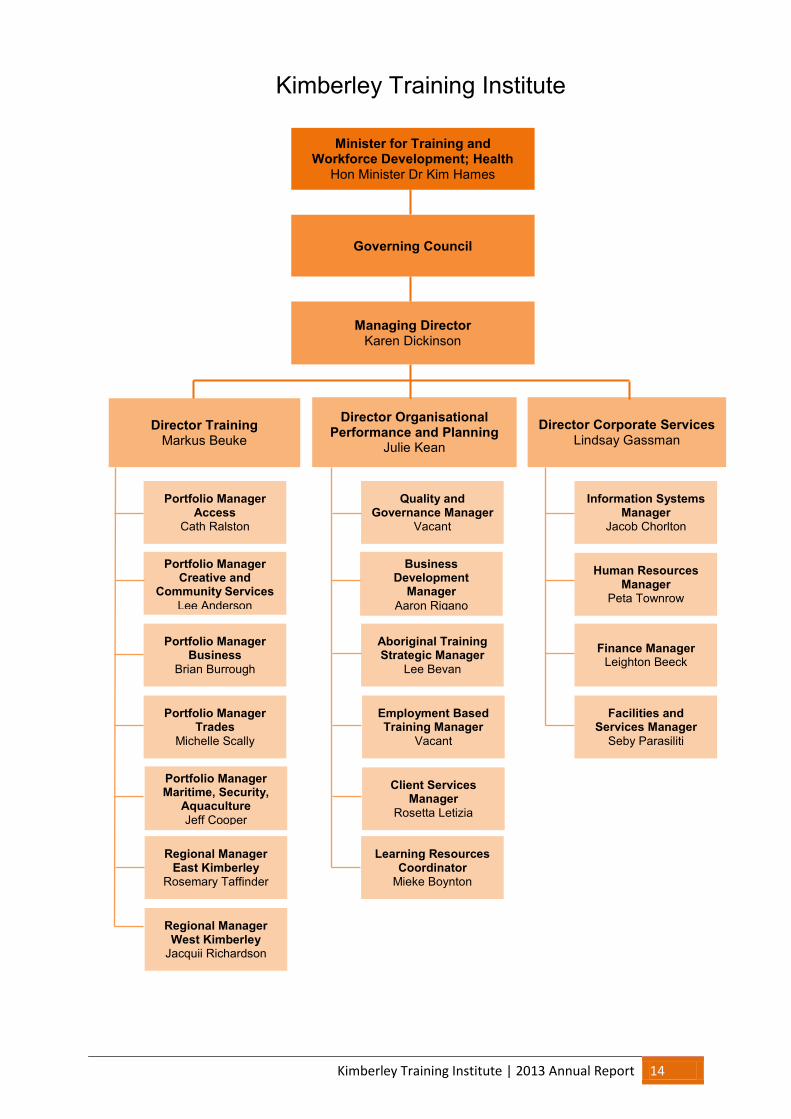
Our organisational structure
In January 2013 Kimberley Training Institute adjusted its organisational structure to encompass a third directorate with responsibility for organisational performance and planning. The organisational structure and incumbents as at 20 December 2013 is shown on the next page.
Kimberley Training Institute | 2013 Annual Report 14
Minister for Training and Workforce Development; Health
Hon Minister Dr Kim Hames
Governing Council
Managing Director Karen Dickinson
Director Training Markus Beuke
Director Organisational Performance and Planning
Julie Kean
Director Corporate Services Lindsay Gassman
Portfolio Manager Access
Cath Ralston
Portfolio Manager Creative and
Community Services Lee Anderson
Portfolio Manager Business
Brian Burrough
Portfolio Manager Trades
Michelle Scally
Portfolio Manager Maritime, Security,
Aquaculture Jeff Cooper
Regional Manager East Kimberley
Rosemary Taffinder
Regional Manager West Kimberley
Jacquii Richardson
Information Systems Manager
Jacob Chorlton
Human Resources Manager
Peta Townrow
Finance Manager Leighton Beeck
Facilities and Services Manager
Seby Parasiliti
Quality and Governance Manager
Vacant
Business Development
Manager Aaron Rigano
Aboriginal Training Strategic Manager
Lee Bevan
Employment Based Training Manager
Vacant
Client Services Manager
Rosetta Letizia
Learning Resources Coordinator
Mieke Boynton
Kimberley Training Institute

Kimberley Training Institute | 2013 Annual Report 15
The Institute’s guiding vision is to be known as … The leading education and training provider in the Kimberley
The Institute’s collective aim is to be recognised as … The best training provider in Western Australia
The Institute pledges to ensure that the following core commitments underpin what we do… Providing quality lifelong learning experiences for individuals, industry and community through innovative and customised vocational training
Encouraging all people to value education, learning and employment
Focusing our efforts on encouraging all students to identify and achieve their aspirations
The Institute uses the following SPIRIT principles to judge how it goes about its business… Success through Professionalism Innovation Respect Integrity Teamwork
State Government Priorities State building – major projects Financial and economic responsibility Results-based service delivery Stronger focus on the regions Social and environmental responsibility
Kimberley Training Institute Strategic plan 2013 – 2105 Our vision, mission and values, and our strategic goals to support the Stage Government’s goal for greater accountability in achieving results
KTI Operational Plans KTI department level plans which align our day-to-day operations with our strategic goals
KTI My Plan for Success Individual employee plans based on setting goals which will support operational plans
KTI Business Plan Our overall operational plan which details how we will achieve our strategic goals for the coming year
Our planning environment
Vision, mission and values
In 2013 we aligned our planning and operations to its internal Strategic Plan as well as state and national training priorities. Our vision and values continued to be key elements of the Institute’s operations.

Kimberley Training Institute | 2013 Annual Report 16
1. Providing an outstanding student experience. 2. Developing strong industry relationships and partnerships. 3. Ensuring the sustainability, capability and capacity of our Institute. 4. Focusing on community and social responsibility. 5. Growing our business.
Kimberley Training Institute Strategic Plan
The Institute’s Strategic Plan was adopted by its Governing Council on 7 November 2012 and in 2013 continued to be our overarching aspirational framework. The Strategic Plan focuses on five key priorities:
Performance management framework
The Institute’s planning is aligned to the planning priorities of the Western Australia Government.
WA State priority KTI priority State building – major projects: Building strategic infrastructure that will create jobs and underpin Western Australia’s long-term economic development
Ensuring the sustainability, capability and capacity of our Institute Growing our business
Financial and economic responsibility: Responsibly managing the State’s finances through the efficient and effective delivery of services, encouraging economic activity and reducing regulatory burdens on the private sector
Ensuring the sustainability, capability and capacity of our Institute Growing our business
Results-based service delivery: Greater focus on achieving results in key service delivery areas for the benefit of all Western Australians
Providing an outstanding student experience Developing strong industry relationships and partnerships
Stronger focus on the regions: Greater focus on service delivery, infrastructure investment and economic development to improve the overall quality in remote and regional areas
Providing an outstanding student experience Developing strong industry relationships and partnerships Ensuring the sustainability, capability and capacity of our Institute Focusing on community and social responsibility Growing our business
Social and environmental responsibility: Ensuring that economic activity is managed in a socially and environmentally responsible manner for the long-term benefit of the State
Focusing on community and social responsibility Growing our business
Government strategic plans
In addition to the WA government’s overall priorities, the Institute aligned its activities to the following state-wide plans:
Skilling WA: A workforce development plan for Western Australia, Department of Training and Workforce Development, 2010

Kimberley Training Institute | 2013 Annual Report 17
Kimberley Workforce Development Plan 2014-2017, Department of Training and Workforce Development , 2013
Training WA: Planning for the future 2009 – 2018, Department of Education and Training, 2009
Information paper: State priority occupation list, WA Department of Training and Workforce Development, August 2013
Future Focus: 2013 national workforce development strategy, Australian Workforce and Productivity Agency, 2013
Training together – working together: Aboriginal workforce development Strategy, Department of Training and Workforce Development, March 2010
Changes to outcome based management framework
Kimberley Training Institute’s outcome based management framework did not change in 2013.
Shared responsibilities with other agencies
KTI did not share any responsibilities with other agencies in 2013.
Our legislative environment
The Institute operates under the authority of the Vocational Education and Training Act 1996 and the Training Legislation Amendment and Repeal Act 2008 which are administered by the Minister for Training and Workforce Development.
The Institute also complies with the following legislative instruments which impact on its operations.
Key operational legislation
Auditor General Act 2006 Disability Services Act 1993 Equal Opportunity Act 1984 Financial Management Act 2006 Freedom of Information Act 1992 Industrial Relations Act 1979 Occupational Safety and Health Act 1984 Public Sector Management Act 1994 Public Interest Disclosure Act 2003 State Records Act 2000 Workers’ Compensation and Injury Management Act 1981 Working with Children (Criminal Record Checking) Act 2004
Additional State legislation
Building and Construction Industry Training Levy Act 1990 Building and Construction Industry Training Fund and Levy Collection Act 1990 Children and Community Services Act 2004 Corruption and Crime Commission Act 2003 Criminal Code Act Compilation Act 1913

Kimberley Training Institute | 2013 Annual Report 18
Education Service Providers (Full Fee Overseas Students) Registration Act 1991 Electoral Act 1907 Electronic Transactions Act 2011 Evidence Act 1906 Financial Management Act 2006 Library Board of Western Australia Act 1951 Limitation Act 2005 Minimum Conditions of Employment Act 1993 Salaries and Allowances Act 1975 School Education Act 1999 State Supply Commission Act 1991
Commonwealth legislation
Competition and Consumer Act 2010 Copyright Act 1968 Copyright Amendment (Digital Agenda) Act 2000 Corporations Act 2001 Education Services for Overseas Students Act 2000 Electronic Transactions Act 1999 Evidence Act 1995 Fringe Benefits Tax Act 1986 Mutual Recognition Act 1992 National Vocational Education and Training Regulator Act 2011 Privacy Act 1988 Skilling Australia’s Workforce Act 2005 Spam Act 2003 Trade Marks Act 1995
Responsible Minister
Kimberley Training Institute is responsible to the Hon Dr Kim Hames, Minister for Training and Workforce Development MLA.
Kimberley Training Institute | 2013 Annual Report 19
Our significant issues
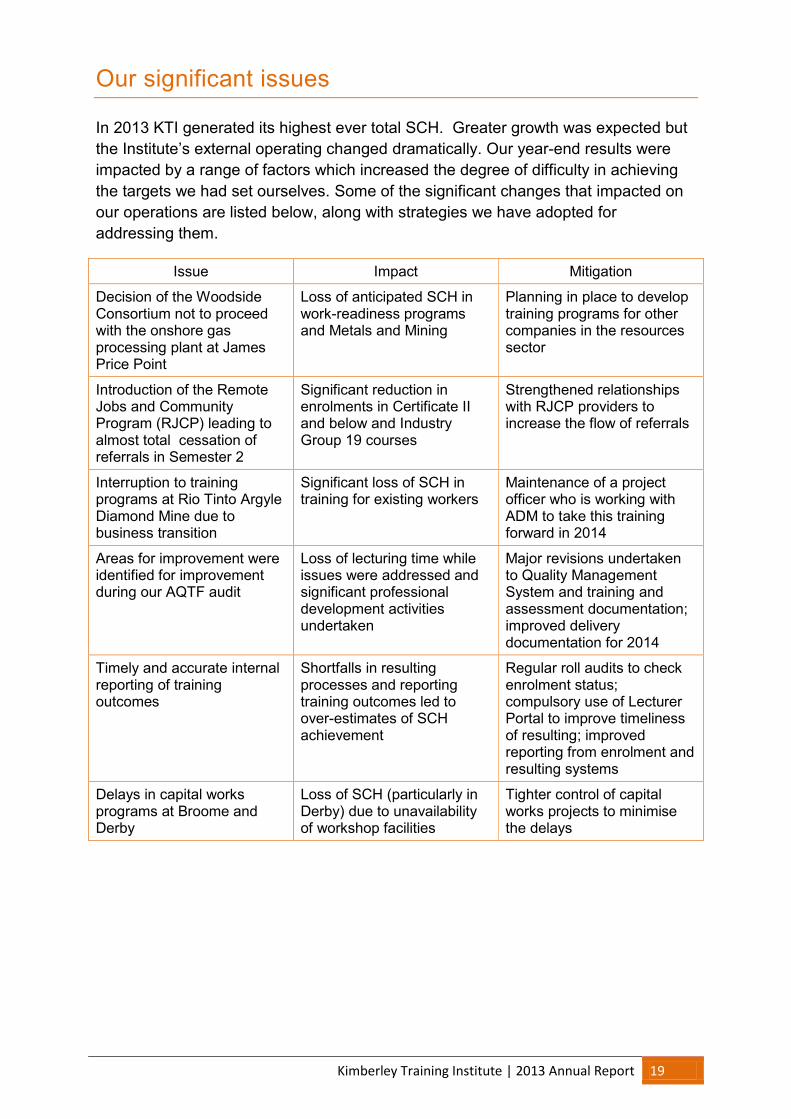
In 2013 KTI generated its highest ever total SCH. Greater growth was expected but the Institute’s external operating changed dramatically. Our year-end results were impacted by a range of factors which increased the degree of difficulty in achieving the targets we had set ourselves. Some of the significant changes that impacted on our operations are listed below, along with strategies we have adopted for addressing them.
Issue Impact Mitigation
Decision of the Woodside Consortium not to proceed with the onshore gas processing plant at James Price Point
Loss of anticipated SCH in work-readiness programs and Metals and Mining
Planning in place to develop training programs for other companies in the resources sector
Introduction of the Remote Jobs and Community Program (RJCP) leading to almost total cessation of referrals in Semester 2
Significant reduction in enrolments in Certificate II and below and Industry Group 19 courses
Strengthened relationships with RJCP providers to increase the flow of referrals
Interruption to training programs at Rio Tinto Argyle Diamond Mine due to business transition
Significant loss of SCH in training for existing workers
Maintenance of a project officer who is working with ADM to take this training forward in 2014
Areas for improvement were identified for improvement during our AQTF audit
Loss of lecturing time while issues were addressed and significant professional development activities undertaken
Major revisions undertaken to Quality Management System and training and assessment documentation; improved delivery documentation for 2014
Timely and accurate internal reporting of training outcomes
Shortfalls in resulting processes and reporting training outcomes led to over-estimates of SCH achievement
Regular roll audits to check enrolment status; compulsory use of Lecturer Portal to improve timeliness of resulting; improved reporting from enrolment and resulting systems
Delays in capital works programs at Broome and Derby
Loss of SCH (particularly in Derby) due to unavailability of workshop facilities
Tighter control of capital works projects to minimise the delays

Kimberley Training Institute | 2013 Annual Report 20
Strategic goal 1: Providing an outstanding student experience
We are delighted to report that by all measures we have provided an outstanding student experience in 2013. Not only did we achieve an exceptional result in the student satisfaction survey, this outcome was validated by an industry panel selecting us as the Western Australia Training Provider of the Year.
Student satisfaction
In the 2013 Training WA Student Satisfaction Survey, 92% of students who responded were either very satisfied or satisfied with their chosen course at Kimberley Training Institute. This compares to the State average of 86% and considerably exceeds the Institute’s previous satisfaction score from 2012 (87%).
Employment outcomes
Likewise, the Institute had an outstanding result in the achievement of graduate employment outcomes. Kimberley Training Institute achieved 90% (compared to 83% in 2011), while the State average for graduate employment in 2013 was 80%, and the national average was 77%.
These indicators demonstrate that the Institute is achieving excellent results in getting unemployed people into jobs and that our strategies to provide training that links to jobs is working.
Not employed before training and employed after training
Graduates Module Completers
Kimberley Training Institute 64.2% (62.5% in 2011) 55% (56% in 2011)
TAFE WA 50.1% 35%
TAFE Australia 40.9% 32%
All WA VET providers 53.1% 37%
All Australia VET providers 43.7% 33%
86%
96% 87% 92%
87% 88%
86% 86%
50%
60%
70%
80%
90%
100%
2010 2011 2012 2013Stu
de
nt
Sati
sfac
tio
n R
ate
(%
)
Overall Student Satisfaction
KTI
State Average

Kimberley Training Institute | 2013 Annual Report 21
Achievement of the main reason for studying
Graduates Module Completers
Kimberley Training Institute 90.2% (90.4% in 2011) 93.1% (90% in 2011)
TAFE WA 86% 84%
TAFE Australia 84% 82%
All WA VET providers 86.7% 84%
All Australia VET providers 83.5% 82%
Some additional examples of the way in which we provide an outstanding student experience include our Open Learning Centres and our Aboriginal training support.
Open Learning Centres
To achieve the results above we have invested in Open Learning Centres at Halls Creek, Derby, Kununurra and Broome. These centres have achieved exceptional results in attracting and retaining people who for a myriad of reasons have disengaged from formal education. The highly qualified and culturally sensitive staff provide one on one support for students with literacy and numeracy issues. Many of students are referred by their lecturers for additional and tailored literacy and numeracy support. Without this level of intensive literacy and numeracy support many students would not make it through their vocational studies.
Aboriginal Training Services
In 2013 Aboriginal and Torres Strait Islander (ATSI) people made up just under half the regional population (~47%) which is similarly reflected in our data with 50% of our students being Aboriginal. As a result the Institute has become a specialist provider for Aboriginal people. There are over 250 Aboriginal communities within the Kimberley Region outside the six major towns and therefore much of the Institute’s training delivery is off-campus in remote or very remote areas or communities where people live and work.
The Institute maintained its committed to the COAG (Council of Australian Governments) “Closing the Gap” strategies and bases its indigenous training activities on the strategies listed in Training WA: Planning for the Future 2009-2018 and Training Together Working Together: Aboriginal workforce development strategy.
In 2013 the Institute employed a team of 12 Aboriginal dedicated non-teaching staff to support its efforts to attract and retain indigenous students in work-focused training. Our statistics show that we provided training to nearly 2,000 Aboriginal students – an exceptional result in the face of the multitude of barriers experienced by indigenous people in participating in vocational education and training.
Kimberley Training Institute | 2013 Annual Report 22
Strategic goal 2: Developing strong industry relationships and partnerships
The Institute recognises the critical importance of strong partnerships with industry and government and community service providers. These partnerships are a key element in ensuring that training has a positive work outcome. Some examples of our successes in this arena are provided below.
Priority industry training
KTI has a long history of partnering with Rio Tinto to deliver pre-employment programs. In 2013 ten students completed their Certificate II in Resources and Infrastructure Work Preparation and all were offered jobs at Rio Tinto mines throughout WA. The project focused not only on building work skills but encouraging students to be healthy to sustain work. Students participated in exercise classes, healthy eating and budgeting.
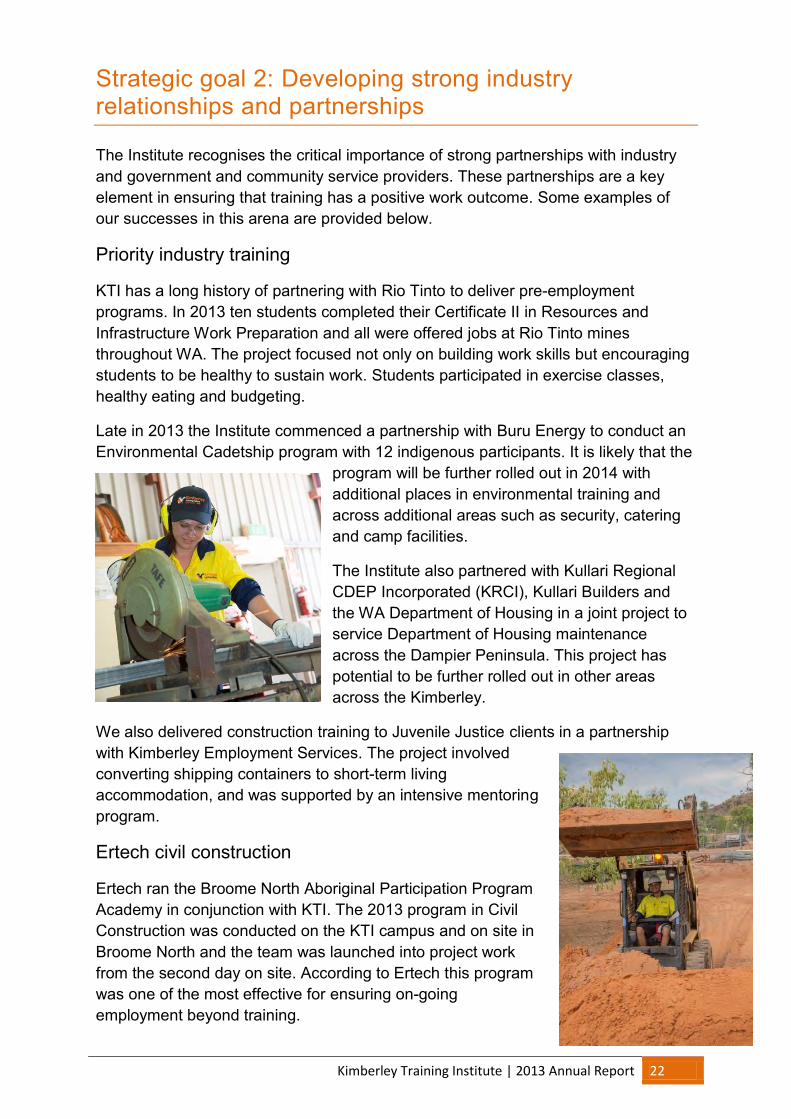
Late in 2013 the Institute commenced a partnership with Buru Energy to conduct an Environmental Cadetship program with 12 indigenous participants. It is likely that the
program will be further rolled out in 2014 with additional places in environmental training and across additional areas such as security, catering and camp facilities.
The Institute also partnered with Kullari Regional CDEP Incorporated (KRCI), Kullari Builders and the WA Department of Housing in a joint project to service Department of Housing maintenance across the Dampier Peninsula. This project has potential to be further rolled out in other areas across the Kimberley.
We also delivered construction training to Juvenile Justice clients in a partnership with Kimberley Employment Services. The project involved converting shipping containers to short-term living accommodation, and was supported by an intensive mentoring program.
Ertech civil construction
Ertech ran the Broome North Aboriginal Participation Program Academy in conjunction with KTI. The 2013 program in Civil Construction was conducted on the KTI campus and on site in Broome North and the team was launched into project work from the second day on site. According to Ertech this program was one of the most effective for ensuring on-going employment beyond training.

Kimberley Training Institute | 2013 Annual Report 23
Regional Jobs and Communities Program (RJCP) providers
The Institute worked closely with the newly appointed Regional Jobs and Communities Program providers to support them in their transition from Jobs Services Australian (JSA) and Community Development and Employment Program (CDEP) providers. In collaboration with these new providers, we tailored our training delivery in a number of programs to meet the new requirements of individual participation plans. We facilitated engagement by appointing dedicated case managers to each of the providers.
One example of where the RJCP and KTI collaboration worked well was a project done in collaboration with Marra Worra Worra, the Fitzroy Valley RJCP provider. Civil construction training was provided for 30 students who were working on actual road construction projects and road repair work for the local communities. The course was tailored in a way that created a real work environment. Practical skills such as using backhoes, graders, skid steers, excavators, tractors, slashers and trucks made the training engaging and practical. Not surprisingly attendance was high and on completion of the course many were employed in the mining industry, road construction and local councils.
Kimberley Training Institute | 2013 Annual Report 24
Strategic goal 3: Ensuring the sustainability, capability and capacity of our Institute
As the major provider of post-secondary education in the Kimberley, the Institute is committed to ensuring that it continues to deliver training programs and services that are comparable to or better than those offered in metropolitan regions. Some examples of this commitment are described below.
Business systems
In 2013 the Institute implemented a number of business system changes to ensure that our systems and processes are fit for purpose into the future. We rolled out a new intranet which is a knowledge base for all our staff, and we commissioned a new website which will be a key plank for communicating with current and future students and stakeholders.
We reviewed our Client Services and enrolment procedures to ensure the process is as seamless as possible for our enrolling students and we did the groundwork for implementing an updated CRM in 2014.
Facilities
The Institute commenced $25.243 M of capital works, involving major upgrades to the Halls Creek ($3.118 M), Derby ($6.99 M), and Broome ($15.135 M) campuses. These projects will all be completed in 2014, and will result in first-class training facilities in these communities.
Quality Management System
The Institute conducted a major review of its Quality Management System (QMS) and has made considerable progress in reviewing and re-publishing every policy and procedure and form to ensure consistency and quality across all aspects of operations. All QMS documents are now easily accessible to all staff via the new intranet.
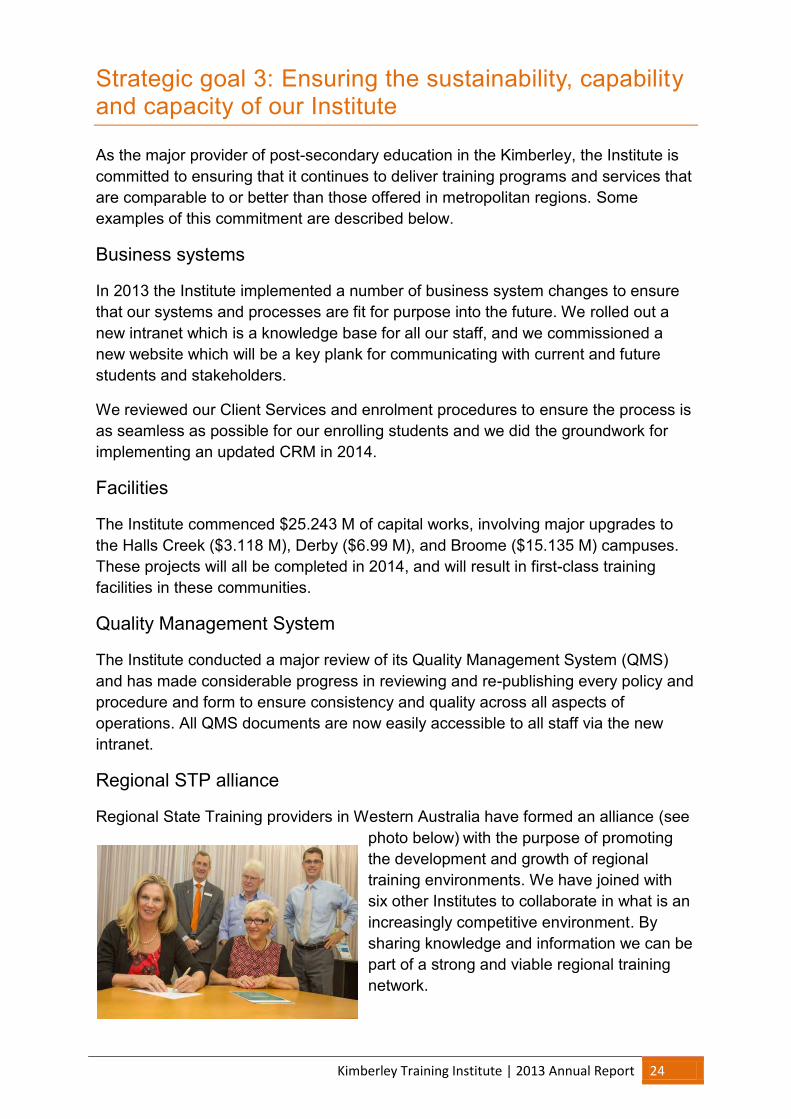
Regional STP alliance
Regional State Training providers in Western Australia have formed an alliance (see photo below) with the purpose of promoting the development and growth of regional training environments. We have joined with six other Institutes to collaborate in what is an increasingly competitive environment. By sharing knowledge and information we can be part of a strong and viable regional training network.

Kimberley Training Institute | 2013 Annual Report 25
Professional development
During 2013 the Institute embarked on a comprehensive professional development program both in preparation for, and as follow-up after, our AQTF audit. Much of this professional development activity centred on ensuring that training and assessment documentation is best practice and supports the quality delivery in which the staff take great pride.
Kimberley Training Institute | 2013 Annual Report 26
Strategic goal 4: Focusing on community and social responsibility
Kimberley Training Institute excels at engaging with its communities and is a major contributor to community development across the region. Below are just a few examples of the many programs we have implemented to support this commitment.
Rural and Remote Aged Care program
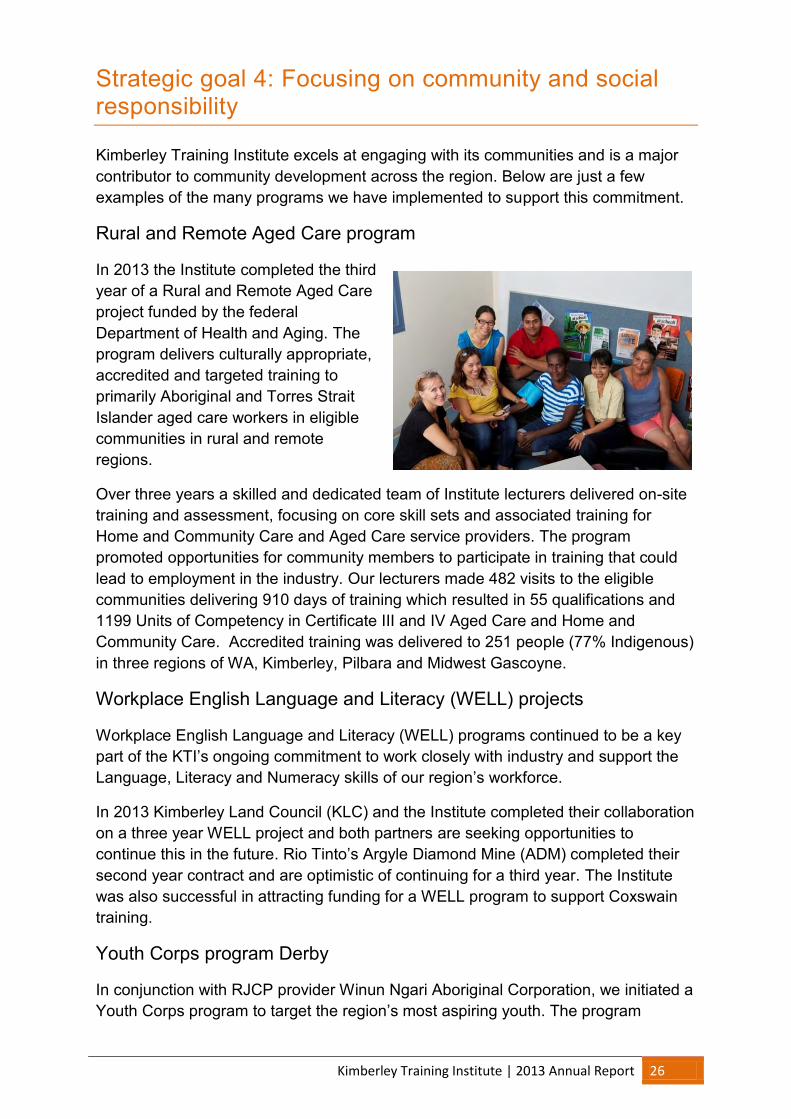
In 2013 the Institute completed the third year of a Rural and Remote Aged Care project funded by the federal Department of Health and Aging. The program delivers culturally appropriate, accredited and targeted training to primarily Aboriginal and Torres Strait Islander aged care workers in eligible communities in rural and remote regions.
Over three years a skilled and dedicated team of Institute lecturers delivered on-site training and assessment, focusing on core skill sets and associated training for Home and Community Care and Aged Care service providers. The program promoted opportunities for community members to participate in training that could lead to employment in the industry. Our lecturers made 482 visits to the eligible communities delivering 910 days of training which resulted in 55 qualifications and 1199 Units of Competency in Certificate III and IV Aged Care and Home and Community Care. Accredited training was delivered to 251 people (77% Indigenous) in three regions of WA, Kimberley, Pilbara and Midwest Gascoyne.
Workplace English Language and Literacy (WELL) projects
Workplace English Language and Literacy (WELL) programs continued to be a key part of the KTI’s ongoing commitment to work closely with industry and support the Language, Literacy and Numeracy skills of our region’s workforce.
In 2013 Kimberley Land Council (KLC) and the Institute completed their collaboration on a three year WELL project and both partners are seeking opportunities to continue this in the future. Rio Tinto’s Argyle Diamond Mine (ADM) completed their second year contract and are optimistic of continuing for a third year. The Institute was also successful in attracting funding for a WELL program to support Coxswain training.
Youth Corps program Derby
In conjunction with RJCP provider Winun Ngari Aboriginal Corporation, we initiated a Youth Corps program to target the region’s most aspiring youth. The program

Kimberley Training Institute | 2013 Annual Report 27
attracted a high level of inter-agency interest with many agencies pre-committing work placements to successful completers.
Youth Access Re-engagement Program (YARP)
The YARP program addresses the needs of young people who have become disengaged from mainstream education and allows the opportunity to provide a supportive transition back into further education and training.
For cultural reasons we ran two separate groups for young men and young women. The participants worked on a range of personal development and language and literacy programs.
VETiS
The Institute maintained its active VET in Schools program involving the following regional schools.
. Broome Senior High School
. Christ the King Catholic School (Lombadina)
. Derby District High School
. Fitzroy Valley District High School
. Halls Creek District High School
. Kununurra District High School
. La Grange Remote Community School
. One Arm Point Remote Community School
. St Mary’s Catholic School
. Wyndham District High School
. Yiramalay/Wesley Studio School (at Leopold Downs Station)
We delivered just under 50,000 SCH (our delivery ceiling) and there is potential to increase this in the future in order to facilitate seamless transition of young people from school to post-secondary education.
VET in Schools (VETiS) is a rapidly expanding area in which is now becoming more and more valued as a senior school pathway.
CGEA students experiencing dinner at the tourist resort in Kooljaman
Kununurra District High School automotive students; Carl Ochea and Jeremy Wood are undertaking a Certificate II in Automotive with Kimberley Group Training and host employers Argyle Motors and Coates Hire

Kimberley Training Institute | 2013 Annual Report 28
Wyndham Work Camp
Wyndham Work Camp (WWC) engineering students assisted with the restoration of the local supermarket’s trolleys. This activity has been highly valued since the retail industry spends more than $200 million a year collecting, repairing, maintaining and replacing trolleys. Saving trolleys that would otherwise have to be replaced also helps reduce carbon pollution.

Kimberley Training Institute | 2013 Annual Report 29
Strategic goal 5: Growing our business
The Institute initiated a number of new projects in 2013 which contributed to growing our business.
Fast-track management skills
In 2013 the Institute initiated a fast-track Diploma of Management, and this attracted a great deal of interest across the region. Around 30 students enrolled in this program when it was advertised late in the year. Students came from a broad range of backgrounds, but were predominantly from the very significant government workforce in the region.
Traineeship and apprenticeship delivery
Our traineeship delivery has been on an exponential growth path. After a slow start in 2009, the Institute has increased its Employment Based Training (EBT) delivery to just under 200 new commencements in 2013.
2010 2011 2012 2013
Commenced in this year 13 31 113 195
Cancelled 0 2 17 49
Completed 10 11 47 34
Still active 3 16 38 103
Completed in this year * 0 0 0 100 * Did not necessarily commence in this year Source: DTWD TRS Cognos Cubes
Although not required by government, the Institute provided a value-add for employers and apprentices by organising all travel and accommodation for block training delivery in Broome. This was a deliberate strategy to minimise the barriers to participation in training, and maximise student retention.
In 2013 around half of all traineeship and apprenticeship delivery was serviced out of Broome, and the remainder was evenly distributed across our other two main campuses at Kununurra and Derby.
To ensure the quality of delivery the Institute maintained its relationship with EBT stakeholders such as Apprenticentre, Australian Apprenticeship Centre, Skillhire, and Kimberley Group Training.
Gubinge project
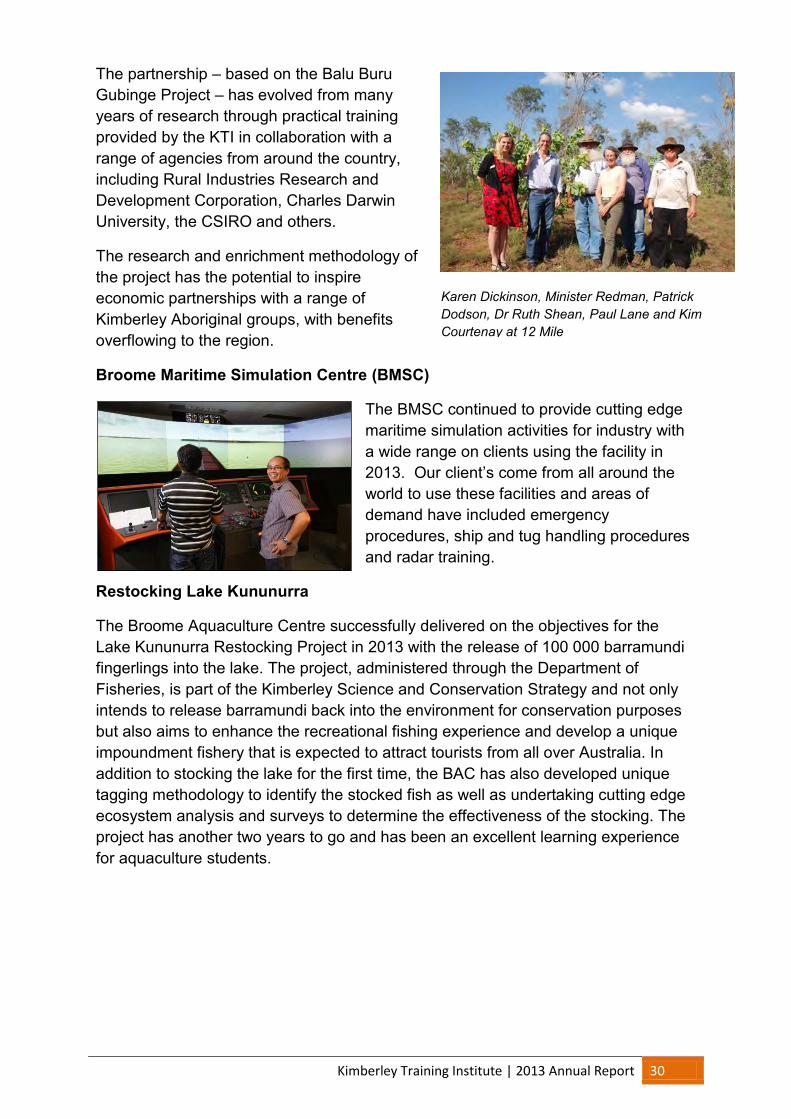
An historical partnership was struck between KTI and traditional owners Nyamba Buru Yawuru to develop a Kimberley-based native fruit industry that will combine indigenous land practices and conventional horticulture at 12 Mile near Broome.
Kimberley Training Institute | 2013 Annual Report 30
Karen Dickinson, Minister Redman, Patrick Dodson, Dr Ruth Shean, Paul Lane and Kim Courtenay at 12 Mile
The partnership – based on the Balu Buru Gubinge Project – has evolved from many years of research through practical training provided by the KTI in collaboration with a range of agencies from around the country, including Rural Industries Research and Development Corporation, Charles Darwin University, the CSIRO and others.
The research and enrichment methodology of the project has the potential to inspire economic partnerships with a range of Kimberley Aboriginal groups, with benefits overflowing to the region.
Broome Maritime Simulation Centre (BMSC)
The BMSC continued to provide cutting edge maritime simulation activities for industry with a wide range on clients using the facility in 2013. Our client’s come from all around the world to use these facilities and areas of demand have included emergency procedures, ship and tug handling procedures and radar training.
Restocking Lake Kununurra
The Broome Aquaculture Centre successfully delivered on the objectives for the Lake Kununurra Restocking Project in 2013 with the release of 100 000 barramundi fingerlings into the lake. The project, administered through the Department of Fisheries, is part of the Kimberley Science and Conservation Strategy and not only intends to release barramundi back into the environment for conservation purposes but also aims to enhance the recreational fishing experience and develop a unique impoundment fishery that is expected to attract tourists from all over Australia. In addition to stocking the lake for the first time, the BAC has also developed unique tagging methodology to identify the stocked fish as well as undertaking cutting edge ecosystem analysis and surveys to determine the effectiveness of the stocking. The project has another two years to go and has been an excellent learning experience for aquaculture students.

Kimberley Training Institute | 2013 Annual Report 31
Disclosure of legal compliance
Kimberley Training Institute | 2013 Annual Report 32

Kimberley Training Institute | 2013 Annual Report 33
Kimberley Training Institute | 2013 Annual Report 34
Financial statements
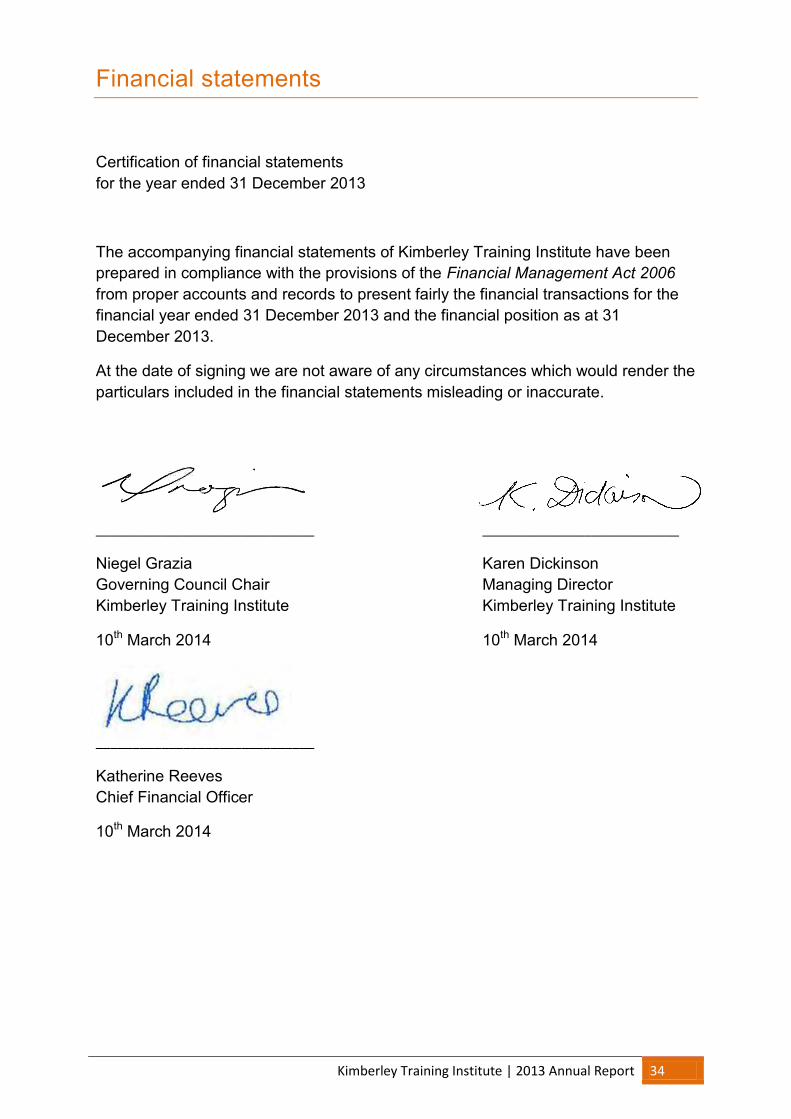
Certification of financial statements for the year ended 31 December 2013
The accompanying financial statements of Kimberley Training Institute have been prepared in compliance with the provisions of the Financial Management Act 2006 from proper accounts and records to present fairly the financial transactions for the financial year ended 31 December 2013 and the financial position as at 31 December 2013.
At the date of signing we are not aware of any circumstances which would render the particulars included in the financial statements misleading or inaccurate.
______________________________ ___________________________
Niegel Grazia Karen Dickinson Governing Council Chair Managing Director Kimberley Training Institute Kimberley Training Institute
10th March 2014 10th March 2014
______________________________
Katherine Reeves Chief Financial Officer
10th March 2014

Kimberley Training Institute | 2013 Annual Report 35
Statement of comprehensive income (For the year ended 31 December 2013)
Not
e
2013 2012
$ $ Cost of services
Expenses Employee benefits expense 7 23,981,661 23,898,850 Supplies and services 8 6,920,919 6,580,539 Depreciation and amortisation expense 9 1,544,520 1,516,689 Grants and subsidies 10 157,010 147,827 Cost of sales 15 30,088 36,090 Loss on disposal of non-current assets 19 6,492 - Other expenses 11 1,487,301 1,290,387 Total cost of services 34,127,991 33,470,382 Income Revenue Fee for service 12 1,297,125 1,542,314 Student fees and charges 13 1,068,281 986,623 Ancillary trading 14 14,433 120,814 Sales 15 35,370 44,348 Commonwealth grants and contributions 16 846,087 994,757 Interest revenue 17 180,747 200,987 Other revenue 18 64,892 113,731 Total revenue 3,506,935 4,003,574 Total income other than income from State Government
3,506,935 4,003,574
Net cost of services 30,621,056 29,466,808
Income from the State Government 20 Service appropriation 28,214,092 26,900,110 Services received free of charge 1,072,830 872,138 Total income from State Government 29,286,922 27,772,248
Surplus/(Deficit) for the period (1,334,134) (1,694,560)
Other comprehensive income Changes in asset revaluation surplus 33 741,975 (1,029,636) Total other comprehensive income 741,975 (1,029,636)
Total comprehensive income/(deficit) for the period
(592,159) (2,724,196)
The Statement of Comprehensive Income should be read in conjunction with the accompanying notes.

Kimberley Training Institute | 2013 Annual Report 36
Statement of financial position (As at 31 December 2013)
Not
e
2013 2012
$ $ Assets
Current Assets Cash and cash equivalents 34 3,861,292 2,458,709 Restricted cash and cash equivalents 21,34 709,339 - Inventories 22 35,180 34,002 Receivables 23 389,237 1,359,167 Other current assets 24 165,735 122,968 Total Current Assets 5,160,783 3,974,846 Non-Current Assets Restricted cash and cash equivalents 21,34 - 629,139 Property, plant and equipment 26 49,930,124 50,307,711 Intangible assets 28 228,377 222,975 Total Non-Current Assets 50,158,501 51,159,825
Total assets 55,319,284 55,134,670
Liabilities Current Liabilities Payables 30 997,861 1,195,872 Provisions 31 2,536,015 3,265,049 Other current liabilities 32 2,370,170 1,084,788 Total Current Liabilities 5,904,046 5,545,708 Non-Current Liabilities Provisions 31 739,352 643,133 Total Non-Current Liabilities 739,352 643,133
Total liabilities 6,643,398 6,188,841
Net assets 48,675,886 48,945,829
Equity 33 Contributed equity 19,586,331 19,264,116 Reserves 24,528,171 23,786,196 Accumulated surplus/(deficit) 4,561,384 5,895,517
Total Equity 48,675,886 48,945,829
The Statement of Financial Position should be read in conjunction with the accompanying notes.

Kimberley Training Institute | 2013 Annual Report 37
Statement of changes in equity (For the year ended 31 December 2013)
Note
Contributed Equity Reserves
Accumulated Surplus /(Deficit)
Total Equity
$ $ $ $ Balance at 1 January 2012 33 6,842,955 24,815,833 7,590,077 39,248,865 Surplus/(deficit) - - (1,694,560) (1,694,560) Other comprehensive income - (1,029,637) - (1,029,637) Total comprehensive income for the period (1,029,637) (1,694,560) (2,724,197) Transaction with owners in their capacity as owners : Capital appropriations 12,421,161 - - 12,421,161 Total 12,421,161 - - 12,421,161
Balance of 31 December 2012 19,264,116 23,786,196 5,895,517 48,945,829
Balance at 1 January 2013 19,264,116 23,786,196 5,895,517 48,945,829 Surplus/(deficit) - - (1,334,133) (1,334,133) Other comprehensive income - 741,975 - 741,975 Total comprehensive income for the period - 741,975 (1,334,133) (592,158) Transaction with owners in their capacity as owners: Capital appropriations 322,215 - - 322,215 Total 322,215 - - 322,215
Balance at 31 December 2013 19,586,331 24,528,171 4,561,384 48,675,886
The Statement of Changes in Equity should be read in conjunction with the accompanying notes.

Kimberley Training Institute | 2013 Annual Report 38
Statement of cash flows (For the year ended 31 December 2013)
Not
e
2013 2012
$ $ Cash flows from State Government
Service appropriation – Dept. of Training and Workforce Development
28,773,529 26,340,670
Net cash provided by State Government 28,773,529 26,340,670 Utilised as follows:
Cash flows from operating activity Payments Employee benefits (24,599,433) (22,442,454) Supplies and services (6,342,409) (5,954,766) Grants and subsidies (157,010) 250,950 GST payments on purchases (159,546) 601,101 Other payments (1,492,700) (1,280,222) Receipts Fee for service 1,263,454 1,262,373 Student fees and charges 1,255,051 906,648 Ancillary trading 16,346 120,813 Commonwealth grants and contributions 2,310,930 1,123,326 Interest received 180,747 200,987 GST receipts on sales 708,801 (303,929) GST receipts from taxation authority (230,512) (56,026) Other receipts 70,173 121,984 Net cash provided by/(used in) operating activities
34 (27,176,108) (25,449,212)
Cash flow from investing activities
Payments Purchase of non-current physical assets (114,639) (365,564) Net cash provided by/(used in) investing activities
(114,639) (365,564)
Net increase/(decrease) in cash and cash equivalents
1,482,782 525,891
Cash and cash equivalents at the beginning of period
3,087,848 2,561,957
Cash and cash equivalents at the end of period
34 4,570,630 3,087,848
The Statement of Cash Flows should be read in conjunction with the accompanying notes.

Kimberley Training Institute | 2013 Annual Report 39
Notes to the financial statements (For the year ended 31 December 2013)
Note 1. Australian Accounting Standards
(a) General
The Institute's financial statements for the year ended 31 December 2013 have been prepared in accordance with Australian Accounting Standards. The term 'Australian Accounting Standards' includes Standards and Interpretations issued by the Australian Accounting Standard Board (AASB).
The Institute has adopted any applicable new and revised Australian Accounting Standards from their operative dates.
(b) Early adoption of standards
The Institute cannot early adopt an Australian Accounting Standard unless specifically permitted by Treasurer's Instruction (TI) 1101 'Application of Australian Accounting Standards and Other Pronouncements'. There has been no early adoption of Australian Accounting Standards that have been issued or amended (but not operative) by the Institute for the annual reporting period ended 31 December 2013.
Note 2. Summary of significant accounting policies
The following accounting policies have been adopted in the preparation of these financial statements. Unless otherwise stated, these policies are consistent with those adopted in the previous year.
(a) General statement
The Institute is a not-for-profit reporting entity that prepares general purpose financial statements in accordance with the Australian Accounting Standards, the Framework, Statements of Accounting Concepts and other authoritative pronouncements of the AASB as applied by the Treasurer’s instructions. Several of these are modified by the Treasurer’s instructions to vary application, disclosure, format and wording.
The Financial Management Act 2006 and the Treasurer’s instructions impose legislative provisions that govern the preparation of financial statements and take precedence over the Australian Accounting Standards, the Framework, Statements of Accounting Concepts and other authoritative pronouncements of the AASB.
Where modification is required and has had a material or significant financial effect upon the reported results, details of that modification and the resulting financial effect are disclosed in the notes to the financial statements.

Kimberley Training Institute | 2013 Annual Report 40
(b) Basis of preparation
The financial statements have been prepared on the accrual basis of accounting using the historical cost convention, except for land and buildings which have been measured at fair value.
The accounting policies adopted in the preparation of the financial statements have been consistently applied throughout all periods presented unless otherwise stated.
The financial statements are presented in Australian dollars ($).
Note 4 ‘Judgements made by management in applying accounting policies’ discloses judgements that have been made in the process of applying the Institute’s accounting policies resulting in the most significant effect on amounts recognised in the financial statements.
Note 5 ‘Key sources of estimation uncertainty’ discloses key assumptions made concerning the future, and other key sources of estimation uncertainty at the end of the reporting period, that have a significant risk of causing a material adjustment to the carrying amounts of assets and liabilities within the next financial year.
(c) Reporting entity
The reporting entity comprises the Institute and bodies included at note 44 ‘Related bodies’.
(d) Contributed equity
AASB Interpretation 1038 ‘Contributions by Owners Made to Wholly-Owned Public Sector Entities’ requires transfers in the nature of equity contributions, other than as a result of a restructure of administrative arrangements, to be designated by the Government (the owner) as contributions by owners (at the time of, or prior to transfer) before such transfers can be recognised as equity contributions. Capital appropriations have been designated as contributions by owners by TI 955 'Contributions by Owners Made to Wholly Owned Public Sector Entities' and have been credited directly to Contributed Equity.
The transfers of net assets to/from other agencies, other than as a result of a restructure of administrative arrangements, are designated as contributions by owners where the transfers are non-discretionary and non-reciprocal. See note 33 'Equity'.
(e) Income
Revenue recognition
Revenue is recognised and measured at the fair value of consideration received or receivable.
Kimberley Training Institute | 2013 Annual Report 41
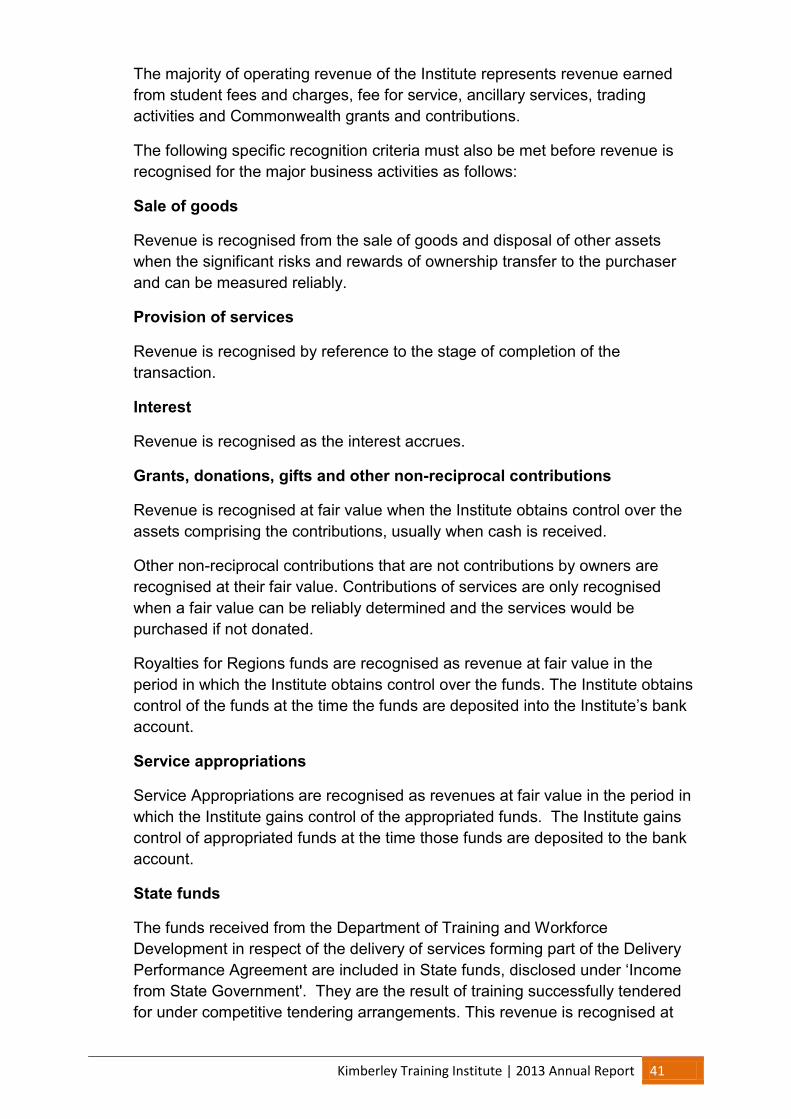
The majority of operating revenue of the Institute represents revenue earned from student fees and charges, fee for service, ancillary services, trading activities and Commonwealth grants and contributions.
The following specific recognition criteria must also be met before revenue is recognised for the major business activities as follows:
Sale of goods
Revenue is recognised from the sale of goods and disposal of other assets when the significant risks and rewards of ownership transfer to the purchaser and can be measured reliably.
Provision of services
Revenue is recognised by reference to the stage of completion of the transaction.
Interest
Revenue is recognised as the interest accrues.
Grants, donations, gifts and other non-reciprocal contributions
Revenue is recognised at fair value when the Institute obtains control over the assets comprising the contributions, usually when cash is received.
Other non-reciprocal contributions that are not contributions by owners are recognised at their fair value. Contributions of services are only recognised when a fair value can be reliably determined and the services would be purchased if not donated.
Royalties for Regions funds are recognised as revenue at fair value in the period in which the Institute obtains control over the funds. The Institute obtains control of the funds at the time the funds are deposited into the Institute’s bank account.
Service appropriations
Service Appropriations are recognised as revenues at fair value in the period in which the Institute gains control of the appropriated funds. The Institute gains control of appropriated funds at the time those funds are deposited to the bank account.
State funds
The funds received from the Department of Training and Workforce Development in respect of the delivery of services forming part of the Delivery Performance Agreement are included in State funds, disclosed under ‘Income from State Government'. They are the result of training successfully tendered for under competitive tendering arrangements. This revenue is recognised at

Kimberley Training Institute | 2013 Annual Report 42
nominal value in the period in which the Institute meets the terms of the Agreement. See note 20 'Income from State Government'.
Gains
Realised and unrealised gains are usually recognised on a net basis. These include gains arising on the disposal of non-current assets and some revaluations of non-current assets.
(f) Borrowing costs
Borrowing costs for qualifying assets are capitalised net of any investment income earned on the unexpended portion of the borrowings. Other borrowing costs are expensed when incurred.
(g) Property, plant and equipment
Capitalisation/expensing of assets
Items of property, plant and equipment costing $5,000 or more are recognised as assets and the cost of utilising assets is expensed (depreciated) over their useful lives. Where applicable in accordance with TI 1101, the capitalisation threshold has been applied to the aggregate value of a group or network of assets where the cost of individual item may be below the threshold but collectively the cost of the items in the group or network exceeds the threshold. Items of property, plant and equipment costing less than $5,000 are immediately expensed direct to the Statement of Comprehensive Income (other than where they form part of a group of similar items which are significant in total).
Initial recognition and measurement
Property, plant and equipment are initially recognised at cost.
For items of property, plant and equipment acquired at no cost or for nominal cost, the cost is the fair value at the date of acquisition.
Subsequent measurement
Subsequent to initial recognition as an asset, the revaluation model is used for the measurement of land and buildings and historical cost for all other property, plant and equipment. Land and buildings are carried at fair value less accumulated depreciation (buildings only) and accumulated impairment losses.
All other items of property, plant and equipment are stated at historical cost less accumulated depreciation and accumulated impairment losses.
Where market-based evidence is available, the fair value of land and buildings is determined on the basis of current market values determined by reference to recent market transactions. When buildings are revalued by reference to recent market transactions, the accumulated depreciation is eliminated against

Kimberley Training Institute | 2013 Annual Report 43
the gross carrying amount of the asset and the net amount restated to the revalued amount.
In the absence of market-based evidence, fair value of land and buildings is determined on the basis of existing use. This normally applies where buildings are specialised or where land use is restricted. Fair value for existing use buildings is determined by reference to the cost of replacing the remaining future economic benefits embodied in the asset, i.e. the depreciated replacement cost. Where the fair value of buildings is determined on the depreciated replacement cost basis, the accumulated depreciation is eliminated against the gross carrying amount of the asset and the net amount restated to the revalued amount. Fair value for restricted use land is determined by comparison with market evidence for land with similar approximate utility (high restricted use land) or market value of comparable unrestricted land less estimated rehabilitation costs (low restricted use land).
Land and buildings are independently valued annually by the Western Australian Land Information Authority (Valuation Services) and recognised annually to ensure that the carrying amount does not differ materially from the asset's fair value at the end of the reporting period.
The most significant assumptions and judgements in estimating fair value are made in assessing whether to apply the existing use basis to assets and in determining estimated useful life.
Professional judgement by the valuer is required where the evidence does not provide a clear distinction between market type assets and existing use assets. Refer to note 26 'Property, plant and equipment' for further information on revaluations.
Derecognition
Upon disposal or derecognition of an item of property, plant and equipment, any revaluation surplus relating to that asset is retained in the asset revaluation surplus.
Asset revaluation surplus
The asset revaluation surplus is used to record increments and decrements on the revaluation of non-current assets as described in note 26 ‘Property, plant and equipment’.
Depreciation
All non-current assets having a limited useful life are systematically depreciated over their estimated useful lives in a manner that reflects the consumption of their future economic benefits.
Kimberley Training Institute | 2013 Annual Report 44
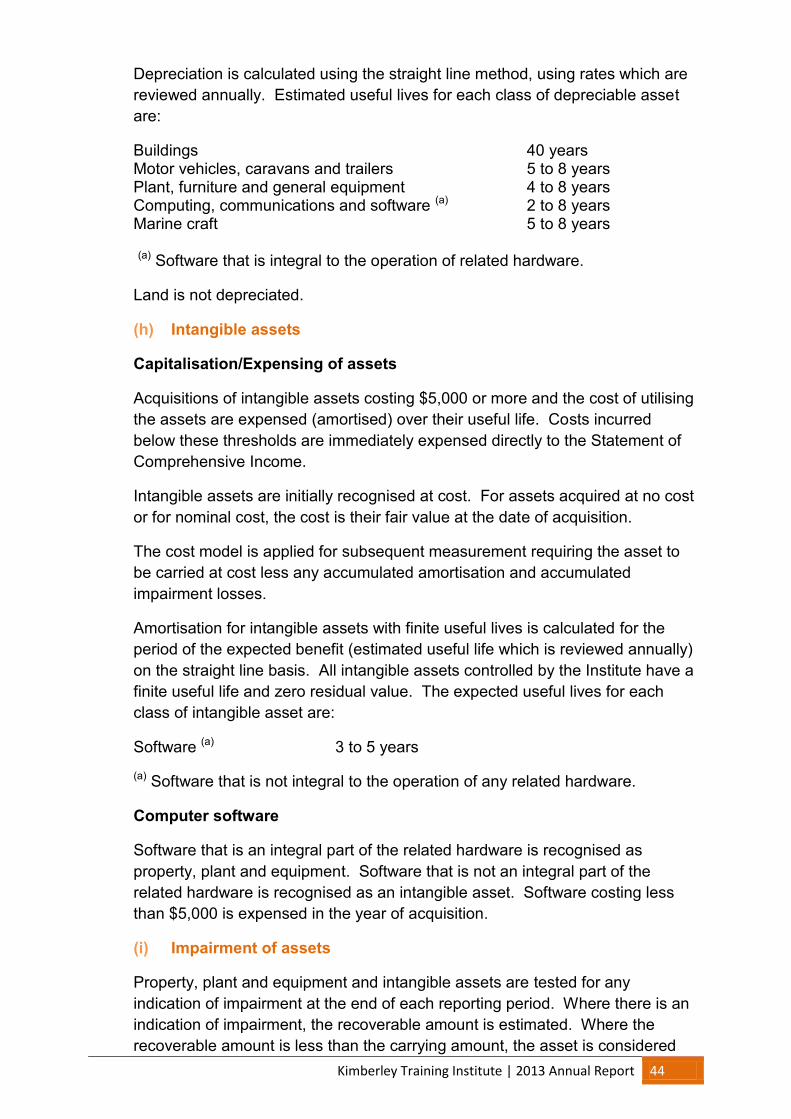
Depreciation is calculated using the straight line method, using rates which are reviewed annually. Estimated useful lives for each class of depreciable asset are:
Buildings 40 years Motor vehicles, caravans and trailers 5 to 8 years Plant, furniture and general equipment 4 to 8 years Computing, communications and software (a) 2 to 8 years Marine craft 5 to 8 years (a) Software that is integral to the operation of related hardware.
Land is not depreciated.
(h) Intangible assets
Capitalisation/Expensing of assets
Acquisitions of intangible assets costing $5,000 or more and the cost of utilising the assets are expensed (amortised) over their useful life. Costs incurred below these thresholds are immediately expensed directly to the Statement of Comprehensive Income.
Intangible assets are initially recognised at cost. For assets acquired at no cost or for nominal cost, the cost is their fair value at the date of acquisition.
The cost model is applied for subsequent measurement requiring the asset to be carried at cost less any accumulated amortisation and accumulated impairment losses.
Amortisation for intangible assets with finite useful lives is calculated for the period of the expected benefit (estimated useful life which is reviewed annually) on the straight line basis. All intangible assets controlled by the Institute have a finite useful life and zero residual value. The expected useful lives for each class of intangible asset are:
Software (a) 3 to 5 years
(a) Software that is not integral to the operation of any related hardware.
Computer software
Software that is an integral part of the related hardware is recognised as property, plant and equipment. Software that is not an integral part of the related hardware is recognised as an intangible asset. Software costing less than $5,000 is expensed in the year of acquisition.
(i) Impairment of assets
Property, plant and equipment and intangible assets are tested for any indication of impairment at the end of each reporting period. Where there is an indication of impairment, the recoverable amount is estimated. Where the recoverable amount is less than the carrying amount, the asset is considered

Kimberley Training Institute | 2013 Annual Report 45
impaired and is written down to the recoverable amount and an impairment loss is recognised. . Where an asset measured at cost is written down to recoverable amount, an impairment loss is recognised in profit or loss. Where a previously revalued asset is written down to recoverable amount, the loss is recognised as a revaluation decrement in other comprehensive income. As the Institute is a not-for-profit entity, unless an asset has been identified as a surplus asset, the recoverable amount is the higher of an asset’s fair value less costs to sell and depreciated replacement cost.
The risk of impairment is generally limited to circumstances where an asset’s depreciation is materially understated, where the replacement cost is falling or where there is a significant change in useful life. Each relevant class of assets is reviewed annually to verify that the accumulated depreciation/amortisation reflects the level of consumption or expiration of asset’s future economic benefits and to evaluate any impairment risk from falling replacement costs.
Intangible assets with an indefinite useful life and intangible assets not yet available for use are tested for impairment at the end of each reporting period irrespective of whether there is any indication of impairment.
The recoverable amount of assets identified as surplus assets is the higher of fair value less costs to sell and the present value of future cash flows expected to be derived from the asset. Surplus assets carried at fair value have no risk of material impairment where fair value is determined by reference to market-based evidence. Where fair value is determined by reference to depreciated replacement cost, surplus assets are at risk of impairment and the recoverable amount is measured. Surplus assets at cost are tested for indications of impairment at the end of each reporting period.
See note 29 ‘Impairment of assets’ for the outcome of impairment reviews and testing. See note 2(p) 'Receivables' and note 23 'Receivables' for impairment of receivables.
(j) Non-current assets (or disposal groups) classified as held for sale
Non-current assets (or disposal groups) held for sale are recognised at the lower of carrying amount and fair value less costs to sell, and are disclosed separately from other assets in the Statement of Financial Position. Assets classified as held for sale are not depreciated or amortised.
(k) Leases
The Institute has entered into operating lease arrangements for vehicles, land and buildings. Lease payments are expensed on a straight line basis over the lease term as this represents the pattern of benefits derived from the leased vehicles, land and buildings.

Kimberley Training Institute | 2013 Annual Report 46
(l) Financial instruments
In addition to cash and bank overdraft, the Institute has two categories of financial instruments:
. Loans and receivables; and
. Financial liabilities measured at amortised cost.
These have been disaggregated into the following classes:
Financial assets
. Cash and cash equivalents
. Restricted cash and cash equivalents
. Receivables
Financial liabilities
. Payables
Initial recognition and measurement of financial instruments is at fair value which normally equates to the transaction cost or the face value. Subsequent measurement is at amortised cost using the effective interest method.
The fair value of short-term receivables and payables is the transaction cost or the face value because there is no interest rate applicable and subsequent measurement is not required as the effect of discounting is not material.
(m) Cash and cash equivalents
For the purpose of the Statement of Cash Flows, cash and cash equivalents include restricted cash and cash equivalents. These are comprised of cash on hand and short-term deposits with original maturities of three months or less that are readily convertible to a known amount of cash and which are subject to insignificant risk of changes in value, and bank overdrafts.
(n) Accrued salaries
Accrued salaries (see note 30 'Payables') represent the amount due to staff but unpaid at the end of the financial year, as the end of the last pay period for that financial year does not coincide with the end of the financial year. Accrued salaries are settled within a fortnight of the financial year end. The Institute considers the carrying amount of accrued salaries to be equivalent to its fair value.
The accrued salaries suspense account (see note 21 ‘Restricted cash and cash equivalents’) consists of amounts paid annually into a suspense account over a period of ten financial years to largely meet the additional cash outlay in each eleventh year when 27 pay days occur instead of the normal 26. No interest is received on this account.

Kimberley Training Institute | 2013 Annual Report 47
(o) Inventories
Inventories are measured at the lower of cost and net realisable value. Costs are assigned by the method most appropriate to each particular class of inventory, with the majority being measured on a first in first out basis.
Inventories not held for resale are measured at cost unless they are no longer required, in which case they are measured at net realisable value.
See note 22 'Inventories'.
(p) Receivables
Receivables are recognised at original invoice amount less an allowance for any uncollectible amounts (i.e. impairment). The collectability of receivables is reviewed on an ongoing basis and any receivables identified as uncollectible are written-off against the allowance account. The allowance for uncollectible amounts (doubtful debts) is raised when there is objective evidence that the Institute will not be able to collect the debts. The carrying amount is equivalent to fair value as it is due for settlement within 30 days. See note 2(l) ‘Financial instruments’ and note 23 ‘Receivables’.
(q) Payables
Payables are recognised when the Institute becomes obliged to make future payments as a result of a purchase of assets or services. The carrying amount is equivalent to fair value, as settlement is generally within 30 days. See note 2(l) ‘Financial instruments’ and note 30 'Payables'.
(r) Borrowings
The Institute had no borrowings during 2013.
(s) Provisions
Provisions are liabilities of uncertain timing or amount and are recognised where there is a present legal or constructive obligation as a result of a past event and when the outflow of resources embodying economic benefits is probable and a reliable estimate can be made of the amount of the obligation. Provisions are reviewed at the end of each reporting period. See note 31 ‘Provisions’.
i. Provisions - employee benefits
All annual leave and long service leave provisions are in respect of employees’ services up to the end of the reporting period.
Annual leave
The liability for annual leave that is expected to be settled within twelve months after the end of the reporting period is recognised and measured at the undiscounted amounts expected to be paid when the liability is settled.

Kimberley Training Institute | 2013 Annual Report 48
Annual leave that is not expected to be settled within 12 months after the end of the reporting period is recognised and measured at the present value of amounts expected to be paid when the liabilities are settled using the remuneration rate expected to apply at the time of settlement.
When assessing expected future payments consideration is given to expected future wage and salary levels including non-salary components such as employer superannuation contributions, as well as the experience of employee departures and periods of service. The expected future payments are discounted using market yields at the end of the reporting period on national government bonds with terms to maturity that match, as closely as possible, the estimated future cash outflows.
The provision for annual leave is classified as a current liability as the Institute does not have an unconditional right to defer settlement of the liability for at least 12 months after the end of the reporting period.
Long service leave
The liability for long service leave expected to be settled within 12 months after the end of the reporting period is recognised and measured at the undiscounted amounts expected to be paid when the liability is settled.
Long service leave that is not expected to be settled within 12 months after the end of the reporting period is recognised and measured at the present value of amounts expected to be paid when the liabilities are settled using the remuneration rate expected to apply at the time of settlement.
When assessing expected future payments consideration is given to expected future wage and salary levels including non-salary components such as employer superannuation contributions, as well as the experience of employee departures and periods of service. The expected future payments are discounted using market yields at the end of the reporting period on national government bonds with terms to maturity that match, as closely as possible, the estimated future cash outflows.
Unconditional long service leave provisions are classified as current liabilities as the Institute does not have an unconditional right to defer settlement of the liability for at least 12 months after the end of the reporting period. Pre-conditional and conditional long service leave provisions are classified as non-current liabilities because the Institute has an unconditional right to defer the settlement of the liability until the employee has completed the requisite years of service.
Superannuation
The Government Employees Superannuation Board (GESB) and other funds administer public sector superannuation arrangements in Western Australia in

Kimberley Training Institute | 2013 Annual Report 49
accordance with legislative requirements. Eligibility criteria for membership in particular schemes for public sector employees vary according to commencement and implementation dates.
Eligible employees contribute to the Pension Scheme, a defined benefit pension scheme closed to new members since 1987, or the Gold State Superannuation Scheme (GSS), a defined benefit lump sum scheme closed to new members since 1995.
Employees commencing employment prior to 16 April 2007 who were not members of either the Pension Scheme or the GSS became non-contributory members of the West State Superannuation Scheme (WSS). Employees commencing employment on or after 16 April 2007 became members of the GESB Super Scheme (GESBS). From 30 March 2012, existing members of the WSS or GESBS and new employees have been able to choose their preferred superannuation fund provider. The Institute makes contributions to GESB or other funds providers on behalf of employees in compliance with the Commonwealth Government’s Superannuation Guarantee (Administration) Act 1992. Contributions to these accumulation schemes extinguish the Institute’s liability for superannuation charges in respect of employees who are not members of the Pension Scheme or GSS.
The GSS is a defined benefit scheme for the purposes of employees and whole-of-government reporting. However, it is a defined contribution plan for Institute purposes because the concurrent contributions (defined contributions) made by the Institute to GESB extinguishes the Institute’s obligations to the related superannuation liability.
The Institute has no liabilities under the Pension Scheme or the GSS. The liabilities for the unfunded Pension Scheme and the unfunded GSS transfer benefits attributable to members who transferred from the Pension Scheme, are assumed by the Treasurer. All other GSS obligations are funded by concurrent contributions made by the Institute to the GESB.
The GESB makes all benefit payments in respect of the Pension Scheme and GSS, and is recouped from the Treasurer for the employer's share. See also note 2(t) 'Superannuation expense'.
ii. Provisions - other
Employment on-costs
Employment on-costs, including workers’ compensation insurance, are not employee benefits and are recognised separately as liabilities and expenses when the employment to which they relate has occurred. Employment on-costs are included as part of 'Other expenses' and are not included as part of the Institute's 'Employee benefits expense’. The related liability is included in 'Employment on-costs provision'. (See note 11 'Other expenses' and note 31 'Provisions'.)

Kimberley Training Institute | 2013 Annual Report 50
(t) Superannuation expense
The superannuation expense in the Statement of Comprehensive Income comprises employer contributions paid to the GSS (concurrent contributions), the West State Superannuation Scheme (WSS), the GESB Super Scheme (GESBS) and other superannuation funds.
(u) Assets and services received free of charge or for nominal cost
Assets or services received free of charge or for nominal cost that the Institute would otherwise purchase if not donated, are recognised as income at the fair value of the assets or services where they can be reliably measured. A corresponding expense is recognised for services received. Receipts of assets are recognised in the Statement of Financial Position.
Assets or services received from other State Government agencies are separately disclosed under Income from State Government in the Statement of Comprehensive Income.
(v) Jointly controlled operations
The Institute has no interests in joint ventures that are jointly controlled operations.
(w) Comparative figures
Comparative figures are, where appropriate, reclassified to be comparable with the figures presented in the current financial year.
Note 3. Other accounting policies not included
There are no further policies to disclose.
Note 4. Judgements made by management in applying accounting policies
The preparation of financial statements requires management to make judgements about the application of accounting policies that have a significant effect on the amounts recognised in the financial statements. The Institute evaluates these judgements regularly.
Operating Lease Commitments
The Institute has entered into a commercial lease and has determined that the lessor retains substantially all the significant risks and rewards incidental to ownership of the property. Accordingly, the lease has been classified as an operating lease.
Note 5. Key sources of estimation uncertainty
Key estimates and assumptions concerning the future are based on historical experience and various other factors that have a significant risk of causing a

Kimberley Training Institute | 2013 Annual Report 51
material adjustment to the carrying amount of assets and liabilities within the next financial year.
DPA refund for under delivery
The Institute has recognised as unearned income received in advance funds received from the Department of Training and Workforce Development due to an under delivery of Student Curriculum Hours required to be delivered in 2013 under the Delivery Performance Agreement. Changes in final determined SCH in each delivery area may impact on the amount of the refund that is required under the terms of the agreement.
Long Service Leave
Several estimations and assumptions in calculating the Institute’s long service leave provision include expected future salary rates, discount rates, employee retention rates and expected future payments. Changes in these estimations and assumptions may impact on the carrying amount of the long service leave provision.
Note 6. Disclosure of changes in accounting policy and estimates
Initial application of an Australian Accounting Standard
The Institute has applied the following Australian Accounting Standards effective for annual reporting periods beginning on or after 1 January 2013 that impacted on the Institute.
AASB 13 Fair Value Measurement This Standard defines fair value, sets out a framework for measuring fair value and requires additional disclosures for fair value measurements for non-financial assets and liabilities. There is no financial impact.
AASB 119 Employee Benefits This Standard supersedes AASB 119 (October 2010), making changes to the recognition, presentation and disclosure requirements. The Institute assessed employee leave patterns to determine whether annual leave is a short-term or other long-term employee benefit. The resultant discounting of annual leave liabilities that were previously measured at the undiscounted amounts is not material.
AASB 1048
Interpretation of standards This Standard supersedes AASB 1048 (June 2012), enabling references to the Interpretations in all other Standards to be updated by reissuing the service Standard. There is no financial impact.

Kimberley Training Institute | 2013 Annual Report 52
AASB 2011-8
Amendments to Australian Accounting Standards arising from AASB 13 [AASB 1, 2, 3, 4, 5, 7, 9, 2009-11, 2010-7, 101, 102, 108, 110, 116, 117, 118, 119, 120, 121, 128, 131, 132, 133, 134, 136, 138, 139, 140, 141, 1004, 1023 & 1038 and Int 2, 4, 12, 13, 14, 17, 19, 131 & 132] This Standard replaces the existing definition and fair value guidance in other Australian Accounting Standards and Interpretations as the result of issuing AASB 13 in September 2011. There is no financial impact.
AASB 2011-9
Amendments to Australian Accounting Standards – Presentation of Items of Other Comprehensive Income [AASB 1, 5, 7, 101, 112, 120, 121, 132, 133, 134, 1039 &1049] This Standard requires to group items presented in other comprehensive income on the basis of whether they are potentially reclassifiable to profit or loss subsequently (reclassification adjustments). There is no financial impact.
AASB 2011-10
Amendments to Australian Accounting Standards arising from AASB 119 (September 2011) [AASB 1, 8, 101, 124, 134, 1049 & 2011-8 and Int 14] This Standard makes amendments to other Australian Accounting Standards and Interpretations as a result of issuing AASB 119 in September 2011. The resultant discounting of annual leave liabilities that were previously measured at the undiscounted amounts is not material.
AASB 2012-2
Amendments to Australian Accounting Standards – Disclosures – Offsetting Financial Assets and Financial Liabilities [AASB 7 & 132] This Standard amends the required disclosures in AASB 7 to include information that will enable users of an entity’s financial statements to evaluate the effect or potential effect of netting arrangements, including rights of set-off associated with the entity’s recognised financial assets and recognised financial liabilities, on the entity’s financial position. There is no financial impact.
AASB 2012-5
Amendments to Australian Accounting Standards arising from Annual Improvements 2009-11 Cycle [AASB 1, 101, 116, 132 & 134 and Int 2] This Standard makes amendments to the Australian Accounting Standards and Interpretations as a consequence of the annual improvements process. There is no financial impact.
AASB 2012-6
Amendments to Australian Accounting Standards – Mandatory Effective Date of AASB 9 and Transition Disclosures [AASB 9, 2009-11, 2010-7, 2011-7 & 2011-8] This Standard amends the mandatory effective date of AASB 9 Financial Instruments to 1 January 2015 (instead of 1 January

Kimberley Training Institute | 2013 Annual Report 53
2013). Further amendments are also made to numerous consequential amendments arising from AASB 9 that will now apply from 1 January 2015. There is no financial impact.
AASB 2012-9
Amendment to AASB 1048 arising from the Withdrawal of Australian Int 1039 The withdrawal of Int 1039 Substantive Enactment of Major Tax Bills in Australia has no financial impact for the Institute during the reporting period and at balance date. Measurement of tax assets and liabilities continues to be measured in accordance with enacted or substantively enacted tax law pursuant to AASB 112.46-47.
AASB 2012-10
Amendments to Australian Accounting Standards – Transition Guidance and Other Amendments [AASB 1, 5, 7, 8, 10, 11, 12, 13, 101, 102, 108, 112, 118, 119, 127, 128, 132, 133, 134, 137, 1023, 1038, 1039, 1049 & 2011-7 and Int 12] The Standard introduces a number of editorial alterations and amends the mandatory application date of Standards for not-for-profit entities accounting for interests in other entities. There is no financial impact.
AASB 2013-9
Amendments to Australian Accounting Standards – Conceptual Framework, Materiality and Financial Instruments Part A of this omnibus Standard makes amendments to other Standards arising from revisions to the Australian Accounting Conceptual Framework for periods ending on or after 20 December 2013. Other Parts of this Standard become operative in later periods. There is no financial impact for Part A of the Standard.
Voluntary changes in accounting policy
No voluntary changes in accounting policy have been made.
Future impact of Australian Accounting Standards not yet operative
The Institute cannot early adopt an Australian Accounting Standard unless specifically permitted by TI 1101 'Application of Australian Accounting Standards and Other Pronouncements'. Consequently, the Institute has not applied early any of the following Australian Accounting Standards that have been issued that may impact the Institute. Where applicable, the Institute plans to apply these Australian Accounting Standards from their application date.

Kimberley Training Institute | 2013 Annual Report 54
Title Operative for reporting periods
beginning on / after
Int 21 Levies This Interpretation clarifies the circumstances under which a liability to pay a government levy imposed should be recognised. There is no financial impact for the Institute at reporting date.
1 Jan 2014
AASB 9 Financial Instruments This Standard supersedes AASB 139 Financial Instruments: Recognition and Measurement, introducing a number of changes to accounting treatments. The mandatory application date of this Standard was amended to 1 January 2015. The Institute has not yet determined the application or the potential impact of the Standard.
1 Jan 2015
AASB 10 Consolidated Financial Statements This Standard, issued in August 2011, supersedes AASB 127 Consolidated and Separate Financial Statements and Int 112 Consolidation – Special Purpose Entities, introducing a number of changes to accounting treatments. Mandatory application was deferred by one year for not-for-profit entities by AASB 2012-10 Amendments to Australian Accounting Standards – Transition Guidance and Other Amendments. The adoption of the new Standard has no financial impact for the Institute as it doesn’t impact accounting for related bodies and the Institute has no interests in other entities.
1 Jan 2014
AASB 11 Joint Arrangements This Standard, issued in August 2011, supersedes AASB 131 Interests in Joint Ventures, introducing new principles for determining the type of joint arrangement that exists, which are more aligned to the actual rights and obligations of the parties to the arrangement. Mandatory application of the Standard was deferred by one year for not-for-profit entities by AASB 2012-10. There is no financial impact for the Institute as the new standard will continue to require proportional consolidation of the Institute’s rights to assets and liabilities for the unincorporated joint operation.
1 Jan 2014

Kimberley Training Institute | 2013 Annual Report 55
Title Operative for reporting periods
beginning on / after
AASB 12 Disclosure of Interests in Other Entities This Standard, issued in August 2011, supersedes disclosure requirements under AASB 127 Consolidated and Separate Financial Statements, AASB 128 Investments in Associates and AASB 131 Interests in Joint Ventures. Mandatory application was deferred by one year for not-for-profit entities by AASB 2012-10. There is no financial impact.
1 Jan 2014
AASB 127 Separate Financial Statements This Standard, issued in August 2011, supersedes AASB 127 Consolidated and Separate Financial Statements, removing the consolidation requirements of the earlier standard whilst retaining accounting and disclosure requirements for the preparation of separate financial statements. Mandatory application was deferred by one year for not-for-profit entities by AASB 2012-10. There is no financial impact.
1 Jan 2014
AASB 128 Investments In Associates and Joint Ventures This Standard issued in August 2011, supersedes AASB 128 Investments in Associates, introducing a number of clarifications for the accounting treatments of changed ownership interest. Mandatory application was deferred by one year for not-for-profit entities by AASB 2012-10. The adoption of the new Standard has no financial impact for the Institute as it doesn’t hold investments in associates or and the accounting treatments for joint operations is consistent with current practice.
1 Jan 2014
AASB 1031 Materiality This Standard is an interim standard cross-referencing definitions of ‘materiality’ in other Standards and will remain operative until references to AASB 1031 are removed from other Standards. There is no financial impact.
1 Jan 2014
AASB 1055 Budgetary Reporting This Standard specifies the nature of budgetary disclosures, the circumstances in which they are to be included in the general purpose financial statements of not-for-profit entities within the General Government Sector. The Institute will be required to disclose additional budgetary information and explanations of
1 Jul 2014

Kimberley Training Institute | 2013 Annual Report 56
Title Operative for reporting periods
beginning on / after
major variances between actual and budgeted amounts, though there is no financial impact.
AASB 2009-11 Amendments to Australian Accounting Standards arising from AASB 9 [AASB 1, 3, 4, 5, 7, 101, 102, 108, 112, 118, 121, 127, 128, 131, 132, 136, 139, 1023 & 1038 and Int 10 & 12] [modified by AASB 2010-7]
1 Jan 2015
AASB 2010-7 Amendments to Australian Accounting Standards arising from AASB 9 (December 2010) [AASB 1, 3, 4, 5, 7, 101,102, 108, 112, 118, 120, 121, 127, 128, 131, 132, 136, 137,139, 1023 & 1038 and Int 2, 5, 10, 12, 19 & 127] This Standard makes consequential amendments to other Australian Accounting Standards and Interpretations as a result of issuing AASB 9 in December 2010. The Institute has not yet determined the application or the potential impact of the Standard.
1 Jan 2015
AASB 2011-7 Amendments to Australian Accounting Standards arising from the Consolidation and Joint Arrangements Standards [AASB 1, 2, 3, 5, 7, 101, 107, 112, 118, 121, 124, 132, 133, 136, 138, 139, 1023 & 1038 and Int 5, 9, 16 & 17] This Standard gives effect to consequential changes arising from the issuance of AASB 10, AASB 11, AASB 127 Separate Financial Statements and AASB 128 Investments in Associates and Joint Ventures. The Institute has undertaken an analysis of the suite of Consolidation and Joint Arrangements Standards and determined that there is no financial impact arising from adoption of the various Standards.
1 Jan 2014
AASB 2012-3 Amendments to Australian Accounting Standards – Offsetting Financial Assets and Financial Liabilities [AASB 132] This Standard adds application guidance to AASB 132 to address inconsistencies identified in applying some of the offsetting criteria, including clarifying the meaning of “currently has a legally enforceable right of set-off” and that some gross settlement systems may be considered equivalent to net settlement. The Institute does not routinely hold financial assets and financial liabilities that it intends to settle on a net
1 Jan 2014

Kimberley Training Institute | 2013 Annual Report 57
Title Operative for reporting periods
beginning on / after
basis, therefore there is no financial impact.
AASB 2013-3 Amendments to AASB 136 – Recoverable Amount Disclosures for Non-Financial Assets. This Standard introduces editorial and disclosure changes. There is no financial impact.
1 Jan 2014
AASB 2013-4 Amendments to Australian Accounting Standards – Novation of Derivatives and Continuation of Hedge Accounting [AASB 139] This Standard permits the continuation of hedge accounting in circumstances where a derivative, which has been designated as a hedging instrument, is novated from one counterparty to a central counterparty as a consequence of laws or regulations. The Institute does not routinely enter into derivatives or hedges, therefore there is no financial impact.
1 Jan 2014
AASB 2013-8 Amendments to Australian Accounting Standards – Australian Implementation Guidance for Not-for-Profit Entities – Control and Structured Entities [AASB 10, 12 & 1049]. The amendments, issued in October 2013, provide significant guidance to clarify whether determine whether a not-for-profit entity controls another entity when financial returns aren’t a key attribute of the investor’s relationship. The Standard has no financial impact in its own right, rather the impact results from the adoption of the amended AASB 10
1 Jan 2014
AASB 2013-9 Amendments to Australian Accounting Standards – Conceptual Framework, Materiality and Financial Instruments This omnibus Standard makes amendments to other Standards arising from the deletion of references to AASB 1031 in other Standards for periods beginning on or after 1 January 2014 (Part B), and, defers the application of AASB 9 to 1 January 2017 (Part C). The Authority has not yet determined the application or the potential impact of AASB 9, otherwise there is no financial impact for Part B.
1 Jan 2014
1 Jan 2017

Kimberley Training Institute | 2013 Annual Report 58
Note 7. Employee benefits expense 2013
$ 2012
$ Wages and salaries (a) 22,411,488 21,866,496 Superannuation - defined contribution plans (b) 1,570,173 2,032,354 23,981,661 23,898,850 (a) Includes the value of the fringe benefit to the employee plus the fringe benefits
tax component, leave entitlements including superannuation contribution component.
(b) Defined contribution plans include West State, and Gold State and GESBS and other eligible funds.
Employment on-costs expenses, such as workers' compensation insurance, are included at note 11 'Other expenses'.
Employment on-costs liability is included at note 31 'Provisions'.
Note 8. Supplies and services 2013
$ 2012
$ Consumables and minor equipment 857,752 778,570 Communication expenses 166,520 108,691 Utilities expenses 463,184 417,469 Consultancies and contracted services 2,586,403 2,010,034 Minor works 700,360 661,588 Repairs and maintenance 210,380 138,904 Operating lease and hire charges 622,455 799,408 Travel and passenger transport 873,336 1,102,863 Advertising and public relations 128,167 132,077 Supplies and services - other 312,362 430,935 6,920,919 6,580,539

Kimberley Training Institute | 2013 Annual Report 59
Note 9. Depreciation and amortisation expense 2013
$ 2012
$ Depreciation Buildings 951,164 1,021,791 Motor vehicles, caravans and trailers 128,504 130,591 Plant, furniture and general equipment 91,832 89,751 Computers and communication network 192,031 190,335 Marine craft 1,925 1,925 Total depreciation 1,365,456 1,434,393 Amortisation Software 179,063 82,296 Total depreciation and amortisation 1,544,519 1,516,689
Note 10. Grants and subsidies 2013
$ 2012
$ Payments to non-TAFE providers for VET service delivery
157,010 147,827
157,010 147,827
Note 11. Other expenses 2013
$ 2012
$ Building maintenance 309,775 271,989 Doubtful debts expense 23,502 8,506 Employment on-costs (a) 1,148,593 983,634 Student prizes and awards 260 2,332 Losses and write-offs 92 1,660 Other 5,079 22,265 1,487,301 1,290,387
(a) Includes workers' compensation insurance and other employment on-costs. The on-costs liability associated with the recognition of annual and long service leave liability is included at note 31 'Provisions'. Superannuation contributions accrued as part of the provision for leave are employee benefits and are not included in employment on-costs.

Kimberley Training Institute | 2013 Annual Report 60
Note 12. Fee for service 2013
$ 2012
$ Fee for service - general 732,314 1,134,785 Fee for service - Department of Training and Workforce Development
240,339 295,703
Fee for service - Government (other than Department of Training and Workforce Development)
182,374 1,660
Adult community education fees 306 1,123 International division fees 141,792 109,043 1,297,125 1,542,314
Note 13. Student fees and charges 2013
$ 2012
$ Tuition fees 689,583 622,535 Enrolment fees 11,462 10,911 Resource fees 364,828 345,567 Other college fees 2,408 7,610 1,068,281 986,623
Note 14. Ancillary trading 2013
$ 2012
$ Contracting and consulting 3,240 11,219 Other ancillary revenue 11,193 109,595 14,433 120,814 Note 15. Bookshop Trading profit/(loss) 2013
$ 2012
$ Bookshop: Sales 35,370 44,348 Cost of sales: Opening inventory (34,002) (29,066) Purchases (31,266) (39,366) Write Offs (See note 46 "Supplementary Financial Information") - (1,660) (65,268) (70,092) Closing inventory 35,180 34,002 Cost of goods sold (30,088) (36,090) Trading profit/(loss) - Bookshop 5,282 8,258 See note 2(o) 'Inventories' and note 22 'Inventories'
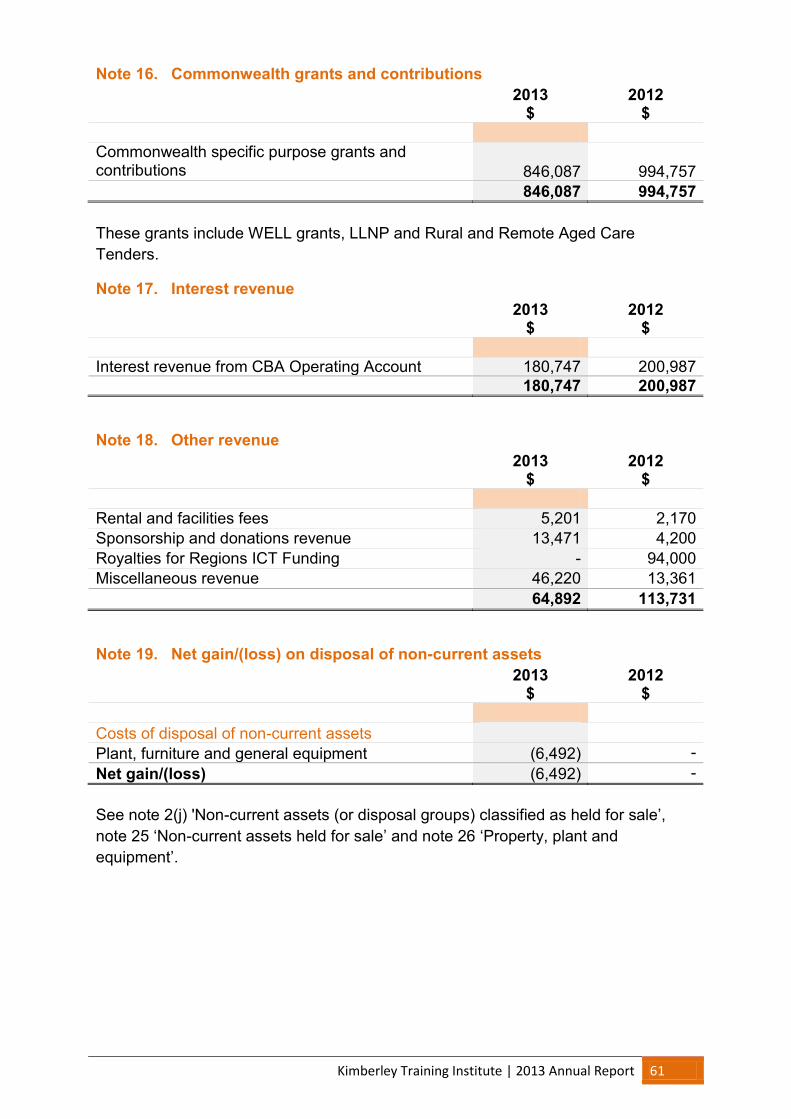
Kimberley Training Institute | 2013 Annual Report 61
Note 16. Commonwealth grants and contributions 2013
$ 2012
$ Commonwealth specific purpose grants and contributions 846,087 994,757 846,087 994,757 These grants include WELL grants, LLNP and Rural and Remote Aged Care Tenders.
Note 17. Interest revenue 2013
$ 2012
$ Interest revenue from CBA Operating Account 180,747 200,987 180,747 200,987
Note 18. Other revenue 2013
$ 2012
$ Rental and facilities fees 5,201 2,170 Sponsorship and donations revenue 13,471 4,200 Royalties for Regions ICT Funding - 94,000 Miscellaneous revenue 46,220 13,361 64,892 113,731
Note 19. Net gain/(loss) on disposal of non-current assets 2013
$ 2012
$ Costs of disposal of non-current assets Plant, furniture and general equipment (6,492) - Net gain/(loss) (6,492) -
See note 2(j) 'Non-current assets (or disposal groups) classified as held for sale’, note 25 ‘Non-current assets held for sale’ and note 26 ‘Property, plant and equipment’.

Kimberley Training Institute | 2013 Annual Report 62
Note 20. Income from State Government 2013
$ 2012
$ Appropriation received during the year: Service appropriation (a) (State funds received from Department of Training and Workforce Development):
Delivery and Performance Agreement (DPA) 22,748,980 21,014,316 Superannuation Ordinary Times Earnings - 559,438 Other recurrent funds 4,179,550 3,779,325 Royalties for Regions District Allowance Funding 1,285,562 1,547,031 Total State funds 28,214,092 26,900,110
Resources received free of charge(b) : Determined on the basis of the following estimates provided by agencies :
Department of Training and Workforce Development . Corporate systems support 610,023 433,608 . Marketing and publications - 417,343 . Other 462,807 21,187
1,072,830 872,138 Total income from State Government 29,286,922 27,772,248
(a)Service appropriations fund the net cost of services delivered. Appropriation revenue comprises a cash component and a receivable (asset). The receivable (holding account) comprises the budgeted depreciation expense for the year and any agreed increase in leave liability during the year. (b) Assets or services received free of charge or for nominal cost are recognised as revenue at the fair value of the assets and/or the fair value of those services that can be reliably measured and which would have been purchased if they were not donated. Contribution of assets or services in the nature of contributions by owners are recognised directly to equity.

Kimberley Training Institute | 2013 Annual Report 63
Note 21. Restricted cash and cash equivalents 2013
$ 2012
$ Current Accrued salaries suspense account (27th Pay provision) 709,339 - 709,339 - Non-current Accrued salaries suspense account (27th Pay provision) - 629,139 - 629,139
Note 22. Inventories 2013
$ 2012
$ Inventories held for resale:
Bookshop (at cost) 35,180 34,002 Total 35,180 34,002
Note 23. Receivables 2013
$ 2012
$ Current Receivables - trade 336,583 683,955 Receivables - students 57,560 162,600 Accrued revenue 28,427 531,227 Allowance for impairment of receivables (26,445) (31,842) GST receivable (6,888) 13,227 Total current 389,237 1,359,167 Reconciliation of changes in the allowance for impairment of receivables: Balance at start of period (31,842) (58,406) Doubtful debts expense (23,502) (8,506) Amount written off during the period 28,899 35,070 Balance at end of period (26,445) (31,842)

Kimberley Training Institute | 2013 Annual Report 64
Ageing of receivables past due but not impaired based on the information provided to senior management, as at the end of the reporting period: Not more than 3 months 61,747 407,620 More than 3 months but less than 6 months 51,497 67,301 More than 6 months but less than 1 year - 91,889 113,244 566,810 Receivables individually determined as impaired as at the end of the reporting period: Carrying amount, before deducting any impairment loss 68,249 141,641 Impairment loss (26,445) (31,842) 41,804 109,799 The Institute does not hold any collateral or other credit enhancements as security for receivables. See also note 2(p) 'Receivables' and note 40 'Financial instruments'.
Note 24. Other assets 2013
$ 2012
$ Current Prepayments 165,735 122,967 Total current 165,735 122,967
Note 25. Non-current assets classified as held for sale
The Institute has no non-current assets classified as held for sale.
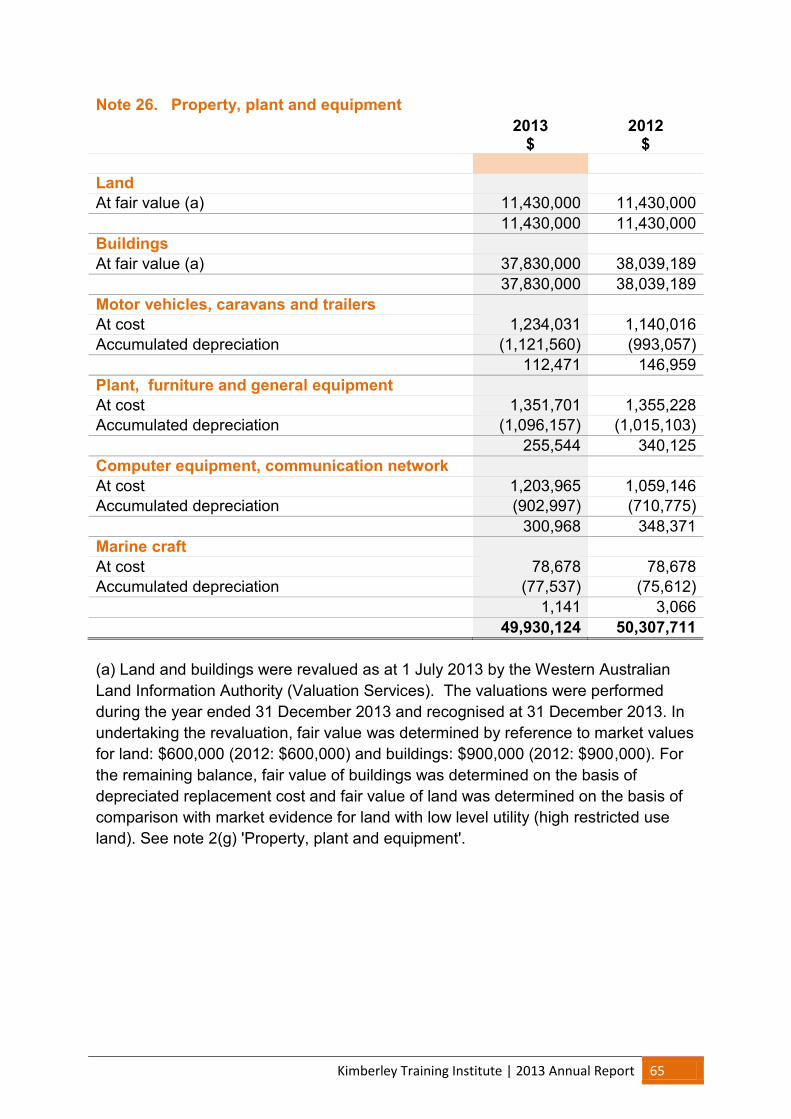
Kimberley Training Institute | 2013 Annual Report 65
Note 26. Property, plant and equipment 2013
$ 2012
$ Land At fair value (a) 11,430,000 11,430,000 11,430,000 11,430,000 Buildings At fair value (a) 37,830,000 38,039,189 37,830,000 38,039,189 Motor vehicles, caravans and trailers At cost 1,234,031 1,140,016 Accumulated depreciation (1,121,560) (993,057) 112,471 146,959 Plant, furniture and general equipment At cost 1,351,701 1,355,228 Accumulated depreciation (1,096,157) (1,015,103) 255,544 340,125 Computer equipment, communication network At cost 1,203,965 1,059,146 Accumulated depreciation (902,997) (710,775) 300,968 348,371 Marine craft At cost 78,678 78,678 Accumulated depreciation (77,537) (75,612) 1,141 3,066 49,930,124 50,307,711
(a) Land and buildings were revalued as at 1 July 2013 by the Western Australian Land Information Authority (Valuation Services). The valuations were performed during the year ended 31 December 2013 and recognised at 31 December 2013. In undertaking the revaluation, fair value was determined by reference to market values for land: $600,000 (2012: $600,000) and buildings: $900,000 (2012: $900,000). For the remaining balance, fair value of buildings was determined on the basis of depreciated replacement cost and fair value of land was determined on the basis of comparison with market evidence for land with low level utility (high restricted use land). See note 2(g) 'Property, plant and equipment'.

Kimberley Training Institute | 2013 Annual Report 66
Reconciliations of the carrying amounts of property, plant and equipment at the beginning and end of the reporting period are set out in the table below.
Land Buildings
Motor vehicles, caravans and
trailers
Plant, furniture and general equipment
Computer equipment,
communication network Marine craft Total
$ $ $ $ $ $ $ 2013 Carrying amount at start of year 11,430,000 38,039,189 146,959 340,125 348,371 3,066 50,307,711 Additions - - 94,015 13,743 144,629 - 252,387 Transfers - - - - Other Disposals - - - (6,492) (6,492) Classified as held for sale - - - - - - - Revaluation increments - 741,975 - - - - 741,975 Depreciation - (951,164) (128,504) (91,832) (192,031) (1,925) (1,365,456) Carrying amount at end of period 11,430,000 37,830,000 112,470 255,544 300,969 1,141 49,930,124
Land Buildings
Motor vehicles, caravans and
trailers
Plant, furniture and general equipment
Computer equipment,
communication network Marine craft Total
$ $ $ $ $ $ $ 2012 Carrying amount at start of year 11,280,000 27,819,455 269,550 366,235 482,640 4,992 40,222,873 Additions - - 8,000 63,641 56,065 - 127,706 Transfers - 12,421,161 - 12,421,161 Other Disposals - - - - - Classified as held for sale - - - - - - - Revaluation increments 150,000 - - - - 150,000 Impairment losses (b) - (1,179,636) - - (1,179,636) Depreciation - (1,021,791) (130,591) (89,751) (190,334) (1,926) (1,434,393) Carrying amount at end of period 11,430,000 38,039,189 146,959 340,125 348,371 3,066 50,307,711 (a) The Department of Lands is the only agency with the power to sell Crown land. The land is transferred to the Department of Lands for sale and the Authority accounts for the transfer as a distribution to owner. (b) Recognised in the Statement of Comprehensive Income. Where an asset measured at cost is written down to recoverable amount, an impairment loss is recognised in profit or loss. Where a previously revalued asset is written down to recoverable amount, the loss is recognised as a revaluation decrement in other comprehensive income. Information on fair value measurements is provided in Note 27.

Kimberley Training Institute | 2013 Annual Report 67
Note 27. Fair value measurements
Assets measured at fair value : Level 1 Level 2 Level 3 Fair Value At end of
period $ $ $ $ 2013 Land (Note 26) - 11,430,000 - 11,430,000 Buildings (Note 26) - 37,830,000 - 37,830,000 - 49,260,000 - 49,260,000 There were no transfers between Levels 1, 2 or 3 during the period.
Valuation techniques to derive Level 2 fair values Level 2 fair values of Non-current assets held for sale, Land and Buildings (Office Accommodation) are derived using the market approach. Market evidence of sales prices of comparable land and buildings (office accommodation) in close proximity is used to determine price per square metre.
Valuation processes There were no changes in valuation techniques during the period. Reconciliations of the opening and closing balances are provided in Notes 26.
Basis of Valuation In the absence of market-based evidence due to the specialised nature of the assets, non-financial assets are valued at Level 3 of the fair value hierarchy on an existing use basis. The existing use basis recognises that restrictions or limitations have been placed on their use and disposal when they are not determined to be surplus to requirements. These restrictions are imposed by virtue of the assets being held to deliver a specific community service and the Institute's enabling legislation.
Note 28. Intangible assets 2013
$ 2012
$ Computer software At cost 524,591 340,127 Accumulated amortisation (296,214) (117,152) 228,377 222,975 Computer software Carrying amount at start of period 222,975 67,414 Additions 184,465 237,857 Amortisation expense (179,063) (82,296) Carrying amount at end of period 228,377 222,975

Kimberley Training Institute | 2013 Annual Report 68
Note 29. Impairment of assets
There were no indications of impairment to property, plant and equipment or intangible assets at 31 December 2013. The Institute held no goodwill or intangible assets with an indefinite useful life during the reporting period. At the end of the reporting period there were no intangible assets not yet available for use. All surplus assets as at 31 December 2013 have either been classified as assets held for sale or written off.
Note 30. Payables 2013
$ 2012
$ Current Trade payables 574 (2,010) GST payable - 6,584 Accrued expenses 244,833 699,437 Accrued salaries and related costs 748,348 491,861 Paid parental leave payable 4,106 - Total current 997,861 1,195,872
See also note 2(q) 'Payables' and note 40 'Financial Instruments'.
Note 31. Provisions 2013
$ 2012
$ Current Employee benefits provision Annual leave (a) 1,263,109 1,361,297 Long service leave (b) 1,119,676 1,175,007 Superannuation - 565,748 2,382,785 3,102,052 Other provisions Employment on-costs (d) 153,230 162,997 Total current 2,536,015 3,265,049 Non-current Employee benefits provision Long service leave (b) 694,849 604,318 694,849 604,318 Other provisions Employment on-costs (d) 44,503 38,815 Total non-current 739,352 643,133
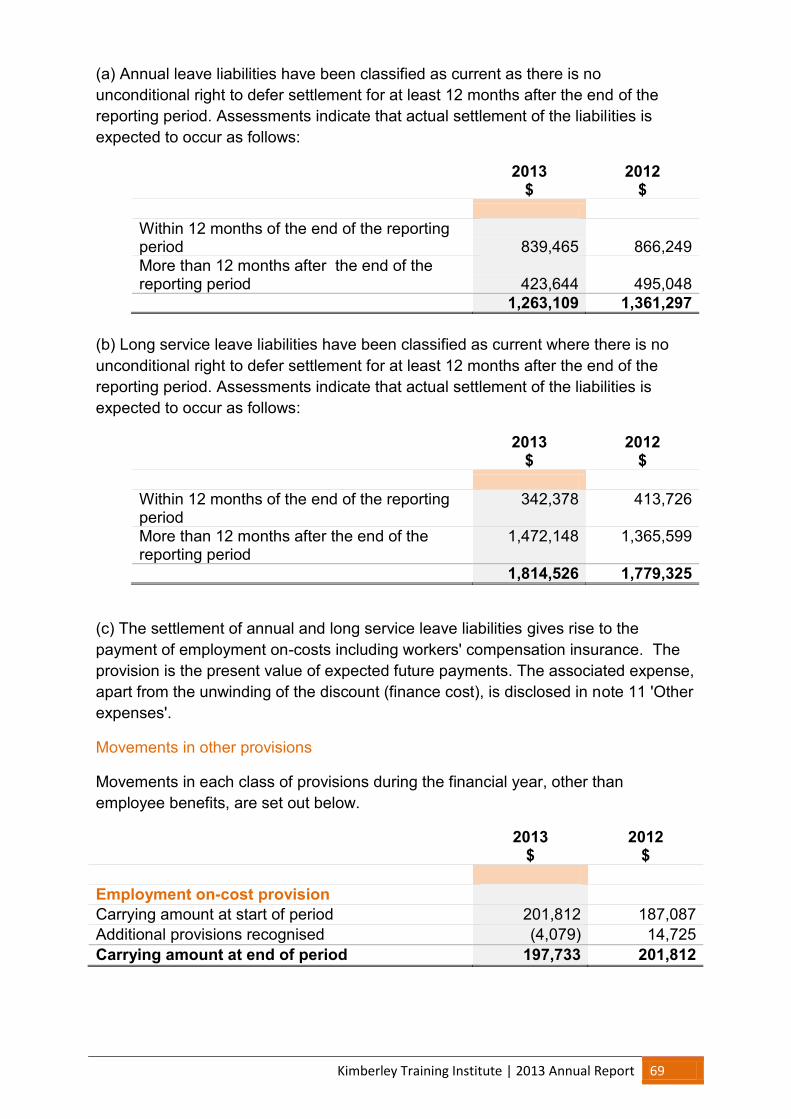
Kimberley Training Institute | 2013 Annual Report 69
(a) Annual leave liabilities have been classified as current as there is no unconditional right to defer settlement for at least 12 months after the end of the reporting period. Assessments indicate that actual settlement of the liabilities is expected to occur as follows:
2013 $
2012 $
Within 12 months of the end of the reporting period 839,465 866,249 More than 12 months after the end of the reporting period 423,644 495,048 1,263,109 1,361,297
(b) Long service leave liabilities have been classified as current where there is no unconditional right to defer settlement for at least 12 months after the end of the reporting period. Assessments indicate that actual settlement of the liabilities is expected to occur as follows:
2013 $
2012 $
Within 12 months of the end of the reporting period
342,378 413,726
More than 12 months after the end of the reporting period
1,472,148 1,365,599
1,814,526 1,779,325
(c) The settlement of annual and long service leave liabilities gives rise to the payment of employment on-costs including workers' compensation insurance. The provision is the present value of expected future payments. The associated expense, apart from the unwinding of the discount (finance cost), is disclosed in note 11 'Other expenses'.
Movements in other provisions
Movements in each class of provisions during the financial year, other than employee benefits, are set out below.
2013 $
2012 $
Employment on-cost provision Carrying amount at start of period 201,812 187,087 Additional provisions recognised (4,079) 14,725 Carrying amount at end of period 197,733 201,812

Kimberley Training Institute | 2013 Annual Report 70
Note 32. Other liabilities
2013 $
2012 $
Current Income received in advance 142,764 247,477 Grants and advances (a) 2,227,406 837,310 Total current 2,370,170 1,084,788 (a) Grants and advances includes: Department of Training and Workforce Development - DPA refund for under delivery 1,263,220 - Other Government (Commonwealth/Local) 964,186 832,130 Other - 5,180
2,227,406 837,310
Note 33. Equity
The Western Australian Government holds the equity interest in the Institute on behalf of the community. Equity represents the residual interest in the net assets of the Institute. The asset revaluation surplus represents that portion of equity resulting from the revaluation of non-current assets. 2013
$ 2012
$ Contributed equity Balance at start of period 19,264,116 6,842,955 Contributions by owners Department of Training and Workforce Development: Capital Appropriation - Regional Infrastructure and Headworks Account 322,215 - Transfer of net assets from other agencies Department of Training and Workforce Development - 12,421,161 Balance at end of period 19,586,331 19,264,116 Reserves Asset revaluation surplus Balance at start of period 23,786,196 24,815,833 Net revaluation increments/(decrements): Land - 150,000 Buildings 741,975 (1,179,636) Balance at end of period 24,528,171 23,786,196 Accumulated surplus/(deficit) Balance at start of period 5,895,517 7,590,077 Result for the period (1,334,133) (1,694,560) Balance at end of period 4,561,384 5,895,517 Total Equity at end of period 48,675,886 48,945,829
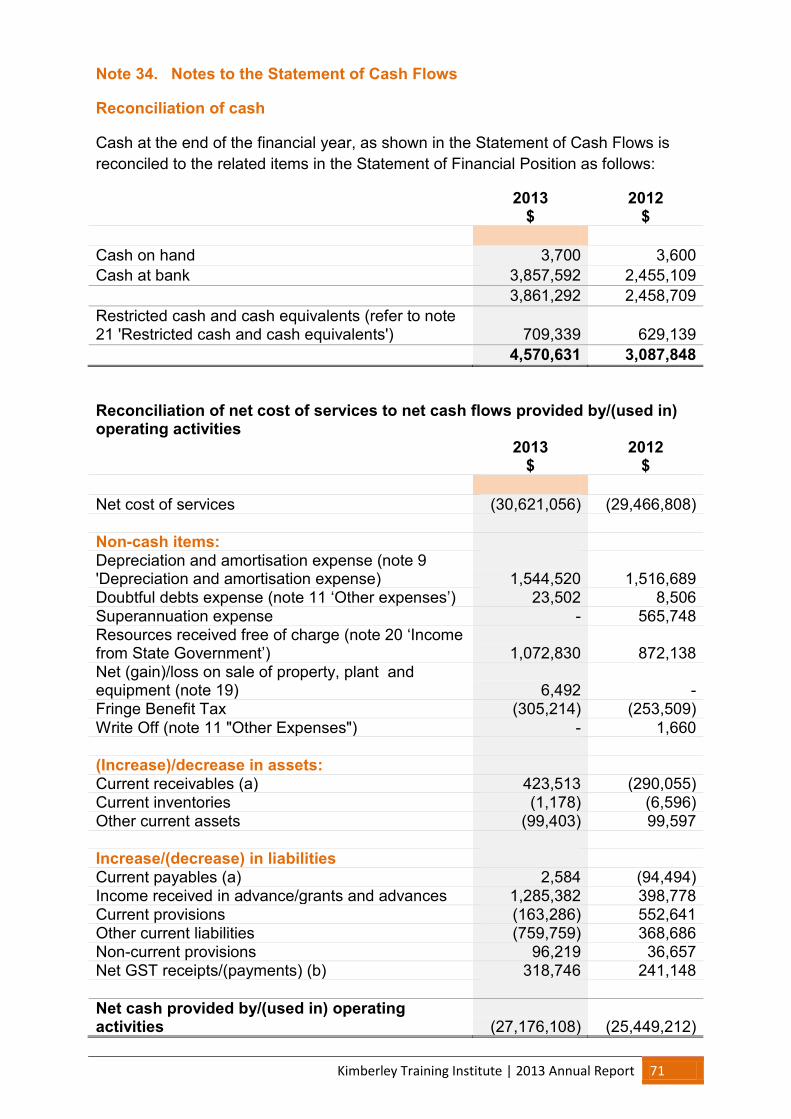
Kimberley Training Institute | 2013 Annual Report 71
Note 34. Notes to the Statement of Cash Flows
Reconciliation of cash
Cash at the end of the financial year, as shown in the Statement of Cash Flows is reconciled to the related items in the Statement of Financial Position as follows:
2013 $
2012 $
Cash on hand 3,700 3,600 Cash at bank 3,857,592 2,455,109 3,861,292 2,458,709 Restricted cash and cash equivalents (refer to note 21 'Restricted cash and cash equivalents') 709,339 629,139 4,570,631 3,087,848
Reconciliation of net cost of services to net cash flows provided by/(used in) operating activities 2013
$ 2012
$ Net cost of services (30,621,056) (29,466,808) Non-cash items: Depreciation and amortisation expense (note 9 'Depreciation and amortisation expense) 1,544,520 1,516,689 Doubtful debts expense (note 11 ‘Other expenses’) 23,502 8,506 Superannuation expense - 565,748 Resources received free of charge (note 20 ‘Income from State Government’) 1,072,830 872,138 Net (gain)/loss on sale of property, plant and equipment (note 19) 6,492 - Fringe Benefit Tax (305,214) (253,509) Write Off (note 11 "Other Expenses") - 1,660 (Increase)/decrease in assets: Current receivables (a) 423,513 (290,055) Current inventories (1,178) (6,596) Other current assets (99,403) 99,597 Increase/(decrease) in liabilities Current payables (a) 2,584 (94,494) Income received in advance/grants and advances 1,285,382 398,778 Current provisions (163,286) 552,641 Other current liabilities (759,759) 368,686 Non-current provisions 96,219 36,657 Net GST receipts/(payments) (b) 318,746 241,148 Net cash provided by/(used in) operating activities (27,176,108) (25,449,212)
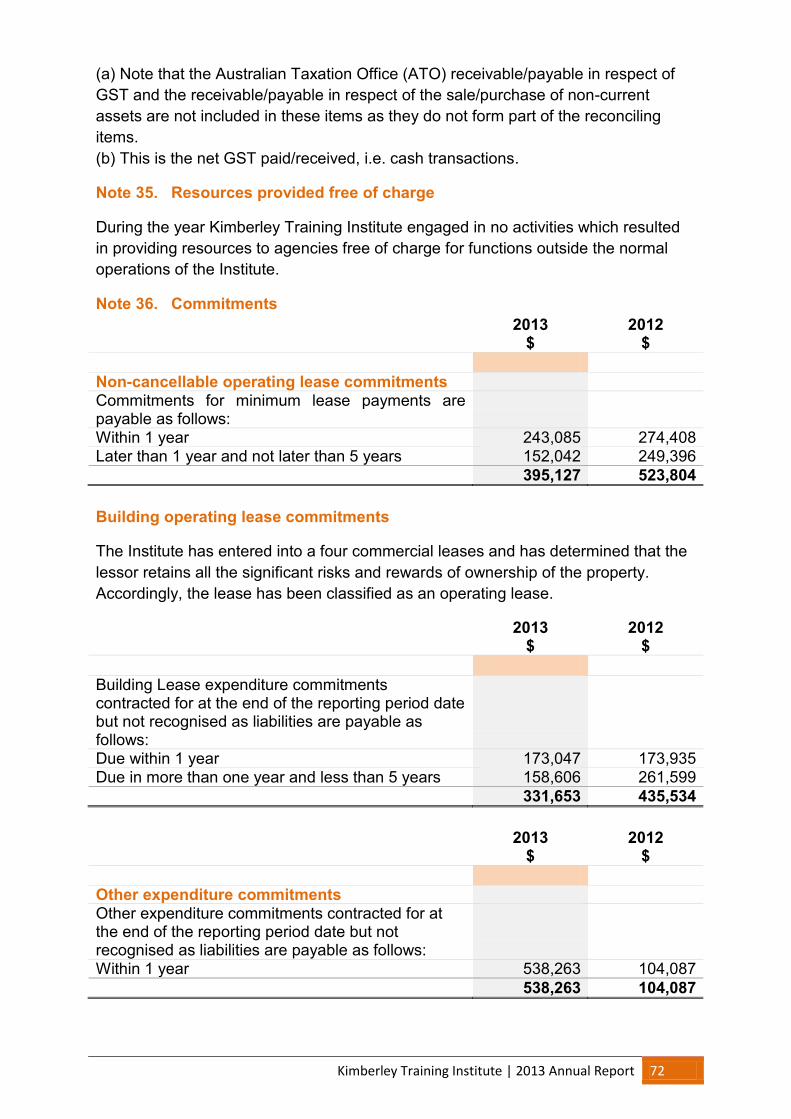
Kimberley Training Institute | 2013 Annual Report 72
(a) Note that the Australian Taxation Office (ATO) receivable/payable in respect of GST and the receivable/payable in respect of the sale/purchase of non-current assets are not included in these items as they do not form part of the reconciling items. (b) This is the net GST paid/received, i.e. cash transactions.
Note 35. Resources provided free of charge
During the year Kimberley Training Institute engaged in no activities which resulted in providing resources to agencies free of charge for functions outside the normal operations of the Institute.
Note 36. Commitments 2013
$ 2012
$ Non-cancellable operating lease commitments Commitments for minimum lease payments are payable as follows: Within 1 year 243,085 274,408 Later than 1 year and not later than 5 years 152,042 249,396 395,127 523,804 Building operating lease commitments
The Institute has entered into a four commercial leases and has determined that the lessor retains all the significant risks and rewards of ownership of the property. Accordingly, the lease has been classified as an operating lease.
2013 $
2012 $
Building Lease expenditure commitments contracted for at the end of the reporting period date but not recognised as liabilities are payable as follows: Due within 1 year 173,047 173,935 Due in more than one year and less than 5 years 158,606 261,599 331,653 435,534 2013
$ 2012
$ Other expenditure commitments Other expenditure commitments contracted for at the end of the reporting period date but not recognised as liabilities are payable as follows: Within 1 year 538,263 104,087 538,263 104,087
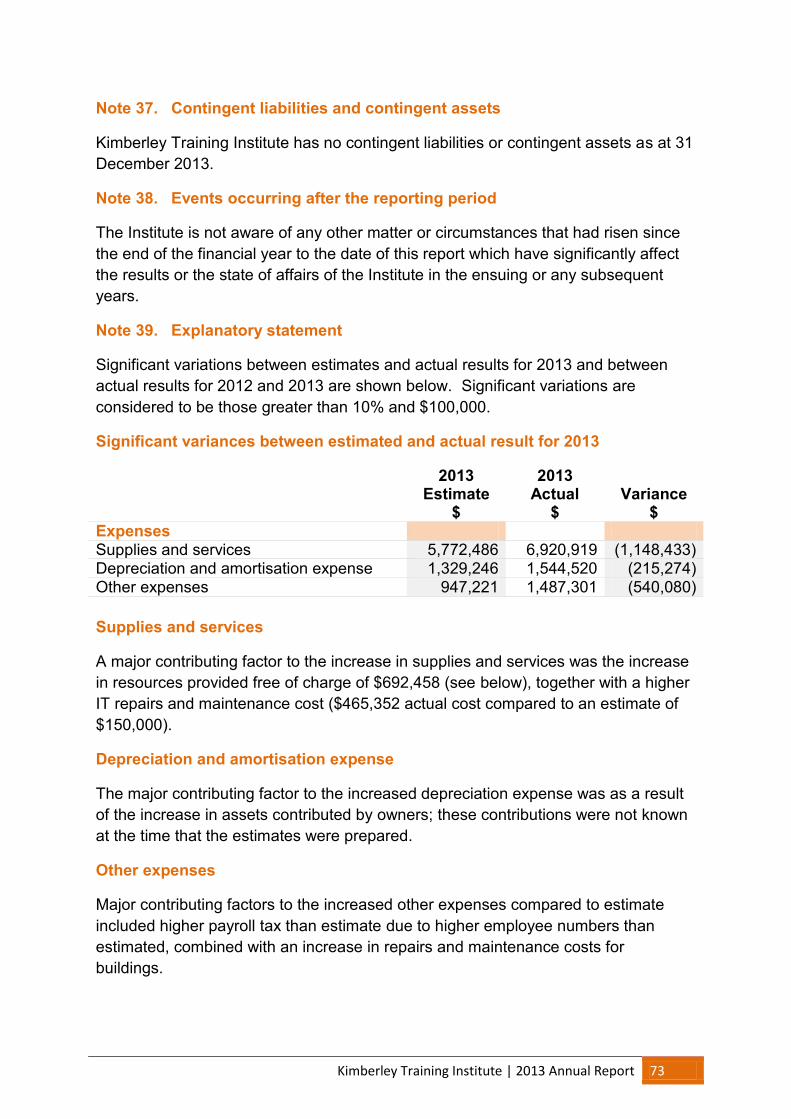
Kimberley Training Institute | 2013 Annual Report 73
Note 37. Contingent liabilities and contingent assets
Kimberley Training Institute has no contingent liabilities or contingent assets as at 31 December 2013.
Note 38. Events occurring after the reporting period
The Institute is not aware of any other matter or circumstances that had risen since the end of the financial year to the date of this report which have significantly affect the results or the state of affairs of the Institute in the ensuing or any subsequent years.
Note 39. Explanatory statement
Significant variations between estimates and actual results for 2013 and between actual results for 2012 and 2013 are shown below. Significant variations are considered to be those greater than 10% and $100,000.
Significant variances between estimated and actual result for 2013
2013 Estimate
$
2013 Actual
$ Variance
$ Expenses Supplies and services 5,772,486 6,920,919 (1,148,433) Depreciation and amortisation expense 1,329,246 1,544,520 (215,274) Other expenses 947,221 1,487,301 (540,080) Supplies and services
A major contributing factor to the increase in supplies and services was the increase in resources provided free of charge of $692,458 (see below), together with a higher IT repairs and maintenance cost ($465,352 actual cost compared to an estimate of $150,000).
Depreciation and amortisation expense
The major contributing factor to the increased depreciation expense was as a result of the increase in assets contributed by owners; these contributions were not known at the time that the estimates were prepared.
Other expenses
Major contributing factors to the increased other expenses compared to estimate included higher payroll tax than estimate due to higher employee numbers than estimated, combined with an increase in repairs and maintenance costs for buildings.
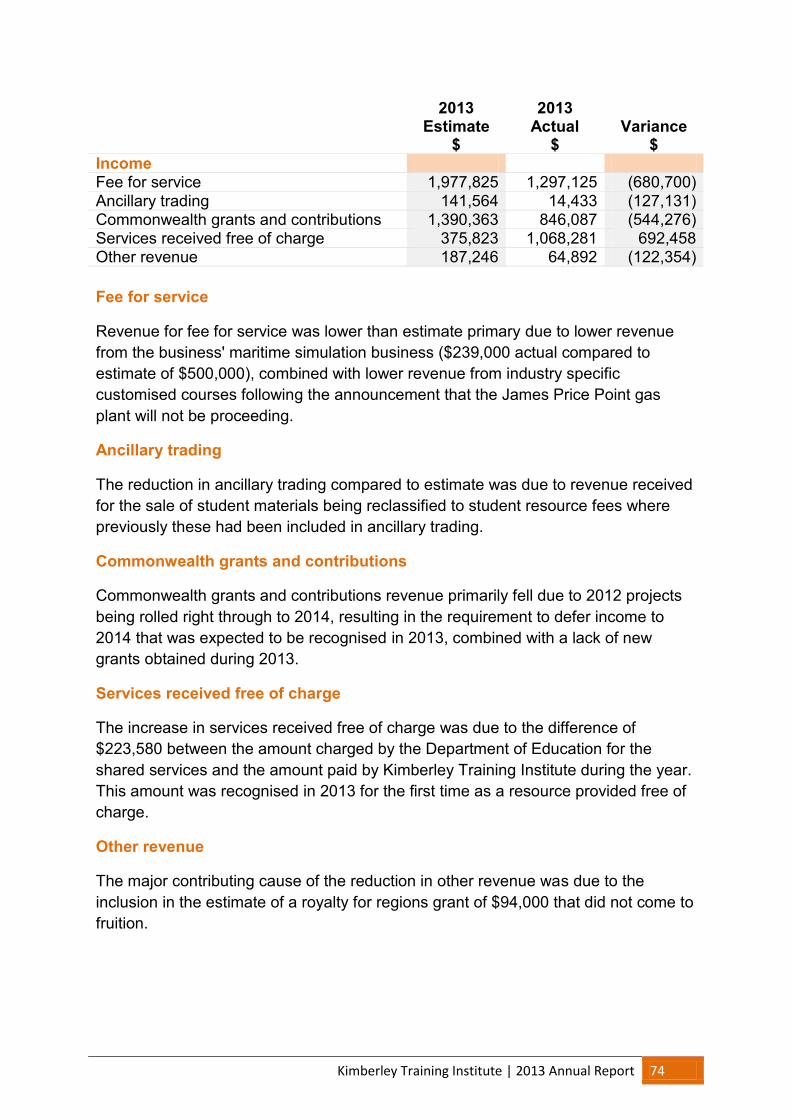
Kimberley Training Institute | 2013 Annual Report 74
2013 Estimate
$
2013 Actual
$ Variance
$ Income Fee for service 1,977,825 1,297,125 (680,700) Ancillary trading 141,564 14,433 (127,131) Commonwealth grants and contributions 1,390,363 846,087 (544,276) Services received free of charge 375,823 1,068,281 692,458 Other revenue 187,246 64,892 (122,354) Fee for service
Revenue for fee for service was lower than estimate primary due to lower revenue from the business' maritime simulation business ($239,000 actual compared to estimate of $500,000), combined with lower revenue from industry specific customised courses following the announcement that the James Price Point gas plant will not be proceeding.
Ancillary trading
The reduction in ancillary trading compared to estimate was due to revenue received for the sale of student materials being reclassified to student resource fees where previously these had been included in ancillary trading.
Commonwealth grants and contributions
Commonwealth grants and contributions revenue primarily fell due to 2012 projects being rolled right through to 2014, resulting in the requirement to defer income to 2014 that was expected to be recognised in 2013, combined with a lack of new grants obtained during 2013.
Services received free of charge
The increase in services received free of charge was due to the difference of $223,580 between the amount charged by the Department of Education for the shared services and the amount paid by Kimberley Training Institute during the year. This amount was recognised in 2013 for the first time as a resource provided free of charge.
Other revenue
The major contributing cause of the reduction in other revenue was due to the inclusion in the estimate of a royalty for regions grant of $94,000 that did not come to fruition.

Kimberley Training Institute | 2013 Annual Report 75
Significant variances between actual results for 2012 and 2013
2013 Estimate
$
2013 Actual
$ Variance
$ Expenses Employee benefits expense 23,981,661 23,898,850 82,811 Supplies and services 6,920,919 6,580,539 340,380 Other expenses 1,487,301 1,290,387 196,914
Employee benefits expense
Whilst the employee benefits expense did not increase significantly on the prior year, 2012 included $565,748 in relation to Superannuation Ordinary Times Earnings backpay. If this amount was excluded from 2012, the increase would have been $648,559. A contributing factor to the increase was an increase in the
casual lecturers expense of $244,855 due to increased lecturers requirement to meet the increased Student Curriculum Hours target and an increase in permanent non-lecturers of $526,180 relating to the full year impact of the cost of an increase in headcount of 8 in the prior year.
Supplies and services
The major contributing factor to the increase in supplies and services compared to 2012 was due to the increase in shared services charge noted above.
Other expenses
Other expenses increase is primarily related to the increase in salary oncosts including an increase in payroll tax of $101,936 and an increase in workers compensation costs of $81,827. 2013
Estimate $
2013 Actual
$ Variance
$ Income Services received free of charge 1,072,830 872,138 200,692 Ancillary trading 14,433 120,814 (106,381) Fee for service 1,297,125 1,542,314 (245,189) Commonwealth grants and contributions 846,087 994,757 (148,670) Services received free of charge
The primary cause of the increase in services received free of charge was due to the additional amount of $223,580 charged for the use of shared services noted above.
Kimberley Training Institute | 2013 Annual Report 76
Ancillary trading
The fall in ancillary trading in 2013 compared to 2012 related to a reallocation of the sale of course materials to sale of student resources and a reduction in refunds of other services & charges.
Fee for service
Revenue for fee for service was lower than prior year due to a drop in revenue from the business' maritime simulation business with a reduction in demand following a port restructure. New avenues of use for the maritime simulator, including alternative course subjects, are being investigated.
Commonwealth grants and contributions
Commonwealth grants and contributions revenue primarily fell due to a lack of new grants obtained during the year, with some of the existing grants rolled over from 2012 completing during 2013.
Note 40. Financial instruments
(a) Financial risk management objectives and policies
Financial instruments held by the Institute are cash and cash equivalents, restricted cash and cash equivalents, loans and receivables, payables, WATC/Bank borrowings and finance leases. The Institute has limited exposure to financial risks. The Institute's overall risk management program focuses on managing the risk identified below:
Credit risk
Credit risk arises when there is the possibility of the Institute’s receivables defaulting on their contractual obligations resulting in financial loss to the Institute. The maximum exposure to credit risk at the end of the reporting period in relation to each class of recognised financial assets is the gross carrying amount of those assets inclusive of any allowance for impairment as shown in the table at note 40(c) ‘Financial instruments disclosures’ and note 23 ‘Receivables’. Credit risk associated with the Institute’s financial assets is minimal because the Institute trades only with recognised, creditworthy third parties. The Institute has policies in place to ensure that sales of products and services are made to customers with an appropriate credit history. In addition, receivable balances are monitored on an ongoing basis with the result that the Institute's exposure to bad debt is minimal. At the end of the reporting period there are no significant concentrations of credit risk.
Liquidity risk
Liquidity risk arises when the Institute is unable to meet its financial obligations as they fall due. The Institute is exposed to liquidity risk through its trading in the normal course of business. The Institute has appropriate procedures to manage cash flows including drawdowns of appropriations by monitoring forecast cash flows to ensure that sufficient funds are available to meet its commitments.

Kimberley Training Institute | 2013 Annual Report 77
Market risk
Market risk is the risk that changes in market prices such as foreign exchange rates and interest rates will affect the Institute's income or the value of its holdings of financial instruments. The Institute does not trade in foreign currency and is not materially exposed to other price risks (for example, equity securities or commodity prices changes). The Institute's exposure to market risk for changes in interest rates relates primarily to the long-term debt obligations.
Other than as detailed in the Interest rate sensitivity analysis table at Note 41(c), the Institute is not exposed to interest rate risk because the majority of cash and cash equivalents and restricted cash are non-interest bearing and it has no borrowings.
(b) Categories of financial instruments
The carrying amounts of each of the following categories of financial assets and financial liabilities at the end of the reporting period are: 2013
$ 2012
$ Financial Assets Cash and cash equivalents 3,861,292 2,458,709 Restricted cash and cash equivalents 709,339 629,139 Receivables (a) 396,125 1,345,940 Financial Liabilities Payables 997,861 1,189,288 (a) The amount of loans and receivables excludes GST recoverable from the ATO (statutory receivable).
(c) Financial instrument disclosures
Credit risk
The following table discloses the Institute's maximum exposure to credit risk and the ageing analysis of financial assets. The Institute's maximum exposure to credit risk at the end of the reporting period is the carrying amount of financial assets as shown below. The table discloses the ageing of financial assets that are past due but not impaired and impaired financial assets. The table is based on information provided to senior management of the Institute.
The Institute does not hold any collateral as security or other credit enhancements relating to the financial assets it holds.
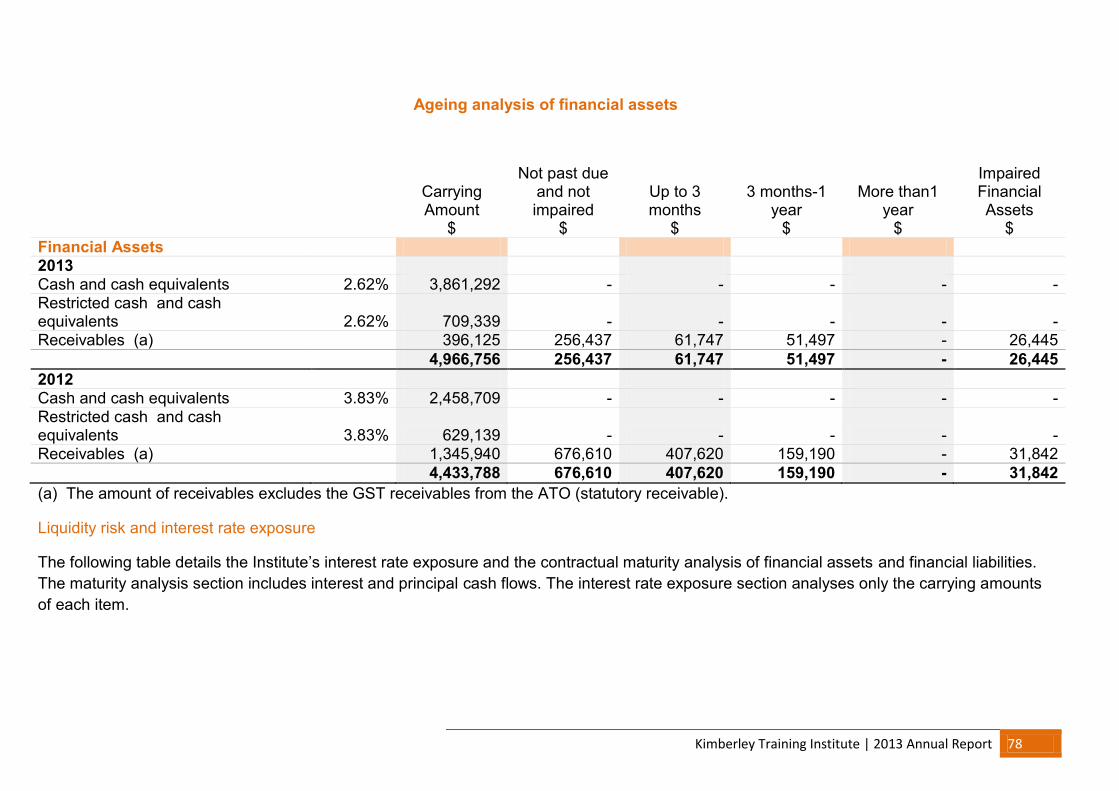
Kimberley Training Institute | 2013 Annual Report 78
Ageing analysis of financial assets
Carrying Amount
$
Not past due and not impaired
$
Up to 3 months
$
3 months-1 year
$
More than1 year
$
Impaired Financial Assets
$ Financial Assets 2013 Cash and cash equivalents 2.62% 3,861,292 - - - - - Restricted cash and cash equivalents 2.62% 709,339 - - - - - Receivables (a) 396,125 256,437 61,747 51,497 - 26,445 4,966,756 256,437 61,747 51,497 - 26,445 2012 Cash and cash equivalents 3.83% 2,458,709 - - - - - Restricted cash and cash equivalents 3.83% 629,139 - - - - - Receivables (a) 1,345,940 676,610 407,620 159,190 - 31,842 4,433,788 676,610 407,620 159,190 - 31,842 (a) The amount of receivables excludes the GST receivables from the ATO (statutory receivable).
Liquidity risk and interest rate exposure
The following table details the Institute’s interest rate exposure and the contractual maturity analysis of financial assets and financial liabilities. The maturity analysis section includes interest and principal cash flows. The interest rate exposure section analyses only the carrying amounts of each item.
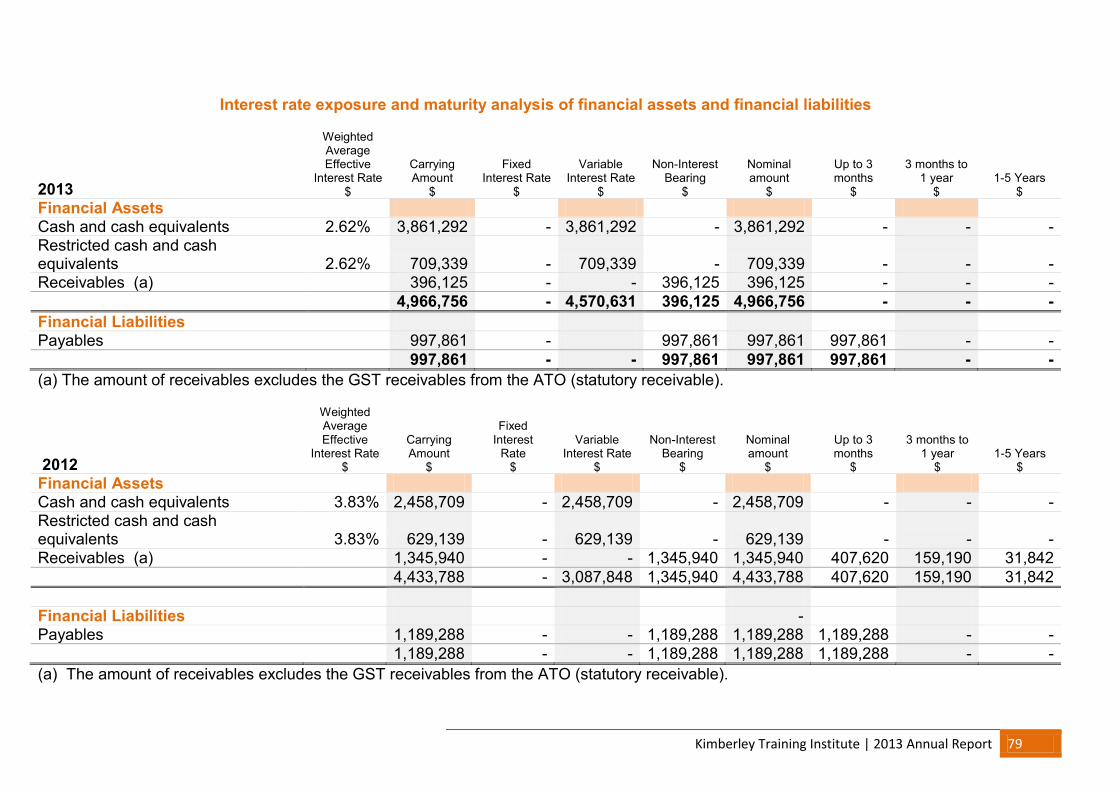
Kimberley Training Institute | 2013 Annual Report 79
Interest rate exposure and maturity analysis of financial assets and financial liabilities
2013
Weighted Average Effective
Interest Rate $
Carrying Amount
$
Fixed Interest Rate
$
Variable Interest Rate
$
Non-Interest Bearing
$
Nominal amount
$
Up to 3 months
$
3 months to 1 year
$ 1-5 Years
$ Financial Assets
Cash and cash equivalents 2.62% 3,861,292 - 3,861,292 - 3,861,292 - - - Restricted cash and cash equivalents 2.62% 709,339 - 709,339 - 709,339 - - - Receivables (a) 396,125 - - 396,125 396,125 - - - 4,966,756 - 4,570,631 396,125 4,966,756 - - - Financial Liabilities Payables 997,861 - 997,861 997,861 997,861 - -
997,861 - - 997,861 997,861 997,861 - - (a) The amount of receivables excludes the GST receivables from the ATO (statutory receivable).
2012
Weighted Average Effective
Interest Rate $
Carrying Amount
$
Fixed Interest
Rate $
Variable Interest Rate
$
Non-Interest Bearing
$
Nominal amount
$
Up to 3 months
$
3 months to 1 year
$ 1-5 Years
$ Financial Assets
Cash and cash equivalents 3.83% 2,458,709 - 2,458,709 - 2,458,709 - - - Restricted cash and cash equivalents 3.83% 629,139 - 629,139 - 629,139 - - - Receivables (a) 1,345,940 - - 1,345,940 1,345,940 407,620 159,190 31,842 4,433,788 - 3,087,848 1,345,940 4,433,788 407,620 159,190 31,842 Financial Liabilities - Payables 1,189,288 - - 1,189,288 1,189,288 1,189,288 - - 1,189,288 - - 1,189,288 1,189,288 1,189,288 - - (a) The amount of receivables excludes the GST receivables from the ATO (statutory receivable).

Kimberley Training Institute | 2013 Annual Report 80
Interest rate sensitivity analysis
The following table represents a summary of the interest rate sensitivity of the Institute's financial assets and liabilities at the end of the reporting period on the surplus for the period and equity for a 1% change in interest rates. It is assumed that the change in interest rates is held constant throughout the reporting period.
- 100 Basis Points + 100 Basis Points
2013 Carrying amount
$ Surplus
$ Equity
$ Surplus
$ Equity
$ Financial Assets Cash, Restricted cash and cash equivalents 4,570,631 (45,706) (45,706) 45,706 45,706 Total Increase/(Decrease) 45,706) (45,706) 45,706 45,706
- 100 Basis Points + 100 Basis Points
2012 Carrying amount
$ Surplus
$ Equity
$ Surplus
$ Equity
$ Financial Assets Cash, Restricted cash and cash equivalents 3,087,848 (30,878) (30,878) 30,878 30,878 Total Increase/(Decrease) (30,878) (30,878) 30,878 30,878
Fair values
All financial assets and liabilities recognised in the Statement of Financial Position, whether they are carried at cost or fair value, are recognised at amounts that represent a reasonable approximation of fair value unless otherwise stated in the applicable notes.
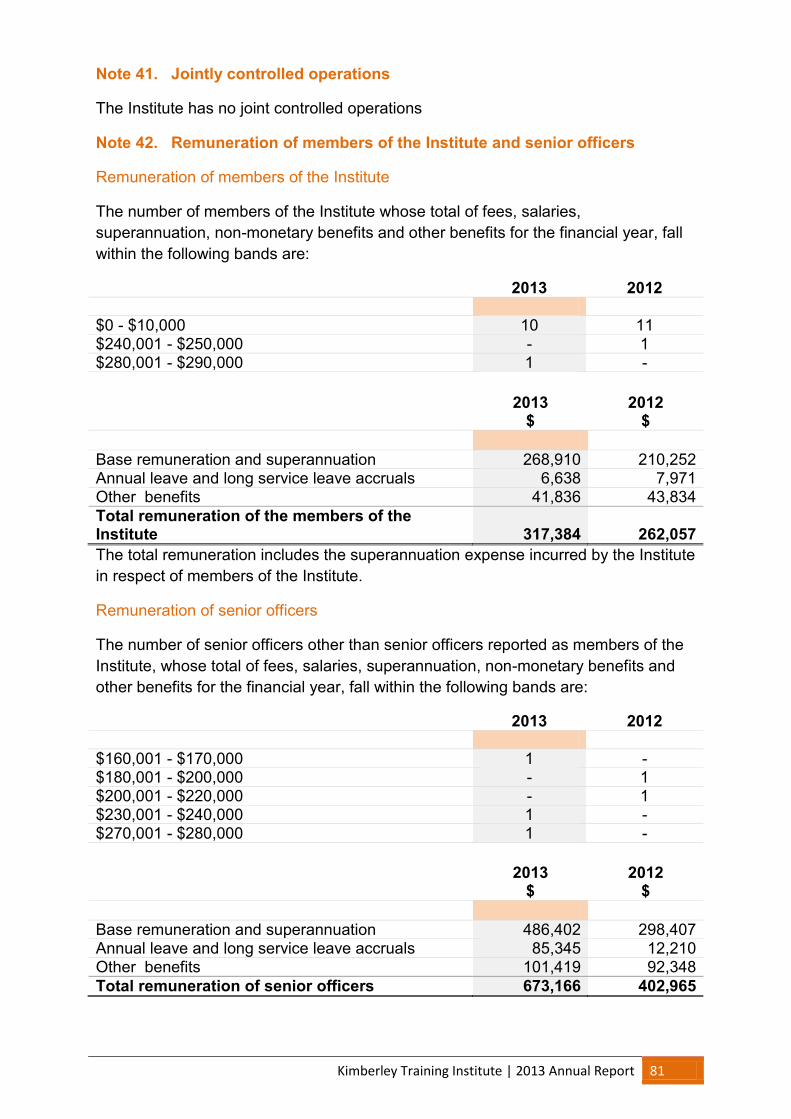
Kimberley Training Institute | 2013 Annual Report 81
Note 41. Jointly controlled operations
The Institute has no joint controlled operations
Note 42. Remuneration of members of the Institute and senior officers
Remuneration of members of the Institute
The number of members of the Institute whose total of fees, salaries, superannuation, non-monetary benefits and other benefits for the financial year, fall within the following bands are:
2013 2012 $0 - $10,000 10 11 $240,001 - $250,000 - 1 $280,001 - $290,000 1 - 2013
$ 2012
$ Base remuneration and superannuation 268,910 210,252 Annual leave and long service leave accruals 6,638 7,971 Other benefits 41,836 43,834 Total remuneration of the members of the Institute 317,384 262,057 The total remuneration includes the superannuation expense incurred by the Institute in respect of members of the Institute.
Remuneration of senior officers
The number of senior officers other than senior officers reported as members of the Institute, whose total of fees, salaries, superannuation, non-monetary benefits and other benefits for the financial year, fall within the following bands are:
2013 2012 $160,001 - $170,000 1 - $180,001 - $200,000 - 1 $200,001 - $220,000 - 1 $230,001 - $240,000 1 - $270,001 - $280,000 1 -
2013 $
2012 $
Base remuneration and superannuation 486,402 298,407 Annual leave and long service leave accruals 85,345 12,210 Other benefits 101,419 92,348 Total remuneration of senior officers 673,166 402,965
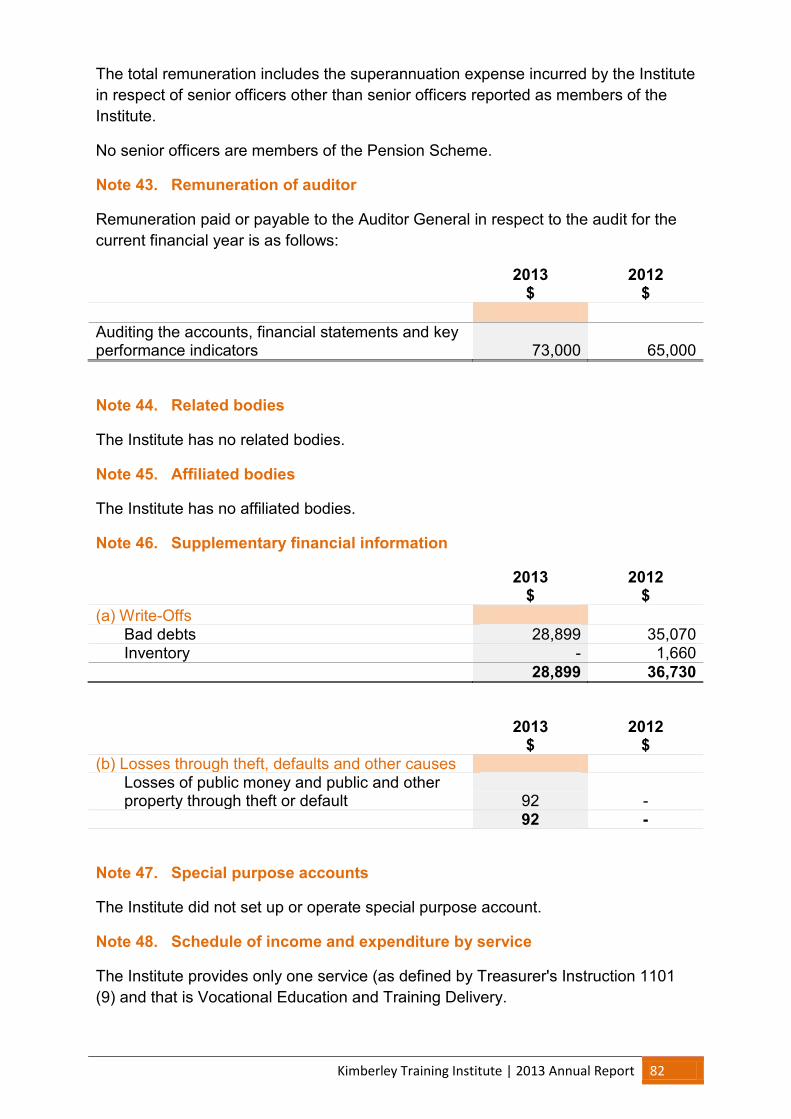
Kimberley Training Institute | 2013 Annual Report 82
The total remuneration includes the superannuation expense incurred by the Institute in respect of senior officers other than senior officers reported as members of the Institute.
No senior officers are members of the Pension Scheme.
Note 43. Remuneration of auditor
Remuneration paid or payable to the Auditor General in respect to the audit for the current financial year is as follows:
2013 $
2012 $
Auditing the accounts, financial statements and key performance indicators 73,000 65,000
Note 44. Related bodies
The Institute has no related bodies.
Note 45. Affiliated bodies
The Institute has no affiliated bodies.
Note 46. Supplementary financial information
2013 $
2012 $
(a) Write-Offs Bad debts 28,899 35,070 Inventory - 1,660
28,899 36,730
2013 $
2012 $
(b) Losses through theft, defaults and other causes Losses of public money and public and other property through theft or default 92 - 92 -
Note 47. Special purpose accounts
The Institute did not set up or operate special purpose account.
Note 48. Schedule of income and expenditure by service
The Institute provides only one service (as defined by Treasurer's Instruction 1101 (9) and that is Vocational Education and Training Delivery.

Kimberley Training Institute | 2013 Annual Report 83
S40 Submission - Statement of comprehensive income
2014
$ COST OF SERVICES Expenses Employee benefits expense 23,162,167 Supplies and services 6,860,369 Depreciation and amortisation expense 1,580,787 Finance costs - Grants and subsidies 125,306 Payments to Non TAFE Providers for VET Delivery - Loss on disposal of non-current assets - Cost of sales 35,067 Other expenses 1,538,851 Total Cost of Services 33,302,547 Income Revenue Fee for service 1,337,010 Student charges and fees 2,160,266 Ancillary trading 11,762 Sales 38,001 Commonwealth grants and contributions 1,176,082 Interest revenue 208,901 Other revenue 106,771 Total Revenue 5,038,794 Gains Gain on disposal of non-current assets - Other gains - Total Gains - Total income other than income from State Government 5,038,794 NET COST OF SERVICES (28,263,752) INCOME FROM STATE GOVERNMENT State funds 26,859,720 Assets assumed/(transferred) - Resources received free of charge 894,813 Royalties for regions - Total income from State Government 27,754,533 (509,219) OTHER COMPREHENSIVE INCOME Changes in asset revaluation reserve - Gains/(losses) recognised directly in equity - TOTAL COMPREHENSIVE INCOME FOR THE PERIOD (509,219)
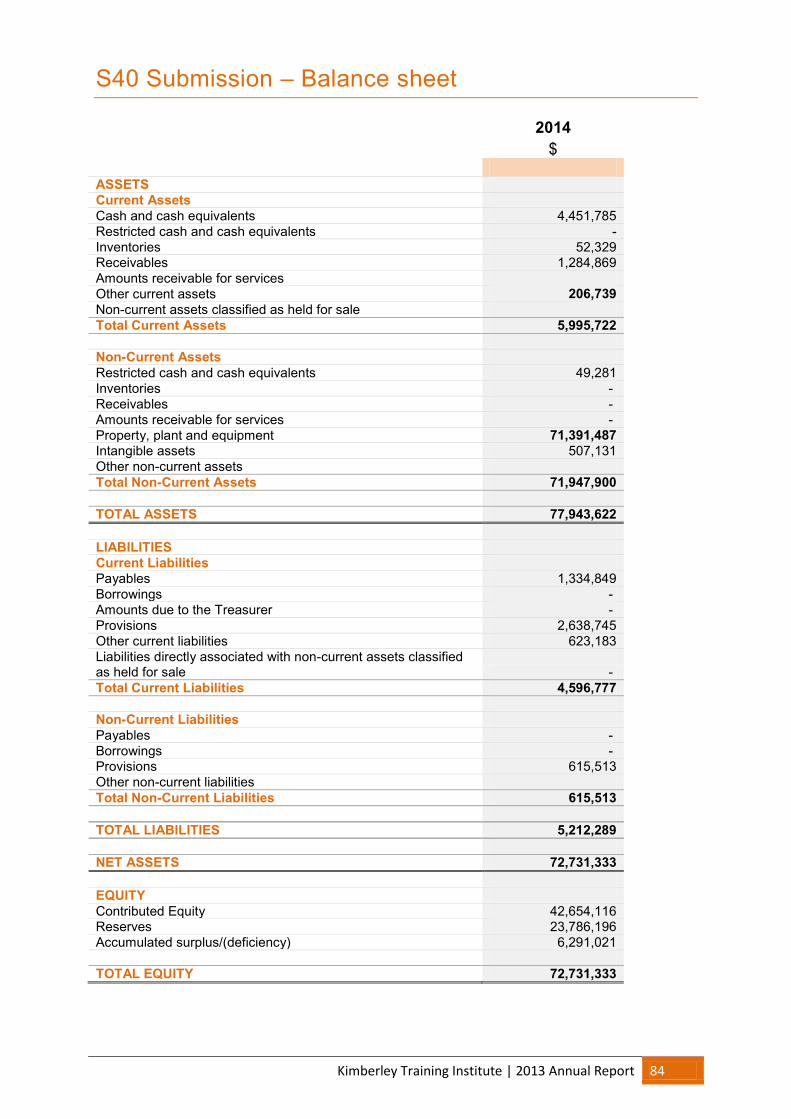
Kimberley Training Institute | 2013 Annual Report 84
S40 Submission – Balance sheet
2014 $
ASSETS Current Assets Cash and cash equivalents 4,451,785 Restricted cash and cash equivalents - Inventories 52,329 Receivables 1,284,869 Amounts receivable for services Other current assets 206,739 Non-current assets classified as held for sale Total Current Assets 5,995,722 Non-Current Assets Restricted cash and cash equivalents 49,281 Inventories - Receivables - Amounts receivable for services - Property, plant and equipment 71,391,487 Intangible assets 507,131 Other non-current assets Total Non-Current Assets 71,947,900 TOTAL ASSETS 77,943,622 LIABILITIES Current Liabilities Payables 1,334,849 Borrowings - Amounts due to the Treasurer - Provisions 2,638,745 Other current liabilities 623,183 Liabilities directly associated with non-current assets classified as held for sale - Total Current Liabilities 4,596,777 Non-Current Liabilities Payables - Borrowings - Provisions 615,513 Other non-current liabilities Total Non-Current Liabilities 615,513 TOTAL LIABILITIES 5,212,289 NET ASSETS 72,731,333 EQUITY Contributed Equity 42,654,116 Reserves 23,786,196 Accumulated surplus/(deficiency) 6,291,021 TOTAL EQUITY 72,731,333

Kimberley Training Institute | 2013 Annual Report 85
S40 Submission – Changes in equity statement
2014 $
Balance of equity at start of period 52,490,552 CONTRIBUTED EQUITY Balance at start of period 21,904,116 Capital contribution 20,750,000 Other contributions by owners Distributions to owners - Balance at end of period 42,654,116 RESERVES Asset Revaluation Reserve Balance at start of period 23,786,196 Changes in accounting policy or correction of prior period errors - Restated balance at start of period 23,786,196
Gains/(losses) from asset revaluation - Balance at end of period 23,786,196 ACCUMULATED SURPLUS (RETAINED EARNINGS) Balance at start of period 6,800,240 Changes in accounting policy or correction of prior period errors - Restated balance at start of period 6,800,240
Surplus/(deficit) or profit/(loss) for the period (509,219) Gains/(losses) recognised directly in equity - Balance at end of period 6,291,021 Balance of equity at end of period 72,731,333 Total income and expense for the period (509,219)

Kimberley Training Institute | 2013 Annual Report 86
S40 Submission – Cash flow statement
2014 $
CASH FLOWS FROM STATE GOVERNMENT State funds 26,859,720 Capital contributions - Holding account drawdowns - Net cash provided by State Government 26,859,720 Utilised as follows: CASH FLOWS FROM OPERATING ACTIVITIES Payments Employee benefits (23,308,198) Supplies and services (6,040,485) Finance costs - Grants and subsidies (125,306) GST payments on purchases 310,669 GST payments to taxation authority - Other payments (1,538,851) Receipts Fee for service 866,381 Student fees and charges 2,160,266 Ancillary trading 13,371 Commonwealth grants and contributions 1,176,082 Interest received 208,901 GST receipts on sales (289,984) GST receipts from taxation authority (3,900) Other receipts 106,771 Net cash provided by/(used in) operating activities (26,464,283) CASH FLOWS FROM INVESTING ACTIVITIES Proceeds from sale of non-current physical assets - Purchase of non-current physical assets (445,000) Net cash provided by/(used in) investing activities (445,000) Net increase/(decrease) in cash held and cash equivalents (49,563) Cash and cash equivalents at the beginning of the period 4,550,629 CASH AND CASH EQUIVALENTS AT THE END OF THE PERIOD 4,501,066

Kimberley Training Institute | 2013 Annual Report 87
Additional key performance indicator information
Certification of key performance indicators for the year ended 31 December 2013
We hereby certify that the performance indicators are based on proper records, are relevant and appropriate for assisting users to evaluate the performance of Kimberley Training Institute, and fairly represent the performance of Kimberley Training Institute for 2013.
Niegel Grazia Karen Dickinson Chairman, Governing Council Managing Director and Accountable Officer
10th March 2014 10th March 2014

Kimberley Training Institute | 2013 Annual Report 88
Performance outcomes
Kimberley Training Institute’s agency level desired outcome is the provision of vocational education and training services to meet community and industry training needs. The following detailed information is provided in support of our key performance indicators.
KPI 1: Overall student satisfaction
Student satisfaction is a key determinant in assessing the overall effectiveness of a training provider, and is measured in an annual survey of a sample of all students enrolled with State Training Providers in 2013.
The overall level of student satisfaction is an expression of the number of “satisfied” and “very satisfied” respondents.
In 2013 Kimberley Training Institute had an exceptional result with 91.7% of our students satisfied with our training delivery compared with a state average of 85.9%.
2010 2011 2012 2013 2013 Target Kimberley Training Institute 86% 96% 87% 91.7% 85%
WA State 87% 88% 86% 85.9% N/A
Source: Student Satisfaction Survey 2013, conducted by Patterson Research Group
Notes for KPI 1: a. The Student Satisfaction Survey was conducted on behalf of the Department of Training and
Workforce Development across October and November 2013. b. The sample size for the state was 10,333 from a total population of 55,468 (18.63% response
rate). The sample size for Kimberley Training Institute was 232 from a total population of 1,657 (14% response rate).
c. The standard error for the Institute survey outcome was 1.7% with a relative sampling error of ±3.3% with a 95% confidence level.
KPI 2: Graduate employment
The achievement of graduate employment outcomes is a performance measure that demonstrates the Institute’s effectiveness in providing vocational education and training services to meet community and industry needs.
2013 graduate employment data is provided by the National Centre for Vocational Education Research (NCVER), based on responses to a survey of 2012 graduates.
The NCVER results reported in 2013 demonstrate that the Institute consistently out-performs other providers in this arena. The results show that the Institute is meeting the government’s objective to contribute to economic growth by supporting and growing sustainable employment.
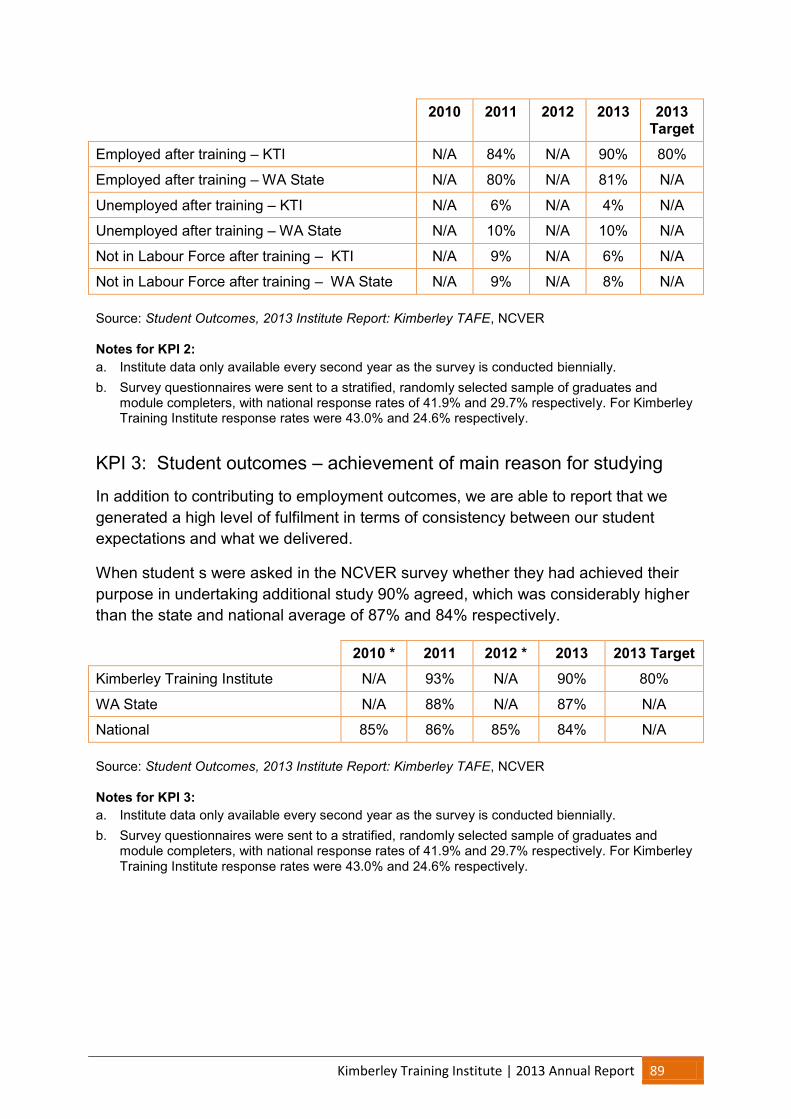
Kimberley Training Institute | 2013 Annual Report 89
2010 2011 2012 2013 2013 Target
Employed after training – KTI N/A 84% N/A 90% 80%
Employed after training – WA State N/A 80% N/A 81% N/A
Unemployed after training – KTI N/A 6% N/A 4% N/A
Unemployed after training – WA State N/A 10% N/A 10% N/A
Not in Labour Force after training – KTI N/A 9% N/A 6% N/A
Not in Labour Force after training – WA State N/A 9% N/A 8% N/A
Source: Student Outcomes, 2013 Institute Report: Kimberley TAFE, NCVER
Notes for KPI 2: a. Institute data only available every second year as the survey is conducted biennially. b. Survey questionnaires were sent to a stratified, randomly selected sample of graduates and
module completers, with national response rates of 41.9% and 29.7% respectively. For Kimberley Training Institute response rates were 43.0% and 24.6% respectively.
KPI 3: Student outcomes – achievement of main reason for studying
In addition to contributing to employment outcomes, we are able to report that we generated a high level of fulfilment in terms of consistency between our student expectations and what we delivered.
When student s were asked in the NCVER survey whether they had achieved their purpose in undertaking additional study 90% agreed, which was considerably higher than the state and national average of 87% and 84% respectively.
2010 * 2011 2012 * 2013 2013 Target Kimberley Training Institute N/A 93% N/A 90% 80%
WA State N/A 88% N/A 87% N/A
National 85% 86% 85% 84% N/A
Source: Student Outcomes, 2013 Institute Report: Kimberley TAFE, NCVER
Notes for KPI 3: a. Institute data only available every second year as the survey is conducted biennially. b. Survey questionnaires were sent to a stratified, randomly selected sample of graduates and
module completers, with national response rates of 41.9% and 29.7% respectively. For Kimberley Training Institute response rates were 43.0% and 24.6% respectively.
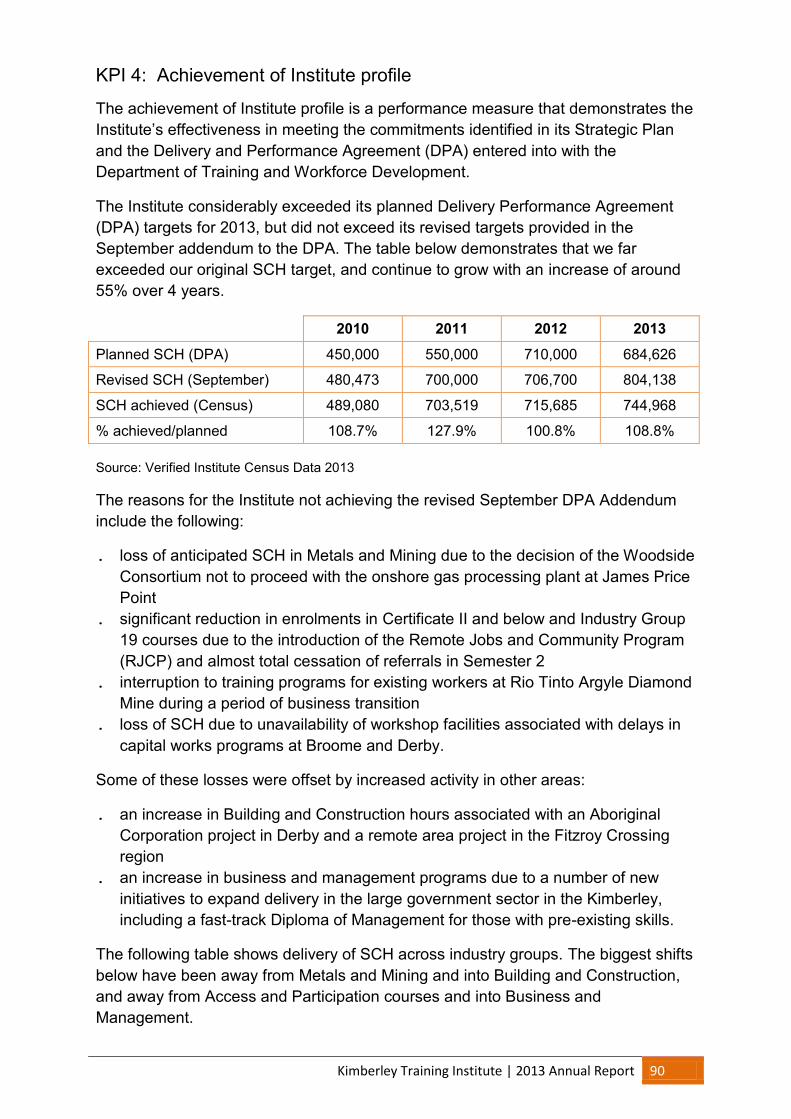
Kimberley Training Institute | 2013 Annual Report 90
KPI 4: Achievement of Institute profile
The achievement of Institute profile is a performance measure that demonstrates the Institute’s effectiveness in meeting the commitments identified in its Strategic Plan and the Delivery and Performance Agreement (DPA) entered into with the Department of Training and Workforce Development.
The Institute considerably exceeded its planned Delivery Performance Agreement (DPA) targets for 2013, but did not exceed its revised targets provided in the September addendum to the DPA. The table below demonstrates that we far exceeded our original SCH target, and continue to grow with an increase of around 55% over 4 years.
2010 2011 2012 2013
Planned SCH (DPA) 450,000 550,000 710,000 684,626
Revised SCH (September) 480,473 700,000 706,700 804,138
SCH achieved (Census) 489,080 703,519 715,685 744,968
% achieved/planned 108.7% 127.9% 100.8% 108.8%
Source: Verified Institute Census Data 2013
The reasons for the Institute not achieving the revised September DPA Addendum include the following:
. loss of anticipated SCH in Metals and Mining due to the decision of the Woodside Consortium not to proceed with the onshore gas processing plant at James Price Point
. significant reduction in enrolments in Certificate II and below and Industry Group 19 courses due to the introduction of the Remote Jobs and Community Program (RJCP) and almost total cessation of referrals in Semester 2
. interruption to training programs for existing workers at Rio Tinto Argyle Diamond Mine during a period of business transition
. loss of SCH due to unavailability of workshop facilities associated with delays in capital works programs at Broome and Derby.
Some of these losses were offset by increased activity in other areas:
. an increase in Building and Construction hours associated with an Aboriginal Corporation project in Derby and a remote area project in the Fitzroy Crossing region
. an increase in business and management programs due to a number of new initiatives to expand delivery in the large government sector in the Kimberley, including a fast-track Diploma of Management for those with pre-existing skills.
The following table shows delivery of SCH across industry groups. The biggest shifts below have been away from Metals and Mining and into Building and Construction, and away from Access and Participation courses and into Business and Management.

Kimberley Training Institute | 2013 Annual Report 91
Industry Group 2010 2011 2012 2013 2013 Target
Recreation Sports and Entertainment 0 0 8,005 7,095 7,000
Visual and Performing Arts 39,547 59,674 54,932 53,576 40,420
Automotive 9,400 8,162 16,497 34,187 20,000
Building and Construction 61,724 77,069 98,035 131,583 87,296
Community Service Workers 13,745 33,790 29,445 23,970 34,450
Education and Childcare 31,917 55,975 53,860 58,965 51,105
Health 6,570 13,250 28,320 39,010 30,095
Finance Insurance Property Service Workers 14,200 9,452 14,312 9,794 12,130
Metals and Mining 7,029 97,084 72,357 15,299 56,245
Forestry, Farming and Landcare 89,705 102,306 64,988 81,730 72,385
Horticulture 44,564 28,165 49,474 43,480 41,275
Personal Service 3,477 26,250 11,288 17,763 9,836
Retail 15 560 0 7,681 0
Cooking 6,937 16,130 10,234 11,398 13,000
Hospitality 26,786 17,791 17,533 15,431 21,842
Tourism 21,425 12,455 16,355 12,890 11,980
Travel Agents 2,935 6,330 1,685 7,890 2,000
Transport Trades, Storage and Associated 7,307 3,876 13,465 12,616 13,382
Accounting and Other Business Services 0 3,210 9,955 10,880 10,125
Management 10,710 12,520 22,745 31,255 18,147
Office and Clerical 28,255 39,530 41,885 47,845 43,900
Computing 3,425 2,570 1,090 2,595 2,925
Science and Technical Workers 12,780 7,865 14,660 14,635 12,920
Adult Literacy/ESL 21,960 40,075 50,555 43,810 50,898
Languages 2,481 800 0 800 0
Targeted Access and Participation Courses 22,186 28,630 14,010 8,790 21,270
TOTALS (Student Curriculum Hours) 489,080 703,519 715,685 744,968 684,626 Source: Verified Institute Census Data 2013
The Institute also delivers a range of programs which are not funded by government. These programs include fee for service and lifestyle and leisure programs and are priced on a cost-recovery basis.
2010 2011 2012 2013 2013 Target
Non-profile delivery 75,654 71,917 71,674 85,981 95,110
% of training delivery 13.4% 9.3% 10.0% 10.3% 11.9% Notes for KPI 4: a. SCH % achievement is based on the original DPA and not on variations agreed to during 2013. b. Adjustments to delivery across industry groups are based on industry and community demand
and reflect actual training market conditions during 2013. c. Non-profile delivery is the total of SCH delivered which were not funded through the Institute’s
DPA.

Kimberley Training Institute | 2013 Annual Report 92
KPI 5: Cost per Student Curriculum Hour
Cost per Student Curriculum Hour (SCH) is a performance measure that demonstrates the Institute’s efficiency in providing training services. The cost per SCH is calculated by dividing the total cost of services by the number of SCH delivered.
The cost per SCH in 2013 was $41.07 – a decrease of $1.44 from 2012 but higher than the target figure of $39.21
2010 2011 2012 2013 2013 Target Total cost of services
$24,125,588 $28,122,967 $33,470,382 $34,127,991 $31,258,103
Total SCH delivered *
564,734 775,436 787,359 830,949 797,236
Total cost per SCH
$42.72 $36.27 $42.51 $41.07 $39.21
* Includes Fee for Service programs and Grants-funded delivery
There were particular circumstances in 2012 that led to a higher than expected cost per SCH. These included additional superannuation commitments, additional provision for leave entitlements and an increase in depreciation. Without these additional costs the Institute estimated that the cost per SCH in 2012 would have been around $39, which therefore became the benchmark for 2013.
There was an expectation in the forward estimates for 2013 that there would be a decrease in the cost per SCH due to an overall increase in funded SCH with expenditure being contained. The expected 2013 result was not fully realised however with a decrease in cost per SCH of only 3.4%. This was primarily due to under achievement of profile SCH against the revised 2013 target (as per KPI 4). When it was confirmed in the fourth quarter of 2013 that achievement of the SCH target was in jeopardy, it was too late to contain fixed costs for the remainder of the year.

Kimberley Training Institute | 2013 Annual Report 93
Ministerial directives
No ministerial directives were received in in 2013.
Other financial disclosures
Pricing policies
Under the Vocational Education and Training Regulations 1996, the Institute may determine fees and charges for services other than for services prescribed by the Minister for Training and Workforce Development. In 2013 Kimberley Training Institute documented its fees and charges, including those gazetted by the Minister, in its annual Fees and Charges Policy.
Major capital projects
The following major capital works projects were underway in 2013.
Project Funding Completion date Value
Broome Stage 1a and 1b – construction of a new Carpentry and Joinery workshop, plus additions and upgrades to existing metal and auto trades’ areas, civil construction training areas and secure vehicle fleet parking New classrooms – Separable Portion 6, variation to Stage 1a and 1 b
$5.135 M State capital works $10 M Royalties for Regions (RfR)
Carpentry and joinery workshop March 2014 Metal trades workshop March 2014 Automotive workshop June 2014 Classrooms September 2014
$15.135 M
Derby workshop alterations and additions to the Loch Street campus; includes the construction of new workshop areas for industrial skills, automotive and carpentry and joinery; construction of new classrooms and upgrades to administrative areas, staff and student amenities, multi-functional conference room
$6.2 M RfR $790 K State
Workshop areas April 2014 Art area, classrooms, conference room June 2014
$6.99 M
Halls Creek – new automotive workshop; additions and alterations to the existing trade workshops to allow for industrial skills and construction training; campus upgrades including new air conditioning service, upgrade of existing on-site staff accommodation, construction of new arts and crafts area, and disability access
$2.8 M RfR $.318M State
Project completed September 2013 (12 weeks ahead of schedule) Landscaping February 2014
$3.118 M
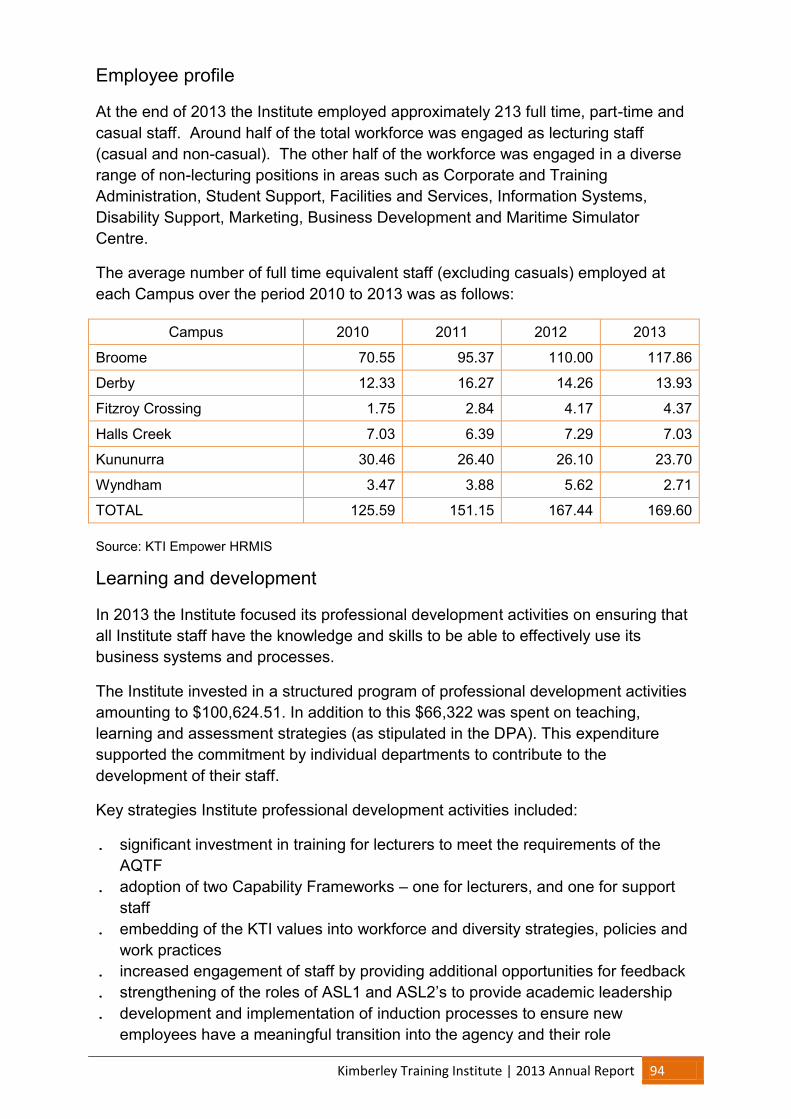
Kimberley Training Institute | 2013 Annual Report 94
Employee profile
At the end of 2013 the Institute employed approximately 213 full time, part-time and casual staff. Around half of the total workforce was engaged as lecturing staff (casual and non-casual). The other half of the workforce was engaged in a diverse range of non-lecturing positions in areas such as Corporate and Training Administration, Student Support, Facilities and Services, Information Systems, Disability Support, Marketing, Business Development and Maritime Simulator Centre.
The average number of full time equivalent staff (excluding casuals) employed at each Campus over the period 2010 to 2013 was as follows:
Campus 2010 2011 2012 2013
Broome 70.55 95.37 110.00 117.86
Derby 12.33 16.27 14.26 13.93
Fitzroy Crossing 1.75 2.84 4.17 4.37
Halls Creek 7.03 6.39 7.29 7.03
Kununurra 30.46 26.40 26.10 23.70
Wyndham 3.47 3.88 5.62 2.71
TOTAL 125.59 151.15 167.44 169.60 Source: KTI Empower HRMIS
Learning and development
In 2013 the Institute focused its professional development activities on ensuring that all Institute staff have the knowledge and skills to be able to effectively use its business systems and processes.
The Institute invested in a structured program of professional development activities amounting to $100,624.51. In addition to this $66,322 was spent on teaching, learning and assessment strategies (as stipulated in the DPA). This expenditure supported the commitment by individual departments to contribute to the development of their staff.
Key strategies Institute professional development activities included:
. significant investment in training for lecturers to meet the requirements of the AQTF
. adoption of two Capability Frameworks – one for lecturers, and one for support staff
. embedding of the KTI values into workforce and diversity strategies, policies and work practices
. increased engagement of staff by providing additional opportunities for feedback
. strengthening of the roles of ASL1 and ASL2’s to provide academic leadership
. development and implementation of induction processes to ensure new employees have a meaningful transition into the agency and their role
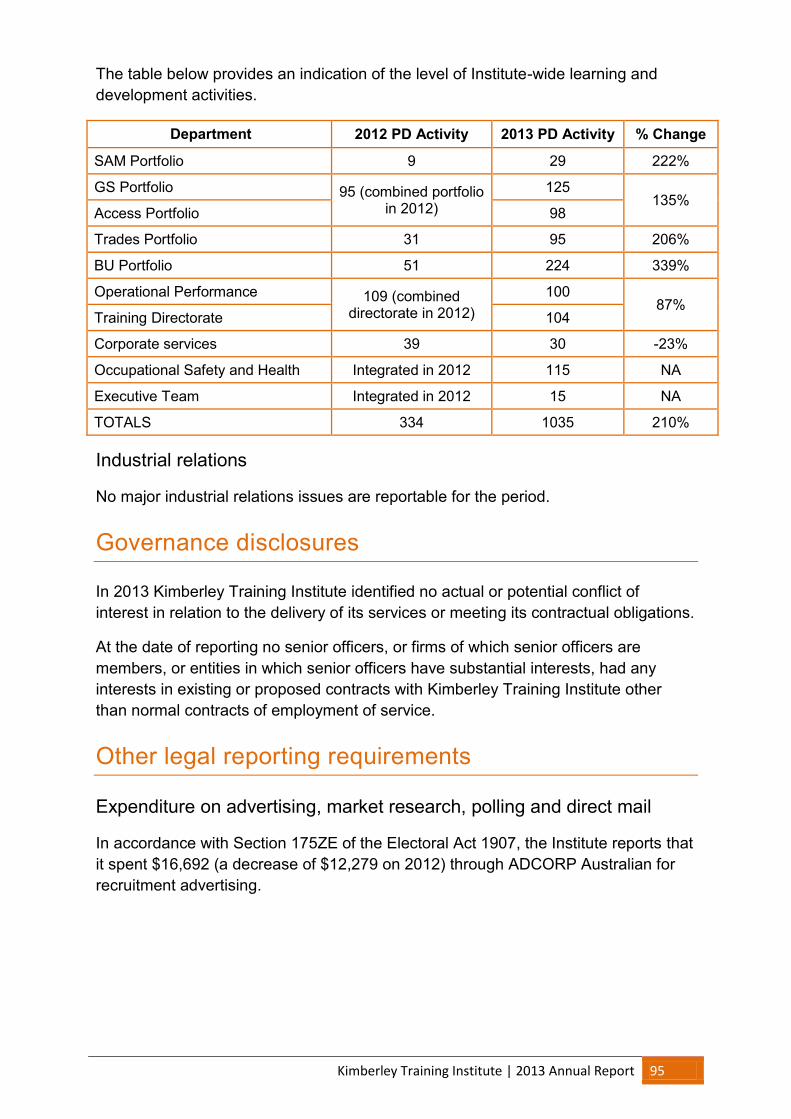
Kimberley Training Institute | 2013 Annual Report 95
The table below provides an indication of the level of Institute-wide learning and development activities.
Department 2012 PD Activity 2013 PD Activity % Change
SAM Portfolio 9 29 222%
GS Portfolio 95 (combined portfolio in 2012)
125 135%
Access Portfolio 98
Trades Portfolio 31 95 206%
BU Portfolio 51 224 339%
Operational Performance 109 (combined directorate in 2012)
100 87%
Training Directorate 104
Corporate services 39 30 -23%
Occupational Safety and Health Integrated in 2012 115 NA
Executive Team Integrated in 2012 15 NA
TOTALS 334 1035 210%
Industrial relations
No major industrial relations issues are reportable for the period.
Governance disclosures
In 2013 Kimberley Training Institute identified no actual or potential conflict of interest in relation to the delivery of its services or meeting its contractual obligations.
At the date of reporting no senior officers, or firms of which senior officers are members, or entities in which senior officers have substantial interests, had any interests in existing or proposed contracts with Kimberley Training Institute other than normal contracts of employment of service.
Other legal reporting requirements
Expenditure on advertising, market research, polling and direct mail
In accordance with Section 175ZE of the Electoral Act 1907, the Institute reports that it spent $16,692 (a decrease of $12,279 on 2012) through ADCORP Australian for recruitment advertising.
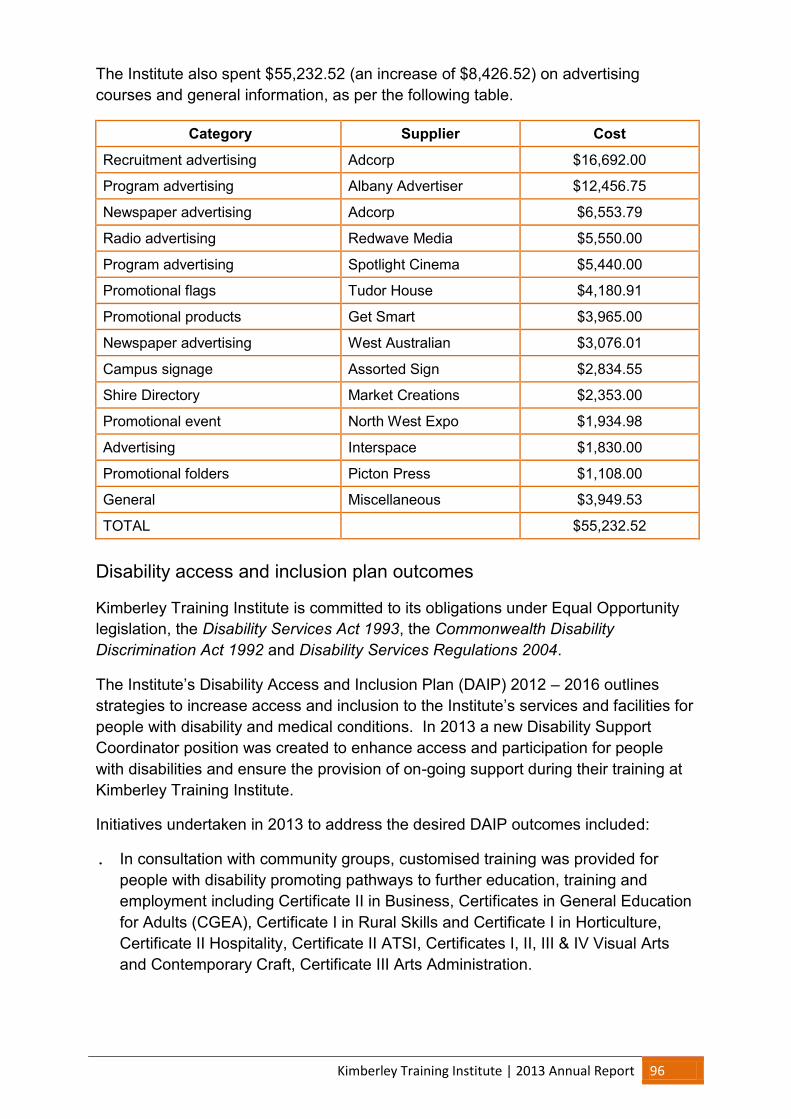
Kimberley Training Institute | 2013 Annual Report 96
The Institute also spent $55,232.52 (an increase of $8,426.52) on advertising courses and general information, as per the following table.
Category Supplier Cost
Recruitment advertising Adcorp $16,692.00
Program advertising Albany Advertiser $12,456.75
Newspaper advertising Adcorp $6,553.79
Radio advertising Redwave Media $5,550.00
Program advertising Spotlight Cinema $5,440.00
Promotional flags Tudor House $4,180.91
Promotional products Get Smart $3,965.00
Newspaper advertising West Australian $3,076.01
Campus signage Assorted Sign $2,834.55
Shire Directory Market Creations $2,353.00
Promotional event North West Expo $1,934.98
Advertising Interspace $1,830.00
Promotional folders Picton Press $1,108.00
General Miscellaneous $3,949.53
TOTAL $55,232.52 Disability access and inclusion plan outcomes
Kimberley Training Institute is committed to its obligations under Equal Opportunity legislation, the Disability Services Act 1993, the Commonwealth Disability Discrimination Act 1992 and Disability Services Regulations 2004.
The Institute’s Disability Access and Inclusion Plan (DAIP) 2012 – 2016 outlines strategies to increase access and inclusion to the Institute’s services and facilities for people with disability and medical conditions. In 2013 a new Disability Support Coordinator position was created to enhance access and participation for people with disabilities and ensure the provision of on-going support during their training at Kimberley Training Institute.
Initiatives undertaken in 2013 to address the desired DAIP outcomes included:
. In consultation with community groups, customised training was provided for people with disability promoting pathways to further education, training and employment including Certificate II in Business, Certificates in General Education for Adults (CGEA), Certificate I in Rural Skills and Certificate I in Horticulture, Certificate II Hospitality, Certificate II ATSI, Certificates I, II, III & IV Visual Arts and Contemporary Craft, Certificate III Arts Administration.

Kimberley Training Institute | 2013 Annual Report 97
. In January 2013 our Student Disability Enrolment and Assistance Policy was updated to assist staff to understand our legislative and operational requirements in relation to the enrolment process and assistance available for existing and potential students with a disability.
. People identified with disability and/or medical conditions were able to access individualised learning support to ensure access and participation in their training at the Institute.
. Equipment and learning aids have been purchased as required.
. Continuous access improvements have included improved access to accessible toilets, automatic doors to buildings, Easy Access parking bays and updated signage.
. Where possible all new buildings and major renovations have been designed and built to comply with access Standards. Where this has not been possible, arrangements for alternative venues for course delivery venues have been made available.
. There was an ongoing commitment to ensure that the Institute’s website meets Web Content Accessibility Guidelines WCAG 2.0
. Improved working relationship with community agencies to ensure better support for students with disabilities.
. The Institute’s customer feedback process includes options for verbal complaints and support for people with disability to provide feedback.
. KTI has developed disability support procedures, policies, and referral forms to ensure the identification and inclusion of those students with a disability.
. KTI has an increased awareness of additional supports available for Australian Apprentices’ with disabilities that can be accessed through KTI.
. KTI has increased its community awareness and inclusion of people with disabilities by hosting events such as the Disability Awareness Week morning tea.
In compliance with annual reporting requirements, a Disability Access and Inclusion Plan (DAIP) progress report was submitted in July 2013 to the Disability Services Commission indicating that 22 of 24 identified planned strategies were considered completed.
Compliance with Public Sector Standards and ethical codes
The Institute is committed to ensuring compliance and ‘best practice’ requirements of the Public Sector Standards in Human Resource Management, the Public Sector Code of Ethics and the Institute’s Code of Conduct.
Human Resources policies and procedures are regularly reviewed and updated to ensure compliance with Public Sector Standards. During the reporting period the Institute received one request for review against the Public Sector Human Resource Standards. A subsequent review was undertaken and the Institute was advised that the process under review was compliant with the Standards.
Kimberley Training Institute | 2013 Annual Report 98
Maintaining awareness of the Public Sector Standards and the Code of Conduct is achieved through staff training, newsletters, staff meetings, email communication and the Institute’s Intranet.
Through our intranet all staff have access to HR policies and procedures, including policies that relate to performance management, redeployment, termination, discipline, grievance resolution, and employment standards. The induction process for new staff includes signing the Code of Conduct and Code of Ethics to indicate that they are aware of and understand the requirement to comply with both.
94% of all permanent and fixed term contract staff at Kimberley Training Institute have completed on-line Accountable and Ethical Decision Making module awareness training.
As required under Section 31 of the Public Sector Management Act 1994, the Institute has complied in 2013 with its reporting requirements to the Office of Public Sector Standards in relation to Public Sector Standards, Code of Ethics and its Code of Conduct. During the reporting period no breach of Public Sector Standards claims were lodged (Grievance) under Public Sector Human Resource standards. The Institute referred one matter of suspected misconduct to the Corruption and Crime Commission (CCC) in 2012 that was carried forward to this reporting period. In April 2013 the CCC completed a review of the matter and advised the Institute that they considered the matter appropriately investigated and dealt with.
Public interest disclosure
The Public Interest Disclosure Act 2003 requires the Institute to:
. Facilitate the disclosure of public interest information
. Provide protection for those making disclosures
. Provide protection for those who are the subject of a disclosure
In accordance with the Act, the Institute has appointed a Public Interest Disclosure (PID) Officer and has published and promoted internal policies and procedures related to its obligations. There were no PID applications received for the reporting period.
Freedom of information
We publish a range of documents that provide information to staff and the community. Publications are available from the Institute and many are widely distributed to interested parties and the broader community. The Institute’s website is continually updated with an increasing amount of general information and documentation, including this Annual Report.
Kimberley Training Institute | 2013 Annual Report 99
Any member of the public wishing to access material under the Freedom of Information Act 1992 (FOI Act), may address requests to:
Managing Director, Kimberley Training Institute PO Box 1380, Broome WA 6725 The Institute received 1 application under the auspices of the FOI Act in 2013
Record keeping plans
Kimberley Training Institute is a signatory to the sector wide Recordkeeping Plan (RKP) which was approved by the State Records Commission (SRC) in December 2012 as prescribed by the State Records Act 2000. The Institute is required to report as required by the State Records Office (SRO), Principles and Standards 2002 (Standard 2, Principle 6) on:
During 2013 the Institute undertook further upgrading of the Electronic Recordkeeping Management System (Hewlett Packard’s TRIM) to version 7.3 which produced significant benefits including seamless integration with Windows 7 and Office 2010.
In 2013 we implemented the following to improve record keeping practices:
. training materials developed (Manual, TRIM Tips, and FAQ’s)
. recordkeeping policy
. regular TRIM training
. streamlined processes
. digitisation of documents
. archival records updated to meet new disposal schedules
By the end of 2013 the Institute had 186 users of TRIM, which is around 87% of the workforce.
We continued to provide a mandatory online Recordkeeping Awareness Training (RAT) course so that staff are aware of their recordkeeping responsibilities. The online course was completed by 73 staff during 2013. Regular TRIM training was delivered on a needs basis to all staff and covers all aspects of capturing business records.
The online RAT training program has been highly efficient because it is easily accessible by KTI staff and the pace of the course can be to a level determined by the staff member. The following TRIM records were created in 2013:
. corporate files created – 5,945
. corporate documents captured – 88,407
. archive boxes created – 54
Kimberley Training Institute | 2013 Annual Report 100
Government policy requirements
Substantive equality
Kimberley Training Institute actively promotes a workplace free of discrimination and compliance with legislative requirements.
In compliance with human resource obligatory information reporting requirements for the Public Sector Commission, Kimberley Training Institute provides information for the Equal Employment Opportunity sector annual reporting. The information provided is primarily related to employment processes and staffing profile.
Workforce and diversity planning are complementary processes that aim to achieve an optimum workforce. These processes are critical in assisting KTI to effectively plan and manage both our current and future workforce and service delivery needs.
The Kimberley Training Institutes Workforce and Diversity Plan 2012 – 2016 was developed in alignment with both Part IX of the Equal Opportunity Act 1984 and Strategic Directions for the Public Sector Workforce 2009 – 2014 and endorsed by the Public Sector Commissioner in July 2012.
Occupational safety and health and injury management
Kimberley Training Institute is committed to ensuring compliance with the requirements of the Occupational Safety and Health Act 1984 and Workers’ Compensation and Injury Management Act 1981. The Institute remains committed to monitoring, management and development of strategies to reduce workplace injuries and accidents.
Kimberley Training Institute has appointed OSH representatives and actively encourages and promotes their involvement in the prevention, identification and implementation of OSH strategies. The OSH Committee is the key to occupational safety and health consultation within Kimberley Training Institute. The Committee members’ location and details are communicated to all employees. The members are accessible and effectively utilised by both management and employees in the discussion and resolution of occupational safety and health issues.
The Institute’s OSH Committee convenes on a bi-monthly basis to discuss and resolve occupational safety and health issues, review hazard and incident reports and review progress against our strategic objectives.
OSH activities in 2013 included:
. OSH inspections on all campuses. A MSDS audit was undertaken, as well as checks of all asbestos registers
. The Institute’s Remote Area Travel Policy was developed and launched to all staff (lecturing and not lecturing)
. Institute vehicles equipped with survival and repair kits
. Increased the number of satellite phones and trained staff on their use
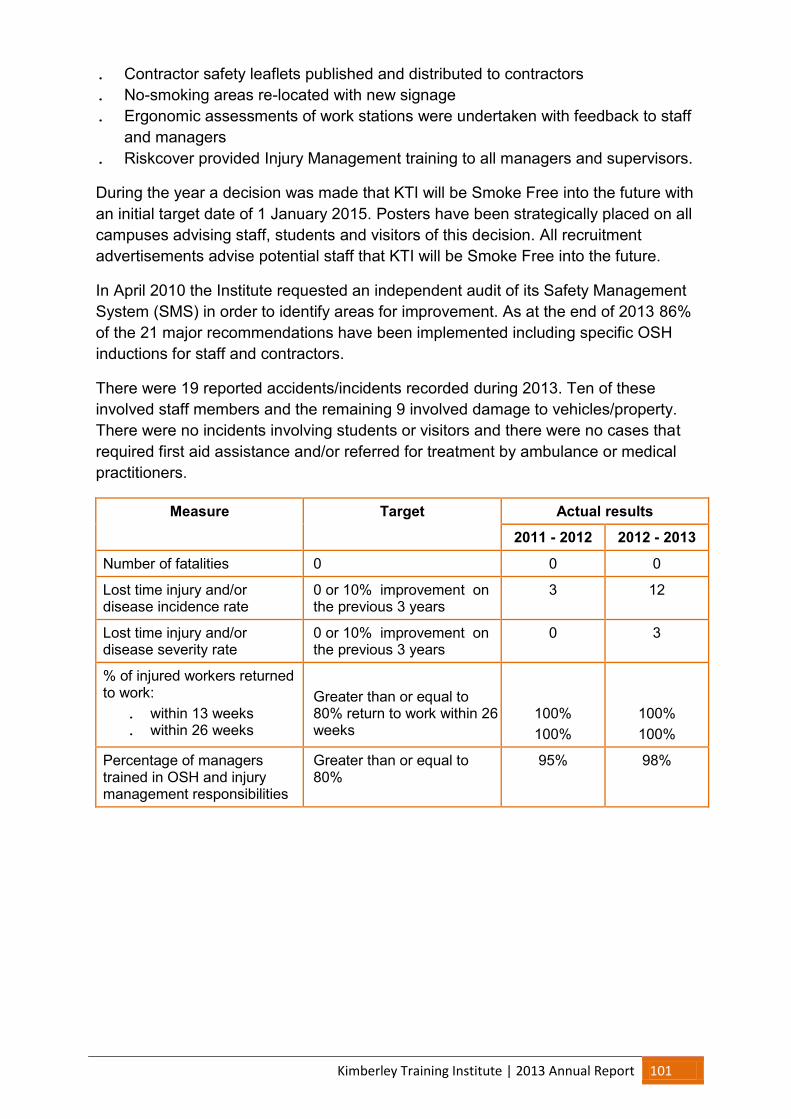
Kimberley Training Institute | 2013 Annual Report 101
. Contractor safety leaflets published and distributed to contractors
. No-smoking areas re-located with new signage
. Ergonomic assessments of work stations were undertaken with feedback to staff and managers
. Riskcover provided Injury Management training to all managers and supervisors.
During the year a decision was made that KTI will be Smoke Free into the future with an initial target date of 1 January 2015. Posters have been strategically placed on all campuses advising staff, students and visitors of this decision. All recruitment advertisements advise potential staff that KTI will be Smoke Free into the future.
In April 2010 the Institute requested an independent audit of its Safety Management System (SMS) in order to identify areas for improvement. As at the end of 2013 86% of the 21 major recommendations have been implemented including specific OSH inductions for staff and contractors.
There were 19 reported accidents/incidents recorded during 2013. Ten of these involved staff members and the remaining 9 involved damage to vehicles/property. There were no incidents involving students or visitors and there were no cases that required first aid assistance and/or referred for treatment by ambulance or medical practitioners.
Measure Target Actual results
2011 - 2012 2012 - 2013
Number of fatalities 0 0 0
Lost time injury and/or disease incidence rate
0 or 10% improvement on the previous 3 years
3 12
Lost time injury and/or disease severity rate
0 or 10% improvement on the previous 3 years
0 3
% of injured workers returned to work:
. within 13 weeks
. within 26 weeks
Greater than or equal to 80% return to work within 26 weeks
100% 100%
100% 100%
Percentage of managers trained in OSH and injury management responsibilities
Greater than or equal to 80%
95% 98%
Kimberley Training Institute | 2013 Annual Report 102
Attachment 1: Feedback form
You can help us make our Annual Report more useful by providing us with some feedback. Please contribute to our continuous improvement by completing the form below.
First, please tell us a little about you. Are you:
☐ KTI student ☐ KTI staff ☐ VET professional
☐ Job applicant ☐ Kimberley resident ☐ Government employee
☐ Other Please specify: _____________________________________
Why did you read the report?
☐ General interest in KTI ☐ Interested in KTI’s financial position
☐ Community interest in KTI ☐ Applying for a position with KTI
☐ Other Please specify: _____________________________________
Please rate the following aspects of the report using a score where 1 = Poor, 2 = Inadequate, 3 = Satisfactory, 4 = Good, 5 = Excellent
The amount of information provided in the report ☐
The clarity of the information provided in the report ☐
The usefulness of graphs and charts in the report ☐
The overall appearance of the report ☐
Please add any comments about how this report could be improved or what we should do differently next time:
___________________________________________________________________
___________________________________________________________________
___________________________________________________________________
___________________________________________________________________
___________________________________________________________________
___________________________________________________________________
Please return this form to us at: [email protected] or PO Box 1380, Broome, WA 6725