kidney cancer - 2012 report on cancer statistics in ... · 2012 report on cancer statistics in...
TRANSCRIPT

2012 Report on
Cancer Statistics in
Alberta
Kidney Cancer
Surveillance & Reporting
CancerControl AB
February 2015

2012 Report on Cancer Statistics in Alberta 2
Acknowledgements
This report was made possible through Surveillance & Reporting, Cancer Measurement Outcomes Research and Evaluation (C-MORE), CancerControl AB, Alberta Health Services, and the many contributions of individuals across Alberta Health Services as well as external agencies and individuals.
The authors wish to thank individuals working in the following AHS departments and partner agencies for their contributions to this report: Alberta Cancer Registry; Population, Public and Aboriginal Health; Alberta Health and Statistics Canada. Contributions included provision of information, analysis and interpretation, and assistance with consultation sessions and communication of the report.
Report Editor: Dr. Lorraine Shack, Director, Surveillance & Reporting
Project Coordinator: Bethany Kaposhi, Epidemiologist
Analysis and Review: Dr. Zhenguo Qiu, Biostatistician Li Huang, Senior Surveillance Analyst Jingyu Bu, Senior Surveillance Analyst Anthony Karosas, Surveillance Analyst Andrew Min, Assistant Programmer Analyst Lee-Anne Weeks, Analyst Michael Taylor, Senior Analyst Shuang Lu, Senior Surveillance Analyst Ting Liu, Programmer
Design Assistance: Kira Kulicki, Communications Coordinator, Alberta Cancer Clinical Trials
Suggested Citation:
Surveillance & Reporting: 2012 Report on Cancer Statistics in Alberta. Edmonton: CancerControl AB, Alberta Health Services, 2015.
For More Information:
Visit our website: http://www.albertahealthservices.ca/1703.asp

2012 Report on Cancer Statistics in Alberta 3
Table of Contents
Purpose of the Report ................................................................................................................................ 4 Navigating the Report ................................................................................................................................. 4 Data Notes.................................................................................................................................................... 4 Summary ...................................................................................................................................................... 5 Probability of Developing or Dying from Kidney Cancer ........................................................................ 6 Potential Years of Life Lost ........................................................................................................................ 8 Prevalence ................................................................................................................................................... 9 Kidney Cancer Incidence and Mortality .................................................................................................. 10
Kidney Cancer Incidence ...................................................................................................................... 14 Kidney Cancer Mortality ....................................................................................................................... 18
Kidney Cancer Survival ............................................................................................................................ 22 Further Information ................................................................................................................................... 26 References ................................................................................................................................................. 27 Contact Information .................................................................................................................................. 28

2012 Report on Cancer Statistics in Alberta 4
Purpose of the Report Surveillance & Reporting, a specialized team within Cancer Measurement Outcomes Research and Evaluation (C-MORE), Alberta Health Services, actively contributes to Changing our Future: Alberta’s Cancer Plan to 2030. As well, Surveillance & Reporting keenly contributes to the goal of making Alberta a place where most cancers are prevented, more cancers are cured, and suffering is reduced. This is accomplished in part by conducting cancer surveillance through the collection, integration, analysis, and dissemination of cancer-related data and information. The report is designed to provide comprehensive and detailed information regarding cancer in Alberta. It will help support health professionals, researchers and policy makers in the planning, monitoring, and evaluation of cancer-related health programs and initiatives. It will also be a useful education tool for the general public and media.
Navigating the Report This document provides information on kidney cancer (see Appendix for cancer site definitions) statistics in Alberta. Details about other individual cancer types are available within separate documents. The words highlighted in dark blue are terms described in detail in the Glossary within the Appendix document.
Data Notes In this document, the term “cancer” refers to invasive cancers unless otherwise specified. It is important to note that this document contains both actual and estimated data; distinctions are made where applicable. The numbers published in this report should be considered provisional, as a few cases and deaths may be registered in subsequent years. The data in this report reflect the state of the Alberta Cancer Registry as of July 14, 2014. For detailed descriptions about data sources and how they affect data presented in this report, please see the Appendix document.

2012 Report on Cancer Statistics in Alberta 5
Summary
Kidney cancer accounts for 3% of all cancers diagnosed and 3% of all cancer deaths. Approximately 1 in 55 men and 1 in 85 women will be diagnosed with invasive kidney cancer within their lifetime. As of December 31, 2012, approximately 4,350 Albertans were alive who had previously been diagnosed with kidney cancer.
In 2012, there were 483 new cases of kidney cancer in Alberta and 162 deaths due to the disease. Over the past 21 years, from 1992 to 2012*, incidence rates for kidney cancer have remained stable while kidney cancer mortality rates have decreased. Incidence of kidney cancer increases gradually in both males and females after age 30. Incidence rates are higher in males than in females after age 30. Approximately 640 cases of kidney cancer are expected to be diagnosed in 2017.
The five-year relative survival ratio for kidney cancer in Alberta increased from 58% for those diagnosed in 1992 to 1994 to 68% for those diagnosed between 2010 and 2012. This means that those diagnosed in 2010 to 2012 are about 68% as likely to be alive 5 years after their diagnoses as someone of the same age who has not been diagnosed with cancer.
Potential years of life lost (PYLL) is the number of years of life lost when a person dies
prematurely from any cause, based on their life expectancy. In 2012, 2,581 potential years of life were lost due to kidney cancer.
* Year range represents the period over which the most recent significant trend was observed.

2012 Report on Cancer Statistics in Alberta 6
Probability of Developing or Dying from Kidney Cancer
The probability of developing or dying of cancer measures the risk of an individual in a given age range developing or dying of cancer, and is conditional upon the person being kidney cancer-free prior to the beginning of that age range. It is important to note that the probabilities of developing or dying of cancer represent all of Alberta’s population on average and should be interpreted with caution at the individual level as the probabilities will be affected by the risk behaviours and exposures of the individual. In addition, someone diagnosed with cancer has a higher probability of developing another cancer in the future.1
Table 12-1: Probability of Developing Kidney Cancer by Age and Sex, Alberta, 2008-2012
Age Group Males Females Lifetime Risk (all ages) 1 in 55 1 in 85 0 - 20 Less than 1 in 10,000 1 in 5,227 20 - 30 Less than 1 in 10,000 Less than 1 in 10,000 30 - 40 1 in 2,542 1 in 3,504 40 - 50 1 in 849 1 in 1,479 50 - 60 1 in 337 1 in 652 60 - 70 1 in 188 1 in 363 70 - 80 1 in 159 1 in 265 80+ 1 in 137 1 in 211
Data Source: Alberta Cancer Registry, Alberta Health Services The probability of developing kidney cancer increases with age (Table 12-1). Approximately 1 in 55 males and 1 in 85 females will develop invasive kidney cancer in their lifetime. Males have a higher chance of developing kidney cancer than females. On a population basis, the probability of developing kidney cancer by the end of the age range for a kidney cancer-free individual at the beginning of the age range are shown in Table 12-1. For instance, a kidney cancer-free female at age 50 has a 1 in 652 chance of developing kidney cancer by the time she is 60.
2012 Report on Cancer Statistics in Alberta 7
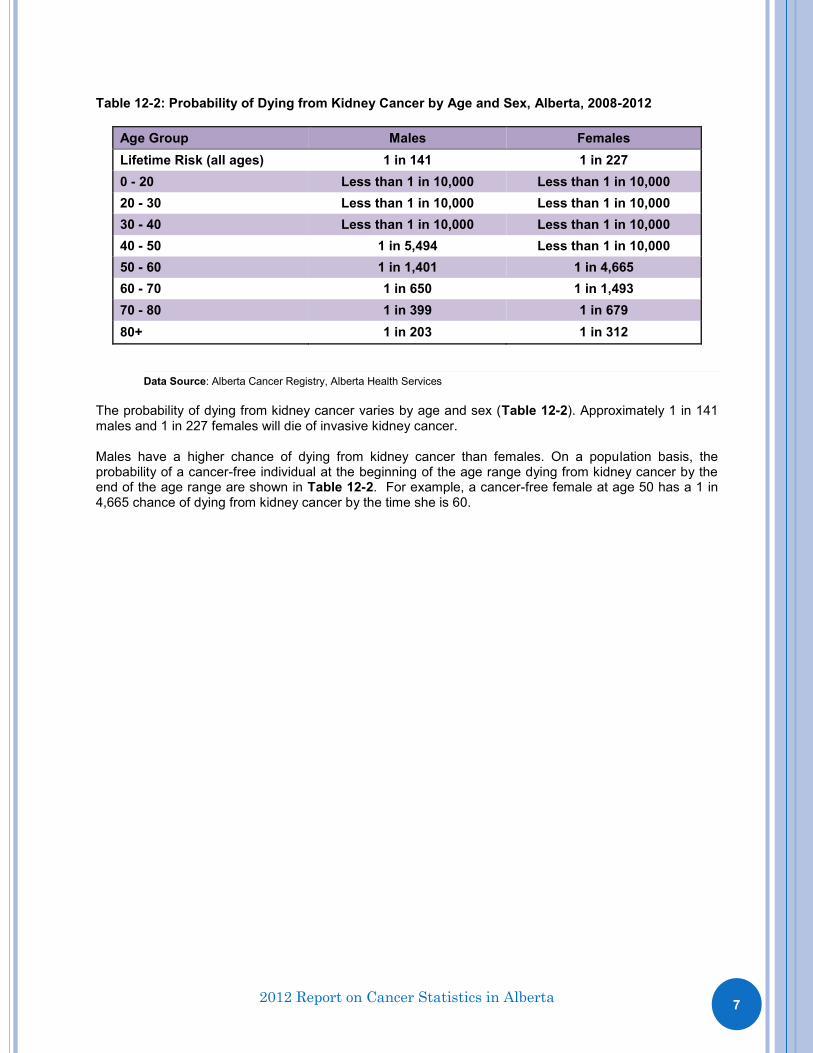
Table 12-2: Probability of Dying from Kidney Cancer by Age and Sex, Alberta, 2008-2012
Age Group Males Females Lifetime Risk (all ages) 1 in 141 1 in 227 0 - 20 Less than 1 in 10,000 Less than 1 in 10,000 20 - 30 Less than 1 in 10,000 Less than 1 in 10,000 30 - 40 Less than 1 in 10,000 Less than 1 in 10,000 40 - 50 1 in 5,494 Less than 1 in 10,000 50 - 60 1 in 1,401 1 in 4,665 60 - 70 1 in 650 1 in 1,493 70 - 80 1 in 399 1 in 679 80+ 1 in 203 1 in 312
Data Source: Alberta Cancer Registry, Alberta Health Services The probability of dying from kidney cancer varies by age and sex (Table 12-2). Approximately 1 in 141 males and 1 in 227 females will die of invasive kidney cancer. Males have a higher chance of dying from kidney cancer than females. On a population basis, the probability of a cancer-free individual at the beginning of the age range dying from kidney cancer by the end of the age range are shown in Table 12-2. For example, a cancer-free female at age 50 has a 1 in 4,665 chance of dying from kidney cancer by the time she is 60.
2012 Report on Cancer Statistics in Alberta 8
Potential Years of Life Lost
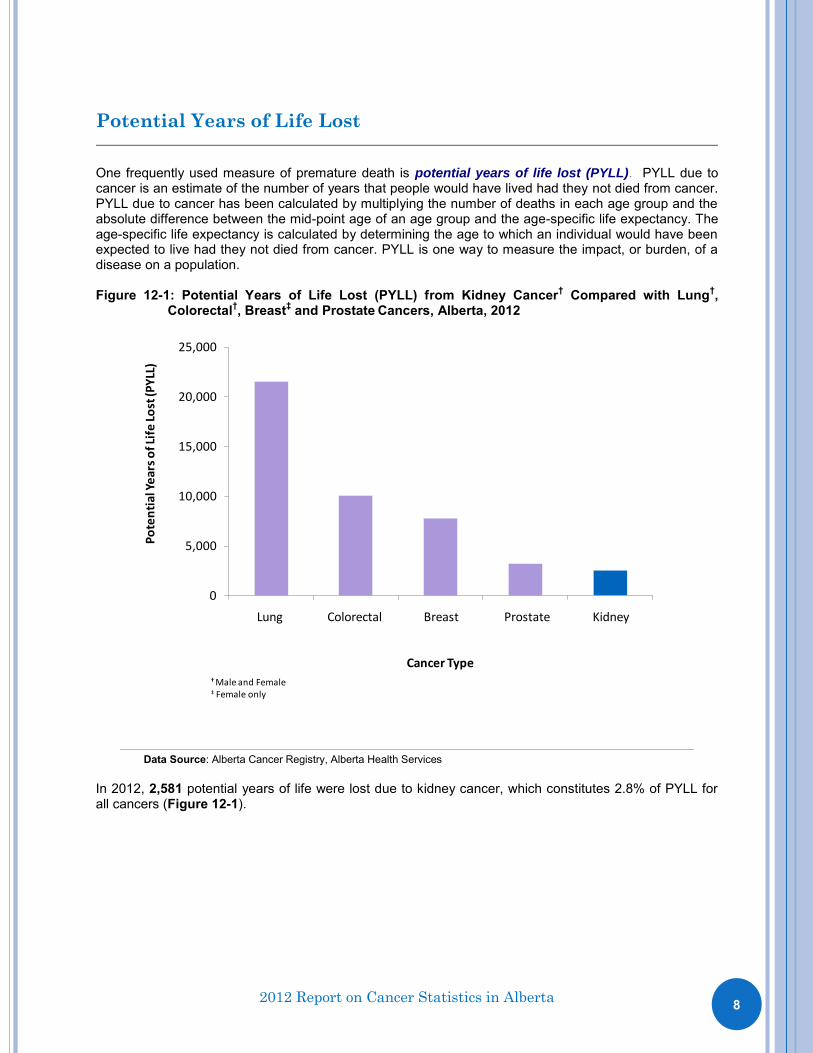
One frequently used measure of premature death is potential years of life lost (PYLL). PYLL due to cancer is an estimate of the number of years that people would have lived had they not died from cancer. PYLL due to cancer has been calculated by multiplying the number of deaths in each age group and the absolute difference between the mid-point age of an age group and the age-specific life expectancy. The age-specific life expectancy is calculated by determining the age to which an individual would have been expected to live had they not died from cancer. PYLL is one way to measure the impact, or burden, of a disease on a population. Figure 12-1: Potential Years of Life Lost (PYLL) from Kidney Cancer† Compared with Lung†,
Colorectal†, Breast‡ and Prostate Cancers, Alberta, 2012
0
5,000
10,000
15,000
20,000
25,000
Lung Colorectal Breast Prostate Kidney
Po
ten
tial
Ye
ars
of L
ife
Lo
st (P
YLL
)
Cancer Type†Male and Female‡ Female only
Data Source: Alberta Cancer Registry, Alberta Health Services
In 2012, 2,581 potential years of life were lost due to kidney cancer, which constitutes 2.8% of PYLL for all cancers (Figure 12-1).

2012 Report on Cancer Statistics in Alberta 9
Prevalence
The prevalence of a disease is defined as the number of people alive who had been previously diagnosed with that disease.
Limited-duration kidney cancer prevalence represents the number of people alive on a certain day who had previously been diagnosed with kidney cancer within a specified number of years (e.g. 2, 5, 10 or 20 years) while complete kidney cancer prevalence represents the proportion of people alive on a certain day who had previously been diagnosed with kidney cancer, regardless of how long ago the diagnosis was.2
In this section of the report, both limited-duration and complete kidney cancer prevalence are presented; the latter describing the number of people alive as of December 31, 2012 who had ever been diagnosed with kidney cancer.
Prevalence is a useful indicator of the impact of cancer on individuals, the healthcare system, and the community as a whole. Although many cancer survivors lead healthy and productive lives, the experience can have a strong impact on the physical and emotional well-being of individuals and their families. The cancer experience can also result in the continued use of the healthcare system through rehabilitation or support services, as well as loss of work productivity, which can affect the whole community.
As of December 31, 2012, approximately 4,350 Albertans were alive who had previously been diagnosed with kidney cancer (Table 12-3). In addition, there were 750 Albertans alive who had been diagnosed with kidney cancer within the previous two years. The two year time period is significant because most definitive cancer treatments will occur within two years of diagnosis. Table 12-3: Limited-Duration and Complete Prevalence for Kidney Cancer, Both Sexes, Alberta,
2012
Duration Prevalence (#)
2-Year 750 5-Year 1,700 10-Year 2,750 20-Year 3,800 Complete (Ever Diagnosed) 4,350
Data Source: Alberta Cancer Registry, Alberta Health Services

2012 Report on Cancer Statistics in Alberta 10
Kidney Cancer Incidence and Mortality
Introduction Incidence counts are the number of new cancer cases diagnosed during a specific time period in a specific population. In this section of the report, incidence counts refer to the number of new kidney cancer diagnoses in Alberta residents in a calendar year. Incidence rates are the number of new cancer cases diagnosed per 100,000 in the population, in a specific time period. Mortality counts describe the number of deaths attributed to cancer during a specific period of time in a specific population. In this section of the report, mortality refers to the number of deaths due to kidney cancer in Alberta residents in a calendar year, regardless of date of diagnosis. Mortality rates are the number of deaths per 100,000 in the population, in a specific time period. In order to compare cancer incidence or cancer mortality over time, or between populations, age-standardized incidence rates (ASIRs) or age-standardized mortality rates (ASMRs) are presented. These are weighted averages of age-specific rates using a standard population. These rates are useful because they are adjusted for differences in age distributions in a population over time, which permit comparisons of cancer incidence or mortality among populations that differ in size, structure, and/or time period. ASIRs and ASMRs give the overall incidence and mortality rates that would have occurred if the population of Alberta had been the same as the standard population. In this report the Canadian 1991 standard population is used. Three-year moving averages are used to smooth out year-to-year fluctuations so that the underlying trend may be more easily observed. They are calculated based on aggregating three years of data. Age-standardized incidence rates (ASIRs) and age-standardized mortality rates (ASMRs) are presented as three-year moving averages; therefore, information can only be presented for 1993-2011. This smoothing of trends is especially important when the number of cancer cases per year is relatively small and where year-to-year variability can be quite large. Incidence and mortality can be affected by the implementation of public health prevention or screening strategies that either prevent disease or find cancer in its early stages when treatment is generally more successful. Incidence and mortality are also affected by the development of cancer treatment programs, which may impact chances of survival and research innovations. The following figures show incidence and mortality trends in Alberta. Separate analyses for both incidence and mortality are shown in subsequent sections. The statistical significance* of the trends was determined by using Joinpoint3 and is described in the text accompanying each graph. Joinpoint models are based on yearly rates; hence there may be slight differences in the rates presented in the text (from Joinpoint model) and the graphs (where ASIRs and ASMRs are shown as three-year moving averages).
* Throughout this report, the use of the word significant refers to statistical significance at an alpha level of 0.05 (i.e. 95%CI).

2012 Report on Cancer Statistics in Alberta 11
Figure 12-2: Age-Standardized Incidence Rates (ASIRs)*† and Mortality Rates (ASMRs)*† with 95% Confidence Intervals (CI) for Kidney Cancer, Both Sexes, Alberta, 1992-2012
0
5
10
15
20
1992 1994 1996 1998 2000 2002 2004 2006 2008 2010 2012
Rat
e p
er
10
0,0
00
Year
ASIR
ASMR
* Three-year moving average.† Standardized to 1991 Canadian population.
Data Source: Alberta Cancer Registry, Alberta Health Services; Alberta Health
Kidney cancer ASIRs for both sexes have not changed significantly since 1992 (Figure 12-2). In 2012, the ASIR for kidney cancer for both sexes was 11.4 per 100,000 in the population. Kidney cancer mortality rates are lower than incidence rates (Figure 12-2). Kidney cancer ASMRs for both sexes have decreased significantly between 1992 and 2012 by 1.2% annually. In 2012, the ASMR for kidney cancer in both sexes was 3.8 per 100,000 in the population.
2012 Report on Cancer Statistics in Alberta 12
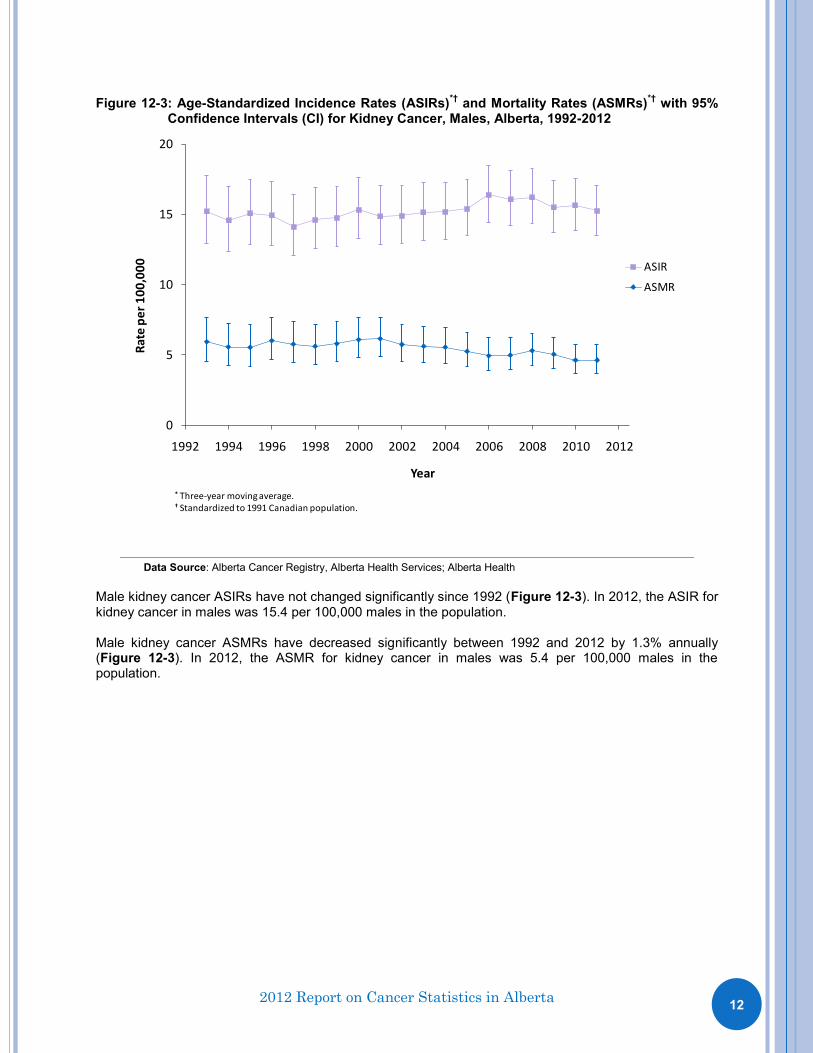
Figure 12-3: Age-Standardized Incidence Rates (ASIRs)*† and Mortality Rates (ASMRs)*† with 95% Confidence Intervals (CI) for Kidney Cancer, Males, Alberta, 1992-2012
0
5
10
15
20
1992 1994 1996 1998 2000 2002 2004 2006 2008 2010 2012
Rat
e p
er
10
0,0
00
Year
ASIR
ASMR
* Three-year moving average.† Standardized to 1991 Canadian population.
Data Source: Alberta Cancer Registry, Alberta Health Services; Alberta Health
Male kidney cancer ASIRs have not changed significantly since 1992 (Figure 12-3). In 2012, the ASIR for kidney cancer in males was 15.4 per 100,000 males in the population. Male kidney cancer ASMRs have decreased significantly between 1992 and 2012 by 1.3% annually (Figure 12-3). In 2012, the ASMR for kidney cancer in males was 5.4 per 100,000 males in the population.

2012 Report on Cancer Statistics in Alberta 13
Figure 12-4: Age-Standardized Incidence Rates (ASIRs)*† and Mortality Rates (ASMRs)*† with 95% Confidence Intervals (CI) for Kidney Cancer, Females, Alberta, 1992-2012
0
5
10
15
20
1992 1994 1996 1998 2000 2002 2004 2006 2008 2010 2012
Rat
e p
er
10
0,0
00
Year
ASIR
ASMR
* Three-year moving average.† Standardized to 1991 Canadian population.
Data Source: Alberta Cancer Registry, Alberta Health Services; Alberta Health
Female kidney cancer ASIRs have not changed significantly since 1992 (Figure 12-4). In 2012, the ASIR for kidney cancer in females was 7.5 per 100,000 females in the population. Female kidney ASMRs have not changed significantly since 1992 (Figure 12-4). In 2012, the ASMR for kidney cancer in females was 2.3 per 100,000 females in the population.
2012 Report on Cancer Statistics in Alberta 14
Kidney Cancer Incidence The following three figures (Figures 12-5 to 12-7) provide information on kidney cancer incidence in Alberta. The number of new cancer cases in Alberta is affected not only by changes in the underlying risk of developing kidney cancer, but also by the changes in the age structure and growth of the population. In order to compare trends over time, age-standardized incidence rates (ASIRs) are provided. In Figures 12-5 and 12-6 observed age standardized incidence rates are shown for 1992 to 2011 (three-year moving averages), projected rates for 2012 to 2017, and observed numbers of new kidney cancer cases are shown for the years 1992 to 2012 and projected numbers for 2013 to 2017. The projected cancer numbers were calculated by applying the estimated age-specific cancer incidence rates to the projected age-specific population figures provided by Alberta Health.4 These were observed up to 2011 (due to the use of three-year moving averages) and estimated for 2012 to 2017. Caution should be exercised when comparing Canada5 and Alberta rates as Canadian rates are yearly rates while Alberta rates are three-year moving averages. The estimated kidney cancer incidence rates were calculated by extrapolating the historical trends in age-specific rate based on data from 1987 to 2011.
2012 Report on Cancer Statistics in Alberta 15
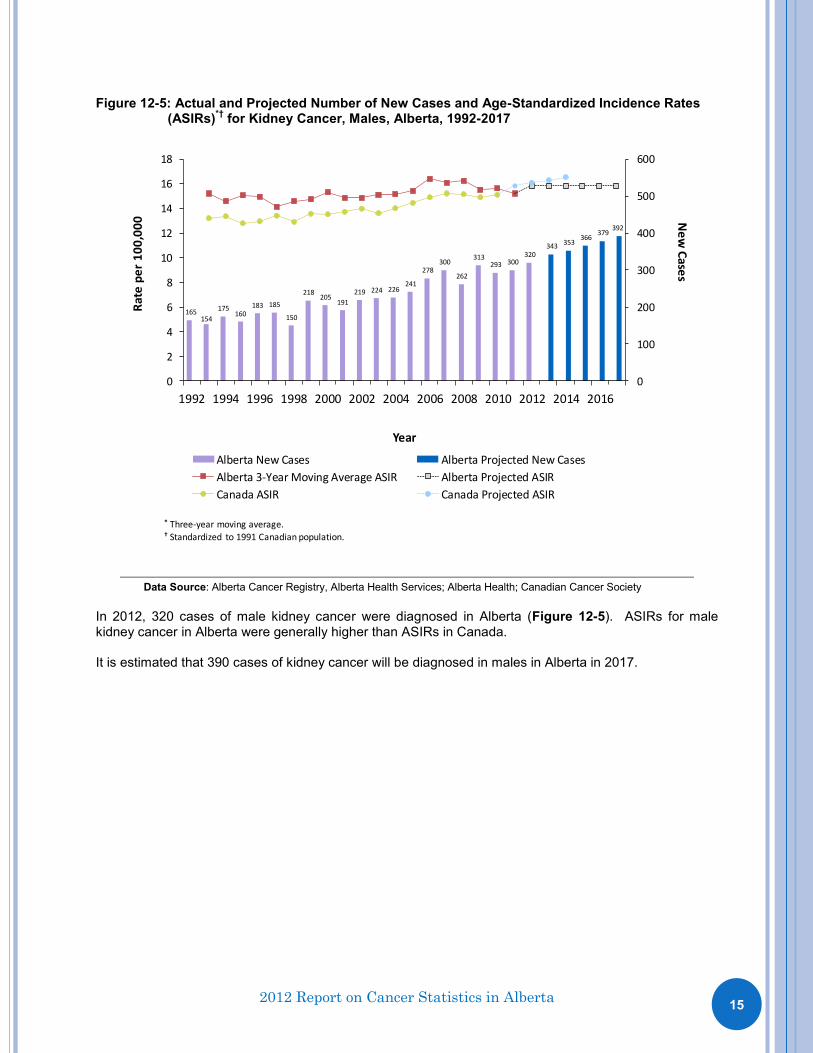
Figure 12-5: Actual and Projected Number of New Cases and Age-Standardized Incidence Rates (ASIRs)*† for Kidney Cancer, Males, Alberta, 1992-2017
165154
175160
183 185
150
218205
191
219 224 226241
278300
262
313293 300
320343 353
366379
392
0
100
200
300
400
500
600
0
2
4
6
8
10
12
14
16
18
1992 1994 1996 1998 2000 2002 2004 2006 2008 2010 2012 2014 2016
Ne
w C
ases
Rat
e p
er
10
0,0
00
Year
Alberta New Cases Alberta Projected New Cases
Alberta 3-Year Moving Average ASIR Alberta Projected ASIR
Canada ASIR Canada Projected ASIR
* Three-year moving average.† Standardized to 1991 Canadian population.
Data Source: Alberta Cancer Registry, Alberta Health Services; Alberta Health; Canadian Cancer Society
In 2012, 320 cases of male kidney cancer were diagnosed in Alberta (Figure 12-5). ASIRs for male kidney cancer in Alberta were generally higher than ASIRs in Canada. It is estimated that 390 cases of kidney cancer will be diagnosed in males in Alberta in 2017.

2012 Report on Cancer Statistics in Alberta 16
Figure 12-6: Actual and Projected Number of New Cases and Age-Standardized Incidence Rates (ASIRs)*† for Kidney Cancer, Females, Alberta, 1992-2017
9780
102 111 114 107 114 109
138125
140129
147126
163
192181
169 179190
163
212 219 228 237 246
0
100
200
300
400
500
600
0
2
4
6
8
10
12
14
16
18
1992 1994 1996 1998 2000 2002 2004 2006 2008 2010 2012 2014 2016
New
CasesR
ate
per
100,
000
Year
Alberta New Cases Alberta Projected New Cases
Alberta 3-Year Moving Average ASIR Alberta Projected ASIR
Canada ASIR Canada Projected ASIR
* Three-year moving average.† Standardized to 1991 Canadian population.
Data Source: Alberta Cancer Registry, Alberta Health Services; Alberta Health; Canadian Cancer Society
In 2012, 163 cases of female kidney cancer were diagnosed in Alberta (Figure 12-6). Overall, ASIRs for female kidney cancer in Alberta were generally higher than ASIRs in Canada. It is estimated that 250 cases of kidney cancer will be diagnosed in females in Alberta in 2017.

2012 Report on Cancer Statistics in Alberta 17
Figure 12-7: Age-Specific Incidence Rates for Kidney Cancer by Sex, Alberta, 2008-2012
0
20
40
60
80
100
0 20 40 60 80 100
Rat
e p
er
10
0,0
00
Age (Years)
Male
Female
Data Source: Alberta Cancer Registry, Alberta Health Services; Alberta Health
Incidence rates of kidney cancer differ by age and sex (Figure 12-7). Age-specific incidence rates for kidney cancer in both males and females increase gradually after age 30. Female rates tend to be lower than male rates, with the difference gradually increasing with age. Female incidence rates tend to level off at age 70, whereas male incidence rates tend to level off at age 80.

2012 Report on Cancer Statistics in Alberta 18
Kidney Cancer Mortality The following three figures (Figures 12-8 to 12-10) provide information on kidney cancer mortality in Alberta. The number of deaths in Alberta is affected not only by changes in the underlying risk of dying from kidney cancer, but also by the changes in the age structure and growth of the population. In order to compare trends over time, age-standardized mortality rates (ASMRs) are provided. In Figures 12-8 and 12-9 observed age standardized mortality rates are shown for 1992 to 2011 (three-year moving averages), projected rates for 2012 to 2017, and observed numbers of kidney cancer deaths are shown for the years 1992 to 2012 and projected numbers for 2013 to 2017. The projected numbers of cancer deaths were calculated by applying the estimated age-specific cancer mortality rates to the age-specific population figures provided by Alberta Health.4 These were observed up to 2011 (due to the use of three-year moving averages) and estimated for 2012 to 2017. Caution should be exercised when comparing Canada5 and Alberta rates as Canadian rates are yearly rates while Alberta rates are three-year moving averages. The estimated kidney cancer mortality rates were calculated by extrapolating the historical trends in age-specific rate based on data from 1987 to 2011.
2012 Report on Cancer Statistics in Alberta 19
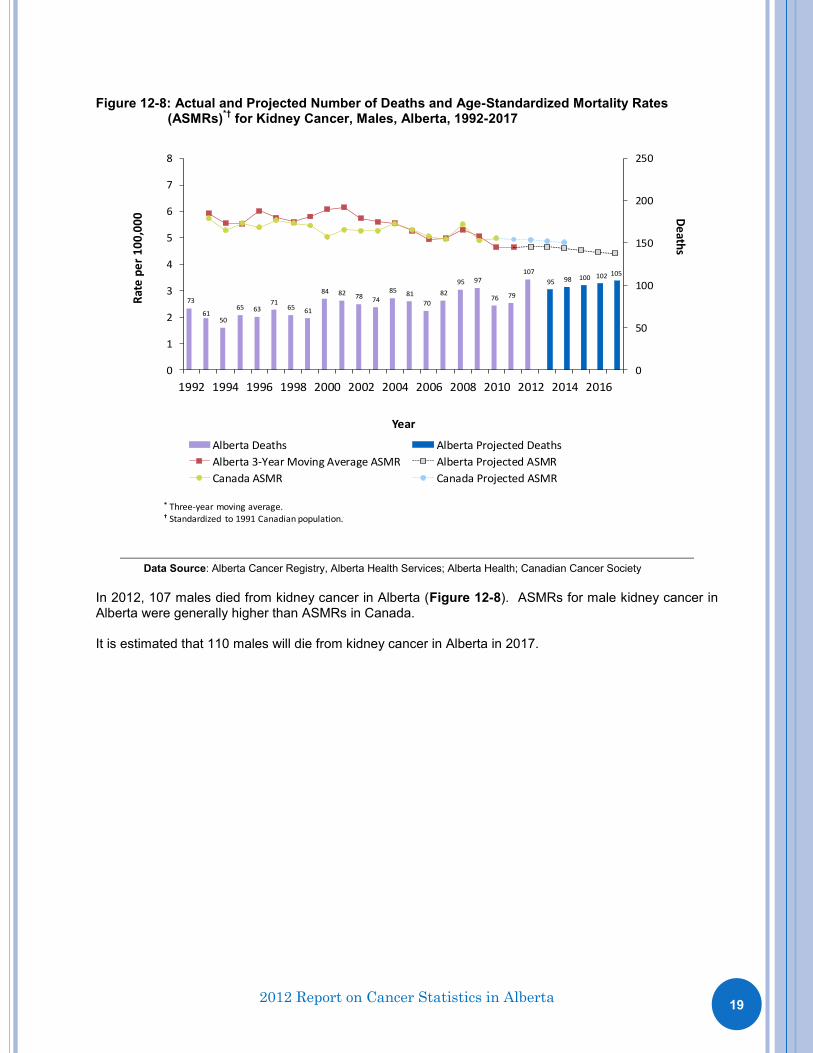
Figure 12-8: Actual and Projected Number of Deaths and Age-Standardized Mortality Rates (ASMRs)*† for Kidney Cancer, Males, Alberta, 1992-2017
73
6150
65 6371
65 61
84 82 78 74
85 81
70
82
95 97
76 79
107
95 98 100 102 105
0
50
100
150
200
250
0
1
2
3
4
5
6
7
8
1992 1994 1996 1998 2000 2002 2004 2006 2008 2010 2012 2014 2016
De
aths
Rat
e p
er
10
0,0
00
Year
Alberta Deaths Alberta Projected Deaths
Alberta 3-Year Moving Average ASMR Alberta Projected ASMR
Canada ASMR Canada Projected ASMR
* Three-year moving average.† Standardized to 1991 Canadian population.
Data Source: Alberta Cancer Registry, Alberta Health Services; Alberta Health; Canadian Cancer Society
In 2012, 107 males died from kidney cancer in Alberta (Figure 12-8). ASMRs for male kidney cancer in Alberta were generally higher than ASMRs in Canada. It is estimated that 110 males will die from kidney cancer in Alberta in 2017.

2012 Report on Cancer Statistics in Alberta 20
Figure 12-9: Actual and Projected Number of Deaths and Age-Standardized Mortality Rates (ASMRs)*† for Kidney Cancer, Females, Alberta, 1992-2017
40 4029
22
4035
48 48
35
46 44
5357
33
5348
57
4549
40
55 52 54 55 56 57
0
50
100
150
200
0
1
2
3
4
1992 1994 1996 1998 2000 2002 2004 2006 2008 2010 2012 2014 2016
De
aths
Rat
e p
er
10
0,0
00
Year
Alberta Deaths Alberta Projected Deaths
Alberta 3-Year Moving Average ASMR Alberta Projected ASMR
Canada ASMR Canada Projected ASMR
* Three-year moving average.† Standardized to 1991 Canadian population.
Data Source: Alberta Cancer Registry, Alberta Health Services; Alberta Health; Canadian Cancer Society
In 2012, 55 females died from kidney cancer in Alberta (Figure 12-9). ASMRs for female kidney cancer in Alberta were similar to ASMRs in Canada. It is estimated that 60 females will die from kidney cancer in Alberta in 2017.

2012 Report on Cancer Statistics in Alberta 21
Figure 12-10: Age-Specific Mortality Rates for Kidney Cancer by Sex, Alberta, 2008-2012
0
20
40
60
80
100
0 20 40 60 80 100
Rat
e p
er
10
0,0
00
Age (Years)
Male
Female
Data Source: Alberta Cancer Registry, Alberta Health Services; Alberta Health
Kidney cancer mortality rates differ by age and sex (Figure 12-10). Age-specific mortality rates for male kidney cancer increase after about age 35, whereas they begin increasing after about age 45 for females. Female rates are lower than male rates after age 35. The highest kidney cancer mortality rates occur in the older age groups.

2012 Report on Cancer Statistics in Alberta 22
Kidney Cancer Survival
Cancer survival ratios indicate the proportion of people who will be alive at a given time after they have been diagnosed with cancer. Survival is an important outcome measure and is used for evaluating the effectiveness of cancer control programs. Survival depends on several factors including the cancer type (most importantly site, stage, and morphology at diagnosis), sex, age at diagnosis, health status, and available treatments for that cancer. While relative survival ratios (RSRs) give a general expectation of survival over the whole province, these ratios may not apply to individual cases. Individual survival outcomes depend on the stage at diagnosis, treatment, and other individual circumstances. Relative survival ratios are estimated by comparing the survival of cancer patients with that expected in the general population of Albertans of the same age, sex, and in the same calendar year.6 In this section of the report, RSRs are standardized by the age structure in the standard population (i.e. all persons who were diagnosed with that cancer in Canada between 1992 and 2001) to permit RSRs to be compared over time, independent of differences in age distribution of cancer cases. RSRs are estimated by the cohort method 6 when complete follow-up data (e.g., at least five years of follow-up to estimate the five-year rate) after diagnosis are available. For recently diagnosed cases, whose complete follow-up data are not available, the up-to-date estimates are computed using the period method.7 However, comparison between cohort and period RSRs should be interpreted with caution because of the two different methods used to derive the respective ratios. The relative survival ratio is usually expressed as a percentage (%) and the closer the value is to 100%, the more similar the survival pattern is to the general population.

2012 Report on Cancer Statistics in Alberta 23
Figure 12-11: Age-Standardized One, Three and Five-Year Relative Survival Ratios with 95% Confidence Intervals (CI) for Kidney Cancer, Both Sexes, Alberta, 1992-1994^, 1998-2000^ and 2004-2006^, 2010-2012*
0
20
40
60
80
100
1 year 3 year 5 year
Re
lati
ve S
urv
ival
(%
)
Years After Diagnosis
1992-1994
1998-2000
2004-2006
2010-2012
^ Ratios calculated by cohort method, where complete follow-up data are available.
* Ratios calculated by period method, where complete follow-up data are not available.
Data Source: Alberta Cancer Registry, Alberta Health Services; Statistics Canada
The five-year relative survival ratio for individuals diagnosed with kidney cancer in the period of 2010 to 2012 is estimated to be 68%. The five-year relative survival ratio for individuals diagnosed with kidney cancer in Alberta has improved from 2010 - 2012 compared to those diagnosed in the 1992 to 1994 cohort years (Figure 12-11).
2012 Report on Cancer Statistics in Alberta 24
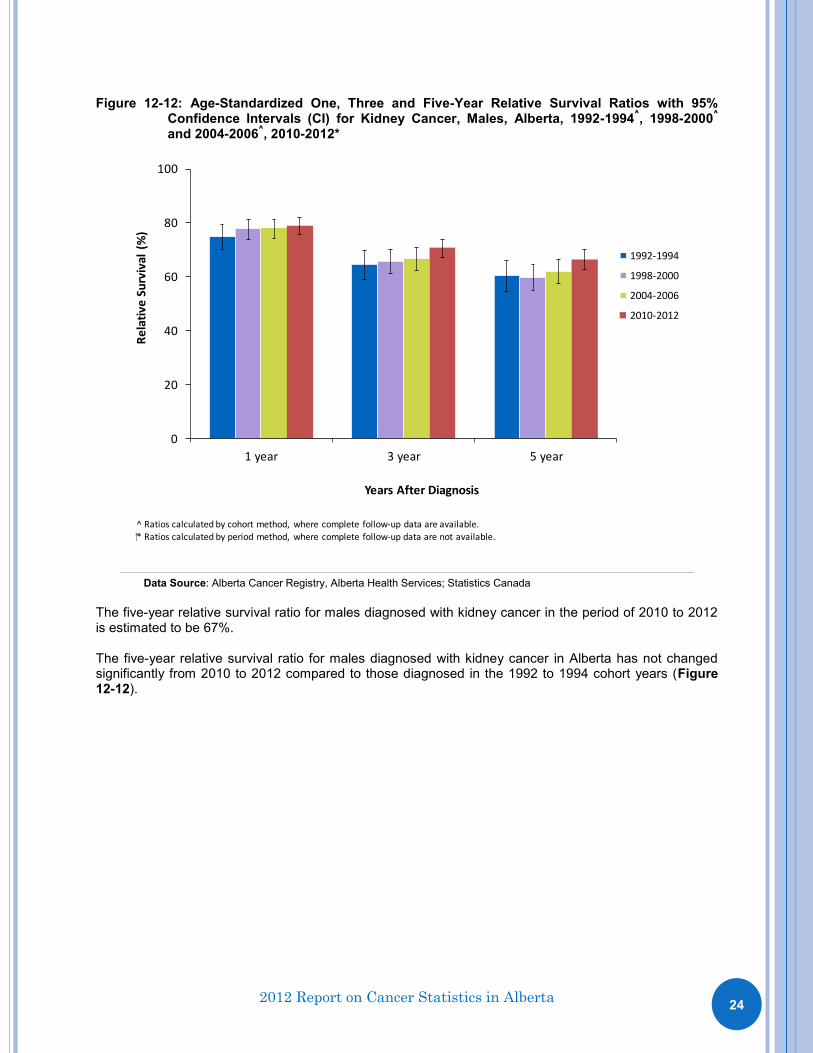
Figure 12-12: Age-Standardized One, Three and Five-Year Relative Survival Ratios with 95% Confidence Intervals (CI) for Kidney Cancer, Males, Alberta, 1992-1994^, 1998-2000^ and 2004-2006^, 2010-2012*
0
20
40
60
80
100
1 year 3 year 5 year
Re
lati
ve S
urv
ival
(%
)
Years After Diagnosis
1992-1994
1998-2000
2004-2006
2010-2012
^ Ratios calculated by cohort method, where complete follow-up data are available.
* Ratios calculated by period method, where complete follow-up data are not available.
Data Source: Alberta Cancer Registry, Alberta Health Services; Statistics Canada
The five-year relative survival ratio for males diagnosed with kidney cancer in the period of 2010 to 2012 is estimated to be 67%. The five-year relative survival ratio for males diagnosed with kidney cancer in Alberta has not changed significantly from 2010 to 2012 compared to those diagnosed in the 1992 to 1994 cohort years (Figure 12-12).

2012 Report on Cancer Statistics in Alberta 25
Figure 12-13: Age-Standardized One, Three and Five-Year Relative Survival Ratios with 95% Confidence Intervals (CI) for Kidney Cancer, Females, Alberta, 1992-1994^, 1998-2000^ and 2004-2006^, 2010-2012*
0
20
40
60
80
100
1 year 3 year 5 year
Re
lati
ve S
urv
ival
(%
)
Years After Diagnosis
1992-1994
1998-2000
2004-2006
2010-2012
^ Ratios calculated by cohort method, where complete follow-up data are available.
* Ratios calculated by period method, where complete follow-up data are not available.
Data Source: Alberta Cancer Registry, Alberta Health Services; Statistics Canada
The five-year relative survival ratio for females diagnosed with kidney cancer in the period of 2010 to 2012 is estimated to be 71%. The five-year relative survival ratios for females diagnosed with kidney cancer from 2010 to 2012 has improved compared to those diagnosed in the 1992 to 1994 cohort years (Figure 12-13).
2012 Report on Cancer Statistics in Alberta 26
Further Information
Further information is available on a separate document, the Appendix:
Appendix 1: Glossary of Terms Appendix 2: Cancer Definitions Appendix 3: Data Notes

2012 Report on Cancer Statistics in Alberta 27
References
1. Okamoto N, Morio S, Inoue R and Akiyama K. The risk of a second primary cancer occurring in
five-year survivors of an initial cancer. Jpn. J Clin Oncol, 1987; 17(3):205-213.
2. National Cancer Institute - Surveillance Epidemiology and End Results [Internet]. USA. National Institutes of Health; Cancer Prevalence Statistics Overview; 2014 Apr 10 [cited 2014 Nov 6]; Available from: http://surveillance.cancer.gov/prevalence/
3. Kim H-J, Fay M and Feuer E. Permutation tests for JoinPoint regression with applications to
cancer rates. Stat Med, 2000; 19:335-351.
4. 2012 Alberta Population Data [Excel Spreadsheet]. Edmonton (Alberta): Alberta Health; 2014.
5. Canadian Cancer Society’s Steering Committee: Canadian Cancer Statistics 2014. Toronto: Canadian Cancer Society, 2014.
6. Ederer F, Axtell LM and Cutler SJ. The relative survival rate: a statistical methodology. Natl Cancer Inst Monogr, 1961; 6: 101-121.
7. Brennera H, Gefellerb O and Hakulinen T. Period analysis for ‘up-to-date’ cancer survival data: theory, empirical evaluation, computational realisation and applications. European Journal of Cancer, 2004; 40: 326-335.

2012 Report on Cancer Statistics in Alberta 28
Contact Information
If further information is required, please contact Surveillance & Reporting, C-MORE, Alberta Health Services as follows: Mailing Address:
Alberta Health Services Surveillance & Reporting C-MORE 1400 - 10123-99 Street Edmonton, AB, Canada T5J 3H1
Phone: 780-643-4347 Fax: 780-643-4380 Email: [email protected]