keybank eb managed guaranteed investment contract fund ... › kco › images ›...
TRANSCRIPT
KeyBank EB Managed Guaranteed Investment Contract Fund KeyBank National Association Annual Report December 31, 2019
TABLE OF CONTENTSKEYBANK EB MANAGED GUARANTEED INVESTMENT CONTRACT FUNDKEYBANK NATIONAL ASSOCIATIONYear Ended December 31, 2019
Report of Independent Auditors................................................................................................................... 1
Financial Statements
Statement of Net Assets............................................................................................................................... 2Statements of Operations and Changes in Net Assets.................................................................................. 3Schedule of Investments Held...................................................................................................................... 4Notes to Financial Statements...................................................................................................................... 9
Supplementary Information
Investment Purchased ................................................................................................................................. 18Investments Sold or Matured....................................................................................................................... 19
1
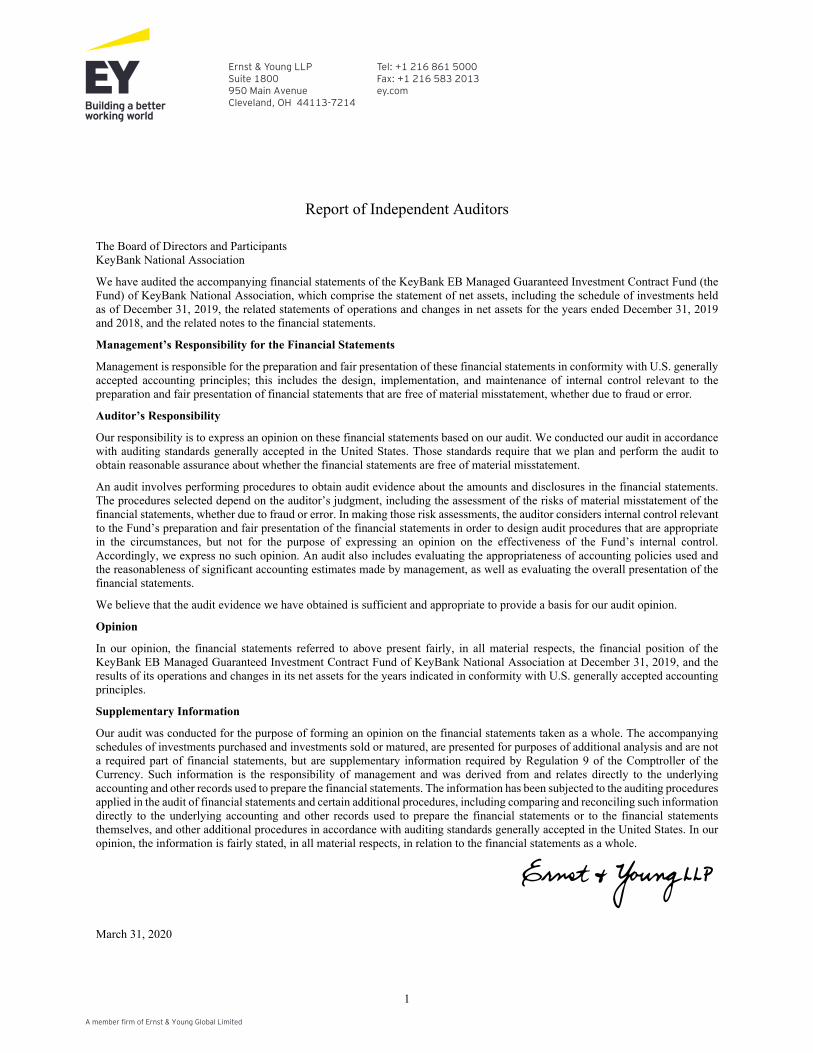
Report of Independent Auditors
The Board of Directors and Participants KeyBank National Association
We have audited the accompanying financial statements of the KeyBank EB Managed Guaranteed Investment Contract Fund (the Fund) of KeyBank National Association, which comprise the statement of net assets, including the schedule of investments held as of December 31, 2019, the related statements of operations and changes in net assets for the years ended December 31, 2019 and 2018, and the related notes to the financial statements.
Management’s Responsibility for the Financial Statements
Management is responsible for the preparation and fair presentation of these financial statements in conformity with U.S. generally accepted accounting principles; this includes the design, implementation, and maintenance of internal control relevant to the preparation and fair presentation of financial statements that are free of material misstatement, whether due to fraud or error.
Auditor’s Responsibility
Our responsibility is to express an opinion on these financial statements based on our audit. We conducted our audit in accordance with auditing standards generally accepted in the United States. Those standards require that we plan and perform the audit to obtain reasonable assurance about whether the financial statements are free of material misstatement.
An audit involves performing procedures to obtain audit evidence about the amounts and disclosures in the financial statements. The procedures selected depend on the auditor’s judgment, including the assessment of the risks of material misstatement of the financial statements, whether due to fraud or error. In making those risk assessments, the auditor considers internal control relevant to the Fund’s preparation and fair presentation of the financial statements in order to design audit procedures that are appropriate in the circumstances, but not for the purpose of expressing an opinion on the effectiveness of the Fund’s internal control. Accordingly, we express no such opinion. An audit also includes evaluating the appropriateness of accounting policies used and the reasonableness of significant accounting estimates made by management, as well as evaluating the overall presentation of the financial statements.
We believe that the audit evidence we have obtained is sufficient and appropriate to provide a basis for our audit opinion.
Opinion
In our opinion, the financial statements referred to above present fairly, in all material respects, the financial position of the KeyBank EB Managed Guaranteed Investment Contract Fund of KeyBank National Association at December 31, 2019, and the results of its operations and changes in its net assets for the years indicated in conformity with U.S. generally accepted accounting principles.
Supplementary Information
Our audit was conducted for the purpose of forming an opinion on the financial statements taken as a whole. The accompanying schedules of investments purchased and investments sold or matured, are presented for purposes of additional analysis and are not a required part of financial statements, but are supplementary information required by Regulation 9 of the Comptroller of the Currency. Such information is the responsibility of management and was derived from and relates directly to the underlying accounting and other records used to prepare the financial statements. The information has been subjected to the auditing procedures applied in the audit of financial statements and certain additional procedures, including comparing and reconciling such information directly to the underlying accounting and other records used to prepare the financial statements or to the financial statements themselves, and other additional procedures in accordance with auditing standards generally accepted in the United States. In our opinion, the information is fairly stated, in all material respects, in relation to the financial statements as a whole.
EY March 31, 2020
A member firm of Ernst & Young Global Limited
Ernst & Young LLP Suite 1800 950 Main Avenue Cleveland, OH 44113-7214
Tel: +1 216 861 5000 Fax: +1 216 583 2013 ey.com
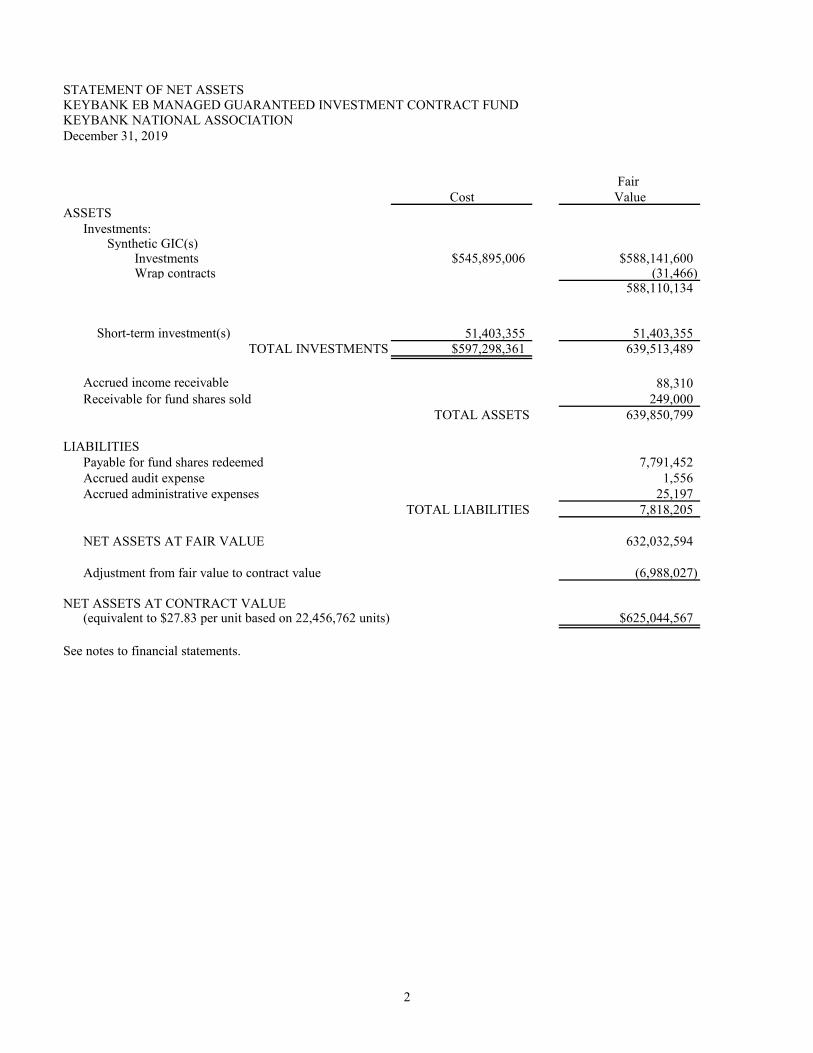
STATEMENT OF NET ASSETS KEYBANK EB MANAGED GUARANTEED INVESTMENT CONTRACT FUNDKEYBANK NATIONAL ASSOCIATIONDecember 31, 2019
Fair Cost Value
ASSETSInvestments: Synthetic GIC(s)
Investments $545,895,006 $588,141,600 Wrap contracts (31,466)
588,110,134
Short-term investment(s) 51,403,355 51,403,355TOTAL INVESTMENTS $597,298,361 639,513,489
Accrued income receivable 88,310Receivable for fund shares sold 249,000
TOTAL ASSETS 639,850,799
LIABILITIESPayable for fund shares redeemed 7,791,452Accrued audit expense 1,556Accrued administrative expenses 25,197
TOTAL LIABILITIES 7,818,205
NET ASSETS AT FAIR VALUE 632,032,594
Adjustment from fair value to contract value (6,988,027)
NET ASSETS AT CONTRACT VALUE (equivalent to $27.83 per unit based on 22,456,762 units) $625,044,567
See notes to financial statements.
2
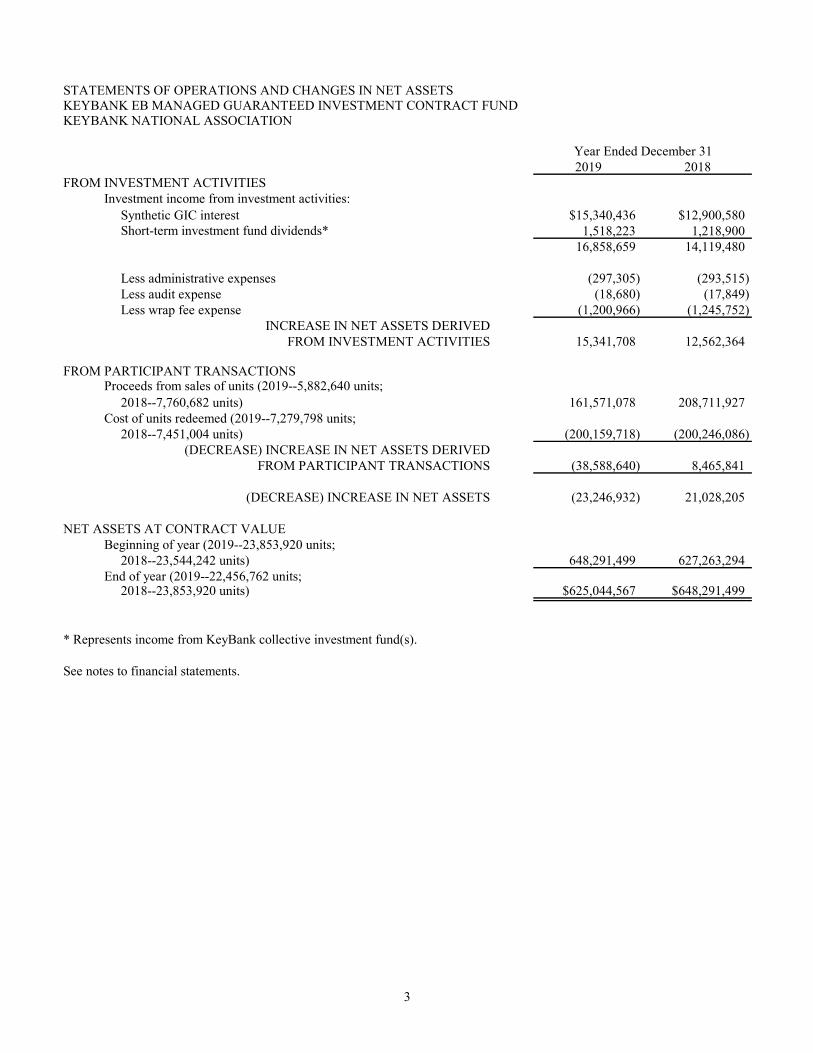
STATEMENTS OF OPERATIONS AND CHANGES IN NET ASSETSKEYBANK EB MANAGED GUARANTEED INVESTMENT CONTRACT FUNDKEYBANK NATIONAL ASSOCIATION
Year Ended December 312019 2018
FROM INVESTMENT ACTIVITIESInvestment income from investment activities: Synthetic GIC interest $15,340,436 $12,900,580 Short-term investment fund dividends* 1,518,223 1,218,900
16,858,659 14,119,480
Less administrative expenses (297,305) (293,515) Less audit expense (18,680) (17,849) Less wrap fee expense (1,200,966) (1,245,752)
INCREASE IN NET ASSETS DERIVEDFROM INVESTMENT ACTIVITIES 15,341,708 12,562,364
FROM PARTICIPANT TRANSACTIONSProceeds from sales of units (2019--5,882,640 units; 2018--7,760,682 units) 161,571,078 208,711,927Cost of units redeemed (2019--7,279,798 units; 2018--7,451,004 units) (200,159,718) (200,246,086)
(DECREASE) INCREASE IN NET ASSETS DERIVEDFROM PARTICIPANT TRANSACTIONS (38,588,640) 8,465,841
(DECREASE) INCREASE IN NET ASSETS (23,246,932) 21,028,205
NET ASSETS AT CONTRACT VALUEBeginning of year (2019--23,853,920 units; 2018--23,544,242 units) 648,291,499 627,263,294End of year (2019--22,456,762 units; 2018--23,853,920 units) $625,044,567 $648,291,499
* Represents income from KeyBank collective investment fund(s).
See notes to financial statements.
3
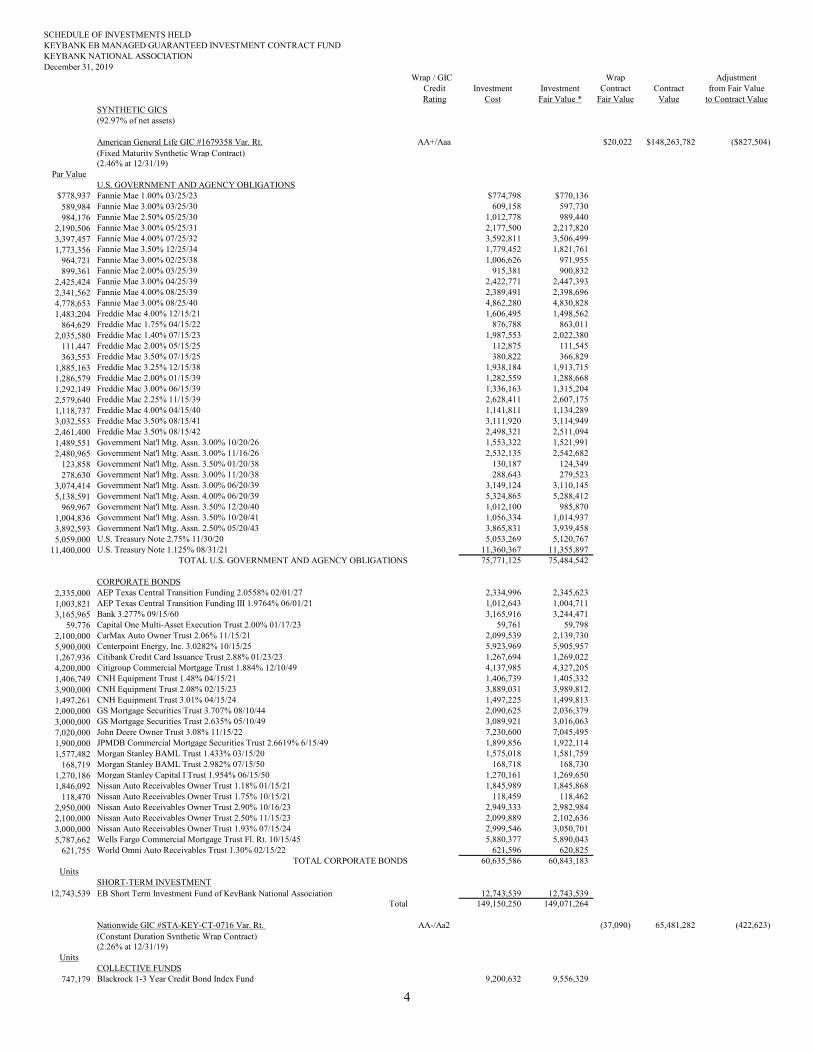
SCHEDULE OF INVESTMENTS HELDKEYBANK EB MANAGED GUARANTEED INVESTMENT CONTRACT FUNDKEYBANK NATIONAL ASSOCIATIONDecember 31, 2019
Wrap / GIC Wrap AdjustmentCredit Investment Investment Contract Contract from Fair ValueRating Cost Fair Value * Fair Value Value to Contract Value
SYNTHETIC GICS(92.97% of net assets)
American General Life GIC #1679358 Var. Rt. AA+/Aaa $20,022 $148,263,782 ($827,504)(Fixed Maturity Synthetic Wrap Contract)(2.46% at 12/31/19)
Par ValueU.S. GOVERNMENT AND AGENCY OBLIGATIONS
$778,937 Fannie Mae 1.00% 03/25/23 $774,798 $770,136589,984 Fannie Mae 3.00% 03/25/30 609,158 597,730984,176 Fannie Mae 2.50% 05/25/30 1,012,778 989,440
2,190,506 Fannie Mae 3.00% 05/25/31 2,177,500 2,217,8203,397,457 Fannie Mae 4.00% 07/25/32 3,592,811 3,506,4991,773,356 Fannie Mae 3.50% 12/25/34 1,779,452 1,821,761
964,721 Fannie Mae 3.00% 02/25/38 1,006,626 971,955899,361 Fannie Mae 2.00% 03/25/39 915,381 900,832
2,425,424 Fannie Mae 3.00% 04/25/39 2,422,771 2,447,3932,341,562 Fannie Mae 4.00% 08/25/39 2,389,491 2,398,6964,778,653 Fannie Mae 3.00% 08/25/40 4,862,280 4,830,8281,483,204 Freddie Mac 4.00% 12/15/21 1,606,495 1,498,562
864,629 Freddie Mac 1.75% 04/15/22 876,788 863,0112,035,580 Freddie Mac 1.40% 07/15/23 1,987,553 2,022,380
111,447 Freddie Mac 2.00% 05/15/25 112,875 111,545363,553 Freddie Mac 3.50% 07/15/25 380,822 366,829
1,885,163 Freddie Mac 3.25% 12/15/38 1,938,184 1,913,7151,286,579 Freddie Mac 2.00% 01/15/39 1,282,559 1,288,6681,292,149 Freddie Mac 3.00% 06/15/39 1,336,163 1,315,2042,579,640 Freddie Mac 2.25% 11/15/39 2,628,411 2,607,1751,118,737 Freddie Mac 4.00% 04/15/40 1,141,811 1,134,2893,032,553 Freddie Mac 3.50% 08/15/41 3,111,920 3,114,9492,461,400 Freddie Mac 3.50% 08/15/42 2,498,321 2,511,0941,489,551 Government Nat'l Mtg. Assn. 3.00% 10/20/26 1,553,322 1,521,9912,480,965 Government Nat'l Mtg. Assn. 3.00% 11/16/26 2,532,135 2,542,682
123,858 Government Nat'l Mtg. Assn. 3.50% 01/20/38 130,187 124,349278,630 Government Nat'l Mtg. Assn. 3.00% 11/20/38 288,643 279,523
3,074,414 Government Nat'l Mtg. Assn. 3.00% 06/20/39 3,149,124 3,110,1455,138,591 Government Nat'l Mtg. Assn. 4.00% 06/20/39 5,324,865 5,288,412
969,967 Government Nat'l Mtg. Assn. 3.50% 12/20/40 1,012,100 985,8701,004,836 Government Nat'l Mtg. Assn. 3.50% 10/20/41 1,056,334 1,014,9373,892,593 Government Nat'l Mtg. Assn. 2.50% 05/20/43 3,865,831 3,939,4585,059,000 U.S. Treasury Note 2.75% 11/30/20 5,053,269 5,120,767
11,400,000 U.S. Treasury Note 1.125% 08/31/21 11,360,367 11,355,897TOTAL U.S. GOVERNMENT AND AGENCY OBLIGATIONS 75,771,125 75,484,542
CORPORATE BONDS2,335,000 AEP Texas Central Transition Funding 2.0558% 02/01/27 2,334,996 2,345,6231,003,821 AEP Texas Central Transition Funding III 1.9764% 06/01/21 1,012,643 1,004,7113,165,965 Bank 3.277% 09/15/60 3,165,916 3,244,471
59,776 Capital One Multi-Asset Execution Trust 2.00% 01/17/23 59,761 59,7982,100,000 CarMax Auto Owner Trust 2.06% 11/15/21 2,099,539 2,139,7305,900,000 Centerpoint Energy, Inc. 3.0282% 10/15/25 5,923,969 5,905,9571,267,936 Citibank Credit Card Issuance Trust 2.88% 01/23/23 1,267,694 1,269,0224,200,000 Citigroup Commercial Mortgage Trust 1.884% 12/10/49 4,137,985 4,327,2051,406,749 CNH Equipment Trust 1.48% 04/15/21 1,406,739 1,405,3323,900,000 CNH Equipment Trust 2.08% 02/15/23 3,889,031 3,989,8121,497,261 CNH Equipment Trust 3.01% 04/15/24 1,497,225 1,499,8132,000,000 GS Mortgage Securities Trust 3.707% 08/10/44 2,090,625 2,036,3793,000,000 GS Mortgage Securities Trust 2.635% 05/10/49 3,089,921 3,016,0637,020,000 John Deere Owner Trust 3.08% 11/15/22 7,230,600 7,045,4951,900,000 JPMDB Commercial Mortgage Securities Trust 2.6619% 6/15/49 1,899,856 1,922,1141,577,482 Morgan Stanley BAML Trust 1.433% 03/15/20 1,575,018 1,581,759
168,719 Morgan Stanley BAML Trust 2.982% 07/15/50 168,718 168,7301,270,186 Morgan Stanley Capital I Trust 1.954% 06/15/50 1,270,161 1,269,6501,846,092 Nissan Auto Receivables Owner Trust 1.18% 01/15/21 1,845,989 1,845,868
118,470 Nissan Auto Receivables Owner Trust 1.75% 10/15/21 118,459 118,4622,950,000 Nissan Auto Receivables Owner Trust 2.90% 10/16/23 2,949,333 2,982,9842,100,000 Nissan Auto Receivables Owner Trust 2.50% 11/15/23 2,099,889 2,102,6363,000,000 Nissan Auto Receivables Owner Trust 1.93% 07/15/24 2,999,546 3,050,7015,787,662 Wells Fargo Commercial Mortgage Trust Fl. Rt. 10/15/45 5,880,377 5,890,043
621,755 World Omni Auto Receivables Trust 1.30% 02/15/22 621,596 620,825TOTAL CORPORATE BONDS 60,635,586 60,843,183
UnitsSHORT-TERM INVESTMENT
12,743,539 EB Short Term Investment Fund of KeyBank National Association 12,743,539 12,743,539Total 149,150,250 149,071,264
Nationwide GIC #STA-KEY-CT-0716 Var. Rt. AA-/Aa2 (37,090) 65,481,282 (422,623)(Constant Duration Synthetic Wrap Contract)(2.26% at 12/31/19)
UnitsCOLLECTIVE FUNDS
747,179 Blackrock 1-3 Year Credit Bond Index Fund 9,200,632 9,556,329
4
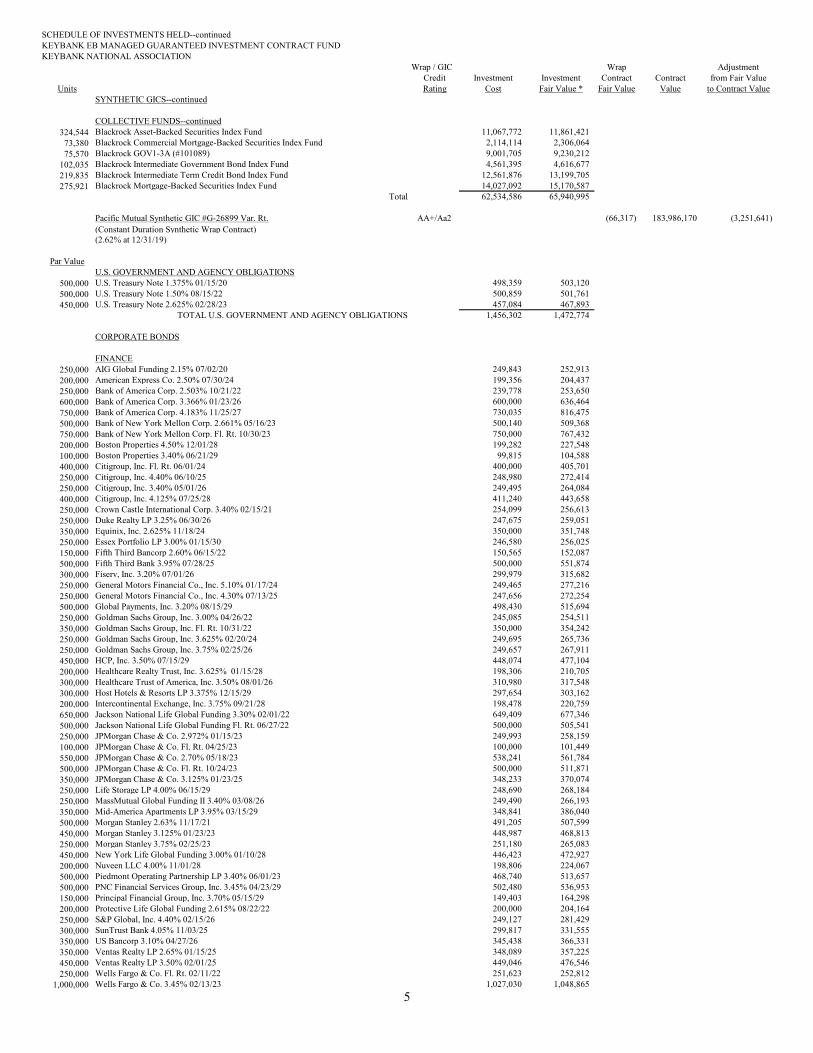
SCHEDULE OF INVESTMENTS HELD--continuedKEYBANK EB MANAGED GUARANTEED INVESTMENT CONTRACT FUNDKEYBANK NATIONAL ASSOCIATION
Wrap / GIC Wrap AdjustmentCredit Investment Investment Contract Contract from Fair Value
Units Rating Cost Fair Value * Fair Value Value to Contract ValueSYNTHETIC GICS--continued
COLLECTIVE FUNDS--continued324,544 Blackrock Asset-Backed Securities Index Fund 11,067,772 11,861,421
73,380 Blackrock Commercial Mortgage-Backed Securities Index Fund 2,114,114 2,306,06475,570 Blackrock GOV1-3A (#101089) 9,001,705 9,230,212
102,035 Blackrock Intermediate Government Bond Index Fund 4,561,395 4,616,677219,835 Blackrock Intermediate Term Credit Bond Index Fund 12,561,876 13,199,705275,921 Blackrock Mortgage-Backed Securities Index Fund 14,027,092 15,170,587
Total 62,534,586 65,940,995
Pacific Mutual Synthetic GIC #G-26899 Var. Rt. AA+/Aa2 (66,317) 183,986,170 (3,251,641)(Constant Duration Synthetic Wrap Contract)(2.62% at 12/31/19)
Par ValueU.S. GOVERNMENT AND AGENCY OBLIGATIONS
500,000 U.S. Treasury Note 1.375% 01/15/20 498,359 503,120500,000 U.S. Treasury Note 1.50% 08/15/22 500,859 501,761450,000 U.S. Treasury Note 2.625% 02/28/23 457,084 467,893
TOTAL U.S. GOVERNMENT AND AGENCY OBLIGATIONS 1,456,302 1,472,774
CORPORATE BONDS
FINANCE250,000 AIG Global Funding 2.15% 07/02/20 249,843 252,913200,000 American Express Co. 2.50% 07/30/24 199,356 204,437250,000 Bank of America Corp. 2.503% 10/21/22 239,778 253,650600,000 Bank of America Corp. 3.366% 01/23/26 600,000 636,464750,000 Bank of America Corp. 4.183% 11/25/27 730,035 816,475500,000 Bank of New York Mellon Corp. 2.661% 05/16/23 500,140 509,368750,000 Bank of New York Mellon Corp. Fl. Rt. 10/30/23 750,000 767,432200,000 Boston Properties 4.50% 12/01/28 199,282 227,548100,000 Boston Properties 3.40% 06/21/29 99,815 104,588400,000 Citigroup, Inc. Fl. Rt. 06/01/24 400,000 405,701250,000 Citigroup, Inc. 4.40% 06/10/25 248,980 272,414250,000 Citigroup, Inc. 3.40% 05/01/26 249,495 264,084400,000 Citigroup, Inc. 4.125% 07/25/28 411,240 443,658250,000 Crown Castle International Corp. 3.40% 02/15/21 254,099 256,613250,000 Duke Realty LP 3.25% 06/30/26 247,675 259,051350,000 Equinix, Inc. 2.625% 11/18/24 350,000 351,748250,000 Essex Portfolio LP 3.00% 01/15/30 246,580 256,025150,000 Fifth Third Bancorp 2.60% 06/15/22 150,565 152,087500,000 Fifth Third Bank 3.95% 07/28/25 500,000 551,874300,000 Fiserv, Inc. 3.20% 07/01/26 299,979 315,682250,000 General Motors Financial Co., Inc. 5.10% 01/17/24 249,465 277,216250,000 General Motors Financial Co., Inc. 4.30% 07/13/25 247,656 272,254500,000 Global Payments, Inc. 3.20% 08/15/29 498,430 515,694250,000 Goldman Sachs Group, Inc. 3.00% 04/26/22 245,085 254,511350,000 Goldman Sachs Group, Inc. Fl. Rt. 10/31/22 350,000 354,242250,000 Goldman Sachs Group, Inc. 3.625% 02/20/24 249,695 265,736250,000 Goldman Sachs Group, Inc. 3.75% 02/25/26 249,657 267,911450,000 HCP, Inc. 3.50% 07/15/29 448,074 477,104200,000 Healthcare Realty Trust, Inc. 3.625% 01/15/28 198,306 210,705300,000 Healthcare Trust of America, Inc. 3.50% 08/01/26 310,980 317,548300,000 Host Hotels & Resorts LP 3.375% 12/15/29 297,654 303,162200,000 Intercontinental Exchange, Inc. 3.75% 09/21/28 198,478 220,759650,000 Jackson National Life Global Funding 3.30% 02/01/22 649,409 677,346500,000 Jackson National Life Global Funding Fl. Rt. 06/27/22 500,000 505,541250,000 JPMorgan Chase & Co. 2.972% 01/15/23 249,993 258,159100,000 JPMorgan Chase & Co. Fl. Rt. 04/25/23 100,000 101,449550,000 JPMorgan Chase & Co. 2.70% 05/18/23 538,241 561,784500,000 JPMorgan Chase & Co. Fl. Rt. 10/24/23 500,000 511,871350,000 JPMorgan Chase & Co. 3.125% 01/23/25 348,233 370,074250,000 Life Storage LP 4.00% 06/15/29 248,690 268,184250,000 MassMutual Global Funding II 3.40% 03/08/26 249,490 266,193350,000 Mid-America Apartments LP 3.95% 03/15/29 348,841 386,040500,000 Morgan Stanley 2.63% 11/17/21 491,205 507,599450,000 Morgan Stanley 3.125% 01/23/23 448,987 468,813250,000 Morgan Stanley 3.75% 02/25/23 251,180 265,083450,000 New York Life Global Funding 3.00% 01/10/28 446,423 472,927200,000 Nuveen LLC 4.00% 11/01/28 198,806 224,067500,000 Piedmont Operating Partnership LP 3.40% 06/01/23 468,740 513,657500,000 PNC Financial Services Group, Inc. 3.45% 04/23/29 502,480 536,953150,000 Principal Financial Group, Inc. 3.70% 05/15/29 149,403 164,298200,000 Protective Life Global Funding 2.615% 08/22/22 200,000 204,164250,000 S&P Global, Inc. 4.40% 02/15/26 249,127 281,429300,000 SunTrust Bank 4.05% 11/03/25 299,817 331,555350,000 US Bancorp 3.10% 04/27/26 345,438 366,331350,000 Ventas Realty LP 2.65% 01/15/25 348,089 357,225450,000 Ventas Realty LP 3.50% 02/01/25 449,046 476,546250,000 Wells Fargo & Co. Fl. Rt. 02/11/22 251,623 252,812
1,000,000 Wells Fargo & Co. 3.45% 02/13/23 1,027,030 1,048,8655

SCHEDULE OF INVESTMENTS HELD--continuedKEYBANK EB MANAGED GUARANTEED INVESTMENT CONTRACT FUNDKEYBANK NATIONAL ASSOCIATION
Wrap / GIC Wrap AdjustmentCredit Investment Investment Contract Contract from Fair Value
Par Value Rating Cost Fair Value * Fair Value Value to Contract ValueSYNTHETIC GICS--continued
FINANCE--continued150,000 Welltower, Inc. 3.95% 09/01/23 149,951 160,300250,000 Welltower, Inc. 3.10% 01/15/30 249,540 256,020250,000 Weyerhaeuser Co. 4.00% 11/15/29 248,655 271,923250,000 Willis North America, Inc. 4.50% 09/15/28 249,917 279,007200,000 Willis North America, Inc. 2.95% 09/15/29 199,638 200,051
TOTAL FINANCE 21,428,334 22,584,920
FOREIGN350,000 AerCap Ireland Capital, Ltd. 3.50% 05/26/22 349,324 360,995200,000 AerCap Ireland Capital, Ltd. 3.30% 01/23/23 199,480 207,917350,000 Bank of Montreal 2.05% 11/01/22 349,590 352,830750,000 Bank of Nova Scotia 2.70% 03/07/22 731,708 769,650300,000 Cooperative Rabobank 3.875% 09/26/23 299,190 320,285450,000 Credit Suisse Group AG 2.997% 12/14/23 450,000 459,065500,000 DH Europe Finance II S.a.r.l. 2.20% 11/15/24 499,760 502,325
1,000,000 Export-Import Bank of Korea 2.25% 01/21/20 998,210 1,010,120250,000 HSBC Holdings PLC 3.90% 05/25/26 243,860 267,655
1,000,000 Korea Development Bank 2.50% 03/11/20 999,800 1,008,529250,000 Korea National Oil Corp. 2.875% 03/27/22 248,583 255,842750,000 National Australia Bank 2.50% 05/22/22 745,702 760,911300,000 Royal Bank of Canada 3.70% 10/05/23 299,376 319,821650,000 Royal Bank of Canada 2.25% 11/01/24 648,557 655,485500,000 Sumitomo Mitsui Financial Group, Inc. 2.784% 07/12/22 500,000 515,190200,000 Suntory Holdings, Ltd. 2.25% 10/16/24 199,672 199,721250,000 Svenska Handelsbanken AB 1.95% 09/08/20 249,747 251,415350,000 Takeda Pharmaceutical Co., Ltd. 4.40% 11/26/23 349,860 377,369450,000 Tencent Holdings, Ltd. 2.985% 01/19/23 449,937 462,989350,000 Waste Connections, Inc. 3.50% 05/01/29 348,283 372,888350,000 Westpac Banking Corp. 2.80% 01/11/22 349,983 360,344
TOTAL FOREIGN 9,510,622 9,791,346
INDUSTRIALS500,000 Allegion US Holding Co. Inc. 3.20% 10/01/24 499,720 518,245500,000 Amgen, Inc. 2.65% 05/11/22 498,930 509,330550,000 Apple, Inc. 3.00% 02/09/24 540,832 577,716300,000 Bristol-Myers Squibb Co. 2.75% 02/15/23 308,241 306,651700,000 Bristol-Myers Squibb Co. 3.20% 06/15/26 698,096 736,429250,000 Broadcom Corp. 3.50% 01/15/28 233,340 255,607350,000 Cheniere Corpus Christi Holdings LLC 3.70% 11/15/29 349,738 359,154350,000 D.R. Horton, Inc. 2.50% 10/15/24 349,787 352,379250,000 Diamondback Energy, Inc. 2.875% 12/01/24 249,897 253,439250,000 Dover Corp. 2.95% 11/04/29 251,644 253,135500,000 El Paso Pipeline Partners 4.30% 05/01/24 505,230 537,988250,000 General Mills, Inc. 4.00% 04/17/25 249,758 272,461700,000 Hyundai Capital America 3.75% 07/08/21 699,146 726,629625,000 International Business Machines Corp. 3.00% 05/15/24 622,613 650,971450,000 Jackson National Life Global Funding 3.25% 01/30/24 449,662 473,045500,000 Masco Corp. 7.75% 08/01/29 630,010 665,066600,000 Mass Mutual Global Funding II 2.75% 06/22/24 599,808 616,013300,000 Metropolitan Life Global Funding, Inc. 2.05% 06/12/20 299,991 300,502200,000 Micron Technology, Inc. 4.185% 02/15/27 199,990 217,405575,000 Mid-America Apartments LP 4.30% 10/15/23 587,138 620,608250,000 MPLX LP 5.25% 01/15/25 262,070 268,637350,000 Roper Technologies, Inc. 3.65% 09/15/23 354,944 371,304200,000 Roper Technologies, Inc. 2.95% 09/15/29 199,566 204,085200,000 Sabine Pass Liquefaction LLC 4.20% 03/15/28 199,806 214,483250,000 Sunoco Logistics Partners Operations LP 4.00% 10/01/27 248,040 261,163400,000 UDR, Inc. 4.00% 10/01/25 399,080 436,040400,000 UDR, Inc. 3.20% 01/15/30 398,648 415,512600,000 United Technologies Corp. 3.95% 08/16/25 598,980 663,235150,000 Waste Management, Inc. 2.95% 06/15/24 149,991 155,057500,000 Zoetis, Inc 3.00% 09/12/27 497,220 518,707
TOTAL INDUSTRIALS 12,131,916 12,710,996
MISCELLANEOUS800,000 AbbVie, Inc. 2.95% 11/21/26 799,048 817,150
83,652 American Airlines, Inc. 4.375% 10/01/22 83,652 87,00989,674 American Airlines, Inc. 3.70% 05/01/23 89,674 90,864
650,000 Anheuser-Busch InBev Worldwide, Inc. 4.75% 01/23/29 659,690 767,012400,000 Anthem, Inc. 2.375% 01/15/25 399,648 402,487250,000 AT&T, Inc. 3.40% 05/15/25 244,702 262,903250,000 AT&T, Inc. 4.10% 02/15/28 238,567 275,910330,000 Avalonbay Communities, Inc. 3.50% 11/15/24 338,639 350,223250,000 Avalonbay Communities, Inc. 2.95% 05/11/26 235,070 258,714
65,706 British Airways 5.625% 12/20/21 70,552 66,269250,000 Cigna Corp. 3.75% 07/15/23 261,728 266,523250,000 Cigna Corp. 4.125% 11/15/25 249,792 272,628650,000 Comcast Corp. 3.95% 10/15/25 649,201 714,837255,343 Delta Airlines, Inc. 4.75% 05/07/20 278,324 259,273250,000 Ford Motor Credit Co. LLC 4.25% 09/20/22 260,495 261,603
6
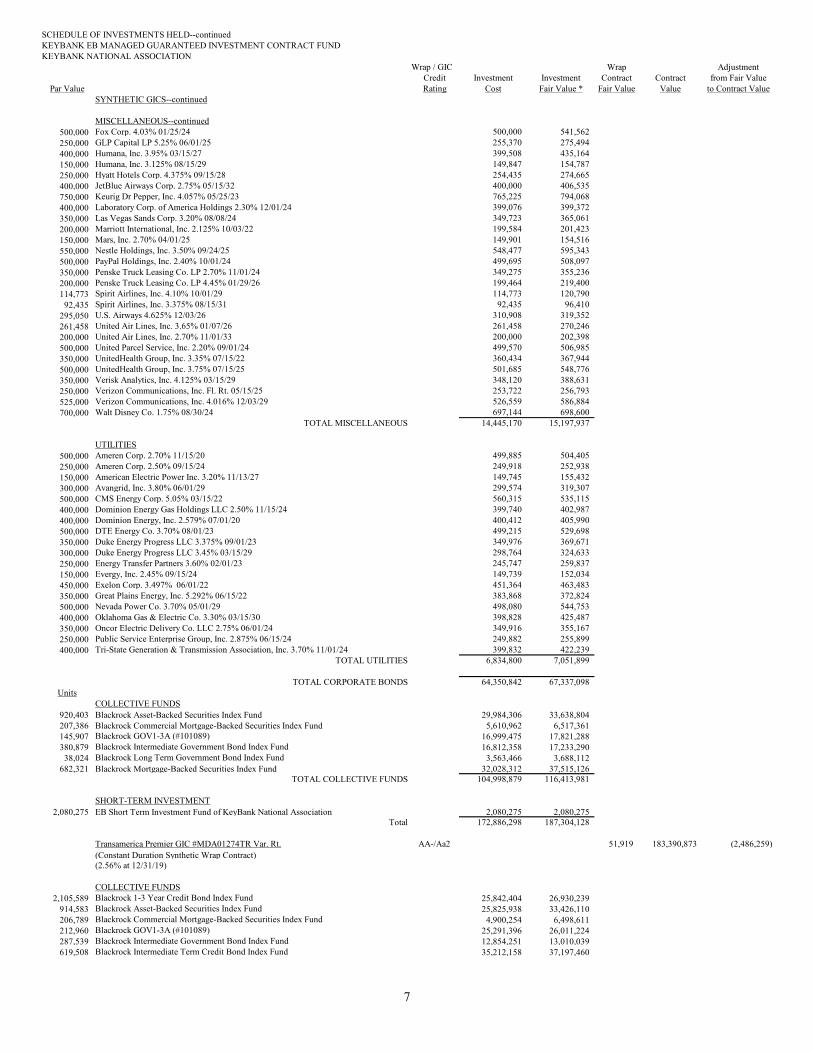
SCHEDULE OF INVESTMENTS HELD--continuedKEYBANK EB MANAGED GUARANTEED INVESTMENT CONTRACT FUNDKEYBANK NATIONAL ASSOCIATION
Wrap / GIC Wrap AdjustmentCredit Investment Investment Contract Contract from Fair Value
Par Value Rating Cost Fair Value * Fair Value Value to Contract ValueSYNTHETIC GICS--continued
MISCELLANEOUS--continued500,000 Fox Corp. 4.03% 01/25/24 500,000 541,562250,000 GLP Capital LP 5.25% 06/01/25 255,370 275,494400,000 Humana, Inc. 3.95% 03/15/27 399,508 435,164150,000 Humana, Inc. 3.125% 08/15/29 149,847 154,787250,000 Hyatt Hotels Corp. 4.375% 09/15/28 254,435 274,665400,000 JetBlue Airways Corp. 2.75% 05/15/32 400,000 406,535750,000 Keurig Dr Pepper, Inc. 4.057% 05/25/23 765,225 794,068400,000 Laboratory Corp. of America Holdings 2.30% 12/01/24 399,076 399,372350,000 Las Vegas Sands Corp. 3.20% 08/08/24 349,723 365,061200,000 Marriott International, Inc. 2.125% 10/03/22 199,584 201,423150,000 Mars, Inc. 2.70% 04/01/25 149,901 154,516550,000 Nestle Holdings, Inc. 3.50% 09/24/25 548,477 595,343500,000 PayPal Holdings, Inc. 2.40% 10/01/24 499,695 508,097350,000 Penske Truck Leasing Co. LP 2.70% 11/01/24 349,275 355,236200,000 Penske Truck Leasing Co. LP 4.45% 01/29/26 199,464 219,400114,773 Spirit Airlines, Inc. 4.10% 10/01/29 114,773 120,790
92,435 Spirit Airlines, Inc. 3.375% 08/15/31 92,435 96,410295,050 U.S. Airways 4.625% 12/03/26 310,908 319,352261,458 United Air Lines, Inc. 3.65% 01/07/26 261,458 270,246200,000 United Air Lines, Inc. 2.70% 11/01/33 200,000 202,398500,000 United Parcel Service, Inc. 2.20% 09/01/24 499,570 506,985350,000 UnitedHealth Group, Inc. 3.35% 07/15/22 360,434 367,944500,000 UnitedHealth Group, Inc. 3.75% 07/15/25 501,685 548,776350,000 Verisk Analytics, Inc. 4.125% 03/15/29 348,120 388,631250,000 Verizon Communications, Inc. Fl. Rt. 05/15/25 253,722 256,793525,000 Verizon Communications, Inc. 4.016% 12/03/29 526,559 586,884700,000 Walt Disney Co. 1.75% 08/30/24 697,144 698,600
TOTAL MISCELLANEOUS 14,445,170 15,197,937
UTILITIES500,000 Ameren Corp. 2.70% 11/15/20 499,885 504,405250,000 Ameren Corp. 2.50% 09/15/24 249,918 252,938150,000 American Electric Power Inc. 3.20% 11/13/27 149,745 155,432300,000 Avangrid, Inc. 3.80% 06/01/29 299,574 319,307500,000 CMS Energy Corp. 5.05% 03/15/22 560,315 535,115400,000 Dominion Energy Gas Holdings LLC 2.50% 11/15/24 399,740 402,987400,000 Dominion Energy, Inc. 2.579% 07/01/20 400,412 405,990500,000 DTE Energy Co. 3.70% 08/01/23 499,215 529,698350,000 Duke Energy Progress LLC 3.375% 09/01/23 349,976 369,671300,000 Duke Energy Progress LLC 3.45% 03/15/29 298,764 324,633250,000 Energy Transfer Partners 3.60% 02/01/23 245,747 259,837150,000 Evergy, Inc. 2.45% 09/15/24 149,739 152,034450,000 Exelon Corp. 3.497% 06/01/22 451,364 463,483350,000 Great Plains Energy, Inc. 5.292% 06/15/22 383,868 372,824500,000 Nevada Power Co. 3.70% 05/01/29 498,080 544,753400,000 Oklahoma Gas & Electric Co. 3.30% 03/15/30 398,828 425,487350,000 Oncor Electric Delivery Co. LLC 2.75% 06/01/24 349,916 355,167250,000 Public Service Enterprise Group, Inc. 2.875% 06/15/24 249,882 255,899400,000 Tri-State Generation & Transmission Association, Inc. 3.70% 11/01/24 399,832 422,239
TOTAL UTILITIES 6,834,800 7,051,899
TOTAL CORPORATE BONDS 64,350,842 67,337,098Units
COLLECTIVE FUNDS920,403 Blackrock Asset-Backed Securities Index Fund 29,984,306 33,638,804207,386 Blackrock Commercial Mortgage-Backed Securities Index Fund 5,610,962 6,517,361145,907 Blackrock GOV1-3A (#101089) 16,999,475 17,821,288380,879 Blackrock Intermediate Government Bond Index Fund 16,812,358 17,233,290
38,024 Blackrock Long Term Government Bond Index Fund 3,563,466 3,688,112682,321 Blackrock Mortgage-Backed Securities Index Fund 32,028,312 37,515,126
TOTAL COLLECTIVE FUNDS 104,998,879 116,413,981
SHORT-TERM INVESTMENT2,080,275 EB Short Term Investment Fund of KeyBank National Association 2,080,275 2,080,275
Total 172,886,298 187,304,128
Transamerica Premier GIC #MDA01274TR Var. Rt. AA-/Aa2 51,919 183,390,873 (2,486,259)(Constant Duration Synthetic Wrap Contract)(2.56% at 12/31/19)
COLLECTIVE FUNDS2,105,589 Blackrock 1-3 Year Credit Bond Index Fund 25,842,404 26,930,239
914,583 Blackrock Asset-Backed Securities Index Fund 25,825,938 33,426,110206,789 Blackrock Commercial Mortgage-Backed Securities Index Fund 4,900,254 6,498,611212,960 Blackrock GOV1-3A (#101089) 25,291,396 26,011,224287,539 Blackrock Intermediate Government Bond Index Fund 12,854,251 13,010,039619,508 Blackrock Intermediate Term Credit Bond Index Fund 35,212,158 37,197,460
7
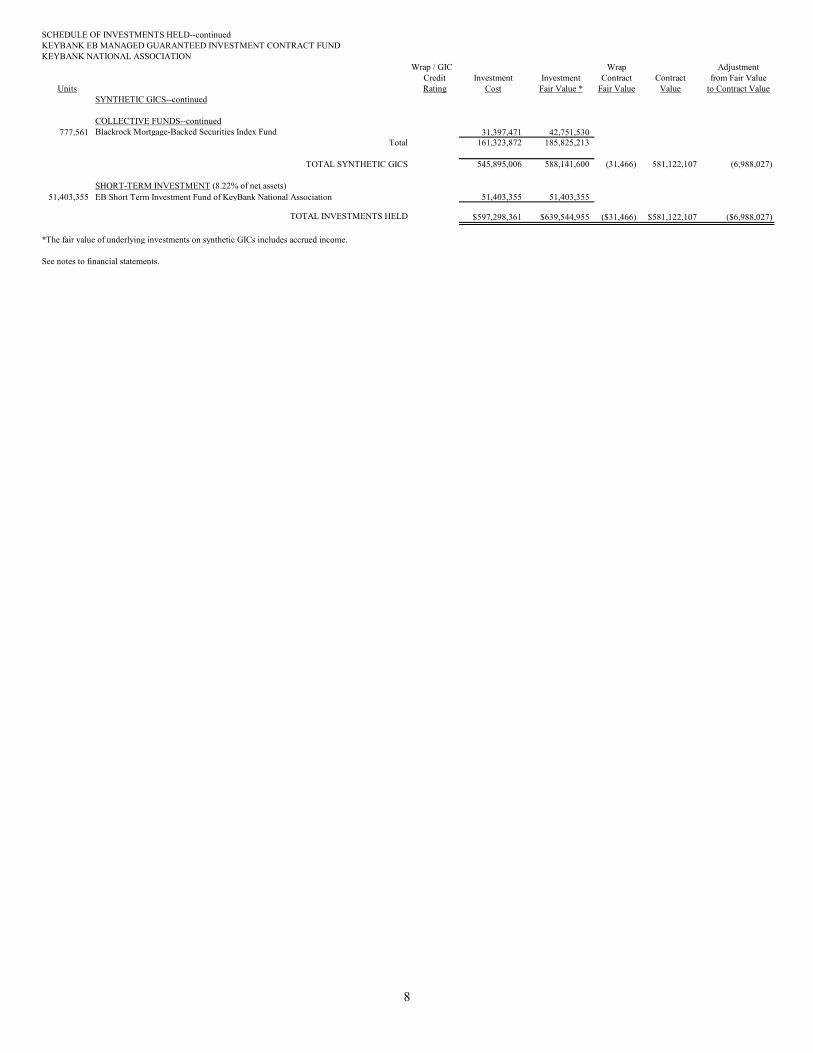
SCHEDULE OF INVESTMENTS HELD--continuedKEYBANK EB MANAGED GUARANTEED INVESTMENT CONTRACT FUNDKEYBANK NATIONAL ASSOCIATION
Wrap / GIC Wrap AdjustmentCredit Investment Investment Contract Contract from Fair Value
Units Rating Cost Fair Value * Fair Value Value to Contract ValueSYNTHETIC GICS--continued
COLLECTIVE FUNDS--continued777,561 Blackrock Mortgage-Backed Securities Index Fund 31,397,471 42,751,530
Total 161,323,872 185,825,213
TOTAL SYNTHETIC GICS 545,895,006 588,141,600 (31,466) 581,122,107 (6,988,027)
SHORT-TERM INVESTMENT (8.22% of net assets)51,403,355 EB Short Term Investment Fund of KeyBank National Association 51,403,355 51,403,355
TOTAL INVESTMENTS HELD $597,298,361 $639,544,955 ($31,466) $581,122,107 ($6,988,027)
*The fair value of underlying investments on synthetic GICs includes accrued income.
See notes to financial statements.
8
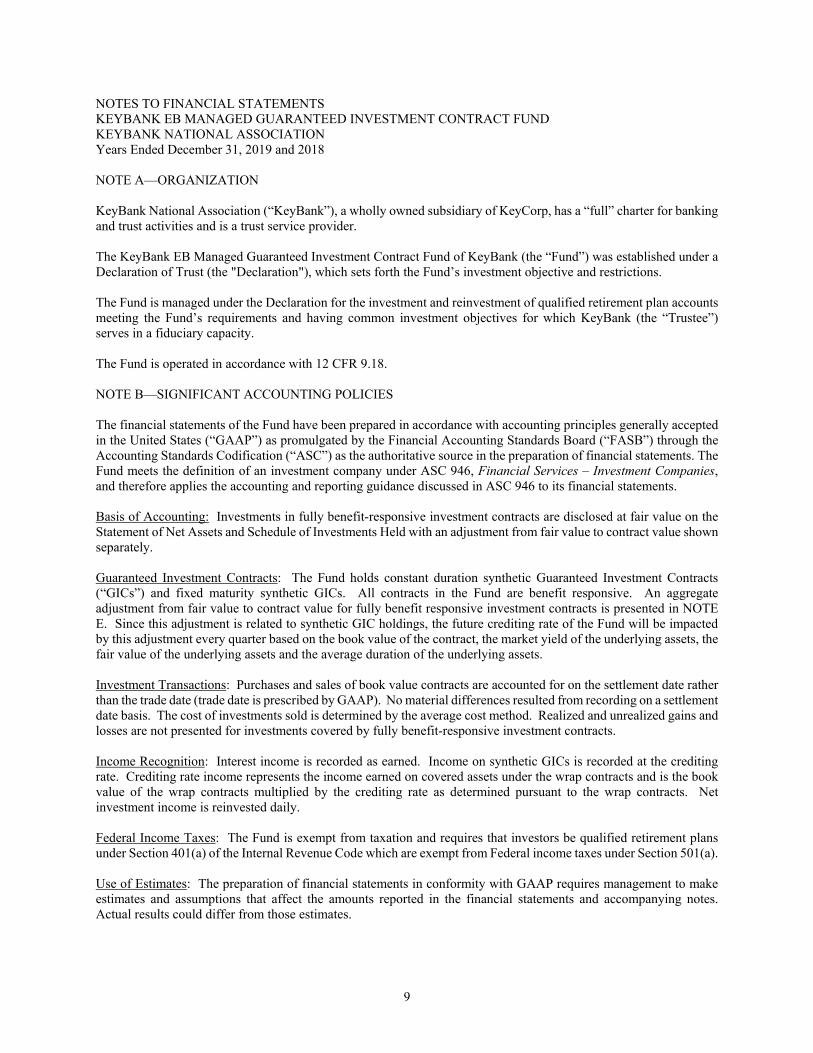
NOTES TO FINANCIAL STATEMENTS KEYBANK EB MANAGED GUARANTEED INVESTMENT CONTRACT FUND KEYBANK NATIONAL ASSOCIATION Years Ended December 31, 2019 and 2018 NOTE A—ORGANIZATION KeyBank National Association (“KeyBank”), a wholly owned subsidiary of KeyCorp, has a “full” charter for banking and trust activities and is a trust service provider. The KeyBank EB Managed Guaranteed Investment Contract Fund of KeyBank (the “Fund”) was established under a Declaration of Trust (the "Declaration"), which sets forth the Fund’s investment objective and restrictions. The Fund is managed under the Declaration for the investment and reinvestment of qualified retirement plan accounts meeting the Fund’s requirements and having common investment objectives for which KeyBank (the “Trustee”) serves in a fiduciary capacity. The Fund is operated in accordance with 12 CFR 9.18. NOTE B—SIGNIFICANT ACCOUNTING POLICIES The financial statements of the Fund have been prepared in accordance with accounting principles generally accepted in the United States (“GAAP”) as promulgated by the Financial Accounting Standards Board (“FASB”) through the Accounting Standards Codification (“ASC”) as the authoritative source in the preparation of financial statements. The Fund meets the definition of an investment company under ASC 946, Financial Services – Investment Companies, and therefore applies the accounting and reporting guidance discussed in ASC 946 to its financial statements. Basis of Accounting: Investments in fully benefit-responsive investment contracts are disclosed at fair value on the Statement of Net Assets and Schedule of Investments Held with an adjustment from fair value to contract value shown separately. Guaranteed Investment Contracts: The Fund holds constant duration synthetic Guaranteed Investment Contracts (“GICs”) and fixed maturity synthetic GICs. All contracts in the Fund are benefit responsive. An aggregate adjustment from fair value to contract value for fully benefit responsive investment contracts is presented in NOTE E. Since this adjustment is related to synthetic GIC holdings, the future crediting rate of the Fund will be impacted by this adjustment every quarter based on the book value of the contract, the market yield of the underlying assets, the fair value of the underlying assets and the average duration of the underlying assets. Investment Transactions: Purchases and sales of book value contracts are accounted for on the settlement date rather than the trade date (trade date is prescribed by GAAP). No material differences resulted from recording on a settlement date basis. The cost of investments sold is determined by the average cost method. Realized and unrealized gains and losses are not presented for investments covered by fully benefit-responsive investment contracts. Income Recognition: Interest income is recorded as earned. Income on synthetic GICs is recorded at the crediting rate. Crediting rate income represents the income earned on covered assets under the wrap contracts and is the book value of the wrap contracts multiplied by the crediting rate as determined pursuant to the wrap contracts. Net investment income is reinvested daily. Federal Income Taxes: The Fund is exempt from taxation and requires that investors be qualified retirement plans under Section 401(a) of the Internal Revenue Code which are exempt from Federal income taxes under Section 501(a). Use of Estimates: The preparation of financial statements in conformity with GAAP requires management to make estimates and assumptions that affect the amounts reported in the financial statements and accompanying notes. Actual results could differ from those estimates.
9
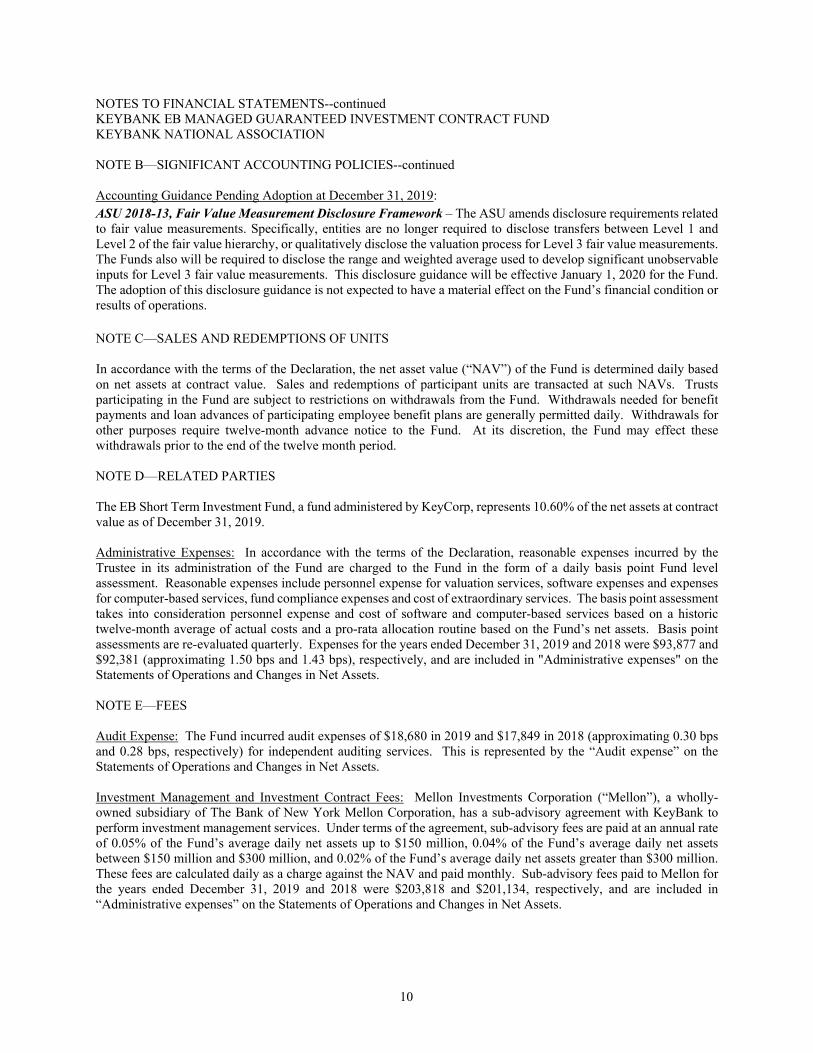
NOTES TO FINANCIAL STATEMENTS--continued KEYBANK EB MANAGED GUARANTEED INVESTMENT CONTRACT FUND KEYBANK NATIONAL ASSOCIATION NOTE B—SIGNIFICANT ACCOUNTING POLICIES--continued Accounting Guidance Pending Adoption at December 31, 2019: ASU 2018-13, Fair Value Measurement Disclosure Framework – The ASU amends disclosure requirements related to fair value measurements. Specifically, entities are no longer required to disclose transfers between Level 1 and Level 2 of the fair value hierarchy, or qualitatively disclose the valuation process for Level 3 fair value measurements. The Funds also will be required to disclose the range and weighted average used to develop significant unobservable inputs for Level 3 fair value measurements. This disclosure guidance will be effective January 1, 2020 for the Fund. The adoption of this disclosure guidance is not expected to have a material effect on the Fund’s financial condition or results of operations. NOTE C—SALES AND REDEMPTIONS OF UNITS In accordance with the terms of the Declaration, the net asset value (“NAV”) of the Fund is determined daily based on net assets at contract value. Sales and redemptions of participant units are transacted at such NAVs. Trusts participating in the Fund are subject to restrictions on withdrawals from the Fund. Withdrawals needed for benefit payments and loan advances of participating employee benefit plans are generally permitted daily. Withdrawals for other purposes require twelve-month advance notice to the Fund. At its discretion, the Fund may effect these withdrawals prior to the end of the twelve month period. NOTE D—RELATED PARTIES The EB Short Term Investment Fund, a fund administered by KeyCorp, represents 10.60% of the net assets at contract value as of December 31, 2019. Administrative Expenses: In accordance with the terms of the Declaration, reasonable expenses incurred by the Trustee in its administration of the Fund are charged to the Fund in the form of a daily basis point Fund level assessment. Reasonable expenses include personnel expense for valuation services, software expenses and expenses for computer-based services, fund compliance expenses and cost of extraordinary services. The basis point assessment takes into consideration personnel expense and cost of software and computer-based services based on a historic twelve-month average of actual costs and a pro-rata allocation routine based on the Fund’s net assets. Basis point assessments are re-evaluated quarterly. Expenses for the years ended December 31, 2019 and 2018 were $93,877 and $92,381 (approximating 1.50 bps and 1.43 bps), respectively, and are included in "Administrative expenses" on the Statements of Operations and Changes in Net Assets. NOTE E—FEES Audit Expense: The Fund incurred audit expenses of $18,680 in 2019 and $17,849 in 2018 (approximating 0.30 bps and 0.28 bps, respectively) for independent auditing services. This is represented by the “Audit expense” on the Statements of Operations and Changes in Net Assets. Investment Management and Investment Contract Fees: Mellon Investments Corporation (“Mellon”), a wholly-owned subsidiary of The Bank of New York Mellon Corporation, has a sub-advisory agreement with KeyBank to perform investment management services. Under terms of the agreement, sub-advisory fees are paid at an annual rate of 0.05% of the Fund’s average daily net assets up to $150 million, 0.04% of the Fund’s average daily net assets between $150 million and $300 million, and 0.02% of the Fund’s average daily net assets greater than $300 million. These fees are calculated daily as a charge against the NAV and paid monthly. Sub-advisory fees paid to Mellon for the years ended December 31, 2019 and 2018 were $203,818 and $201,134, respectively, and are included in “Administrative expenses” on the Statements of Operations and Changes in Net Assets.
10
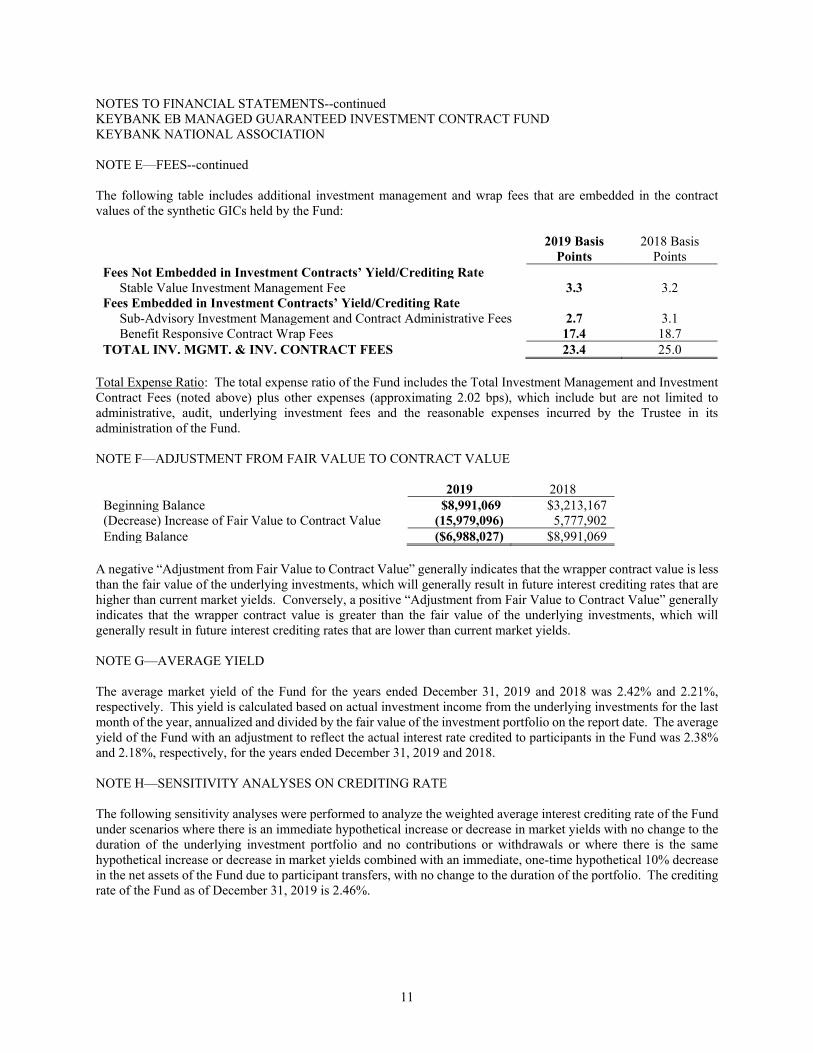
NOTES TO FINANCIAL STATEMENTS--continued KEYBANK EB MANAGED GUARANTEED INVESTMENT CONTRACT FUND KEYBANK NATIONAL ASSOCIATION NOTE E—FEES--continued The following table includes additional investment management and wrap fees that are embedded in the contract values of the synthetic GICs held by the Fund:
2019 Basis Points
2018 Basis Points
Fees Not Embedded in Investment Contracts’ Yield/Crediting Rate Stable Value Investment Management Fee 3.3 3.2 Fees Embedded in Investment Contracts’ Yield/Crediting Rate Sub-Advisory Investment Management and Contract Administrative Fees 2.7 3.1 Benefit Responsive Contract Wrap Fees 17.4 18.7 TOTAL INV. MGMT. & INV. CONTRACT FEES 23.4 25.0
Total Expense Ratio: The total expense ratio of the Fund includes the Total Investment Management and Investment Contract Fees (noted above) plus other expenses (approximating 2.02 bps), which include but are not limited to administrative, audit, underlying investment fees and the reasonable expenses incurred by the Trustee in its administration of the Fund. NOTE F—ADJUSTMENT FROM FAIR VALUE TO CONTRACT VALUE
2019 2018 Beginning Balance $8,991,069 $3,213,167 (Decrease) Increase of Fair Value to Contract Value (15,979,096) 5,777,902 Ending Balance ($6,988,027) $8,991,069
A negative “Adjustment from Fair Value to Contract Value” generally indicates that the wrapper contract value is less than the fair value of the underlying investments, which will generally result in future interest crediting rates that are higher than current market yields. Conversely, a positive “Adjustment from Fair Value to Contract Value” generally indicates that the wrapper contract value is greater than the fair value of the underlying investments, which will generally result in future interest crediting rates that are lower than current market yields. NOTE G—AVERAGE YIELD The average market yield of the Fund for the years ended December 31, 2019 and 2018 was 2.42% and 2.21%, respectively. This yield is calculated based on actual investment income from the underlying investments for the last month of the year, annualized and divided by the fair value of the investment portfolio on the report date. The average yield of the Fund with an adjustment to reflect the actual interest rate credited to participants in the Fund was 2.38% and 2.18%, respectively, for the years ended December 31, 2019 and 2018. NOTE H—SENSITIVITY ANALYSES ON CREDITING RATE The following sensitivity analyses were performed to analyze the weighted average interest crediting rate of the Fund under scenarios where there is an immediate hypothetical increase or decrease in market yields with no change to the duration of the underlying investment portfolio and no contributions or withdrawals or where there is the same hypothetical increase or decrease in market yields combined with an immediate, one-time hypothetical 10% decrease in the net assets of the Fund due to participant transfers, with no change to the duration of the portfolio. The crediting rate of the Fund as of December 31, 2019 is 2.46%.
11
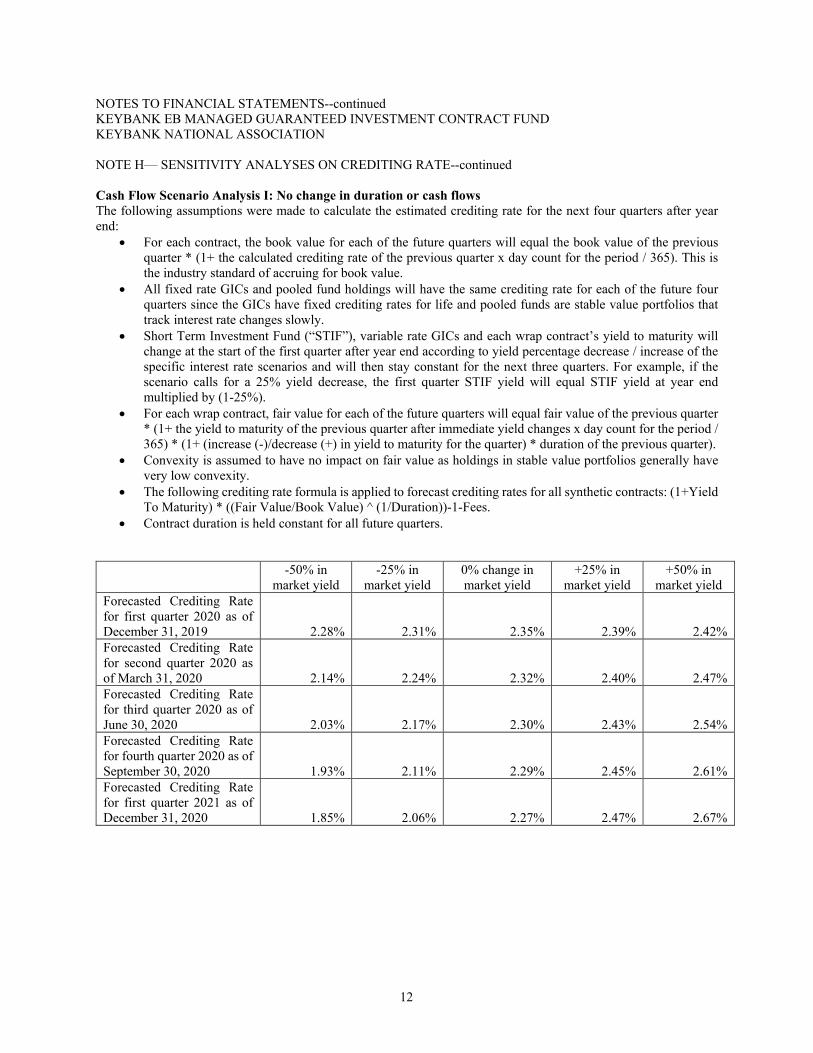
NOTES TO FINANCIAL STATEMENTS--continued KEYBANK EB MANAGED GUARANTEED INVESTMENT CONTRACT FUND KEYBANK NATIONAL ASSOCIATION NOTE H— SENSITIVITY ANALYSES ON CREDITING RATE--continued Cash Flow Scenario Analysis I: No change in duration or cash flows The following assumptions were made to calculate the estimated crediting rate for the next four quarters after year end:
• For each contract, the book value for each of the future quarters will equal the book value of the previous quarter * (1+ the calculated crediting rate of the previous quarter x day count for the period / 365). This is the industry standard of accruing for book value.
• All fixed rate GICs and pooled fund holdings will have the same crediting rate for each of the future four quarters since the GICs have fixed crediting rates for life and pooled funds are stable value portfolios that track interest rate changes slowly.
• Short Term Investment Fund (“STIF”), variable rate GICs and each wrap contract’s yield to maturity will change at the start of the first quarter after year end according to yield percentage decrease / increase of the specific interest rate scenarios and will then stay constant for the next three quarters. For example, if the scenario calls for a 25% yield decrease, the first quarter STIF yield will equal STIF yield at year end multiplied by (1-25%).
• For each wrap contract, fair value for each of the future quarters will equal fair value of the previous quarter * (1+ the yield to maturity of the previous quarter after immediate yield changes x day count for the period / 365) * (1+ (increase (-)/decrease (+) in yield to maturity for the quarter) * duration of the previous quarter).
• Convexity is assumed to have no impact on fair value as holdings in stable value portfolios generally have very low convexity.
• The following crediting rate formula is applied to forecast crediting rates for all synthetic contracts: (1+Yield To Maturity) * ((Fair Value/Book Value) ^ (1/Duration))-1-Fees.
• Contract duration is held constant for all future quarters.
-50% in
market yield -25% in
market yield 0% change in market yield
+25% in market yield
+50% in market yield
Forecasted Crediting Rate for first quarter 2020 as of December 31, 2019 2.28% 2.31% 2.35% 2.39% 2.42% Forecasted Crediting Rate for second quarter 2020 as of March 31, 2020 2.14% 2.24% 2.32% 2.40% 2.47% Forecasted Crediting Rate for third quarter 2020 as of June 30, 2020 2.03% 2.17% 2.30% 2.43% 2.54% Forecasted Crediting Rate for fourth quarter 2020 as of September 30, 2020 1.93% 2.11% 2.29% 2.45% 2.61% Forecasted Crediting Rate for first quarter 2021 as of December 31, 2020 1.85% 2.06% 2.27% 2.47% 2.67%
12
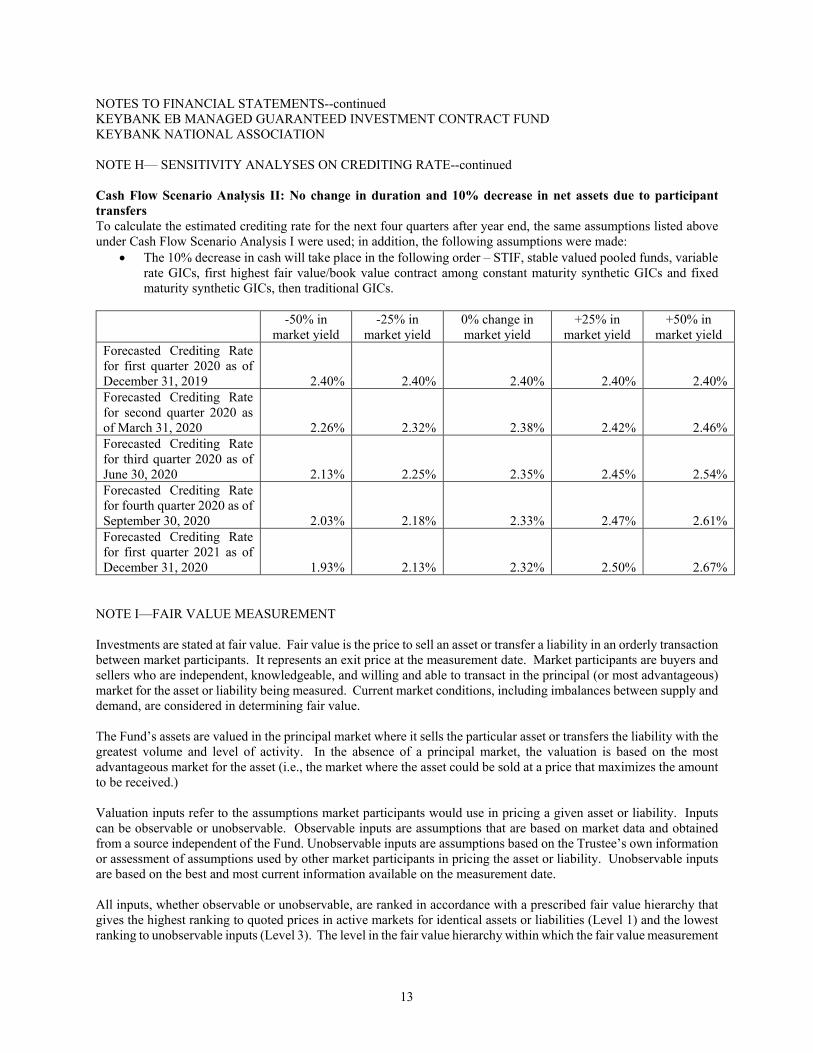
NOTES TO FINANCIAL STATEMENTS--continued KEYBANK EB MANAGED GUARANTEED INVESTMENT CONTRACT FUND KEYBANK NATIONAL ASSOCIATION NOTE H— SENSITIVITY ANALYSES ON CREDITING RATE--continued Cash Flow Scenario Analysis II: No change in duration and 10% decrease in net assets due to participant transfers To calculate the estimated crediting rate for the next four quarters after year end, the same assumptions listed above under Cash Flow Scenario Analysis I were used; in addition, the following assumptions were made:
• The 10% decrease in cash will take place in the following order – STIF, stable valued pooled funds, variable rate GICs, first highest fair value/book value contract among constant maturity synthetic GICs and fixed maturity synthetic GICs, then traditional GICs.
-50% in
market yield -25% in
market yield 0% change in market yield
+25% in market yield
+50% in market yield
Forecasted Crediting Rate for first quarter 2020 as of December 31, 2019 2.40% 2.40% 2.40% 2.40% 2.40% Forecasted Crediting Rate for second quarter 2020 as of March 31, 2020 2.26% 2.32% 2.38% 2.42% 2.46% Forecasted Crediting Rate for third quarter 2020 as of June 30, 2020 2.13% 2.25% 2.35% 2.45% 2.54% Forecasted Crediting Rate for fourth quarter 2020 as of September 30, 2020 2.03% 2.18% 2.33% 2.47% 2.61% Forecasted Crediting Rate for first quarter 2021 as of December 31, 2020 1.93% 2.13% 2.32% 2.50% 2.67%
NOTE I—FAIR VALUE MEASUREMENT Investments are stated at fair value. Fair value is the price to sell an asset or transfer a liability in an orderly transaction between market participants. It represents an exit price at the measurement date. Market participants are buyers and sellers who are independent, knowledgeable, and willing and able to transact in the principal (or most advantageous) market for the asset or liability being measured. Current market conditions, including imbalances between supply and demand, are considered in determining fair value. The Fund’s assets are valued in the principal market where it sells the particular asset or transfers the liability with the greatest volume and level of activity. In the absence of a principal market, the valuation is based on the most advantageous market for the asset (i.e., the market where the asset could be sold at a price that maximizes the amount to be received.) Valuation inputs refer to the assumptions market participants would use in pricing a given asset or liability. Inputs can be observable or unobservable. Observable inputs are assumptions that are based on market data and obtained from a source independent of the Fund. Unobservable inputs are assumptions based on the Trustee’s own information or assessment of assumptions used by other market participants in pricing the asset or liability. Unobservable inputs are based on the best and most current information available on the measurement date. All inputs, whether observable or unobservable, are ranked in accordance with a prescribed fair value hierarchy that gives the highest ranking to quoted prices in active markets for identical assets or liabilities (Level 1) and the lowest ranking to unobservable inputs (Level 3). The level in the fair value hierarchy within which the fair value measurement
13
NOTES TO FINANCIAL STATEMENTS--continued KEYBANK EB MANAGED GUARANTEED INVESTMENT CONTRACT FUND KEYBANK NATIONAL ASSOCIATION NOTE I—FAIR VALUE MEASUREMENT—continued in its entirety falls is determined based on the lowest level input that is significant to the fair value measurement in its entirety. The inputs used in determining fair value in each of the three levels of the hierarchy are as follows:
Level 1 – Quoted prices in active markets for identical securities. Level 2 – Other observable inputs such as quoted prices for similar securities in active markets, quoted prices for identical or similar securities in markets which are not active, inputs other than quoted prices which are observable for the security or inputs that are derived principally from or corroborated by observable market data by correlation or other means. Level 3 – Unobservable inputs only used to measure fair value to the extent that observable inputs are not available. Use of Level 3 inputs only occurs in situations where there is little, if any, market activity for the security at the measurement date.
Fixed Maturity Synthetic GICs General fixed maturity synthetic GICs consist of an asset or collection of assets that are owned by the Fund and a benefit-responsive, book value wrap contract purchased for the portfolio. The wrap contract provides book value accounting for the asset and assures that book value, benefit responsive payments, will be made for participant directed withdrawals. The crediting rate of the contract is set at the start of the contract and typically resets every quarter based on the book value of the contract, the market yield of the underlying assets, the fair value of the underlying assets and the average duration of the underlying assets. The crediting rate aims at converging the book value of the contract and the fair value of the underlying portfolio over the duration of the contract and therefore will be affected by movements in interest rates and/or changes in the fair value of the underlying portfolio. Generally, Fixed Maturity Synthetics are held to maturity of the final underlying bond. The initial crediting rate for the contract is established based on the market interest rates at the time the initial asset is purchased and it will have an interest crediting rate of not less than 0%. Constant Duration Synthetic GICs Constant duration synthetic GICs consist of a portfolio of securities owned by the Fund and a benefit-responsive, book value wrap contract purchased for the portfolio. The wrap contract amortizes gains and losses of the underlying securities over the portfolio duration, and assures that book value, benefit responsive payments will be made for participant directed withdrawals. The crediting rate on a constant duration synthetic GIC resets every quarter based on the book value of the contract, the market yield of the underlying assets, the fair value of the underlying assets and the average duration of the underlying assets. The crediting rate aims at converging the book value of the contract and the fair value of the underlying portfolio over the duration of the contract and therefore will be affected by movements in interest rates and/or changes in the fair value of the underlying portfolio. The initial crediting rate for the contract is established based on the market interest rates at the time the underlying portfolio is first put together and it will have an interest crediting rate of not less than 0%. Short Term Investment This category represents an investment in a short term collective investment fund, the valuations for which are based on NAV, as a practical expedient. NAV is equal to the fair value of the short term investment fund’s investments and other assets, less liabilities, divided by the number of fund shares. The short-term investments are composed of highly liquid investments with maturities of three months or less and are not likely to be sold at amounts different from the NAV per share. There are no withdrawal restrictions on redeeming the investments. The investment objective of the EB Short Term Investment Fund of KeyBank is stability and liquidity.
14
NOTES TO FINANCIAL STATEMENTS--continued KEYBANK EB MANAGED GUARANTEED INVESTMENT CONTRACT FUND KEYBANK NATIONAL ASSOCIATION NOTE I—FAIR VALUE MEASUREMENT—continued If it becomes probable that any of the following events will result in withdrawals and transfers from the Fund which would limit the ability of the Fund to transact at book or contract value, fair value would likely be used in determining the payouts to the participants:
1) Employer-initiated events – events within the control of the plan or the plan sponsor which would have a material and adverse impact on the Fund (e.g., layoffs, bankruptcy, plant closings, plan termination, mergers, early retirement incentives);
2) Employer communications designed to induce participants to transfer from the Fund; 3) Competing fund transfer or violation of equity wash or equivalent rules in place; and 4) Changes of qualification status of employer or plan.
In general, issuers may terminate the contract and settle at other than contract value if the qualification status of employer or plan changes, due to breach of material obligations under the contract and misrepresentation by the contract holder, or failure of the underlying portfolio to conform to the pre-established investment guidelines. For fixed maturity synthetic GICs, underlying assets are traded in active markets and have readily quoted market prices. For constant duration synthetic GICs, the fair values of the underlying assets are provided by the investment managers of the underlying portfolios. The constant duration synthetic contracts wrap a combination of high credit quality portfolios of assets; the result is a diversified portfolio that provides certain portfolio characteristics (such as yield and duration). Each of the strategies require adherence to an investment policy approved by the wrap issuer at the time of the contract purchase. The constant duration synthetic contracts wrap a Yield Enhanced Strategy (“YES”) and a Separately Managed Indexed Strategy; the Separately Managed portfolio of investments is managed exclusively for the Fund.
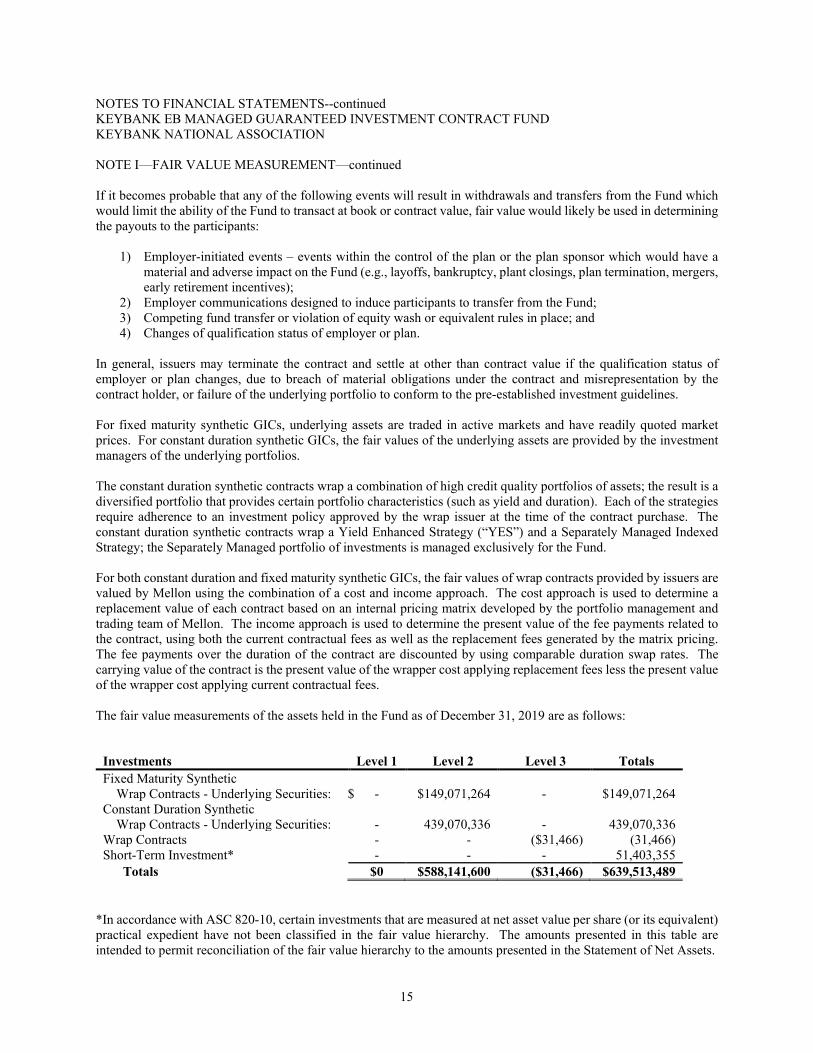
The fair value measurements of the assets held in the Fund as of December 31, 2019 are as follows:
Investments Level 1 Level 2
Level 3 Totals Fixed Maturity Synthetic Wrap Contracts - Underlying Securities: - $149,071,264 - $149,071,264 Constant Duration Synthetic Wrap Contracts - Underlying Securities: - 439,070,336 - 439,070,336 Wrap Contracts - - ($31,466) (31,466) Short-Term Investment* - - - 51,403,355 Totals $0 $588,141,600 ($31,466) $639,513,489
*In accordance with ASC 820-10, certain investments that are measured at net asset value per share (or its equivalent) practical expedient have not been classified in the fair value hierarchy. The amounts presented in this table are intended to permit reconciliation of the fair value hierarchy to the amounts presented in the Statement of Net Assets.
15
For both constant duration and fixed maturity synthetic GICs, the fair values of wrap contracts provided by issuers are valued by Mellon using the combination of a cost and income approach. The cost approach is used to determine a replacement value of each contract based on an internal pricing matrix developed by the portfolio management and trading team of Mellon. The income approach is used to determine the present value of the fee payments related to the contract, using both the current contractual fees as well as the replacement fees generated by the matrix pricing. The fee payments over the duration of the contract are discounted by using comparable duration swap rates. The carrying value of the contract is the present value of the wrapper cost applying replacement fees less the present value of the wrapper cost applying current contractual fees.
$
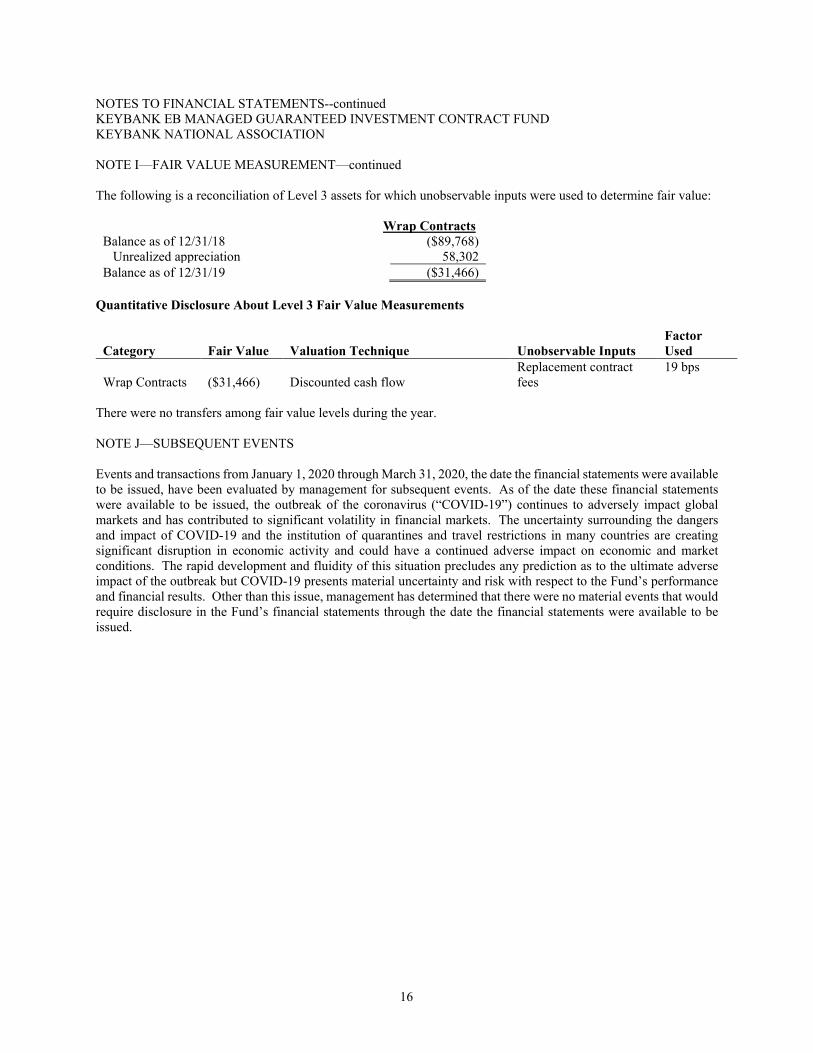
NOTES TO FINANCIAL STATEMENTS--continued KEYBANK EB MANAGED GUARANTEED INVESTMENT CONTRACT FUND KEYBANK NATIONAL ASSOCIATION NOTE I—FAIR VALUE MEASUREMENT—continued The following is a reconciliation of Level 3 assets for which unobservable inputs were used to determine fair value: Wrap Contracts
Balance as of 12/31/18 ($89,768) Unrealized appreciation 58,302 Balance as of 12/31/19 ($31,466)
Quantitative Disclosure About Level 3 Fair Value Measurements
Category Fair Value Valuation Technique Unobservable Inputs Factor Used
Wrap Contracts ($31,466) Discounted cash flow Replacement contract fees
19 bps
There were no transfers among fair value levels during the year. NOTE J—SUBSEQUENT EVENTS Events and transactions from January 1, 2020 through March 31, 2020, the date the financial statements were available to be issued, have been evaluated by management for subsequent events. As of the date these financial statements were available to be issued, the outbreak of the coronavirus (“COVID-19”) continues to adversely impact global markets and has contributed to significant volatility in financial markets. The uncertainty surrounding the dangers and impact of COVID-19 and the institution of quarantines and travel restrictions in many countries are creating significant disruption in economic activity and could have a continued adverse impact on economic and market conditions. The rapid development and fluidity of this situation precludes any prediction as to the ultimate adverse impact of the outbreak but COVID-19 presents material uncertainty and risk with respect to the Fund’s performance and financial results. Other than this issue, management has determined that there were no material events that would require disclosure in the Fund’s financial statements through the date the financial statements were available to be issued.
16
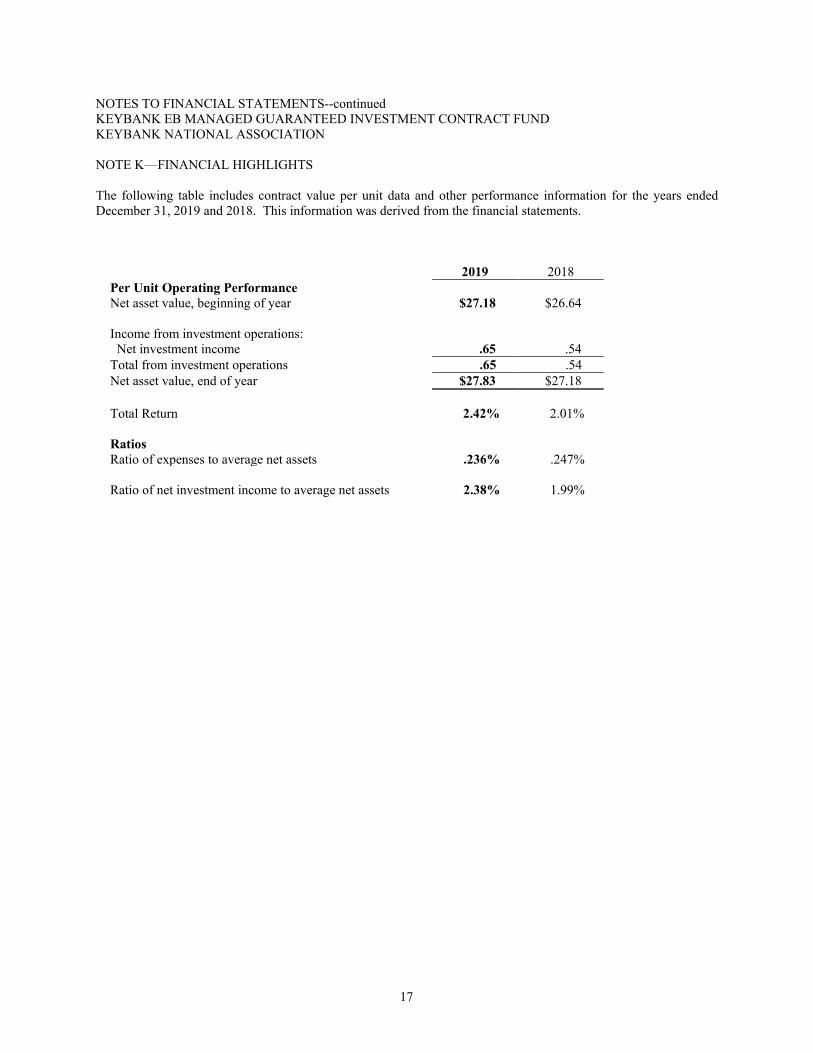
NOTES TO FINANCIAL STATEMENTS--continued KEYBANK EB MANAGED GUARANTEED INVESTMENT CONTRACT FUND KEYBANK NATIONAL ASSOCIATION NOTE K—FINANCIAL HIGHLIGHTS The following table includes contract value per unit data and other performance information for the years ended December 31, 2019 and 2018. This information was derived from the financial statements.
2019 2018
Per Unit Operating Performance Net asset value, beginning of year $27.18 $26.64 Income from investment operations: Net investment income .65 .54 Total from investment operations .65 .54 Net asset value, end of year $27.83 $27.18 Total Return 2.42% 2.01% Ratios Ratio of expenses to average net assets .236% .247% Ratio of net investment income to average net assets 2.38% 1.99%
17

SUPPLEMENTARY INFORMATIONINVESTMENT PURCHASED KEYBANK EB MANAGED GUARANTEED INVESTMENT CONTRACT FUNDKEYBANK NATIONAL ASSOCIATIONYear Ended December 31, 2019
Units CostSHORT-TERM INVESTMENT
86,047,335 EB Short Term Investment Fund of KeyBank National Association $86,047,335
18
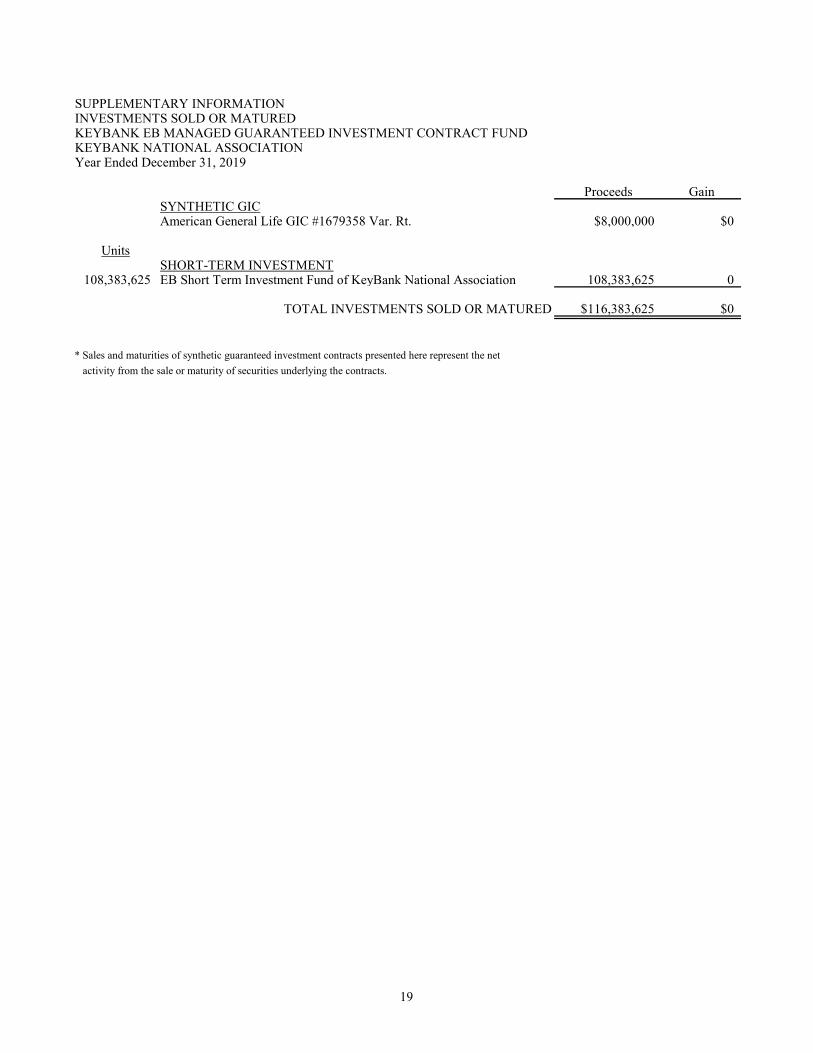
SUPPLEMENTARY INFORMATIONINVESTMENTS SOLD OR MATUREDKEYBANK EB MANAGED GUARANTEED INVESTMENT CONTRACT FUNDKEYBANK NATIONAL ASSOCIATIONYear Ended December 31, 2019
Proceeds GainSYNTHETIC GICAmerican General Life GIC #1679358 Var. Rt. $8,000,000 $0
UnitsSHORT-TERM INVESTMENT
108,383,625 EB Short Term Investment Fund of KeyBank National Association 108,383,625 0
TOTAL INVESTMENTS SOLD OR MATURED $116,383,625 $0
* Sales and maturities of synthetic guaranteed investment contracts presented here represent the net activity from the sale or maturity of securities underlying the contracts.
19