keybanc capital markets’ industrial, automotive .../media/files/t/tenneco-ir/...nvh solutions ride...
TRANSCRIPT

NYSE: TENBoston, MAMay 31, 2017
KeyBanc Capital Markets’ Industrial, Automotive & Transportation Conference
Safe HarborThis presentation contains forward-looking statements that involve risks and uncertainties which could cause the company’s plans, actionsand results to differ materially from its current expectations. The words “expect,” “estimate,” “will,” and similar expressions identify certain ofthese forward-looking statements. The company cautions that actual results may differ materially from those projected or implied in forward-looking statements due to a variety of factors including, but not limited to, the following: (i) general economic, business and marketconditions; (ii) the company’s ability to source needed goods and services in accordance with customer demand and at competitive prices;(iii) the cost and outcome of claims, legal proceedings or investigations, including, but not limited to, those arising in connection with theongoing global antitrust investigation, product safety or intellectual property rights; (iv) the impact of the changing laws and regulations towhich we are subject, including environmental laws and regulations, pensions or other regulated activities; (v) the ability of the company toaccess capital markets on commercially reasonable terms; (vi) changes in consumer demand; (vii) changes in vehicle manufacturers’production rates and their requirements for the company’s products, including with respect to any delays in the adoption of the currentmandated timelines for worldwide emissions regulations; (viii) the overall highly competitive nature of the automobile and commercialvehicle parts industry, and any resultant inability to realize the sales represented by the company’s awarded book of business which isbased on anticipated pricing for the applicable program over its life; (ix) the loss of any of our large original equipment manufacturer(“OEM”) customers, or the loss of market shares by these customers if we are unable to achieve increased sales to other OEMs; (x) thecompany’s continued success in cost reduction and cash management programs; (xi) economic, exchange rate and political conditions inthe countries where we operate or sell our products; (xii) workforce factors such as strikes or labor interruptions; (xiii) increases in the costsof raw materials; (xiv) the negative impact of fuel price volatility on logistics costs and discretionary purchases of vehicles or aftermarketproducts, and demand for off-highway equipment; (xv) the cyclical nature of the global vehicular industry, including the performance of theglobal aftermarket sector and longer product lives of automobile parts; (xvi) product warranty costs; (xvii) material developments relating toour intellectual property or the failure or breach of our IT systems; (xviii) the company’s ability to develop and profitably commercialize newproducts and technologies; (xix) governmental actions, including the ability to receive regulatory approvals and the timing of suchapprovals; and (xx) the timing and occurrence (or non-occurrence) of transactions and events which may be subject to circumstancesbeyond the control of the company. Additional information regarding these and other risk factors and uncertainties is detailed from time totime in the company’s SEC filings, including but not limited to its annual report on Form 10-K. Unless otherwise indicated in thispresentation, the forward-looking statements in this presentation are made as of the date hereof, and the company does not undertake anyobligation to publicly disclose revisions or updates to any forward-looking statements.
2
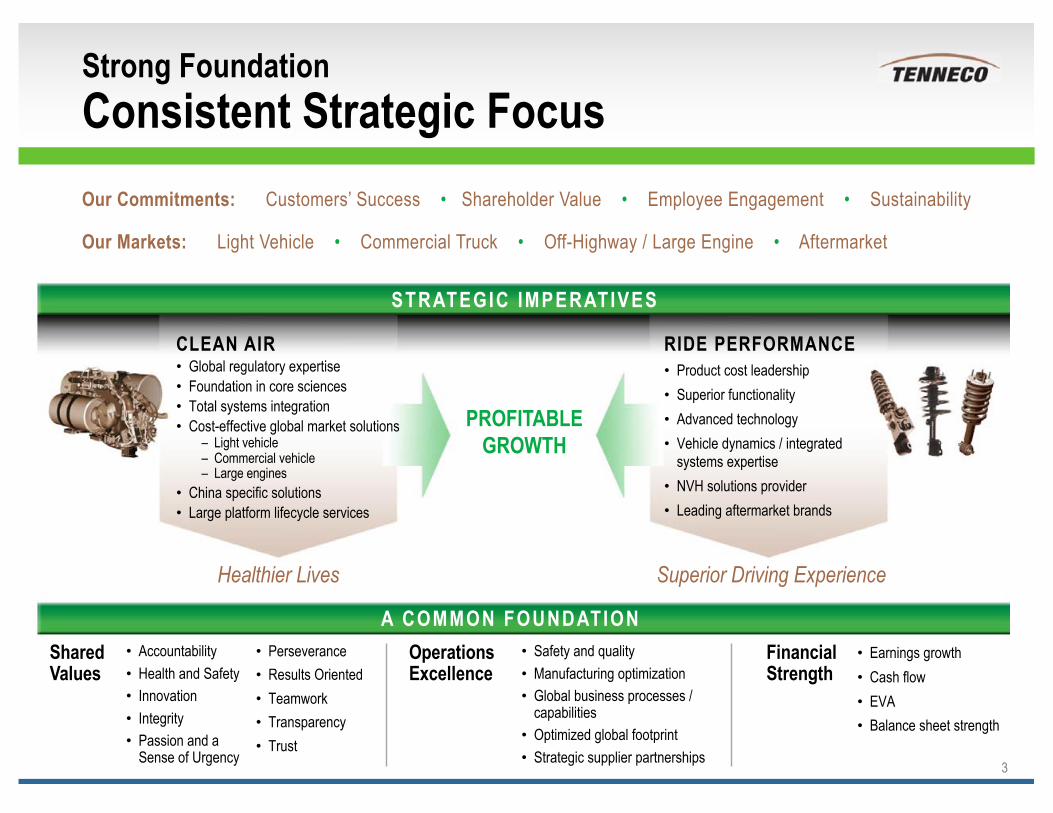
Strong Foundation Consistent Strategic Focus
3
Our Commitments: Customers’ Success • Shareholder Value • Employee Engagement • Sustainability
Our Markets: Light Vehicle • Commercial Truck • Off-Highway / Large Engine • Aftermarket
Operations Excellence
Financial Strength
Safety and qualityManufacturing optimizationGlobal business processes / capabilitiesOptimized global footprintStrategic supplier partnerships
Earnings growthCash flowEVABalance sheet strength
Shared Values
AccountabilityHealth and SafetyInnovationIntegrityPassion and a Sense of Urgency
STRATEGIC IMPERATIVES
PROFITABLEGROWTH
CLEAN AIRGlobal regulatory expertiseFoundation in core sciencesTotal systems integrationCost-effective global market solutions
– Light vehicle– Commercial vehicle– Large engines
China specific solutionsLarge platform lifecycle services
RIDE PERFORMANCEProduct cost leadershipSuperior functionalityAdvanced technologyVehicle dynamics / integrated systems expertiseNVH solutions providerLeading aftermarket brands
Healthier Lives Superior Driving Experience
A COMMON FOUNDATIONPerseveranceResults OrientedTeamworkTransparencyTrust

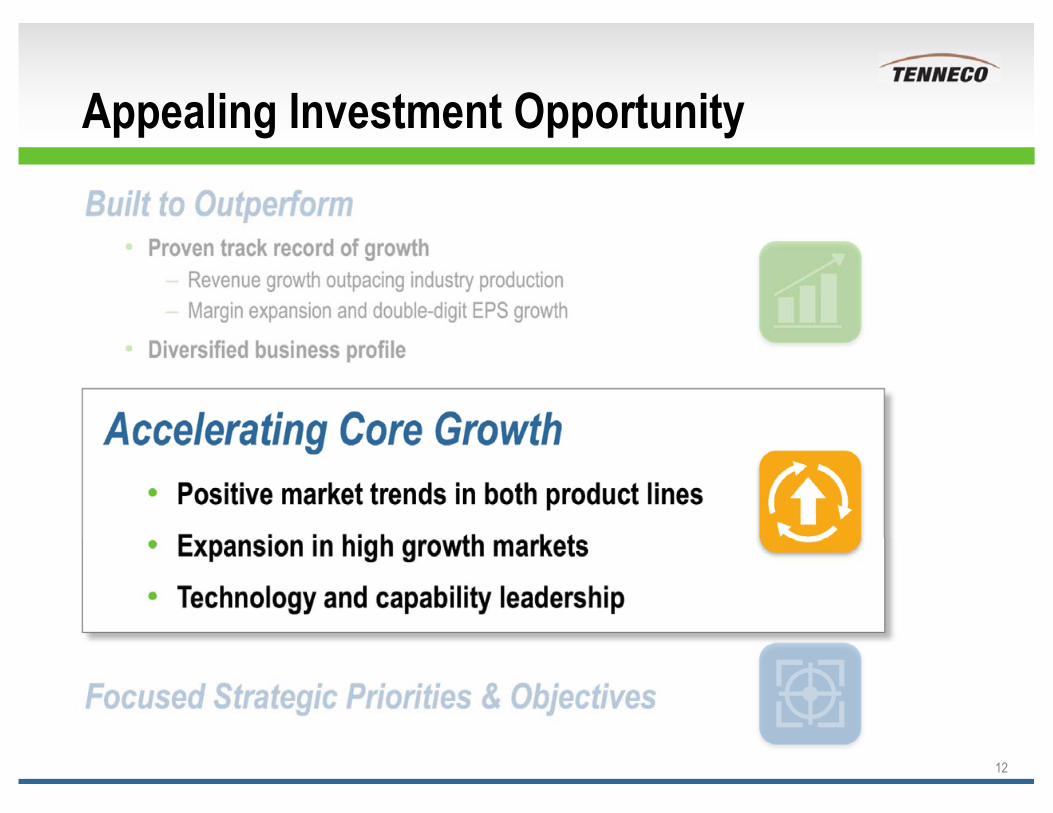
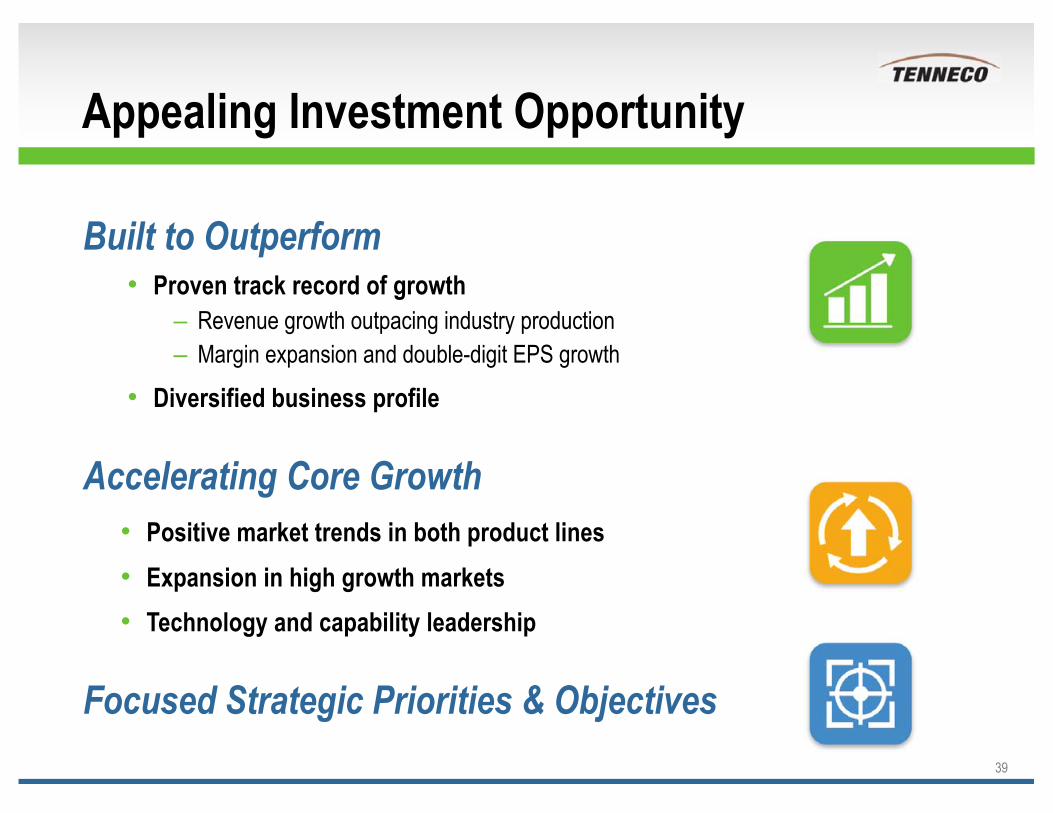
Appealing Investment Opportunity
Built to OutperformProven track record of growth
Revenue growth outpacing industry productionMargin expansion and double-digit EPS growth
Diversified business profile
Accelerating Core GrowthPositive market trends in both product linesExpansion in high growth marketsTechnology and capability leadership
Focused Strategic Priorities & Objectives
4
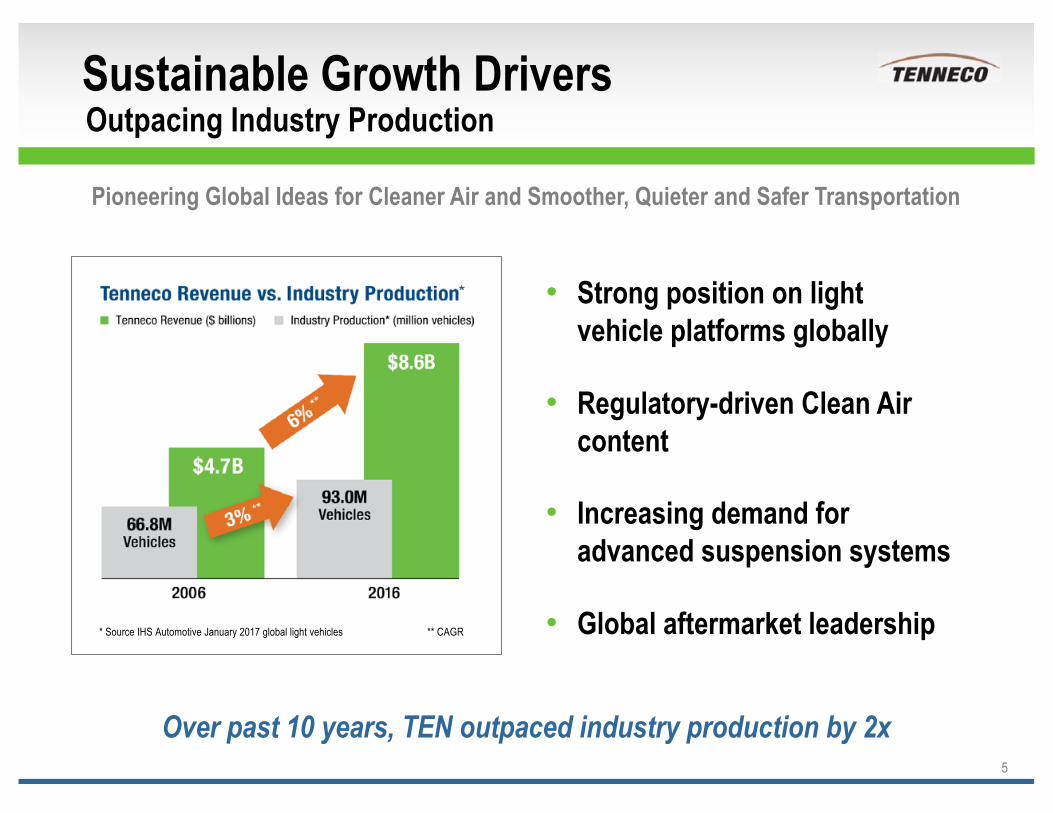
Sustainable Growth DriversOutpacing Industry Production
Strong position on light vehicle platforms globally
Regulatory-driven Clean Air content
Increasing demand for advanced suspension systems
Global aftermarket leadership
5
Over past 10 years, TEN outpaced industry production by 2x
* Source IHS Automotive January 2017 global light vehicles ** CAGR
Pioneering Global Ideas for Cleaner Air and Smoother, Quieter and Safer Transportation
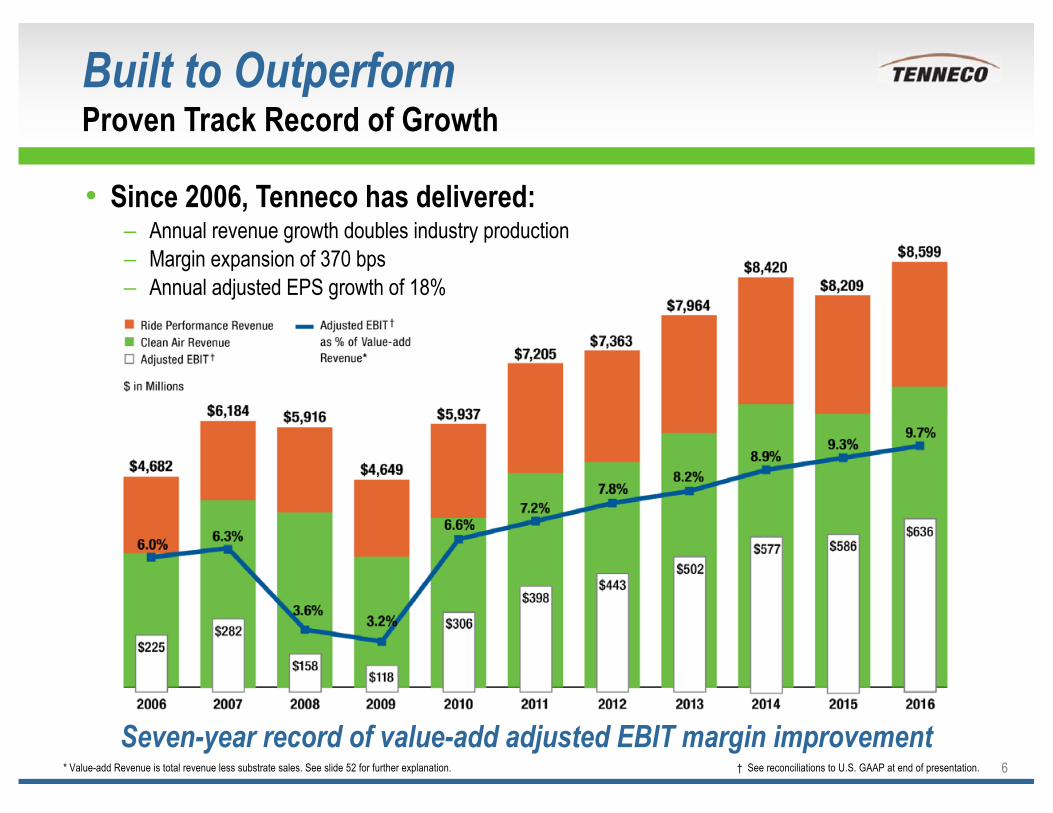
Built to Outperform Proven Track Record of Growth
Since 2006, Tenneco has delivered:Annual revenue growth doubles industry productionMargin expansion of 370 bpsAnnual adjusted EPS growth of 18%
Seven-year record of value-add adjusted EBIT margin improvement* Value-add Revenue is total revenue less substrate sales. See slide 52 for further explanation. † See reconciliations to U.S. GAAP at end of presentation. 6
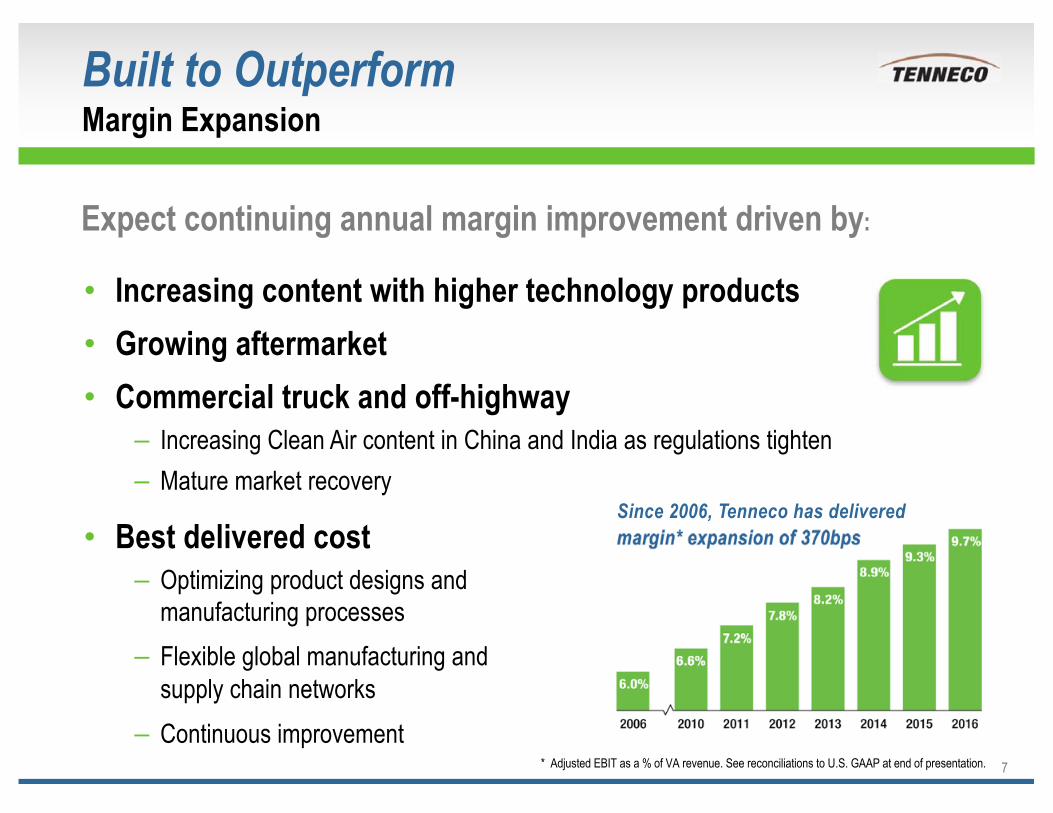
Built to Outperform Margin Expansion
7
Expect continuing annual margin improvement driven by:
Increasing content with higher technology products Growing aftermarket Commercial truck and off-highway– Increasing Clean Air content in China and India as regulations tighten– Mature market recovery
* Adjusted EBIT as a % of VA revenue. See reconciliations to U.S. GAAP at end of presentation.
Since 2006, Tenneco has delivered margin* expansion of 370bpsBest delivered cost
– Optimizing product designs and manufacturing processes
– Flexible global manufacturing and supply chain networks
– Continuous improvement
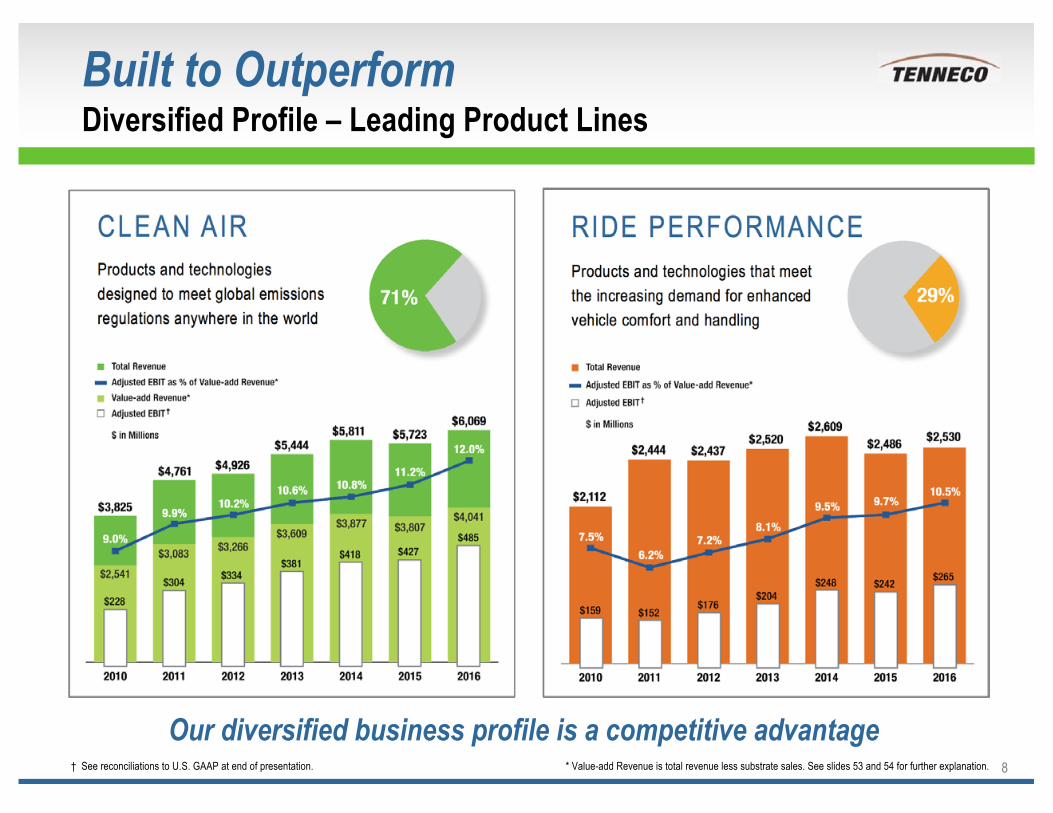
Built to Outperform Diversified Profile – Leading Product Lines
8† See reconciliations to U.S. GAAP at end of presentation. * Value-add Revenue is total revenue less substrate sales. See slides 53 and 54 for further explanation.
CLEAN AIR RIDE PERFORMANCEProducts and technologies designed to meet global emissions regulations anywhere in the world
Products and technologies that meet the increasing demand for enhanced vehicle comfort and handling
Our diversified business profile is a competitive advantage
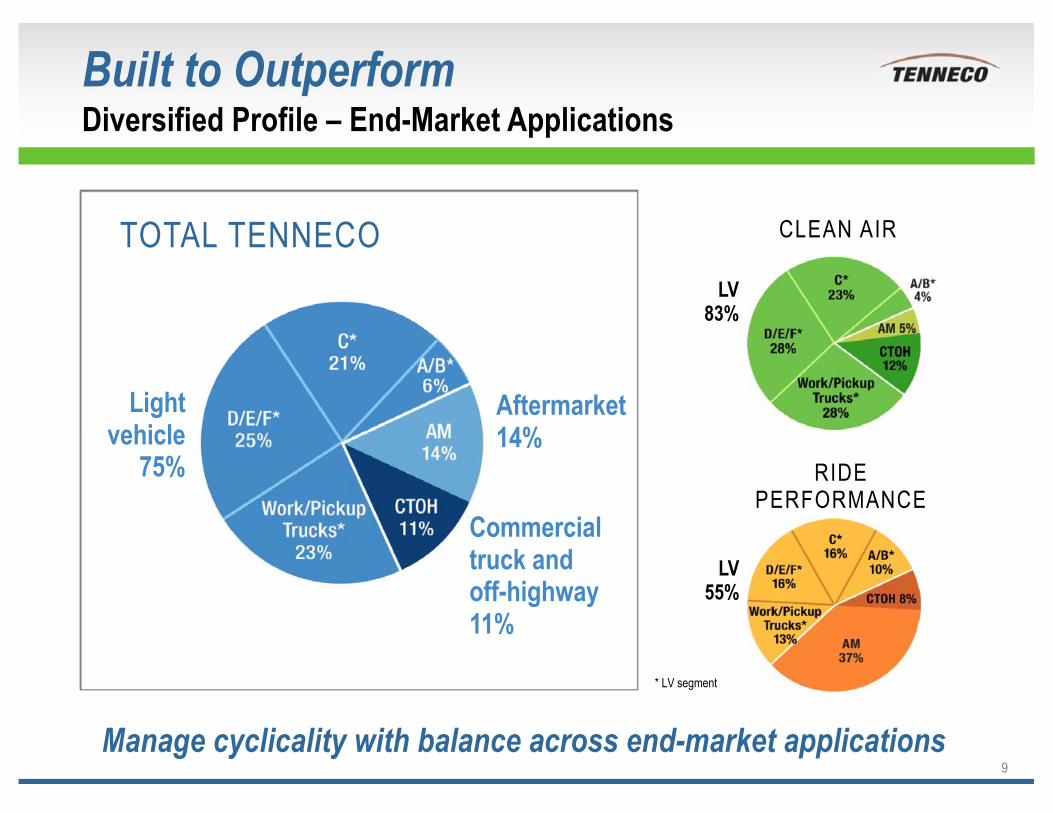
Built to OutperformDiversified Profile – End-Market Applications
9Manage cyclicality with balance across end-market applications
CLEAN AIR
LV83%
RIDE PERFORMANCE
LV55%
TOTAL TENNECO
Light vehicle
75%
Commercial truck and off-highway11%
Aftermarket14%
* LV segment
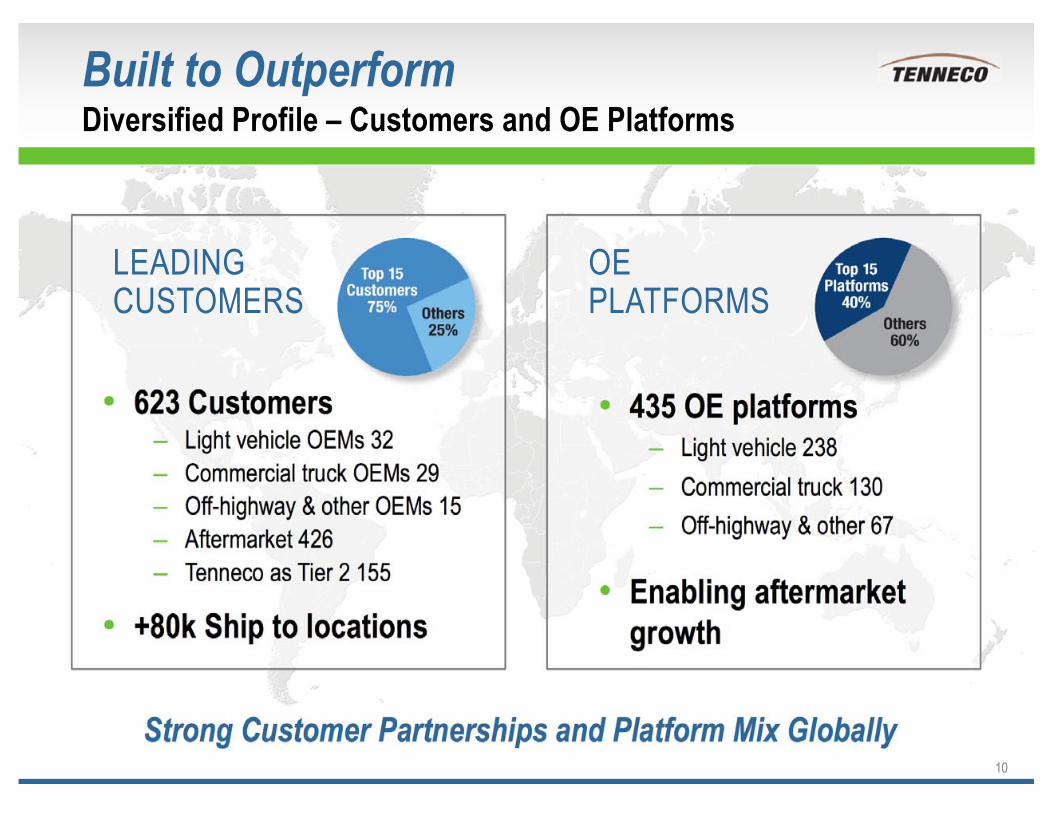
Built to Outperform Diversified Profile – Customers and OE Platforms
10
Strong Customer Partnerships and Platform Mix Globally
623 CustomersLight vehicle OEMs 32Commercial truck OEMs 29Off-highway & other OEMs 15Aftermarket 426Tenneco as Tier 2 155
+80k Ship to locations
435 OE platformsLight vehicle 238Commercial truck 130Off-highway & other 67
Enabling aftermarket growth
LEADING CUSTOMERS
OEPLATFORMS
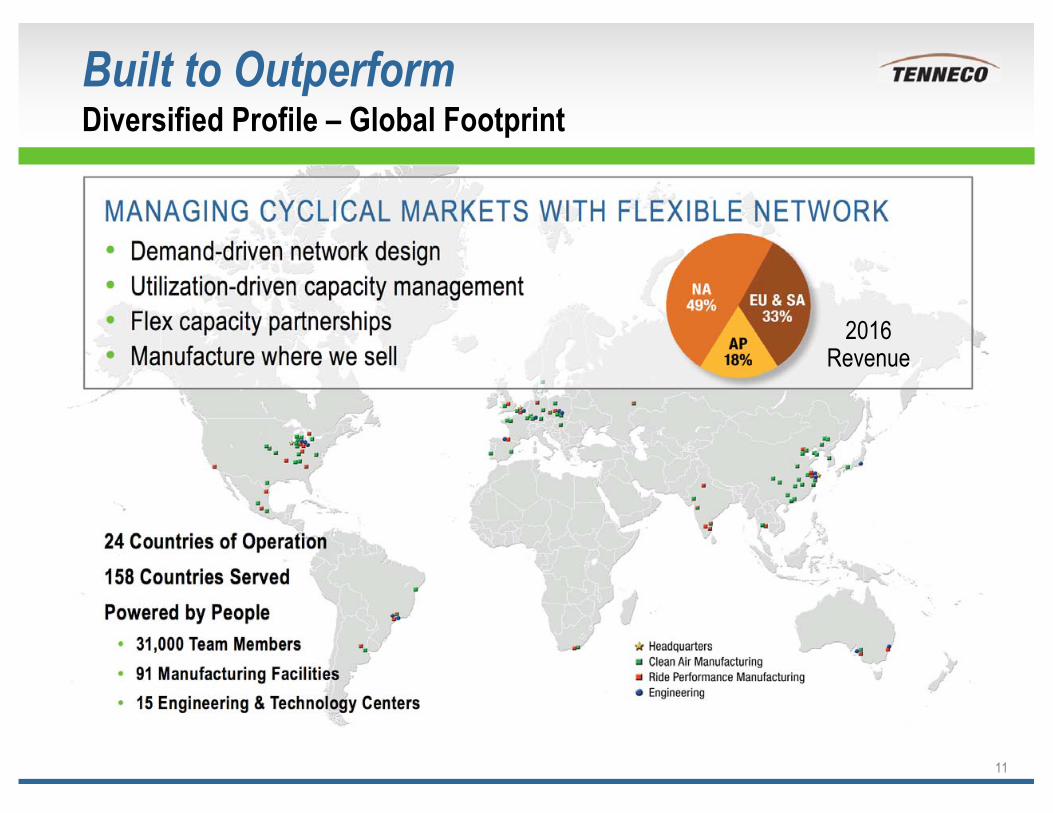
Built to Outperform Diversified Profile – Global Footprint
11
24 Countries of Operation 158 Countries ServedPowered by People
31,000 Team Members91 Manufacturing Facilities15 Engineering & Technology Centers
MANAGING CYCLICAL MARKETS WITH FLEXIBLE NETWORKDemand-driven network designUtilization-driven capacity managementFlex capacity partnershipsManufacture where we sell
2016 Revenue
Appealing Investment Opportunity
12
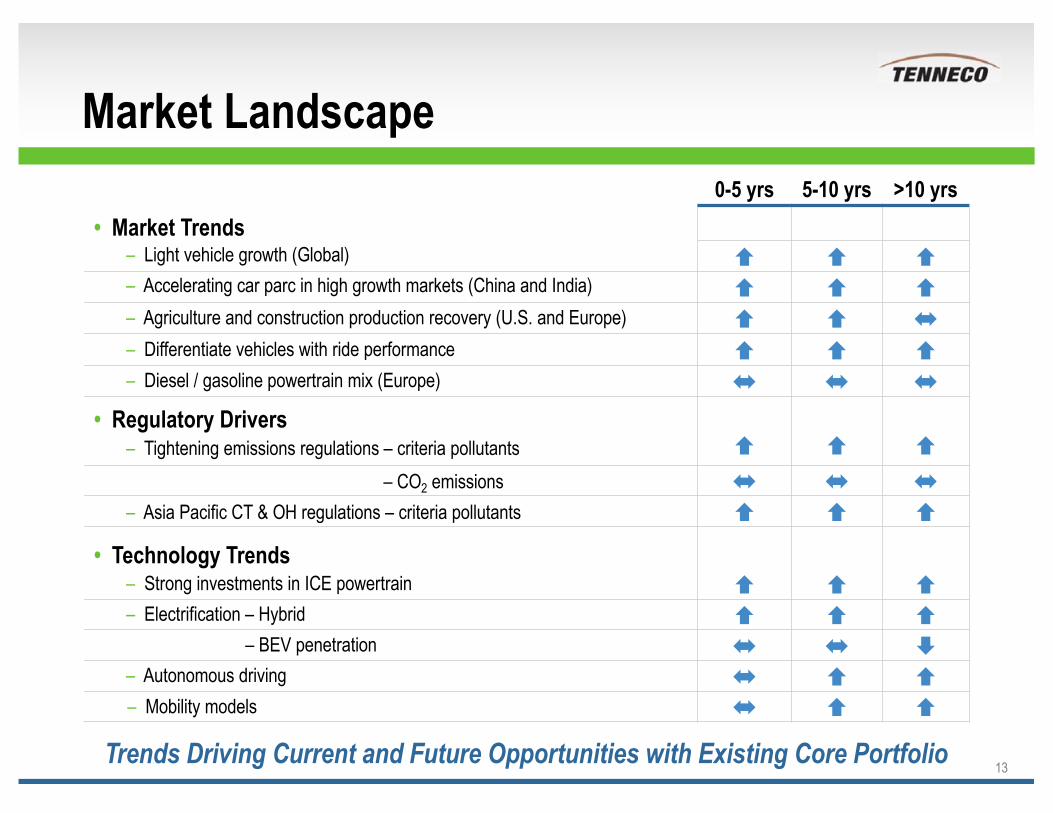
0-5 yrs 5-10 yrs >10 yrs• Market Trends
– Light vehicle growth (Global)– Accelerating car parc in high growth markets (China and India)– Agriculture and construction production recovery (U.S. and Europe)– Differentiate vehicles with ride performance– Diesel / gasoline powertrain mix (Europe)
• Regulatory Drivers– Tightening emissions regulations – criteria pollutants
– CO2 emissions– Asia Pacific CT & OH regulations – criteria pollutants
• Technology Trends– Strong investments in ICE powertrain– Electrification – Hybrid
– BEV penetration– Autonomous driving– Mobility models
Market Landscape
13Trends Driving Current and Future Opportunities with Existing Core Portfolio
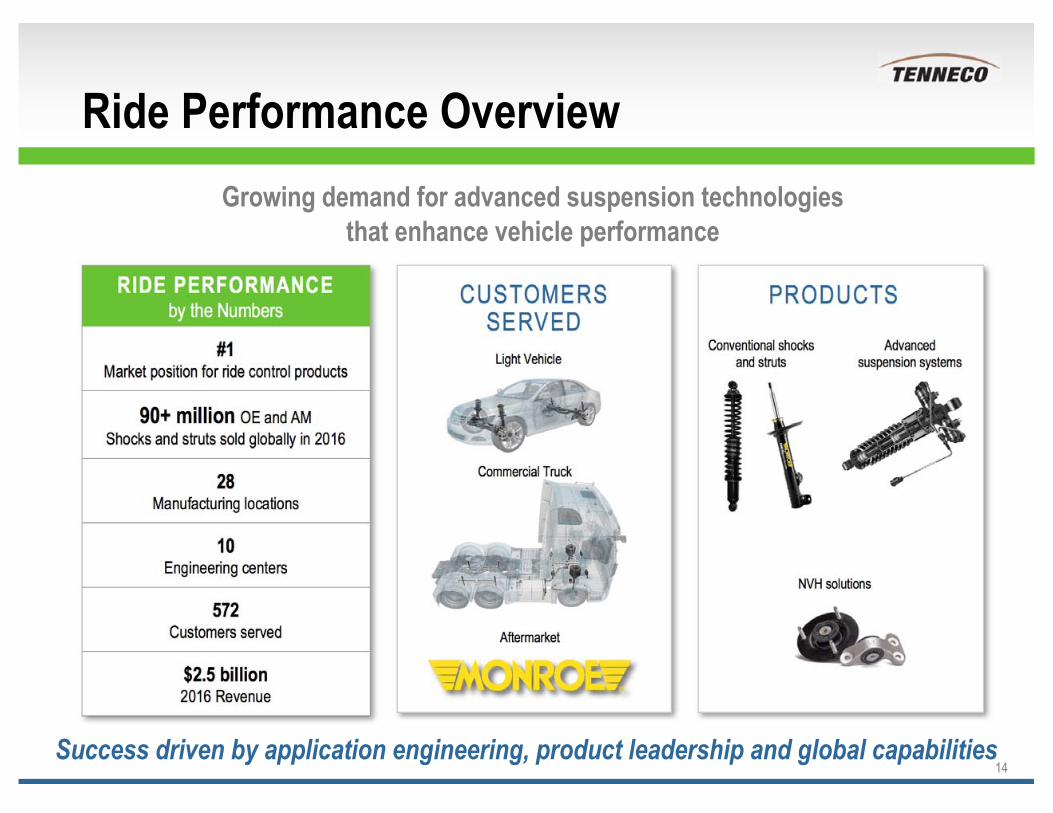
Ride Performance Overview
14
Conventional shocks and struts
Advanced suspension systems
NVH solutions
RIDE PERFORMANCEby the Numbers
#1Market position for ride control products
90+ million OE and AMShocks and struts sold globally in 2016
28 Manufacturing locations
10Engineering centers
572Customers served
$2.5 billion2016 Revenue
Light Vehicle
Commercial Truck
PRODUCTSCUSTOMERS SERVED
Growing demand for advanced suspension technologiesthat enhance vehicle performance
Success driven by application engineering, product leadership and global capabilities
Aftermarket
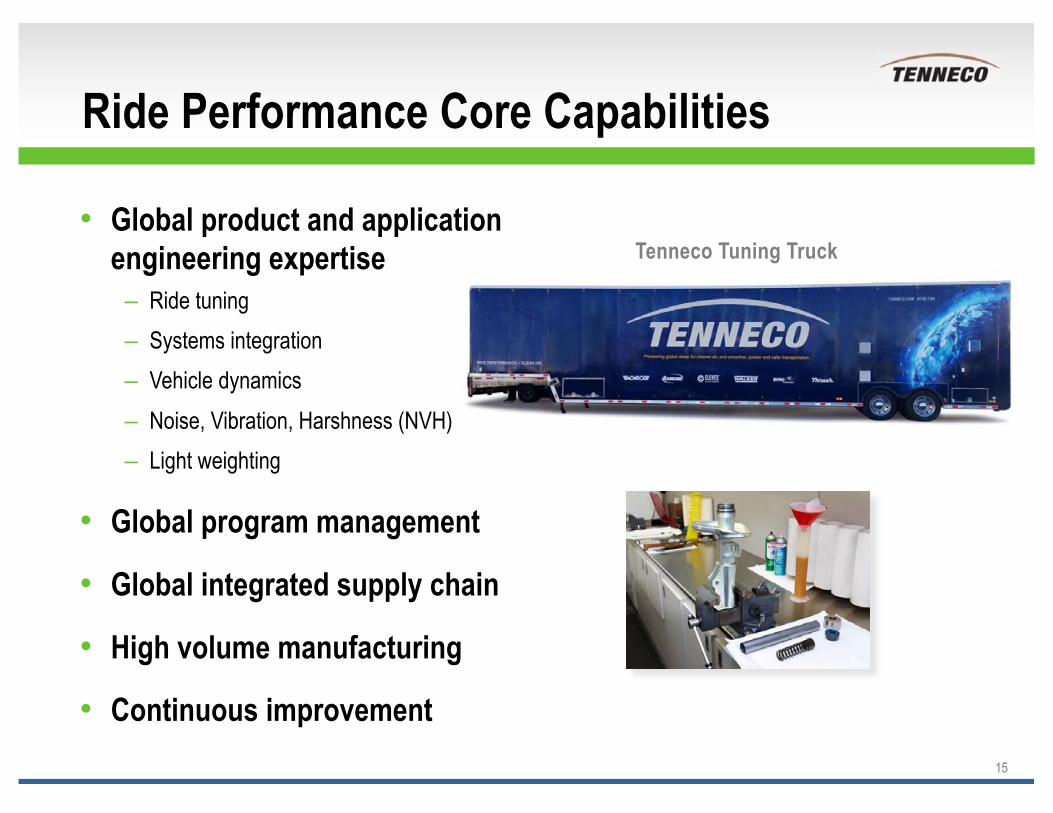
Ride Performance Core Capabilities
15
Global product and application engineering expertise
Ride tuningSystems integrationVehicle dynamicsNoise, Vibration, Harshness (NVH)Light weighting
Global program management
Global integrated supply chain
High volume manufacturing
Continuous improvement
Tenneco Tuning Truck
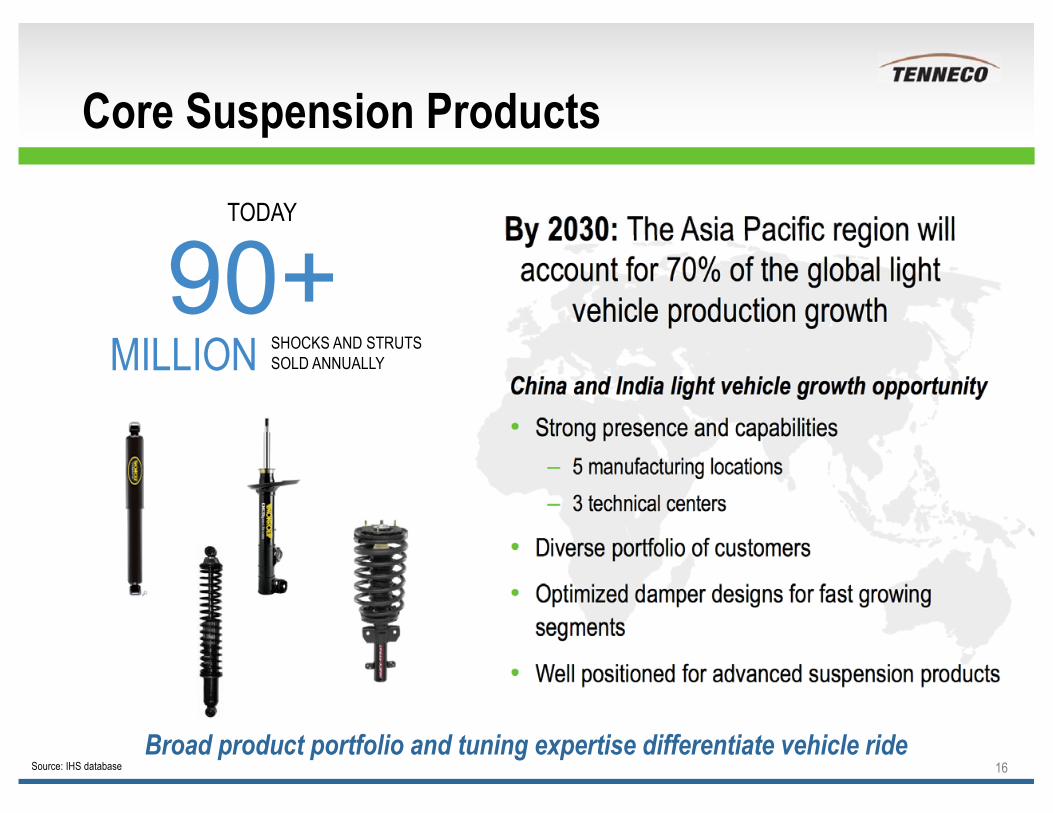
Core Suspension Products
China and India light vehicle growth opportunity
Strong presence and capabilities– 5 manufacturing locations– 3 technical centers
Diverse portfolio of customers
Optimized damper designs for fast growing segments
Well positioned for advanced suspension products
16
By 2030: The Asia Pacific region will account for 70% of the global light
vehicle production growthMILLION SHOCKS AND STRUTS
SOLD ANNUALLY
Source: IHS database
TODAY
Broad product portfolio and tuning expertise differentiate vehicle ride
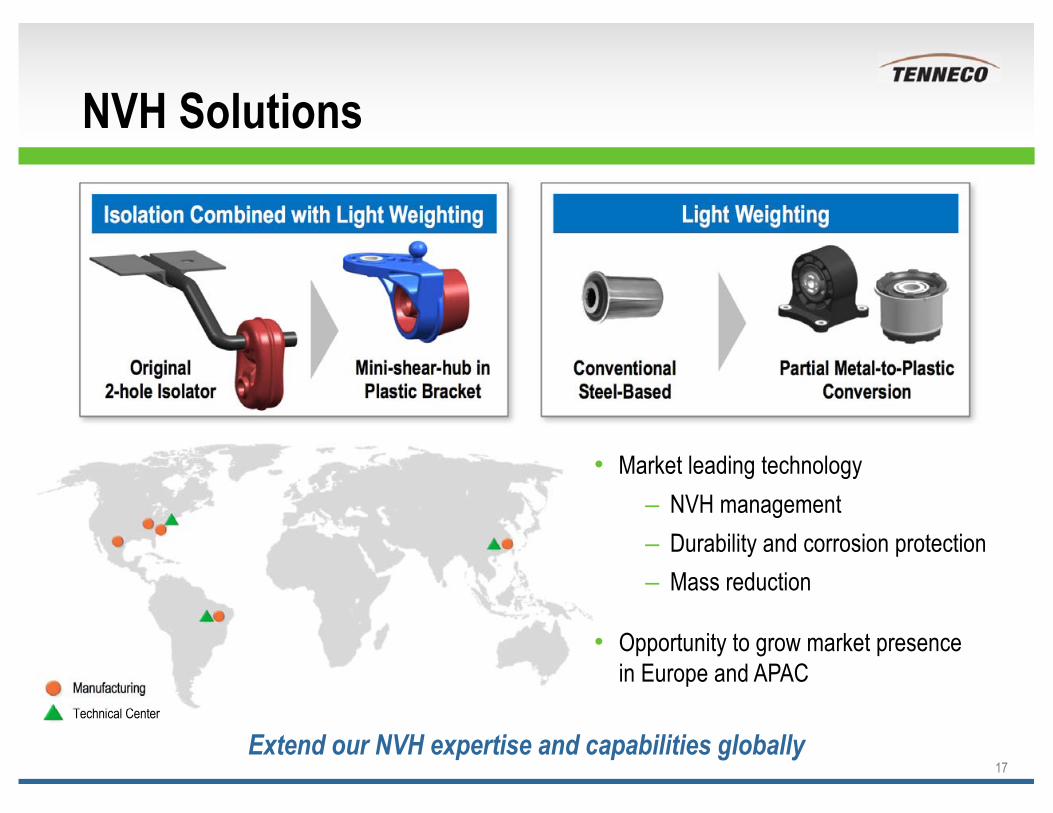
NVH Solutions
Market leading technologyNVH managementDurability and corrosion protectionMass reduction
Opportunity to grow market presence in Europe and APAC
17
Isolation Combined with Light Weighting
Mini-shear-hub in Plastic Bracket
Original 2-hole Isolator
Light Weighting
Conventional Steel-Based
Partial Metal-to-Plastic Conversion
Manufacturing
Technical Center
Extend our NVH expertise and capabilities globally
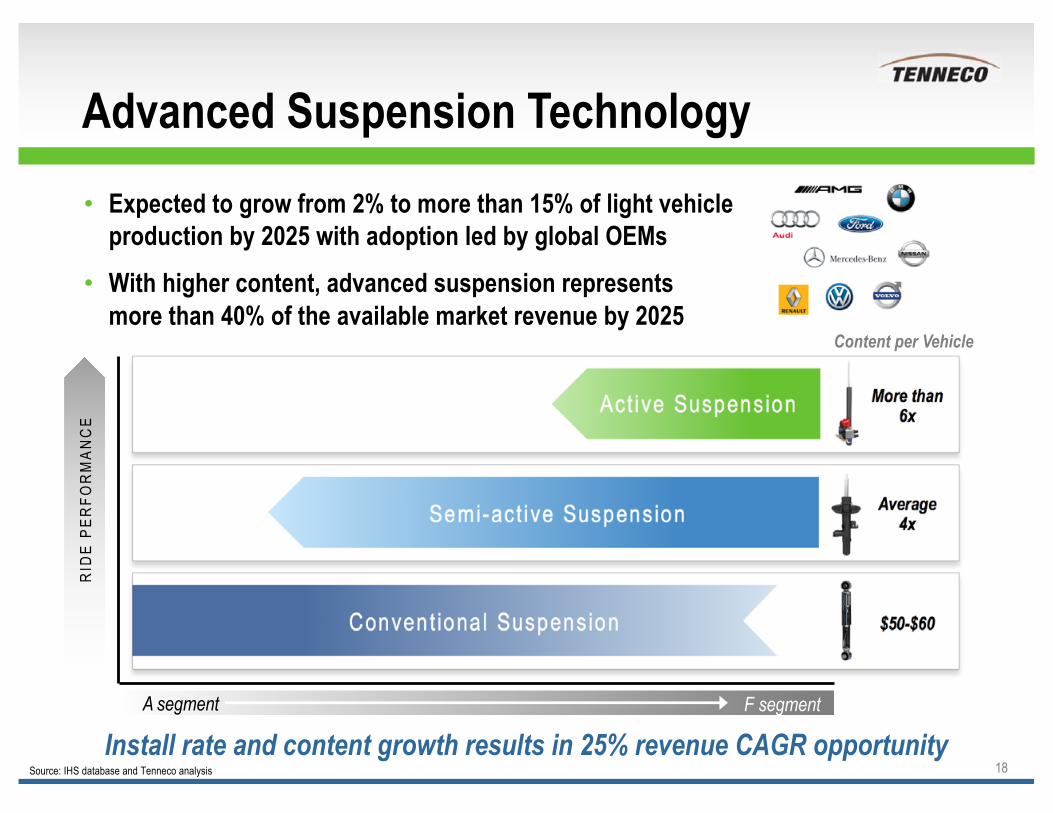
Advanced Suspension Technology
18
Expected to grow from 2% to more than 15% of light vehicle production by 2025 with adoption led by global OEMsWith higher content, advanced suspension represents more than 40% of the available market revenue by 2025
Install rate and content growth results in 25% revenue CAGR opportunitySource: IHS database and Tenneco analysis
RID
E PE
RFO
RM
ANC
E
More than6xAct ive Suspension
Average4xSemi-act ive Suspension
$50-$60Convent ional Suspension
A segment F segment
Content per Vehicle
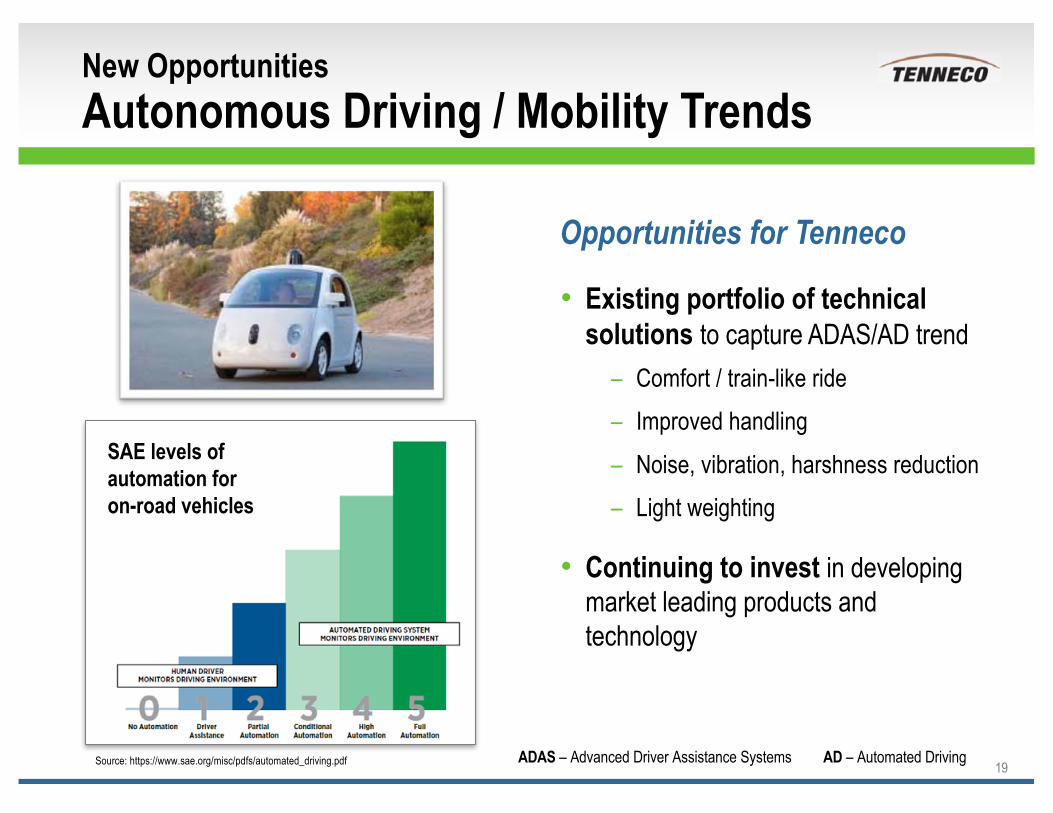
New Opportunities Autonomous Driving / Mobility Trends
Opportunities for Tenneco
Existing portfolio of technical solutions to capture ADAS/AD trend
– Comfort / train-like ride– Improved handling– Noise, vibration, harshness reduction– Light weighting
Continuing to invest in developing market leading products and technology
19
SAE levels of automation foron-road vehicles
Source: https://www.sae.org/misc/pdfs/automated_driving.pdf ADAS – Advanced Driver Assistance Systems AD – Automated Driving
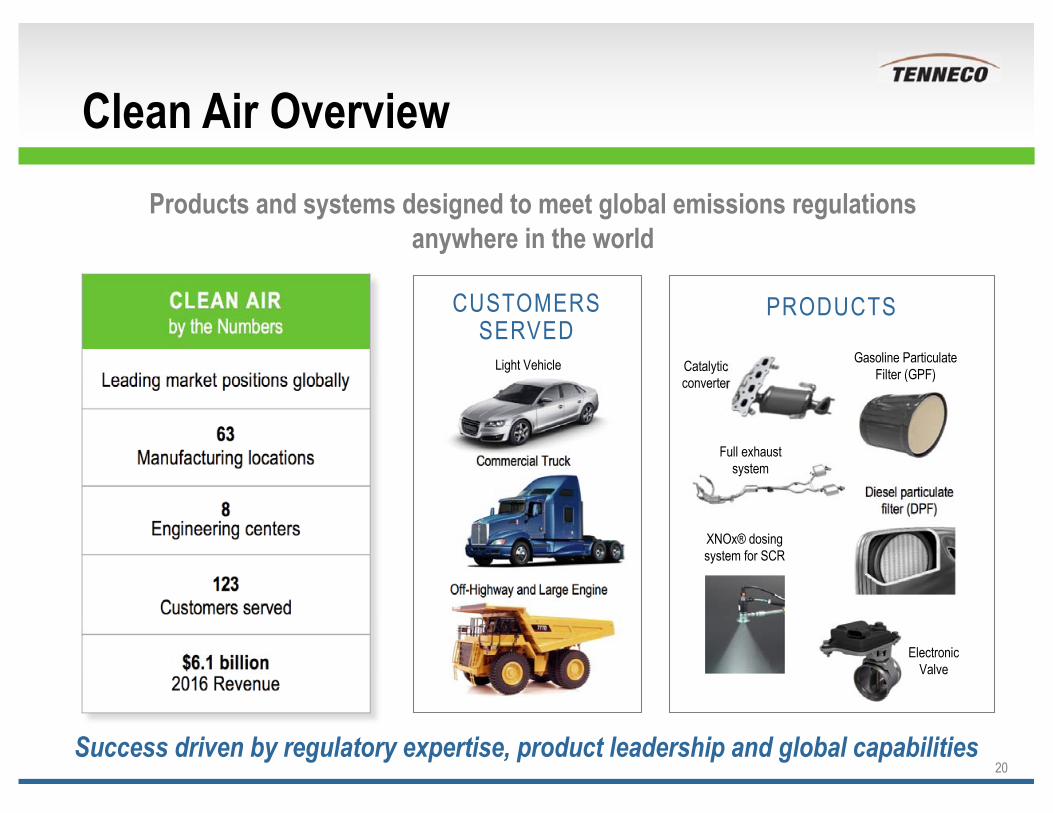
Clean Air Overview
20
Products and systems designed to meet global emissions regulationsanywhere in the world
Success driven by regulatory expertise, product leadership and global capabilities
PRODUCTS
Catalytic converter
Gasoline Particulate Filter (GPF)
Diesel particulate filter (DPF)
XNOx® dosing system for SCR
Electronic Valve
CLEAN AIRby the Numbers
Leading market positions globally
63 Manufacturing locations
8Engineering centers
123Customers served
$6.1 billion2016 Revenue
CUSTOMERS SERVED
Light Vehicle
Commercial Truck
Off-Highway and Large Engine
Full exhaust system
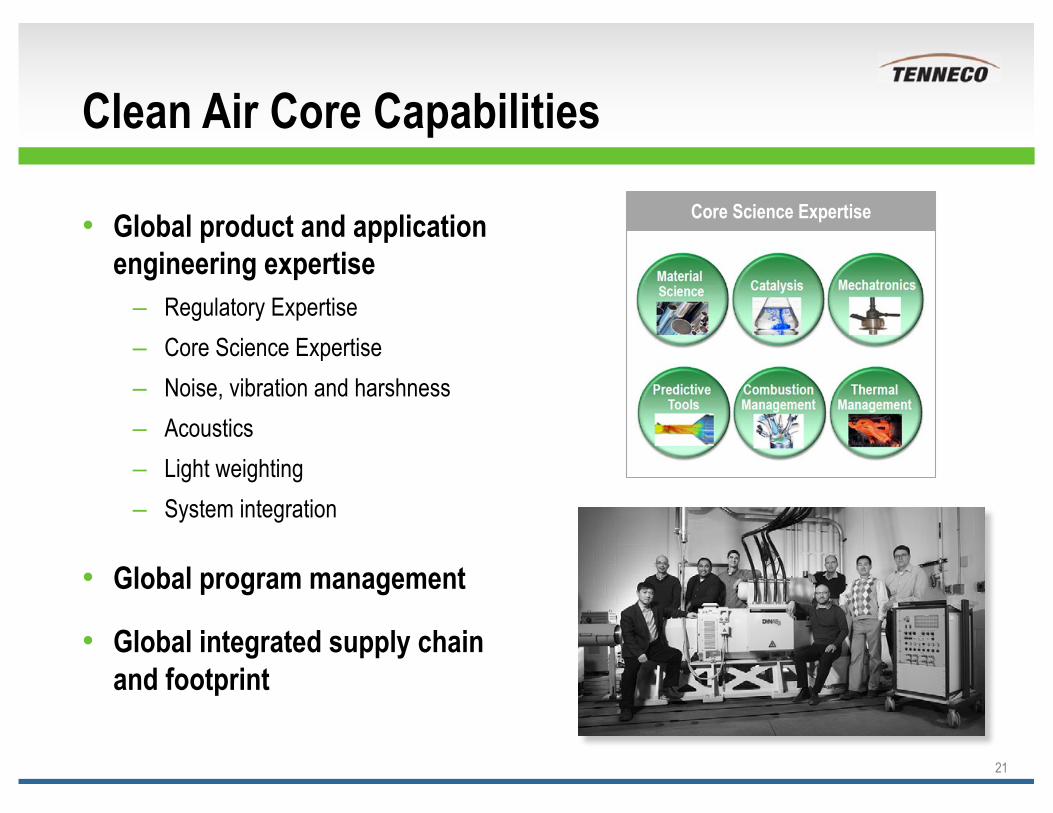
Clean Air Core Capabilities
Global product and application engineering expertise
Regulatory ExpertiseCore Science ExpertiseNoise, vibration and harshnessAcousticsLight weightingSystem integration
Global program management
Global integrated supply chain and footprint
21
Core Science Expertise
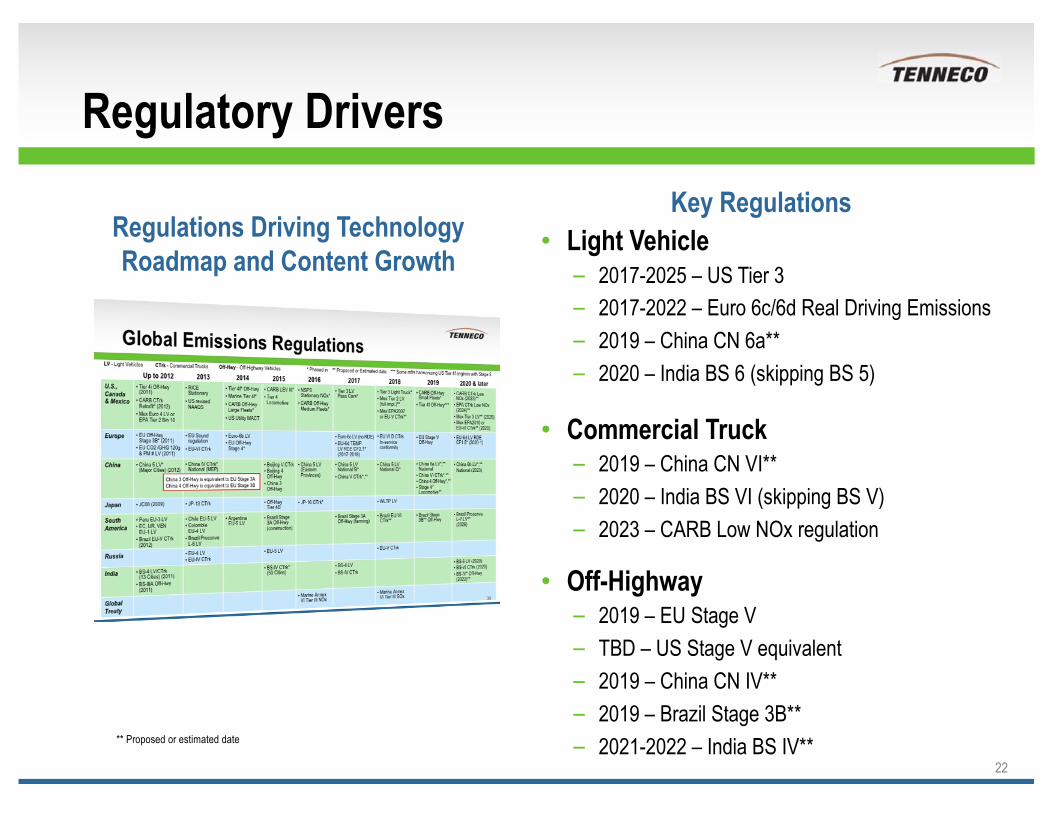
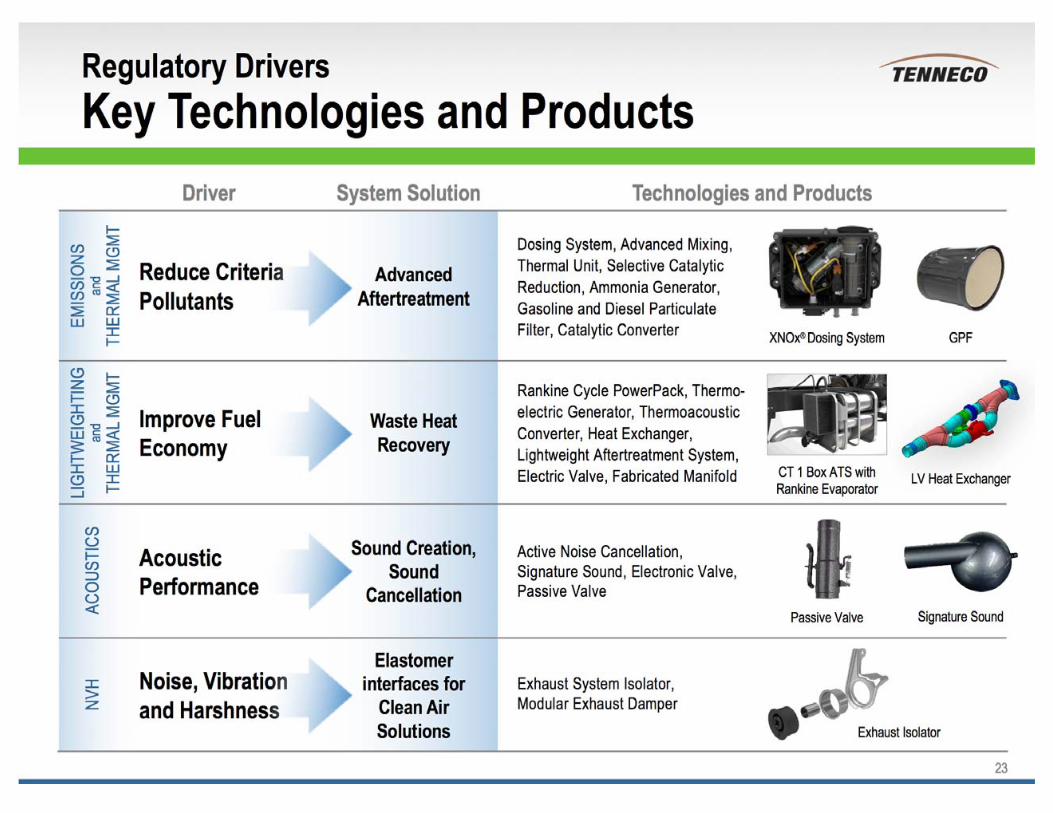
Regulatory Drivers
22
Light Vehicle– 2017-2025 – US Tier 3– 2017-2022 – Euro 6c/6d Real Driving Emissions– 2019 – China CN 6a**– 2020 – India BS 6 (skipping BS 5)
Commercial Truck– 2019 – China CN VI** – 2020 – India BS VI (skipping BS V)– 2023 – CARB Low NOx regulation
Off-Highway– 2019 – EU Stage V– TBD – US Stage V equivalent– 2019 – China CN IV**– 2019 – Brazil Stage 3B**– 2021-2022 – India BS IV**
Regulations Driving Technology Roadmap and Content Growth
Key Regulations
** Proposed or estimated date
EMIS
SION
S an
dTH
ERMA
L MGM
T
LIGHT
WEI
GHTI
NGan
dTH
ERMA
L MGM
TAC
OUST
ICS
NVH
Driver System Solution Technologies and Products
Reduce Criteria Pollutants
Advanced Aftertreatment
Improve FuelEconomy
Waste Heat Recovery
AcousticPerformance
Sound Creation,Sound
Cancellation
Noise, Vibration and Harshness
Elastomerinterfaces for
Clean Air Solutions
Regulatory DriversKey Technologies and Products
23
XNOx® Dosing System
LV Heat ExchangerCT 1 Box ATS with Rankine Evaporator
Passive Valve
Exhaust Isolator
GPF
Dosing System, Advanced Mixing, Thermal Unit, Selective Catalytic Reduction, Ammonia Generator, Gasoline and Diesel Particulate Filter, Catalytic Converter
Rankine Cycle PowerPack, Thermo-electric Generator, ThermoacousticConverter, Heat Exchanger, Lightweight Aftertreatment System, Electric Valve, Fabricated Manifold
Active Noise Cancellation, Signature Sound, Electronic Valve, Passive Valve
Exhaust System Isolator, Modular Exhaust Damper
Signature Sound
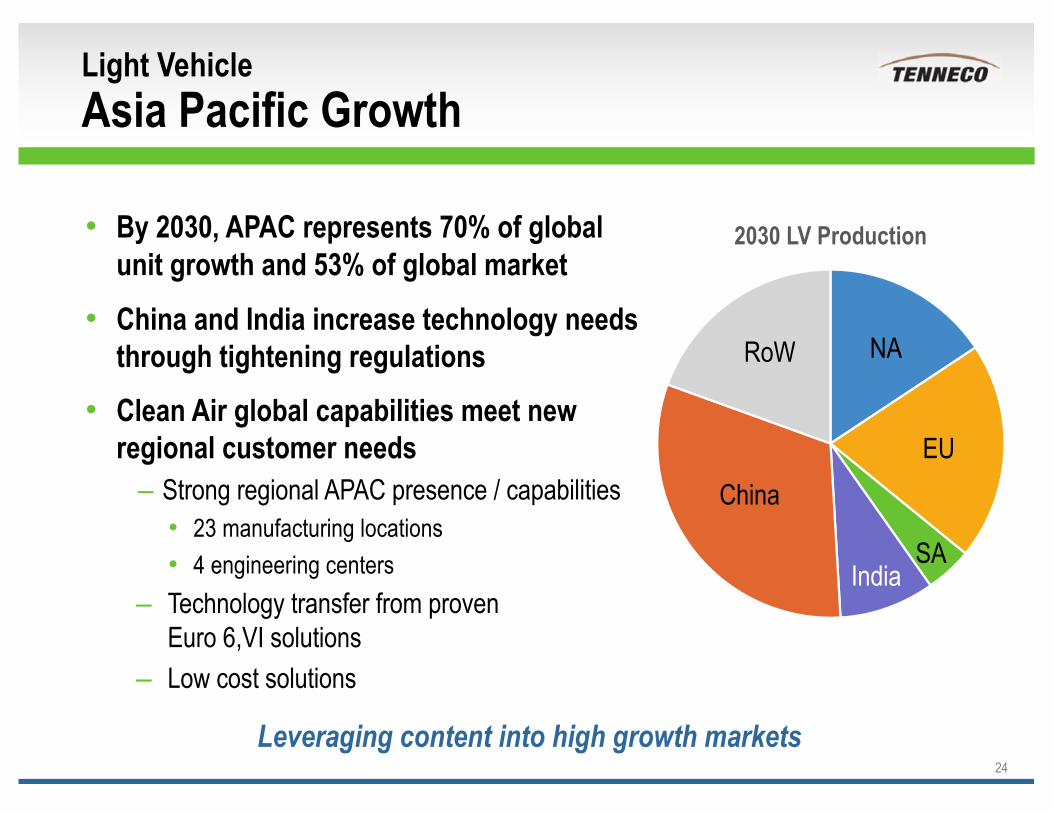
Light VehicleAsia Pacific Growth
By 2030, APAC represents 70% of global unit growth and 53% of global marketChina and India increase technology needs through tightening regulations Clean Air global capabilities meet new regional customer needs
Strong regional APAC presence / capabilities23 manufacturing locations4 engineering centers
Technology transfer from proven Euro 6,VI solutionsLow cost solutions
24
Leveraging content into high growth markets
China
NA
EU
RoW
IndiaSA
NA
EU
SAIndia
China
RoW
2030 LV Production
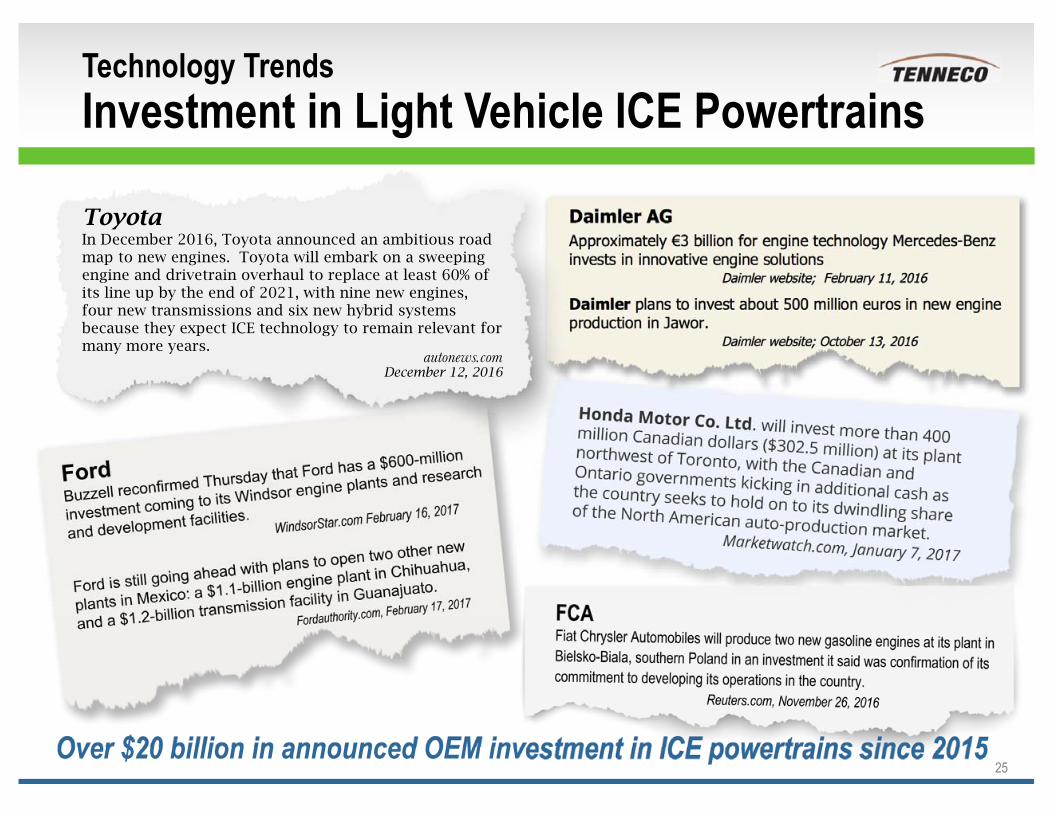
Technology TrendsInvestment in Light Vehicle ICE Powertrains
25Over $20 billion in announced OEM investment in ICE powertrains since 2015
Toyota In December 2016, Toyota announced an ambitious road map to new engines. Toyota will embark on a sweeping engine and drivetrain overhaul to replace at least 60% of its line up by the end of 2021, with nine new engines, four new transmissions and six new hybrid systems because they expect ICE technology to remain relevant for many more years. autonews.com
December 12, 2016
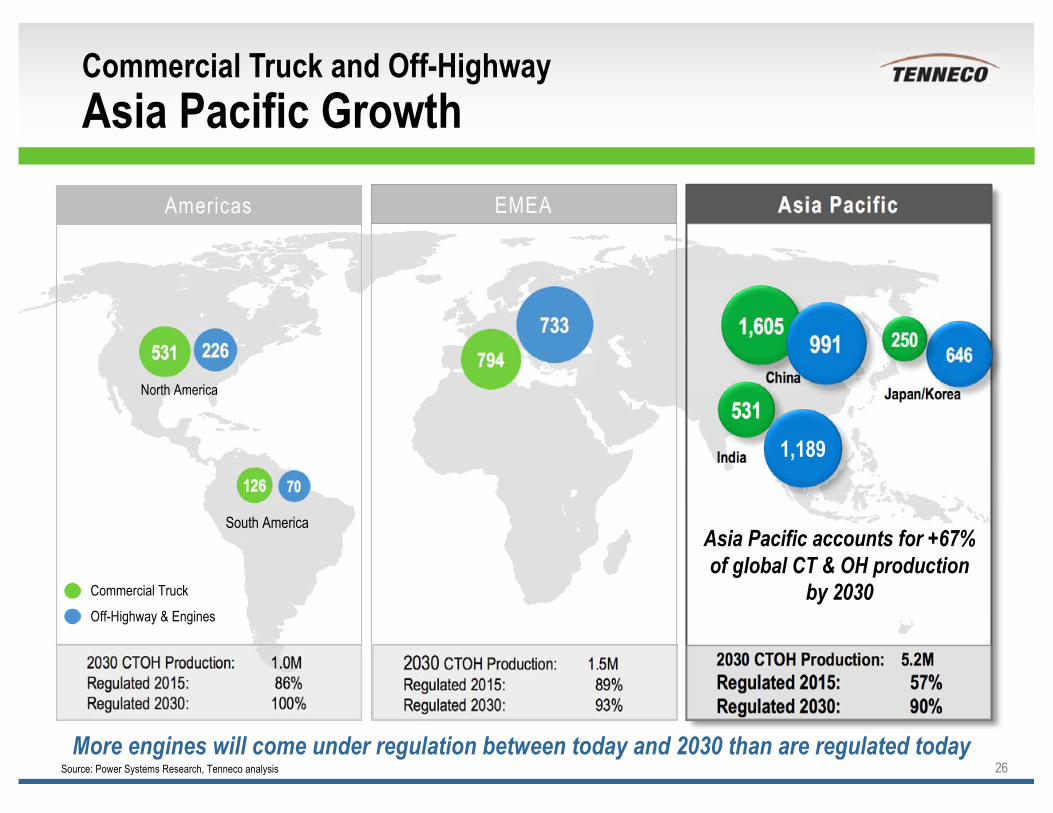
Commercial Truck and Off-Highway Asia Pacific Growth
26
North America
South America
China226531
Americas Asia Pacific
2030 CTOH Production: 1.0MRegulated 2015: 86%Regulated 2030: 100%
2030 CTOH Production: 1.5MRegulated 2015: 89%Regulated 2030: 93%
2030 CTOH Production: 5.2MRegulated 2015: 57%Regulated 2030: 90%
1,605
EMEA
India
Japan/Korea
Commercial Truck
Off-Highway & Engines
70126
733794
991 646250
5311,189
More engines will come under regulation between today and 2030 than are regulated today
Asia Pacific accounts for +67% of global CT & OH production
by 2030
Source: Power Systems Research, Tenneco analysis
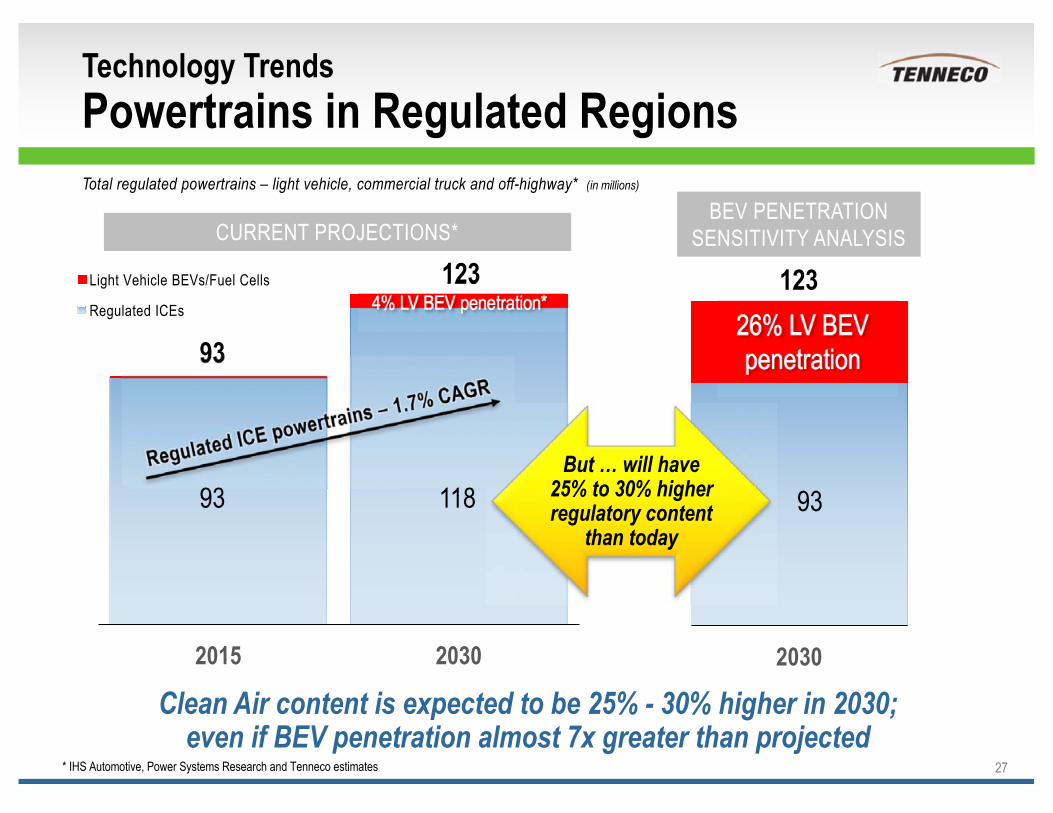
Technology TrendsPowertrains in Regulated Regions
27
Clean Air content is expected to be 25% - 30% higher in 2030;even if BEV penetration almost 7x greater than projected
* IHS Automotive, Power Systems Research and Tenneco estimates
2015 2030
Light Vehicle BEVs/Fuel Cells
Regulated ICEs
123
93 118
93
CURRENT PROJECTIONS*
4% LV BEV penetration*
2030
26% LV BEV penetration
93
BEV PENETRATION SENSITIVITY ANALYSIS
123
Total regulated powertrains – light vehicle, commercial truck and off-highway* (in millions)
But … will have 25% to 30% higher regulatory content
than today
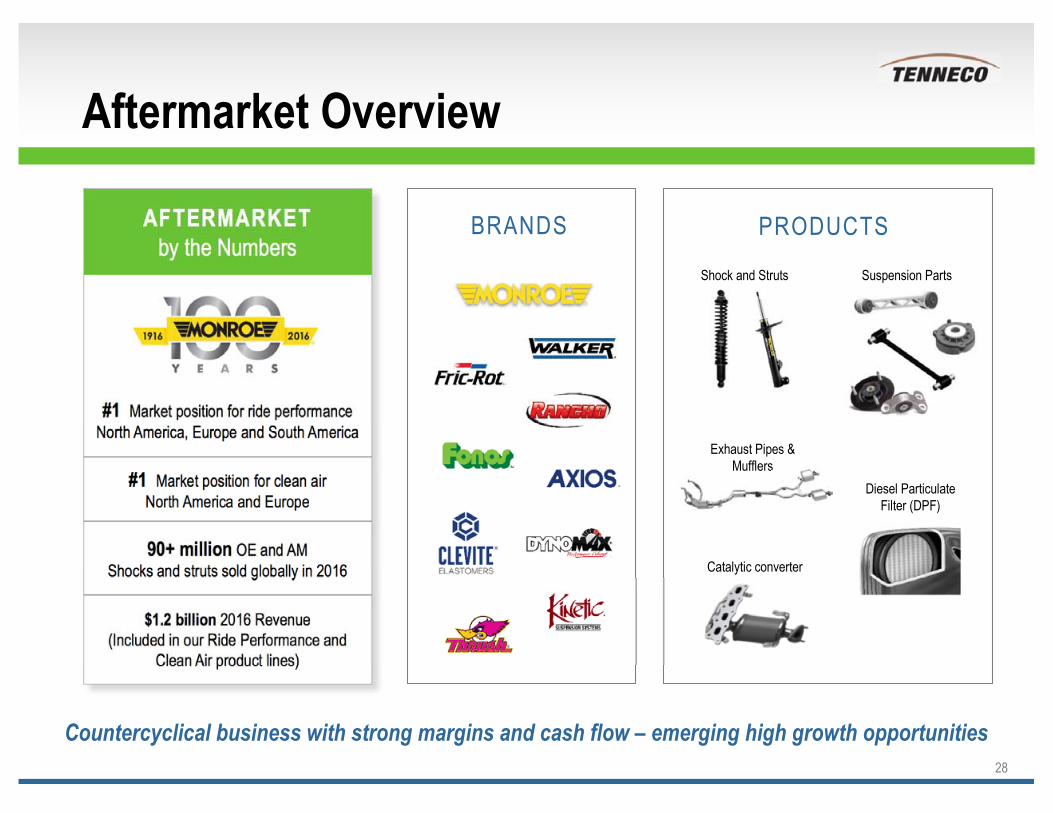
Aftermarket Overview
28
Countercyclical business with strong margins and cash flow – emerging high growth opportunities
BRANDSAFTERMARKETby the Numbers
#1 Market position for ride performance North America, Europe and South America
#1 Market position for clean airNorth America and Europe
90+ million OE and AMShocks and struts sold globally in 2016
$1.2 billion 2016 Revenue(Included in our Ride Performance and
Clean Air product lines)
PRODUCTS
Catalytic converter
Exhaust Pipes & Mufflers
Diesel Particulate Filter (DPF)
Suspension PartsShock and Struts
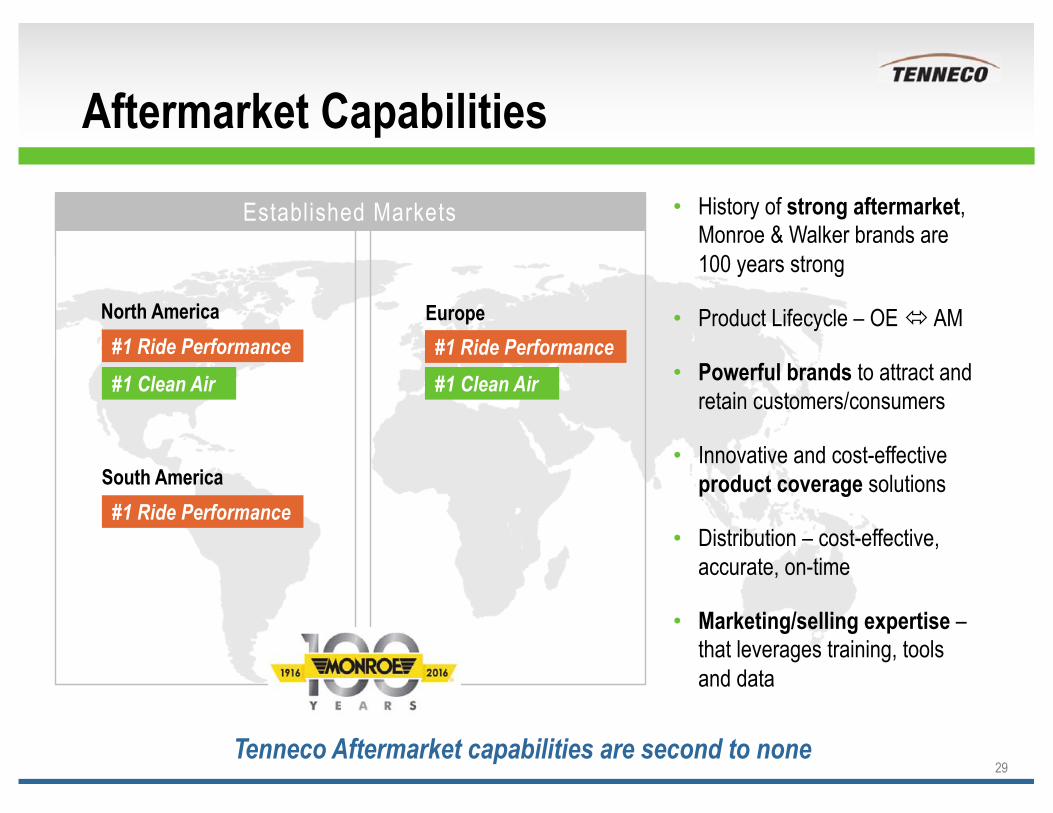
Aftermarket CapabilitiesHistory of strong aftermarket, Monroe & Walker brands are 100 years strong
Product Lifecycle – OE AM
Powerful brands to attract and retain customers/consumers
Innovative and cost-effective product coverage solutions
Distribution – cost-effective, accurate, on-time
Marketing/selling expertise –that leverages training, tools and data
29
North America Europe
South America
#1 Ride Performance #1 Ride Performance
#1 Ride Performance
#1 Clean Air#1 Clean Air
Established Markets
Tenneco Aftermarket capabilities are second to none
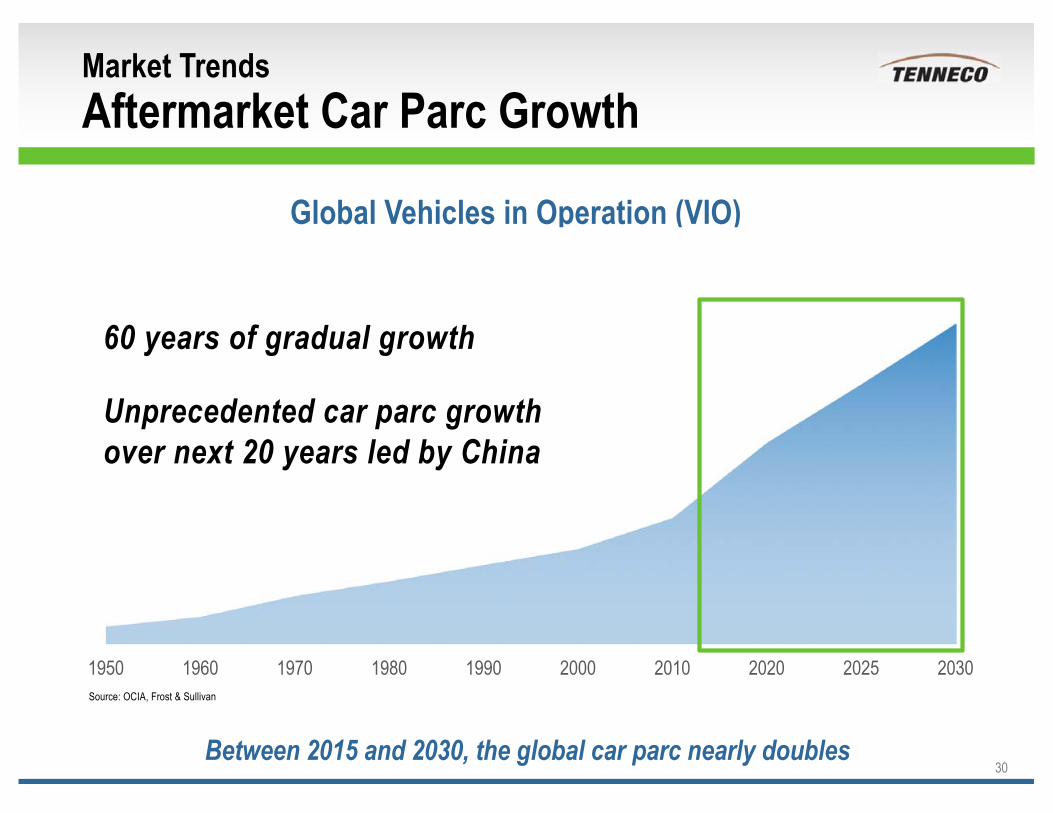
Market TrendsAftermarket Car Parc Growth
30
Global Vehicles in Operation (VIO)
Between 2015 and 2030, the global car parc nearly doubles
1950 1960 1970 1980 1990 2000 2010 2020 2025 2030
60 years of gradual growth
Unprecedented car parc growth over next 20 years led by China
Source: OCIA, Frost & Sullivan
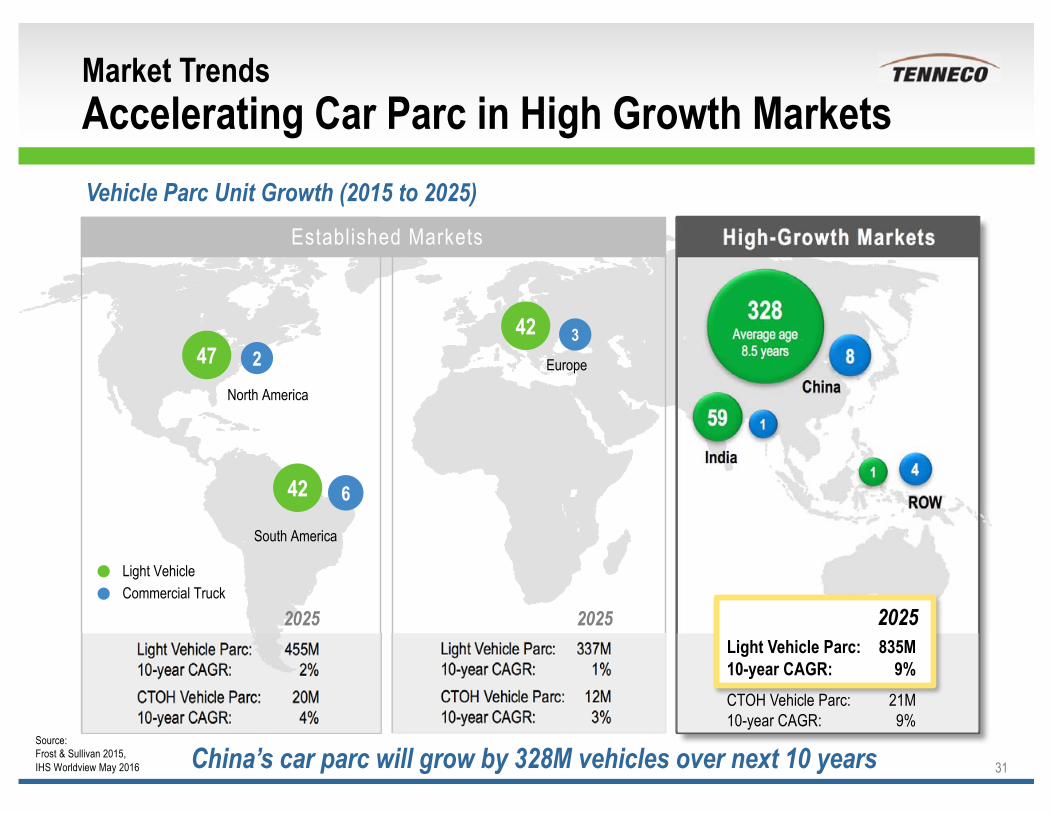
Market Trends Accelerating Car Parc in High Growth Markets Vehicle Parc Unit Growth (2015 to 2025)
31
Established Markets High-Growth Markets
328Average age
8.5 years
59
2
6
8
4
North America
South America
EuropeChina
India
ROW
Light VehicleCommercial Truck
Light Vehicle Parc: 455M10-year CAGR: 2%CTOH Vehicle Parc: 20M10-year CAGR: 4%
Light Vehicle Parc: 337M10-year CAGR: 1%CTOH Vehicle Parc: 12M10-year CAGR: 3%
Light Vehicle Parc: 835
1
Source: Frost & Sullivan 2015, IHS Worldview May 2016
4247
421
3
2025 2025 2025
China’s car parc will grow by 328M vehicles over next 10 years
Light Vehicle Parc: 835M10-year CAGR: 9%CTOH Vehicle Parc: 21M10-year CAGR: 9%
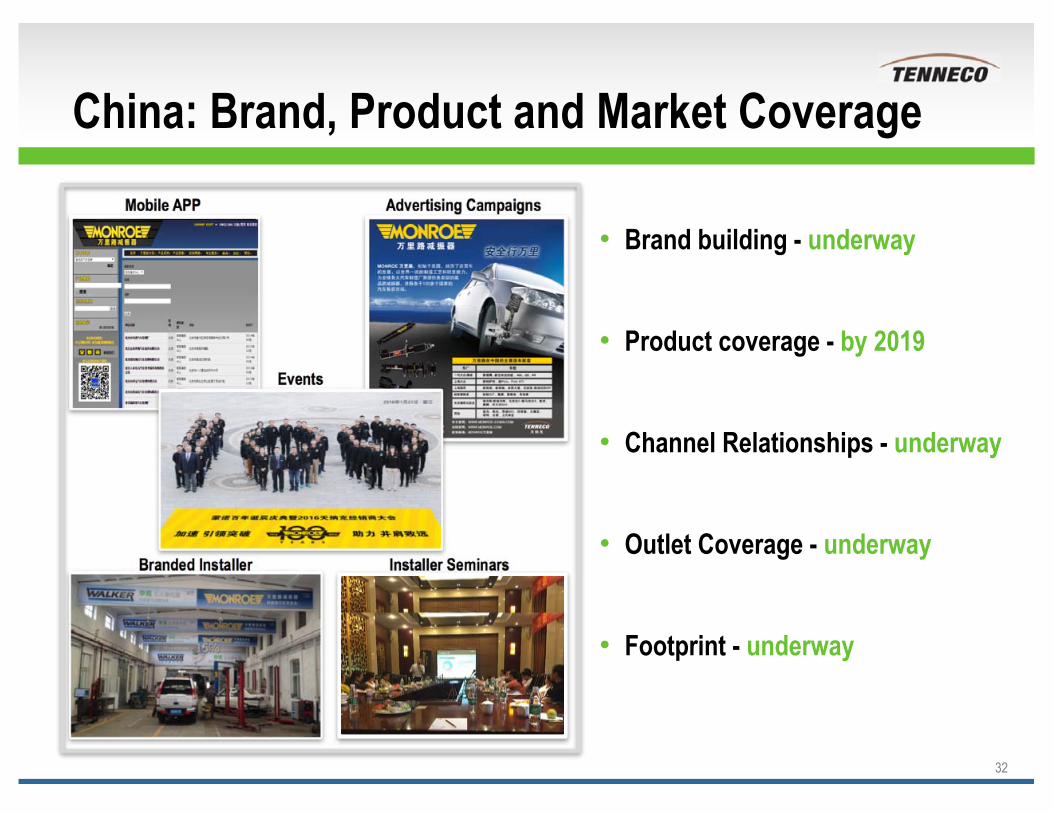
Branded Installer Installer Seminars
China: Brand, Product and Market Coverage
Brand building - underway
Product coverage - by 2019
Channel Relationships - underway
Outlet Coverage - underway
Footprint - underway
32
Mobile APP Advertising Campaigns
Events
MobileApp AD
Event
Branded Installer Seminar
3949
5973
1416
24
33
4
5
6
8
2015 2020 2025 2030
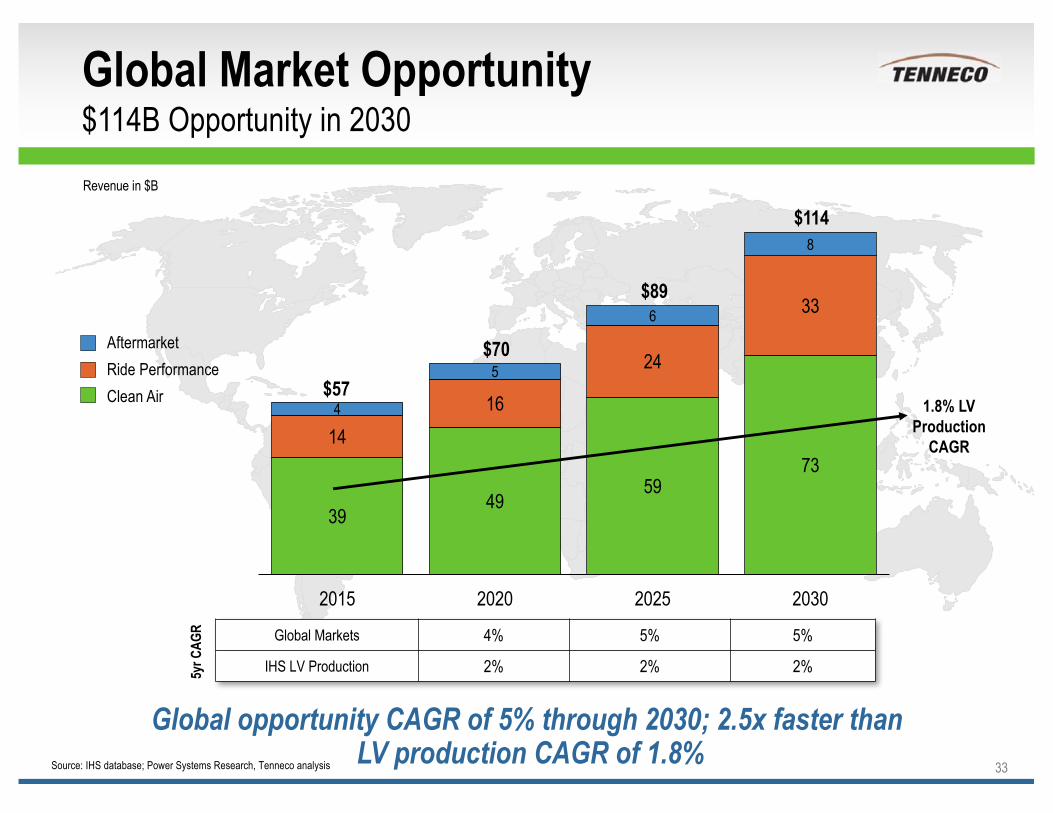
Global Market Opportunity$114B Opportunity in 2030
33Source: IHS database; Power Systems Research, Tenneco analysis
Revenue in $B
Global opportunity CAGR of 5% through 2030; 2.5x faster thanLV production CAGR of 1.8%
$57
$70
$89
$114
AftermarketRide PerformanceClean Air
Global Markets 4% 5% 5%
IHS LV Production 2% 2% 2%5yr C
AGR
1.8% LV Production
CAGR
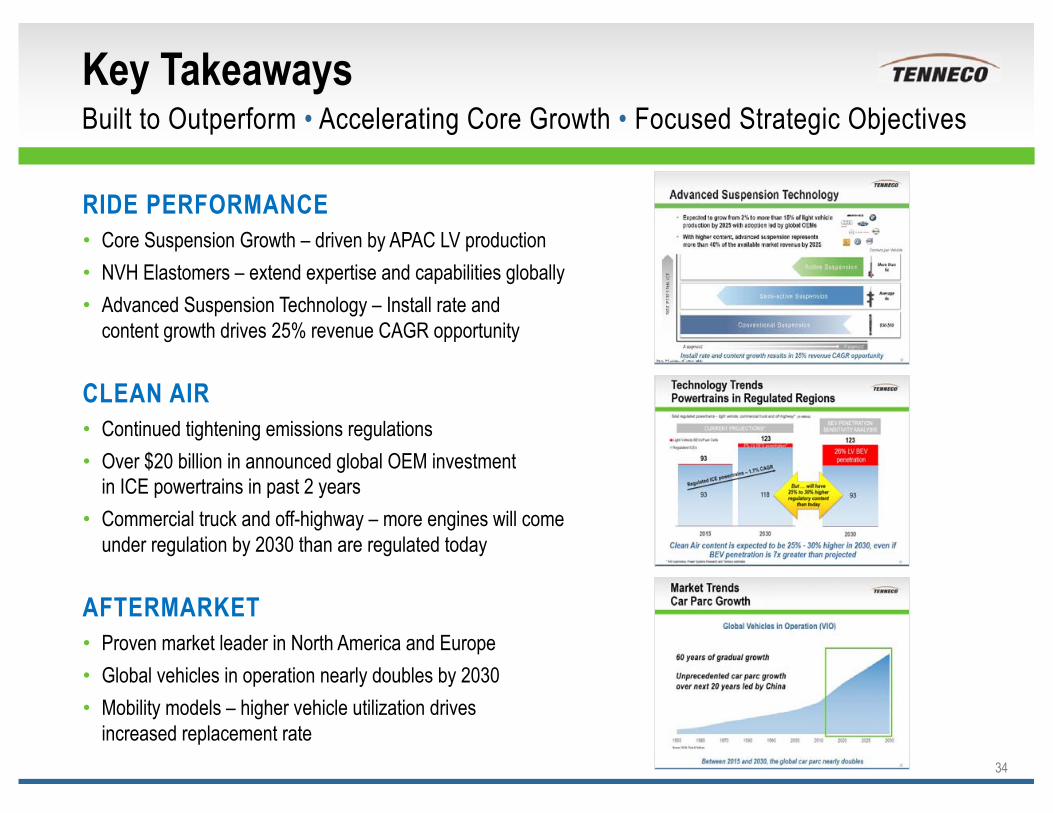
Key TakeawaysBuilt to Outperform • Accelerating Core Growth • Focused Strategic Objectives
34
RIDE PERFORMANCECore Suspension Growth – driven by APAC LV productionNVH Elastomers – extend expertise and capabilities globally Advanced Suspension Technology – Install rate and content growth drives 25% revenue CAGR opportunity
CLEAN AIRContinued tightening emissions regulationsOver $20 billion in announced global OEM investment in ICE powertrains in past 2 yearsCommercial truck and off-highway – more engines will come under regulation by 2030 than are regulated today
AFTERMARKETProven market leader in North America and EuropeGlobal vehicles in operation nearly doubles by 2030Mobility models – higher vehicle utilization drives increased replacement rate
Focused Strategic Priorities & Objectives
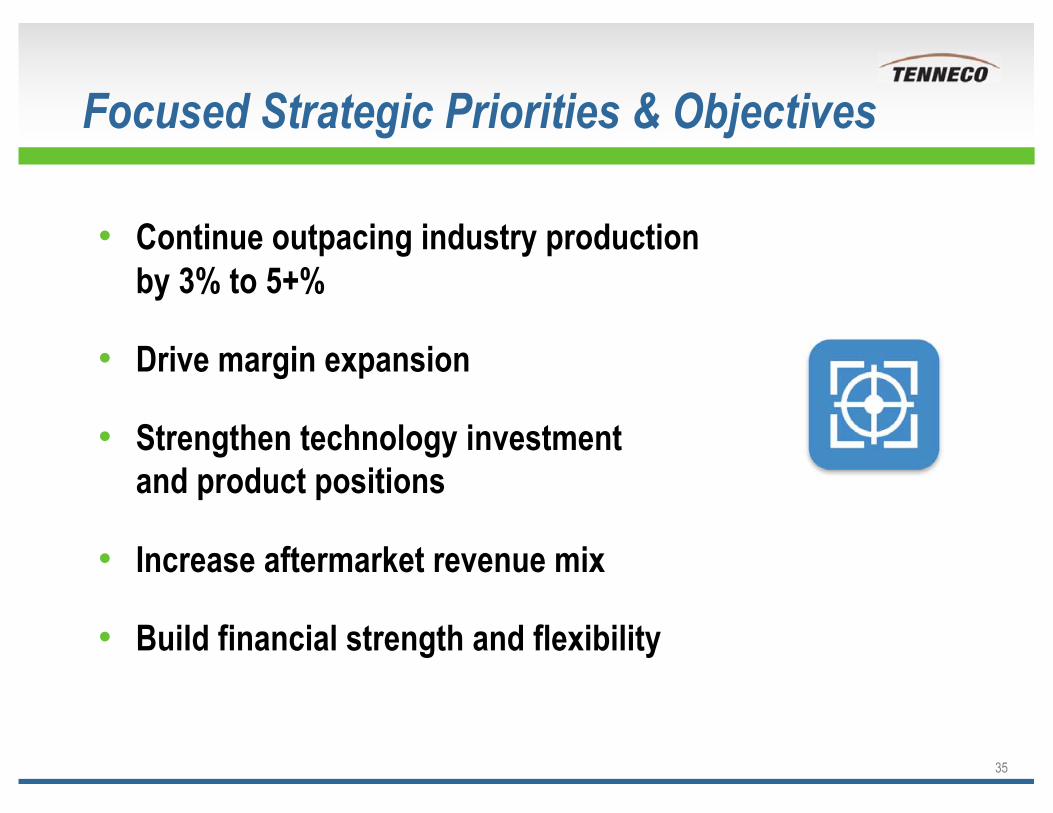
Continue outpacing industry production by 3% to 5+%
Drive margin expansion
Strengthen technology investment and product positions
Increase aftermarket revenue mix
Build financial strength and flexibility
35
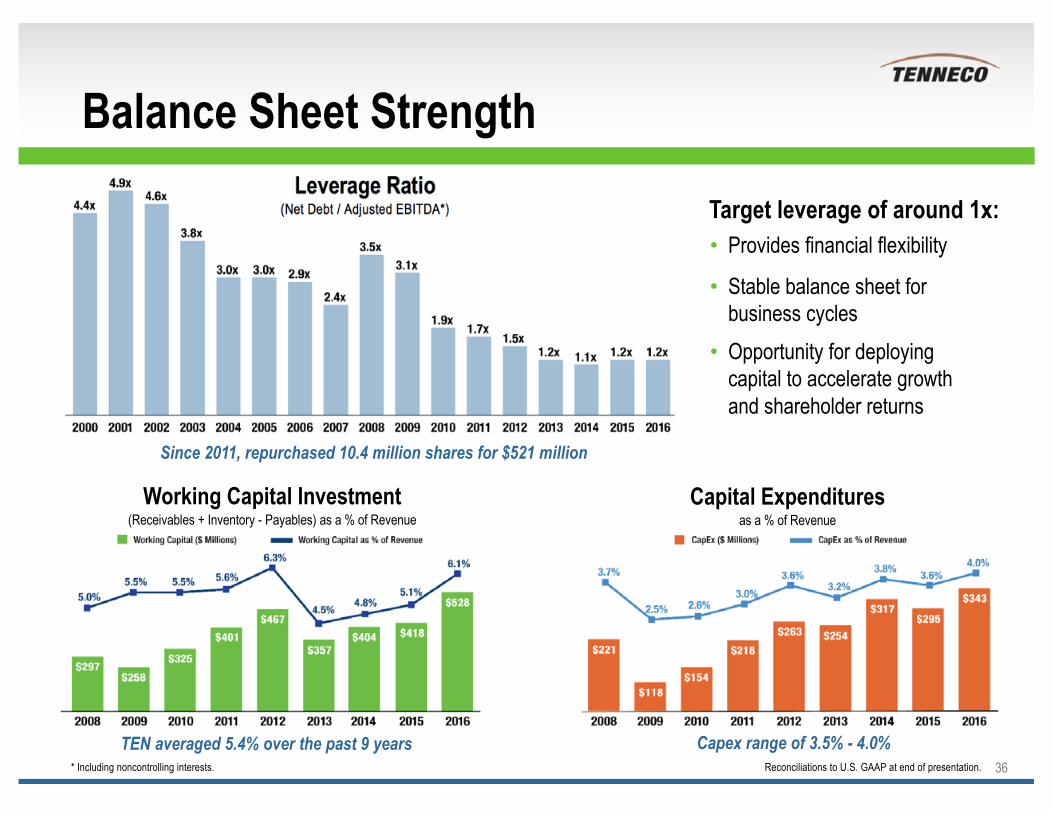
Balance Sheet Strength
36
Since 2011, repurchased 10.4 million shares for $521 million
TEN averaged 5.4% over the past 9 years Capex range of 3.5% - 4.0%
Leverage Ratio(Net Debt / Adjusted EBITDA*)
Capital Expendituresas a % of Revenue
Working Capital Investment(Receivables + Inventory - Payables) as a % of Revenue
Reconciliations to U.S. GAAP at end of presentation. * Including noncontrolling interests.
Target leverage of around 1x:Provides financial flexibility
Stable balance sheet for business cycles Opportunity for deploying capital to accelerate growth and shareholder returns
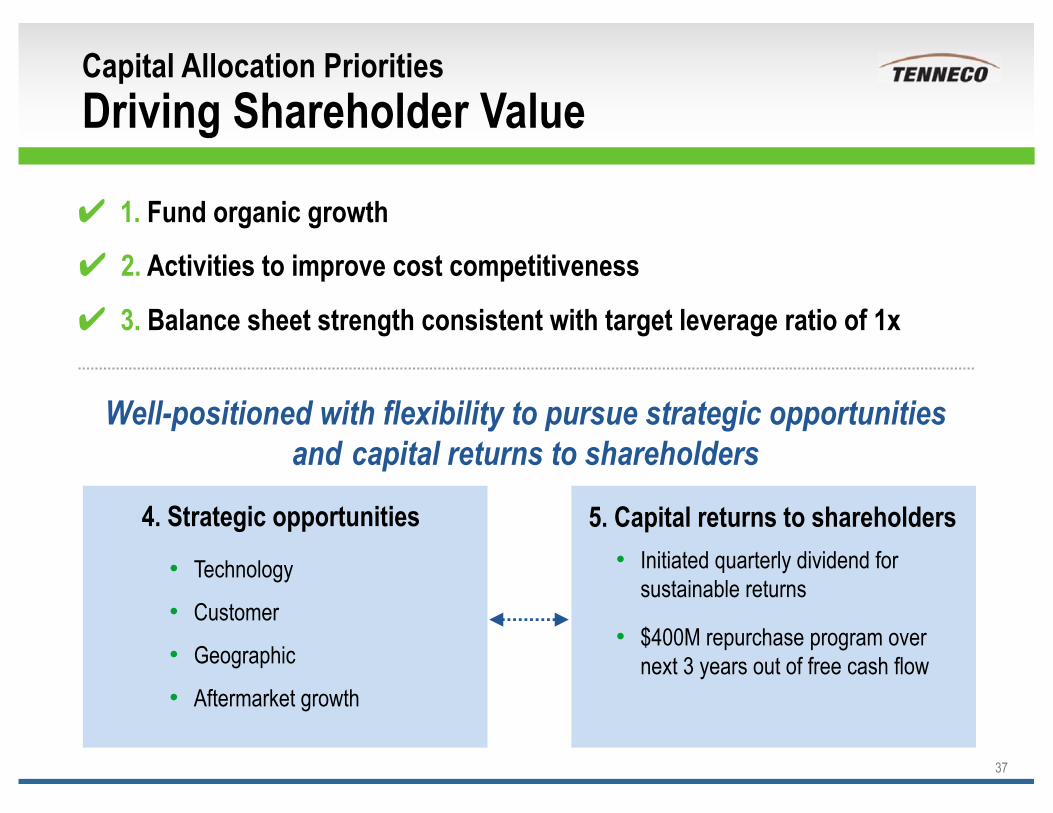
1. Fund organic growth
Capital Allocation Priorities Driving Shareholder Value
37
2. Activities to improve cost competitiveness
3. Balance sheet strength consistent with target leverage ratio of 1x
Well-positioned with flexibility to pursue strategic opportunities and capital returns to shareholders
4. Strategic opportunitiesTechnology – urea dosing and injection capabilities; digital valve technology
Customer – regional players with specific target customers
Geographic – expand NVH elastomer global reach; accelerate Aftermarket growth in China
Aftermarket growth – increase Aftermarket revenue mix; enhance product portfolio
4. Strategic opportunities 5. Capital returns to shareholders
Technology
Customer
Geographic
Aftermarket growth
Initiated quarterly dividend for sustainable returns
$400M repurchase program over next 3 years out of free cash flow
What It Means to Tenneco
38Source: IHS database; Power Systems Research, Tenneco analysis
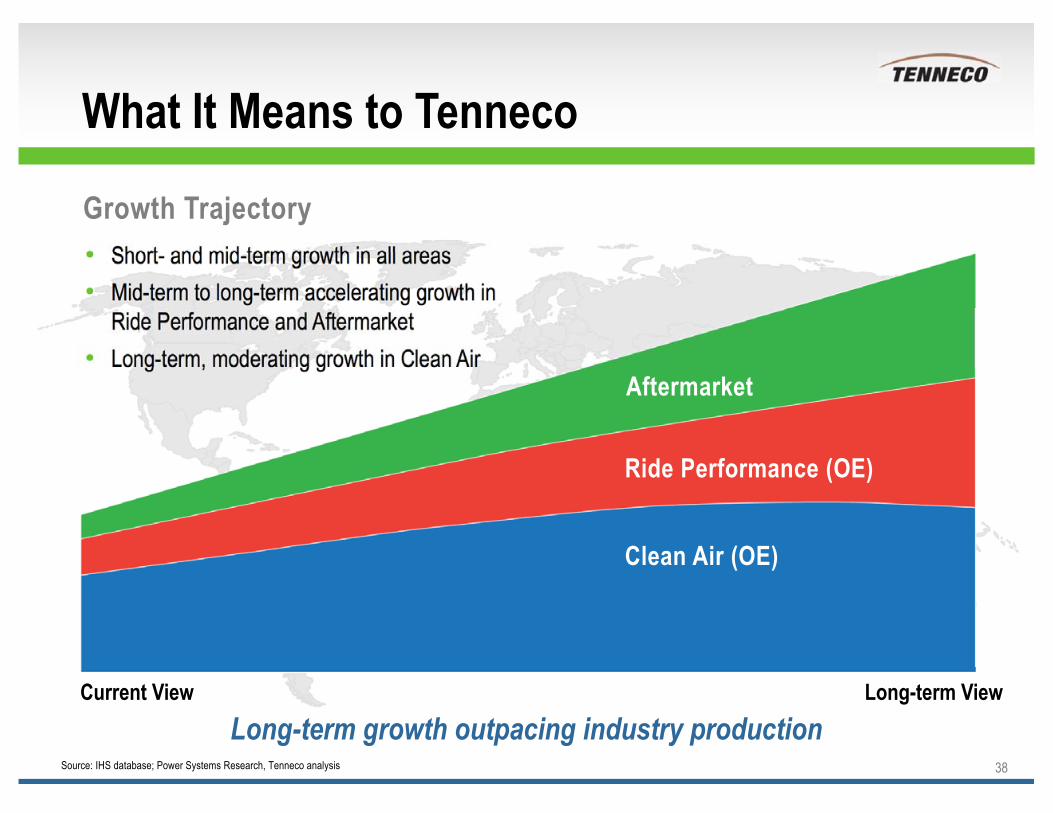
Growth Trajectory
Long-term growth outpacing industry production
Short- and mid-term growth in all areasMid-term to long-term accelerating growth in Ride Performance and Aftermarket Long-term, moderating growth in Clean Air
Current View Long-term View
Aftermarket
Ride Performance (OE)
Clean Air (OE)
Appealing Investment Opportunity
Built to OutperformProven track record of growth
Revenue growth outpacing industry productionMargin expansion and double-digit EPS growth
Diversified business profile
Accelerating Core GrowthPositive market trends in both product linesExpansion in high growth marketsTechnology and capability leadership
Focused Strategic Priorities & Objectives
39
40
Up to 2012 2013 2014 2015 2016 2017 2018 2019 2020 & laterU.S., Canada& Mexico
Tier 4i Off-Hwy(2011)CARB CTrkRetrofit* (2012)Mex Euro 4 LV orEPA Tier 2 Bin 10
RICE StationaryUS revised NAAQS
Tier 4f* Off-HwyMarine Tier 4f*CARB Off-HwyLarge Fleets*US Utility MACT
CARB LEV III*Tier 4 Locomotive
NSPS Stationary NOx*CARB Off-HwyMedium Fleets*
Tier 3 LV Pass Cars*
Tier 3 Light Truck*Mex Tier 2 LV (full impl.)**Mex EPA2007 or EU-V CTrk**
CARB Off-HwySmall Fleets*Tier 4f Off-Hwy***
CARB CTrk Low NOx (2023)**EPA CTrk Low NOx(2024)**Mex Tier 3 LV** (2025)Mex EPA2010 or EU-VI CTrk** (2020)
Europe EU Off-HwyStage 3B* (2011)EU CO2 /GHG 120g& PM # LV (2011)
EU Sound regulationEU-VI CTrk
Euro-6b LVEU Off-HwyStage 4*
Euro-6c LV (no RDE)EU-6d TEMP LV RDE CF2.1* (2017-2018)
EU VI D CTrkIn-service conformity
EU Stage VOff-Hwy
EU-6d LV RDECF1.5* (2020-1)
China China 5 LV* (Major Cities) (2012)
China IV CTrk*National (MEP)
Beijing V CTrkBeijing 4 Off-HwyChina 3 Off-Hwy
China 5 LV (Eastern Provinces)
China 5 LV National Sl*China V CTrk*,**
China 5 LV National Cl*
China 6a LV*,**NationalChina VI CTrk*,**China 4 Off-Hwy*,**Stage 4*Locomotive**
China 6b LV*,** National (2023)
Japan JC08 (2009) JP-13 CTrk Off-Hwy Tier 4B
JP-16 CTrk* WLTP LV
SouthAmerica
Peru EU-3 LVEC, UR, VENEU-1 LVBrazil EU-V CTrk (2012)
Chile EU-5 LVColombiaEU-4 LVBrazil ProconveL-6 LV
ArgentinaEU-5 LV
Brazil Stage 3A Off-Hwy (construction)
Brazil Stage 3A Off-Hwy (farming)
Brazil EU-VI CTrk**
Brazil Stage3B** Off-Hwy
Brazil ProconveL-7 LV**(2026)
Russia EU-4 LVEU-IV CTrk
EU-5 LV EU-V CTrk
India BS-4 LV/CTrk(13 Cities) (2011)BS-IIIA Off-Hwy(2011)
BS-IV CTrk*(50 Cities)
BS-4 LVBS-IV CTrk
BS-6 LV (2020)BS-VI CTrk (2020)BS-IV* Off-Hwy (2022)**
GlobalTreaty
Marine Annex VI Tier III NOx
Marine Annex VI Tier III SOx
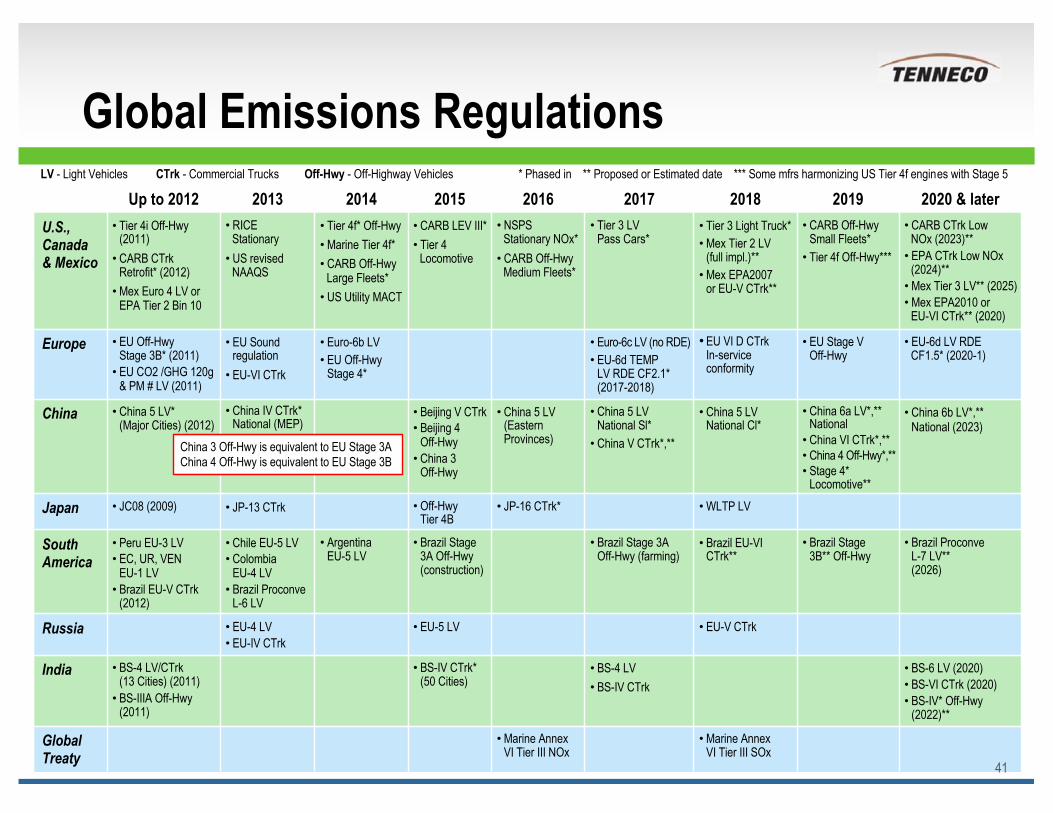
Global Emissions Regulations
41
LV - Light Vehicles CTrk - Commercial Trucks Off-Hwy - Off-Highway Vehicles * Phased in ** Proposed or Estimated date *** Some mfrs harmonizing US Tier 4f engines with Stage 5
China 3 Off-Hwy is equivalent to EU Stage 3AChina 4 Off-Hwy is equivalent to EU Stage 3B
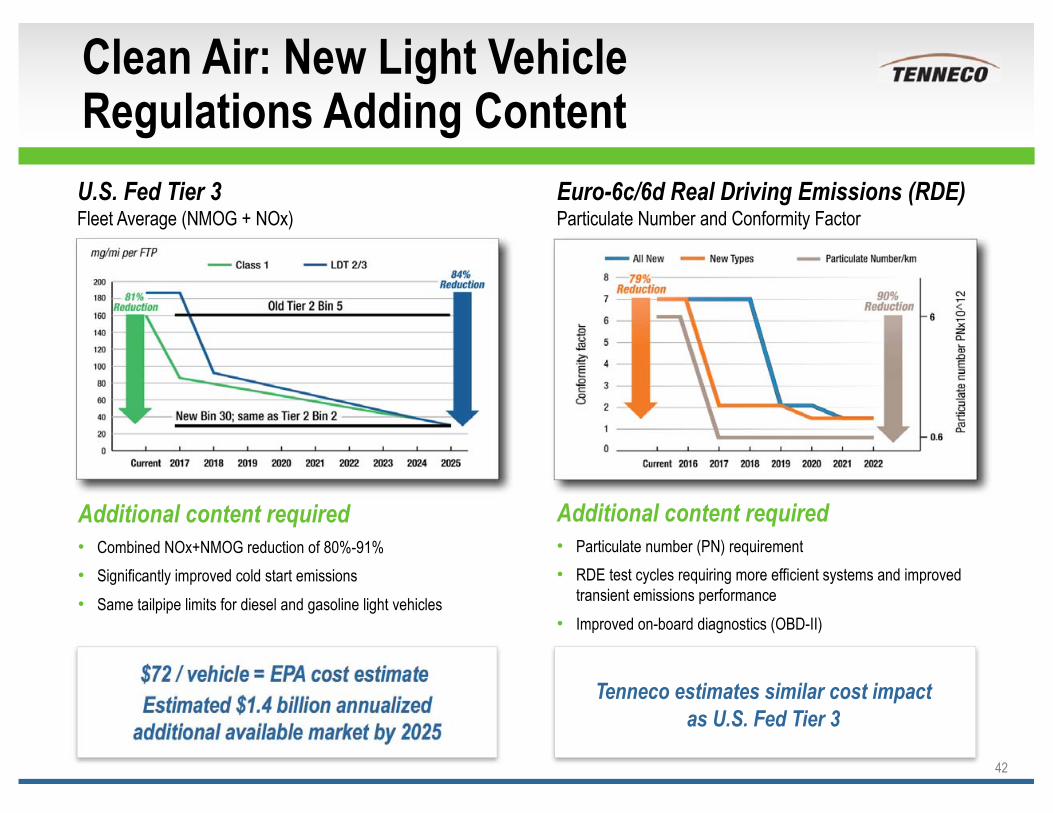
Clean Air: New Light Vehicle Regulations Adding Content
Additional content requiredCombined NOx+NMOG reduction of 80%-91%Significantly improved cold start emissionsSame tailpipe limits for diesel and gasoline light vehicles
Additional content requiredParticulate number (PN) requirementRDE test cycles requiring more efficient systems and improved transient emissions performanceImproved on-board diagnostics (OBD-II)
$72 / vehicle = EPA cost estimateEstimated $1.4 billion annualized
additional available market by 2025
Tenneco estimates similar cost impact as U.S. Fed Tier 3
U.S. Fed Tier 3Fleet Average (NMOG + NOx)
Euro-6c/6d Real Driving Emissions (RDE)Particulate Number and Conformity Factor
42
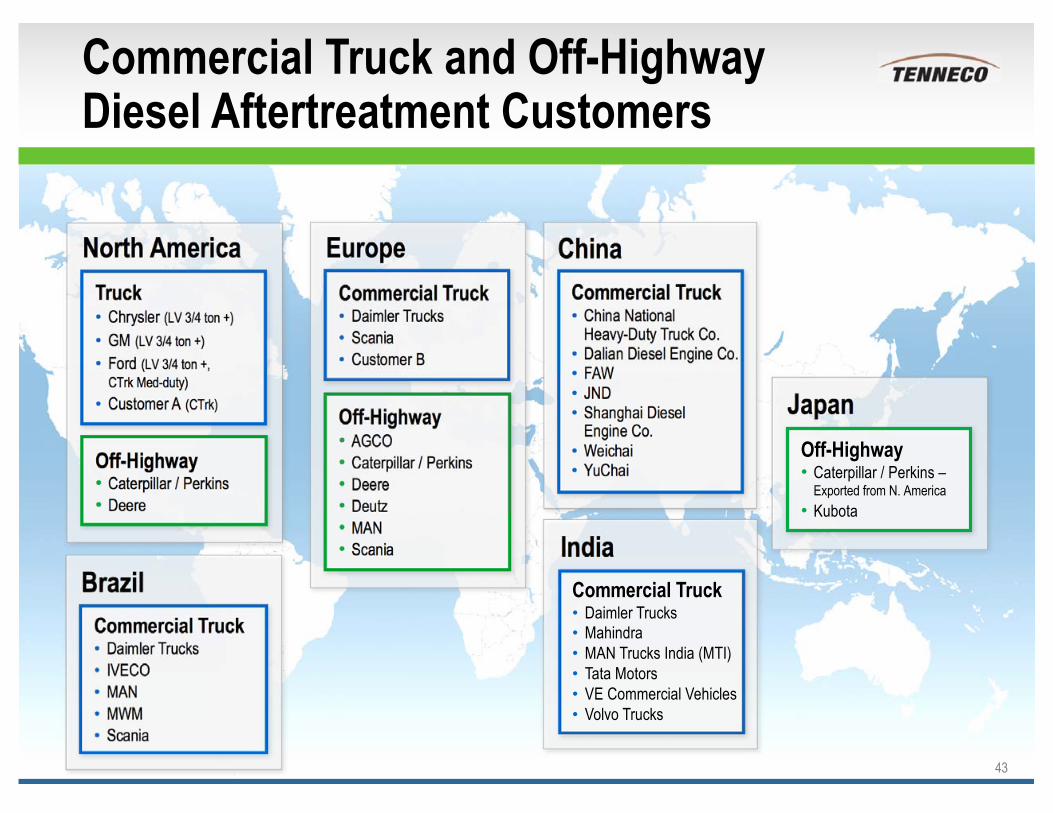
Commercial Truck and Off-Highway Diesel Aftertreatment Customers
43
Europe
Off-HighwayAGCOCaterpillar / Perkins DeereDeutzMANScania
Commercial TruckDaimler TrucksScaniaCustomer B
India
North AmericaTruck
Chrysler (LV 3/4 ton +) GM (LV 3/4 ton +)Ford (LV 3/4 ton +, CTrk Med-duty)Customer A (CTrk)
Off-HighwayCaterpillar / Perkins Deere
BrazilCommercial Truck
Daimler Trucks IVECO MANMWMScania
ChinaCommercial Truck
China National Heavy-Duty Truck Co.Dalian Diesel Engine Co.FAWJNDShanghai DieselEngine Co.WeichaiYuChai
JapanOff-Highway
Caterpillar / Perkins –Exported from N. AmericaKubota
Commercial TruckDaimler TrucksMahindraMAN Trucks India (MTI)Tata MotorsVE Commercial VehiclesVolvo Trucks
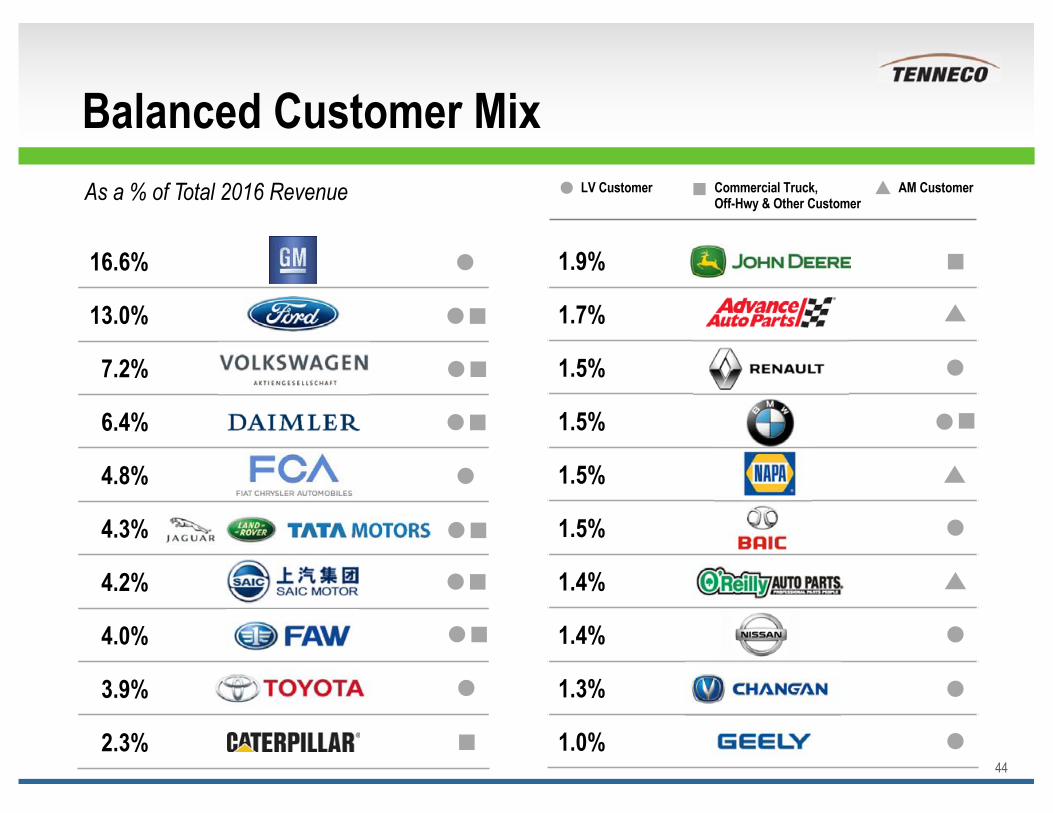
Balanced Customer Mix
44
As a % of Total 2016 Revenue
16.6%
13.0%
7.2%
6.4%
4.8%
4.3%
4.2%
4.0%
3.9%
2.3%
1.9%
1.7%
1.5%
1.5%
1.5%
1.5%
1.4%
1.4%
1.3%
1.0%
LV Customer Commercial Truck, AM CustomerOff-Hwy & Other Customer
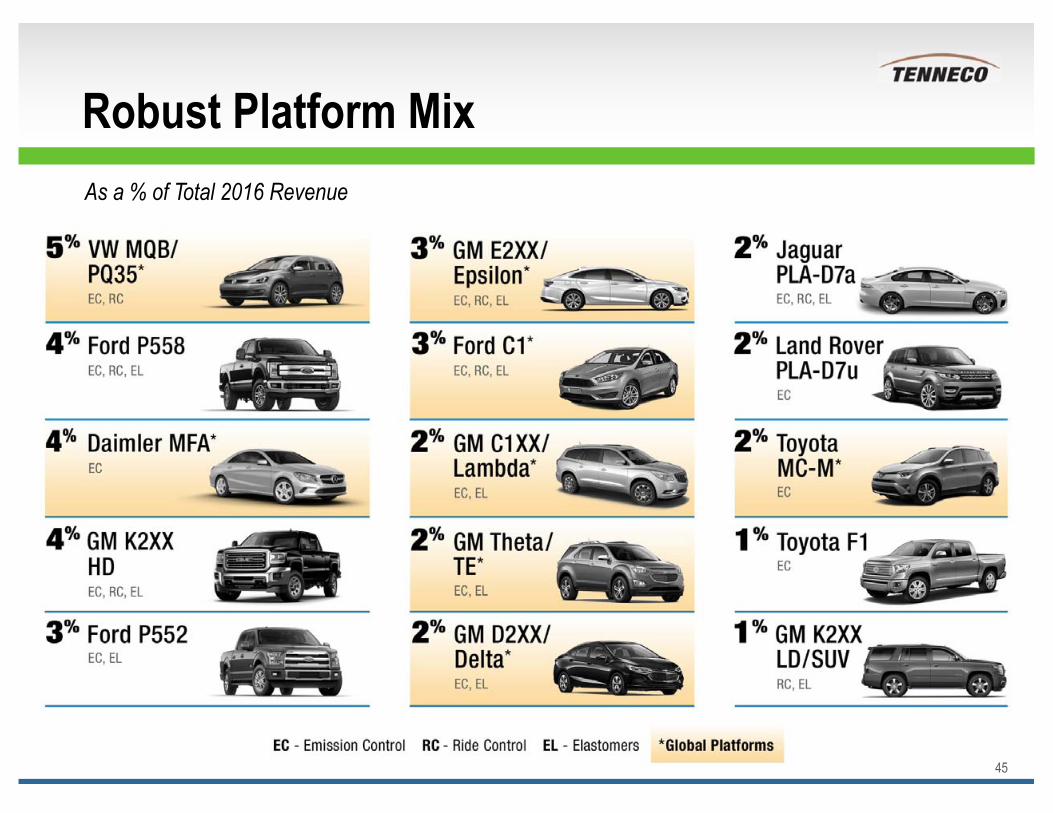
Robust Platform Mix
45
As a % of Total 2016 Revenue
Financial Results Disclaimer
46
• Use of Non-GAAP Financial InformationIn addition to the results reported in accordance with accounting principles generally accepted in the United States (“GAAP”) included in this presentation, the company has provided information regarding certain non-GAAP financial measures. These measures include Earnings Before Interest Expense, Income Taxes, Noncontrolling Interests and Depreciation and Amortization (“EBITDA*”), Net Debt, Value-Add Revenue, Adjusted EBITDA*, Adjusted Earnings Before Interest Expense, Income Taxes and Noncontrolling Interests (“Adjusted EBIT”), and Adjusted Earnings Per Share.
Reconciliations of these non-GAAP financial measures to the comparable GAAP measure are included in this presentation.
* Including noncontrolling interests.
Tenneco’s Revenue Outlook
47
Tenneco’s revenue outlook is based on the type of information set forth under “Outlook” in Item 7 – “Management’s Discussion and Analysis of Financial Condition and Results of Operations” as set forth in Tenneco’s Annual Report on Form 10-K for the year ended December 31, 2016. Please see that disclosure for further information. Key additional assumptions and limitations described in that disclosure include:
Revenue projections are based on original equipment manufacturers’ programs that have been formally awarded to the company; programs where the company is highly confident that it will be awarded business based on informal customer indications consistent with past practices; and Tenneco’s status as supplier for the existing program and its relationship with the customer.
Revenue projections are based on the anticipated pricing of each program over its life.
Revenue projections assume a fixed foreign currency value. This value is used to translate foreign business to the U.S. dollar.
Revenue projections are subject to increase or decrease due to changes in customer requirements, customer and consumer preferences, the number of vehicles actually produced by our customers and pricing.
Tenneco’s revenue outlook constitutes a forward-looking statement. We also refer you to the cautionary language regarding our forward-looking statements set forth in the Safe Harbor statement on slide 2.
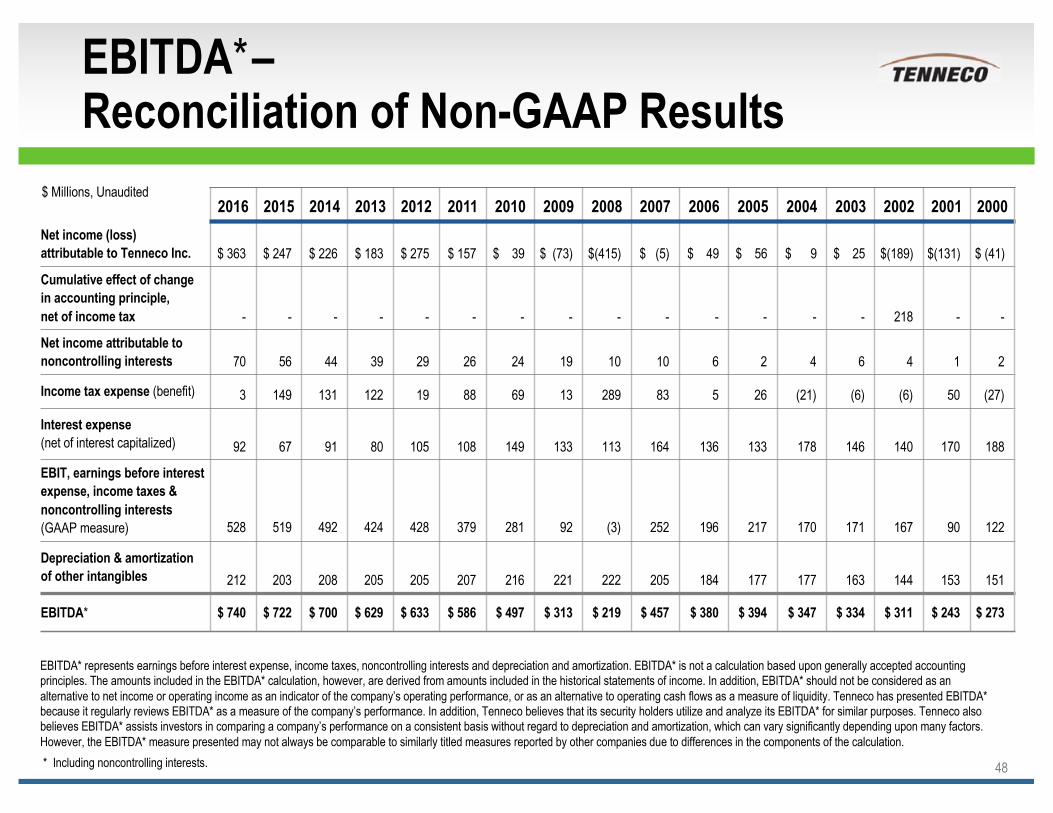
EBITDA*–Reconciliation of Non-GAAP Results
48
EBITDA* represents earnings before interest expense, income taxes, noncontrolling interests and depreciation and amortization. EBITDA* is not a calculation based upon generally accepted accounting principles. The amounts included in the EBITDA* calculation, however, are derived from amounts included in the historical statements of income. In addition, EBITDA* should not be considered as an alternative to net income or operating income as an indicator of the company’s operating performance, or as an alternative to operating cash flows as a measure of liquidity. Tenneco has presented EBITDA* because it regularly reviews EBITDA* as a measure of the company’s performance. In addition, Tenneco believes that its security holders utilize and analyze its EBITDA* for similar purposes. Tenneco also believes EBITDA* assists investors in comparing a company’s performance on a consistent basis without regard to depreciation and amortization, which can vary significantly depending upon many factors. However, the EBITDA* measure presented may not always be comparable to similarly titled measures reported by other companies due to differences in the components of the calculation.* Including noncontrolling interests.
2016 2015 2014 2013 2012 2011 2010 2009 2008 2007 2006 2005 2004 2003 2002 2001 2000Net income (loss) attributable to Tenneco Inc. $ 363 $ 247 $ 226 $ 183 $ 275 $ 157 $ 39 $ (73) $(415) $ (5) $ 49 $ 56 $ 9 $ 25 $(189) $(131) $ (41)
Cumulative effect of change in accounting principle, net of income tax - - - - - - - - - - - - - - 218 - -
Net income attributable tononcontrolling interests 70 56 44 39 29 26 24 19 10 10 6 2 4 6 4 1 2
Income tax expense (benefit) 3 149 131 122 19 88 69 13 289 83 5 26 (21) (6) (6) 50 (27)
Interest expense (net of interest capitalized) 92 67 91 80 105 108 149 133 113 164 136 133 178 146 140 170 188
EBIT, earnings before interest expense, income taxes & noncontrolling interests (GAAP measure) 528 519 492 424 428 379 281 92 (3) 252 196 217 170 171 167 90 122
Depreciation & amortization of other intangibles 212 203 208 205 205 207 216 221 222 205 184 177 177 163 144 153 151
EBITDA* $ 740 $ 722 $ 700 $ 629 $ 633 $ 586 $ 497 $ 313 $ 219 $ 457 $ 380 $ 394 $ 347 $ 334 $ 311 $ 243 $ 273
$ Millions, Unaudited
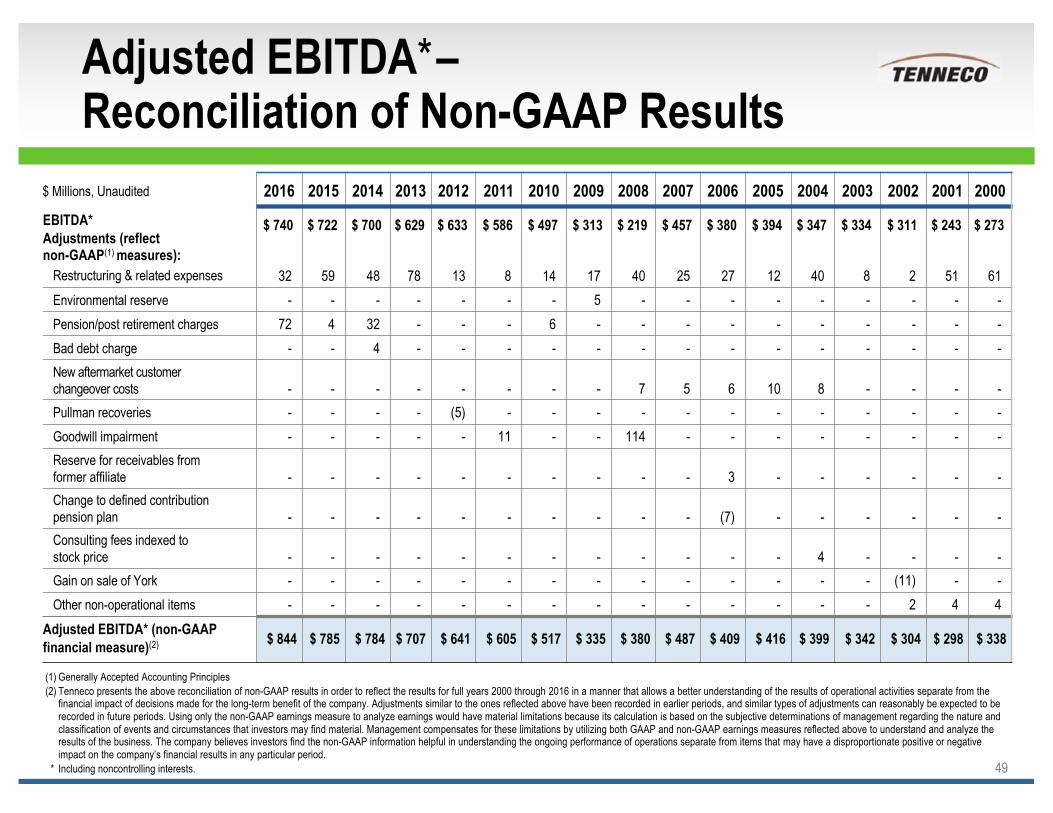
Adjusted EBITDA*–Reconciliation of Non-GAAP Results
49
2016 2015 2014 2013 2012 2011 2010 2009 2008 2007 2006 2005 2004 2003 2002 2001 2000EBITDA*Adjustments (reflect non-GAAP(1) measures):
$ 740 $ 722 $ 700 $ 629 $ 633 $ 586 $ 497 $ 313 $ 219 $ 457 $ 380 $ 394 $ 347 $ 334 $ 311 $ 243 $ 273
Restructuring & related expenses 32 59 48 78 13 8 14 17 40 25 27 12 40 8 2 51 61Environmental reserve - - - - - - - 5 - - - - - - - - -Pension/post retirement charges 72 4 32 - - - 6 - - - - - - - - - -Bad debt charge - - 4 - - - - - - - - - - - - - -New aftermarket customer changeover costs - - - - - - - - 7 5 6 10 8 - - - -Pullman recoveries - - - - (5) - - - - - - - - - - - -Goodwill impairment - - - - - 11 - - 114 - - - - - - - -Reserve for receivables from former affiliate - - - - - - - - - - 3 - - - - - -Change to defined contribution pension plan - - - - - - - - - - (7) - - - - - -Consulting fees indexed to stock price - - - - - - - - - - - - 4 - - - -Gain on sale of York - - - - - - - - - - - - - - (11) - -Other non-operational items - - - - - - - - - - - - - - 2 4 4
Adjusted EBITDA* (non-GAAP financial measure)(2) $ 844 $ 785 $ 784 $ 707 $ 641 $ 605 $ 517 $ 335 $ 380 $ 487 $ 409 $ 416 $ 399 $ 342 $ 304 $ 298 $ 338
$ Millions, Unaudited
(1) Generally Accepted Accounting Principles(2) Tenneco presents the above reconciliation of non-GAAP results in order to reflect the results for full years 2000 through 2016 in a manner that allows a better understanding of the results of operational activities separate from the
financial impact of decisions made for the long-term benefit of the company. Adjustments similar to the ones reflected above have been recorded in earlier periods, and similar types of adjustments can reasonably be expected to be recorded in future periods. Using only the non-GAAP earnings measure to analyze earnings would have material limitations because its calculation is based on the subjective determinations of management regarding the nature and classification of events and circumstances that investors may find material. Management compensates for these limitations by utilizing both GAAP and non-GAAP earnings measures reflected above to understand and analyze the results of the business. The company believes investors find the non-GAAP information helpful in understanding the ongoing performance of operations separate from items that may have a disproportionate positive or negative impact on the company’s financial results in any particular period.
* Including noncontrolling interests.
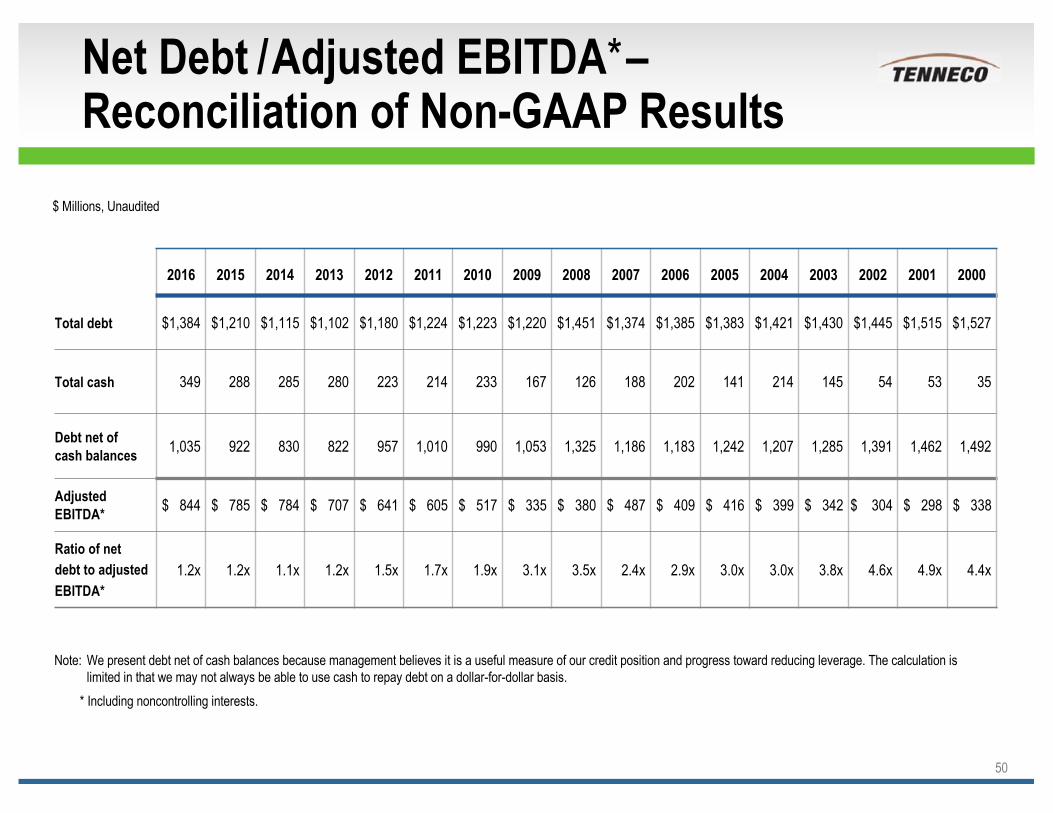
Net Debt /Adjusted EBITDA*–Reconciliation of Non-GAAP Results
50
$ Millions, Unaudited
2016 2015 2014 2013 2012 2011 2010 2009 2008 2007 2006 2005 2004 2003 2002 2001 2000
Total debt $1,384 $1,210 $1,115 $1,102 $1,180 $1,224 $1,223 $1,220 $1,451 $1,374 $1,385 $1,383 $1,421 $1,430 $1,445 $1,515 $1,527
Total cash 349 288 285 280 223 214 233 167 126 188 202 141 214 145 54 53 35
Debt net of cash balances 1,035 922 830 822 957 1,010 990 1,053 1,325 1,186 1,183 1,242 1,207 1,285 1,391 1,462 1,492
Adjusted EBITDA* $ 844 $ 785 $ 784 $ 707 $ 641 $ 605 $ 517 $ 335 $ 380 $ 487 $ 409 $ 416 $ 399 $ 342 $ 304 $ 298 $ 338
Ratio of net debt to adjusted EBITDA*
1.2x 1.2x 1.1x 1.2x 1.5x 1.7x 1.9x 3.1x 3.5x 2.4x 2.9x 3.0x 3.0x 3.8x 4.6x 4.9x 4.4x
Note: We present debt net of cash balances because management believes it is a useful measure of our credit position and progress toward reducing leverage. The calculation is limited in that we may not always be able to use cash to repay debt on a dollar-for-dollar basis.
* Including noncontrolling interests.
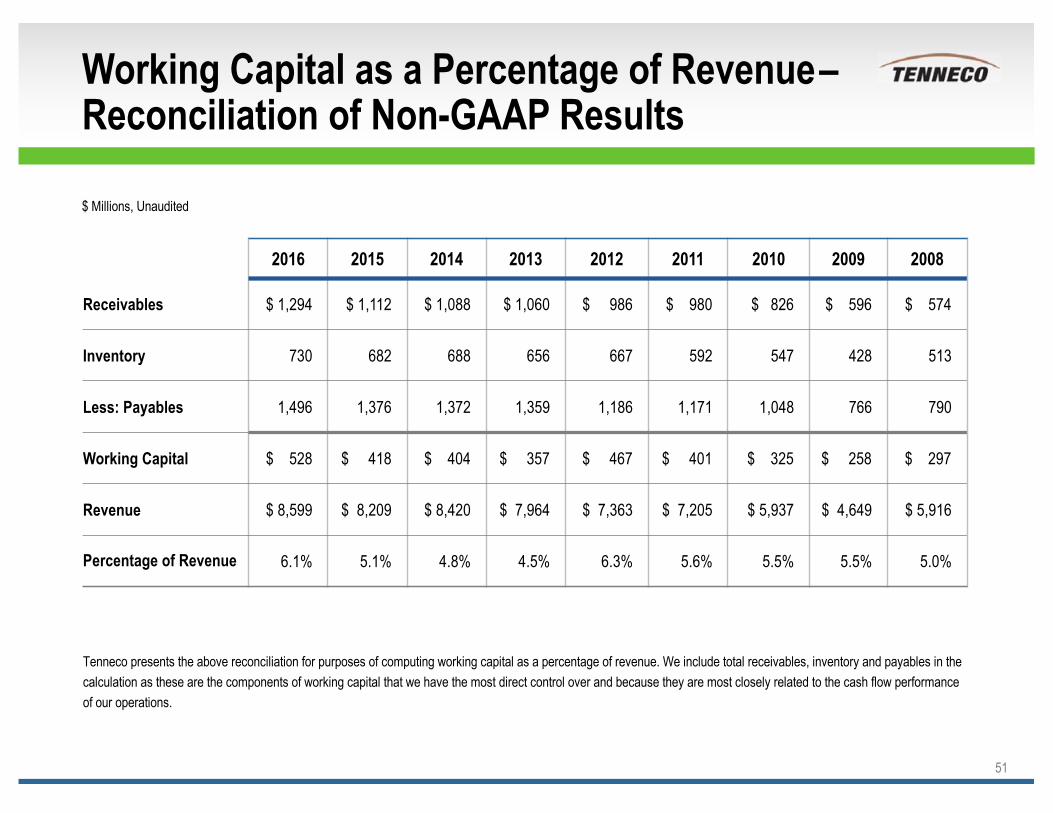
Working Capital as a Percentage of Revenue–Reconciliation of Non-GAAP Results
51
$ Millions, Unaudited
2016 2015 2014 2013 2012 2011 2010 2009 2008
Receivables $ 1,294 $ 1,112 $ 1,088 $ 1,060 $ 986 $ 980 $ 826 $ 596 $ 574
Inventory 730 682 688 656 667 592 547 428 513
Less: Payables 1,496 1,376 1,372 1,359 1,186 1,171 1,048 766 790
Working Capital $ 528 $ 418 $ 404 $ 357 $ 467 $ 401 $ 325 $ 258 $ 297
Revenue $ 8,599 $ 8,209 $ 8,420 $ 7,964 $ 7,363 $ 7,205 $ 5,937 $ 4,649 $ 5,916
Percentage of Revenue 6.1% 5.1% 4.8% 4.5% 6.3% 5.6% 5.5% 5.5% 5.0%
Tenneco presents the above reconciliation for purposes of computing working capital as a percentage of revenue. We include total receivables, inventory and payables in the calculation as these are the components of working capital that we have the most direct control over and because they are most closely related to the cash flow performance of our operations.
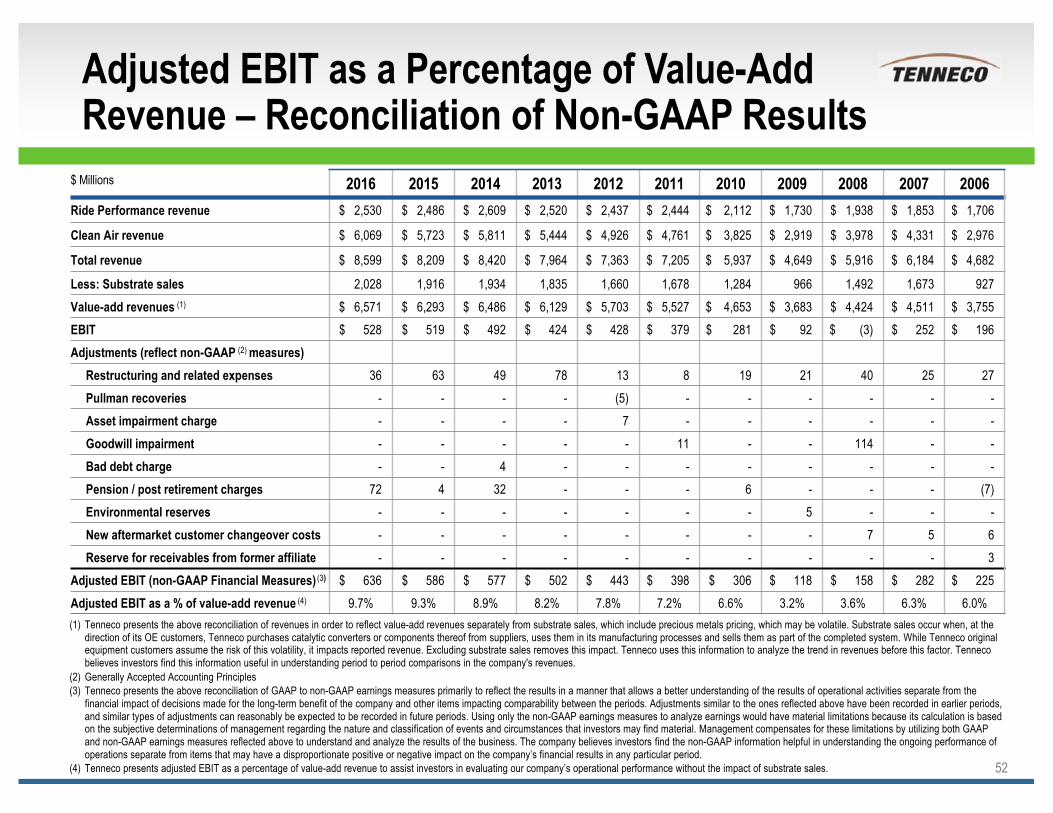
Adjusted EBIT as a Percentage of Value-Add Revenue – Reconciliation of Non-GAAP Results
52
(1) Tenneco presents the above reconciliation of revenues in order to reflect value-add revenues separately from substrate sales, which include precious metals pricing, which may be volatile. Substrate sales occur when, at the direction of its OE customers, Tenneco purchases catalytic converters or components thereof from suppliers, uses them in its manufacturing processes and sells them as part of the completed system. While Tenneco original equipment customers assume the risk of this volatility, it impacts reported revenue. Excluding substrate sales removes this impact. Tenneco uses this information to analyze the trend in revenues before this factor. Tenneco believes investors find this information useful in understanding period to period comparisons in the company's revenues.
(2) Generally Accepted Accounting Principles(3) Tenneco presents the above reconciliation of GAAP to non-GAAP earnings measures primarily to reflect the results in a manner that allows a better understanding of the results of operational activities separate from the
financial impact of decisions made for the long-term benefit of the company and other items impacting comparability between the periods. Adjustments similar to the ones reflected above have been recorded in earlier periods, and similar types of adjustments can reasonably be expected to be recorded in future periods. Using only the non-GAAP earnings measures to analyze earnings would have material limitations because its calculation is based on the subjective determinations of management regarding the nature and classification of events and circumstances that investors may find material. Management compensates for these limitations by utilizing both GAAP and non-GAAP earnings measures reflected above to understand and analyze the results of the business. The company believes investors find the non-GAAP information helpful in understanding the ongoing performance of operations separate from items that may have a disproportionate positive or negative impact on the company’s financial results in any particular period.
(4) Tenneco presents adjusted EBIT as a percentage of value-add revenue to assist investors in evaluating our company’s operational performance without the impact of substrate sales.
$ Millions 2016 2015 2014 2013 2012 2011 2010 2009 2008 2007 2006Ride Performance revenue $ 2,530 $ 2,486 $ 2,609 $ 2,520 $ 2,437 $ 2,444 $ 2,112 $ 1,730 $ 1,938 $ 1,853 $ 1,706
Clean Air revenue $ 6,069 $ 5,723 $ 5,811 $ 5,444 $ 4,926 $ 4,761 $ 3,825 $ 2,919 $ 3,978 $ 4,331 $ 2,976
Total revenue $ 8,599 $ 8,209 $ 8,420 $ 7,964 $ 7,363 $ 7,205 $ 5,937 $ 4,649 $ 5,916 $ 6,184 $ 4,682
Less: Substrate sales 2,028 1,916 1,934 1,835 1,660 1,678 1,284 966 1,492 1,673 927Value-add revenues (1) $ 6,571 $ 6,293 $ 6,486 $ 6,129 $ 5,703 $ 5,527 $ 4,653 $ 3,683 $ 4,424 $ 4,511 $ 3,755EBIT $ 528 $ 519 $ 492 $ 424 $ 428 $ 379 $ 281 $ 92 $ (3) $ 252 $ 196Adjustments (reflect non-GAAP (2) measures)
Restructuring and related expenses 36 63 49 78 13 8 19 21 40 25 27Pullman recoveries - - - - (5) - - - - - -Asset impairment charge - - - - 7 - - - - - -Goodwill impairment - - - - - 11 - - 114 - -Bad debt charge - - 4 - - - - - - - -Pension / post retirement charges 72 4 32 - - - 6 - - - (7)Environmental reserves - - - - - - - 5 - - -New aftermarket customer changeover costs - - - - - - - - 7 5 6Reserve for receivables from former affiliate - - - - - - - - - - 3
Adjusted EBIT (non-GAAP Financial Measures) (3) $ 636 $ 586 $ 577 $ 502 $ 443 $ 398 $ 306 $ 118 $ 158 $ 282 $ 225Adjusted EBIT as a % of value-add revenue (4) 9.7% 9.3% 8.9% 8.2% 7.8% 7.2% 6.6% 3.2% 3.6% 6.3% 6.0%
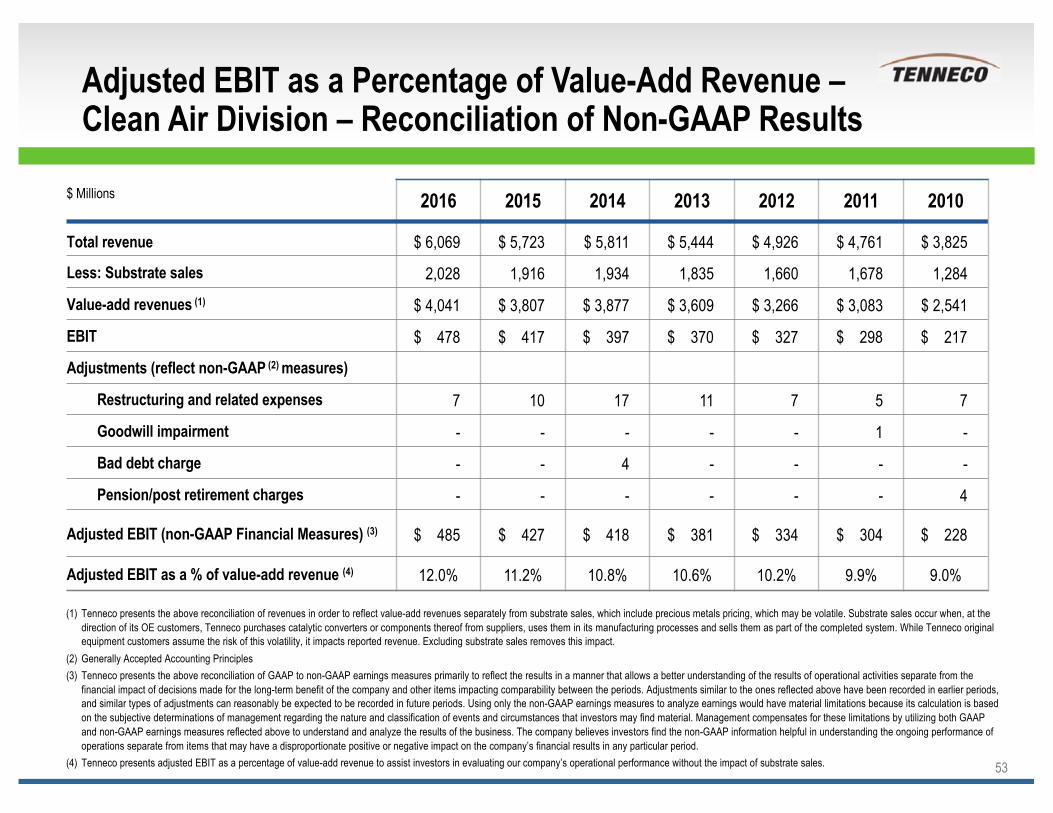
Adjusted EBIT as a Percentage of Value-Add Revenue –Clean Air Division – Reconciliation of Non-GAAP Results
53
(1) Tenneco presents the above reconciliation of revenues in order to reflect value-add revenues separately from substrate sales, which include precious metals pricing, which may be volatile. Substrate sales occur when, at the direction of its OE customers, Tenneco purchases catalytic converters or components thereof from suppliers, uses them in its manufacturing processes and sells them as part of the completed system. While Tenneco original equipment customers assume the risk of this volatility, it impacts reported revenue. Excluding substrate sales removes this impact.
(2) Generally Accepted Accounting Principles(3) Tenneco presents the above reconciliation of GAAP to non-GAAP earnings measures primarily to reflect the results in a manner that allows a better understanding of the results of operational activities separate from the
financial impact of decisions made for the long-term benefit of the company and other items impacting comparability between the periods. Adjustments similar to the ones reflected above have been recorded in earlier periods, and similar types of adjustments can reasonably be expected to be recorded in future periods. Using only the non-GAAP earnings measures to analyze earnings would have material limitations because its calculation is based on the subjective determinations of management regarding the nature and classification of events and circumstances that investors may find material. Management compensates for these limitations by utilizing both GAAP and non-GAAP earnings measures reflected above to understand and analyze the results of the business. The company believes investors find the non-GAAP information helpful in understanding the ongoing performance of operations separate from items that may have a disproportionate positive or negative impact on the company’s financial results in any particular period.
(4) Tenneco presents adjusted EBIT as a percentage of value-add revenue to assist investors in evaluating our company’s operational performance without the impact of substrate sales.
$ Millions 2016 2015 2014 2013 2012 2011 2010
Total revenue $ 6,069 $ 5,723 $ 5,811 $ 5,444 $ 4,926 $ 4,761 $ 3,825
Less: Substrate sales 2,028 1,916 1,934 1,835 1,660 1,678 1,284
Value-add revenues (1) $ 4,041 $ 3,807 $ 3,877 $ 3,609 $ 3,266 $ 3,083 $ 2,541
EBIT $ 478 $ 417 $ 397 $ 370 $ 327 $ 298 $ 217
Adjustments (reflect non-GAAP (2) measures)
Restructuring and related expenses 7 10 17 11 7 5 7
Goodwill impairment - - - - - 1 -
Bad debt charge - - 4 - - - -
Pension/post retirement charges - - - - - - 4
Adjusted EBIT (non-GAAP Financial Measures) (3) $ 485 $ 427 $ 418 $ 381 $ 334 $ 304 $ 228
Adjusted EBIT as a % of value-add revenue (4) 12.0% 11.2% 10.8% 10.6% 10.2% 9.9% 9.0%
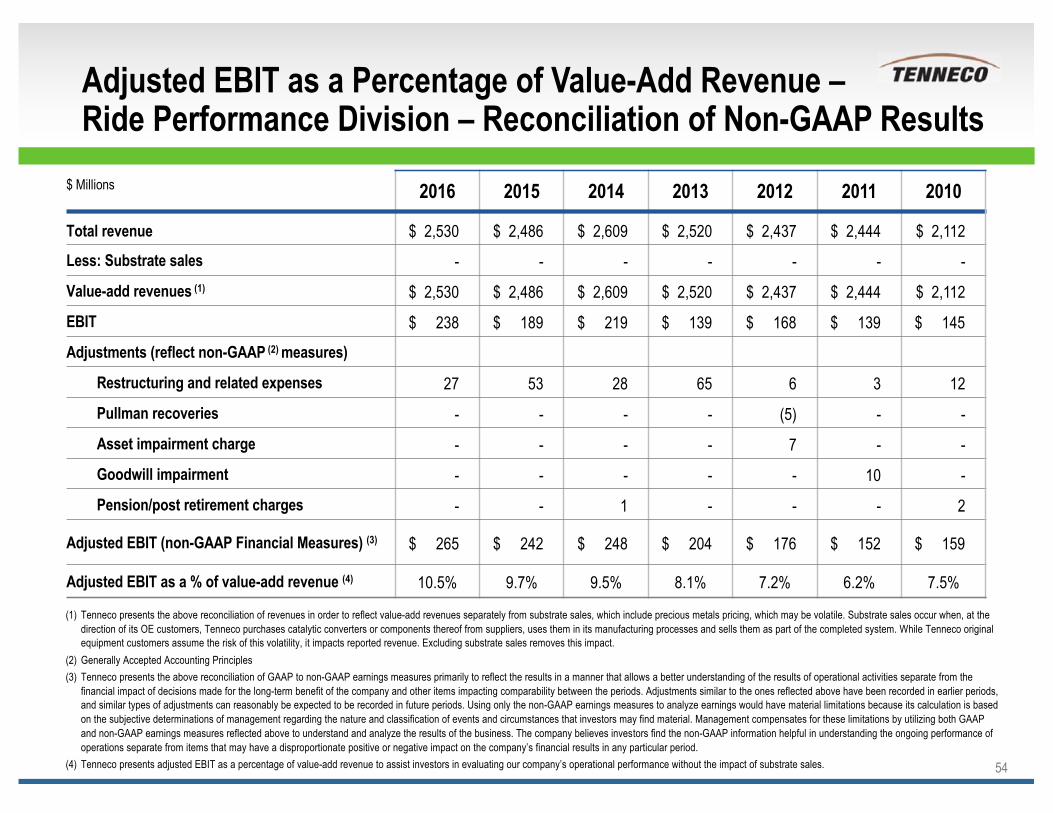
Adjusted EBIT as a Percentage of Value-Add Revenue –Ride Performance Division – Reconciliation of Non-GAAP Results
54
(1) Tenneco presents the above reconciliation of revenues in order to reflect value-add revenues separately from substrate sales, which include precious metals pricing, which may be volatile. Substrate sales occur when, at the direction of its OE customers, Tenneco purchases catalytic converters or components thereof from suppliers, uses them in its manufacturing processes and sells them as part of the completed system. While Tenneco original equipment customers assume the risk of this volatility, it impacts reported revenue. Excluding substrate sales removes this impact.
(2) Generally Accepted Accounting Principles(3) Tenneco presents the above reconciliation of GAAP to non-GAAP earnings measures primarily to reflect the results in a manner that allows a better understanding of the results of operational activities separate from the
financial impact of decisions made for the long-term benefit of the company and other items impacting comparability between the periods. Adjustments similar to the ones reflected above have been recorded in earlier periods, and similar types of adjustments can reasonably be expected to be recorded in future periods. Using only the non-GAAP earnings measures to analyze earnings would have material limitations because its calculation is based on the subjective determinations of management regarding the nature and classification of events and circumstances that investors may find material. Management compensates for these limitations by utilizing both GAAP and non-GAAP earnings measures reflected above to understand and analyze the results of the business. The company believes investors find the non-GAAP information helpful in understanding the ongoing performance of operations separate from items that may have a disproportionate positive or negative impact on the company’s financial results in any particular period.
(4) Tenneco presents adjusted EBIT as a percentage of value-add revenue to assist investors in evaluating our company’s operational performance without the impact of substrate sales.
$ Millions 2016 2015 2014 2013 2012 2011 2010
Total revenue $ 2,530 $ 2,486 $ 2,609 $ 2,520 $ 2,437 $ 2,444 $ 2,112 Less: Substrate sales - - - - - - -
Value-add revenues (1) $ 2,530 $ 2,486 $ 2,609 $ 2,520 $ 2,437 $ 2,444 $ 2,112
EBIT $ 238 $ 189 $ 219 $ 139 $ 168 $ 139 $ 145
Adjustments (reflect non-GAAP (2) measures)
Restructuring and related expenses 27 53 28 65 6 3 12
Pullman recoveries - - - - (5) - -
Asset impairment charge - - - - 7 - -
Goodwill impairment - - - - - 10 -
Pension/post retirement charges - - 1 - - - 2
Adjusted EBIT (non-GAAP Financial Measures) (3) $ 265 $ 242 $ 248 $ 204 $ 176 $ 152 $ 159
Adjusted EBIT as a % of value-add revenue (4) 10.5% 9.7% 9.5% 8.1% 7.2% 6.2% 7.5%
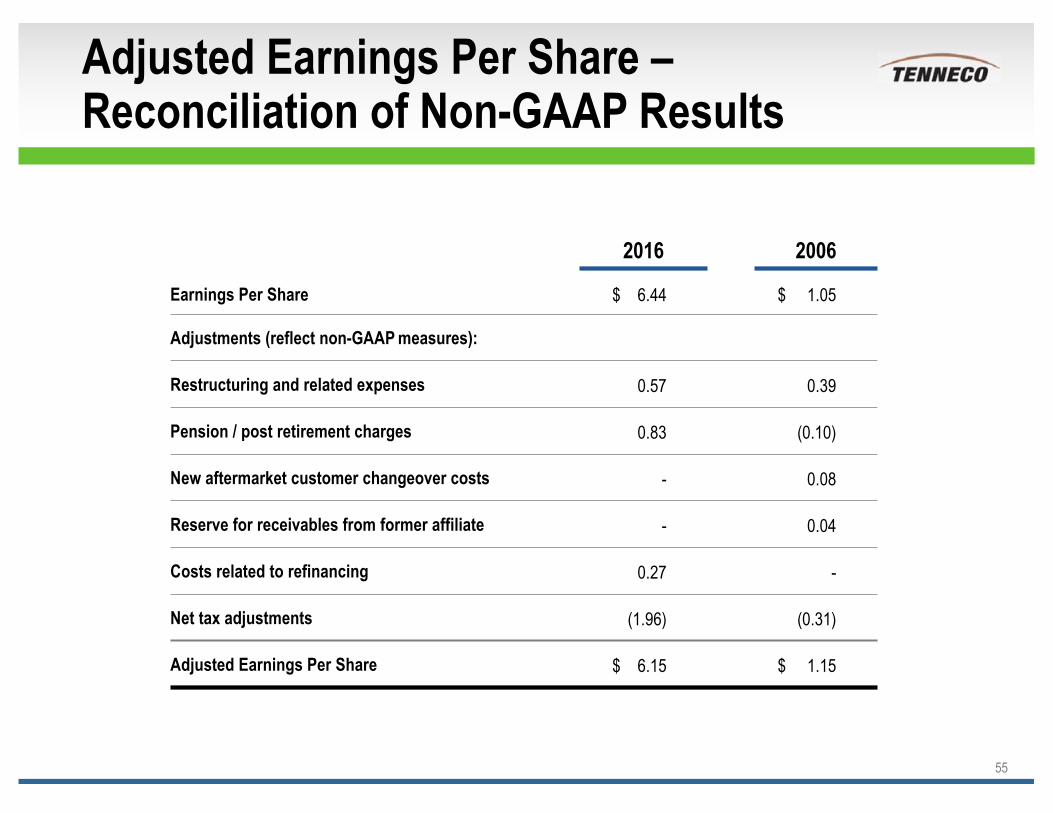
Adjusted Earnings Per Share –Reconciliation of Non-GAAP Results
55
2016 2006
Earnings Per Share $ 6.44 $ 1.05
Adjustments (reflect non-GAAP measures):
Restructuring and related expenses 0.57 0.39
Pension / post retirement charges 0.83 (0.10)
New aftermarket customer changeover costs - 0.08
Reserve for receivables from former affiliate - 0.04
Costs related to refinancing 0.27 -
Net tax adjustments (1.96) (0.31)
Adjusted Earnings Per Share $ 6.15 $ 1.15