key to areas assessed key to colours shown on images 2011/2.01-2.03... · key to areas assessed key...
TRANSCRIPT

Appendix 9.4(A) – Overshadowing to Proposed Amenity Areas Page 1 of 13
Appendix 9.4(A)
March 21st - Overshadowing Study to Proposed Amenity Areas
Key to Areas Assessed Key to Colours Shown on Images
Appendix 9.4(A) – Overshadowing to Proposed Amenity Areas Page 2 of 13
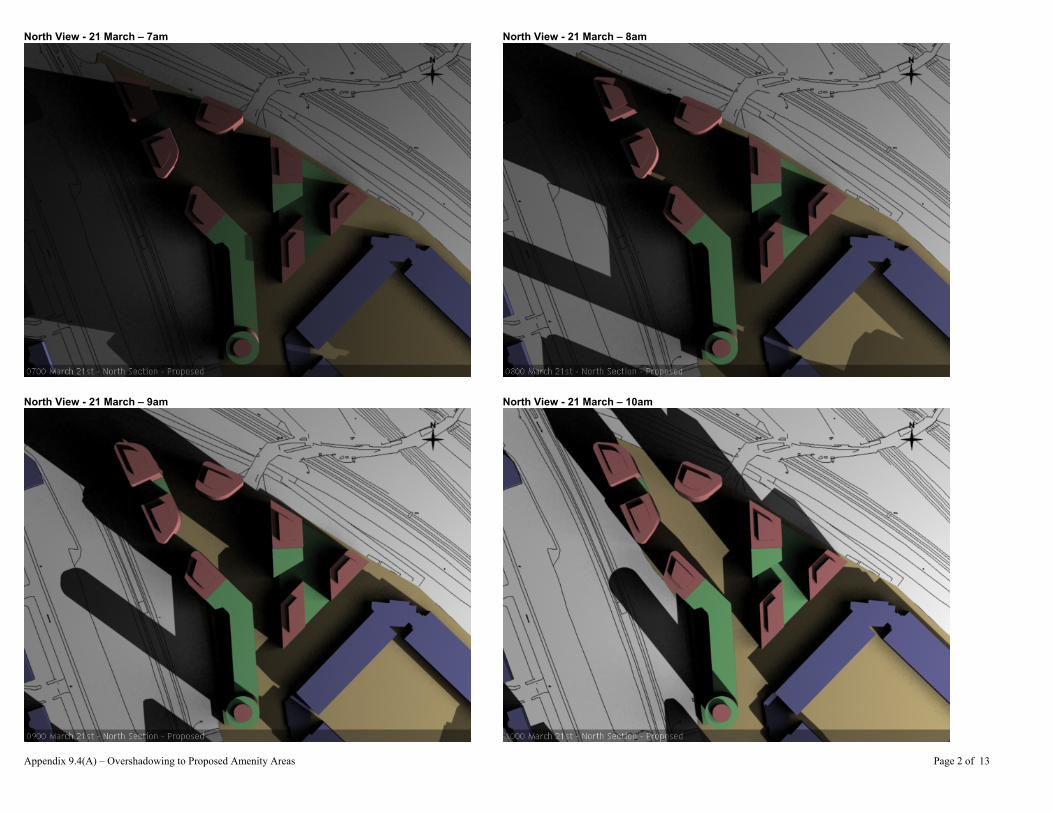
North View - 21 March – 7am North View - 21 March – 8am
North View - 21 March – 9am North View - 21 March – 10am

Appendix 9.4(A) – Overshadowing to Proposed Amenity Areas Page 3 of 13
North View - 21 March – 11am North View - 21 March – 12pm
North View - 21 March – 1pm North View - 21 March – 2pm

Appendix 9.4(A) – Overshadowing to Proposed Amenity Areas Page 4 of 13
North View - 21 March – 3pm North View - 21 March – 4pm
North View - 21 March – 5pm
Appendix 9.4(A) – Overshadowing to Proposed Amenity Areas Page 5 of 13
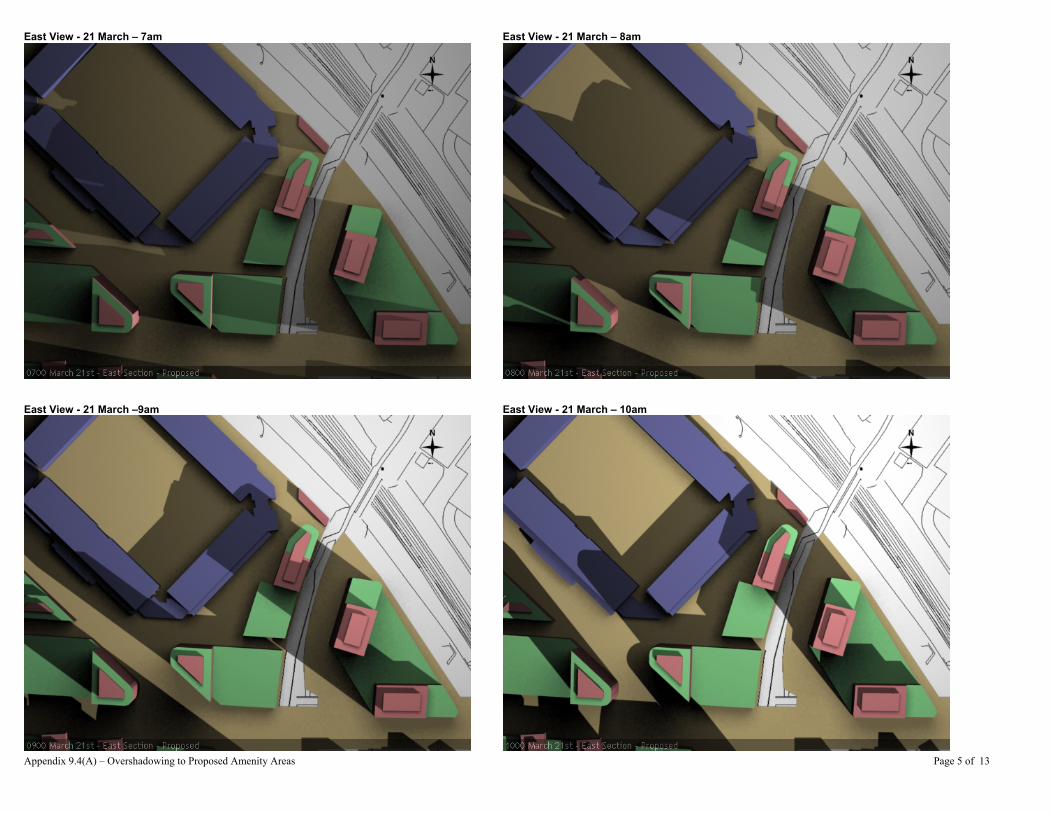
East View - 21 March – 7am East View - 21 March – 8am
East View - 21 March –9am East View - 21 March – 10am
Appendix 9.4(A) – Overshadowing to Proposed Amenity Areas Page 6 of 13
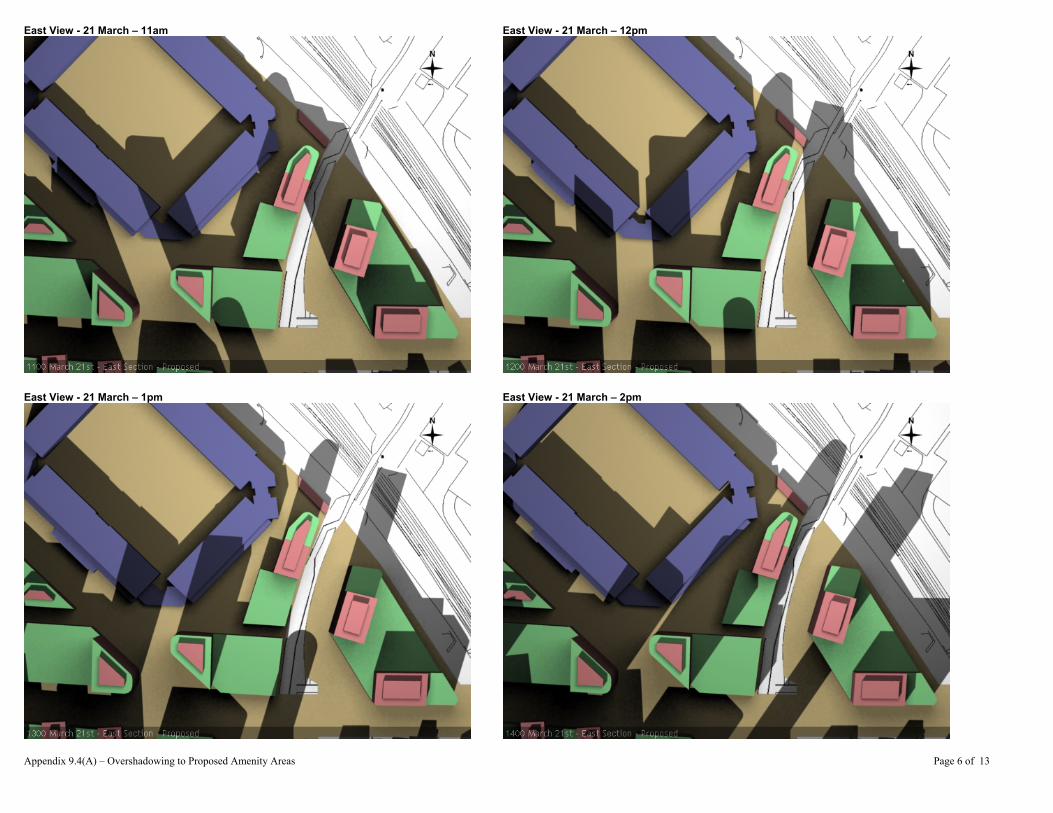
East View - 21 March – 11am East View - 21 March – 12pm
East View - 21 March – 1pm East View - 21 March – 2pm

Appendix 9.4(A) – Overshadowing to Proposed Amenity Areas Page 7 of 13
East View - 21 March – 3pm East View - 21 March – 4pm
East View - 21 March – 5pm
Appendix 9.4(A) – Overshadowing to Proposed Amenity Areas Page 8 of 13
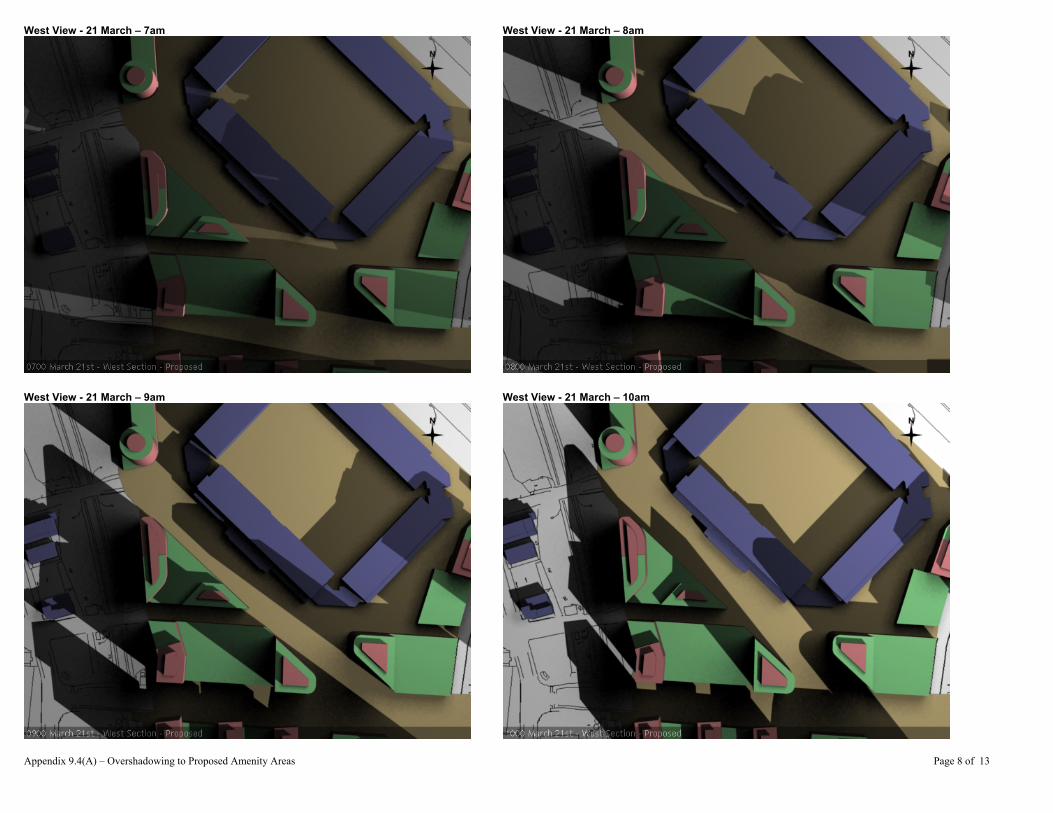
West View - 21 March – 7am West View - 21 March – 8am
West View - 21 March – 9am West View - 21 March – 10am

Appendix 9.4(A) – Overshadowing to Proposed Amenity Areas Page 9 of 13
West View - 21 March – 11am West View - 21 March – 12pm
West View - 21 March – 1pm West View - 21 March – 2pm

Appendix 9.4(A) – Overshadowing to Proposed Amenity Areas Page 10 of 13
West View - 21 March – 3pm West View - 21 March – 4pm
West View - 21 March – 5pm

Appendix 9.4(A) – Overshadowing to Proposed Amenity Areas Page 11 of 13
South View - 21 March – 7am South View - 21 March – 8am
South View - 21 March – 9am South View - 21 March – 10am

Appendix 9.4(A) – Overshadowing to Proposed Amenity Areas Page 12 of 13
South View - 21 March – 11am South View - 21 March – 12pm
South View - 21 March – 1pm South View - 21 March – 2pm

Appendix 9.4(A) – Overshadowing to Proposed Amenity Areas Page 13 of 13
South View - 21 March –3pm South View - 21 March – 4pm
South View - 21 March – 5pm

Wind Microclimate addendum, July 2011
1
10. Wind Microclimate addendum, July 2011
10.1 Introduction
10.1.1 This ES Addendum follows the same EIA methodology and approach to the assessment
detailed within the January 2011 Environmental Statement. This is considered to be a robust
approach that does not need amending.
10.1.2 This chapter assesses the likely significant environmental effects of the Proposed Surrey
Canal Development, as amended, on the wind microclimate within and around the Application
Site.
10.1.3 Following a full wind microclimate assessment undertaken in preparation of the wind
microclimate chapter of the January 2011 Environmental Statement, and in light of the
revisions made to the Proposed Development following this assessment, a further boundary
layer wind tunnel test was undertaken to assess the likely significant environmental effects of
the Proposed Development, as amended, (incorporating soft landscaping proposals) in
relation to wind, and any mitigation measures required to prevent, reduce or offset any likely
significant environmental effects.
10.1.4 The boundary layer wind tunnel study has provided a detailed quantitative assessment of the
wind environment at key locations in and around the Proposed Development in terms of
accepted, UK industry standard, pedestrian comfort and safety criteria (Lawson Criteria). The
study considers the Proposed Development in the context of existing surroundings.
10.1.5 The revisions made to the Proposed Development following submission of the January 2011
Environmental Statement do not affect the interim construction scenario (an environmental
assessment ‘snapshot’), comprising Phase 1 of the Proposed Development. Correspondingly
the further assessment work has not additionally considered Phase 1 of the Proposed
Development within the context of Construction Effects.
10.1.6 The revisions made to the Proposed Development following submission of the January 2011
Environmental Statement do not affect the conditions at roof-top terrace level.
Correspondingly the further assessment work has not additionally considered wind conditions
at roof-top terrace level.

Wind Microclimate addendum, July 2011
2
10.2 Policy Context
National and Regional Planning Policy
10.2.1 National and Regional and Planning Policies of relevance to wind microclimate remain as set
out in the January 2011 Environmental Statement.
Local Planning Policy
10.2.2 Policy URB5 of the Lewisham Unitary Development Plan (adopted in 2004) states:
“In those situations where the height of the proposed development may, in the Council’s view
generate potential developmental, overshadowing or micro-climatic problems at street level,
overshadowing of riverside pathways, channels and the foreshore with detrimental effect to
the river environment or in relation to adjoining buildings, the Council will require information
to be submitted that will demonstrate that such problems will not result from the proposed
high buildings. Applications for high buildings should therefore be accompanied by design
statements. An Environmental Impact Assessment may also be required.”
With reasoning as follows:
“Account will also be taken of the effects of wind turbulence and overshadowing in the siting
of any high building and applicants must demonstrate that every effort has been made to
contain or eliminate such factors.”
10.2.3 Following ratification by LBL in June 2011, the relevant policy within the adopted Lewisham
Borough Council Core Strategy states, in relation to the location and design of tall buildings:
“An assessment will be made on the potential developmental, overshadowing or micro-
climatic problems at street level.”
10.3 Methodology and Assessment Criteria
10.3.1 The methodology and assessment criteria for the further wind microclimate assessment of the
Proposed Development, as amended, within the context of existing surrounds remain as
detailed within the January 2011 Environmental Statement.
10.3.2 Correspondingly a wind tunnel test of the Proposed Development, as amended, was
undertaken within BMT’s Boundary Layer Wind Tunnel, which has a working section 4.8
metres wide, 2.4 metres high and 15 metres long with a 4.4 metre diameter multiple plate
turntable. BMT’s wind tunnel model was updated in accordance with the revisions to the
Proposed Development, and included a detailed modelling representation of the soft
landscaping proposals described within the Development Specification and as detailed within
the Parameter Plans that accompany the planning application. Relevant existing trees both
Wind Microclimate addendum, July 2011
3
within the Application Site, and within the adjacent surrounding area were also modelled.
Trees were modelled in winter form, without foliage. It is however assumed that the trees are
of a species with substantial retained solidity in winter and therefore includes numerous small
branches and twigs.
10.3.3 All components of the wind tunnel model (including the measurement sensors) were reviewed
in advance of, and during the wind tunnel test to confirm the validity of measurements
acquired during the wind tunnel test, and correspondingly included within BMT’s assessment.
10.3.4 Wind tunnel testing represents industry-standard best practice, in contrast to other methods
which are less applicable to the assessment of wind effects and architectural aerodynamics
(including CFD assessment methods that do not apply to turbulent wind flows in the built
environment). Correspondingly the assessment technique is considered to be robust.
10.4 Aspects of the Proposed Development of Relevance to the Assessment
10.4.1 The Proposed Development, as amended, is largely similar to the scheme originally
considered within the January 2011 Environmental Statement, and wind effects are expected
to be correspondingly similar.
10.4.2 There are, however, differences to the Proposed Development that were expected to be of
some potential significance. With regard to prevailing westerly and south-westerly winds the
setting back of the Plot Stadium Avenue and the loss of plots Stadium 1 and Stadium 2 create
the potential for a reasonable change to the wind conditions within this and connected areas.
Additionally the removal of the lower two storeys of Senegal Way may give rise to
downdraughts being funnelled underneath the undercut from prevailing directions. The minor
increase in the maximum height parameters of Senegal Way 2 are not considered to be
material.
10.5 Baseline Situation
10.5.1 The baseline scenario remains unchanged from that detailed within Chapter 2 of the January
2011 Environmental Statement.
10.5.2 Correspondingly, baseline conditions are considered to be identical to those presented within
the January 2011 Environmental Statement.

Wind Microclimate addendum, July 2011
4
10.6 Identification and Assessment of Effects
Construction Effects
10.6.1 Construction effects are not expected to differ from those detailed within the January 2011
Environmental Statement.
Operational Effects
10.6.2 Full details of the suitability assessment for the Proposed Development, as amended, with
proposed landscaping as set out in the Development Specification, are presented in graphical
format in Figure 10.3A. The trees considered comprised ~7-8m high deciduous trees of a
species with substantial retained solidity in winter. A fence / wall incorporated around the
Bolina West private open space was 2.1m high.
10.6.3 The general wind microclimate within the Application Site and surrounding area is largely
similar to that presented within the January 2011 Environmental Statement. Where minor
differences do exist, these are attributable to the scheme changes and to minor differences
between the current soft landscaping proposals and those developed during boundary layer
wind tunnel testing of the original scheme.
Thoroughfares and Entrances
10.6.4 Landscaping measures proposed within the Development Specification, would generally be
beneficial with respect to pedestrian level wind conditions. As a result, conditions across the
Site would rate as safe for all users and would be suitably comfortable for at least leisurely
strolling. Conditions would thus be suitable for pedestrian access to, and passage through,
the Site in relation to recreational activities, and the Proposed Development would have no
significant effect on wind conditions along the thoroughfares within the Site.
10.6.5 Building fronts currently envisaged as potential entrance locations would generally be suitable
for pedestrian ingress/egress, and the potential environmental effect of the Proposed
Development across much of the Site would thus not be significant. However, the potential
residential entrances at the curved Southeast corner of Stockholm 1, the curved northwest
corner of Stockholm 2, the western entrance to Senegal Way 2 and the southwest side of
Orion would be suitable, ideally, only for leisurely strolling during winter. Although marginally
windy for comfortable pedestrian ingress/egress during winter, conditions are expected to be
tolerable for an entrance, and these potential significant environmental effects would thus be
considered minor adverse.
Active Retail Fronts
10.6.6 Building fronts currently envisaged for active retail uses would generally be suitable for at
least short periods of standing and would thus be suitable for window-shopping as well as
Wind Microclimate addendum, July 2011
5
pedestrian ingress/egress at entrances. Conditions would thus be suitable for active fronts,
and the potential environmental effect would not be significant.
Open Spaces
10.6.7 Within Bolina Gardens, conditions across the play area would be considered suitable for a
children’s play space. The remainder of the public space would be suitable for general
recreational activities, including short periods of standing or sitting, from spring through to
autumn, and would be suitable for a meeting point for example. The East side of the space
may benefit from evolution of the detailed landscaping scheme, pursuant to and consistent
with the landscaping referred to on the Parameter Plans and Development Specification, to
create more amenable conditions for outdoor seating. However this potential significant
environmental effect would be considered, at worst, minor adverse.
10.6.8 The private open space on the North West side of Bolina West would be suitable for a
children’s play space or crèche, being suitable for recreational activities including short
periods of standing or sitting from spring through to autumn. Much of the space would be also
be suitable during winter, with only the East side of the space, immediately adjacent to the
building corner, being slightly windy for such activities. Given the area and season affected,
the potential environmental effect would not be considered significant.
10.6.9 Along Stadium Avenue, between the Stadium Avenue plot and Millwall FC, wind conditions
would be suitable for at least short periods of standing / sitting, and within the south-eastern
half, would be suitable for prolonged periods of outdoor sitting during at least summer if
incidental seating were to be incorporated within the publicly accessible open space.
Evolution of the detailed landscaping scheme may be beneficial in ensuring similarly
amenable conditions within the north-western area of Stadium Avenue, but the potential
environmental effect would not be significant.
10.6.10 Away from building corners, wind conditions along the North East front of Stockholm 1 and
the South West front of Stockholm 2 would be suitable for long periods of outdoor sitting from
spring through to autumn and would thus be suitable for café outdoor seating. Evolution of
detailed landscaping may be beneficial in enhancing conditions within the more open space
between Stockholm 1 and Stockholm 2, but the potential environmental effect would not be
significant.
10.6.11 Station Square would be suitable for general recreational activities, including short periods of
standing or sitting, and would be suitable for a meeting point for example. This environmental
effect would not be significant.
10.6.12 The public space in front of Orion would be suitable for general recreational activities,
including short periods of standing or sitting, from spring through to autumn, but may benefit
from evolution of the detailed landscaping scheme to create similarly amenable conditions for

Wind Microclimate addendum, July 2011
6
a meeting point during winter. This potential significant environmental effect would be
considered, at worst, minor adverse.
Surrounding Area
10.6.13 As for existing Site conditions, the Away Supporters Route around the North Eastern side of
the Site would enjoy suitable conditions for pedestrian thoroughfare. The South East corner of
the existing Silwood Estate, beyond the railway lines, would also remain suitable for
pedestrian passage and it is expected that the building entrances would remain suitable for
pedestrian ingress/egress. Adjacent developments to the South of the Site would similarly
remain suitable for pedestrian passage and for pedestrian ingress/egress at building
entrances.
10.6.14 Wind conditions at the location of the proposed Surrey Canal Road Station platforms, to the
South East of the Site, would remain suitable for at least short periods of sitting or standing
and would be suitable for awaiting a train.
10.6.15 The Proposed Development would therefore have no significant environmental effects on
wind conditions within the surrounding area.
10.7 Opportunities for Further Mitigation Measures
10.7.1 The pedestrian level wind environment has been assessed for the Proposed Development in
accordance with the Development Specification, and within the constraints of the Parameter
Plans. The assessment has highlighted opportunities for further development of the wind
mitigation measures at detailed design to further enhance wind conditions for proposed
pedestrian activities. The potential further measures are listed as follows (Note: opportunities
for further mitigation measures identified at rooftop terrace level are identified via the original
January 2011 Environmental Statement assessment):
Recessed or locally protected entrances at the curved Southeast corner of Stockholm
1, the curved northwest corner of Stockholm 2, the western side of Senegal Way 2 and
the southwest side of Orion;
Localised shelter, through introduction of screens, hedges or low-level shrubs, of any
seating benches in the public spaces in Bolina Gardens, in front of Orion along Stadium
Avenue, and between plots Stockholm 1 and 2;
Development of barrier schemes at the edges of occupied roof level open spaces,
potentially culminating in winter gardens on Bolina North 1 and Bolina North 2;
Introduction of soft landscaping and screens across the larger roof level open spaces,
potentially breaking larger spaces into smaller, more sheltered, pockets.
Wind Microclimate addendum, July 2011
7
10.8 Summary of Residual Effects
10.8.1 With development and implementation of the further mitigation measures listed in Section
10.7, it is expected that suitable conditions would be created for planned recreational
activities and the likely residual effects of the Proposed Development would not be significant.
10.9 Assessment of Cumulative Effects
10.9.1 Cumulative effects are not expected to differ from those detailed within the January 2011
Environmental Statement. Correspondingly potential cumulative environmental effects would
not be considered significant as part of any baseline consideration or in conjunction with the
completion of the Proposed Development.
10.10 References
10.11 References for the current ES Addendum are as set out in the January 2011 Environmental
Statement.

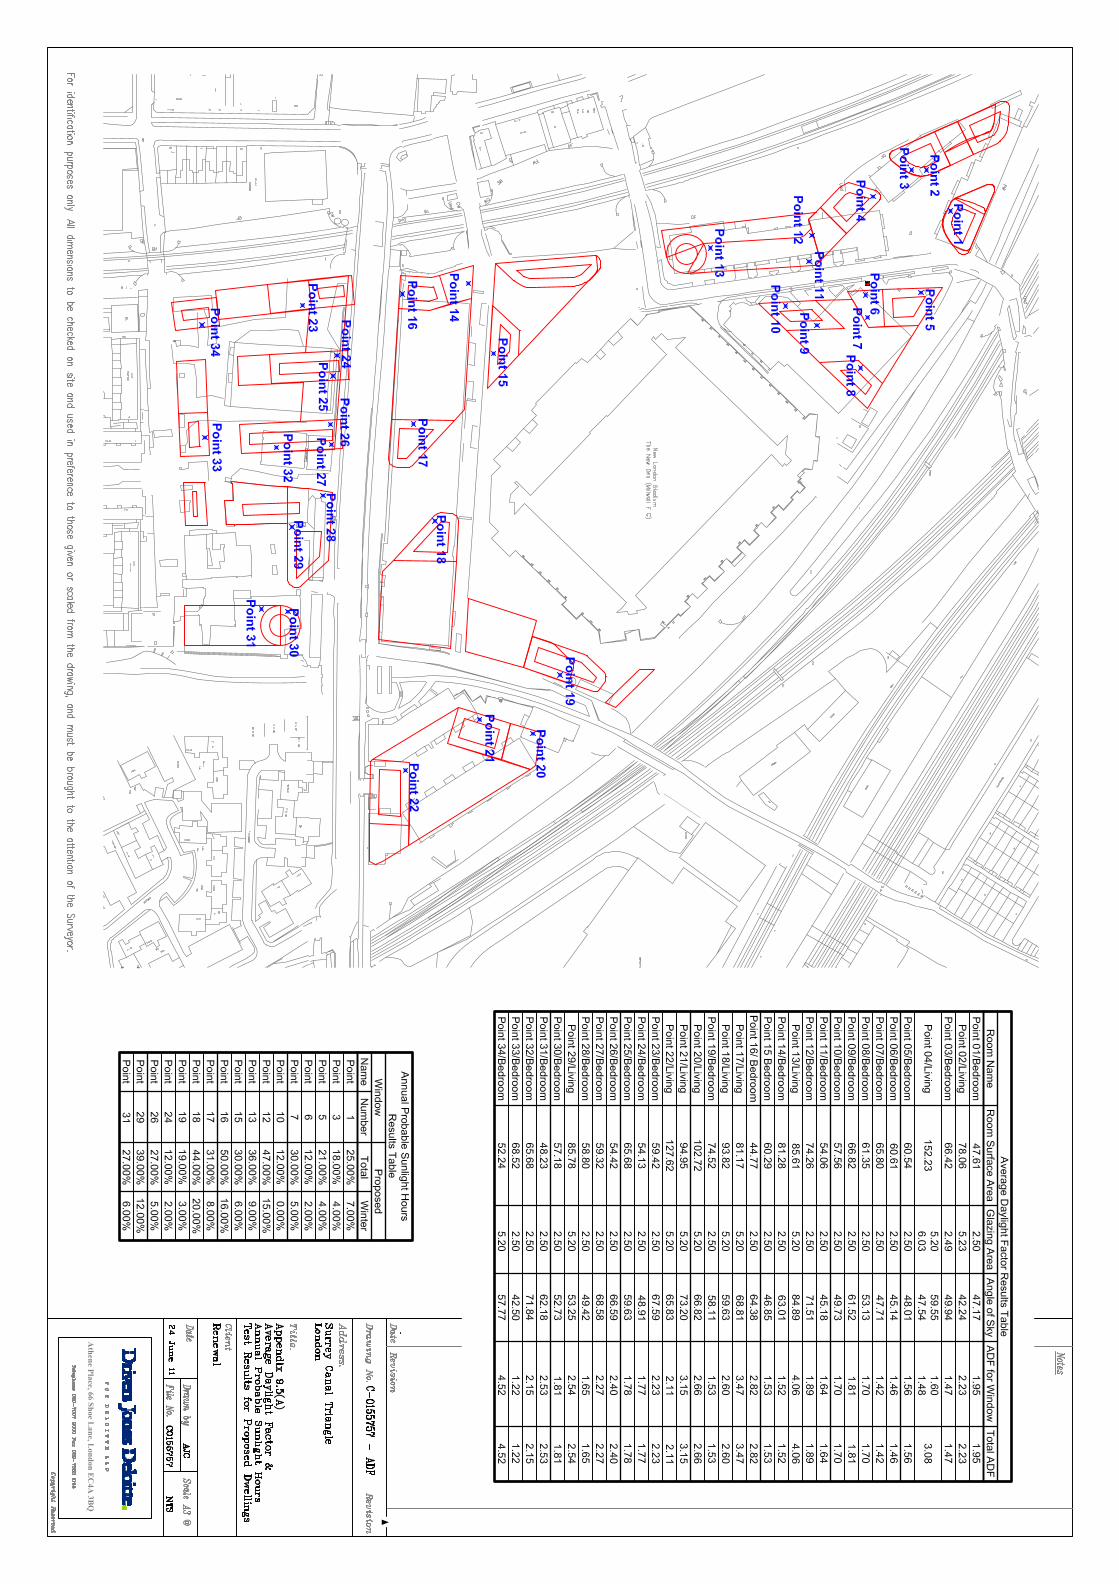
Figure 10.3 A Proposed Development Wind Environment
Assessment

Socio Economics & Population addendum, July 2011
1
11. Socio Economics & Population addendum, July 2011
11.1 Introduction
11.1.1 This chapter addresses points of clarification and re-assessment with regard to socio-
economic effects. The revisions to the Proposed Development that potentially affect the
assessment of the significance of socio-economic environmental effects are:
– Fewer FTE construction jobs due to a reduction in the size of the Proposed
Development;
– Fewer residential units and changes to the tenure mix, leading to lower population and
child yield;
– Additional child playspace identified and commitment to replacement of indoor sports
pitch within the Millwall Community Scheme; and
– Less commercial floorspace, leading to fewer FTE jobs at the operational phase.
11.2 Policy Context
11.2.1 There have been no significant changes to policy which require re-assessment in relation to
socio-economics.
11.2.2 The previous assessment provided a detailed review of socio-economic regeneration policy at
national, regional and local scales. The chapter aims to give its own reference to national and
regional policy in terms of the development, and although it is recognised that local policy is
directed by national and regional policy, it is usually helpful to pull out the key aspects.
11.3 Methodology and Assessment Criteria
11.3.1 There are no significant changes to the approach to methodology or assessment criteria in
respect of defining the significance of the Proposed Development on socio-economic
receptors. However, the range of unit tenure and size scenarios referred to in Para 11.3.3 and
11.3.4 of the January 2011 ES are now no longer applicable, and have been replaced with
two defined unit scenarios based on a 0% affordable housing and 20% affordable housing the
minimum and maximum range stated in the revised Development Specification.
11.3.2 Para 11.3.5 of the January 2011 ES states that the operational development “will never
include the lowest parameters” in assessment of employment impacts. By way of clarification,
this refers to the approach in the Development Specification which highlights minimum and
maximum parameters by type of floorspace. The intention was to explain that the minimum of
all individual floorspace elements will not be assessed - the „lowest parameters‟ are actually

Socio Economics & Population addendum, July 2011
2
higher than the sum of individual minimum parameters by floorspace type due to the
requirement at 2.6 in the Development Specification which states that “the total quantum by
floor space of non-residential uses will always be no less than 37,000 sq m or 20% of the total
floor space provided, whichever is the lower, notwithstanding the minima quanta by land use
specified in paragraph 2.4”. Also, the minimum built extents shown on the Parameter Plans
would give rise to more quantum than the minimum floorspace quantum by land use.
11.3.3 In the January 2011 ES, Para 11.3.8 indicates that significance is to be judged solely by
reference to the magnitude of any likely change relative to normal variations in baseline
conditions, without reference to the actual levels of baseline conditions or to the sensitivity of
the receptor(s), or to any of the other considerations set out in Chapter 2. The text appears to
establish that where socio-economic effects are concerned, minor effects are to be treated as
significant”. To clarify this point, the „significance‟ of effects is related to the baseline and the
sensitivity of the receptor, and the definition given in chapter 2 stands. A „significant‟ effect is
any effect that has an above-negligible impact on the baseline and sensitive receptors, and
the significance is described as minor, moderate or major.
11.3.4 Para 11.3.9 of the socio-economic assessment in the January 2011 ES referred to the
significance of temporary and permanent effects, and may not have explicitly referenced
„occasional‟ effects such as events held at the MFC Stadium. To clarify this point, it is taken
that assessment includes a review of the effects related to the MFC Stadium, which is
considered a consistent element that will be subject to occasional events, and therefore this
element is encompassed in the assessment.
11.4 Baseline Situation
11.4.1 There are no changes to the socio-economic baseline required to update the assessment.
11.4.2 While it is recognized that the geographical units used to assess the socio-economic baseline
do not include the immediately adjacent parts of LB Southwark (e.g. Ilderton Road and Jarrow
Road), whose residents and industrial users can also expect to be affected by the Proposed
Development, by way of clarification it is noted that socio-economic baseline data is collected
on a ward-based level and aggregated across the ward rather than representing demographic
data on a street-level basis for data relating to housing, population, jobs and economic activity
etc. In addition, many of the baseline parameters including the assessment of deprivation and
all elements of the community facilities audit look at a geographical radius of the area and
therefore cover the surrounding streets and neighbourhoods.
11.4.3 Para 11.4.1 of the January 2011 ES describes the sports facilities component of the scheme
as “…a regionally significant provision of sports facilities”. To clarify this point, „regionally

Socio Economics & Population addendum, July 2011
3
significant‟ in this context is meant as a descriptive term to summarise the number, size and
type of facilities provided, rather than its impact on the receptors.
11.4.4 Para 11.4.4 of the January 2011 ES appears to cover ground that has already been dealt with
in Chapter 6, and some of the items included in the bulleted list are not necessarily control
measures. To clarify, this section tries to pull out references to the relevant environmental
management control measures that are relevant to socio-economics.
11.4.5 The socio-economic assessment baseline within the January 2011 ES does not include the
Grove Medical Centre, Windlass Place, which sits just outside the 1km contour centred on the
site. To clarify the approach taken, this facility hasn‟t been included in the assessment as it is
just outside 1km, the cut-off for assessment. However, the text following the diagram refers to
the Grove Medical Centre and recognises that it is just outside this distance.
11.4.6 Following a consultation on the provision of additional permanent places in primary schools in
LBL, a number of recommendations were made on taking forward a number of projects to
increase the supply of permanent primary places in Lewisham from 2012. The
recommendations pertinent to the Surrey Canal scheme include:
An intention to publish a Statutory Notice to expand Kender Primary School from 1 to 2 forms
of entry.
An intention to put on hold the proposed expansion of Deptford Park Primary School from 3 to
4 forms of entry.
11.4.7 Additionally, in PPPL5 (Deptford / New Cross), LBL is in discussion with John Ball Primary
School whose Governing Body is considering expanding the school on the Mornington Centre
Site, with the intention of increasing the number of permanent places available in the locality
more generally.
11.4.8 Latest projections suggest a shortfall in Reception places in Deptford / New Cross from 2010
onwards, and this is borne out by the current levels of late applications from the area. A high
proportion of late applicants for places in 2010 have come from this part of the borough The
LA will need to plan for approximately three additional forms of entry from 2011 - 15. Deptford
and New Cross are areas where major developments are planned, to be completed by the
end of the decade. Longer term projections anticipating the impact of major development
schemes indicate the need for up to 4.5 FE by 2014 and 7 FE by 2020.

Socio Economics & Population addendum, July 2011
4
11.5 Identification and Assessment of Effects
11.5.1 The following section sets out a re-assessment of the likely significance of the socio-economic
environmental effects arising from the Proposed Development, as amended.
Construction Employment
11.5.2 The Proposed Development has reduced in size, and therefore will create a lower number of
FTE jobs during the construction phase. On this basis, the demolition and construction phase
of the Proposed Development will account for approximately 4,700 person-years of
employment, based on a 10-15 year build-out.
11.5.3 By convention, a permanent full-time equivalent (FTE) job equates to 10 person-years of
employment. Therefore, it can be estimated that approximately 470 FTE jobs could be
generated by the construction phase of the Proposed Development. However, peak
headcount on-site will be significantly higher.
11.5.4 The previous assessment concluded that the Proposed Development would have a minor
beneficial effect at the district level. The level of significance of the Proposed Development
as amended remains minor beneficial.
Population and Child Yield
11.5.5 Para 11.6.16 of the socio-economic assessment in the January 2011 ES presents the
estimated future population and “child yield” of the Proposed Development, without explaining
the tenure and unit size assumptions that underpin these estimates. The revised
Development Specification commits to a range of between 0% and 20% affordable housing
and a housing mix. The two scenarios outlined in the following tables represent the illustrative
scheme with 0 or 20% affordable housing. The illustrative scheme is only a few units short of
the maximum number of residential units specified in the Development Specification (2,400).
The illustrative scheme applies residential unit sizes and a mix consistent with the Parameters
and Principles in the Development Specification. Increased numbers could only be achieved
by improved efficiencies.
Scenario 1
1-bed 2-bed 3-bed 4-bed TOTAL
Private 757 1,027 178 21 1,983
Intermediate 27 64 36 30 157
Social Rented 40 94 34 63 231
TOTAL 824 1,185 248 114 2,371
Socio Economics & Population addendum, July 2011
5
Scenario 2
1-bed 2-bed 3-bed 4-bed TOTAL
Private 830 1,186 237 119 2,372
Intermediate 0 0 0 0 0
Social Rented 0 0 0 0 0
TOTAL 830 1,186 237 119 2,372
11.5.6 The Proposed Development, as amended, would bring forward a total of up to around 2,400
homes, split between a range of sizes and tenures. The proposed homes are expected to
accommodate around 3,849-4,205 people including around 212-532 children of between 0 to
15 years of age.
Households
11.5.7 The Proposed Development, as amended, will contribute up to 21% of the total housing target
for the Borough over the 10 year plan period.
11.5.8 Overall, the effect of the provision of up to 2,400 residential units and the hotel (up to 150
bedrooms) against policy targets for housing provision outlined in local and regional policy is
still assessed to be a major beneficial long-term effect at the local level, major beneficial
long-term effect at the district level, and minor beneficial at the regional scale.
Operational Employment
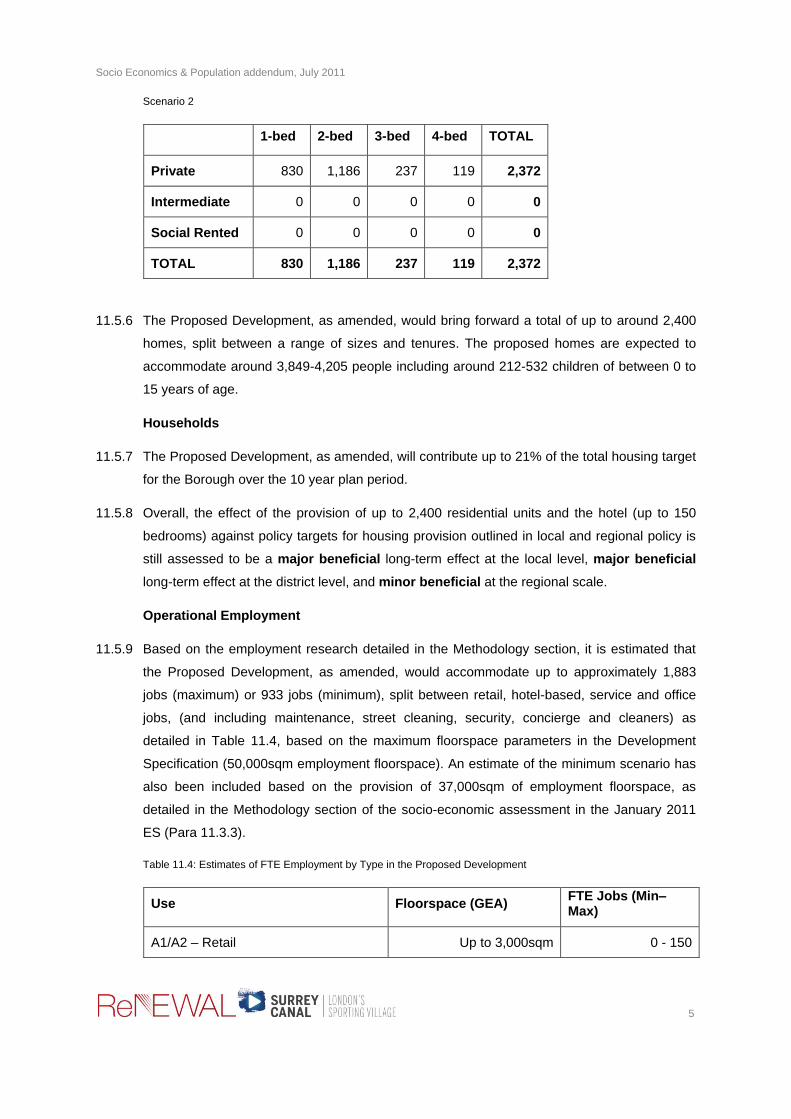
11.5.9 Based on the employment research detailed in the Methodology section, it is estimated that
the Proposed Development, as amended, would accommodate up to approximately 1,883
jobs (maximum) or 933 jobs (minimum), split between retail, hotel-based, service and office
jobs, (and including maintenance, street cleaning, security, concierge and cleaners) as
detailed in Table 11.4, based on the maximum floorspace parameters in the Development
Specification (50,000sqm employment floorspace). An estimate of the minimum scenario has
also been included based on the provision of 37,000sqm of employment floorspace, as
detailed in the Methodology section of the socio-economic assessment in the January 2011
ES (Para 11.3.3).
Table 11.4: Estimates of FTE Employment by Type in the Proposed Development
Use Floorspace (GEA) FTE Jobs (Min–Max)
A1/A2 – Retail Up to 3,000sqm 0 - 150

Socio Economics & Population addendum, July 2011
6
A3/A4 – Café/Restaurant/Drinking Up to 3,000sqm 0 - 231
A5 – Hot Food Takeaways Up to 300sqm 0 - 23
B1 – Office / Creative Industries 10,000-15,000sqm 526 - 789
D1 – Community 400-10,000sqm 11 - 278
D2 – Leisure and Assembly 4,260-15,800sqm 211 - 287
C1 – Hotel / Conferencing Up to 15,000sqm (150
room) 9 - 75
Maintenance, street cleaners, security, concierge and cleaners (domestic)
N/A 110
TOTAL 933 - 1,883
11.5.10 The Proposed Development, as amended, therefore represents an uplift of approximately
506-1,456 potential FTE workspaces across a range of floorspace uses, or a net uplift of 750-
1,700 FTE jobs based on current surveyed employment on-site. The January 2011
assessment estimated an uplift of approximately 506-1,519 potential FTE workspaces across
a range of floorspace uses, or a net uplift of 750-1,763 FTE jobs based on current surveyed
employment on-site. The overall effect of the Proposed Development, as amended, on
employment remains a major beneficial long-term effect at the local level and a moderate
effect at a regional scale.
Household, Tourist and Workforce Spending
11.5.11 The provision of up to 2,400 residential units will bring associated spending by new residents.
It is estimated that the households accommodated by the Proposed Development will
generate spending of approximately £38.2million per annum.
11.5.12 There are forecast to be around 506-1,456 net additional potential FTE workspaces on-site
based on minimum and maximum parameters, or 750-1,700 potential employees based on
minimum and maximum parameters. On the basis of the spending statistic above, that will
result in spending by employees of up to approximately £674,000-£1.9m per year based on
potential net additional FTE workspaces or £999,000-2.3m per year based on potential net
additional employees.
11.5.13 Overall, the spending calculated to be generated by the Proposed Development, once
operational, is in the region of up to around £45million per year based on maximum
parameters.
11.5.14 The assumptions for expenditure associated with visitors to the hotel remains consistent with
those detailed in para 11.6.31 of the January 2011 ES. Assessment of the proposed hotel is

Socio Economics & Population addendum, July 2011
7
based on average London figures for spend, occupancy etc (Paras 11.6.18 and 11.6.31 of the
January 2011) rather than for Lewisham. To clarify, this approach was taken as the London
average includes central as well as outer London hotels, giving a good overall estimate for
average spend. The proposals at Surrey Canal are at an early stage and it is not fixed what
kind of visitors the hotel would attract. At present it is considered the best and most robust
estimate to use.
11.5.16 The Proposed Development, as amended, would generate an estimated overall spend of up
to around £45million per year, compared with an estimate of up to £47million in the January
2011 ES (Para 11.6.34). As such, this is still assessed to be a major beneficial long-term
effect at the local level, moderate beneficial long-term effect at the district level and
negligible at all other levels.
Effect on Education Facilities
11.5.17 The Proposed Development, as amended, is expected to produce a slightly lower number of
children at both primary age (70-205 children) and secondary age (19-105 children). This is
reduced from the assessment in the January 2011 ES (Para 11.6.39 and 11.6.40) of 214-236
primary school children and 110-125 secondary school children. The significance of the effect
of the development on primary school capacity remains minor adverse at the local level and
the effect on secondary school capacity remains negligible at the district level.
11.5.18 Para 11.6.39 of the January 2011 ES identifies a need for significant new school capacity for
both primary and secondary pupils, although the conclusion (in Para 11.6.42) stated that an
additional need for 125 school places (now revised to 19-105) will represent a negligible
effect. To clarify the assessment of negligible significance outlined in Para 11.6.42 of the
January 2011 ES, increased secondary school capacity is needed at the borough-level and
this need is highlighted in published documents1 and through consultation with pupil place
1 LBL (2010) Draft Infrastructure Delivery Plan as of August 2010; LBL (2008) Primary Strategy for
Change 2008-2017

Socio Economics & Population addendum, July 2011
8
managers. This shouldn‟t be confused with the assessment of local increase of secondary-
age children arising from the Proposed Development (125, now revised to 19-105) which will
be negligible in respect to the current existing capacity of schools in the borough. Secondary
school aged children are also expected to travel a far wider distance to school and the
dispersal of these children, assessed at a regional level, will be negligible. The cumulative
assessment section highlights that the combined effect of development in the area will indeed
have a minor adverse impact on secondary school place provision.
Effect on Primary Healthcare Facilities
11.5.19 The Proposed Development, as amended, is expected to produce a slightly lower population
(3,849-4,205 people) compared to the assessment at Para 11.6.16 in the January 2011 ES
(4,430-4,495 people). Health-related uses are included within the Proposed Development,
which potentially include GP surgeries, sports injury treatment and related activities, and
ancillary primary healthcare facilities. As such, the significance of the effect of the Proposed
Development, as amended, on primary healthcare capacity remains minor beneficial at the
local level.
Open Space and Children’s Playspace
11.5.20 The revised Development Specification commits to a total of at least 7,700 sqm and a
maximum of 9,100 sqm of publicly accessible open space in two locations, and between
9,645-13,695 sqm of private communal open space for residents. This is in comparison to a
total of between 5,600-6,600 sqm of publicly accessible open space and 13,000 sqm of
private communal open space in the January 2011 proposals. In addition, play provision for
children over the age of 12 is also to be provided on Site, specifically within the areas of the
publicly accessible open space that adjoin the Stadium. It is to be designed in such a way
that it does not interfere with crowd movement around the Stadium on a match day.
11.5.21 Based on modelling of the child yield based on research by Hunt Dobson Stringer into the
2001 Census data, and CORE lettings data from the National Housing Federation (2009),
around 2,220-5,740 sqm of playable space would need to be provided on-site to provide each
child (aged 0-17) with at least 10sqm. This compares with a requirement of 5,990-6,590 sqm
based on the January 2011 proposals.
11.5.22 The playspace calculations presented in Table 11.5 of the January 2011 ES are based on
the multipliers in the London Plan SPG on Providing for Children and Young People’s Play
and Recreation (2008) i.e. 10sqm per child, using population assessment outlined in the
methodology section of the January 2011 ES (Para 11.3.3). To clarify, the SPG does not
specify the child yield calculation methodology that should be used, although does include an
example methodology. The assessment of population and child yield in the January 2011 ES
has been based on a model that is more robust than the example presented, and therefore is

Socio Economics & Population addendum, July 2011
9
considered to be in-line with the requirements of the SPG. However, were the child yields
published in the SPG used in this assessment, there would be a requirement for 2,241-
6,280sqm of playspace (based on 224-628 children depending on the unit tenure scenario –
Appendix B, GLA SPG on Providing for Children and Young People’s Play and Recreation
(2008) – extrapolated to ages 0-17). Given the provision of playable space in private
courtyard/roofs which Townshends estimated at 5,330sqm, plus provision for ages 12+ at
publicly accessible locations within the Site up to a maximum of 9,100 sqm and at Bridghouse
Meadow, the estimated child yield would still be adequately served by the proposed open
space and playspace within the Proposed Development.
11.5.23 The provision of new, well-designed and equipped, safe and accessible areas for play
remains a moderate beneficial effect at the local scale.
11.5.24 Paras 11.6.48 to 11.6.54 of the January 2011 ES describe the beneficial effects of the
proposed communal open space. To clarify, these paragraphs refer to “publicly accessible
open space” implying that open space is intended for the use of surrounding communities, as
well as occupiers of the proposed housing.
Sports Facilities
11.5.25 Para 11.6.55 of the January 2011 ES outlines the proposals for sports facilities at Surrey
Canal. We can confirm that the specific sports facilities that are definite commitments are
referred to in the Development Specification. The existing Millwall Community Scheme in Plot
Bolina East is to be accommodated in the future within the Proposed Development, within
either of Plots Stockholm 1 or 2. The existing indoor sports pitch within the Community
Scheme is to be re-provided as part of the D2 uses within the Proposed Development.
Waste Management
11.5.26 Section 11.5 of the socio-economic assessment of the January 2011 ES does not mention
the waste management sector, which features in the vicinity of the Site, and which could be
affected by the scheme. The following paragraphs provide an assessment of the potential
effects of the Proposed Development on the waste management sector.
11.5.27 There are a number of waste transfer sites currently situated amongst and beyond railway
embankments which run along the north eastern boundary of the Site (including Welcocks
and RTS waste management). Vehicular access from these waste transfer sites is currently
taken through the Site via Bolina Road. As part of the Thameslink 2000 works, vehicular
access to the Site from the north east is shortly to be extinguished, together with the future of
some of the waste transfer sites. The Welcocks site is currently accessed off of Bolina Road.
Whilst it is acknowledged that the Proposed Development does not aspire to encourage large
waste vehicles travelling along the roads within the development, the closure of part of Bolina
Road, as stated above, is brought about as a result of the consented Thameslink works. The

Socio Economics & Population addendum, July 2011
10
closure of Bolina Road (between the Proposed Bolina North 1 and Bolina North 2 Plots) would
ultimately prevent any vehicular traffic entering the application site at this point.
11.5.28 The details of the Thameslink works indicate that the ongoing function or operation of the
RTS Waste Site will be altered and that no adverse impact can be attributed to the proposed
Surrey Canal Development. It is assessed that the Proposed Development does not directly
affect any of the existing waste management facilities in the local area. However, some waste
management works adjacent to the site will be disrupted by other local developments.
11.5.29 The Air Quality assessment (Chapter 14 of the January 2011 ES) refers to the potential for
significant odour or fugitive dust effects to occur within the Proposed Development, based on
the history of complaints, the location of the processes giving rise to emissions. Complaints
are largely clustered around houses to the north east of the Deptford Recycling Centre,
between Trundley Road and Greenland Mews. These houses are about 100-150 metres from
the Recycling Centre. Chapter 14 of the January 2011 ES highlights that it is not possible to
confirm what mitigation measures might be implemented at the Recycling Centre as
operations are expanded. Given the location of the Proposed Development, the prevailing
wind direction, and the history of complaints, odour effects within the Proposed Development
should be infrequent, but cannot be discounted. This does not directly affect the operation of
the facility, but the need for the recycling centre to mitigate the effects of any future expansion
could potentially increase the cost of such expansion. This situation already exists, given the
complaints from existing residents, so is not a result of this development. The impact on the
operation of the waste sector is therefore considered negligible at the local scale.
Summary of Residual Effects
11.5.30 Table 11.6 in the January 2011 ES did not refer to the geographical level at which the
reported effects apply, and omitted reference to qualitative effects of the Proposed
Development on crime, retail, amenity, health and well-being and equalities. The following
table therefore updates and replaces Table 11.6 (Summary of Residual Impacts):
Table 11.6: Summary of Residual Effects
Effect Details Significance
Construction: Direct
Employment
470 FTE construction jobs, including local
training and jobs brokerage initiatives
Minor Beneficial (District level)
Construction: Amenity and
Disruption
Effects on amenity, disruption to access and
services, and environmental effects
Negligible, following mitigation
Housing and Population Provision of up to 2,371 units in a range of
sizes and tenures
Major Beneficial (Local and
District level); Minor Beneficial
(Regional level)

Socio Economics & Population addendum, July 2011
11
Child Yield / Education Up to 70-205 primary school aged children
and 19-105 secondary school aged children
Primary level – Minor Adverse
(req. Mitigation, potentially
through contributions) (Local
level)
Secondary level – Negligible
Healthcare Up to 3,849-4,205 residents expected to
occupy the new units would imply a need for
the equivalent of around 2-2.5 GPs to
maintain the current level of provision. New
Health Facility proposed.
Minor Beneficial (Local level)
Operational Employment Net increase of up to 1,456 FTE potential
workspaces in a range of positions, including
entry-level jobs
Major Beneficial (Local level);
Moderate Beneficial (Regional
level)
Additional Local Spending £38.2 million annually in additional
household spending and up to around £2.3m
annually in spending by additional workforce
based on maximum parameters.
Major Beneficial (Local level);
Moderate Beneficial (District
level)
Tourism and Hotel Tourist draw and expenditure of up to £4.1
million per year in local area based on
maximum parameters
Major Beneficial (Local level)
Sports, Recreation, Leisure and
Community
Provision of regionally-significant sporting
facilities and community facilities including
for assembly and health uses.
Major Beneficial (Local, District
and Regional level)
Public Open Space and Play
Space
At least 7,700sqm of publicly accessible
open space in two locations, and 9,645-
13,695 sqm of private communal open
space for residents
Moderate Beneficial (Local
level)
Waste Management Disruption of existing works to the north of
the Site;
Odour from Deptford Recycling Centre.
Negligible, as not resulting from
proposed development
Negligible
Crime – Design and Access Additional natural surveillance, active street
environment, Secured by Design elements
Minor Beneficial (Local level)
Crime – Millwall FC Improved public realm Minor Beneficial (Local level)
Health and Well-being Provision of new affordable homes, increase
in the stock of quality accommodation,
opportunities for employment, public open
space and child play space
Minor Beneficial (Local level)

Socio Economics & Population addendum, July 2011
12
Equalities Accessible homes, range of tenures; Range
of employment opportunities; Scheme
design does not promote social exclusion
Minor Beneficial (Local level)
11.6 Opportunities for Further Mitigation
11.6.1 The level of significance of socio-economic effects remains consistent with the January 2011
ES, therefore no additional mitigation measures are required.
11.7 Assessment of Cumulative Effects
11.7.1 The following paragraphs outline the quantifiable socio-economic effects of the Proposed
Development, as amended, against the estimated socio-economic effects of the identified
cumulative schemes listed in Chapter 2 of the January 2011 ES, in order to highlight a
„without scheme‟ scenario at 2026 baseline alongside a „with scheme‟ scenario. The section is
summarised with a table of the estimated effects.
11.7.2 The assessment of residential units in cumulative developments is based on a uniform tenure
split for each of the cumulative developments based on a similar average model to the sizes
and tenures of units at the Proposed Development (maximum development parameters). The
employment generation is based on the methodology outlined above, using ARUP/English
Partnerships Employment Densities: A Full Guide (2001).
Provision of New Homes and Household Expenditure
11.7.3 The residential element of the cumulative development, totals around 10,600 additional
homes in north Lewisham and Southwark. Applying an average estimated household spend
of £310 per week on goods and services, this would create an additional £171.7m per year in
local household expenditure. The Surrey Canal development, based on an assessment of up
to 2,400 homes, would provide an additional £38.7m annual household expenditure. The
cumulative developments, including the Proposed Development at Surrey Canal, would
therefore generate around £210m in annual household expenditure, and this is therefore
considered a major beneficial effect.
Employment and Employee Expenditure
11.7.4 The cumulative developments will also include an element of commercial floorspace, with
office, leisure, hotel and community floorspace, equating to up to an estimated 12,000 FTE
jobs, and therefore generating in the region of £16m in annual employee expenditure on food
and drink. The Proposed Development would add an additional 750-1,763 net additional jobs
based on minimum and maximum floorspace scenarios, generating around £1m-£2.3m in

Socio Economics & Population addendum, July 2011
13
annual employee expenditure on food and drink. In total, the cumulative developments and
Proposed Development at Surrey Canal could generate in the region of 12,700-13,700 jobs
and employee expenditure of £16.9m-£18.2m annually. This is therefore considered a major
beneficial effect.
Population and Child Yield
11.7.5 The cumulative developments would be expected to accommodate around 19,000 people, of
whom around 921 would be primary-school aged children and 474 are forecast to be
secondary-school aged children. In addition, the Proposed Development at Surrey Canal are
forecast to be expected to yield between 3,849-4,205 people, of whom 70-205 are forecast to
be primary school-aged children and 19-105 are forecast to be secondary school-aged
children. The cumulative developments and Proposed Development combined would
therefore be expected to accommodate a population of around 22,745-23,101 people,
including 991-1,126 primary school-aged children and 493-579 secondary school-aged
children.
Effects on Education and Primary Healthcare Provision
11.7.6 The new population in these cumulative developments will increase pressure on local facilities
such as primary healthcare and education. However, the developments will include some
element of education and community provision on-site through the re-developed Tidemill
Primary School and new library at Deptford Lounge and the Leisure Centre within the Giffin
Street Masterplan Area, and the Convoys Wharf development is due to provide an additional
new school.
Education
11.7.7 Based on an assessment of capacity at local education facilities, the increased population
would increase demand for primary and secondary school places in the local area. Given the
scale of cumulative development in the area, it is likely that there will be a need to mitigate the
effect of the Proposed Development as part of the broader investment in north Lewisham‟s
infrastructure.
11.7.8 The proposed cumulative developments would create demand for additional capacity in
primary schools in the local area by generating an estimated 921 primary school-aged
children and 474 secondary school-aged children. This demand has been accounted for in
LBLs forward planning of pupil place capacity and referenced in the Infrastructure Delivery
Plan and the effect is therefore considered to be mitigated. As referred to in the socio-
economic assessment of the Proposed Development, the Proposed Development will also
when built out create demand for school places (70-205 would be primary school-aged
children and 19-105 would be secondary school-aged children). LBL's assessment of
infrastructure delivery recognizes the level of development in the local area, including Surrey

Socio Economics & Population addendum, July 2011
14
Canal, and therefore provides mitigation of future baseline population in respect of primary
school capacity. In the context of an overall cumulative increase of up to 991-1,126 primary
school-aged children and 493-579 secondary school-aged children in nearby Developments,
the Proposed Development would therefore be expected to have a minor adverse effect on
existing education capacity before mitigation.
Healthcare
11.7.9 The cumulative increase in the local population of around 19,000 people estimated from the
cumulative developments would increase demand for local GP surgeries in north Lewisham
and Southwark. At present, the combined Local Authorities have an average list size of
around 1,200 patients per GP (NHS Business Services, 2010). Given that the most frequently
used planning assumptions take an average of 1,800 patients per GP as being considered
acceptable, it is likely that the additional population will create demand for around 10 new
GPs.
11.7.10 The cumulative developments include potential healthcare space at the Proposed
Development and Eileen House, and Convoys Wharf is due to provide a new 4-6 GP Surgery.
Consultation with LB Lewisham has identified that there is currently vacant floorspace with the
capacity to incorporate additional local healthcare services, potentially GPs, at the recently
opened Waldron Health Centre at Stanley Street, next to New Cross Rail Station. In addition,
the New Cross Gate NDC Neighbourhood Centre, including an integrated GP centre and
pharmacy, is a committed development.
11.7.11 In the context of the increased demand for GPs from the Proposed Development at Surrey
Canal (around 2-2.3 GPs) and the intended provision of healthcare facility on site, the effect of
increased population at the Proposed Development and cumulative developments (a
combined requirement for around 12 GPs) is therefore considered negligible due to the
proposed on site provision of health space.
Accessibility and Open Space
11.7.12 The cumulative developments have all been subject to standard planning criteria in terms of
design, accessibility and safety, and will all offer a significant physical improvement to
streetscene and public realm, with a variety of soft and hard landscaped public space suitable
for play and recreation.
Summary Table
Cumulative Developments
Surrey Canal (min)
Surrey Canal (max)
TOTAL (min) TOTAL (max)
Total Population 18,896 3,849 4,205 22,745 23,101
Primary Children 921 70 205 991 1,126
Secondary 474 19 105 493 579

Socio Economics & Population addendum, July 2011
15
Children
Total Homes 10,654 2,400 2,400 13,054 13,054
Total Household Spending
£171,742,480 £38,688,000 £38,688,000 £210,430,480 £210,430,480
Total Jobs 11,959 750 1,763 12,709 13,722
Total Jobs Spending
£15,928,941 £999,000 £2,348,316 £16,927,941 £18,277,257
GPs Demand 10 2 2 13 13

Surrey Canal Triangle Revised Jobs Analysis
June 2011

CONTENTS
1.0 Brief
2.0 Methodology 3.0 Existing Job Ratio Conclusions 4.0 Proposed Job Ratio Conclusions 5.0 Appendices:
I Site Plan II Table of Employment Densities
Arup/English Partnership Report July 2001 III Detailed Analysis of Existing SCT Jobs IV Detailed Analysis of Prospective SCT Jobs V Summary Existing/Proposed SCT Jobs

1.0 Brief The London Borough of Lewisham have requested a detailed report to demonstrate the current level of jobs provided by the existing built form within the Surrey Canal Triangle Site as identified on the plan at Appendix I. We are further requested to provide an estimate of the number of jobs that would be created following completion of construction of the proposed Master plan. The methodology, assumptions made, and the resultant comparisons are set out below.
2.0 Methodology – Existing Jobs The Existing job numbers shown in the attached tables have been calculated against approximate gross internal floor spaces of each building and shown in the 3 formats as set out below: 2.1 Format 1 – Column A in the Table at Appendix III – ARUP/EP Calculations These figures are calculated by reference to the Arup Economic and Planning Employment Densities Report commissioned by English Partnerships dated July 2001 that sets out employment ratios against the Gross Internal Floor space for each building based on their specific use class with region variance applied referenced in the full report against the SERPLAN/Roger Tym Research. See Extracted ‘Table of Employment Densities’ at Appendix I. Where the report does not specify a ratio for a specific use the number of jobs has been assessed based on our detailed knowledge of Surrey Canal Triangle which Renewal manages on behalf of Cragside Ltd. 2.2 Format 2 – Column B in the Table at Appendix III – Actual Job No.s These figures are based on Renewals detailed knowledge of their own estate that they directly manage, with jobs for property outside our ownership taken from the following sources: Millwall Football Club: Millwall Holdings Plc Report and Accounts for year
ended 30 June 2009 Millwall Community Scheme: Charity Commission Data Charity Registration No.1082274 based on the 31st January 2009 Accounts. Vacant properties have been shown at a 0 job level or 1 where security is present on site. All vacant property is currently on the market to let at open market rents and flexible lease terms but remains empty. As such this reflects the lack of demand in certain sectors and sizes of accommodation in the Surrey Canal Area.

2.3 Format 3 – Column C in the Table at Appendix III – Actual with ARUP/EP on vacant units. These figures are calculated as detailed in Format 2 with the exception that we have assumed that there is a market for these properties and if let would generate an estimated number of potential jobs that has been calculated by reference to the Arup Economic and Planning Employment Densities Report commissioned by English Partnerships dated July 2001 reference earlier in this report. See Extracted ‘Table of Employment Densities’ at Appendix III.
2.4 Methodology – Proposed Jobs The Proposed job numbers shown in the attached tables have been calculated against approximate gross internal floor spaces of each building and shown in the 2 formats as set out below: 2.5 Format 1 – Column A in the Table at Appendix IV – Renewal Job Estimations These figures are based on our original assumptions as to prospective job numbers based on the expected mix of occupiers.
2.6 Format 2 – Column B in the Table at Appendix IV – ARUP/EP Calculations These figures are calculated by reference to the Arup Economic and Planning Employment Densities Report commissioned by English Partnerships dated July 2001 that sets out employment ratios against the Gross Internal Floor space for each building based on their specific use class with region variance applied referenced in the full report against the SERPLAN/Roger Tym Research. See Extracted ‘Table of Employment Densities’ at Appendix I. Where the report does not specify a ratio for a specific use the number of jobs has been assessed based on our detailed knowledge of Surrey Canal Triangle which Renewal manages on behalf of Cragside Ltd.
2.7 Uses Where EP Data Does Not Define a Density
The Arup Economic and Planning Employment Densities Report commissioned by English Partnerships dated July 2001 does not include job density ratios for all the uses within the proposed scheme or the existing occupiers. For the purposes of this report we have derived densities for the following uses based on the following:
Crèche/Nursery: The guidance set out in the Early Years Foundation Stage Statutory Framework of May 2008 it sets out the registration space requirements based on childrens ages as follows:

Under two years: 3.5 m2 per child 30% 2-3 year olds: 2.5 m2 per child 40% 3-5 year olds: 2.3 m2 per child. 30%
From our enquiries of local facilities the mix of ages tends to be split in the percentages above which based on an area of 610 sqm (as per the proposed area shown in Appendix IV) equates to the staffing level set out in the table below:
Church: We have estimated the job ration at 1:100 based on the use being of a slightly lower density that would be needed for a Cinema or Sports Centre which are both stated as 1:90 in the EP data. We have also consulted with a number of large churches have advised us that expect staffing numbers for the size of facility proposed would be in the region of 100.
Medical Use: In arriving at a density for the D1 medical use within the scheme we based the density on a 7 GP surgery which would require staffing of 15 allowing for support nursing and practice management staff within a 1000 sqm facility. This equates to a ratio of 1:66 and we have applied this across the overall area. The exact use is still to be defined as consultation with the various NHS Trusts and PCTs progress.
Construction: Based on a £650m construction (240,000 sqm at £2700 per sqm average)cost for the entire scheme construction job ratios have been calculated based on 1 job per £92,500 of construction costs (Revision to GLA Economics – Laying Foundations February 2006). This equates to 7027 person years of employment and with and accepted industry standard, 10 years equates to 1 full time permanent job. This provides an estimated number of full time equivalent jobs of 702.7.
TOTAL NO
146 Sqm/Child No. Of
Children Sqm Staff per
child Staff
Needed
30% 3.5 43.8 153.3 0.3 13
40% 2.5 58.4 146 0.25 15
30% 2.3 43.8 100.74 0.08 3
400.04
31

2.8 Built Areas
For the purposes of this report the areas of existing building have been calculated using Gross Internal Areas (GIA) from the following sources:
o From our own measurements of our existing estate. o From the Valuation Office Agency’s Online 2010 Rating Valuation Data
3.0 Existing Use Job Ratio Conclusions. The three calculative formats derive the following ratios of job to gross internal area of the buildings currently on Surrey Canal Triangle:
EP NO.s 67 SQMS PER JOB
ACTUAL 110 SQMS PER JOB
ACTUAL WITH EP ON VACANT 82 SQMS PER JOB
A detailed breakdown of the data used is attached at Appendix III. 4.0 Proposed Use Job Ratio Conclusions. Based on the proposed development of Surrey Canal Triangle the non-residential areas derive the following job to gross internal area ratios.
EP NO.s 23.97 SQMS PER JOB
RENEWALS ESTIMATED NUMBERS 21.35 SQMS PER JOB
EP NO.s (EXCLUDING CONSTRUCTION FTE) 37.84 SQMS PER JOB
RENEWALS ESTIMATED NUMBERS (EXCLUDING CONSTRUCTION FTE) 31.70 SQMS PER JOB
A detailed breakdown of the data used is attached at Appendix IV.

APPENDIX I
Site Plan


APPENDIX II
Extracted Table of Employment Densities Arup/English Partnership Report July 2001


APPENDIX III
Detailed Analysis of Existing SCT Jobs

GIA GIA ACTUAL ACTUAL + EP EP EP EP RATIO APPLIEDUNIT ESTATE TENANT USE SQFT SQM JOBS VACANT JOBS JOBS/SQM JOBS/SQM JOBSUnit 1 Enterprise Alan Richardson Den Investments Ltd B1 1,240 10.764 115 2 2 58 34 3.4Unit 4 Enterprise Viet Minh Duong VD Motors B1 1,153 10.764 107 2 2 54 34 3.2Unit 4a Enterprise Joe Charlton Sherwood Services Ltd B1 1,075 10.764 100 1 1 100 34 2.9Unit 5 Enterprise Gary Anderson Kirk Mobile Autos B1 1,075 10.764 100 2 2 50 34 2.9Unit 6 Enterprise Anne Robinson GPS (Testing) Ltd B1 1,250 10.764 116 2 2 58 34 3.4Unit 7 Enterprise Oztok Oztok Motors B1 1,248 10.764 116 2 2 58 34 3.4Unit 8 Enterprise Tuan Huynh Lee Motors Ltd B1 1,250 10.764 116 3 3 39 34 3.4Unit 9 Enterprise Omotilewa Toyin Adediwura Quality Auto Services B1 1,059 10.764 98 2 2 49 34 2.9Unit 11 Enterprise Adam Lees Figaro Imports Ltd B2 1,059 10.764 98 1 1 98 34 2.9Unit 12 Enterprise Len GPS (Testing) Ltd B1 1,059 10.764 98 1 1 98 34 2.9Unit 13 Enterprise Vacant ‐ Fire Damaged Vacant B1 1,059 10.764 98 0 3 34 34 2.9Unit 14 Enterprise Vacant ‐ Fire Damaged Vacant B1 1,059 10.764 98 0 3 34 34 2.9Unit 15 Enterprise Kenneth Schreiber Kentray (London) Ltd B1 1,221 10.764 113 1 1 113 34 3.3Unit 16 Enterprise Kenneth Schreiber Kentray (London) Ltd B1 1,221 10.764 113 1 1 113 34 3.3Unit 17 Enterprise Anne Robinson GPS (Testing) Ltd B1 1,221 10.764 113 2 2 57 34 3.3Unit 18 Enterprise Anne Robinson GPS (Testing) Ltd B1 1,221 10.764 113 2 2 57 34 3.3Unit 19 Enterprise Anne Robinson GPS (Testing) Ltd B1 998 10.764 93 1 1 93 34 2.7Unit 20 Enterprise Anne Robinson GPS (Testing) Ltd B1 974 10.764 90 1 1 90 34 2.7Unit 21 Enterprise Abdelouahab Belal CP Autos B1 908 10.764 84 2 2 42 34 2.5Unit 22 Enterprise Abdelouahab Belal CP Autos B1 1,079 10.764 100 1 1 100 34 2.9Unit 23 Enterprise Anne Robinson GPS (Testing) Ltd B1 1,124 10.764 104 1 1 104 34 3.1Unit 24 Enterprise Anne Robinson GPS (Testing) Ltd B1 1,124 10.764 104 1 1 104 34 3.1Unit 25&26 Enterprise Michael Healy MH Coachworks B2 2,250 10.764 209 4 4 52 34 6.1Unit 31 Enterprise T Huynh Millwall Motors Ltd B1 832 10.764 77 2 2 39 34 2.3Unit 32 Enterprise T Huynh Millwall Motors Ltd B2 615 10.764 57 1 1 57 34 1.7Unit 35 Enterprise Sylvanas Sylvanas Wood Craft Ltd B1 1,250 10.764 116 2 2 58 34 3.4 ACTUAL JOBS EP JOBUnit 36 Enterprise Hong Wan B1 1,250 10.764 116 1 1 116 34 3.4 GIA SQM JOBS RATIO NO NOUnit 39 Enterprise Helen Chines Food Productions B1 1,153 10.764 107 4 4 27 34 3.2 2975 51 59 45 87.51Unit 10 Enterprise Alan Richardson Den Investments Ltd B8 1,059 10.764 98 0 0 0 50 2.0Unit 29 Enterprise Paper Paper Distributon B8 904 10.764 84 1 1 84 50 1.7Unit 30a Enterprise Paper Paper Distributon B8 904 10.764 84 1 1 84 50 1.7Unit 30a Enterprise Paper Paper Distributon B8 896 10.764 83 1 1 83 50 1.7Unit 33 Enterprise Tim Jones Overseas Courier Services Ltd B8 1,250 10.764 116 3 3 39 50 2.3Unit 34 Enterprise Tim Jones Overseas Courier Services Ltd B8 1,250 10.764 116 3 3 39 50 2.3Unit 37 Enterprise Michael Corby CPR Parts B8 1,250 10.764 116 3 3 39 50 2.3Unit 38 Enterprise Hong Wan B8 1,250 10.764 116 0 0 0 50 2.3 EP JOBUnit 40 Enterprise Michael Corby CPR Parts B8 1,153 10.764 107 1 1 107 50 2.1 GIA SQM JOBS RATIO NOUnit 41 Enterprise Abdula Hassan My Butchers Ltd B8 904 10.764 84 0 0 0 50 1.7 1005 13 77 20.10Unit 2 Enterprise Alan Richardson Den Investments Ltd Cafe 830 10.764 77 3 3 26 13 5.9 EP JOBUnit 3 Enterprise Alan Richardson Den Investments Ltd Cafe 772 10.764 72 4 4 18 13 5.5 GIA SQM JOBS RATIO NOUnit 27 Enterprise Abraham Osibana Celestial God's Glory Church Community 1,124 10.764 104 2 2 52 100 1.0 149 7 21 11.45Unit 42 Enterprise Church Church Community 904 10.764 84 2 2 42 100 0.8 EP JOB
69 75 121 GIA SQM JOBS RATIO NO188 4 47 1.88
B1 TOTALS
B8 TOTALS
FOOD RETAIL TOTALS
EXISTING JOBS ON SURREY CANAL TRIANGLE ‐ SOURCE ONSITE POLE AND EP EQUIVALENT ON VACANT
COMMUNITY TOTALS
NUMBERS TRANSFERRED TO SUMMARY APPENDIX V
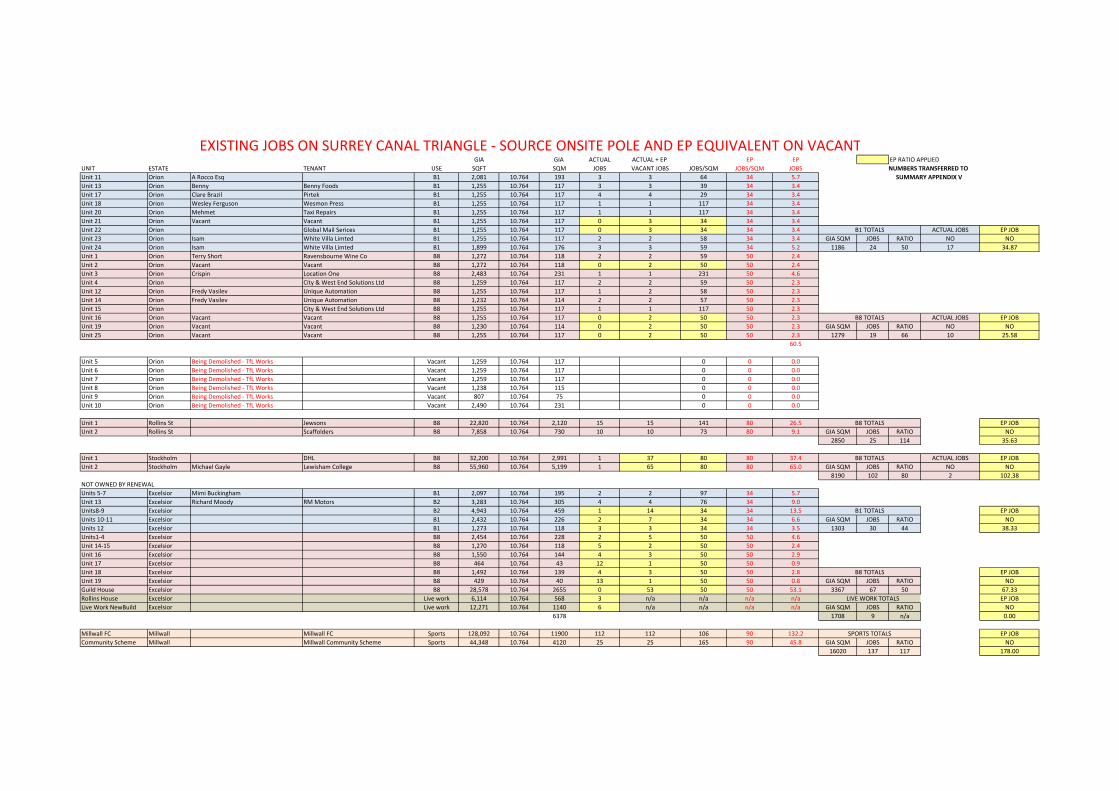
GIA GIA ACTUAL ACTUAL + EP EP EP EP RATIO APPLIEDUNIT ESTATE TENANT USE SQFT SQM JOBS VACANT JOBS JOBS/SQM JOBS/SQM JOBSUnit 11 Orion A Rocco Esq B1 2,081 10.764 193 3 3 64 34 5.7Unit 13 Orion Benny Benny Foods B1 1,255 10.764 117 3 3 39 34 3.4Unit 17 Orion Clare Brazil Pirtek B1 1,255 10.764 117 4 4 29 34 3.4Unit 18 Orion Wesley Ferguson Wesmon Press B1 1,255 10.764 117 1 1 117 34 3.4Unit 20 Orion Mehmet Taxi Repairs B1 1,255 10.764 117 1 1 117 34 3.4Unit 21 Orion Vacant Vacant B1 1,255 10.764 117 0 3 34 34 3.4Unit 22 Orion Global Mail Serices B1 1,255 10.764 117 0 3 34 34 3.4 ACTUAL JOBS EP JOBUnit 23 Orion Isam White Villa Limted B1 1,255 10.764 117 2 2 58 34 3.4 GIA SQM JOBS RATIO NO NOUnit 24 Orion Isam White Villa Limted B1 1,899 10.764 176 3 3 59 34 5.2 1186 24 50 17 34.87Unit 1 Orion Terry Short Ravensbourne Wine Co B8 1,272 10.764 118 2 2 59 50 2.4Unit 2 Orion Vacant Vacant B8 1,272 10.764 118 0 2 50 50 2.4Unit 3 Orion Crispin Location One B8 2,483 10.764 231 1 1 231 50 4.6Unit 4 Orion City & West End Solutions Ltd B8 1,259 10.764 117 2 2 59 50 2.3Unit 12 Orion Fredy Vasilev Unique Automation B8 1,255 10.764 117 1 2 58 50 2.3Unit 14 Orion Fredy Vasilev Unique Automation B8 1,232 10.764 114 2 2 57 50 2.3Unit 15 Orion City & West End Solutions Ltd B8 1,255 10.764 117 1 1 117 50 2.3Unit 16 Orion Vacant Vacant B8 1,255 10.764 117 0 2 50 50 2.3 ACTUAL JOBS EP JOBUnit 19 Orion Vacant Vacant B8 1,230 10.764 114 0 2 50 50 2.3 GIA SQM JOBS RATIO NO NOUnit 25 Orion Vacant Vacant B8 1,255 10.764 117 0 2 50 50 2.3 1279 19 66 10 25.58
60.5
Unit 5 Orion Being Demolished ‐ TfL Works Vacant 1,259 10.764 117 0 0 0.0Unit 6 Orion Being Demolished ‐ TfL Works Vacant 1,259 10.764 117 0 0 0.0Unit 7 Orion Being Demolished ‐ TfL Works Vacant 1,259 10.764 117 0 0 0.0Unit 8 Orion Being Demolished ‐ TfL Works Vacant 1,238 10.764 115 0 0 0.0Unit 9 Orion Being Demolished ‐ TfL Works Vacant 807 10.764 75 0 0 0.0Unit 10 Orion Being Demolished ‐ TfL Works Vacant 2,490 10.764 231 0 0 0.0
Unit 1 Rollins St Jewsons B8 22,820 10.764 2,120 15 15 141 80 26.5 EP JOBUnit 2 Rollins St Scaffolders B8 7,858 10.764 730 10 10 73 80 9.1 GIA SQM JOBS RATIO NO
2850 25 114 35.63
Unit 1 Stockholm DHL B8 32,200 10.764 2,991 1 37 80 80 37.4 ACTUAL JOBS EP JOBUnit 2 Stockholm Michael Gayle Lewisham College B8 55,960 10.764 5,199 1 65 80 80 65.0 GIA SQM JOBS RATIO NO NO
8190 102 80 2 102.38NOT OWNED BY RENEWALUnits 5‐7 Excelsior Mimi Buckingham B1 2,097 10.764 195 2 2 97 34 5.7Unit 13 Excelsior Richard Moody RM Motors B2 3,283 10.764 305 4 4 76 34 9.0Units8‐9 Excelsior B2 4,943 10.764 459 1 14 34 34 13.5 EP JOBUnits 10‐11 Excelsior B1 2,432 10.764 226 2 7 34 34 6.6 GIA SQM JOBS RATIO NOUnits 12 Excelsior B1 1,273 10.764 118 3 3 34 34 3.5 1303 30 44 38.33Units1‐4 Excelsior B8 2,454 10.764 228 2 5 50 50 4.6Unit 14‐15 Excelsior B8 1,270 10.764 118 5 2 50 50 2.4Unit 16 Excelsior B8 1,550 10.764 144 4 3 50 50 2.9Unit 17 Excelsior B8 464 10.764 43 12 1 50 50 0.9Unit 18 Excelsior B8 1,492 10.764 139 4 3 50 50 2.8 EP JOBUnit 19 Excelsior B8 429 10.764 40 13 1 50 50 0.8 GIA SQM JOBS RATIO NOGuild House Excelsior B8 28,578 10.764 2655 0 53 50 50 53.1 3367 67 50 67.33Rollins House Excelsior Live work 6,114 10.764 568 3 n/a n/a n/a n/a LIVE WORK TOTALS EP JOBLive Work NewBuild Excelsior Live work 12,271 10.764 1140 6 n/a n/a n/a n/a GIA SQM JOBS RATIO NO
6378 1708 9 n/a 0.00
Millwall FC Millwall Millwall FC Sports 128,092 10.764 11900 112 112 106 90 132.2 EP JOBCommunity Scheme Millwall Millwall Community Scheme Sports 44,348 10.764 4120 25 25 165 90 45.8 GIA SQM JOBS RATIO NO
16020 137 117 178.00
B8 TOTALS
SPORTS TOTALS
B8 TOTALS
B8 TOTALS
B8 TOTALS
NUMBERS TRANSFERRED TO SUMMARY APPENDIX V
B1 TOTALS
B1 TOTALS
EXISTING JOBS ON SURREY CANAL TRIANGLE ‐ SOURCE ONSITE POLE AND EP EQUIVALENT ON VACANT

APPENDIX IV
Detailed Analysis of Prospective SCT Jobs

B A
GIA GIAClass Use m2 Jobs Opening hours m2 EP Ratio Jobs
A1 SHOPS Mid ‐ Size Supermarket 800 20 8 am ‐ 10 pm Mid ‐ Size Supermarket 800 19 42Chemist 100 5 9 am ‐ 6 pm Chemist 100 20 5
Newsagents 100 8 6 am ‐ 7 pm Newsagents 100 20 5Off Licence 100 5 11 am ‐ 10.30 pm Off Licence 100 20 5Dry Cleaners 63 4 8 am ‐ 6 pm Dry Cleaners 63 20 3
Shoe repair/key cutting 50 2 8 am ‐ 6 pm Shoe repair/key cutting 50 20 3Hair Salon 100 12 9.30 am ‐ 10 pm Hair Salon 100 20 5Florist 100 4 8am ‐ 5 pm Florist 100 20 5
Sports Shop 200 10 9 am ‐ 6 pm Sports Shop 200 20 10Delicatessen 100 5 8 am ‐ 6 pm Delicatessen 100 20 5
Specialist Retail 400 20 9 am ‐ 6 pm Specialist Retail 400 20 20total 2113 95 total 2113 108
0A2 FINANCIAL Estate Management Company 318 10 8 AM ‐ 8 PM Estate Management Company 318 19 17
& PROFESSIONAL SERVICES Maintenance ‐ Landscaping 25 Maintenance ‐ Landscaping 25Street Cleaning 5 Street Cleaning 5
Security 30 Security 30Concierge 20 Concierge 20
Cleaners ‐ Domestic 30 Cleaners ‐ Domestic 30Estate Agent 150 8 9AM ‐ 6.30PM Estate Agent 150 19 8
0total 468 128 total 468 135
0A3/A4/A5 FOOD AND DRINK Sports Cafe 400 25 10 AM ‐ 11 PM Sports Cafe 400 13 31
Wine Bar/Pub x2 450 30 11 AM ‐ 11 PM Wine Bar/Pub x2 450 13 35Coffee Shop x 2 200 10 7 AM ‐ 7 PM Coffee Shop x 2 200 13 15
Brasserie 300 20 8 AM ‐ 12 PM Brasserie 300 13 23Restaurants x2 800 30 11 AM ‐ 12 PM Restaurants x2 800 13 62
Take‐away hot food x2 300 20 5 PM ‐ 11 PM Take‐away hot food x2 300 13 23Sandwich Bar 90 6 7 AM ‐ 3 PM Sandwich Bar 90 13 7Millwall Café 200 10 Millwall Café 200 13 15
total 2740 151 total 2740 211
SURREY CANAL TRIANGLE ‐ NEW JOB ANALYSIS ‐ SOURCE EP DENSITIES TABLERENEWAL GROUP JOB ESTIMATES ENGLISH PARTNERSHIP/ ARUP RATIO COMPARISON

B1 BUSINESS Creative Business Incubation Units 5,664 280 7 AM ‐ 7 PM Creative Business Incubation Units 5664 32 177Managed/Serviced Office Space 2,311 155 8 AM ‐ 6.30 PM Managed/Serviced Office Space 2311 20 116
Small Office Units 1,732 100 Small Office Units 1732 19 91
Total 9,707 535 Total 9707 384
C1 HOTELS & CONFERENCING Hotel 7633 100 8 AM ‐ 10 PM Hotel 7633 90 8524HRS
Total 7,633 100 Total 7633 85
D1 NON RESIDENTIAL Medical 3,663 50 Medical 3663 66 56INSTITUTIONS Nursery/Crèche 400 31 Nursery/Crèche 400 30 13
Church 5,027 100 Church 5027 100 50
Total 9,090 181 Total 9090 196 119
D2 ASSEMBLY AND LEISURE Millwall FC 112 9 AM ‐ 5 PM Millwall FC 112Lions Community Centre 20 7 AM ‐ 11 PM Lions Community Centre 20Indoor Cricket School 15 7 AM ‐ 11 PM Indoor Cricket School 15Basketball/Netball 15 7 AM ‐ 11 PM Basketball/Netball 15Leisure Club & Spa 30 7 AM ‐ 11 PM Leisure Club & Spa 30
Table Tennis/Gymnastics 10 7 AM ‐ 11 PM Table Tennis/Gymnastics 10Boxing & Weightlifting 10 9 AM ‐ 11 PM Boxing & Weightlifting 10
Climbing Wall 3 9 AM ‐ 11 PM Climbing Wall 3*these job's include coaching *these job's include coaching
& administrative staff & administrative staff
Total 13,700 215 Total 13,700 90 152
SUI GENERIS Laundrette 100 4 8 AM ‐ 10 PM Laundrette 100 20 5Minicab Office 50 30 24HRS Minicab Office 50 20 3
Urban Garden Centre 200 6 9.30 ‐ 8 PM Urban Garden Centre 200 20 10
Total 350 40 Total 350 18
RENEWAL TOTALS ‐ PERMENANT JOBS 1,445 EP TOTALS ‐ PERMENANT JOBS 1,211
5‐10 Year Construction jobs 700 5‐10 Year Construction jobs 700
FULL TIME EQUIVALENT JOBS 700 FULL TIME EQUIVALENT JOBS 700
RENEWAL TOTALS ‐ PERMENANT & F/T EQUIVALENT 45,801 2,145 EP TOTALS ‐ PERMENANT & F/T EQUIVALENT 45,801 1,911
13700 13700

APPENDIX IV
Summary Existing/Proposed SCT Jobs

A B C
PLOT REFERENCE GIA SQM USESENGLISH PARTNERSHIP JOB
RATIO PER SQM *ENGLISH PARTNERSHIP JOB NO.s ACTUAL JOB NO.S **
ACTUAL JOB NO.S WITH EP RATES APPLIED TO VACANT BUIDLINGS **
Bolina Road 2975 B1/B2 34 88 45 51
Bolina Road 188 Community Use 100 2 4 4
Bolina Road 1005 B8 50 20 13 13
Bolina Road 149 A3 13 11 7 7
Millwall FC 11900 Sport 90 132 112 112
Community Scheme 4120 Sport 90 46 25 25
Stockholm Road (Unoccupied) 8190 B8 80 102 2 102
Orion 1186 B1/B2 34 35 17 24
Orion 1279 B8 50 26 10 19
Rollins Street 2850 B8 80 36 25 25
Excelsior Works 1303 B1/B2 34 38 30 30
Excelsior Works 3367 B8 50 67 67 67
Excelsior Works 1708 Live Work 0 0 9 9
PLOT REFERENCE GIA SQM ENGLISH PARTNERSHIP JOB NO.s ACTUAL JOB NO.SACTUAL JOB NO.S WITH EP RATES APPLIED TO
VACANT BUIDLINGS **
OVERALL 40221 603 366 488
67 SQMS PER JOB
110 SQMS PER JOB
82 SQMS PER JOB
EXISTING JOBS ANALYSIS ‐ SURREY CANAL TRIANGLE ‐ SUMMARY ANALYSIS
EP NO.s
ACTUAL
ACTUAL WITH EP ON VACANT

PLOT REFERENCE GIA SQM USESENGLISH PARTNERSHIP JOB
NO.sRENEWAL ESTIMATED JOB NO.S
SCT 10,025 B1/Business Incubation 400 545
13,700 Sports/Leisure 152 215
4,063 Medical/Creche 69 81
2613 Retail A1/A2 133 143
2740 Retail A3/A4/A5 211 151
7,633 Hotel/Conference 85 100
5,027 Church/Auditorium 50 100
Site Mangement 110 110
5‐7 Yr Construction 700 700
PLOT REFERENCE AREA SQM JOB NO.S JOB NO.S
OVERALL 45801 1911 2145
23.97 SQMS PER JOB
21.35 SQMS PER JOB
37.84 SQMS PER JOB
31.70 SQMS PER JOB
EP NO.s (EXCLUDING CONSTRUCTION FTE)
RENEWALS ESTIMATED NUMBERS (EXCLUDING CONSTRUCTION FTE)
EP NO.s
RENEWALS ESTIMATED NUMBERS
PROPOSED JOBS ANALYSIS ‐ SURREY CANAL TRIANGLE ‐ SUMMARY ANALYSIS

Transport & Movement addendum, July 2011
1
12. Transport & Movement addendum, July 2011
12.1 Introduction
12.1.1. Chapter 12 of the Environmental Statement (January 2011) describes the likely
significant effects of the Proposed Development with respect to Transport and
Movement during both the construction and operational phases. The Chapter is
supported by the Transport Assessment in Technical Appendix 12.1.
12.1.2. There have been a series of post application discussions from February to June 2011
with the London Borough of Lewisham (LBL), Transport for London (TfL) and the
London Borough of Southwark (LBS) relating to the Transport Assessment. This
Chapter should be read in conjunction with the Transport Assessment Addendum
(Technical Appendix 12.1A) document which provides further details of the transport
strategy, further detailed areas of clarification and further assessment of the
Proposed Development, reflecting the points raised by TfL, LBL and LBS in their
consultation responses on the Planning Application.
12.1.3. In addition to TfL, LBL and LBS there have also been transport related issues raised
by Millwall Football Club (MFC) relating to the level of car parking available to the
Football Club on a match day and non match day, the provision of coach parking and
movement to and from the Stadium. These matters are again detailed in the TA
Addendum (Technical Appendix 12.1A).
12.1.4. Since the submission of the ES in January 2011, there have also been a number of
changes to the Proposed Development as set out in Chapter 2 of this ES Addendum.
The changes to the Parameter Plans and the Development Specification include the
following items of relevance to this transport and movement Chapter:
A reduction in the maximum parameter of A1/A2 retail of 600 sq m;
A reduction in the maximum parameter of A3/A4 cafes/restaurants and drinking
establishments of 500 sq m.
A reduction in the maximum parameter of C1 hotels of 5,000 sq m;
A reduction in the maximum parameter of C3 residential of 20,000 sq m (100
units);
An increase in the minimum parameter of D2 leisure and assembly of 140 sq m to
provide for a replacement of the ground person’s store to the north of the
Stadium.

Transport & Movement addendum, July 2011
2
Extension of the red line of the Planning Application south of Surrey Canal Road
by 0.23 ha, by discretionary agreement with LBL, in order to facilitate the
permission of a proposed access road to the east of the Excelsior plots;
Alterations to the access arrangements to Plots Senegal 1 and 2 to provide two
alternatives;
The drawing back of Plot Bolina East from the Stadium and from the northern
boundary and the incorporation of coach parking, to meet operational concerns
raised by Millwall FC, and a new policy requirement to allow for the future
expansion of the Stadium;
The drawing back of the Plot Stadium Avenue away from the Stadium to allow
space for police and Sky TV operations, to meet other operational concerns
raised by Millwall FC, and new policy requirements to allow for the future
expansion of the Stadium;
The cutting away of part of the lower floors of Senegal 2 and the reshaping of the
Plot to allow for improved crowd movement to meet operational concerns raised
by Millwall FC, and new policy requirements to allow for the future expansion of
the Stadium;
The omission of Plots Stadium 1 and 2;
A reduction in car parking numbers from 1,146 to 1,103 (-43)
Amended proposed highways, parking and servicing parameters;
Amended landscape and open space parameters.
12.2 Policy Context
12.2.1. There have been no material changes to the policy context reported in the January
2011 ES Chapter 12. LBL’s Core Strategy was adopted by LBL on 29th June 2011.
The relevant policies within that document were referred to in the January 2011 ES
Chapter 12.
12.3 Methodology Assessment Criteria
12.3.1. There have been no changes to the methodology assessment criteria reported in the
January 2011 ES Chapter 12. The criteria of Driver Delay and Crowding on
Passenger Transport have been provided with an assessment in this addendum.

Transport & Movement addendum, July 2011
3
12.4 Aspects of the Proposed Development of Relevance to
Assessment
Level of Development / Traffic Generation
12.4.1. The January 2011 ES assessment was undertaken on the basis of a first principles
approach to trip generation. This was based on an assumed worst case of
development in terms of the level of trip generation in the peak hours. As a result of
recent changes to the Proposed Development, the footprint of the plots at Bolina
East, Senegal 2 and Stadium Avenue will be reduced in size and the Stadium 1 and
Stadium 2 plots are removed. On this basis the floor space of development proposed
will be reduced by approximately 5%. The January 2011 ES assessment was based
on a robust or worst case in terms of trip generation using the minimum and
maximum allowed parameters that are being applied for. The changes to the
Proposed Development will result in a lower level of floorspace than assessed
previously. This in turn will mean that the trip generation used in the assessments will
be greater still than the actual trip generation of the Proposed Development, as
amended.
12.5 Baseline Situation
12.5.1. There have been no changes to the baseline situation reported in the January 2011
ES Chapter 12.
12.6 Identification and Assessment of Effects
12.6.1. The assessment in the Environmental Statement (January 2011) and the description
of the likely significant effects during both the construction and operational phases
relating to severance, pedestrian delay and amenity, fear and intimidation, accidents
and road safety, and dust and dirt remain unchanged. There are three criteria relating
to Transport and Movement where this addendum provides further assessment.
Firstly, it provides an assessment of the implications of driver delay taking account of
the further assessment and mitigation schemes being provided. Secondly, it provides
an assessment of crowding on public transport services, which has only been
possible upon both finalising the bus services to serve the Site as well as being
provided by rail patronage forecast data and bus patronage information from TfL.
Thirdly there is a revised assessment of the transport effects of construction.
12.6.2. In addition to the above assessment there is also a further consideration of the
assessment of effects on transport for new residents, or people using, working at or
passing through and around the Proposed Development on Millwall FC match days /
event days.

Transport & Movement addendum, July 2011
4
Driver Delay
12.6.3. As part of the post January 2011 discussions with TfL, an assessment of an
additional junction to the west of the Proposed Development has been undertaken.
This is in addition to the study area described in paragraph 12.3.41 of the January
2011 ES Chapter 12. The additional junction is that of the Old Kent Road (A2) and St
James Road. The table below demonstrates the forecast level of effect that the
Proposed Development would have upon the junction.
Table 12-1A: Level of traffic increase at the junction of St James Road and Old Kent Road
AM PM Sat
Flow Effect Flow Effect Flow Effect
Baseline 3377 3741 3495
Dev Flow 199 6% 237 6% 252 7%
12.6.4. The table above identifies that there would be an effect of 6% in the weekday AM and
PM peak hours and 7% on a Saturday peak on this junction. In light of this, further
detailed assessment of the junction has been undertaken in liaison with and using
traffic flow and signal timing information supplied by TfL. The results of this
assessment are reported in the Transport Assessment Addendum (Technical
Appendix 12.1A). TfL requested that this junction be assessed in terms of a ‘best
case’ assessment adding the Surrey Canal development traffic to the existing
baseline traffic flows as well as a ‘worst case’ where development flows associated
with other local developments are added to the junction as well. The results of this
further assessment are reported in the Transport Assessment Addendum (Technical
Appendix 12.1A) in detail and a summary of the findings is reported below.
12.6.5. The junction of Surrey Canal Road and Ilderton Road has also been the subject of
continuing discussion between Renewal, TfL, LBS and LBL. A revised scheme has
been developed to implement a widening of the western end of Surrey Canal Road to
provide a flared approach to the junction. This will provide capacity improvement and
reduce the delays to vehicles using this junction. Further assessment of the improved
junction has been undertaken and is reported in detail in the Transport Assessment
Addendum (Technical Appendix 12.1A) as well as below.
12.6.6. In addition to the above changes there has also been some further detailed changes
and additional information provided to TfL and LBL relating to junction assessments.
This is reported in the Transport Assessment Addendum (Technical Appendix 12.1A).
12.6.7. The assessment of driver delay / junction capacity is set out in detail in the Transport
Assessment Addendum and is summarized in the Table 12-2A.

Transport & Movement addendum, July 2011
5
Table 12-2A: Summary of Junction Assessments
Junction Summary of detailed junction assessment / mitigation identified
Effect on driver delay
Ilderton Road / Old
Kent Road
‘Best’ case assessment without other committed
development is within capacity in AM and PM
weekday and Saturday assessments
Minor, adverse effect
Rollins Street /
Ilderton Road
Junction operates within capacity Neutral
Surrey Canal Road
/ Ilderton Road
Junction operates over capacity in base situation.
Combination of junction improvement and
improvements to accessibility of the wider area
achieves a nil detriment solution
Without mitigation
Moderate Adverse
effect
With Mitigation neutral
Surrey Canal Road
/ pedestrian
crossing
Operates within capacity but adds an additional set
of traffic lights to traffic
Minor, adverse effect
Ilderton Road /
Stockholm Road
Junction operates within capacity Neutral
Ilderton Road /
Zampa Road /
Verney Road
Junction operates within capacity Neutral
Ilderton Road /
Rotherhithe New
Road
Amendment to the staging of the junction identified
(no physical amendment). Junction operates within
capacity with this change
Without mitigation Minor
Adverse effect
With mitigation Neutral
Lower Road
Gyratory
Operates within capacity Neutral
St James Road /
Old Kent Road
‘Best’ case assessment is within capacity in AM
and PM weekday and Saturday assessments.
Minor, adverse effect
Overall efffect on Driver Delay (Surrey Canal only) Minor, adverse effect
12.6.8. Further details relating to the above capacity assessments are included in the
Transport Assessment Addendum report (Technical Appendix 12.1A).
12.6.9. The Proposed Development has reduced in floorspace. This in turn results in a low
level of traffic effect to that summarised above. The above assessment therefore
represents a conservative worst case.
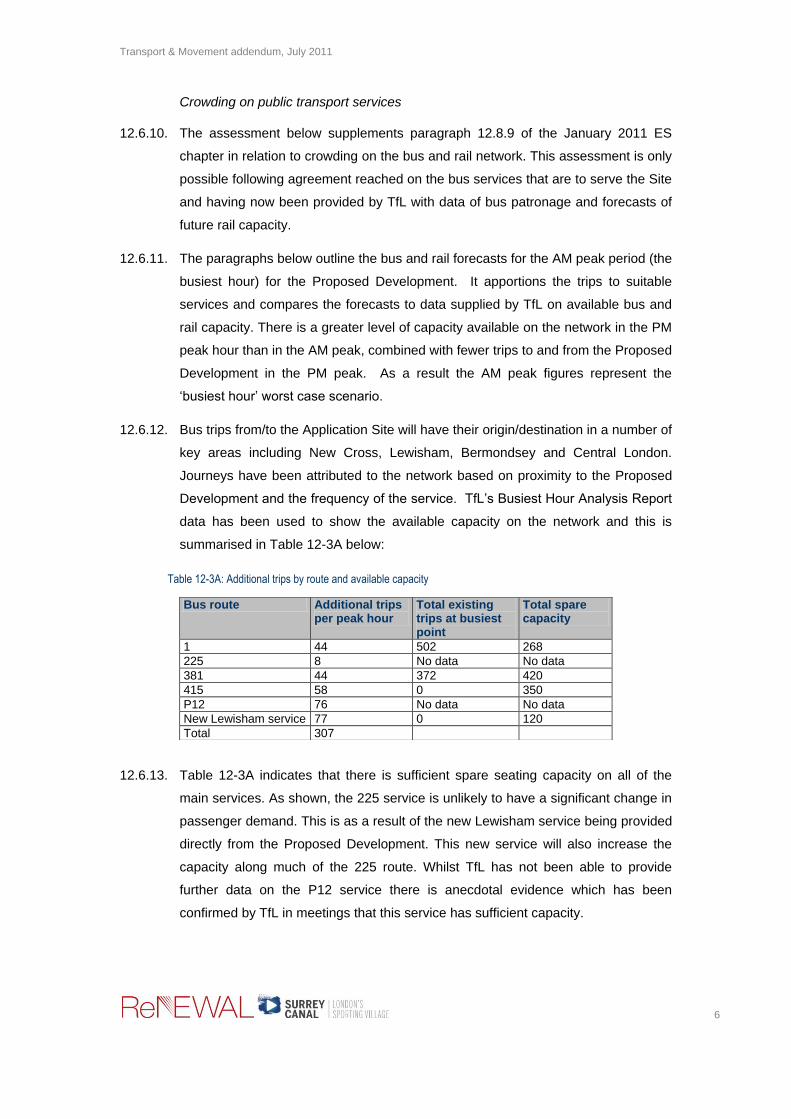
Transport & Movement addendum, July 2011
6
Crowding on public transport services
12.6.10. The assessment below supplements paragraph 12.8.9 of the January 2011 ES
chapter in relation to crowding on the bus and rail network. This assessment is only
possible following agreement reached on the bus services that are to serve the Site
and having now been provided by TfL with data of bus patronage and forecasts of
future rail capacity.
12.6.11. The paragraphs below outline the bus and rail forecasts for the AM peak period (the
busiest hour) for the Proposed Development. It apportions the trips to suitable
services and compares the forecasts to data supplied by TfL on available bus and
rail capacity. There is a greater level of capacity available on the network in the PM
peak hour than in the AM peak, combined with fewer trips to and from the Proposed
Development in the PM peak. As a result the AM peak figures represent the
‘busiest hour’ worst case scenario.
12.6.12. Bus trips from/to the Application Site will have their origin/destination in a number of
key areas including New Cross, Lewisham, Bermondsey and Central London.
Journeys have been attributed to the network based on proximity to the Proposed
Development and the frequency of the service. TfL’s Busiest Hour Analysis Report
data has been used to show the available capacity on the network and this is
summarised in Table 12-3A below:
Table 12-3A: Additional trips by route and available capacity
12.6.13. Table 12-3A indicates that there is sufficient spare seating capacity on all of the
main services. As shown, the 225 service is unlikely to have a significant change in
passenger demand. This is as a result of the new Lewisham service being provided
directly from the Proposed Development. This new service will also increase the
capacity along much of the 225 route. Whilst TfL has not been able to provide
further data on the P12 service there is anecdotal evidence which has been
confirmed by TfL in meetings that this service has sufficient capacity.
Bus route Additional trips per peak hour
Total existing trips at busiest point
Total spare capacity
1 44 502 268
225 8 No data No data
381 44 372 420
415 58 0 350
P12 76 No data No data
New Lewisham service 77 0 120
Total 307

Transport & Movement addendum, July 2011
7
12.6.14. The new bus services will provide additional capacity to the wider local area and
also provide an interchange with the new Surrey Canal Station on the East London
Line Extension. Therefore the services will benefit existing local residents.
12.6.15. In terms of rail capacity, forecasts from the January 2011 Transport Assessment
identified that rail trips from/to the Application Site will have their origin/destination
in a number of key areas, but are predominantly focused on central London.
These, together with the number of trips expected to each destination in the busiest
peak hour (i.e. outbound from the Site in the AM peak hour) were analysed. Table
12-4A below indicates the numbers of additional trips on each route and uses
Railplan data supplied by TfL for 2016 to calculate the spare capacity on trains at
their busiest point:
Table 12-4A: Rail additional trips and capacity
Rail route Additional trips per peak hour
Total existing trips
Total spare capacity
South Bermondsey to London Bridge
291 5,800 2,509
Surrey Canal Road to Surrey Quays
322 2,400 78
Surrey Quays to West Croydon
17 No data No data
12.6.16. This review indicates that a spare capacity is available on the London Overground
line to Surrey Quays, but considerably more is available at South Bermondsey
towards London Bridge. On the basis of the above assessment of both rail and bus
crowding and capacity it is considered that the Proposed Development will have a
minor beneficial effect in terms of providing additional seating capacity on buses
both to Lewisham and to Elephant & Castle.
Construction Effect
12.6.17. In terms of the transport construction effect this was discussed in paragraphs
12.6.28 to 12.6.33 of the January 2011 ES Chapter 12. As a result of changes in
the Proposed Development relating primarily to plots around the Stadium the
implications for construction effect will be altered. The reduction in basement
footprint below Bolina East results in a minor reduction in the expected excavation
arising during construction from a site wide volume of 129,000m3 used in the
January 2011 assessment to 125,000m3 now proposed. This represents a
reduction of 3% by volume. In the context of the assessment this is not significant
and the Proposed Development , as amended, results in slightly less excavation
arising than that already assessed, so it is considered that the assessment already
undertaken based on 129,000m3 represents a conservative worst case. There is

Transport & Movement addendum, July 2011
8
no change in relation to the significance of the transport environmental effects
identified in the January 2011 assessment.
Effect of Stadium / Event Day Activity
12.6.18. The Proposed Development has been designed to accommodate movement to and
from the Stadium. Access is improved to the Stadium in terms of the following
providing the new Surrey Canal Station,
providing new bus services to Lewisham and Elephant & Castle,
improving the access to South Bermondsey station
improving pedestrian crossing provision on Surrey Canal Road
12.6.19. In addition the Proposed Development has been amended to improve the
pedestrian routing by the drawing back of Plot Bolina East from the Stadium and
from the northern boundary, the drawing back of the Plot Stadium Avenue away
from the Stadium and the cutting away of part of the lower floors of Senegal 2 and
the reshaping of the Plot to improve crowd movement. These changes also ensure
the segregation of home and away supporters and for away coach access. A Travel
Plan and Events Strategy are proposed. Further details of these measures are
contained in the Transport Assessment Addendum (Technical Appendix 12.1A).
12.6.20. The assessment below relates to the new residents, or people using, working at or
passing through and around the Proposed Development on a match day relating to
the busy crowd conditions that exist. All of these effects are short term in nature
and the number of home matches per year is limited to the fixtures of the club in a
season, i.e. 23 league games plus cup games. In addition to football matches
Millwall FC also have permission to hold 8 concerts per year, 2 musical festivals per
year, a total of 33 specified types of events (but a maximum of 10 non-football
events with more than 2,500 spectators allowed on weekdays); and unlimited
events with less than 2,500 spectators and without amplified music at the Stadium.
12.6.21. Severance – this refers to the effect of traffic levels on pedestrian movements.
Millwall FC would have 150 on-site parking spaces retained for match day use. The
management of those spaces is covered further in the TA Addendum (Technical
Appendix 12.1A). During match days as part of the crowd control the police may
temporarily close roads (as they do currently). The area between Plot Bolina East
and the Stadium will have segregation lines to ensure segregation between home
and away supporters. The Police would also utilise some areas of the public realm
for their operations. It is not considered that the traffic levels associated with the
Millwall FC parking would have a material effect in terms of severance, given the
Transport & Movement addendum, July 2011
9
Assessment Criteria. The police operations may result in a minor adverse effect,
albeit temporary in nature.
12.6.22. Driver Delay – it is considered likely that there would be periods of delay to
residents, or people using, working at or passing through and around the Proposed
Development in terms of access / egress to car parks. This is likely to result in
periods of waiting for crowds to dissipate. The Stadium does empty over a short
period of time (typically 70% of the crowd within 5 minutes). Therefore it is
considered that this effect is minor adverse in nature but would only be temporary
in nature.
12.6.23. Pedestrian delay and amenity – pedestrian delay and amenity relates to the
interaction between traffic levels and pedestrians. Residents or people using,
working at or passing through and around the Proposed Development will be
sharing the spaces with crowds on match days. The development is designed to
accommodate these pedestrian flows. It is considered that there would be a minor
adverse effect related to the ability to cross the roads as a result of match day
activity. Amenity relates more to the physical provision for pedestrians and the
Proposed Development has been designed to accommodate match day crowds.
12.6.24. Fear and intimidation – this Assessment Criteria relates to the fear and intimidation
as a result of the interaction between pedestrians and traffic, particularly large
vehicles. It is not an assessment of security or personal safety. With limited traffic
generated by Millwall FC this is unlikely to be significant. There would be coach
movements, police vehicles and emergency service vehicles which are large in
nature but their routing, location within the Site and the low speed they would be
travelling at would not result in a material effect on fear and intimidation.
12.6.25. Accidents and road safety – with match day conditions the speed of traffic is likely
to be reduced and as such the likelihood and severity of accidents is low. As a
result it is not considered that this would be changed on match days.
12.6.26. Dust and Dirt – this would not be worsened by the match day conditions.
12.6.27. Crowding on public transport services – the match day attendance at the Stadium
would have an effect in terms of the crowding of both rail and bus services locally.
The nature of the match day travel will result in a period of intense demand (70% of
the crowd would leave the Stadium within a 5 minute period). However, there is
very limited data available in relation to these time periods in terms of crowding
outside of the traditional peak hours.
12.6.28. The majority of the activity on match days would not coincide with the highest levels
of trip making from the Proposed Development, being at the weekend. There would
Transport & Movement addendum, July 2011
10
be a greater effect expected on weekday evening matches / events with supporters
arriving in the early evening. In addition to the timing of events, where people are
travelling from is also material to the effect. The majority of Millwall FC supporters
would be travelling from the south and east to the Stadium from Bexley, Greenwich,
Southwark and Lewisham as described further in Section 12 of the TA Addendum
(Technical Appendix 12.1A). The majority of the Proposed Development public
transport trips would be travelling north of the Site as described further in Section
5.5 of the TA Addendum (Technical Appendix 12.1A). Therefore the majority of
Proposed Development public transport trips would be arriving from a different
direction and on different services (particularly by bus) to the majority of Millwall FC
supporters.
12.6.29. It is considered that, depending on the scale of attendance which does vary
significantly, the effect on the residents, employees, visitors, or people passing
through or around the Proposed Development (the sensitive receptors) would be a
moderate adverse effect in terms of crowding on passenger transport, albeit one
that is temporary in nature and only occurs a limited number of times throughout
the year (23 home league matches, cup games and event days).
12.7 Mitigation Measures
12.7.1 The January 2011 ES Chapter 12 provides details of the mitigation package to be
provided in association with the Proposed Development. The paragraphs below
provide further clarification on these mitigation measures. Further details are
provided in the Transport Assessment Addendum in Technical Appendix 12.1A.
Pedestrian Improvements
12.7.2. There has also been further discussion concerning the improvement of pedestrian
routes surrounding the Site. Eight off-site pedestrian improvements were identified in
the original TA. Table 12-5A provides further information on the details associated
with each off-site measure.

Transport & Movement addendum, July 2011
11
Table 12-5A: Pedestrian Improvements
Pedestrian Improvement
Details In partnership with local authority / TfL / Network Rail / Sustrans
1 Zampa Road/ Stockholm Road Footway
Increase footway width and improve lighting on sections of Zampa Road and Stockholm Road between Ilderton Road and the red line boundary. Improvements to the railway arches along these sections as discussed in pedestrian improvement 2 below.
LBS
2 Railway Arches and Underpasses
Lighting and cleaning of railway arches within the red line and along Zampa Road, Stockholm Road, Bolina Road, Rollins Street and to the route of the ELLE, taking into account works by Rail for London on the footpath alongside the ELLE.
LBL / TfL / Network Rail
3 Improved Pedestrian and Cycle Links to Bridgehouse Meadows
Improve the pedestrian access route from Surrey Canal Road to Bridge House Meadows.
LBL / TfL
4 Pedestrian and Cycle Link to South Bermondsey Station
Direct pedestrian and cycle link to South Bermondsey Station from the Proposed Development. An Interim link is being investigated by JMP and would be complete between January 2014 to April 2015 to coincide with Thameslink Works.
LBS / LBL / Network Rail / Sustrans
5 Lighting along pedestrian route to Surrey Quays Station
Provide street lighting from Bolina Road, along Silwood Road to Surrey Quays station. This is an extension to the planned TfL/LBL lighting project by a few hundred metres.
LBL
6 Improvements to Silwood Street
Street lighting and widening of pavements along Silwood Street.
LBL
7 Pedestrian crossing on Surrey Canal Road
Provide a wide signalised crossing on Surrey Canal Road linked to pedestrian connections on-site.
LBL
8 Rollins Street S106 contribution to traffic calming along Rollins Street to create an improved pedestrian environment.
LBL
9 Legible London (Throughout Site and Local Area)
S106 contribution towards Legible London signage for the Proposed Development to aid wayfinding for pedestrians through the railway arches and around the Proposed Development.
LBL / LBS / TfL
Bus Strategy
12.7.3. The bus strategy to serve the Proposed Development has been the subject of further
consideration by TfL since January 2011. Following consultation with TfL and LBL, a
revised strategy has been developed which provides two new bus routes to the
Proposed Development:
Extension of service 415 (Tulse Hill to Elephant & Castle) to Surrey Canal
Road station (every 12 minutes daytimes, every 20 minutes evenings and
Sundays); and
Provision of a new service between the development and Lewisham (every
20 minutes daytime, every 30 minutes evenings and Sundays).
12.7.4. Both of these services will provide considerable enhancement to the accessibility of
the Proposed Development as well as the wider community in the surrounding area
by providing higher frequencies on some sections of route, connection to the new
Surrey Canal Station and extra direct links not currently possible by bus. This

Transport & Movement addendum, July 2011
12
provision replaces that described in paragraphs 12.7.8 and 12.7.9 of the January
2011 ES Chapter 12.
Surrey Canal Road Station
12.7.5. Since the date of the submission of the Planning Application in January 2011, further
discussions have been undertaken in relation to the date of delivery of elements of
the transport package. As part of these discussions Renewal has committed to bridge
the funding gap along with LBL to deliver Surrey Canal Station at the outset of the
Proposed Development. This will result in significant enhancements to the
accessibility of the Proposed Development and the wider area from its earliest
phases.
12.8 Summary of Residual Effects
12.8.1 There are no changes to the summary of residual effects from those set out in the
January 2011 ES. Further assessments in relation to both Driver Delay, a minor
adverse effect, and Crowding on Public Transport Services, a minor beneficial effect,
have been identified.
12.9 Opportunities for Future Mitigation Measures
12.9.1 The January 2011 ES Chapter 12 provided some details of the Travel Plan to serve
the Proposed Development. Further details of the management, operation and
delivery of the Travel Plan is provided to the Transport Assessment Addendum
(Technical Appendix 12.1A).
12.10 Assessment of Cumulative Effects
12.10.1. The assessment in the Environmental Statement (January 2011) of the cumulative
effects of the Proposed Development relating to severance, pedestrian delay and
amenity, fear and intimidation, accidents and road safety, and dust and dirt remain
unchanged. There are two criteria relating to Transport and Movement where this
addendum provides further assessment of cumulative effect. Firstly, it provides an
assessment of the implications of cumulative driver delay, secondly it provides an
assessment of the cumulative effect of crowding on public transport services.
Driver delay
12.10.2. The assessments made above on driver delay include traffic associated with other
committed developments with the exception of the ‘best case’ assessments on the
Old Kent Road junctions. These junctions have been tested without the additional
committed development traffic. In addition to these tests a ‘worst case’ assessment

Transport & Movement addendum, July 2011
13
has also been undertaken for the two junctions on Old Kent Road to demonstrate
the implication of the cumulative effect on the capacity of those junctions. Table 12-
6A below summarises the results for those ‘worst case’ cumulative assessments.
The full assessments are provided in the Transport Assessment Addendum
(Technical Appendix 12.1A).
Table 12-6A: Cumulative Effect on Driver Delay
Junction Summary of detailed junction assessment / mitigation identified
Effect on driver delay
Ilderton Road / Old
Kent Road
Cumulative ‘worst’ case assessment is within
capacity in AM and PM weekday assessment and
approaching capacity on a Saturday.
A sum of money secured in the S106 against future
junction performance which could be used to
investigate increasing cycle times across the
SCOOT region or other measures
Worst Case (cumulative
effect) Minor, adverse,
With mitigation Neutral
St James Road /
Old Kent Road
In the cumulative ‘worst’ case assessment the
junction operates over capacity in AM and PM
weekday assessment and Saturday assessment.
A sum of money secured in the S106 against future
junction performance which could be used to
investigate increasing cycle times across the
SCOOT region or other measures
Worst Case (cumulative
effect) Moderate,
adverse effect
With mitigation Minor
Adverse effect
Overall effect on Driver Delay cumulative effect (‘worst’ case assessment)
without mitigation
Moderate, adverse
effect
Overall effect on Driver Delay cumulative effect (‘worst’ case assessment)
with mitigation
Minor, adverse effect
12.10.3. It is considered that the implication of the cumulative effect on driver delay would be
a Moderate Adverse effect without mitigation. However the mitigation that has been
identified in liaison with TfL, through management through SCOOT, etc, (should it
be required) would reduce the cumulative effect to Minor Adverse.
Crowding on public transport services
12.10.4. The assessment made above on the capacity of the rail network includes
passenger growth and changes to the network, as this is inherent in the forecast
data available. The bus patronage is unlikely to be significantly changed as a result
of the committed developments, given the amount of additional capacity provided
by the new service to Lewisham and extended service to Elephant and Castle and

Transport & Movement addendum, July 2011
14
the location of the other sites concerned. On that basis it is considered that the
implication of the cumulative effect would also be a Minor Beneficial effect.

12.1 A Transport Assessment addendum and Appendices can
be found in Folder 2.04 and 2.05 Vol. 4 addendum
Environmental Statement Transport Assessment Report and
Appendices, July 2011
Noise and Vibration addendum, July 2011
1
13. Noise and Vibration addendum, July 2011
13.1 Introduction
13.1.1 The Environmental Statement submitted as part of the Planning Application for the Proposed
Development in January 2011 included, at Chapter 13, an assessment of potential noise and
vibration effects arising from the construction effects, operational effects and residential
suitability.
13.1.2 Following the submission of the Planning Application, requests for clarification have been
received from the London Borough of Lewisham (LBL). These points are addressed in this
addendum. There have also been changes to the Proposed Development, including the
Development Specification, in the matter of noise which also require the information in the
Chapter to be updated.
13.2 Policy Context
13.2.1 The national, regional and local planning policies of relevance to noise and vibration remain
as set out in ES Chapter 13, January 2011.
13.3 Methodology and Assessment Criteria
13.3.1 Changes to the Commitments set out in the Development Specification, included at Technical
Appendix 2.1A of this Addendum, have been made in relation to internal noise levels within
residential accommodation within the Proposed Development. These are as follows;
‘Buildings shall be constructed so as to provide sound insulation against external noise, to
achieve levels not exceeding 30dB LAeg and 45dB LAmax (night) for bedrooms, 35dB LAeg (day)
for other habitable rooms, with windows shut and other means of ventilation provided. The
ventilation shall be designed to avoid the intake of air from the Surrey Canal Road side of the
site.’
Day and night are defined as 07:00 – 23:00 and 23:00 – 07:00 respectively.
13.3.2 All other criteria are as set out in ES Chapter 13, January 2011.
13.4 Aspects of the Proposed Development of Relevance to the Assessment
13.4.1 The Proposed Development as amended is not significantly different to the scheme originally
considered within the January 2011 ES and the noise effects are expected to be
correspondingly similar.

Noise and Vibration addendum, July 2011
2
13.5 Baseline Situation
13.5.1 The baseline scenario remains unchanged form that set out in ES Chapter 13, January 2011.
13.5.2 To clarify, the short term measurements in Table 3.6 of the January 2011 ES were made
over 15 minute periods.
13.6 Identification and Assessment of Effects
South Bermondsey Station Announcements
13.6.1 The effects from station announcements from South Bermondsey Station are set out in
paragraphs 13.5.8 and 13.5.7 of the January 2011 ES.
13.6.2 To clarify, the noise level from station announcements at a platform location has been
measured to demonstrate the extent of the effect that would arise at the closest noise
sensitive receptors (Bolina North). Announcements are made before each train arrives.
There are also programmed safety announcements. It is estimated that there is a maximum of
around 20 such announcements in one hour.
Table 13.21 : Noise levels from Station Announcements
Average duration LAeq (dB) LAmax (dB)
20 secs 53 @ 4m 60 @ 4m
13.6.3 Observations made on the platform note that the noise levels from the announcements are
considerably less than those arising from the train movements on the line. The effect of the
announcements on the Proposed Development, the LAmax level within residential uses within
the closest residential uses has been considered and are presented in Table13. 22.
Table 13.22: Calculation of LAmax Levels Within the Closest Proposed Residential
Properties
LAmax at 4m 60 dB
Distance attenuation Bolina North 17 dB
Minimum attenuation from open window (Ref BS 8233) 10 dB
LAmax within closest dwellings 33 dB
Nightime internal LAmax (Ref: BS8233) 45 dB

Noise and Vibration addendum, July 2011
3
13.6.4 From the Table above, it can be seen that the predicted LAmax from announcements is 12 dB
below the maximum level in BS8233 given as guidance for night-time noise. On this basis,
no significant effect is predicted at the closest noise sensitive point to the station and as such
is determined not to be significant for the Proposed Development, as amended, as a whole.
Potential Receptors, Construction Phase
13.6.5 The main effects of noise and vibration at all receptor points during the construction phase
have been detailed within Table 13.12 of the January 2011 ES. Ilderton Road, affected as it is
primarily by road traffic noise, will not experience the effects of construction noise to the same
extent as those properties at greater distance from main roads which have been assessed.
Noise Levels Within Proposed Residential Properties
13.6.6 As noted in 13.3.1 above, these internal noise levels have been revised in the Development
Specification. Changes to the Accommodation Schedule, also included in Technical Appendix
2.1A, have been remodeled. The principal changes that have required reassessment are
alterations to the heights and footprint of some plots, for example Bolina East and Senegal
Way 2 and the relationship of the Proposed Development with Millwall FC Stadium.
13.6.7 The SoundPLAN acoustic models for combined road and rail have been re run using the
revised Parameter Plan to define the footprints and heights of the plots. These results are
shown in Tables 13.14A and 13.15A which replace Tables 13.14 and 13.15 in the January
2011 ES.
13.6.8 The model has also been run to see the effects of rail alone. The model has been run for this
condition for the daytime and night-time periods, and the results are presented in Tables
13.23 and 13.24 below.
Table 13.14A : Predicted combined road and rail noise levels without East London Line
Extension and Thameslink Works 07:00 - 23:00
Plot Predicted LAeq (dB)
Required internal noise
environment windows
closed (dB)
Minimum sound
insulation thermal
insulating units
(6-12-6) (dB)
Achieved internal noise
environment windows
closed (dB)
Bolina East 46 - 61 35 33 13 - 28
Bolina North 1 58 - 62 35 33 25 - 29
Bolina North 2 54 - 60 35 33 21 - 27
Bolina West 48 - 63 35 33 15 - 30
Excelsior 1 70 - 72 35 33 37 – 391
Excelsior 3 49 - 66 35 33 16 - 33
Excelsior 4 60 - 62 35 33 27 - 29
Excelsior 5 58 - 63 35 33 25 - 30

Noise and Vibration addendum, July 2011
4
Orion 46 - 70 35 33 13 - 372
Senegal Way 48 - 61 35 33 15 - 28
Stadium Avenue 52 - 62 35 33 19 - 29
Stockholm 1 53 - 69 35 33 20 – 363
Stockholm 2 58 - 69 35 33 25 – 364
Timber Wharf 1 54 - 74 35 33 21 - 412
Timber Wharf 2 61 - 64 35 33 28 - 31 1 At 1.5m to 13.5m AOD facing Surrey Canal Road
2 At 1.5m to 25.5m AOD facing Surrey Canal Road
3 At 4.5m to 31.5m AOD facing Surrey Canal Road
4 At 4.5m to 75.5m AOD facing Surrey Canal Road
5 At 1.5m to 16.5m AOD facing Surrey Canal Road
Table 13.15A : Predicted combined road and rail noise levels with East London Line
Extension and Thameslink Works 07:00 – 23:00
Plot Predicted LAeq (dB)
Required internal noise
environment windows closed
(dB)
Minimum sound insulation thermal
insulating units (6-12-6) (dB)
Achieved internal noise environment
windows closed (dB)
Bolina East 46 - 61 35 33 13 - 28
Bolina North 1 59 - 62 35 33 26 - 29
Bolina North 2 54 - 61 35 33 21 - 28
Bolina West 48 - 63 35 33 15 - 30
Excelsior 1 70 - 72 35 33 37 - 391
Excelsior 3 64 - 71 35 33 31 – 382
Excelsior 4 62 - 63 35 33 29 – 30
Excelsior 5 60 - 65 35 33 27 – 32
Orion 49 - 70 35 33 16 – 373
Senegal Way 61 - 67 35 33 28 - 34
Stadium Avenue
52 - 62 35 33 19 - 29
Stockholm 1 54 - 69 35 33 21 – 364
Stockholm 2 59 - 70 35 33 26 – 375
Timber Wharf 1 54 - 74 35 33 21 – 416
Timber Wharf 2 62 - 65 35 33 29 - 32 1 At 1.5m to 13.5m AOD facing Surrey Canal Road
2 At 1.5m to 25.5m AOD facing Surrey Canal Road and at 1.5m to 10.5m AOD facing ELL
3 At 1.5m to 25.5m AOD facing Surrey Canal Road and at 4.5m to 31.5m AOD facing ELL
4 At 4.5m to 31.5m AOD facing Surrey Canal Road
5 At 4.5m to 75.5m AOD facing Surrey Canal Road
6 At 1.5m to 16.5m AOD facing Surrey Canal Road
Table 13.23 : Predicted combined rail noise levels with East London Line Extension
and Thameslink Works only daytime 07:00 – 23:00
Plot Predicted LAeq (dB)
Required internal noise environment
windows closed (dB)
Minimum sound
insulation thermal
insulating units (6-
Achieved internal noise environment
windows closed (dB)
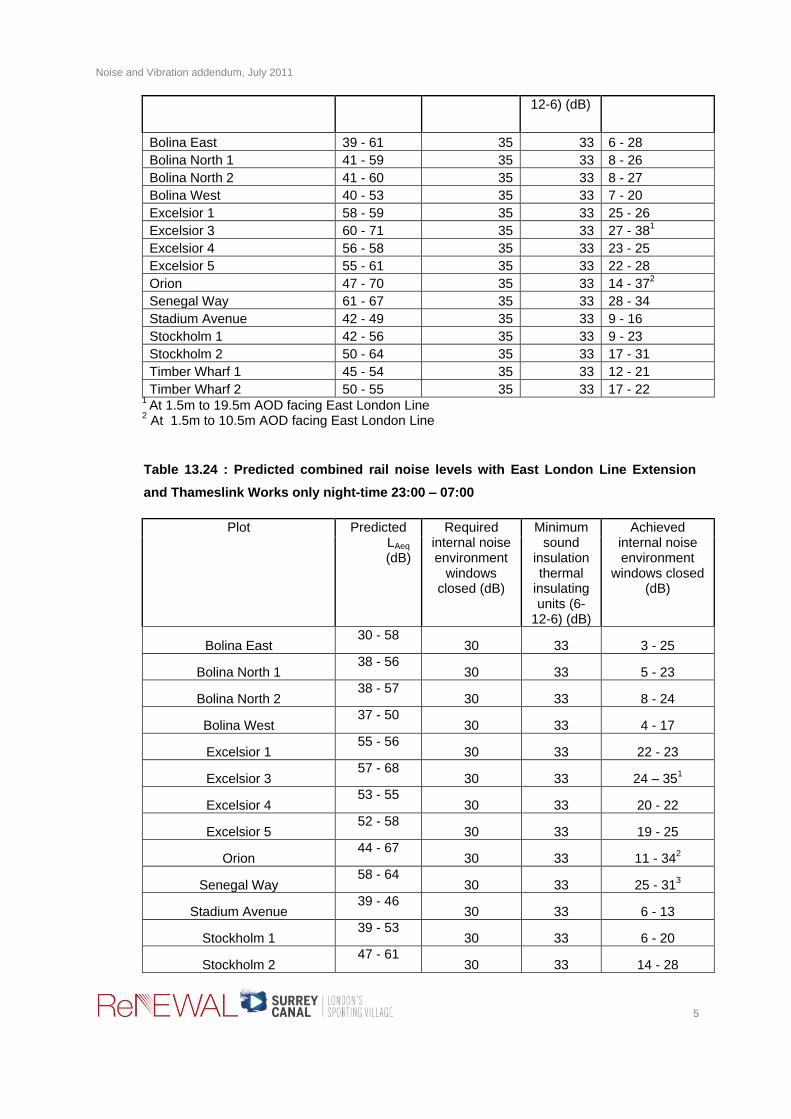
Noise and Vibration addendum, July 2011
5
12-6) (dB)
Bolina East 39 - 61 35 33 6 - 28
Bolina North 1 41 - 59 35 33 8 - 26
Bolina North 2 41 - 60 35 33 8 - 27
Bolina West 40 - 53 35 33 7 - 20
Excelsior 1 58 - 59 35 33 25 - 26
Excelsior 3 60 - 71 35 33 27 - 381
Excelsior 4 56 - 58 35 33 23 - 25
Excelsior 5 55 - 61 35 33 22 - 28
Orion 47 - 70 35 33 14 - 372
Senegal Way 61 - 67 35 33 28 - 34
Stadium Avenue 42 - 49 35 33 9 - 16
Stockholm 1 42 - 56 35 33 9 - 23
Stockholm 2 50 - 64 35 33 17 - 31
Timber Wharf 1 45 - 54 35 33 12 - 21
Timber Wharf 2 50 - 55 35 33 17 - 22 1 At 1.5m to 19.5m AOD facing East London Line
2 At 1.5m to 10.5m AOD facing East London Line
Table 13.24 : Predicted combined rail noise levels with East London Line Extension
and Thameslink Works only night-time 23:00 – 07:00
Plot Predicted LAeq (dB)
Required internal noise environment
windows closed (dB)
Minimum sound
insulation thermal
insulating units (6-
12-6) (dB)
Achieved internal noise environment
windows closed (dB)
Bolina East 30 - 58
30 33 3 - 25
Bolina North 1 38 - 56
30 33 5 - 23
Bolina North 2 38 - 57
30 33 8 - 24
Bolina West 37 - 50
30 33 4 - 17
Excelsior 1 55 - 56
30 33 22 - 23
Excelsior 3 57 - 68
30 33 24 – 351
Excelsior 4 53 - 55
30 33 20 - 22
Excelsior 5 52 - 58
30 33 19 - 25
Orion 44 - 67
30 33 11 - 342
Senegal Way 58 - 64
30 33 25 - 313
Stadium Avenue 39 - 46
30 33 6 - 13
Stockholm 1 39 - 53
30 33 6 - 20
Stockholm 2 47 - 61
30 33 14 - 28

Noise and Vibration addendum, July 2011
6
Timber Wharf 1 42 - 51
30 33 9 - 18
Timber Wharf 2 47 - 52
30 33 14 - 19 1 At 4.5m to 25.5m AOD facing East London Line
2 At 1.5m to 19.5m AOD facing East London Line
3 At 7.5m to 25.5m AOD facing East London Line
13.6.9 Tables 13.14 and 13.15 in the January 2011 ES list the internal noise levels achieved by
thermal glazing. The lowest sound insulation value given in BS8233 for this glazing format
has been used. There is scope therefore to meet any enhanced standard that may be
required as part of the design. This Addendum updates the January 2011 ES in respect of
the changes to the Development Specification.
Construction Traffic Routes
13.6.10 The construction routes remain as set out in Section 13 of the January 2011 Transport
Assessment.
Crowd Noise and Concerts at Millwall Stadium.
13.6.11 The noise and vibration chapter of the January 2011 ES did not include an explicit
assessment of the possible noise impacts from crowds attending football matches, matches
held on Sundays or the Millwall FC Stadium being used for music events as specified in upon
proposed residential properties when going to, and leaving the stadium, including likely routes
supporters take and entrances / exits at the stadium
13.6.12 To clarify, most of the sound generated is from football crowds on match days at Millwall FC
and this has been included in the January 2011 assessment. The sound levels from Sunday
matches are likely to be no different than those from other matches. Sunday matches are not
likely to be evening matches. The Noise Council ‘Code of Practice on Environmental Noise
Control at Concerts’ guidance indicates that for up to a maximum of 12 events each calendar
year at a venue the music noise level, measured as an LAeq,15 minutes, should not exceed the
background noise level (measured LA90 for the last 4 hours of the duration of the event) by
more than 15 dB. This would permit concert noise levels of up to LAeq 62 dB at the Plots
closest to the Stadium and LAeq 67 dB in the vicinity of Rollins House. These levels have
been derived from the baseline noise surveys provided in Technical Appendix 13.1 to the
January 2011 ES. The façade levels calculated are similar to those from football matches (as
detailed in Table 13.8 in the January 2011ES Chapter).
13.6.13 The noise from spectators arriving has been included in the overall sound profile which covers
a period of 6 hours for a 90 minute match with half time.
13.6.14 Internal noise levels during matches have been calculated to be between LAeq,T 37 -39 dB.
The reference façade levels in Table 13.8 of the January 2011 ES note that 33 dB attenuation
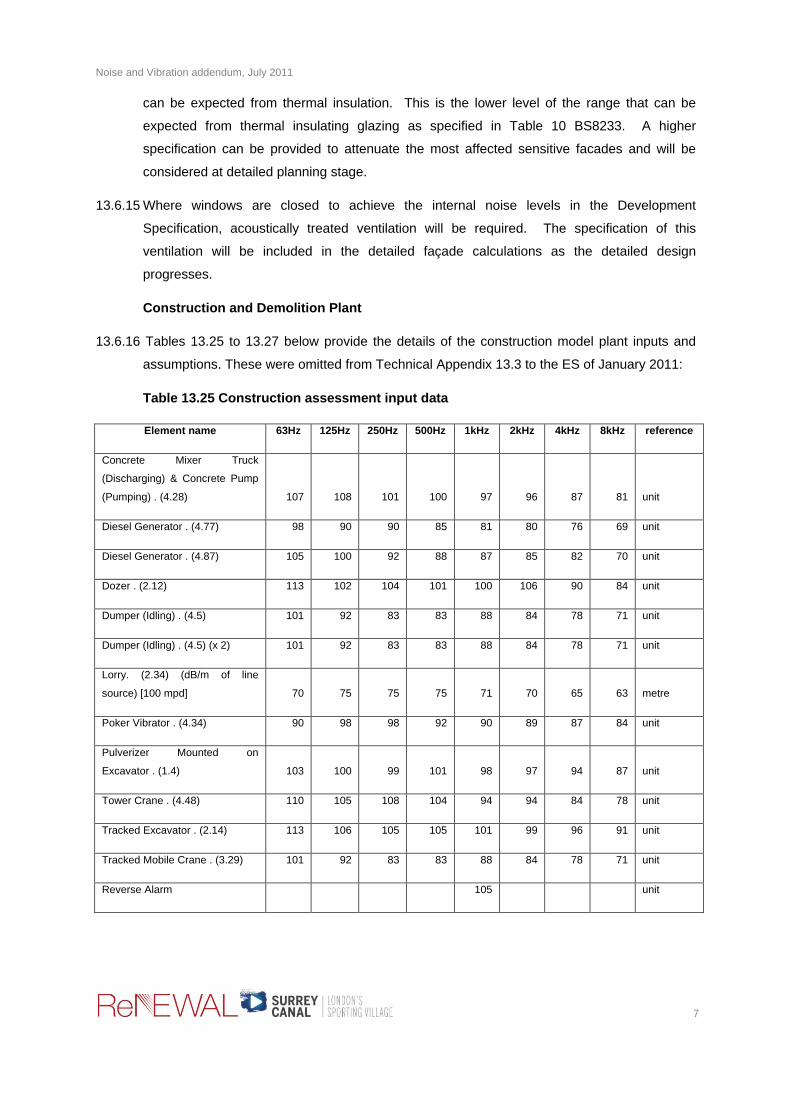
Noise and Vibration addendum, July 2011
7
can be expected from thermal insulation. This is the lower level of the range that can be
expected from thermal insulating glazing as specified in Table 10 BS8233. A higher
specification can be provided to attenuate the most affected sensitive facades and will be
considered at detailed planning stage.
13.6.15 Where windows are closed to achieve the internal noise levels in the Development
Specification, acoustically treated ventilation will be required. The specification of this
ventilation will be included in the detailed façade calculations as the detailed design
progresses.
Construction and Demolition Plant
13.6.16 Tables 13.25 to 13.27 below provide the details of the construction model plant inputs and
assumptions. These were omitted from Technical Appendix 13.3 to the ES of January 2011:
Table 13.25 Construction assessment input data
Element name 63Hz 125Hz 250Hz 500Hz 1kHz 2kHz 4kHz 8kHz reference
Concrete Mixer Truck
(Discharging) & Concrete Pump
(Pumping) . (4.28) 107 108 101 100 97 96 87 81 unit
Diesel Generator . (4.77) 98 90 90 85 81 80 76 69 unit
Diesel Generator . (4.87) 105 100 92 88 87 85 82 70 unit
Dozer . (2.12) 113 102 104 101 100 106 90 84 unit
Dumper (Idling) . (4.5) 101 92 83 83 88 84 78 71 unit
Dumper (Idling) . (4.5) (x 2) 101 92 83 83 88 84 78 71 unit
Lorry. (2.34) (dB/m of line
source) [100 mpd] 70 75 75 75 71 70 65 63 metre
Poker Vibrator . (4.34) 90 98 98 92 90 89 87 84 unit
Pulverizer Mounted on
Excavator . (1.4) 103 100 99 101 98 97 94 87 unit
Tower Crane . (4.48) 110 105 108 104 94 94 84 78 unit
Tracked Excavator . (2.14) 113 106 105 105 101 99 96 91 unit
Tracked Mobile Crane . (3.29) 101 92 83 83 88 84 78 71 unit
Reverse Alarm 105 unit
Noise and Vibration addendum, July 2011
8
Table 13.26 : On Times Demolition Phases
Item On-time
Pulverizer mounted on excavator 80%
Lorry (Model based on 50 vehicles entering and leaving site per day) 100%
Dumper Idling (x2) 100%
Dozer 80%
Tracked Excavator 80%
Table 13.27 : On Times Construction phases
Item On-time
Diesel Generator (x2) 100%
Lorry (Model based on 50 vehicles entering and leaving site per day) 100%
Dumper Idling 100%
Concrete mixer & pump 100%
Poker vibrator 80%
Tower crane (source height: 40m) 50%
Tracked Mobile crane 50%
Reverse Alarm 50%
Operational Noise
13.6.17 Paragraph 13.6.35 of the January 2011 ES refers to sources of operational noise, but makes
no reference to noise from sports activities, or the multi-faith centre, and its potential impacts
on the dwellings above or facing the areas concerned.
13.6.18 To clarify, the main noise will be from air handling plant which has been covered in the
January 2011 ES chapter. The buildings will be designed to attenuate the noise to local,
national and international guidance levels.
13.6.19 Noise from vehicles accessing the multi-faith centre have been included in the traffic flow
data as part of the global traffic generation for the site. The potential for noise disturbance
from the congregation leaving the multi-faith centre is considered below.
13.6.20 It is noted that this is not a quiet area even in the early hours of the morning (reference
receptor ST-03 as reported in Table 13.6 in the January 2011 ES). The area is already
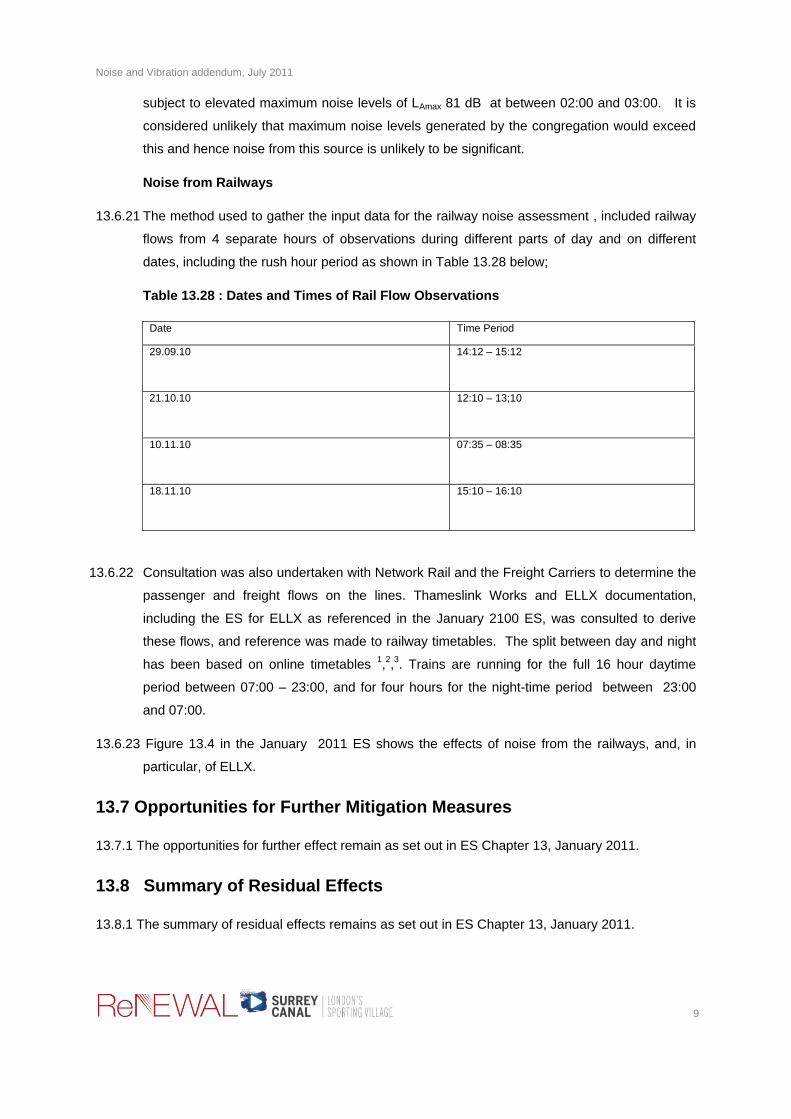
Noise and Vibration addendum, July 2011
9
subject to elevated maximum noise levels of LAmax 81 dB at between 02:00 and 03:00. It is
considered unlikely that maximum noise levels generated by the congregation would exceed
this and hence noise from this source is unlikely to be significant.
Noise from Railways
13.6.21 The method used to gather the input data for the railway noise assessment , included railway
flows from 4 separate hours of observations during different parts of day and on different
dates, including the rush hour period as shown in Table 13.28 below;
Table 13.28 : Dates and Times of Rail Flow Observations
Date Time Period
29.09.10
14:12 – 15:12
21.10.10
12:10 – 13;10
10.11.10 07:35 – 08:35
18.11.10 15:10 – 16:10
13.6.22 Consultation was also undertaken with Network Rail and the Freight Carriers to determine the
passenger and freight flows on the lines. Thameslink Works and ELLX documentation,
including the ES for ELLX as referenced in the January 2100 ES, was consulted to derive
these flows, and reference was made to railway timetables. The split between day and night
has been based on online timetables 1,2,3. Trains are running for the full 16 hour daytime
period between 07:00 – 23:00, and for four hours for the night-time period between 23:00
and 07:00.
13.6.23 Figure 13.4 in the January 2011 ES shows the effects of noise from the railways, and, in
particular, of ELLX.
13.7 Opportunities for Further Mitigation Measures
13.7.1 The opportunities for further effect remain as set out in ES Chapter 13, January 2011.
13.8 Summary of Residual Effects
13.8.1 The summary of residual effects remains as set out in ES Chapter 13, January 2011.

Noise and Vibration addendum, July 2011
10
13.9 Assessment of Cumulative Effects
13.9.1 The cumulative effects are not expected to differ from those set out in ES Chapter 13, January
2011. Correspondingly potential cumulative effects would not be considered significant as part
of any baseline consideration or in conjunction with the completion of the Proposed
Development.
References
1. Southern Railway website www.southernrailway.com
2. Southeastern Railway website www.southeasterrailway.co.uk
3. Fisrt Capital Connect website www.firstcapitalconnect.co.uk
All other references remain as set out in the January 2011 ES chapter.

Air Quality addendum, July 2011
1
14. Air Quality addendum, July 2011
14.1 Introduction
14.1.1 Chapter 14 of the Environmental Statement (January 2011) describes the likely significant
effects of the Proposed Development with respect to air quality during both the construction
and operational phases. The Chapter is supported by Technical Appendix 14.1.
14.1.2 Following the submission of the ES in January 2011, changes have been made to the
Parameter Plans and Development Specification as set out in Chapter 2 of this Addendum.
This Chapter provides a reassessment of the Proposed Development as amended, defines
additional assessment criteria, and provides clarification and further information on relevant
matters.
14.2 Policy Context
14.2.1 There have been no changes to the national policies and strategies as set out in the January
2011 ES.
14.2.2 The Consolidated Draft Replacement London Plan was published by the Mayor in December
2010 and was subject to an EiP Panel Report in May 2011. Policy 7.14 relates to improving
air quality and with respect to planning decisions, and states:
Development proposals should:
a) minimise increased exposure to existing poor air quality and make provision to address
local problems of air quality (particularly within AQMAs or where development is likely to be
used by large numbers of those particularly vulnerable to poor air quality, such as children or
older people) such by design solutions, buffer zones or steps to promote greater use of
sustainable transport modes through travel plans (see Policy 6.3);
b) promote sustainable design and construction to reduce emissions from the demolition and
construction of buildings following the best practice guidance in the GLA and London Councils
“The control, of dust and emissions form construction and demolition”;
c) be at least “air quality neutral” and not lead to further deterioration of existing poor air
quality (such as areas designated as Air Quality Management Areas(AQMAs);
d) ensure that where provision needs to made to reduce emissions from a development,
these usually are made on site. Where it can be demonstrated that on-sire provision is
impractical or inappropriate, and that it is possible to pout in place measures having clearly
demonstrated equivalent air quality benefits, planning obligations or planning conditions

Air Quality addendum, July 2011
2
should be used as appropriate to ensure this, whether on a scheme by scheme basis or
through joint area-based approaches.
14.2.3 The LBL Core Strategy was submitted to the Secretary of State in October 2010. Following
receipt of the Planning Inspectors report, the Council has incorporated the recommended
changes to the Core Strategy which was adopted on 29 June 2011. Core Strategy Policy 9
addresses improving local air quality:
The Council will seek to improve local air quality and minimise any negative impacts by:
a) supporting a coordinated and partnership approach to implement a national policy, London
pan policy and the actions outlined in the Council’s Air Quality Management Plan
b) working with Transport for London to manage and improve air quality along transport
corridors and traffic congestion points
c) working with all businesses, including SELCHP, within Lewisham to manage and improve
air quality.
14.3 Assessment Criteria
14.3.1 There have been no changes to the assessment criteria as set out in the January 2011 ES.
However, it is appropriate to cite additional health-based criteria.
14.3.2 The criteria are set out in Tables 14.1 and 14.2, and have been derived from guidance issued
by the Environment Agency (1).
14.3.3 The Environment Agency‟s guidance in H1 also provides criteria to screen out insignificant
process contributions. Process contributions can be considered to be insignificant if:
The long-term process contribution is <1% of the long-term environmental standard;
and
The short-term process contribution is <10% of the short-term environmental
standard.
These screening criteria apply regardless of whether the environmental standard is exceeded.

Air Quality addendum, July 2011
3
Table 14.1: Air Quality Standards
Pollutant Limit Value
(µg/m3)
Averaging Period Frequency of Exceedence
Nitrogen dioxide 200 1-hour
18 times per year (99.8th %ile)
40 Annual -
Sulphur Dioxide
266 15 minutes 35 times per year (99.9
th %ile)
350 1 hour 24 times per year
(99.73rd
%ile)
125 24 hours 3 times per year
(99.18th %ile)
Particulate Matter (PM10)
50 24 hours 35 times per year
(90th %ile)
40 Annual -
Carbon monoxide 10,000 8 hours running -
Hydrogen chloride 800 Annual -
20 1 hour -
Lead 0.25 Annual -
Benzene 5 Annual -
1,3-butadiene 2.25 Annual -
Table 14.2: Environmental Assessment Levels for Metals (µg/m3)
Pollutant Long Term EAL Short Term EAL
Arsenic 0.003 15
Antimony 5 150
Cadmium 0.005 1.5
Chromium (II & III) 5 150
Chromium (VI) 0.0002 3
Cobalt 0.2 6
Copper 10 200
Lead 0.25 -
Manganese 1 1500
Mercury 0.25 7.5
Nickel 0.02 30
Thallium 1 30
Vanadium 5 1
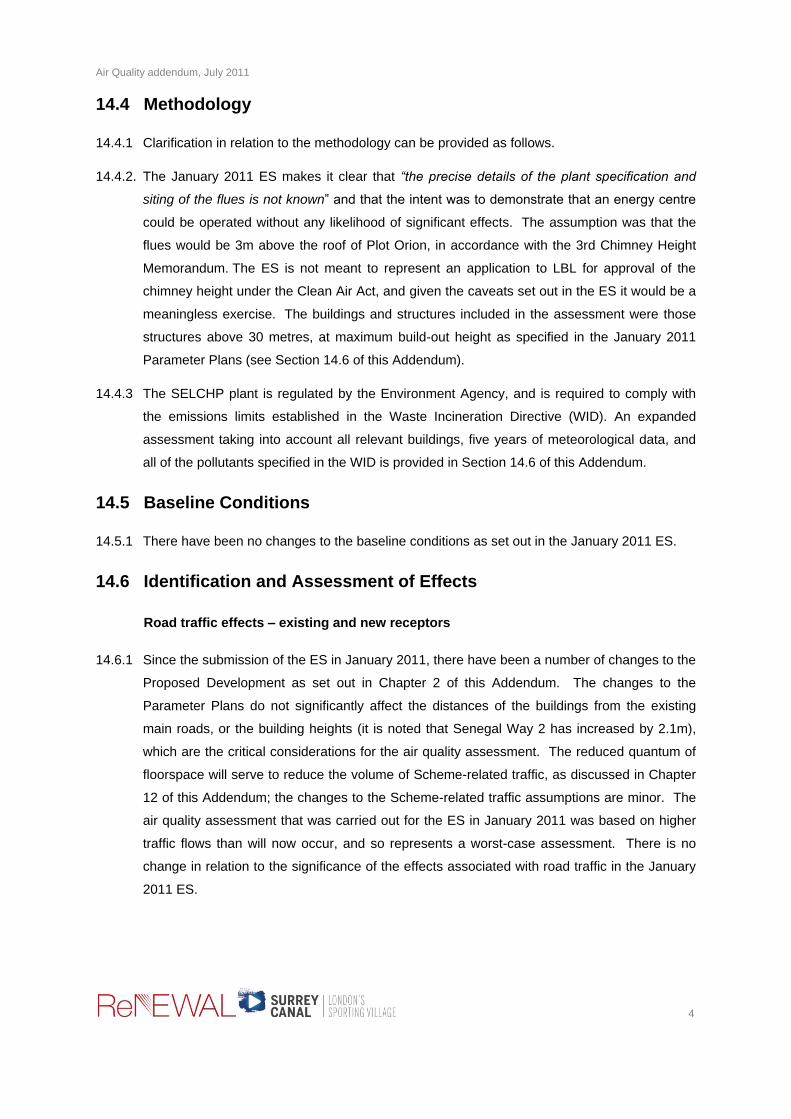
Air Quality addendum, July 2011
4
14.4 Methodology
14.4.1 Clarification in relation to the methodology can be provided as follows.
14.4.2. The January 2011 ES makes it clear that “the precise details of the plant specification and
siting of the flues is not known” and that the intent was to demonstrate that an energy centre
could be operated without any likelihood of significant effects. The assumption was that the
flues would be 3m above the roof of Plot Orion, in accordance with the 3rd Chimney Height
Memorandum. The ES is not meant to represent an application to LBL for approval of the
chimney height under the Clean Air Act, and given the caveats set out in the ES it would be a
meaningless exercise. The buildings and structures included in the assessment were those
structures above 30 metres, at maximum build-out height as specified in the January 2011
Parameter Plans (see Section 14.6 of this Addendum).
14.4.3 The SELCHP plant is regulated by the Environment Agency, and is required to comply with
the emissions limits established in the Waste Incineration Directive (WID). An expanded
assessment taking into account all relevant buildings, five years of meteorological data, and
all of the pollutants specified in the WID is provided in Section 14.6 of this Addendum.
14.5 Baseline Conditions
14.5.1 There have been no changes to the baseline conditions as set out in the January 2011 ES.
14.6 Identification and Assessment of Effects
Road traffic effects – existing and new receptors
14.6.1 Since the submission of the ES in January 2011, there have been a number of changes to the
Proposed Development as set out in Chapter 2 of this Addendum. The changes to the
Parameter Plans do not significantly affect the distances of the buildings from the existing
main roads, or the building heights (it is noted that Senegal Way 2 has increased by 2.1m),
which are the critical considerations for the air quality assessment. The reduced quantum of
floorspace will serve to reduce the volume of Scheme-related traffic, as discussed in Chapter
12 of this Addendum; the changes to the Scheme-related traffic assumptions are minor. The
air quality assessment that was carried out for the ES in January 2011 was based on higher
traffic flows than will now occur, and so represents a worst-case assessment. There is no
change in relation to the significance of the effects associated with road traffic in the January
2011 ES.

Air Quality addendum, July 2011
5
SELCHP and Proposed Energy Centre
14.6.2 A detailed assessment of whether the new buildings within the Proposed Development could
affect the dispersion of the plume from the South East London Combined Heat and Power
(SELCHP) facility has been carried out. In addition, the potential effect of all the pollutant
emissions specified in the Waste Incineration Directive (WID) arising from the SELCHP facility
have been considered at the new buildings within the Proposed Development itself.
14.6.3 The approach to the assessment, including the selection of appropriate sensitive receptor
locations was agreed with LBL (see Technical Appendix 14.2).
14.6.4 Predictions have been carried out using the ADMS-4.2 dispersion model. ADMS-4 is a new
generation model that incorporates a state-of-the art understanding of the dispersion
processes within the atmospheric boundary layer.
14.6.5 The model was run using 5 years (2006-2010) of sequential hourly meteorological data from
London Heathrow. The meteorological data were sourced from ADM Ltd. The wind roses for
each year are shown in Figure 14.1. A surface roughness length of 1 m was assumed, typical
of an urban area environment.
2006 2007
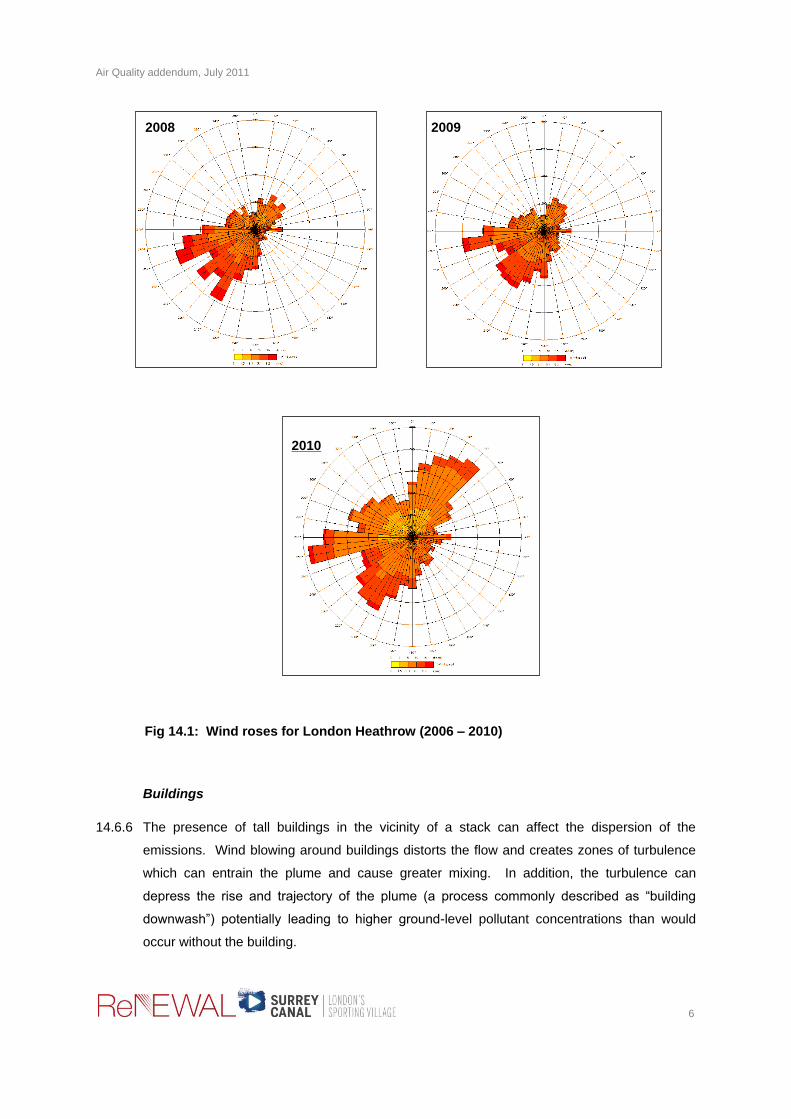
Air Quality addendum, July 2011
6
Fig 14.1: Wind roses for London Heathrow (2006 – 2010)
Buildings
14.6.6 The presence of tall buildings in the vicinity of a stack can affect the dispersion of the
emissions. Wind blowing around buildings distorts the flow and creates zones of turbulence
which can entrain the plume and cause greater mixing. In addition, the turbulence can
depress the rise and trajectory of the plume (a process commonly described as “building
downwash”) potentially leading to higher ground-level pollutant concentrations than would
occur without the building.
2008 2009
2010

Air Quality addendum, July 2011
7
14.6.7 The assessment has been carried out for two scenarios, “Without Scheme” and “With
Scheme”. For the “Without Scheme” scenario, only the existing SELCHP refuse silo and
boiler hall buildings were included in the model. It was agreed with LBL (see Technical
Appendix 14.2) that there are no other existing tall buildings in the vicinity of SELCHP that
need to be accounted for. For the “With Scheme” scenario, additional buildings within the
Proposed Development, as amended, were included (at the assumed maximum build-out
heights specified in the revised Parameter Plans).
14.6.8 The ADMS model can include a maximum of 25 individual buildings. It is generally accepted
that building downwash effects are only likely to occur where the stack height is less than 2.5
times the building height, and the building is within 5 stack heights distance. The SELCHP
stack is 100 m high; this equates to potential downwash effects associated with buildings that
are above 40 m height, and that are within 500 m of the stack base. As a conservative
approach, all buildings above 30 m height within the Proposed Development were included.
The locations of the buildings included in the assessment are shown in Figure 14.2 (NB:
Figure 14.2 is based on the January 2011 Parameter Plans, but this has no material effect on
the assessment as the maximum build-out heights of those structures above 30 meters are
unchanged within the revised Parameter Plans, with the exception of Senegal 2 which has
increased by 2.1m to a maximum height of 43.40m AOD but this is not material to the
assessment.
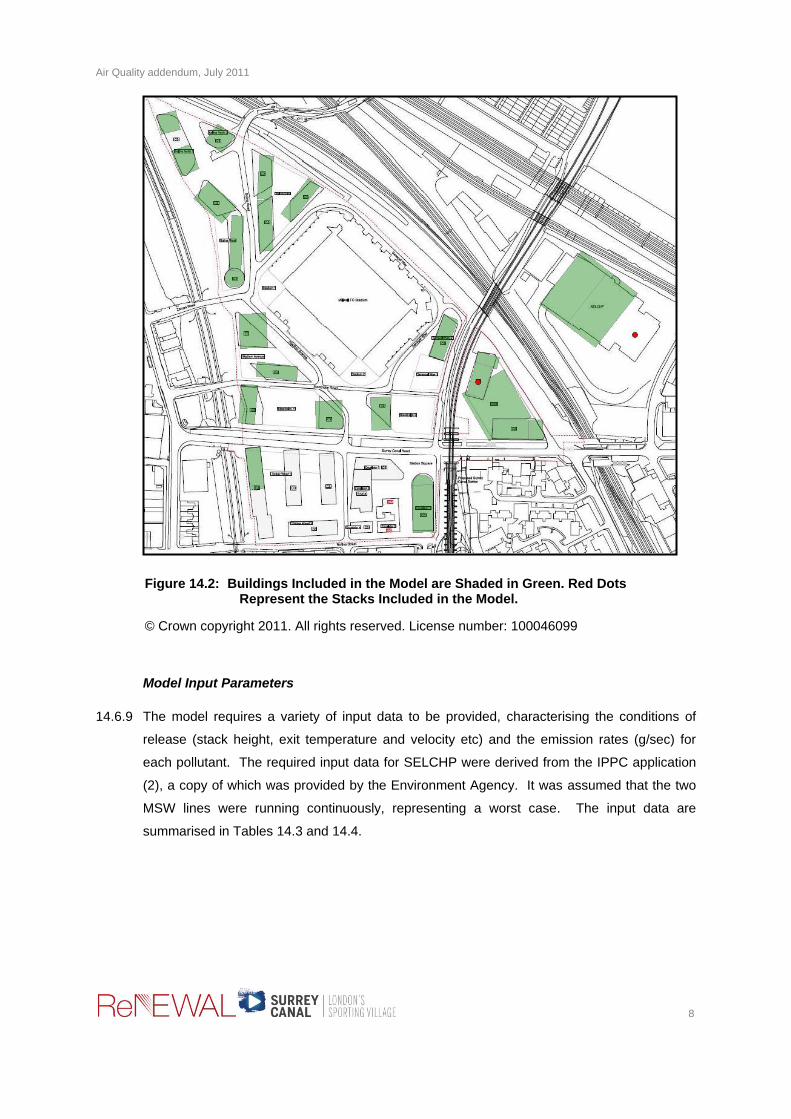
Air Quality addendum, July 2011
8
Figure 14.2: Buildings Included in the Model are Shaded in Green. Red Dots Represent the Stacks Included in the Model.
© Crown copyright 2011. All rights reserved. License number: 100046099
Model Input Parameters
14.6.9 The model requires a variety of input data to be provided, characterising the conditions of
release (stack height, exit temperature and velocity etc) and the emission rates (g/sec) for
each pollutant. The required input data for SELCHP were derived from the IPPC application
(2), a copy of which was provided by the Environment Agency. It was assumed that the two
MSW lines were running continuously, representing a worst case. The input data are
summarised in Tables 14.3 and 14.4.

Air Quality addendum, July 2011
9
Table 14.3: ADMS-4 Input Parameters – SELCHP
Temperature (°C)
Exhaust gas Exit Velocity
(m/s)
Stack diameter (m)
Stack Height (m)
160 19.1 2.97 100
Table 14.4: Emission Rates - SELCHP
Pollutant Emission Rate
Nitrogen oxides (as NO2) 16.309 g/s
Sulphur dioxide 4.077 g/s
Carbon monoxide 4.077 g/s
Particulate Matter (PM10) 0.815 g/s
Hydrogen Chloride 0.815 g/s
Hydrogen Fluoride 0.081 g/s
VOCs 0.815 g/s
Mercury 4.08 mg/s
Cadmium and Thallium 4.08 mg/s
Other Metalsb
0.041 g/s
Dioxins and Furans 8.15 ng/s a
Emission concentrations are for dry flue gas, 11% oxygen. Emission rates are corrected to the
actual flue gas conditions. b “Other Metals” are Antimony, Arsenic, Chromium, Cobalt, Copper, Lead, Manganese, Nickel,
Vanadium
14.6.10 For the “With Scheme” scenario, emissions from the Proposed Energy Centre were also
considered, so as to take account of potential cumulative effects. The input parameters for
the Energy Centre were derived, and are unchanged from, those set out in the January 2011
ES; the assessment was based on the worst-case assumption of continuous, full load
operation. It can be seen from Table 14.5 that this will have overestimated the potential
effects by a factor of about 2.5.
Table 14.5: ADMS-4 Input Parameters – Energy Centre
Weighted Temp (˚C)
a
Weighted Volume (Nm/s
3)a
Weighted Diam (m)
a
Stack Height
(m)
NOx Emission rate (g/sec)
Continuous Full Load
Operational Load
311 5.86 1.12 70.7 1.40 0.55
a Values have been weighted using the proportional volumes from each stack for the temperature,
volume and diameter.
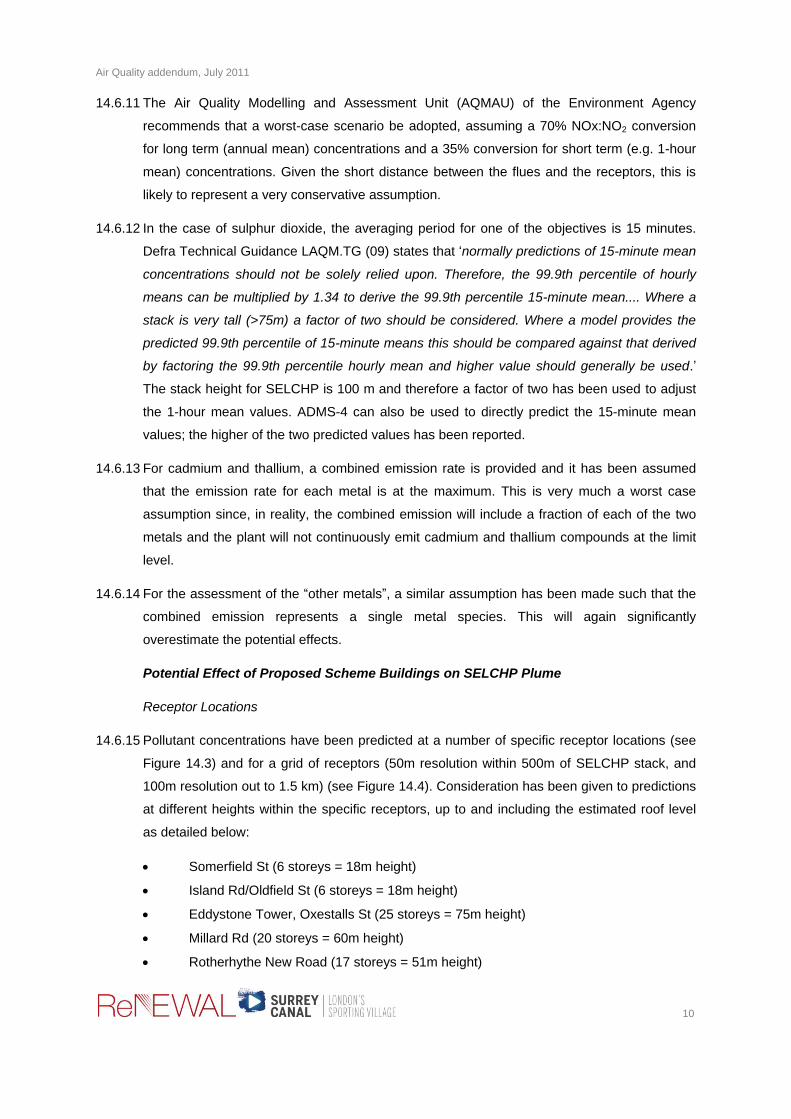
Air Quality addendum, July 2011
10
14.6.11 The Air Quality Modelling and Assessment Unit (AQMAU) of the Environment Agency
recommends that a worst-case scenario be adopted, assuming a 70% NOx:NO2 conversion
for long term (annual mean) concentrations and a 35% conversion for short term (e.g. 1-hour
mean) concentrations. Given the short distance between the flues and the receptors, this is
likely to represent a very conservative assumption.
14.6.12 In the case of sulphur dioxide, the averaging period for one of the objectives is 15 minutes.
Defra Technical Guidance LAQM.TG (09) states that „normally predictions of 15-minute mean
concentrations should not be solely relied upon. Therefore, the 99.9th percentile of hourly
means can be multiplied by 1.34 to derive the 99.9th percentile 15-minute mean.... Where a
stack is very tall (>75m) a factor of two should be considered. Where a model provides the
predicted 99.9th percentile of 15-minute means this should be compared against that derived
by factoring the 99.9th percentile hourly mean and higher value should generally be used.‟
The stack height for SELCHP is 100 m and therefore a factor of two has been used to adjust
the 1-hour mean values. ADMS-4 can also be used to directly predict the 15-minute mean
values; the higher of the two predicted values has been reported.
14.6.13 For cadmium and thallium, a combined emission rate is provided and it has been assumed
that the emission rate for each metal is at the maximum. This is very much a worst case
assumption since, in reality, the combined emission will include a fraction of each of the two
metals and the plant will not continuously emit cadmium and thallium compounds at the limit
level.
14.6.14 For the assessment of the “other metals”, a similar assumption has been made such that the
combined emission represents a single metal species. This will again significantly
overestimate the potential effects.
Potential Effect of Proposed Scheme Buildings on SELCHP Plume
Receptor Locations
14.6.15 Pollutant concentrations have been predicted at a number of specific receptor locations (see
Figure 14.3) and for a grid of receptors (50m resolution within 500m of SELCHP stack, and
100m resolution out to 1.5 km) (see Figure 14.4). Consideration has been given to predictions
at different heights within the specific receptors, up to and including the estimated roof level
as detailed below:
Somerfield St (6 storeys = 18m height)
Island Rd/Oldfield St (6 storeys = 18m height)
Eddystone Tower, Oxestalls St (25 storeys = 75m height)
Millard Rd (20 storeys = 60m height)
Rotherhythe New Road (17 storeys = 51m height)

Air Quality addendum, July 2011
11
14.6.16 The receptor grid was modelled at ground-floor level (1.5 m height). Only winds within the
180-315° sector were considered for this assessment; it is only winds arising from this
direction that could potentially be affected by downwash associated with the buildings within
the Proposed Development.
Figure 14.3: Receptor Locations – Specific Locations (SELCHP- pink star, Proposed Energy Centre – blue star)
© Crown copyright 2011. All rights reserved. License number: 100046099
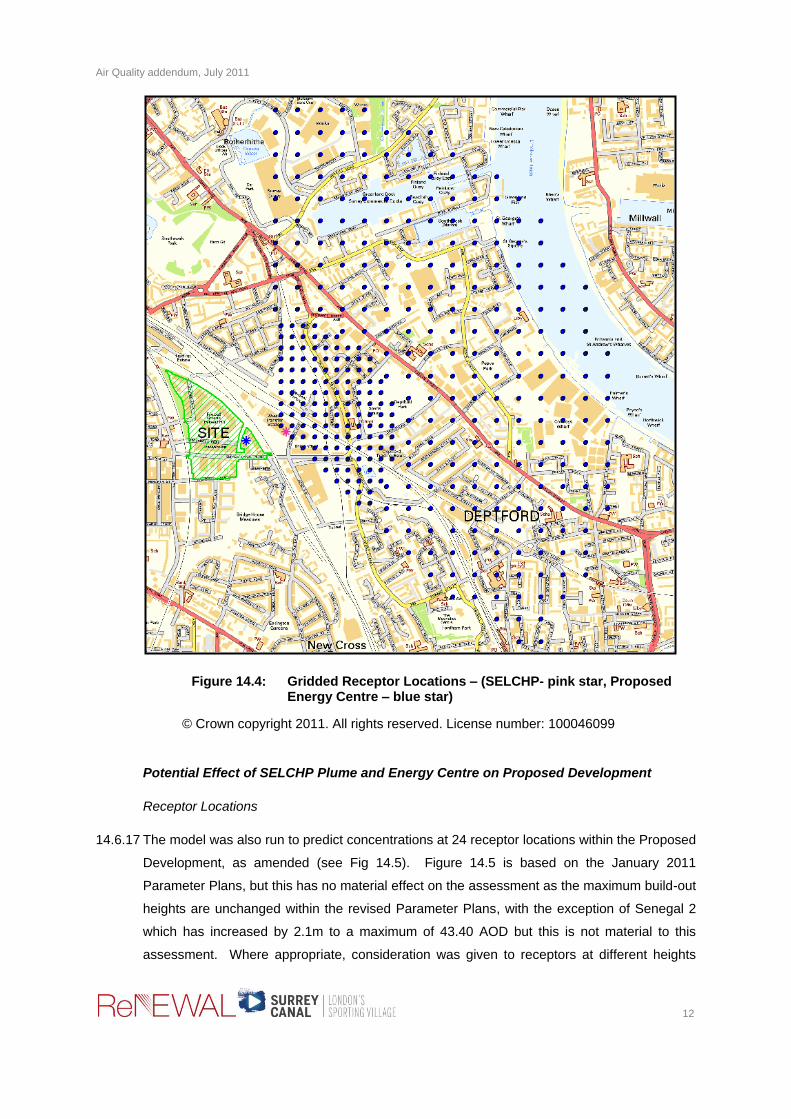
Air Quality addendum, July 2011
12
Figure 14.4: Gridded Receptor Locations – (SELCHP- pink star, Proposed Energy Centre – blue star)
© Crown copyright 2011. All rights reserved. License number: 100046099
Potential Effect of SELCHP Plume and Energy Centre on Proposed Development
Receptor Locations
14.6.17 The model was also run to predict concentrations at 24 receptor locations within the Proposed
Development, as amended (see Fig 14.5). Figure 14.5 is based on the January 2011
Parameter Plans, but this has no material effect on the assessment as the maximum build-out
heights are unchanged within the revised Parameter Plans, with the exception of Senegal 2
which has increased by 2.1m to a maximum of 43.40 AOD but this is not material to this
assessment. Where appropriate, consideration was given to receptors at different heights
Air Quality addendum, July 2011
13
within the buildings, in particular taking account of roof areas which provide residential
communal amenity space. The model was run for all wind sectors.
Figure 14.5: Receptor Locations Within Proposed Development
© Crown copyright 2011. All rights reserved. License number: 100046099
Results – Existing Receptor Locations
14.6.18 The results of the modelling study for the existing receptor locations are summarised in Table
14.6. The predicted concentrations are presented for both the “Without Scheme” and “With
Scheme” scenarios. In each case, the maximum predicted concentration at any receptor
location (both gridded and specific) is shown for the meteorological year that generated the
highest value. The location, receptor height and meteorological year that generated the
maximum predicted concentration for each metric (e.g. annual mean, 99.8th percentile of 1-
hour means etc) is described in Table 14.7.
14.6.19 It can be seen from Table 14.6 that (with the exception of nitrogen dioxide) the maximum
predicted concentrations for the “With Scheme” scenario are unchanged from those predict
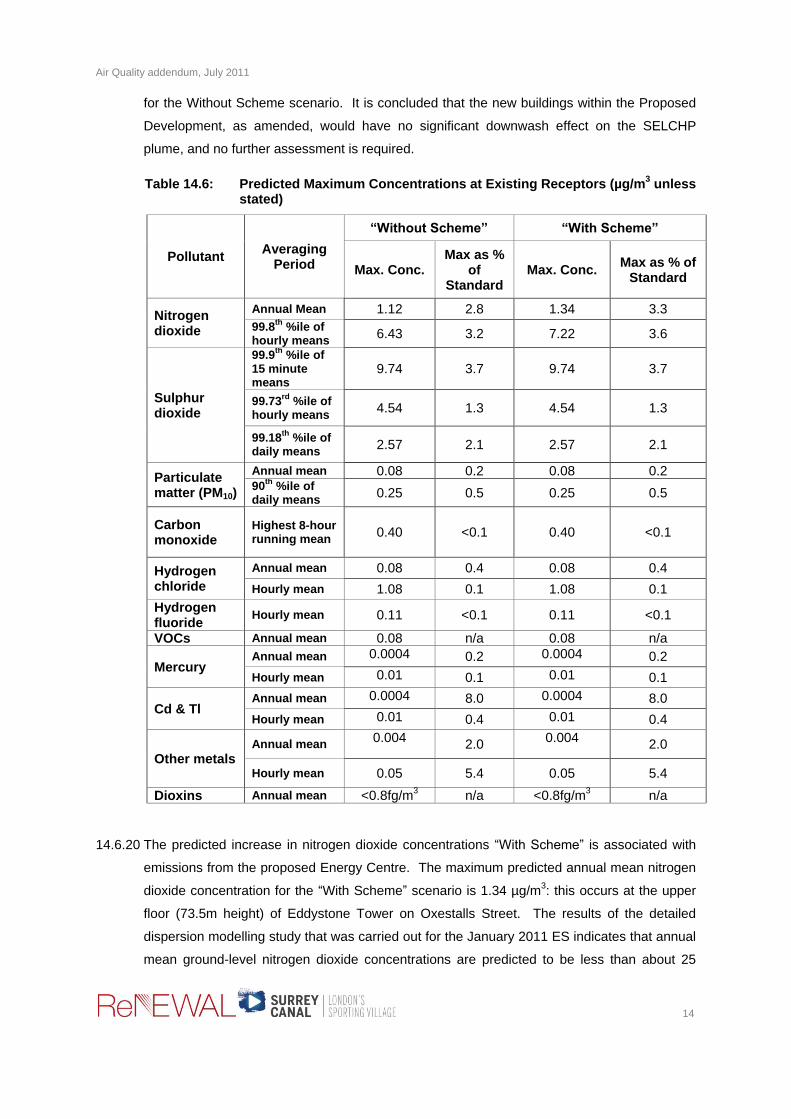
Air Quality addendum, July 2011
14
for the Without Scheme scenario. It is concluded that the new buildings within the Proposed
Development, as amended, would have no significant downwash effect on the SELCHP
plume, and no further assessment is required.
Table 14.6: Predicted Maximum Concentrations at Existing Receptors (µg/m3 unless
stated)
Pollutant Averaging
Period
“Without Scheme” “With Scheme”
Max. Conc. Max as %
of Standard
Max. Conc. Max as % of
Standard
Nitrogen dioxide
Annual Mean 1.12 2.8 1.34 3.3
99.8th
%ile of hourly means
6.43 3.2 7.22 3.6
Sulphur dioxide
99.9th
%ile of 15 minute means
9.74 3.7 9.74 3.7
99.73rd
%ile of hourly means
4.54 1.3 4.54 1.3
99.18th
%ile of daily means
2.57 2.1 2.57 2.1
Particulate matter (PM10)
Annual mean 0.08 0.2 0.08 0.2 90
th %ile of
daily means 0.25 0.5 0.25 0.5
Carbon monoxide
Highest 8-hour running mean
0.40 <0.1 0.40 <0.1
Hydrogen chloride
Annual mean 0.08 0.4 0.08 0.4
Hourly mean 1.08 0.1 1.08 0.1
Hydrogen fluoride
Hourly mean 0.11 <0.1 0.11 <0.1
VOCs Annual mean 0.08 n/a 0.08 n/a
Mercury Annual mean 0.0004 0.2 0.0004 0.2
Hourly mean 0.01 0.1 0.01 0.1
Cd & Tl Annual mean 0.0004 8.0 0.0004 8.0
Hourly mean 0.01 0.4 0.01 0.4
Other metals Annual mean
0.004 2.0
0.004 2.0
Hourly mean 0.05 5.4 0.05 5.4
Dioxins Annual mean <0.8fg/m3 n/a <0.8fg/m
3 n/a
14.6.20 The predicted increase in nitrogen dioxide concentrations “With Scheme” is associated with
emissions from the proposed Energy Centre. The maximum predicted annual mean nitrogen
dioxide concentration for the “With Scheme” scenario is 1.34 µg/m3: this occurs at the upper
floor (73.5m height) of Eddystone Tower on Oxestalls Street. The results of the detailed
dispersion modelling study that was carried out for the January 2011 ES indicates that annual
mean ground-level nitrogen dioxide concentrations are predicted to be less than about 25

Air Quality addendum, July 2011
15
µg/m3 at the worst-case locations, adjacent to major roads, in the earliest opening year of the
Proposed Development. Concentrations at the top of tall buildings will be much lower, and
are expected to be at the general urban background (less than 22 µg/m3). Even if the
combined process contributions from SELCHP and the proposed Energy Centre were added
to the background, concentrations would remain well below the objective. The predicted
annual mean nitrogen dioxide concentrations are judged to be insignificant.
14.6.21 The predicted maximum 99.8th percentile of 1-hour mean concentrations is below the
screening criteria recommended by the Environment Agency, and the effects are judged to be
insignificant.
Table 14.7: Details of Maximum Predicted Concentrations for Different Metrics at Existing Receptors
Averaging Period
Without Scheme With Scheme
Grid Ref Height (m) Met. Year Grid Ref Height (m) Met. Year
Annual Mean 536458.88, 178482.41
73.5 2008 536458.88, 178482.41
73.5 2008
99.8th
%ile of hourly means
535605.5, 178769.0
49.5 2008 536302.5, 177930.5
1.5 2009
99.9th
%ile of 15 minute means
536302.5, 177930.5
1.5 2009 536302.5, 177930.5
1.5 2009
99.73rd
%ile of hourly means
535605.5, 178769.0
49.5 2008 535605.5, 178769.0
49.5 2008
99.18th
%ile of daily means
535605.5, 178769.0
49.5 2006 535605.5, 178769.0
49.5 2006
90th
%ile of daily means
536458.88, 178482.41
73.5 2008 536458.88, 178482.41
73.5 2008
Highest 8-hour running mean
536458.88, 178482.41
73.5 2008 536458.88, 178482.41
73.5 2008
Hourly mean 536227.5, 177955.5
1.5 2007 536227.5, 177955.5
1.5 2007
Results – Receptor Locations Within the Proposed Development
14.6.22 The results of the modelling study for the new receptor locations within the Proposed
Development, as amended, are summarised in Table 14.8. In each case, the maximum
predicted concentration at any receptor location is shown for the meteorological year that
generated the highest value. The location, receptor height and meteorological year that
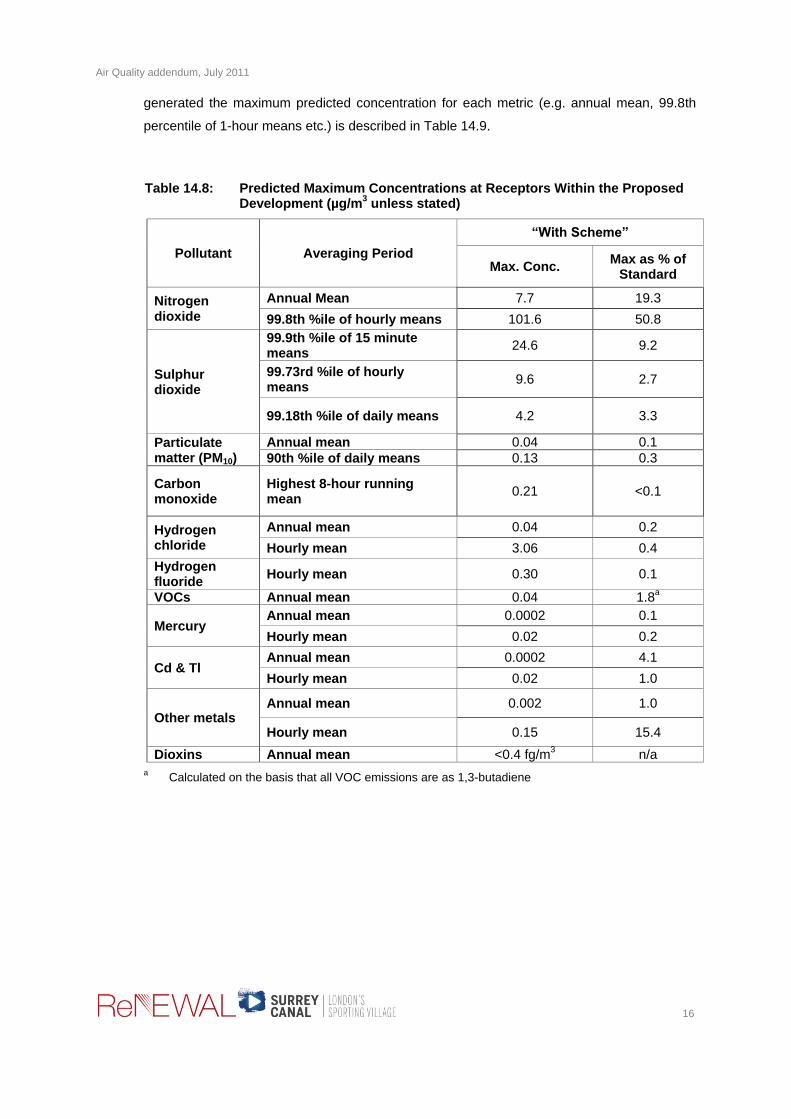
Air Quality addendum, July 2011
16
generated the maximum predicted concentration for each metric (e.g. annual mean, 99.8th
percentile of 1-hour means etc.) is described in Table 14.9.
Table 14.8: Predicted Maximum Concentrations at Receptors Within the Proposed Development (µg/m
3 unless stated)
Pollutant Averaging Period
“With Scheme”
Max. Conc. Max as % of
Standard
Nitrogen dioxide
Annual Mean 7.7 19.3
99.8th %ile of hourly means 101.6 50.8
Sulphur dioxide
99.9th %ile of 15 minute means
24.6 9.2
99.73rd %ile of hourly means
9.6 2.7
99.18th %ile of daily means 4.2 3.3
Particulate matter (PM10)
Annual mean 0.04 0.1
90th %ile of daily means 0.13 0.3
Carbon monoxide
Highest 8-hour running mean
0.21 <0.1
Hydrogen chloride
Annual mean 0.04 0.2
Hourly mean 3.06 0.4
Hydrogen fluoride
Hourly mean 0.30 0.1
VOCs Annual mean 0.04 1.8a
Mercury Annual mean 0.0002 0.1
Hourly mean 0.02 0.2
Cd & Tl Annual mean 0.0002 4.1
Hourly mean 0.02 1.0
Other metals Annual mean 0.002 1.0
Hourly mean 0.15 15.4
Dioxins Annual mean <0.4 fg/m3 n/a
a Calculated on the basis that all VOC emissions are as 1,3-butadiene

Air Quality addendum, July 2011
17
Table 14.9: Details of Maximum Predicted Concentrations For Different Metrics at Receptors Within the Proposed Development
Averaging Period
With Scheme
Receptor Location Height Met. Year
Annual Mean 17 535516.56, 177936.05
71.29 2010
99.8th %ile of hourly means
15 535474.0, 178010.0
74.3 2006
99.9th %ile of 15 minute means
15 535474.0, 178010.0
74.3 2008
99.73rd %ile of hourly means
21 535421.94, 177999.55
74.17 2009
99.18th %ile of daily means
15 535474.0, 178010.0
74.3 2009
90th %ile of daily means
15 535474.0, 178010.0
74.3 2008
Highest 8-hour running mean
15 535474.0, 178010.0
74.3 2008
Hourly mean 15 535474.0, 178010.0
74.3 2008
14.6.23 The maximum predicted annual mean nitrogen dioxide concentration is 7.7 µg/m3: this occurs
at 71.3 m height at Excelsior 3. This exceeds the Environment Agency‟s screening criterion
(1% of the annual mean objective, or 0.4 µg/m3). The results of the detailed dispersion
modelling study that was carried out for the January 2011 ES indicate that annual mean
ground-level nitrogen dioxide concentrations are predicted to be less than about 25 µg/m3 at
the worst-case locations, adjacent to major roads, in the earliest opening year of the
Proposed Development. Concentrations at the top of tall buildings will be much lower, and
are expected to be at the general urban background (less than 22 µg/m3). Even if the
combined process contributions from SELCHP and the proposed Energy Centre were added
to the background, concentrations would remain well below the objective. The predicted
annual mean nitrogen dioxide concentrations are judged to be insignificant.
14.6.24 The maximum predicted 99.8th percentile of 1-hour mean nitrogen dioxide concentrations is
101.6 µg/m3 which occurs at 74.3m height at Stockholm 2. This exceeds the Environment
Agency‟s screening criterion (10% of the 1-hour mean objective, i.e. 20 µg/m3). It is not
appropriate to add the predicted 99.8th percentile from a process to the 99.8
th percentile
background as they will not occur at the same time. The approach recommended in
Air Quality addendum, July 2011
18
LAQM.TG(09) has therefore been used, using the assumptions as described in the January
2011 ES. The predicted 99.8th percentile of 1-hour mean nitrogen dioxide concentrations at
the worst-case receptor is 184.4 µg/m3. This is below the objective and is based on the
assumption of full load, continuous operation of the proposed Energy Centre which will have
substantially overestimated the predicted concentrations. It is concluded that the effects are
insignificant.
14.6.25 For VOCs, the highest predicted annual mean concentration is 0.04 µg/m3. If this is assumed
to be all as 1,3-butadiene, it would represent only 1.8% of the environmental standard. In
reality, only a small fraction of the VOCs emitted from SELCHP will be as 1,3-butadiene. In
addition, the predicted concentration at any receptor within the Proposed Development is
lower than for any existing receptor (see Table 14.4). It is concluded that any effects are
insignificant.
14.6.26 For cadmium and thallium combined, the highest predicted annual mean concentration is
0.0002 µg/m3. If this is assumed to be all as cadmium, it would represent only 4.1% of the
environmental standard. In reality, the SELCHP plant will not emit cadmium at the limit value.
In addition, the predicted concentration within any receptor at the Proposed Development is
lower than for any existing receptor (see Table 13.4). It is concluded that any effects are
insignificant.
14.6.27 For the other metals combined, the highest predicted annual mean concentration is 0.002
µg/m3. If this is assumed to be all as arsenic, it would represent 66% of the environmental
standard. In reality, the SELCHP plant will not emit arsenic at the limit value, and recent
guidance issued by the Environment Agency (3) suggests that in-stack arsenic concentrations
from municipal waste incineration plant are highly unlikely to exceed 0.033 mg/m3 (about
0.6% of the emission limit). If this factor is used to scale the emissions, the predicted
concentrations are below the screening criteria recommended by the Environment Agency. In
addition, the predicted concentration at any receptor within the Proposed Development is
lower than for any existing receptor (see Table 13.4). It is concluded that any effects are
insignificant.
14.6.28 Emissions of chromium VI need to be considered separately. The Environment Agency also
advise that no more than about 2% of chromium released from municipal waste incineration
plant will be as chromium VI. If it is assumed that SELCHP operated at its limit for the other
metals, but only released chromium, the maximum annual mean concentration of chromium
VI would be 0.00004 µg/m3 and the maximum hourly concentration would be 0.0003 µg/m
3.
These concentrations are well below the screening criteria recommended by the Environment
Agency and any effects would be insignificant.