key statistics - indian railway · key statistics (1970-71 to 2012 indian railways सयमेव...
TRANSCRIPT
KEY STATISTICS(1970-71 TO 2012
INDIAN RAILWAYS
स�यमेव जयते
Bharat Sarkar Government of India
Rail MantralayaMinistry of Railways
(Railway Board)
DIRECTORATE OF STATISTICS AND ECONOMICS
KEY STATISTICS71 TO 2012-13)
INDIAN RAILWAYS
स�यमेव जयते
Bharat Sarkar Government of India
Rail MantralayaMinistry of Railways
(Railway Board)
DIRECTORATE OF STATISTICS AND ECONOMICS
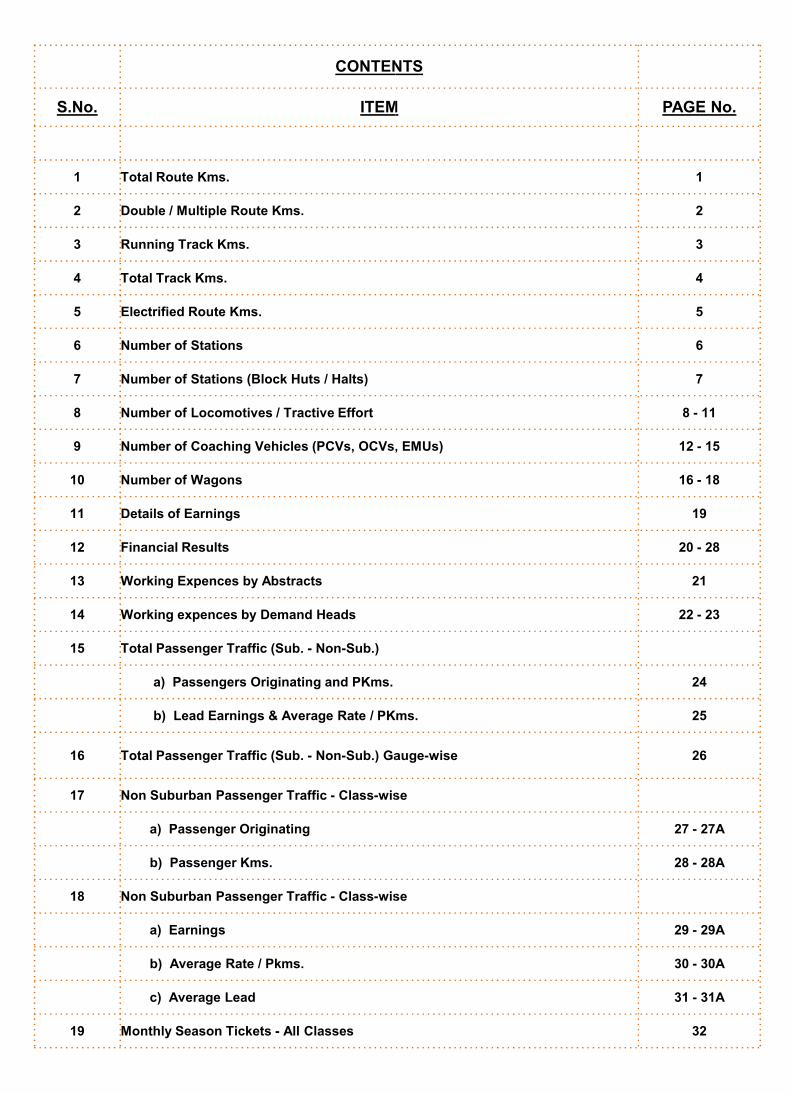
CONTENTS
S.No. ITEM
1 Total Route Kms.
2 Double / Multiple Route Kms.
3 Running Track Kms.
4 Total Track Kms.
5 Electrified Route Kms.
6 Number of Stations
7 Number of Stations (Block Huts / Halts)
8 Number of Locomotives / Tractive Effort
9 Number of Coaching Vehicles (PCVs, OCVs, EMUs)
10 Number of Wagons
11 Details of Earnings
12 Financial Results12 Financial Results
13 Working Expences by Abstracts
14 Working expences by Demand Heads
15 Total Passenger Traffic (Sub. - Non-Sub.)
a) Passengers Originating and PKms.
b) Lead Earnings & Average Rate / PKms.
16 Total Passenger Traffic (Sub. - Non-Sub.) Gauge
17 Non Suburban Passenger Traffic - Class-wise
a) Passenger Originating
b) Passenger Kms.
18 Non Suburban Passenger Traffic - Class-wise
a) Earnings
b) Average Rate / Pkms.
c) Average Lead
19 Monthly Season Tickets - All Classes
CONTENTS
ITEM PAGE No.
1
2
3
4
5
6
7
8 - 11
Number of Coaching Vehicles (PCVs, OCVs, EMUs) 12 - 15
16 - 18
19
20 - 2820 - 28
21
22 - 23
24
b) Lead Earnings & Average Rate / PKms. 25
Sub.) Gauge-wise 26
wise
27 - 27A
28 - 28A
wise
29 - 29A
30 - 30A
31 - 31A
32
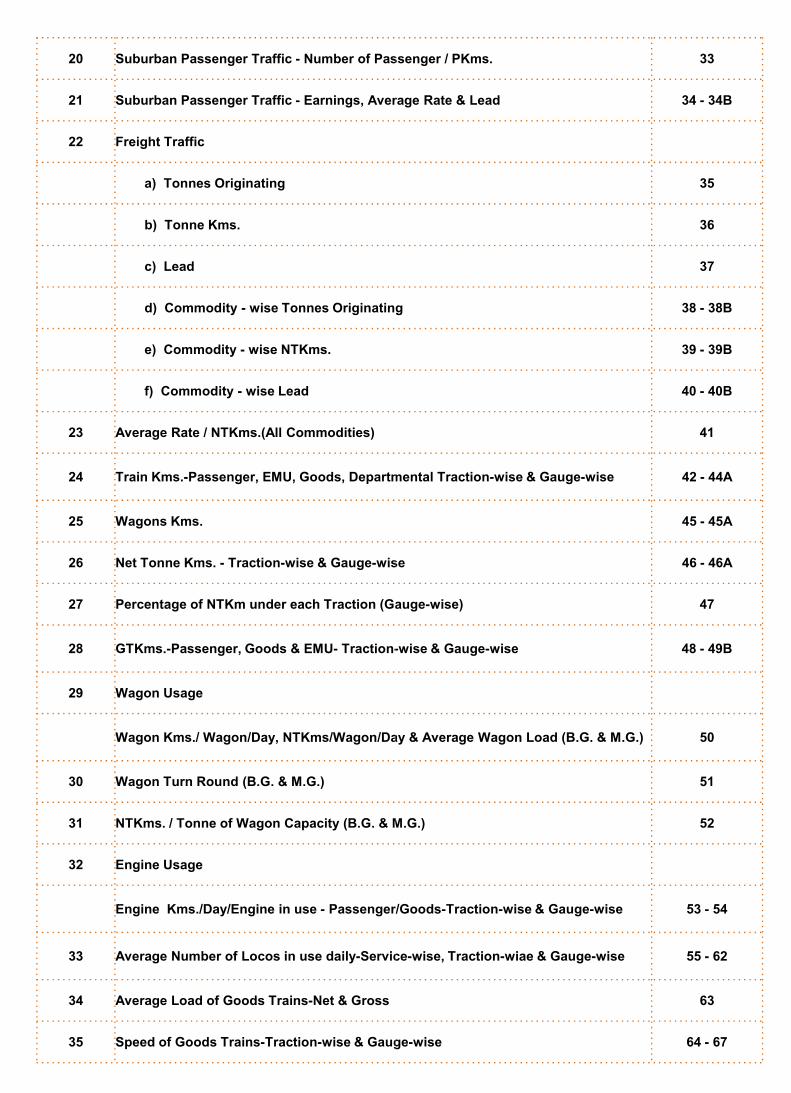
20 Suburban Passenger Traffic - Number of Passenger /
21 Suburban Passenger Traffic - Earnings, Average Rate & Lead
22 Freight Traffic
a) Tonnes Originating
b) Tonne Kms.
c) Lead
d) Commodity - wise Tonnes Originating
e) Commodity - wise NTKms.
f) Commodity - wise Lead
23 Average Rate / NTKms.(All Commodities)
24 Train Kms.-Passenger, EMU, Goods, Departmental Traction
25 Wagons Kms.
26 Net Tonne Kms. - Traction-wise & Gauge-wise
27 Percentage of NTKm under each Traction (Gauge
28 GTKms.-Passenger, Goods & EMU- Traction-
29 Wagon Usage
Wagon Kms./ Wagon/Day, NTKms/Wagon/Day & Average Wagon Load (B.G. & M.G.)
30 Wagon Turn Round (B.G. & M.G.)
31 NTKms. / Tonne of Wagon Capacity (B.G. & M.G.)
32 Engine Usage
Engine Kms./Day/Engine in use - Passenger/Goods
33 Average Number of Locos in use daily-Service
34 Average Load of Goods Trains-Net & Gross
35 Speed of Goods Trains-Traction-wise & Gauge
Number of Passenger / PKms. 33
Earnings, Average Rate & Lead 34 - 34B
35
36
37
wise Tonnes Originating 38 - 38B
39 - 39B
40 - 40B
41
Passenger, EMU, Goods, Departmental Traction-wise & Gauge-wise 42 - 44A
45 - 45A
wise 46 - 46A
Percentage of NTKm under each Traction (Gauge-wise) 47
-wise & Gauge-wise 48 - 49B
Wagon Kms./ Wagon/Day, NTKms/Wagon/Day & Average Wagon Load (B.G. & M.G.) 50
51
NTKms. / Tonne of Wagon Capacity (B.G. & M.G.) 52
Passenger/Goods-Traction-wise & Gauge-wise 53 - 54
Service-wise, Traction-wiae & Gauge-wise 55 - 62
63
wise & Gauge-wise 64 - 67
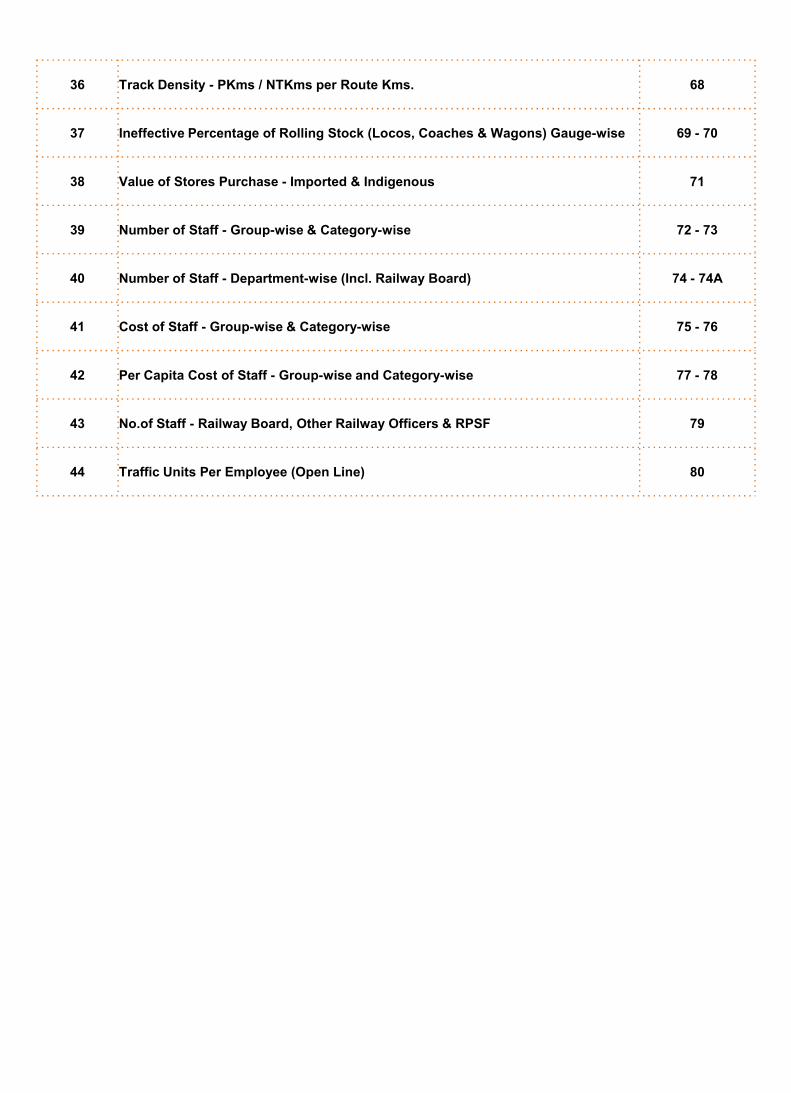
36 Track Density - PKms / NTKms per Route Kms.
37 Ineffective Percentage of Rolling Stock (Locos, Coaches & Wagons) Gauge
38 Value of Stores Purchase - Imported & Indigenous
39 Number of Staff - Group-wise & Category-wise
40 Number of Staff - Department-wise (Incl. Railway Board)
41 Cost of Staff - Group-wise & Category-wise
42 Per Capita Cost of Staff - Group-wise and Category
43 No.of Staff - Railway Board, Other Railway Officers & RPSF
44 Traffic Units Per Employee (Open Line)
PKms / NTKms per Route Kms. 68
Ineffective Percentage of Rolling Stock (Locos, Coaches & Wagons) Gauge-wise 69 - 70
Imported & Indigenous 71
wise 72 - 73
wise (Incl. Railway Board) 74 - 74A
75 - 76
wise and Category-wise 77 - 78
Railway Board, Other Railway Officers & RPSF 79
80
-1-
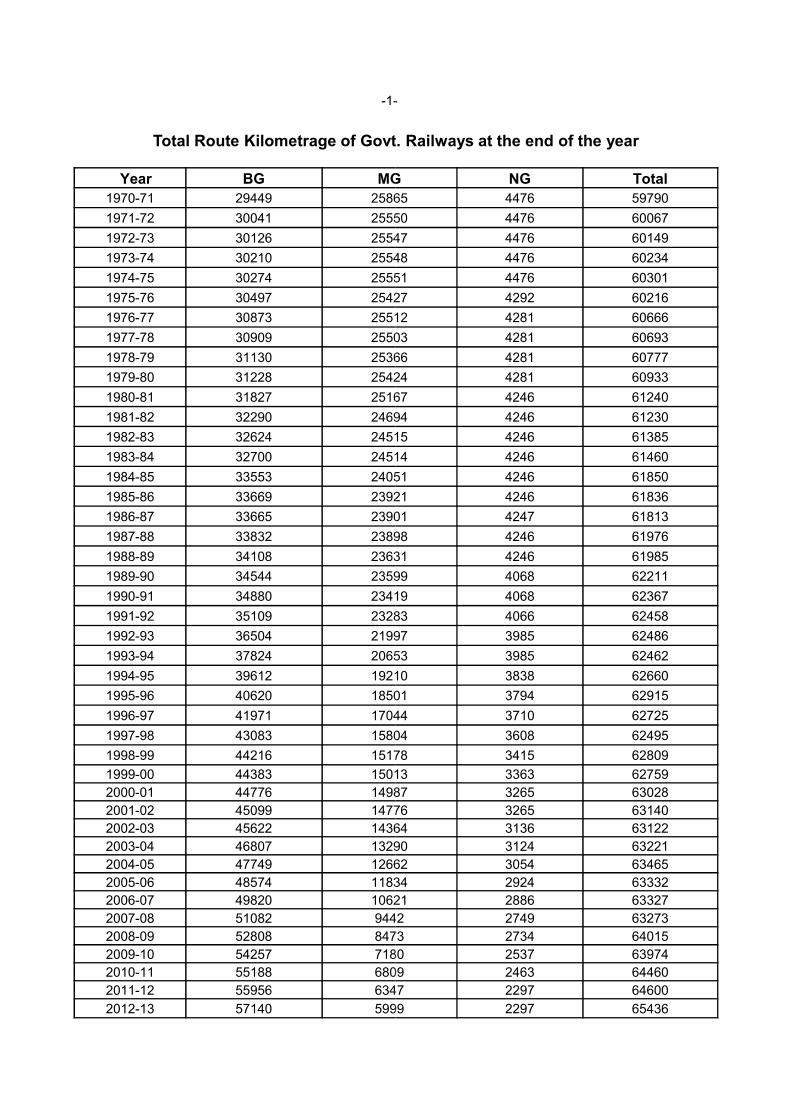
Total Route Kilometrage of Govt. Railways at the end of the year
Year BG MG
1970-71 29449 25865
1971-72 30041 25550
1972-73 30126 25547
1973-74 30210 25548
1974-75 30274 25551
1975-76 30497 25427
1976-77 30873 25512
1977-78 30909 25503
1978-79 31130 25366
1979-80 31228 25424
1980-81 31827 25167
1981-82 32290 24694
1982-83 32624 24515
1983-84 32700 24514
1984-85 33553 24051
1985-86 33669 23921
1986-87 33665 23901
1987-88 33832 23898
1988-89 34108 23631
1989-90 34544 23599
1990-91 34880 23419
1991-92 35109 23283
1992-93 36504 21997
1993-94 37824 20653
1994-95 39612 19210
1995-96 40620 18501
1996-97 41971 17044
1997-98 43083 15804
1998-99 44216 15178
1999-00 44383 15013
2000-01 44776 14987
2001-02 45099 14776
2002-03 45622 14364
2003-04 46807 13290
2004-05 47749 12662
2005-06 48574 11834
2006-07 49820 10621
2007-08 51082 9442
2008-09 52808 8473
2009-10 54257 7180
2010-11 55188 6809
2011-12 55956 6347
2012-13 57140 5999
-
of Govt. Railways at the end of the year
MG NG Total
25865 4476 59790
25550 4476 60067
25547 4476 60149
25548 4476 60234
25551 4476 60301
25427 4292 60216
25512 4281 60666
25503 4281 60693
25366 4281 60777
25424 4281 60933
25167 4246 61240
24694 4246 61230
24515 4246 61385
24514 4246 61460
24051 4246 61850
23921 4246 61836
23901 4247 61813
23898 4246 61976
23631 4246 61985
23599 4068 62211
23419 4068 62367
23283 4066 62458
21997 3985 62486
20653 3985 62462
19210 3838 62660
18501 3794 62915
17044 3710 62725
15804 3608 62495
15178 3415 62809
15013 3363 62759
14987 3265 63028
14776 3265 63140
14364 3136 63122
13290 3124 63221
12662 3054 63465
11834 2924 63332
10621 2886 63327
9442 2749 63273
8473 2734 64015
7180 2537 63974
6809 2463 64460
6347 2297 64600
5999 2297 65436
-2
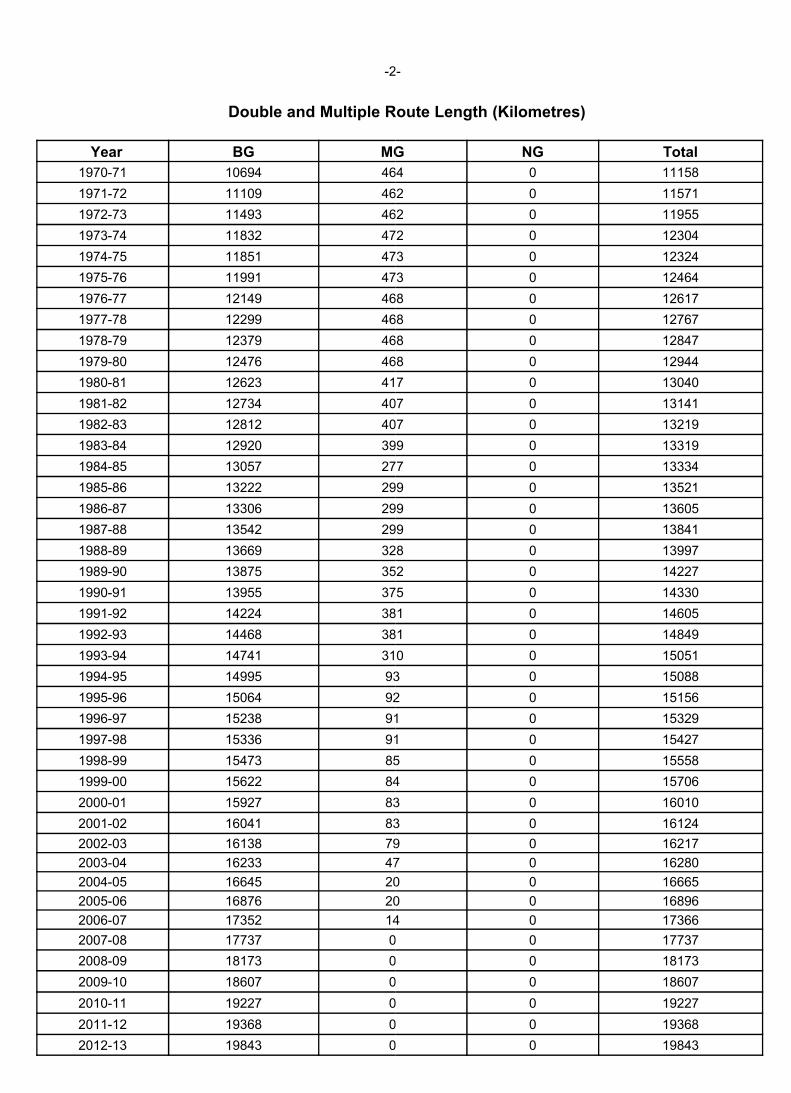
Double and Multiple Route Length (Kilometres)
Year BG MG
1970-71 10694 464
1971-72 11109 462
1972-73 11493 462
1973-74 11832 472
1974-75 11851 473
1975-76 11991 473
1976-77 12149 468
1977-78 12299 468
1978-79 12379 468
1979-80 12476 468
1980-81 12623 417
1981-82 12734 407
1982-83 12812 407
1983-84 12920 399
1984-85 13057 277
1985-86 13222 299
1986-87 13306 299
1987-88 13542 299
1988-89 13669 3281988-89 13669 328
1989-90 13875 352
1990-91 13955 375
1991-92 14224 381
1992-93 14468 381
1993-94 14741 310
1994-95 14995 93
1995-96 15064 92
1996-97 15238 91
1997-98 15336 91
1998-99 15473 85
1999-00 15622 84
2000-01 15927 83
2001-02 16041 83
2002-03 16138 79
2003-04 16233 47
2004-05 16645 20
2005-06 16876 20
2006-07 17352 14
2007-08 17737 0
2008-09 18173 0
2009-10 18607 0
2010-11 19227 0
2011-12 19368 0
2012-13 19843 0
2-
Double and Multiple Route Length (Kilometres)
MG NG Total
464 0 11158
462 0 11571
462 0 11955
472 0 12304
473 0 12324
473 0 12464
468 0 12617
468 0 12767
468 0 12847
468 0 12944
417 0 13040
407 0 13141
407 0 13219
399 0 13319
277 0 13334
299 0 13521
299 0 13605
299 0 13841
328 0 13997328 0 13997
352 0 14227
375 0 14330
381 0 14605
381 0 14849
310 0 15051
93 0 15088
92 0 15156
91 0 15329
91 0 15427
85 0 15558
84 0 15706
83 0 16010
83 0 16124
79 0 16217
47 0 16280
20 0 16665
20 0 16896
14 0 17366
0 0 17737
0 0 18173
0 0 18607
0 0 19227
0 0 19368
0 0 19843
-3
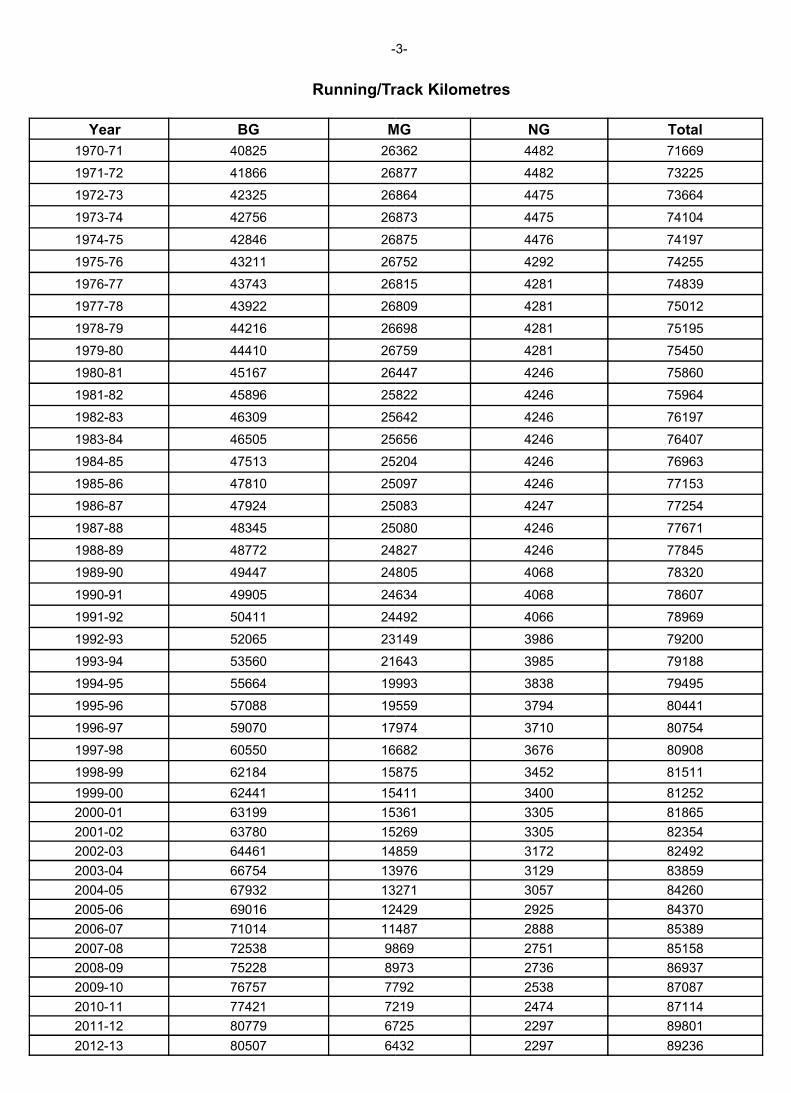
Running/Track Kilometres
Year BG MG
1970-71 40825 26362
1971-72 41866 26877
1972-73 42325 26864
1973-74 42756 26873
1974-75 42846 26875
1975-76 43211 26752
1976-77 43743 26815
1977-78 43922 26809
1978-79 44216 26698
1979-80 44410 26759
1980-81 45167 26447
1981-82 45896 25822
1982-83 46309 25642
1983-84 46505 25656
1984-85 47513 25204
1985-86 47810 25097
1986-87 47924 25083
1987-88 48345 25080
1988-89 48772 248271988-89 48772 24827
1989-90 49447 24805
1990-91 49905 24634
1991-92 50411 24492
1992-93 52065 23149
1993-94 53560 21643
1994-95 55664 19993
1995-96 57088 19559
1996-97 59070 17974
1997-98 60550 16682
1998-99 62184 15875
1999-00 62441 15411
2000-01 63199 15361
2001-02 63780 15269
2002-03 64461 14859
2003-04 66754 13976
2004-05 67932 13271
2005-06 69016 12429
2006-07 71014 11487
2007-08 72538 9869
2008-09 75228 8973
2009-10 76757 7792
2010-11 77421 7219
2011-12 80779 6725
2012-13 80507 6432
3-
Running/Track Kilometres
MG NG Total
26362 4482 71669
26877 4482 73225
26864 4475 73664
26873 4475 74104
26875 4476 74197
26752 4292 74255
26815 4281 74839
26809 4281 75012
26698 4281 75195
26759 4281 75450
26447 4246 75860
25822 4246 75964
25642 4246 76197
25656 4246 76407
25204 4246 76963
25097 4246 77153
25083 4247 77254
25080 4246 77671
24827 4246 7784524827 4246 77845
24805 4068 78320
24634 4068 78607
24492 4066 78969
23149 3986 79200
21643 3985 79188
19993 3838 79495
19559 3794 80441
17974 3710 80754
16682 3676 80908
15875 3452 81511
15411 3400 81252
15361 3305 81865
15269 3305 82354
14859 3172 82492
13976 3129 83859
13271 3057 84260
12429 2925 84370
11487 2888 85389
9869 2751 85158
8973 2736 86937
7792 2538 87087
7219 2474 87114
6725 2297 89801
6432 2297 89236
-4
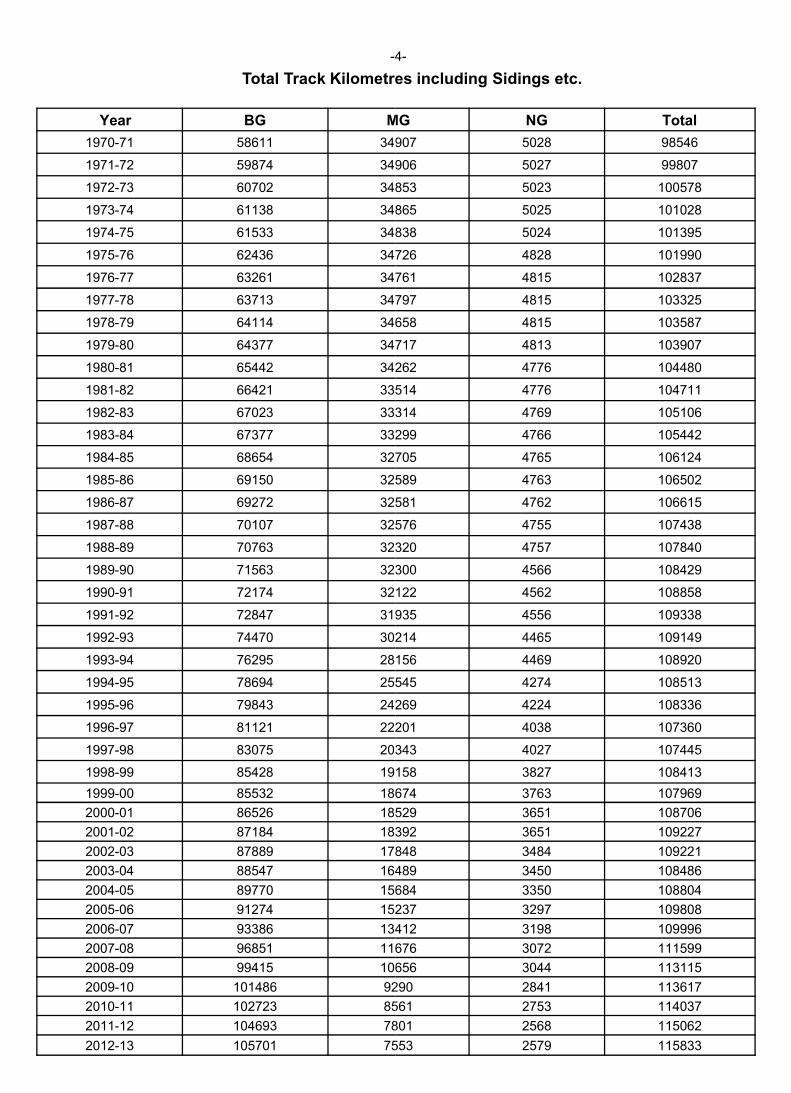
Total Track Kilometres including Sidings etc.
Year BG MG
1970-71 58611 34907
1971-72 59874 34906
1972-73 60702 34853
1973-74 61138 34865
1974-75 61533 34838
1975-76 62436 34726
1976-77 63261 34761
1977-78 63713 34797
1978-79 64114 34658
1979-80 64377 34717
1980-81 65442 34262
1981-82 66421 33514
1982-83 67023 33314
1983-84 67377 33299
1984-85 68654 32705
1985-86 69150 32589
1986-87 69272 32581
1987-88 70107 32576
1988-89 70763 323201988-89 70763 32320
1989-90 71563 32300
1990-91 72174 32122
1991-92 72847 31935
1992-93 74470 30214
1993-94 76295 28156
1994-95 78694 25545
1995-96 79843 24269
1996-97 81121 22201
1997-98 83075 20343
1998-99 85428 19158
1999-00 85532 18674
2000-01 86526 18529
2001-02 87184 18392
2002-03 87889 17848
2003-04 88547 16489
2004-05 89770 15684
2005-06 91274 15237
2006-07 93386 13412
2007-08 96851 11676
2008-09 99415 10656
2009-10 101486 9290
2010-11 102723 8561
2011-12 104693 7801
2012-13 105701 7553
4-
Total Track Kilometres including Sidings etc.
MG NG Total
34907 5028 98546
34906 5027 99807
34853 5023 100578
34865 5025 101028
34838 5024 101395
34726 4828 101990
34761 4815 102837
34797 4815 103325
34658 4815 103587
34717 4813 103907
34262 4776 104480
33514 4776 104711
33314 4769 105106
33299 4766 105442
32705 4765 106124
32589 4763 106502
32581 4762 106615
32576 4755 107438
32320 4757 10784032320 4757 107840
32300 4566 108429
32122 4562 108858
31935 4556 109338
30214 4465 109149
28156 4469 108920
25545 4274 108513
24269 4224 108336
22201 4038 107360
20343 4027 107445
19158 3827 108413
18674 3763 107969
18529 3651 108706
18392 3651 109227
17848 3484 109221
16489 3450 108486
15684 3350 108804
15237 3297 109808
13412 3198 109996
11676 3072 111599
10656 3044 113115
9290 2841 113617
8561 2753 114037
7801 2568 115062
7553 2579 115833
-
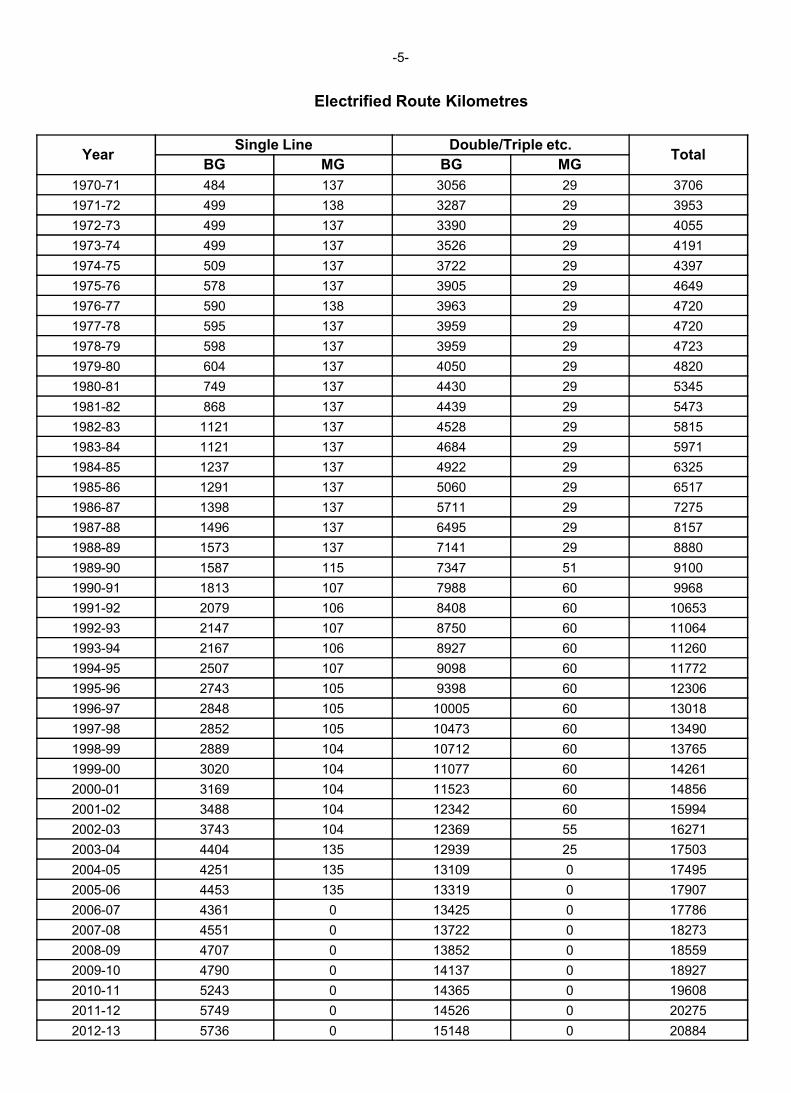
Electrified Route Kilometres
YearSingle Line
BG MG
1970-71 484 137
1971-72 499 138
1972-73 499 137
1973-74 499 137
1974-75 509 137
1975-76 578 137
1976-77 590 138
1977-78 595 137
1978-79 598 137
1979-80 604 137
1980-81 749 137
1981-82 868 137
1982-83 1121 137
1983-84 1121 137
1984-85 1237 137
1985-86 1291 137
1986-87 1398 137
1987-88 1496 137
1988-89 1573 1371988-89 1573 137
1989-90 1587 115
1990-91 1813 107
1991-92 2079 106
1992-93 2147 107
1993-94 2167 106
1994-95 2507 107
1995-96 2743 105
1996-97 2848 105
1997-98 2852 105
1998-99 2889 104
1999-00 3020 104
2000-01 3169 104
2001-02 3488 104
2002-03 3743 104
2003-04 4404 135
2004-05 4251 135
2005-06 4453 135
2006-07 4361 0
2007-08 4551 0
2008-09 4707 0
2009-10 4790 0
2010-11 5243 0
2011-12 5749 0
2012-13 5736 0
-5-
Electrified Route Kilometres
Double/Triple etc.Total
BG MG
3056 29 3706
3287 29 3953
3390 29 4055
3526 29 4191
3722 29 4397
3905 29 4649
3963 29 4720
3959 29 4720
3959 29 4723
4050 29 4820
4430 29 5345
4439 29 5473
4528 29 5815
4684 29 5971
4922 29 6325
5060 29 6517
5711 29 7275
6495 29 8157
7141 29 88807141 29 8880
7347 51 9100
7988 60 9968
8408 60 10653
8750 60 11064
8927 60 11260
9098 60 11772
9398 60 12306
10005 60 13018
10473 60 13490
10712 60 13765
11077 60 14261
11523 60 14856
12342 60 15994
12369 55 16271
12939 25 17503
13109 0 17495
13319 0 17907
13425 0 17786
13722 0 18273
13852 0 18559
14137 0 18927
14365 0 19608
14526 0 20275
15148 0 20884
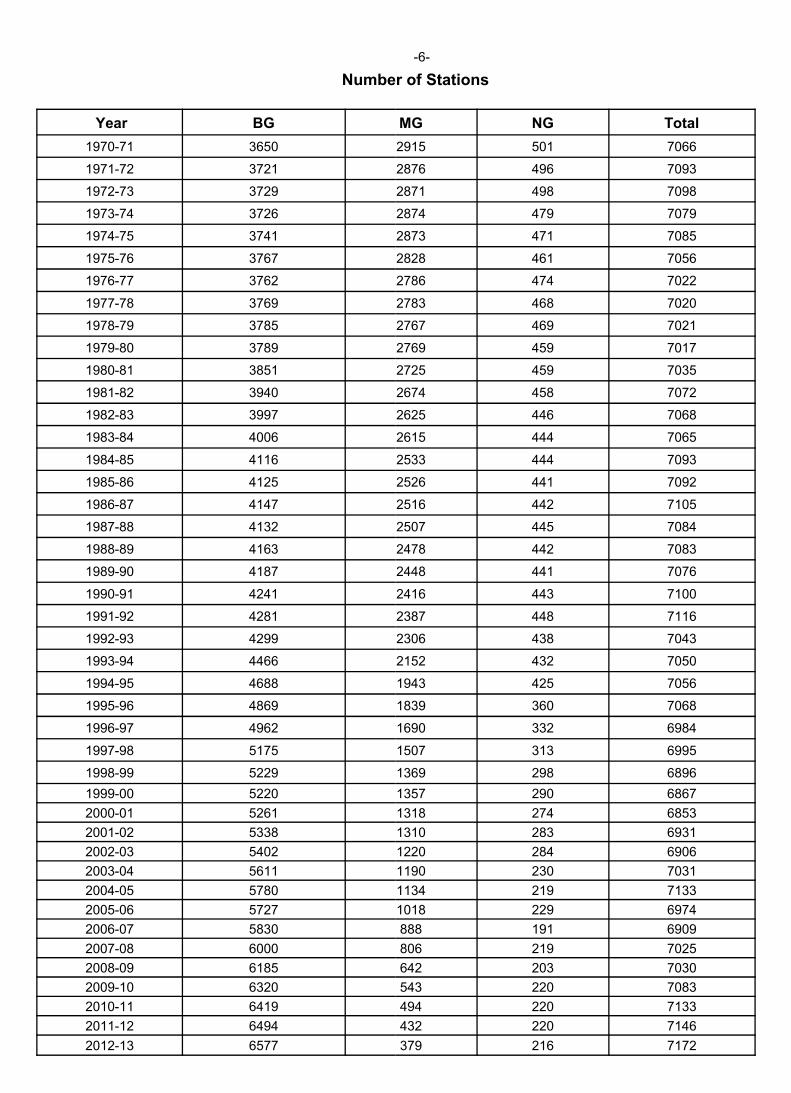
Number of Stations
Year BG
1970-71 3650
1971-72 3721
1972-73 3729
1973-74 3726
1974-75 3741
1975-76 3767
1976-77 3762
1977-78 3769
1978-79 3785
1979-80 3789
1980-81 3851
1981-82 3940
1982-83 3997
1983-84 4006
1984-85 4116
1985-86 4125
1986-87 4147
1987-88 4132
1988-89 41631988-89 4163
1989-90 4187
1990-91 4241
1991-92 4281
1992-93 4299
1993-94 4466
1994-95 4688
1995-96 4869
1996-97 4962
1997-98 5175
1998-99 5229
1999-00 5220
2000-01 5261
2001-02 5338
2002-03 5402
2003-04 5611
2004-05 5780
2005-06 5727
2006-07 5830
2007-08 6000
2008-09 6185
2009-10 6320
2010-11 6419
2011-12 6494
2012-13 6577
-6-
Number of Stations
MG NG Total
2915 501 7066
2876 496 7093
2871 498 7098
2874 479 7079
2873 471 7085
2828 461 7056
2786 474 7022
2783 468 7020
2767 469 7021
2769 459 7017
2725 459 7035
2674 458 7072
2625 446 7068
2615 444 7065
2533 444 7093
2526 441 7092
2516 442 7105
2507 445 7084
2478 442 70832478 442 7083
2448 441 7076
2416 443 7100
2387 448 7116
2306 438 7043
2152 432 7050
1943 425 7056
1839 360 7068
1690 332 6984
1507 313 6995
1369 298 6896
1357 290 6867
1318 274 6853
1310 283 6931
1220 284 6906
1190 230 7031
1134 219 7133
1018 229 6974
888 191 6909
806 219 7025
642 203 7030
543 220 7083
494 220 7133
432 220 7146
379 216 7172
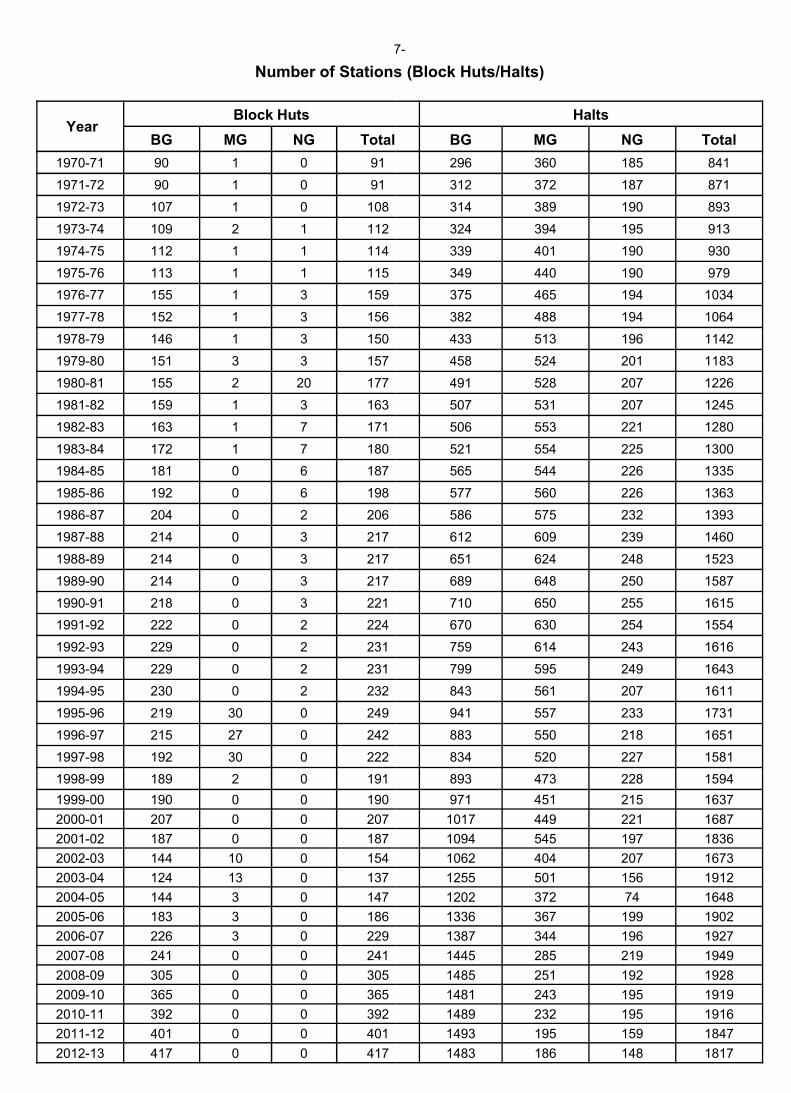
7
Number of Stations (Block Huts/Halts)
YearBlock Huts
BG MG NG Total
1970-71 90 1 0 91
1971-72 90 1 0 91
1972-73 107 1 0 108
1973-74 109 2 1 112
1974-75 112 1 1 114
1975-76 113 1 1 115
1976-77 155 1 3 159
1977-78 152 1 3 156
1978-79 146 1 3 150
1979-80 151 3 3 157
1980-81 155 2 20 177
1981-82 159 1 3 163
1982-83 163 1 7 171
1983-84 172 1 7 180
1984-85 181 0 6 187
1985-86 192 0 6 198
1986-87 204 0 2 206
1987-88 214 0 3 217
1988-89 214 0 3 217
1989-90 214 0 3 217
1990-91 218 0 3 221
1991-92 222 0 2 224
1992-93 229 0 2 231
1993-94 229 0 2 231
1994-95 230 0 2 232
1995-96 219 30 0 249
1996-97 215 27 0 242
1997-98 192 30 0 222
1998-99 189 2 0 191
1999-00 190 0 0 190
2000-01 207 0 0 207
2001-02 187 0 0 187
2002-03 144 10 0 154
2003-04 124 13 0 137
2004-05 144 3 0 147
2005-06 183 3 0 186
2006-07 226 3 0 229
2007-08 241 0 0 241
2008-09 305 0 0 305
2009-10 365 0 0 365
2010-11 392 0 0 392
2011-12 401 0 0 401
2012-13 417 0 0 417
7-
Number of Stations (Block Huts/Halts)
Halts
BG MG NG Total
296 360 185 841
312 372 187 871
314 389 190 893
324 394 195 913
339 401 190 930
349 440 190 979
375 465 194 1034
382 488 194 1064
433 513 196 1142
458 524 201 1183
491 528 207 1226
507 531 207 1245
506 553 221 1280
521 554 225 1300
565 544 226 1335
577 560 226 1363
586 575 232 1393
612 609 239 1460
651 624 248 1523
689 648 250 1587
710 650 255 1615
670 630 254 1554
759 614 243 1616
799 595 249 1643
843 561 207 1611
941 557 233 1731
883 550 218 1651
834 520 227 1581
893 473 228 1594
971 451 215 1637
1017 449 221 1687
1094 545 197 1836
1062 404 207 1673
1255 501 156 1912
1202 372 74 1648
1336 367 199 1902
1387 344 196 1927
1445 285 219 1949
1485 251 192 1928
1481 243 195 1919
1489 232 195 1916
1493 195 159 1847
1483 186 148 1817
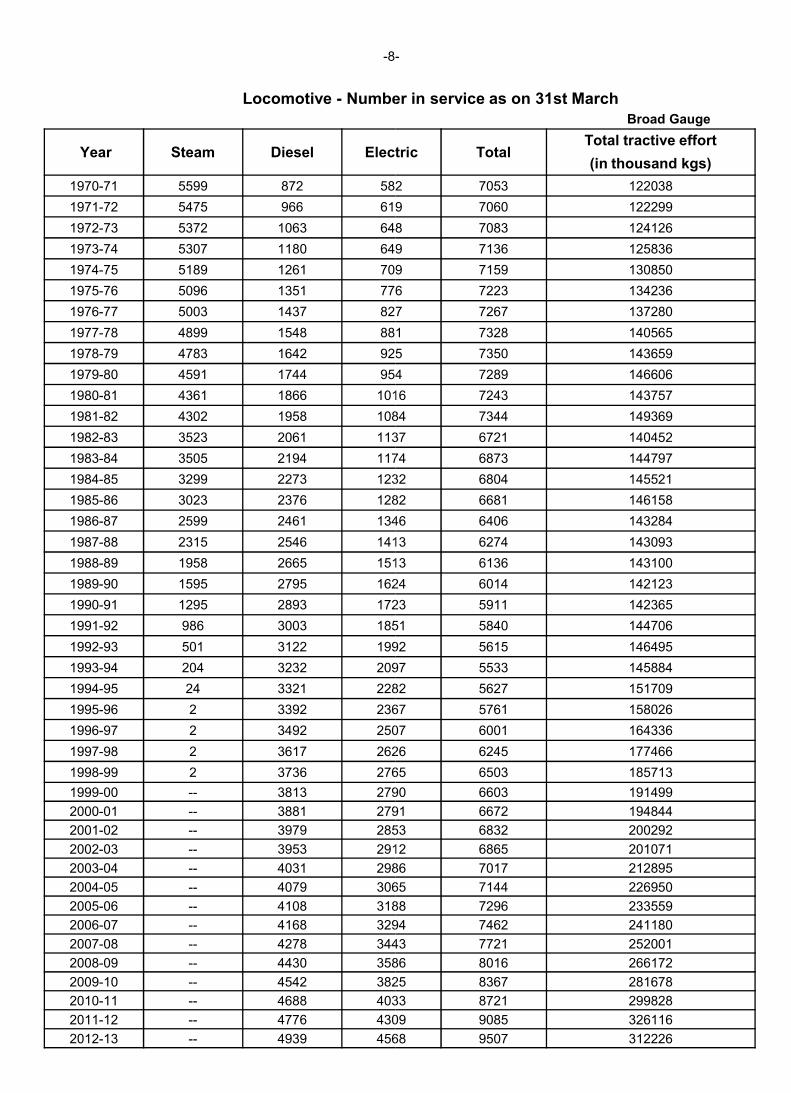
-8-
Locomotive - Number in service as on 31st March
Year Steam Diesel Electric
1970-71 5599 872 582
1971-72 5475 966 619
1972-73 5372 1063 648
1973-74 5307 1180 649
1974-75 5189 1261 709
1975-76 5096 1351 776
1976-77 5003 1437 827
1977-78 4899 1548 881
1978-79 4783 1642 925
1979-80 4591 1744 954
1980-81 4361 1866 1016
1981-82 4302 1958 1084
1982-83 3523 2061 1137
1983-84 3505 2194 1174
1984-85 3299 2273 1232
1985-86 3023 2376 1282
1986-87 2599 2461 1346
1987-88 2315 2546 14131987-88 2315 2546 1413
1988-89 1958 2665 1513
1989-90 1595 2795 1624
1990-91 1295 2893 1723
1991-92 986 3003 1851
1992-93 501 3122 1992
1993-94 204 3232 2097
1994-95 24 3321 2282
1995-96 2 3392 2367
1996-97 2 3492 2507
1997-98 2 3617 2626
1998-99 2 3736 2765
1999-00 -- 3813 2790
2000-01 -- 3881 2791
2001-02 -- 3979 2853
2002-03 -- 3953 2912
2003-04 -- 4031 2986
2004-05 -- 4079 3065
2005-06 -- 4108 3188
2006-07 -- 4168 3294
2007-08 -- 4278 3443
2008-09 -- 4430 3586
2009-10 -- 4542 3825
2010-11 -- 4688 4033
2011-12 -- 4776 4309
2012-13 -- 4939 4568
-
Number in service as on 31st March Broad Gauge
Electric TotalTotal tractive effort
(in thousand kgs)
582 7053 122038
619 7060 122299
648 7083 124126
649 7136 125836
709 7159 130850
776 7223 134236
827 7267 137280
881 7328 140565
925 7350 143659
954 7289 146606
1016 7243 143757
1084 7344 149369
1137 6721 140452
1174 6873 144797
1232 6804 145521
1282 6681 146158
1346 6406 143284
1413 6274 1430931413 6274 143093
1513 6136 143100
1624 6014 142123
1723 5911 142365
1851 5840 144706
1992 5615 146495
2097 5533 145884
2282 5627 151709
2367 5761 158026
2507 6001 164336
2626 6245 177466
2765 6503 185713
2790 6603 191499
2791 6672 194844
2853 6832 200292
2912 6865 201071
2986 7017 212895
3065 7144 226950
3188 7296 233559
3294 7462 241180
3443 7721 252001
3586 8016 266172
3825 8367 281678
4033 8721 299828
4309 9085 326116
4568 9507 312226
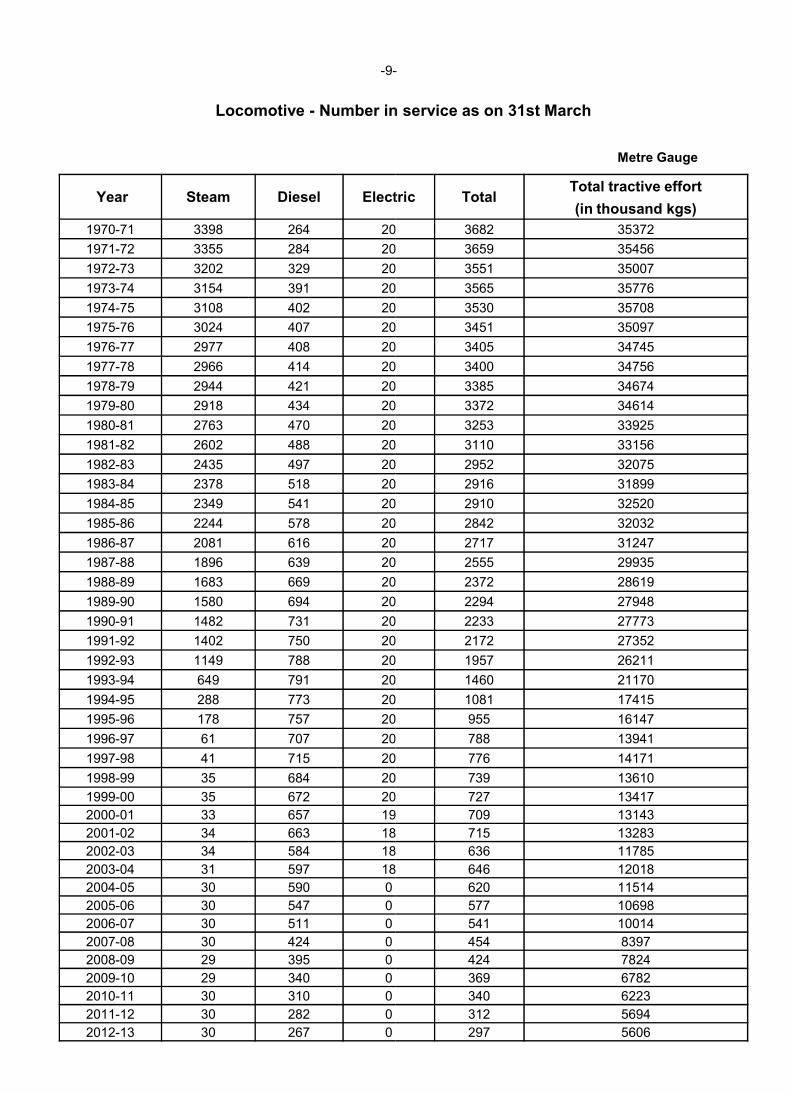
-9-
Locomotive - Number in service as on 31st March
Year Steam Diesel Electric
1970-71 3398 264 20
1971-72 3355 284 20
1972-73 3202 329 20
1973-74 3154 391 20
1974-75 3108 402 20
1975-76 3024 407 20
1976-77 2977 408 20
1977-78 2966 414 20
1978-79 2944 421 20
1979-80 2918 434 20
1980-81 2763 470 20
1981-82 2602 488 20
1982-83 2435 497 20
1983-84 2378 518 20
1984-85 2349 541 20
1985-86 2244 578 20
1986-87 2081 616 201986-87 2081 616 20
1987-88 1896 639 20
1988-89 1683 669 20
1989-90 1580 694 20
1990-91 1482 731 20
1991-92 1402 750 20
1992-93 1149 788 20
1993-94 649 791 20
1994-95 288 773 20
1995-96 178 757 20
1996-97 61 707 20
1997-98 41 715 20
1998-99 35 684 20
1999-00 35 672 20
2000-01 33 657 19
2001-02 34 663 18
2002-03 34 584 18
2003-04 31 597 18
2004-05 30 590 0
2005-06 30 547 0
2006-07 30 511 0
2007-08 30 424 0
2008-09 29 395 0
2009-10 29 340 0
2010-11 30 310 0
2011-12 30 282 0
2012-13 30 267 0
-
Number in service as on 31st March
Metre Gauge
Electric TotalTotal tractive effort
(in thousand kgs)
20 3682 35372
20 3659 35456
20 3551 35007
20 3565 35776
20 3530 35708
20 3451 35097
20 3405 34745
20 3400 34756
20 3385 34674
20 3372 34614
20 3253 33925
20 3110 33156
20 2952 32075
20 2916 31899
20 2910 32520
20 2842 32032
20 2717 3124720 2717 31247
20 2555 29935
20 2372 28619
20 2294 27948
20 2233 27773
20 2172 27352
20 1957 26211
20 1460 21170
20 1081 17415
20 955 16147
20 788 13941
20 776 14171
20 739 13610
20 727 13417
19 709 13143
18 715 13283
18 636 11785
18 646 12018
620 11514
577 10698
541 10014
454 8397
424 7824
369 6782
340 6223
312 5694
297 5606
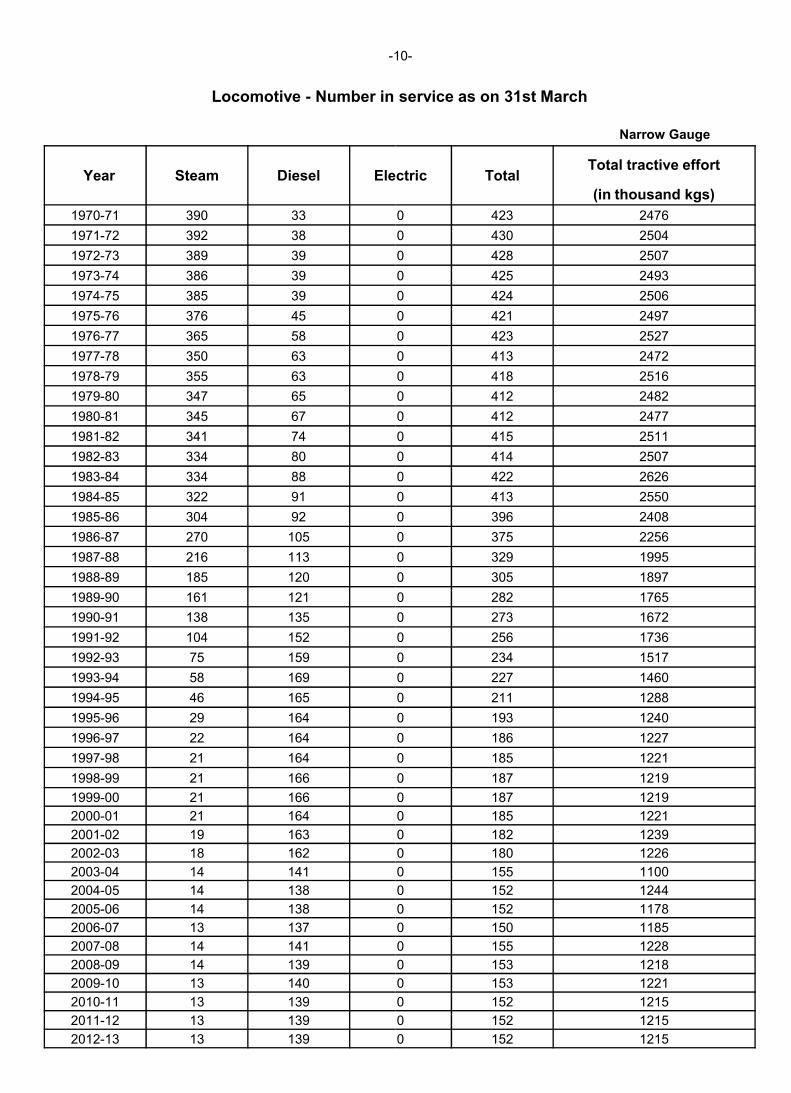
-10
Locomotive - Number in service as on 31st March
Year Steam Diesel Electric
1970-71 390 33
1971-72 392 38
1972-73 389 39
1973-74 386 39
1974-75 385 39
1975-76 376 45
1976-77 365 58
1977-78 350 63
1978-79 355 63
1979-80 347 65
1980-81 345 67
1981-82 341 74
1982-83 334 80
1983-84 334 88
1984-85 322 91
1985-86 304 92
1986-87 270 105
1987-88 216 113
1988-89 185 120
1989-90 161 121
1990-91 138 135
1991-92 104 152
1992-93 75 159
1993-94 58 169
1994-95 46 165
1995-96 29 164
1996-97 22 164
1997-98 21 164
1998-99 21 166
1999-00 21 166
2000-01 21 164
2001-02 19 163
2002-03 18 162
2003-04 14 141
2004-05 14 138
2005-06 14 138
2006-07 13 137
2007-08 14 141
2008-09 14 139
2009-10 13 140
2010-11 13 139
2011-12 13 139
2012-13 13 139
10-
Number in service as on 31st March
Narrow Gauge
Electric TotalTotal tractive effort
(in thousand kgs)
0 423 2476
0 430 2504
0 428 2507
0 425 2493
0 424 2506
0 421 2497
0 423 2527
0 413 2472
0 418 2516
0 412 2482
0 412 2477
0 415 2511
0 414 2507
0 422 2626
0 413 2550
0 396 2408
0 375 2256
0 329 1995
0 305 1897
0 282 1765
0 273 1672
0 256 1736
0 234 1517
0 227 1460
0 211 1288
0 193 1240
0 186 1227
0 185 1221
0 187 1219
0 187 1219
0 185 1221
0 182 1239
0 180 1226
0 155 1100
0 152 1244
0 152 1178
0 150 1185
0 155 1228
0 153 1218
0 153 1221
0 152 1215
0 152 1215
0 152 1215
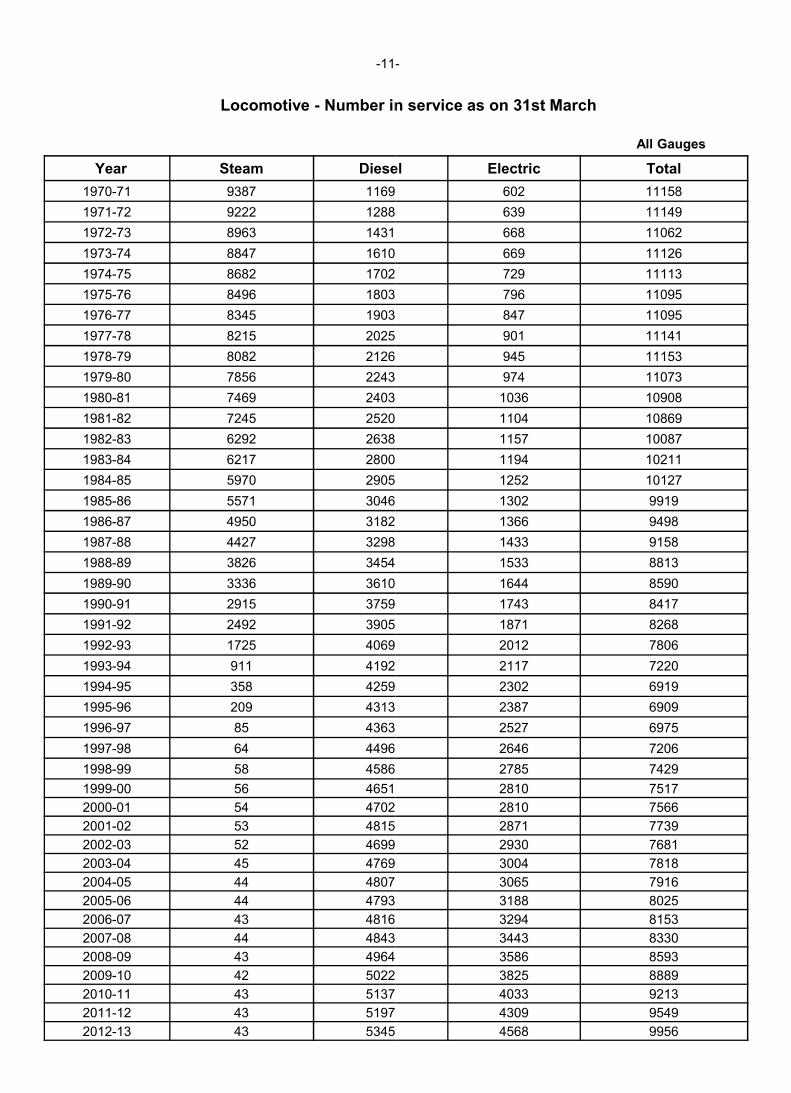
-11-
Locomotive - Number in service as on 31st March
Year Steam Diesel
1970-71 9387 1169
1971-72 9222 1288
1972-73 8963 1431
1973-74 8847 1610
1974-75 8682 1702
1975-76 8496 1803
1976-77 8345 1903
1977-78 8215 2025
1978-79 8082 2126
1979-80 7856 2243
1980-81 7469 2403
1981-82 7245 2520
1982-83 6292 2638
1983-84 6217 2800
1984-85 5970 2905
1985-86 5571 3046
1986-87 4950 3182
1987-88 4427 32981987-88 4427 3298
1988-89 3826 3454
1989-90 3336 3610
1990-91 2915 3759
1991-92 2492 3905
1992-93 1725 4069
1993-94 911 4192
1994-95 358 4259
1995-96 209 4313
1996-97 85 4363
1997-98 64 4496
1998-99 58 4586
1999-00 56 4651
2000-01 54 4702
2001-02 53 4815
2002-03 52 4699
2003-04 45 4769
2004-05 44 4807
2005-06 44 4793
2006-07 43 4816
2007-08 44 4843
2008-09 43 4964
2009-10 42 5022
2010-11 43 5137
2011-12 43 5197
2012-13 43 5345
-
Number in service as on 31st March
All Gauges
Diesel Electric Total
602 11158
639 11149
668 11062
669 11126
729 11113
796 11095
847 11095
901 11141
945 11153
974 11073
1036 10908
1104 10869
1157 10087
1194 10211
1252 10127
1302 9919
1366 9498
1433 91581433 9158
1533 8813
1644 8590
1743 8417
1871 8268
2012 7806
2117 7220
2302 6919
2387 6909
2527 6975
2646 7206
2785 7429
2810 7517
2810 7566
2871 7739
2930 7681
3004 7818
3065 7916
3188 8025
3294 8153
3443 8330
3586 8593
3825 8889
4033 9213
4309 9549
4568 9956
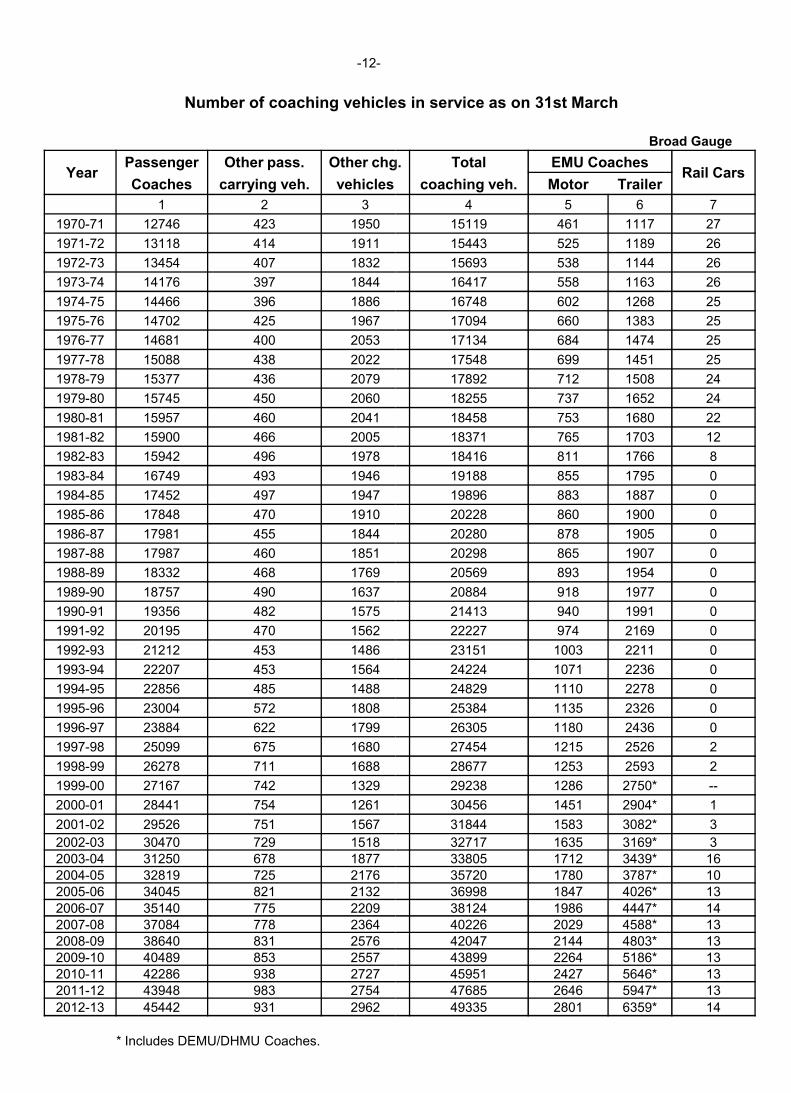
-12-
Number of coaching vehicles in service as on 31st March
YearPassenger Other pass. Other chg.
Coaches carrying veh. vehicles
1 2 3
1970-71 12746 423 1950
1971-72 13118 414 1911
1972-73 13454 407 1832
1973-74 14176 397 1844
1974-75 14466 396 1886
1975-76 14702 425 1967
1976-77 14681 400 2053
1977-78 15088 438 2022
1978-79 15377 436 2079
1979-80 15745 450 2060
1980-81 15957 460 2041
1981-82 15900 466 2005
1982-83 15942 496 1978
1983-84 16749 493 1946
1984-85 17452 497 1947
1985-86 17848 470 1910
1986-87 17981 455 1844
1987-88 17987 460 18511987-88 17987 460 1851
1988-89 18332 468 1769
1989-90 18757 490 1637
1990-91 19356 482 1575
1991-92 20195 470 1562
1992-93 21212 453 1486
1993-94 22207 453 1564
1994-95 22856 485 1488
1995-96 23004 572 1808
1996-97 23884 622 1799
1997-98 25099 675 1680
1998-99 26278 711 1688
1999-00 27167 742 1329
2000-01 28441 754 1261
2001-02 29526 751 1567
2002-03 30470 729 15182003-04 31250 678 18772004-05 32819 725 21762005-06 34045 821 2132
2006-07 35140 775 22092007-08 37084 778 23642008-09 38640 831 25762009-10 40489 853 25572010-11 42286 938 27272011-12 43948 983 2754
2012-13 45442 931 2962
* Includes DEMU/DHMU Coaches.
Number of coaching vehicles in service as on 31st March
Broad Gauge
Other chg. Total EMU CoachesRail Cars
coaching veh. Motor Trailer
4 5 6 7
15119 461 1117 27
15443 525 1189 26
15693 538 1144 26
16417 558 1163 26
16748 602 1268 25
17094 660 1383 25
17134 684 1474 25
17548 699 1451 25
17892 712 1508 24
18255 737 1652 24
18458 753 1680 22
18371 765 1703 12
18416 811 1766 8
19188 855 1795 0
19896 883 1887 0
20228 860 1900 0
20280 878 1905 0
20298 865 1907 020298 865 1907 0
20569 893 1954 0
20884 918 1977 0
21413 940 1991 0
22227 974 2169 0
23151 1003 2211 0
24224 1071 2236 0
24829 1110 2278 0
25384 1135 2326 0
26305 1180 2436 0
27454 1215 2526 2
28677 1253 2593 2
29238 1286 2750* --
30456 1451 2904* 1
31844 1583 3082* 3
32717 1635 3169* 333805 1712 3439* 1635720 1780 3787* 1036998 1847 4026* 13
38124 1986 4447* 1440226 2029 4588* 1342047 2144 4803* 1343899 2264 5186* 1345951 2427 5646* 1347685 2646 5947* 13
49335 2801 6359* 14
Number of coaching vehicles in service as on 31st March
YearPassenger Other pass. Other chg.
Coaches carrying veh. vehicles
1 2 3
1970-71 10411 178 1590
1971-72 10459 171 1546
1972-73 10594 166 1529
1973-74 10451 162 1506
1974-75 10279 168 1531
1975-76 10157 164 1530
1976-77 10082 158 1496
1977-78 10153 166 1480
1978-79 10099 167 1445
1979-80 10156 165 1416
1980-81 10142 164 1395
1981-82 10008 163 1360
1982-83 9689 171 1299
1983-84 9325 174 1290
1984-85 9097 163 1392
1985-86 8680 158 1320
1986-87 8422 156 1283
1987-88 8243 150 1226
1988-89 8176 133 1188
1989-90 8044 126 1138
1990-91 8186 117 1095
1991-92 8158 126 1053
1992-93 7992 137 1016
1993-94 7239 130 929
1994-95 6095 103 779
1995-96 5450 153 717
1996-97 5103 144 652
1997-98 4685 133 637
1998-99 4383 129 622
1999-00 4228 125 564
2000-01 4013 105 516
2001-02 4040 102 490
2002-03 3657 96 459
2003-04 3788 81 350
2004-05 3640 75 386
2005-06 3486 57 300
2006-07 3073 50 299
2007-08 2966 45 310
2008-09 2785 44 252
2009-10 2378 41 177
2010-11 2178 43 165
2011-12 2080 41 143
2012-13 1959 47 124
* Includes DEMU/DHMU Coaches.
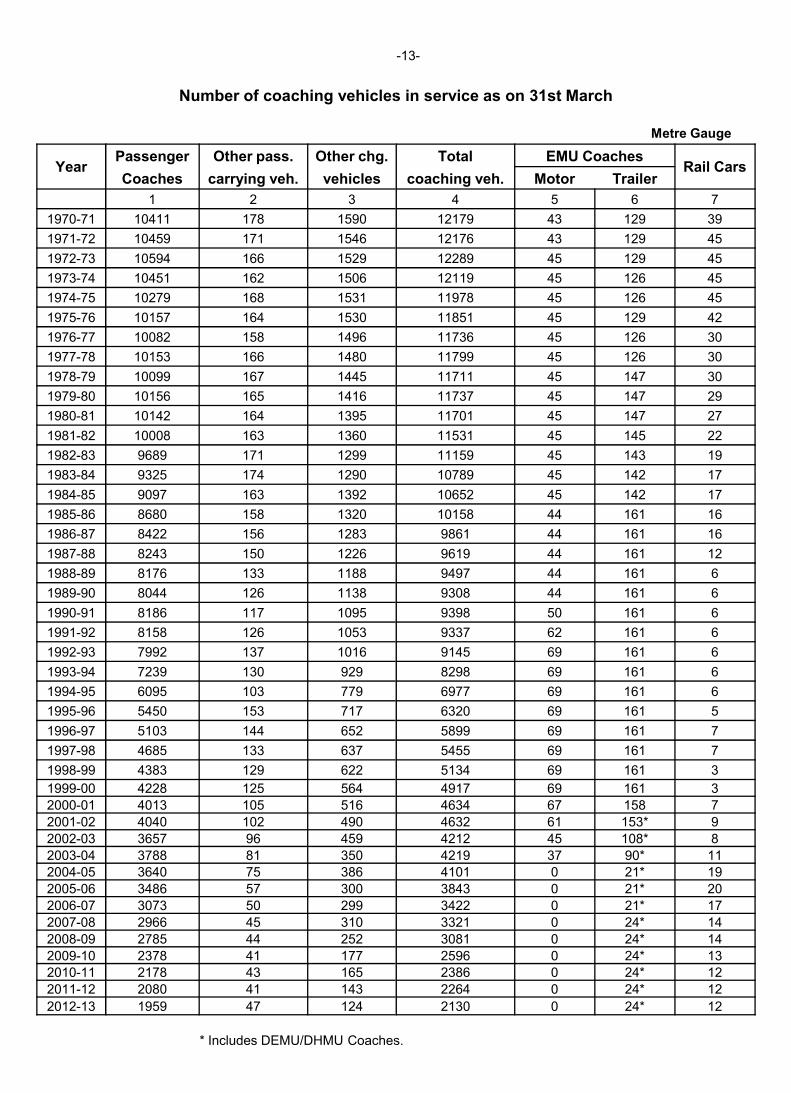
-13-
Number of coaching vehicles in service as on 31st March
Metre Gauge
Total EMU CoachesRail Cars
coaching veh. Motor Trailer
4 5 6 7
12179 43 129 39
12176 43 129 45
12289 45 129 45
12119 45 126 45
11978 45 126 45
11851 45 129 42
11736 45 126 30
11799 45 126 30
11711 45 147 30
11737 45 147 29
11701 45 147 27
11531 45 145 22
11159 45 143 19
10789 45 142 17
10652 45 142 17
10158 44 161 16
9861 44 161 16
9619 44 161 12
9497 44 161 6
9308 44 161 6
9398 50 161 6
9337 62 161 6
9145 69 161 6
8298 69 161 6
6977 69 161 6
6320 69 161 5
5899 69 161 7
5455 69 161 7
5134 69 161 3
4917 69 161 3
4634 67 158 7
4632 61 153* 9
4212 45 108* 8
4219 37 90* 11
4101 0 21* 19
3843 0 21* 20
3422 0 21* 17
3321 0 24* 14
3081 0 24* 14
2596 0 24* 13
2386 0 24* 12
2264 0 24* 12
2130 0 24* 12
* Includes DEMU/DHMU Coaches.
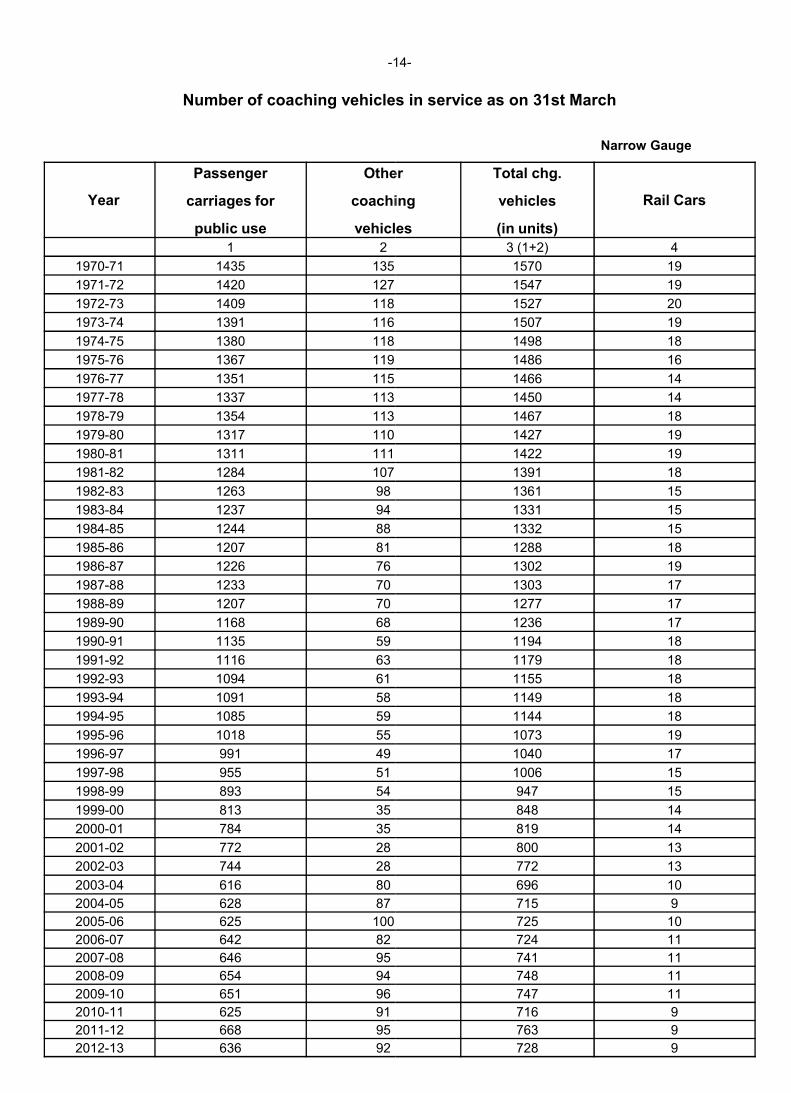
-14
Number of coaching vehicles in service as on 31st March
Year
Passenger Other
carriages for coaching
public use vehicles
1 2
1970-71 1435 135
1971-72 1420 127
1972-73 1409 118
1973-74 1391 116
1974-75 1380 118
1975-76 1367 119
1976-77 1351 115
1977-78 1337 113
1978-79 1354 113
1979-80 1317 110
1980-81 1311 111
1981-82 1284 107
1982-83 1263 98
1983-84 1237 94
1984-85 1244 88
1985-86 1207 811985-86 1207 81
1986-87 1226 76
1987-88 1233 70
1988-89 1207 70
1989-90 1168 68
1990-91 1135 59
1991-92 1116 63
1992-93 1094 61
1993-94 1091 58
1994-95 1085 59
1995-96 1018 55
1996-97 991 49
1997-98 955 51
1998-99 893 54
1999-00 813 35
2000-01 784 35
2001-02 772 28
2002-03 744 28
2003-04 616 80
2004-05 628 87
2005-06 625 100
2006-07 642 82
2007-08 646 95
2008-09 654 94
2009-10 651 96
2010-11 625 91
2011-12 668 95
2012-13 636 92
14-
Number of coaching vehicles in service as on 31st March
Narrow Gauge
Other Total chg.
Rail Carscoaching vehicles
vehicles (in units)
3 (1+2) 4
1570 19
1547 19
1527 20
1507 19
1498 18
1486 16
1466 14
1450 14
1467 18
1427 19
1422 19
1391 18
1361 15
1331 15
1332 15
1288 181288 18
1302 19
1303 17
1277 17
1236 17
1194 18
1179 18
1155 18
1149 18
1144 18
1073 19
1040 17
1006 15
947 15
848 14
819 14
800 13
772 13
696 10
715 9
725 10
724 11
741 11
748 11
747 11
716 9
763 9
728 9
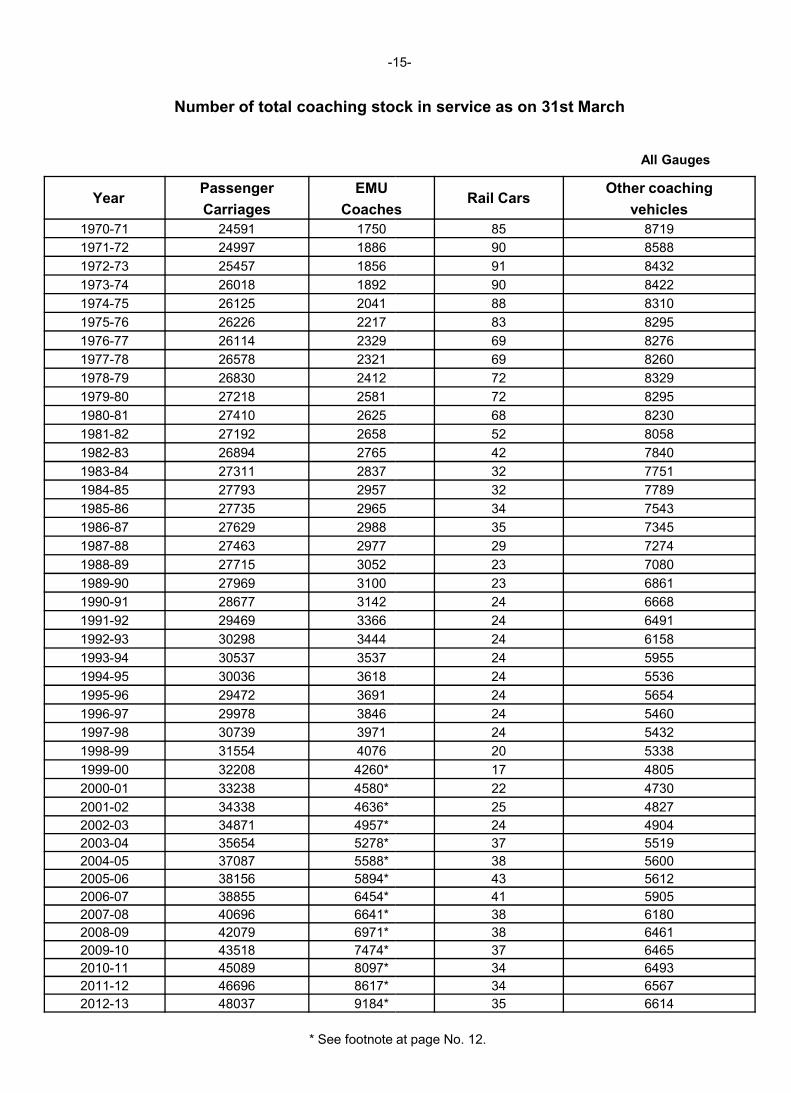
-15
Number of total coaching stock in service as on 31st March
YearPassenger EMU
Carriages Coaches
1970-71 24591 1750
1971-72 24997 1886
1972-73 25457 1856
1973-74 26018 1892
1974-75 26125 2041
1975-76 26226 2217
1976-77 26114 2329
1977-78 26578 2321
1978-79 26830 2412
1979-80 27218 2581
1980-81 27410 2625
1981-82 27192 2658
1982-83 26894 2765
1983-84 27311 2837
1984-85 27793 2957
1985-86 27735 2965
1986-87 27629 2988
1987-88 27463 29771987-88 27463 2977
1988-89 27715 3052
1989-90 27969 3100
1990-91 28677 3142
1991-92 29469 3366
1992-93 30298 3444
1993-94 30537 3537
1994-95 30036 3618
1995-96 29472 3691
1996-97 29978 3846
1997-98 30739 3971
1998-99 31554 4076
1999-00 32208 4260*
2000-01 33238 4580*
2001-02 34338 4636*
2002-03 34871 4957*
2003-04 35654 5278*
2004-05 37087 5588*
2005-06 38156 5894*
2006-07 38855 6454*
2007-08 40696 6641*
2008-09 42079 6971*
2009-10 43518 7474*
2010-11 45089 8097*
2011-12 46696 8617*
2012-13 48037 9184*
* See footnote at page No. 12.
15-
Number of total coaching stock in service as on 31st March
All Gauges
Rail CarsOther coaching
Coaches vehicles
85 8719
90 8588
91 8432
90 8422
88 8310
83 8295
69 8276
69 8260
72 8329
72 8295
68 8230
52 8058
42 7840
32 7751
32 7789
34 7543
35 7345
29 727429 7274
23 7080
23 6861
24 6668
24 6491
24 6158
24 5955
24 5536
24 5654
24 5460
24 5432
20 5338
17 4805
22 4730
25 4827
24 4904
37 5519
38 5600
43 5612
41 5905
38 6180
38 6461
37 6465
34 6493
34 6567
35 6614
* See footnote at page No. 12.
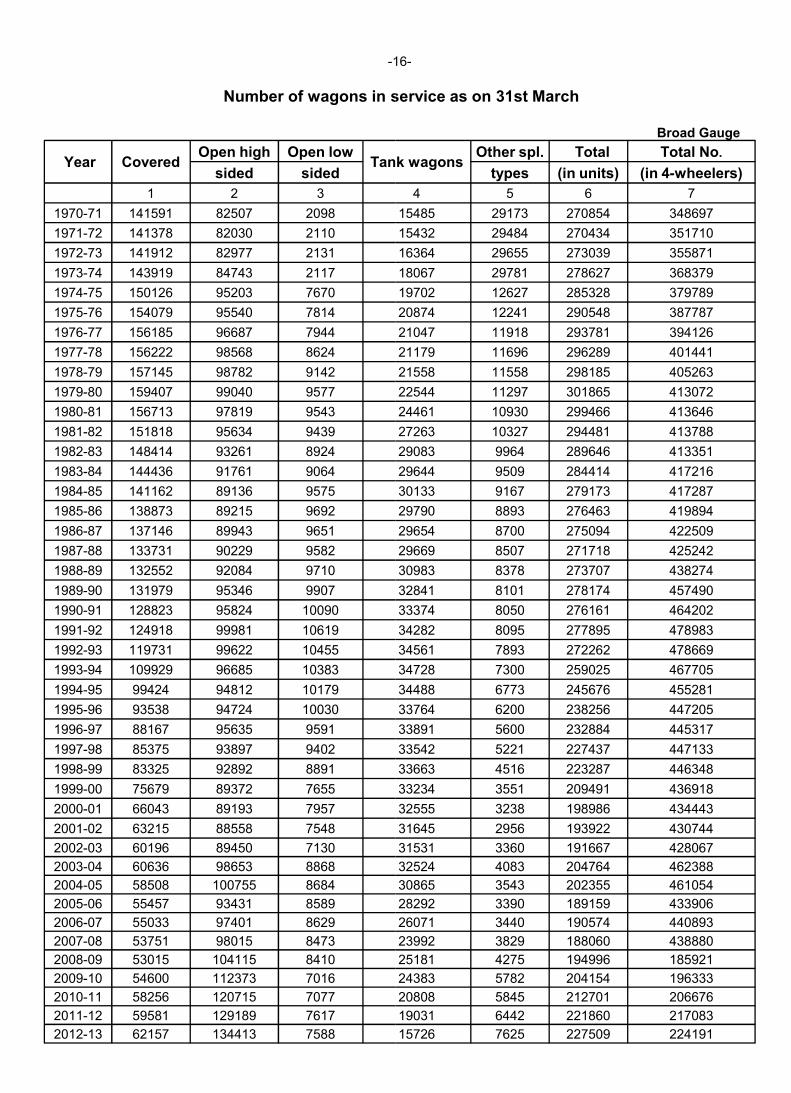
-16
Number of wagons in service as on 31st March
Year CoveredOpen high Open low
Tank wagonssided sided
1 2 3
1970-71 141591 82507 2098
1971-72 141378 82030 2110
1972-73 141912 82977 2131
1973-74 143919 84743 2117
1974-75 150126 95203 7670
1975-76 154079 95540 7814
1976-77 156185 96687 7944
1977-78 156222 98568 8624
1978-79 157145 98782 9142
1979-80 159407 99040 9577
1980-81 156713 97819 9543
1981-82 151818 95634 9439
1982-83 148414 93261 8924
1983-84 144436 91761 9064
1984-85 141162 89136 9575
1985-86 138873 89215 9692
1986-87 137146 89943 9651
1987-88 133731 90229 95821987-88 133731 90229 9582
1988-89 132552 92084 9710
1989-90 131979 95346 9907
1990-91 128823 95824 10090
1991-92 124918 99981 10619
1992-93 119731 99622 10455
1993-94 109929 96685 10383
1994-95 99424 94812 10179
1995-96 93538 94724 10030
1996-97 88167 95635 9591
1997-98 85375 93897 9402
1998-99 83325 92892 8891
1999-00 75679 89372 7655
2000-01 66043 89193 7957
2001-02 63215 88558 7548
2002-03 60196 89450 7130
2003-04 60636 98653 8868
2004-05 58508 100755 8684
2005-06 55457 93431 8589
2006-07 55033 97401 8629
2007-08 53751 98015 8473
2008-09 53015 104115 8410
2009-10 54600 112373 7016
2010-11 58256 120715 7077
2011-12 59581 129189 7617
2012-13 62157 134413 7588
16-
Number of wagons in service as on 31st March
Broad Gauge
Tank wagonsOther spl. Total Total No.
types (in units) (in 4-wheelers)
4 5 6 7
15485 29173 270854 348697
15432 29484 270434 351710
16364 29655 273039 355871
18067 29781 278627 368379
19702 12627 285328 379789
20874 12241 290548 387787
21047 11918 293781 394126
21179 11696 296289 401441
21558 11558 298185 405263
22544 11297 301865 413072
24461 10930 299466 413646
27263 10327 294481 413788
29083 9964 289646 413351
29644 9509 284414 417216
30133 9167 279173 417287
29790 8893 276463 419894
29654 8700 275094 422509
29669 8507 271718 42524229669 8507 271718 425242
30983 8378 273707 438274
32841 8101 278174 457490
33374 8050 276161 464202
34282 8095 277895 478983
34561 7893 272262 478669
34728 7300 259025 467705
34488 6773 245676 455281
33764 6200 238256 447205
33891 5600 232884 445317
33542 5221 227437 447133
33663 4516 223287 446348
33234 3551 209491 436918
32555 3238 198986 434443
31645 2956 193922 430744
31531 3360 191667 428067
32524 4083 204764 462388
30865 3543 202355 461054
28292 3390 189159 433906
26071 3440 190574 440893
23992 3829 188060 438880
25181 4275 194996 185921
24383 5782 204154 196333
20808 5845 212701 206676
19031 6442 221860 217083
15726 7625 227509 224191
-17-
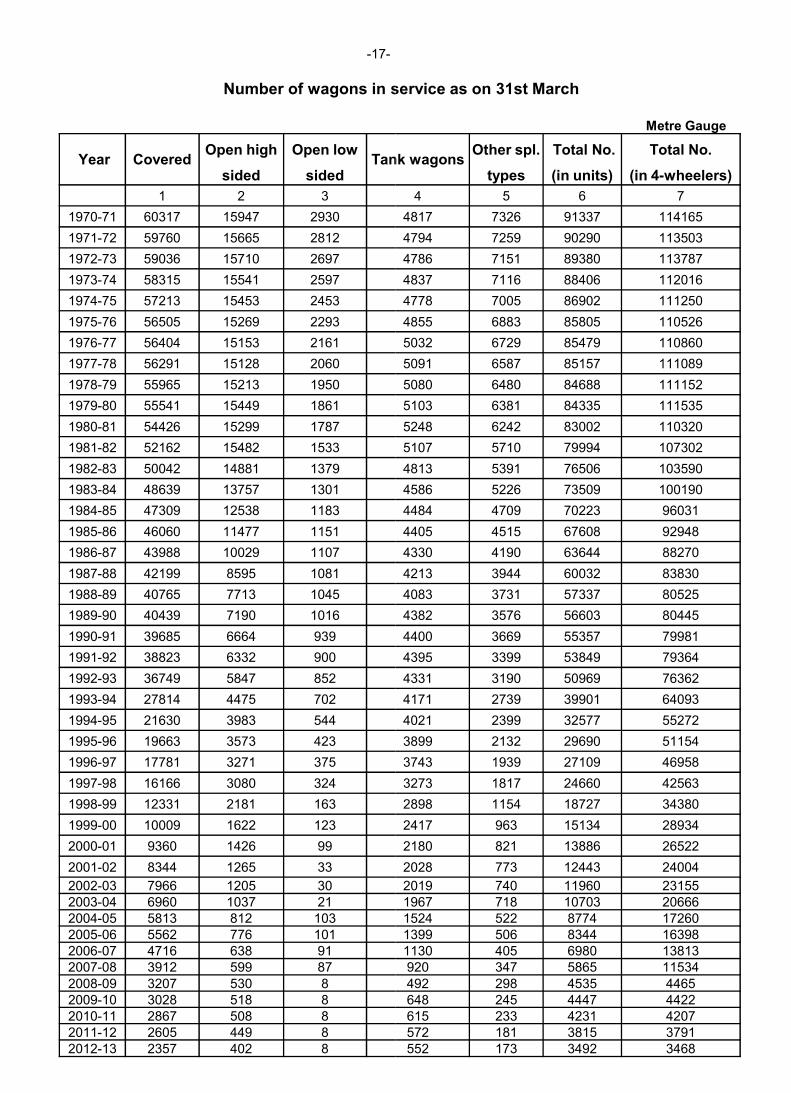
Number of wagons in service as on 31st March
Year CoveredOpen high Open low
Tank wagonssided sided
1 2 3
1970-71 60317 15947 2930
1971-72 59760 15665 2812
1972-73 59036 15710 2697
1973-74 58315 15541 2597
1974-75 57213 15453 2453
1975-76 56505 15269 2293
1976-77 56404 15153 2161
1977-78 56291 15128 2060
1978-79 55965 15213 1950
1979-80 55541 15449 1861
1980-81 54426 15299 1787
1981-82 52162 15482 1533
1982-83 50042 14881 1379
1983-84 48639 13757 1301
1984-85 47309 12538 1183
1985-86 46060 11477 1151
1986-87 43988 10029 11071986-87 43988 10029 1107
1987-88 42199 8595 1081
1988-89 40765 7713 1045
1989-90 40439 7190 1016
1990-91 39685 6664 939
1991-92 38823 6332 900
1992-93 36749 5847 852
1993-94 27814 4475 702
1994-95 21630 3983 544
1995-96 19663 3573 423
1996-97 17781 3271 375
1997-98 16166 3080 324
1998-99 12331 2181 163
1999-00 10009 1622 123
2000-01 9360 1426 99
2001-02 8344 1265 33
2002-03 7966 1205 302003-04 6960 1037 212004-05 5813 812 1032005-06 5562 776 1012006-07 4716 638 912007-08 3912 599 872008-09 3207 530 82009-10 3028 518 82010-11 2867 508 82011-12 2605 449 82012-13 2357 402 8
Number of wagons in service as on 31st March
Metre Gauge
Tank wagonsOther spl. Total No. Total No.
types (in units) (in 4-wheelers)
4 5 6 7
4817 7326 91337 114165
4794 7259 90290 113503
4786 7151 89380 113787
4837 7116 88406 112016
4778 7005 86902 111250
4855 6883 85805 110526
5032 6729 85479 110860
5091 6587 85157 111089
5080 6480 84688 111152
5103 6381 84335 111535
5248 6242 83002 110320
5107 5710 79994 107302
4813 5391 76506 103590
4586 5226 73509 100190
4484 4709 70223 96031
4405 4515 67608 92948
4330 4190 63644 882704330 4190 63644 88270
4213 3944 60032 83830
4083 3731 57337 80525
4382 3576 56603 80445
4400 3669 55357 79981
4395 3399 53849 79364
4331 3190 50969 76362
4171 2739 39901 64093
4021 2399 32577 55272
3899 2132 29690 51154
3743 1939 27109 46958
3273 1817 24660 42563
2898 1154 18727 34380
2417 963 15134 28934
2180 821 13886 26522
2028 773 12443 24004
2019 740 11960 231551967 718 10703 206661524 522 8774 172601399 506 8344 163981130 405 6980 13813920 347 5865 11534492 298 4535 4465648 245 4447 4422615 233 4231 4207572 181 3815 3791552 173 3492 3468
-18
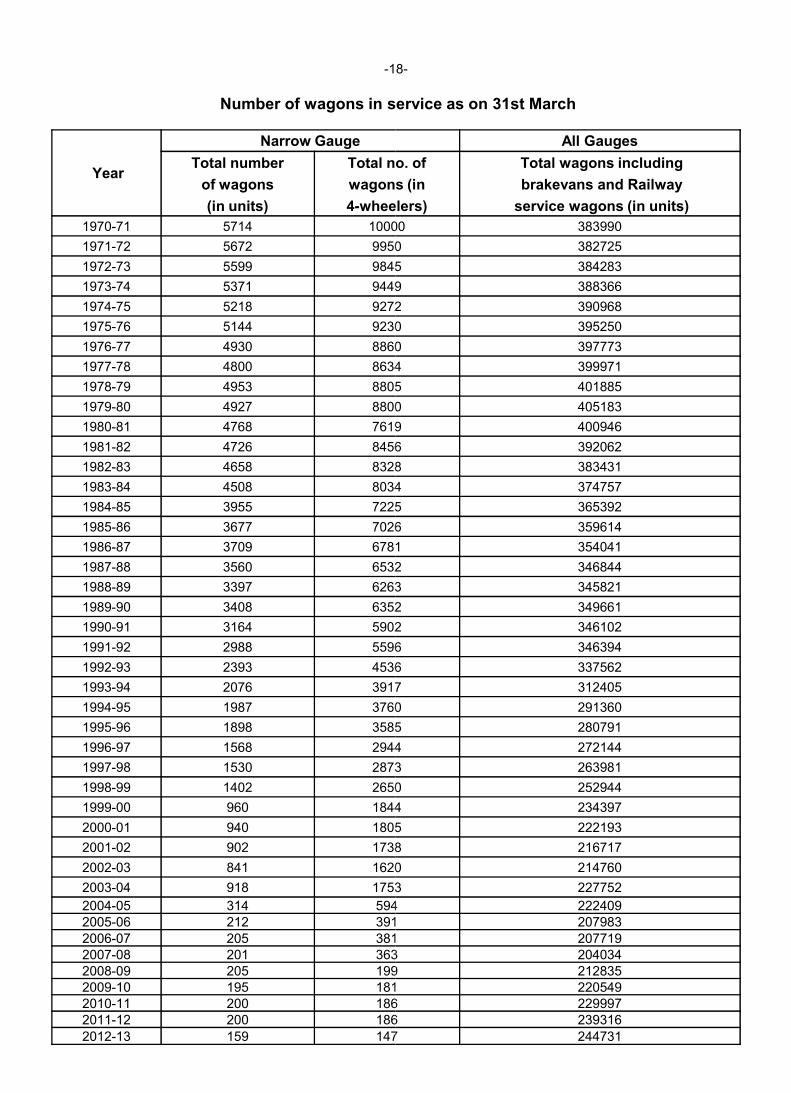
Number of wagons in service as on 31st March
Year
Narrow Gauge
Total number Total no. of
of wagons wagons (in
(in units) 4-wheelers)
1970-71 5714 10000
1971-72 5672 9950
1972-73 5599 9845
1973-74 5371 9449
1974-75 5218 9272
1975-76 5144 9230
1976-77 4930 8860
1977-78 4800 8634
1978-79 4953 8805
1979-80 4927 8800
1980-81 4768 7619
1981-82 4726 8456
1982-83 4658 8328
1983-84 4508 8034
1984-85 3955 7225
1985-86 3677 7026
1986-87 3709 67811986-87 3709 6781
1987-88 3560 6532
1988-89 3397 6263
1989-90 3408 6352
1990-91 3164 5902
1991-92 2988 5596
1992-93 2393 4536
1993-94 2076 3917
1994-95 1987 3760
1995-96 1898 3585
1996-97 1568 2944
1997-98 1530 2873
1998-99 1402 2650
1999-00 960 1844
2000-01 940 1805
2001-02 902 1738
2002-03 841 1620
2003-04 918 1753
2004-05 314 5942005-06 212 3912006-07 205 3812007-08 201 3632008-09 205 1992009-10 195 1812010-11 200 1862011-12 200 186
2012-13 159 147
18-
Number of wagons in service as on 31st March
All Gauges
Total no. of Total wagons including
wagons (in brakevans and Railway
wheelers) service wagons (in units)
10000 383990
9950 382725
9845 384283
9449 388366
9272 390968
9230 395250
8860 397773
8634 399971
8805 401885
8800 405183
7619 400946
8456 392062
8328 383431
8034 374757
7225 365392
7026 359614
6781 3540416781 354041
6532 346844
6263 345821
6352 349661
5902 346102
5596 346394
4536 337562
3917 312405
3760 291360
3585 280791
2944 272144
2873 263981
2650 252944
1844 234397
1805 222193
1738 216717
1620 214760
1753 227752
594 222409391 207983381 207719363 204034199 212835181 220549186 229997186 239316
147 244731
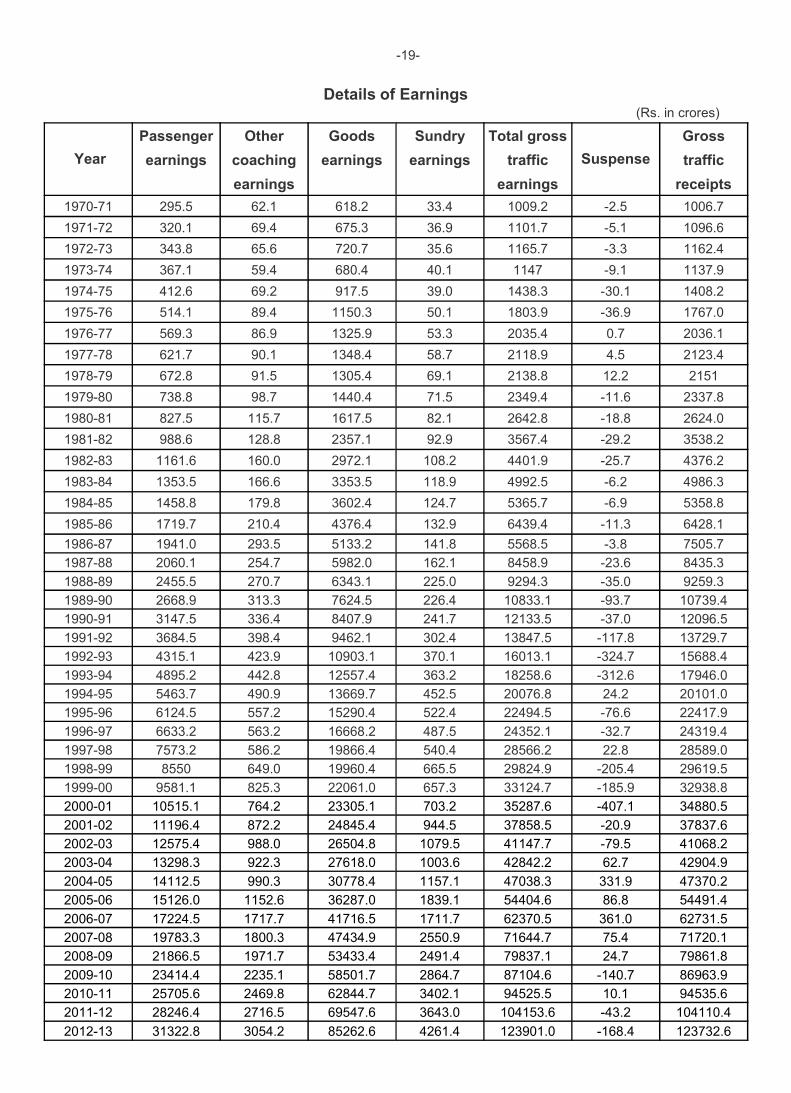
Details of Earnings
Year
Passenger Other Goods
earnings coaching earnings
earnings
1970-71 295.5 62.1 618.2
1971-72 320.1 69.4 675.3
1972-73 343.8 65.6 720.7
1973-74 367.1 59.4 680.4
1974-75 412.6 69.2 917.5
1975-76 514.1 89.4 1150.3
1976-77 569.3 86.9 1325.9
1977-78 621.7 90.1 1348.4
1978-79 672.8 91.5 1305.4
1979-80 738.8 98.7 1440.4
1980-81 827.5 115.7 1617.5
1981-82 988.6 128.8 2357.1
1982-83 1161.6 160.0 2972.1
1983-84 1353.5 166.6 3353.5
1984-85 1458.8 179.8 3602.4
1985-86 1719.7 210.4 4376.4
1986-87 1941.0 293.5 5133.21986-87 1941.0 293.5 5133.2
1987-88 2060.1 254.7 5982.0
1988-89 2455.5 270.7 6343.1
1989-90 2668.9 313.3 7624.5
1990-91 3147.5 336.4 8407.9
1991-92 3684.5 398.4 9462.1
1992-93 4315.1 423.9 10903.1
1993-94 4895.2 442.8 12557.4
1994-95 5463.7 490.9 13669.7
1995-96 6124.5 557.2 15290.4
1996-97 6633.2 563.2 16668.2
1997-98 7573.2 586.2 19866.4
1998-99 8550 649.0 19960.4
1999-00 9581.1 825.3 22061.0
2000-01 10515.1 764.2 23305.1
2001-02 11196.4 872.2 24845.4
2002-03 12575.4 988.0 26504.8
2003-04 13298.3 922.3 27618.0
2004-05 14112.5 990.3 30778.4
2005-06 15126.0 1152.6 36287.0
2006-07 17224.5 1717.7 41716.5
2007-08 19783.3 1800.3 47434.9
2008-09 21866.5 1971.7 53433.4
2009-10 23414.4 2235.1 58501.7
2010-11 25705.6 2469.8 62844.7
2011-12 28246.4 2716.5 69547.6
2012-13 31322.8 3054.2 85262.6
-19-
Details of Earnings(Rs. in crores)
Sundry Total gross
Suspense
Gross
earnings traffic traffic
earnings receipts
33.4 1009.2 -2.5 1006.7
36.9 1101.7 -5.1 1096.6
35.6 1165.7 -3.3 1162.4
40.1 1147 -9.1 1137.9
39.0 1438.3 -30.1 1408.2
50.1 1803.9 -36.9 1767.0
53.3 2035.4 0.7 2036.1
58.7 2118.9 4.5 2123.4
69.1 2138.8 12.2 2151
71.5 2349.4 -11.6 2337.8
82.1 2642.8 -18.8 2624.0
92.9 3567.4 -29.2 3538.2
108.2 4401.9 -25.7 4376.2
118.9 4992.5 -6.2 4986.3
124.7 5365.7 -6.9 5358.8
132.9 6439.4 -11.3 6428.1
141.8 5568.5 -3.8 7505.7141.8 5568.5 -3.8 7505.7
162.1 8458.9 -23.6 8435.3
225.0 9294.3 -35.0 9259.3
226.4 10833.1 -93.7 10739.4
241.7 12133.5 -37.0 12096.5
302.4 13847.5 -117.8 13729.7
370.1 16013.1 -324.7 15688.4
363.2 18258.6 -312.6 17946.0
452.5 20076.8 24.2 20101.0
522.4 22494.5 -76.6 22417.9
487.5 24352.1 -32.7 24319.4
540.4 28566.2 22.8 28589.0
665.5 29824.9 -205.4 29619.5
657.3 33124.7 -185.9 32938.8
703.2 35287.6 -407.1 34880.5
944.5 37858.5 -20.9 37837.6
1079.5 41147.7 -79.5 41068.2
1003.6 42842.2 62.7 42904.9
1157.1 47038.3 331.9 47370.2
1839.1 54404.6 86.8 54491.4
1711.7 62370.5 361.0 62731.5
2550.9 71644.7 75.4 71720.1
2491.4 79837.1 24.7 79861.8
2864.7 87104.6 -140.7 86963.9
3402.1 94525.5 10.1 94535.6
3643.0 104153.6 -43.2 104110.4
4261.4 123901.0 -168.4 123732.6
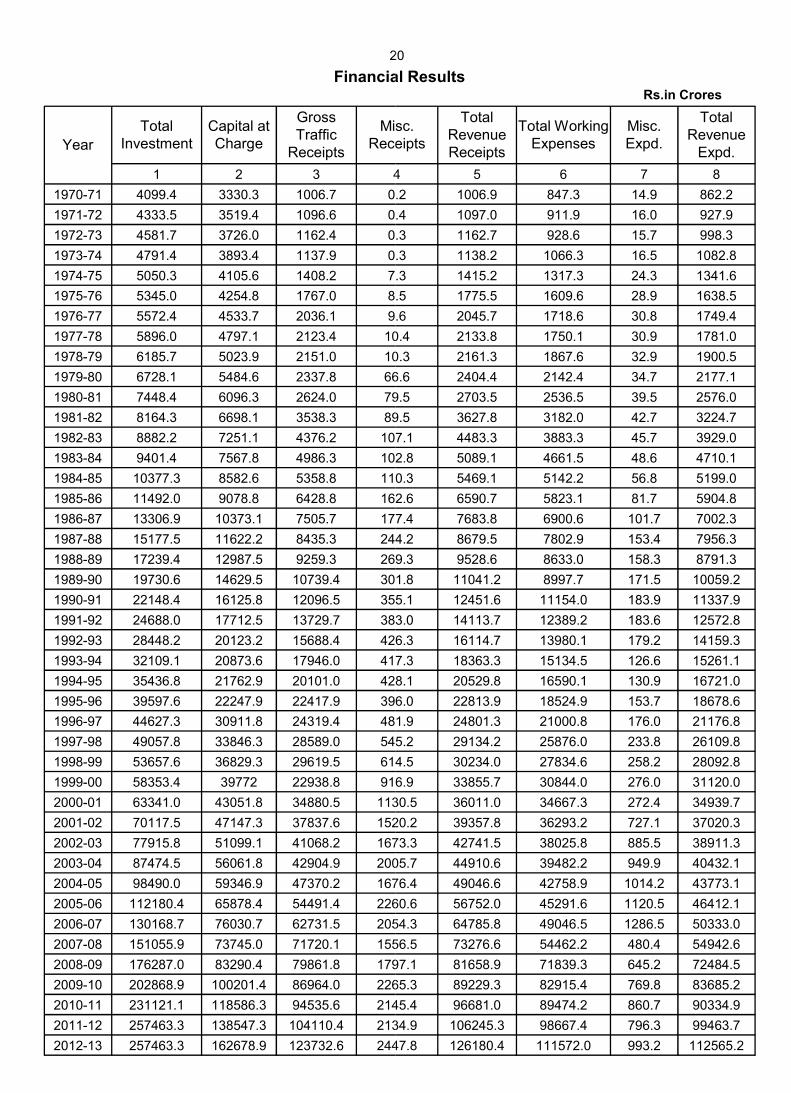
20
Financial Results
Year
Total Investment
Capital at Charge
Gross Traffic
Receipts
Misc. Receipts
1 2 3 4
1970-71 4099.4 3330.3 1006.7 0.2
1971-72 4333.5 3519.4 1096.6 0.4
1972-73 4581.7 3726.0 1162.4 0.3
1973-74 4791.4 3893.4 1137.9 0.3
1974-75 5050.3 4105.6 1408.2 7.3
1975-76 5345.0 4254.8 1767.0 8.5
1976-77 5572.4 4533.7 2036.1 9.6
1977-78 5896.0 4797.1 2123.4 10.4
1978-79 6185.7 5023.9 2151.0 10.3
1979-80 6728.1 5484.6 2337.8 66.6
1980-81 7448.4 6096.3 2624.0 79.5
1981-82 8164.3 6698.1 3538.3 89.5
1982-83 8882.2 7251.1 4376.2 107.1
1983-84 9401.4 7567.8 4986.3 102.8
1984-85 10377.3 8582.6 5358.8 110.3
1985-86 11492.0 9078.8 6428.8 162.6
1986-87 13306.9 10373.1 7505.7 177.4
1987-88 15177.5 11622.2 8435.3 244.21987-88 15177.5 11622.2 8435.3 244.2
1988-89 17239.4 12987.5 9259.3 269.3
1989-90 19730.6 14629.5 10739.4 301.8
1990-91 22148.4 16125.8 12096.5 355.1
1991-92 24688.0 17712.5 13729.7 383.0
1992-93 28448.2 20123.2 15688.4 426.3
1993-94 32109.1 20873.6 17946.0 417.3
1994-95 35436.8 21762.9 20101.0 428.1
1995-96 39597.6 22247.9 22417.9 396.0
1996-97 44627.3 30911.8 24319.4 481.9
1997-98 49057.8 33846.3 28589.0 545.2
1998-99 53657.6 36829.3 29619.5 614.5
1999-00 58353.4 39772 22938.8 916.9
2000-01 63341.0 43051.8 34880.5 1130.5
2001-02 70117.5 47147.3 37837.6 1520.2
2002-03 77915.8 51099.1 41068.2 1673.3
2003-04 87474.5 56061.8 42904.9 2005.7
2004-05 98490.0 59346.9 47370.2 1676.4
2005-06 112180.4 65878.4 54491.4 2260.6
2006-07 130168.7 76030.7 62731.5 2054.3
2007-08 151055.9 73745.0 71720.1 1556.5
2008-09 176287.0 83290.4 79861.8 1797.1
2009-10 202868.9 100201.4 86964.0 2265.3
2010-11 231121.1 118586.3 94535.6 2145.4
2011-12 257463.3 138547.3 104110.4 2134.9
2012-13 257463.3 162678.9 123732.6 2447.8
20
Financial ResultsRs.in Crores
Misc. Receipts
Total Revenue Receipts
Total Working Expenses
Misc. Expd.
Total Revenue
Expd.
4 5 6 7 8
0.2 1006.9 847.3 14.9 862.2
0.4 1097.0 911.9 16.0 927.9
0.3 1162.7 928.6 15.7 998.3
0.3 1138.2 1066.3 16.5 1082.8
7.3 1415.2 1317.3 24.3 1341.6
8.5 1775.5 1609.6 28.9 1638.5
9.6 2045.7 1718.6 30.8 1749.4
10.4 2133.8 1750.1 30.9 1781.0
10.3 2161.3 1867.6 32.9 1900.5
66.6 2404.4 2142.4 34.7 2177.1
79.5 2703.5 2536.5 39.5 2576.0
89.5 3627.8 3182.0 42.7 3224.7
107.1 4483.3 3883.3 45.7 3929.0
102.8 5089.1 4661.5 48.6 4710.1
110.3 5469.1 5142.2 56.8 5199.0
162.6 6590.7 5823.1 81.7 5904.8
177.4 7683.8 6900.6 101.7 7002.3
244.2 8679.5 7802.9 153.4 7956.3244.2 8679.5 7802.9 153.4 7956.3
269.3 9528.6 8633.0 158.3 8791.3
301.8 11041.2 8997.7 171.5 10059.2
355.1 12451.6 11154.0 183.9 11337.9
383.0 14113.7 12389.2 183.6 12572.8
426.3 16114.7 13980.1 179.2 14159.3
417.3 18363.3 15134.5 126.6 15261.1
428.1 20529.8 16590.1 130.9 16721.0
396.0 22813.9 18524.9 153.7 18678.6
481.9 24801.3 21000.8 176.0 21176.8
545.2 29134.2 25876.0 233.8 26109.8
614.5 30234.0 27834.6 258.2 28092.8
916.9 33855.7 30844.0 276.0 31120.0
1130.5 36011.0 34667.3 272.4 34939.7
1520.2 39357.8 36293.2 727.1 37020.3
1673.3 42741.5 38025.8 885.5 38911.3
2005.7 44910.6 39482.2 949.9 40432.1
1676.4 49046.6 42758.9 1014.2 43773.1
2260.6 56752.0 45291.6 1120.5 46412.1
2054.3 64785.8 49046.5 1286.5 50333.0
1556.5 73276.6 54462.2 480.4 54942.6
1797.1 81658.9 71839.3 645.2 72484.5
2265.3 89229.3 82915.4 769.8 83685.2
2145.4 96681.0 89474.2 860.7 90334.9
2134.9 106245.3 98667.4 796.3 99463.7
2447.8 126180.4 111572.0 993.2 112565.2
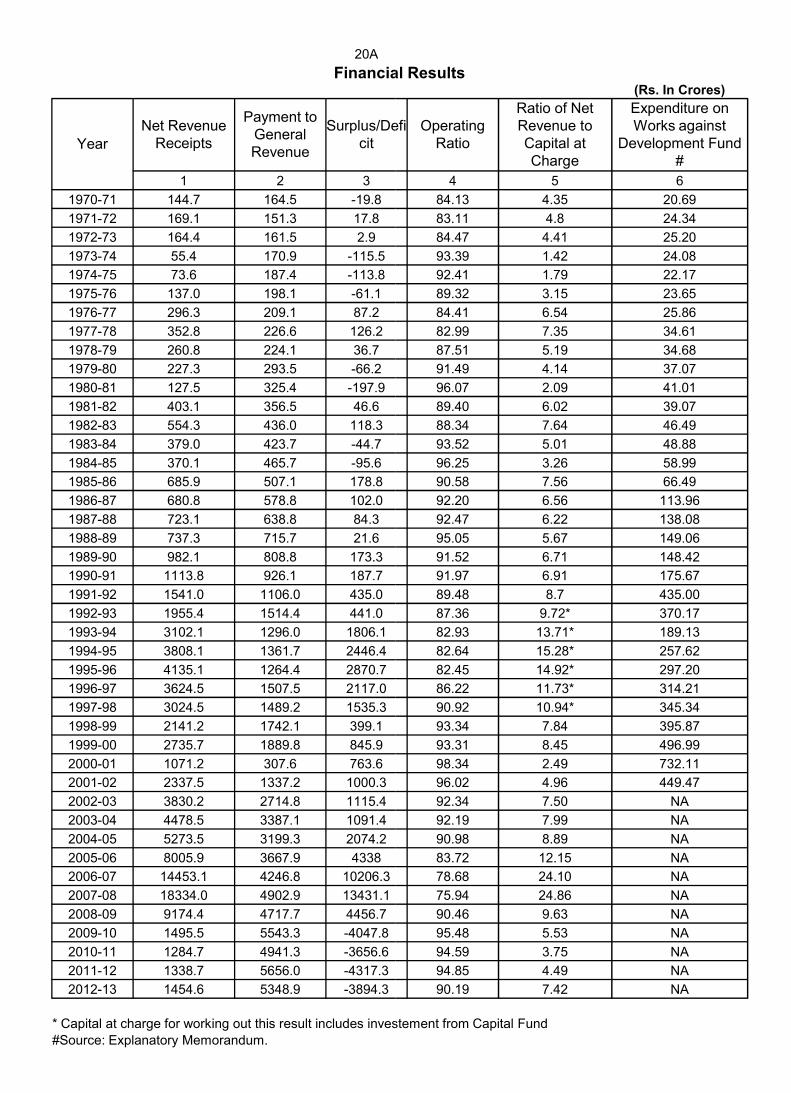
20A
Financial Results
YearNet Revenue
Receipts
Payment to General Revenue
Surplus/Deficit
1 2 3
1970-71 144.7 164.5 -19.8
1971-72 169.1 151.3 17.8
1972-73 164.4 161.5 2.9
1973-74 55.4 170.9 -115.5
1974-75 73.6 187.4 -113.8
1975-76 137.0 198.1 -61.1
1976-77 296.3 209.1 87.2
1977-78 352.8 226.6 126.2
1978-79 260.8 224.1 36.7
1979-80 227.3 293.5 -66.2
1980-81 127.5 325.4 -197.9
1981-82 403.1 356.5 46.6
1982-83 554.3 436.0 118.3
1983-84 379.0 423.7 -44.7
1984-85 370.1 465.7 -95.6
1985-86 685.9 507.1 178.8
1986-87 680.8 578.8 102.0
1987-88 723.1 638.8 84.3
1988-89 737.3 715.7 21.6
1989-90 982.1 808.8 173.3
1990-91 1113.8 926.1 187.7
1991-92 1541.0 1106.0 435.0
1992-93 1955.4 1514.4 441.0
1993-94 3102.1 1296.0 1806.1
1994-95 3808.1 1361.7 2446.4
1995-96 4135.1 1264.4 2870.7
1996-97 3624.5 1507.5 2117.0
1997-98 3024.5 1489.2 1535.3
1998-99 2141.2 1742.1 399.1
1999-00 2735.7 1889.8 845.9
2000-01 1071.2 307.6 763.6
2001-02 2337.5 1337.2 1000.3
2002-03 3830.2 2714.8 1115.4
2003-04 4478.5 3387.1 1091.4
2004-05 5273.5 3199.3 2074.2
2005-06 8005.9 3667.9 4338
2006-07 14453.1 4246.8 10206.3
2007-08 18334.0 4902.9 13431.1
2008-09 9174.4 4717.7 4456.7
2009-10 1495.5 5543.3 -4047.8
2010-11 1284.7 4941.3 -3656.6
2011-12 1338.7 5656.0 -4317.3
2012-13 1454.6 5348.9 -3894.3
* Capital at charge for working out this result includes investement
#Source: Explanatory Memorandum.
Financial Results(Rs. In Crores)
Surplus/Defi Operating Ratio
Ratio of Net Revenue to Capital at Charge
Expenditure on Works against
Development Fund #
4 5 6
84.13 4.35 20.69
83.11 4.8 24.34
84.47 4.41 25.20
93.39 1.42 24.08
92.41 1.79 22.17
89.32 3.15 23.65
84.41 6.54 25.86
82.99 7.35 34.61
87.51 5.19 34.68
91.49 4.14 37.07
96.07 2.09 41.01
89.40 6.02 39.07
88.34 7.64 46.49
93.52 5.01 48.88
96.25 3.26 58.99
90.58 7.56 66.49
92.20 6.56 113.96
92.47 6.22 138.08
95.05 5.67 149.06
91.52 6.71 148.42
91.97 6.91 175.67
89.48 8.7 435.00
87.36 9.72* 370.17
82.93 13.71* 189.13
82.64 15.28* 257.62
82.45 14.92* 297.20
86.22 11.73* 314.21
90.92 10.94* 345.34
93.34 7.84 395.87
93.31 8.45 496.99
98.34 2.49 732.11
96.02 4.96 449.47
92.34 7.50 NA
92.19 7.99 NA
90.98 8.89 NA
83.72 12.15 NA
78.68 24.10 NA
75.94 24.86 NA
90.46 9.63 NA
95.48 5.53 NA
94.59 3.75 NA
94.85 4.49 NA
90.19 7.42 NA
investement from Capital Fund
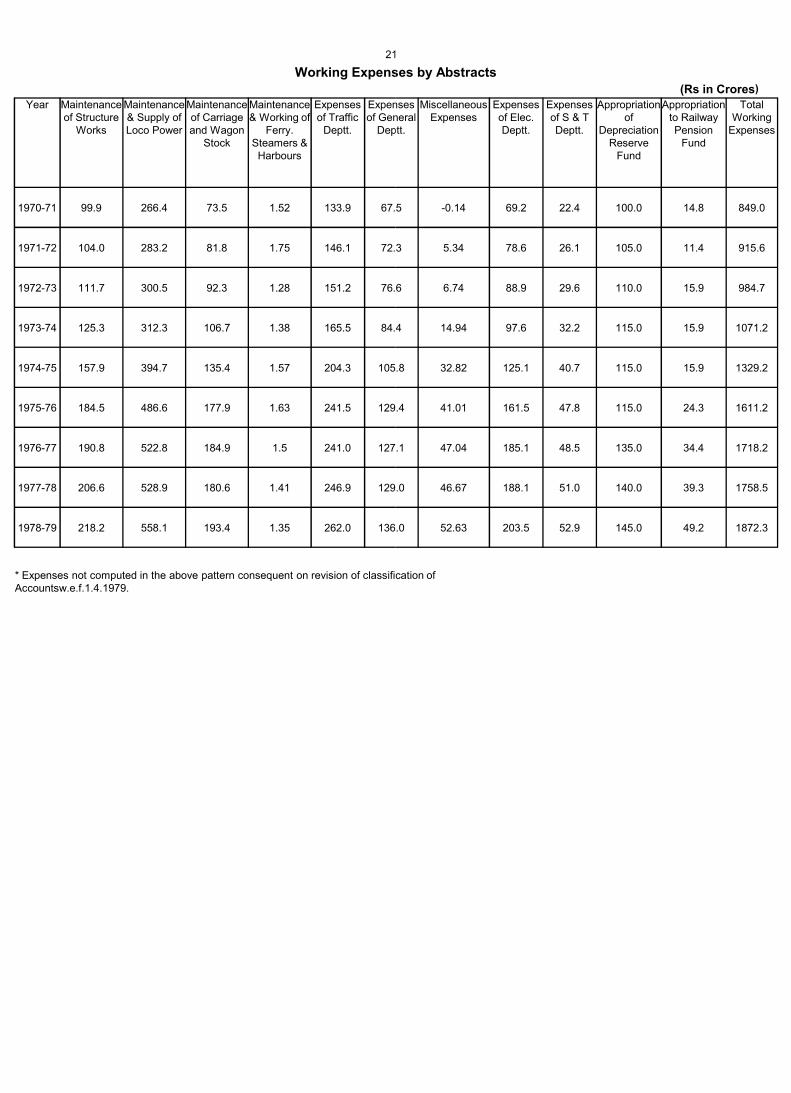
21
Working Expenses by Abstracts
Year Maintenance of Structure
Works
Maintenance & Supply of Loco Power
Maintenance of Carriage and Wagon
Stock
Maintenance & Working of
Ferry. Steamers & Harbours
Expenses of Traffic
Deptt.
Expenses of General
Deptt
1970-71 99.9 266.4 73.5 1.52 133.9 67.5
1971-72 104.0 283.2 81.8 1.75 146.1 72.3
1972-73 111.7 300.5 92.3 1.28 151.2 76.6
1973-74 125.3 312.3 106.7 1.38 165.5 84.4
1974-75 157.9 394.7 135.4 1.57 204.3 105.8
1975-76 184.5 486.6 177.9 1.63 241.5 129.4
1976-77 190.8 522.8 184.9 1.5 241.0 127.1
1977-78 206.6 528.9 180.6 1.41 246.9 129.0
1978-79 218.2 558.1 193.4 1.35 262.0 136.0
* Expenses not computed in the above pattern consequent on revision of classification of Accountsw.e.f.1.4.1979.
21
Working Expenses by Abstracts(Rs in Crores)
Expenses of General
Deptt.
Miscellaneous Expenses
Expenses of Elec. Deptt.
Expenses of S & T Deptt.
Appropriation of
Depreciation Reserve
Fund
Appropriation to Railway Pension
Fund
Total Working
Expenses
67.5 -0.14 69.2 22.4 100.0 14.8 849.0
72.3 5.34 78.6 26.1 105.0 11.4 915.6
76.6 6.74 88.9 29.6 110.0 15.9 984.7
84.4 14.94 97.6 32.2 115.0 15.9 1071.2
105.8 32.82 125.1 40.7 115.0 15.9 1329.2
129.4 41.01 161.5 47.8 115.0 24.3 1611.2
127.1 47.04 185.1 48.5 135.0 34.4 1718.2
129.0 46.67 188.1 51.0 140.0 39.3 1758.5
136.0 52.63 203.5 52.9 145.0 49.2 1872.3
* Expenses not computed in the above pattern consequent on revision of classification of
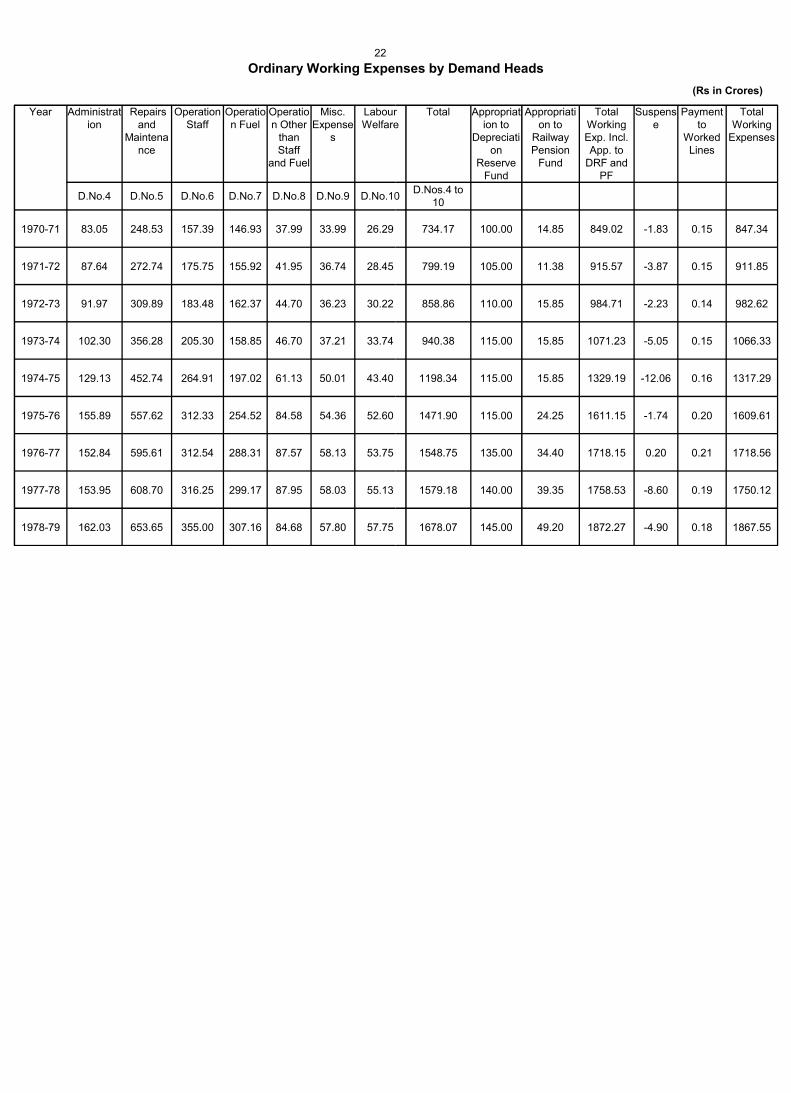
22
Ordinary Working Expenses by Demand Heads
Year Administration
Repairs and
Maintenance
Operation Staff
Operation Fuel
Operation Other
than Staff
and Fuel
Misc. Expense
s
Labour Welfare
D.No.4 D.No.5 D.No.6 D.No.7 D.No.8 D.No.9 D.No.10
1970-71 83.05 248.53 157.39 146.93 37.99 33.99 26.29
1971-72 87.64 272.74 175.75 155.92 41.95 36.74 28.45
1972-73 91.97 309.89 183.48 162.37 44.70 36.23 30.22
1973-74 102.30 356.28 205.30 158.85 46.70 37.21 33.74
1974-75 129.13 452.74 264.91 197.02 61.13 50.01 43.40
1975-76 155.89 557.62 312.33 254.52 84.58 54.36 52.60
1976-77 152.84 595.61 312.54 288.31 87.57 58.13 53.75
1977-78 153.95 608.70 316.25 299.17 87.95 58.03 55.13
1978-79 162.03 653.65 355.00 307.16 84.68 57.80 57.75
Ordinary Working Expenses by Demand Heads
(Rs in Crores)
Labour Welfare
Total Appropriation to
Depreciation
Reserve Fund
Appropriation to
Railway Pension
Fund
Total Working Exp. Incl. App. to
DRF and PF
Suspense
Payment to
Worked Lines
Total Working
Expenses
D.No.10D.Nos.4 to
10
734.17 100.00 14.85 849.02 -1.83 0.15 847.34
799.19 105.00 11.38 915.57 -3.87 0.15 911.85
858.86 110.00 15.85 984.71 -2.23 0.14 982.62
940.38 115.00 15.85 1071.23 -5.05 0.15 1066.33
1198.34 115.00 15.85 1329.19 -12.06 0.16 1317.29
1471.90 115.00 24.25 1611.15 -1.74 0.20 1609.61
1548.75 135.00 34.40 1718.15 0.20 0.21 1718.56
1579.18 140.00 39.35 1758.53 -8.60 0.19 1750.12
1678.07 145.00 49.20 1872.27 -4.90 0.18 1867.55
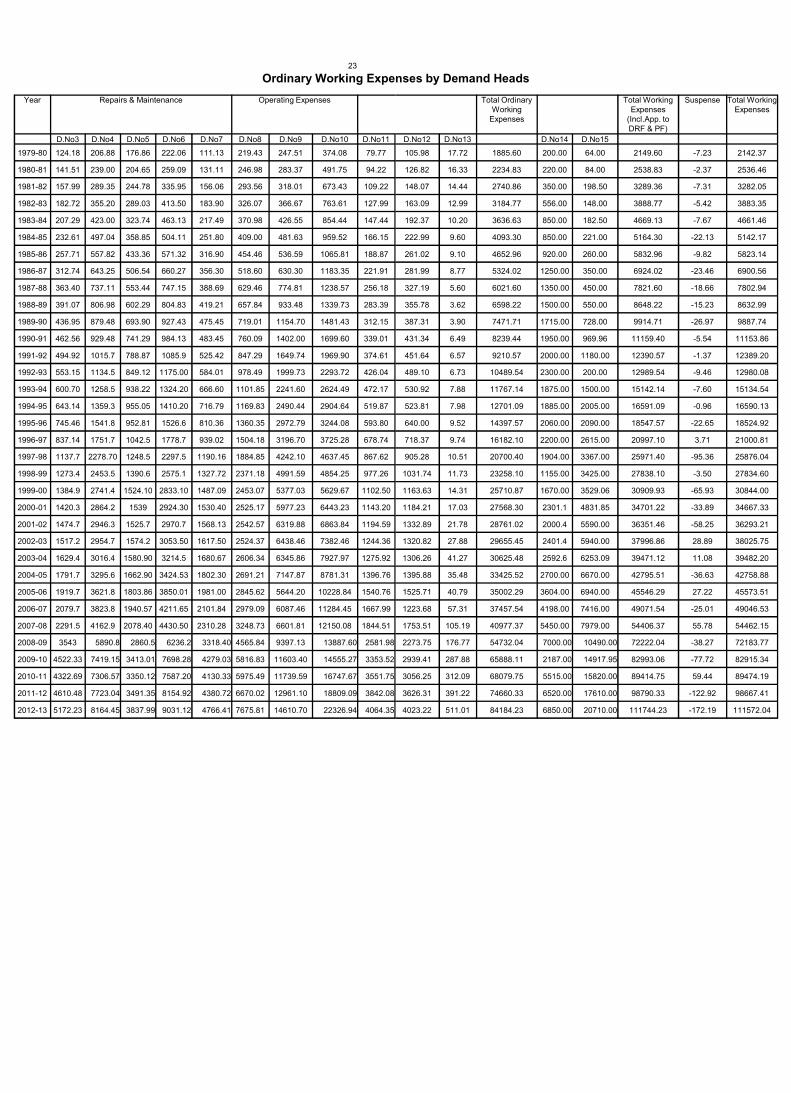
23
Ordinary Working Expenses by Demand Heads
Year Repairs & Maintenance Operating Expenses
D.No3 D.No4 D.No5 D.No6 D.No7 D.No8 D.No9 D.No10 D.No11
1979-80 124.18 206.88 176.86 222.06 111.13 219.43 247.51 374.08 79.77
1980-81 141.51 239.00 204.65 259.09 131.11 246.98 283.37 491.75 94.22
1981-82 157.99 289.35 244.78 335.95 156.06 293.56 318.01 673.43 109.22
1982-83 182.72 355.20 289.03 413.50 183.90 326.07 366.67 763.61 127.99
1983-84 207.29 423.00 323.74 463.13 217.49 370.98 426.55 854.44 147.44
1984-85 232.61 497.04 358.85 504.11 251.80 409.00 481.63 959.52 166.15
1985-86 257.71 557.82 433.36 571.32 316.90 454.46 536.59 1065.81 188.87
1986-87 312.74 643.25 506.54 660.27 356.30 518.60 630.30 1183.35 221.91
1987-88 363.40 737.11 553.44 747.15 388.69 629.46 774.81 1238.57 256.18
1988-89 391.07 806.98 602.29 804.83 419.21 657.84 933.48 1339.73 283.39
1989-90 436.95 879.48 693.90 927.43 475.45 719.01 1154.70 1481.43 312.15
1990-91 462.56 929.48 741.29 984.13 483.45 760.09 1402.00 1699.60 339.01
1991-92 494.92 1015.7 788.87 1085.9 525.42 847.29 1649.74 1969.90 374.61
1992-93 553.15 1134.5 849.12 1175.00 584.01 978.49 1999.73 2293.72 426.04
1993-94 600.70 1258.5 938.22 1324.20 666.60 1101.85 2241.60 2624.49 472.17
1994-95 643.14 1359.3 955.05 1410.20 716.79 1169.83 2490.44 2904.64 519.87
1995-96 745.46 1541.8 952.81 1526.6 810.36 1360.35 2972.79 3244.08 593.80
1996-97 837.14 1751.7 1042.5 1778.7 939.02 1504.18 3196.70 3725.28 678.74
1997-98 1137.7 2278.70 1248.5 2297.5 1190.16 1884.85 4242.10 4637.45 867.62
1998-99 1273.4 2453.5 1390.6 2575.1 1327.72 2371.18 4991.59 4854.25 977.26
1999-00 1384.9 2741.4 1524.10 2833.10 1487.09 2453.07 5377.03 5629.67 1102.50
2000-01 1420.3 2864.2 1539 2924.30 1530.40 2525.17 5977.23 6443.23 1143.20
2001-02 1474.7 2946.3 1525.7 2970.7 1568.13 2542.57 6319.88 6863.84 1194.59
2002-03 1517.2 2954.7 1574.2 3053.50 1617.50 2524.37 6438.46 7382.46 1244.36
2003-04 1629.4 3016.4 1580.90 3214.5 1680.67 2606.34 6345.86 7927.97 1275.92
2004-05 1791.7 3295.6 1662.90 3424.53 1802.30 2691.21 7147.87 8781.31 1396.76
2005-06 1919.7 3621.8 1803.86 3850.01 1981.00 2845.62 5644.20 10228.84 1540.76
2006-07 2079.7 3823.8 1940.57 4211.65 2101.84 2979.09 6087.46 11284.45 1667.99
2007-08 2291.5 4162.9 2078.40 4430.50 2310.28 3248.73 6601.81 12150.08 1844.51
2008-09 3543 5890.8 2860.5 6236.2 3318.40 4565.84 9397.13 13887.60 2581.98
2009-10 4522.33 7419.15 3413.01 7698.28 4279.03 5816.83 11603.40 14555.27 3353.52
2010-11 4322.69 7306.57 3350.12 7587.20 4130.33 5975.49 11739.59 16747.67 3551.75
2011-12 4610.48 7723.04 3491.35 8154.92 4380.72 6670.02 12961.10 18809.09 3842.08
2012-13 5172.23 8164.45 3837.99 9031.12 4766.41 7675.81 14610.70 22326.94 4064.35
Ordinary Working Expenses by Demand Heads
Total Ordinary Working
Expenses
Total Working Expenses
(Incl.App. to DRF & PF)
Suspense Total Working Expenses
D.No12 D.No13 D.No14 D.No15
105.98 17.72 1885.60 200.00 64.00 2149.60 -7.23 2142.37
126.82 16.33 2234.83 220.00 84.00 2538.83 -2.37 2536.46
148.07 14.44 2740.86 350.00 198.50 3289.36 -7.31 3282.05
163.09 12.99 3184.77 556.00 148.00 3888.77 -5.42 3883.35
192.37 10.20 3636.63 850.00 182.50 4669.13 -7.67 4661.46
222.99 9.60 4093.30 850.00 221.00 5164.30 -22.13 5142.17
261.02 9.10 4652.96 920.00 260.00 5832.96 -9.82 5823.14
281.99 8.77 5324.02 1250.00 350.00 6924.02 -23.46 6900.56
327.19 5.60 6021.60 1350.00 450.00 7821.60 -18.66 7802.94
355.78 3.62 6598.22 1500.00 550.00 8648.22 -15.23 8632.99
387.31 3.90 7471.71 1715.00 728.00 9914.71 -26.97 9887.74
431.34 6.49 8239.44 1950.00 969.96 11159.40 -5.54 11153.86
451.64 6.57 9210.57 2000.00 1180.00 12390.57 -1.37 12389.20
489.10 6.73 10489.54 2300.00 200.00 12989.54 -9.46 12980.08
530.92 7.88 11767.14 1875.00 1500.00 15142.14 -7.60 15134.54
523.81 7.98 12701.09 1885.00 2005.00 16591.09 -0.96 16590.13
640.00 9.52 14397.57 2060.00 2090.00 18547.57 -22.65 18524.92
718.37 9.74 16182.10 2200.00 2615.00 20997.10 3.71 21000.81
905.28 10.51 20700.40 1904.00 3367.00 25971.40 -95.36 25876.04
1031.74 11.73 23258.10 1155.00 3425.00 27838.10 -3.50 27834.60
1163.63 14.31 25710.87 1670.00 3529.06 30909.93 -65.93 30844.00
1184.21 17.03 27568.30 2301.1 4831.85 34701.22 -33.89 34667.33
1332.89 21.78 28761.02 2000.4 5590.00 36351.46 -58.25 36293.21
1320.82 27.88 29655.45 2401.4 5940.00 37996.86 28.89 38025.75
1306.26 41.27 30625.48 2592.6 6253.09 39471.12 11.08 39482.20
1395.88 35.48 33425.52 2700.00 6670.00 42795.51 -36.63 42758.88
1525.71 40.79 35002.29 3604.00 6940.00 45546.29 27.22 45573.51
1223.68 57.31 37457.54 4198.00 7416.00 49071.54 -25.01 49046.53
1753.51 105.19 40977.37 5450.00 7979.00 54406.37 55.78 54462.15
2273.75 176.77 54732.04 7000.00 10490.00 72222.04 -38.27 72183.77
2939.41 287.88 65888.11 2187.00 14917.95 82993.06 -77.72 82915.34
3056.25 312.09 68079.75 5515.00 15820.00 89414.75 59.44 89474.19
3626.31 391.22 74660.33 6520.00 17610.00 98790.33 -122.92 98667.41
4023.22 511.01 84184.23 6850.00 20710.00 111744.23 -172.19 111572.04
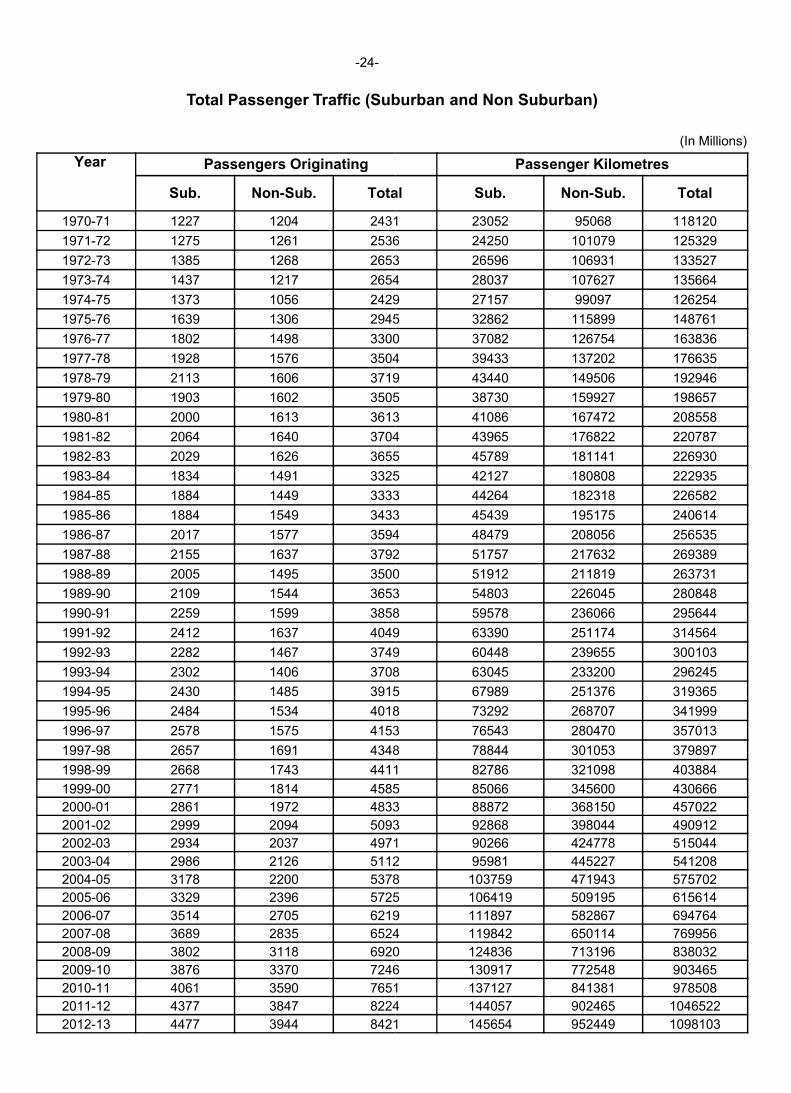
-24-
Total Passenger Traffic (Suburban and Non Suburban)
Year Passengers Originating
Sub. Non-Sub. Total
1970-71 1227 1204 2431
1971-72 1275 1261 2536
1972-73 1385 1268 2653
1973-74 1437 1217 2654
1974-75 1373 1056 2429
1975-76 1639 1306 2945
1976-77 1802 1498 3300
1977-78 1928 1576 3504
1978-79 2113 1606 3719
1979-80 1903 1602 3505
1980-81 2000 1613 3613
1981-82 2064 1640 3704
1982-83 2029 1626 3655
1983-84 1834 1491 3325
1984-85 1884 1449 3333
1985-86 1884 1549 3433
1986-87 2017 1577 3594
1987-88 2155 1637 3792
1988-89 2005 1495 3500
1989-90 2109 1544 3653
1990-91 2259 1599 3858
1991-92 2412 1637 4049
1992-93 2282 1467 3749
1993-94 2302 1406 3708
1994-95 2430 1485 3915
1995-96 2484 1534 4018
1996-97 2578 1575 4153
1997-98 2657 1691 4348
1998-99 2668 1743 4411
1999-00 2771 1814 4585
2000-01 2861 1972 4833
2001-02 2999 2094 5093
2002-03 2934 2037 4971
2003-04 2986 2126 5112
2004-05 3178 2200 5378
2005-06 3329 2396 5725
2006-07 3514 2705 6219
2007-08 3689 2835 6524
2008-09 3802 3118 6920
2009-10 3876 3370 7246
2010-11 4061 3590 7651
2011-12 4377 3847 8224
2012-13 4477 3944 8421
Total Passenger Traffic (Suburban and Non Suburban)
(In Millions)
Passenger Kilometres
Total Sub. Non-Sub. Total
2431 23052 95068 118120
2536 24250 101079 125329
2653 26596 106931 133527
2654 28037 107627 135664
2429 27157 99097 126254
2945 32862 115899 148761
3300 37082 126754 163836
3504 39433 137202 176635
3719 43440 149506 192946
3505 38730 159927 198657
3613 41086 167472 208558
3704 43965 176822 220787
3655 45789 181141 226930
3325 42127 180808 222935
3333 44264 182318 226582
3433 45439 195175 240614
3594 48479 208056 256535
3792 51757 217632 269389
3500 51912 211819 263731
3653 54803 226045 280848
3858 59578 236066 295644
4049 63390 251174 314564
3749 60448 239655 300103
3708 63045 233200 296245
3915 67989 251376 319365
4018 73292 268707 341999
4153 76543 280470 357013
4348 78844 301053 379897
4411 82786 321098 403884
4585 85066 345600 430666
4833 88872 368150 457022
5093 92868 398044 490912
4971 90266 424778 515044
5112 95981 445227 541208
5378 103759 471943 575702
5725 106419 509195 615614
6219 111897 582867 694764
6524 119842 650114 769956
6920 124836 713196 838032
7246 130917 772548 903465
7651 137127 841381 978508
8224 144057 902465 1046522
8421 145654 952449 1098103
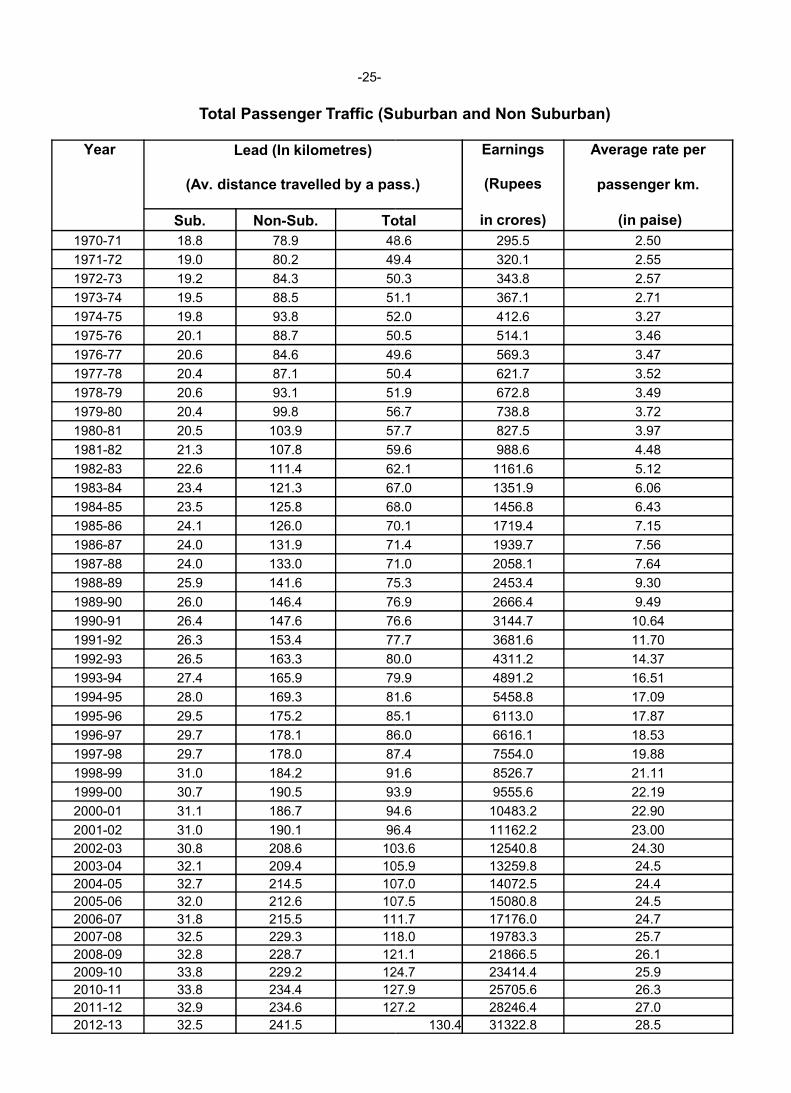
-25-
Total Passenger Traffic (Suburban and Non Suburban)
Year Lead (In kilometres)
(Av. distance travelled by a pass.)
Sub. Non-Sub. Total
1970-71 18.8 78.9 48.6
1971-72 19.0 80.2 49.4
1972-73 19.2 84.3 50.3
1973-74 19.5 88.5 51.1
1974-75 19.8 93.8 52.0
1975-76 20.1 88.7 50.5
1976-77 20.6 84.6 49.6
1977-78 20.4 87.1 50.4
1978-79 20.6 93.1 51.9
1979-80 20.4 99.8 56.7
1980-81 20.5 103.9 57.7
1981-82 21.3 107.8 59.6
1982-83 22.6 111.4 62.1
1983-84 23.4 121.3 67.0
1984-85 23.5 125.8 68.0
1985-86 24.1 126.0 70.1
1986-87 24.0 131.9 71.41986-87 24.0 131.9 71.4
1987-88 24.0 133.0 71.0
1988-89 25.9 141.6 75.3
1989-90 26.0 146.4 76.9
1990-91 26.4 147.6 76.6
1991-92 26.3 153.4 77.7
1992-93 26.5 163.3 80.0
1993-94 27.4 165.9 79.9
1994-95 28.0 169.3 81.6
1995-96 29.5 175.2 85.1
1996-97 29.7 178.1 86.0
1997-98 29.7 178.0 87.4
1998-99 31.0 184.2 91.6
1999-00 30.7 190.5 93.9
2000-01 31.1 186.7 94.6
2001-02 31.0 190.1 96.4
2002-03 30.8 208.6 103.6
2003-04 32.1 209.4 105.9
2004-05 32.7 214.5 107.0
2005-06 32.0 212.6 107.5
2006-07 31.8 215.5 111.7
2007-08 32.5 229.3 118.0
2008-09 32.8 228.7 121.1
2009-10 33.8 229.2 124.7
2010-11 33.8 234.4 127.9
2011-12 32.9 234.6 127.2
2012-13 32.5 241.5
Total Passenger Traffic (Suburban and Non Suburban)
Earnings Average rate per
(Av. distance travelled by a pass.) (Rupees passenger km.
Total in crores) (in paise)
48.6 295.5 2.50
49.4 320.1 2.55
50.3 343.8 2.57
51.1 367.1 2.71
52.0 412.6 3.27
50.5 514.1 3.46
49.6 569.3 3.47
50.4 621.7 3.52
51.9 672.8 3.49
56.7 738.8 3.72
57.7 827.5 3.97
59.6 988.6 4.48
62.1 1161.6 5.12
67.0 1351.9 6.06
68.0 1456.8 6.43
70.1 1719.4 7.15
71.4 1939.7 7.5671.4 1939.7 7.56
71.0 2058.1 7.64
75.3 2453.4 9.30
76.9 2666.4 9.49
76.6 3144.7 10.64
77.7 3681.6 11.70
80.0 4311.2 14.37
79.9 4891.2 16.51
81.6 5458.8 17.09
85.1 6113.0 17.87
86.0 6616.1 18.53
87.4 7554.0 19.88
91.6 8526.7 21.11
93.9 9555.6 22.19
94.6 10483.2 22.90
96.4 11162.2 23.00
103.6 12540.8 24.30
105.9 13259.8 24.5
107.0 14072.5 24.4
107.5 15080.8 24.5
111.7 17176.0 24.7
118.0 19783.3 25.7
121.1 21866.5 26.1
124.7 23414.4 25.9
127.9 25705.6 26.3
127.2 28246.4 27.0
130.4 31322.8 28.5
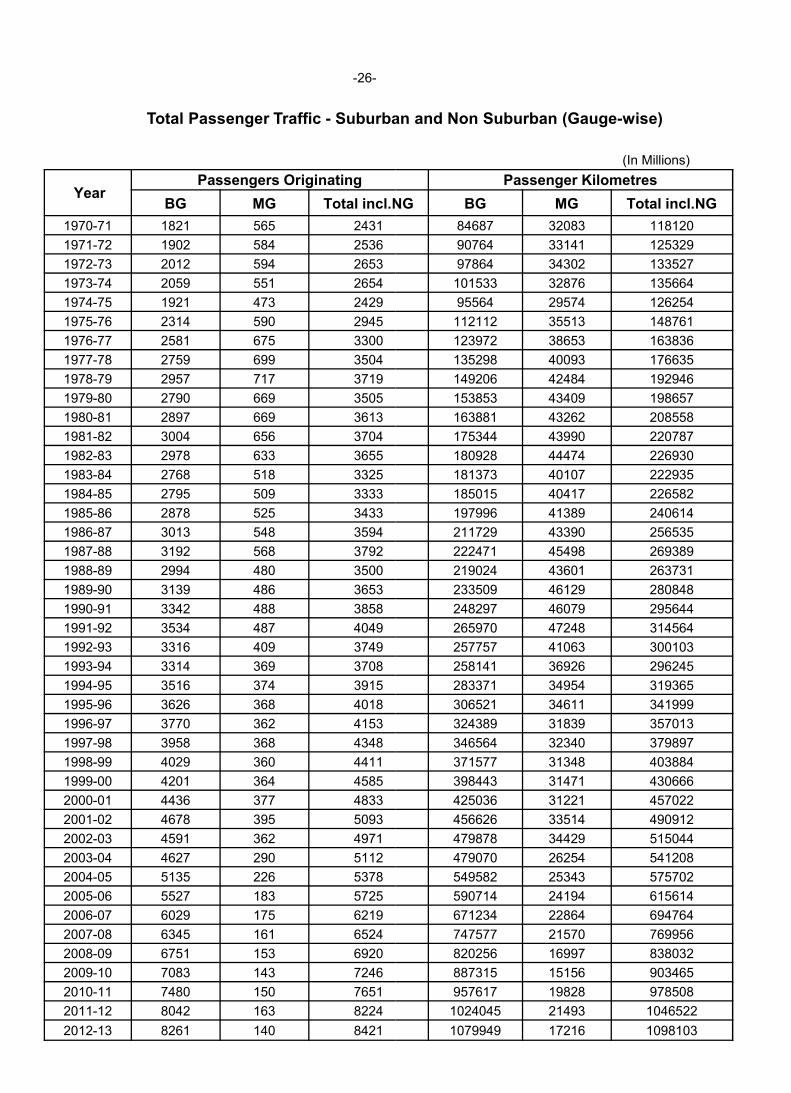
-26-
Total Passenger Traffic - Suburban and Non Suburban (Gauge
YearPassengers Originating
BG MG Total incl.NG
1970-71 1821 565 2431
1971-72 1902 584 2536
1972-73 2012 594 2653
1973-74 2059 551 2654
1974-75 1921 473 2429
1975-76 2314 590 2945
1976-77 2581 675 3300
1977-78 2759 699 3504
1978-79 2957 717 3719
1979-80 2790 669 3505
1980-81 2897 669 3613
1981-82 3004 656 3704
1982-83 2978 633 3655
1983-84 2768 518 3325
1984-85 2795 509 3333
1985-86 2878 525 3433
1986-87 3013 548 3594
1987-88 3192 568 37921987-88 3192 568 3792
1988-89 2994 480 3500
1989-90 3139 486 3653
1990-91 3342 488 3858
1991-92 3534 487 4049
1992-93 3316 409 3749
1993-94 3314 369 3708
1994-95 3516 374 3915
1995-96 3626 368 4018
1996-97 3770 362 4153
1997-98 3958 368 4348
1998-99 4029 360 4411
1999-00 4201 364 4585
2000-01 4436 377 4833
2001-02 4678 395 5093
2002-03 4591 362 4971
2003-04 4627 290 5112
2004-05 5135 226 5378
2005-06 5527 183 5725
2006-07 6029 175 6219
2007-08 6345 161 6524
2008-09 6751 153 6920
2009-10 7083 143 7246
2010-11 7480 150 7651
2011-12 8042 163 8224
2012-13 8261 140 8421
Suburban and Non Suburban (Gauge-wise)
(In Millions)
Passenger Kilometres
Total incl.NG BG MG Total incl.NG
84687 32083 118120
90764 33141 125329
97864 34302 133527
101533 32876 135664
95564 29574 126254
112112 35513 148761
123972 38653 163836
135298 40093 176635
149206 42484 192946
153853 43409 198657
163881 43262 208558
175344 43990 220787
180928 44474 226930
181373 40107 222935
185015 40417 226582
197996 41389 240614
211729 43390 256535
222471 45498 269389222471 45498 269389
219024 43601 263731
233509 46129 280848
248297 46079 295644
265970 47248 314564
257757 41063 300103
258141 36926 296245
283371 34954 319365
306521 34611 341999
324389 31839 357013
346564 32340 379897
371577 31348 403884
398443 31471 430666
425036 31221 457022
456626 33514 490912
479878 34429 515044
479070 26254 541208
549582 25343 575702
590714 24194 615614
671234 22864 694764
747577 21570 769956
820256 16997 838032
887315 15156 903465
957617 19828 978508
1024045 21493 1046522
1079949 17216 1098103
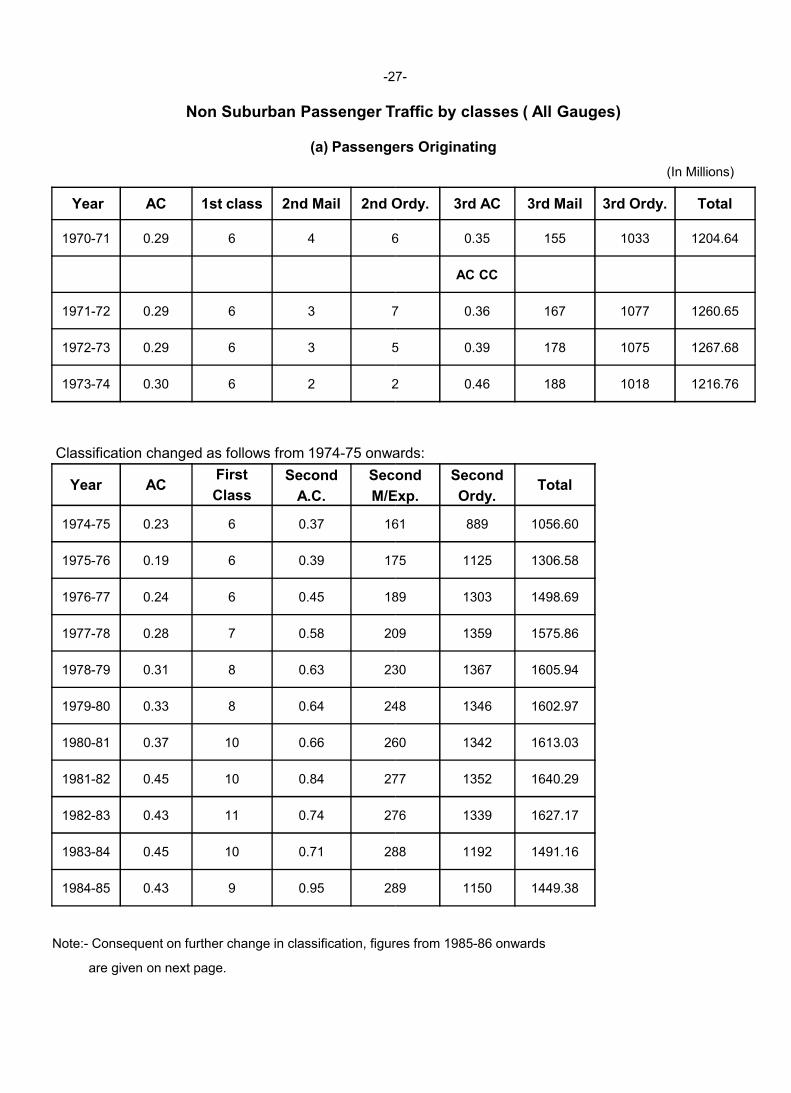
-27
Non Suburban Passenger Traffic by classes ( All Gauges)
(a) Passengers Originating
Year AC 1st class 2nd Mail 2nd Ordy
1970-71 0.29 6 4 6
1971-72 0.29 6 3 7
1972-73 0.29 6 3 5
1973-74 0.30 6 2 2
Classification changed as follows from 1974-75 onwards:
Year ACFirst Second Second
Class A.C. M/Exp.
1974-75 0.23 6 0.37 161
1975-76 0.19 6 0.39 175
1976-77 0.24 6 0.45 189
1977-78 0.28 7 0.58 209
1978-79 0.31 8 0.63 230
1979-80 0.33 8 0.64 248
1980-81 0.37 10 0.66 260
1981-82 0.45 10 0.84 277
1982-83 0.43 11 0.74 276
1983-84 0.45 10 0.71 288
1984-85 0.43 9 0.95 289
Note:- Consequent on further change in classification, figures from 1985
are given on next page.
27-
Non Suburban Passenger Traffic by classes ( All Gauges)
(a) Passengers Originating
(In Millions)
Ordy. 3rd AC 3rd Mail 3rd Ordy. Total
6 0.35 155 1033 1204.64
AC CC
7 0.36 167 1077 1260.65
5 0.39 178 1075 1267.68
2 0.46 188 1018 1216.76
75 onwards:
Second SecondTotal
M/Exp. Ordy.
161 889 1056.60
175 1125 1306.58
189 1303 1498.69
209 1359 1575.86
230 1367 1605.94
248 1346 1602.97
260 1342 1613.03
277 1352 1640.29
276 1339 1627.17
288 1192 1491.16
289 1150 1449.38
Consequent on further change in classification, figures from 1985-86 onwards
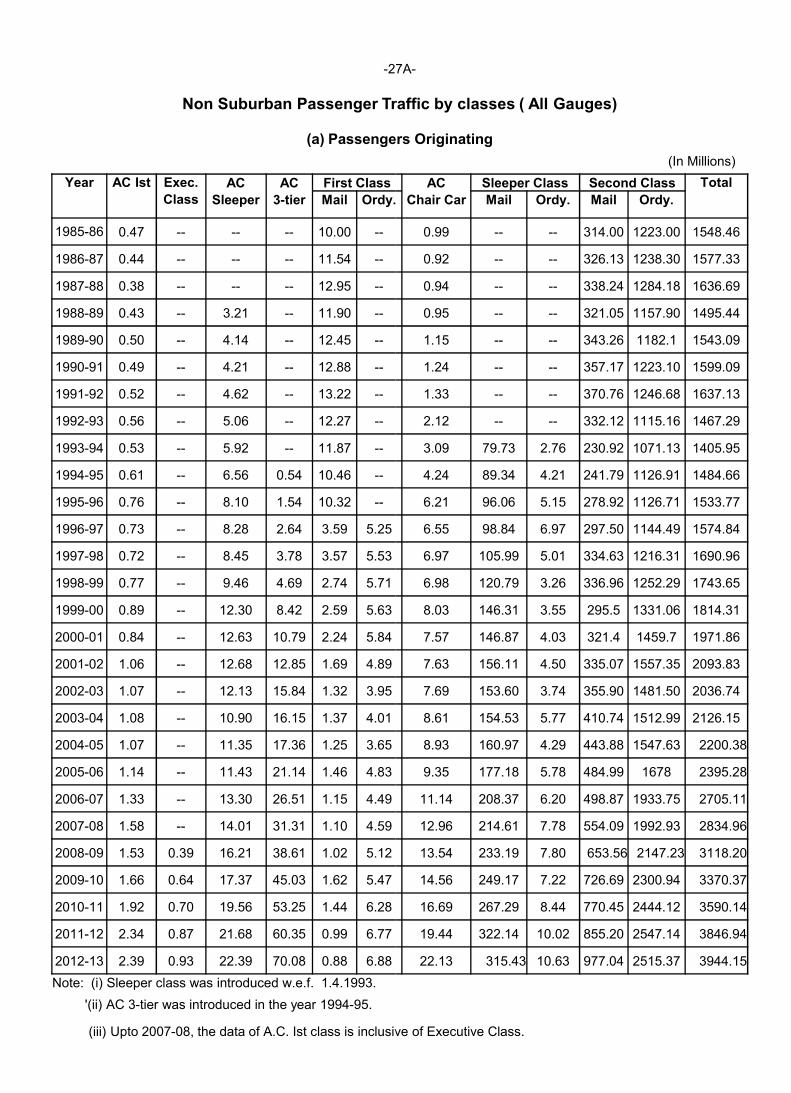
-27A
Non Suburban Passenger Traffic by classes ( All Gauges)
(a) Passengers Originating
Year AC Ist Exec. AC AC First ClassClass Sleeper 3-tier Mail Ordy.
1985-86 0.47 -- -- -- 10.00 --
1986-87 0.44 -- -- -- 11.54 --
1987-88 0.38 -- -- -- 12.95 --
1988-89 0.43 -- 3.21 -- 11.90 --
1989-90 0.50 -- 4.14 -- 12.45 --
1990-91 0.49 -- 4.21 -- 12.88 --
1991-92 0.52 -- 4.62 -- 13.22 --
1992-93 0.56 -- 5.06 -- 12.27 --
1993-94 0.53 -- 5.92 -- 11.87 --
1994-95 0.61 -- 6.56 0.54 10.46 --
1995-96 0.76 -- 8.10 1.54 10.32 --
1996-97 0.73 -- 8.28 2.64 3.59 5.25
1997-98 0.72 -- 8.45 3.78 3.57 5.53
1998-99 0.77 -- 9.46 4.69 2.74 5.71
1999-00 0.89 -- 12.30 8.42 2.59 5.63
2000-01 0.84 -- 12.63 10.79 2.24 5.84
2001-02 1.06 -- 12.68 12.85 1.69 4.89
2002-03 1.07 -- 12.13 15.84 1.32 3.95
2003-04 1.08 -- 10.90 16.15 1.37 4.01
2004-05 1.07 -- 11.35 17.36 1.25 3.65
2005-06 1.14 -- 11.43 21.14 1.46 4.83
2006-07 1.33 -- 13.30 26.51 1.15 4.49
2007-08 1.58 -- 14.01 31.31 1.10 4.59
2008-09 1.53 0.39 16.21 38.61 1.02 5.12
2009-10 1.66 0.64 17.37 45.03 1.62 5.47
2010-11 1.92 0.70 19.56 53.25 1.44 6.28
2011-12 2.34 0.87 21.68 60.35 0.99 6.77
2012-13 2.39 0.93 22.39 70.08 0.88 6.88
Note: (i) Sleeper class was introduced w.e.f. 1.4.1993.
'(ii) AC 3-tier was introduced in the year 1994-95.
(iii) Upto 2007-08, the data of A.C. Ist class is inclusive of Executive Class.
27A-
Non Suburban Passenger Traffic by classes ( All Gauges)
(a) Passengers Originating
(In Millions)
AC Sleeper Class Second Class Total
. Chair Car Mail Ordy. Mail Ordy.
0.99 -- -- 314.00 1223.00 1548.46
0.92 -- -- 326.13 1238.30 1577.33
0.94 -- -- 338.24 1284.18 1636.69
0.95 -- -- 321.05 1157.90 1495.44
1.15 -- -- 343.26 1182.1 1543.09
1.24 -- -- 357.17 1223.10 1599.09
1.33 -- -- 370.76 1246.68 1637.13
2.12 -- -- 332.12 1115.16 1467.29
3.09 79.73 2.76 230.92 1071.13 1405.95
4.24 89.34 4.21 241.79 1126.91 1484.66
6.21 96.06 5.15 278.92 1126.71 1533.77
6.55 98.84 6.97 297.50 1144.49 1574.84
6.97 105.99 5.01 334.63 1216.31 1690.96
6.98 120.79 3.26 336.96 1252.29 1743.65
8.03 146.31 3.55 295.5 1331.06 1814.31
7.57 146.87 4.03 321.4 1459.7 1971.86
7.63 156.11 4.50 335.07 1557.35 2093.83
7.69 153.60 3.74 355.90 1481.50 2036.74
8.61 154.53 5.77 410.74 1512.99 2126.15
8.93 160.97 4.29 443.88 1547.63 2200.38
9.35 177.18 5.78 484.99 1678 2395.28
11.14 208.37 6.20 498.87 1933.75 2705.11
12.96 214.61 7.78 554.09 1992.93 2834.96
13.54 233.19 7.80 653.56 2147.23 3118.20
14.56 249.17 7.22 726.69 2300.94 3370.37
16.69 267.29 8.44 770.45 2444.12 3590.14
19.44 322.14 10.02 855.20 2547.14 3846.94
22.13 315.43 10.63 977.04 2515.37 3944.15
08, the data of A.C. Ist class is inclusive of Executive Class.
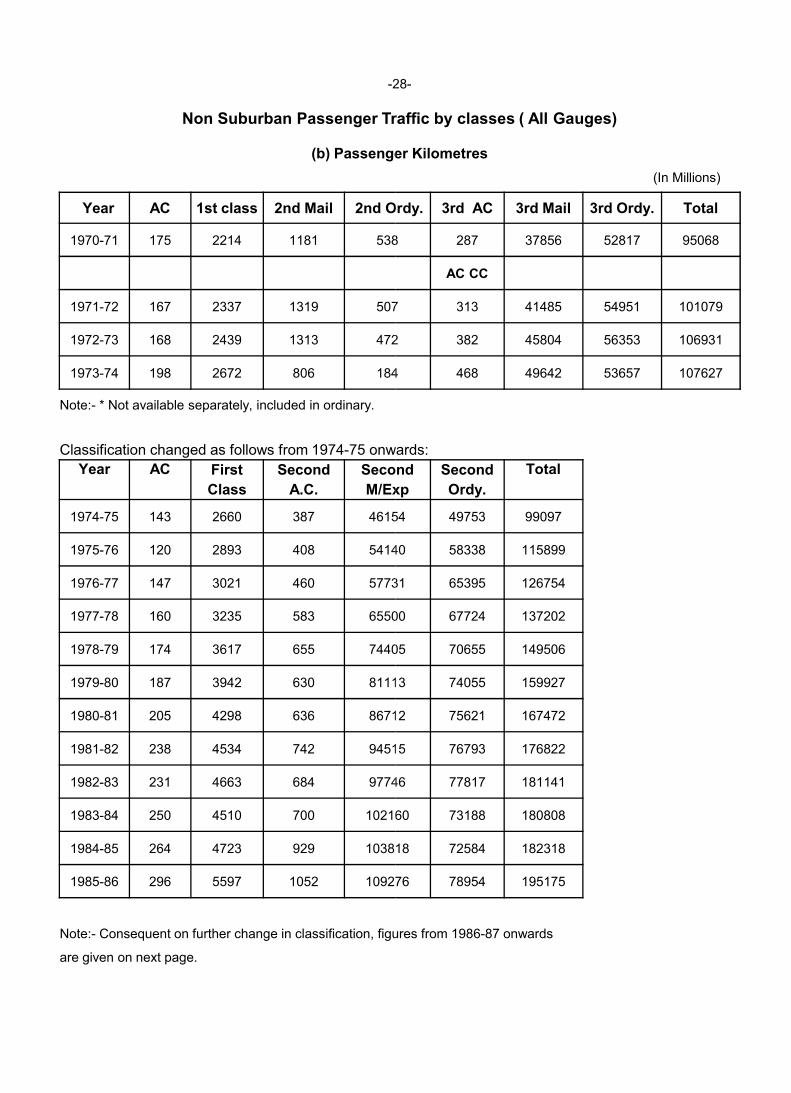
-28
Non Suburban Passenger Traffic by classes ( All Gauges)
(b) Passenger Kilometres
Year AC 1st class 2nd Mail 2nd Ordy
1970-71 175 2214 1181 538
1971-72 167 2337 1319 507
1972-73 168 2439 1313 472
1973-74 198 2672 806 184
Note:- * Not available separately, included in ordinary.
Classification changed as follows from 1974-75 onwards:
Year AC First Second Second
Class A.C. M/Exp
1974-75 143 2660 387 46154
1975-76 120 2893 408 541401975-76 120 2893 408 54140
1976-77 147 3021 460 57731
1977-78 160 3235 583 65500
1978-79 174 3617 655 74405
1979-80 187 3942 630 81113
1980-81 205 4298 636 86712
1981-82 238 4534 742 94515
1982-83 231 4663 684 97746
1983-84 250 4510 700 102160
1984-85 264 4723 929 103818
1985-86 296 5597 1052 109276
Note:- Consequent on further change in classification, figures from 1986
are given on next page.
28-
Non Suburban Passenger Traffic by classes ( All Gauges)
(b) Passenger Kilometres
(In Millions)
Ordy. 3rd AC 3rd Mail 3rd Ordy. Total
538 287 37856 52817 95068
AC CC
507 313 41485 54951 101079
472 382 45804 56353 106931
184 468 49642 53657 107627
75 onwards:
Second Second Total
M/Exp Ordy.
46154 49753 99097
54140 58338 11589954140 58338 115899
57731 65395 126754
65500 67724 137202
74405 70655 149506
81113 74055 159927
86712 75621 167472
94515 76793 176822
97746 77817 181141
102160 73188 180808
103818 72584 182318
109276 78954 195175
Consequent on further change in classification, figures from 1986-87 onwards
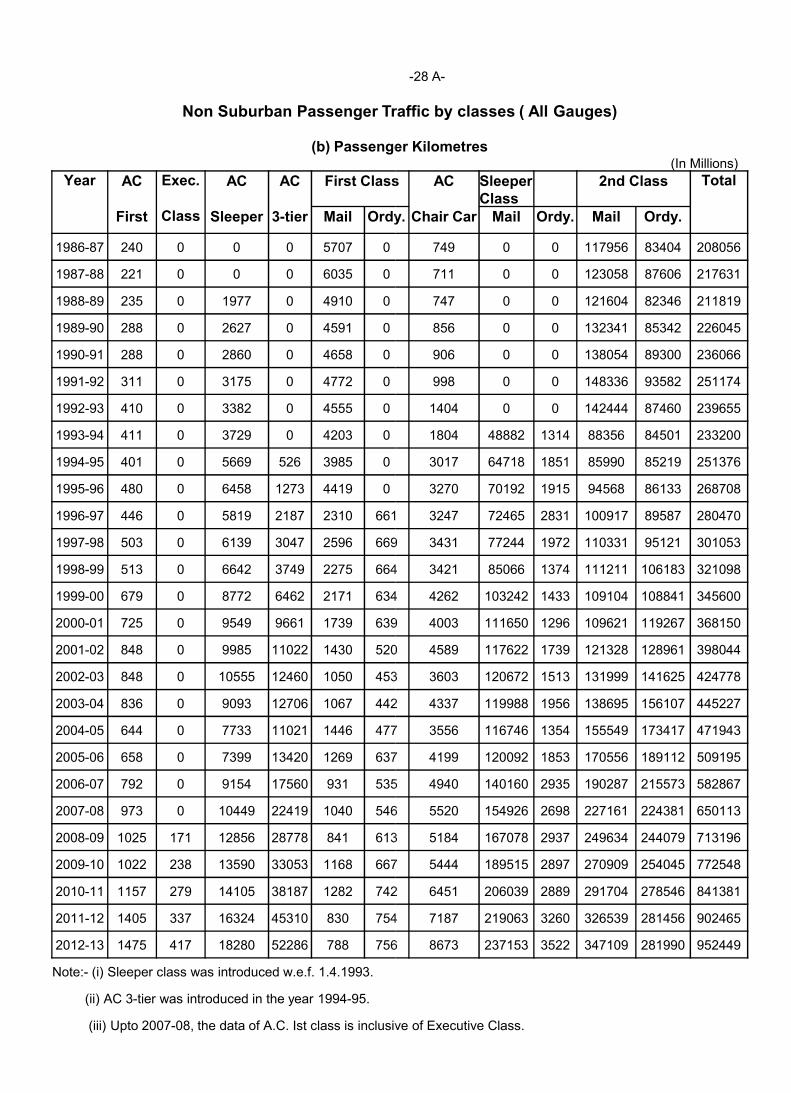
Non Suburban Passenger Traffic by classes ( All Gauges)
(b) Passenger Kilometres
Year AC Exec. AC AC First Class
First Class Sleeper 3-tier Mail Ordy
1986-87 240 0 0 0 5707 0
1987-88 221 0 0 0 6035 0
1988-89 235 0 1977 0 4910 0
1989-90 288 0 2627 0 4591 0
1990-91 288 0 2860 0 4658 0
1991-92 311 0 3175 0 4772 0
1992-93 410 0 3382 0 4555 0
1993-94 411 0 3729 0 4203 0
1994-95 401 0 5669 526 3985 0
1995-96 480 0 6458 1273 4419 0
1996-97 446 0 5819 2187 2310 661
1997-98 503 0 6139 3047 2596 6691997-98 503 0 6139 3047 2596 669
1998-99 513 0 6642 3749 2275 664
1999-00 679 0 8772 6462 2171 634
2000-01 725 0 9549 9661 1739 639
2001-02 848 0 9985 11022 1430 520
2002-03 848 0 10555 12460 1050 453
2003-04 836 0 9093 12706 1067 442
2004-05 644 0 7733 11021 1446 477
2005-06 658 0 7399 13420 1269 637
2006-07 792 0 9154 17560 931 535
2007-08 973 0 10449 22419 1040 546
2008-09 1025 171 12856 28778 841 613
2009-10 1022 238 13590 33053 1168 667
2010-11 1157 279 14105 38187 1282 742
2011-12 1405 337 16324 45310 830 754
2012-13 1475 417 18280 52286 788 756
Note:- (i) Sleeper class was introduced w.e.f. 1.4.1993.
(ii) AC 3-tier was introduced in the year 1994-95.
(iii) Upto 2007-08, the data of A.C. Ist class is inclusive of Executive Class.
-28 A-
Non Suburban Passenger Traffic by classes ( All Gauges)
(b) Passenger Kilometres (In Millions)
First Class AC Sleeper Class
2nd Class Total
Ordy. Chair Car Mail Ordy. Mail Ordy.
749 0 0 117956 83404 208056
711 0 0 123058 87606 217631
747 0 0 121604 82346 211819
856 0 0 132341 85342 226045
906 0 0 138054 89300 236066
998 0 0 148336 93582 251174
1404 0 0 142444 87460 239655
1804 48882 1314 88356 84501 233200
3017 64718 1851 85990 85219 251376
3270 70192 1915 94568 86133 268708
661 3247 72465 2831 100917 89587 280470
669 3431 77244 1972 110331 95121 301053669 3431 77244 1972 110331 95121 301053
664 3421 85066 1374 111211 106183 321098
634 4262 103242 1433 109104 108841 345600
639 4003 111650 1296 109621 119267 368150
520 4589 117622 1739 121328 128961 398044
453 3603 120672 1513 131999 141625 424778
442 4337 119988 1956 138695 156107 445227
477 3556 116746 1354 155549 173417 471943
637 4199 120092 1853 170556 189112 509195
535 4940 140160 2935 190287 215573 582867
546 5520 154926 2698 227161 224381 650113
613 5184 167078 2937 249634 244079 713196
667 5444 189515 2897 270909 254045 772548
742 6451 206039 2889 291704 278546 841381
754 7187 219063 3260 326539 281456 902465
756 8673 237153 3522 347109 281990 952449
08, the data of A.C. Ist class is inclusive of Executive Class.
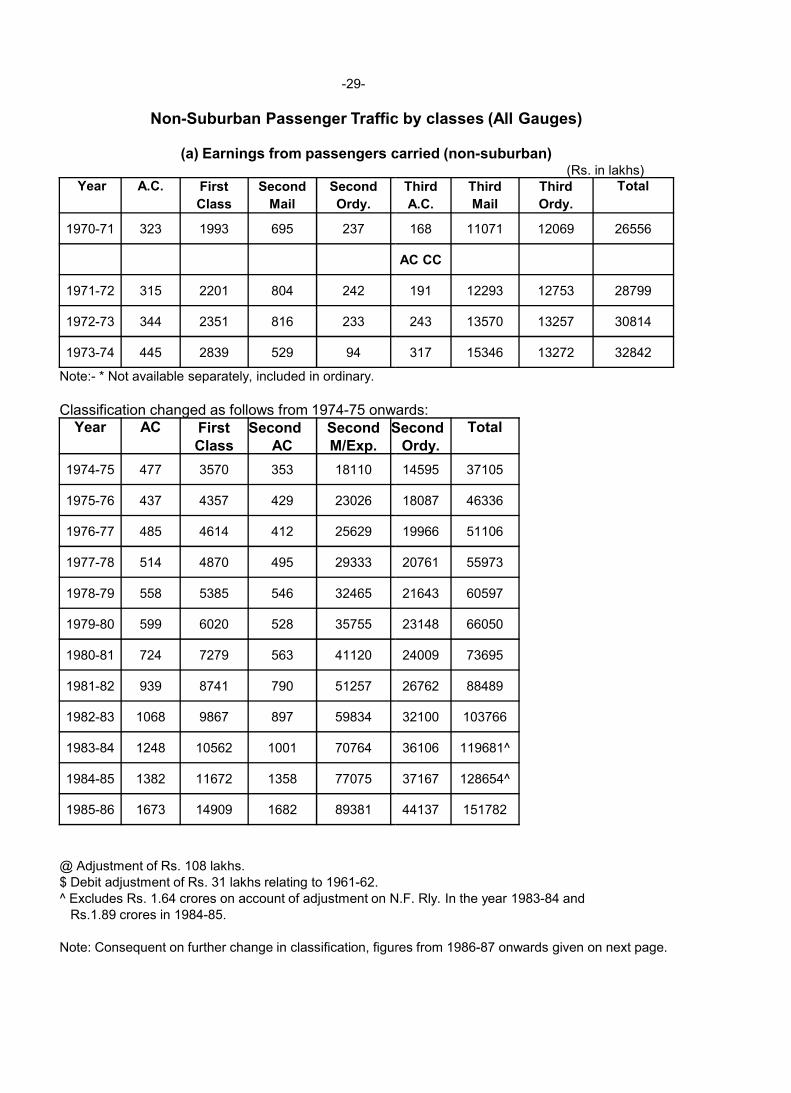
-29-
Non-Suburban Passenger Traffic by classes (All Gauges)
(a) Earnings from passengers carried (non
Year A.C. First Second Second
Class Mail Ordy.
1970-71 323 1993 695 237
1971-72 315 2201 804 242
1972-73 344 2351 816 233
1973-74 445 2839 529 94
Note:- * Not available separately, included in ordinary.
Classification changed as follows from 1974-75 onwards:Year AC First Second Second Second
Class AC M/Exp.
1974-75 477 3570 353 18110
1975-76 437 4357 429 23026
1976-77 485 4614 412 25629
1977-78 514 4870 495 29333
1978-79 558 5385 546 32465
1979-80 599 6020 528 35755
1980-81 724 7279 563 41120
1981-82 939 8741 790 51257
1982-83 1068 9867 897 59834
1983-84 1248 10562 1001 70764
1984-85 1382 11672 1358 77075
1985-86 1673 14909 1682 89381
@ Adjustment of Rs. 108 lakhs.$ Debit adjustment of Rs. 31 lakhs relating to 1961-62. ^ Excludes Rs. 1.64 crores on account of adjustment on N.F. Rly. In the year 1983
Rs.1.89 crores in 1984-85.
Note: Consequent on further change in classification, figures from 1986
Suburban Passenger Traffic by classes (All Gauges)
(a) Earnings from passengers carried (non-suburban)(Rs. in lakhs)
Third Third Third Total
A.C. Mail Ordy.
168 11071 12069 26556
AC CC
191 12293 12753 28799
243 13570 13257 30814
317 15346 13272 32842
75 onwards:Second Total
Ordy.
14595 37105
18087 46336
19966 51106
20761 55973
21643 60597
23148 66050
24009 73695
26762 88489
32100 103766
36106 119681^
37167 128654^
44137 151782
^ Excludes Rs. 1.64 crores on account of adjustment on N.F. Rly. In the year 1983-84 and
Note: Consequent on further change in classification, figures from 1986-87 onwards given on next page.
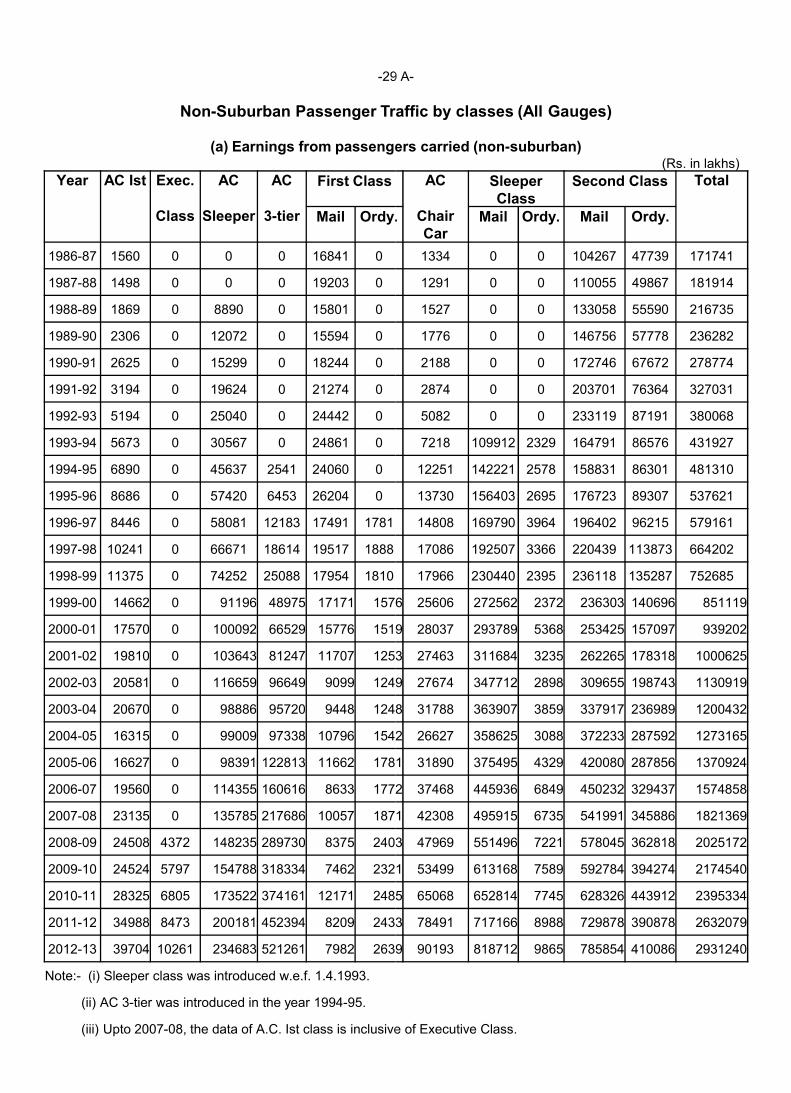
-29 A
Non-Suburban Passenger Traffic by classes (All Gauges)
(a) Earnings from passengers carried (non
Year AC Ist Exec. AC AC First Class
Class Sleeper 3-tier Mail Ordy.
1986-87 1560 0 0 0 16841 0
1987-88 1498 0 0 0 19203 0
1988-89 1869 0 8890 0 15801 0
1989-90 2306 0 12072 0 15594 0
1990-91 2625 0 15299 0 18244 0
1991-92 3194 0 19624 0 21274 0
1992-93 5194 0 25040 0 24442 0
1993-94 5673 0 30567 0 24861 0
1994-95 6890 0 45637 2541 24060 0
1995-96 8686 0 57420 6453 26204 0
1996-97 8446 0 58081 12183 17491 1781
1997-98 10241 0 66671 18614 19517 18881997-98 10241 0 66671 18614 19517 1888
1998-99 11375 0 74252 25088 17954 1810
1999-00 14662 0 91196 48975 17171 1576
2000-01 17570 0 100092 66529 15776 1519
2001-02 19810 0 103643 81247 11707 1253
2002-03 20581 0 116659 96649 9099 1249
2003-04 20670 0 98886 95720 9448 1248
2004-05 16315 0 99009 97338 10796 1542
2005-06 16627 0 98391 122813 11662 1781
2006-07 19560 0 114355 160616 8633 1772
2007-08 23135 0 135785 217686 10057 1871
2008-09 24508 4372 148235 289730 8375 2403
2009-10 24524 5797 154788 318334 7462 2321
2010-11 28325 6805 173522 374161 12171 2485
2011-12 34988 8473 200181 452394 8209 2433
2012-13 39704 10261 234683 521261 7982 2639
Note:- (i) Sleeper class was introduced w.e.f. 1.4.1993.
(ii) AC 3-tier was introduced in the year 1994-95.
(iii) Upto 2007-08, the data of A.C. Ist class is inclusive of Executive Class.
29 A-
Suburban Passenger Traffic by classes (All Gauges)
(a) Earnings from passengers carried (non-suburban)(Rs. in lakhs)
AC Sleeper Class
Second Class Total
. Chair Car
Mail Ordy. Mail Ordy.
1334 0 0 104267 47739 171741
1291 0 0 110055 49867 181914
1527 0 0 133058 55590 216735
1776 0 0 146756 57778 236282
2188 0 0 172746 67672 278774
2874 0 0 203701 76364 327031
5082 0 0 233119 87191 380068
7218 109912 2329 164791 86576 431927
12251 142221 2578 158831 86301 481310
13730 156403 2695 176723 89307 537621
14808 169790 3964 196402 96215 579161
17086 192507 3366 220439 113873 66420217086 192507 3366 220439 113873 664202
17966 230440 2395 236118 135287 752685
1576 25606 272562 2372 236303 140696 851119
1519 28037 293789 5368 253425 157097 939202
1253 27463 311684 3235 262265 178318 1000625
1249 27674 347712 2898 309655 198743 1130919
1248 31788 363907 3859 337917 236989 1200432
1542 26627 358625 3088 372233 287592 1273165
1781 31890 375495 4329 420080 287856 1370924
1772 37468 445936 6849 450232 329437 1574858
1871 42308 495915 6735 541991 345886 1821369
2403 47969 551496 7221 578045 362818 2025172
2321 53499 613168 7589 592784 394274 2174540
2485 65068 652814 7745 628326 443912 2395334
2433 78491 717166 8988 729878 390878 2632079
2639 90193 818712 9865 785854 410086 2931240
08, the data of A.C. Ist class is inclusive of Executive Class.
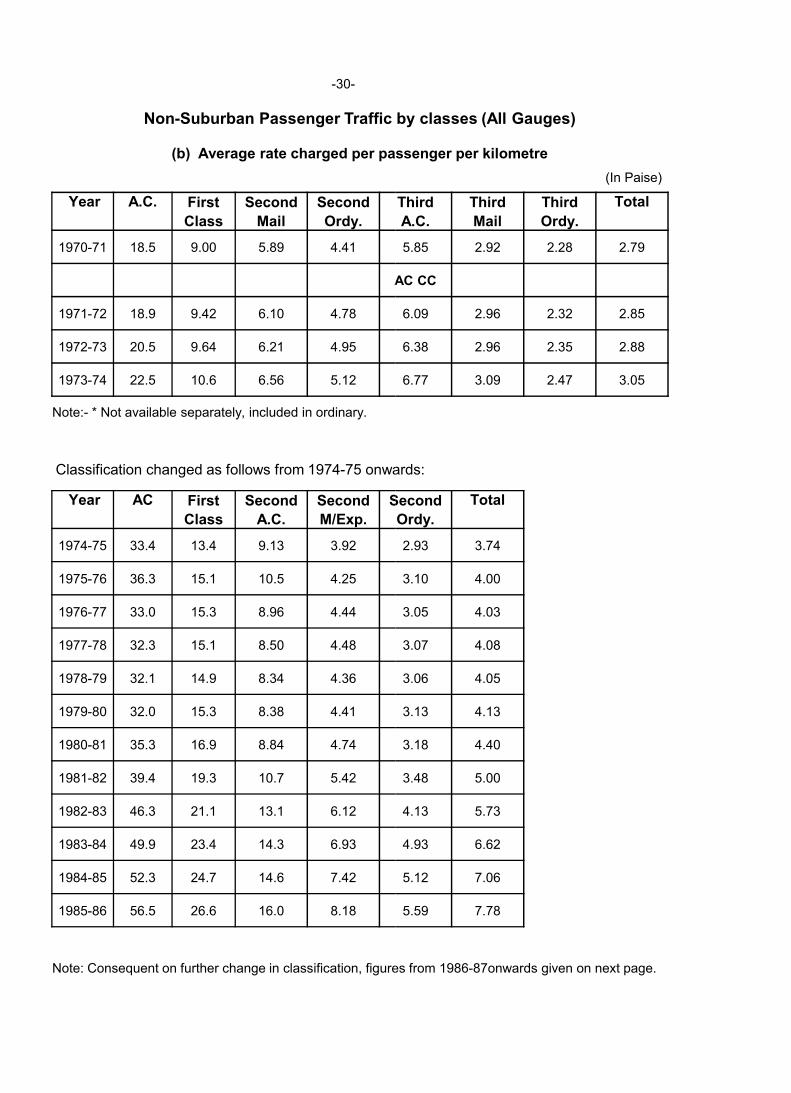
-30-
Non-Suburban Passenger Traffic by classes (All Gauges)
(b) Average rate charged per passenger per kilometre
Year A.C. First Second Second
Class Mail Ordy.
1970-71 18.5 9.00 5.89 4.41
AC CC
1971-72 18.9 9.42 6.10 4.78
1972-73 20.5 9.64 6.21 4.95
1973-74 22.5 10.6 6.56 5.12
Note:- * Not available separately, included in ordinary.
Classification changed as follows from 1974-75 onwards:
Year AC First Second Second Second
Class A.C. M/Exp.
1974-75 33.4 13.4 9.13 3.921974-75 33.4 13.4 9.13 3.92
1975-76 36.3 15.1 10.5 4.25
1976-77 33.0 15.3 8.96 4.44
1977-78 32.3 15.1 8.50 4.48
1978-79 32.1 14.9 8.34 4.36
1979-80 32.0 15.3 8.38 4.41
1980-81 35.3 16.9 8.84 4.74
1981-82 39.4 19.3 10.7 5.42
1982-83 46.3 21.1 13.1 6.12
1983-84 49.9 23.4 14.3 6.93
1984-85 52.3 24.7 14.6 7.42
1985-86 56.5 26.6 16.0 8.18
Note: Consequent on further change in classification, figures from 1986
Suburban Passenger Traffic by classes (All Gauges)
(b) Average rate charged per passenger per kilometre
(In Paise)
Third Third Third Total
A.C. Mail Ordy.
5.85 2.92 2.28 2.79
AC CC
6.09 2.96 2.32 2.85
6.38 2.96 2.35 2.88
6.77 3.09 2.47 3.05
75 onwards:
Second Total
Ordy.
2.93 3.742.93 3.74
3.10 4.00
3.05 4.03
3.07 4.08
3.06 4.05
3.13 4.13
3.18 4.40
3.48 5.00
4.13 5.73
4.93 6.62
5.12 7.06
5.59 7.78
Note: Consequent on further change in classification, figures from 1986-87onwards given on next page.
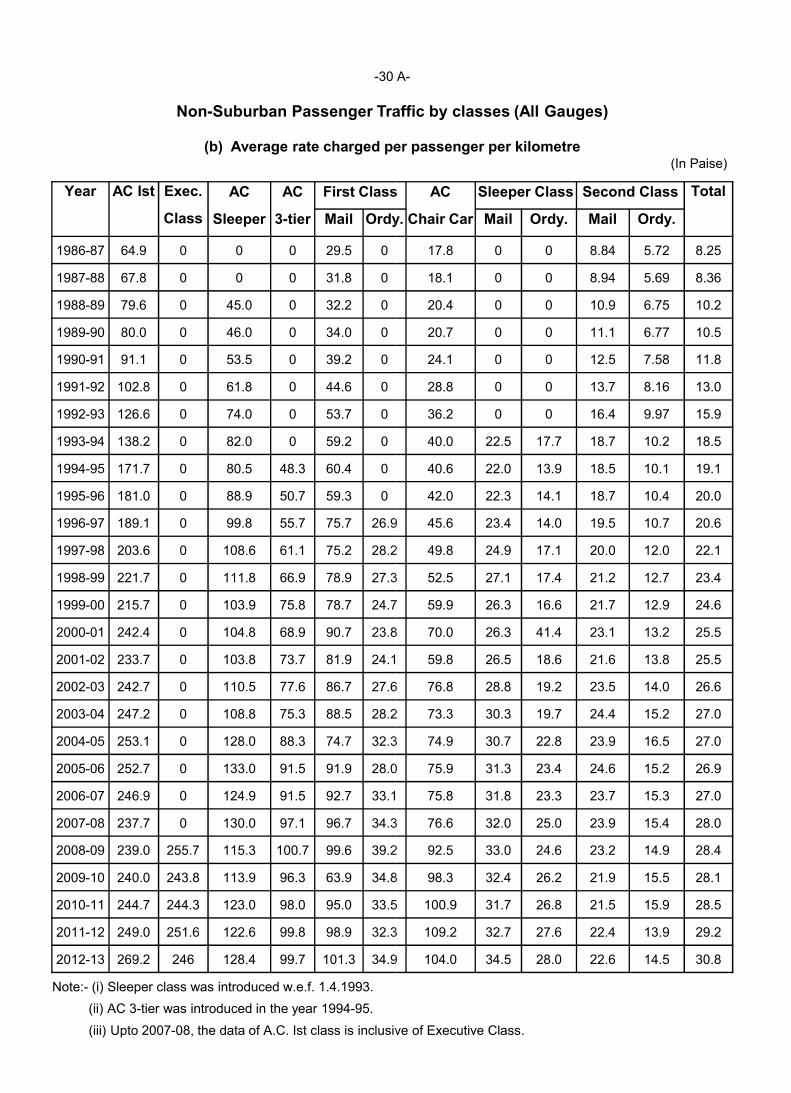
-30 A
Non-Suburban Passenger Traffic by classes (All Gauges)
(b) Average rate charged per passenger per kilometre
Year AC Ist Exec. AC AC First Class
Class Sleeper 3-tier Mail Ordy
1986-87 64.9 0 0 0 29.5 0
1987-88 67.8 0 0 0 31.8 0
1988-89 79.6 0 45.0 0 32.2 0
1989-90 80.0 0 46.0 0 34.0 0
1990-91 91.1 0 53.5 0 39.2 0
1991-92 102.8 0 61.8 0 44.6 0
1992-93 126.6 0 74.0 0 53.7 0
1993-94 138.2 0 82.0 0 59.2 0
1994-95 171.7 0 80.5 48.3 60.4 0
1995-96 181.0 0 88.9 50.7 59.3 0
1996-97 189.1 0 99.8 55.7 75.7 26.9
1997-98 203.6 0 108.6 61.1 75.2 28.21997-98 203.6 0 108.6 61.1 75.2 28.2
1998-99 221.7 0 111.8 66.9 78.9 27.3
1999-00 215.7 0 103.9 75.8 78.7 24.7
2000-01 242.4 0 104.8 68.9 90.7 23.8
2001-02 233.7 0 103.8 73.7 81.9 24.1
2002-03 242.7 0 110.5 77.6 86.7 27.6
2003-04 247.2 0 108.8 75.3 88.5 28.2
2004-05 253.1 0 128.0 88.3 74.7 32.3
2005-06 252.7 0 133.0 91.5 91.9 28.0
2006-07 246.9 0 124.9 91.5 92.7 33.1
2007-08 237.7 0 130.0 97.1 96.7 34.3
2008-09 239.0 255.7 115.3 100.7 99.6 39.2
2009-10 240.0 243.8 113.9 96.3 63.9 34.8
2010-11 244.7 244.3 123.0 98.0 95.0 33.5
2011-12 249.0 251.6 122.6 99.8 98.9 32.3
2012-13 269.2 246 128.4 99.7 101.3 34.9
Note:- (i) Sleeper class was introduced w.e.f. 1.4.1993.
(ii) AC 3-tier was introduced in the year 1994-95.
(iii) Upto 2007-08, the data of A.C. Ist class is inclusive of Executive Class.
30 A-
Suburban Passenger Traffic by classes (All Gauges)
(b) Average rate charged per passenger per kilometre(In Paise)
First Class AC Sleeper Class Second Class Total
Ordy. Chair Car Mail Ordy. Mail Ordy.
17.8 0 0 8.84 5.72 8.25
18.1 0 0 8.94 5.69 8.36
20.4 0 0 10.9 6.75 10.2
20.7 0 0 11.1 6.77 10.5
24.1 0 0 12.5 7.58 11.8
28.8 0 0 13.7 8.16 13.0
36.2 0 0 16.4 9.97 15.9
40.0 22.5 17.7 18.7 10.2 18.5
40.6 22.0 13.9 18.5 10.1 19.1
42.0 22.3 14.1 18.7 10.4 20.0
26.9 45.6 23.4 14.0 19.5 10.7 20.6
28.2 49.8 24.9 17.1 20.0 12.0 22.128.2 49.8 24.9 17.1 20.0 12.0 22.1
27.3 52.5 27.1 17.4 21.2 12.7 23.4
24.7 59.9 26.3 16.6 21.7 12.9 24.6
23.8 70.0 26.3 41.4 23.1 13.2 25.5
24.1 59.8 26.5 18.6 21.6 13.8 25.5
27.6 76.8 28.8 19.2 23.5 14.0 26.6
28.2 73.3 30.3 19.7 24.4 15.2 27.0
32.3 74.9 30.7 22.8 23.9 16.5 27.0
28.0 75.9 31.3 23.4 24.6 15.2 26.9
33.1 75.8 31.8 23.3 23.7 15.3 27.0
34.3 76.6 32.0 25.0 23.9 15.4 28.0
39.2 92.5 33.0 24.6 23.2 14.9 28.4
34.8 98.3 32.4 26.2 21.9 15.5 28.1
33.5 100.9 31.7 26.8 21.5 15.9 28.5
32.3 109.2 32.7 27.6 22.4 13.9 29.2
34.9 104.0 34.5 28.0 22.6 14.5 30.8
08, the data of A.C. Ist class is inclusive of Executive Class.
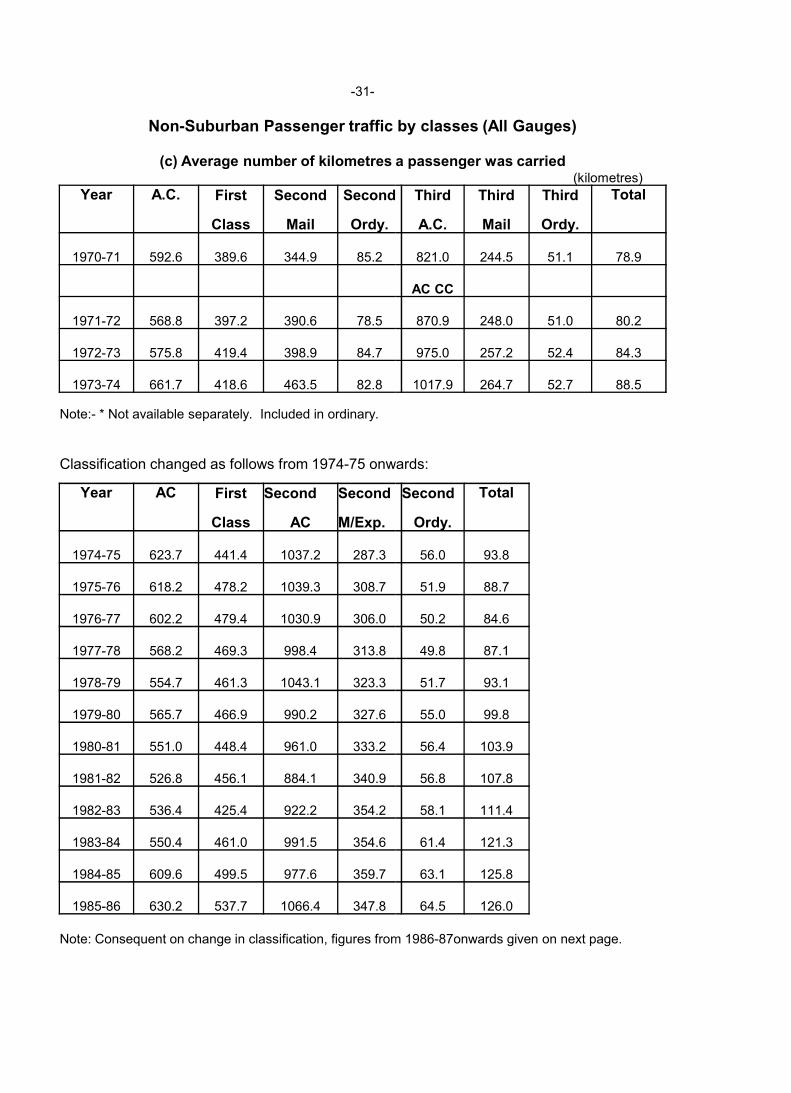
-31-
Non-Suburban Passenger traffic by classes (All Gauges)
(c) Average number of kilometres a passenger was carried
Year A.C. First Second Second
Class Mail Ordy.
1970-71 592.6 389.6 344.9 85.2
1971-72 568.8 397.2 390.6 78.5
1972-73 575.8 419.4 398.9 84.7
1973-74 661.7 418.6 463.5 82.8
Note:- * Not available separately. Included in ordinary.
Classification changed as follows from 1974-75 onwards:
Year AC First Second Second
Class AC M/Exp.
1974-75 623.7 441.4 1037.2 287.3
1975-76 618.2 478.2 1039.3 308.7
1976-77 602.2 479.4 1030.9 306.0
1977-78 568.2 469.3 998.4 313.8
1978-79 554.7 461.3 1043.1 323.3
1979-80 565.7 466.9 990.2 327.6
1980-81 551.0 448.4 961.0 333.2
1981-82 526.8 456.1 884.1 340.9
1982-83 536.4 425.4 922.2 354.2
1983-84 550.4 461.0 991.5 354.6
1984-85 609.6 499.5 977.6 359.7
1985-86 630.2 537.7 1066.4 347.8
Note: Consequent on change in classification, figures from 1986
Suburban Passenger traffic by classes (All Gauges)
(c) Average number of kilometres a passenger was carried(kilometres)
Second Third Third Third Total
A.C. Mail Ordy.
821.0 244.5 51.1 78.9
AC CC
870.9 248.0 51.0 80.2
975.0 257.2 52.4 84.3
1017.9 264.7 52.7 88.5
75 onwards:
Second Total
Ordy.
56.0 93.8
51.9 88.7
50.2 84.6
49.8 87.1
51.7 93.1
55.0 99.8
56.4 103.9
56.8 107.8
58.1 111.4
61.4 121.3
63.1 125.8
64.5 126.0
Note: Consequent on change in classification, figures from 1986-87onwards given on next page.
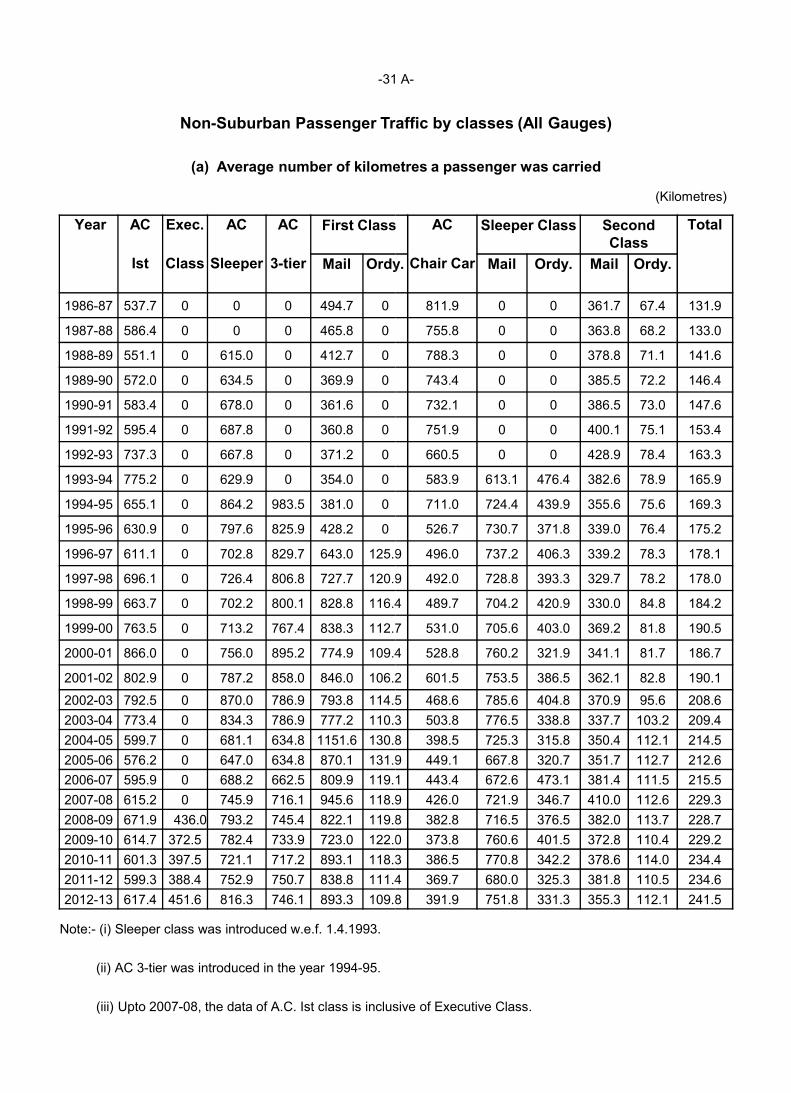
-31 A
Non-Suburban Passenger Traffic by classes (All Gauges)
(a) Average number of kilometres a passenger was carried
Year AC Exec. AC AC First Class
Ist Class Sleeper 3-tier Mail Ordy
1986-87 537.7 0 0 0 494.7 0
1987-88 586.4 0 0 0 465.8 0
1988-89 551.1 0 615.0 0 412.7 0
1989-90 572.0 0 634.5 0 369.9 0
1990-91 583.4 0 678.0 0 361.6 0
1991-92 595.4 0 687.8 0 360.8 0
1992-93 737.3 0 667.8 0 371.2 0
1993-94 775.2 0 629.9 0 354.0 0
1994-95 655.1 0 864.2 983.5 381.0 0
1995-96 630.9 0 797.6 825.9 428.2 0
1996-97 611.1 0 702.8 829.7 643.0 125.9
1997-98 696.1 0 726.4 806.8 727.7 120.9
1998-99 663.7 0 702.2 800.1 828.8 116.4
1999-00 763.5 0 713.2 767.4 838.3 112.7
2000-01 866.0 0 756.0 895.2 774.9 109.4
2001-02 802.9 0 787.2 858.0 846.0 106.2
2002-03 792.5 0 870.0 786.9 793.8 114.5
2003-04 773.4 0 834.3 786.9 777.2 110.3
2004-05 599.7 0 681.1 634.8 1151.6 130.8
2005-06 576.2 0 647.0 634.8 870.1 131.9
2006-07 595.9 0 688.2 662.5 809.9 119.1
2007-08 615.2 0 745.9 716.1 945.6 118.9
2008-09 671.9 436.0 793.2 745.4 822.1 119.8
2009-10 614.7 372.5 782.4 733.9 723.0 122.0
2010-11 601.3 397.5 721.1 717.2 893.1 118.3
2011-12 599.3 388.4 752.9 750.7 838.8 111.4
2012-13 617.4 451.6 816.3 746.1 893.3 109.8
Note:- (i) Sleeper class was introduced w.e.f. 1.4.1993.
(ii) AC 3-tier was introduced in the year 1994-95.
(iii) Upto 2007-08, the data of A.C. Ist class is inclusive of Executive Class.
31 A-
Suburban Passenger Traffic by classes (All Gauges)
(a) Average number of kilometres a passenger was carried
(Kilometres)
First Class AC Sleeper Class Second Class
Total
Ordy. Chair Car Mail Ordy. Mail Ordy.
811.9 0 0 361.7 67.4 131.9
755.8 0 0 363.8 68.2 133.0
788.3 0 0 378.8 71.1 141.6
743.4 0 0 385.5 72.2 146.4
732.1 0 0 386.5 73.0 147.6
751.9 0 0 400.1 75.1 153.4
660.5 0 0 428.9 78.4 163.3
583.9 613.1 476.4 382.6 78.9 165.9
711.0 724.4 439.9 355.6 75.6 169.3
526.7 730.7 371.8 339.0 76.4 175.2
125.9 496.0 737.2 406.3 339.2 78.3 178.1
120.9 492.0 728.8 393.3 329.7 78.2 178.0
116.4 489.7 704.2 420.9 330.0 84.8 184.2
112.7 531.0 705.6 403.0 369.2 81.8 190.5
109.4 528.8 760.2 321.9 341.1 81.7 186.7
106.2 601.5 753.5 386.5 362.1 82.8 190.1
114.5 468.6 785.6 404.8 370.9 95.6 208.6
110.3 503.8 776.5 338.8 337.7 103.2 209.4
130.8 398.5 725.3 315.8 350.4 112.1 214.5
131.9 449.1 667.8 320.7 351.7 112.7 212.6
119.1 443.4 672.6 473.1 381.4 111.5 215.5
118.9 426.0 721.9 346.7 410.0 112.6 229.3
119.8 382.8 716.5 376.5 382.0 113.7 228.7
122.0 373.8 760.6 401.5 372.8 110.4 229.2
118.3 386.5 770.8 342.2 378.6 114.0 234.4
111.4 369.7 680.0 325.3 381.8 110.5 234.6
109.8 391.9 751.8 331.3 355.3 112.1 241.5
08, the data of A.C. Ist class is inclusive of Executive Class.
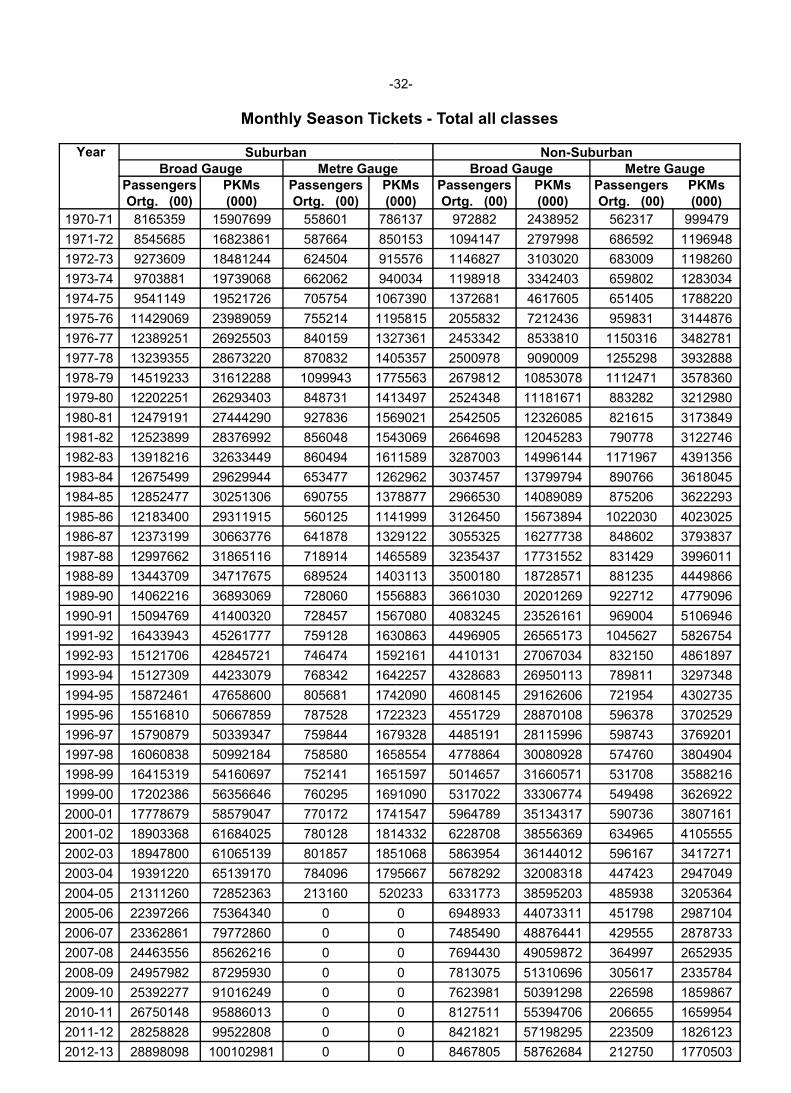
-32
Monthly Season Tickets
Year SuburbanBroad Gauge Metre Gauge
Passengers PKMs Passengers PKMsOrtg. (00) (000) Ortg. (00) (000)
1970-71 8165359 15907699 558601 786137
1971-72 8545685 16823861 587664 850153
1972-73 9273609 18481244 624504 915576
1973-74 9703881 19739068 662062 940034
1974-75 9541149 19521726 705754 1067390
1975-76 11429069 23989059 755214 1195815
1976-77 12389251 26925503 840159 1327361
1977-78 13239355 28673220 870832 1405357
1978-79 14519233 31612288 1099943 1775563
1979-80 12202251 26293403 848731 1413497
1980-81 12479191 27444290 927836 1569021
1981-82 12523899 28376992 856048 1543069
1982-83 13918216 32633449 860494 1611589
1983-84 12675499 29629944 653477 1262962
1984-85 12852477 30251306 690755 1378877
1985-86 12183400 29311915 560125 1141999
1986-87 12373199 30663776 641878 1329122
1987-88 12997662 31865116 718914 1465589
1988-89 13443709 34717675 689524 1403113
1989-90 14062216 36893069 728060 1556883
1990-91 15094769 41400320 728457 1567080
1991-92 16433943 45261777 759128 1630863
1992-93 15121706 42845721 746474 1592161
1993-94 15127309 44233079 768342 1642257
1994-95 15872461 47658600 805681 1742090
1995-96 15516810 50667859 787528 1722323
1996-97 15790879 50339347 759844 1679328
1997-98 16060838 50992184 758580 1658554
1998-99 16415319 54160697 752141 1651597
1999-00 17202386 56356646 760295 1691090
2000-01 17778679 58579047 770172 1741547
2001-02 18903368 61684025 780128 1814332
2002-03 18947800 61065139 801857 1851068
2003-04 19391220 65139170 784096 1795667
2004-05 21311260 72852363 213160 520233
2005-06 22397266 75364340 0
2006-07 23362861 79772860 0
2007-08 24463556 85626216 0
2008-09 24957982 87295930 0
2009-10 25392277 91016249 0
2010-11 26750148 95886013 0
2011-12 28258828 99522808 0
2012-13 28898098 100102981 0
32-
Monthly Season Tickets - Total all classes
Non-SuburbanMetre Gauge Broad Gauge Metre Gauge
PKMs Passengers PKMs Passengers PKMs(000) Ortg. (00) (000) Ortg. (00) (000)
786137 972882 2438952 562317 999479
850153 1094147 2797998 686592 1196948
915576 1146827 3103020 683009 1198260
940034 1198918 3342403 659802 1283034
1067390 1372681 4617605 651405 1788220
1195815 2055832 7212436 959831 3144876
1327361 2453342 8533810 1150316 3482781
1405357 2500978 9090009 1255298 3932888
1775563 2679812 10853078 1112471 3578360
1413497 2524348 11181671 883282 3212980
1569021 2542505 12326085 821615 3173849
1543069 2664698 12045283 790778 3122746
1611589 3287003 14996144 1171967 4391356
1262962 3037457 13799794 890766 3618045
1378877 2966530 14089089 875206 3622293
1141999 3126450 15673894 1022030 4023025
1329122 3055325 16277738 848602 3793837
1465589 3235437 17731552 831429 3996011
1403113 3500180 18728571 881235 4449866
1556883 3661030 20201269 922712 4779096
1567080 4083245 23526161 969004 5106946
1630863 4496905 26565173 1045627 5826754
1592161 4410131 27067034 832150 4861897
1642257 4328683 26950113 789811 3297348
1742090 4608145 29162606 721954 4302735
1722323 4551729 28870108 596378 3702529
1679328 4485191 28115996 598743 3769201
1658554 4778864 30080928 574760 3804904
1651597 5014657 31660571 531708 3588216
1691090 5317022 33306774 549498 3626922
1741547 5964789 35134317 590736 3807161
1814332 6228708 38556369 634965 4105555
1851068 5863954 36144012 596167 3417271
1795667 5678292 32008318 447423 2947049
520233 6331773 38595203 485938 3205364
0 6948933 44073311 451798 2987104
0 7485490 48876441 429555 2878733
0 7694430 49059872 364997 2652935
0 7813075 51310696 305617 2335784
0 7623981 50391298 226598 1859867
0 8127511 55394706 206655 1659954
0 8421821 57198295 223509 1826123
0 8467805 58762684 212750 1770503
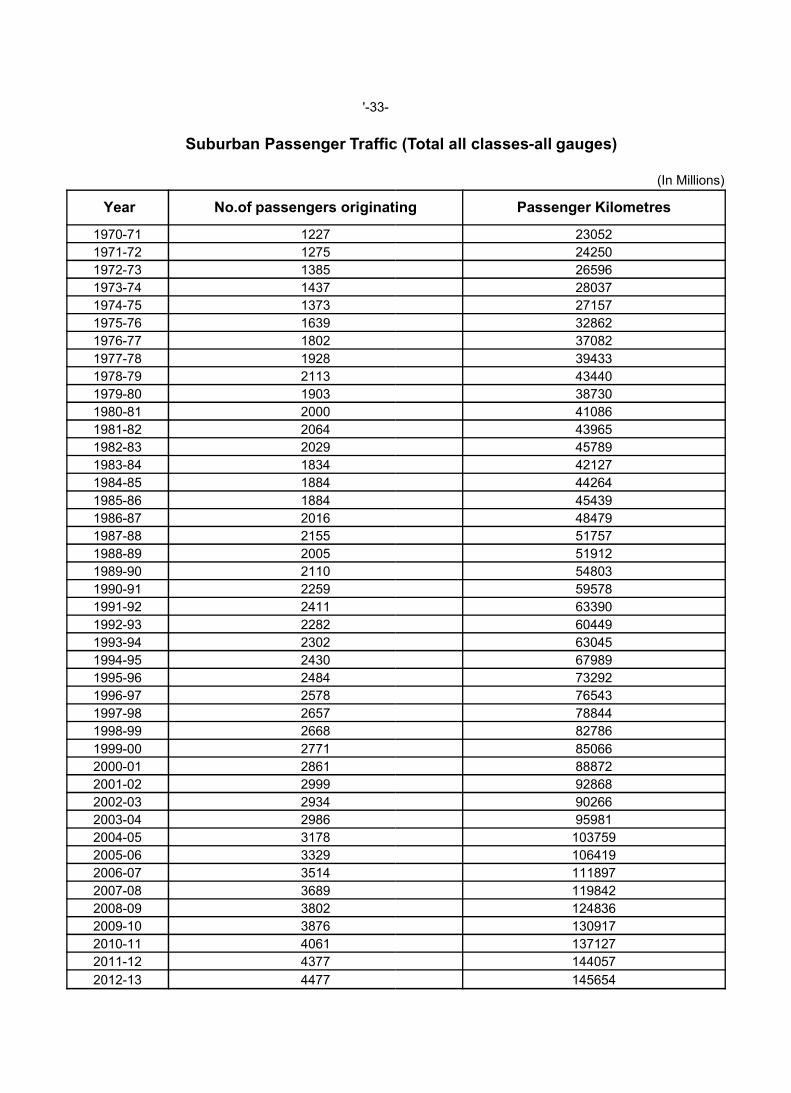
'-33-
Suburban Passenger Traffic (Total all classes
Year No.of passengers originating
1970-71 1227
1971-72 1275
1972-73 1385
1973-74 1437
1974-75 1373
1975-76 1639
1976-77 1802
1977-78 1928
1978-79 2113
1979-80 1903
1980-81 2000
1981-82 2064
1982-83 2029
1983-84 1834
1984-85 1884
1985-86 1884
1986-87 2016
1987-88 2155
1988-89 2005
1989-90 2110
1990-91 2259
1991-92 2411
1992-93 2282
1993-94 2302
1994-95 2430
1995-96 2484
1996-97 2578
1997-98 2657
1998-99 2668
1999-00 2771
2000-01 2861
2001-02 2999
2002-03 2934
2003-04 2986
2004-05 3178
2005-06 3329
2006-07 3514
2007-08 3689
2008-09 3802
2009-10 3876
2010-11 4061
2011-12 4377
2012-13 4477
Suburban Passenger Traffic (Total all classes-all gauges)
(In Millions)
passengers originating Passenger Kilometres
23052
24250
26596
28037
27157
32862
37082
39433
43440
38730
41086
43965
45789
42127
44264
45439
48479
51757
51912
54803
59578
63390
60449
63045
67989
73292
76543
78844
82786
85066
88872
92868
90266
95981
103759
106419
111897
119842
124836
130917
137127
144057
145654
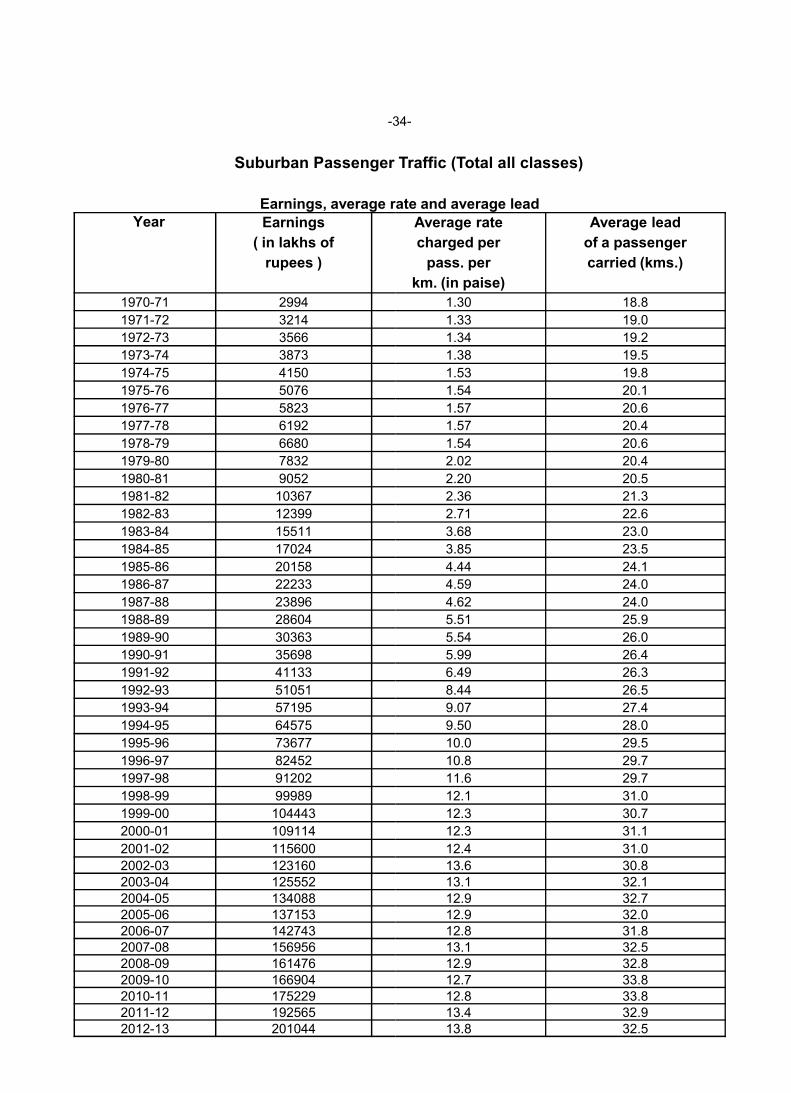
-34
Suburban Passenger Traffic (Total all classes)
Earnings, average rate and average leadYear Earnings
( in lakhs of
rupees )
1970-71 2994
1971-72 3214
1972-73 3566
1973-74 3873
1974-75 4150
1975-76 5076
1976-77 5823
1977-78 6192
1978-79 6680
1979-80 7832
1980-81 9052
1981-82 10367
1982-83 12399
1983-84 15511
1984-85 170241984-85 17024
1985-86 20158
1986-87 22233
1987-88 23896
1988-89 28604
1989-90 30363
1990-91 35698
1991-92 41133
1992-93 51051
1993-94 57195
1994-95 64575
1995-96 73677
1996-97 82452
1997-98 91202
1998-99 99989
1999-00 104443
2000-01 109114
2001-02 115600
2002-03 1231602003-04 1255522004-05 1340882005-06 1371532006-07 1427432007-08 1569562008-09 1614762009-10 1669042010-11 1752292011-12 1925652012-13 201044
34-
Suburban Passenger Traffic (Total all classes)
Earnings, average rate and average lead
Average rate Average lead
charged per of a passenger
pass. per carried (kms.)
km. (in paise)
1.30 18.8
1.33 19.0
1.34 19.2
1.38 19.5
1.53 19.8
1.54 20.1
1.57 20.6
1.57 20.4
1.54 20.6
2.02 20.4
2.20 20.5
2.36 21.3
2.71 22.6
3.68 23.0
3.85 23.53.85 23.5
4.44 24.1
4.59 24.0
4.62 24.0
5.51 25.9
5.54 26.0
5.99 26.4
6.49 26.3
8.44 26.5
9.07 27.4
9.50 28.0
10.0 29.5
10.8 29.7
11.6 29.7
12.1 31.0
12.3 30.7
12.3 31.1
12.4 31.0
13.6 30.813.1 32.112.9 32.712.9 32.012.8 31.813.1 32.512.9 32.812.7 33.812.8 33.813.4 32.913.8 32.5
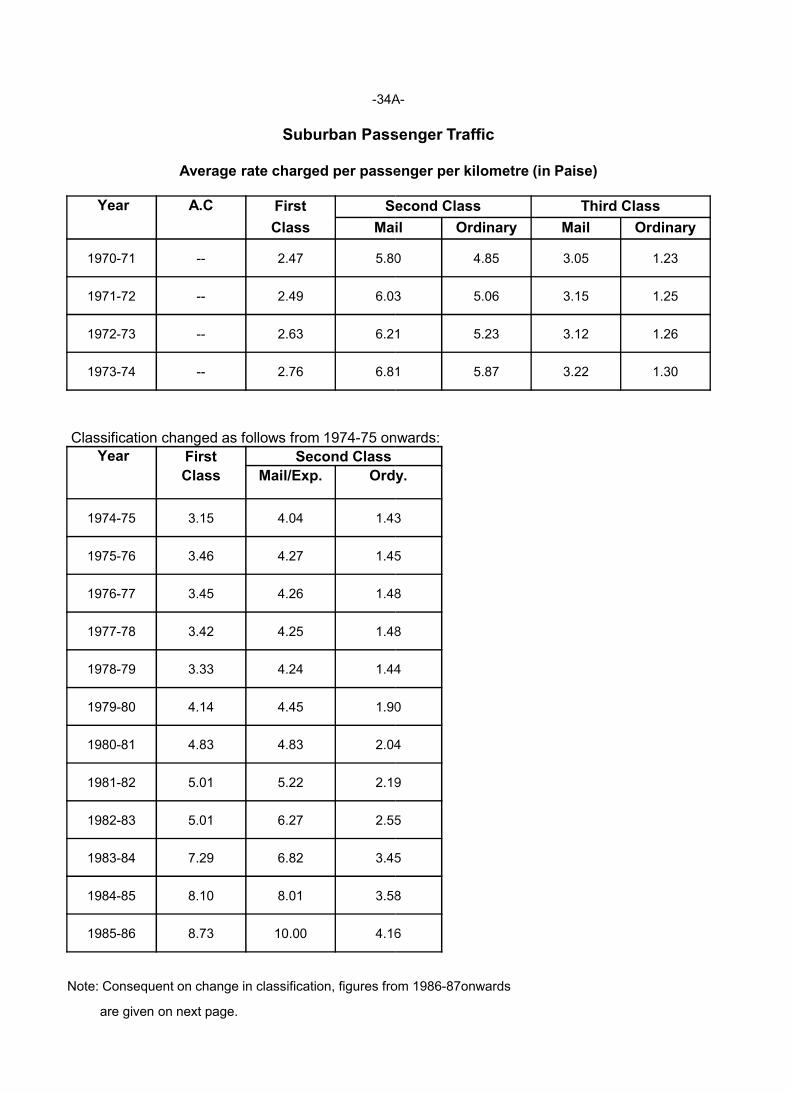
-34A
Suburban Passenger Traffic
Average rate charged per passenger per kilometre (in
Year A.C First Second Class
Class Mail
1970-71 -- 2.47 5.80
1971-72 -- 2.49 6.03
1972-73 -- 2.63 6.21
1973-74 -- 2.76 6.81
Classification changed as follows from 1974-75 onwards:Year First Second Class
Class Mail/Exp. Ordy
1974-75 3.15 4.04 1.43
1975-76 3.46 4.27 1.45
1976-77 3.45 4.26 1.48
1977-78 3.42 4.25 1.48
1978-79 3.33 4.24 1.44
1979-80 4.14 4.45 1.90
1980-81 4.83 4.83 2.04
1981-82 5.01 5.22 2.19
1982-83 5.01 6.27 2.55
1983-84 7.29 6.82 3.45
1984-85 8.10 8.01 3.58
1985-86 8.73 10.00 4.16
Note: Consequent on change in classification, figures from 1986
are given on next page.
34A-
Suburban Passenger Traffic
Average rate charged per passenger per kilometre (in Paise)
Second Class Third Class
Mail Ordinary Mail Ordinary
5.80 4.85 3.05 1.23
6.03 5.06 3.15 1.25
6.21 5.23 3.12 1.26
6.81 5.87 3.22 1.30
75 onwards:
Ordy.
1.43
1.45
1.48
1.48
1.44
1.90
2.04
2.19
2.55
3.45
3.58
4.16
Note: Consequent on change in classification, figures from 1986-87onwards
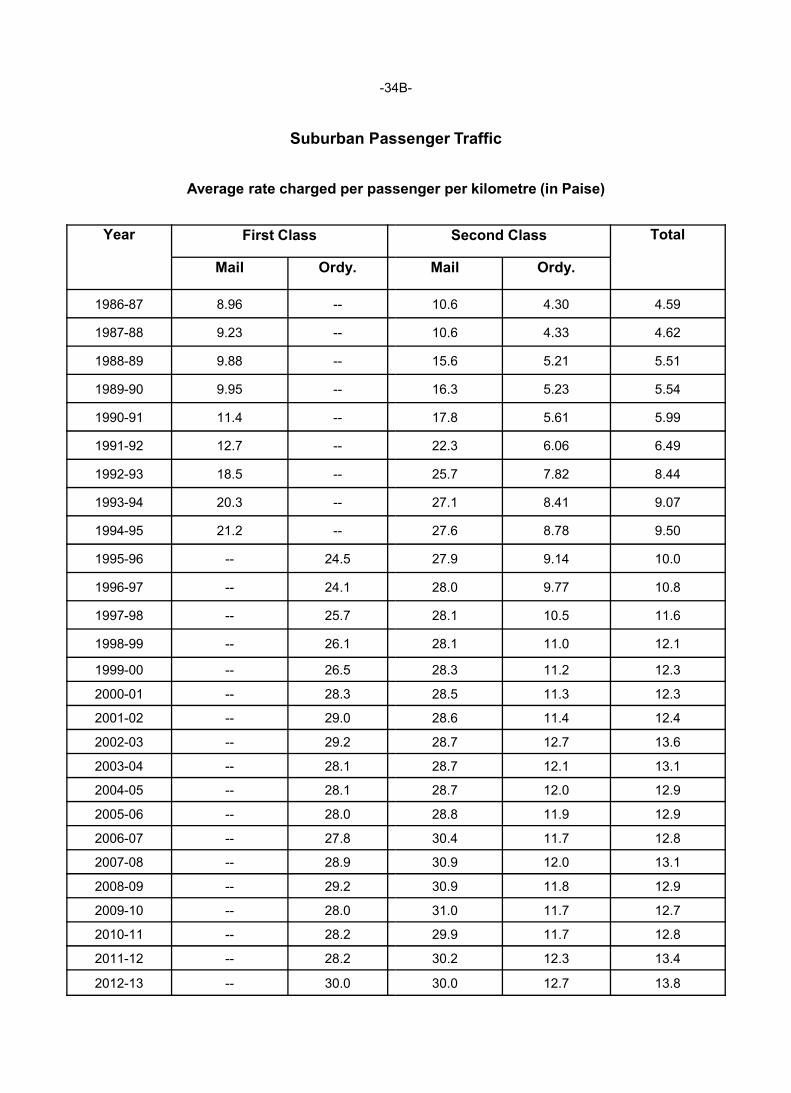
-34B
Suburban Passenger Traffic
Average rate charged per passenger per kilometre (in
Year First Class
Mail Ordy.
1986-87 8.96 --
1987-88 9.23 --
1988-89 9.88 --
1989-90 9.95 --
1990-91 11.4 --
1991-92 12.7 --
1992-93 18.5 --
1993-94 20.3 --
1994-95 21.2 --
1995-96 -- 24.5
1996-97 -- 24.1
1997-98 -- 25.7
1998-99 -- 26.1
1999-00 -- 26.5
2000-01 -- 28.3
2001-02 -- 29.0
2002-03 -- 29.2
2003-04 -- 28.1
2004-05 -- 28.1
2005-06 -- 28.0
2006-07 -- 27.8
2007-08 -- 28.9
2008-09 -- 29.2
2009-10 -- 28.0
2010-11 -- 28.2
2011-12 -- 28.2
2012-13 -- 30.0
34B-
Suburban Passenger Traffic
Average rate charged per passenger per kilometre (in Paise)
Second Class Total
Mail Ordy.
10.6 4.30 4.59
10.6 4.33 4.62
15.6 5.21 5.51
16.3 5.23 5.54
17.8 5.61 5.99
22.3 6.06 6.49
25.7 7.82 8.44
27.1 8.41 9.07
27.6 8.78 9.50
27.9 9.14 10.0
28.0 9.77 10.8
28.1 10.5 11.6
28.1 11.0 12.1
28.3 11.2 12.3
28.5 11.3 12.3
28.6 11.4 12.4
28.7 12.7 13.6
28.7 12.1 13.1
28.7 12.0 12.9
28.8 11.9 12.9
30.4 11.7 12.8
30.9 12.0 13.1
30.9 11.8 12.9
31.0 11.7 12.7
29.9 11.7 12.8
30.2 12.3 13.4
30.0 12.7 13.8
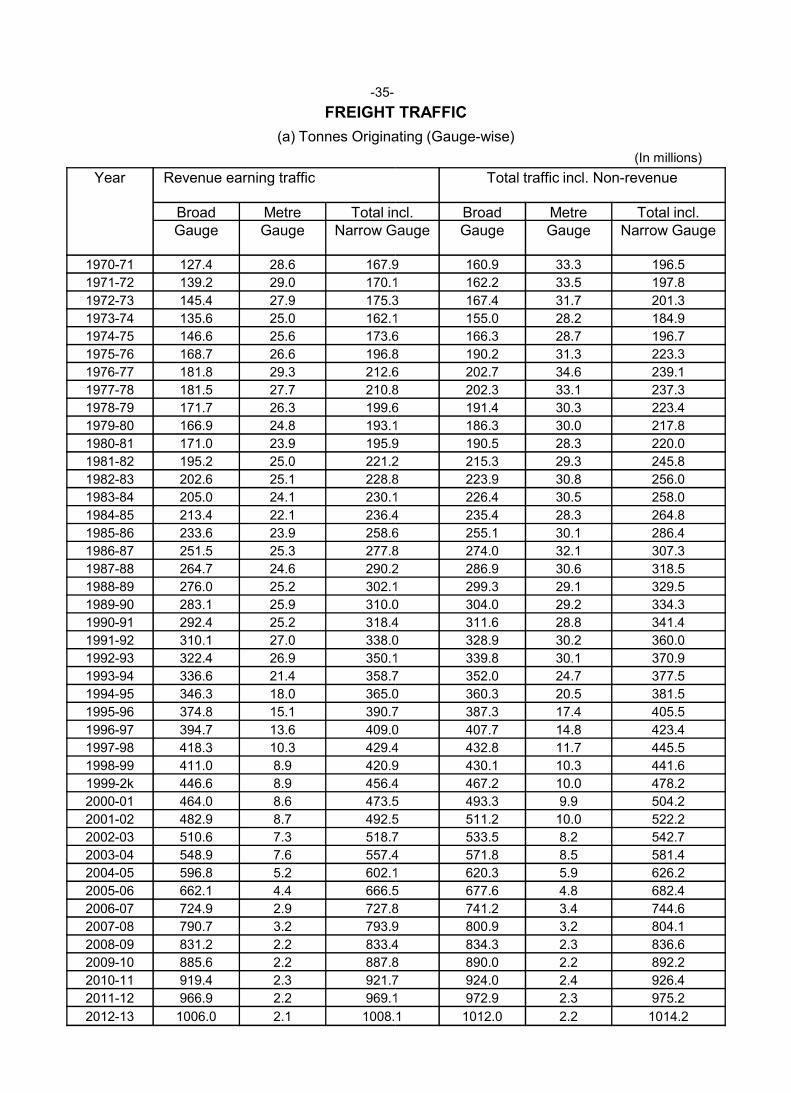
-35-
FREIGHT TRAFFIC
(a) Tonnes Originating (Gauge
Year Revenue earning traffic
Broad Metre Total incl.Gauge Gauge Narrow Gauge
1970-71 127.4 28.6 167.9
1971-72 139.2 29.0 170.1
1972-73 145.4 27.9 175.3
1973-74 135.6 25.0 162.1
1974-75 146.6 25.6 173.6
1975-76 168.7 26.6 196.8
1976-77 181.8 29.3 212.6
1977-78 181.5 27.7 210.8
1978-79 171.7 26.3 199.6
1979-80 166.9 24.8 193.1
1980-81 171.0 23.9 195.9
1981-82 195.2 25.0 221.2
1982-83 202.6 25.1 228.8
1983-84 205.0 24.1 230.1
1984-85 213.4 22.1 236.4
1985-86 233.6 23.9 258.6
1986-87 251.5 25.3 277.81986-87 251.5 25.3 277.8
1987-88 264.7 24.6 290.2
1988-89 276.0 25.2 302.1
1989-90 283.1 25.9 310.0
1990-91 292.4 25.2 318.4
1991-92 310.1 27.0 338.0
1992-93 322.4 26.9 350.1
1993-94 336.6 21.4 358.7
1994-95 346.3 18.0 365.0
1995-96 374.8 15.1 390.7
1996-97 394.7 13.6 409.0
1997-98 418.3 10.3 429.4
1998-99 411.0 8.9 420.9
1999-2k 446.6 8.9 456.4
2000-01 464.0 8.6 473.5
2001-02 482.9 8.7 492.5
2002-03 510.6 7.3 518.7
2003-04 548.9 7.6 557.4
2004-05 596.8 5.2 602.1
2005-06 662.1 4.4 666.5
2006-07 724.9 2.9 727.8
2007-08 790.7 3.2 793.9
2008-09 831.2 2.2 833.4
2009-10 885.6 2.2 887.8
2010-11 919.4 2.3 921.7
2011-12 966.9 2.2 969.1
2012-13 1006.0 2.1 1008.1
FREIGHT TRAFFIC
(a) Tonnes Originating (Gauge-wise)
(In millions)
Total traffic incl. Non-revenue
Total incl. Broad Metre Total incl.Narrow Gauge Gauge Gauge Narrow Gauge
167.9 160.9 33.3 196.5
170.1 162.2 33.5 197.8
175.3 167.4 31.7 201.3
162.1 155.0 28.2 184.9
173.6 166.3 28.7 196.7
196.8 190.2 31.3 223.3
212.6 202.7 34.6 239.1
210.8 202.3 33.1 237.3
199.6 191.4 30.3 223.4
193.1 186.3 30.0 217.8
195.9 190.5 28.3 220.0
221.2 215.3 29.3 245.8
228.8 223.9 30.8 256.0
230.1 226.4 30.5 258.0
236.4 235.4 28.3 264.8
258.6 255.1 30.1 286.4
277.8 274.0 32.1 307.3277.8 274.0 32.1 307.3
290.2 286.9 30.6 318.5
302.1 299.3 29.1 329.5
310.0 304.0 29.2 334.3
318.4 311.6 28.8 341.4
338.0 328.9 30.2 360.0
350.1 339.8 30.1 370.9
358.7 352.0 24.7 377.5
365.0 360.3 20.5 381.5
390.7 387.3 17.4 405.5
409.0 407.7 14.8 423.4
429.4 432.8 11.7 445.5
420.9 430.1 10.3 441.6
456.4 467.2 10.0 478.2
473.5 493.3 9.9 504.2
492.5 511.2 10.0 522.2
518.7 533.5 8.2 542.7
557.4 571.8 8.5 581.4
602.1 620.3 5.9 626.2
666.5 677.6 4.8 682.4
727.8 741.2 3.4 744.6
793.9 800.9 3.2 804.1
833.4 834.3 2.3 836.6
887.8 890.0 2.2 892.2
921.7 924.0 2.4 926.4
969.1 972.9 2.3 975.2
1008.1 1012.0 2.2 1014.2
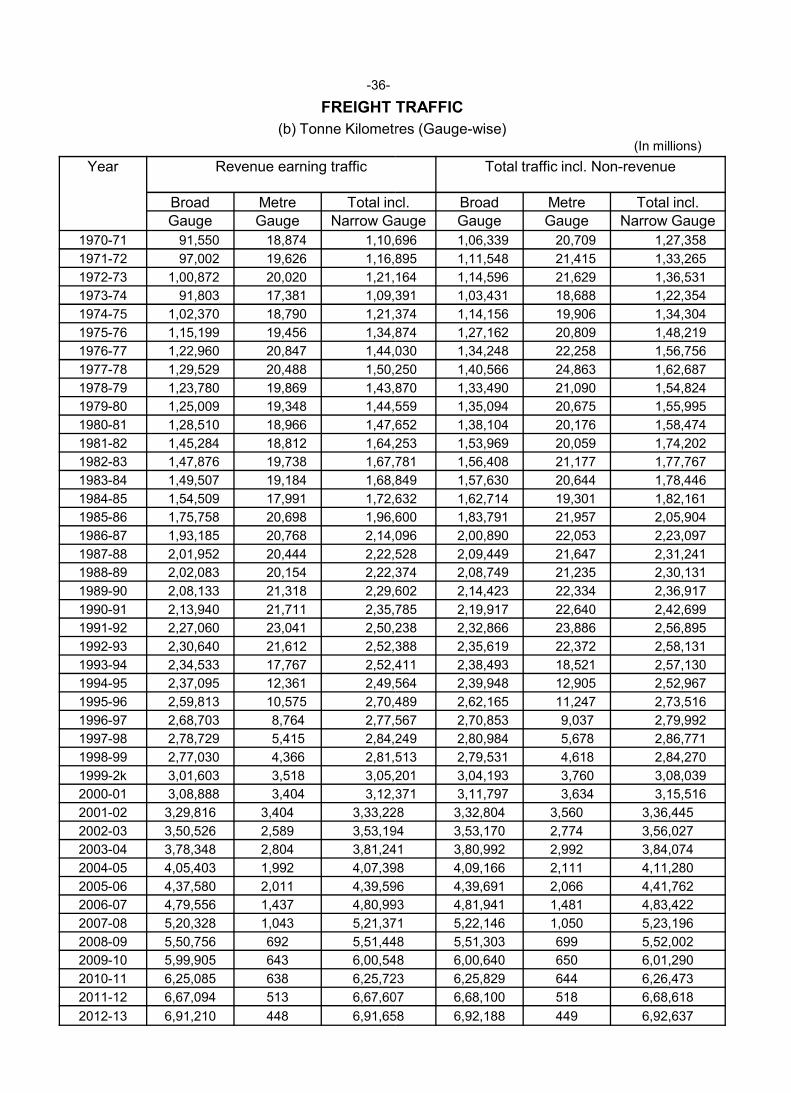
-36-
FREIGHT TRAFFIC
(b) Tonne Kilometres (Gauge
Year Revenue earning traffic
Broad Metre Total incl.Gauge Gauge Narrow Gauge
1970-71 91,550 18,874 1,10,696
1971-72 97,002 19,626 1,16,895
1972-73 1,00,872 20,020 1,21,164
1973-74 91,803 17,381 1,09,391
1974-75 1,02,370 18,790 1,21,374
1975-76 1,15,199 19,456 1,34,874
1976-77 1,22,960 20,847 1,44,030
1977-78 1,29,529 20,488 1,50,250
1978-79 1,23,780 19,869 1,43,870
1979-80 1,25,009 19,348 1,44,559
1980-81 1,28,510 18,966 1,47,652
1981-82 1,45,284 18,812 1,64,253
1982-83 1,47,876 19,738 1,67,781
1983-84 1,49,507 19,184 1,68,849
1984-85 1,54,509 17,991 1,72,632
1985-86 1,75,758 20,698 1,96,600
1986-87 1,93,185 20,768 2,14,096
1987-88 2,01,952 20,444 2,22,528
1988-89 2,02,083 20,154 2,22,374
1989-90 2,08,133 21,318 2,29,602
1990-91 2,13,940 21,711 2,35,785
1991-92 2,27,060 23,041 2,50,238
1992-93 2,30,640 21,612 2,52,388
1993-94 2,34,533 17,767 2,52,411
1994-95 2,37,095 12,361 2,49,564
1995-96 2,59,813 10,575 2,70,489
1996-97 2,68,703 8,764 2,77,567
1997-98 2,78,729 5,415 2,84,249
1998-99 2,77,030 4,366 2,81,513
1999-2k 3,01,603 3,518 3,05,201
2000-01 3,08,888 3,404 3,12,371
2001-02 3,29,816 3,404 3,33,228
2002-03 3,50,526 2,589 3,53,194
2003-04 3,78,348 2,804 3,81,241
2004-05 4,05,403 1,992 4,07,398
2005-06 4,37,580 2,011 4,39,596
2006-07 4,79,556 1,437 4,80,993
2007-08 5,20,328 1,043 5,21,371
2008-09 5,50,756 692 5,51,448
2009-10 5,99,905 643 6,00,548
2010-11 6,25,085 638 6,25,723
2011-12 6,67,094 513 6,67,607
2012-13 6,91,210 448 6,91,658
FREIGHT TRAFFIC
(b) Tonne Kilometres (Gauge-wise)(In millions)
Total traffic incl. Non-revenue
Total incl. Broad Metre Total incl.Narrow Gauge Gauge Gauge Narrow Gauge
1,10,696 1,06,339 20,709 1,27,358
1,16,895 1,11,548 21,415 1,33,265
1,21,164 1,14,596 21,629 1,36,531
1,09,391 1,03,431 18,688 1,22,354
1,21,374 1,14,156 19,906 1,34,304
1,34,874 1,27,162 20,809 1,48,219
1,44,030 1,34,248 22,258 1,56,756
1,50,250 1,40,566 24,863 1,62,687
1,43,870 1,33,490 21,090 1,54,824
1,44,559 1,35,094 20,675 1,55,995
1,47,652 1,38,104 20,176 1,58,474
1,64,253 1,53,969 20,059 1,74,202
1,67,781 1,56,408 21,177 1,77,767
1,68,849 1,57,630 20,644 1,78,446
1,72,632 1,62,714 19,301 1,82,161
1,96,600 1,83,791 21,957 2,05,904
2,14,096 2,00,890 22,053 2,23,097
2,22,528 2,09,449 21,647 2,31,241
2,22,374 2,08,749 21,235 2,30,131
2,29,602 2,14,423 22,334 2,36,917
2,35,785 2,19,917 22,640 2,42,699
2,50,238 2,32,866 23,886 2,56,895
2,52,388 2,35,619 22,372 2,58,131
2,52,411 2,38,493 18,521 2,57,130
2,49,564 2,39,948 12,905 2,52,967
2,70,489 2,62,165 11,247 2,73,516
2,77,567 2,70,853 9,037 2,79,992
2,84,249 2,80,984 5,678 2,86,771
2,81,513 2,79,531 4,618 2,84,270
3,05,201 3,04,193 3,760 3,08,039
3,12,371 3,11,797 3,634 3,15,516
3,33,228 3,32,804 3,560 3,36,445
3,53,194 3,53,170 2,774 3,56,027
3,81,241 3,80,992 2,992 3,84,074
4,07,398 4,09,166 2,111 4,11,280
4,39,596 4,39,691 2,066 4,41,762
4,80,993 4,81,941 1,481 4,83,422
5,21,371 5,22,146 1,050 5,23,196
5,51,448 5,51,303 699 5,52,002
6,00,548 6,00,640 650 6,01,290
6,25,723 6,25,829 644 6,26,473
6,67,607 6,68,100 518 6,68,618
6,91,658 6,92,188 449 6,92,637
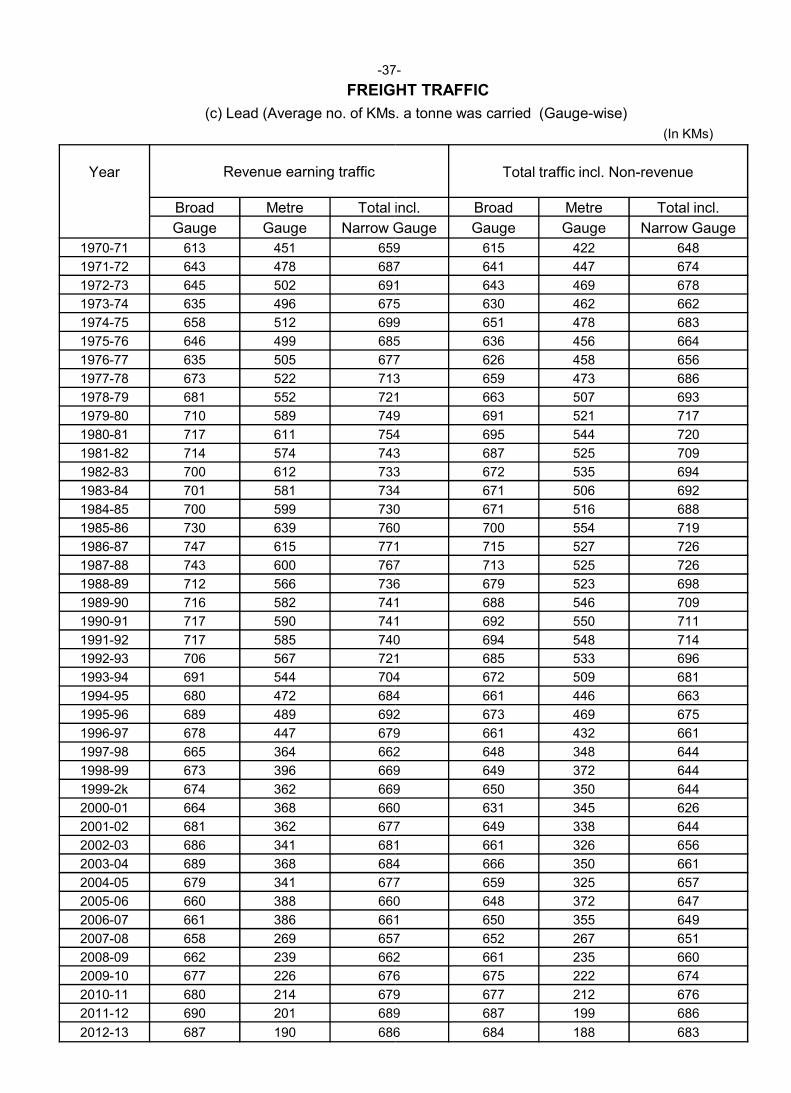
-37
FREIGHT TRAFFIC
(c) Lead (Average no. of KMs. a tonne was carried (Gauge
Year Revenue earning traffic
Broad Metre Total incl.
Gauge Gauge Narrow Gauge
1970-71 613 451 659
1971-72 643 478 687
1972-73 645 502 691
1973-74 635 496 675
1974-75 658 512 699
1975-76 646 499 685
1976-77 635 505 677
1977-78 673 522 713
1978-79 681 552 721
1979-80 710 589 749
1980-81 717 611 754
1981-82 714 574 743
1982-83 700 612 733
1983-84 701 581 734
1984-85 700 599 730
1985-86 730 639 760
1986-87 747 615 7711986-87 747 615 771
1987-88 743 600 767
1988-89 712 566 736
1989-90 716 582 741
1990-91 717 590 741
1991-92 717 585 740
1992-93 706 567 721
1993-94 691 544 704
1994-95 680 472 684
1995-96 689 489 692
1996-97 678 447 679
1997-98 665 364 662
1998-99 673 396 669
1999-2k 674 362 669
2000-01 664 368 660
2001-02 681 362 677
2002-03 686 341 681
2003-04 689 368 684
2004-05 679 341 677
2005-06 660 388 660
2006-07 661 386 661
2007-08 658 269 657
2008-09 662 239 662
2009-10 677 226 676
2010-11 680 214 679
2011-12 690 201 689
2012-13 687 190 686
37-
FREIGHT TRAFFIC
(c) Lead (Average no. of KMs. a tonne was carried (Gauge-wise)
(In KMs)
Total traffic incl. Non-revenue
Total incl. Broad Metre Total incl.
Narrow Gauge Gauge Gauge Narrow Gauge
659 615 422 648
687 641 447 674
691 643 469 678
675 630 462 662
699 651 478 683
685 636 456 664
677 626 458 656
713 659 473 686
721 663 507 693
749 691 521 717
754 695 544 720
743 687 525 709
733 672 535 694
734 671 506 692
730 671 516 688
760 700 554 719
771 715 527 726771 715 527 726
767 713 525 726
736 679 523 698
741 688 546 709
741 692 550 711
740 694 548 714
721 685 533 696
704 672 509 681
684 661 446 663
692 673 469 675
679 661 432 661
662 648 348 644
669 649 372 644
669 650 350 644
660 631 345 626
677 649 338 644
681 661 326 656
684 666 350 661
677 659 325 657
660 648 372 647
661 650 355 649
657 652 267 651
662 661 235 660
676 675 222 674
679 677 212 676
689 687 199 686
686 684 188 683
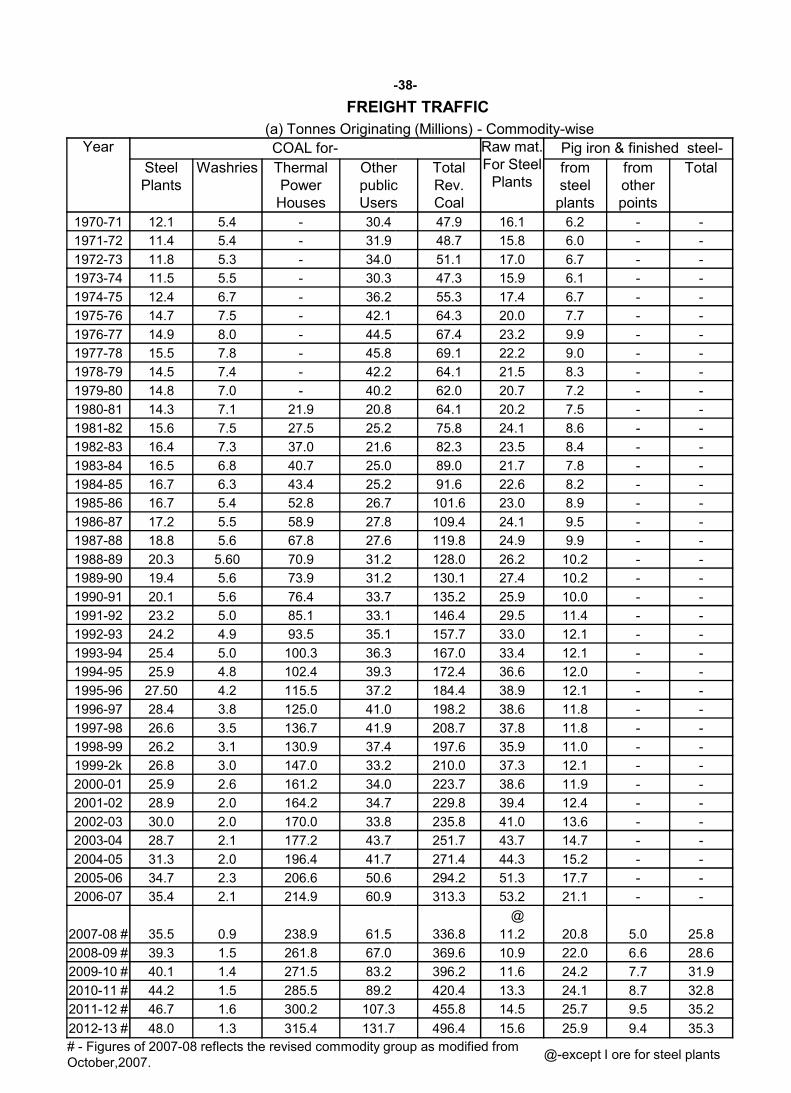
-
FREIGHT TRAFFIC
(a) Tonnes Originating (Millions) Year COAL for-
Steel Plants
Washries Thermal Power
Houses
Other public Users
1970-71 12.1 5.4 - 30.4
1971-72 11.4 5.4 - 31.9
1972-73 11.8 5.3 - 34.0
1973-74 11.5 5.5 - 30.3
1974-75 12.4 6.7 - 36.2
1975-76 14.7 7.5 - 42.1
1976-77 14.9 8.0 - 44.5
1977-78 15.5 7.8 - 45.8
1978-79 14.5 7.4 - 42.2
1979-80 14.8 7.0 - 40.2
1980-81 14.3 7.1 21.9 20.8
1981-82 15.6 7.5 27.5 25.2
1982-83 16.4 7.3 37.0 21.6
1983-84 16.5 6.8 40.7 25.0
1984-85 16.7 6.3 43.4 25.2
1985-86 16.7 5.4 52.8 26.7
1986-87 17.2 5.5 58.9 27.8
1987-88 18.8 5.6 67.8 27.61987-88 18.8 5.6 67.8 27.6
1988-89 20.3 5.60 70.9 31.2
1989-90 19.4 5.6 73.9 31.2
1990-91 20.1 5.6 76.4 33.7
1991-92 23.2 5.0 85.1 33.1
1992-93 24.2 4.9 93.5 35.1
1993-94 25.4 5.0 100.3 36.3
1994-95 25.9 4.8 102.4 39.3
1995-96 27.50 4.2 115.5 37.2
1996-97 28.4 3.8 125.0 41.0
1997-98 26.6 3.5 136.7 41.9
1998-99 26.2 3.1 130.9 37.4
1999-2k 26.8 3.0 147.0 33.2
2000-01 25.9 2.6 161.2 34.0
2001-02 28.9 2.0 164.2 34.7
2002-03 30.0 2.0 170.0 33.8
2003-04 28.7 2.1 177.2 43.7
2004-05 31.3 2.0 196.4 41.7
2005-06 34.7 2.3 206.6 50.6
2006-07 35.4 2.1 214.9 60.9
2007-08 # 35.5 0.9 238.9 61.5
2008-09 # 39.3 1.5 261.8 67.0
2009-10 # 40.1 1.4 271.5 83.2
2010-11 # 44.2 1.5 285.5 89.2
2011-12 # 46.7 1.6 300.2 107.3
2012-13 # 48.0 1.3 315.4 131.7
# - Figures of 2007-08 reflects the revised commodity group as modified from October,2007.
-38-
FREIGHT TRAFFIC
(a) Tonnes Originating (Millions) - Commodity-wiseRaw mat. For Steel
Plants
Pig iron & finished steel-
Other public Users
Total Rev. Coal
from steel
plants
from other points
Total
47.9 16.1 6.2 - -
48.7 15.8 6.0 - -
51.1 17.0 6.7 - -
47.3 15.9 6.1 - -
55.3 17.4 6.7 - -
64.3 20.0 7.7 - -
67.4 23.2 9.9 - -
69.1 22.2 9.0 - -
64.1 21.5 8.3 - -
62.0 20.7 7.2 - -
64.1 20.2 7.5 - -
75.8 24.1 8.6 - -
82.3 23.5 8.4 - -
89.0 21.7 7.8 - -
91.6 22.6 8.2 - -
101.6 23.0 8.9 - -
109.4 24.1 9.5 - -
119.8 24.9 9.9 - -119.8 24.9 9.9 - -
128.0 26.2 10.2 - -
130.1 27.4 10.2 - -
135.2 25.9 10.0 - -
146.4 29.5 11.4 - -
157.7 33.0 12.1 - -
167.0 33.4 12.1 - -
172.4 36.6 12.0 - -
184.4 38.9 12.1 - -
198.2 38.6 11.8 - -
208.7 37.8 11.8 - -
197.6 35.9 11.0 - -
210.0 37.3 12.1 - -
223.7 38.6 11.9 - -
229.8 39.4 12.4 - -
235.8 41.0 13.6 - -
251.7 43.7 14.7 - -
271.4 44.3 15.2 - -
294.2 51.3 17.7 - -
313.3 53.2 21.1 - -
@
336.8 11.2 20.8 5.0 25.8
369.6 10.9 22.0 6.6 28.6
396.2 11.6 24.2 7.7 31.9
420.4 13.3 24.1 8.7 32.8
455.8 14.5 25.7 9.5 35.2
496.4 15.6 25.9 9.4 35.3
08 reflects the revised commodity group as modified from @-except I ore for steel plants
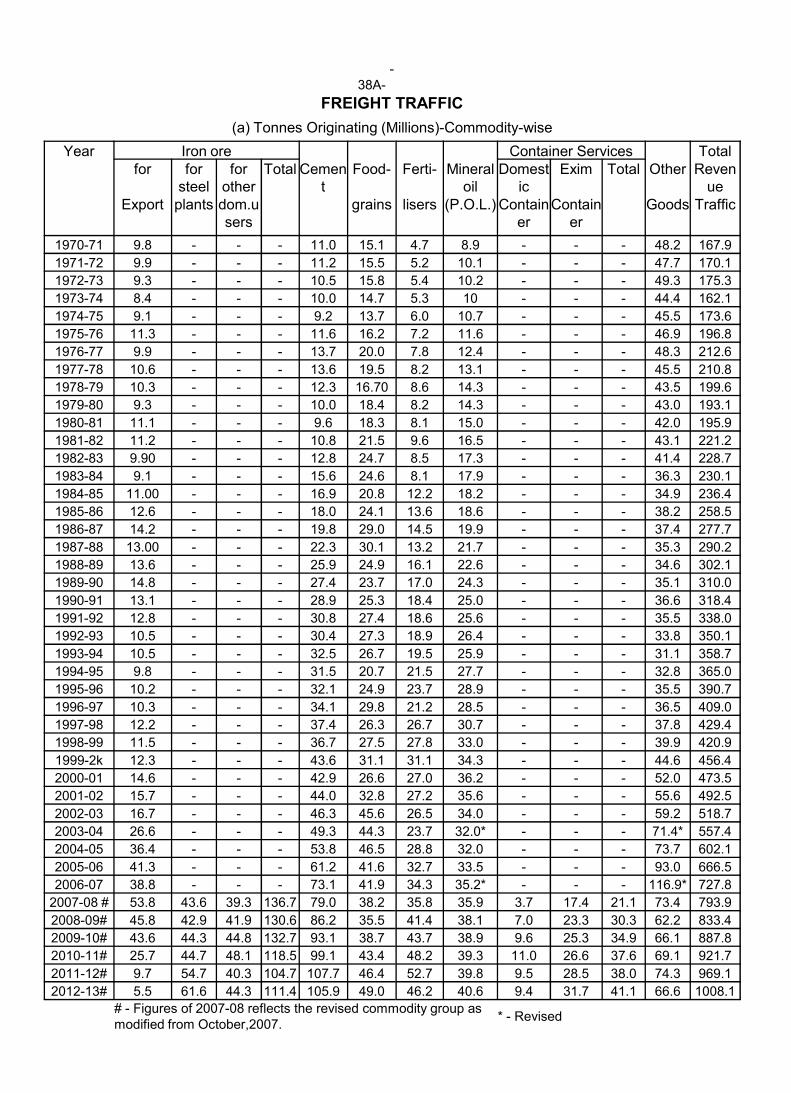
-38A-
FREIGHT TRAFFIC
(a) Tonnes Originating (Millions)
Year Iron orefor for
steelfor
other Total Cemen
tFood-
Export plants dom.users
grains
1970-71 9.8 - - - 11.0 15.1
1971-72 9.9 - - - 11.2 15.5
1972-73 9.3 - - - 10.5 15.8
1973-74 8.4 - - - 10.0 14.7
1974-75 9.1 - - - 9.2 13.7
1975-76 11.3 - - - 11.6 16.2
1976-77 9.9 - - - 13.7 20.0
1977-78 10.6 - - - 13.6 19.5
1978-79 10.3 - - - 12.3 16.70
1979-80 9.3 - - - 10.0 18.4
1980-81 11.1 - - - 9.6 18.3
1981-82 11.2 - - - 10.8 21.5
1982-83 9.90 - - - 12.8 24.7
1983-84 9.1 - - - 15.6 24.6
1984-85 11.00 - - - 16.9 20.8
1985-86 12.6 - - - 18.0 24.1
1986-87 14.2 - - - 19.8 29.0
1987-88 13.00 - - - 22.3 30.11987-88 13.00 - - - 22.3 30.1
1988-89 13.6 - - - 25.9 24.9
1989-90 14.8 - - - 27.4 23.7
1990-91 13.1 - - - 28.9 25.3
1991-92 12.8 - - - 30.8 27.4
1992-93 10.5 - - - 30.4 27.3
1993-94 10.5 - - - 32.5 26.7
1994-95 9.8 - - - 31.5 20.7
1995-96 10.2 - - - 32.1 24.9
1996-97 10.3 - - - 34.1 29.8
1997-98 12.2 - - - 37.4 26.3
1998-99 11.5 - - - 36.7 27.5
1999-2k 12.3 - - - 43.6 31.1
2000-01 14.6 - - - 42.9 26.6
2001-02 15.7 - - - 44.0 32.8
2002-03 16.7 - - - 46.3 45.6
2003-04 26.6 - - - 49.3 44.3
2004-05 36.4 - - - 53.8 46.5
2005-06 41.3 - - - 61.2 41.6
2006-07 38.8 - - - 73.1 41.9
2007-08 # 53.8 43.6 39.3 136.7 79.0 38.2
2008-09# 45.8 42.9 41.9 130.6 86.2 35.5
2009-10# 43.6 44.3 44.8 132.7 93.1 38.7
2010-11# 25.7 44.7 48.1 118.5 99.1 43.4
2011-12# 9.7 54.7 40.3 104.7 107.7 46.4
2012-13# 5.5 61.6 44.3 111.4 105.9 49.0
# - Figures of 2007-08 reflects the revised commodity group as modified from October,2007.
FREIGHT TRAFFIC
a) Tonnes Originating (Millions)-Commodity-wise
Container Services TotalFerti- Mineral
oilDomest
icExim Total Other Reven
uelisers (P.O.L.) Contain
er Contain
er Goods Traffic
4.7 8.9 - - - 48.2 167.9
5.2 10.1 - - - 47.7 170.1
5.4 10.2 - - - 49.3 175.3
5.3 10 - - - 44.4 162.1
6.0 10.7 - - - 45.5 173.6
7.2 11.6 - - - 46.9 196.8
7.8 12.4 - - - 48.3 212.6
8.2 13.1 - - - 45.5 210.8
8.6 14.3 - - - 43.5 199.6
8.2 14.3 - - - 43.0 193.1
8.1 15.0 - - - 42.0 195.9
9.6 16.5 - - - 43.1 221.2
8.5 17.3 - - - 41.4 228.7
8.1 17.9 - - - 36.3 230.1
12.2 18.2 - - - 34.9 236.4
13.6 18.6 - - - 38.2 258.5
14.5 19.9 - - - 37.4 277.7
13.2 21.7 - - - 35.3 290.213.2 21.7 - - - 35.3 290.2
16.1 22.6 - - - 34.6 302.1
17.0 24.3 - - - 35.1 310.0
18.4 25.0 - - - 36.6 318.4
18.6 25.6 - - - 35.5 338.0
18.9 26.4 - - - 33.8 350.1
19.5 25.9 - - - 31.1 358.7
21.5 27.7 - - - 32.8 365.0
23.7 28.9 - - - 35.5 390.7
21.2 28.5 - - - 36.5 409.0
26.7 30.7 - - - 37.8 429.4
27.8 33.0 - - - 39.9 420.9
31.1 34.3 - - - 44.6 456.4
27.0 36.2 - - - 52.0 473.5
27.2 35.6 - - - 55.6 492.5
26.5 34.0 - - - 59.2 518.7
23.7 32.0* - - - 71.4* 557.4
28.8 32.0 - - - 73.7 602.1
32.7 33.5 - - - 93.0 666.5
34.3 35.2* - - - 116.9* 727.8
35.8 35.9 3.7 17.4 21.1 73.4 793.9
41.4 38.1 7.0 23.3 30.3 62.2 833.4
43.7 38.9 9.6 25.3 34.9 66.1 887.8
48.2 39.3 11.0 26.6 37.6 69.1 921.7
52.7 39.8 9.5 28.5 38.0 74.3 969.1
46.2 40.6 9.4 31.7 41.1 66.6 1008.1
08 reflects the revised commodity group as * - Revised
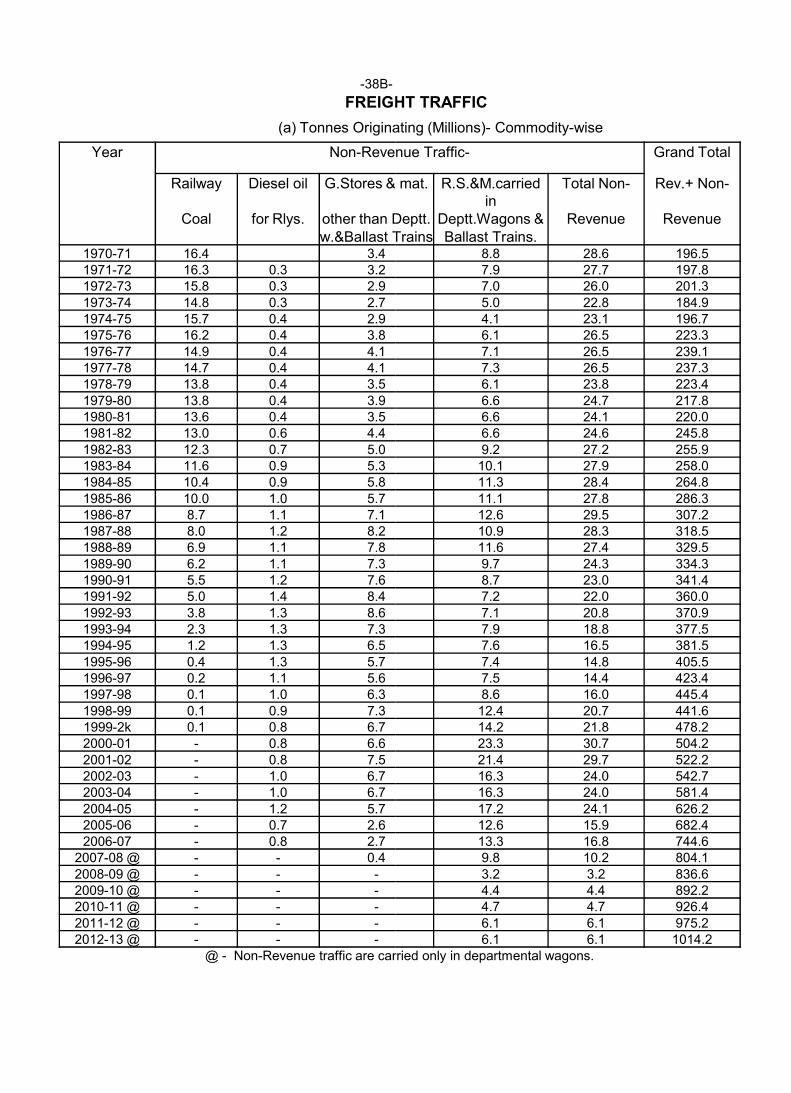
-38B-
FREIGHT TRAFFIC
(a) Tonnes Originating (Millions)
Year Non-Revenue
Railway Diesel oil G.Stores & mat.
Coal for Rlys. other than Deptt.w.&Ballast Trains
1970-71 16.4 3.41971-72 16.3 0.3 3.21972-73 15.8 0.3 2.91973-74 14.8 0.3 2.71974-75 15.7 0.4 2.91975-76 16.2 0.4 3.81976-77 14.9 0.4 4.11977-78 14.7 0.4 4.11978-79 13.8 0.4 3.51979-80 13.8 0.4 3.91980-81 13.6 0.4 3.51981-82 13.0 0.6 4.41982-83 12.3 0.7 5.01983-84 11.6 0.9 5.31984-85 10.4 0.9 5.81985-86 10.0 1.0 5.71986-87 8.7 1.1 7.11987-88 8.0 1.2 8.21988-89 6.9 1.1 7.81988-89 6.9 1.1 7.81989-90 6.2 1.1 7.31990-91 5.5 1.2 7.61991-92 5.0 1.4 8.41992-93 3.8 1.3 8.61993-94 2.3 1.3 7.31994-95 1.2 1.3 6.51995-96 0.4 1.3 5.71996-97 0.2 1.1 5.61997-98 0.1 1.0 6.31998-99 0.1 0.9 7.31999-2k 0.1 0.8 6.72000-01 - 0.8 6.62001-02 - 0.8 7.52002-03 - 1.0 6.72003-04 - 1.0 6.72004-05 - 1.2 5.72005-06 - 0.7 2.62006-07 - 0.8 2.7
2007-08 @ - - 0.42008-09 @ - - -2009-10 @ - - -2010-11 @ - - -2011-12 @ - - -2012-13 @ - - -
@ - Non-Revenue traffic are carried only in departmental wagons.
FREIGHT TRAFFIC
(a) Tonnes Originating (Millions)- Commodity-wise
Revenue Traffic- Grand Total
G.Stores & mat. R.S.&M.carried in
Total Non- Rev.+ Non-
other than Deptt. Deptt.Wagons & Revenue Revenuew.&Ballast Trains Ballast Trains.
8.8 28.6 196.57.9 27.7 197.87.0 26.0 201.35.0 22.8 184.94.1 23.1 196.76.1 26.5 223.37.1 26.5 239.17.3 26.5 237.36.1 23.8 223.46.6 24.7 217.86.6 24.1 220.06.6 24.6 245.89.2 27.2 255.910.1 27.9 258.011.3 28.4 264.811.1 27.8 286.312.6 29.5 307.210.9 28.3 318.511.6 27.4 329.511.6 27.4 329.59.7 24.3 334.38.7 23.0 341.47.2 22.0 360.07.1 20.8 370.97.9 18.8 377.57.6 16.5 381.57.4 14.8 405.57.5 14.4 423.48.6 16.0 445.412.4 20.7 441.614.2 21.8 478.223.3 30.7 504.221.4 29.7 522.216.3 24.0 542.716.3 24.0 581.417.2 24.1 626.212.6 15.9 682.413.3 16.8 744.69.8 10.2 804.13.2 3.2 836.64.4 4.4 892.24.7 4.7 926.46.1 6.1 975.26.1 6.1 1014.2
Revenue traffic are carried only in departmental wagons.
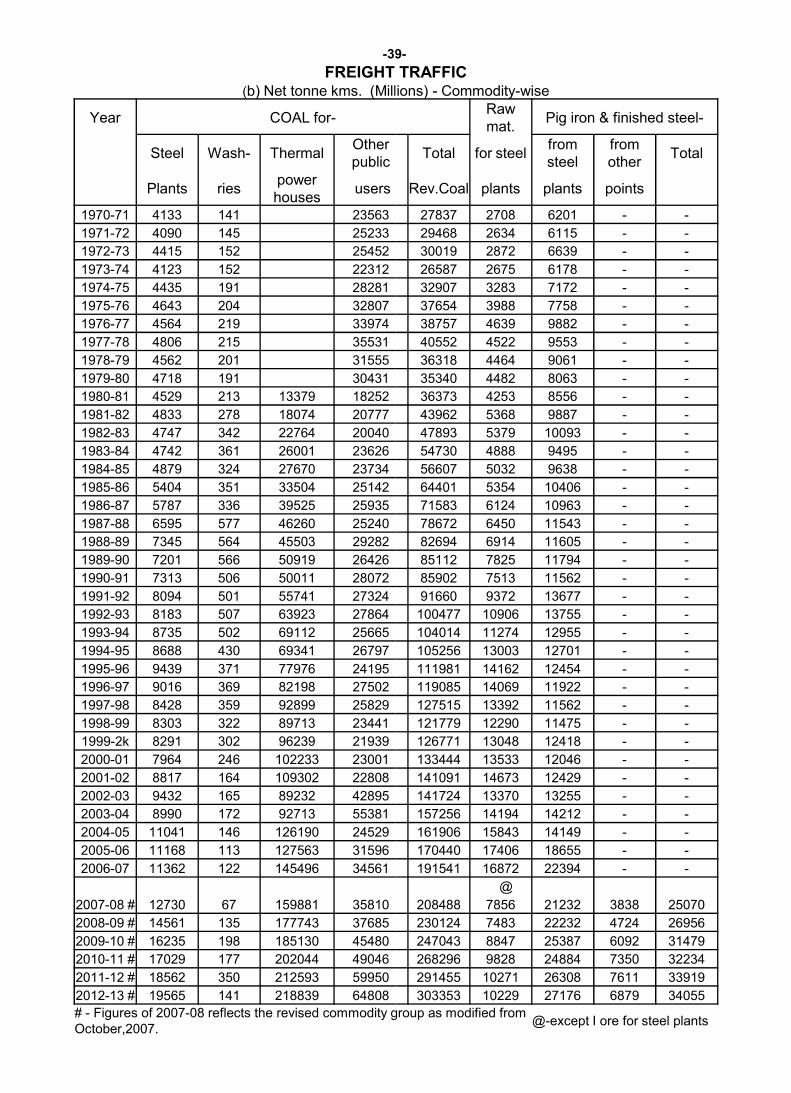
-39
FREIGHT TRAFFIC(b) Net tonne kms. (Millions)
Year COAL for-
Steel Wash- Thermal Other public
Plants riespower houses
users
1970-71 4133 141 23563
1971-72 4090 145 25233
1972-73 4415 152 25452
1973-74 4123 152 22312
1974-75 4435 191 28281
1975-76 4643 204 32807
1976-77 4564 219 33974
1977-78 4806 215 35531
1978-79 4562 201 31555
1979-80 4718 191 30431
1980-81 4529 213 13379 18252
1981-82 4833 278 18074 20777
1982-83 4747 342 22764 20040
1983-84 4742 361 26001 23626
1984-85 4879 324 27670 23734
1985-86 5404 351 33504 25142
1986-87 5787 336 39525 25935
1987-88 6595 577 46260 25240
1988-89 7345 564 45503 292821988-89 7345 564 45503 29282
1989-90 7201 566 50919 26426
1990-91 7313 506 50011 28072
1991-92 8094 501 55741 27324
1992-93 8183 507 63923 27864
1993-94 8735 502 69112 25665
1994-95 8688 430 69341 26797
1995-96 9439 371 77976 24195
1996-97 9016 369 82198 27502
1997-98 8428 359 92899 25829
1998-99 8303 322 89713 23441
1999-2k 8291 302 96239 21939
2000-01 7964 246 102233 23001
2001-02 8817 164 109302 22808
2002-03 9432 165 89232 42895
2003-04 8990 172 92713 55381
2004-05 11041 146 126190 24529
2005-06 11168 113 127563 31596
2006-07 11362 122 145496 34561
2007-08 # 12730 67 159881 35810
2008-09 # 14561 135 177743 37685
2009-10 # 16235 198 185130 45480
2010-11 # 17029 177 202044 49046
2011-12 # 18562 350 212593 59950
2012-13 # 19565 141 218839 64808
# - Figures of 2007-08 reflects the revised commodity group as modified from October,2007.
39-
FREIGHT TRAFFIC. (Millions) - Commodity-wise
Raw mat.
Pig iron & finished steel-
Total for steelfrom steel
from other
Total
Rev.Coal plants plants points
27837 2708 6201 - -
29468 2634 6115 - -
30019 2872 6639 - -
26587 2675 6178 - -
32907 3283 7172 - -
37654 3988 7758 - -
38757 4639 9882 - -
40552 4522 9553 - -
36318 4464 9061 - -
35340 4482 8063 - -
36373 4253 8556 - -
43962 5368 9887 - -
47893 5379 10093 - -
54730 4888 9495 - -
56607 5032 9638 - -
64401 5354 10406 - -
71583 6124 10963 - -
78672 6450 11543 - -
82694 6914 11605 - -82694 6914 11605 - -
85112 7825 11794 - -
85902 7513 11562 - -
91660 9372 13677 - -
100477 10906 13755 - -
104014 11274 12955 - -
105256 13003 12701 - -
111981 14162 12454 - -
119085 14069 11922 - -
127515 13392 11562 - -
121779 12290 11475 - -
126771 13048 12418 - -
133444 13533 12046 - -
141091 14673 12429 - -
141724 13370 13255 - -
157256 14194 14212 - -
161906 15843 14149 - -
170440 17406 18655 - -
191541 16872 22394 - -
@
208488 7856 21232 3838 25070
230124 7483 22232 4724 26956
247043 8847 25387 6092 31479
268296 9828 24884 7350 32234
291455 10271 26308 7611 33919
303353 10229 27176 6879 34055
08 reflects the revised commodity group as modified from @-except I ore for steel plants
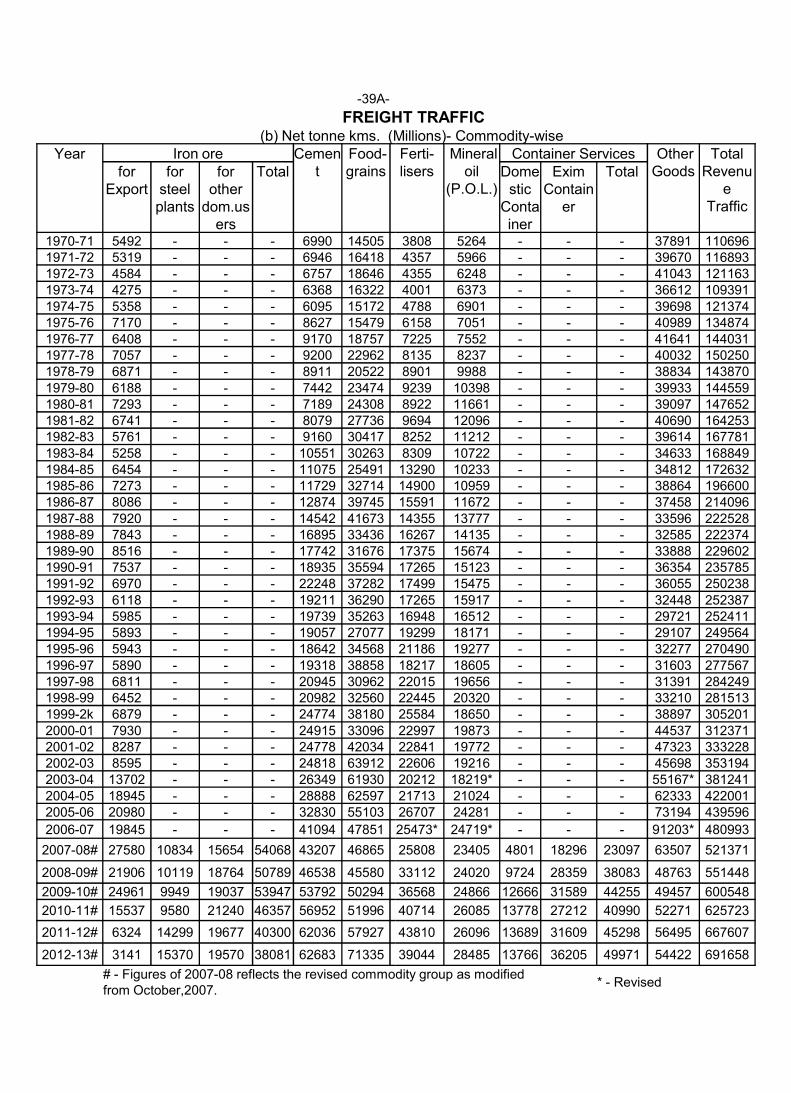
-39A-
FREIGHT TRAFFIC(b) Net tonne kms. (Millions)
Year Iron ore Cement
Food-grainsfor
Exportfor
steelplants
for other
dom.users
Total
1970-71 5492 - - - 6990 145051971-72 5319 - - - 6946 164181972-73 4584 - - - 6757 186461973-74 4275 - - - 6368 163221974-75 5358 - - - 6095 151721975-76 7170 - - - 8627 154791976-77 6408 - - - 9170 187571977-78 7057 - - - 9200 229621978-79 6871 - - - 8911 205221979-80 6188 - - - 7442 234741980-81 7293 - - - 7189 243081981-82 6741 - - - 8079 277361982-83 5761 - - - 9160 304171983-84 5258 - - - 10551 302631984-85 6454 - - - 11075 254911985-86 7273 - - - 11729 327141986-87 8086 - - - 12874 397451987-88 7920 - - - 14542 416731988-89 7843 - - - 16895 334361989-90 8516 - - - 17742 316761989-90 8516 - - - 17742 316761990-91 7537 - - - 18935 355941991-92 6970 - - - 22248 372821992-93 6118 - - - 19211 362901993-94 5985 - - - 19739 352631994-95 5893 - - - 19057 270771995-96 5943 - - - 18642 345681996-97 5890 - - - 19318 388581997-98 6811 - - - 20945 309621998-99 6452 - - - 20982 325601999-2k 6879 - - - 24774 381802000-01 7930 - - - 24915 330962001-02 8287 - - - 24778 420342002-03 8595 - - - 24818 639122003-04 13702 - - - 26349 619302004-05 18945 - - - 28888 625972005-06 20980 - - - 32830 55103
2006-07 19845 - - - 41094 47851
2007-08# 27580 10834 15654 54068 43207 46865
2008-09# 21906 10119 18764 50789 46538 45580
2009-10# 24961 9949 19037 53947 53792 50294
2010-11# 15537 9580 21240 46357 56952 51996
2011-12# 6324 14299 19677 40300 62036 57927
2012-13# 3141 15370 19570 38081 62683 71335
# - Figures of 2007-08 reflects the revised commodity group as modified from October,2007.
FREIGHT TRAFFIC. (Millions)- Commodity-wise
Ferti-lisers
Mineral oil
(P.O.L.)
Container Services OtherGoods
TotalRevenu
eTraffic
Domestic
Container
EximContain
er
Total
3808 5264 - - - 37891 1106964357 5966 - - - 39670 1168934355 6248 - - - 41043 1211634001 6373 - - - 36612 1093914788 6901 - - - 39698 1213746158 7051 - - - 40989 1348747225 7552 - - - 41641 1440318135 8237 - - - 40032 1502508901 9988 - - - 38834 1438709239 10398 - - - 39933 1445598922 11661 - - - 39097 1476529694 12096 - - - 40690 1642538252 11212 - - - 39614 1677818309 10722 - - - 34633 16884913290 10233 - - - 34812 17263214900 10959 - - - 38864 19660015591 11672 - - - 37458 21409614355 13777 - - - 33596 22252816267 14135 - - - 32585 22237417375 15674 - - - 33888 22960217375 15674 - - - 33888 22960217265 15123 - - - 36354 23578517499 15475 - - - 36055 25023817265 15917 - - - 32448 25238716948 16512 - - - 29721 25241119299 18171 - - - 29107 24956421186 19277 - - - 32277 27049018217 18605 - - - 31603 27756722015 19656 - - - 31391 28424922445 20320 - - - 33210 28151325584 18650 - - - 38897 30520122997 19873 - - - 44537 31237122841 19772 - - - 47323 33322822606 19216 - - - 45698 35319420212 18219* - - - 55167* 38124121713 21024 - - - 62333 42200126707 24281 - - - 73194 439596
25473* 24719* - - - 91203* 480993
25808 23405 4801 18296 23097 63507 521371
33112 24020 9724 28359 38083 48763 551448
36568 24866 12666 31589 44255 49457 600548
40714 26085 13778 27212 40990 52271 625723
43810 26096 13689 31609 45298 56495 667607
39044 28485 13766 36205 49971 54422 691658
08 reflects the revised commodity group as modified * - Revised
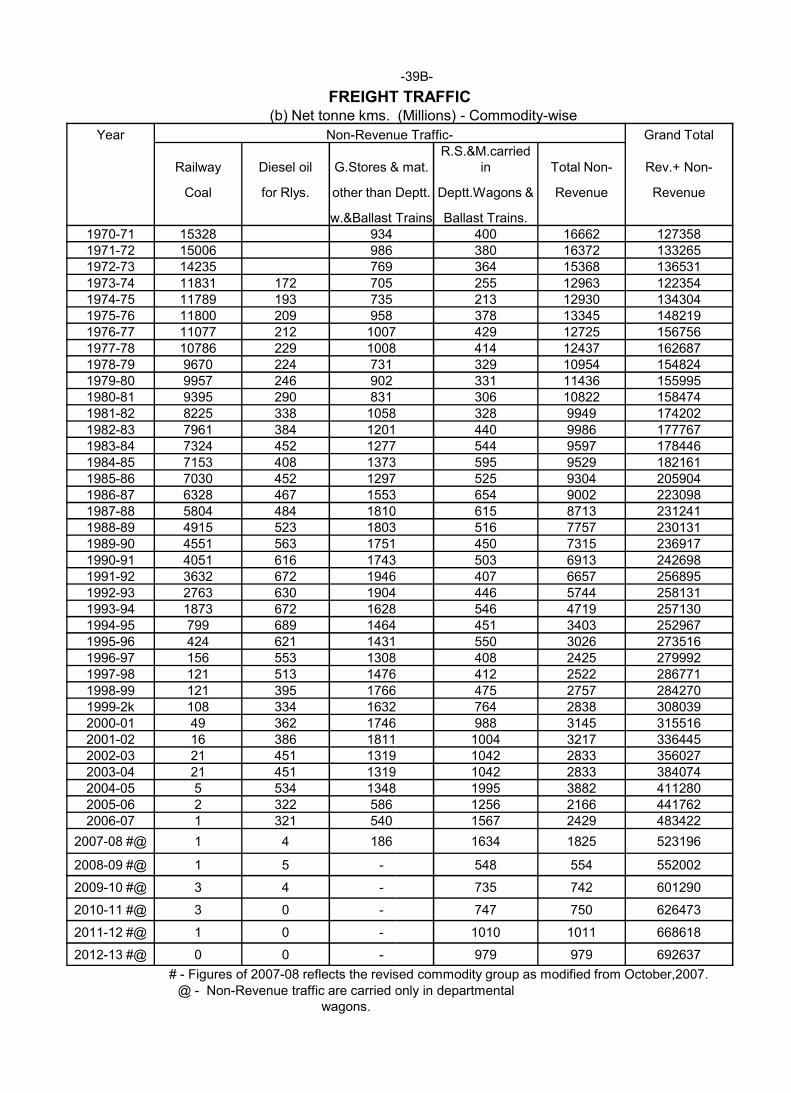
FREIGHT TRAFFIC(b) Net tonne kms. (Millions)
Year Non-Revenue Traffic
Railway Diesel oil G.Stores & mat.
Coal for Rlys. other than Deptt.
w.&Ballast Trains1970-71 15328 9341971-72 15006 9861972-73 14235 7691973-74 11831 172 7051974-75 11789 193 7351975-76 11800 209 9581976-77 11077 212 10071977-78 10786 229 10081978-79 9670 224 7311979-80 9957 246 9021980-81 9395 290 8311981-82 8225 338 10581982-83 7961 384 12011983-84 7324 452 12771984-85 7153 408 13731985-86 7030 452 12971986-87 6328 467 15531987-88 5804 484 18101988-89 4915 523 18031989-90 4551 563 17511989-90 4551 563 17511990-91 4051 616 17431991-92 3632 672 19461992-93 2763 630 19041993-94 1873 672 16281994-95 799 689 14641995-96 424 621 14311996-97 156 553 13081997-98 121 513 14761998-99 121 395 17661999-2k 108 334 16322000-01 49 362 17462001-02 16 386 18112002-03 21 451 13192003-04 21 451 13192004-05 5 534 13482005-06 2 322 5862006-07 1 321 540
2007-08 #@ 1 4 186
2008-09 #@ 1 5 -
2009-10 #@ 3 4 -
2010-11 #@ 3 0 -
2011-12 #@ 1 0 -
2012-13 #@ 0 0 -
# - Figures of 2007-08 reflects the revised commodity group as modified from October,2007.@ - Non-Revenue traffic are carried only in departmental
wagons.
-39B-
FREIGHT TRAFFIC. (Millions) - Commodity-wise
Revenue Traffic- Grand Total
G.Stores & mat.R.S.&M.carried
in Total Non- Rev.+ Non-
other than Deptt. Deptt.Wagons & Revenue Revenue
Trains Ballast Trains.400 16662 127358380 16372 133265364 15368 136531255 12963 122354213 12930 134304378 13345 148219
1007 429 12725 1567561008 414 12437 162687
329 10954 154824331 11436 155995306 10822 158474
1058 328 9949 1742021201 440 9986 1777671277 544 9597 1784461373 595 9529 1821611297 525 9304 2059041553 654 9002 2230981810 615 8713 2312411803 516 7757 2301311751 450 7315 2369171751 450 7315 2369171743 503 6913 2426981946 407 6657 2568951904 446 5744 2581311628 546 4719 2571301464 451 3403 2529671431 550 3026 2735161308 408 2425 2799921476 412 2522 2867711766 475 2757 2842701632 764 2838 3080391746 988 3145 3155161811 1004 3217 3364451319 1042 2833 3560271319 1042 2833 3840741348 1995 3882 411280
1256 2166 4417621567 2429 483422
1634 1825 523196
548 554 552002
735 742 601290
747 750 626473
1010 1011 668618
979 979 692637
08 reflects the revised commodity group as modified from October,2007.Revenue traffic are carried only in departmental
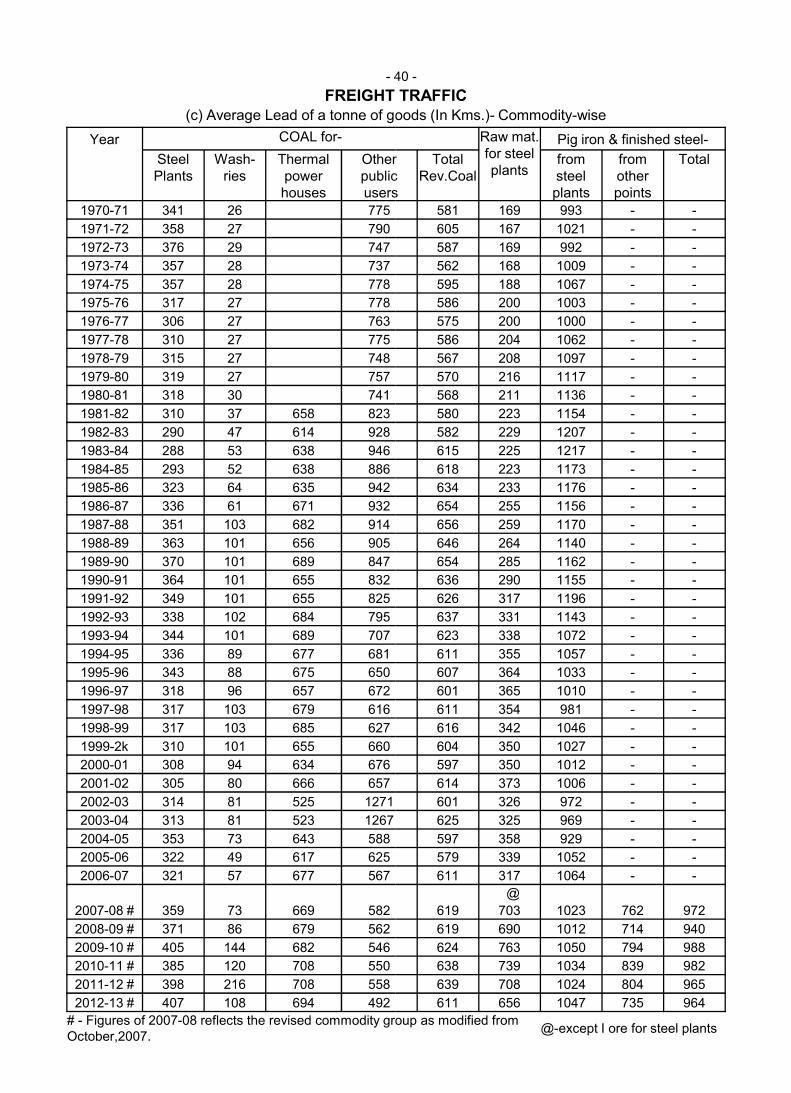
- 40
FREIGHT TRAFFIC(c) Average Lead of a tonne of goods (In
Year COAL for-
SteelPlants
Wash-ries
Thermal power houses
Other publicusers
1970-71 341 26 775
1971-72 358 27 790
1972-73 376 29 747
1973-74 357 28 737
1974-75 357 28 778
1975-76 317 27 778
1976-77 306 27 763
1977-78 310 27 775
1978-79 315 27 748
1979-80 319 27 757
1980-81 318 30 741
1981-82 310 37 658 823
1982-83 290 47 614 928
1983-84 288 53 638 946
1984-85 293 52 638 886
1985-86 323 64 635 942
1986-87 336 61 671 932
1987-88 351 103 682 914
1988-89 363 101 656 9051988-89 363 101 656 905
1989-90 370 101 689 847
1990-91 364 101 655 832
1991-92 349 101 655 825
1992-93 338 102 684 795
1993-94 344 101 689 707
1994-95 336 89 677 681
1995-96 343 88 675 650
1996-97 318 96 657 672
1997-98 317 103 679 616
1998-99 317 103 685 627
1999-2k 310 101 655 660
2000-01 308 94 634 676
2001-02 305 80 666 657
2002-03 314 81 525 1271
2003-04 313 81 523 1267
2004-05 353 73 643 588
2005-06 322 49 617 625
2006-07 321 57 677 567
2007-08 # 359 73 669 582
2008-09 # 371 86 679 562
2009-10 # 405 144 682 546
2010-11 # 385 120 708 550
2011-12 # 398 216 708 558
2012-13 # 407 108 694 492
# - Figures of 2007-08 reflects the revised commodity group as modified from October,2007.
40 -
FREIGHT TRAFFIC(c) Average Lead of a tonne of goods (In Kms.)- Commodity-wise
Raw mat.for steelplants
Pig iron & finished steel-
Other publicusers
TotalRev.Coal
from steel plants
from otherpoints
Total
581 169 993 - -
605 167 1021 - -
587 169 992 - -
562 168 1009 - -
595 188 1067 - -
586 200 1003 - -
575 200 1000 - -
586 204 1062 - -
567 208 1097 - -
570 216 1117 - -
568 211 1136 - -
580 223 1154 - -
582 229 1207 - -
615 225 1217 - -
618 223 1173 - -
634 233 1176 - -
654 255 1156 - -
656 259 1170 - -
646 264 1140 - -646 264 1140 - -
654 285 1162 - -
636 290 1155 - -
626 317 1196 - -
637 331 1143 - -
623 338 1072 - -
611 355 1057 - -
607 364 1033 - -
601 365 1010 - -
611 354 981 - -
616 342 1046 - -
604 350 1027 - -
597 350 1012 - -
614 373 1006 - -
601 326 972 - -
625 325 969 - -
597 358 929 - -
579 339 1052 - -
611 317 1064 - -
@
619 703 1023 762 972
619 690 1012 714 940
624 763 1050 794 988
638 739 1034 839 982
639 708 1024 804 965
611 656 1047 735 964
08 reflects the revised commodity group as modified from @-except I ore for steel plants
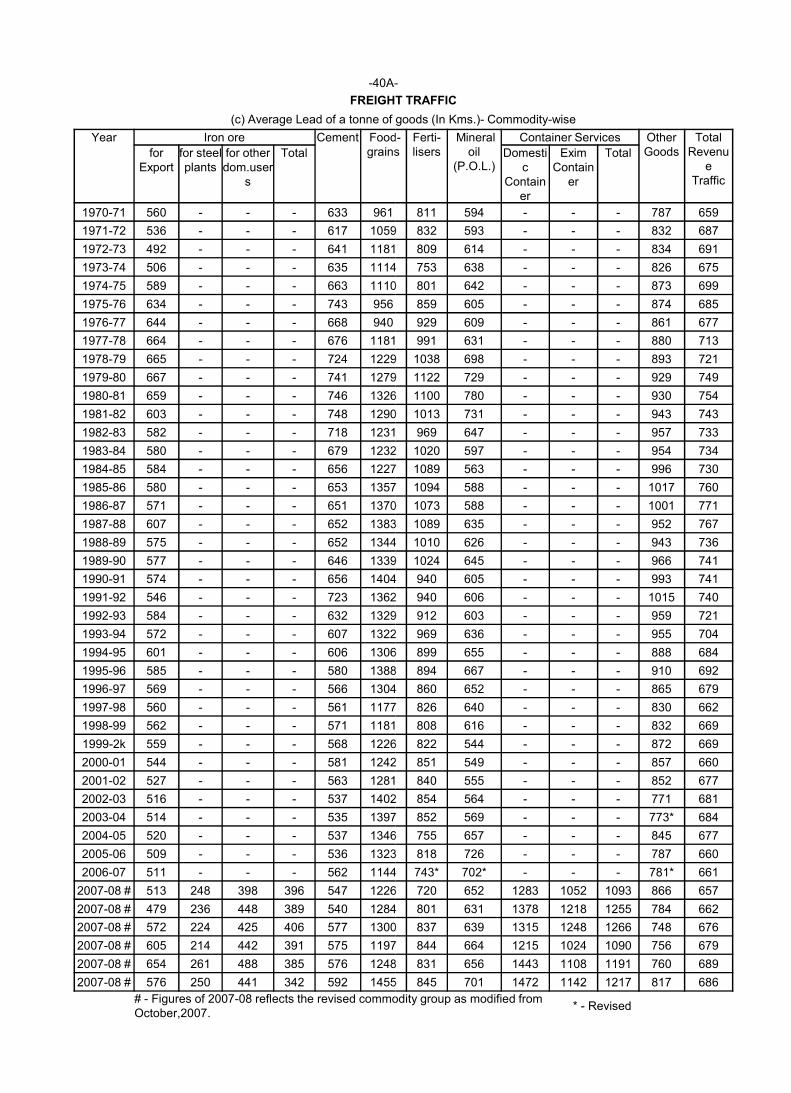
-40A-
FREIGHT TRAFFIC
(c) Average Lead of a tonne of goods (In Kms.)
Year Iron ore Cement Foodgrainsfor
Exportfor steelplants
for other dom.user
s
Total
1970-71 560 - - - 633 961
1971-72 536 - - - 617 1059
1972-73 492 - - - 641 1181
1973-74 506 - - - 635 1114
1974-75 589 - - - 663 1110
1975-76 634 - - - 743 956
1976-77 644 - - - 668 940
1977-78 664 - - - 676 1181
1978-79 665 - - - 724 1229
1979-80 667 - - - 741 1279
1980-81 659 - - - 746 1326
1981-82 603 - - - 748 1290
1982-83 582 - - - 718 1231
1983-84 580 - - - 679 1232
1984-85 584 - - - 656 1227
1985-86 580 - - - 653 1357
1986-87 571 - - - 651 1370
1987-88 607 - - - 652 1383
1988-89 575 - - - 652 13441988-89 575 - - - 652 1344
1989-90 577 - - - 646 1339
1990-91 574 - - - 656 1404
1991-92 546 - - - 723 1362
1992-93 584 - - - 632 1329
1993-94 572 - - - 607 1322
1994-95 601 - - - 606 1306
1995-96 585 - - - 580 1388
1996-97 569 - - - 566 1304
1997-98 560 - - - 561 1177
1998-99 562 - - - 571 1181
1999-2k 559 - - - 568 1226
2000-01 544 - - - 581 1242
2001-02 527 - - - 563 1281
2002-03 516 - - - 537 1402
2003-04 514 - - - 535 1397
2004-05 520 - - - 537 1346
2005-06 509 - - - 536 1323
2006-07 511 - - - 562 1144
2007-08 # 513 248 398 396 547 1226
2007-08 # 479 236 448 389 540 1284
2007-08 # 572 224 425 406 577 1300
2007-08 # 605 214 442 391 575 1197
2007-08 # 654 261 488 385 576 1248
2007-08 # 576 250 441 342 592 1455
# - Figures of 2007-08 reflects the revised commodity group as modified from October,2007.
-
FREIGHT TRAFFIC
(c) Average Lead of a tonne of goods (In Kms.)- Commodity-wise
Food-grains
Ferti-lisers
Mineral oil
(P.O.L.)
Container Services OtherGoods
TotalRevenu
eTraffic
Domestic
Container
EximContain
er
Total
811 594 - - - 787 659
1059 832 593 - - - 832 687
1181 809 614 - - - 834 691
1114 753 638 - - - 826 675
1110 801 642 - - - 873 699
859 605 - - - 874 685
929 609 - - - 861 677
1181 991 631 - - - 880 713
1229 1038 698 - - - 893 721
1279 1122 729 - - - 929 749
1326 1100 780 - - - 930 754
1290 1013 731 - - - 943 743
1231 969 647 - - - 957 733
1232 1020 597 - - - 954 734
1227 1089 563 - - - 996 730
1357 1094 588 - - - 1017 760
1370 1073 588 - - - 1001 771
1383 1089 635 - - - 952 767
1344 1010 626 - - - 943 7361344 1010 626 - - - 943 736
1339 1024 645 - - - 966 741
1404 940 605 - - - 993 741
1362 940 606 - - - 1015 740
1329 912 603 - - - 959 721
1322 969 636 - - - 955 704
1306 899 655 - - - 888 684
1388 894 667 - - - 910 692
1304 860 652 - - - 865 679
1177 826 640 - - - 830 662
1181 808 616 - - - 832 669
1226 822 544 - - - 872 669
1242 851 549 - - - 857 660
1281 840 555 - - - 852 677
1402 854 564 - - - 771 681
1397 852 569 - - - 773* 684
1346 755 657 - - - 845 677
1323 818 726 - - - 787 660
1144 743* 702* - - - 781* 661
1226 720 652 1283 1052 1093 866 657
1284 801 631 1378 1218 1255 784 662
1300 837 639 1315 1248 1266 748 676
1197 844 664 1215 1024 1090 756 679
1248 831 656 1443 1108 1191 760 689
1455 845 701 1472 1142 1217 817 686
08 reflects the revised commodity group as modified from * - Revised
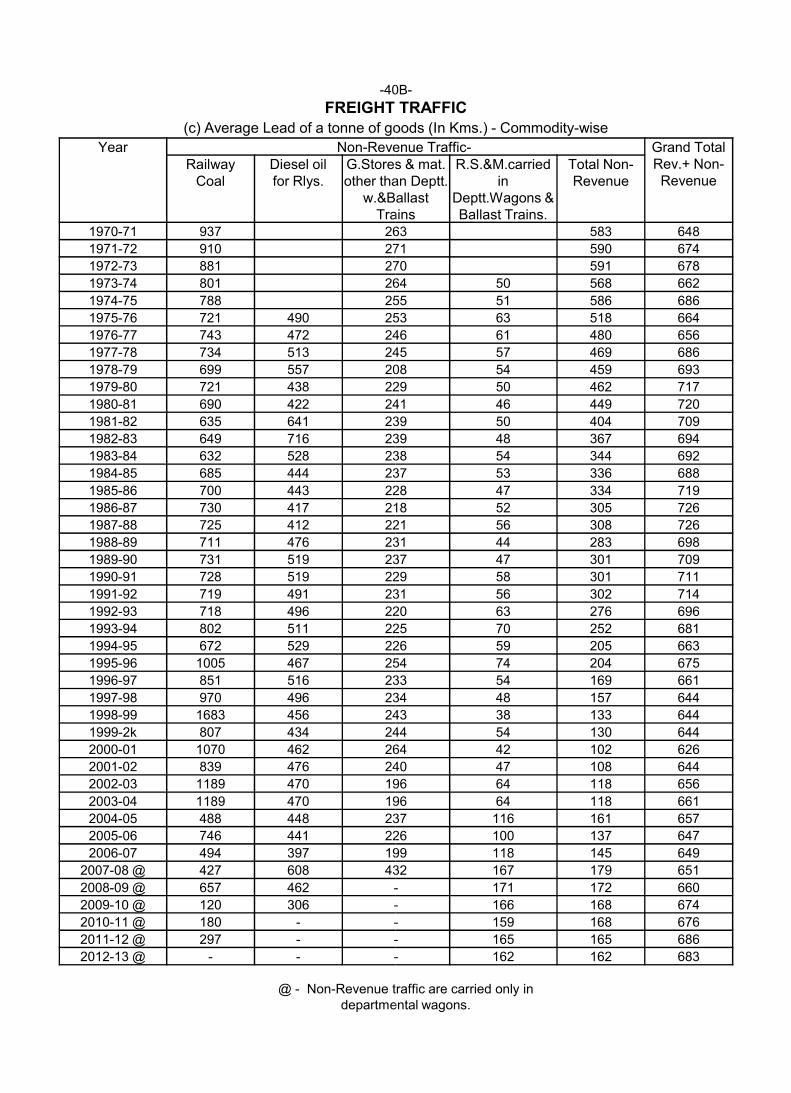
-40B
FREIGHT TRAFFIC(c) Average Lead of a tonne of goods (In
Year Non-Revenue Railway
CoalDiesel oilfor Rlys.
G.Storesother than
w.&BallastTrains
1970-71 937 263
1971-72 910 271
1972-73 881 270
1973-74 801 264
1974-75 788 255
1975-76 721 490 253
1976-77 743 472 246
1977-78 734 513 245
1978-79 699 557 208
1979-80 721 438 229
1980-81 690 422 241
1981-82 635 641 239
1982-83 649 716 239
1983-84 632 528 238
1984-85 685 444 237
1985-86 700 443 228
1986-87 730 417 218
1987-88 725 412 221
1988-89 711 476 2311988-89 711 476 231
1989-90 731 519 237
1990-91 728 519 229
1991-92 719 491 231
1992-93 718 496 220
1993-94 802 511 225
1994-95 672 529 226
1995-96 1005 467 254
1996-97 851 516 233
1997-98 970 496 234
1998-99 1683 456 243
1999-2k 807 434 244
2000-01 1070 462 264
2001-02 839 476 240
2002-03 1189 470 196
2003-04 1189 470 196
2004-05 488 448 237
2005-06 746 441 226
2006-07 494 397 199
2007-08 @ 427 608 432
2008-09 @ 657 462 -
2009-10 @ 120 306 -
2010-11 @ 180 - -
2011-12 @ 297 - -
2012-13 @ - - -
@ - Non-Revenue traffic are carried only in departmental wagons.
40B-
FREIGHT TRAFFIC(c) Average Lead of a tonne of goods (In Kms.) - Commodity-wise
Revenue Traffic- Grand TotalRev.+ Non-Revenue
G.Stores & mat.other than Deptt.
w.&BallastTrains
R.S.&M.carriedin
Deptt.Wagons &Ballast Trains.
Total Non-Revenue
263 583 648
271 590 674
270 591 678
264 50 568 662
255 51 586 686
253 63 518 664
246 61 480 656
245 57 469 686
208 54 459 693
229 50 462 717
241 46 449 720
239 50 404 709
239 48 367 694
238 54 344 692
237 53 336 688
228 47 334 719
218 52 305 726
221 56 308 726
231 44 283 698231 44 283 698
237 47 301 709
229 58 301 711
231 56 302 714
220 63 276 696
225 70 252 681
226 59 205 663
254 74 204 675
233 54 169 661
234 48 157 644
243 38 133 644
244 54 130 644
264 42 102 626
240 47 108 644
196 64 118 656
196 64 118 661
237 116 161 657
226 100 137 647
199 118 145 649
432 167 179 651
- 171 172 660
- 166 168 674
- 159 168 676
- 165 165 686
- 162 162 683
Revenue traffic are carried only in departmental wagons.
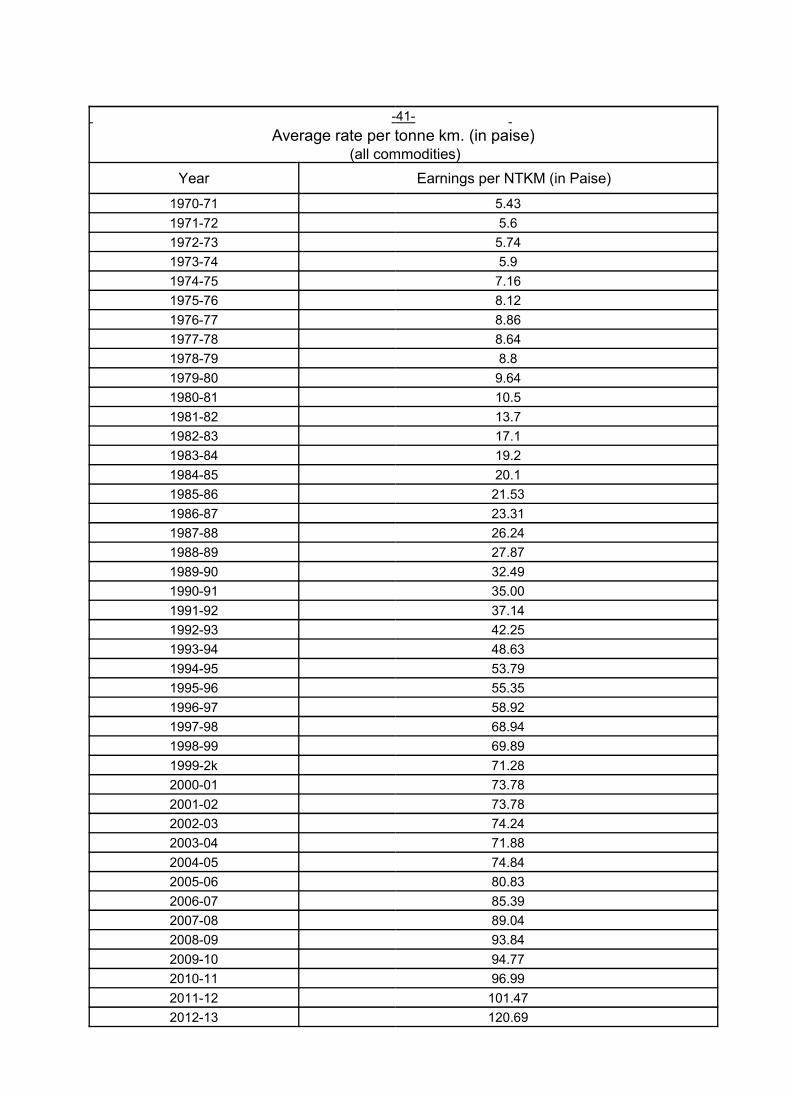
-
Average rate per tonne km. (in (all commodities)
Year
1970-71
1971-72
1972-73
1973-74
1974-75
1975-76
1976-77
1977-78
1978-79
1979-80
1980-81
1981-82
1982-83
1983-84
1984-85
1985-86
1986-87
1987-88
1988-891988-89
1989-90
1990-91
1991-92
1992-93
1993-94
1994-95
1995-96
1996-97
1997-98
1998-99
1999-2k
2000-01
2001-02
2002-03
2003-04
2004-05
2005-06
2006-07
2007-08
2008-09
2009-10
2010-11
2011-12
2012-13
-41-
Average rate per tonne km. (in paise)(all commodities)
Earnings per NTKM (in Paise)
5.43
5.6
5.74
5.9
7.16
8.12
8.86
8.64
8.8
9.64
10.5
13.7
17.1
19.2
20.1
21.53
23.31
26.24
27.8727.87
32.49
35.00
37.14
42.25
48.63
53.79
55.35
58.92
68.94
69.89
71.28
73.78
73.78
74.24
71.88
74.84
80.83
85.39
89.04
93.84
94.77
96.99
101.47
120.69
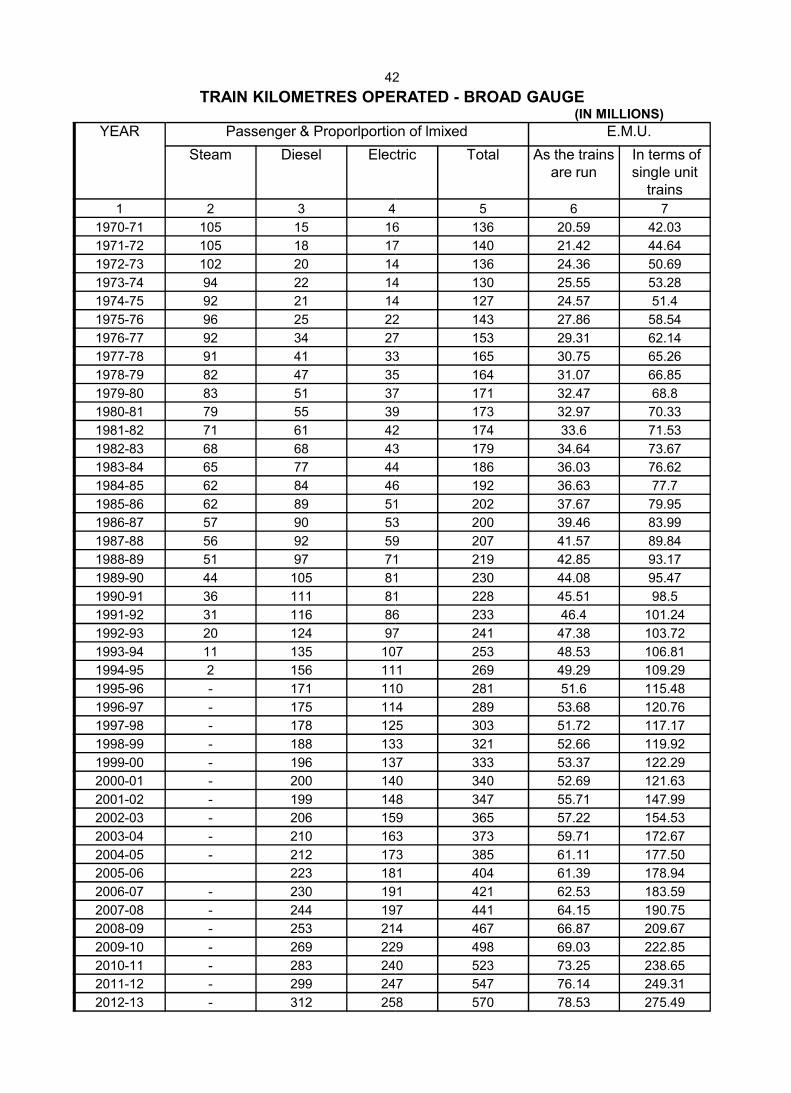
42
TRAIN KILOMETRES OPERATED
YEAR Passenger & Proporlportion
Steam Diesel Electric
1 2 3 4
1970-71 105 15 16
1971-72 105 18 17
1972-73 102 20 14
1973-74 94 22 14
1974-75 92 21 14
1975-76 96 25 22
1976-77 92 34 27
1977-78 91 41 33
1978-79 82 47 35
1979-80 83 51 37
1980-81 79 55 39
1981-82 71 61 42
1982-83 68 68 43
1983-84 65 77 44
1984-85 62 84 46
1985-86 62 89 51
1986-87 57 90 53
1987-88 56 92 591987-88 56 92 59
1988-89 51 97 71
1989-90 44 105 81
1990-91 36 111 81
1991-92 31 116 86
1992-93 20 124 97
1993-94 11 135 107
1994-95 2 156 111
1995-96 - 171 110
1996-97 - 175 114
1997-98 - 178 125
1998-99 - 188 133
1999-00 - 196 137
2000-01 - 200 140
2001-02 - 199 148
2002-03 - 206 159
2003-04 - 210 163
2004-05 - 212 173
2005-06 223 181
2006-07 - 230 191
2007-08 - 244 197
2008-09 - 253 214
2009-10 - 269 229
2010-11 - 283 240
2011-12 - 299 247
2012-13 - 312 258
42
TRAIN KILOMETRES OPERATED - BROAD GAUGE(IN MILLIONS)
Proporlportion of lmixed E.M.U.
Electric Total As the trains are run
In terms of single unit
trains
5 6 7
16 136 20.59 42.03
17 140 21.42 44.64
14 136 24.36 50.69
14 130 25.55 53.28
14 127 24.57 51.4
22 143 27.86 58.54
27 153 29.31 62.14
33 165 30.75 65.26
35 164 31.07 66.85
37 171 32.47 68.8
39 173 32.97 70.33
42 174 33.6 71.53
43 179 34.64 73.67
44 186 36.03 76.62
46 192 36.63 77.7
51 202 37.67 79.95
53 200 39.46 83.99
59 207 41.57 89.8459 207 41.57 89.84
71 219 42.85 93.17
81 230 44.08 95.47
81 228 45.51 98.5
86 233 46.4 101.24
97 241 47.38 103.72
107 253 48.53 106.81
111 269 49.29 109.29
110 281 51.6 115.48
114 289 53.68 120.76
125 303 51.72 117.17
133 321 52.66 119.92
137 333 53.37 122.29
140 340 52.69 121.63
148 347 55.71 147.99
159 365 57.22 154.53
163 373 59.71 172.67
173 385 61.11 177.50
181 404 61.39 178.94
191 421 62.53 183.59
197 441 64.15 190.75
214 467 66.87 209.67
229 498 69.03 222.85
240 523 73.25 238.65
247 547 76.14 249.31
258 570 78.53 275.49
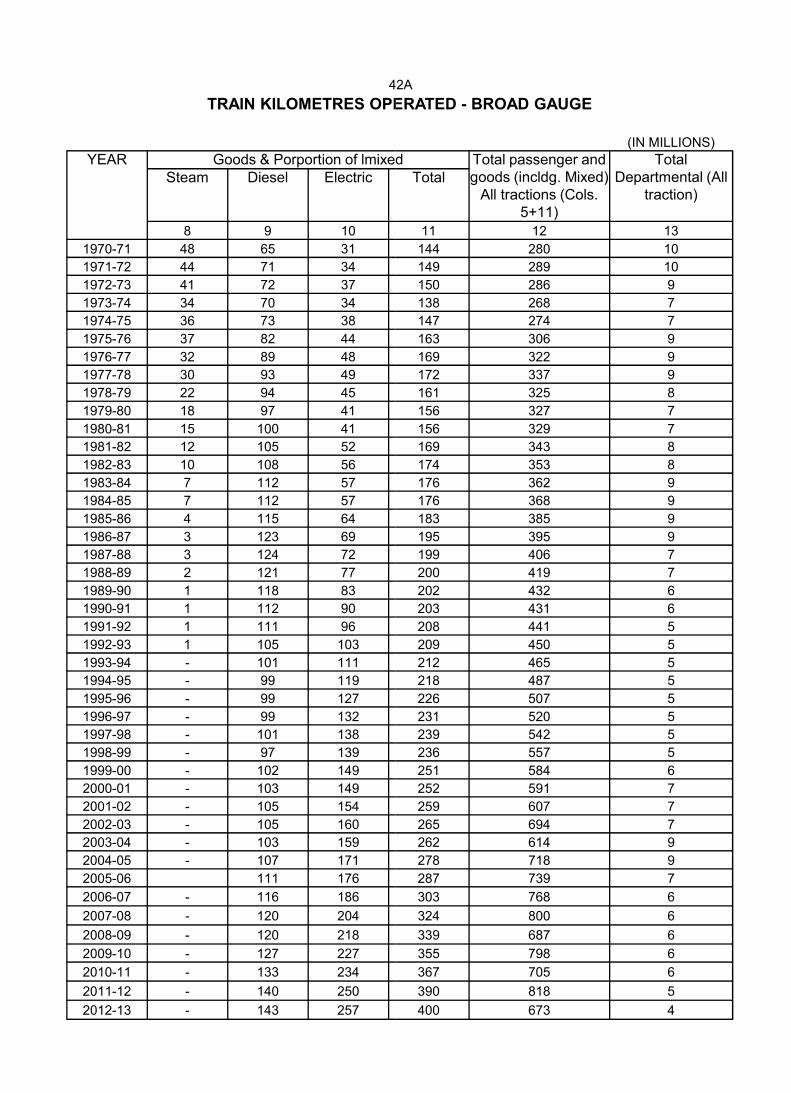
42A
TRAIN KILOMETRES OPERATED
YEAR Goods & Porportion of lmixedSteam Diesel Electric
8 9 10
1970-71 48 65 31
1971-72 44 71 34
1972-73 41 72 37
1973-74 34 70 34
1974-75 36 73 38
1975-76 37 82 44
1976-77 32 89 48
1977-78 30 93 49
1978-79 22 94 45
1979-80 18 97 41
1980-81 15 100 41
1981-82 12 105 52
1982-83 10 108 56
1983-84 7 112 57
1984-85 7 112 57
1985-86 4 115 64
1986-87 3 123 69
1987-88 3 124 72
1988-89 2 121 77
1989-90 1 118 83
1990-91 1 112 90
1991-92 1 111 96
1992-93 1 105 103
1993-94 - 101 111
1994-95 - 99 119
1995-96 - 99 127
1996-97 - 99 132
1997-98 - 101 138
1998-99 - 97 139
1999-00 - 102 149
2000-01 - 103 149
2001-02 - 105 154
2002-03 - 105 160
2003-04 - 103 159
2004-05 - 107 171
2005-06 111 176
2006-07 - 116 186
2007-08 - 120 204
2008-09 - 120 218
2009-10 - 127 227
2010-11 - 133 234
2011-12 - 140 250
2012-13 - 143 257
42A
TRAIN KILOMETRES OPERATED - BROAD GAUGE
(IN MILLIONS)
Goods & Porportion of lmixed Total passenger and goods (incldg. Mixed)
All tractions (Cols. 5+11)
Total Departmental (All
traction)Total
11 12 13
144 280 10
149 289 10
150 286 9
138 268 7
147 274 7
163 306 9
169 322 9
172 337 9
161 325 8
156 327 7
156 329 7
169 343 8
174 353 8
176 362 9
176 368 9
183 385 9
195 395 9
199 406 7
200 419 7
202 432 6
203 431 6
208 441 5
209 450 5
212 465 5
218 487 5
226 507 5
231 520 5
239 542 5
236 557 5
251 584 6
252 591 7
259 607 7
265 694 7
262 614 9
278 718 9
287 739 7
303 768 6
324 800 6
339 687 6
355 798 6
367 705 6
390 818 5
400 673 4
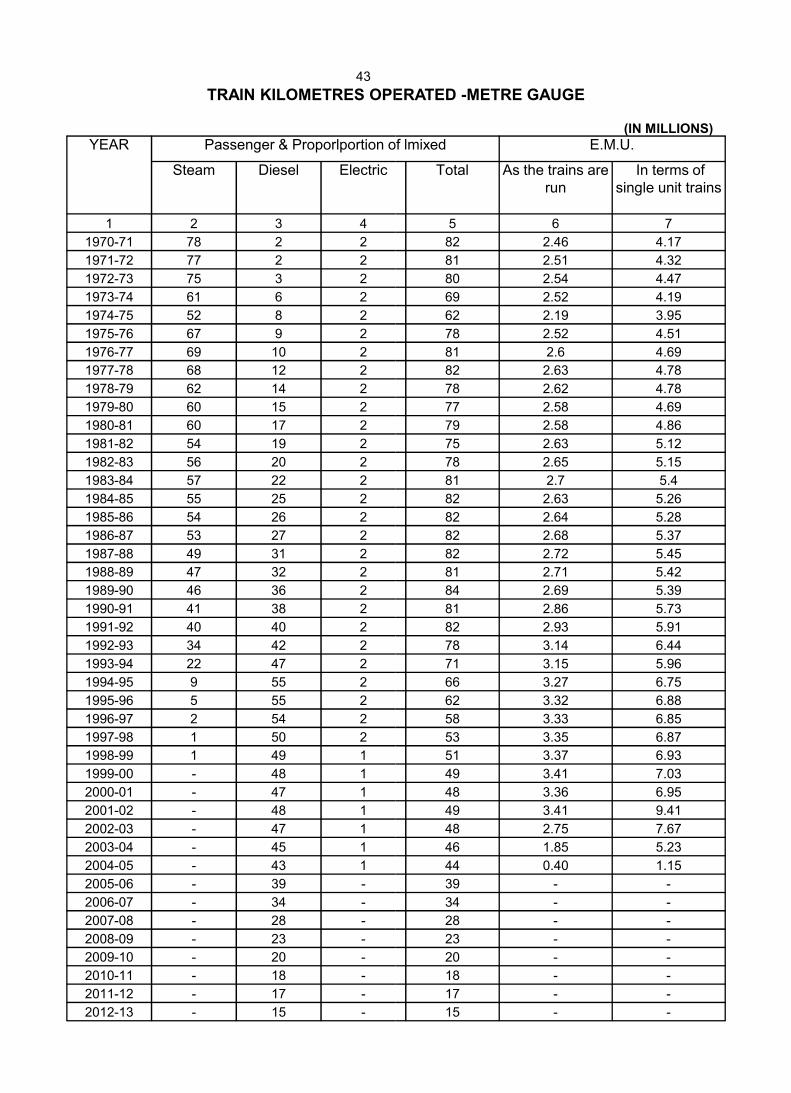
43
TRAIN KILOMETRES OPERATED
YEAR Passenger & Proporlportion of lmixed
Steam Diesel Electric
1 2 3 4
1970-71 78 2 2
1971-72 77 2 2
1972-73 75 3 2
1973-74 61 6 2
1974-75 52 8 2
1975-76 67 9 2
1976-77 69 10 2
1977-78 68 12 2
1978-79 62 14 2
1979-80 60 15 2
1980-81 60 17 2
1981-82 54 19 2
1982-83 56 20 2
1983-84 57 22 2
1984-85 55 25 2
1985-86 54 26 2
1986-87 53 27 2
1987-88 49 31 2
1988-89 47 32 2
1989-90 46 36 2
1990-91 41 38 2
1991-92 40 40 2
1992-93 34 42 2
1993-94 22 47 2
1994-95 9 55 2
1995-96 5 55 2
1996-97 2 54 2
1997-98 1 50 2
1998-99 1 49 1
1999-00 - 48 1
2000-01 - 47 1
2001-02 - 48 1
2002-03 - 47 1
2003-04 - 45 1
2004-05 - 43 1
2005-06 - 39 -
2006-07 - 34 -
2007-08 - 28 -
2008-09 - 23 -
2009-10 - 20 -
2010-11 - 18 -
2011-12 - 17 -
2012-13 - 15 -
TRAIN KILOMETRES OPERATED -METRE GAUGE
(IN MILLIONS)
Passenger & Proporlportion of lmixed E.M.U.
Total As the trains are run
In terms of single unit trains
5 6 7
82 2.46 4.17
81 2.51 4.32
80 2.54 4.47
69 2.52 4.19
62 2.19 3.95
78 2.52 4.51
81 2.6 4.69
82 2.63 4.78
78 2.62 4.78
77 2.58 4.69
79 2.58 4.86
75 2.63 5.12
78 2.65 5.15
81 2.7 5.4
82 2.63 5.26
82 2.64 5.28
82 2.68 5.37
82 2.72 5.45
81 2.71 5.42
84 2.69 5.39
81 2.86 5.73
82 2.93 5.91
78 3.14 6.44
71 3.15 5.96
66 3.27 6.75
62 3.32 6.88
58 3.33 6.85
53 3.35 6.87
51 3.37 6.93
49 3.41 7.03
48 3.36 6.95
49 3.41 9.41
48 2.75 7.67
46 1.85 5.23
44 0.40 1.15
39 - -
34 - -
28 - -
23 - -
20 - -
18 - -
17 - -
15 - -
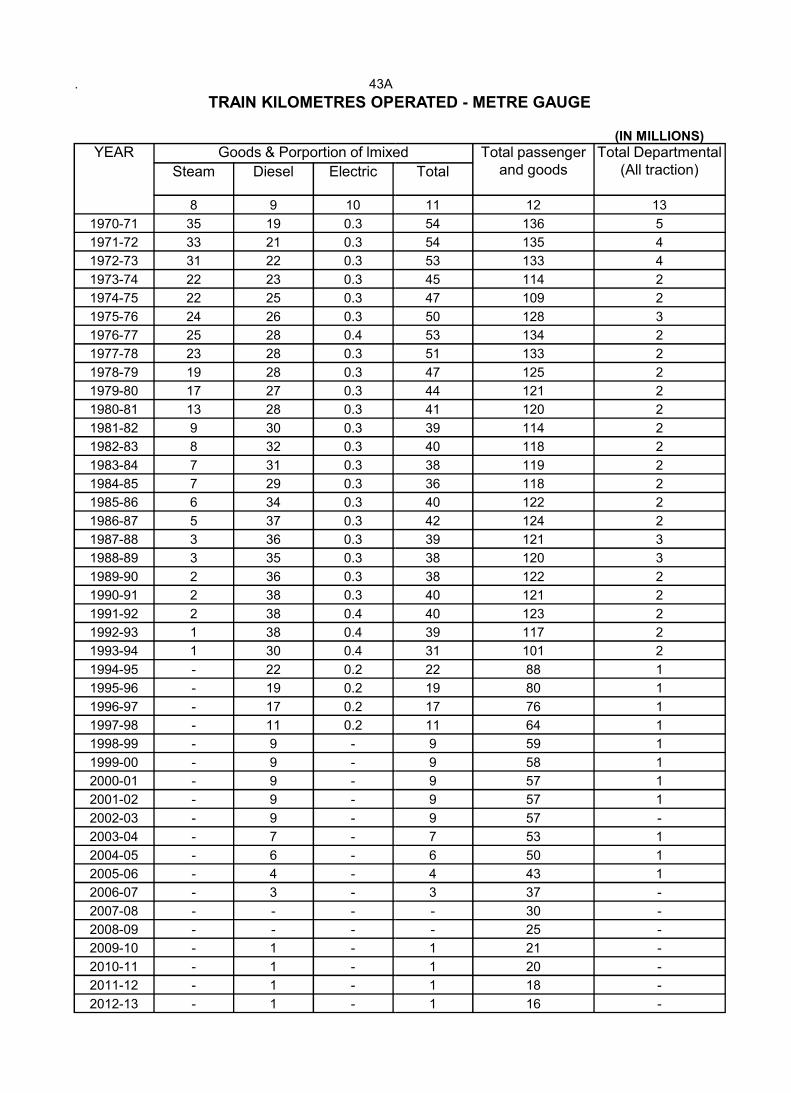
. 43A
TRAIN KILOMETRES OPERATED
YEAR Goods & Porportion of lmixed
Steam Diesel Electric
8 9 10
1970-71 35 19 0.3
1971-72 33 21 0.3
1972-73 31 22 0.3
1973-74 22 23 0.3
1974-75 22 25 0.3
1975-76 24 26 0.3
1976-77 25 28 0.4
1977-78 23 28 0.3
1978-79 19 28 0.3
1979-80 17 27 0.3
1980-81 13 28 0.3
1981-82 9 30 0.3
1982-83 8 32 0.3
1983-84 7 31 0.3
1984-85 7 29 0.3
1985-86 6 34 0.3
1986-87 5 37 0.3
1987-88 3 36 0.31987-88 3 36 0.3
1988-89 3 35 0.3
1989-90 2 36 0.3
1990-91 2 38 0.3
1991-92 2 38 0.4
1992-93 1 38 0.4
1993-94 1 30 0.4
1994-95 - 22 0.2
1995-96 - 19 0.2
1996-97 - 17 0.2
1997-98 - 11 0.2
1998-99 - 9 -
1999-00 - 9 -
2000-01 - 9 -
2001-02 - 9 -
2002-03 - 9 -
2003-04 - 7 -
2004-05 - 6 -
2005-06 - 4 -
2006-07 - 3 -
2007-08 - - -
2008-09 - - -
2009-10 - 1 -
2010-11 - 1 -
2011-12 - 1 -
2012-13 - 1 -
TRAIN KILOMETRES OPERATED - METRE GAUGE
(IN MILLIONS)
lmixed Total passenger and goods
Total Departmental (All traction)Total
11 12 13
54 136 5
54 135 4
53 133 4
45 114 2
47 109 2
50 128 3
53 134 2
51 133 2
47 125 2
44 121 2
41 120 2
39 114 2
40 118 2
38 119 2
36 118 2
40 122 2
42 124 2
39 121 339 121 3
38 120 3
38 122 2
40 121 2
40 123 2
39 117 2
31 101 2
22 88 1
19 80 1
17 76 1
11 64 1
9 59 1
9 58 1
9 57 1
9 57 1
9 57 -
7 53 1
6 50 1
4 43 1
3 37 -
- 30 -
- 25 -
1 21 -
1 20 -
1 18 -
1 16 -
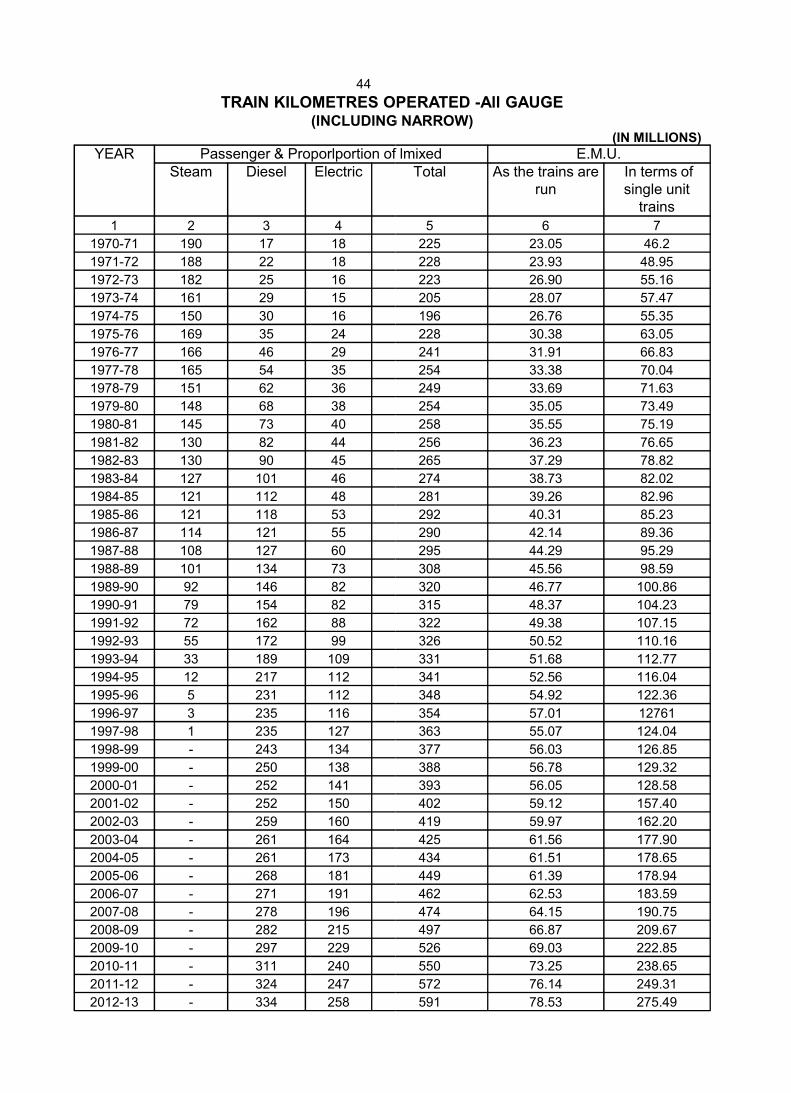
44
TRAIN KILOMETRES OPERATED (INCLUDING NARROW)
YEAR Passenger & Proporlportion of Steam Diesel Electric
1 2 3 4
1970-71 190 17 18
1971-72 188 22 18
1972-73 182 25 16
1973-74 161 29 15
1974-75 150 30 16
1975-76 169 35 24
1976-77 166 46 29
1977-78 165 54 35
1978-79 151 62 36
1979-80 148 68 38
1980-81 145 73 40
1981-82 130 82 44
1982-83 130 90 45
1983-84 127 101 46
1984-85 121 112 48
1985-86 121 118 53
1986-87 114 121 55
1987-88 108 127 601987-88 108 127 60
1988-89 101 134 73
1989-90 92 146 82
1990-91 79 154 82
1991-92 72 162 88
1992-93 55 172 99
1993-94 33 189 109
1994-95 12 217 112
1995-96 5 231 112
1996-97 3 235 116
1997-98 1 235 127
1998-99 - 243 134
1999-00 - 250 138
2000-01 - 252 141
2001-02 - 252 150
2002-03 - 259 160
2003-04 - 261 164
2004-05 - 261 173
2005-06 - 268 181
2006-07 - 271 191
2007-08 - 278 196
2008-09 - 282 215
2009-10 - 297 229
2010-11 - 311 240
2011-12 - 324 247
2012-13 - 334 258
TRAIN KILOMETRES OPERATED -All GAUGE(INCLUDING NARROW)
(IN MILLIONS)
of lmixed E.M.U.Total As the trains are
runIn terms of single unit
trains
5 6 7
225 23.05 46.2
228 23.93 48.95
223 26.90 55.16
205 28.07 57.47
196 26.76 55.35
228 30.38 63.05
241 31.91 66.83
254 33.38 70.04
249 33.69 71.63
254 35.05 73.49
258 35.55 75.19
256 36.23 76.65
265 37.29 78.82
274 38.73 82.02
281 39.26 82.96
292 40.31 85.23
290 42.14 89.36
295 44.29 95.29295 44.29 95.29
308 45.56 98.59
320 46.77 100.86
315 48.37 104.23
322 49.38 107.15
326 50.52 110.16
331 51.68 112.77
341 52.56 116.04
348 54.92 122.36
354 57.01 12761
363 55.07 124.04
377 56.03 126.85
388 56.78 129.32
393 56.05 128.58
402 59.12 157.40
419 59.97 162.20
425 61.56 177.90
434 61.51 178.65
449 61.39 178.94
462 62.53 183.59
474 64.15 190.75
497 66.87 209.67
526 69.03 222.85
550 73.25 238.65
572 76.14 249.31
591 78.53 275.49
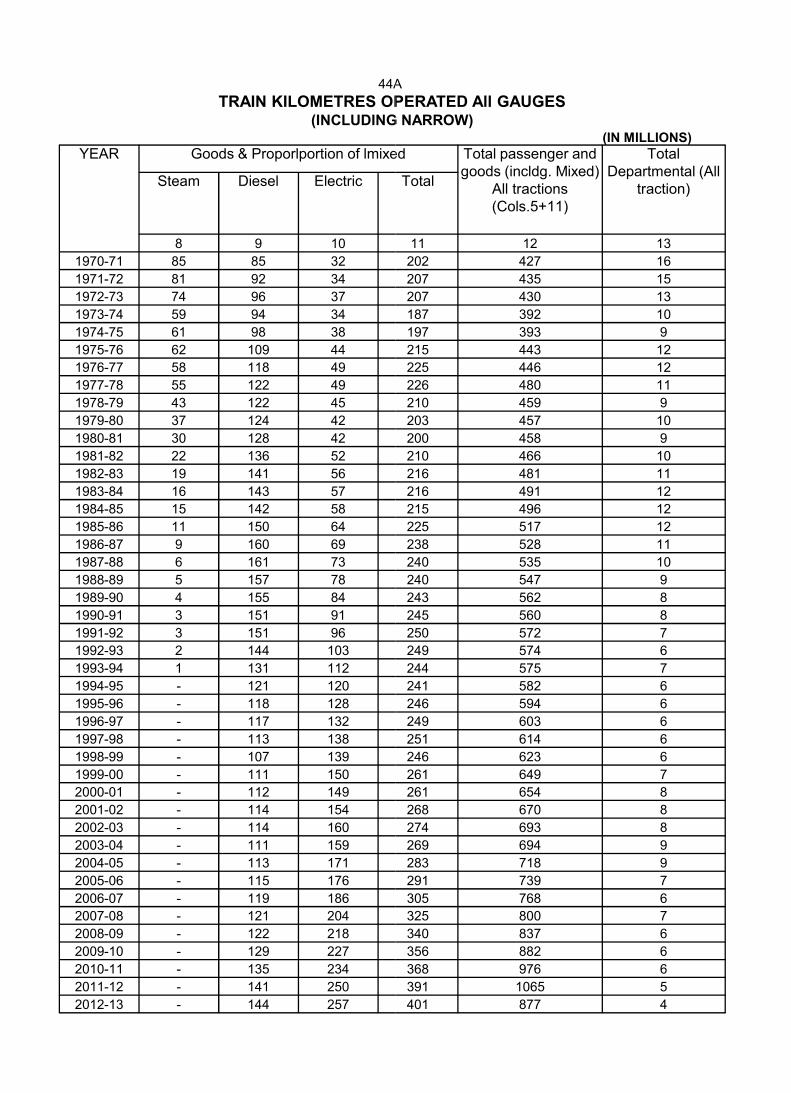
44A
TRAIN KILOMETRES OPERATED All GAUGES(INCLUDING NARROW)
YEAR Goods & Proporlportion of lmixed
Steam Diesel Electric
8 9 10
1970-71 85 85 32
1971-72 81 92 34
1972-73 74 96 37
1973-74 59 94 34
1974-75 61 98 38
1975-76 62 109 44
1976-77 58 118 49
1977-78 55 122 49
1978-79 43 122 45
1979-80 37 124 42
1980-81 30 128 42
1981-82 22 136 52
1982-83 19 141 56
1983-84 16 143 57
1984-85 15 142 58
1985-86 11 150 64
1986-87 9 160 691986-87 9 160 69
1987-88 6 161 73
1988-89 5 157 78
1989-90 4 155 84
1990-91 3 151 91
1991-92 3 151 96
1992-93 2 144 103
1993-94 1 131 112
1994-95 - 121 120
1995-96 - 118 128
1996-97 - 117 132
1997-98 - 113 138
1998-99 - 107 139
1999-00 - 111 150
2000-01 - 112 149
2001-02 - 114 154
2002-03 - 114 160
2003-04 - 111 159
2004-05 - 113 171
2005-06 - 115 176
2006-07 - 119 186
2007-08 - 121 204
2008-09 - 122 218
2009-10 - 129 227
2010-11 - 135 234
2011-12 - 141 250
2012-13 - 144 257
44A
TRAIN KILOMETRES OPERATED All GAUGES(INCLUDING NARROW)
(IN MILLIONS)
lmixed Total passenger and goods (incldg. Mixed)
All tractions (Cols.5+11)
Total Departmental (All
traction)Total
11 12 13
202 427 16
207 435 15
207 430 13
187 392 10
197 393 9
215 443 12
225 446 12
226 480 11
210 459 9
203 457 10
200 458 9
210 466 10
216 481 11
216 491 12
215 496 12
225 517 12
238 528 11238 528 11
240 535 10
240 547 9
243 562 8
245 560 8
250 572 7
249 574 6
244 575 7
241 582 6
246 594 6
249 603 6
251 614 6
246 623 6
261 649 7
261 654 8
268 670 8
274 693 8
269 694 9
283 718 9
291 739 7
305 768 6
325 800 7
340 837 6
356 882 6
368 976 6
391 1065 5
401 877 4
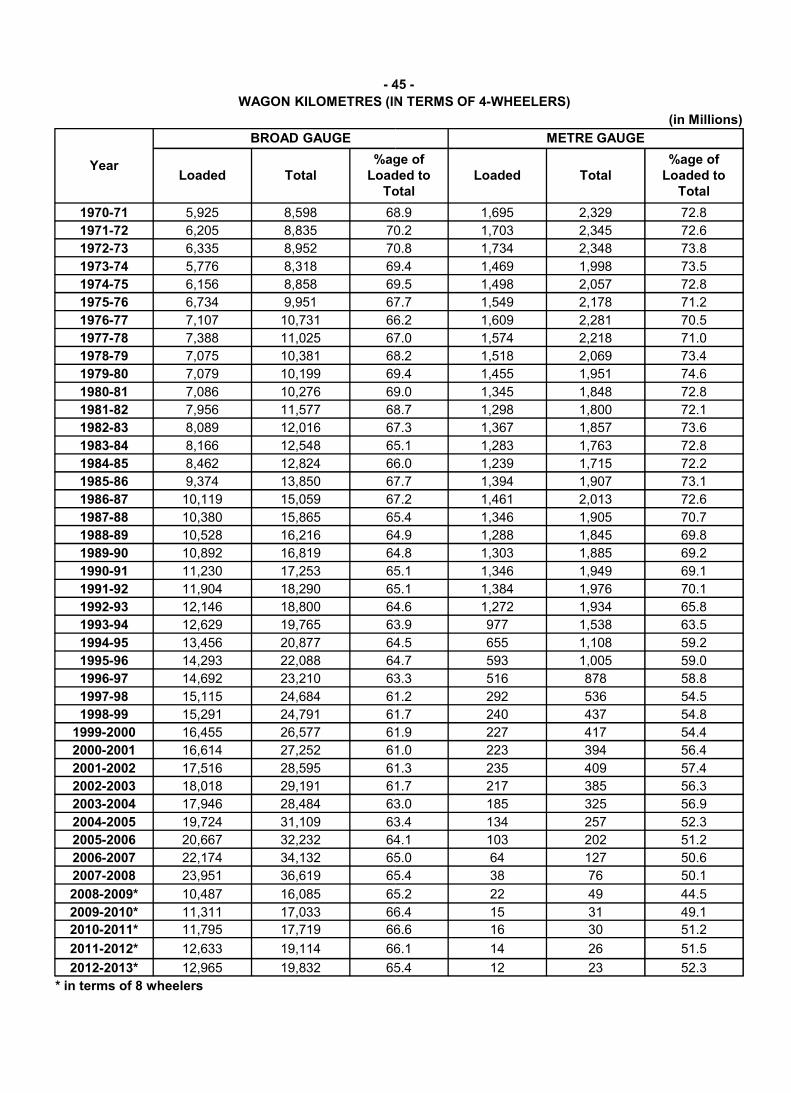
- 45
WAGON KILOMETRES (IN TERMS OF 4
Year
BROAD GAUGE
Loaded Total%age of
Loaded to Total
1970-71 5,925 8,598 68.9
1971-72 6,205 8,835 70.2
1972-73 6,335 8,952 70.8
1973-74 5,776 8,318 69.4
1974-75 6,156 8,858 69.5
1975-76 6,734 9,951 67.7
1976-77 7,107 10,731 66.2
1977-78 7,388 11,025 67.0
1978-79 7,075 10,381 68.2
1979-80 7,079 10,199 69.4
1980-81 7,086 10,276 69.0
1981-82 7,956 11,577 68.7
1982-83 8,089 12,016 67.3
1983-84 8,166 12,548 65.1
1984-85 8,462 12,824 66.0
1985-86 9,374 13,850 67.7
1986-87 10,119 15,059 67.2
1987-88 10,380 15,865 65.4
1988-89 10,528 16,216 64.9
1989-90 10,892 16,819 64.81989-90 10,892 16,819 64.8
1990-91 11,230 17,253 65.1
1991-92 11,904 18,290 65.1
1992-93 12,146 18,800 64.6
1993-94 12,629 19,765 63.9
1994-95 13,456 20,877 64.5
1995-96 14,293 22,088 64.7
1996-97 14,692 23,210 63.3
1997-98 15,115 24,684 61.2
1998-99 15,291 24,791 61.7
1999-2000 16,455 26,577 61.9
2000-2001 16,614 27,252 61.0
2001-2002 17,516 28,595 61.3
2002-2003 18,018 29,191 61.7
2003-2004 17,946 28,484 63.0
2004-2005 19,724 31,109 63.4
2005-2006 20,667 32,232 64.1
2006-2007 22,174 34,132 65.0
2007-2008 23,951 36,619 65.4
2008-2009* 10,487 16,085 65.2
2009-2010* 11,311 17,033 66.4
2010-2011* 11,795 17,719 66.6
2011-2012* 12,633 19,114 66.1
2012-2013* 12,965 19,832 65.4
* in terms of 8 wheelers
45 -
WAGON KILOMETRES (IN TERMS OF 4-WHEELERS)
(in Millions)
METRE GAUGE
%age of Loaded to
TotalLoaded Total
%age of Loaded to
Total
68.9 1,695 2,329 72.8
70.2 1,703 2,345 72.6
70.8 1,734 2,348 73.8
69.4 1,469 1,998 73.5
69.5 1,498 2,057 72.8
67.7 1,549 2,178 71.2
66.2 1,609 2,281 70.5
67.0 1,574 2,218 71.0
68.2 1,518 2,069 73.4
69.4 1,455 1,951 74.6
69.0 1,345 1,848 72.8
68.7 1,298 1,800 72.1
67.3 1,367 1,857 73.6
65.1 1,283 1,763 72.8
66.0 1,239 1,715 72.2
67.7 1,394 1,907 73.1
67.2 1,461 2,013 72.6
65.4 1,346 1,905 70.7
64.9 1,288 1,845 69.8
64.8 1,303 1,885 69.264.8 1,303 1,885 69.2
65.1 1,346 1,949 69.1
65.1 1,384 1,976 70.1
64.6 1,272 1,934 65.8
63.9 977 1,538 63.5
64.5 655 1,108 59.2
64.7 593 1,005 59.0
63.3 516 878 58.8
61.2 292 536 54.5
61.7 240 437 54.8
61.9 227 417 54.4
61.0 223 394 56.4
61.3 235 409 57.4
61.7 217 385 56.3
63.0 185 325 56.9
63.4 134 257 52.3
64.1 103 202 51.2
65.0 64 127 50.6
65.4 38 76 50.1
65.2 22 49 44.5
66.4 15 31 49.1
66.6 16 30 51.2
66.1 14 26 51.5
65.4 12 23 52.3
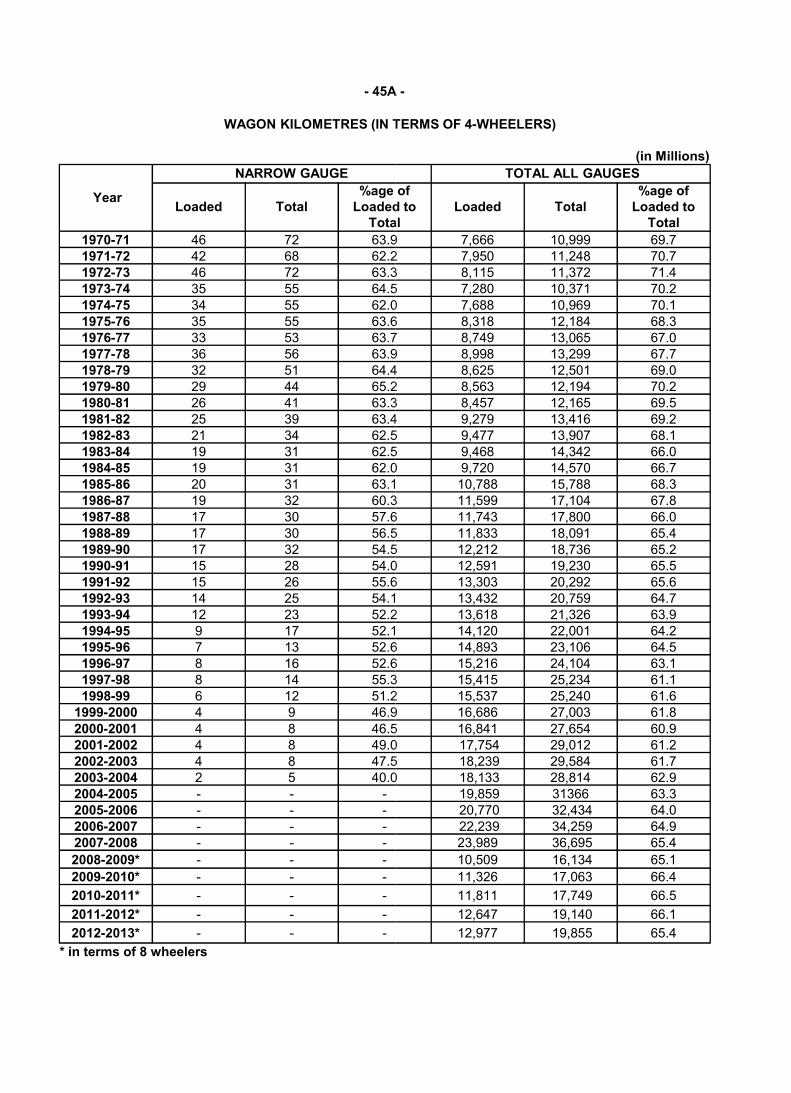
- 45A
WAGON KILOMETRES (IN TERMS OF 4
Year
NARROW GAUGE
Loaded Total%age of
Loaded to Total
1970-71 46 72 63.91971-72 42 68 62.21972-73 46 72 63.31973-74 35 55 64.51974-75 34 55 62.01975-76 35 55 63.61976-77 33 53 63.71977-78 36 56 63.91978-79 32 51 64.41979-80 29 44 65.21980-81 26 41 63.31981-82 25 39 63.41982-83 21 34 62.51983-84 19 31 62.51984-85 19 31 62.01985-86 20 31 63.11986-87 19 32 60.31987-88 17 30 57.61988-89 17 30 56.51989-90 17 32 54.51989-90 17 32 54.51990-91 15 28 54.01991-92 15 26 55.61992-93 14 25 54.11993-94 12 23 52.21994-95 9 17 52.11995-96 7 13 52.61996-97 8 16 52.61997-98 8 14 55.31998-99 6 12 51.2
1999-2000 4 9 46.92000-2001 4 8 46.52001-2002 4 8 49.02002-2003 4 8 47.52003-2004 2 5 40.02004-2005 - - -2005-2006 - - -2006-2007 - - -2007-2008 - - -
2008-2009* - - -
2009-2010* - - -
2010-2011* - - -
2011-2012* - - -
2012-2013* - - -
* in terms of 8 wheelers
45A -
WAGON KILOMETRES (IN TERMS OF 4-WHEELERS)
(in Millions)
TOTAL ALL GAUGES
%age of Loaded to
Total Loaded Total
%age of Loaded to
Total
63.9 7,666 10,999 69.762.2 7,950 11,248 70.763.3 8,115 11,372 71.464.5 7,280 10,371 70.262.0 7,688 10,969 70.163.6 8,318 12,184 68.363.7 8,749 13,065 67.063.9 8,998 13,299 67.764.4 8,625 12,501 69.065.2 8,563 12,194 70.263.3 8,457 12,165 69.563.4 9,279 13,416 69.262.5 9,477 13,907 68.162.5 9,468 14,342 66.062.0 9,720 14,570 66.763.1 10,788 15,788 68.360.3 11,599 17,104 67.857.6 11,743 17,800 66.056.5 11,833 18,091 65.454.5 12,212 18,736 65.254.5 12,212 18,736 65.254.0 12,591 19,230 65.555.6 13,303 20,292 65.654.1 13,432 20,759 64.752.2 13,618 21,326 63.952.1 14,120 22,001 64.252.6 14,893 23,106 64.552.6 15,216 24,104 63.155.3 15,415 25,234 61.151.2 15,537 25,240 61.646.9 16,686 27,003 61.846.5 16,841 27,654 60.949.0 17,754 29,012 61.247.5 18,239 29,584 61.740.0 18,133 28,814 62.9
19,859 31366 63.320,770 32,434 64.022,239 34,259 64.923,989 36,695 65.4
10,509 16,134 65.1
11,326 17,063 66.4
11,811 17,749 66.5
12,647 19,140 66.1
12,977 19,855 65.4
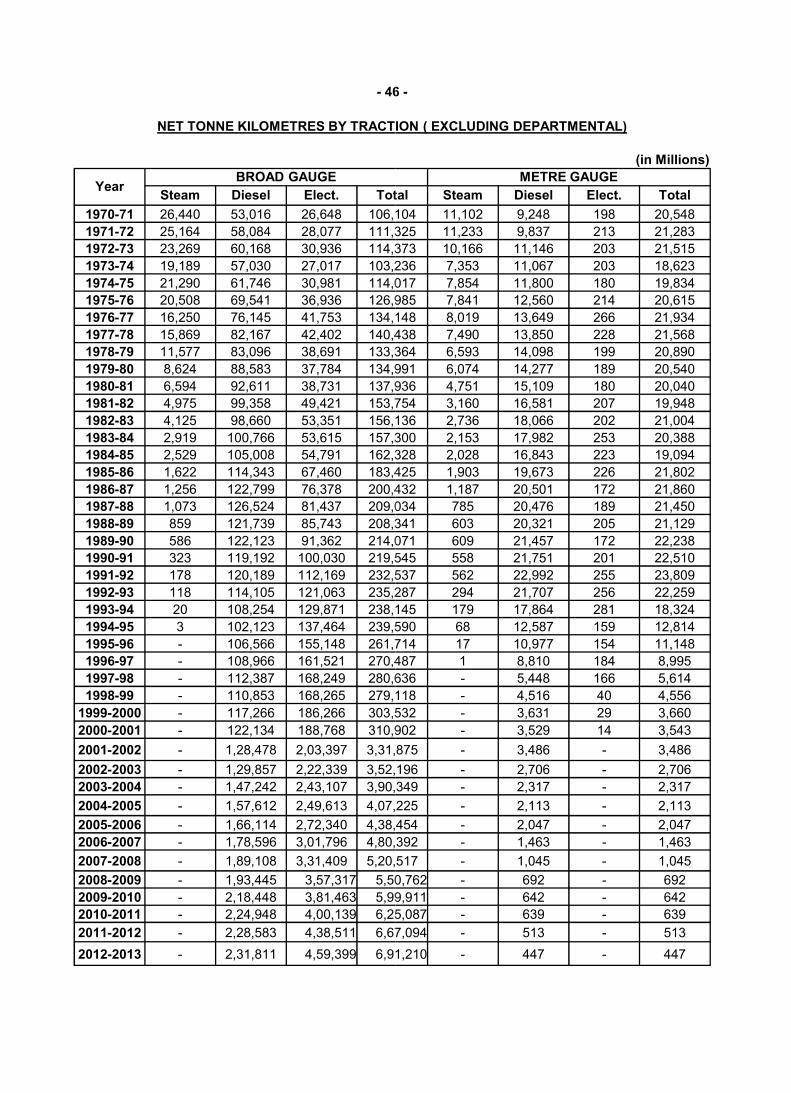
- 46
NET TONNE KILOMETRES BY TRACTION ( EXCLUDING DEPARTMENTAL)
YearBROAD GAUGE
Steam Diesel Elect. Total
1970-71 26,440 53,016 26,648 106,104
1971-72 25,164 58,084 28,077 111,325
1972-73 23,269 60,168 30,936 114,373
1973-74 19,189 57,030 27,017 103,236
1974-75 21,290 61,746 30,981 114,017
1975-76 20,508 69,541 36,936 126,985
1976-77 16,250 76,145 41,753 134,148
1977-78 15,869 82,167 42,402 140,438
1978-79 11,577 83,096 38,691 133,364
1979-80 8,624 88,583 37,784 134,991
1980-81 6,594 92,611 38,731 137,936
1981-82 4,975 99,358 49,421 153,754
1982-83 4,125 98,660 53,351 156,136
1983-84 2,919 100,766 53,615 157,300
1984-85 2,529 105,008 54,791 162,328
1985-86 1,622 114,343 67,460 183,425
1986-87 1,256 122,799 76,378 200,432
1987-88 1,073 126,524 81,437 209,034
1988-89 859 121,739 85,743 208,341
1989-90 586 122,123 91,362 214,0711989-90 586 122,123 91,362 214,071
1990-91 323 119,192 100,030 219,545
1991-92 178 120,189 112,169 232,537
1992-93 118 114,105 121,063 235,287
1993-94 20 108,254 129,871 238,145
1994-95 3 102,123 137,464 239,590
1995-96 - 106,566 155,148 261,714
1996-97 - 108,966 161,521 270,487
1997-98 - 112,387 168,249 280,636
1998-99 - 110,853 168,265 279,118
1999-2000 - 117,266 186,266 303,532
2000-2001 - 122,134 188,768 310,902
2001-2002 - 1,28,478 2,03,397 3,31,875
2002-2003 - 1,29,857 2,22,339 3,52,196
2003-2004 - 1,47,242 2,43,107 3,90,349
2004-2005 - 1,57,612 2,49,613 4,07,225
2005-2006 - 1,66,114 2,72,340 4,38,454
2006-2007 - 1,78,596 3,01,796 4,80,392
2007-2008 - 1,89,108 3,31,409 5,20,517
2008-2009 - 1,93,445 3,57,317 5,50,762
2009-2010 - 2,18,448 3,81,463 5,99,911
2010-2011 - 2,24,948 4,00,139 6,25,087
2011-2012 - 2,28,583 4,38,511 6,67,094
2012-2013 - 2,31,811 4,59,399 6,91,210
46 -
NET TONNE KILOMETRES BY TRACTION ( EXCLUDING DEPARTMENTAL)
(in Millions)
METRE GAUGE
Total Steam Diesel Elect. Total
106,104 11,102 9,248 198 20,548
111,325 11,233 9,837 213 21,283
114,373 10,166 11,146 203 21,515
103,236 7,353 11,067 203 18,623
114,017 7,854 11,800 180 19,834
126,985 7,841 12,560 214 20,615
134,148 8,019 13,649 266 21,934
140,438 7,490 13,850 228 21,568
133,364 6,593 14,098 199 20,890
134,991 6,074 14,277 189 20,540
137,936 4,751 15,109 180 20,040
153,754 3,160 16,581 207 19,948
156,136 2,736 18,066 202 21,004
157,300 2,153 17,982 253 20,388
162,328 2,028 16,843 223 19,094
183,425 1,903 19,673 226 21,802
200,432 1,187 20,501 172 21,860
209,034 785 20,476 189 21,450
208,341 603 20,321 205 21,129
214,071 609 21,457 172 22,238214,071 609 21,457 172 22,238
219,545 558 21,751 201 22,510
232,537 562 22,992 255 23,809
235,287 294 21,707 256 22,259
238,145 179 17,864 281 18,324
239,590 68 12,587 159 12,814
261,714 17 10,977 154 11,148
270,487 1 8,810 184 8,995
280,636 - 5,448 166 5,614
279,118 - 4,516 40 4,556
303,532 - 3,631 29 3,660
310,902 - 3,529 14 3,543
3,31,875 - 3,486 - 3,486
3,52,196 - 2,706 - 2,706
3,90,349 - 2,317 - 2,317
4,07,225 - 2,113 - 2,113
4,38,454 - 2,047 - 2,047
4,80,392 - 1,463 - 1,463
5,20,517 - 1,045 - 1,045
5,50,762 - 692 - 692
5,99,911 - 642 - 642
6,25,087 - 639 - 639
6,67,094 - 513 - 513
6,91,210 - 447 - 447
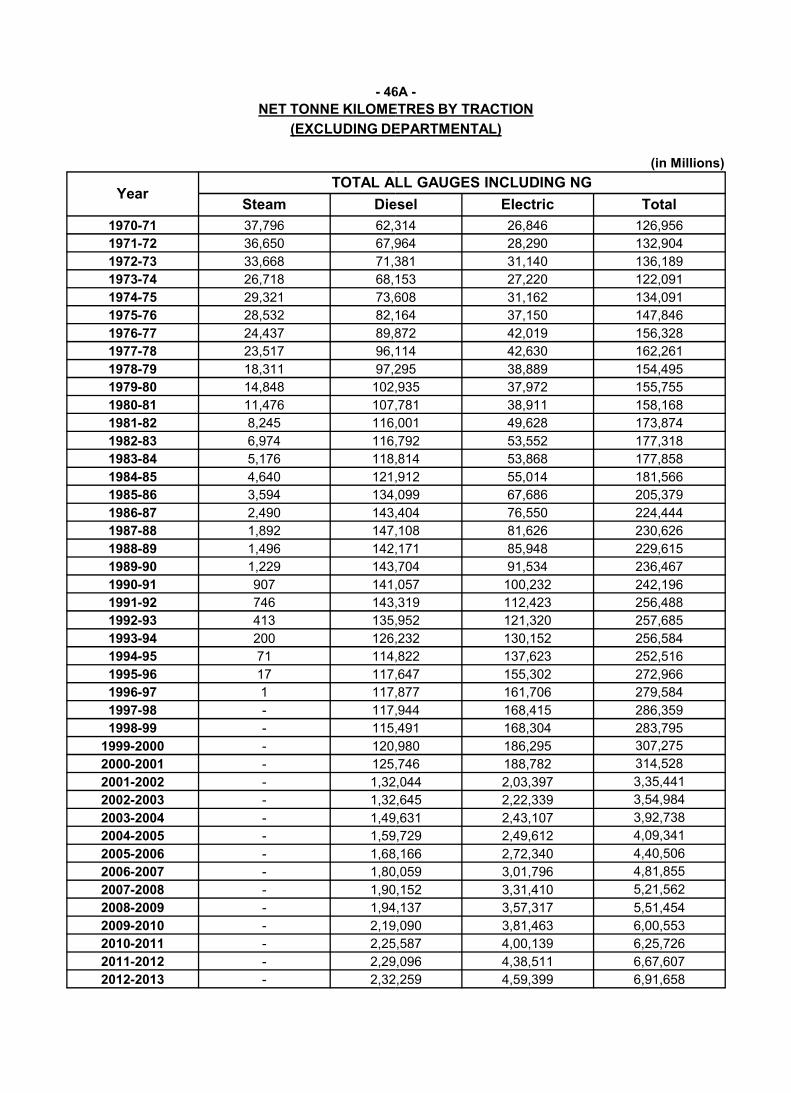
- 46A
NET TONNE KILOMETRES BY TRACTION
(EXCLUDING DEPARTMENTAL)
YearTOTAL ALL GAUGES INCLUDING NG
Steam Diesel
1970-71 37,796 62,314
1971-72 36,650 67,964
1972-73 33,668 71,381
1973-74 26,718 68,153
1974-75 29,321 73,608
1975-76 28,532 82,164
1976-77 24,437 89,872
1977-78 23,517 96,114
1978-79 18,311 97,295
1979-80 14,848 102,935
1980-81 11,476 107,781
1981-82 8,245 116,001
1982-83 6,974 116,792
1983-84 5,176 118,814
1984-85 4,640 121,912
1985-86 3,594 134,099
1986-87 2,490 143,404
1987-88 1,892 147,108
1988-89 1,496 142,1711988-89 1,496 142,171
1989-90 1,229 143,704
1990-91 907 141,057
1991-92 746 143,319
1992-93 413 135,952
1993-94 200 126,232
1994-95 71 114,822
1995-96 17 117,647
1996-97 1 117,877
1997-98 - 117,944
1998-99 - 115,491
1999-2000 - 120,980
2000-2001 - 125,746
2001-2002 - 1,32,044
2002-2003 - 1,32,645
2003-2004 - 1,49,631
2004-2005 - 1,59,729
2005-2006 - 1,68,166
2006-2007 - 1,80,059
2007-2008 - 1,90,152
2008-2009 - 1,94,137
2009-2010 - 2,19,090
2010-2011 - 2,25,587
2011-2012 - 2,29,096
2012-2013 - 2,32,259
46A -
NET TONNE KILOMETRES BY TRACTION
(EXCLUDING DEPARTMENTAL)
(in Millions)
TOTAL ALL GAUGES INCLUDING NG
Diesel Electric Total
62,314 26,846 126,956
67,964 28,290 132,904
71,381 31,140 136,189
68,153 27,220 122,091
73,608 31,162 134,091
82,164 37,150 147,846
89,872 42,019 156,328
96,114 42,630 162,261
97,295 38,889 154,495
102,935 37,972 155,755
107,781 38,911 158,168
116,001 49,628 173,874
116,792 53,552 177,318
118,814 53,868 177,858
121,912 55,014 181,566
134,099 67,686 205,379
143,404 76,550 224,444
147,108 81,626 230,626
142,171 85,948 229,615142,171 85,948 229,615
143,704 91,534 236,467
141,057 100,232 242,196
143,319 112,423 256,488
135,952 121,320 257,685
126,232 130,152 256,584
114,822 137,623 252,516
117,647 155,302 272,966
117,877 161,706 279,584
117,944 168,415 286,359
115,491 168,304 283,795
120,980 186,295 307,275
125,746 188,782 314,528
1,32,044 2,03,397 3,35,441
1,32,645 2,22,339 3,54,984
1,49,631 2,43,107 3,92,738
1,59,729 2,49,612 4,09,341
1,68,166 2,72,340 4,40,506
1,80,059 3,01,796 4,81,855
1,90,152 3,31,410 5,21,562
1,94,137 3,57,317 5,51,454
2,19,090 3,81,463 6,00,553
2,25,587 4,00,139 6,25,726
2,29,096 4,38,511 6,67,607
2,32,259 4,59,399 6,91,658
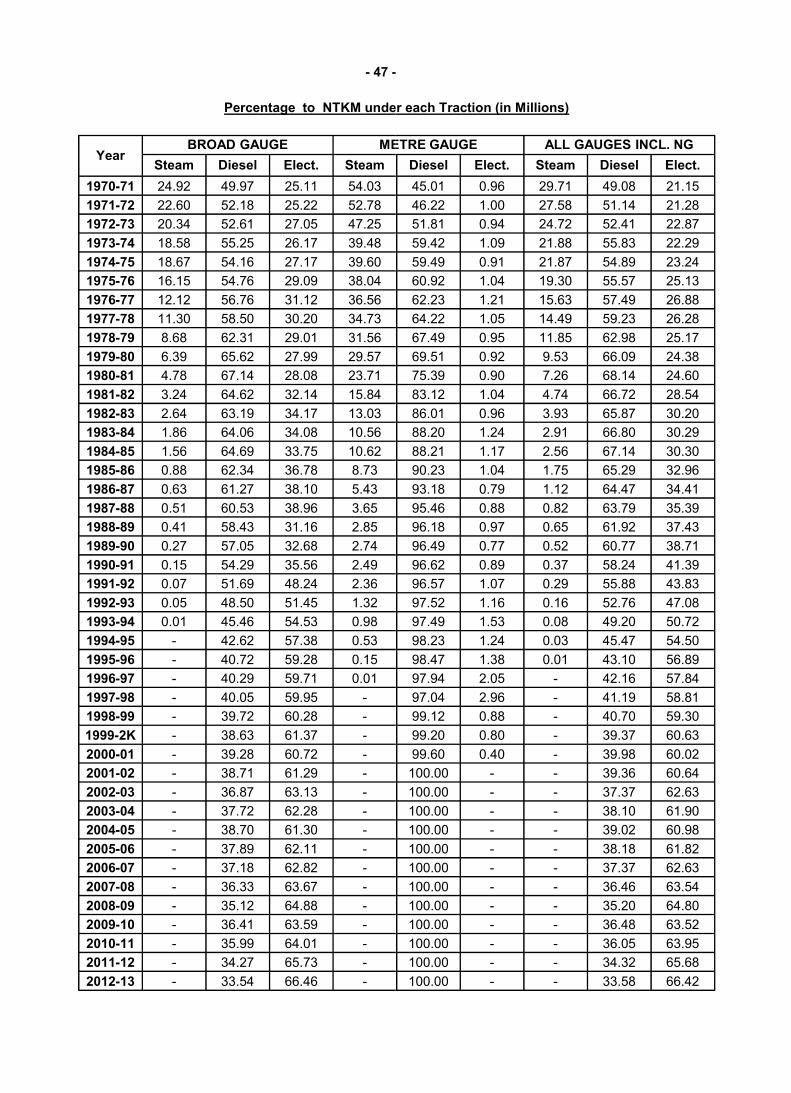
- 47 -
Percentage to NTKM under each Traction (in Millions)
YearBROAD GAUGE METRE GAUGE
Steam Diesel Elect. Steam
1970-71 24.92 49.97 25.11 54.03
1971-72 22.60 52.18 25.22 52.78
1972-73 20.34 52.61 27.05 47.25
1973-74 18.58 55.25 26.17 39.48
1974-75 18.67 54.16 27.17 39.60
1975-76 16.15 54.76 29.09 38.04
1976-77 12.12 56.76 31.12 36.56
1977-78 11.30 58.50 30.20 34.73
1978-79 8.68 62.31 29.01 31.56
1979-80 6.39 65.62 27.99 29.57
1980-81 4.78 67.14 28.08 23.71
1981-82 3.24 64.62 32.14 15.84
1982-83 2.64 63.19 34.17 13.03
1983-84 1.86 64.06 34.08 10.56
1984-85 1.56 64.69 33.75 10.62
1985-86 0.88 62.34 36.78 8.73
1986-87 0.63 61.27 38.10 5.43
1987-88 0.51 60.53 38.96 3.65
1988-89 0.41 58.43 31.16 2.85
1989-90 0.27 57.05 32.68 2.741989-90 0.27 57.05 32.68 2.74
1990-91 0.15 54.29 35.56 2.49
1991-92 0.07 51.69 48.24 2.36
1992-93 0.05 48.50 51.45 1.32
1993-94 0.01 45.46 54.53 0.98
1994-95 - 42.62 57.38 0.53
1995-96 - 40.72 59.28 0.15
1996-97 - 40.29 59.71 0.01
1997-98 - 40.05 59.95 -
1998-99 - 39.72 60.28 -
1999-2K - 38.63 61.37 -
2000-01 - 39.28 60.72 -
2001-02 - 38.71 61.29 -
2002-03 - 36.87 63.13 -
2003-04 - 37.72 62.28 -
2004-05 - 38.70 61.30 -
2005-06 - 37.89 62.11 -
2006-07 - 37.18 62.82 -
2007-08 - 36.33 63.67 -
2008-09 - 35.12 64.88 -
2009-10 - 36.41 63.59 -
2010-11 - 35.99 64.01 -
2011-12 - 34.27 65.73 -
2012-13 - 33.54 66.46 -
-
Percentage to NTKM under each Traction (in Millions)
METRE GAUGE ALL GAUGES INCL. NG
Diesel Elect. Steam Diesel Elect.
45.01 0.96 29.71 49.08 21.15
46.22 1.00 27.58 51.14 21.28
51.81 0.94 24.72 52.41 22.87
59.42 1.09 21.88 55.83 22.29
59.49 0.91 21.87 54.89 23.24
60.92 1.04 19.30 55.57 25.13
62.23 1.21 15.63 57.49 26.88
64.22 1.05 14.49 59.23 26.28
67.49 0.95 11.85 62.98 25.17
69.51 0.92 9.53 66.09 24.38
75.39 0.90 7.26 68.14 24.60
83.12 1.04 4.74 66.72 28.54
86.01 0.96 3.93 65.87 30.20
88.20 1.24 2.91 66.80 30.29
88.21 1.17 2.56 67.14 30.30
90.23 1.04 1.75 65.29 32.96
93.18 0.79 1.12 64.47 34.41
95.46 0.88 0.82 63.79 35.39
96.18 0.97 0.65 61.92 37.43
96.49 0.77 0.52 60.77 38.7196.49 0.77 0.52 60.77 38.71
96.62 0.89 0.37 58.24 41.39
96.57 1.07 0.29 55.88 43.83
97.52 1.16 0.16 52.76 47.08
97.49 1.53 0.08 49.20 50.72
98.23 1.24 0.03 45.47 54.50
98.47 1.38 0.01 43.10 56.89
97.94 2.05 - 42.16 57.84
97.04 2.96 - 41.19 58.81
99.12 0.88 - 40.70 59.30
99.20 0.80 - 39.37 60.63
99.60 0.40 - 39.98 60.02
100.00 - - 39.36 60.64
100.00 - - 37.37 62.63
100.00 - - 38.10 61.90
100.00 - - 39.02 60.98
100.00 - - 38.18 61.82
100.00 - - 37.37 62.63
100.00 - - 36.46 63.54
100.00 - - 35.20 64.80
100.00 - - 36.48 63.52
100.00 - - 36.05 63.95
100.00 - - 34.32 65.68
100.00 - - 33.58 66.42
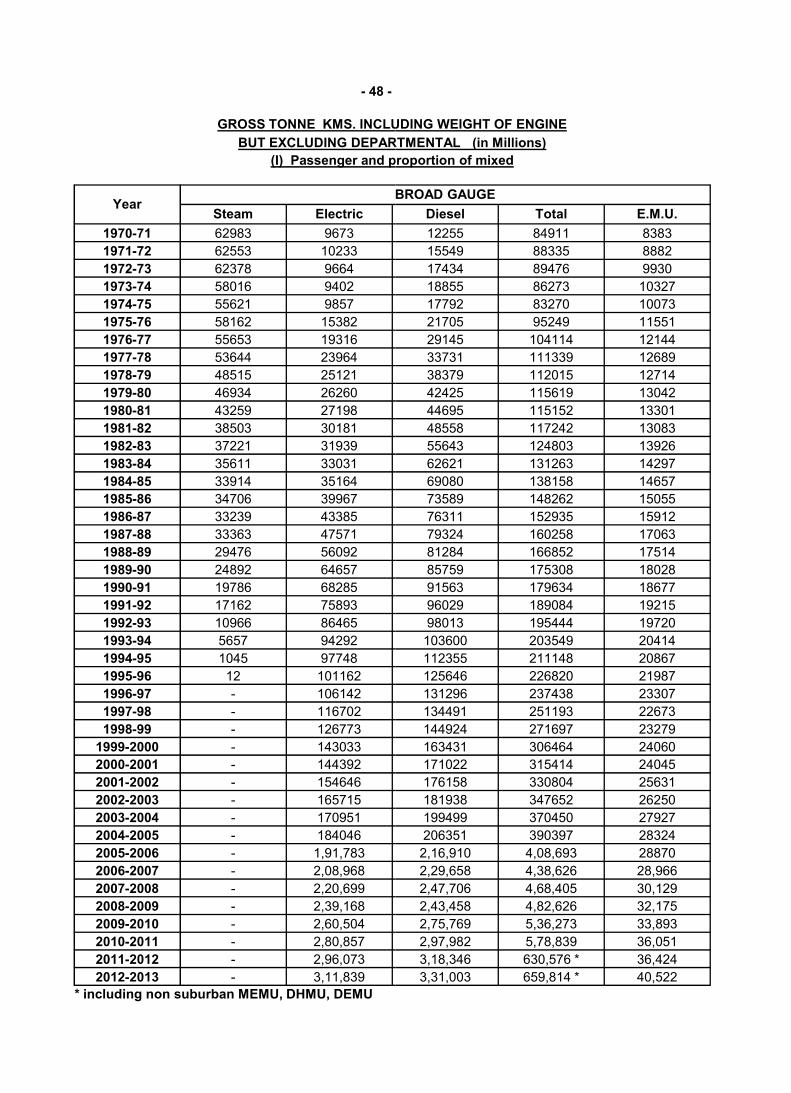
- 48 -
GROSS TONNE KMS. INCLUDING WEIGHT OF ENGINE
BUT EXCLUDING DEPARTMENTAL (in Millions)
(I) Passenger and proportion of mixed
YearBROAD GAUGE
Steam Electric
1970-71 62983 9673
1971-72 62553 10233
1972-73 62378 9664
1973-74 58016 9402
1974-75 55621 9857
1975-76 58162 15382
1976-77 55653 19316
1977-78 53644 23964
1978-79 48515 25121
1979-80 46934 26260
1980-81 43259 27198
1981-82 38503 30181
1982-83 37221 31939
1983-84 35611 33031
1984-85 33914 35164
1985-86 34706 39967
1986-87 33239 43385
1987-88 33363 47571
1988-89 29476 560921988-89 29476 56092
1989-90 24892 64657
1990-91 19786 68285
1991-92 17162 75893
1992-93 10966 86465
1993-94 5657 94292
1994-95 1045 97748
1995-96 12 101162
1996-97 - 106142
1997-98 - 116702
1998-99 - 126773
1999-2000 - 143033
2000-2001 - 144392
2001-2002 - 154646
2002-2003 - 165715
2003-2004 - 170951
2004-2005 - 184046
2005-2006 - 1,91,783
2006-2007 - 2,08,968
2007-2008 - 2,20,699
2008-2009 - 2,39,168
2009-2010 - 2,60,504
2010-2011 - 2,80,857
2011-2012 - 2,96,073
2012-2013 - 3,11,839
* including non suburban MEMU, DHMU, DEMU
GROSS TONNE KMS. INCLUDING WEIGHT OF ENGINE
BUT EXCLUDING DEPARTMENTAL (in Millions)
(I) Passenger and proportion of mixed
BROAD GAUGE
Diesel Total E.M.U.
12255 84911 8383
15549 88335 8882
17434 89476 9930
18855 86273 10327
17792 83270 10073
21705 95249 11551
29145 104114 12144
33731 111339 12689
38379 112015 12714
42425 115619 13042
44695 115152 13301
48558 117242 13083
55643 124803 13926
62621 131263 14297
69080 138158 14657
73589 148262 15055
76311 152935 15912
79324 160258 17063
81284 166852 1751481284 166852 17514
85759 175308 18028
91563 179634 18677
96029 189084 19215
98013 195444 19720
103600 203549 20414
112355 211148 20867
125646 226820 21987
131296 237438 23307
134491 251193 22673
144924 271697 23279
163431 306464 24060
171022 315414 24045
176158 330804 25631
181938 347652 26250
199499 370450 27927
206351 390397 28324
2,16,910 4,08,693 28870
2,29,658 4,38,626 28,966
2,47,706 4,68,405 30,129
2,43,458 4,82,626 32,175
2,75,769 5,36,273 33,893
2,97,982 5,78,839 36,051
3,18,346 630,576 * 36,424
3,31,003 659,814 * 40,522
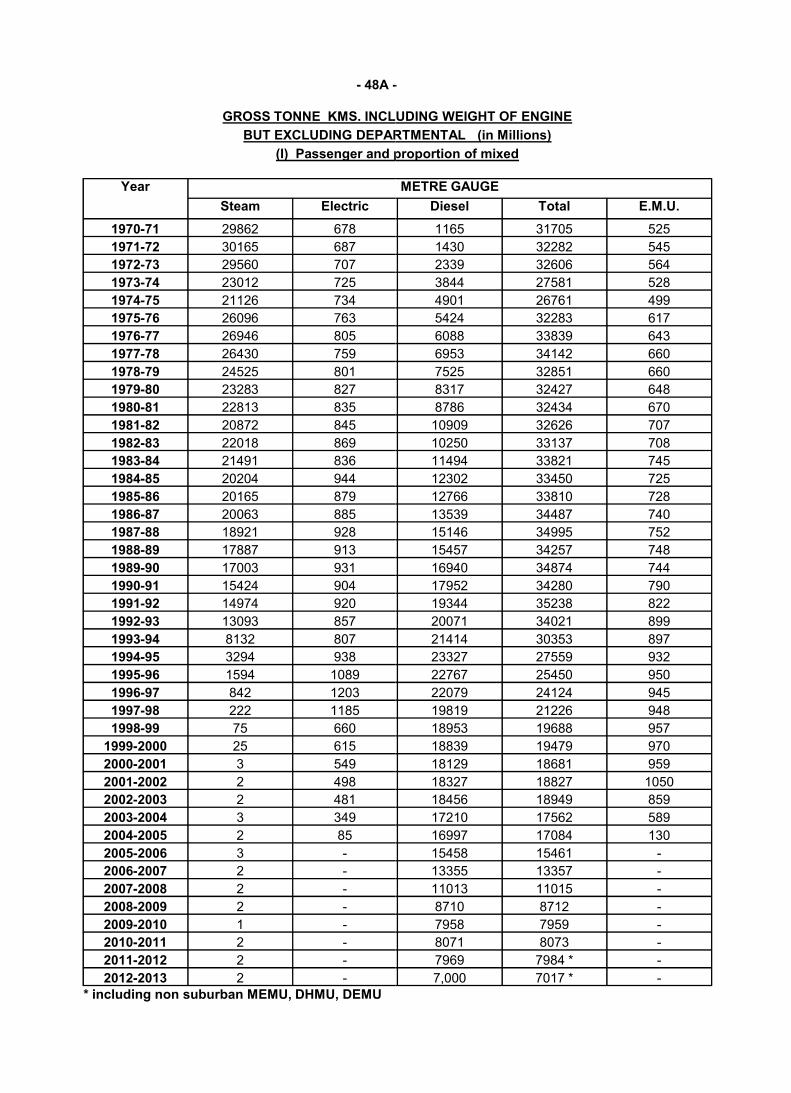
- 48A -
GROSS TONNE KMS. INCLUDING WEIGHT OF ENGINE
BUT EXCLUDING DEPARTMENTAL (in Millions)
(I) Passenger and proportion of mixed
Year
Steam Electric
1970-71 29862 678
1971-72 30165 687
1972-73 29560 707
1973-74 23012 725
1974-75 21126 734
1975-76 26096 763
1976-77 26946 805
1977-78 26430 759
1978-79 24525 801
1979-80 23283 827
1980-81 22813 835
1981-82 20872 845
1982-83 22018 869
1983-84 21491 836
1984-85 20204 944
1985-86 20165 879
1986-87 20063 885
1987-88 18921 928
1988-89 17887 9131988-89 17887 913
1989-90 17003 931
1990-91 15424 904
1991-92 14974 920
1992-93 13093 857
1993-94 8132 807
1994-95 3294 938
1995-96 1594 1089
1996-97 842 1203
1997-98 222 1185
1998-99 75 660
1999-2000 25 615
2000-2001 3 549
2001-2002 2 498
2002-2003 2 481
2003-2004 3 349
2004-2005 2 85
2005-2006 3 -
2006-2007 2 -
2007-2008 2 -
2008-2009 2 -
2009-2010 1 -
2010-2011 2 -
2011-2012 2 -
2012-2013 2 -* including non suburban MEMU, DHMU, DEMU
-
GROSS TONNE KMS. INCLUDING WEIGHT OF ENGINE
BUT EXCLUDING DEPARTMENTAL (in Millions)
(I) Passenger and proportion of mixed
METRE GAUGE
Diesel Total E.M.U.
1165 31705 525
1430 32282 545
2339 32606 564
3844 27581 528
4901 26761 499
5424 32283 617
6088 33839 643
6953 34142 660
7525 32851 660
8317 32427 648
8786 32434 670
10909 32626 707
10250 33137 708
11494 33821 745
12302 33450 725
12766 33810 728
13539 34487 740
15146 34995 752
15457 34257 74815457 34257 748
16940 34874 744
17952 34280 790
19344 35238 822
20071 34021 899
21414 30353 897
23327 27559 932
22767 25450 950
22079 24124 945
19819 21226 948
18953 19688 957
18839 19479 970
18129 18681 959
18327 18827 1050
18456 18949 859
17210 17562 589
16997 17084 130
15458 15461 -
13355 13357 -
11013 11015 -
8710 8712 -
7958 7959 -
8071 8073 -
7969 7984 * -
7,000 7017 * -
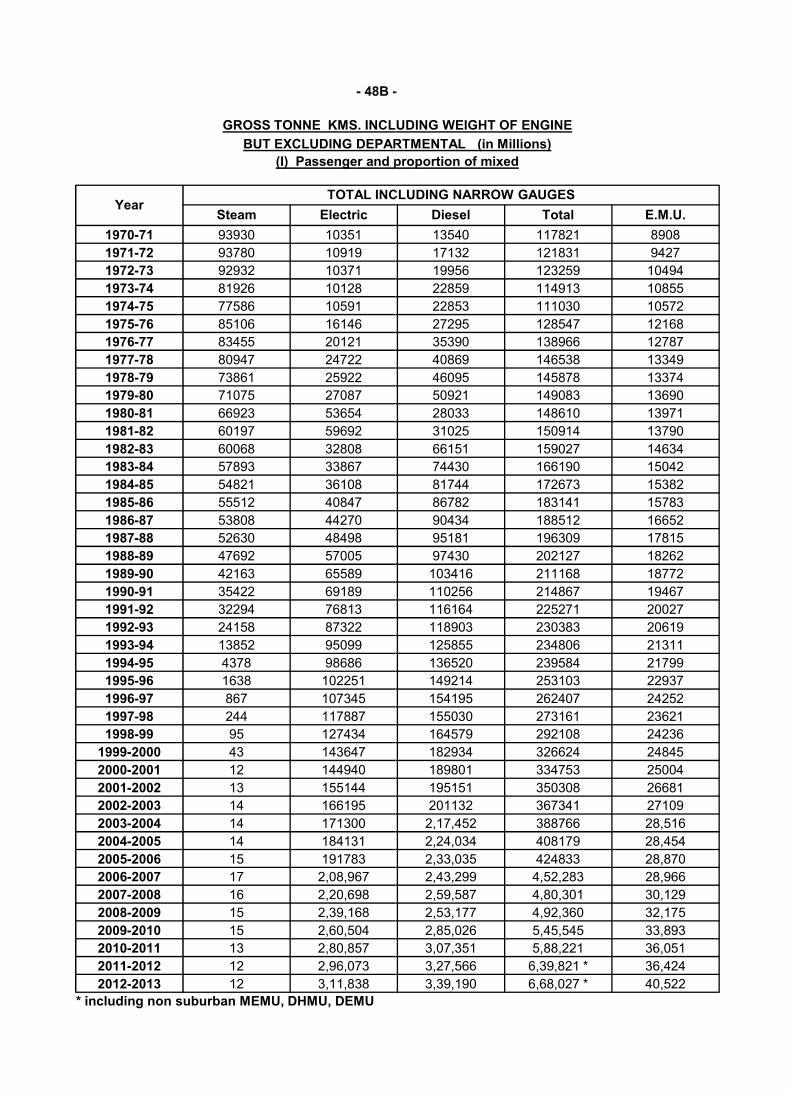
- 48B -
GROSS TONNE KMS. INCLUDING WEIGHT OF ENGINE
BUT EXCLUDING DEPARTMENTAL (in Millions)
(I) Passenger and proportion of mixed
YearTOTAL INCLUDING NARROW GAUGES
Steam Electric
1970-71 93930 10351
1971-72 93780 10919
1972-73 92932 10371
1973-74 81926 10128
1974-75 77586 10591
1975-76 85106 16146
1976-77 83455 20121
1977-78 80947 24722
1978-79 73861 25922
1979-80 71075 27087
1980-81 66923 53654
1981-82 60197 59692
1982-83 60068 32808
1983-84 57893 33867
1984-85 54821 36108
1985-86 55512 40847
1986-87 53808 44270
1987-88 52630 48498
1988-89 47692 57005
1989-90 42163 65589
1990-91 35422 69189
1991-92 32294 76813
1992-93 24158 87322
1993-94 13852 95099
1994-95 4378 98686
1995-96 1638 102251
1996-97 867 107345
1997-98 244 117887
1998-99 95 127434
1999-2000 43 143647
2000-2001 12 144940
2001-2002 13 155144
2002-2003 14 166195
2003-2004 14 171300
2004-2005 14 184131
2005-2006 15 191783
2006-2007 17 2,08,967
2007-2008 16 2,20,698
2008-2009 15 2,39,168
2009-2010 15 2,60,504
2010-2011 13 2,80,857
2011-2012 12 2,96,073
2012-2013 12 3,11,838
* including non suburban MEMU, DHMU, DEMU
-
GROSS TONNE KMS. INCLUDING WEIGHT OF ENGINE
BUT EXCLUDING DEPARTMENTAL (in Millions)
(I) Passenger and proportion of mixed
TOTAL INCLUDING NARROW GAUGES
Diesel Total E.M.U.
13540 117821 8908
17132 121831 9427
19956 123259 10494
22859 114913 10855
22853 111030 10572
27295 128547 12168
35390 138966 12787
40869 146538 13349
46095 145878 13374
50921 149083 13690
28033 148610 13971
31025 150914 13790
66151 159027 14634
74430 166190 15042
81744 172673 15382
86782 183141 15783
90434 188512 16652
95181 196309 17815
97430 202127 18262
103416 211168 18772
110256 214867 19467
116164 225271 20027
118903 230383 20619
125855 234806 21311
136520 239584 21799
149214 253103 22937
154195 262407 24252
155030 273161 23621
164579 292108 24236
182934 326624 24845
189801 334753 25004
195151 350308 26681
201132 367341 27109
2,17,452 388766 28,516
2,24,034 408179 28,454
2,33,035 424833 28,870
2,43,299 4,52,283 28,966
2,59,587 4,80,301 30,129
2,53,177 4,92,360 32,175
2,85,026 5,45,545 33,893
3,07,351 5,88,221 36,051
3,27,566 6,39,821 * 36,424
3,39,190 6,68,027 * 40,522
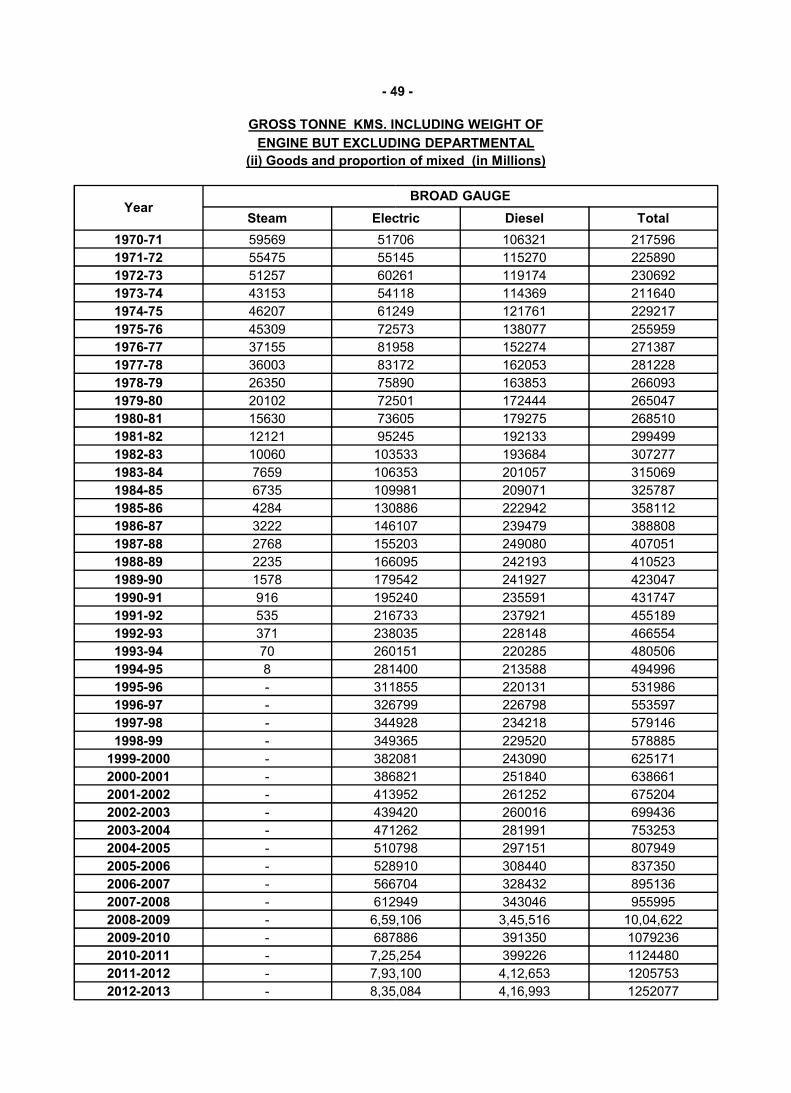
- 49
GROSS TONNE KMS. INCLUDING WEIGHT OF
ENGINE BUT EXCLUDING DEPARTMENTAL
(ii) Goods and proportion of mixed (in Millions)
YearSteam Electric
1970-71 59569 51706
1971-72 55475 55145
1972-73 51257 60261
1973-74 43153 54118
1974-75 46207 61249
1975-76 45309 72573
1976-77 37155 81958
1977-78 36003 83172
1978-79 26350 75890
1979-80 20102 72501
1980-81 15630 73605
1981-82 12121 95245
1982-83 10060 103533
1983-84 7659 106353
1984-85 6735 109981
1985-86 4284 130886
1986-87 3222 146107
1987-88 2768 1552031987-88 2768 155203
1988-89 2235 166095
1989-90 1578 179542
1990-91 916 195240
1991-92 535 216733
1992-93 371 238035
1993-94 70 260151
1994-95 8 281400
1995-96 - 311855
1996-97 - 326799
1997-98 - 344928
1998-99 - 349365
1999-2000 - 382081
2000-2001 - 386821
2001-2002 - 413952
2002-2003 - 439420
2003-2004 - 471262
2004-2005 - 510798
2005-2006 - 528910
2006-2007 - 566704
2007-2008 - 612949
2008-2009 - 6,59,106
2009-2010 - 687886
2010-2011 - 7,25,254
2011-2012 - 7,93,100
2012-2013 - 8,35,084
49 -
GROSS TONNE KMS. INCLUDING WEIGHT OF
ENGINE BUT EXCLUDING DEPARTMENTAL
(ii) Goods and proportion of mixed (in Millions)
BROAD GAUGE
Electric Diesel Total
51706 106321 217596
55145 115270 225890
60261 119174 230692
54118 114369 211640
61249 121761 229217
72573 138077 255959
81958 152274 271387
83172 162053 281228
75890 163853 266093
72501 172444 265047
73605 179275 268510
95245 192133 299499
103533 193684 307277
106353 201057 315069
109981 209071 325787
130886 222942 358112
146107 239479 388808
155203 249080 407051155203 249080 407051
166095 242193 410523
179542 241927 423047
195240 235591 431747
216733 237921 455189
238035 228148 466554
260151 220285 480506
281400 213588 494996
311855 220131 531986
326799 226798 553597
344928 234218 579146
349365 229520 578885
382081 243090 625171
386821 251840 638661
413952 261252 675204
439420 260016 699436
471262 281991 753253
510798 297151 807949
528910 308440 837350
566704 328432 895136
612949 343046 955995
6,59,106 3,45,516 10,04,622
687886 391350 1079236
7,25,254 399226 1124480
7,93,100 4,12,653 1205753
8,35,084 4,16,993 1252077
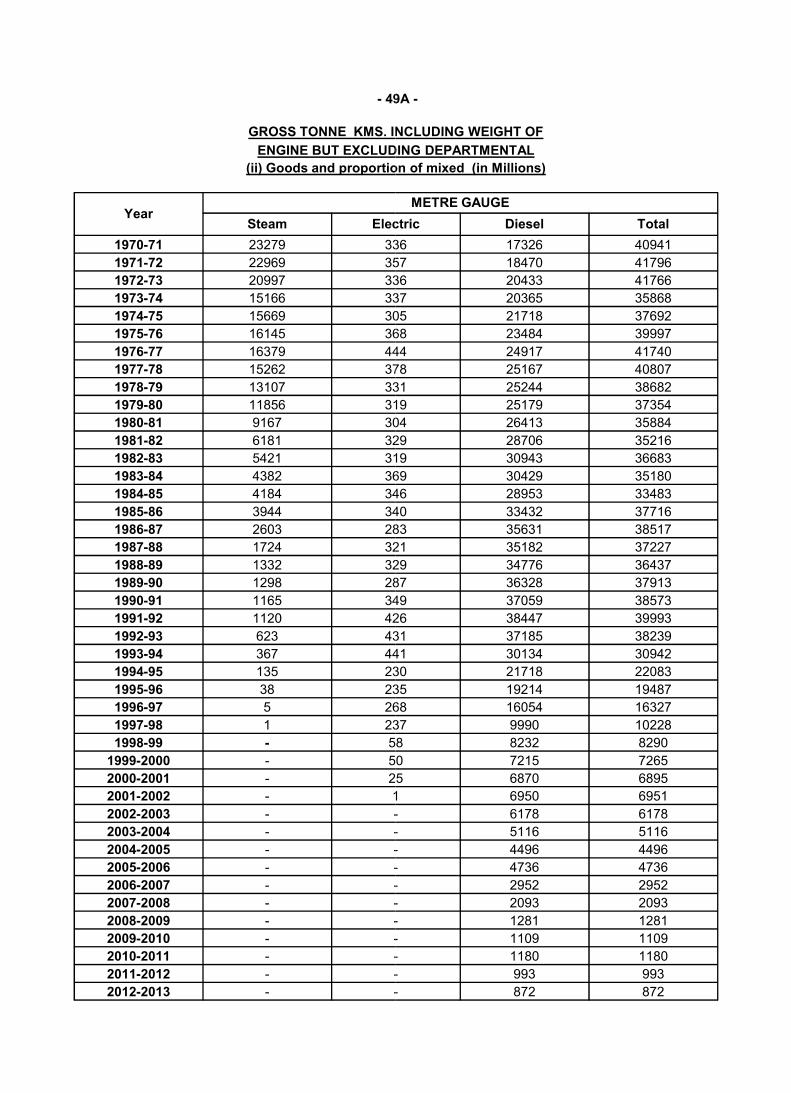
- 49A
GROSS TONNE KMS. INCLUDING WEIGHT OF
ENGINE BUT EXCLUDING DEPARTMENTAL
(ii) Goods and proportion of mixed (in Millions)
YearSteam Electric
1970-71 23279 336
1971-72 22969 357
1972-73 20997 336
1973-74 15166 337
1974-75 15669 305
1975-76 16145 368
1976-77 16379 444
1977-78 15262 378
1978-79 13107 331
1979-80 11856 319
1980-81 9167 304
1981-82 6181 329
1982-83 5421 319
1983-84 4382 369
1984-85 4184 346
1985-86 3944 340
1986-87 2603 283
1987-88 1724 3211987-88 1724 321
1988-89 1332 329
1989-90 1298 287
1990-91 1165 349
1991-92 1120 426
1992-93 623 431
1993-94 367 441
1994-95 135 230
1995-96 38 235
1996-97 5 268
1997-98 1 237
1998-99 - 58
1999-2000 - 50
2000-2001 - 25
2001-2002 - 1
2002-2003 - -
2003-2004 - -
2004-2005 - -
2005-2006 - -
2006-2007 - -
2007-2008 - -
2008-2009 - -
2009-2010 - -
2010-2011 - -
2011-2012 - -
2012-2013 - -
49A -
GROSS TONNE KMS. INCLUDING WEIGHT OF
ENGINE BUT EXCLUDING DEPARTMENTAL
(ii) Goods and proportion of mixed (in Millions)
METRE GAUGE
Electric Diesel Total
336 17326 40941
357 18470 41796
336 20433 41766
337 20365 35868
305 21718 37692
368 23484 39997
444 24917 41740
378 25167 40807
331 25244 38682
319 25179 37354
304 26413 35884
329 28706 35216
319 30943 36683
369 30429 35180
346 28953 33483
340 33432 37716
283 35631 38517
321 35182 37227321 35182 37227
329 34776 36437
287 36328 37913
349 37059 38573
426 38447 39993
431 37185 38239
441 30134 30942
230 21718 22083
235 19214 19487
268 16054 16327
237 9990 10228
58 8232 8290
50 7215 7265
25 6870 6895
1 6950 6951
- 6178 6178
- 5116 5116
- 4496 4496
- 4736 4736
- 2952 2952
- 2093 2093
- 1281 1281
- 1109 1109
- 1180 1180
- 993 993
- 872 872
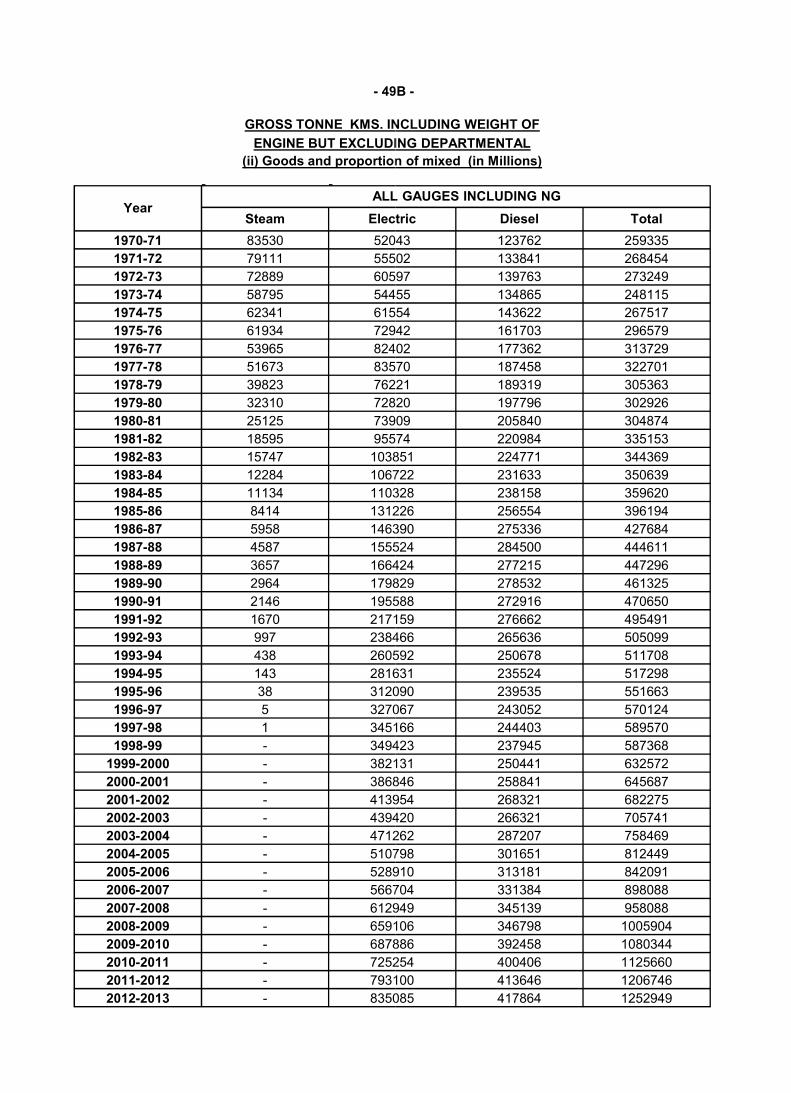
- 49B
GROSS TONNE KMS. INCLUDING WEIGHT OF
ENGINE BUT EXCLUDING DEPARTMENTAL
(ii) Goods and proportion of mixed (in Millions)
YearALL GAUGES INCLUDING NG
Steam Electric
1970-71 83530 52043
1971-72 79111 55502
1972-73 72889 60597
1973-74 58795 54455
1974-75 62341 61554
1975-76 61934 72942
1976-77 53965 82402
1977-78 51673 83570
1978-79 39823 76221
1979-80 32310 72820
1980-81 25125 73909
1981-82 18595 95574
1982-83 15747 103851
1983-84 12284 106722
1984-85 11134 110328
1985-86 8414 131226
1986-87 5958 146390
1987-88 4587 1555241987-88 4587 155524
1988-89 3657 166424
1989-90 2964 179829
1990-91 2146 195588
1991-92 1670 217159
1992-93 997 238466
1993-94 438 260592
1994-95 143 281631
1995-96 38 312090
1996-97 5 327067
1997-98 1 345166
1998-99 - 349423
1999-2000 - 382131
2000-2001 - 386846
2001-2002 - 413954
2002-2003 - 439420
2003-2004 - 471262
2004-2005 - 510798
2005-2006 - 528910
2006-2007 - 566704
2007-2008 - 612949
2008-2009 - 659106
2009-2010 - 687886
2010-2011 - 725254
2011-2012 - 793100
2012-2013 - 835085
49B -
GROSS TONNE KMS. INCLUDING WEIGHT OF
ENGINE BUT EXCLUDING DEPARTMENTAL
(ii) Goods and proportion of mixed (in Millions)
ALL GAUGES INCLUDING NG
Electric Diesel Total
52043 123762 259335
55502 133841 268454
60597 139763 273249
54455 134865 248115
61554 143622 267517
72942 161703 296579
82402 177362 313729
83570 187458 322701
76221 189319 305363
72820 197796 302926
73909 205840 304874
95574 220984 335153
103851 224771 344369
106722 231633 350639
110328 238158 359620
131226 256554 396194
146390 275336 427684
155524 284500 444611155524 284500 444611
166424 277215 447296
179829 278532 461325
195588 272916 470650
217159 276662 495491
238466 265636 505099
260592 250678 511708
281631 235524 517298
312090 239535 551663
327067 243052 570124
345166 244403 589570
349423 237945 587368
382131 250441 632572
386846 258841 645687
413954 268321 682275
439420 266321 705741
471262 287207 758469
510798 301651 812449
528910 313181 842091
566704 331384 898088
612949 345139 958088
659106 346798 1005904
687886 392458 1080344
725254 400406 1125660
793100 413646 1206746
835085 417864 1252949
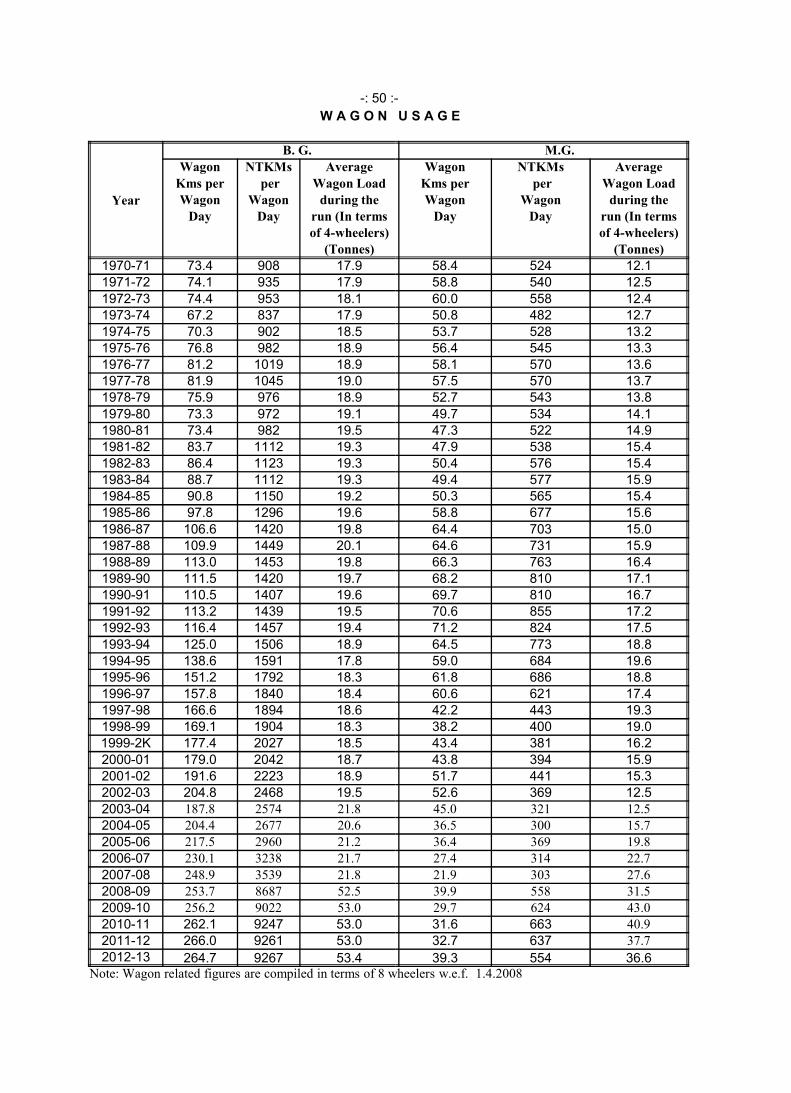
-: 50 :-
W A G O N U S A G E
Year
B. G.
Wagon NTKMs Average
Kms per per Wagon LoadWagon Wagon during the
Day Day run (In termsof 4-wheelers)
(Tonnes)
1970-71 73.4 908 17.91971-72 74.1 935 17.9
1972-73 74.4 953 18.11973-74 67.2 837 17.91974-75 70.3 902 18.51975-76 76.8 982 18.91976-77 81.2 1019 18.91977-78 81.9 1045 19.01978-79 75.9 976 18.9
1979-80 73.3 972 19.11980-81 73.4 982 19.51981-82 83.7 1112 19.31982-83 86.4 1123 19.31983-84 88.7 1112 19.31984-85 90.8 1150 19.21985-86 97.8 1296 19.6
1986-87 106.6 1420 19.81987-88 109.9 1449 20.11987-88 109.9 1449 20.11988-89 113.0 1453 19.81989-90 111.5 1420 19.71990-91 110.5 1407 19.61991-92 113.2 1439 19.51992-93 116.4 1457 19.4
1993-94 125.0 1506 18.91994-95 138.6 1591 17.81995-96 151.2 1792 18.31996-97 157.8 1840 18.41997-98 166.6 1894 18.61998-99 169.1 1904 18.31999-2K 177.4 2027 18.5
2000-01 179.0 2042 18.72001-02 191.6 2223 18.92002-03 204.8 2468 19.52003-04 187.8 2574 21.8
2004-05 204.4 2677 20.6
2005-06 217.5 2960 21.2
2006-07 230.1 3238 21.7
2007-08 248.9 3539 21.8
2008-09 253.7 8687 52.5
2009-10 256.2 9022 53.0
2010-11 262.1 9247 53.02011-12 266.0 9261 53.02012-13 264.7 9267 53.4
Note: Wagon related figures are compiled in terms of 8 wheelers
-
W A G O N U S A G E
M.G.
Wagon NTKMs Average
Kms per per Wagon LoadWagon Wagon during the
Day Day run (In termsof 4-wheelers)
(Tonnes)
58.4 524 12.158.8 540 12.5
60.0 558 12.450.8 482 12.753.7 528 13.256.4 545 13.358.1 570 13.657.5 570 13.752.7 543 13.8
49.7 534 14.147.3 522 14.947.9 538 15.450.4 576 15.449.4 577 15.950.3 565 15.458.8 677 15.6
64.4 703 15.064.6 731 15.964.6 731 15.966.3 763 16.468.2 810 17.169.7 810 16.770.6 855 17.271.2 824 17.5
64.5 773 18.859.0 684 19.661.8 686 18.860.6 621 17.442.2 443 19.338.2 400 19.043.4 381 16.2
43.8 394 15.951.7 441 15.352.6 369 12.545.0 321 12.536.5 300 15.736.4 369 19.827.4 314 22.7
21.9 303 27.639.9 558 31.529.7 624 43.0
31.6 663 40.9
32.7 637 37.7
39.3 554 36.6Note: Wagon related figures are compiled in terms of 8 wheelers w.e.f. 1.4.2008
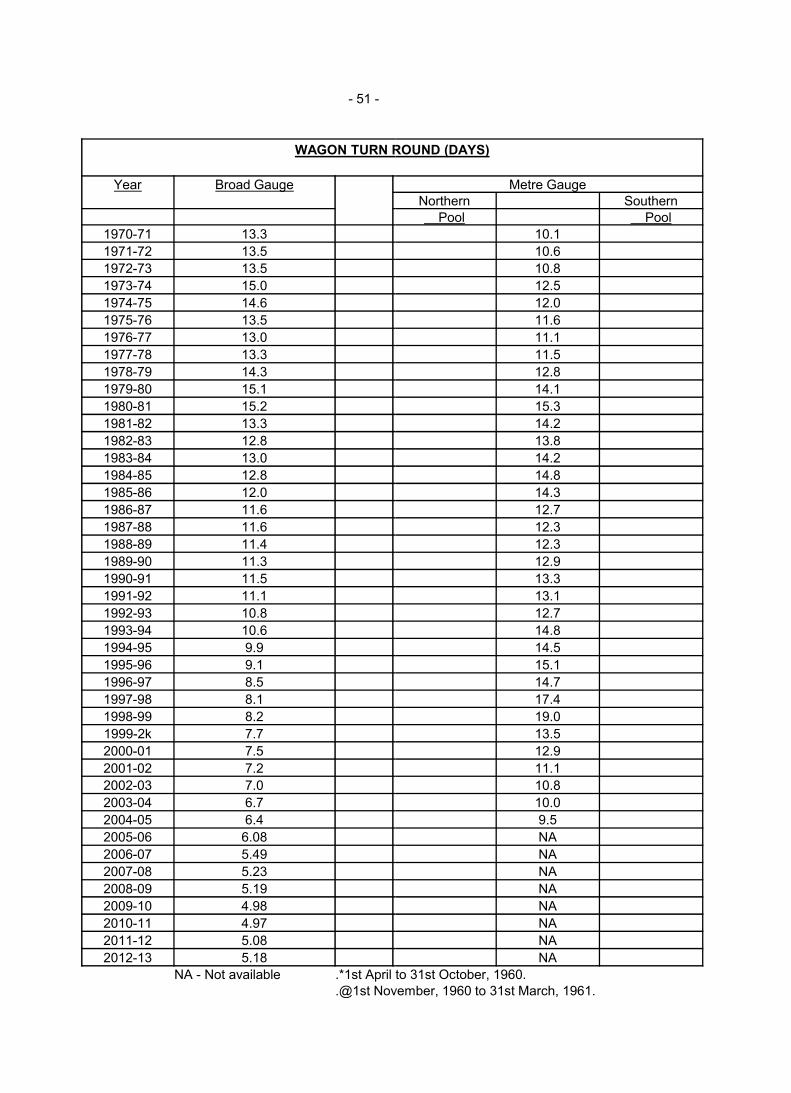
- 51 -
WAGON TURN ROUND (DAYS)
Year Broad Gauge
1970-71 13.3
1971-72 13.5
1972-73 13.5
1973-74 15.0
1974-75 14.6
1975-76 13.5
1976-77 13.0
1977-78 13.3
1978-79 14.3
1979-80 15.1
1980-81 15.2
1981-82 13.3
1982-83 12.8
1983-84 13.0
1984-85 12.8
1985-86 12.0
1986-87 11.6
1987-88 11.6
1988-89 11.41988-89 11.4
1989-90 11.3
1990-91 11.5
1991-92 11.1
1992-93 10.8
1993-94 10.6
1994-95 9.9
1995-96 9.1
1996-97 8.5
1997-98 8.1
1998-99 8.2
1999-2k 7.7
2000-01 7.5
2001-02 7.2
2002-03 7.0
2003-04 6.7
2004-05 6.4
2005-06 6.08
2006-07 5.49
2007-08 5.23
2008-09 5.19
2009-10 4.98
2010-11 4.97
2011-12 5.08
2012-13 5.18
NA - Not available .*1st April to 31st October, 1960..@1st November, 1960 to 31st March, 1961.
WAGON TURN ROUND (DAYS)
Metre GaugeNorthern Southern
Pool Pool
10.1
10.6
10.8
12.5
12.0
11.6
11.1
11.5
12.8
14.1
15.3
14.2
13.8
14.2
14.8
14.3
12.7
12.3
12.312.3
12.9
13.3
13.1
12.7
14.8
14.5
15.1
14.7
17.4
19.0
13.5
12.9
11.1
10.8
10.0
9.5
NA
NA
NA
NA
NA
NA
NA
NA
.*1st April to 31st October, 1960.
.@1st November, 1960 to 31st March, 1961.
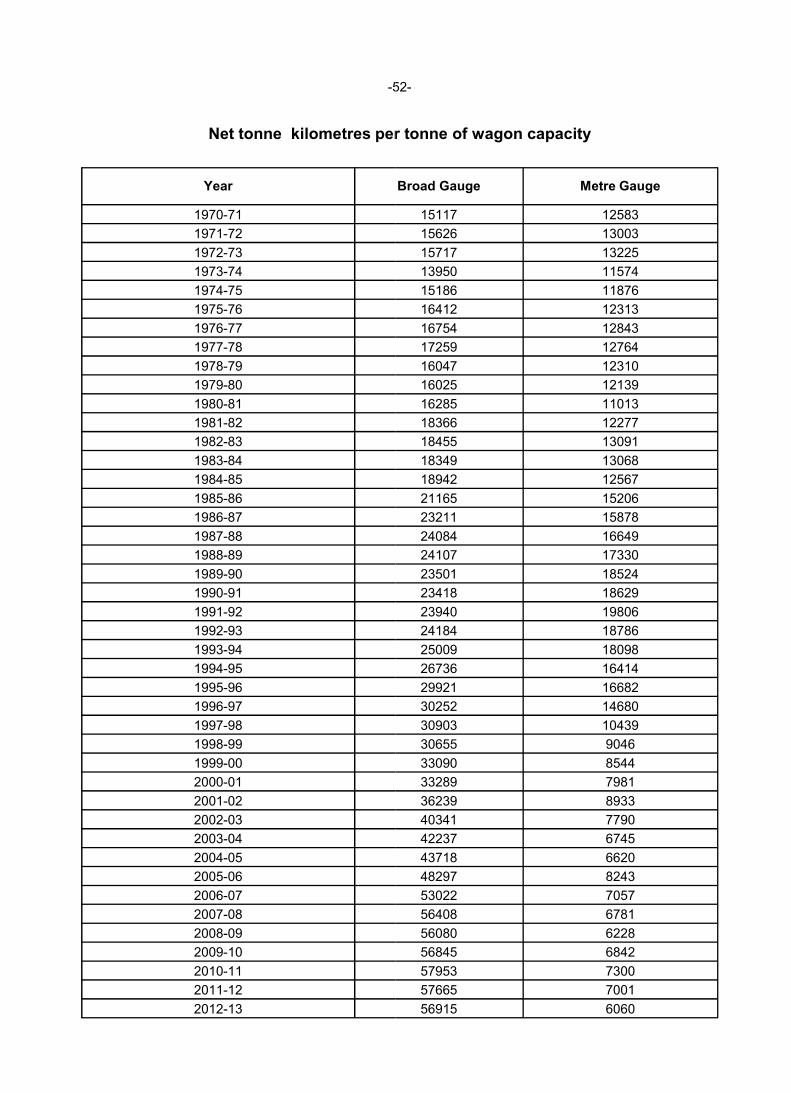
-52
Net tonne kilometres per tonne of wagon capacity
Year
1970-71
1971-72
1972-73
1973-74
1974-75
1975-76
1976-77
1977-78
1978-79
1979-80
1980-81
1981-82
1982-83
1983-84
1984-85
1985-86
1986-87
1987-88
1988-89
1989-90
1990-91
1991-92
1992-93
1993-94
1994-95
1995-96
1996-97
1997-98
1998-99
1999-00
2000-01
2001-02
2002-03
2003-04
2004-05
2005-06
2006-07
2007-08
2008-09
2009-10
2010-11
2011-12
2012-13
52-
Net tonne kilometres per tonne of wagon capacity
Broad Gauge Metre Gauge
15117 12583
15626 13003
15717 13225
13950 11574
15186 11876
16412 12313
16754 12843
17259 12764
16047 12310
16025 12139
16285 11013
18366 12277
18455 13091
18349 13068
18942 12567
21165 15206
23211 15878
24084 16649
24107 17330
23501 18524
23418 18629
23940 19806
24184 18786
25009 18098
26736 16414
29921 16682
30252 14680
30903 10439
30655 9046
33090 8544
33289 7981
36239 8933
40341 7790
42237 6745
43718 6620
48297 8243
53022 7057
56408 6781
56080 6228
56845 6842
57953 7300
57665 7001
56915 6060
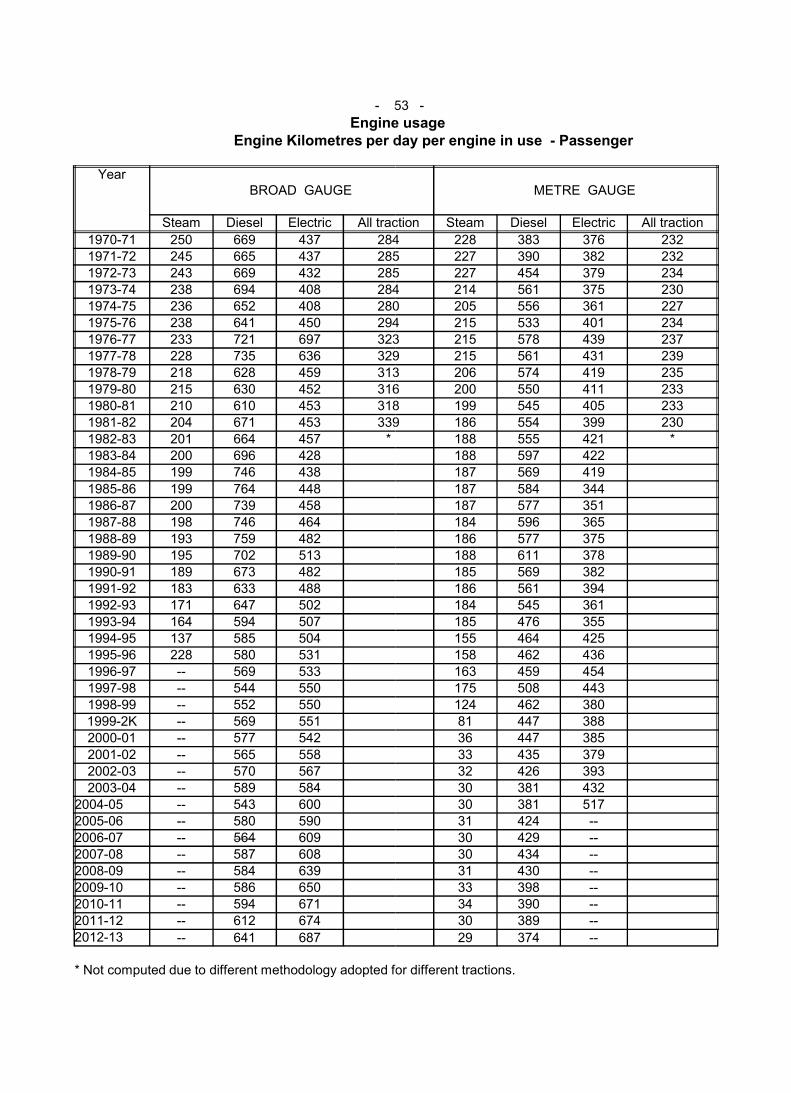
- 53
Engine usageEngine Kilometres per day per engine in use
YearBROAD GAUGE
Steam Diesel Electric All traction
1970-71 250 669 437 284
1971-72 245 665 437 285
1972-73 243 669 432 285
1973-74 238 694 408 284
1974-75 236 652 408 280
1975-76 238 641 450 294
1976-77 233 721 697 323
1977-78 228 735 636 329
1978-79 218 628 459 313
1979-80 215 630 452 316
1980-81 210 610 453 318
1981-82 204 671 453 339
1982-83 201 664 457 *
1983-84 200 696 428
1984-85 199 746 438
1985-86 199 764 448
1986-87 200 739 458
1987-88 198 746 464
1988-89 193 759 482
1989-90 195 702 513
1990-91 189 673 482
1991-92 183 633 488
1992-93 171 647 502
1993-94 164 594 507
1994-95 137 585 504
1995-96 228 580 531
1996-97 -- 569 533
1997-98 -- 544 550
1998-99 -- 552 550
1999-2K -- 569 551
2000-01 -- 577 542
2001-02 -- 565 558
2002-03 -- 570 567
2003-04 -- 589 584
2004-05 -- 543 600
2005-06 -- 580 590
2006-07 -- 564 609
2007-08 -- 587 608
2008-09 -- 584 639
2009-10 -- 586 650
2010-11 -- 594 671
2011-12 -- 612 674
2012-13 -- 641 687
* Not computed due to different methodology adopted for different tractions.
53 -
Engine usageEngine Kilometres per day per engine in use - Passenger
METRE GAUGE
All traction Steam Diesel Electric All traction
284 228 383 376 232
285 227 390 382 232
285 227 454 379 234
284 214 561 375 230
280 205 556 361 227
294 215 533 401 234
323 215 578 439 237
329 215 561 431 239
313 206 574 419 235
316 200 550 411 233
318 199 545 405 233
339 186 554 399 230
188 555 421 *
188 597 422
187 569 419
187 584 344
187 577 351
184 596 365
186 577 375
188 611 378
185 569 382
186 561 394
184 545 361
185 476 355
155 464 425
158 462 436
163 459 454
175 508 443
124 462 380
81 447 388
36 447 385
33 435 379
32 426 393
30 381 432
30 381 517
31 424 --
30 429 --
30 434 --
31 430 --
33 398 --
34 390 --
30 389 --
29 374 --
* Not computed due to different methodology adopted for different tractions.
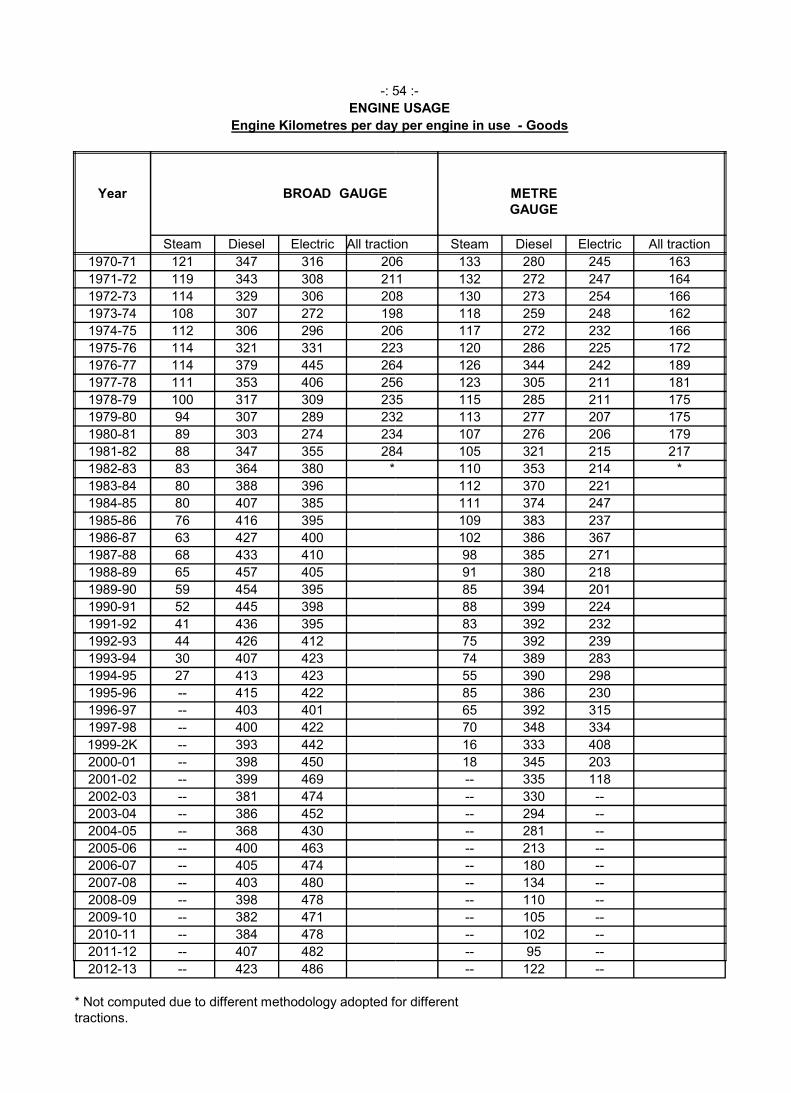
-: 54 :
ENGINE USAGE
Engine Kilometres per day per engine in use
Year BROAD GAUGE
Steam Diesel Electric All traction
1970-71 121 347 316 206
1971-72 119 343 308 211
1972-73 114 329 306 208
1973-74 108 307 272 198
1974-75 112 306 296 206
1975-76 114 321 331 223
1976-77 114 379 445 264
1977-78 111 353 406 256
1978-79 100 317 309 235
1979-80 94 307 289 232
1980-81 89 303 274 234
1981-82 88 347 355 284
1982-83 83 364 380 *
1983-84 80 388 396
1984-85 80 407 385
1985-86 76 416 395
1986-87 63 427 400
1987-88 68 433 410
1988-89 65 457 405
1989-90 59 454 395
1990-91 52 445 398
1991-92 41 436 395
1992-93 44 426 412
1993-94 30 407 423
1994-95 27 413 423
1995-96 -- 415 422
1996-97 -- 403 401
1997-98 -- 400 422
1999-2K -- 393 442
2000-01 -- 398 450
2001-02 -- 399 469
2002-03 -- 381 474
2003-04 -- 386 452
2004-05 -- 368 430
2005-06 -- 400 463
2006-07 -- 405 474
2007-08 -- 403 480
2008-09 -- 398 478
2009-10 -- 382 471
2010-11 -- 384 478
2011-12 -- 407 482
2012-13 -- 423 486
* Not computed due to different methodology adopted for different tractions.
: 54 :-
ENGINE USAGE
Engine Kilometres per day per engine in use - Goods
METRE GAUGE
All traction Steam Diesel Electric All traction
206 133 280 245 163
211 132 272 247 164
208 130 273 254 166
198 118 259 248 162
206 117 272 232 166
223 120 286 225 172
264 126 344 242 189
256 123 305 211 181
235 115 285 211 175
232 113 277 207 175
234 107 276 206 179
284 105 321 215 217
110 353 214 *
112 370 221
111 374 247
109 383 237
102 386 367
98 385 271
91 380 218
85 394 201
88 399 224
83 392 232
75 392 239
74 389 283
55 390 298
85 386 230
65 392 315
70 348 334
16 333 408
18 345 203
-- 335 118
-- 330 --
-- 294 --
-- 281 --
-- 213 --
-- 180 --
-- 134 --
-- 110 --
-- 105 --
-- 102 --
-- 95 --
-- 122 --
* Not computed due to different methodology adopted for different
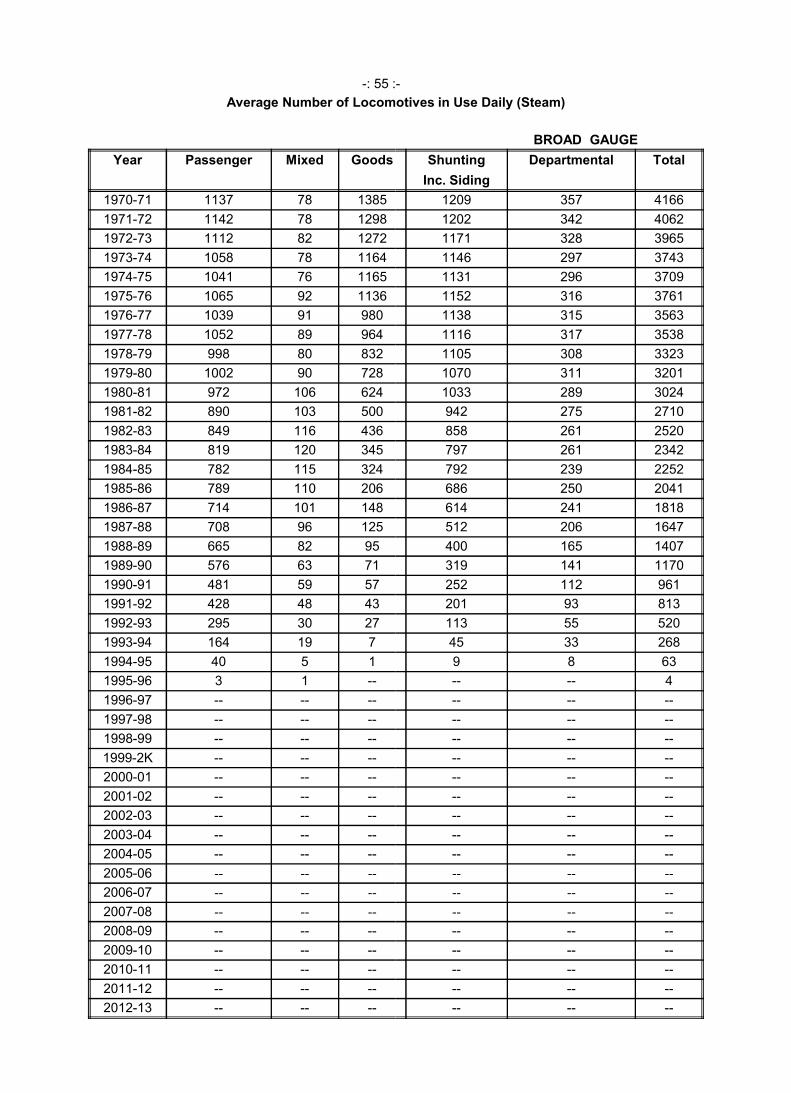
-: 55 :
Average Number of Locomotives in Use Daily (Steam)
Year Passenger Mixed Goods
1970-71 1137 78 1385
1971-72 1142 78 1298
1972-73 1112 82 1272
1973-74 1058 78 1164
1974-75 1041 76 1165
1975-76 1065 92 1136
1976-77 1039 91 980
1977-78 1052 89 964
1978-79 998 80 832
1979-80 1002 90 728
1980-81 972 106 624
1981-82 890 103 500
1982-83 849 116 436
1983-84 819 120 345
1984-85 782 115 324
1985-86 789 110 206
1986-87 714 101 148
1987-88 708 96 125
1988-89 665 82 951988-89 665 82 95
1989-90 576 63 71
1990-91 481 59 57
1991-92 428 48 43
1992-93 295 30 27
1993-94 164 19 7
1994-95 40 5 1
1995-96 3 1 --
1996-97 -- -- --
1997-98 -- -- --
1998-99 -- -- --
1999-2K -- -- --
2000-01 -- -- --
2001-02 -- -- --
2002-03 -- -- --
2003-04 -- -- --
2004-05 -- -- --
2005-06 -- -- --
2006-07 -- -- --
2007-08 -- -- --
2008-09 -- -- --
2009-10 -- -- --
2010-11 -- -- --
2011-12 -- -- --
2012-13 -- -- --
-
Average Number of Locomotives in Use Daily (Steam)
BROAD GAUGE
Shunting Departmental Total
Inc. Siding
1209 357 4166
1202 342 4062
1171 328 3965
1146 297 3743
1131 296 3709
1152 316 3761
1138 315 3563
1116 317 3538
1105 308 3323
1070 311 3201
1033 289 3024
942 275 2710
858 261 2520
797 261 2342
792 239 2252
686 250 2041
614 241 1818
512 206 1647
400 165 1407400 165 1407
319 141 1170
252 112 961
201 93 813
113 55 520
45 33 268
9 8 63
-- -- 4
-- -- --
-- -- --
-- -- --
-- -- --
-- -- --
-- -- --
-- -- --
-- -- --
-- -- --
-- -- --
-- -- --
-- -- --
-- -- --
-- -- --
-- -- --
-- -- --
-- -- --
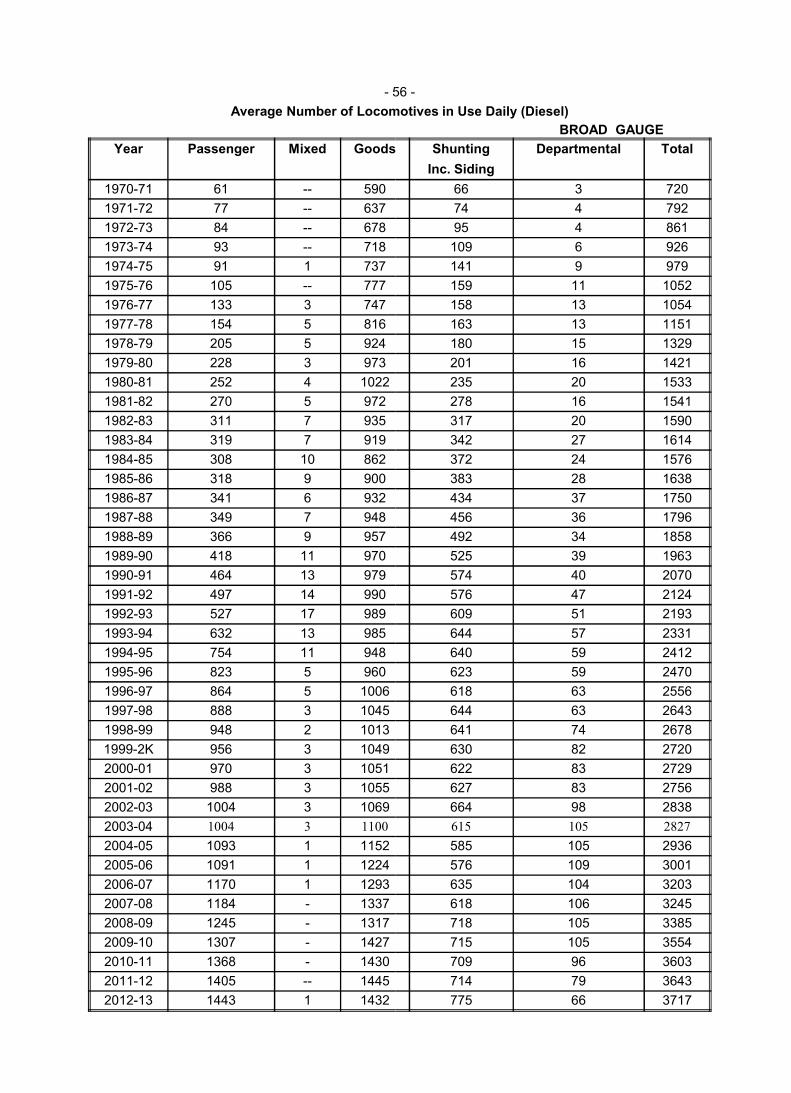
- 56
Average Number of Locomotives in Use Daily (Diesel)
Year Passenger Mixed Goods
1970-71 61 -- 590
1971-72 77 -- 637
1972-73 84 -- 678
1973-74 93 -- 718
1974-75 91 1 737
1975-76 105 -- 777
1976-77 133 3 747
1977-78 154 5 816
1978-79 205 5 924
1979-80 228 3 973
1980-81 252 4 1022
1981-82 270 5 972
1982-83 311 7 935
1983-84 319 7 919
1984-85 308 10 862
1985-86 318 9 900
1986-87 341 6 932
1987-88 349 7 948
1988-89 366 9 957
1989-90 418 11 970
1990-91 464 13 979
1991-92 497 14 990
1992-93 527 17 989
1993-94 632 13 985
1994-95 754 11 948
1995-96 823 5 960
1996-97 864 5 1006
1997-98 888 3 1045
1998-99 948 2 1013
1999-2K 956 3 1049
2000-01 970 3 1051
2001-02 988 3 1055
2002-03 1004 3 1069
2003-04 1004 3 1100
2004-05 1093 1 1152
2005-06 1091 1 1224
2006-07 1170 1 1293
2007-08 1184 - 1337
2008-09 1245 - 1317
2009-10 1307 - 1427
2010-11 1368 - 1430
2011-12 1405 -- 1445
2012-13 1443 1 1432
56 -
Average Number of Locomotives in Use Daily (Diesel)
BROAD GAUGE
Goods Shunting Departmental Total
Inc. Siding
66 3 720
74 4 792
95 4 861
109 6 926
141 9 979
159 11 1052
158 13 1054
163 13 1151
180 15 1329
201 16 1421
235 20 1533
278 16 1541
317 20 1590
342 27 1614
372 24 1576
383 28 1638
434 37 1750
456 36 1796
492 34 1858
525 39 1963
574 40 2070
576 47 2124
609 51 2193
644 57 2331
640 59 2412
623 59 2470
618 63 2556
644 63 2643
641 74 2678
630 82 2720
622 83 2729
627 83 2756
664 98 2838
615 105 2827
585 105 2936
576 109 3001
635 104 3203
618 106 3245
718 105 3385
715 105 3554
709 96 3603
714 79 3643
775 66 3717
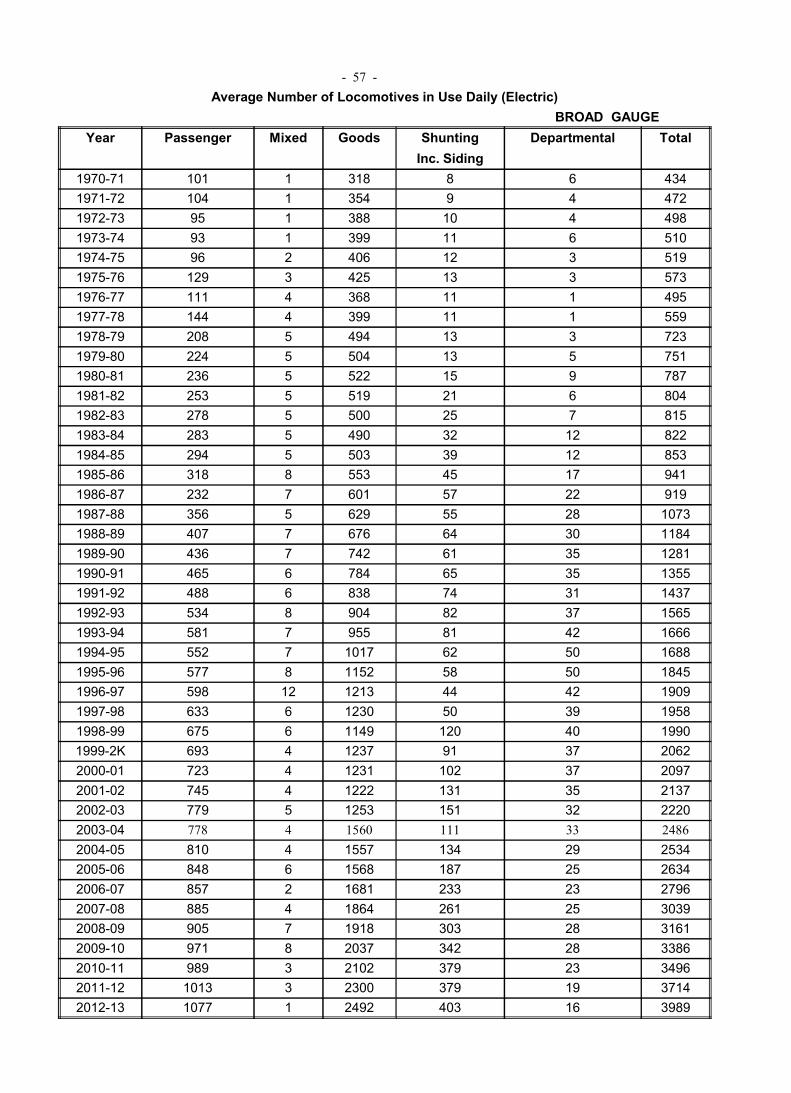
- 57 -
Average Number of Locomotives in Use Daily (Electric)
Year Passenger Mixed Goods
1970-71 101 1 318
1971-72 104 1 354
1972-73 95 1 388
1973-74 93 1 399
1974-75 96 2 406
1975-76 129 3 425
1976-77 111 4 368
1977-78 144 4 399
1978-79 208 5 494
1979-80 224 5 504
1980-81 236 5 522
1981-82 253 5 519
1982-83 278 5 500
1983-84 283 5 490
1984-85 294 5 503
1985-86 318 8 553
1986-87 232 7 601
1987-88 356 5 629
1988-89 407 7 676
1989-90 436 7 742
1990-91 465 6 784
1991-92 488 6 838
1992-93 534 8 904
1993-94 581 7 955
1994-95 552 7 1017
1995-96 577 8 1152
1996-97 598 12 1213
1997-98 633 6 1230
1998-99 675 6 1149
1999-2K 693 4 1237
2000-01 723 4 1231
2001-02 745 4 1222
2002-03 779 5 1253
2003-04 778 4 1560
2004-05 810 4 1557
2005-06 848 6 1568
2006-07 857 2 1681
2007-08 885 4 1864
2008-09 905 7 1918
2009-10 971 8 2037
2010-11 989 3 2102
2011-12 1013 3 2300
2012-13 1077 1 2492
Average Number of Locomotives in Use Daily (Electric)
BROAD GAUGE
Shunting Departmental Total
Inc. Siding
8 6 434
9 4 472
10 4 498
11 6 510
12 3 519
13 3 573
11 1 495
11 1 559
13 3 723
13 5 751
15 9 787
21 6 804
25 7 815
32 12 822
39 12 853
45 17 941
57 22 919
55 28 1073
64 30 1184
61 35 1281
65 35 1355
74 31 1437
82 37 1565
81 42 1666
62 50 1688
58 50 1845
44 42 1909
50 39 1958
120 40 1990
91 37 2062
102 37 2097
131 35 2137
151 32 2220
111 33 2486
134 29 2534
187 25 2634
233 23 2796
261 25 3039
303 28 3161
342 28 3386
379 23 3496
379 19 3714
403 16 3989
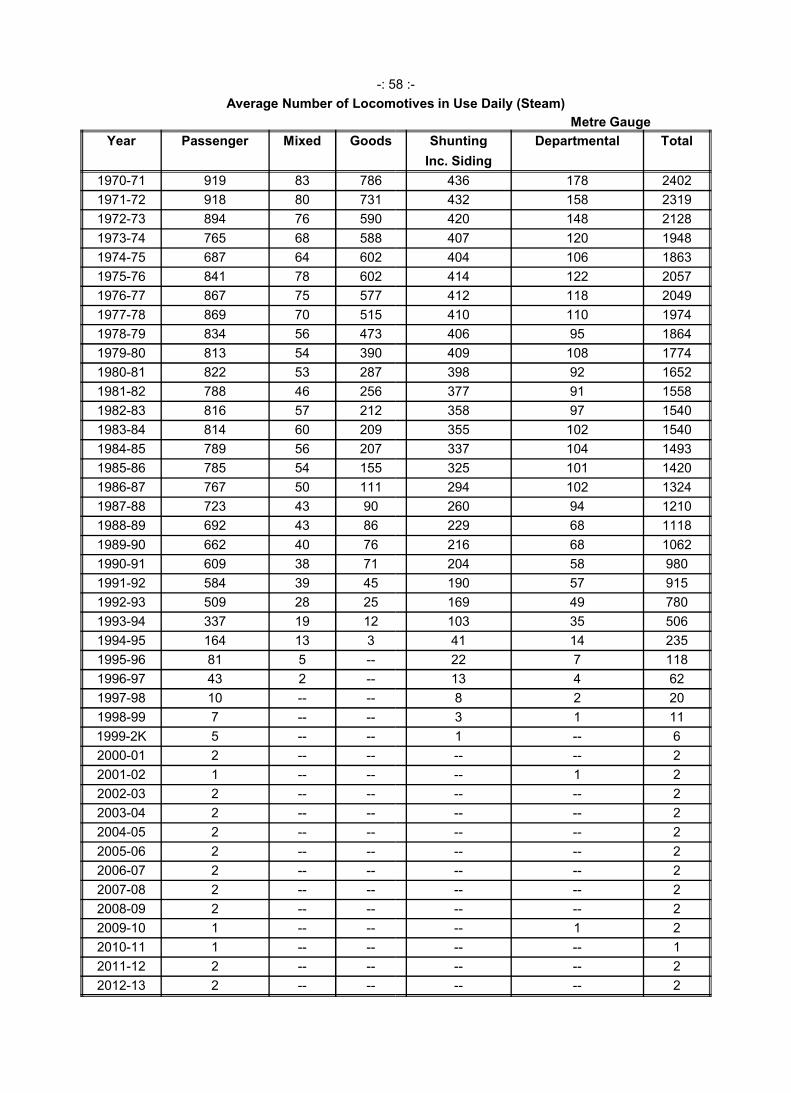
-: 58 :
Average Number of Locomotives in Use Daily (Steam)
Year Passenger Mixed Goods
1970-71 919 83 786
1971-72 918 80 731
1972-73 894 76 590
1973-74 765 68 588
1974-75 687 64 602
1975-76 841 78 602
1976-77 867 75 577
1977-78 869 70 515
1978-79 834 56 473
1979-80 813 54 390
1980-81 822 53 287
1981-82 788 46 256
1982-83 816 57 212
1983-84 814 60 209
1984-85 789 56 207
1985-86 785 54 155
1986-87 767 50 111
1987-88 723 43 90
1988-89 692 43 86
1989-90 662 40 761989-90 662 40 76
1990-91 609 38 71
1991-92 584 39 45
1992-93 509 28 25
1993-94 337 19 12
1994-95 164 13 3
1995-96 81 5 --
1996-97 43 2 --
1997-98 10 -- --
1998-99 7 -- --
1999-2K 5 -- --
2000-01 2 -- --
2001-02 1 -- --
2002-03 2 -- --
2003-04 2 -- --
2004-05 2 -- --
2005-06 2 -- --
2006-07 2 -- --
2007-08 2 -- --
2008-09 2 -- --
2009-10 1 -- --
2010-11 1 -- --
2011-12 2 -- --
2012-13 2 -- --
: 58 :-
Average Number of Locomotives in Use Daily (Steam)
Metre Gauge
Shunting Departmental Total
Inc. Siding
436 178 2402
432 158 2319
420 148 2128
407 120 1948
404 106 1863
414 122 2057
412 118 2049
410 110 1974
406 95 1864
409 108 1774
398 92 1652
377 91 1558
358 97 1540
355 102 1540
337 104 1493
325 101 1420
294 102 1324
260 94 1210
229 68 1118
216 68 1062216 68 1062
204 58 980
190 57 915
169 49 780
103 35 506
41 14 235
22 7 118
13 4 62
8 2 20
3 1 11
1 -- 6
-- -- 2
-- 1 2
-- -- 2
-- -- 2
-- -- 2
-- -- 2
-- -- 2
-- -- 2
-- -- 2
-- 1 2
-- -- 1
-- -- 2
-- -- 2
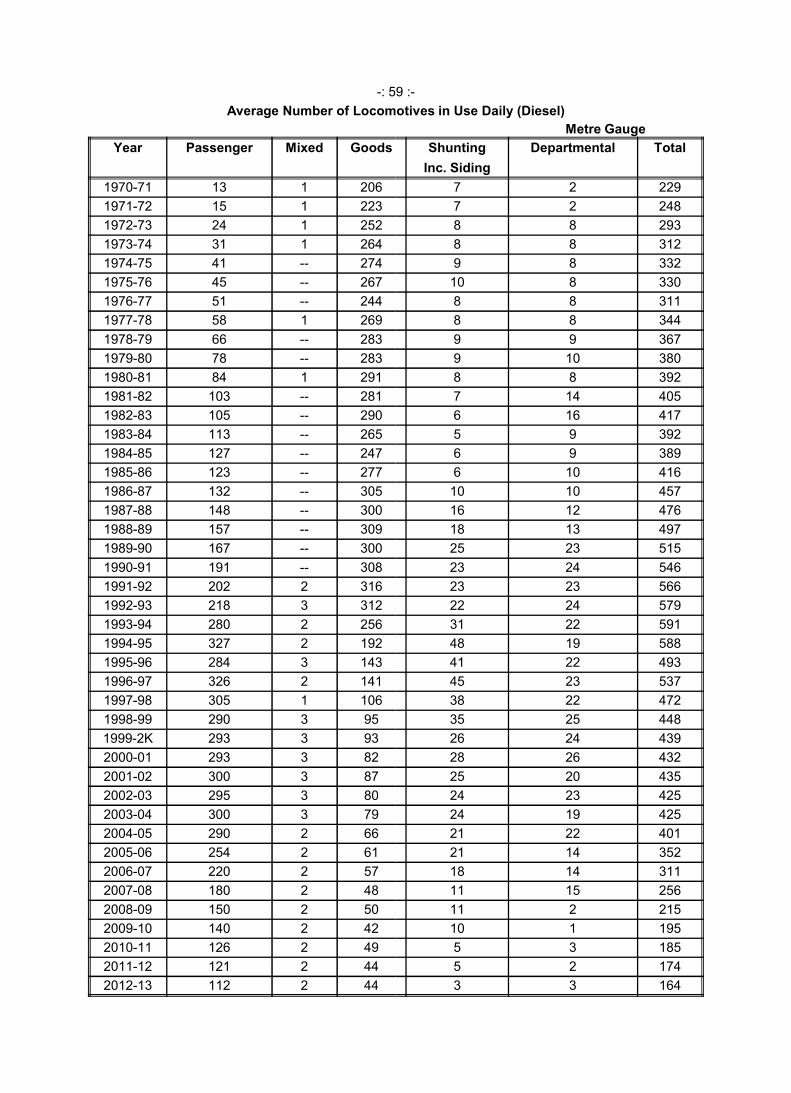
-: 59 :
Average Number of Locomotives in Use Daily (Diesel)
Year Passenger Mixed Goods
1970-71 13 1 206
1971-72 15 1 223
1972-73 24 1 252
1973-74 31 1 264
1974-75 41 -- 274
1975-76 45 -- 267
1976-77 51 -- 244
1977-78 58 1 269
1978-79 66 -- 283
1979-80 78 -- 283
1980-81 84 1 291
1981-82 103 -- 281
1982-83 105 -- 290
1983-84 113 -- 265
1984-85 127 -- 247
1985-86 123 -- 277
1986-87 132 -- 305
1987-88 148 -- 300
1988-89 157 -- 309
1989-90 167 -- 3001989-90 167 -- 300
1990-91 191 -- 308
1991-92 202 2 316
1992-93 218 3 312
1993-94 280 2 256
1994-95 327 2 192
1995-96 284 3 143
1996-97 326 2 141
1997-98 305 1 106
1998-99 290 3 95
1999-2K 293 3 93
2000-01 293 3 82
2001-02 300 3 87
2002-03 295 3 80
2003-04 300 3 79
2004-05 290 2 66
2005-06 254 2 61
2006-07 220 2 57
2007-08 180 2 48
2008-09 150 2 50
2009-10 140 2 42
2010-11 126 2 49
2011-12 121 2 44
2012-13 112 2 44
: 59 :-
Average Number of Locomotives in Use Daily (Diesel)
Metre Gauge
Shunting Departmental Total
Inc. Siding
7 2 229
7 2 248
8 8 293
8 8 312
9 8 332
10 8 330
8 8 311
8 8 344
9 9 367
9 10 380
8 8 392
7 14 405
6 16 417
5 9 392
6 9 389
6 10 416
10 10 457
16 12 476
18 13 497
25 23 51525 23 515
23 24 546
23 23 566
22 24 579
31 22 591
48 19 588
41 22 493
45 23 537
38 22 472
35 25 448
26 24 439
28 26 432
25 20 435
24 23 425
24 19 425
21 22 401
21 14 352
18 14 311
11 15 256
11 2 215
10 1 195
5 3 185
5 2 174
3 3 164
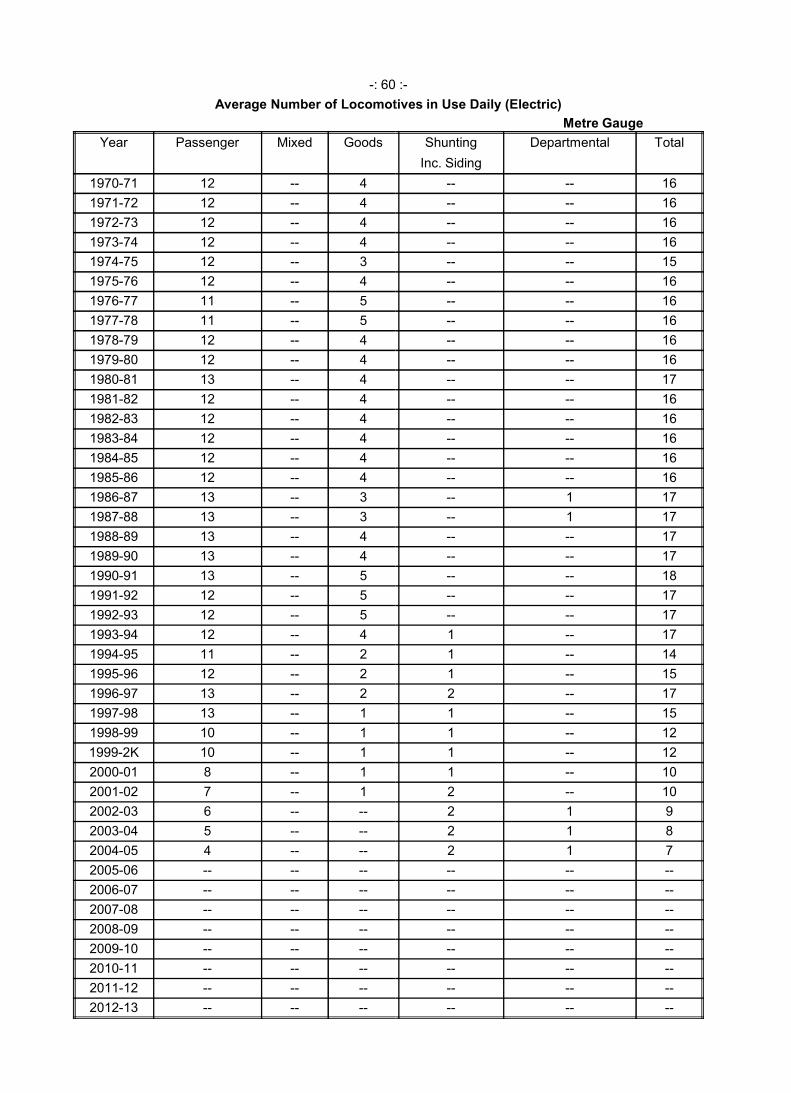
-: 60 :
Average Number of Locomotives in Use Daily (Electric)
Year Passenger Mixed Goods
1970-71 12 -- 4
1971-72 12 -- 4
1972-73 12 -- 4
1973-74 12 -- 4
1974-75 12 -- 3
1975-76 12 -- 4
1976-77 11 -- 5
1977-78 11 -- 5
1978-79 12 -- 4
1979-80 12 -- 4
1980-81 13 -- 4
1981-82 12 -- 4
1982-83 12 -- 4
1983-84 12 -- 4
1984-85 12 -- 4
1985-86 12 -- 4
1986-87 13 -- 3
1987-88 13 -- 3
1988-89 13 -- 4
1989-90 13 -- 4
1990-91 13 -- 5
1991-92 12 -- 5
1992-93 12 -- 5
1993-94 12 -- 4
1994-95 11 -- 2
1995-96 12 -- 2
1996-97 13 -- 2
1997-98 13 -- 1
1998-99 10 -- 1
1999-2K 10 -- 1
2000-01 8 -- 1
2001-02 7 -- 1
2002-03 6 -- --
2003-04 5 -- --
2004-05 4 -- --
2005-06 -- -- --
2006-07 -- -- --
2007-08 -- -- --
2008-09 -- -- --
2009-10 -- -- --
2010-11 -- -- --
2011-12 -- -- --
2012-13 -- -- --
: 60 :-
Average Number of Locomotives in Use Daily (Electric)
Metre Gauge
Shunting Departmental Total
Inc. Siding
-- -- 16
-- -- 16
-- -- 16
-- -- 16
-- -- 15
-- -- 16
-- -- 16
-- -- 16
-- -- 16
-- -- 16
-- -- 17
-- -- 16
-- -- 16
-- -- 16
-- -- 16
-- -- 16
-- 1 17
-- 1 17
-- -- 17
-- -- 17
-- -- 18
-- -- 17
-- -- 17
1 -- 17
1 -- 14
1 -- 15
2 -- 17
1 -- 15
1 -- 12
1 -- 12
1 -- 10
2 -- 10
2 1 9
2 1 8
2 1 7
-- -- --
-- -- --
-- -- --
-- -- --
-- -- --
-- -- --
-- -- --
-- -- --
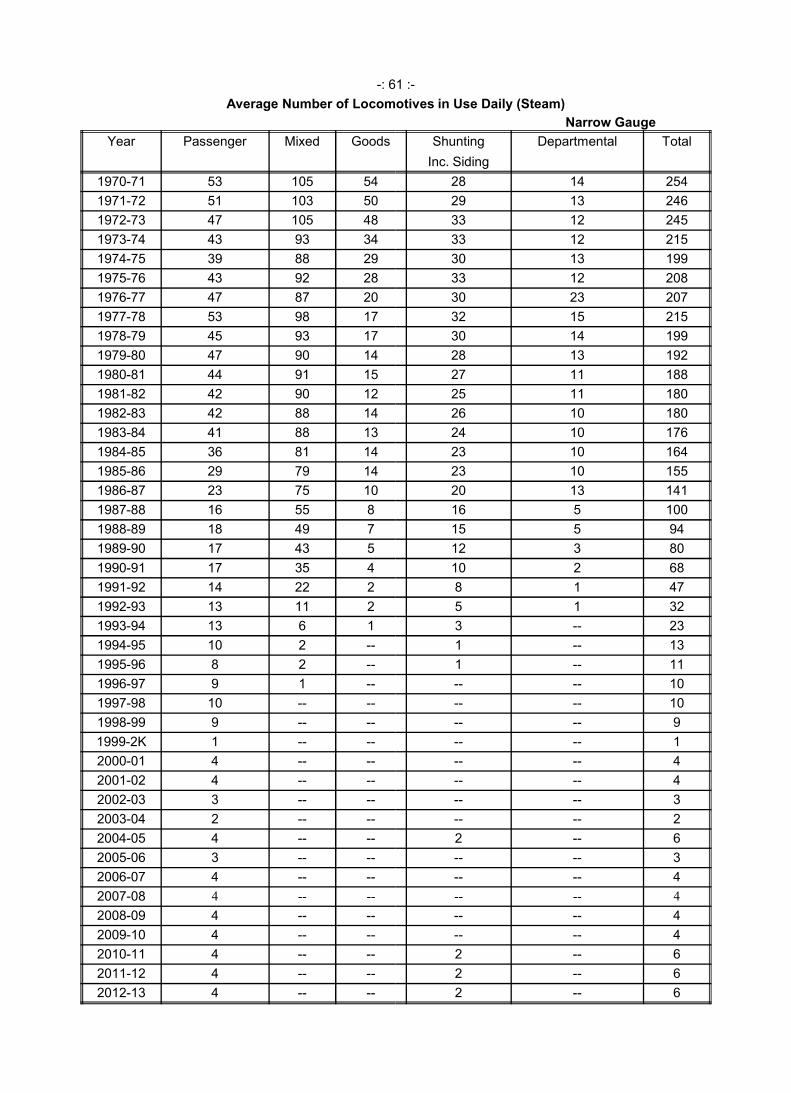
-: 61 :
Average Number of Locomotives in Use Daily (Steam)
Year Passenger Mixed Goods
1970-71 53 105 54
1971-72 51 103 50
1972-73 47 105 48
1973-74 43 93 34
1974-75 39 88 29
1975-76 43 92 28
1976-77 47 87 20
1977-78 53 98 17
1978-79 45 93 17
1979-80 47 90 14
1980-81 44 91 15
1981-82 42 90 12
1982-83 42 88 14
1983-84 41 88 13
1984-85 36 81 14
1985-86 29 79 14
1986-87 23 75 10
1987-88 16 55 8
1988-89 18 49 7
1989-90 17 43 51989-90 17 43 5
1990-91 17 35 4
1991-92 14 22 2
1992-93 13 11 2
1993-94 13 6 1
1994-95 10 2 --
1995-96 8 2 --
1996-97 9 1 --
1997-98 10 -- --
1998-99 9 -- --
1999-2K 1 -- --
2000-01 4 -- --
2001-02 4 -- --
2002-03 3 -- --
2003-04 2 -- --
2004-05 4 -- --
2005-06 3 -- --
2006-07 4 -- --
2007-08 4 -- --
2008-09 4 -- --
2009-10 4 -- --
2010-11 4 -- --
2011-12 4 -- --
2012-13 4 -- --
: 61 :-
Average Number of Locomotives in Use Daily (Steam)
Narrow Gauge
Shunting Departmental Total
Inc. Siding
28 14 254
29 13 246
33 12 245
33 12 215
30 13 199
33 12 208
30 23 207
32 15 215
30 14 199
28 13 192
27 11 188
25 11 180
26 10 180
24 10 176
23 10 164
23 10 155
20 13 141
16 5 100
15 5 94
12 3 8012 3 80
10 2 68
8 1 47
5 1 32
3 -- 23
1 -- 13
1 -- 11
-- -- 10
-- -- 10
-- -- 9
-- -- 1
-- -- 4
-- -- 4
-- -- 3
-- -- 2
2 -- 6
-- -- 3
-- -- 4
-- -- 4
-- -- 4
-- -- 4
2 -- 6
2 -- 6
2 -- 6
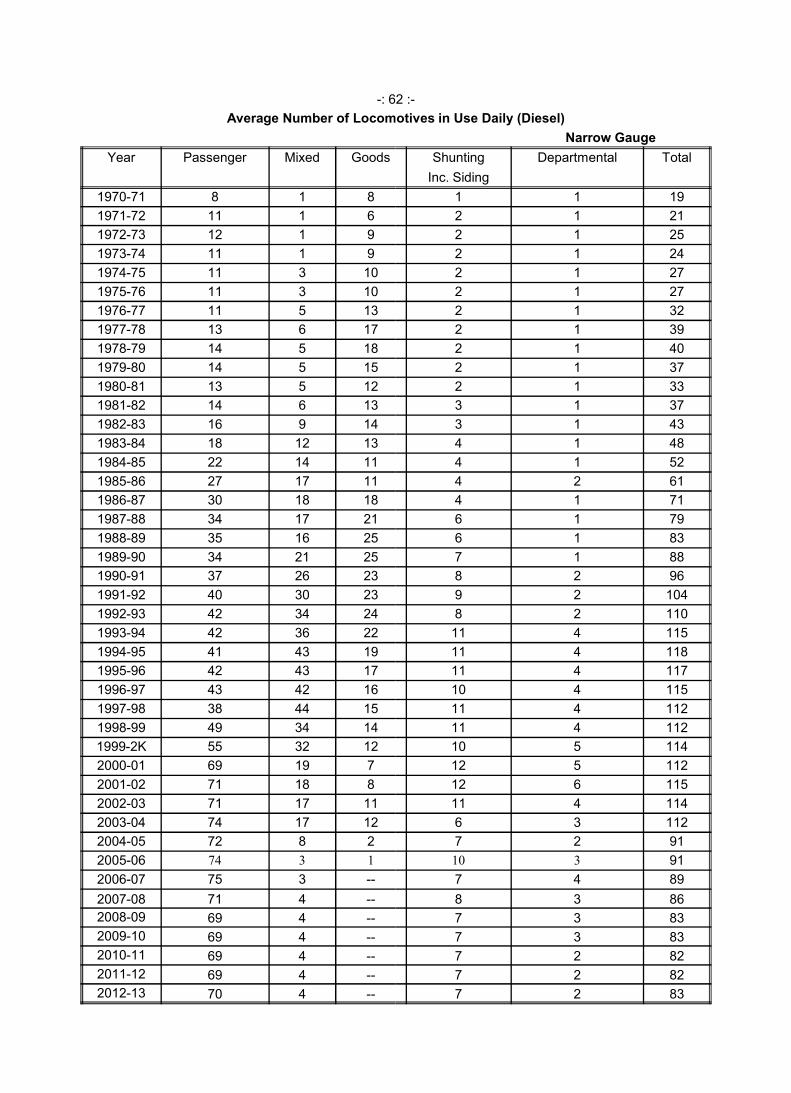
-: 62 :
Average Number of Locomotives in Use Daily (Diesel)
Year Passenger Mixed Goods
1970-71 8 1 8
1971-72 11 1 6
1972-73 12 1 9
1973-74 11 1 9
1974-75 11 3 10
1975-76 11 3 10
1976-77 11 5 13
1977-78 13 6 17
1978-79 14 5 18
1979-80 14 5 15
1980-81 13 5 12
1981-82 14 6 13
1982-83 16 9 14
1983-84 18 12 13
1984-85 22 14 11
1985-86 27 17 11
1986-87 30 18 18
1987-88 34 17 21
1988-89 35 16 25
1989-90 34 21 25
1990-91 37 26 23
1991-92 40 30 23
1992-93 42 34 24
1993-94 42 36 22
1994-95 41 43 19
1995-96 42 43 17
1996-97 43 42 16
1997-98 38 44 15
1998-99 49 34 14
1999-2K 55 32 12
2000-01 69 19 7
2001-02 71 18 8
2002-03 71 17 11
2003-04 74 17 12
2004-05 72 8 2
2005-06 74 3 1
2006-07 75 3 --
2007-08 71 4 --
2008-09 69 4 --
2009-10 69 4 --
2010-11 69 4 --
2011-12 69 4 --
2012-13 70 4 --
: 62 :-
Average Number of Locomotives in Use Daily (Diesel)
Narrow Gauge
Shunting Departmental Total
Inc. Siding
1 1 19
2 1 21
2 1 25
2 1 24
2 1 27
2 1 27
2 1 32
2 1 39
2 1 40
2 1 37
2 1 33
3 1 37
3 1 43
4 1 48
4 1 52
4 2 61
4 1 71
6 1 79
6 1 83
7 1 88
8 2 96
9 2 104
8 2 110
11 4 115
11 4 118
11 4 117
10 4 115
11 4 112
11 4 112
10 5 114
12 5 112
12 6 115
11 4 114
6 3 112
7 2 91
10 3 91
7 4 89
8 3 86
7 3 83
7 3 83
7 2 82
7 2 82
7 2 83
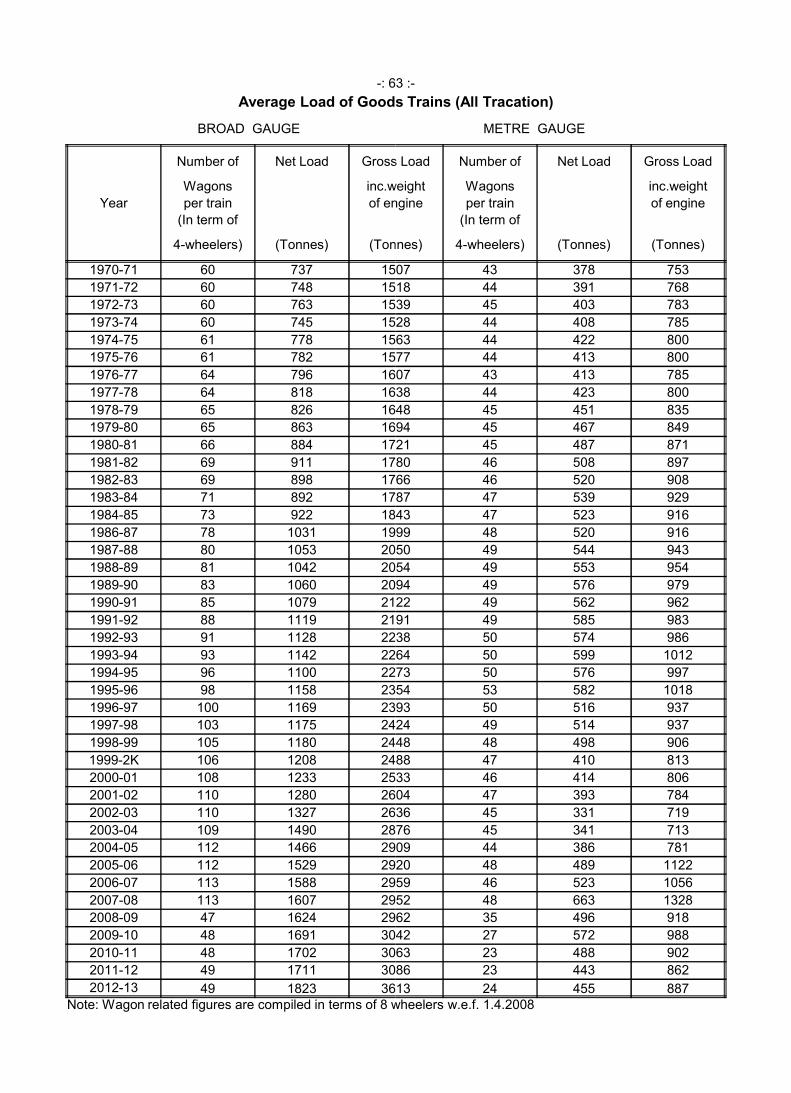
-: 63 :
Average Load of Goods Trains (All
BROAD GAUGE
Number of Net Load Gross Load
Wagons inc.weight
Year per train of engine
(In term of
4-wheelers) (Tonnes) (Tonnes)
1970-71 60 737 1507
1971-72 60 748 1518
1972-73 60 763 1539
1973-74 60 745 1528
1974-75 61 778 1563
1975-76 61 782 1577
1976-77 64 796 1607
1977-78 64 818 1638
1978-79 65 826 1648
1979-80 65 863 1694
1980-81 66 884 1721
1981-82 69 911 1780
1982-83 69 898 1766
1983-84 71 892 1787
1984-85 73 922 1843
1986-87 78 1031 1999
1987-88 80 1053 20501987-88 80 1053 2050
1988-89 81 1042 2054
1989-90 83 1060 2094
1990-91 85 1079 2122
1991-92 88 1119 2191
1992-93 91 1128 2238
1993-94 93 1142 2264
1994-95 96 1100 2273
1995-96 98 1158 2354
1996-97 100 1169 2393
1997-98 103 1175 2424
1998-99 105 1180 2448
1999-2K 106 1208 2488
2000-01 108 1233 2533
2001-02 110 1280 2604
2002-03 110 1327 2636
2003-04 109 1490 2876
2004-05 112 1466 2909
2005-06 112 1529 2920
2006-07 113 1588 2959
2007-08 113 1607 2952
2008-09 47 1624 2962
2009-10 48 1691 3042
2010-11 48 1702 3063
2011-12 49 1711 3086
2012-13 49 1823 3613Note: Wagon related figures are compiled in terms of 8 wheelers
: 63 :-
Average Load of Goods Trains (All Tracation)
METRE GAUGE
Gross Load Number of Net Load Gross Load
inc.weight Wagons inc.weight
of engine per train of engine
(In term of
(Tonnes) 4-wheelers) (Tonnes) (Tonnes)
1507 43 378 753
1518 44 391 768
1539 45 403 783
1528 44 408 785
1563 44 422 800
1577 44 413 800
1607 43 413 785
1638 44 423 800
1648 45 451 835
1694 45 467 849
1721 45 487 871
1780 46 508 897
1766 46 520 908
1787 47 539 929
1843 47 523 916
1999 48 520 916
2050 49 544 9432050 49 544 943
2054 49 553 954
2094 49 576 979
2122 49 562 962
2191 49 585 983
2238 50 574 986
2264 50 599 1012
2273 50 576 997
2354 53 582 1018
2393 50 516 937
2424 49 514 937
2448 48 498 906
2488 47 410 813
2533 46 414 806
2604 47 393 784
2636 45 331 719
2876 45 341 713
2909 44 386 781
2920 48 489 1122
2959 46 523 1056
2952 48 663 1328
2962 35 496 918
3042 27 572 988
3063 23 488 902
3086 23 443 862
3613 24 455 887Note: Wagon related figures are compiled in terms of 8 wheelers w.e.f. 1.4.2008
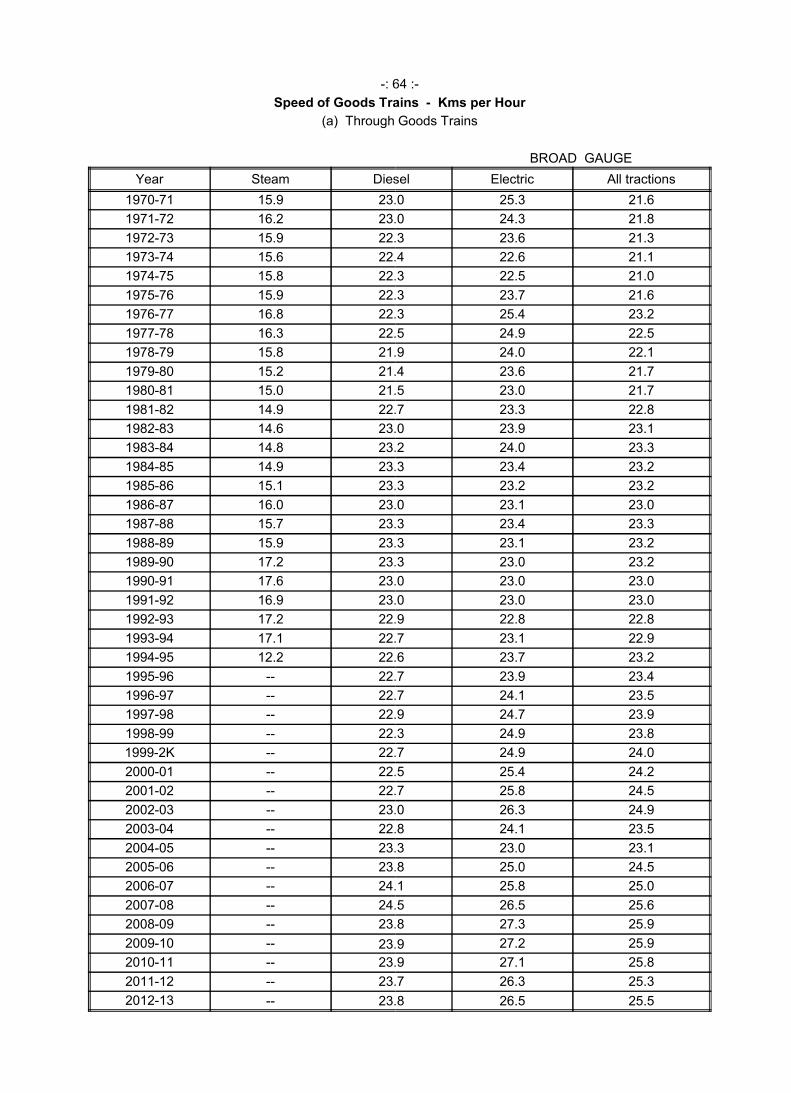
-: 64 :
Speed of Goods Trains
(a) Through Goods Trains
Year Steam Diesel
1970-71 15.9 23.0
1971-72 16.2 23.0
1972-73 15.9 22.3
1973-74 15.6 22.4
1974-75 15.8 22.3
1975-76 15.9 22.3
1976-77 16.8 22.3
1977-78 16.3 22.5
1978-79 15.8 21.9
1979-80 15.2 21.4
1980-81 15.0 21.5
1981-82 14.9 22.7
1982-83 14.6 23.0
1983-84 14.8 23.2
1984-85 14.9 23.3
1985-86 15.1 23.3
1986-87 16.0 23.0
1987-88 15.7 23.3
1988-89 15.9 23.31988-89 15.9 23.3
1989-90 17.2 23.3
1990-91 17.6 23.0
1991-92 16.9 23.0
1992-93 17.2 22.9
1993-94 17.1 22.7
1994-95 12.2 22.6
1995-96 -- 22.7
1996-97 -- 22.7
1997-98 -- 22.9
1998-99 -- 22.3
1999-2K -- 22.7
2000-01 -- 22.5
2001-02 -- 22.7
2002-03 -- 23.0
2003-04 -- 22.8
2004-05 -- 23.3
2005-06 -- 23.8
2006-07 -- 24.1
2007-08 -- 24.5
2008-09 -- 23.8
2009-10 -- 23.9
2010-11 -- 23.9
2011-12 -- 23.7
2012-13 -- 23.8
: 64 :-
Speed of Goods Trains - Kms per Hour
(a) Through Goods Trains
BROAD GAUGE
Diesel Electric All tractions
23.0 25.3 21.6
23.0 24.3 21.8
22.3 23.6 21.3
22.4 22.6 21.1
22.3 22.5 21.0
22.3 23.7 21.6
22.3 25.4 23.2
22.5 24.9 22.5
21.9 24.0 22.1
21.4 23.6 21.7
21.5 23.0 21.7
22.7 23.3 22.8
23.0 23.9 23.1
23.2 24.0 23.3
23.3 23.4 23.2
23.3 23.2 23.2
23.0 23.1 23.0
23.3 23.4 23.3
23.3 23.1 23.223.3 23.1 23.2
23.3 23.0 23.2
23.0 23.0 23.0
23.0 23.0 23.0
22.9 22.8 22.8
22.7 23.1 22.9
22.6 23.7 23.2
22.7 23.9 23.4
22.7 24.1 23.5
22.9 24.7 23.9
22.3 24.9 23.8
22.7 24.9 24.0
22.5 25.4 24.2
22.7 25.8 24.5
23.0 26.3 24.9
22.8 24.1 23.5
23.3 23.0 23.1
23.8 25.0 24.5
24.1 25.8 25.0
24.5 26.5 25.6
23.8 27.3 25.9
23.9 27.2 25.9
23.9 27.1 25.8
23.7 26.3 25.3
23.8 26.5 25.5
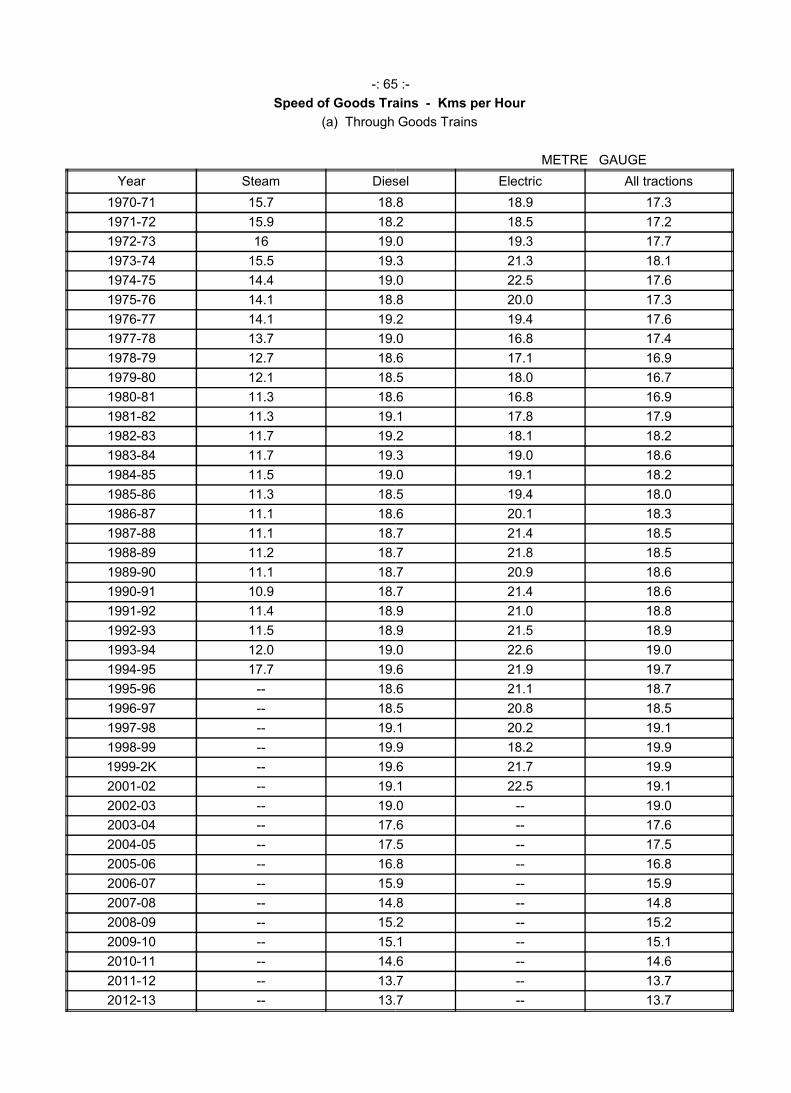
-: 65 :
Speed of Goods Trains
(a) Through Goods Trains
Year Steam Diesel
1970-71 15.7 18.8
1971-72 15.9 18.2
1972-73 16 19.0
1973-74 15.5 19.3
1974-75 14.4 19.0
1975-76 14.1 18.8
1976-77 14.1 19.2
1977-78 13.7 19.0
1978-79 12.7 18.6
1979-80 12.1 18.5
1980-81 11.3 18.6
1981-82 11.3 19.1
1982-83 11.7 19.2
1983-84 11.7 19.3
1984-85 11.5 19.0
1985-86 11.3 18.5
1986-87 11.1 18.6
1987-88 11.1 18.7
1988-89 11.2 18.71988-89 11.2 18.7
1989-90 11.1 18.7
1990-91 10.9 18.7
1991-92 11.4 18.9
1992-93 11.5 18.9
1993-94 12.0 19.0
1994-95 17.7 19.6
1995-96 -- 18.6
1996-97 -- 18.5
1997-98 -- 19.1
1998-99 -- 19.9
1999-2K -- 19.6
2001-02 -- 19.1
2002-03 -- 19.0
2003-04 -- 17.6
2004-05 -- 17.5
2005-06 -- 16.8
2006-07 -- 15.9
2007-08 -- 14.8
2008-09 -- 15.2
2009-10 -- 15.1
2010-11 -- 14.6
2011-12 -- 13.7
2012-13 -- 13.7
: 65 :-
Speed of Goods Trains - Kms per Hour
(a) Through Goods Trains
METRE GAUGE
Diesel Electric All tractions
18.8 18.9 17.3
18.2 18.5 17.2
19.0 19.3 17.7
19.3 21.3 18.1
19.0 22.5 17.6
18.8 20.0 17.3
19.2 19.4 17.6
19.0 16.8 17.4
18.6 17.1 16.9
18.5 18.0 16.7
18.6 16.8 16.9
19.1 17.8 17.9
19.2 18.1 18.2
19.3 19.0 18.6
19.0 19.1 18.2
18.5 19.4 18.0
18.6 20.1 18.3
18.7 21.4 18.5
18.7 21.8 18.518.7 21.8 18.5
18.7 20.9 18.6
18.7 21.4 18.6
18.9 21.0 18.8
18.9 21.5 18.9
19.0 22.6 19.0
19.6 21.9 19.7
18.6 21.1 18.7
18.5 20.8 18.5
19.1 20.2 19.1
19.9 18.2 19.9
19.6 21.7 19.9
19.1 22.5 19.1
19.0 -- 19.0
17.6 -- 17.6
17.5 -- 17.5
16.8 -- 16.8
15.9 -- 15.9
14.8 -- 14.8
15.2 -- 15.2
15.1 -- 15.1
14.6 -- 14.6
13.7 -- 13.7
13.7 -- 13.7
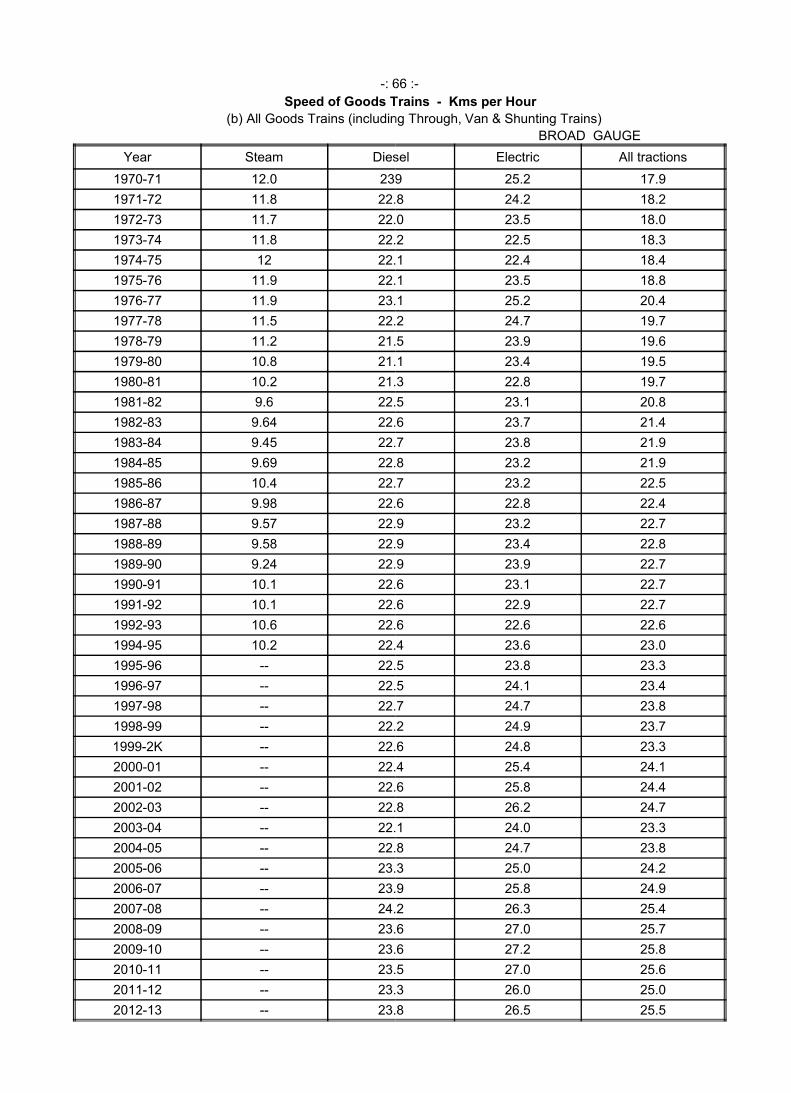
-: 66 :
Speed of Goods Trains
(b) All Goods Trains (including Through, Van & Shunting Trains)
Year Steam Diesel
1970-71 12.0 239
1971-72 11.8 22.8
1972-73 11.7 22.0
1973-74 11.8 22.2
1974-75 12 22.1
1975-76 11.9 22.1
1976-77 11.9 23.1
1977-78 11.5 22.2
1978-79 11.2 21.5
1979-80 10.8 21.1
1980-81 10.2 21.3
1981-82 9.6 22.5
1982-83 9.64 22.6
1983-84 9.45 22.7
1984-85 9.69 22.8
1985-86 10.4 22.7
1986-87 9.98 22.6
1987-88 9.57 22.9
1988-89 9.58 22.91988-89 9.58 22.9
1989-90 9.24 22.9
1990-91 10.1 22.6
1991-92 10.1 22.6
1992-93 10.6 22.6
1994-95 10.2 22.4
1995-96 -- 22.5
1996-97 -- 22.5
1997-98 -- 22.7
1998-99 -- 22.2
1999-2K -- 22.6
2000-01 -- 22.4
2001-02 -- 22.6
2002-03 -- 22.8
2003-04 -- 22.1
2004-05 -- 22.8
2005-06 -- 23.3
2006-07 -- 23.9
2007-08 -- 24.2
2008-09 -- 23.6
2009-10 -- 23.6
2010-11 -- 23.5
2011-12 -- 23.3
2012-13 -- 23.8
: 66 :-
Speed of Goods Trains - Kms per Hour
(b) All Goods Trains (including Through, Van & Shunting Trains)
BROAD GAUGE
Diesel Electric All tractions
239 25.2 17.9
22.8 24.2 18.2
22.0 23.5 18.0
22.2 22.5 18.3
22.1 22.4 18.4
22.1 23.5 18.8
23.1 25.2 20.4
22.2 24.7 19.7
21.5 23.9 19.6
21.1 23.4 19.5
21.3 22.8 19.7
22.5 23.1 20.8
22.6 23.7 21.4
22.7 23.8 21.9
22.8 23.2 21.9
22.7 23.2 22.5
22.6 22.8 22.4
22.9 23.2 22.7
22.9 23.4 22.822.9 23.4 22.8
22.9 23.9 22.7
22.6 23.1 22.7
22.6 22.9 22.7
22.6 22.6 22.6
22.4 23.6 23.0
22.5 23.8 23.3
22.5 24.1 23.4
22.7 24.7 23.8
22.2 24.9 23.7
22.6 24.8 23.3
22.4 25.4 24.1
22.6 25.8 24.4
22.8 26.2 24.7
22.1 24.0 23.3
22.8 24.7 23.8
23.3 25.0 24.2
23.9 25.8 24.9
24.2 26.3 25.4
23.6 27.0 25.7
23.6 27.2 25.8
23.5 27.0 25.6
23.3 26.0 25.0
23.8 26.5 25.5
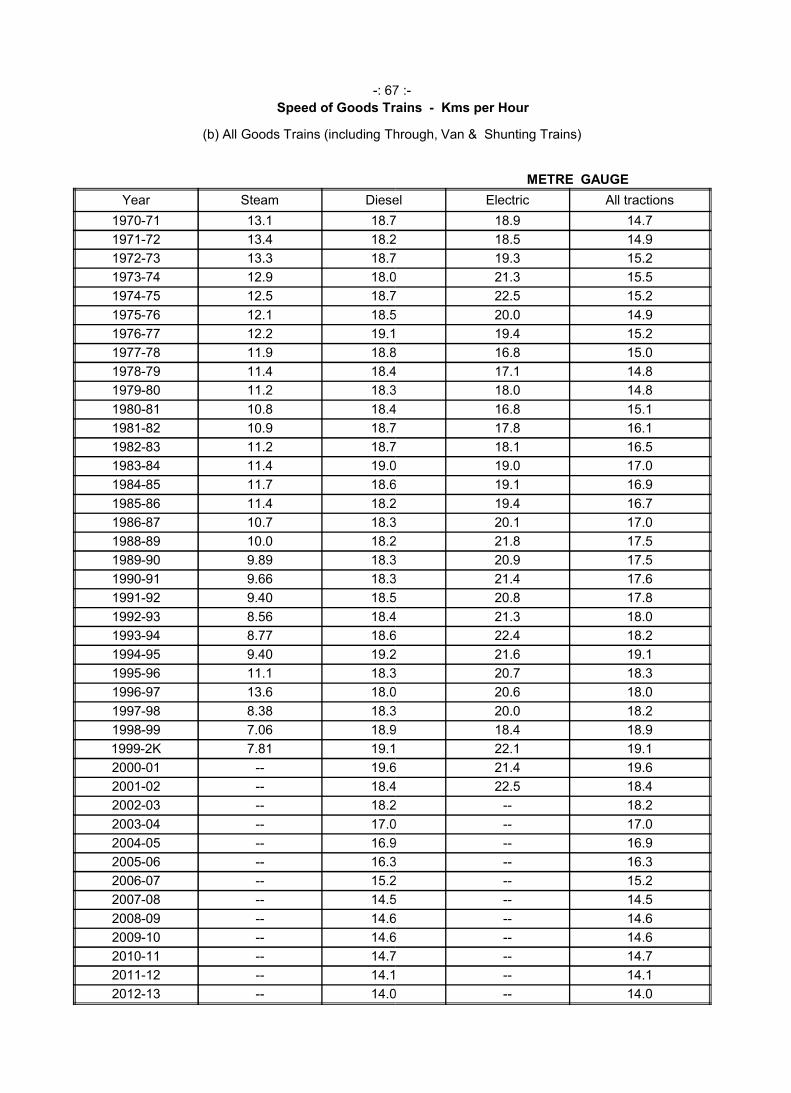
-: 67 :
Speed of Goods Trains
(b) All Goods Trains (including Through, Van & Shunting Trains)
Year Steam Diesel
1970-71 13.1 18.7
1971-72 13.4 18.2
1972-73 13.3 18.7
1973-74 12.9 18.0
1974-75 12.5 18.7
1975-76 12.1 18.5
1976-77 12.2 19.1
1977-78 11.9 18.8
1978-79 11.4 18.4
1979-80 11.2 18.3
1980-81 10.8 18.4
1981-82 10.9 18.7
1982-83 11.2 18.7
1983-84 11.4 19.0
1984-85 11.7 18.6
1985-86 11.4 18.2
1986-87 10.7 18.3
1988-89 10.0 18.21988-89 10.0 18.2
1989-90 9.89 18.3
1990-91 9.66 18.3
1991-92 9.40 18.5
1992-93 8.56 18.4
1993-94 8.77 18.6
1994-95 9.40 19.2
1995-96 11.1 18.3
1996-97 13.6 18.0
1997-98 8.38 18.3
1998-99 7.06 18.9
1999-2K 7.81 19.1
2000-01 -- 19.6
2001-02 -- 18.4
2002-03 -- 18.2
2003-04 -- 17.0
2004-05 -- 16.9
2005-06 -- 16.3
2006-07 -- 15.2
2007-08 -- 14.5
2008-09 -- 14.6
2009-10 -- 14.6
2010-11 -- 14.7
2011-12 -- 14.1
2012-13 -- 14.0
: 67 :-
Speed of Goods Trains - Kms per Hour
(b) All Goods Trains (including Through, Van & Shunting Trains)
METRE GAUGE
Diesel Electric All tractions
18.7 18.9 14.7
18.2 18.5 14.9
18.7 19.3 15.2
18.0 21.3 15.5
18.7 22.5 15.2
18.5 20.0 14.9
19.1 19.4 15.2
18.8 16.8 15.0
18.4 17.1 14.8
18.3 18.0 14.8
18.4 16.8 15.1
18.7 17.8 16.1
18.7 18.1 16.5
19.0 19.0 17.0
18.6 19.1 16.9
18.2 19.4 16.7
18.3 20.1 17.0
18.2 21.8 17.518.2 21.8 17.5
18.3 20.9 17.5
18.3 21.4 17.6
18.5 20.8 17.8
18.4 21.3 18.0
18.6 22.4 18.2
19.2 21.6 19.1
18.3 20.7 18.3
18.0 20.6 18.0
18.3 20.0 18.2
18.9 18.4 18.9
19.1 22.1 19.1
19.6 21.4 19.6
18.4 22.5 18.4
18.2 -- 18.2
17.0 -- 17.0
16.9 -- 16.9
16.3 -- 16.3
15.2 -- 15.2
14.5 -- 14.5
14.6 -- 14.6
14.6 -- 14.6
14.7 -- 14.7
14.1 -- 14.1
14.0 -- 14.0
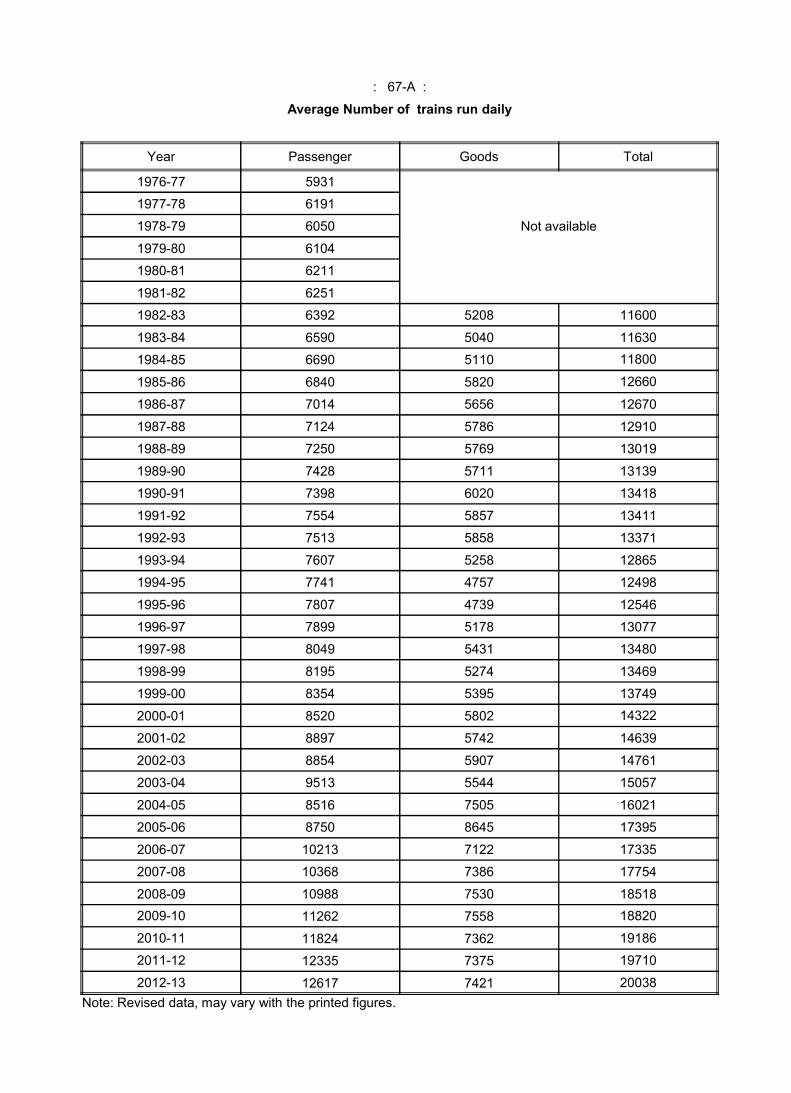
: 67
Average Number of trains run daily
Year Passenger
1976-77 5931
1977-78 6191
1978-79 6050
1979-80 6104
1980-81 6211
1981-82 6251
1982-83 6392
1983-84 6590
1984-85 6690
1985-86 6840
1986-87 7014
1987-88 7124
1988-89 7250
1989-90 7428
1990-91 7398
1991-92 7554
1992-93 7513
1993-94 7607
1994-95 7741
1995-96 7807
1996-97 7899
1997-98 8049
1998-99 8195
1999-00 8354
2000-01 8520
2001-02 8897
2002-03 8854
2003-04 9513
2004-05 8516
2005-06 8750
2006-07 10213
2007-08 10368
2008-09 10988
2009-10 11262
2010-11 11824
2011-12 12335
2012-13 12617
Note: Revised data, may vary with the printed figures.
: 67-A :
Average Number of trains run daily
Goods Total
Not available
5208 11600
5040 11630
5110 11800
5820 12660
5656 12670
5786 12910
5769 13019
5711 13139
6020 13418
5857 13411
5858 13371
5258 12865
4757 12498
4739 12546
5178 13077
5431 13480
5274 13469
5395 13749
5802 14322
5742 14639
5907 14761
5544 15057
7505 16021
8645 17395
7122 17335
7386 17754
7530 18518
7558 18820
7362 19186
7375 19710
7421 20038
Note: Revised data, may vary with the printed figures.
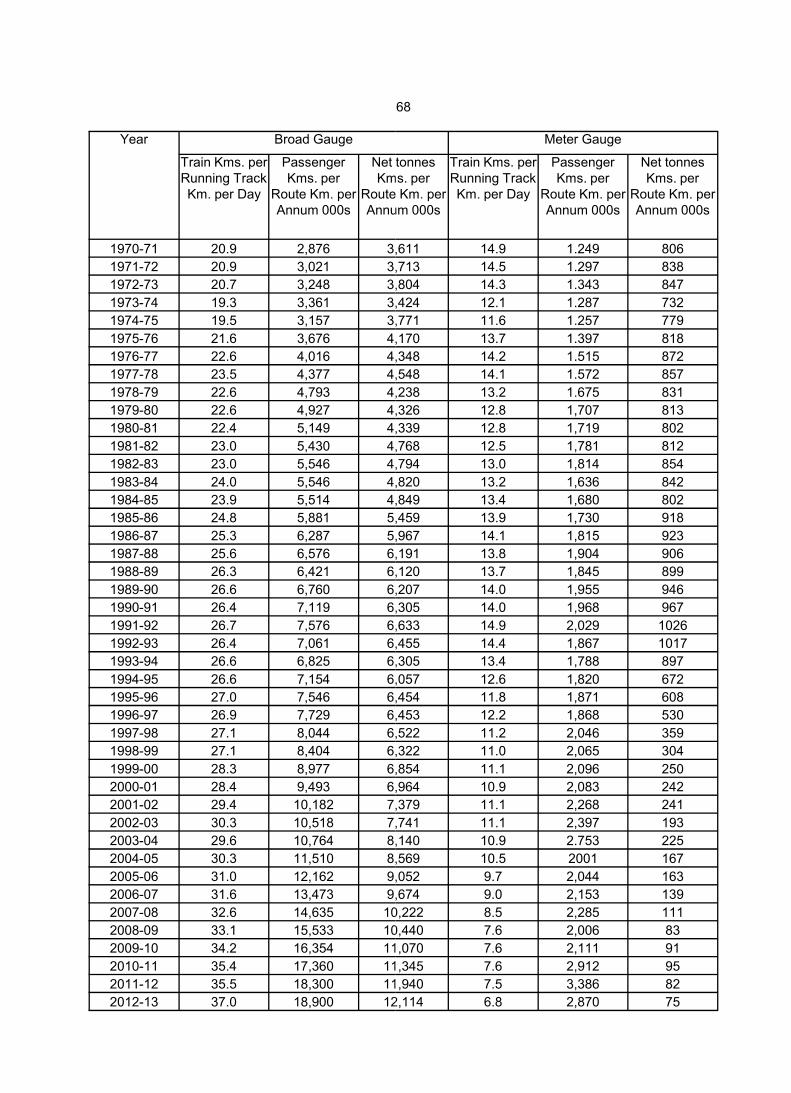
Year Broad Gauge
Train Kms. per Running Track Km. per Day
Passenger Kms. per
Route Km. per Annum 000s
Net tonnes Kms
Route Km. per Annum 000s
1970-71 20.9 2,876 3,611
1971-72 20.9 3,021 3,713
1972-73 20.7 3,248 3,804
1973-74 19.3 3,361 3,424
1974-75 19.5 3,157 3,771
1975-76 21.6 3,676 4,170
1976-77 22.6 4,016 4,348
1977-78 23.5 4,377 4,548
1978-79 22.6 4,793 4,238
1979-80 22.6 4,927 4,326
1980-81 22.4 5,149 4,339
1981-82 23.0 5,430 4,768
1982-83 23.0 5,546 4,794
1983-84 24.0 5,546 4,820
1984-85 23.9 5,514 4,849
1985-86 24.8 5,881 5,459
1986-87 25.3 6,287 5,967
1987-88 25.6 6,576 6,191
1988-89 26.3 6,421 6,120
1989-90 26.6 6,760 6,207
1990-91 26.4 7,119 6,305
1991-92 26.7 7,576 6,633
1992-93 26.4 7,061 6,455
1993-94 26.6 6,825 6,305
1994-95 26.6 7,154 6,057
1995-96 27.0 7,546 6,454
1996-97 26.9 7,729 6,453
1997-98 27.1 8,044 6,522
1998-99 27.1 8,404 6,322
1999-00 28.3 8,977 6,854
2000-01 28.4 9,493 6,964
2001-02 29.4 10,182 7,379
2002-03 30.3 10,518 7,741
2003-04 29.6 10,764 8,140
2004-05 30.3 11,510 8,569
2005-06 31.0 12,162 9,052
2006-07 31.6 13,473 9,674
2007-08 32.6 14,635 10,222
2008-09 33.1 15,533 10,440
2009-10 34.2 16,354 11,070
2010-11 35.4 17,360 11,345
2011-12 35.5 18,300 11,940
2012-13 37.0 18,900 12,114
68
Meter Gauge
Net tonnes Kms. per
Route Km. per Annum 000s
Train Kms. per Running Track Km. per Day
Passenger Kms. per
Route Km. per Annum 000s
Net tonnes Kms. per
Route Km. per Annum 000s
3,611 14.9 1.249 806
3,713 14.5 1.297 838
3,804 14.3 1.343 847
3,424 12.1 1.287 732
3,771 11.6 1.257 779
4,170 13.7 1.397 818
4,348 14.2 1.515 872
4,548 14.1 1.572 857
4,238 13.2 1.675 831
4,326 12.8 1,707 813
4,339 12.8 1,719 802
4,768 12.5 1,781 812
4,794 13.0 1,814 854
4,820 13.2 1,636 842
4,849 13.4 1,680 802
5,459 13.9 1,730 918
5,967 14.1 1,815 923
6,191 13.8 1,904 906
6,120 13.7 1,845 899
6,207 14.0 1,955 946
6,305 14.0 1,968 967
6,633 14.9 2,029 1026
6,455 14.4 1,867 1017
6,305 13.4 1,788 897
6,057 12.6 1,820 672
6,454 11.8 1,871 608
6,453 12.2 1,868 530
6,522 11.2 2,046 359
6,322 11.0 2,065 304
6,854 11.1 2,096 250
6,964 10.9 2,083 242
7,379 11.1 2,268 241
7,741 11.1 2,397 193
8,140 10.9 2.753 225
8,569 10.5 2001 167
9,052 9.7 2,044 163
9,674 9.0 2,153 139
10,222 8.5 2,285 111
10,440 7.6 2,006 83
11,070 7.6 2,111 91
11,345 7.6 2,912 95
11,940 7.5 3,386 82
12,114 6.8 2,870 75
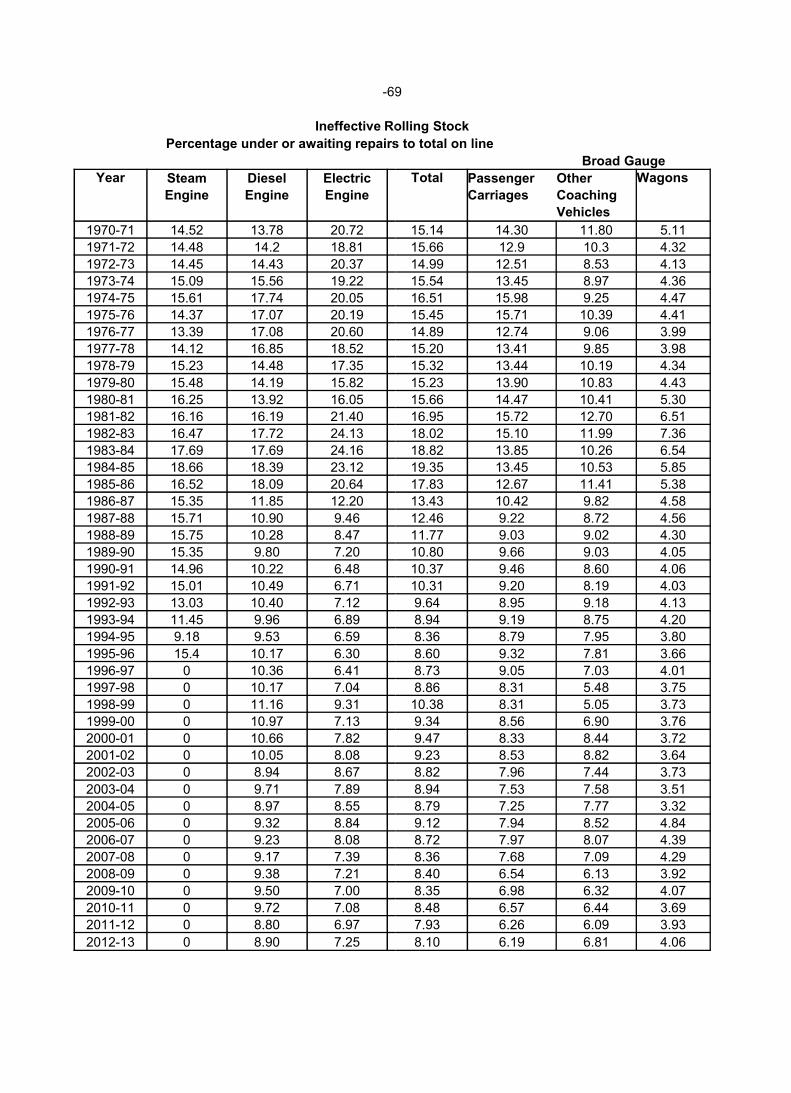
-69
Ineffective Rolling Stock
Percentage under or awaiting repairs to total on line
Year Steam Diesel Electric
Engine Engine Engine
1970-71 14.52 13.78 20.72
1971-72 14.48 14.2 18.81
1972-73 14.45 14.43 20.37
1973-74 15.09 15.56 19.22
1974-75 15.61 17.74 20.05
1975-76 14.37 17.07 20.19
1976-77 13.39 17.08 20.60
1977-78 14.12 16.85 18.52
1978-79 15.23 14.48 17.35
1979-80 15.48 14.19 15.82
1980-81 16.25 13.92 16.05
1981-82 16.16 16.19 21.40
1982-83 16.47 17.72 24.13
1983-84 17.69 17.69 24.16
1984-85 18.66 18.39 23.12
1985-86 16.52 18.09 20.64
1986-87 15.35 11.85 12.20
1987-88 15.71 10.90 9.46
1988-89 15.75 10.28 8.47
1989-90 15.35 9.80 7.201989-90 15.35 9.80 7.20
1990-91 14.96 10.22 6.48
1991-92 15.01 10.49 6.71
1992-93 13.03 10.40 7.12
1993-94 11.45 9.96 6.89
1994-95 9.18 9.53 6.59
1995-96 15.4 10.17 6.30
1996-97 0 10.36 6.41
1997-98 0 10.17 7.04
1998-99 0 11.16 9.31
1999-00 0 10.97 7.13
2000-01 0 10.66 7.82
2001-02 0 10.05 8.08
2002-03 0 8.94 8.67
2003-04 0 9.71 7.89
2004-05 0 8.97 8.55
2005-06 0 9.32 8.84
2006-07 0 9.23 8.08
2007-08 0 9.17 7.39
2008-09 0 9.38 7.21
2009-10 0 9.50 7.00
2010-11 0 9.72 7.08
2011-12 0 8.80 6.97
2012-13 0 8.90 7.25
69
Ineffective Rolling Stock
Percentage under or awaiting repairs to total on line
Broad Gauge
Total Passenger Other Wagons
Carriages Coaching
Vehicles
15.14 14.30 11.80 5.11
15.66 12.9 10.3 4.32
14.99 12.51 8.53 4.13
15.54 13.45 8.97 4.36
16.51 15.98 9.25 4.47
15.45 15.71 10.39 4.41
14.89 12.74 9.06 3.99
15.20 13.41 9.85 3.98
15.32 13.44 10.19 4.34
15.23 13.90 10.83 4.43
15.66 14.47 10.41 5.30
16.95 15.72 12.70 6.51
18.02 15.10 11.99 7.36
18.82 13.85 10.26 6.54
19.35 13.45 10.53 5.85
17.83 12.67 11.41 5.38
13.43 10.42 9.82 4.58
12.46 9.22 8.72 4.56
11.77 9.03 9.02 4.30
10.80 9.66 9.03 4.0510.80 9.66 9.03 4.05
10.37 9.46 8.60 4.06
10.31 9.20 8.19 4.03
9.64 8.95 9.18 4.13
8.94 9.19 8.75 4.20
8.36 8.79 7.95 3.80
8.60 9.32 7.81 3.66
8.73 9.05 7.03 4.01
8.86 8.31 5.48 3.75
10.38 8.31 5.05 3.73
9.34 8.56 6.90 3.76
9.47 8.33 8.44 3.72
9.23 8.53 8.82 3.64
8.82 7.96 7.44 3.73
8.94 7.53 7.58 3.51
8.79 7.25 7.77 3.32
9.12 7.94 8.52 4.84
8.72 7.97 8.07 4.39
8.36 7.68 7.09 4.29
8.40 6.54 6.13 3.92
8.35 6.98 6.32 4.07
8.48 6.57 6.44 3.69
7.93 6.26 6.09 3.93
8.10 6.19 6.81 4.06
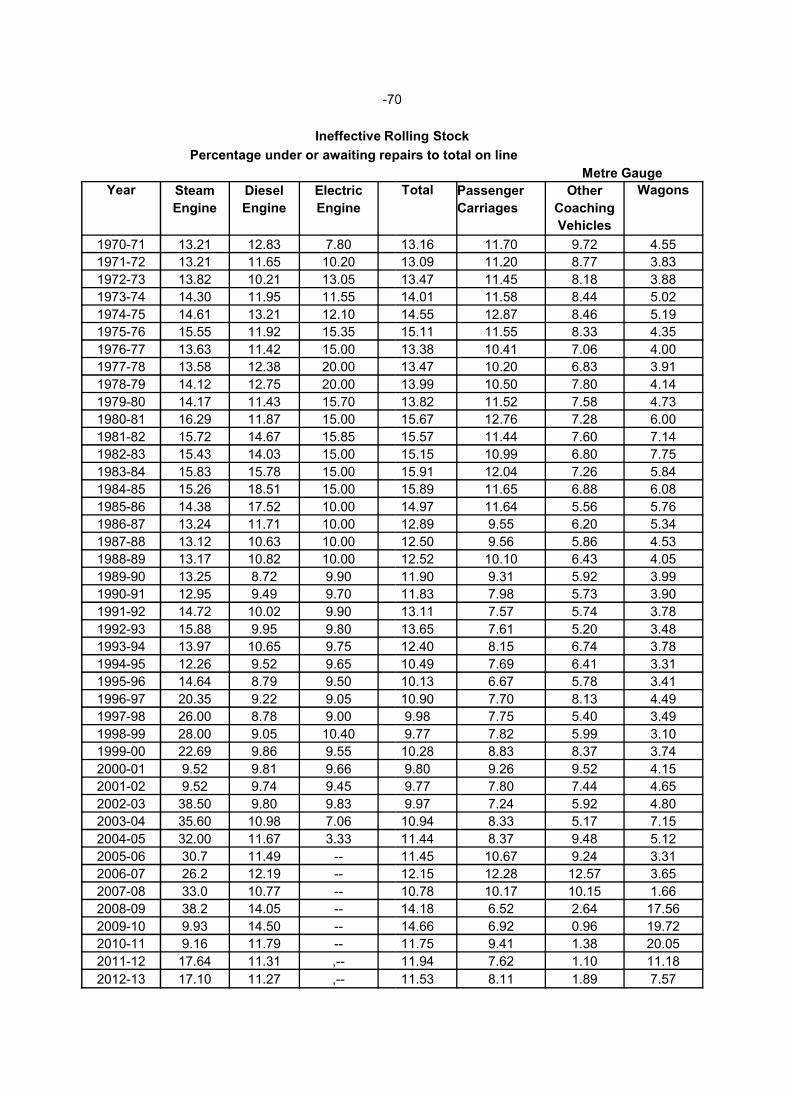
-70
Ineffective Rolling Stock
Percentage under or awaiting repairs to total on line
Year Steam Diesel Electric
Engine Engine Engine
1970-71 13.21 12.83 7.80
1971-72 13.21 11.65 10.20
1972-73 13.82 10.21 13.05
1973-74 14.30 11.95 11.55
1974-75 14.61 13.21 12.10
1975-76 15.55 11.92 15.35
1976-77 13.63 11.42 15.00
1977-78 13.58 12.38 20.00
1978-79 14.12 12.75 20.00
1979-80 14.17 11.43 15.70
1980-81 16.29 11.87 15.00
1981-82 15.72 14.67 15.85
1982-83 15.43 14.03 15.00
1983-84 15.83 15.78 15.00
1984-85 15.26 18.51 15.00
1985-86 14.38 17.52 10.00
1986-87 13.24 11.71 10.00
1987-88 13.12 10.63 10.001987-88 13.12 10.63 10.00
1988-89 13.17 10.82 10.00
1989-90 13.25 8.72 9.90
1990-91 12.95 9.49 9.70
1991-92 14.72 10.02 9.90
1992-93 15.88 9.95 9.80
1993-94 13.97 10.65 9.75
1994-95 12.26 9.52 9.65
1995-96 14.64 8.79 9.50
1996-97 20.35 9.22 9.05
1997-98 26.00 8.78 9.00
1998-99 28.00 9.05 10.40
1999-00 22.69 9.86 9.55
2000-01 9.52 9.81 9.66
2001-02 9.52 9.74 9.45
2002-03 38.50 9.80 9.83
2003-04 35.60 10.98 7.06
2004-05 32.00 11.67 3.33
2005-06 30.7 11.49 --
2006-07 26.2 12.19 --
2007-08 33.0 10.77 --
2008-09 38.2 14.05 --
2009-10 9.93 14.50 --
2010-11 9.16 11.79 --
2011-12 17.64 11.31 ,--
2012-13 17.10 11.27 ,--
70
Ineffective Rolling Stock
Percentage under or awaiting repairs to total on line
Metre Gauge
Total Passenger Other Wagons
Carriages Coaching
Vehicles
13.16 11.70 9.72 4.55
13.09 11.20 8.77 3.83
13.47 11.45 8.18 3.88
14.01 11.58 8.44 5.02
14.55 12.87 8.46 5.19
15.11 11.55 8.33 4.35
13.38 10.41 7.06 4.00
13.47 10.20 6.83 3.91
13.99 10.50 7.80 4.14
13.82 11.52 7.58 4.73
15.67 12.76 7.28 6.00
15.57 11.44 7.60 7.14
15.15 10.99 6.80 7.75
15.91 12.04 7.26 5.84
15.89 11.65 6.88 6.08
14.97 11.64 5.56 5.76
12.89 9.55 6.20 5.34
12.50 9.56 5.86 4.5312.50 9.56 5.86 4.53
12.52 10.10 6.43 4.05
11.90 9.31 5.92 3.99
11.83 7.98 5.73 3.90
13.11 7.57 5.74 3.78
13.65 7.61 5.20 3.48
12.40 8.15 6.74 3.78
10.49 7.69 6.41 3.31
10.13 6.67 5.78 3.41
10.90 7.70 8.13 4.49
9.98 7.75 5.40 3.49
9.77 7.82 5.99 3.10
10.28 8.83 8.37 3.74
9.80 9.26 9.52 4.15
9.77 7.80 7.44 4.65
9.97 7.24 5.92 4.80
10.94 8.33 5.17 7.15
11.44 8.37 9.48 5.12
11.45 10.67 9.24 3.31
12.15 12.28 12.57 3.65
10.78 10.17 10.15 1.66
14.18 6.52 2.64 17.56
14.66 6.92 0.96 19.72
11.75 9.41 1.38 20.05
11.94 7.62 1.10 11.18
11.53 8.11 1.89 7.57
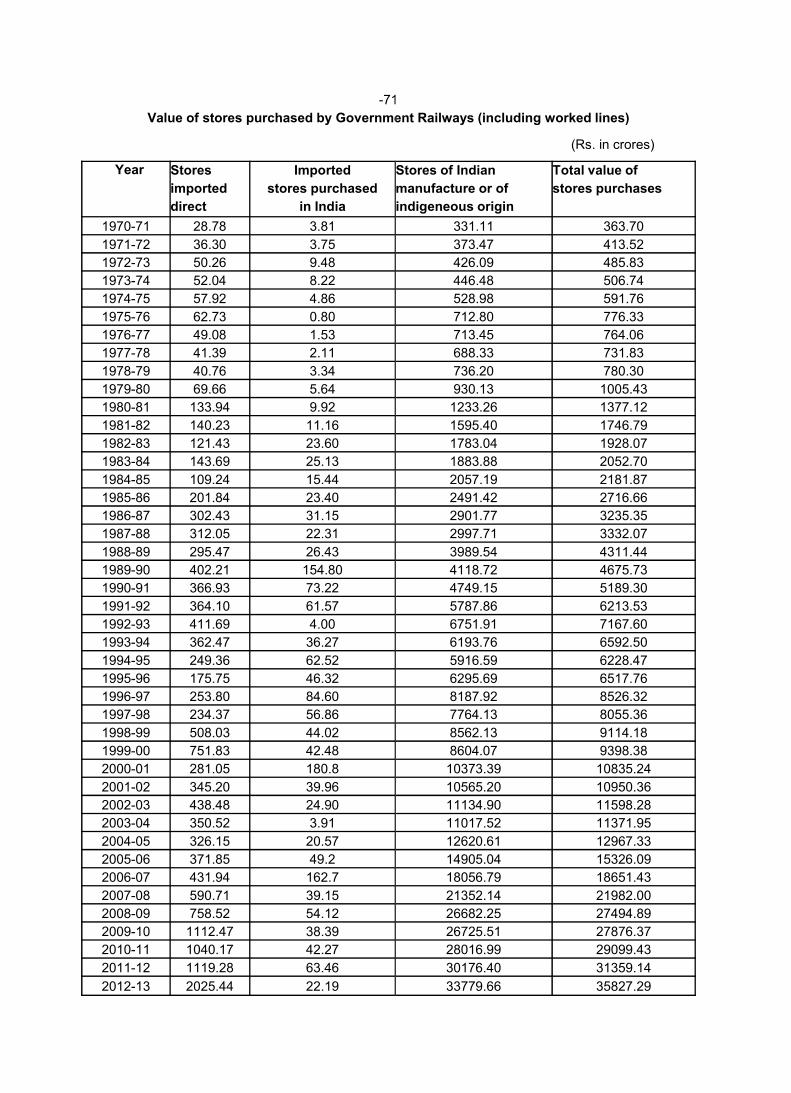
-71
Value of stores purchased by Government Railways (including worked lines)
Year Stores Imported Stores of Indian
imported stores purchased manufacture or of
direct in India indigeneous origin
1970-71 28.78 3.81
1971-72 36.30 3.75
1972-73 50.26 9.48
1973-74 52.04 8.22
1974-75 57.92 4.86
1975-76 62.73 0.80
1976-77 49.08 1.53
1977-78 41.39 2.11
1978-79 40.76 3.34
1979-80 69.66 5.64
1980-81 133.94 9.92
1981-82 140.23 11.16
1982-83 121.43 23.60
1983-84 143.69 25.13
1984-85 109.24 15.44
1985-86 201.84 23.40
1986-87 302.43 31.15
1987-88 312.05 22.31
1988-89 295.47 26.431988-89 295.47 26.43
1989-90 402.21 154.80
1990-91 366.93 73.22
1991-92 364.10 61.57
1992-93 411.69 4.00
1993-94 362.47 36.27
1994-95 249.36 62.52
1995-96 175.75 46.32
1996-97 253.80 84.60
1997-98 234.37 56.86
1998-99 508.03 44.02
1999-00 751.83 42.48
2000-01 281.05 180.8
2001-02 345.20 39.96
2002-03 438.48 24.90
2003-04 350.52 3.91
2004-05 326.15 20.57
2005-06 371.85 49.2
2006-07 431.94 162.7
2007-08 590.71 39.15
2008-09 758.52 54.12
2009-10 1112.47 38.39
2010-11 1040.17 42.27
2011-12 1119.28 63.46
2012-13 2025.44 22.19
71
Value of stores purchased by Government Railways (including worked lines)
(Rs. in crores)
Stores of Indian Total value of
manufacture or of stores purchases
indigeneous origin
331.11 363.70
373.47 413.52
426.09 485.83
446.48 506.74
528.98 591.76
712.80 776.33
713.45 764.06
688.33 731.83
736.20 780.30
930.13 1005.43
1233.26 1377.12
1595.40 1746.79
1783.04 1928.07
1883.88 2052.70
2057.19 2181.87
2491.42 2716.66
2901.77 3235.35
2997.71 3332.07
3989.54 4311.443989.54 4311.44
4118.72 4675.73
4749.15 5189.30
5787.86 6213.53
6751.91 7167.60
6193.76 6592.50
5916.59 6228.47
6295.69 6517.76
8187.92 8526.32
7764.13 8055.36
8562.13 9114.18
8604.07 9398.38
10373.39 10835.24
10565.20 10950.36
11134.90 11598.28
11017.52 11371.95
12620.61 12967.33
14905.04 15326.09
18056.79 18651.43
21352.14 21982.00
26682.25 27494.89
26725.51 27876.37
28016.99 29099.43
30176.40 31359.14
33779.66 35827.29
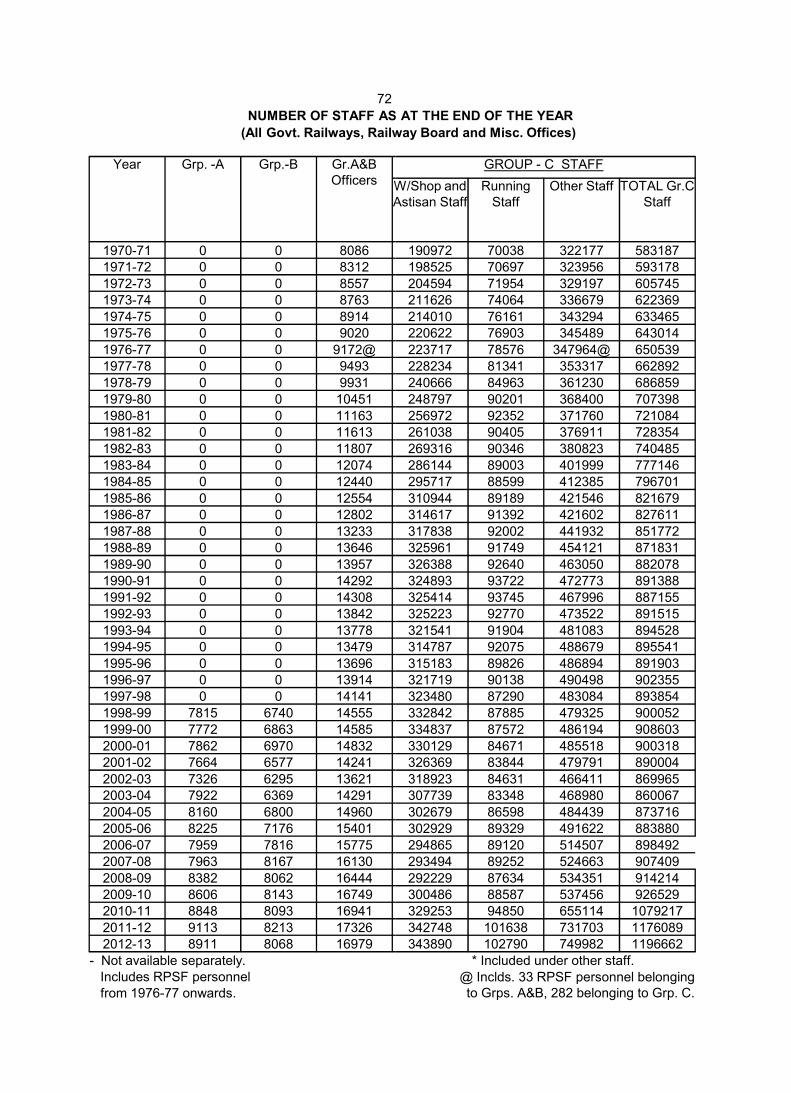
72
NUMBER OF STAFF AS AT THE END OF THE YEAR
(All Govt. Railways, Railway Board and Misc. Offices)
Year Grp. -A Grp.-B Gr.A&BOfficers W/Shop and
Astisan
1970-71 0 0 80861971-72 0 0 8312
1972-73 0 0 85571973-74 0 0 8763
1974-75 0 0 89141975-76 0 0 9020
1976-77 0 0 9172@1977-78 0 0 9493
1978-79 0 0 99311979-80 0 0 10451
1980-81 0 0 111631981-82 0 0 116131982-83 0 0 11807
1983-84 0 0 120741984-85 0 0 12440
1985-86 0 0 125541986-87 0 0 12802
1987-88 0 0 132331988-89 0 0 136461988-89 0 0 13646
1989-90 0 0 139571990-91 0 0 14292
1991-92 0 0 143081992-93 0 0 13842
1993-94 0 0 137781994-95 0 0 13479
1995-96 0 0 136961996-97 0 0 139141997-98 0 0 14141
1998-99 7815 6740 145551999-00 7772 6863 14585
2000-01 7862 6970 148322001-02 7664 6577 14241
2002-03 7326 6295 136212003-04 7922 6369 14291
2004-05 8160 6800 149602005-06 8225 7176 15401
2006-07 7959 7816 157752007-08 7963 8167 16130
2008-09 8382 8062 164442009-10 8606 8143 167492010-11 8848 8093 16941
2011-12 9113 8213 173262012-13 8911 8068 16979
- Not available separately.Includes RPSF personnelfrom 1976-77 onwards.
NUMBER OF STAFF AS AT THE END OF THE YEAR
(All Govt. Railways, Railway Board and Misc. Offices)
GROUP - C STAFF
W/Shop and Astisan Staff
Running Staff
Other Staff TOTAL Gr.CStaff
190972 70038 322177 583187198525 70697 323956 593178
204594 71954 329197 605745211626 74064 336679 622369
214010 76161 343294 633465220622 76903 345489 643014
223717 78576 347964@ 650539228234 81341 353317 662892
240666 84963 361230 686859248797 90201 368400 707398
256972 92352 371760 721084261038 90405 376911 728354269316 90346 380823 740485
286144 89003 401999 777146295717 88599 412385 796701
310944 89189 421546 821679314617 91392 421602 827611
317838 92002 441932 851772325961 91749 454121 871831325961 91749 454121 871831
326388 92640 463050 882078324893 93722 472773 891388
325414 93745 467996 887155325223 92770 473522 891515
321541 91904 481083 894528314787 92075 488679 895541
315183 89826 486894 891903321719 90138 490498 902355323480 87290 483084 893854
332842 87885 479325 900052334837 87572 486194 908603
330129 84671 485518 900318326369 83844 479791 890004
318923 84631 466411 869965307739 83348 468980 860067
302679 86598 484439 873716302929 89329 491622 883880
294865 89120 514507 898492293494 89252 524663 907409
292229 87634 534351 914214300486 88587 537456 926529329253 94850 655114 1079217
342748 101638 731703 1176089343890 102790 749982 1196662
* Included under other staff.@ Inclds. 33 RPSF personnel belonging to Grps. A&B, 282 belonging to Grp. C.
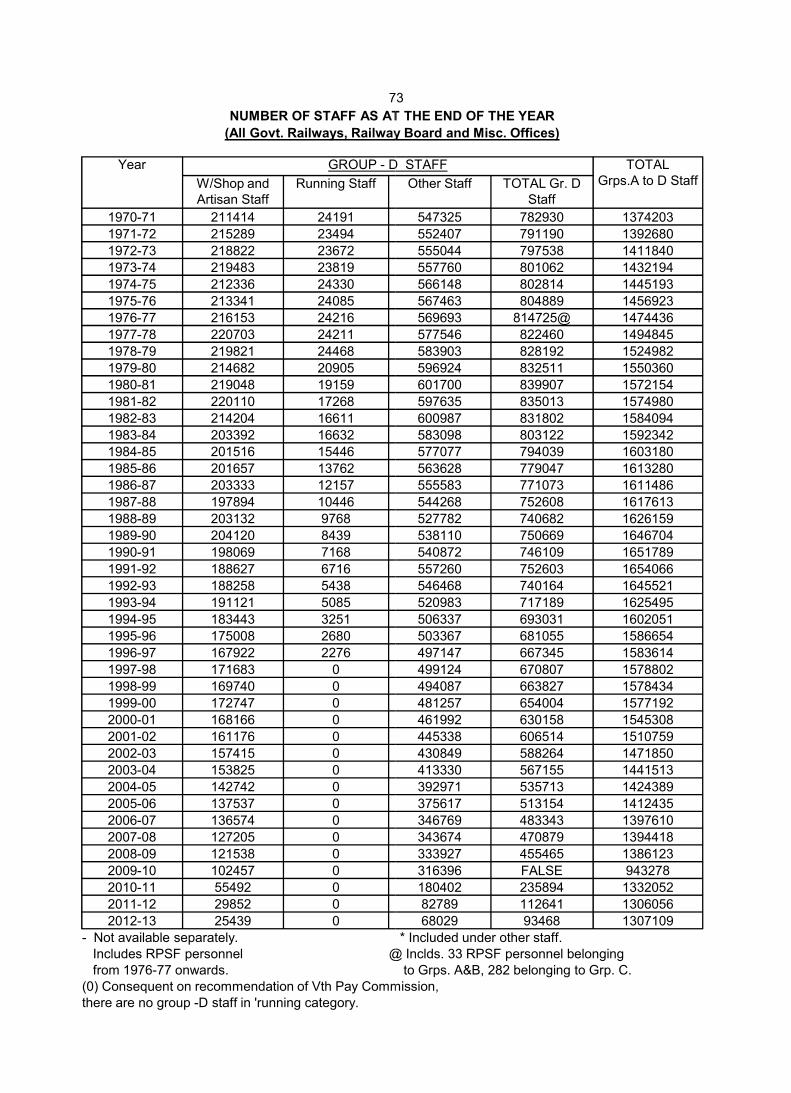
73
NUMBER OF STAFF AS AT THE END OF THE YEAR
(All Govt. Railways, Railway Board and Misc. Offices)
Year GROUP - D STAFF
W/Shop and Artisan Staff
Running Staff
1970-71 211414 24191
1971-72 215289 23494
1972-73 218822 23672
1973-74 219483 23819
1974-75 212336 24330
1975-76 213341 24085
1976-77 216153 24216
1977-78 220703 24211
1978-79 219821 24468
1979-80 214682 20905
1980-81 219048 19159
1981-82 220110 17268
1982-83 214204 16611
1983-84 203392 16632
1984-85 201516 15446
1985-86 201657 13762
1986-87 203333 12157
1987-88 197894 10446
1988-89 203132 9768
1989-90 204120 8439
1990-91 198069 71681990-91 198069 7168
1991-92 188627 6716
1992-93 188258 5438
1993-94 191121 5085
1994-95 183443 3251
1995-96 175008 2680
1996-97 167922 2276
1997-98 171683 0
1998-99 169740 0
1999-00 172747 0
2000-01 168166 0
2001-02 161176 0
2002-03 157415 0
2003-04 153825 0
2004-05 142742 0
2005-06 137537 0
2006-07 136574 0
2007-08 127205 0
2008-09 121538 0
2009-10 102457 0
2010-11 55492 0
2011-12 29852 0
2012-13 25439 0
- Not available separately.Includes RPSF personnel @ Inclds. 33 RPSF personnel belonging from 1976-77 onwards.
(0) Consequent on recommendation of Vth Pay Commission,there are no group -D staff in 'running category.
73
NUMBER OF STAFF AS AT THE END OF THE YEAR
(All Govt. Railways, Railway Board and Misc. Offices)
D STAFF TOTAL Grps.A to D StaffOther Staff TOTAL Gr. D
Staff
547325 782930 1374203
552407 791190 1392680
555044 797538 1411840
557760 801062 1432194
566148 802814 1445193
567463 804889 1456923
569693 814725@ 1474436
577546 822460 1494845
583903 828192 1524982
596924 832511 1550360
601700 839907 1572154
597635 835013 1574980
600987 831802 1584094
583098 803122 1592342
577077 794039 1603180
563628 779047 1613280
555583 771073 1611486
544268 752608 1617613
527782 740682 1626159
538110 750669 1646704
540872 746109 1651789540872 746109 1651789
557260 752603 1654066
546468 740164 1645521
520983 717189 1625495
506337 693031 1602051
503367 681055 1586654
497147 667345 1583614
499124 670807 1578802
494087 663827 1578434
481257 654004 1577192
461992 630158 1545308
445338 606514 1510759
430849 588264 1471850
413330 567155 1441513
392971 535713 1424389
375617 513154 1412435
346769 483343 1397610
343674 470879 1394418
333927 455465 1386123
316396 FALSE 943278
180402 235894 1332052
82789 112641 1306056
68029 93468 1307109
* Included under other staff.@ Inclds. 33 RPSF personnel belonging
to Grps. A&B, 282 belonging to Grp. C.(0) Consequent on recommendation of Vth Pay Commission,
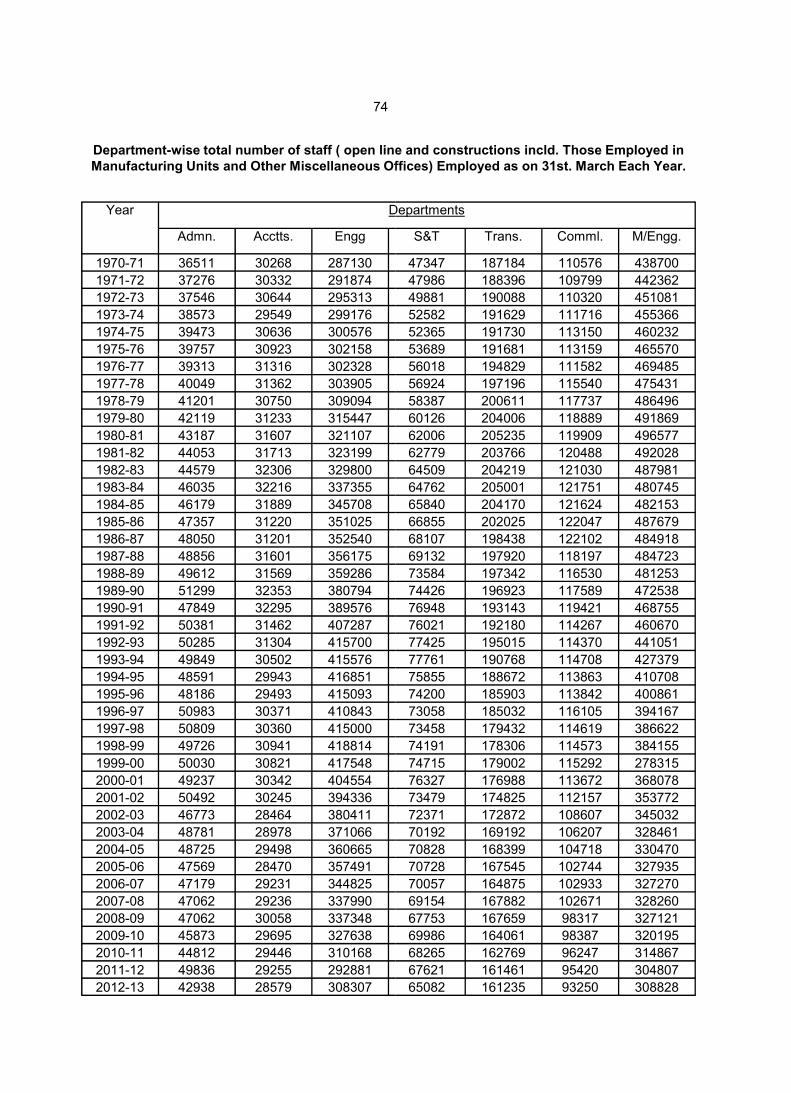
74
Department-wise total number of staff ( open line and constructions incld. Those Employed in Manufacturing Units and Other Miscellaneous Offices) Employed as on 31st. March Each Year.
Year Departments
Admn. Acctts. Engg
1970-71 36511 30268 287130
1971-72 37276 30332 291874
1972-73 37546 30644 295313
1973-74 38573 29549 299176
1974-75 39473 30636 300576
1975-76 39757 30923 302158
1976-77 39313 31316 302328
1977-78 40049 31362 303905
1978-79 41201 30750 309094
1979-80 42119 31233 315447
1980-81 43187 31607 321107
1981-82 44053 31713 323199
1982-83 44579 32306 329800
1983-84 46035 32216 337355
1984-85 46179 31889 345708
1985-86 47357 31220 351025
1986-87 48050 31201 352540
1987-88 48856 31601 356175
1988-89 49612 31569 359286
1989-90 51299 32353 380794
1990-91 47849 32295 389576
1991-92 50381 31462 407287
1992-93 50285 31304 415700
1993-94 49849 30502 415576
1994-95 48591 29943 416851
1995-96 48186 29493 415093
1996-97 50983 30371 410843
1997-98 50809 30360 415000
1998-99 49726 30941 418814
1999-00 50030 30821 417548
2000-01 49237 30342 404554
2001-02 50492 30245 394336
2002-03 46773 28464 380411
2003-04 48781 28978 371066
2004-05 48725 29498 360665
2005-06 47569 28470 357491
2006-07 47179 29231 344825
2007-08 47062 29236 337990
2008-09 47062 30058 337348
2009-10 45873 29695 327638
2010-11 44812 29446 310168
2011-12 49836 29255 292881
2012-13 42938 28579 308307
wise total number of staff ( open line and constructions incld. Those Employed in Manufacturing Units and Other Miscellaneous Offices) Employed as on 31st. March Each Year.
Departments
S&T Trans. Comml. M/Engg.
47347 187184 110576 438700
47986 188396 109799 442362
49881 190088 110320 451081
52582 191629 111716 455366
52365 191730 113150 460232
53689 191681 113159 465570
56018 194829 111582 469485
56924 197196 115540 475431
58387 200611 117737 486496
60126 204006 118889 491869
62006 205235 119909 496577
62779 203766 120488 492028
64509 204219 121030 487981
64762 205001 121751 480745
65840 204170 121624 482153
66855 202025 122047 487679
68107 198438 122102 484918
69132 197920 118197 484723
73584 197342 116530 481253
74426 196923 117589 472538
76948 193143 119421 468755
76021 192180 114267 460670
77425 195015 114370 441051
77761 190768 114708 427379
75855 188672 113863 410708
74200 185903 113842 400861
73058 185032 116105 394167
73458 179432 114619 386622
74191 178306 114573 384155
74715 179002 115292 278315
76327 176988 113672 368078
73479 174825 112157 353772
72371 172872 108607 345032
70192 169192 106207 328461
70828 168399 104718 330470
70728 167545 102744 327935
70057 164875 102933 327270
69154 167882 102671 328260
67753 167659 98317 327121
69986 164061 98387 320195
68265 162769 96247 314867
67621 161461 95420 304807
65082 161235 93250 308828
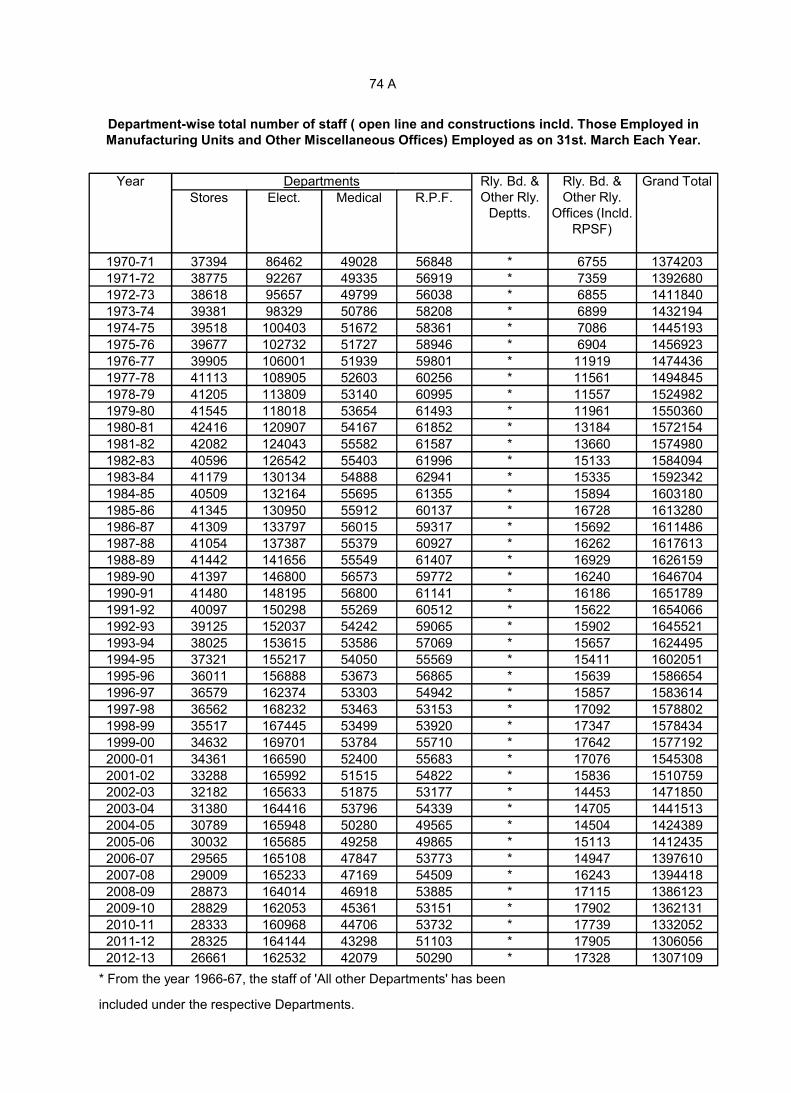
74 A
Department-wise total number of staff ( open line and constructions incld. Those Employed in Manufacturing Units and Other Miscellaneous Offices) Employed as on 31st. March Each Year.
Year DepartmentsStores Elect. Medical
1970-71 37394 86462 49028
1971-72 38775 92267 493351972-73 38618 95657 49799
1973-74 39381 98329 50786
1974-75 39518 100403 51672
1975-76 39677 102732 51727
1976-77 39905 106001 51939
1977-78 41113 108905 52603
1978-79 41205 113809 53140
1979-80 41545 118018 536541980-81 42416 120907 54167
1981-82 42082 124043 55582
1982-83 40596 126542 55403
1983-84 41179 130134 54888
1984-85 40509 132164 55695
1985-86 41345 130950 55912
1986-87 41309 133797 560151987-88 41054 137387 553791987-88 41054 137387 55379
1988-89 41442 141656 55549
1989-90 41397 146800 56573
1990-91 41480 148195 56800
1991-92 40097 150298 55269
1992-93 39125 152037 54242
1993-94 38025 153615 535861994-95 37321 155217 54050
1995-96 36011 156888 53673
1996-97 36579 162374 53303
1997-98 36562 168232 53463
1998-99 35517 167445 53499
1999-00 34632 169701 53784
2000-01 34361 166590 52400
2001-02 33288 165992 515152002-03 32182 165633 51875
2003-04 31380 164416 53796
2004-05 30789 165948 50280
2005-06 30032 165685 49258
2006-07 29565 165108 47847
2007-08 29009 165233 47169
2008-09 28873 164014 469182009-10 28829 162053 45361
2010-11 28333 160968 44706
2011-12 28325 164144 43298
2012-13 26661 162532 42079
* From the year 1966-67, the staff of 'All other Departments' has been
included under the respective Departments.
74 A
wise total number of staff ( open line and constructions incld. Those Employed in Manufacturing Units and Other Miscellaneous Offices) Employed as on 31st. March Each Year.
Rly. Bd. & Other Rly.
Deptts.
Rly. Bd. & Other Rly.
Offices (Incld. RPSF)
Grand TotalR.P.F.
56848 * 6755 1374203
56919 * 7359 139268056038 * 6855 1411840
58208 * 6899 1432194
58361 * 7086 1445193
58946 * 6904 1456923
59801 * 11919 1474436
60256 * 11561 1494845
60995 * 11557 1524982
61493 * 11961 155036061852 * 13184 1572154
61587 * 13660 1574980
61996 * 15133 1584094
62941 * 15335 1592342
61355 * 15894 1603180
60137 * 16728 1613280
59317 * 15692 161148660927 * 16262 161761360927 * 16262 1617613
61407 * 16929 1626159
59772 * 16240 1646704
61141 * 16186 1651789
60512 * 15622 1654066
59065 * 15902 1645521
57069 * 15657 162449555569 * 15411 1602051
56865 * 15639 1586654
54942 * 15857 1583614
53153 * 17092 1578802
53920 * 17347 1578434
55710 * 17642 1577192
55683 * 17076 1545308
54822 * 15836 151075953177 * 14453 1471850
54339 * 14705 1441513
49565 * 14504 1424389
49865 * 15113 1412435
53773 * 14947 1397610
54509 * 16243 1394418
53885 * 17115 138612353151 * 17902 1362131
53732 * 17739 1332052
51103 * 17905 1306056
50290 * 17328 1307109
67, the staff of 'All other Departments' has been
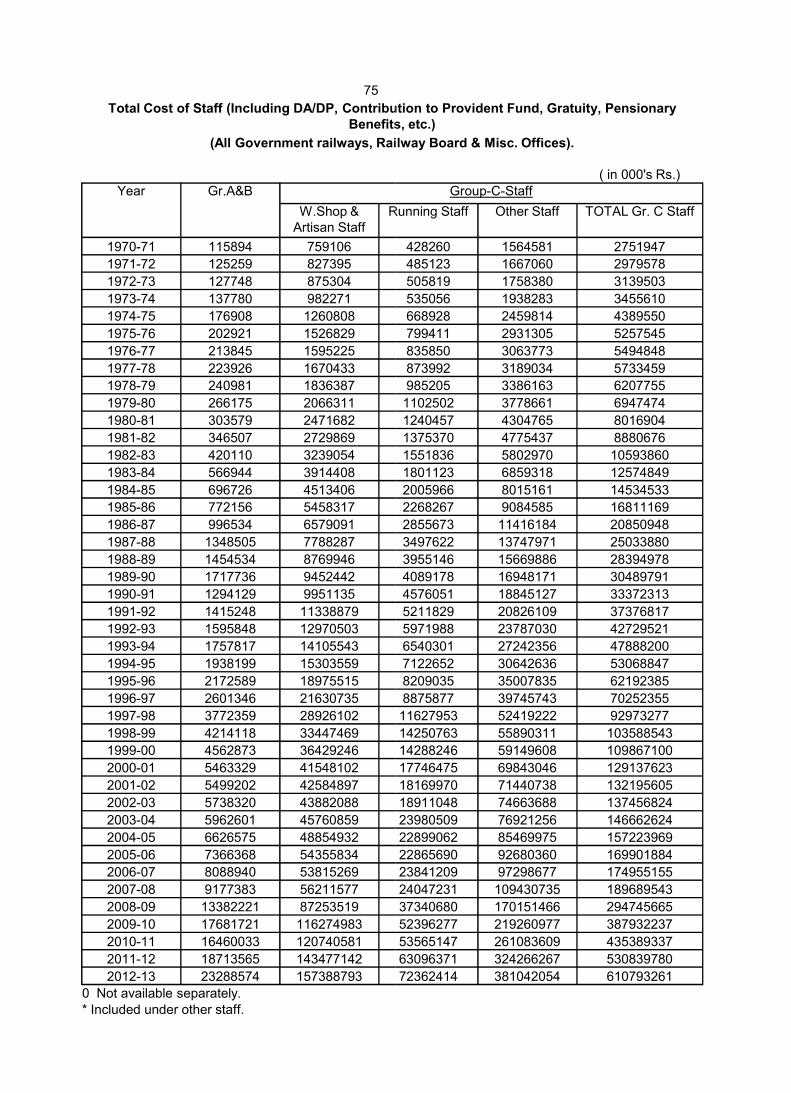
75
Total Cost of Staff (Including DA/DP, Contribution to Provident Fund, Gratuity, Pensionary Benefits, etc.)
(All Government railways, Railway Board & Misc. Offices).
Year Gr.A&B
W.Shop & Artisan Staff
Running Staff
1970-71 115894 759106
1971-72 125259 827395
1972-73 127748 875304
1973-74 137780 982271
1974-75 176908 1260808
1975-76 202921 1526829
1976-77 213845 1595225
1977-78 223926 1670433
1978-79 240981 1836387
1979-80 266175 2066311
1980-81 303579 2471682
1981-82 346507 2729869
1982-83 420110 3239054
1983-84 566944 3914408
1984-85 696726 4513406
1985-86 772156 5458317
1986-87 996534 6579091
1987-88 1348505 77882871987-88 1348505 7788287
1988-89 1454534 8769946
1989-90 1717736 9452442
1990-91 1294129 9951135
1991-92 1415248 11338879
1992-93 1595848 12970503
1993-94 1757817 14105543
1994-95 1938199 15303559
1995-96 2172589 18975515
1996-97 2601346 21630735
1997-98 3772359 28926102
1998-99 4214118 33447469
1999-00 4562873 36429246
2000-01 5463329 41548102
2001-02 5499202 42584897
2002-03 5738320 43882088
2003-04 5962601 45760859
2004-05 6626575 48854932
2005-06 7366368 54355834
2006-07 8088940 53815269
2007-08 9177383 56211577
2008-09 13382221 87253519
2009-10 17681721 116274983
2010-11 16460033 120740581
2011-12 18713565 143477142
2012-13 23288574 157388793
0 Not available separately.* Included under other staff.
Total Cost of Staff (Including DA/DP, Contribution to Provident Fund, Gratuity, Pensionary Benefits, etc.)
(All Government railways, Railway Board & Misc. Offices).
( in 000's Rs.)Group-C-Staff
Running Staff Other Staff TOTAL Gr. C Staff
428260 1564581 2751947
485123 1667060 2979578
505819 1758380 3139503
535056 1938283 3455610
668928 2459814 4389550
799411 2931305 5257545
835850 3063773 5494848
873992 3189034 5733459
985205 3386163 6207755
1102502 3778661 6947474
1240457 4304765 8016904
1375370 4775437 8880676
1551836 5802970 10593860
1801123 6859318 12574849
2005966 8015161 14534533
2268267 9084585 16811169
2855673 11416184 20850948
3497622 13747971 250338803497622 13747971 25033880
3955146 15669886 28394978
4089178 16948171 30489791
4576051 18845127 33372313
5211829 20826109 37376817
5971988 23787030 42729521
6540301 27242356 47888200
7122652 30642636 53068847
8209035 35007835 62192385
8875877 39745743 70252355
11627953 52419222 92973277
14250763 55890311 103588543
14288246 59149608 109867100
17746475 69843046 129137623
18169970 71440738 132195605
18911048 74663688 137456824
23980509 76921256 146662624
22899062 85469975 157223969
22865690 92680360 169901884
23841209 97298677 174955155
24047231 109430735 189689543
37340680 170151466 294745665
52396277 219260977 387932237
53565147 261083609 435389337
63096371 324266267 530839780
72362414 381042054 610793261
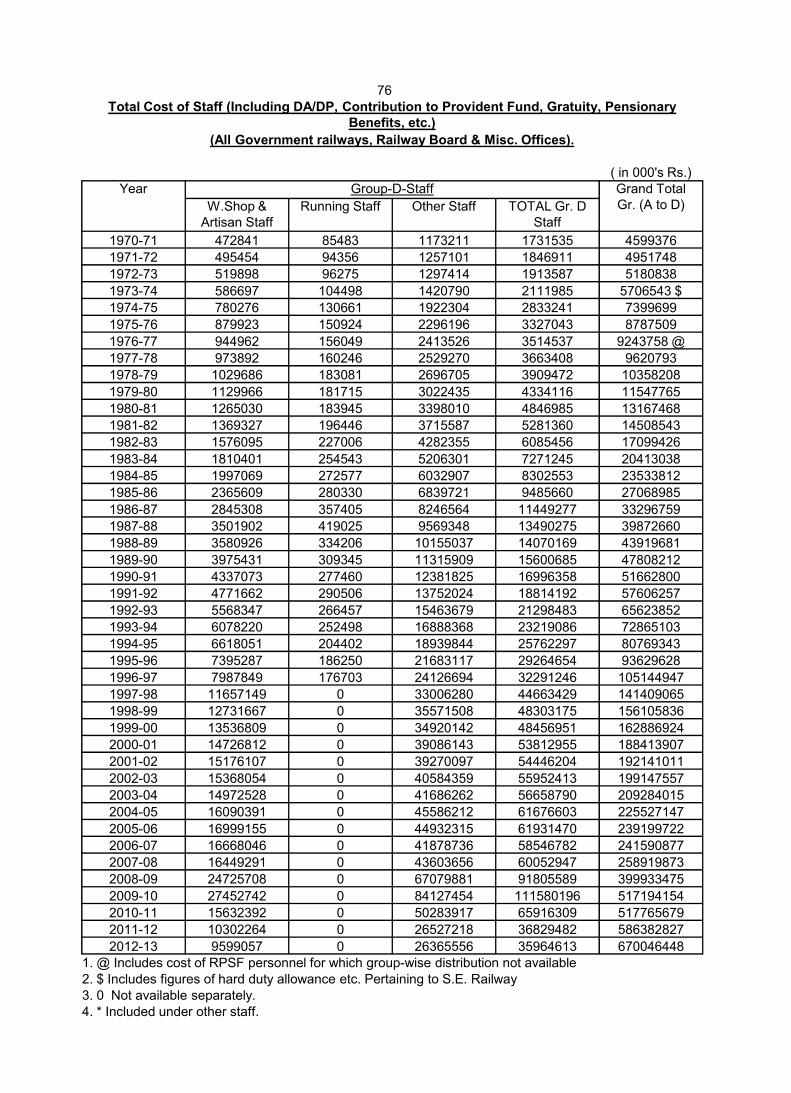
76Total Cost of Staff (Including DA/DP, Contribution to Provident Fund, Gratuity, Pensionary
Benefits, etc.)
(All Government railways, Railway Board & Misc. Offices).
Year Group-D
W.Shop & Artisan Staff
Running Staff
1970-71 472841 85483
1971-72 495454 94356
1972-73 519898 96275
1973-74 586697 104498
1974-75 780276 130661
1975-76 879923 150924
1976-77 944962 156049
1977-78 973892 160246
1978-79 1029686 183081
1979-80 1129966 181715
1980-81 1265030 183945
1981-82 1369327 196446
1982-83 1576095 227006
1983-84 1810401 254543
1984-85 1997069 272577
1985-86 2365609 280330
1986-87 2845308 357405
1987-88 3501902 419025
1988-89 3580926 3342061988-89 3580926 334206
1989-90 3975431 309345
1990-91 4337073 277460
1991-92 4771662 290506
1992-93 5568347 266457
1993-94 6078220 252498
1994-95 6618051 204402
1995-96 7395287 186250
1996-97 7987849 176703
1997-98 11657149 0
1998-99 12731667 0
1999-00 13536809 0
2000-01 14726812 0
2001-02 15176107 0
2002-03 15368054 0
2003-04 14972528 0
2004-05 16090391 0
2005-06 16999155 0
2006-07 16668046 0
2007-08 16449291 0
2008-09 24725708 0
2009-10 27452742 0
2010-11 15632392 0
2011-12 10302264 0
2012-13 9599057 01. @ Includes cost of RPSF personnel for which group2. $ Includes figures of hard duty allowance etc. Pertaining to S.E. Railway3. 0 Not available separately.4. * Included under other staff.
Total Cost of Staff (Including DA/DP, Contribution to Provident Fund, Gratuity, Pensionary Benefits, etc.)
(All Government railways, Railway Board & Misc. Offices).
( in 000's Rs.)D-Staff Grand Total
Gr. (A to D)Other Staff TOTAL Gr. D Staff
1173211 1731535 4599376
1257101 1846911 4951748
1297414 1913587 5180838
1420790 2111985 5706543 $
1922304 2833241 7399699
2296196 3327043 8787509
2413526 3514537 9243758 @
2529270 3663408 9620793
2696705 3909472 10358208
3022435 4334116 11547765
3398010 4846985 13167468
3715587 5281360 14508543
4282355 6085456 17099426
5206301 7271245 20413038
6032907 8302553 23533812
6839721 9485660 27068985
8246564 11449277 33296759
9569348 13490275 39872660
10155037 14070169 4391968110155037 14070169 43919681
11315909 15600685 47808212
12381825 16996358 51662800
13752024 18814192 57606257
15463679 21298483 65623852
16888368 23219086 72865103
18939844 25762297 80769343
21683117 29264654 93629628
24126694 32291246 105144947
33006280 44663429 141409065
35571508 48303175 156105836
34920142 48456951 162886924
39086143 53812955 188413907
39270097 54446204 192141011
40584359 55952413 199147557
41686262 56658790 209284015
45586212 61676603 225527147
44932315 61931470 239199722
41878736 58546782 241590877
43603656 60052947 258919873
67079881 91805589 399933475
84127454 111580196 517194154
50283917 65916309 517765679
26527218 36829482 586382827
26365556 35964613 6700464481. @ Includes cost of RPSF personnel for which group-wise distribution not available2. $ Includes figures of hard duty allowance etc. Pertaining to S.E. Railway
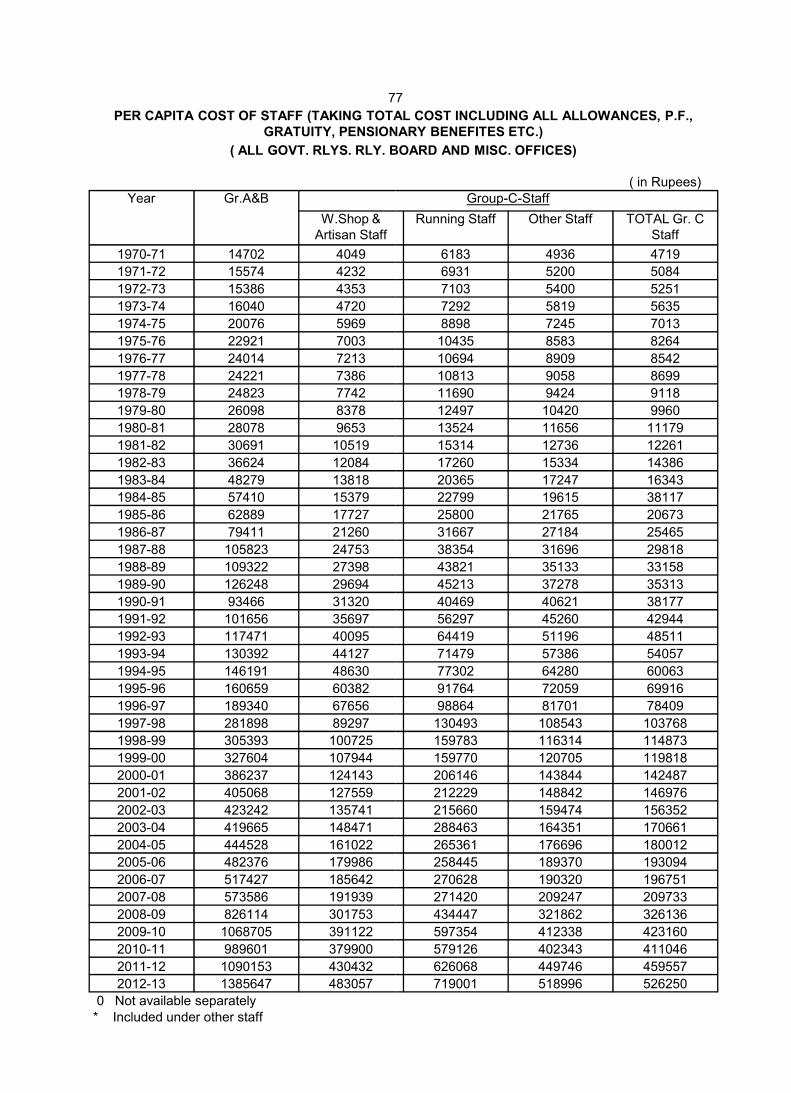
77
PER CAPITA COST OF STAFF (TAKING TOTAL COST INCLUDING ALL ALLOWANCES, P.F., GRATUITY, PENSIONARY BENEFITES ETC.)
( ALL GOVT. RLYS. RLY. BOARD AND MISC. OFFICES)
Year Gr.A&B
W.Shop & Artisan Staff
1970-71 14702 4049
1971-72 15574 4232
1972-73 15386 4353
1973-74 16040 4720
1974-75 20076 5969
1975-76 22921 7003
1976-77 24014 7213
1977-78 24221 7386
1978-79 24823 7742
1979-80 26098 8378
1980-81 28078 9653
1981-82 30691 10519
1982-83 36624 12084
1983-84 48279 13818
1984-85 57410 15379
1985-86 62889 17727
1986-87 79411 21260
1987-88 105823 247531987-88 105823 24753
1988-89 109322 27398
1989-90 126248 29694
1990-91 93466 31320
1991-92 101656 35697
1992-93 117471 40095
1993-94 130392 44127
1994-95 146191 48630
1995-96 160659 60382
1996-97 189340 67656
1997-98 281898 89297
1998-99 305393 100725
1999-00 327604 107944
2000-01 386237 124143
2001-02 405068 127559
2002-03 423242 135741
2003-04 419665 148471
2004-05 444528 161022
2005-06 482376 179986
2006-07 517427 185642
2007-08 573586 191939
2008-09 826114 301753
2009-10 1068705 391122
2010-11 989601 379900
2011-12 1090153 430432
2012-13 1385647 483057
0 Not available separately* Included under other staff
77
PER CAPITA COST OF STAFF (TAKING TOTAL COST INCLUDING ALL ALLOWANCES, P.F., GRATUITY, PENSIONARY BENEFITES ETC.)
( ALL GOVT. RLYS. RLY. BOARD AND MISC. OFFICES)
( in Rupees)Group-C-Staff
Running Staff Other Staff TOTAL Gr. C Staff
6183 4936 4719
6931 5200 5084
7103 5400 5251
7292 5819 5635
8898 7245 7013
10435 8583 8264
10694 8909 8542
10813 9058 8699
11690 9424 9118
12497 10420 9960
13524 11656 11179
15314 12736 12261
17260 15334 14386
20365 17247 16343
22799 19615 38117
25800 21765 20673
31667 27184 25465
38354 31696 2981838354 31696 29818
43821 35133 33158
45213 37278 35313
40469 40621 38177
56297 45260 42944
64419 51196 48511
71479 57386 54057
77302 64280 60063
91764 72059 69916
98864 81701 78409
130493 108543 103768
159783 116314 114873
159770 120705 119818
206146 143844 142487
212229 148842 146976
215660 159474 156352
288463 164351 170661
265361 176696 180012
258445 189370 193094
270628 190320 196751
271420 209247 209733
434447 321862 326136
597354 412338 423160
579126 402343 411046
626068 449746 459557
719001 518996 526250
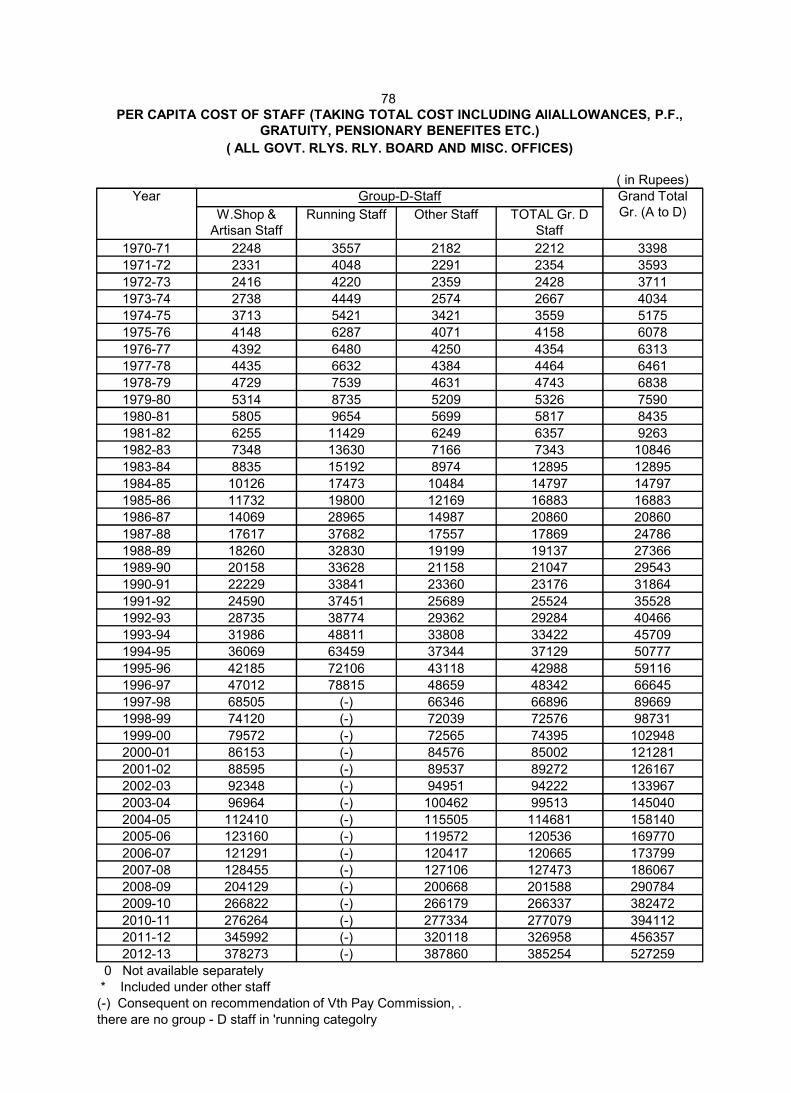
78PER CAPITA COST OF STAFF (TAKING TOTAL COST INCLUDING AllALLOWANCES, P.F.,
GRATUITY, PENSIONARY BENEFITES ETC.)
( ALL GOVT. RLYS. RLY. BOARD AND MISC. OFFICES)
Year Group-
W.Shop & Artisan Staff
Running Staff
1970-71 2248 3557
1971-72 2331 4048
1972-73 2416 4220
1973-74 2738 4449
1974-75 3713 5421
1975-76 4148 6287
1976-77 4392 6480
1977-78 4435 6632
1978-79 4729 7539
1979-80 5314 8735
1980-81 5805 9654
1981-82 6255 11429
1982-83 7348 13630
1983-84 8835 15192
1984-85 10126 17473
1985-86 11732 19800
1986-87 14069 28965
1987-88 17617 37682
1988-89 18260 328301988-89 18260 32830
1989-90 20158 33628
1990-91 22229 33841
1991-92 24590 37451
1992-93 28735 38774
1993-94 31986 48811
1994-95 36069 63459
1995-96 42185 72106
1996-97 47012 78815
1997-98 68505 (-)
1998-99 74120 (-)
1999-00 79572 (-)
2000-01 86153 (-)
2001-02 88595 (-)
2002-03 92348 (-)
2003-04 96964 (-)
2004-05 112410 (-)
2005-06 123160 (-)
2006-07 121291 (-)
2007-08 128455 (-)
2008-09 204129 (-)
2009-10 266822 (-)
2010-11 276264 (-)
2011-12 345992 (-)
2012-13 378273 (-)
0 Not available separately* Included under other staff(-) Consequent on recommendation of Vth Pay Commissionthere are no group - D staff in 'running categolry
PER CAPITA COST OF STAFF (TAKING TOTAL COST INCLUDING AllALLOWANCES, P.F., GRATUITY, PENSIONARY BENEFITES ETC.)
( ALL GOVT. RLYS. RLY. BOARD AND MISC. OFFICES)
( in Rupees)-D-Staff Grand Total
Gr. (A to D)Other Staff TOTAL Gr. D Staff
2182 2212 3398
2291 2354 3593
2359 2428 3711
2574 2667 4034
3421 3559 5175
4071 4158 6078
4250 4354 6313
4384 4464 6461
4631 4743 6838
5209 5326 7590
5699 5817 8435
6249 6357 9263
7166 7343 10846
8974 12895 12895
10484 14797 14797
12169 16883 16883
14987 20860 20860
17557 17869 24786
19199 19137 2736619199 19137 27366
21158 21047 29543
23360 23176 31864
25689 25524 35528
29362 29284 40466
33808 33422 45709
37344 37129 50777
43118 42988 59116
48659 48342 66645
66346 66896 89669
72039 72576 98731
72565 74395 102948
84576 85002 121281
89537 89272 126167
94951 94222 133967
100462 99513 145040
115505 114681 158140
119572 120536 169770
120417 120665 173799
127106 127473 186067
200668 201588 290784
266179 266337 382472
277334 277079 394112
320118 326958 456357
387860 385254 527259
Commission, .
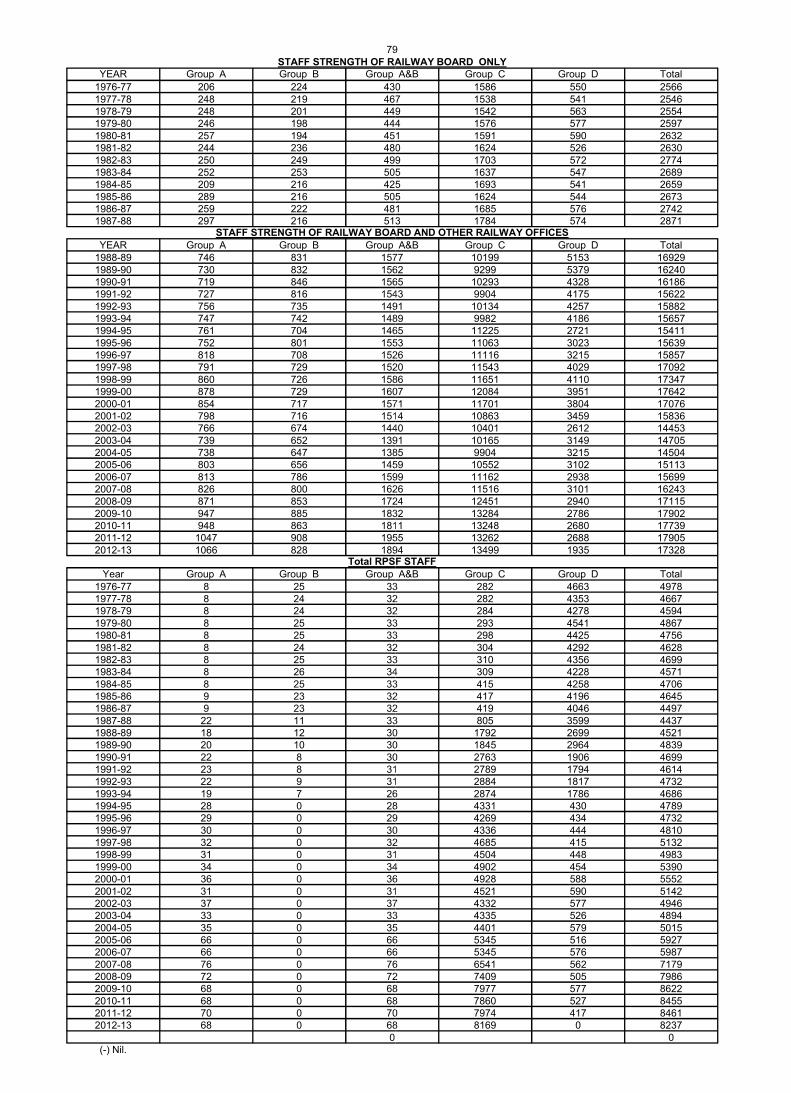
79STAFF STRENGTH OF RAILWAY BOARD ONLY
YEAR Group A Group B Group A&B
1976-77 206 224 4301977-78 248 219 4671978-79 248 201 4491979-80 246 198 4441980-81 257 194 4511981-82 244 236 4801982-83 250 249 4991983-84 252 253 5051984-85 209 216 4251985-86 289 216 5051986-87 259 222 4811987-88 297 216 513
STAFF STRENGTH OF RAILWAY BOARD AND OTHER RAILWAY OFFICES
YEAR Group A Group B Group A&B1988-89 746 831 15771989-90 730 832 15621990-91 719 846 15651991-92 727 816 15431992-93 756 735 14911993-94 747 742 14891994-95 761 704 14651995-96 752 801 15531996-97 818 708 15261997-98 791 729 15201998-99 860 726 15861999-00 878 729 16072000-01 854 717 15712001-02 798 716 15142002-03 766 674 14402003-04 739 652 13912004-05 738 647 13852005-06 803 656 14592006-07 813 786 15992007-08 826 800 16262008-09 871 853 17242009-10 947 885 18322010-11 948 863 18112011-12 1047 908 19552012-13 1066 828 18942012-13 1066 828 1894
Total RPSF STAFF
Year Group A Group B Group A&B
1976-77 8 25 331977-78 8 24 321978-79 8 24 321979-80 8 25 331980-81 8 25 331981-82 8 24 321982-83 8 25 331983-84 8 26 341984-85 8 25 331985-86 9 23 321986-87 9 23 321987-88 22 11 331988-89 18 12 301989-90 20 10 301990-91 22 8 301991-92 23 8 311992-93 22 9 311993-94 19 7 261994-95 28 0 281995-96 29 0 291996-97 30 0 301997-98 32 0 321998-99 31 0 311999-00 34 0 342000-01 36 0 362001-02 31 0 312002-03 37 0 372003-04 33 0 332004-05 35 0 352005-06 66 0 662006-07 66 0 662007-08 76 0 762008-09 72 0 722009-10 68 0 682010-11 68 0 682011-12 70 0 702012-13 68 0 68
0(-) Nil.
79STAFF STRENGTH OF RAILWAY BOARD ONLY
Group A&B Group C Group D Total
430 1586 550 2566467 1538 541 2546449 1542 563 2554444 1576 577 2597451 1591 590 2632480 1624 526 2630499 1703 572 2774505 1637 547 2689425 1693 541 2659505 1624 544 2673481 1685 576 2742513 1784 574 2871
STAFF STRENGTH OF RAILWAY BOARD AND OTHER RAILWAY OFFICES
Group A&B Group C Group D Total1577 10199 5153 169291562 9299 5379 162401565 10293 4328 161861543 9904 4175 156221491 10134 4257 158821489 9982 4186 156571465 11225 2721 154111553 11063 3023 156391526 11116 3215 158571520 11543 4029 170921586 11651 4110 173471607 12084 3951 176421571 11701 3804 170761514 10863 3459 158361440 10401 2612 144531391 10165 3149 147051385 9904 3215 145041459 10552 3102 151131599 11162 2938 156991626 11516 3101 162431724 12451 2940 171151832 13284 2786 179021811 13248 2680 177391955 13262 2688 179051894 13499 1935 173281894 13499 1935 17328
Total RPSF STAFF
Group A&B Group C Group D Total
33 282 4663 497832 282 4353 466732 284 4278 459433 293 4541 486733 298 4425 475632 304 4292 462833 310 4356 469934 309 4228 457133 415 4258 470632 417 4196 464532 419 4046 449733 805 3599 443730 1792 2699 452130 1845 2964 483930 2763 1906 469931 2789 1794 461431 2884 1817 473226 2874 1786 468628 4331 430 478929 4269 434 473230 4336 444 481032 4685 415 513231 4504 448 498334 4902 454 539036 4928 588 555231 4521 590 514237 4332 577 494633 4335 526 489435 4401 579 501566 5345 516 592766 5345 576 598776 6541 562 717972 7409 505 798668 7977 577 862268 7860 527 845570 7974 417 846168 8169 0 8237
0
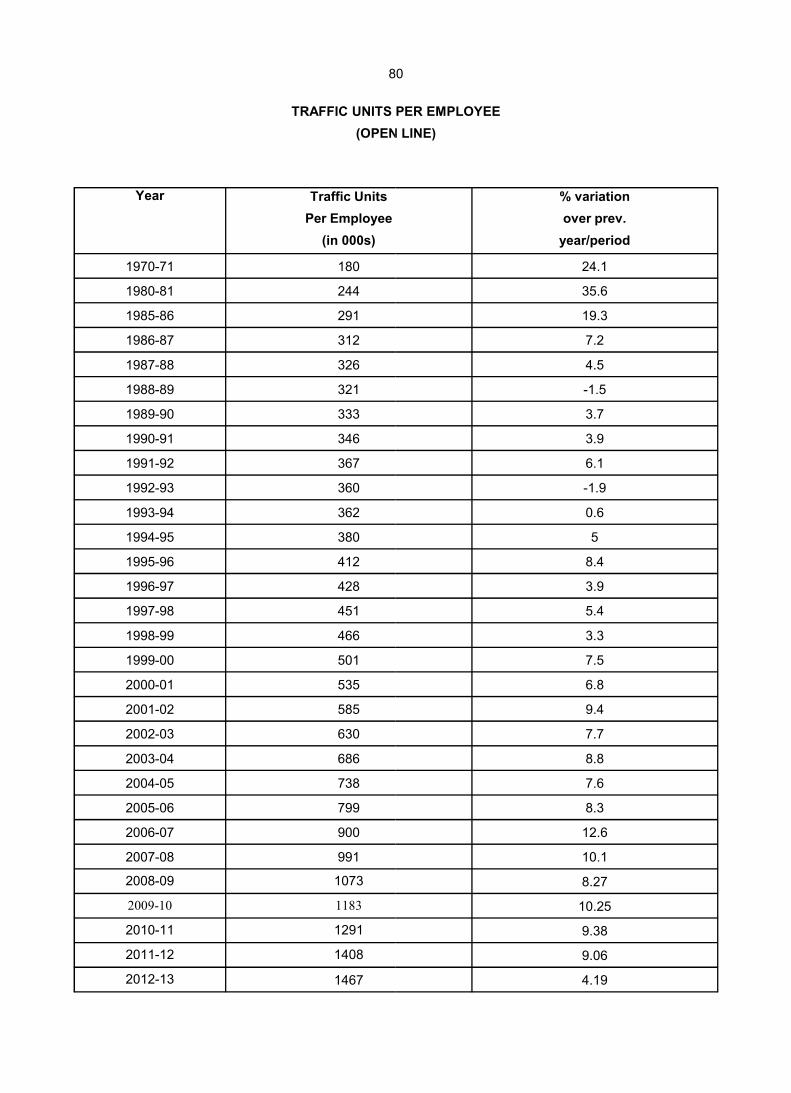
80
TRAFFIC UNITS PER EMPLOYEE
(OPEN LINE)
Year Traffic Units
Per Employee
(in 000s)
1970-71 180
1980-81 244
1985-86 291
1986-87 312
1987-88 326
1988-89 321
1989-90 333
1990-91 346
1991-92 367
1992-93 360
1993-94 362
1994-95 380
1995-96 412
1996-97 428
1997-98 451
1998-99 466
1999-00 501
2000-01 535
2001-02 585
2002-03 630
2003-04 686
2004-05 738
2005-06 799
2006-07 900
2007-08 991
2008-09 1073
2009-10 1183
2010-11 1291
2011-12 1408
2012-13 1467
80
TRAFFIC UNITS PER EMPLOYEE
(OPEN LINE)
% variation
over prev.
year/period
24.1
35.6
19.3
7.2
4.5
-1.5
3.7
3.9
6.1
-1.9
0.6
5
8.4
3.9
5.4
3.3
7.5
6.8
9.4
7.7
8.8
7.6
8.3
12.6
10.1
8.27
10.25
9.38
9.06
4.19