key resources for workforce and labor market …...key resources for workforce and labor market...
TRANSCRIPT
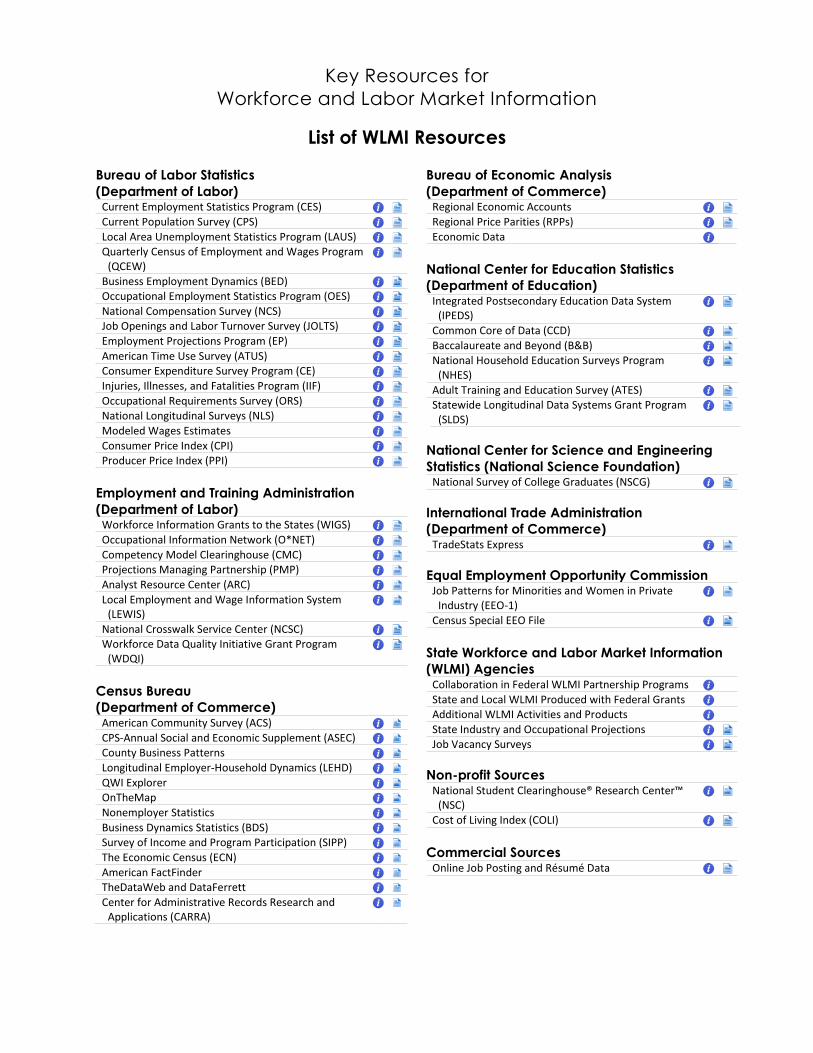
Key Resources for
Workforce and Labor Market Information
List of WLMI Resources
Bureau of Labor Statistics
(Department of Labor) Current Employment Statistics Program (CES)
Current Population Survey (CPS)
Local Area Unemployment Statistics Program (LAUS) Quarterly Census of Employment and Wages Program
(QCEW)
Business Employment Dynamics (BED) Occupational Employment Statistics Program (OES)
National Compensation Survey (NCS) Job Openings and Labor Turnover Survey (JOLTS)
Employment Projections Program (EP)
American Time Use Survey (ATUS) Consumer Expenditure Survey Program (CE)
Injuries, Illnesses, and Fatalities Program (IIF)
Occupational Requirements Survey (ORS) National Longitudinal Surveys (NLS)
Modeled Wages Estimates
Consumer Price Index (CPI) Producer Price Index (PPI)
Employment and Training Administration
(Department of Labor) Workforce Information Grants to the States (WIGS)
Occupational Information Network (O*NET)
Competency Model Clearinghouse (CMC) Projections Managing Partnership (PMP)
Analyst Resource Center (ARC)
Local Employment and Wage Information System (LEWIS)
National Crosswalk Service Center (NCSC) Workforce Data Quality Initiative Grant Program
(WDQI)
Census Bureau
(Department of Commerce) American Community Survey (ACS)
CPS-Annual Social and Economic Supplement (ASEC) County Business Patterns
Longitudinal Employer-Household Dynamics (LEHD)
QWI Explorer OnTheMap
Nonemployer Statistics
Business Dynamics Statistics (BDS) Survey of Income and Program Participation (SIPP)
The Economic Census (ECN)
American FactFinder TheDataWeb and DataFerrett
Center for Administrative Records Research and Applications (CARRA)
Bureau of Economic Analysis
(Department of Commerce) Regional Economic Accounts
Regional Price Parities (RPPs)
Economic Data
National Center for Education Statistics
(Department of Education) Integrated Postsecondary Education Data System
(IPEDS)
Common Core of Data (CCD)
Baccalaureate and Beyond (B&B) National Household Education Surveys Program
(NHES)
Adult Training and Education Survey (ATES) Statewide Longitudinal Data Systems Grant Program
(SLDS)
National Center for Science and Engineering
Statistics (National Science Foundation) National Survey of College Graduates (NSCG)
International Trade Administration
(Department of Commerce) TradeStats Express
Equal Employment Opportunity Commission Job Patterns for Minorities and Women in Private
Industry (EEO-1)
Census Special EEO File
State Workforce and Labor Market Information
(WLMI) Agencies Collaboration in Federal WLMI Partnership Programs
State and Local WLMI Produced with Federal Grants Additional WLMI Activities and Products
State Industry and Occupational Projections Job Vacancy Surveys
Non-profit Sources National Student Clearinghouse® Research Center™
(NSC)
Cost of Living Index (COLI)
Commercial Sources Online Job Posting and Résumé Data

Key Resources for Workforce and Labor Market Information August 2017
Page 2
List
Brief Descriptions of WLMI Resources
Bureau of Labor Statistics (Department of Labor)
Current Employment Statistics Program (CES) – Surveys approximately 146,000 businesses
and government agencies monthly, representing approximately 623,000 individual worksites, in
order to provide detailed industry data on employment, hours, and earnings of workers on
nonfarm payrolls for all 50 States, the District of Columbia, Puerto Rico, the Virgin Islands, and
about 450 metropolitan areas and divisions.1 Monthly. National/State/Metro.
Current Population Survey (CPS) – Monthly survey of about 60,000 households that provides a
comprehensive body of data on the labor force, employment, unemployment, persons not in the
labor force, hours of work, earnings, and other demographic and labor force characteristics. The
CPS, which is conducted by the U.S. Census Bureau on behalf of the BLS, is a primary source of
data on the national unemployment rate and employment by occupation, among other key
statistics.2 Monthly. National/State.
Local Area Unemployment Statistics Program (LAUS) – A federal-state cooperative effort in
which monthly estimates of total employment and unemployment are prepared for
approximately 7,500 areas based on data from CPS, CES, state UI systems, ACS. LAUS includes
employment and unemployment effort for a wide variety of geographical divisions, including
states, Metropolitan Statistical Areas and Divisions, Micropolitan Statistical Areas, Small Labor
Market Areas, Counties and county equivalents, and cities. 3 Monthly.
National/State/County/Metro/City.
Quarterly Census of Employment and Wages Program (QCEW) – Produces a comprehensive
tabulation of employment and wage information for workers covered by State unemployment
insurance (UI) laws, as reported to State Employment Security Agencies (SSEAs) and Federal
workers covered by the Unemployment Compensation for Federal Employees (UCFE) program.
At the national level, the QCEW program publishes employment and wage data for nearly
every NAICS industry. At the State and area level, the QCEW program publishes employment
and wage data down to the 6-digit NAICS industry level, if disclosure restrictions are met.4
Quarterly. National/State/County/Metro.
Business Employment Dynamics (BED) – A set of longitudinal statistics from the QCEW
program consisting of gross job gains and gross job losses.5 Quarterly. National/State.
Key Resources for Workforce and Labor Market Information August 2017
Page 3
List
Occupational Employment Statistics Program (OES) – Produces employment and wages for
workers in nonfarm establishments, by occupation and industry nationally and occupation and
area for about 649 geographical areas. Estimates are provided annually for over 800
occupations, according the Standard Occupational Classification system (SOC).6 The OES
survey is a federal-state cooperative program between the Bureau of Labor Statistics (BLS) and
State Workforce Agencies (SWAs).7 Annual. National/State/Metro.
National Compensation Survey (NCS) – Produces quarterly indexes measuring change over
time in labor costs, Employment Cost Index (ECI), and quarterly data measuring the level of
average costs per hour worked, Employer Costs for Employee Compensation (ECEC).8
Quarterly. National.
Job Openings and Labor Turnover Survey (JOLTS) – A monthly survey of about 16,000
business and government establishments that produces information on labor demand and
turnover. JOLTS includes estimates for the rates and levels of job openings, hires, and
separations for the nation and regions, as well as by public or private ownership and for
industry sectors, with data going back to 2000.9 Monthly. National.
Employment Projections Program (EP) – Develops information about the labor market for the
Nation as a whole for 10 years in the future using data from CES, OES, and CPS to produce the
Career Outlook newsletter (monthly) and the Occupational Outlook Handbook (OOH,
biannual).10 Biannual. National.
American Time Use Survey (ATUS) – Measures the amount of time people spend doing
various activities, such as paid work, childcare, volunteering, and socializing.11 Annual. National.
Consumer Expenditure Survey Program (CE) – Consists of two surveys, the Quarterly
Interview Survey and the Diary Survey, that provide information on the buying habits of
America's consumers, including data on their expenditures, income, and consumer unit
(families and single consumers) characteristics. It is the only Federal survey to provide
information on the complete range of consumers' expenditures and incomes, as well as the
characteristics of those consumers.12 Annual. National/Metro.
Injuries, Illnesses, and Fatalities Program (IIF) – Information on the rate and number of work-
related injuries, illnesses, and fatal injuries, and how these statistics vary by incident, industry,
geography, occupation, and other characteristics. These data are collected through the Survey
of Occupational Injuries and Illnesses (SOII) and the Census of Fatal Occupational Injuries
(CFOI).13
Occupational Requirements Survey (ORS) – A new survey designed to collect data about the
requirements of work in the national economy conducted under an interagency agreement with
the Social Security Administration (SSA).14 Timing TBD. National.

Key Resources for Workforce and Labor Market Information August 2017
Page 4
List
National Longitudinal Surveys (NLS) – A set of surveys designed to gather information at
multiple points in time on the labor market activities and other significant life events of several
groups of men and women. For more than 4 decades, NLS data have served as an important
tool for economists, sociologists, and other researchers. Includes the National Longitudinal
Surveys of Youth (NLSY79 and NLSY97), which include information about the education and
employment of individual cohorts of youths followed over time.15 Biennial. National.
Modeled Wages Estimates – An experimental set of wage estimates modeled from two surveys
(OES and NCS) that provides more extensive information about workers’ wage rates than either
survey provides individually.16 Timing TBD. National/State/Metro.
Consumer Price Index (CPI) – Produces monthly data on changes in the prices paid by urban
consumers for a representative basket of goods and services.17
Producer Price Index (PPI) – Measures the average change over time in the selling prices
received by domestic producers for their output.18
Employment and Training Administration (Department of Labor)
Workforce Information Grants to the States (WIGS) – State workforce agencies use WIGS to
develop and disseminate essential state and local WLMI for a range of customer groups.19
Occupational Information Network (O*NET) – The nation's primary source of occupational
information. Central to the project is the O*NET database, containing information on hundreds
of standardized and occupation-specific descriptors.20 Rolling. National.
Competency Model Clearinghouse (CMC) – The goal of the clearinghouse is to inform the
public workforce system about the value, development, and uses of competency models:
collections of multiple competencies that together define successful performance in a defined
work setting. Each model provides a clear description of what a person needs to know and be
able to do – the knowledge, skills, and abilities – to perform well in a specific job, occupation, or
industry.21
Projections Managing Partnership (PMP) – The PMP provides states with guidance and
technical assistance on projections requirements funded through the Workforce Investment
Grants.22
Analyst Resource Center (ARC) – Primarily concerned with the ongoing design, development,
and maintenance of the Workforce Information Database (a common, standardized WLMI
database template available to states), the Center also provides a range of additional products
and services designed to enhance information delivery to workforce customers in the
employment, education, and economic development sectors.23
Key Resources for Workforce and Labor Market Information August 2017
Page 5
List
Local Employment and Wage Information System (LEWIS) – formerly Estimates Delivery
System or EDS – State systems (developed in cooperation with BLS/OES program) used to
generate localized employment and wage estimates from OES data for area definitions not
provided by BLS.24
National Crosswalk Service Center (NCSC) – The National Crosswalk Service Center (NCSC)
is a federally-funded national clearinghouse for classification information about occupations,
training programs and industries.25
Workforce Data Quality Initiative Grant Program (WDQI) – Grant program to support state
longitudinal databases that will, at a minimum, include information on programs that provide
training and employment services and will be linked longitudinally at the individual level to
allow for analysis leading to enhanced opportunity for program evaluation and better
information for customers and stakeholders of the workforce system.26
Census Bureau (Department of Commerce)
American Community Survey (ACS) – An ongoing survey that provides vital and detailed
information on a yearly basis about jobs and occupations, educational attainment, veterans,
whether people own or rent their home, and other topics.27 Annual.
National/State/County/Metro/City/Neighborhood.
CPS-Annual Social and Economic Supplement (ASEC) – This annual supplement to the
monthly Current Population Survey collects data concerning family characteristics, household
composition, marital status, education attainment, health insurance coverage, foreign-born
population, previous year’s income from all sources, work experience, receipt of noncash
benefit, poverty, program participation, and geographic mobility.28 Annual.
National/State/Regional.
County Business Patterns (CPB) – County Business Patterns (CBP) is an annual series that
provides subnational economic data by industry. This series includes the number of
establishments, employment during the week of March 12, first quarter payroll, and annual
payroll. This data is useful for studying the economic activity of small areas; analyzing
economic changes over time; and as a benchmark for other statistical series, surveys, and
databases between economic censuses.29 Annual. State/County/Metro/ZIP/District.

Key Resources for Workforce and Labor Market Information August 2017
Page 6
List
Longitudinal Employer-Household Dynamics (LEHD) – Combines unemployment insurance
administrative data provided by states under the Local Employment Dynamics (LED)
Partnership with additional administrative data and data from censuses and surveys to create
the Quarterly Workforce Indicators (QWI) and other products. In addition, the LEHD program
uses these data to create partially synthetic data on workers' residential patterns.30 The LEHD
Infrastructure Files provide a detailed and comprehensive picture of workers, employers, and
their interaction in the U.S. economy.
Quarterly Workforce Indicators (QWI) – A set of economic indicators including
employment, job creation, earnings, and other measures of employment flows. The QWI
are reported based on detailed firm characteristics (geography, industry, age, and size)
and worker demographics information (sex, age, education, race, ethnicity).31 Quarterly.
National (beta)/state/county/metro/micro/WIB.
LEHD Origin-Destination Employment Statistics (LODES) – A partially synthetic
dataset that describes geographic patterns of jobs by their employment locations and
residential locations as well as the connections between the two locations. Data files are
state-based and organized into three types: Origin-Destination (OD), Residence Area
Characteristics (RAC), and Workplace Area Characteristics (WAC), all at census block
geographic detail.32
Job-to-Job Flows (J2J) (Beta) – A new set of statistics on worker reallocation in the
United States constructed from the LEHD data. The initial release of national data
distinguishes hires and separations associated with job change from hires from and
separations to nonemployment. Future releases will be published at more detailed levels
of aggregations, and will tabulate the origin and destination job characteristics of
workers changing jobs.33
QWI Explorer – QWI Explorer is a web-based analysis tool that enables comprehensive access
to the full depth and breadth of the Quarterly Workforce Indicators (QWI) dataset. Through
charts, maps and interactive tables, users can compare, rank and aggregate QWIs across time,
geography, and/or firm and worker characteristics on the fly.34 (Replaced QWI Online and
Industry Focus)
OnTheMap – OnTheMap is an online mapping and reporting application showing where
workers are employed and where they live with companion reports on worker characteristics
and optional filtering by age, earnings, or industry groups. It provides an easy-to-use interface
for creating, viewing, printing and downloading workforce related maps, profiles, and
underlying data based on LEHD Origin Destination Employment Statistics (LODES).35
Key Resources for Workforce and Labor Market Information August 2017
Page 7
List
Nonemployer Statistics – An annual series that provides subnational economic data for
businesses that have no paid employees and are subject to federal income tax. The data consist
of the number of businesses and total receipts by industry. Most nonemployers are self-
employed individuals operating unincorporated businesses (known as sole proprietorships),
which may or may not be the owner's principal source of income.36 Annual.
National/State/County/Metro/Micro.
Business Dynamics Statistics (BDS) – Created from the Longitudinal Business Database
(LBD), BDS provides annual measures of business dynamics (such as job creation and
destruction, establishment births and deaths, and firm startups and shutdowns) for the
economy and aggregated by establishment and firm characteristics.37 Annual.
National/State/Metro.
Survey of Income and Program Participation (SIPP) – The purpose of SIPP is to provide
accurate and comprehensive information about the income and program participation of
individuals and households in the United States. The survey’s mission is to provide a nationally
representative sample for evaluating: 1) annual and sub-annual income dynamics; 2)
movements into and out of government transfer programs; 3) family and social context of
individuals and households; and 4) interactions among these items. A major use of the SIPP has
been to evaluate the use of and eligibility for government programs and to analyze the impacts
of modifications to those programs.38 Periodicity varies (2.5 to 4 years). National.
The Economic Census (ECN) – Collects nonfarm business statistics, including industry
revenues, that are used to produce a variety of key economic indicators, such as GPD,
productivity, and producer prices as well as for state and local planning and economic
development.39 Every 5 years (ending in 2 and 7). National/State/County/Metro.
American FactFinder – American FactFinder is the primary way to access data from the
Decennial Census, the American Community Survey, the Puerto Rico Community Survey, the
Economic Census, the Population Estimates Program and Annual Economic Surveys presented
in resented in customizable table format.
TheDataWeb and DataFerrett – TheDataWeb is a platform for bringing together many different
datasets and disseminating them to users. It supports: DataFerret, an analytical interface that
allows simultaneous access to multiple datasets and variables (ACS, CPS, SIPP, and more) for
instant analysis or for retrieval for use in other software; HotReports, which use analytical
output from DataFerrett to create custom, dynamic websites by bringing together relevant
statistics from multiple datasets in a dashboard style; and a variety of other reporting
products.40

Key Resources for Workforce and Labor Market Information August 2017
Page 8
List
Center for Administrative Records Research and Application (CARRA) – CARRA is charged
with the strategic re-use of administrative data from federal, state, and third-party providers.
CARRA combines information from multiple sources to create new data products that would be
impossible to produce using single data sets.41 The Data Linkage Infrastructure enables data
discovery and secure analytic access for policy analysis and research. The Data Linkage
Infrastructure includes the protocols by which we obtain government records, metadata and
documentation on the files, linkage methods and results, warehousing, and provisioning data,
and sharing results of prior linkages.42
Bureau of Economic Analysis (Department of Commerce)
Regional Economic Accounts – The regional economic accounts tell us about the geographic
distribution of U.S. economic activity and growth. The estimates of gross domestic product by
state and state and local area personal income, and the accompanying detail, provide a
consistent framework for analyzing and comparing individual state and local area economies.43
Quarterly. State/Local Area/Metro/Micro/Combined.
Regional Price Parities (RPPs) – Price indexes that measure geographic price level differences
for one period in time within the United States. An RPP is a weighted average of the price level
of goods and services for the average consumer in one geographic region compared to all other
regions in the U.S.44 Quarterly. National/County/Metro.
Economic Data – The BEA produces data on a wide variety of macroeconomic topics at the
national, state and metropolitan area levels, including: GDP, personal income and outlays,
consumer spending, corporate profits, and fixed assets. BEA also produces economic data on
international topics such as balance of payments, trade in goods and services, and international
investments.
National Center for Education Statistics (Department of Education)
Integrated Postsecondary Education Data System (IPEDS) – A system of interrelated surveys
conducted annually by the National Center for Education Statistics (NCES) that gathers
information from every college, university, and technical and vocational institution that
participates in the federal student financial aid programs on enrollments, program completions,
graduation rates, faculty and staff, finances, institutional prices, and student financial aid.45
Annual. Institution-level.

Key Resources for Workforce and Labor Market Information August 2017
Page 9
List
Common Core of Data (CCD) – The Common Core of Data is the Department of Education's
primary database on public elementary and secondary education in the United States. CCD is a
comprehensive, annual, national statistical database of all public elementary and secondary
schools and school districts, which contains data that are designed to be comparable across all
states.46 Annual. State/School District/School.
Baccalaureate and Beyond (B&B) – The Baccalaureate and Beyond Longitudinal Study
examines students’ education and work experiences after they complete a bachelor’s degree,
with a special emphasis on the experiences of new elementary and secondary teachers.
Following several cohorts of students over time, B&B looks at bachelor’s degree recipients’
workforce participation, income and debt repayment, and entry into and persistence through
graduate school programs, among other indicators.47 Updates every four years. National.
National Household Education Surveys Program (NHES) – Administered by the U.S. Census
Bureau, the NHES provides descriptive data on the educational activities of the U.S. population
and offers researchers, educators, and policymakers a variety of statistics on the condition of
education in the United States.48 Recent and planned additions include the Credentials for
Work Survey (CWS, first administered in 2015) and the Training for Work Survey (TWS,
planned in 2017).49
Adult Training and Education Survey (ATES) – The Interagency Working Group on Expanded
Measures of Enrollment and Attainment (GEMEnA) has developed a core set of survey items to
measure the prevalence and key characteristics of certifications and licenses, and efforts are
underway to deploy these items within the federal statistical system. The National Center for
Education Statistics has fielded an in-depth survey of US adults, the Adult Training and
Education Survey, to provide detailed cross-sectional time series data beginning in 2016 as part
of the NHES.50 Data are expected to be available in early 2017. Every 4 to 6 years. National.
Statewide Longitudinal Data Systems Grant Program (SLDS) – Through grants and a growing
range of services and resources, the program has helped propel the successful design,
development, implementation, and expansion of K12 and P-20W (early learning through the
workforce) longitudinal data systems intended to enhance the ability of States to efficiently and
accurately manage, analyze, and use education data, including individual student records.51

Key Resources for Workforce and Labor Market Information August 2017
Page 10
List
National Center for Science and Engineering Statistics (National
Science Foundation)
National Survey of College Graduates (NSCG) – The National Survey of College Graduates is
a longitudinal biennial survey conducted since the 1970s that provides data on the nation’s
college graduates, with particular focus on those in the science and engineering workforce. This
survey is a unique source for examining various characteristics of college-educated individuals,
including occupation, work activities, salary, the relationship of degree field and occupation,
and demographic information.52 Biennial. National.
International Trade Administration (Department of Commerce)
TradeStats Express – Displays the latest annual U.S. merchandise trade statistics in maps,
graphs, and tables as exports, imports, or trade balances. Quarterly. National/State.
Equal Employment Opportunity Commission
Job Patterns for Minorities and Women in Private Industry (EEO-1) – The EEOC requires
periodic reports from public and private employers, and unions and labor organizations, which
indicate the composition of their work forces by sex and by race/ethnic category. Key among
these reports is the EEO-1, which is collected annually from Private employers with 100 or more
employees or federal contractors with 50 more employees.53 Annual. National/State/Metro.
Census Special EEO File – The Special EEO File serves as the primary benchmark for
comparing the racial, ethnic and gender composition of an internal workforce, within a
specified geography and job category, and the analogous external labor market.54
State Workforce and Labor Market Information (WLMI) Agencies
Collaboration in Federal WLMI Partnership Programs – State WLMI agencies are vital
partners with the federal government in collecting, developing, analyzing and disseminating
data through partnerships in programs with the U.S. Bureau of Labor Statistics, including the
Current Employment Statistics (CES), Local Area Unemployment Statistics (LAUS), Quarterly
Census of Employment and Wages (QCEW), and Occupational Employment Statistics (OES)
programs, as well as with the U.S. Census Bureau through the Local Employment Dynamics
Partnership (LED).
Key Resources for Workforce and Labor Market Information August 2017
Page 11
List
State and Local WLMI Produced with Federal Grants – State WLMI agencies use Workforce
Information Grants (WIGS) from the U.S. Employment and Training Administration (ETA) to
develop and disseminate state and local WLMI to a broad range of local customer groups. These
include products and activities such as conducting economic analyses, populating and
maintaining a database of economic and labor market data, producing long and short term
employment outlooks, and providing for the dissemination of workforce and labor market
information within their states. They also use Workforce Data Quality Initiative grants, funded
through the ETA, to develop longitudinal databases for evaluation of training and employment
services, which may be linked to education data systems to provide even greater workforce
development evaluation capabilities.
Additional WLMI Activities and Products – State WLMI agencies perform a wide variety of
additional activities, which vary from state to state based on the availability of funding from the
state or other sources, but may include custom economic impact analyses and labor supply
studies, state-specific occupational guides, training for WLMI customers, responding to special
legislative and workforce system requests, conducting special surveys, and producing a variety
of other state-specific resources and reports.
State Industry and Occupational Projections – Each state develops its own projections of
employment growth, which are available through state WLMI agencies and can also be found
on www.projectionscentral.com. 55 State employment projections, by industry and occupation,
are used by job seekers and career counselors to guide career decisions, as well as by private
industry to gain insight into local labor supply and policymakers to guide investments in
education and training, among many other applications. Biannual/varies by state.
National/State/varies by state.
Job Vacancy Surveys – Individual states may conduct additional employer surveys to collect
information about labor market demand. Specific data available vary by state and are typically
available through the state WLMI agency.
Non-profit Sources
National Student Clearinghouse® Research Center™ (NSC) – The National Student
Clearinghouse® Research Center™ is the research arm of the National Student Clearinghouse.56
The Research Center regularly publishes research on student enrollment, movement, and other
important student outcomes using student-level data provided exclusively to the National
Student Clearinghouse by our nationwide network of postsecondary institutions. These reports
are free, to benefit and better inform the educational community, policymakers, community
leaders, and others.57

Key Resources for Workforce and Labor Market Information August 2017
Page 12
List
Cost of Living Index (COLI) – Published by the Council for Community and Economic
Research (C2ER) – C2ER is a membership organization that promotes excellence in community
and economic research by working to improve data availability, enhance data quality, and
foster learning about regional economic analytic methods.58 The quarterly Cost of Living Index
provides a useful and reasonably accurate way to compare cost of living differences between
urban areas weighted by different categories of consumer expenditures for mid-management
households.59
Commercial Sources
Online Job Posting and Résumé Data – In recent years, a small number of private, for-profit
software companies have developed real-time labor market information tools to transform job
postings data into analytics. The real-time data they produce can help jobseekers and education
institutions better understand hiring trends and employer demand in their areas, including
certifications and skill requirements. But the methodologies by which each vendor compiles its
data are not consistent—nor are they necessarily made known to potential users (from: Jobs for
the Future60).
References 1 http://www.bls.gov/ces 2 http://www.census.gov/programs-surveys/cps/about.html 3 http://www.bls.gov/lau/lauov.htm 4 http://www.bls.gov/cew/cewover.htm 5 http://www.bls.gov/bdm 6 http://www.bls.gov/oes 7 http://www.bls.gov/oes/oes_emp.htm 8 http://www.bls.gov/ncs/summary.htm 9 http://www.bls.gov/jlt 10 http://www.bls.gov/emp 11 http://www.bls.gov/tus 12 http://www.bls.gov/cex 13 http://www.bls.gov/iif/ 14 http://www.bls.gov/ors 15 https://www.bls.gov/nls/home.htm 16 http://www.bls.gov/opub/mlr/2013/article/lettau-zamora.htm 17 http://www.bls.gov/cpi 18 http://www.bls.gov/ppi/ppiover.htm 19 https://wdr.doleta.gov/directives/attach/TEGL/TEGL_1-16.pdf 20 https://www.onetonline.org/help/onet 21 http://www.careeronestop.org/CompetencyModel/faq.aspx
Key Resources for Workforce and Labor Market Information August 2017
Page 13
List
22 https://www.doleta.gov/business/projections/StateEmpProjProgram.cfm 23 http://www.workforceinfodb.org/2aboutus.cfm 24 http://www.workforceinfodb.org/Pdf/ARC_Newsletter_July_2015.pdf 25 http://www.xwalkcenter.org/index.php/ncsc-info 26 https://www.doleta.gov/performance/workforcedatagrant09.cfm 27 https://www.census.gov/programs-surveys/acs/about.html 28 http://www.census.gov/programs-surveys/cps/about/supplemental-surveys.html 29 https://www.census.gov/programs-surveys/cbp/about.html 30 http://lehd.ces.census.gov 31 http://lehd.ces.census.gov/data 32 http://lehd.did.census.gov/data/#lodes and
http://lehd.ces.census.gov/doc/help/onthemap/OnTheMapDataOverview.pdf 33 http://lehd.did.census.gov/data/#lodes 34 http://lehd.ces.census.gov/applications 35 http://lehd.ces.census.gov/applications 36 http://www.census.gov/econ/nonemployer 37 http://www.census.gov/ces/dataproducts/bds/ 38 http://www.census.gov/programs-surveys/sipp/about/sipp-introduction-history.html 39 http://www.census.gov/programs-surveys/sipp/about/sipp-introduction-history.html 40 http://thedataweb.rm.census.gov/ProductsServices.html 41 https://www.census.gov/ces/pdf/CARRA_Introduction.pdf 42 https://census.gov/about/adrm/linkage/about/what.html 43 https://bea.gov/regional/about.cfm 44 https://www.bea.gov/regional/pdf/RPP2015.pdf 45 https://nces.ed.gov/ipeds/Home/AboutIPEDS 46 https://nces.ed.gov/ccd/aboutCCD.asp 47 https://nces.ed.gov/surveys/b&b/about.asp 48 https://nces.ed.gov/nhes/ 49 http://www.lmiontheweb.org/resources/briefs/Summary_Brief_-_NHES.pdf 50 https://nces.ed.gov/surveys/gemena/index.asp 51 https://nces.ed.gov/programs/slds/about_SLDS.asp 52 https://www.nsf.gov/statistics/srvygrads/ 53 https://www.eeoc.gov/eeoc/statistics/employment/jobpat-eeo1/ 54 https://www.eeoc.gov/eeoc/statistics/census/index.cfm 55 http://www.projectionscentral.com 56 https://nscresearchcenter.org/aboutus 57 https://nscresearchcenter.org/ourreports 58 https://www.c2er.org/about 59 https://www.c2er.org/products 60 http://www.jff.org/publications/vendor-product-review-consumers-guide-real-time-labor-market-information

Key Resources for Workforce and Labor Market Information August 2017
Page 14
List
WLMI Resource Details
This section presents selected details about the resources for workforce and labor market
information contained in this compilation. Each resource is covered on one page consisting of a
brief overview of the resource; the information, uses, and typical users associated with that
resource; and relevant characteristics such as geographic coverage and periodicity, as
applicable. This information, presented in a consistent, easy to read layout, highlights the
unique contributions each of these resources makes to the nationwide workforce and labor
market information system.
These descriptions were adapted from content found online and in other published sources to
fill the need for a concise, executive-level summary of the key programs, products, tools, and
organizations that make up the nationwide WLMI System. In concert with the brief descriptions
in the previous section, these details provide a convenient reference for basic information about
the features of these selected resources – they are not intended to be comprehensive or
definitive in nature. Where available, sources and referenced websites are provided for each
resource, so that interested readers can seek out additional information regarding these
important resources and the roles they play in the nationwide WLMI System.

Key Resources for Workforce and Labor Market Information August 2017
Page 15
List
Current Employment Statistics Program (CES)
Summary: Primary Agency:
Monthly employment and wage data for local areas, states and the
nation that serve as early economic indicators. U.S. Bureau of Labor Statistics
Description:
Each month the Current Employment Statistics program surveys about 146,000 businesses and government agencies,
representing approximately 623,000 individual worksites, in order to provide detailed industry data on employment,
hours, and earnings of workers on nonfarm payrolls for the Nation, all 50 States, the District of Columbia, Puerto
Rico, the Virgin Islands, and about 450 metropolitan areas and divisions.
The survey is conducted by state workforce agencies in cooperation with the BLS. The survey has been underway
since 1939 and provides one of the more continuous statistical series on employment and earnings in the U.S.
Coverage includes non-farm payroll employment in over 600 industries, including major divisions and more detailed
industry levels
Key Uses: Key Data:
The CES monthly employment series are the first economic indicator
of current economic trends each month, together with the
unemployment rate, and are inputs to many gauges of the U.S.
economy including:
• The overall health of the economy (employment)
• Earnings trends and wage-push inflation (average hourly
earnings)
• Short-term fluctuations in demand (average weekly hours)
Current and time series nonfarm
employment for:
• All employees
• Production and supervisory
employees
• Women employees
• Average hourly earnings
• Average weekly hours
• Average weekly overtime hours
• Seasonally and not seasonally
adjusted
Key Users: Data Available at:
• Businesses
o Location, sales and purchasing planning
o Industry benchmarking
o Labor negotiations
o Employment base information
o Economic forecasting
• Government
o Economic planning
o Economic development and industry analysis
o Assessing industry and overall economic growth
o Tax revenue forecasting
http://www.bls.gov/ces
Periodicity:
Monthly
Geographic Divisions Available:
National/State/Metro
Source: U.S. Department of Labor, Bureau of Labor Statistics

Key Resources for Workforce and Labor Market Information August 2017
Page 16
List
Current Population Survey (CPS)
Summary: Primary Agency:
Monthly estimates of national employment and unemployment, by
various demographic characteristics. Conducted by U.S. Census Bureau
For U.S. Bureau of Labor Statistics
Description:
The Current Population Survey, a monthly household survey of 60,000 households conducted by the Bureau of the
Census for the Bureau of Labor Statistics, provides a comprehensive body of information on the employment and
unemployment experience of the nation's population, classified by age, sex, race, and a variety of other
characteristics. The CPS provides a more holistic picture of unemployment than do statistics on the insured
unemployed generated by stat UI programs, which exclude important sub-groups such as the self-employed, unpaid
family workers, some workers in non-profits and some seasonal workers.
In addition to being the primary source of monthly labor force statistics, the CPS is used to collect data for a variety
of other studies that collect economic and social information by adding a set of supplemental questions to the
monthly basic CPS questions. Supplemental inquiries vary month to month and cover a wide variety of topics.
Key Uses: Key Data:
• Economic indicators.
• Most comprehensive measure of national employment and
unemployment.
• Primary source of data on employment status and characteristics
of the labor force, emerging trends, and changes.
• Measure of potential labor supply.
• Determining factors affecting changes in labor force participation
of different population groups.
• Evaluation of wage rates and earnings trends for specific
demographic groups.
• Employment status of adult
population
• Employment by occupation, Industry
and other characteristics
• Unemployed persons by occupation
and industry, including duration of
unemployment and job seeking intent
• Characteristics of persons not in the
labor force
• Earnings and union membership
Key Users: Data Available at:
• National, state, and local policymakers use economic indicators to
gauge the overall health of the economy.
• Workforce development professionals use employment and labor
supply data to plan for training and placement needs.
• Economic development professionals use employment data to
match investment opportunities with local labor market capacity.
• Economic and labor market researchers and analysts use
employment and other data to investigate employment trends
and linkages.
www.bls.gov/cps
Periodicity:
Monthly
Geographic Divisions Available:
National
Sources: U.S. Department of Labor, Bureau of Labor Statistics; U.S. Department of Commerce, Census Bureau

Key Resources for Workforce and Labor Market Information August 2017
Page 17
List
Local Area Unemployment Statistics Program (LAUS)
Summary: Primary Agency:
Provides monthly estimates of employment and unemployment for
local areas, including states, cities, and counties. U.S. Bureau of Labor Statistics
Description:
A federal-state cooperative effort in which monthly estimates of total employment and unemployment are prepared
for approximately 7,500 areas based on data from CPS, CES, state UI systems, ACS. LAUS includes employment and
unemployment effort for a wide variety of geographical divisions including Census regions and divisions, states,
Metropolitan Statistical Areas and Divisions, Micropolitan Statistical Areas, Small Labor Market Areas, Counties and
county equivalents, and cities. The concepts and definitions underlying LAUS data come from the Current
Population Survey (CPS), the household survey that is the source of the national unemployment rate.
Key Uses: Key Data:
• Official source of civilian labor force and unemployment data for
7,500 subnational areas
• Used by numerous federal programs to determine eligibility and
to allocate funds
• Labor market research
• Policy analysis
• Regional planning
• Grant proposals
• Employment and unemployment for
regions, states, counties, cities and
other local divisions
Key Users: Data Available at:
• Federal programs use the data for allocations to states and areas,
as well as eligibility determinations for assistance.
• State and local governments use the estimates for planning and
budgetary purposes and to determine the need for local
employment and training services.
• Private industry, researchers, the media, and other individuals
use the data to assess localized labor market developments and
make comparisons across areas.
www.bls.gov/lau
Periodicity:
Monthly
Geographic Divisions Available:
Regional/State/County/City/MSA
Source: U.S. Department of Labor, Bureau of Labor Statistics

Key Resources for Workforce and Labor Market Information August 2017
Page 18
List
Quarterly Census of Employment and Wages (QCEW) Program
Summary: Primary Agency:
Local, state and national data on employment and wages by industry. U.S. Bureau of Labor Statistics
Description:
The Quarterly Census of Employment and Wages Program is a cooperative program involving the BLS and the State
Employment Security Agencies (SESAs). The QCEW program produces a comprehensive tabulation of employment
and wage information for workers covered by State unemployment insurance (UI) laws and Federal workers covered
by the Unemployment Compensation for Federal Employees (UCFE) program.
The QCEW program serves as a near census of monthly employment and quarterly wage information by 6-digit
NAICS industry at the national, State, and county levels. At the national level, the QCEW program publishes
employment and wage data for nearly every NAICS industry. At the State and area level, the QCEW program
publishes employment and wage data down to the 6-digit NAICS industry level, if disclosure restrictions are met.
Key Uses: Key Data:
• Detailed county and industry employment and wage data
• MSA employment and wage data by industry
• State employment and wage data by industry
• Quarterly rankings of the fastest growing counties by
employment and wages.
• Data totals for every NAICS industry and for every county, MSA,
and state
• Location Quotient
• Employment
• Establishments
• Wages
• Average weekly wage
• Average annual pay
Key Users: Data Available at:
• Sample frame for BLS business surveys (CES, OES, NCS, PPI,
JOLTS)
• SSEAs for state and local data
• Local governments and economic planners
• Managing UI system and trust funds
• Census Bureau for LEHD program
• Researchers and other federal agencies
www.bls.gov/cew
Periodicity:
Quarterly
Geographic Divisions Available:
National/State/Country/Metro
Sources: U.S. Department of Labor, Bureau of Labor Statistics; LMI Institute

Key Resources for Workforce and Labor Market Information August 2017
Page 19
List
Business Employment Dynamics (BED)
Summary: Primary Agency:
Quarterly statistics on job gains and losses, with time series. U.S. Bureau of Labor Statistics
Description:
Business Employment Dynamics data are quarterly series of gross job gains and gross job losses statistics for the
entire economy. These data track changes in employment at the establishment level, and thus provide a picture of the
dynamics underlying aggregate net employment growth statistics. The data used to construct the gross job gains and
gross job losses statistics are from the Quarterly Census of Employment and Wages (QCEW) program and include all
establishments subject to State unemployment insurance (UI) laws and Federal agencies subject to the
Unemployment Compensation for Federal Employees program. Each quarter, the State agencies edit and process the
data and send the information to BLS in Washington, DC. The data cover approximately 98 percent of all
employment; the major exclusions from UI coverage are the self-employed and certain nonprofit organizations..
Key Uses: Key Data:
• Analysis of national and state economic trends
• Identifying employment trends in specific industries
• Tracking the role of startups and established firms in the labor
market
• Gross jobs gains and losses
• Establishment
o Openings and expansions
o Closings and contractions
• By industry, establishment size and
age
Key Users: Data Available at:
• The Federal Reserve Board uses BED data on job creation and job
destruction.
• State Labor Market Information Bureaus use BED data to compare
state and national business cycle trends.
• The Small Business Administration uses BED data tabulated by
size of firm to measure job creation and destruction by small
businesses.
• National and local media use BED job flow, and firm size data to
explain and discuss economic trends.
• The OECD uses BED birth and death to measure entrepreneurship
in The OECD-Eurostat Entrepreneurship Indicators Program.
www.bls.gov/bdm
Periodicity:
Quarterly
Geographic Divisions Available:
National/State
Source: U.S. Department of Labor, Bureau of Labor Statistics

Key Resources for Workforce and Labor Market Information August 2017
Page 20
List
Occupational Employment Statistics (OES) Program
Summary: Primary Agency:
Local, state and national employment and wage data by occupation
and industry. U.S. Bureau of Labor Statistics
Description:
The Occupational Employment Statistics (OES) program conducts a semiannual mail survey designed to produce
estimates of employment and wages for specific occupations. The OES program collects data on wage and salary
workers in nonfarm establishments in order to produce employment and wage estimates for about 800 occupations.
Data from self-employed persons are not collected and are not included in the estimates. The OES program produces
these occupational estimates for the nation as a whole, by state, by metropolitan or nonmetropolitan area, and by
industry or ownership. The Bureau of Labor Statistics produces occupational employment and wage estimates for
over 450 industry classifications at the national level. The industry classifications correspond to the sector, 3-, 4-, and
selected 5- and 6-digit North American Industry Classification System (NAICS) industrial groups.
The OES program surveys approximately 200,000 establishments per panel (every six months), taking three years to
fully collect the sample of 1.2 million establishments. To reduce respondent burden, the collection is on a three-year
survey cycle that ensures that establishments are surveyed at most once every three years. The estimates for
occupations in nonfarm establishments are based on OES data collected for the reference months of May and
November. The OES survey is a federal-state cooperative program between the Bureau of Labor Statistics (BLS) and
State Workforce Agencies (SWAs).
Key Uses: Key Data:
• Analysis of occupational employment
• Analysis of occupational wages
• Development of occupational projections
• Vocational counseling and planning
• Industry skill and technology studies
• Market analysis
Employment and wages by:
• Occupations
• Industries
• Geographic areas
Key Users: Data Available at:
• State and local workforce investment boards for education and
employment needs
• Economic development for labor supply analysis
• Career counselors for labor demand analysis
• Employers for prevailing wages rates for specific occupations and
industries
• BLS and State Employment Security Agencies for employment
projections and identifying in-demand career
http://www.bls.gov/oes/
Periodicity:
Annual
Geographic Divisions Available:
National/State/Metro
Source: U.S. Department of Labor, Bureau of Labor Statistics
Key Resources for Workforce and Labor Market Information August 2017
Page 21
List
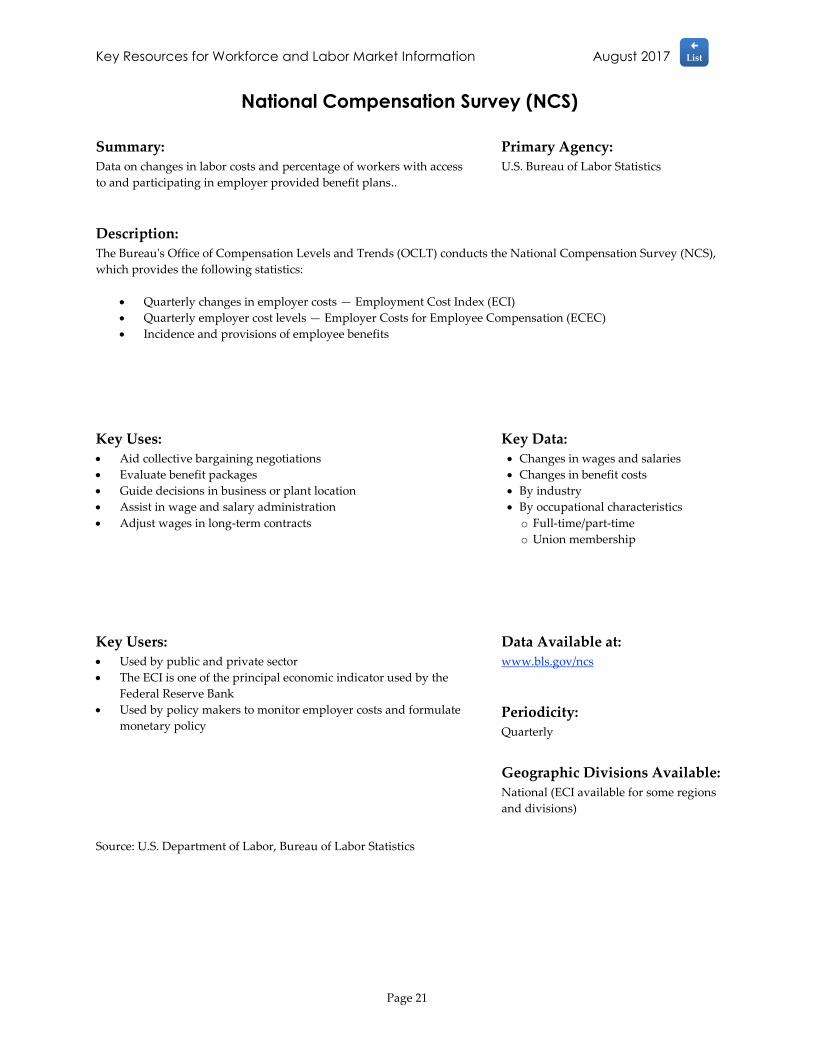
National Compensation Survey (NCS)
Summary: Primary Agency:
Data on changes in labor costs and percentage of workers with access
to and participating in employer provided benefit plans.. U.S. Bureau of Labor Statistics
Description:
The Bureau's Office of Compensation Levels and Trends (OCLT) conducts the National Compensation Survey (NCS),
which provides the following statistics:
• Quarterly changes in employer costs — Employment Cost Index (ECI)
• Quarterly employer cost levels — Employer Costs for Employee Compensation (ECEC)
• Incidence and provisions of employee benefits
Key Uses: Key Data:
• Aid collective bargaining negotiations
• Evaluate benefit packages
• Guide decisions in business or plant location
• Assist in wage and salary administration
• Adjust wages in long-term contracts
• Changes in wages and salaries
• Changes in benefit costs
• By industry
• By occupational characteristics
o Full-time/part-time
o Union membership
Key Users: Data Available at:
• Used by public and private sector
• The ECI is one of the principal economic indicator used by the
Federal Reserve Bank
• Used by policy makers to monitor employer costs and formulate
monetary policy
www.bls.gov/ncs
Periodicity:
Quarterly
Geographic Divisions Available:
National (ECI available for some regions
and divisions)
Source: U.S. Department of Labor, Bureau of Labor Statistics

Key Resources for Workforce and Labor Market Information August 2017
Page 22
List
The Job Openings & Labor Turnover Survey (JOLTS)
Summary: Primary Agency:
Produces data on job openings, hires, and separations. U.S. Bureau of Labor Statistics
Description:
This program produces a monthly study that has been developed to address the need for data on job openings, hires,
and separations. Estimates are based on data are collected from about 16,000 business and government
establishments each month. Estimates from the JOLTS program are not seasonally adjusted; therefore, comparisons
of JOLTS estimates should be based on the same month in different years. These data serve as a demand-side
indicator of labor shortages at the national level. Prior to JOLTS, there was no economic indicator of the unmet
demand for labor with which to assess the presence or extent of labor shortages in the U.S.
Key Uses: Key Data:
• National economic policy
• Business cycle analysis
• Industry retention rates
• Economic research and planning
• Industry studies
• Education and job training
• Rates and levels for:
o Job openings
o Hires
o Separations
• Quits
• Discharges
• By industry sector
Key Users: Data Available at:
• Economic development professionals use labor turnover data to
match businesses with labor market trends and opportunities.
• Workforce development and education and training providers use
turnover data to identify areas of labor market demand.
• Job seekers and career counselors use turnover data to inform
career and placement decisions.
• State and local policymakers use turnover data as an indicator of
economic health and to inform a variety of service and
development policies.
www.bls.gov/jlt
Periodicity:
Monthly
Geographic Divisions Available:
National
Source: U.S. Department of Labor, Bureau of Labor Statistics

Key Resources for Workforce and Labor Market Information August 2017
Page 23
List
Employment Projections Program (EP)
Summary: Primary Agency:
Develops and publishes estimates on the economy and labor market
10 years into the future. U.S. Bureau of Labor Statistics
Description:
The EP program analyzes historical data and information from secondary sources and biennially prepares projections
10 years into the future at the national level covering the future size and composition of the labor force, aggregate
economic growth, detailed estimates of industrial production, and industrial and occupational employment. These
data are a basis for developing estimates of occupational requirements by industry, evaluating the future size and
quality of the labor force, and a framework for analyzing future problems of labor utilization.
The Occupational Outlook Handbook (OOH) and Career Outlook are the principles publications of the EP program,
and provide a wealth of information regarding the projected state of the economy, including job openings by
occupation.
Key Uses: Key Data:
• Career exploration
• Education and training
• Economic policymaking
• Planning for public and private sectors
• Labor force by gender, race and age
• GDP and industrial output
• Employment by industry and
occupation
• Employment and labor productivity
• Job openings due to growth and
replacement needs
Key Users: Data Available at:
• Students, jobseekers, and career counselors, to make career
decisions or provide guidance
• Education and training specialists, to plan and develop education
and training programs
• Workforce investment boards, for policy and program planning
purposes and to determine jobs in demand
• Economic developers, to understand demand for skilled workers
• State labor market information offices, to develop state and
regional employment projections
(see www.projectionscentral.com)
www.bls.gov/emp
Periodicity:
Biennial
Geographic Divisions Available:
National
Source: U.S. Department of Labor, Bureau of Labor Statistics
Key Resources for Workforce and Labor Market Information August 2017
Page 24
List
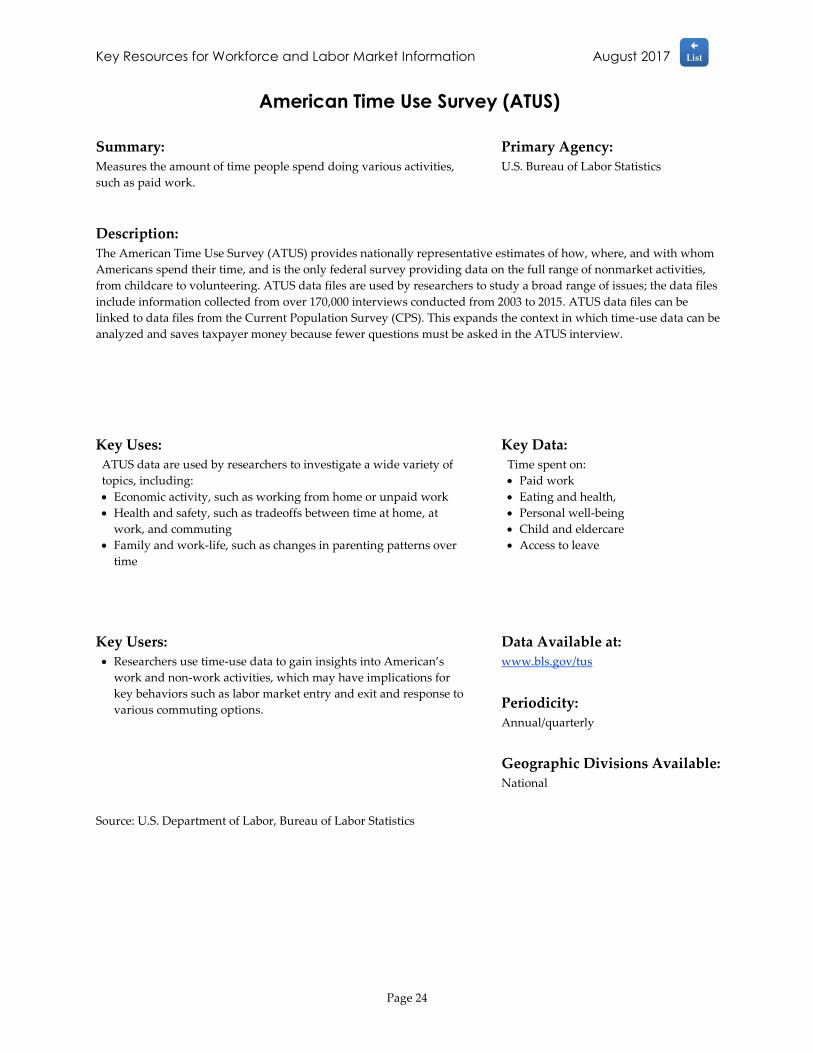
American Time Use Survey (ATUS)
Summary: Primary Agency:
Measures the amount of time people spend doing various activities,
such as paid work. U.S. Bureau of Labor Statistics
Description:
The American Time Use Survey (ATUS) provides nationally representative estimates of how, where, and with whom
Americans spend their time, and is the only federal survey providing data on the full range of nonmarket activities,
from childcare to volunteering. ATUS data files are used by researchers to study a broad range of issues; the data files
include information collected from over 170,000 interviews conducted from 2003 to 2015. ATUS data files can be
linked to data files from the Current Population Survey (CPS). This expands the context in which time-use data can be
analyzed and saves taxpayer money because fewer questions must be asked in the ATUS interview.
Key Uses: Key Data:
ATUS data are used by researchers to investigate a wide variety of
topics, including:
• Economic activity, such as working from home or unpaid work
• Health and safety, such as tradeoffs between time at home, at
work, and commuting
• Family and work-life, such as changes in parenting patterns over
time
Time spent on:
• Paid work
• Eating and health,
• Personal well-being
• Child and eldercare
• Access to leave
Key Users: Data Available at:
• Researchers use time-use data to gain insights into American’s
work and non-work activities, which may have implications for
key behaviors such as labor market entry and exit and response to
various commuting options.
www.bls.gov/tus
Periodicity:
Annual/quarterly
Geographic Divisions Available:
National
Source: U.S. Department of Labor, Bureau of Labor Statistics
Key Resources for Workforce and Labor Market Information August 2017
Page 25
List
Consumer Expenditure Survey Program (CE)
Summary: Primary Agency:
Information on the buying habits of America’s consumers. Conducted by U.S. Census Bureau
For U.S. Bureau of Labor Statistics
Description:
The Consumer Expenditure Survey (CE) program consists of two surveys, the Quarterly Interview Survey and the
Diary Survey, that provide information on the buying habits of America's consumers, including data on their
expenditures, income, and consumer unit (families and single consumers) characteristics. The survey data are
collected for the Bureau of Labor Statistics by the U.S. Census Bureau.
The CE is important because it is the only Federal survey to provide information on the complete range of consumers'
expenditures and incomes, as well as the characteristics of those consumers.
Key Uses: Key Data:
• Basic source of data for revising the items and weights in the
market basket of consumer purchases to be priced for the
Consumer Price Index.
• Cost of raising a child, produced by the USDA.
• Construction of statistical measures of consumption.
• Analysis of expenditure patterns by characteristics.
• Market research studies.
• Economic research.
• Consumer guidance materials.
• Annual income and expenditures
• By various demographic
characteristics
Key Users: Data Available at:
• Policymakers to assess the impact of policy changes on economic
groups.
• The Census Bureau as the sours of the Supplemental Poverty
Measure.
• Researchers investigate consumer spending patterns.
• Updating the market basket of goods used to develop the CPI.
www.bls.gov/cex
Periodicity:
Annual (w/ mid-year update)
Geographic Divisions Available:
National/Regional/Metro
Source: U.S. Department of Labor, Bureau of Labor Statistics

Key Resources for Workforce and Labor Market Information August 2017
Page 26
List
Injuries, Illness and Fatalities Program (IIF)
Summary: Primary Agency:
Information on work-related injuries, illnesses, and fatalities. U.S. Bureau of Labor Statistics
Description:
The Injuries, Illnesses, and Fatalities (IIF) program provides annual information on the rate and number of work-
related injuries, illnesses, and fatal injuries, and how these statistics vary by incident, industry, geography, occupation,
and other characteristics. These data are collected through the Survey of Occupational Injuries and Illnesses (SOII) and
the Census of Fatal Occupational Injuries (CFOI).
Since 1972, the survey has reported annually on the number of workplace injuries and illnesses in private industry
and the frequency of those incidents. With the 1992 survey, BLS began collecting additional information on the more
seriously injured or ill workers in the form of worker and case characteristics. At that time, BLS also initiated a
separate Census of Fatal Occupational Injuries to count these tragic events more effectively than had been possible in
the survey.
Key Uses: Key Data:
• Identification and correction of hazards in the workplace. • Summary data: Number and rate of
injuries and illnesses by industry
• Case and demographic data: Detailed
data on the demographics of ill or
injured workers and their conditions
• Fatal injury data: information on
workers, incidents, and equipment
involved
Key Users: Data Available at:
• National and state policy makers to identify areas that may benefit
from policy intervention
• Occupational Safety and Health Administration uses the statistics
to help determine where additional measures are needed to
improve safety programs.
• Private industry to design and improve workplace safety
interventions
http://www.bls.gov/iif/home.htm
Periodicity:
Annual
Geographic Divisions Available:
National/State
Source: U.S. Department of Labor, Bureau of Labor Statistics
Key Resources for Workforce and Labor Market Information August 2017
Page 27
List
Occupational Requirements Survey (ORS)
Summary: Primary Agency:
A new survey of establishments collecting information about
occupational requirements, demands and, conditions. U.S. Bureau of Labor Statistics
Description:
The Occupational Requirements Survey (ORS) is a new survey designed to collect data about the requirements of
work in the national economy conducted under an interagency agreement with the Social Security Administration
(SSA). BLS will collect and publish data on the following information:
• Physical demands of work, ranging from keyboarding to lifting
• Environmental conditions such as extreme heat and cold
• Vocational preparation including education, prior work experience, and training
• Mental and cognitive demands of work including decision making and communication
Key Uses: Key Data:
• Adjudication of disability claims
• Finding occupations that match individual workers’ qualifications
• Findings jobs that are related on key dimensions such as training
requirements or skills used
• Potentially comparing occupational requirements between
geographic locations or over time
• Initial publication of data planned by
end of 2016
Key Users: Data Available at:
• U.S. Social Security Administration
• Job seekers and career counselors looking for detailed information
about the requirements associated with particular occupations
• Researchers interested in the nature of occupations and work
www.bls.gov/ncs/ors
Periodicity:
Annual (planned)
Geographic Divisions Available:
National
Source: U.S. Department of Labor, Bureau of Labor Statistics
Key Resources for Workforce and Labor Market Information August 2017
Page 28
List
National Longitudinal Surveys (NLS)
Summary: Primary Agency:
A set of longitudinal surveys that track sample cohorts over time,
with information on educational and employment experiences. U.S. Bureau of Labor Statistics
Description:
The National Longitudinal Surveys (NLS) are a set of surveys designed to gather information at multiple points in
time on the labor market activities and other significant life events of several groups of men and women. For more
than 4 decades, NLS data have served as an important tool for economists, sociologists, and other researchers.
Includes the National Longitudinal Survey of Youth 1997 (NLSY97), which is designed to document the transition
from school to work and into adulthood. It collects extensive information about youths' labor market behavior and
educational experiences over time. Employment information focuses on two types of jobs, "employee" jobs where
youths work for a particular employer, and "freelance" jobs such as lawn mowing and babysitting. These distinctions
will enable researchers to study effects of very early employment among youths.
Key Uses: Key Data:
• Education, Training, and Achievement Scores: information about
high school and college experience, types of training, and
cognitive test scores
• Employment: extensive history of employment over time,
including wages, hours, occupation, industry, and job search.
• Household, Geography, and Contextual Variables: household
composition, location, and demographics
• Education
o Schooling history
o Courses of study
o Test performance
o Timing and types of degrees
o Post-secondary schooling
• Employment
o Start and stop dates
o Occupation and industry
o Hours and earnings
o Job search
Key Users: Data Available at:
• Educators and trainers to learn about students’ educational
experiences and labor market outcomes and to guide the design of
educational and training programs.
• Academic researchers to better understand youths’ progression
through their academic careers and into the labor market,
including other factors that may affect labor market outcomes.
https://www.bls.gov/nls/home.htm
Periodicity:
Biennial
Geographic Divisions Available:
National
Source: U.S. Department of Labor, Bureau of Labor Statistics

Key Resources for Workforce and Labor Market Information August 2017
Page 29
List
Modeled Wage Estimates
Summary: Primary Agency:
Experimental data set that combines information from the OES and
NCS to produce more detailed wage estimates. U.S. Bureau of Labor Statistics
Description:
The Occupational Employment Statistics (OES) and National Compensation Survey (NCS) programs have produced
estimates by borrowing from the strength and breath of each survey to provide more details on occupational wages
than either program provides individually.
The Modeled Wage Estimates provide annual estimates of average hourly wages for occupations by selected job
characteristics and within geographical location. The job characteristics include bargaining status (union and
nonunion), part- and full-time work status, incentive- and time-based pay, and work levels by occupation.
Whereas direct estimates are based on survey responses only from the particular geographic area to which the
estimate refers, modeled wage estimates use survey responses from larger areas to fill in information for smaller areas
where the sample size is not sufficient to produce direct estimates. Modeled wage estimate require the assumption
that the patterns to responses in the larger area hold in the smaller area.
Key Uses: Key Data:
• Analysis of wages by occupation and job characteristics
• Economic development and planning
• Career counseling and advising
• Analysis of labor markets for union negotiations and plant
location decisions
• Wage estimates for occupations by:
o Geographical location
o Selected job characteristics:
o Full-time/part-time
o Union/nonunion
o Incentive/time-bases
o Work level
Key Users: Data Available at:
• Businesses looking for information on wages for jobs with specific
characteristics
• Economic development planners
• Workforce development professions
• Job seekers and career counselors and advisors
www.bls.gov/ncs
Periodicity:
TBD (Estimates for 2014 and 2015 are
currently available.)
Geographic Divisions Available:
States/Metropolitan areas (availability
varies)
Source: U.S. Department of Labor, Bureau of Labor Statistics
Key Resources for Workforce and Labor Market Information August 2017
Page 30
List
Consumer Price Index and Producer Price Index (CPI & PPI)
Summary: Primary Agency:
Indexes of the prices consumers pay and producers receive over time. U.S. Bureau of Labor Statistics
Description:
The Consumer Price Indexes (CPI) program produces monthly data on changes in the prices paid by urban consumers
for a representative basket of goods and services.
The Producer Price Index (PPI) program measures the average change over time in the selling prices received by
domestic producers for their output. The prices included in the PPI are from the first commercial transaction for many
products and some services.
Key Uses: Key Data:
• CPI
o Economic indicator of inflation
o Deflator for other economic series
o Income payment adjustments (cost-of-living)
• PPI
o Referenced in contracts
o National price indicator
o Used as deflator for other economic series data
• CPI time series available for a variety
of geographic divisions
• PPI time series available for
thousands of commodities and
various levels of aggregation
Key Users: Data Available at:
• Policy makers and government agencies to adjust fixed payments
over time (cost-of-living adjustments).
• Researchers and analysts to compare prices and purchasing power
across disparate geographies and time frames.
• Borrowers and lenders to set loan terms.
www.bls.gov/cpi
www.bls.gov/ppi
Periodicity:
Monthly
Geographic Divisions Available:
National/Regional/City/Metro
Source: U.S. Department of Labor, Bureau of Labor Statistics

Key Resources for Workforce and Labor Market Information August 2017
Page 31
List
Workforce Information Grants to the States (WIGS)
Summary: Primary Agency:
State workforce agencies use WIGS to develop and disseminate
essential state and local WLMI for job seekers, employers, educators,
economic developers, and others.
U.S. Employment and Training
Administration
Description:
State workforce agencies use WIGS to develop and disseminate essential state and local WLMI for a range of customer
groups:
1) job seekers;
2) businesses/employers;
3) workforce and labor market intermediaries, such as employment, school, and career counselors, and case
managers at AJCs, who help individuals find a job or make career decisions, or engage businesses seeking
skilled workers;
4) program and service planners at educational institutions and community based organizations; 5) policy
makers, including state and local workforce development boards (WDBs);
5) partners, such as economic development entities and human resource professionals; and
6) other customers, including recipients of workforce development grants, researchers, commercial data
providers, and the media.
Grantees have considerable flexibility to meet customer needs, but must consult their customers and prepare several
types of products. Grantees must produce a workforce information database, state and local industry and
occupational employment projections, and a statewide annual economic analysis report for state and local policy
makers.
Key Uses: Key Data:
• State WLMI Agencies use WIGS to produce:
o State workforce and information databases
o State and local industry and occupational employment
projections
o Statewide annual economic analysis reports
N/A
Key Users: Info Available at:
• Awarded to state WLMI agencies to support their efforts to
develop and disseminate essential state and local workforce and
labor market information
• State workforce and information databases provide valuable
information for job seekers, employers, and labor market
intermediaries
• State employment projections assist job seekers, education
providers and planners and workforce development efforts
• Statewide annual economic analyses are used by state and local
policy makers and in economic development and planning
https://lmi.worfocegps.org/resources
Periodicity:
Annual
Geographic Applicability:
Grants awarded at state level
Source: U.S. Department of Labor, Employment and Training Administration; WorkforceGPS; LMI Central

Key Resources for Workforce and Labor Market Information August 2017
Page 32
List
Occupational Information Network (O*NET)
Summary: Primary Agency:
Maintains a database of occupational descriptions based on the
Standard Occupational Classification (SOC) system. North Carolina Department of Commerce
with funding from USDOL/ETA
Description:
The O*NET program is the nation's primary source of occupational information. Central to the project is the O*NET
database, containing information on hundreds of standardized and occupation-specific descriptors. The database,
which is available to the public at no cost, is continually updated by surveying a broad range of workers from each
occupation. Information from this database forms the heart of O*NET OnLine, an interactive application for exploring
and searching occupations. The database also provides the basis for our Career Exploration Tools, a set of valuable
assessment instruments for workers and students looking to find or change careers.
Key Uses: Key Data:
• Career exploration for students, mid-career transitions, and for
veterans
• Guidance with classifying occupations according to the SOC
• Crosswalk between different occupational classification systems
• Over 900 occupational descriptions
corresponding to SOC codes,
including the applicable knowledge,
skills and abilities for each occupation
• Information on career clusters, green
sector and STEM occupations
Key Users: Data Available at:
• Job seekers
• Career counselors
• Human resources professionals
• Economics and social science researchers
www.onetonline.org
Periodicity:
Rolling
Geographic Divisions Available:
National
Source: National Center for O*NET Development

Key Resources for Workforce and Labor Market Information August 2017
Page 33
List
Competency Model Clearinghouse (CMC)
Summary: Primary Agency:
Online portal for competency models, which relate the basic KSAs
and training needed for entry-level workers in a variety of industries. Supported by U.S. Employment and
Training Administration
Description:
The Competency Model Clearinghouse (CMC) is a Web site sponsored by the U.S. Department of Labor, Employment
and Training Administration (ETA). The goal of the clearinghouse is to inform the public workforce system about the
value, development, and uses of competency models.
A competency model is a collection of multiple competencies that together define successful performance in a defined
work setting. A model provides a clear description of what a person needs to know and be able to do – the knowledge,
skills, and abilities – to perform well in a specific job, occupation, or industry.
In response to workforce challenges, the ETA and industry partners have collaborated to develop and maintain
dynamic models of the foundation and technical competencies that are necessary in economically vital industries and
sectors of the American economy. The goal of the effort is to promote an understanding of the skill sets and
competencies that are essential to educate and train a globally competitive workforce.
Key Uses: Key Data:
• Competency models articulate the business and industry
requirements that are essential components for the development of
curriculum, skill assessment instruments, and certifications.
• Competency models also facilitate the development of career
pathways and career lattices providing the framework for career
advancement.
• Competency models are the foundation for important human
resource functions such as: recruitment and hiring, training and
development, and performance management.
Competency models are available for
twenty-six industries.
Each model consists of competencies
relevant to a particular industry.
Competencies are the ability to apply or
uses a set of related knowledge, skills,
and abilities (KSAs) in a defined work
setting.
Key Users: Info Available at:
• WLMI system partners to create a common understanding among
employers, educators, and other labor market intermediaries.
• Business and industry partners to clearly articulate their workforce
needs and improve hiring practices.
• Workforce Investment Boards to identify in-demand KSAs and
guide training and planning.
• American Workforce Centers to design programs that meet local
labor demands.
• Education and training providers to target training to local
employer needs.
www.CareerOneStop.org
Periodicity:
Rolling
Geographic Applicability:
National
Source: U.S. Department of Labor, Employment and Training Administration; CareerOneStop.org; Competency
Model Clearinghouse

Key Resources for Workforce and Labor Market Information August 2017
Page 34
List
Projections Managing Partnership (PMP)
Summary: Primary Agency:
Provides states with guidance and technical assistance on projections
requirements funded through the Workforce Investment Grants. Supported by U.S. Employment and
Training Administration
Description:
The Projections Managing Partnership (PMP) operates an integrated, nationwide program of state and local
projections. The PMP helps projections customers make informed decisions based on the most reliable and relevant
occupational and industry outlook information. Funding for the PMP is provided by the U.S. Department of Labor,
Employment & Training Administration, with technical support from the Bureau of Labor Statistics and other entities
across the country. PMP’s goals include but are not limited to the following:
• Operating an integrated long- and short-term industry and occupational projections program.
• Understanding the needs of projections users and customers.
• Responding to customer needs in a demand-driven system.
• Refining operating processes to improve product quality and delivery time.
• Deploying integrated staff training.
• Improving projections analysis and presentation.
Key Functions: Key Data:
• Creating, maintaining, and improving a shared software and
methodology.
• Developing/providing a network of subject matter experts (and
analysts).
• Offering professional development for analysts (promote
professional excellence to improve quality of employment
projections).
• Designing new products and processes for users.
• Representing the network of analysts to national stakeholders
(workforce, education, and economic development).
• Engaging federal partners to support and recognize our work/use
federal methods.
The PMP provides technical support and
assistance to state WLMI agencies.
State LMI agencies develop state-level
long- and short-term employment
projections, which are available from
www.projectionscentral.com.
Key Users: Info Available at:
• State WLMI agencies rely on the PMP for guidance, support, and
standards in developing short and long-term occupational
projections
• State occupational projections are used by a wide variety of WLMI
customers and stakeholders.
https://support.projectionscental.com
Periodicity:
Rolling
Geographic Applicability:
National
Source: Projection Managing Partnership

Key Resources for Workforce and Labor Market Information August 2017
Page 35
List
Analyst Resource Center (ARC)
Summary: Primary Agency:
Develops and maintains a standardized Workforce Information
Database structure for use by state WLMI agencies. Supported by U.S. Employment and
Training Administration
Description:
The Analyst Resource Center (ARC) is a joint effort between the U.S. Employment and Training Administration and
the states to enhance information delivery to workforce customers in the employment, education and economic
development sectors. The ongoing design, development, and maintenance of the Workforce Information Database is
of primary concern to the ARC, but the Center also provides a range of additional products and services.
The Workforce Information Database (WIDb) is a normalized relational database structure developed for the storage
and maintenance of employment statistics, labor market information, employer listings and related economic and
demographic data from all states and territories in the U.S.
Key Functions: Key Data:
• Ongoing design, development, and maintenance of the Workforce
Information Database.
• Employer Database with information on more than 10 million
businesses across the country.
• National Crosswalk Service Center (NCSC) which functions as a
clearinghouse for national, state, and local data from standardized
sources.
• Capacity Building through technical assistance and training for
federal and state staff relating to the Workforce Information
Database.
• Workforce Information Database
standardized database structure and
related resources
• Employer Database
Key Users: Info Available at:
• State database administrators who receive training on the
operation of the ARC website.
• Researchers and other WLMI customers who rely on the technical
support and products provided the ARC.
www.workforceinfodb.org
Periodicity:
Rolling
Geographic Applicability:
National
Source: Analyst Resource Center

Key Resources for Workforce and Labor Market Information August 2017
Page 36
List
Local Employment and Wage Information System (LEWIS)
Summary: Primary Agency:
An automated system for producing custom occupational wage and
employment publications from the results of the annual Occupational
Employment Survey.
Supported by U.S. Employment and
Training Administration
Description:
LEWIS is an automated system for producing custom occupational wage and employment publications from the
results of the annual Occupational Employment Survey. This project was developed by the North Carolina
Department of Commerce in cooperation with the Bureau of Labor Statistics and the OES Policy Council. Currently
the LEWIS system is maintained by the State of Utah- Department of Technology Services.
Key Functions: Key Data:
• Utilized by state WLMI agencies to develop staffing patterns for
the industry and occupational employment projections. • Wage and employment data for all
areas, including those not supported
by the BLS.
• Includes underlying microdata.
Key Users: Info Available at:
• State WLMI agencies use LEWIS to access data need to generate
industry and occupational employment projections. www.oes-eds.com
Periodicity:
Annual
Geographic Applicability:
State/Metro/Micro
Sources: Price, Tom; “Analyst Resource Center E-News;” Summer, 2015; The Analyst Resource Center; LEWIS Home
Page; www.oes-eds.com.
Key Resources for Workforce and Labor Market Information August 2017
Page 37
List
National Crosswalk Service Center (NCSC)
Summary: Primary Agency:
Clearinghouse for federal occupation, education and industry
classifications and related data. Supported by U.S. Employment and
Training Administration
Description:
The National Crosswalk Service Center (NCSC) is a federally-funded national clearinghouse for classification
information about occupations, training programs and industries. The NCSC has been operated by the State of Iowa
since 1983 under a series of grants from federal agencies. Funding for the Center has been provided by the
Employment and Training Administration, U.S. Department of Labor since 1996. Nearly all of the material
distributed by the NCSC is produced by federal agencies including:
• Bureau of Labor Statistics
• National O*NET Center
• Defense Manpower Data Center
• Bureau of Census, U.S. Department of Commerce
• Bureau of Economic Analysis, U.S. Department of Commerce
• Office of Management and Budget
Key Functions: Key Data:
A central location to retrieve information about:
• Federal occupational and education classifications
• Workforce Information Database files
• O*NET data and files
Also maintains the ARC website and the Workforce Information
Database Wiki web site.
• CIP to SOC crosswalks
• Military-Civilian crosswalks
• NAICS-SIC industry crosswalks
• SOC-NAICS linkages
• Current-prior classification version
crosswalks
Key Users: Info Available at:
Many WLMI customers rely on the crosswalks produced by the
NCSC to relate occupational employment and projections (SOC) to
education and training programs (CIP), including:
• Career counselors and advisors to match job seekers to openings
based on prior experience.
• Educators and trainers to identify training programs associated
with in-demand occupations.
• Labor market analysts and researchers to identify mismatches
between available jobs and job seekers.
• State and local policy makers and economic development
professionals to plan for labor market and training requirements.
www.xwalkcenter.org
Periodicity:
Rolling
Geographic Applicability:
National
Source: National Crosswalk Center

Key Resources for Workforce and Labor Market Information August 2017
Page 38
List
Workforce Data Quality Initiative Grant Program (WDQI)
Summary: Primary Agency:
Federal grant program to support state WLMI agencies in
development of workforce longitudinal administrative databases. U.S. Employment and Training
Administration
Description:
In 2010, the U.S. Department of Labor (DOL) launched round one of WDQI to fund the development, or enhancement,
of state workforce longitudinal administrative databases. These state longitudinal databases will, at a minimum,
include information on programs that provide training and employment services and will be linked longitudinally at
the individual level to allow for analysis leading to enhanced opportunity for program evaluation and better
information for customers and stakeholders of the workforce system.
WDQI funding is made available through competitive grants administered by DOL in support of a parallel and much
larger effort, the Statewide Longitudinal Data System (SLDS) grants administered by the U.S. Department of
Education. These two programs encourage the development of state education and workforce longitudinal
administrative databases. Ultimately, databases developed through WDQI should be linked to education data at the
individual level. Collecting these and other data sources longitudinally will provide a comprehensive picture of
workers' earnings throughout their careers. Through analysis, these data will demonstrate the relationship between
education and training programs, as well as the additional contribution of the provision of other employment services.
Key Functions: Key Data:
• Fund state workforce longitudinal administrative databases.
• Once complete, and connected to SLDS, these databases will
facilitate analysis of:
o The relationship of education and training
o The contribution of providing other employment services
NA
Key Users: Info Available at:
• Grants are awarded to state to fund the development of their
longitudinal workforce databases
• Once complete, the databases will of value to a wide variety of
labor market stakeholders, including:
o Education policy makers and educators for tailoring education
programs to labor market needs and to demonstrate the
contribution of education and training.
o Workforce development professionals and policy makers to
identify educational and training needs to meet labor market
demand
www.doleta.gov/performance
Periodicity:
Annual
Geographic Applicability:
National
Source: U.S Department of Labor, Employment and Training Administration

Key Resources for Workforce and Labor Market Information August 2017
Page 39
List
American Community Survey (ACS)
Summary: Primary Agency:
An ongoing survey that provides vital information on a yearly basis
about our nation and its people U.S. Census Bureau
Description:
The American Community Survey collects data from a sample of 3 million households each year, in every county, and
American Indian and Native Alaska area, as well as in the Hawaiian Homelands and Puerto Rico. The ACS provides
the same sort of data as the census long form. Unlike the decennial censuses, however, the ACS is a continuous
national survey.
Rather than collect data as of a single decennial reference point, the ACS collects data nearly every day and
summarizes it over 1-, 3-, and 5-year periods. Much like the census, the ACS provides a picture of the social, economic,
and housing characteristics of the population, but it has the added advantage of providing these data on a yearly
basis.
Key Uses: Key Data:
• Annual data for states and most metropolitan statistical areas
• 5-year estimates down to the ZIP code, Census track and even
Census block group
Estimates of population characteristics,
including:
• Demographic
• Social
• Economic
• Housing
Key Users: Data Available at:
• Public officials, planners, and entrepreneurs use this information
to assess the past and plan the future.
• Information from the survey generates data that help determine
how more than $400 billion in federal and state funds are
distributed each year.
https://www.census.gov/programs-
surveys/acs/data.html
Periodicity:
Updated annually
Geographic Divisions Available:
National – Census block groups
Source: U.S. Department of Commerce, Census Bureau

Key Resources for Workforce and Labor Market Information August 2017
Page 40
List
CPS Annual Social Economic Supplement (ASEC)
Summary: Primary Agency:
Annual supplement to the CPS that provides additional detail on the
socio-economic characteristics of the population. U.S. Census Bureau
Description:
The ASEC is an annual supplement to the CPS that provides data concerning family characteristics, household
composition, marital status, education attainment, health insurance coverage, foreign-born population, previous
year’s income from all sources, work experience, receipt of noncash benefit, poverty, program participation, and
geographic mobility.
The key purpose of the CPS ASEC is to provide timely and detailed estimates of income and poverty and to measure
change in these national-level estimates. The CPS ASEC is the official source of the national poverty estimates. (State
and local estimates are reported from the American Community Survey.) The CPS ASEC is also the key source of
national estimates for health insurance coverage, including the uninsured rate, with detail on the rates of private and
government health insurance coverage.
Key Uses: Key Data:
National estimates for:
• Median income and income distribution
• Poverty
• Health insurance coverage
• Educational attainment
Data can be
CPS labor force data, plus additional
data on:
• Workforce experience
• Educational attainment
• Income and benefits/non-cash income
• Migration
Key Users: Data Available at:
• Federal agencies use CPS ASEC data to report key indicators of the
economic well-being of the U.S. population.
• Policymakers use income, poverty, insurance, and educational
attainment data to guide and evaluate relevant national policies.
• Researchers use CPS ASEC data to identify and study economic
trends and the impact on the population.
www.bls.gov/cps
Periodicity:
Annual
Geographic Divisions Available:
National/State/Regional/Select Counties
and Metro areas
Source: U.S. Department of Commerce, Census Bureau

Key Resources for Workforce and Labor Market Information August 2017
Page 41
List
County Business Patterns (CBP)
Summary: Primary Agency:
County Business Patterns (CBP) is an annual series that provides
subnational economic data by industry. U.S. Census Bureau
Description:
County Business Patterns (CBP) includes the number of establishments, employment during the week of March 12,
first quarter payroll, and annual payroll. Data for establishments are presented by geographic area, 6-digit NAICS
industry, legal form of organization (U.S. and state only), and employment size class.
CBP basic data items are extracted from the Business Register (BR), a database of all known single and multi-
establishment employer companies maintained and updated by the U.S. Census Bureau. The BR contains the most
complete, current, and consistent data for business establishments. The annual Company Organization Survey
provides individual establishment data for multi-establishment companies. Data for single-establishment companies
are obtained from various Census Bureau programs, such as the Economic Census, Annual Survey of Manufactures
and Current Business Surveys, as well as from administrative record sources.
Key Uses: Key Data:
• Studying the economic activity of small areas
• Analyzing economic changes over time
• Benchmark for other statistical series, surveys, and databases
between economic censuses
• Number of establishments
• Paid employees on March 12
• First-quarter payroll
• Annual payroll
• Data by Industry for Congressional
Districts, Counties, and ZIP Codes
• Only annual source of establishment
data by industry at county level for
Puerto Rico and Island Areas
Key Users: Data Available at:
• Businesses use the data for analyzing market potential, measuring
the effectiveness of sales and advertising programs, setting sales
quotas, and developing budgets.
• Government agencies use the data for administration and
planning.
• Federal agencies use the data to determine employee
concentrations and trends by industry.
https://www.census.gov/programs-
surveys/cbp/data.html
Periodicity:
Annual
Geographic Divisions Available:
National/State/County/Metro/
ZIP/Congressional District
Source: U.S. Department of Commerce, Census Bureau

Key Resources for Workforce and Labor Market Information August 2017
Page 42
List
Longitudinal Employer-Household Dynamics (LEHD)
Summary: Primary Agency:
Employment, earnings, and job flow estimates based on state UI data
shared under the Local Employment Dynamics (LED) partnership. U.S. Census Bureau
Description:
Under the LED Partnership, states agree to share Unemployment Insurance earnings data and the Quarterly Census of
Employment and Wages (QCEW) data with the Census Bureau. The LEHD program combines these administrative
data, additional administrative data and data from censuses and surveys. From these data, the program creates
statistics on employment, earnings, and job flows at detailed levels of geography and industry and for different
demographic groups. In addition, the LEHD program uses these data to create partially synthetic data on workers'
residential patterns.
Key Uses: Key Data:
LEHD data are used to produce valuable applications, including:
• QWI Indicators and the QWI Explorer application
• LODES Data and the OnTheMap application
• Job-to-Job Flows (beta)
• QWI Indicators
o Employment
o Job creation
o Earnings
o Report based on firm characteristics
• LODES Data
o Origin-Destination data allow
analysis of labor sheds and
commuting patterns
Key Users: Data Available at:
• Local economic specialists to identify development opportunities
and assess available labor supply and worker commuting and
residential patterns.
• Workforce development specialists to identity areas of high
demand and monitor labor market trends.
• Job seekers and career counselors to inform career and training
decisions.
• Policy makers to monitor the health of various industries and
occupations in their localities.
http://lehd.ces.census.gov/data/
Periodicity:
Quarterly
Geographic Divisions Available:
National/State/WIB/County/Metro/Micro
Source: U.S. Department of Commerce, Census Bureau

Key Resources for Workforce and Labor Market Information August 2017
Page 43
List
QWI Explorer
Summary: Primary Agency:
Employment, earnings, and job flow estimates based on state UI data
shared under the Local Employment Dynamics (LED) partnership. U.S. Census Bureau
Description:
QWI Explorer is a new, web-based analysis tool that enables comprehensive access to the full depth and breadth of the
Quarterly Workforce Indicators (QWI) dataset. Through charts, maps and interactive tables, users can compare, rank
and aggregate QWIs across time, geography, and/or firm and worker characteristics on the fly.
QWI Explorer makes the entire QWI dataset available for visualization in line charts, bar charts, and thematic maps.
The application's intuitive dashboard allows for the construction of pivot tables to compare and rank labor-force
indicators such as employment, job creation and destruction, wages, and hires across a wide range of firm and worker
characteristics. Potential analyses include a longitudinal look at wages by worker sex and age across counties, ranking
job creation rates of young firms across NAICS industry groups, and comparing hiring levels by worker race and
education levels across a selection of Metropolitan Areas.
Key Uses: Key Data:
• Access all 32 workforce indicators, all available years/quarters, all
firm and worker characteristics, and all geographic tabulation
areas (national, state, county, metro/micro areas, and workforce
investment areas).
• Explore the many detailed interactions between firms and workers
by building the exact table, line chart, bar chart, or thematic map
required to analyze – and inspire subsequent – labor force
questions.
• The synchronized table and chart/map interact to provide multiple
visual perspectives on the data. Visualizations, data tables, and
reports are simple to download and share.
• QWI Indicators
o Employment
o Job creation
o Earnings
o Report based on firm characteristics
Key Users: Data Available at:
• Local economic specialists to identify development opportunities
and assess available labor supply and worker commuting and
residential patterns.
• Workforce development specialists to identity areas of high
demand and monitor labor market trends.
• Job seekers and career counselors to inform career and training
decisions.
• Policy makers to monitor the health of various industries and
occupations in their localities.
http://lehd.ces.census.gov/data/
Periodicity:
Quarterly
Geographic Divisions Available:
National/State/WIB/County/Metro/Micro
Source: U.S. Department of Commerce, Census Bureau
Key Resources for Workforce and Labor Market Information August 2017
Page 44
List
OnTheMap
Summary: Primary Agency:
Employment, earnings, and job flow estimates based on state UI data
shared under the Local Employment Dynamics (LED) partnership. U.S. Census Bureau
Description:
OnTheMap is an online mapping and reporting application showing where workers are employed and where they
live with companion reports on worker characteristics and optional filtering by age, earnings, or industry groups. It
provides an easy-to-use interface for creating, viewing, printing and downloading workforce related maps, profiles,
and underlying data.
Based on 2002–2013 LEHD Origin Destination Employment Statistics (LODES), OnTheMap is a unique resource for
mapping the travel patterns of workers and identifying small-area workforce characteristics.
A total of 50 state partners are currently featured, showing data for 12 years (2002 through 2013). The latest version of
OnTheMap was released in August 2015.
Key Uses: Key Data:
• Census block-level coverage for home and work areas in 50
partner states/territories with consecutive years of data from 2002
to 2014. Available characteristics include worker age, earnings,
industry sector, worker race, worker ethnicity, worker educational
attainment, worker sex, firm age and firm size.
• Six different analysis types are available for users to analyze,
compare, and summarize a vast amount of labor force data for
user-defined or Census-standard areas. Each set of results are
presented through interactive maps, charts, and reports.
• Results can be exported to a report (PDF, HTML, XLS), to a map
(KML or Shapefile), or to other forms (PNG images or composite
PDF). Users can also save their analysis settings for future use in
OnTheMap.
• LODES Data
o Origin-Destination data allow
analysis of labor sheds and
commuting patterns
Key Users: Data Available at:
• Private industry and economic development specialists to assess
available labor market supply and commuting patterns.
• Policymakers for planning infrastructure investments and policy.
• Researchers and analysts to investigate worker commuting
patterns and responses.
http://lehd.ces.census.gov/data/
Periodicity:
Annual (2007-2014 currently available)
Geographic Divisions Available:
National/State/WIB/County/Metro/Micro
Source: U.S. Department of Commerce, Census Bureau

Key Resources for Workforce and Labor Market Information August 2017
Page 45
List
Nonemployer Statistics
Summary: Primary Agency:
Annual data on number and receipts of businesses with no
employees. U.S. Census Bureau
Description:
Nonemployer Statistics is an annual series that provides subnational economic data for businesses that have no paid
employees and are subject to federal income tax. The data consist of the number of businesses and total receipts by
industry. Most nonemployers are self-employed individuals operating unincorporated businesses (known as sole
proprietorships), which may or may not be the owner's principal source of income.
The majority of all business establishments in the United States are nonemployers, yet these firms average less than 4
percent of all sales and receipts nationally. Due to their small economic impact, these firms are excluded from most
other Census Bureau business statistics (the primary exception being the Survey of Business Owners). The
Nonemployers Statistics series is the primary resource available to study the scope and activities of nonemployers at a
detailed geographic level. For complementary statistics on the firms that do have paid employees, refer to the County
Business Patterns. Additional sources of data on small businesses include the Economic Census, and the Statistics of
U.S. Businesses.
Key Uses: Key Data:
• Statistical use in federal economic programs
• Contribute to calculation of GDP
• Assessing changes in business patterns
• Market research
Statistics on businesses with no paid
employees, including:
• Legal form of organization
• Receipts
• By, geography and industry
Key Users: Data Available at:
• Federal programs and statistical agencies, such as the U.S. Small
Business Administration
• State and local policymakers and economic development
professionals
• Private businesses
https://www.census.gov/
econ/nonemployer/index.html
Periodicity:
Annual
Geographic Divisions Available:
National/State/Count/Metro
Source: U.S. Department of Commerce, Census Bureau

Key Resources for Workforce and Labor Market Information August 2017
Page 46
List
Business Dynamics Statistics (BDS)
Summary: Primary Agency:
Annual data on number and receipts of businesses with no
employees. U.S. Census Bureau
Description:
The Business Dynamics Statistics (BDS) provides annual measures of business dynamics (such as job creation and
destruction, establishment births and deaths, and firm startups and shutdowns) for the economy and aggregated by
establishment and firm characteristics. The BDS is created from the Longitudinal Business Database (LBD), a
confidential database available to qualified researchers through secure Federal Statistical Research Data Centers. The
use of the LBD as its source data permits tracking establishments and firms over time.
Key Uses: Key Data:
• Tacking of business and job creations
• Identifying trends for new and older businesses
• Investigating business survival rates
BDS data tables:
• Employment – job creation and
destruction
• Job expansions and contractions
• Number of establishments
• Establishment openings and closings
• Number of startups and firm
shutdowns
The BDS series:
• Annual statistics for 1976–2014
o Age and size of firms and
establishments
o State
o Metro/Non-metro and MSA
o Standard Industrial Classification
sectors
• Coverage of the entire U.S. economy
Key Users: Data Available at:
• Economists and other researchers
• Policymakers and economic development specialists
• Private businesses
http://www.census.gov/
ces/dataproducts/bds/
Periodicity:
Annual
Geographic Divisions Available:
National/State (limited)
Source: U.S. Department of Commerce, Census Bureau
Key Resources for Workforce and Labor Market Information August 2017
Page 47
List
Survey of Income and Program Participation (SIPP)
Summary: Primary Agency:
The main objective of SIPP is to provide accurate and comprehensive
information about the income and program participation of
individuals and households in the U.S. and about the principal
determinants of income and program participation.
U.S. Census Bureau
Description:
The Survey of Income and Program Participation (SIPP) collects source and amount of income, labor force
information, program participation and eligibility data, and general demographic characteristics to measure the
effectiveness of existing federal, state, and local programs; to estimate future costs and coverage for government
programs such as food stamps; and to provide improved statistics on the distribution of income in the country.
SIPP is a household-based survey designed as a continuous series of national panels. Each panel features a nationally
representative sample interviewed over a multi-year period lasting approximately four years. SIPP is a source of data
for a variety of topics and provides for the integration of information for separate topics to form a single, unified
database.
Key Uses: Key Data:
• Evaluating the use of and eligibility for government programs and
the impacts of modifications to those programs.
• SIPP produces national-level estimates for the U.S. population and
subgroups.
• SIPP is intended to primarily support longitudinal studies.
• Income dynamics
• Movement into and out of
government transfer or assistance
programs
• Effects of changing family and social
situations
Key Users: Data Available at:
• Federal agencies use SIPP to measure utilization of federal
programs, including:
o SNAP
o TANF
o Medicaid
o Health care coverage
o Effect of age on unemployment
• SIPP is also used by private and academic researchers to inform
policy decisions.
http://www.census.gov/sipp/
Periodicity:
Varies
Geographic Divisions Available:
National
Source: U.S. Department of Commerce, Census Bureau

Key Resources for Workforce and Labor Market Information August 2017
Page 48
List
The Economic Census (ECN)
Summary: Primary Agency:
The Economic Census profiles the U.S. economy every five years,
from the national to the local level. U.S. Census Bureau
Description:
Every 5 years—in years ending in “2” and “7”—the Economic Census collects reliable business statistics that are
essential to understanding the American economy. Only the Economic Census provides information on industry
revenues and other measures of American business performance that are consistent, comparable, and comprehensive
across industries and geographic areas.
Key Uses: Key Data:
• You can use Economic Census data to compare one industry or
geographic area with another. Most census reports use the same
methods, classifications, and definitions.
• You can track and compare Economic Census data for industries
and geographic areas over time. Geographic notes and bridging
data are provided when definitions or boundaries change.
• Employment
• Sales
• Establishment size by employment
• Number of establishments
• Annual payroll
• Legal form of organization
Key Users: Data Available at:
• Business owners and managers can:
o Compare their operating data to totals and averages for their
industry (such as sales per employee) from the national, state,
and local levels.
o Analyze information for their customers at the local level to
identify unsaturated or emerging/growing markets for their
products and for opportunities for expansion
• Local economic development organizations and chambers of
commerce can compare statistics for the industries in their
community to identify opportunities for growth.
• Entrepreneurs can use statistics from the Economic Census for the
industry that they are considering starting a business in or for
related industries at the local level in their business plans.
• Federal, state and local governments use EC data for economic,
transportation, and emergency preparedness planning.
• EC data are used as a benchmark for a variety of economic
indicators.
https://www.census.gov/econ/census/
Periodicity:
Every 5 years
Geographic Divisions Available:
National/State/Metro/County/Places/ZIP
Source: U.S. Department of Commerce, Census Bureau

Key Resources for Workforce and Labor Market Information August 2017
Page 49
List
American FactFinder
Summary: Primary Agency:
Central database of frequently requested facts about U.S.
Communities. U.S. Census Bureau
Description:
The American FactFinder is a web site that provides access to select data on U.S. communities from a wide variety of
Census Bureau surveys and sources by providing ready access to frequently used tables and data from a variety of
U.S. Census Bureau surveys.
Key Uses: Key Data:
Includes data from the following, among other sources:
• American Community Survey
• American Housing Survey
• Annual Surveys of Governments
• Census of Governments
• Commodity Flow Survey
• Decennial Census
• Economic Census
• Equal Employment Opportunity (EEO) Tabulation
Community level information about:
• People (demographics, etc.)
• Housing (housing units, home values)
• Businesses and Industries (payroll,
receipts, number of employees)
Key Users: Data Available at:
• Workforce and economic development specialists to access current
contextual information about populations, demographics, housing
trends, and business activity.
• Researchers and analysts to access data on population
characteristics, employment, and educational attainment.
https://factfinder.census.gov
Periodicity:
Varies
Geographic Divisions Available:
National
Source: U.S. Department of Commerce, Census Bureau
Key Resources for Workforce and Labor Market Information August 2017
Page 50
List
The DataWeb: DataFerret and Hot Reports
Summary: Primary Agency:
Central database of frequently requested facts about U.S.
Communities. U.S. Census Bureau
Description:
TheDataWeb implementation at the U.S. Census Bureau provides access to over 828 datasets with new files added
monthly. It provides statistical business intelligence (BI), allowing everyone to access public government databases, as
well as providing secure access to authorized users of non-public data.
DataFerrett is a data analysis and extraction tool to customize federal, state, and local data to suit your requirements.
Using DataFerrett, you can develop an unlimited array of customized spreadsheets that are as versatile and complex
as your usage demands then turn those spreadsheets into graphs and maps without any additional software.
HotReports are dynamic web pages and dashboards created for customers of TheDataWeb according to their
specifications. Each HotReport is a custom design that draws upon data in TheDataWeb and includes options such as
interactive graphics, dynamic text, and animated visualizations.
Key Uses: Key Data:
Includes data from the following, among other sources:
• American Community Survey
• Current Population Survey
• Decennial Census
• Survey of Income and Program Participation
• Geography
• Other data
Information about:
• People and households
(demographics, employment,
education, income, etc.)
• Housing (housing units, home values)
• Businesses and Industries (payroll,
receipts, number of employees)
Key Users: Data Available at:
• Workforce and economic development specialists to access current
contextual information about populations, demographics, housing
trends, and business activity.
• Researchers and analysts to access data on population
characteristics, employment, and educational attainment.
www.thedataweb.org
Periodicity:
Varies
Geographic Divisions Available:
National
Source: U.S. Department of Commerce, Census Bureau

Key Resources for Workforce and Labor Market Information August 2017
Page 51
List
Center for Administrative Records
Research and Applications (CARRA)
Summary: Primary Agency:
Research and analysis based on linkage of a wide variety of survey
and administrative data. U.S. Census Bureau
Description:
CARRA is charged with the strategic re-use of administrative data from federal, state, and third party providers.
CARRA demonstrates how administrative records data can advance the mission of the Census Bureau by making
operations more efficient, improving data quality, reducing data collection and processing costs, and reducing
respondent burden. CARRA combines information from multiple sources to create new data products that would be
impossible to produce using single data sets. CARRA researchers collaborate with social scientists within the Census
Bureau, from other federal agencies, and from academia.
The Data Linkage Infrastructure enables data discovery and secure analytic access for policy analysis and research. It
relies on the Census Bureau’s authority to access government records and collect data for statistical purposes, and
leverages the Census Bureau’s data stewardship culture, policies, and practices. The Data Linkage Infrastructure
includes the protocols by which we obtain government records, metadata and documentation on the files, linkage
methods and results, warehousing and provisioning data, and sharing results of prior linkages.
Key Uses: Key Data:
CARRA pursues research in many areas including:
• Demographic characteristics and racial identification and fluidity -
• Income distribution and tax analyses
• Social and economic mobility
• Economics of education and crime
• Food stamps, Medicaid, and other program participation
• Home values and housing assistance programs
• Record linkage and Big Data
• Planning the 2020 Census of Population and Housing
Researchers can access linked data from a
wide variety of surveys and
administrative databases upon approval
of their proposed research project.
Key Users: Data Available at:
• Researchers and social scientists from the Census bureau, other
federal agencies, and academia. https://census.gov/about/adrm/
linkage/guidance.html
Periodicity:
Varies
Geographic Divisions Available:
Varies
Source: U.S. Department of Commerce, Census Bureau

Key Resources for Workforce and Labor Market Information August 2017
Page 52
List
Regional Economic Accounts
Summary: Primary Agency:
Statistics on gross domestic product (GDP), personal income, and
employment for states and a variety of local geographic subdivisions. U.S. Bureau of Economic Analysis
Description:
The annual GDP by state and metropolitan statistical area statistics measure the value added to U.S. production by the
labor and property in each state. GDP by state is the conceptual counterpart of gross domestic product, the featured
measure of economic activity in the national accounts. Thus, these statistics provide a framework for analyzing the
contributions of regions and states to U.S. economic activity.
The annual and quarterly state personal income statistics measure the income received by or on behalf of the residents
of the state. The state statistics provide detailed information by type of income (such as wages and salaries, dividend
income, and social security benefits) that is comparable across all states and with the nation as a whole. Statistics of
compensation and of earnings by place of work indicate the economic activity and industrial structure of business and
government within the state, while statistics of personal income by place of residence provide a measure of the fiscal
capacity of the state.
BEA also prepares annual state statistics on disposable personal income (personal income less personal current taxes),
per capita personal income (personal income divided by total population), and employment.
Key Uses: Key Data:
• To measure and track the levels and types of incomes received by
people who reside in the state or area of interest
• To allocate funds to states and in economic models for policy
planning
• To measure the economic base for states and local areas for tax
revenue and utility planning
• To conduct market research
• Personal income levels
o Over time
o From employment, investment and
government transfers
• Employment by industry
• Number of self-employed
• Regional input-output multipliers
Key Users: Data Available at:
• State and local policy makers to estimate tax revenues and
infrastructure needs
• Federal policy makers and programs to allocate program funds
• Business, trade associations, and labor organizations to conduct
market research
• Academic researchers to conduct theoretical and applied economic
research
http://www.bea.gov/regional/index.htm
Periodicity:
Annual/quarterly
Geographic Divisions Available:
State/Metro/County/Micro/Combined
Source: U.S. Department of Commerce, Bureau of Economic Analysis

Key Resources for Workforce and Labor Market Information August 2017
Page 53
List
Regional Price Parities
Summary: Primary Agency:
Regional price parities measure the difference in prices across
geographic areas. U.S. Bureau of Economic Analysis
Description:
The regional economic accounts tell us about the geographic distribution of U.S. economic activity and growth. They
provide statistics on gross domestic product (GDP) for states and metropolitan areas, personal income for states and
local areas, and regional economic multipliers for any county or group of counties.
Regional Price Parities (RPPs) measure the differences in the price levels of goods and services across states and
metropolitan areas for a given year. RPPs are expressed as a percentage of the overall national price level for each
year.
Key Uses: Key Data:
• Convert estimates of per capita GDP into comparable levels in a
common currency • RPP are expressed as a percentage of
the overall national price level for
each year.
Key Users: Data Available at:
• Researchers and analysts use RPPs to compare incomes and prices
across states and metropolitan areas.
• Economic development professions can use RPPs to adjust for cost
differences faced by private businesses.
• Job seekers, career counselors, and workforce development
professionals may use RPPs to account for price differences when
making career and employment decisions.
http://www.bea.gov/regional/index.htm
Periodicity:
Varies
Geographic Divisions Available:
State/Metro
Source: U.S. Department of Commerce, Bureau of Economic Analysis

Key Resources for Workforce and Labor Market Information August 2017
Page 54
List
Integrated Postsecondary Education Data System (IPEDS)
Summary: Primary Agency:
Primary source of information about institutions of higher education,
including program completions. National Center for Education Statistics
Description:
IPEDS is the Integrated Postsecondary Education Data System. It is a system of interrelated surveys conducted
annually by the U.S. Department of Education’s National Center for Education Statistics (NCES). IPEDS gathers
information from every college, university, and technical and vocational institution that participates in the federal
student financial aid programs. The Higher Education Act of 1965, as amended, requires that institutions that
participate in federal student aid programs report data on enrollments, program completions, graduation rates,
faculty and staff, finances, institutional prices, and student financial aid. These data are made available to students
and parents through the College Navigator college search Web site and to researchers and others through the IPEDS
Data Center.
Key Uses: Key Data:
• Describe and analyze trends in higher education
o Program completions data is frequently used as an indicator of
changes in near-term labor supply.
• Institutional sampling frame for other NCES postsecondary
surveys.
• Program completions by year
• Institution spending and staffing
levels
Key Users: Data Available at:
• Education and training professionals may use IPEDS to evaluate
the supply of completers overall or in specific programs of study.
• Students, job seekers, and career counselors may use IPEDS to find
institutions that offer specific academic or vocational training
programs.
• Policymakers use IPEDS to evaluate institutional performance and
assess labor market conditions.
http://nces.ed.gov/ipeds/
Periodicity:
Annual
Geographic Divisions Available:
By individual institution
Source: U.S. Department of Education, National Center for Education Statistics
Key Resources for Workforce and Labor Market Information August 2017
Page 55
List
Common Core of Data (CCD)
Summary: Primary Agency:
A comprehensive, annual, national statistical database of all public
elementary and secondary schools and school districts, National Center for Education Statistics
Description:
The CCD survey annually collects data about all public elementary and secondary schools, all local education
agencies, and all state education agencies throughout the United States. CCD contains three categories of information:
general descriptive information on schools and school districts; data on students and staff; and fiscal data. The general
descriptive information includes name, address, phone number, and type of locale; the data on students and staff
include selected demographic characteristics; and the fiscal data cover revenues and current expenditures.
CCD is made up of a set of five surveys sent to state education departments. Most of the data are obtained from
administrative records maintained by the state education agencies (SEAs). Statistical information is collected annually
from approximately 100,000 public elementary and secondary schools and approximately 18,000 public school
districts (including supervisory unions and regional education service agencies) in the 50 states, the District of
Columbia, Department of Defense Schools, and the outlying areas. The SEAs compile CCD requested data into
prescribed formats and transmit the information to NCES.
Key Uses: Key Data:
Examples of CCD data that could be used to address important
education issues are:
• size of school and pupil/teacher ratio;
• size of school district and region of the country;
• locale of school and racial/ethnic composition for selected states;
• racial/ethnic composition and pupil/teacher ratio for selected
states;
• locale of school and percent of free-lunch eligible students for
selected states;
• grade level and pupil/teacher ratio;
• size of school district and number of special education students;
• graduates; and
• state share of expenditure for education and expenditure per
pupil.
• Directory of elementary/secondary
schools, school districts, and state
education agencies
• Number of students/graduates by
school and school district
• Fiscal data for schools/districts/states
Key Users: Data Available at:
• Education and training professionals may use the CCD to research
education investment levels and the expected supply of talent in
geographic areas.
• Policymakers may use data from the CCD to compare enrollment
and investment levels and evaluate education policy options.
https://nces.ed.gov/ccd/search.asp
Periodicity:
Annual
Geographic Divisions Available:
State/School District/School
Source: U.S. Department of Education, National Center for Education Statistics
Key Resources for Workforce and Labor Market Information August 2017
Page 56
List
Baccalaureate and Beyond (B&B)
Summary: Primary Agency:
Longitudinal survey that follows a cohort of postsecondary students’
after completion of their bachelor’s degrees. National Center for Education Statistics
Description:
The Baccalaureate and Beyond Longitudinal Study (B&B) examines students’ education and work experiences after
they complete a bachelor’s degree, with a special emphasis on the experiences of new elementary and secondary
teachers. Following several cohorts of students over time, B&B looks at bachelor’s degree recipients’ workforce
participation, income and debt repayment, and entry into and persistence through graduate school programs, among
other indicators. It addresses several issues specifically related to teaching, including teacher preparation, entry into
and persistence in the profession, and teacher career paths. B&B also gathers extensive information on bachelor’s
degree recipients’ undergraduate experience, demographic backgrounds, expectations regarding graduate study and
work, and participation in community service.
B&B draws its initial cohorts from the National Postsecondary Student Aid Study (NPSAS). Initial B&B cohorts are a
representative sample of graduating seniors in all majors. The first B&B cohort (about 11,000 students) was drawn
from the 1993 NPSAS and followed-up by survey in 1994, 1997, and 2003. The second B&B cohort (about 10,000
students) was chosen from the 2000 NPSAS and followed-up in 2001. The third B&B cohort was drawn from the 2008
NPSAS sample. This group of approximately 19,000 sample members was follow-up in 2009 and is currently being
interviewed in 2012.
Key Uses: Key Data:
• Gain insight into the transition of college graduates into the
teaching profession
• Track workforce outcomes for nationally representative sample of
students who recently completed a bachelor’s degree.
• Investigate factors affecting loan repayment for college graduates.
• Enrollment
• Persistence and attainment
• Student characteristics
• Financial need
• Loans
• Prices and costs
Key Users: Data Available at:
• Education and training professionals may use B&B to better
understand how students transition from college to the workforce.
• Researchers and policymakers may use B&B to identify factors
that affect employment and loan repayment after graduation and
design programs accordingly.
https://nces.ed.gov/datalab/
Periodicity:
Updates every 4-years
Geographic Divisions Available:
National
Source: U.S. Department of Education, National Center for Education Statistics
Key Resources for Workforce and Labor Market Information August 2017
Page 57
List
National Household Education Surveys Program (NHES)
Summary: Primary Agency:
A series of surveys covering American’s educational experiences. National Center for Education Statistics
Description:
The National Household Education Surveys Program (NHES) provides descriptive data on the educational activities
of the U.S. population and offers researchers, educators, and policymakers a variety of statistics on the condition of
education in the United States.
The NHES surveys cover learning at all ages, from early childhood to school age through adulthood. The most recent
data collection in 2012 consisted of two surveys: Parent and Family Involvement in Education and Early Childhood
Program Participation.
Key Uses: Key Data:
• Collecting information about educational attainment and training
• Investigating participation in:
o Apprenticeships
o Work-related courses
o Informal learning at work
Information about:
• Early childhood care and education
• Young children’s readiness for school
• Before- and after-school activities of
school-age children
• Parent and family involvement in
education
• Adult education
Key Users: Data Available at:
• Educators and trainers to lean about students’ participation in and
experiences with education and training programs.
• Workforce development specialists to learn more about the
students experiences in work-related training programs.
• Researchers and analysts to inform improvements in education
and training programs.
https://nces.ed.gov/nhes/index.asp
Periodicity:
Varies
Geographic Divisions Available:
National/Regional
Source: U.S. Department of Education, National Center for Education Statistics

Key Resources for Workforce and Labor Market Information August 2017
Page 58
List
Adult Training and Education Survey (ATES)
Summary: Primary Agency:
Nationally representative survey focusing on certifications, licenses,
and employment. National Center for Education Statistics
Description:
The Interagency Working Group on Expanded Measures of Enrollment and Attainment (GEMEnA) has developed a
core set of survey items to measure the prevalence and key characteristics of certifications and licenses, and efforts are
underway to deploy these items within the federal statistical system. NCES has fielded an in-depth survey of US
adults, the Adult Training and Education Survey (ATES), to provide detailed cross-sectional time series data
beginning in 2016. NCES has also incorporated survey items on non-degree credentials into its post high school
longitudinal studies.
Other GEMEnA agencies have also begun deploying survey items on certifications and licenses in their own surveys
of households and individuals including the redesigned Survey of Income and Program Participation (Census), the
National Survey of College Graduates (NSF), and the Current Population Survey (BLS).
Key Uses: Key Data:
• Investigate the relationship between employment, by industry and
occupation, and educational attainment by certificate or license
level, type, and field.
• Educational attainment
• Certificate(s) or license(s) held
• Occupation
• Value of certificate or license in
occupation
• Recent employment status and
income
Key Users: Data Available at:
• Educators and trainers may use ATES data to improve student
advisement and career pathway planning.
• Researchers and policymakers may use ATES data to better design
workforce training and adult education programs.
https://nces.ed.gov/nhes/
Periodicity:
Four years
Geographic Divisions Available:
National
Source: U.S. Department of Education, National Center for Education Statistics

Key Resources for Workforce and Labor Market Information August 2017
Page 59
List
Statewide Longitudinal Data Systems Grant Program (SLDS)
Summary: Primary Agency:
SLDS is a grant program which assists with the design, development,
implementation, and expansion of longitudinal data systems related
to education.
National Center for Education Statistics
Description:
Through grants and a growing range of services and resources, the program has helped propel the successful design,
development, implementation, and expansion of K12 and P-20W (early learning through the workforce) longitudinal
data systems. These systems are intended to enhance the ability of States to efficiently and accurately manage,
analyze, and use education data, including individual student records. The SLDSs should help states, districts,
schools, educators, and other stakeholders to make data-informed decisions to improve student learning and
outcomes; as well as to facilitate research to increase student achievement and close achievement gaps.
Key Uses: Key Data:
• Facilitate data-driven decisions to improve student learning and
outcomes. • Longitudinal data systems
• Teacher–student linkages
• External evaluations
• Student records
Key Users: Data Available at:
• Educators and trainers to assess outcomes for students and
graduates.
• Economic and workforce development professionals to anticipate
changes in labor force.
https://nces.ed.gov/programs/
slds/index.asp
Periodicity:
Grants awarded annually
Geographic Divisions Available:
Grants award by state
Source: U.S. Department of Education, National Center for Education Statistics

Key Resources for Workforce and Labor Market Information August 2017
Page 60
List
National Survey of College Graduates (NSCG)
Summary: Primary Agency:
A longitudinal survey that provides data on the nation’s college
graduates, with emphasis on those in the science and engineering
workforce.
National Center for Science and
Engineering Statistics
Description:
The National Survey of College Graduates (NSCG) is a longitudinal survey conducted since the 1970s, designed to
provide data on the characteristics of the nation's college graduates. By surveying college graduates in all academic
disciplines, the NSCG provides data useful in understanding the relationship between college education and career
opportunities.
The 1993, 2003, and 2010 cycles of the NSCG provided coverage of the nation's college-educated population as of the
survey reference date. In addition to the 1993, 2003, and 2010 survey cycles, the NSCG was conducted biennially or
triennially in the periods 1990–99 and 2000–09. For these within-decade iterations of the NSCG, the survey focused on
the science and engineering (S&E) workforce component of the college-educated population (health-related and S&E-
related fields are included in the S&E definition beginning with 2003).
Key Uses: Key Data:
Examining various characteristics of college-educated individuals,
including:
• occupation,
• work activities,
• salary,
• the relationship of degree field and occupation,
• and demographic information.
• Educational history (degrees)
• Employment Status
• Occupation
• Sector of employment
• Primary work activity
• Salary
• Geographic place of employment
• Work-related training
• Demographics
Key Users: Data Available at:
• Educators and trainers to lean about students’ educational
experience and labor market outcomes.
• Workforce development specialists to learn about the educational
and training characteristics of workforce.
https://www.nsf.gov/statistics/
srvygrads/#quality
Periodicity:
Biennial
Geographic Divisions Available:
National
Source: National Science Foundation, National Center for Science and Engineering Statistics

Key Resources for Workforce and Labor Market Information August 2017
Page 61
List
TradeStats Express
Summary: Primary Agency:
The latest annual and quarterly trade data. U.S. International Trade Administration
Description:
TradeStats Express displays the latest annual U.S. merchandise trade statistics -
• At national and state levels.
• In maps, graphs, and tables.
• As exports, imports, and trade balances.
• Custom-tailored to your year and dollar ranges and display preferences.
Key Uses: Key Data:
• Monitor trade trends by industry.
• Learn about the major trade partners for industries by state. Information about:
• Global patterns of a state’s exports
• State-by-state exports to a selected
market
• Export product profile to a selected
market
Key Users: Data Available at:
• Economic development specialists to identify industries with
opportunities in trade.
• Policymakers to gauge the health and impact of trade in their
locality.
http://tse.export.gov/tse/tsehome.aspx
Periodicity:
Annual
Geographic Divisions Available:
National/State
Source: U.S. Department of Commerce, International Trade Administration
Key Resources for Workforce and Labor Market Information August 2017
Page 62
List
Job Patterns for Minorities and Women in Private Industry (EEO-1)
Summary: Primary Agency:
Employment levels for women and minorities by state. U.S. Equal Employment Opportunity
Commission
Description:
As part of its mandate under Title VII of the Civil Rights Act of 1964, as amended, the Equal Employment
Opportunity Commission requires periodic reports from public and private employers, and unions and labor
organizations which indicate the composition of their work forces by sex and by race/ethnic category. Key among
these reports is the EEO-1, which is collected annually from Private employers with 100 or more employees or federal
contractors with 50 more employees. In 2014, about 67,200 employers with more than 64.2 million employees filed
EEO-1 reports.
Key Uses: Key Data:
• Monitor trends in employment for women and minorities.
• Identify variations in employment of women and minorities by
industry.
Employment by:
• Gender
• Race/ethnicity
Key Users: Data Available at:
• Workforce development specialists and policymakers to ensure
equitable employment opportunities are available for women and
minority individuals.
https://www.eeoc.gov/eeoc/
statistics/employment/jobpat-
eeo1/index.cfm
Periodicity:
Annual
Geographic Divisions Available:
National/State/CBSAs
Source: U.S. Equal Employment Opportunity Commission

Key Resources for Workforce and Labor Market Information August 2017
Page 63
List
Census Special EEO Tabulation
Summary: Primary Agency:
Tabulation of race/ethnicity and gender composition of the workforce
geography and job category. U.S. Census Bureau for U.S. Equal
Employment Opportunity Commission
and other agencies
Description:
The primary external benchmark for comparing the race, ethnicity, and sex composition of an organization's internal
workforce, and the analogous external labor market, within a specified geography and job category. It is also used by
organizations to develop and update their affirmative action plans.
Key Uses: Key Data:
• Compare composition of organizational workforce to the external
workforce. Employment by:
• Geographic area of workplace or
residence
• Gender
• Race/ethnicity
• Citizenship status
• Job category
Key Users: Data Available at:
• Private businesses to ensure compliance with equal employment
opportunity law and regulations.
• Policymakers and workforce development specialists to monitor
the composition of the workforce in their locality relative to other
geographic areas.
http://www.census.gov/people/
eeotabulation/
Periodicity:
Every 5 years
Geographic Divisions Available:
National/State/CBSAs
Source: U.S. Department of Commerce, Census Bureau
Key Resources for Workforce and Labor Market Information August 2017
Page 64
List
State Industry and Occupational Projections
Summary: Primary Agency:
Occupational and employment projections for each state, prepared by
the state’s WLMI agency. State WLMI Agencies
Description:
The Bureau of Labor Statistics prepares employment projections for the nation, but not for individual states. State
WLMI agencies prepare employment projections for their states, to inform job seekers, employers, policymakers, and
other workforce stakeholders. The data available may vary from state to state, and are available through each state’s
WLMI agency. State WLMI agencies also distribute their projections through Projections Central, a web site associated
with the Projections Managing Partnership (PMP).
Key Uses: Key Data:
• Career exploration
• Education and training
• Economic policymaking
• Planning for public and private sectors
• Short- and long-term projections
• Project employment
• Percent change in the projection
period
• Average annual openings over the
projection period
Key Users: Data Available at:
• Students, jobseekers, and career counselors, to make career
decisions or provide guidance
• Education and training specialists, to plan and develop education
and training programs
• Workforce investment boards, for policy and program planning
purposes and to determine jobs in demand
• Economic developers, to understand demand for skilled workers
www.projectionscentral.com
Periodicity:
Every 5 years
Geographic Divisions Available:
National/State/CBSAs
Source: U.S. Department of Labor, Bureau of Labor Statistics, ProjectionsCentral.com
Key Resources for Workforce and Labor Market Information August 2017
Page 65
List
Job Vacancy Surveys
Summary: Primary Agency:
Surveys of establishments to assess numbers of job vacancies. State WLMI Agencies
Description:
State WLMI agencies may conduct surveys of establishments to assess the current number of job vacancies in the state.
The methodologies may vary from state to state, and the results of the surveys are available through the state WLMI
agency.
Key Uses: Key Data:
• Measure the current level of labor market demand
• Identify industries and/or occupations with high demand
• Find job openings that match a worker’s knowledge, skills, and
abilities and/or work experience
• Current job vacancies with high
degree of accuracy and geographic
specificity.
Key Users: Data Available at:
• Students, job seekers, and career counselors to identify in-demand
occupations and industries to inform career decisions.
• Workforce development specialists to identify current
opportunities and monitor employer needs.
• State and local policymakers to track employer needs and develop
policy interventions to improve the functioning of the labor
market.
State WLMI agency web sites
Periodicity:
Varies
Geographic Divisions Available:
Varies

Key Resources for Workforce and Labor Market Information August 2017
Page 66
List
National Student Clearinghouse® (NSC) Research Center™
Summary:
Longitudinal information on postsecondary student outcomes.
Description:
The National Student Clearinghouse® Research Center™ is the research arm of the National Student Clearinghouse.
The Research Center works with higher education institutions, states, districts, high schools, and educational
organizations to better inform practitioners and policymakers about student educational pathways. Through accurate
longitudinal data outcomes reporting, the Research Center enables better educational policy decisions leading to
improved student outcomes.
Key Uses: Key Data:
• Labor market supply analysis and projections
• Longitudinal analysis of college students’ outcomes • Longitudinal student outcomes
• Educational attainment rates
• Postsecondary persistence and
retention
• Interstate mobility of students
Key Users: Data Available at:
• State higher education policy researchers to tracks students’
outcomes.
• Educators and trainers to track outcomes of students from their
institutions and programs.
https://nscresearchcenter.org/ourreports/
Periodicity:
Varies
Geographic Divisions Available:
Varies
Source: National Student Clearinghouse® (NSC) Research Center™

Key Resources for Workforce and Labor Market Information August 2017
Page 67
List
Cost of Living Index
Summary:
Index that allows comparison of cost of living between cities.
Description:
Published quarterly, using over 60 goods and services collected at the local level from over 300 independent
researchers, COLI is the only local level cost of living index available for the US. Items on which the Index is based
have been carefully chosen to reflect the different categories of consumer expenditures. Weights assigned to relative
costs are based on government survey data on expenditure patterns for professional and executive households. All
items are priced in each place at a specified time and according to standardized specifications. Useful and versatile,
the Cost of Living Index data is:
• Data is available at the metropolitan statistical area (MSA) level and at the county level.
• Organized into 6 categories: food, housing, utilities, transportation, health care, and miscellaneous goods and
services, as well as a composite index.
• Data is released on a quarterly basis, within 2 to 3 months after its collection.
• Methodology has been recognized by the U.S. Census Bureau, the Bureau of Labor Statistics, President’s Council of
Economic Advisors, Bankrate.com, and Brookings Institution.
• Routinely cited by the Wall Street Journal, Forbes, Kiplingers, CNNMoney, US News and World Report, ABC
News, and many other national media outlets.
Key Uses: Key Data:
• Compare cost of living between U.S. cities • Cost of living indexes for U.S cities
Key Users: Data Available at:
• Job Seekers – How does a new job offer in another city actually
compare?
• Human Resource Managers – What is the appropriate salary
adjustment of employees in multiple cities?
• Academic and Market Researchers – How have the average prices
changed across the country over time?
• Chambers of Commerce, EDOs, and Realtors – How does our city
compare in cost in the region, state, and country?
• Site Selectors – Will this community fit my business and lifestyle
needs?
http://coli.org/
Periodicity:
Quarterly
Geographic Divisions Available:
Metro areas
Source: The Council for Community and Economic Research

Key Resources for Workforce and Labor Market Information August 2017
Page 68
List
Online Job Posting and Résumé Data
Summary:
Information about job openings and job seekers generated through
analysis of online job postings and resumes.
Description:
A variety of private vendors provide real-time LMI based on analytics of online job postings and resumes. Data
gathered with this methodology are referred to as “real-time” because they can often be collected and reported more
quickly than is possible through traditional survey methodologies and analysis of administrative data. These products
can indicate emerging trends in demand for particular occupations or particular knowledge, skills, and abilities
(KSAs), as well as shifts in industrial employment levels and other aspects of business dynamics. The specific
methodologies and data sampled may vary by vendor/product and may be proprietary and confidential.
Key Uses: Key Data:
• Asses current labor market demand and monitor trends in
demand for specific occupations and KSAs
• Identify specific skills that are in high demand
• Job postings disaggregated by various
factors
• Changes in the number of job
postings over time
• Knowledge, skills, and abilities
referenced in job postings
Key Users: Data Available at:
• State WLMI agencies use real-time LMI to supplement traditional
data sources.
• Job seekers, career counselor, and workforce development
specialists may use real-time LMI to identify in-demand jobs and
industries and to inform training and career decisions.
Varies by vendor/product
Periodicity:
Varies by vendor/product
Geographic Divisions Available:
Varies by vendor/product
Source: The LMI Institute