key incident monitoring & management systems - eqalm · key incident monitoring &...
TRANSCRIPT

Key Incident Monitoring & Management Systems
KIMMS Alan Bateman

Alan Bateman

Alan Bateman
RCPA QAP Enrolments

Outline History / Objectives / Why
Data from 2010 / 2011
Reports
Risk Matrix
Haemolysis Survey

Outline History / Objectives / Why
Data from 2010 / 2011
Reports
Risk Matrix
Haemolysis Survey

KIMMS History
AIMS •Voluntary reporting system
PIMMS •Constructed logical map of pathology processes •Identify likely failure points
KIMMS •Identified highest frequency failure points & classify
SKIMMS •Summary of KIMMS & very similar to this pilot •Top 4-5 failure points identified by frequency or importance •Pilot run through QASEC, 6 sites, 4 completed
RCPA KIMMS QAP •Pilots in 2007 and 2008, Full QAP program in 2009.

Request-test-report cycle Patient
Doctor investigates cause of symptoms
Pathology Test (s) Requested
Pathology tests collected
Sample transported to
pathology Sample processed & entered into
the LIS
Sample tested
Result processed
Result validated
Result sent to Doctor
Doctor takes actions
based on results
Pre-analytical
Post-analytical
Analytical

Currently laboratory errors occur more frequently in the extra-analytical phases” Plebani. M., Carraro. P. Clin Chem Lab Med 2004 “The great majority (88.9%)of quality failures occurred in the pre-analytical phase” O’Kane. M. J., Lynch. P. L.,McGowan. N. Ann Clin Biochem 2008
Alan Bateman
Recent Articles

KIMMS Objectives
To establish a national data set for pathology incidents
To develop the data set to enable participants to measure and monitor pathology incidents
Set achievable, national benchmarks for good pathology practice
Educate laboratories on methods to reduce errors
Raise awareness of safe work practices
Set standards for best practice

KIMMS Definitions
Definitions are provided to ensure that the
same data is submitted by participants
Definitions are continuously updated & refined to improve data quality
Additional categories have been added to capture more specific data for example: precious samples

Requirements
National
Pathology
Accreditation
Advisory
Council

Requirements

Outline History / Objectives / Why Data from 2010 / 2011
Reports
Risk Matrix
Haemolysis Survey

Accessions
Run Accessions
Run 1 2010 3,860,160
Run 2 2010 5,513,862
Run 3 2010 5,896,629
Run 4 2010 5,469,028
Run 1 2011 6,605,854
Run 2 2011 6,467,546
Total for 18 Months 33,813,079

Method of Detection
Jan-Mar Apr-Jun Jul-Sept Oct-Dec
All (59) All (70) All (69) All (66)
HOW WAS THE INCIDENT
DETECTED? Count All % % of
Accessions Count All % % of
Accessions Count All % % of
Accessions Count All % % of
Accessions
Complaint (always detected by
those outside pathology)
1,203 3.03% 0.03% 2,698 5.33% 0.05%
3,807 5.69% 0.06% 2,420 3.90% 0.04%
Problems detected by the lab, ie by the Quality System 38,531 96.97% 1.00% 47,906 94.67% 0.87%
63,122 94.31% 1.07% 59,588 96.10% 1.09%
Total Feedback 39,734 50,604 66,929 62,008

Sample Misidentifications 2010
Statistics Summary
KIMMS 2010 Jan-Mar Apr-Jun Jul-Sept Oct-Dec PRE-
ANALYTICAL (before results
released) All (59) All (70) All (69) All (66) IDENTIFICATION
PROBLEMS (count all as
potential harm) Count All % % of
Accessions Count All % % of
Accessions Count All % % of
Accessions Count All % % of
Accessions
Sample suspected to be from wrong
patient (wrong
patients blood in tube) 241 2.19% 0.01% 999 6.45% 0.02%
1,030 5.75% 0.02% 1,060 6.04% 0.02%
Unlabelled samples 3,371 30.70% 0.09% 4,605 29.74% 0.08%
4,990 27.87% 0.08% 4,759 27.14% 0.09%
Fewer than 2
identifiers initially supplied 1,973 17.97% 0.05% 2,330 15.05% 0.04%
3,747 20.93% 0.06% 2,983 17.01% 0.05%
Any mismatch or discrepancy of
identifiers (major
or minor) 3,222 29.34% 0.08% 4,545 29.35% 0.08%
5,081 28.38% 0.09% 5,337 30.43% 0.10%
Any within
laboratory failure of ID 119 1.08% 0.00% 139 902.00% 0.00%
263 1.47% 0.00% 253 1.44% 0.00%
Transfusion issues-not covered
in other categories 1,647 15.00% 0.04% 2,057 13.29% 0.04%
2,293 12.81% 0.04% 2,483 14.16% 0.05%
Sample misidentifications
not classified above 407 3.71% 0.01% 808 5.22% 0.01%
499 2.79% 0.01% 662 3.77% 0.01%
TOTAL Pre-
analytical errors
10,980 15,483 17,903 17,537
IDENTIFICATION errors as % of ACCESSIONS 0.28% 0.28% 0.30% 0.32%

Sample Rejections 2010 Statistics
Summary KIMMS 2010
Jan-Mar
Apr-Jun
Jul-Sept
Oct-Dec
PRE-ANALYTICAL (before results
released) All (59) All (70) All (69) All (66)
SAMPLES REJECTED
Count All %
% of
Accessions Count All %
% of
Accessions Count All %
% of
Accessions Count All %
% of
Accessions
Samples rejected due to misidentification
issues 5,495 14.85% 0.14% 7,275 14.73% 0.13%
8,989 15.23% 0.15% 8,754 15.26% 0.16%
Incorrect patient preparation 168 0.45% 0.00% 183 0.37% 0.00%
451 0.76% 0.01% 604 1.05% 0.01%
Sample haemolysed 5,683 15.36% 0.15% 7,358 14.90% 0.13%
8,688 14.72% 0.15% 8,246 14.38% 0.15%
Sample clotted 4,372 11.81% 0.11% 6,134 12.42% 0.11%
6,957 11.79% 0.12% 6,729 11.73% 0.12%
Incorrect fill level of
sample 2,071 5.60% 0.05% 3,760 7.61% 0.07%
2,718 4.61% 0.05% 2,569 4.48% 0.05%
Insufficient sample 2,560 6.92% 0.07% 3,307 6.70% 0.06%
5,660 9.59% 0.10% 5,808 10.13% 0.11%
Incorrect sample
storage or transport 1,047 2.83% 0.03% 1,399 2.83% 0.03%
1,456 2.47% 0.02% 1,680 2.93% 0.03%
Specimen not collected 8,853 29.92% 0.23% 12,144 24.59% 0.22%
13,591 23.03% 0.23% 13,673 23.84% 0.25%
Incorrect specimen
type 2,191 5.92% 0.06% 2,911 5.90% 0.05%
3,907 6.62% 0.07% 3,477 6.06% 0.06%
Registration of test
error 1,658 4.48% 0.04% 1,340 2.71% 0.02%
2,607 4.42% 0.04% 1,893 3.30% 0.03%
Other (please specify) 2,911 7.87% 0.08% 3,566 7.22% 0.06%
3,983 6.75% 0.07% 3,919 6.83% 0.07%
TOTAL SAMPLE
REJECTIONS 37,009 49,377 59,007 57,352
REJECTIONS as % of ACCESSIONS 0.96% 0.90% 1.00% 1.05%

Overall Incident Rate 2010/2011
2010 2011
Run 1 Run 2 Run 3 Run 4 Run 1 Run 2
1.22% 1.21% 1.41% 1.39% 1.38% 1.53%

Outline History / Objectives / Why
Data from 2010 / 2011
Reports
Risk Matrix
Haemolysis Survey

Web Based Report

KIMMS Welcome Page


Cumulative Report
Other Reports
Top 3 Graphs – Development /
Improvement
Comparison Graphs – Testing Phase
Supervisor Reports – Testing phase

Outline History / Objectives / Why
Data from 2010 / 2011
Reports
Risk Matrix
Haemolysis Survey

KIMMS Risk Matrix
A Risk Matrix has been developed to
replace the Harm Categories used by
KIMMS.
Old Categories:
– Actual harm
– Potential harm
– Recollection Risk

KIMMS Risk Matrix
PRE-ANALYTICAL IDENTIFICATION INCIDENTS Run 1 Run 2
Sample suspected to be from wrong patient (Wrong blood in tube)
4.30% 3.00%
Transfusion samples 4.90% 5.10%
TOTAL IDENTIFICATION INCIDENTS 15.30% 13.70%

KIMMS Risk Matrix
PRE-ANALYTICAL SAMPLES REJECTED Run 1 Run 2
Sample haemolysed 21.60% 26.60%
Incorrect fill level of sample 4.50% 3.90%
Specimen not collected 6.10% 5.60%
Registration of test error 7.60% 8.20%
TOTAL SAMPLES REJECTED 61.40% 63.80%
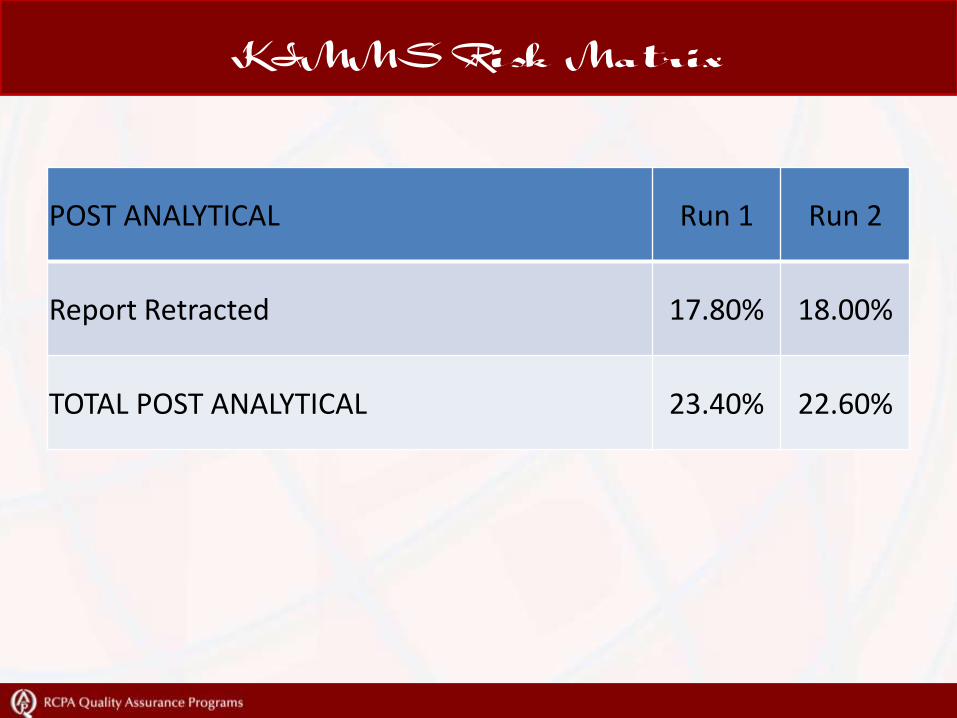
KIMMS Risk Matrix
POST ANALYTICAL Run 1 Run 2
Report Retracted 17.80% 18.00%
TOTAL POST ANALYTICAL 23.40% 22.60%

Outline History / Objectives / Why
Data from 2010 / 2011
Reports
Risk Matrix
Haemolysis Survey

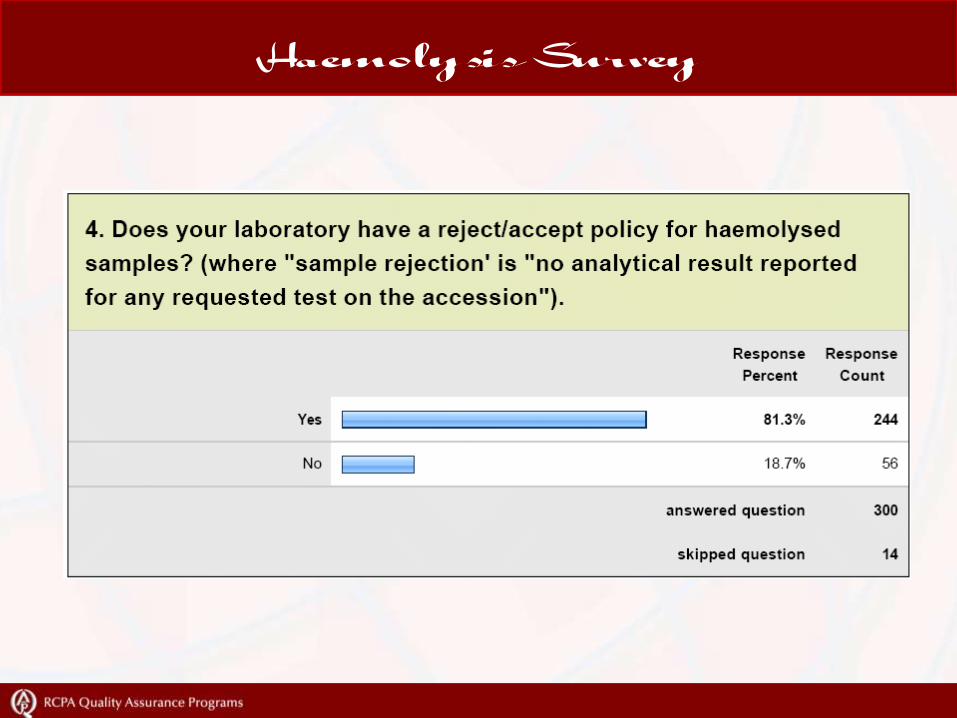
Haemolysis Survey
• One of the biggest problems identified to date for
Sample Rejections is haemolysed samples
• Data being returned for this category appears to
be inconsistent with some laboratories not
reporting Haemolysis if some tests were
performed.
• The RCPA KIMMS QAP surveyed laboratories to
assist in the development of a haemolysis
position statement.

Haemolysis Survey
Haemolysis Survey

Haemolysis Survey

Haemolysis Survey

Haemolysis Survey

Australian Pre-analytical Network

Acknowledgements
Department of Health & Ageing – Quality Use of Pathology (QUPP) for funding of the KIMMS Program
KIMMS Advisory committee;
Dr Ken Sikaris (Program Chairman)
Prof Leslie Burnett
Dr Mathew Meerkin
Dr Ian Beer (NZ)
Assoc/Prof David Porter
Lynn Nelson
Kathy Bailey
Mark Mackay
Gordon Wilckens
Dr Ian Gardner
Penny Petinos
Alan Bateman

Questions

Thank You!