key findings from the multi-asset solutions strategy summit
TRANSCRIPT

FOR INSTITUTIONAL/WHOLESALE/PROFESSIONAL CLIENTS AND QUALIFIED INVESTORS ONLY NOT FOR RETAIL USE OR DISTRIBUTION
Global Asset Allocation Views
Key findings from the Multi-Asset Solutions Strategy Summit
3Q 2021
AUTHOR
John Bilton Managing Director Head of Global Multi-Asset Strategy
Multi-Asset Solutions
Cyclical indicators in the U.S. point to a rapidly healing economy now in mid-cycle
EXHIBIT 2: U.S. U-3 UNEMPLOYMENT RATE, % OF LABOR FORCE AND NAIRU ESTIMATE
Source: U.S. Bureau of Labor Statistics, U.S. Congressional Budget Office , J.P. Morgan Asset Management Multi-Asset Solutions; data as of June 2021.
0%
2%
4%
6%
8%
10%
12%
14%
2006 2008 2011 2014 2017 2020
U-3 U.S. Unemployment Rate Natural Rate of Unemployment (Long-Term)
Asset class Opportunity Set UW N OW Chg Conviction
MAIN ASSET
CLASSES
Equities High
Duration Low
Credit Low
Cash Moderate
PREF
EREN
CE B
Y AS
SET
CLA
SS
EQU
ITIE
S
U.S. Moderate
Europe Moderate
UK
Japan Moderate
Emerging markets
FIXE
D IN
COM
E
U.S. Treasuries Low
G4 ex-U.S. sovereigns
EMD hard currency ▼
EMD local FX ▼
Corporate inv. grade
Corporate high yield Low
FX
USD
EUR Low
JPY Moderate
EM FX Low
IN B R I E F
• The U.S. economy is moving toward mid cycle, while other developed markets remainlargely in early cycle; signals that the Federal Reserve will eventually removeaccommodation still leave policy today extremely supportive but mitigate inflationfears.
• We are overweight (OW) stocks and favor cyclical regions; we also expect renewedfocus on earnings quality and secular growth themes. We are OW Europe and Japan,and more balanced between U.S. large and small cap, but feel it is too soon to return to emerging markets.
• We have a mild underweight (UW) to duration and have pared our OW to credit,reflecting our belief that rates along the yield curve will increase slowly and that creditspreads are already very tight. Moderately higher U.S. rates also point to more supportfor USD in 2H21.
• Our portfolios are set up for further upside in economic growth and risk asset returns;inflation risks are fading, but the risks relating to vaccine/virus data, earnings growthand policy continue to be areas we watch closely.
EXHIBIT 1: MAS ASSET CLASS VIEWS

GLOBAL ASSET ALLOCATION VIEWS
2 Multi-Asset Solutions
SUMMARY
Since the start of 2021, global equities have advanced 11% and
aggregate 10-year government bond yields have moved 40 basis
points (bps) higher. High frequency data suggest that economic
activity is surging, aggregate household balance sheets are in
good health, and economic output in developed markets is
expected to surpass pre-pandemic levels by 3Q21.
The question, perhaps, might be why the Federal Reserve (Fed)
has not been even more anxious to withdraw monetary stimulus
than the somewhat hawkish tone at the June policy meeting
implied. The answer lies in the high level of unemployment that
has persisted since the pandemic lockdowns. True, economic
reopening will mop up labor slack quickly. But getting people
back to work and reinforcing the recovery remain policymakers’
principal goals today. At the same time, investors worry about
the inflationary implications of massive monetary and fiscal
stimulus. Yet asset markets were less than enthusiastic when the
Fed made clear that it would not allow inflation to run away.
The Fed’s tone was a hawkish surprise even as its current policy
remains dovish. In the context of the prevailing economic data,
the tone suggests that the U.S. economy is now in a mid-cycle
phase. Mid-cycle dynamics tend to support stocks moving higher
and rates rising along the yield curve — something we expect to
see in this cycle, too. However, elevated inflation in the near
term, pent-up demand and an excess of global liquidity imply
that there may be upside risks to the normally steady grind of
mid-cycle returns.
As the reopening trend spreads out from the U.S., we expect to
see a prolonged period of above-trend global growth. Although
economic indicators in the U.S. point to mid cycle, in Europe and
Japan economies still appear to be in the early phase of the cycle.
With capex strong and consumers poised to unleash meaningful
pent-up demand — likely to be directed more toward the services
side of the economy — we expect above-trend global growth to
persist well into 2022. This will in turn lend solid support to
corporate earnings.
Base effects, supply-chain disruption and the impact of fiscal
stimulus have combined to push inflation higher, notably in the
U.S. As we move toward autumn, we expect inflation to ease but
upside risks to persist. Importantly, the Fed’s marginally hawkish
tone suggests that higher rates — when they materialize — will
from here be led by rising real rates rather than further advances
in inflation breakevens.
With the extremes of policy accommodation likely behind us, the
global economic backdrop has slightly changed, taking on a more
mid-cycle feel. Nevertheless, the surge of reopening activity and
already-ample liquidity support a risk-on tilt in portfolios. We
continue to overweight equities with fairly high conviction and
underweight cash with moderate conviction. We also overweight
credit, but at the margin we are reducing exposure, given tight
spreads. And while we retain an underweight in duration, our
conviction level is low, given central bank bond purchases.
Within equities, we keep our preference for cyclical markets in
Europe and Japan, and at the margin have trimmed our tilt
toward value-style stocks. While the value factor remains
attractive relative to the growth factor, we are inclined to also
focus a little more on the quality factor as we move into mid
cycle. This leads us to reevaluate U.S. equities, where we believe
quality of earnings and a renewed focus on secular growth
themes may provide support in 2H21. By contrast, we think it is
too early to rotate back toward emerging market (EM) stocks —
particularly as the Fed’s recent policy shift lends some near-term
support to the dollar. In fixed income, our duration underweights
are concentrated in U.S. Treasuries, and our credit overweight
continues to be expressed in U.S. high yield (HY) and crossover
credit — albeit with lighter exposures. We continue to expect
higher sovereign yields over the remainder of 2021 but see a
much reduced risk of a disorderly bond market sell-off.
Above all, we look increasingly to diversify equity exposure
across a range of markets, in keeping with the broadening of
global growth. Corporate earnings failing to come through,
unjustified policy tightening and new vaccine-resistant strains of
COVID-19 all present downside risks. At the same time, consumer
and corporate spending booms present topside risks — which
could possibly be followed by an inflationary episode. But our
core case remains above-trend growth well into 2022, driving
further upside to global stocks and, eventually, to global yields.

GLOBAL ASSET ALLOCATION VIEWS
3 Multi-Asset Solutions
MACRO OVERVIEW
With virus fears receding in much of the world, a powerful
rebound in economic activity has taken hold, one that we think
will deliver annualized global real GDP growth exceeding 8% in
the middle two quarters of this year. Subsequent deceleration
appears inevitable, but we believe growth will hold above its
medium-term trend rate through 2022. The rapidity of this
bounce has moved the U.S. economy through the early part of
this expansion and into a mid-cycle phase. The associated near-
term rise in inflation has proven more intense than previously
expected, at least in the U.S., and we think some of this pressure
will persist. In our judgment, though, recession risk during our
tactical investment period remains very low, and we think
monetary policy will continue to be accommodative for an
extended period.
INTO MID CYCLE, BUT FEW WARNING SIGNS
Our U.S. business-cycle scorecard now shows most of the
economic categories in mid-cycle territory, and the same is true
for a majority of the market metrics (Exhibit 3). What does this
mean for the outlook? It suggests that the nearly automatic
recovery phase of the expansion is largely complete, with few
remaining easy gains as various forms of activity normalize.
Markets have experienced a similar phenomenon, with valuations
having risen strongly off their lows. We do not, however, believe
that the clock is ticking on the expansion. We see few significant
vulnerabilities in the economy – barring, perhaps, a variant-
driven resurgence of the virus later this year – that could
plausibly lead to a recessionary change in behavior. Nor do we
find a typical mid-cycle slowdown particularly likely. Admittedly,
we forecast deceleration in growth in the second half of this year.
But we do not expect a dip below the trend rate of the type that
dents corporate earnings and causes market participants to
worry about cumulating downside risks.
Much of our comfort with the sustainability of the expansion
stems from the strength of corporate and household balance
sheets and income flows. To be sure, elevated corporate leverage
already caught our eye during the previous expansion, and last
year’s recession not only failed to clear the decks in this area but
resulted in a ratcheting upward of indebtedness. Three factors,
however, temper our concerns on this front. First, the rise in
leverage that resulted from the downturn appears to have run its
course. Most credit metrics leveled off in the first quarter, and
they should improve through the remainder of the year. Second,
with interest rates declining further, debt service obligations
appear moderate by historical standards. Third, corporate flows
look healthy. For example, the corporate financing gap – the
difference between business capex and free cash flow – has
moved into negative territory, meaning firms are easily funding
their investment from internal funds. Corporates thus have not
been behaving in exuberantly expansionary fashion, suggesting
little near-term need or inclination for a pullback.
Thanks to a combination of federal government income support
and very cautious behavior, household balance sheets have
improved sharply in an aggregate sense over the past year.
Household net worth, expressed as a share of income, stands
near a record high. Debt has held steady, but with a favorable
composition shift away from high rate revolving credit to lower
cost mortgages. And the “excess saving” flows since the
pandemic shock now total USD 2.4 trillion, by our estimate. Most
of this savings has gone into cash balances, which look high
relative to other assets (Exhibit 4). While the differing nature of
fiscal stimulus elsewhere in the world means that households in
other economies have accumulated smaller stockpiles, saving
rates are running at elevated levels in many places. We therefore
see room for more expansionary behavior globally, not just in the
U.S.
Excess saving has swelled cash balances
EXHIBIT 4: U.S. HOUSEHOLD CASH HOLDINGS, YEAR-ON-YEAR CHANGE (%)
Source: Haver Analytics, J.P. Morgan Asset Management Multi-Asset Solutions; data as of June 2021.
-2
-1
0
1
2
3
4
5
-10
-5
0
5
10
15
20
1953 1963 1973 1983 1993 2003 2013
YoY change in % of GDP YoY change in USD(Trillions)

GLOBAL ASSET ALLOCATION VIEWS
4 Multi-Asset Solutions
Productivity growth and its relationship with wage gains, as
always, will play a major role in shaping the length and vigor of
the current expansion. Currently available data show a surge in
unit labor costs over the past few quarters. Taken at face value,
that development implies a combination of downward pressure
on corporate profit margins and an inflationary impulse. But the
national accounts measure of wages, which enters this
calculation, appears to have been distorted by large composition
shifts in the workforce. Metrics that adjust for these changes
show a much more moderate path for wage growth. The
published data for productivity likely suffer from similar effects,
but productivity growth did appear to be turning upward before
the pandemic hit, and the strong early rebound in business
investment spending bodes well for ongoing expansion of the
capital stock. Sustained improvement in productivity growth,
relative to the disappointing experience during the previous
cycle, would allow for a healthy combination of wage increases,
stable inflation and profit margins.
GROWTH: ABOVE-TREND INTO NEXT YEAR
Fluctuations in local virus conditions, with their knock-on effects
on personal mobility and private sector confidence, have
dominated growth outcomes since early 2020. Significant
progress on vaccination should push the virus into the
background as a growth driver, barring the widespread
circulation of a new inoculation-resistant variant. As virus risk
fades, we expect that healthy balance sheets, elevated saving
rates, firm private sector confidence and supportive financial
conditions will facilitate above-trend growth for the global
economy through 2022. In the aggregate, global growth is likely
now in the process of topping out, but we expect a series of
rolling peaks at the country level through the end of this year, in
line with differential easing of restrictions.
In addition to those fundamental drivers, we are monitoring
several cross-country phenomena that will influence growth
outcomes this year and next. First is the gradual waning of fiscal
stimulus. After unprecedented support for private sector incomes
last year and in early 2021, most governments are now stepping
back. To be sure, public sector deficits remain large, and
negotiations are underway in the U.S. toward another package,
this time focused on infrastructure. But even in the U.S., the 12-
month sum of the fiscal deficit has already begun narrowing.
Further, the spending being discussed would be spaced out over
a decade and would not alter that trajectory in the near term. We
believe that the character of fiscal stimulus over the last year,
which essentially replaced (with cash) lost wages and sales,
means that it can be withdrawn smoothly alongside private
sector healing. In our view, this on-paper fiscal tightening will not
generate significant drags on growth, but we will need to
examine this hypothesis repeatedly in coming quarters.
Second, labor markets are healing in very different ways, based
on their immediate reaction to the shock. In Europe, Japan and
Australia, policymakers cushioned labor markets by creating (or
expanding) furlough and short-hour schemes, essentially freezing
firm-employee relations in place. Open unemployment rates thus
rose very little despite the steep contraction in activity. As
economies reopen, labor market data might look oddly weak for
a time, especially if jobs need to be reallocated across the
economy. By contrast, in the U.S. and Canada, labor markets
adjusted sharply last year, and their recovery will now need to be
characterized by rising participation (as sidelined workers return
to the labor force) and better matching (as available openings
are filled with currently unemployed or inactive people). Success
on these fronts should show up in broad measures like the
employment-to-population ratio, which will likely serve as a
better gauge of healing than will payroll figures alone.
Third, as economies reopen, we expect a shift in spending back
toward services, unwinding at least part of the rise in the goods
share of consumption that occurred last year. The recovery in
services should help labor markets, given their more worker-
intensive nature. But goods activities are over-represented in
public equity and credit markets (compared with the composition
of GDP), and an outright fall in goods spending might therefore
represent a headwind for investors. If our forecast for the path of
U.S. consumer spending through the end of 2021 came true and
were accompanied by a full reversal in the goods share, back to
its end-2020 level, U.S. household spending on goods would
indeed decline somewhat. But we think goods activity would
remain well supported globally. Consumption of goods did not
surge as much outside the U.S., having lagged notably in China
and Japan. And capex, which accounts for about one-third of
goods demand, should stay strong almost everywhere. Even in
the U.S., the unwind in the goods share of consumption will likely
take longer than a few quarters to play out, given elevated
housing activity. Meanwhile, near-term supply disruptions are

GLOBAL ASSET ALLOCATION VIEWS
5 Multi-Asset Solutions
leading firms to once again draw down inventories. Companies
attempted to rebuild stocks around the turn of the year, but
factors like the shortage of semiconductors have been thwarting
those plans. As a result, production is running short of sales in
many sectors. As bottlenecks ease later this year, we expect an
inventory rebuilding cycle to give further impetus to industrial
output globally.
Among developed market (DM) economies, Japan has turned in a
relatively lackluster growth performance so far this year. But we
expect momentum to rebound strongly in 2H21, helped by a
faster than expected vaccine rollout, which should prove critical
for Japan’s consumption recovery, and solid external demand.
Limited vaccine supply, which was the main cause of Japan’s
initially slow vaccine rollout, is no longer a problem, as Japan’s
government has secured delivery of 140 million doses by the end
of June, enough to cover 70% of Japan’s adult population.
Logistics problems also turned out to be less severe than
expected. As a result, daily vaccinations have accelerated rapidly
since mid-May to a current rate of around 1.1 million doses per
day.
In our view, the key milestone for Japan’s total vaccination rate is
one-third of the population, which covers all the medical workers
and over-65-year-olds. At the current pace, this target should be
reached before the end of July (Exhibit 5). Vaccinating the elderly
is important for both reopening the economy and spurring a
consumption rebound: over-65-year-olds account for 40% of
total consumption.
Japan’s vaccination rollout gathering speed
EXHIBIT 5: JAPAN’S VACCINATION SCENARIOS
Source: CEIC, J.P. Morgan Asset Management Multi-Asset Solutions; data as of June 2021. *Full coverage of medical workers and over-65-year-olds.
Weakness in Japan’s consumption has been concentrated in the
services sector, and the hit to services consumption has been
particularly large for the elderly households due to health
concerns. Their low e-commerce usage also suggests limited
offset of weaker in-person consumption from online shopping.
The combination of a larger decline in spending with higher
savings and a higher propensity to consume means elderly
households also have higher potential as pent-up spenders.
Solid external demand further supports our bullish outlook for
Japan. The country’s exports are highly leveraged to the global
manufacturing cycle and should continue to benefit from the
strong recovery in global capex currently underway. The
sustained strength in external demand also points to tailwinds for
industrial production. Supply-side bottlenecks, especially in
semiconductor chips, pose downside risks to manufacturing
activities. However, recent data suggest that the negative impact
of the chip shortage is mostly limited to the automobile sector.
The effects are likely to be short-lived, as auto production is
expected to rebound from Q3.
China, the first major economy to emerge out of the COVID-19
crisis, has moved beyond the initial snapback phase; its
sequential growth momentum is moderating. While peak growth
in China is probably behind us, we expect a moderate growth
slowdown in the second half of this year with a shift in growth
drivers to private consumption and manufacturing investment.
A slower than expected consumption recovery likely reflects still-
cautious consumer sentiment, weighed down by recent local
outbreaks across several different provinces. However, China,
which has seen a sharp pickup in the pace of vaccinations, is on
track to fully vaccinate 40% of its population by the end of June.
Significant progress toward herd immunity later this year should
support further normalization of household consumption,
especially services consumption. Recovery of China’s
manufacturing capex also seems to have further room to run.
Continued improvement in corporate profitability and robust
export growth bode well for the manufacturing investment
outlook. This should cushion the expected slowdown in
infrastructure and property investment growth amid fading
policy support. At the same time, we expect China’s export
performance to remain robust, despite near-term logistics and
supply-side constraints.
0.00
10.00
20.00
30.00
40.00
50.00
60.00
70.00
80.00
Mar-21 Apr-21 May-21 Jun-21 Jul-21 Aug-21 Sep-21 Oct-21
*
1.2m/day
1m/day
0.8m/day
Total vaccination, % of population, 2 doses

GLOBAL ASSET ALLOCATION VIEWS
6 Multi-Asset Solutions
More broadly, we remain constructive on the outlook for overall
emerging market exports, which underpins our expectation of
further recovery in EM growth. As discussed, we have seen little
evidence of a sharp rotation away from goods spending that
might damage EM sales. Trade data from North Asia (including
China, Korea and Taiwan), which accounts for around half of
overall EM exports, suggest shipments to the U.S. and European
Union (EU) have held up relatively well in recent months (Exhibit
6).
EM export recovery is slowly broadening with volume moving
back above pre-virus levels
EXHIBIT 6: NORTH ASIA EXPORTS BY DESTINATION (2019 = 100, NSA)
Source: CEIC, J.P. Morgan Asset Management Multi-Asset Solutions; data as of May 2021.
While demand for consumer goods could moderate along with
reopening, especially in the U.S., we believe EM exports should
find support from the robust global capex cycle, as investment
demand tends to be more import intensive. In fact, we have
already seen a shift of North Asia’s export growth drivers from
pandemic-related goods such as medical supplies and electronics
to capital goods such as machinery. Robust exports should also
boost EM domestic demand, as they provide support to the labor
market and manufacturing investment.
Looking across both DM and EM economies, we project that
global real GDP growth reaccelerated to a 7.6% annualized pace
in the second quarter, after a dip to a below-trend rate in 1Q21.
That slowdown owed to renewed virus restrictions in the euro
area, the UK and Japan, along with a stumble in China, where the
recovery was already well advanced. With mobility on the rise
and lockdowns easing, activity has picked up strongly in the past
few months. With U.S. growth likely peaking in the second
quarter – the last period to be heavily influenced by direct fiscal
stimulus payments, and the one in which activity will have more
or less closed the gap created by last year’s downturn – the baton
will pass to other economies in the second half of the year. We
expect euro area growth to hit its high point in the third quarter
and global GDP growth to exceed its 2Q21 pace marginally. Japan
would then follow in 4Q21, albeit against the backdrop of
somewhat slower growth worldwide. Still, even that more
moderate pace, in our forecast, would exceed the rate recorded
in any quarter of the prior expansion. While any 2022 projections
are necessarily speculative at this point, we think the
fundamental drivers described earlier will keep global growth
running between 3% and 4% annualized next year. That would
be nearly a percentage point above our estimate of the long-
term trend.
As mentioned, this burst of growth differs from prior episodes in
that EM economies are benefiting less. Instead, we see non-U.S.
DM countries as the “high beta” economies of the moment, given
that levels of activity, relative to the pre-pandemic trend, are
more depressed and that as a group these economies should
benefit from strong global capex. We do, however, see the global
economy as a whole benefiting from strong nominal growth as an
upturn in prices occurs alongside the strength in real activity.
Nominal growth should exceed fairly easily its pace from the
“global reflation” era of 2017–18, creating a supportive
environment for corporate profit growth and debt servicing
capacity (Exhibit 7).
Nominal growth will boost corporate earnings
EXHIBIT 7: GLOBAL GDP GROWTH (% QUARTER-ON-QUARTER, SAAR)
Source: Haver Analytics, J.P. Morgan Asset Management Multi-Asset Solutions; data and forecasts as of June 2021.
60
80
100
120
140
160
Jan-19 May-19 Sep-19 Jan-20 May-20 Sep-20 Jan-21 May-21
North Asia total exports (CN+KR+TW) To US To EU
-10
-5
0
5
10
15
20
2010 2013 2016 2019 2022
Real Nominal

GLOBAL ASSET ALLOCATION VIEWS
7 Multi-Asset Solutions
INFLATION: HOT FOR NOW, MORE MODERATE LATER
With growth running hot as economies reopen, the possibility of
a rise in inflation has occupied considerable attention among
market participants in recent months. Although we had expected
a burst of inflation pressure in the U.S. during the first half of this
year, we have nonetheless been surprised at its intensity. We
have taken on board some of this increase in thinking about our
medium-term forecasts, but we also expect some low side
payback in coming quarters as prices currently being squeezed
sharply higher begin to normalize. On the whole, we continue to
think that inflation will likely run at a somewhat stronger pace in
this expansion than during the previous decade. But we do not
see a dramatic inflation overshoot as particularly likely.
To be sure, U.S. numbers have shown more near-term inflation
than has been observed for decades. In year-on-year terms,
some of the increase reflects simple base effects, given
comparisons with the depths of the pandemic shock in 2020. But
the sequential trend has turned sharply upward as well, for three
reasons. First, a set of prices that collapsed amid plunging
demand during the pandemic have begun to correct. Examples
include airfares and hotels. Second, manufacturing bottlenecks
have led to shortages in some goods, most notably new and (by
extension) used cars but also some types of furniture and home
goods. Third, inflation in other areas has thus far slowed by less
than during the early part of the prior expansion, presumably
reflecting lesser, and less persistent, labor market slack.
Measures of underlying inflation, using trimmed-mean and
similar methods, illustrate these points. They have not moved
significantly higher in recent months, reflecting the importance
of outliers, but neither have they dropped noticeably.
Outside of the U.S., we hear faint echoes of these trends. Relative
to the U.S., greater prevalence of policy interventions, including
tax changes in the euro area and travel-and-leisure subsidies in
the UK and Japan, have affected price levels and made it more
difficult to parse the data. However, reopening effects have
proven smaller thus far, in part because of more drawn-out
processes elsewhere. Moreover, base effects also trail the U.S., as
prices in other economies fell less in 2020. Canada represents
the main exception among DM economies. With its economy
having followed a similar path to that of the U.S., core inflation in
year-on-year terms has moved above 2%. At the other end of the
spectrum, the shock appears to have entrenched further Japan’s
near-zero inflation environment, while inflation in the euro area
and the UK has moved up in the past quarter but remains firmly
below central bank targets.
Our top-down approach to inflation forecasting rests on three
main factors: inertia (as inflation tends to continue doing what it
has recently done), expectations (which we believe act as a
gravitational pull on inflation over time) and slack (which puts a
thumb on the scale in either direction if economies are operating
significantly below or above their potential output levels).
Inflation’s recent jump can thus pass through into the medium-
term outlook through the first two of these. Inertial effects mean
today’s high readings are likely to reverberate for some time.
Private sector inflation expectations appear to have moved
upward, a recent correction notwithstanding. Survey- and
market-based measures of expectations generally stand well
below levels observed during the higher inflation era of the
1970s and 1980s but above the extremely low readings of the
past decade.
With our near-term growth forecasts broadly unchanged, our
estimates of the output gap in coming quarters have not moved
significantly. We continue to believe that the U.S. economy will be
operating with a positive, and increasing, output gap from the
second half of 2021 onward. By our reckoning, this state of affairs
will produce gradual upward pressure on inflation next year, but
not a sharp acceleration.
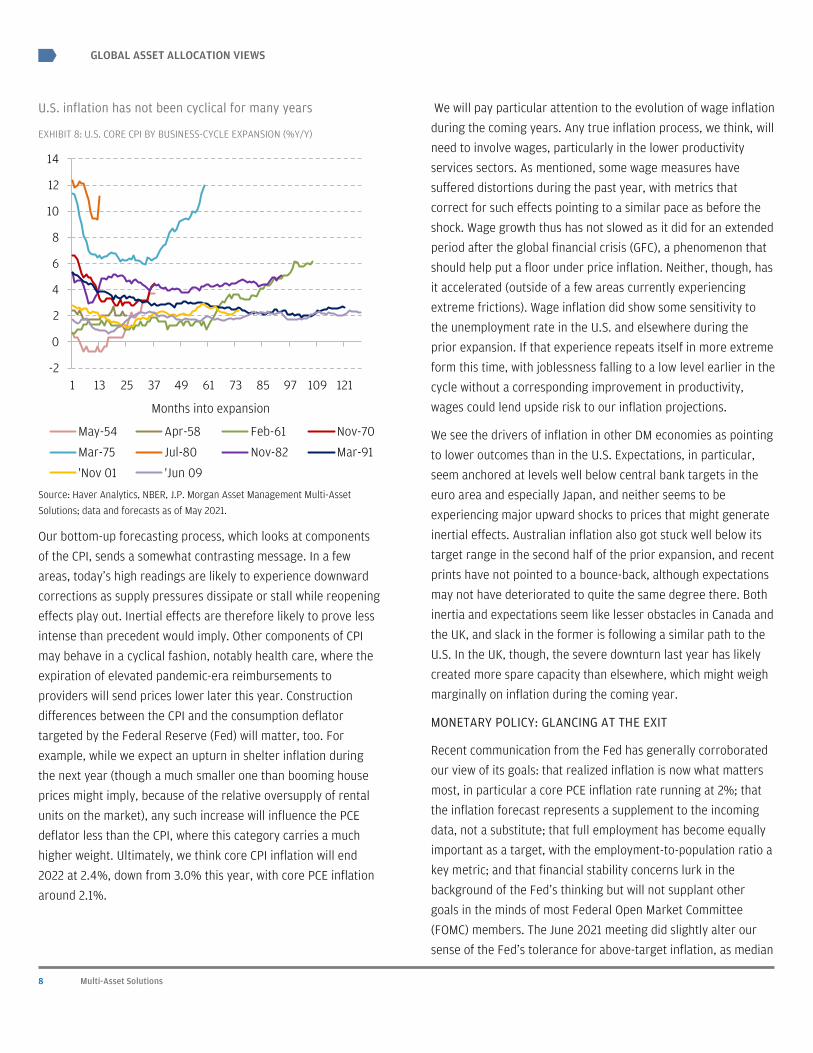
Why do we not expect a surge? For a few decades now, inflation
has showed almost no cyclicality, and therefore the estimated
sensitivity of inflation to the output gap is fairly small (Exhibit 8).
We regard comparisons to the 1960s and 1970s with skepticism.
What was then a largely closed, goods-oriented economy with
strong worker bargaining power and pervasive indexation
mechanisms is now an open, services-oriented economy with
limited unionization or indexation, and indeed with much higher
levels of consumer information. These changes likely make it
more difficult today to “overheat” the economy into truly high
inflation. All told, our top-down model points to the underlying
trend in core CPI inflation moving into the 2 1/2% range by the
end of next year.
GLOBAL ASSET ALLOCATION VIEWS
8 Multi-Asset Solutions
U.S. inflation has not been cyclical for many years
EXHIBIT 8: U.S. CORE CPI BY BUSINESS-CYCLE EXPANSION (%Y/Y)
Source: Haver Analytics, NBER, J.P. Morgan Asset Management Multi-Asset Solutions; data and forecasts as of May 2021.
Our bottom-up forecasting process, which looks at components
of the CPI, sends a somewhat contrasting message. In a few
areas, today’s high readings are likely to experience downward
corrections as supply pressures dissipate or stall while reopening
effects play out. Inertial effects are therefore likely to prove less
intense than precedent would imply. Other components of CPI
may behave in a cyclical fashion, notably health care, where the
expiration of elevated pandemic-era reimbursements to
providers will send prices lower later this year. Construction
differences between the CPI and the consumption deflator
targeted by the Federal Reserve (Fed) will matter, too. For
example, while we expect an upturn in shelter inflation during
the next year (though a much smaller one than booming house
prices might imply, because of the relative oversupply of rental
units on the market), any such increase will influence the PCE
deflator less than the CPI, where this category carries a much
higher weight. Ultimately, we think core CPI inflation will end
2022 at 2.4%, down from 3.0% this year, with core PCE inflation
around 2.1%.
We will pay particular attention to the evolution of wage inflation
during the coming years. Any true inflation process, we think, will
need to involve wages, particularly in the lower productivity
services sectors. As mentioned, some wage measures have
suffered distortions during the past year, with metrics that
correct for such effects pointing to a similar pace as before the
shock. Wage growth thus has not slowed as it did for an extended
period after the global financial crisis (GFC), a phenomenon that
should help put a floor under price inflation. Neither, though, has
it accelerated (outside of a few areas currently experiencing
extreme frictions). Wage inflation did show some sensitivity to
the unemployment rate in the U.S. and elsewhere during the
prior expansion. If that experience repeats itself in more extreme
form this time, with joblessness falling to a low level earlier in the
cycle without a corresponding improvement in productivity,
wages could lend upside risk to our inflation projections.
We see the drivers of inflation in other DM economies as pointing
to lower outcomes than in the U.S. Expectations, in particular,
seem anchored at levels well below central bank targets in the
euro area and especially Japan, and neither seems to be
experiencing major upward shocks to prices that might generate
inertial effects. Australian inflation also got stuck well below its
target range in the second half of the prior expansion, and recent
prints have not pointed to a bounce-back, although expectations
may not have deteriorated to quite the same degree there. Both
inertia and expectations seem like lesser obstacles in Canada and
the UK, and slack in the former is following a similar path to the
U.S. In the UK, though, the severe downturn last year has likely
created more spare capacity than elsewhere, which might weigh
marginally on inflation during the coming year.
MONETARY POLICY: GLANCING AT THE EXIT
Recent communication from the Fed has generally corroborated
our view of its goals: that realized inflation is now what matters
most, in particular a core PCE inflation rate running at 2%; that
the inflation forecast represents a supplement to the incoming
data, not a substitute; that full employment has become equally
important as a target, with the employment-to-population ratio a
key metric; and that financial stability concerns lurk in the
background of the Fed’s thinking but will not supplant other
goals in the minds of most Federal Open Market Committee
(FOMC) members. The June 2021 meeting did slightly alter our
sense of the Fed’s tolerance for above-target inflation, as median
-2
0
2
4
6
8
10
12
14
1 13 25 37 49 61 73 85 97 109 121
May-54 Apr-58 Feb-61 Nov-70
Mar-75 Jul-80 Nov-82 Mar-91
'Nov 01 'Jun 09
Months into expansion

GLOBAL ASSET ALLOCATION VIEWS
9 Multi-Asset Solutions
projections of 2.1% in 2022 and 2023 now, in many FOMC
participants’ minds, imply rate hikes in the second half of the
latter year. We previously thought the Fed might aim for a
slightly larger overshoot.
With that June meeting also bringing the start of a discussion
about “tapering,” or a gradual reduction in the Fed’s asset
purchases, we continue to expect that process to get underway
around the turn of the year, and expect it to run for about 12
months. We believe the FOMC will want to complete its exit from
bond-buying before raising short-term interest rates. A rate hike
would thus become possible in 2023, and we think the first one
will occur in the second half of that year, in line with the FOMC’s
June suggestion. We see little room for tapering to be brought
forward, as the Fed has consistently said it will provide ample
advance warning before it begins. The calendar also implies only
limited space for an earlier rate hike, and the slightly more
hawkish than expected reaction function now on display also
reduces the probability of a significant delay, unless inflation fails
to hold at the 2% mark. Were inflation to behave similarly in this
expansion as in the prior one, running persistently below the
target, we think the FOMC would hold off on raising rates
indefinitely.
Relative to the Fed, the Bank of Canada (BoC) has staked out the
most hawkish territory among DM central banks. With a relatively
comfortable inflation track record, slightly above-target inflation
currently, no framework change in favor of average inflation
targeting and a cyclical, commodity-sensitive economy, the BoC
has already begun reducing asset purchases. It will likely raise its
policy interest rate ahead of the Fed, too. By contrast, the
Reserve Bank of Australia (RBA) – previously a highly cyclical
central bank – has moved toward dovishness in the face of recent
inflation disappointments. Like Canada, Australia features a
mature housing cycle with growing hints of speculative activity,
but the Australian authorities have in the past successfully
addressed such issues with regulatory policy rather than higher
rates. The Bank of Japan will likely stay on hold indefinitely, and
we think the European Central Bank (ECB) may struggle to move
away from maximum accommodation for some time to come.
While the Bank of England is feeling its way in a post-Brexit
environment, its inflation history and outlook both seem
comfortable. We think it will behave more like the Fed than the
ECB.
During the last cycle, many central banks justified extreme
dovishness in part by referring to the likelihood that r*, the
equilibrium real short-term interest rate, had fallen to very low
levels. Estimates of r* produced by various central bank models
remain quite low and appear still to be serving as an anchor for
views about policy over the medium term. These calculations,
though, display high sensitivity to econometric specifications, and
various factors – such as demographics, saving behavior or
technological progress – might conspire to boost equilibrium real
rates as this expansion unfolds. A different view about “natural”
rates could alter the policy landscape, and we will be watching
for evidence that any such shift is taking hold. For now, we
believe that central banks worry more about getting stuck in a
permanently low inflation environment than about overshoots,
and we think monetary policy will retain a dovish tone even after
central banks begin moving to the exit.
Turning to the EM landscape, although China’s overall policy
stance has turned less accommodative since mid-2020, its policy
tightening so far has proceeded more gradually than in previous
cycles. From a financial conditions perspective, the magnitude of
tightening this cycle is only around 25% of what we witnessed
during 2016–18. Weaker growth data in April and May have likely
further reduced the risk of more aggressive tightening later this
year.
We expect monetary policy tightening to remain gradual, mainly
in the form of slower credit growth amid tighter control of
implicit local government debt and shadow banking credit. The
pace of credit slowdown will likely moderate in the coming
months and bottom out in the fourth quarter. Meanwhile, we
believe the People’s Bank of China will keep interbank liquidity
relatively ample to avoid adding further pressure on small and
medium-sized enterprises (SMEs), which were hit hard by the
pandemic. Despite rising producer price index inflation, we do
not expect any policy rate hikes as the government focuses more
on administrative measures to curb commodity price inflation.
Following a large easing cycle during 2019–20, rate cuts in other
EM economies have come to a stop. We expect to see tightening
by several EM central banks in 2H21, mainly in Latin America and
EMEA, but we do not think the tightening will be as prevalent
across emerging markets as it was during 2010 and 2018. We
continue to see limited risks of broad-based EM inflationary
pressure. While EM headline and core CPI inflation rates have

GLOBAL ASSET ALLOCATION VIEWS
10 Multi-Asset Solutions
moved up since the start of the year, driven by base effects and
higher commodity prices, they remain in the lower end of the
post-GFC range. Surveyed inflation expectations have also been
relatively stable in most EM economies despite rising commodity
prices. That said, inflation is more of a concern for some high
yielders, such as Brazil and Russia. Current inflation as well as
surveyed inflation expectations are above both of these central
banks’ inflation targets. As a result, we have already seen three
rate hikes each from Brazil and Russia, and expect further
tightening later this year.
EXHIBIT 3: THE BUSINESS-CYCLE SCORECARD FOR THE U.S.
Overall, we do not expect the rate hiking cycle to pose significant
challenges to the overall EM economic recovery. The EM rates
market has already priced in hikes for the coming quarters.
Moreover, the expected policy normalization in Central Europe
primarily reflects strong growth because of fast vaccine rollouts
and high leverage to the euro area recovery, and therefore
should prove less disruptive.
Early cycle Mid cycle Late cycle Recession
Econ
omic
met
rics
Overall economic output Below potential, rising Near potential, rising Above potential, rising Contracting
Consumption Low, lagging income Recovering High, ahead of income Falling
Capital investment Low as % of GDP Rising, moderate as % of GDP High as % of GDP Falling
Residential investment Low as % of GDP Rising, moderate as % of GDP High as % of GDP Contracting
Price inflation Below central bank target, stable Below CB target, rising Above CB target Falling
Wage inflation Low, stable Moderate, rising High Falling
Private credit formation Low, starting to rise Rising in line with output Rising faster than output Falling
Personal savings rate High relative to income Starting to decline Low relative to income Rising vs. income
Unemployment Well above NAIRU Above NAIRU Around or below NAIRU Rising sharply
Consumer confidence Low Moderate Exuberant Falling
Asse
t mar
ket m
etri
cs
EPS revision ratios Downgrade cycle, improving trend Upgrade cycle, improving trend Upgrade cycle, falling trend Downgrade cycle, falling trend
Corporate margins Rising Peaking Declining Low
Credit spreads Wide, contracting Tight, stable Past cyclical trough Wide, unstable
Aggressive issuance Low as share of total Moderate as share of total High as share of total Nonexistent
M&A activity Low Moderate High Nonexistent
Yield curve Rates low, curve steep Rates rising, curve flattening Rates high, curve flat Rates falling, curve steepening
Volatility Vol high, skew falling Vol low, skew low Vol starting to rise, skew rising Vol high, skew high
Most economic indicators are now in mid-cycle territory
Source: J.P. Morgan Asset Management Multi-Asset Solutions; assessments as of June 2021.

GLOBAL ASSET ALLOCATION VIEWS
11 Multi-Asset Solutions
LEVEL ONE ASSET ALLOCATION
At our June Strategy Summit, two conflicting themes emerged:
robust expectations for economic growth, and concern that
markets have already overshot. In the microcosm of the past
year, projecting some divergence of the economy and markets
over the next couple of quarters might seem reasonable. Not
only have equity valuations surged upward as central bank
liquidity fueled a buying frenzy in the stock market, but in the last
few days the Fed has indicated that time will eventually be called
on the monetary bonanza. However, if we take a sober, longer-
term perspective, we would note that it is unusual for economies
and markets to diverge for very long. Moreover, while economies
transitioning from early to mid cycle – as the U.S. is doing today
– can see shifts in momentum in their stock markets, they seldom
see changes in direction, especially when earnings growth is both
robust and underpriced.
We believe that the U.S. economy has shifted from the initial
early cycle to mid cycle with unprecedented speed, helped along
by massive fiscal stimulus and policy that – in contrast to some
prior cycles – was both proactive and suitably scaled. The result is
aggregate household balance sheets that are unusually healthy
for this point in the cycle, leading to the potential for a sustained
unleashing of pent-up demand as the economy reopens. At the
same time, favorable financing costs have driven a surge of
corporate capex, and banks – the epicenter of the last crisis – are
in very good shape despite the whipsaw of the last 18 months
(Exhibit 9). Concerns rightly linger on the large bloc of
unemployed and furloughed workers, and the slack in labor
markets. But even as the Fed has indicated a marginally more
hawkish turn, getting people back to work remains its primary
policy goal.
Global PMIs remain strong; Capex growth surged following
lockdowns and levels of investment are robust
EXHIBIT 9: GLOBAL CAPEX PMI AND CAPEX (% Q/Q, SAAR)
Source: Haver Analytics, J.P. Morgan Asset Management Multi-Asset Solutions; data as of June 2021.
The fiscal and monetary bonanza of the last year and a half has
left many fearing a surge in inflation, and base effects have
further conspired to drive a leap in inflation measures in the U.S.
and countries such as the UK. While we acknowledge that the
output gap is closing rapidly, we believe that labor market slack
together with persistent secular disinflation trends such as
automation will serve to prevent higher inflation from becoming
persistent. Indeed, the base effects from 2Q20, the recent jump
in commodity prices and the disruptions in the supply chain that
have caused an outsize price effect in specific areas all appear to
be on the wane. While it is true that upside inflation risks remain
and we expect the volatility of inflation to be rather higher, we
expect the inflation scare to subside in 2H21.
The same might also be said of the Fed, based on its projections:
inflation hitting 3% this year before subsiding to 2.1% in the
subsequent two years. This acknowledgment, together with the
upward shift to forward policy guidance through the Fed’s
Summary of Economic Projections (SEP) “dot plot,” takes some of
the steam out of the upward inflation trend, in our view. To be
sure, Fed policy remains remarkably easy, and based on the
“dots,” fed funds rates would rise only to 50–75bps by the end of
2023. That is hardly tight monetary policy by any reasonable
standard. And yet the FOMC meeting was for investors a hawkish
surprise, consistent with an economy moving rapidly from policy-
reliant early cycle to a self-sustaining mid cycle.
-36
-24
-12
0
12
24
42
44
46
48
50
52
54
56
58
2010 2013 2016 2019
PMI Capex

GLOBAL ASSET ALLOCATION VIEWS
12 Multi-Asset Solutions
The U.S. economy, along with Fed policy, remains clearly ahead
of other developed nations. As we suggested at the start of 2021,
the U.S. would lead in the first half of the year – given a rapid
vaccine rollout and uncompromising policy support – with Europe
and Japan accelerating in the second half. In our view, this
playbook remains broadly intact. With other developed regions
earlier in the cycle, their respective central banks remain some
way from the policy pivot recently taken by the Fed. This has
implications for both the currency and rates outlooks, as we will
explore. But it also implies that the reopening trade has further
to run within equity markets. This should lend support to cyclical
regions outside the U.S., even as market participants begin, once
again, to warm up to some of the secular growth themes deeply
embedded in U.S. equities. Emerging markets are rather more
nuanced. China and the North Asian economies are further ahead
in this cycle than the U.S., buoyed in part by the surge in goods
demand as locked-down householders quickly diverted dollars
destined for services and leisure to consumer goods and home
makeovers. By contrast, countries such as India and Brazil,
recently ravaged by second waves of COVID-19, are only now
beginning to see activity pick up (Exhibit 10).
PMIs show that the U.S. continues to lead the recovery
EXHIBIT 10: MARKIT FINAL COMPOSITE PURCHASING MANAGERS INDEX, SA
Source: Bloomberg, J.P. Morgan Asset Management Multi-Asset Solutions; data as of June 2021.
Turning to asset markets, we take a reasonably constructive view
on the outlook. At our Strategy Summit, some commentators
argued that the kind of positive economic outlook described in
the preceding paragraphs is already fully – or even excessively –
reflected in prices. We disagree. In our view, bond yields reflect
global policy frameworks at least as much as fundamentals,
suggesting that while there might be information in the direction
or trend in rates, there might be little in the level of yields. In
equity markets, we acknowledge the high optical level of P/E
valuations – especially in the U.S. – but equally note that over a
short time horizon valuation is a poor predictor of returns. Our
expectation that earnings growth will ease the extremes of
valuation is hardly unique. But we do believe that the likely
upside to earnings, both this year and next, is widely
understated. On balance, this leaves us with a high conviction
overweight to equity, a low conviction overweight to credit, a low
conviction underweight to duration and a moderate conviction
underweight to cash – in short, a portfolio tilted for a
continuation of the trends in both economic growth and asset
market returns.
Our equity overweight continues to display a cyclical and value-
style tone, although we note that, at the margin, some of the
impetus for the value tilt coming from steeper curves and higher
rates has diminished. As we see the U.S. economy move to mid
cycle, we anticipate a renewed focus on quality of earnings. In
our view, the early surge of buying and confidence will likely give
way to a sharper focus on sectors, regions and stocks with
reliable earnings. Indeed, we have already seen evidence of this
pattern within small caps, where the distinction between
profitable and nonprofitable stocks in 2Q21 became quite
palpable. Our quant team finds both the value and the quality
factors to be attractive, so building in something of a quality tilt
is further supported. Our cyclical bias continues to lead us to
favor Europe and Japan on a regional basis. In the U.S., we
believe that some of the secular growth themes expressed across
the wider U.S. equity market will receive renewed attention as
the topside risks to inflation and rates subside. By contrast, the
outlook for EM equities remains mixed, especially with further
weakening of the dollar now possibly on hold in 2H21 after the
Fed’s recent shift in stance.
A hiatus in the dollar’s downtrend was not the only outcome of
the Fed’s policy adjustment. The steepening of the U.S. yield
curve also came to an abrupt halt. To be clear, the maximum
steepness of the U.S. 2s10s and 5s30s curves had already been
reached in the first quarter – at around 160bps in both cases –
and the sharp flattening that followed the Fed’s June meeting
was likely exacerbated by positioning (Exhibit 11). Nevertheless,
20
30
40
50
60
70
Jun-18 Dec-18 Jun-19 Dec-19 Jun-20 Dec-20
U.S. Eurozone JapanU.K. Emerging Market

GLOBAL ASSET ALLOCATION VIEWS
13 Multi-Asset Solutions
we are probably now past the point of maximum steepness for
this cycle, in the U.S. Treasury market at least. The short end of
the curve is no longer as anchored as it was, and some of the
inflation fears affecting the back end have lessened. Equally, it is
probably too soon to argue for a flattening trend to take hold.
While short-end rates can move up over time, the Fed has
signaled that tapering will come first, potentially allowing the
longer end of the curve to drift higher. Thus, we expect that rates
do rise gradually – their momentum somewhat governed by the
ongoing duration demand from international central banks and
portfolio de-risking flows – but that it will probably be felt along
the curve rather than in one specific segment.
Yield curves steepened earlier this year; in real terms we
remain close to historically steep levels
EXHIBIT 11: U.S. REAL YIELD 5S30S CURVE SLOPE, BASIS POINTS
Source: Bloomberg, J.P. Morgan Asset Management Multi-Asset Solutions; data as of June 2021.
Elsewhere in fixed income, we have pared back our enthusiasm
for credit across many portfolios. True, the economic
environment and ample liquidity are supportive for the credit
complex, but at current levels of spread we view credit principally
as a carry asset. To see spreads tighter from here, we would need
to make some fairly heroic calls on a surge in demand for credit
hybrid structures. While low yields elsewhere could spark some
renewed interest, we think the lessons from the global financial
crisis are still quite fresh in investors’ minds. Overall, we see
credit as solid but unexciting and have reduced conviction in our
mild overweight in high yield. Given our expectation that the
downtrend in the U.S. dollar could also be on hold, we also move
EM debt – both hard and local currency – to a neutral stance.
Above all, we prefer to keep a risk-on tone in our portfolios but
believe that returns in 2H21 will be driven by upside surprise to
earnings. We acknowledge lofty P/E valuations in some indices
but equally note that some other metrics of valuation – including
cash flow yields – are far less stretched. Ultimately, we think this
is a time for spreading risk across equity markets but maintaining
something of a cyclical and value/quality tone. At a portfolio
level, the Fed’s action has perhaps reduced the extreme right tail
risk of inflation and, by extension, of rates. As a result, those
seeking to lock in gains from this year’s already strong equity
market performance may feel more compelled to own duration,
even as rates are likely to grind higher. Taking a step back and
for a moment looking through the levels of asset markets and
yields, we would acknowledge that their likely direction does
indeed map quite well to the economic backdrop.
-50
0
50
100
150
200
250
2002 2005 2008 2011 2014 2017 2020

GLOBAL ASSET ALLOCATION VIEWS
14 Multi-Asset Solutions
Our Level One scorecard favors equities and credit
EXHIBIT 12: LEVEL ONE SCORECARD
Considerations Comment Stock Bond Credit Cash
Mac
ro fa
ctor
s
Economic growth A period of above-trend growth lies ahead in 2021, with leadership broadnening out beyond the U.S. + - + 0
Financial conditions Financial conditions should remain easy, with spreads contained + 0 + 0 Monetary policy DM CBs are past the point of maximum accommodation, but will rolling back stimulus only gradually + + + -
Tail risks Quicker withdrawal of policy stimulus; delta variant; inflation upside; China over-tightening - 0 - 0
Mar
ket f
acto
rs
Valuation – absolute Global equities expensive; bond yields look somewhat rich; little scope for spreads to tighten further - 0 0 0 Valuation – relative Equity risk premium, though lower, remains elevated; duration cheaper but not cheap; credit looks rich + 0 - - Fundamentals EPS upside to come; policy turning less positive for bonds; leverage still extended in credit + 0 0 0 Positioning Equity positioning elevated, but not extreme; bonds and credit more evenly balanced 0 0 0 - Flows/sentiment Equity flows still positive; moderate flows in bonds; credit flows turned negative + 0 - -
Overall Score + - + - Source: J.P. Morgan Asset Management Multi-Asset Solutions; assessments as of June 2021.

GLOBAL ASSET ALLOCATION VIEWS
15 Multi-Asset Solutions
LEVEL TWO ASSET ALLOCATION
At this juncture, we shift our perspective. In the preceding pages,
we examined our Level One asset choices, the basic portfolio
decisions involving broad asset classes (for example, stocks vs.
bonds). We now present our Level Two asset decisions. Here we
look within asset classes and determine, for example, what type
of credit (investment grade [IG], high yield or emerging market
debt) appears most attractive.
RATES
We maintain an underweight stance on duration, but with low
conviction. Yields over the last quarter have largely tracked
sideways, with the JP Morgan GBI bond yield unchanged and U.S.
10-year yields 20bps lower. Beneath the surface, however,
markets have been volatile. Positioning-driven moves and a pivot
from the Fed led to sharper moves in the yield curve, with 5s30s
flattening by over 30bps in the quarter. Despite the decline in
U.S. yields, we maintain our short-duration bias. This reflects our
positive macroeconomic outlook along with our sense that the
global economy is likely in a reflationary regime and that easy
monetary policy has passed its peak. While central banks are still
accommodative in an absolute sense, in a relative sense the
direction of travel is toward less emergency accommodation as
economies heal.
We expect the Fed to start tapering asset purchases early next
year. At its latest meeting, the FOMC talked about when tapering
might start and how rate hikes might proceed – a hawkish
surprise for markets. In coming months, we expect further
discussion of both tapering and rate hikes as the central bank
calibrates policy to the post-COVID-19 environment. That
environment will still see significant fiscal stimulus and,
potentially, the unleashing of trillions in “excess” savings
accumulated by households during the pandemic lockdowns.
Going forward, we expect more volatility in shorter-maturity
bonds (the two- to five-year sector) as the market reassesses the
Fed’s reaction function in the average-inflation targeting regime.
The Fed’s marginally hawkish tone complicates an investor’s view
of the yield curve, as the front end is no longer firmly pinned. We
had previously seen the global yield curve steepening, but now
we question this view, especially in the U.S. market (Exhibit 12).
Yield curve steepening view called into question
EXHIBIT 12: U.S. YIELD CURVE SLOPE, BASIS POINTS
Source: Bloomberg, J.P. Morgan Asset Management Multi-Asset Solutions; data as of June 2021.
High inflation outcomes are likely to persist for the next few
quarters due to economic reopening, supply-chain disruptions
and labor shortage issues. But we expect this to be a temporary
phenomenon, with inflation returning closer to central bank
targets later in 2022. On the policy front, we also learned a little
more about the Fed’s willingness to look through inflation rates
above its target. Effectively, the FOMC is signaling that it is likely
to raise policy rates as inflation rises above 2.1% in core PCE
terms (as inferred from the Fed’s latest Summary of Economic
Projections). This is a lower inflation threshold than we had
previously considered, and it signals a Fed eager to reduce the
right tail of inflation distribution. Given this backdrop, we are
cooling our optimism about inflation breakeven markets and
reduce our positive view on U.S. TIPS (Exhibit 13A and 13B).
Inflation breakeven markets have priced in a lot already
EXHIBIT 13A: 5Y5Y INFLATION SWAP, %
Source: Bloomberg, J.P. Morgan Asset Management Multi-Asset Solutions; data as of June 2021.
0
50
100
150
200
250
300
350
2010 2011 2012 2013 2014 2015 2016 2017 2018 2019 2020 20212s10s 5s30s
0.0
0.5
1.0
1.5
2.0
2.5
3.0
2018 2019 2020 2021
U.S. Euro Area

GLOBAL ASSET ALLOCATION VIEWS
16 Multi-Asset Solutions
EXHIBIT 13B: ESTIMATED COMPOSITION OF CHANGES IN 10-YEAR U.S INFLATION PRICING SINCE JANUARY 2020, %
Source: D’Amico, Kim and Wei (2018) updated by Kim, Walsh and Wei (2019), J.P. Morgan Asset Management Multi-Asset Solutions; data as of June 2021.
Market positioning remains short duration in the U.S., a modest
headwind to our stance on duration. But in the wake of the June
FOMC meeting, we have seen a sharp unwind of consensus
positions, pointing to a cleaner investor positioning base.
Moreover, since the meeting our underweight stance on duration
has shifted to intermediate maturities on the yield curve. In the
two- to 10-year part of the yield curve, positioning is less
concentrated (Exhibit 14).
Bond investors were short duration but started to cover this
recently
EXHIBIT 14: NET LONG SHARE OF NONCOMMERCIAL CONTRACTS, %
Source: Bloomberg, J.P. Morgan Asset Management Multi-Asset Solutions; data as of June 2021.
Our relative preferences across government bond markets
remain relatively unchanged with the U.S., the UK and Canada
our least preferred markets. By contrast, we prefer lower yielding
markets in Europe and Japan on a relative basis. This ranking is
largely a function of our views on relative inflation and central
bank policy as well as these markets’ exhibited cyclical beta.
In the U.S., we expect 10-year bond yields to reach 2% by the end
of the year, driven mainly by a rise in real rates. Historically, real
rates have risen as growth improved and policymakers adjusted
to that growth environment. We expect a similar reaction
function in this cycle – but we think it will be more muted, given
the extraordinary scale of policy stimulus still coursing through
the global monetary system. Crucially, though, this expected rise
in bond yields should coincide with very strong growth outcomes.
Thus, we do not believe that a move higher in yields will
necessarily translate into tighter financial conditions.
We also underweight the UK Gilt and Canadian government bond
markets. In both countries, we already see central banks moving
away from extreme policy accommodation by tapering asset
purchases and even discussing the pathway to lifting policy rates
of the zero bound. In the UK, we see strong growth and rising
inflation against a backdrop of fairly well-anchored inflation
expectations (both survey- and market-based measures). As a
result, we expect the Bank of England will signal the end of QE in
coming months, with rate hikes penciled in for 2022 and beyond.
Markets have adjusted to this thesis, with Gilt yields up over
50bps year-to-date. We expect a continuation of UK market
underperformance in the coming quarters.
In the context of our overall underweight to duration, we
maintain a relative preference for markets in Japan and the euro
area. That view reflects the lack of persistent inflation pressure in
the regions and central banks that are signaling a continued
accommodation. In Europe, we remain positive on peripheral
bond markets, which are the clearest beneficiaries of the pro-
cyclical economic recovery as well as extreme monetary policy
accommodation.
In the last few months, we learned about the disbursement of
funds from the EU Next Generation Fund, and as expected, the
plan is for sizable funding for southern countries. Exhibit 15,
shows the size of grant and loan disbursements (as % of GDP) for
the major economies that have disclosed their plans for usage of
-1.0
-0.5
0.0
0.5
1.0
Jan-20 May-20 Sep-20 Jan-21 May-21
Expected inflation Inflation risk premium Liquidity premium
-60
-50
-40
-30
-20
-10
0
10
20
2019 2020 20212y 5y 10y 30y

GLOBAL ASSET ALLOCATION VIEWS
17 Multi-Asset Solutions
NextGen Funds. Italy is expected to receive over EUR 200 billion
in support. Over the next two years alone, Italy benefits from
loans and grants of over 3% of GDP. This fiscal support alongside
a central bank that remains accommodative provides strong
tailwinds to peripheral bond markets.
Peripheral states benefit disproportionately from NextGenEU
funds
EXHIBIT 15: EU NEXT GENERATION – GRANTS AND LOANS, % OF GDP
Source: EU Comission, Morgan Stanley, J.P. Morgan Asset Management Multi-Asset Solutions; data as of June 2021. EA = euro area, DE = Germany, FR = France, IT = Italy, ES = Spain, NL = Netherlands, BE = Belgium, AT = Austria, PT = Portugal, GR = Greece, IE = Ireland.
We remain neutral on Australia. Historically, Australian bonds
would sit in the higher beta, more cyclically geared bond bucket,
but over the last quarter we have been surprised by how stable
Australian government bonds (ACGBs) have been. We attribute
this lower beta dynamic largely to the Reserve Bank of Australia’s
QE program and anchoring of short rates as inflation remained
weak. We do see a high degree of uncertainty about how long the
RBA will remain this dovish and whether it will follow the Fed in
signaling rate hikes over the foreseeable horizon. This
uncertainty keeps us neutral as we await clearer guidance on the
policy outlook.
FX
Amid improved COVID-19 outcomes and substantial policy
support, we think above-trend global growth will likely persist
over the latter half of 2021. All else equal, this pro-cyclical
environment implies appreciation in high beta FX while
tempering enthusiasm for reserve currencies, particularly USD.
That said, the constructive global outlook is already well
appreciated by FX participants and thus, in isolation, less likely to
be the catalyst for further broad-based USD weakness (Exhibit
16). Instead, over the coming months, we expect compositional
changes in the ongoing global recovery to spark a more
differentiated phase of currency price action.
Year-to-date, the U.S.’s growth lead over RoW has stabilized,
however broad-based dollar depreciation has stalled
EXHIBIT 16: DXY PERFORMANCE AND U.S.-GLOBAL JFRI COMPARISON
Source: Bloomberg, J.P. Morgan Asset Management Multi-Asset Solutions; data as of June 2021.
Specifically, in aggregate, we anticipate an acceleration in ex-U.S.
rest-of-world (RoW) growth driven by economic reopening,
greater global services sector activity and increasing divergence
in DM monetary policy stances. How individual currencies
perform in this context depends significantly on their countries’
own course of the virus, which in turn dictates domestic
reopening and policy normalization. Generally, we continue to
favor currencies that were vaccine and growth laggards in the
first half of the year, but crucially, we acknowledge that near-
term scope for broader USD weakness is more limited.
USD
We remain circumspect on the U.S. dollar in the medium term,
given the macro backdrop and collapsed nominal yield
differentials. Historically, moderation of U.S. growth leadership
and a persistently dovish Fed have implied sustained dollar
weakness. And we did see spells of DXY depreciation through
April and May as vaccine laggards, particularly in Western
Europe, began to catch up.
0
0.5
1
1.5
2
EA DE FR IT ES NL BE AT PT GR IE
Grant 2021 Grant 2022 Loan 2021 Loan 2022 -3
-2
-1
0
1
2
88
91
94
96
99
102
Apr-20 Jul-20 Oct-20 Jan-21 Apr-21DXY U.S. - Global JFRI (Z-Score, RHS)
GLOBAL ASSET ALLOCATION VIEWS
18 Multi-Asset Solutions
But in June, the Fed’s communication took a hawkish turn,
lending some near-term support to the dollar. Specifically, the
Fed made an upward shift to forward policy guidance through its
“dot plot,” effectively signaling greater data dependency in the
context of mounting inflation and frictional job market weakness.
Further, talk of tapering has escalated broadly among G10
policymakers, with Canada already beginning to decelerate its QE
purchases.
As we have noted in the past, a repricing of UST yields does not
preclude medium-term dollar bearishness. Indeed, collapsed
yield differentials, particularly in real terms, have been one of
our core themes. Yet we find that rates repricing that reflects
improved domestic growth prospects rather than tightening
financial conditions can coexist with selective USD softness. That
said, recent Fed messaging has introduced greater scope for
front-end real rates to rise in a way that is dollar supportive.
Ultimately, we are confident that explicit Fed communication will
comfortably precede any material changes to monetary policy.
We emphasize the distinction between beginning “talks of
tapering” and actually beginning to taper. Currently, the Fed
remains committed to above-target inflation and “substantial
further progress … toward the Committee’s maximum
employment and price stability goals.” We see the Fed’s June
turn as hawkish at the margin while absolute levels of policy
remain highly accommodative, a distinction we believe justifies
maintaining our neutral stance on USD. However, the trajectory
of financial conditions is decidedly less dovish than it was at our
last Summit, skewing the balance of risks toward some near-term
support for USD.
JPY
In Japan, inflation expectations have structurally de-anchored
from the policy target, suggesting that the Bank of Japan will
persistently lag in reflation and monetary policy normalization.
This dynamic has played a key role in yen weakness over the first
half of 2021. Other, more transient headwinds, primarily a third
COVID-19-related “state of emergency,” have also generated
near-term growth underperformance. Still, there is reason to be
constructive on Japanese macro conditions going forward. The
vaccine rollout is clearly gathering speed, suggesting an
impending recovery in domestic services consumption. In
addition, Japan’s gearing to the booming global goods cycle
implies further support from the current account. In sum, we
continue to expect the ongoing global reflation trade to burden
yen performance, but anticipate the more transitory headwinds
to abate somewhat in the coming months.
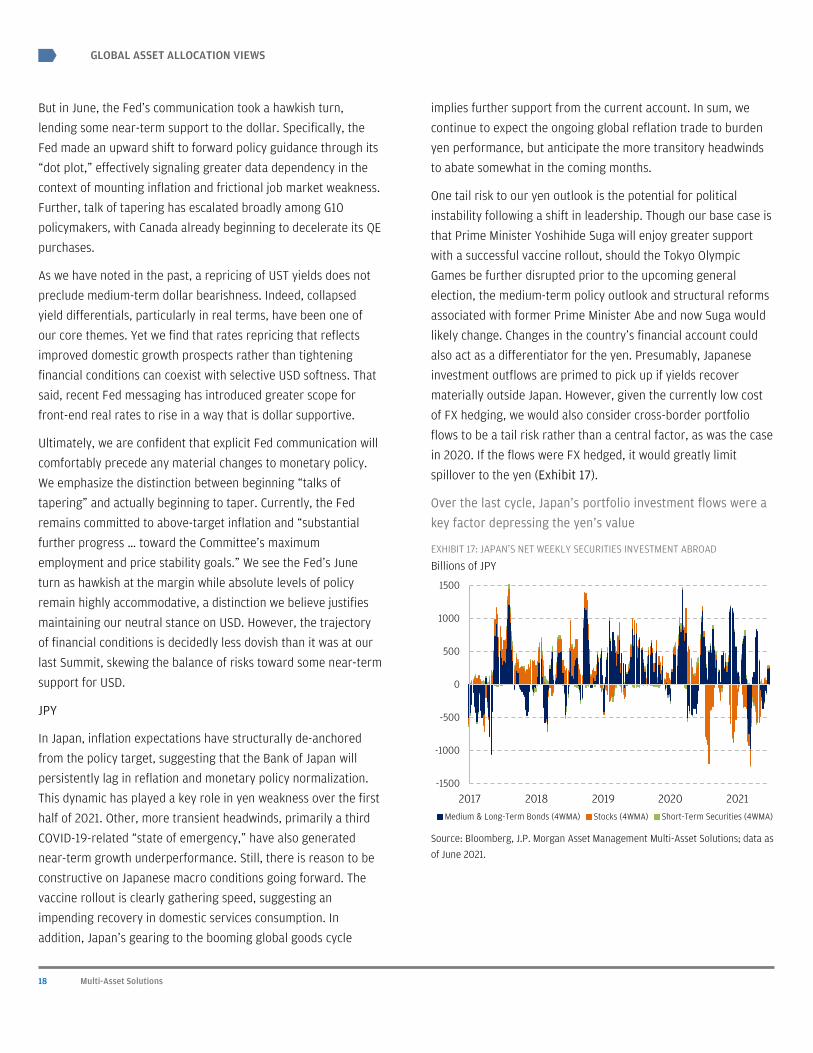
One tail risk to our yen outlook is the potential for political
instability following a shift in leadership. Though our base case is
that Prime Minister Yoshihide Suga will enjoy greater support
with a successful vaccine rollout, should the Tokyo Olympic
Games be further disrupted prior to the upcoming general
election, the medium-term policy outlook and structural reforms
associated with former Prime Minister Abe and now Suga would
likely change. Changes in the country’s financial account could
also act as a differentiator for the yen. Presumably, Japanese
investment outflows are primed to pick up if yields recover
materially outside Japan. However, given the currently low cost
of FX hedging, we would also consider cross-border portfolio
flows to be a tail risk rather than a central factor, as was the case
in 2020. If the flows were FX hedged, it would greatly limit
spillover to the yen (Exhibit 17).
Over the last cycle, Japan’s portfolio investment flows were a
key factor depressing the yen’s value
EXHIBIT 17: JAPAN’S NET WEEKLY SECURITIES INVESTMENT ABROAD
Source: Bloomberg, J.P. Morgan Asset Management Multi-Asset Solutions; data as of June 2021.
-1500
-1000
-500
0
500
1000
1500
2017 2018 2019 2020 2021Medium & Long-Term Bonds (4WMA) Stocks (4WMA) Short-Term Securities (4WMA)
Billions of JPY

GLOBAL ASSET ALLOCATION VIEWS
19 Multi-Asset Solutions
EUR
Within G4 FX, the euro continues to be our most preferred
expression of a broadening global economic recovery. Domestic
growth momentum, globally easy financial conditions and, more
recently, equity investment inflows all support the currency.
Market participants largely anticipated strong Q2 growth fueled
by an accelerated vaccine rollout. But we have been further
encouraged by the participation of services activity in recent data
outperformance. A still-significant negative output gap in
services indicates further upside potential for the euro as the
services sector continues to rebound. In addition, net inflows to
European equity funds are tilted in favor of EUR amid the
ongoing equity style rotation (Exhibit 18).
Net equity inflows to European equities have picked-up
EXHIBIT 18: FLOWS INTO EUR-DENOMINATED ETF INSTRUMENTS
Source: Bloomberg, J.P. Morgan Asset Management Multi-Asset Solutions; data as of June 2021.
Opposite this, as talks of monetary policy normalization intensify,
tilting against EUR strength is a decade’s worth of inflation
undershoots. This precedent calls into question the ECB’s
capacity to “keep up” when the global rate hiking cycle
eventually gets underway, and by extension, the euro’s ability to
remain pro-cyclical. Not only are underlying price pressures
structurally weaker in the euro area compared with the U.S., but
in the immediate response to the pandemic, Europe’s fiscal policy
was much less forceful. Together, these factors cast doubt on the
euro area’s ability to meet inflation targets and thus keep pace in
the eventual normalization of monetary policy. For today’s
narrow, EUR-supportive real yield differential to be maintained,
markets likely require continued Fed easing. If the Fed is slow to
implement its recent shift in communication, it should allow EUR
to continue to appreciate as part of the ongoing reflationary
process. Taking all these factors into account, we reduce our EUR
overweight with low conviction.
GBP
As near-term tailwinds continue to largely determine sterling
price action, we’re increasingly less negative on GBP. In
developed markets, the Norges Bank, the Bank of Canada and the
Bank of England have distinguished themselves as leaders in
monetary policy normalization. This provides further support to
GBP, which is also buoyed by a very successful COVID-19 vaccine
rollout and a near-term growth rate that outpaces the U.S.
Still, we have been circumspect on GBP, given the considerable
damage that the UK economy suffered as a result of a severe
COVID-19 experience, along with uncertainty related to Brexit. FX
markets have looked through recently heightened EU-UK
tensions related to the Northern Ireland protocol, which concerns
the implementation of a trade border between Northern Ireland
and the UK. Investors have focused instead on COVID-19-related
progress and monetary policy normalization. For now, the
currency seems desensitized to Brexit news flow and continues to
perform in the ongoing global reflation environment. However,
idiosyncratic political instability remains a concern.
EQUITY
Since our last Strategy Summit, in March, equity markets have
ground higher, and year-to-date the MSCI ACWI Index is up over
11%. In terms of market leadership, the past quarter has been
more balanced than the previous two: Cyclical stock markets
have tended to do better than defensive ones, but less
emphatically, and value vs. growth has moved sideways. By
region, European stock markets have fared well and U.S. small
cap stocks have stopped outperforming, while Japanese equities
have struggled amid a wave of COVID-19 infections.
Against a macro backdrop of surging economic growth and
supportive policy, we remain positive on equities as an asset
class. We continue to expect the main driver of positive returns to
be an earnings recovery in 2021 that is both much stronger than
in historical post-recession periods and still much stronger than
expected, even after recent upgrades in both top-down and
1
1.05
1.1
1.15
1.2
1.25
1.3
30
40
50
60
70
80
90
2015 2016 2017 2018 2019 2020 2021
U.S. listed unhedged Europe ETF flows ($, LHS) EURUSD

GLOBAL ASSET ALLOCATION VIEWS
20 Multi-Asset Solutions
bottom-up expectations. However, set against this are elevated
equity valuations across regions, which already price in a good
portion of the recovery in economies and earnings – although not
all of it, in our view. It would be highly unusual not to see further
declines in valuation multiples from here. Crucially, however,
these should be driven by earnings rising faster than stock prices
rather than weak markets. As we’ve been saying for some time,
the combination of rising earnings and falling multiples should
still leave plenty of potential for stock indices to rise, and this is
indeed what we have been seeing so far this year.
The transition from a valuation-driven market to an earnings-
driven market has been a little bumpy. Not surprisingly, we have
seen repeated bouts of volatility along the way. One key
milestone: the arrival of “peak growth” for this cycle. That is, the
acceleration in economic and profit growth has reached its high
point in the U.S. during the second quarter and should be
decelerating from here. Europe and Japan should experience the
same dynamic in the third and fourth quarters, respectively.
History suggests that equity returns will slow from this point but
should stay positive unless investors begin to worry about an
imminent descent into economic slowdown or recession. A
recession over the near term seems less likely than usual, given
the unique characteristics of this cycle.
The possibility of higher corporate tax rates – particularly in the
U.S. – is a negative for equities, but we think the threat will likely
remain quite modest in the context of the huge scale of earnings
growth still ahead. Still, until tax proposals come into focus it
remains impossible to quantify the precise impact on earnings
levels or identify corporate winners and losers. On a regional
basis, the prospect of higher taxes is likely to be a headwind
mostly for the U.S. equity market.
Earnings
As we’ve noted, exceptionally strong earnings growth will remain
the key fundamental driver of positive equity returns over the
coming quarters. Growth expectations for 2021 incorporate an
element of recovery as well as additional growth beyond the pre-
crisis baseline.
After falling by around 12% in 2020, EPS for the MSCI ACWI index
is now expected to grow by around 39% in 2021 – up from 30%
at our March Summit – and should leave the level of EPS at the
end of 2021 above the pre-COVID-19 (2019) level by 20%. A rise
in growth forecasts can be seen across many regions and is also
evident in surging earnings revision ratios, which are now at all-
time record highs in both the U.S. and Europe (Exhibit 19). Over
the last six months, EPS growth expectations for 2021 have risen
by 12% globally, including 14% in the U.S. and 15% in emerging
markets. While this rapid pace of earnings upgrades may not be
sustained for very long, we do see further substantial scope for
2021 and 2022 EPS forecasts to move higher, providing additional
momentum to equities and sentiment.
Earnings revisions ratios are near all-time highs in Europe and
Japan
EXHIBIT 19: NET EPS REVISION RATIO, 13-WEEK AVERAGE
Source: Datastream, J.P. Morgan Asset Management Multi-Asset Solutions; data as of June 2021.
The unusually steep upgrade cycle largely reflects a catch-up
with the unprecedented pace of economic recovery and growth.
While analysts often find themselves behind the curve around
cyclical turning points – owing to factors such as behavioral
biases, the difficulty in quantifying operational gearing at the
firm level and heightened uncertainty – the sheer scale of this
cycle’s growth acceleration makes the upgrade dynamic more
pronounced than usual.
Consider: For the past four quarters, companies in the U.S.,
Europe and Japan have beaten bottom-up analysts’ expectations
in record numbers and by unprecedented amounts, at both the
top and bottom lines. We would expect to see something similar
to repeat in the upcoming second-quarter earnings reports,
-80%
-60%
-40%
-20%
0%
20%
40%
60%
2016 2017 2018 2019 2020 2021
ACWI U.S. Large Cap EM Europe Japan

GLOBAL ASSET ALLOCATION VIEWS
21 Multi-Asset Solutions
which are likely to provide the catalyst for another round of
bottom-up analyst forecast upgrades and further momentum to
the upgrade cycle overall.
Valuations
Falling valuations should constrain equity returns over the
coming year. As Exhibit 20 shows, in simple forward PE terms
equity valuations continue to be very elevated. They have been
falling since late 2020, but the declines have only partly offset
strong earnings gains. As we’ve seen for much of this cycle,
valuations remain most stretched in the U.S. equity market,
where the current P/E of 21x is just 16% below the highs of the
dot-com bubble and 40% above the 40-year average. A fall of
around 20% from last year’s high seems a realistic target for the
U.S. P/E ratio, but we acknowledge that this move is very difficult
to forecast.
Absolute levels of stock market valuations remain elevated
EXHIBIT 20: 12-MONTH FORWARD PE RATIOS ACROSS REGIONS
Source: Datastream, J.P. Morgan Asset Management Multi-Asset Solutions; data as of June 2021.
Most other measures of global equity valuations – cyclically
adjusted P/E ratios, price-to-book ratios, dividend yields – also
continue to signal that equities are expensive. However,
valuation metrics comparing equities to the prevailing level of
interest rates still tell a more supportive story. Our preferred
metric here is the equity risk premium (ERP). Through all the
recent gyrations in bond markets, we estimate that in the U.S. the
ERP has nevertheless stabilized over recent months, at just below
6%, after coming down sharply from the March 2020 high
(Exhibit 21). This reflects UST 10-year yields toward the lower end
of their recent range, at around 1.5%. But it also reflects very low
U.S. dividend yields (just over 1.3%), driven by rising share prices
rather than cuts in dividends, which should recover in time. This
leaves the ERP only slightly below its post-GFC average of 6.2%.
It is still well above the longer-run average of 4.8%. Overall, the
current level of ERP suggests that equities can still rise further
before they look outright expensive relative to bonds. Conversely,
equities should be able to digest higher bond yields through a
compressing ERP, especially if bond yields moved higher because
of stronger economic growth. Looking ahead, we think the ERP
will likely compress as a result of both factors: rising bond yields
and equity prices.
Equity yields are still attractive vs. bond yields, but less so
EXHIBIT 21: EQUITY RISK PREMIUM. U.S., %
Source: Bloomberg, J.P. Morgan Asset Management Multi-Asset Solutions; data as of June 2021.
0x
5x
10x
15x
20x
25x
30x
1987 1992 1997 2002 2007 2012 2017
DM Ex-U.S. 10-Year AverageU.S. Large Cap 10-Year AverageEM 10-Year Average
0.0
1.0
2.0
3.0
4.0
5.0
6.0
7.0
8.0
9.0
1984 1988 1992 1996 2000 2004 2008 2012 2016 2020
ERP Average +1 stdev -1 stdev

GLOBAL ASSET ALLOCATION VIEWS
22 Multi-Asset Solutions
Relative Value
Styles
Over the start of 2021, investors focused on strength in the
cyclical parts of the stock market, as well as that of value stocks.
In the second quarter, momentum for these styles waned
(Exhibit 22).
Cyclicality and value styles moved sideways over the last
quarter
EXHIBIT 22: CYCLICALS VS. DEFENSIVES AND VALUE VS. GROWTH, U.S. INDICES
Source: Bloomberg, J.P. Morgan Asset Management Multi-Asset Solutions; data as of June 2021.
Several factors explain this more muted performance. First, both
cyclical and value styles have already moved some distance in
recent quarters. Cyclical performance has been much stronger
than value’s, but value’s recent strong run suggests that markets
have priced in much of the good news about the economic
recovery. For example, since U.S. financials hit bottom in March
2020 the sector is up over 100% and now trades nearly 20%
above pre-COVID-19 levels. Second, markets have focused on the
implications of hitting “peak growth” in the U.S., moving past the
high point in economic and earnings acceleration. Third,
valuations for defensive and growth sectors have begun to look
more attractive: The relative forward P/E ratio for the U.S. health
care sector recently approached all-time lows (Exhibit 23).
Fourth, rates markets have provided more muted signals for
these styles, with both real rates and breakevens moderating.
Some defensive sectors, including healthcare, have looked
more attractive from a valuation perspective
EXHIBIT 23: RELATIVE FORWARD P/E RATIO, HEALTHCARE VS. MARKET
Source: Datastream, J.P. Morgan Asset Management Multi-Asset Solutions; data as of June 2021.
We have trimmed our preference for the value factor but still
think that cyclical and value stocks can perform well, supported
by a prolonged period of above-trend growth, marginally higher
interest rates and future earnings upgrades, concentrated in the
relevant sectors. However, we advocate a more selective and
international approach as the cycle matures, and a greater focus
on quality.
U.S.
U.S. large cap stocks are the highest quality market in our
geographic opportunity set (Exhibit 24). Quality of earnings and
investors’ renewed focus on cheaper secular growth themes
make the U.S. large cap market more attractive, in our view. As a
result, we have neutralized our preference for U.S. small caps
over U.S. large caps, remaining positive on the region as a whole.
The dominance of the growth parts of the U.S. large cap index
may prove a negative should the value vs. growth trade pick up
steam. But retaining exposure to stocks with secular earnings
growth still makes sense, especially if yields rise only marginally.
40
50
60
70
80
90
100
110
120
130
140
Jul-19 Dec-19 May-20 Oct-20 Mar-21
Value vs Growth (Morgan Stanley Indices, U.S.)Cyclicals vs. Defensives (Morgan Stanley Indices, U.S.)
Style Performance, 100 = 2 Years Ago
60%
70%
80%
90%
100%
110%
120%
130%
140%
150%
1995 1998 2001 2004 2007 2010 2013 2016 2019

GLOBAL ASSET ALLOCATION VIEWS
23 Multi-Asset Solutions
U.S. stocks remain the highest quality in our opportunity set
EXHIBIT 24: ROE BY GEOGRAPHY
Source: Bloomberg, J.P. Morgan Asset Management Multi-Asset Solutions; data as of June 2021.
Europe
We remain positive on euro area equities. Europe lags the U.S. in
its growth trajectory, and its economy should experience its
strongest period of growth in the third quarter. European
earnings revisions have moved sharply higher, and we anticipate
more upgrades in the upcoming earnings season. The European
vaccination program has ramped up significantly, catching up
with the U.S. and the UK, and starting valuations for “reopening”
stocks look more attractive than in other regions. The growing
prevalence of the delta variant poses a risk to European growth,
but we feel that the strength of Europe’s vaccination programs
should support the reopening theme in the medium term. Europe
is one of our preferred value plays, and we note that investor
sentiment toward Europe has improved recently, with positive
flows into the region.
Japan
Our positive outlook on Japanese equities is an expression of our
preference for cyclical markets. By sector weighting, Japan ranks
as the most cyclical major market, at over 60% when broken
down to industry groups. The biggest sectors in the TOPIX are
industrials and consumer discretionary, which is dominated by
exposure to auto companies. Though the auto sector faces
supply-chain issues due to shortages of semiconductor chips and
petrochemicals, the situation seems to be improving. The relative
performance of the Japanese market also tends to benefit from a
weaker JPY. The yen is less preferred in our FX framework,
though it’s notable that the strength of that relationship has
moderated. As it has in Europe, Japan’s vaccination program has
accelerated quickly in recent months.
Emerging markets
We think it’s too early to rotate back into emerging market
stocks. The Fed’s recent policy shift lends some near-term
support to the U.S. dollar, which is a headwind. Emerging market
stocks tend to trade with a growth bias, reflecting the importance
of some Chinese mega cap stocks in the index. As previously
noted, at the margin we still prefer value to growth styles, and
Chinese internet companies are also in the middle of a regulatory
and policy cycle that has hurt sentiment. It’s notable that a
number of key Chinese internet names are trading at more
attractive valuations, suggesting that emerging market equities
might become more attractive sometime later in the year. For
now, we prefer to take equity risk elsewhere (Exhibit 25).
Chinese internet stocks are trading on better valuations, but
we think it’s too early to enter into Emerging Market positions
EXHIBIT 25: CHINA INTERNET STOCKS PRICE TO SALES RATIOS
Source: Bloomberg, J.P. Morgan Asset Management Multi-Asset Solutions; data as of June 2021.
UK
We remain neutral on UK equities. On the positive side of the
ledger, the UK market continues to trade below pre-COVID-19
levels, trades with the value style and offers exposure to energy
and materials companies with a bright earnings outlook.
However, one of the largest sectors in the FTSE 100 is consumer
staples, a defensive sector that has been a laggard amid the
strong economic reopening. With the UK’s earnings revisions in
the middle of the pack, Europe and Japan seem like better
8.3% 8.4%10.6% 11.7% 12.3% 12.5% 12.8% 13.2% 14.5%
19.1%
0%
5%
10%
15%
20%
25%
JP SC HK EU CA AU UK EM ACWI US
12-Month Forward ROE Long-Run Average
3x
4x
5x
6x
7x
8x
9x
10x
Jan-20 Apr-20 Jul-20 Oct-20 Jan-21 Apr-21
Average 12-Month Forward Price to Sales (China Internet)

GLOBAL ASSET ALLOCATION VIEWS
24 Multi-Asset Solutions
markets to own. Finally, we note that while the UK vaccine rollout
is going very well, this is less relevant to the FTSE 100, which
earns a large majority of its revenue abroad.
CREDIT
Reducing overweights
Since our March Strategy Summit, trimming credit overweights
has been a consistent trend across our multi-asset portfolios.
Spreads tightened considerably and since April have steadied.
These last few months marked a transition from the early to the
middle phase of the economic and market cycle, in our view.
Early in a new cycle, credit returns receive a strong boost from
spread normalization and capital appreciation makes an outsize
contribution. This was the story for most of the last year.
In mid-cycle, spread compression is largely complete and
modest returns are driven by carry and roll yield
EXHIBIT 26: U.S. HIGH YIELD AVERAGE MONTHLY EXCESS RETURN, %
Source: Bloomberg, Barclays, J.P.Morgan Asset Management Multi-Asset Solutions, based on monthly returns since August 1988 and phases of the Multi-Asset Solutions Business Cycle Index (BCI); data as of 29 June 2021.
But as the cycle progresses to the middle phase and downside
risks are largely priced out, the spread compression tailwind
fades and returns are largely driven by carry and roll-down
(Exhibit 26). Historically, in the remaining course of the cycle
spreads tend to grind tighter, generally tracking equity implied
1 By contrast, the Fed’s unwinding its Secondary Market Corporate Credit
Facility (SMCCF) is not a significant risk. This facility mattered more for its signaling that the Fed was a buyer of last resort than in actual Fed
purchases, which never amounted to significant quantities. Moreover, the SMCCF focused not on high yield but rather on investment grade
bonds, where we are neutrally positioned.
volatility. But the path there has tended to be slow and bumpy.
Since we do not expect the strong performance of the first half of
2021 to continue, we have taken some profits on early-cycle
compression trades, reapportioning some of that exposure to
assets with more cyclical upside, like equities.
However, we do retain some modest credit overweights, in
particular for corporate high yield, for two reasons. First, while
we see little chance of a significant upside to returns, downside
risks also seem limited. On a risk-adjusted, duration-hedged
basis, credit tends to underperform equities only on significant
fears of an economic downturn that threatens corporate
solvency, which seems very unlikely. Without such an adverse
event, low volatility should turn modest carry into attractive
Sharpe ratios.
Second, as the last couple weeks’ market volatility illustrates,
credit risks are slightly different from the risks to other asset
classes and thus offer diversification benefits. A less
accommodative Fed, for instance, reduces the very modest odds
of an eventually disorderly Fed tightening,0F
1 at the cost of
removing odds on right-tail exceptional growth. While equities
sold off modestly on the Fed’s marginally hawkish turn in June,
credit spreads were virtually unaffected.
U.S. high yield
On a duration-hedged basis, U.S. high yield remains a preferred
expression of credit overweights.
Valuations are no longer compelling, but also not as tight as
simple historical comparisons would suggest, given the
significant improvement in index quality in recent years. For the
first time, BBs account for the majority of the index, and the
CCCs’ share is around all-time lows. That means that if,
hypothetically, option-adjusted spreads (OAS) in each quality
segment were to reach their respective individual historical
tights, then OAS on the overall index would reach new historical
-0.1
0.0
0.1
0.2
0.3
0.4
0.5
0.6
Early Mid Late Recession
Phase of business cycle

GLOBAL ASSET ALLOCATION VIEWS
25 Multi-Asset Solutions
tights, some 50bps tighter than today.1F
2 The full extent of this
supposed upside is most likely years away, although significant
economic rebound coupled with an orderly Fed tightening could
deliver significant progress over the intermediate term.
We grant that tight spreads give little leeway for defaults, but
downside risks seem quite limited as well. Recent default rates
and intermediate-term default expectations are both
extraordinarily low, fundamentals are solid, and a strong ratings
upgrade cycle is now underway.
Some market participants worry about rising leverage ratios, but
we think these concerns can be easily exaggerated. For the
universe of high yield issuers, leverage ratios have increased by
much less than for the broader nonfinancial corporate economy.
The quality of this issuance has not declined, risky lending
practices have not increased, and proceeds have been mostly
used for refinancing – in sharp contrast to the late 1990s or the
years preceding the global financial crisis. Rising debt levels have
been concentrated in pandemic-affected sectors that are now on
the cusp of a strong rebound. In most other sectors, debt levels
have actually fallen. Finally, leverage seems likely to decline
sharply toward or below 4x EBITDA – driven both passively, as
earnings continue rebounding, and actively (for example, recent
and proposed changes in U.S. tax policy reduce the deductibility
of interest payments).
Some external shock, not leverage, likely poses the bigger risk to
U.S. high yield. Moderate downside could come from a rapid
tightening of monetary policy, arguably a leading contributor to
historical episodes of significant spread widening. Tax hikes could
also have a modest impact. But following the Fed’s more cautious
pivot on inflation risks, as well as progress on a U.S.
infrastructure package that does not depend on tax hikes, these
risks have abated. A more negative but more unlikely far-left-tail
risk could involve threats from emerging COVID-19 variants.
Within U.S. high yield, we still prefer BB rated bonds, especially
likely “crossover” opportunities poised for moderate spread
compression on upgrade to BBB rated investment grade. On the
other end of the spectrum, we would avoid lower quality CCCs,
where spread performance tends to slow down more
2 For the Barclays US Corporate High Yield Index.
dramatically in the transition to mid cycle and where recent
spread compression has arguably gone too far, given debt levels
in this segment.
U.S. leveraged loans
Since January, credit flows have been dominated by U.S. bank
loans, as investors avoid duration exposure on fear of rising
interest rates. Even after hedgingn duration, we now find U.S.
loans attractive relative to high yield bonds
EXHIBIT 27: CREDIT FLOWS INTO MUTUAL FUNDS AND ETFS, % AUM, 4WMA
Source: EPFR, J.P.Morgan Asset Management Multi-Asset Solutions; data as of 28 June 2021.
As less compelling valuations lead us to reduce exposure to U.S.
high yield bonds, we have redoubled efforts to find suitable
alternatives. One outlet is U.S. leveraged loans. On a fundamental
basis, loans now look roughly as strong, and as expensive, as U.S.
HY. But as investors have focused on the prospects for rising
yields, aversion to longer-duration securities has caused floating
rate loans to attract significant demand since January (Exhibit
27). As a result, issuance has notably picked up.
On a duration-hedged basis, though, the more compelling
argument for loans is not underlying rate changes per se but
rather economic and rate volatility, with loans tending to
outperform in periods of high volatility. In early 2020, spreads
widened significantly more for bonds than loans; subsequently,
bonds on a duration-hedged basis outperformed loans as their
spreads compressed more quickly. But as the spread
compression trade has stalled, relative valuations now slightly
-4
-3
-2
-1
0
1
2
3
Jan-20 May-20 Sep-20 Jan-21 May-21
EMD hard EMD local US HYUS bank loans European HY

GLOBAL ASSET ALLOCATION VIEWS
26 Multi-Asset Solutions
favor loans. The intermediate-term risk of rising rate volatility as
the Fed removes accommodation appears the greater threat to
bonds.
European high yield
European high yield bonds look roughly as attractive as their U.S.
counterparts, with only slightly different risk exposures. Broadly
speaking, most of the considerations we’ve highlighted for the
U.S. also apply to Europe. The biggest difference at the index
level: European high yield skews even higher quality, which of
course means narrower index spreads. For all quality segments
besides CCCs, U.S. HY provides marginally more spread vs.
European high yield. All of these relative valuations are arguably
justified – for CCCs, given relatively weaker U.S. fundamentals,
and for other quality ratings, given the more active presence of
the ECB in credit markets, as well as a reduced risk of sharp
policy tightening.
Corporate investment grade
In contrast to high yield, we see very little value in corporate
investment grade.
For U.S. corporate IG, after adjusting for compositional changes,
current index spreads are arguably even tighter than they have
been in prior periods. Over the last year, the index’s average
rating has declined – its most notable compositional change.
Given that the weighted average costs of capital (WACC) for BBB
rated and AA or A rated companies are quite similar, investment
grade companies’ management have little incentive to pursue or
maintain higher ratings.
European corporate IG looks not quite as unattractive but still
offers little value.
Emerging markets debt
Downgrading emerging markets sovereign debt (EMD sovereign)
from overweight to neutral is one of relatively few changes we
made at this Strategy Summit. The asset class will offer
opportunity in the future, we believe, but in the near term it
presents too much downside risk to justify an overweight
position.
High yield EMD sovereigns, in particular, still provide potential for
cyclical recovery and early-cycle-like capital appreciation.
Notwithstanding a lower quality and distressed skew among them
compared with U.S. or European corporates, like-for-like quality
buckets do consistently offer greater average spreads.
The issue is timing: Broad capital appreciation of EMD sovereigns
does not seem imminent. For many issuers, the COVID-19
recession reduced revenues and increased expenditures,
expanding debt levels and reducing foreign currency reserves
relative to required external funding. Judging from the current
balance of ratings outlooks, the wave of net downgrades has yet
to conclude. Emerging market recoveries generally lag those of
developed markets, in large part due to relatively sluggish
vaccination rollouts. Funding stresses might be compounded by
the removal of Fed accommodation. A significant rise in U.S.
yields could also prompt investors to sell the EM asset class
relative to U.S. and European corporate high yield, given the
significantly longer average duration of EMD sovereigns.
Emerging market U.S. dollar corporate debt remains relatively
attractive, however. Fundamentals are robust, and issuers are
not exposed to the same degree of risks as sovereigns.
COMMODITIES
Oil prices moved higher over the second quarter, reflecting a
recovering demand environment and curtailed supply. Brent oil
broke through the USD 75/bbl level, and other parts of the
energy complex have performed equally well, with notable
strength in gas and coal markets.
The post-COVID-19 demand recovery continues to animate
energy markets. Oil-intensive activity has partially rebounded
from a period of severe weakness following the coronavirus
outbreak. Mobility measures are picking up, with increased miles
traveled in cars and the number of observed airline flights
approaching 2019 levels. Looking ahead, dents to oil demand
might stem from the spread of the delta variant in Europe or
from slower growth in China. But for now these remain
manageable risks.
The supply environment has also supported oil prices. OPEC+,
signaling concern and uncertainty about the pace of the demand
recovery, has been increasing oil production at a relatively slow
pace. At the same time, the U.S. shale sector has demonstrated a
muted supply response to higher prices (Exhibit 28). This
response in turn makes it easier for OPEC+ to hold firm to its
supply curtailments, because the group is not losing significant
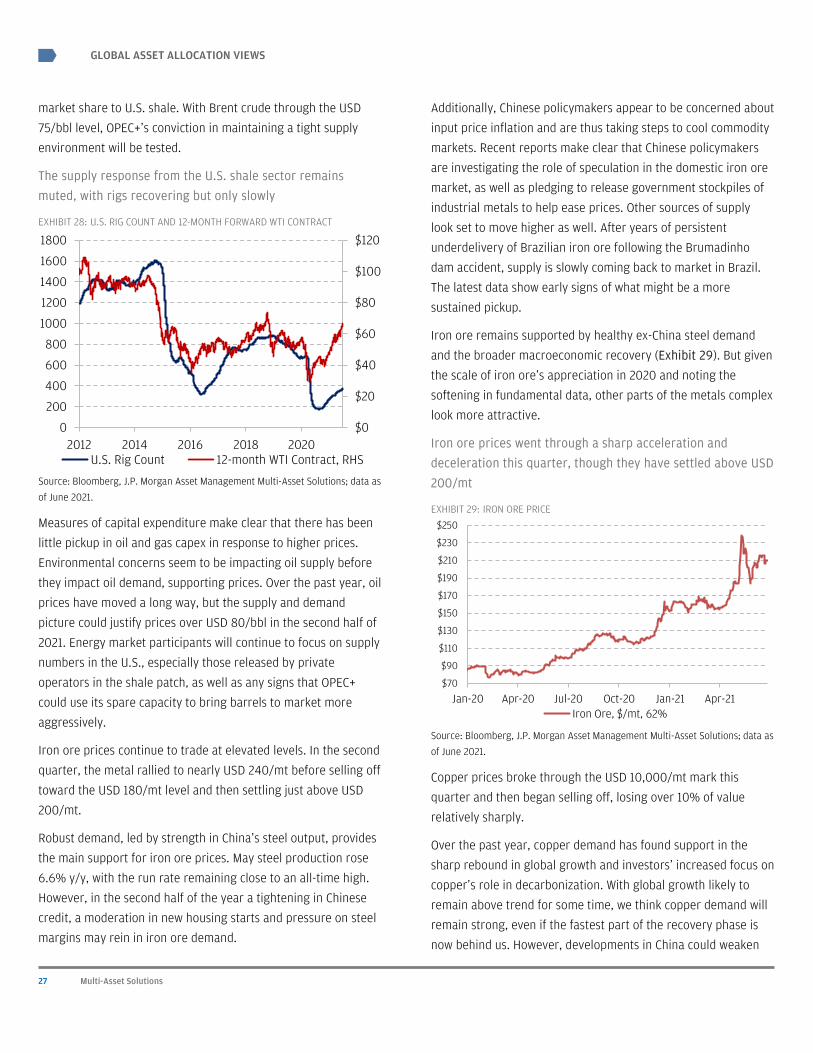
GLOBAL ASSET ALLOCATION VIEWS
27 Multi-Asset Solutions
market share to U.S. shale. With Brent crude through the USD
75/bbl level, OPEC+’s conviction in maintaining a tight supply
environment will be tested.
The supply response from the U.S. shale sector remains
muted, with rigs recovering but only slowly
EXHIBIT 28: U.S. RIG COUNT AND 12-MONTH FORWARD WTI CONTRACT
Source: Bloomberg, J.P. Morgan Asset Management Multi-Asset Solutions; data as of June 2021.
Measures of capital expenditure make clear that there has been
little pickup in oil and gas capex in response to higher prices.
Environmental concerns seem to be impacting oil supply before
they impact oil demand, supporting prices. Over the past year, oil
prices have moved a long way, but the supply and demand
picture could justify prices over USD 80/bbl in the second half of
2021. Energy market participants will continue to focus on supply
numbers in the U.S., especially those released by private
operators in the shale patch, as well as any signs that OPEC+
could use its spare capacity to bring barrels to market more
aggressively.
Iron ore prices continue to trade at elevated levels. In the second
quarter, the metal rallied to nearly USD 240/mt before selling off
toward the USD 180/mt level and then settling just above USD
200/mt.
Robust demand, led by strength in China’s steel output, provides
the main support for iron ore prices. May steel production rose
6.6% y/y, with the run rate remaining close to an all-time high.
However, in the second half of the year a tightening in Chinese
credit, a moderation in new housing starts and pressure on steel
margins may rein in iron ore demand.
Additionally, Chinese policymakers appear to be concerned about
input price inflation and are thus taking steps to cool commodity
markets. Recent reports make clear that Chinese policymakers
are investigating the role of speculation in the domestic iron ore
market, as well as pledging to release government stockpiles of
industrial metals to help ease prices. Other sources of supply
look set to move higher as well. After years of persistent
underdelivery of Brazilian iron ore following the Brumadinho
dam accident, supply is slowly coming back to market in Brazil.
The latest data show early signs of what might be a more
sustained pickup.
Iron ore remains supported by healthy ex-China steel demand
and the broader macroeconomic recovery (Exhibit 29). But given
the scale of iron ore’s appreciation in 2020 and noting the
softening in fundamental data, other parts of the metals complex
look more attractive.
Iron ore prices went through a sharp acceleration and
deceleration this quarter, though they have settled above USD
200/mt
EXHIBIT 29: IRON ORE PRICE
Source: Bloomberg, J.P. Morgan Asset Management Multi-Asset Solutions; data as of June 2021.
Copper prices broke through the USD 10,000/mt mark this
quarter and then began selling off, losing over 10% of value
relatively sharply.
Over the past year, copper demand has found support in the
sharp rebound in global growth and investors’ increased focus on
copper’s role in decarbonization. With global growth likely to
remain above trend for some time, we think copper demand will
remain strong, even if the fastest part of the recovery phase is
now behind us. However, developments in China could weaken
$0
$20
$40
$60
$80
$100
$120
0
200
400
600
800
1000
1200
1400
1600
1800
2012 2014 2016 2018 2020U.S. Rig Count 12-month WTI Contract, RHS
$70
$90
$110
$130
$150
$170
$190
$210
$230
$250
Jan-20 Apr-20 Jul-20 Oct-20 Jan-21 Apr-21Iron Ore, $/mt, 62%

GLOBAL ASSET ALLOCATION VIEWS
28 Multi-Asset Solutions
demand. Authorities have announced plans to enact state
inventory sales, and the important State Grid has deferred orders
for copper. On the production side, companies have maintained
their supply guidance for the year, suggesting a moderate pickup
in supply. Still, disruption risks persist, given labor negotiations
at several Latin American and Asian mines, and from proposed
increases to copper royalties impacting Chilean and Peruvian
investment plans.
Turning to monetary policy considerations, the hawkish shift at
the Federal Reserve has had a further negative impact on
investor sentiment; it seems unlikely that the strong tailwinds
that have supported the copper market over the past year can be
repeated. Interestingly, managed money positioning in copper
has been coming off recently, suggesting a further cooling in
sentiment (Exhibit 30).
Managed money positioning in copper has been moderating,
suggesting some cooling of investor sentiment
EXHIBIT 30: COPPER POSITIONING
Source: Bloomberg, J.P. Morgan Asset Management Multi-Asset Solutions; data as of June 2021.
-160
-120
-80
-40
0
40
80
120
160
200
2016 2017 2018 2019 2020 2021
Long Short NetCOMEX Managed Money, Number of Contracts

GLOBAL ASSET ALLOCATION VIEWS
29 Multi-Asset Solutions
PORTFOLIO IMPLICATIONS
In the second half of 2021, we anticipate continued above-trend
global growth together with ample policy support and a
moderation in the recent surge in inflation. We expect the period
of above-trend growth to extend into 2022 and to support strong
earnings growth this year and next. While we acknowledge that
central bank accommodation is now past its maximum point, we
believe that the absolute level of rates and accommodation
remain extremely supportive. Persistent inflation poses a risk,
but in our view the impact of base effects, supply-chain
disruption and surging commodities prices will diminish over the
coming months, in turn moderating inflation.
Our constructive economic view translates to a risk-on tilt in our
multi-asset portfolios, with overweights to stocks and credit and
underweights to duration and cash. As economies begin to move
toward mid cycle – driven by the U.S. – patterns of volatility and
correlation will be important in determining both where to
deploy risk and what absolute level of risk to take. In addition,
recognizing potential concentrations of risk, both across assets
and within specific asset classes, will be critical, given that a
number of macroeconomic trends are also manifesting
themselves at the sector, style and even individual security level.
In keeping with the improving macro outlook and ongoing policy
support mitigating extreme tail risks, volatility has steadily
declined over the first half of 2021. While volatility implied from
the options market – measured by the VIX and comparable
indices – has not fallen as quickly as realized volatility observed
from actual index prices, the trajectory of volatility is aligned to
the economic backdrop. Falling headline volatility can
mechanically increase the required notional position size to
achieve a given level of risk allocation but at the same time may
not capture the risk of intra-index volatility.
Prevailing levels of correlation across asset classes (Exhibit 31),
and notably between stocks and bonds, are still somewhat
elevated. However, the level of realized correlation within indices
is depressed. This reflects an environment where macro issues
are manifesting themselves similarly at an asset class level, with
abundant liquidity driving asset prices all in a similar direction. At
the same time, the shift in fiscal policy stance, more two-sided
inflation risk and the sharp rebound in cyclical sectors have
combined to drive a lot of rotation within indices. Elevated asset-
level correlations present a challenge in creating a diversified
portfolio, while low correlations within indices point to a more
favorable environment for active security selection alpha.
On a cross-asset basis, correlation across returns is trending
above its historic average
EXHIBIT 31: 360-DAY CROSS-ASSET CORRELATION
Source: Bloomberg, J.P. Morgan Asset Management Multi-Asset Solutions; data as of June 2021.
The ability to capture greater alpha from manager and security
selection is welcome for portfolio allocators, but it doesn’t arise
without some challenges and considerations. Since
macroeconomic drivers behind both the asset class-level outlook
and the rotation within indices are similar, whenever these
drivers are questioned correlations can quickly, if temporarily,
jump sharply. This can lead to periods where apparently well-
diversified risks can rapidly become concentrated. In our view,
the unstable correlations that appear to exist currently between
higher rates, value rotation, cyclical sectors and overall equity
market performance argue for some moderation, at the margin,
of overall risk levels. We recognize, too, that the risks within a
diversified portfolio may not be entirely captured by asset class-
level volatility, and that the low prevailing intra-index correlation
does not, in isolation, necessarily mitigate overall portfolio risks.
Another important consideration is the ongoing assessment of
factor tilts across the portfolio. This year, much has been made of
the rotation away from the growth style toward the value style.
This trend could continue, but as the economic environment
moves more fully into a mid-cycle phase, we believe that quality
0%
5%
10%
15%
20%
25%
30%
35%
2001 2006 2011 2016 2021Average Cross-Asset Return CorrelationAverage, +/- 1SD

GLOBAL ASSET ALLOCATION VIEWS
30 Multi-Asset Solutions
will increasingly be a sought-after style again. Certainly, both the
value and quality factors remain attractive when compared with
growth, but as investors home in more on earnings, we believe
that those assets with higher quality earnings together with a
value bias will come into sharper focus. While the outlook for
value-style assets is more favorable now than in the last decade,
we note that episodes of factor volatility can be quite violent and
may temporarily lead to further concentration of overall portfolio
risks.
Ultimately, we continue to prefer to deploy risk through a
diversified overweight in equities above all. We do maintain a tilt
toward cyclicality and value, but at the margin increasingly look
to build in a modest tilt to quality. In what is now a favorable
environment for security selection alpha, we do see good
potential for end manager alpha. Equally, though, we’re attentive
to where the current environment might build in concentrations
of risk – transient or otherwise. Above all, with the economy
progressing into mid cycle, we also believe that simply increasing
position size to compensate for falling volatility is not a prudent
move. Instead, we look to express our constructive economic
view in a more nuanced manner now that the rapid and
widespread asset gains of early cycle are behind us, and as we
expect a positive but more pedestrian pattern of returns from
here.

GLOBAL ASSET ALLOCATION VIEWS
• Global growth above trend; U.S. now mid cycle; other developed markets in early cycle
• Inflation elevated for now, but set to return toward target in 2022
• Fiscal and monetary policy accommodative, but past maximum
• UW to duration, especially in U.S., as yields set to steadily rise in 2H21
• Dollar supported near-term by rates, but long-run trend still lower
• Strong EPS upside supports stocks, easing valuations in U.S.
• Stay OW equities with modest cyclical, value and ex-U.S. bias
• Renewed focus on secular growth themes
• Key risks: persistent inflation, new virus strains, policy tightening
Active allocation viewsThese asset class views apply to a 12- to 18-month horizon. Up/down arrows indicate a positive ( ) or negative ( ) change in view since the prior quarterly Strategy Summit. These views should not be construed as a recommended portfolio. This summary of our individual asset class views indicates strength of conviction and relative preferences across a broad-based range of assets but is independent of portfolio construction considerations.
Multi-Asset Solutions Key Insights & “Big Ideas”The Key Insights and “Big Ideas” are discussed in depth at our Strategy Summit and collectively reflect the core views of the portfolio managers and research teams within Multi-Asset Solutions. They represent the common perspectives we come back to and regularly retest in all our asset allocation discussions. We use these “Big Ideas” as a way of sense-checking our portfolio tilts and ensuring they are reflected in all of our portfolios.
Source: J.P. Morgan Asset Management Multi-Asset Solutions; assessments are made using data and information up to June 2021. For illustrative purposes only.
Diversification does not guarantee investment returns and does not eliminate the risk of loss. Diversification among investment options and asset classes may help to reduce overall volatility.
Underweight Neutral Overweight
Asset class Opportunity set UW N OW Change Conviction
MAIN ASSET
CLASSES
Equities High Further upside to top lines and earnings ahead given above-trend global growth backdrop
Duration Low Solid growth means yields set to grind upward despite duration demand from global central banks
Credit Low Limited scope for further spread compression, but carry still attractive in some parts of credit complex
Cash Moderate Higher prevailing inflation and easy policy mean profoundly negative cash rates in many currencies
PR
EFER
ENCE
BY
ASS
ET C
LASS
EQU
ITIE
S
U.S. Moderate Cyclical sectors well supported and earnings quality high; secular themes beginning to reassert
Europe Moderate Meaningful upside potential for earnings as economy reopens, and attractive exposure to cyclicality
UK Becoming more attractive, but political risks linked to post-Brexit trade issues cast a shadow
Japan Moderate Domestic economic outlook improving, underheld by investors and geared to global recovery
Emerging markets Likely held back by high growth style exposure and limited near-term further dollar downside
FIX
ED I
NCO
ME
U.S. Treasuries Low Risk of taper tantrum reduced, but strong growth and more hawkish Fed tone argue for higher yields
G4 ex-U.S. sovereigns Ex-U.S. inflation pressure lower, and central banks more vocally committed to lower yields
EMD hard currency EM economic outlook better, but long duration presents some headwind to returns
EMD local FX Supported by global recovery and yields are attractive, but rates starting to rise in some EM countries
Corporate investment grade Tight spreads but ongoing demand, especially in longer maturities, likely from portfolio de-risking flow
Corporate high yield Low Defaults remain subdued, but generally less attractive in most sectors, as spreads quite tight
CUR
REN
CY
USD Overvalued with poor fundamentals, but for time being the more hawkish Fed tone is supportive
EUR Low A further leg higher plausible as Europe starts to catch up to the global recovery in mid-2021
JPY Moderate BoJ’s ongoing commitment to easy policy could lead to some weakness as safe haven demand fades
EM FX Low Preferred way to play continuing global growth support of EM economies
31 Multi-Asset Solutions

GLOBAL ASSET ALLOCATION VIEWS
32 Multi-Asset Solutions
Global Multi-Asset Strategy:
John Bilton
Head of Global Multi-Asset Strategy
Multi-Asset Solutions
Michael Hood
Global Strategist
Multi-Asset Solutions
Thushka Maharaj
Global Strategist
Multi-Asset Solutions
Patrik Schöwitz
Global Strategist
Multi-Asset Solutions
Michael Albrecht
Global Strategist
Multi-Asset Solutions
Sylvia Sheng
Global Strategist
Multi-Asset Solutions
Tim Lintern
Global Strategist
Multi-Asset Solutions
Michael Akinyele
Global Strategist
Multi-Asset Solutions

FOR INSTITUTIONAL/WHOLESALE/PROFESSIONAL CLIENTS AND QUALIFIED INVESTORS ONLY NOT FOR RETAIL USE OR DISTRIBUTION
PORTFOLIO INSIGHTS
NOT FOR RETAIL DISTRIBUTION: This communication has been prepared exclusively for institutional, wholesale, professional clients and qualified investors only, as defined by local
laws and regulations.
For the purposes of MiFID 11. the JPM Market Insights and Portfolio Insights programs are marketing communications and are not in scope for any MiFID 11 / MiFIR requirements specifically related to investment research. Furthermore. the J.P. Morgan Asset Management Market Insights and Portfolio Insights programs. as non-independent research. have not been prepared in accordance with legal requirements designed to promote the independence of investment research. nor are they subject to any prohibition on dealing ahead of the dissemination of investment research. This document is a general communication being provided for informational purposes only. It is educational in nature and not designed to be taken as advice or a recommendation for any specific investment product, strategy, plan feature or other purpose in any jurisdiction, nor is it a commitment from J.P. Morgan Asset Management or any of its subsidiaries to participate in any of the transactions mentioned herein. Any examples used are generic, hypothetical and for illustration purposes only. This material does not contain sufficient information to support an investment decision and it should not be relied upon by you in evaluating the merits of investing in any securities or products. In addition, users should make an independent assessment of the legal, regulatory, tax, credit. and accounting implications and determine, together with their own financial professional. if any investment mentioned herein is believed to be appropriate to their personal goals. Investors should ensure that they obtain all available relevant information before making any investment. Any forecasts. figures, opinions or investment techniques and strategies set out are for information purposes only, based on certain assumptions and current market conditions and are subject to change without prior notice. All information presented herein is considered to be accurate at the time of production, but no warranty of accuracy is given and no liability in respect of any error or omission is accepted. It should be noted that investment involves risks. the value of investments and the income from them may fluctuate in accordance with market conditions and taxation agreements and investors may not get back the full amount invested. Both past performance and yields are not reliable indicators of current and future results. J.P. Morgan Asset Management is the brand for the asset management business of JPMorgan Chase & Co. and its affiliates worldwide.
To the extent permitted by applicable law, we may record telephone calls and monitor electronic communications to comply with our legal and regulatory obligations and internal policies. Personal data will be collected, stored and processed by J.P. Morgan Asset Management in accordance with our privacy policies at https://am.jpmorgan.com/global/privacy.
This communication is issued by the following entities: In the United States, by J.P. Morgan Investment Management Inc. or J.P. Morgan Alternative Asset Management, Inc., both regulated by the Securities and Exchange Commission; in Latin America, for intended recipients' use only, by local J.P. Morgan entities, as the case may be.; in Canada. for institutional clients' use only, by JPMorgan Asset Management (Canada) Inc., which is a registered Portfolio Manager and Exempt Market Dealer in all Canadian provinces and territories except the Yukon and is also registered as an Investment Fund Manager in British Columbia. Ontario, Quebec and Newfoundland and Labrador. In the United Kingdom, by JPMorgan Asset Management (UK) Limited. which is authorized and regulated by the Financial Conduct Authority; in other European jurisdictions, by JPMorgan Asset Management (Europe) S.a r.l. In Asia Pacific ("APAC"), by the following issuing entities and in the respective jurisdictions in which they are primarily regulated: JPMorgan Asset Management (Asia Pacific) Limited. or JPMorgan Funds (Asia) Limited, or JPMorgan Asset Management Real Assets (Asia) Limited, each of which is regulated by the Securities and Futures Commission of Hong Kong; JPMorgan Asset Management (Singapore) Limited (Co. Reg. No. 197601586K), which this advertisement or publication has not been reviewed by the Monetary Authority of Singapore; JPMorgan Asset Management (Taiwan) Limited; JPMorgan Asset Management (Japan) Limited, which is a member of the Investment Trusts Association. Japan, the Japan Investment Advisers Association, Type 11 Financial Instruments Firms Association and the Japan Securities Dealers Association and is regulated by the Financial Services Agency (registration number "Kanta Local Finance Bureau (Financial Instruments Firm) No. 330"); in Australia, to wholesale clients only as defined in section 761A and 761G of the Corporations Act 2001 (Commonwealth). by JPMorgan Asset Management (Australia) Limited (ABN 55143832080) (AFSL 376919). For all other markets in APAC. to intended recipients only.
For U.S. only: If you are a person with a disability and need additional support in viewing the material, please call us at l-800-343-lll3 for assistance.
Copyright 2021 JPMorgan Chase & Co. All rights reserved.
EXTENDED_PI-AA-VIEWS_3Q21 I 0903c02a8lcf0b62
J.P.Morgan Asset Management