key financial management officials financial management officials yvette s. jackson deputy...
TRANSCRIPT

Principal Financial Statements and Notes 35
Key Financial Management Officials
Yvette S. Jackson
Deputy Commissioner for Finance, Assessmentand Management
Key official responsible for Budget, Finance,Procurement and Quality Assurance
Dale W. Sopper
Assistant Deputy Commissioner forFinance, Assessment and Management
Thomas G. Staples
Associate Commissioner forFinancial Policy and Operations

Consolidated Balance Sheet as of September 30, 2000 and September 30, 1999
Assets 2000 1999
Intragovernmental:
Fund Balance with Treasury (Note 2) $ 90 $ 1,035Investments (Note 4) 1,007,226 854,892Interest Receivable, Net (Note 5) 16,382 14,029Accounts Receivable, Net (Notes 5 and 6) 501 286Other 0 0
Total Intragovernmental 1,024,199 870,242
Accounts Receivable, Net (Notes 5 and 6) 4,696 4,271Property, Plant and Equipment, Net (Note 7) 341 340Other 0 4
Total Assets 1,029,236 874,857
Liabilities (Note 8)
Intragovernmental:
Accrued Railroad Retirement Interchange 3,096 3,587Accounts Payable 1,906 1,957Other 385 457
Total Intragovernmental 5,387 6,001
Benefits Due and Payable 39,646 37,106Accounts Payable 231 285Other 840 738
Total 46,104 44,130
Net Position (Note 9)
Unexpended Appropriations 395 380Cumulative Results of Operations 982,737 830,347Total Net Position 983,132 830,727
Total Liabilities and Net Position $ 1,029,236 $ 874,857 The accompanying notes are an integral part of these financial statements.
(Dollars in Millions)
36 SSA’s FY 2000 Performance and Accountability Report
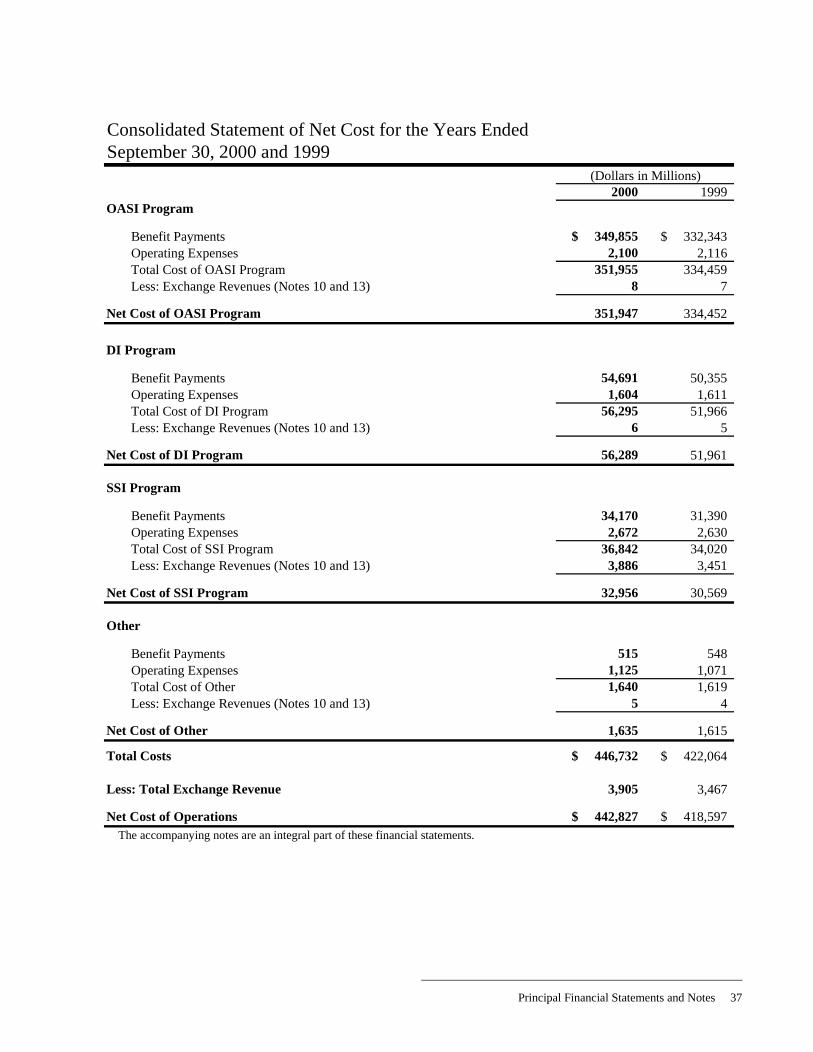
Consolidated Statement of Net Cost for the Years EndedSeptember 30, 2000 and 1999
2000 1999OASI Program
Benefit Payments $ 349,855 $ 332,343Operating Expenses 2,100 2,116Total Cost of OASI Program 351,955 334,459Less: Exchange Revenues (Notes 10 and 13) 8 7
Net Cost of OASI Program 351,947 334,452
DI Program
Benefit Payments 54,691 50,355Operating Expenses 1,604 1,611Total Cost of DI Program 56,295 51,966Less: Exchange Revenues (Notes 10 and 13) 6 5
Net Cost of DI Program 56,289 51,961
SSI Program
Benefit Payments 34,170 31,390Operating Expenses 2,672 2,630Total Cost of SSI Program 36,842 34,020Less: Exchange Revenues (Notes 10 and 13) 3,886 3,451
Net Cost of SSI Program 32,956 30,569
Other
Benefit Payments 515 548Operating Expenses 1,125 1,071Total Cost of Other 1,640 1,619Less: Exchange Revenues (Notes 10 and 13) 5 4
Net Cost of Other 1,635 1,615
Total Costs $ 446,732 $ 422,064
Less: Total Exchange Revenue 3,905 3,467
Net Cost of Operations $ 442,827 $ 418,597 The accompanying notes are an integral part of these financial statements.
(Dollars in Millions)
Principal Financial Statements and Notes 37

Consolidated Statement of Changes in Net Position for the Years Ended September 30, 2000 and 1999
2000 1999
Net Cost of Operations $ 442,827 $ 418,597
Financing Sources (other than Exchange Revenues)
Appropriations Used 33,454 30,885
Tax Revenues (Note 11) 501,707 462,657
Imputed Financing (Note 14) 291 288
Interest, Donations and Other Revenues 62,170 53,675
Transfers-In (Note 12)
Trust Fund Draws and Other 1,010 941
SSI Receivables Recovered 1,410 1,332
Transfers-Out (Note 12)
Trust Fund Draws and Other (59) 0
Railroad Retirement Interchange (3,207) (3,738)
SSI Receivables Transferred to Treasury (1,410) (1,332)
SSI Administrative Fees Transferred to Treasury (149) (147)
Total Financing Sources 595,217 544,561
Net Results of Operations 152,390 125,964
Increase (Decrease) in Unexpended Appropriations 15 64
Change in Net Position 152,405 126,028
Net Position, Beginning Balance 830,727 704,699
Net Position, Ending Balance $ 983,132 $ 830,727 The accompanying notes are an integral part of these financial statements.
(Dollars in Millions)
38 SSA’s FY 2000 Performance and Accountability Report

Consolidated Statement of Budgetary Resources for the Years EndedSeptember 30, 2000 and 1999
2000 1999Budgetary Resources Made Available (Note 15)
Budget Authority $ 597,909 $ 548,228
Unobligated Balances - Beginning of the Period 86 231
Spending Authority from Offsetting Collections 3,809 3,320
Temporarily Not Available and Adjustments (149,684) (124,516)
Total Budgetary Resources Made Available 452,120 427,263
Status of Budgetary Resources (Note 15)
Obligations Incurred 451,779 426,916
Unobligated Balances - Available 319 307
Unobligated Balances - Not Available 22 40
Total Status of Budgetary Resources 452,120 427,263
Outlays
Obligations Incurred 451,779 426,916
Less: Spending Authority (3,803) (3,333)
Obligated Balances - Beginning of the Period 40,699 40,756
Less: Obligated Balance - End of the Period (42,610) (40,699)
Total Outlays $ 446,065 $ 423,640 The accompanying notes are an integral part of these financial statements.
(Dollars in Millions)
Principal Financial Statements and Notes 39

Consolidated Statement of Financing for the Years EndedSeptember 30, 2000 and 1999
Obligations and Non-Budgetary Resources
Obligations Incurred $ 451,779 $ 426,916Other Spending Authority (3,803) (3,333)Imputed Financing 291 288Transfers In (Out) (5,322) (5,391)Exchange Revenue (170) (298)
Total Obligations and Non-Budgetary Resources 442,775 418,182
Resources Not Funding Net Cost of Operations
Change in Undelivered Orders (49) (44)Capitalized Costs (1) 62Financing Sources that Fund Costs of Prior Periods (100) (9)
Total Resources Not Funding Net Cost of Operations (150) 9
Costs Not Requiring Resources
Depreciation and Amortization 99 170Other (60) (36)
Total Costs Not Requiring Resources 39 134
Financing Sources Yet to Be Provided 163 272
Net Cost of Operations $ 442,827 $ 418,597 The accompanying notes are an integral part of these financial statements.
2000 1999(Dollars in Millions)
40 SSA’s FY 2000 Performance and Accountability Report

Reporting Entity
The Social Security Administration (SSA), as anindependent agency of the United States Government, isresponsible for administering the Nation’s Old-Age andSurvivors, and Disability Insurance programs (OASDI),the Supplemental Security Income (SSI) program andPart B of the Black Lung (BL) program. SSA isconsidered a separate reporting entity for financialreporting purposes, and its financial statements have beenprepared to report the financial position, net cost, changesin net position, budgetary resources, and reconciliation ofnet cost to budgetary resources as required by the ChiefFinancial Officers Act of 1990.
The financial statements have been prepared from theaccounting records of SSA in conformity with generallyaccepted accounting principles (GAAP) and the form andcontent for entity financial statements specified by theOffice of Management and Budget (OMB) in OMBBulletin 97-01 and technical amendments. GAAP forFederal entities are the standards prescribed by the FederalAccounting Standards Advisory Board (FASAB). Thesestatements are different from the financial reports, alsoprepared by SSA, pursuant to OMB directives that areused to monitor and control SSA’s use of budgetaryresources. The preparation of financial statements, inconformity with GAAP, requires management to makeestimates and assumptions that affect the reported amountsof assets and liabilities and disclosure of contingent assetsand liabilities at the dates of the financial statements andthe reported amounts of revenues and expenses during thereporting periods. Actual results could differ from thoseestimates.
The consolidated financial statements include the accountsof all funds under SSA control, consisting of two trustfunds, three general fund appropriations and five depositfunds. The trust funds are the Old-Age and Survivors
Insurance (OASI) Trust Fund and the Disability Insurance(DI) Trust Fund. SSA’s statements also include OASI andDI investment activities performed by Treasury. SSA’sfinancial activity has been classified and reported by thefollowing program areas: OASI, DI, SSI, and Other.FY 2000 and 1999 BL Part B benefit payments were $515and $548 million, respectively. Since the financial activityfor BL Part B has become immaterial overall to theconsolidated financial statements, they are no longerpresented as a major program on any financial statements.Instead, BL financial activity has been combined withOther.
Administrative Expenses
SSA initially charges administrative expenses to theLimitation on Administrative Expenses (LAE)appropriation. Section 201 (g) of the Social Security Actrequires the Commissioner of Social Security to determinethe proper share of costs incurred during the fiscal year tobe charged to the appropriate trust or general fund.Accordingly, administrative expenses are subsequentlydistributed during each month to the appropriate trust fundand general funds accounts. All such distributions areinitially made on an estimated basis and adjusted to actualeach year, as provided for in Section 1534 of Title 31,United States Code.
Recognition of Financing Sources
Financing sources consist of funds transferred from theU.S. Treasury to the OASI and DI Trust Funds foremployment taxes (Federal Insurance Contributions Act(FICA) and Self Employment Contributions Act (SECA)),drawdown of funds for benefit entitlement payments andadministrative expenses, appropriations, gifts and othermiscellaneous receipts. On an as-needed basis, funds aredrawn from the OASI and DI Trust Funds to cover benefitpayments. Governed by limitations determined annuallyby the U.S. Congress, funds are also drawn from the OASIand DI Trust Funds for SSA’s operating expenses. Tocover SSA’s costs to administer the Medicare program,funds are drawn from the HI/SMI Trust Funds.
1 Summary of Significant Accounting Policies
SOCIAL SECURITY ADMINISTRATION
Notes to the Principal Financial Statements
Principal Financial Statements and Notes 41

Appropriations Used includes payments and accruals forthe SSI and BL programs and funding from Treasury’sGeneral Fund for the Office of the Inspector Generalappropriation.
Employment tax revenues are made available daily basedon a quarterly estimate of the amount of FICA taxespayable by employers and SECA taxes payable from theself-employed. Adjustments are made to the estimates foractual FICA taxes payable, actual SECA taxes paid andrefunds made. Employment tax credits (the differencebetween the combined employee and employer rate andthe self-employed rate), credits for military service,income taxation of Social Security benefits and interest ontrust fund unnegotiated benefit payment checks are alsoincluded in tax revenues (See Note 11, Tax Revenues).
Revenues from sales of goods and services to the publicinclude payments SSA receives from those Stateschoosing to have SSA administer their Statesupplementation of Federal SSI benefits.
Other financing sources consist primarily of reimbursableservices. Reimbursements are recognized as the servicesare performed (See Note 10, Exchange Revenues). Thesefinancing sources may be used to pay for current operatingexpenses as well as for capital expenditures such asproperty, plant and equipment as specified by law.
Capitalized expenditures are recognized in the Statementof Net Cost as they are consumed. In contrast, budgetreporting recognizes these same financing sources in theyear the obligation was established to purchase the asset.
Reclassifications
Certain FY 1999 balances have been reclassified toconform to FY 2000 financial statement presentations, theeffect of which is immaterial.
The fund balance with Treasury, shown on the BalanceSheet, represents the total of all of SSA’s undisbursedaccount balances with the Department of Treasury. Otherfund types consist of deposit funds and receipt accounts.
2 Fund Balance with Treasury
Categories of Funds2000
Deposit &Obligated Not ReceiptNot Paid Obligated Expended Accounts Total
OASI $ $ (309)$ $ (309)$ DI (62) (62)
SSI 271 53 16 340
Other:BL 43 7 50Misc. 71 71
Total 314$ 60$ (371)$ 87$ 90$
1999Deposit &
Obligated Not ReceiptNot Paid Obligated Expended Accounts Total
OASI $ $ 151$ $ 151$ DI (36) (36)
SSI 542 261 13 816
Other:BL 49 1 50Misc. 54 54
Total 591$ 262$ 115$ 67$ 1,035$
(In Millions)
(In Millions)
2000 1999Trust Funds
OASI $ (309) $ 151DI (62) (36)
Appropriated FundsSSI 340 816Other 121 104
Total $ 90 $ 1,035
(In Millions)
42 SSA’s FY 2000 Performance and Accountability Report

Transfers between the Trust Funds and Treasury aremanaged to favor the financial position of the Trust Funds.Therefore, investments held by the Trust Funds areliquidated only as needed by Treasury to cover benefitpayment checks. The negative fund balances reported forthe Trust Funds are the result of the policy to protect theTrust Fund investments by not liquidating the investmentsuntil the cash is needed. To maintain consistency withTreasury year-end reporting requirements, the Trust Fundbalances were not reclassified as liabilities on the BalanceSheet.
SSA’s financial activities interact with and are dependenton the financial activities of the centralized managementfunctions of the Federal Government that are undertakenfor the benefit of the whole Federal Government. Theseactivities include public debt, employee retirement, lifeinsurance and health benefit programs. Accordingly,SSA’s financial statements do not contain the results ofcentralized financial decisions and activities performed forthe benefit of the entire Government.
Financing for general fund appropriations reported on theConsolidated Statement of Changes in Net Position maybe from tax revenue, public borrowing, or both. Thesource of this funding, whether tax revenue or publicborrowing, has not been allocated to SSA.
The General Services Administration (GSA), usingmonies provided from the OASI and DI Trust Funds,administers the construction or purchase of buildings onSSA’s behalf. The acquisition costs of these buildingshave been charged to the OASI and DI Trust Funds,capitalized and included in these statements. SSA alsooccupies buildings that have been leased by GSA or havebeen constructed using Public Building Funds. Thesestatements reflect SSA’s payments to GSA for lease,operations maintenance and depreciation expensesassociated with these buildings.
SSA’s employees participate in the contributory CivilService Retirement System (CSRS) or the FederalEmployees’ Retirement System (FERS), to which SSAmakes matching contributions. Pursuant to Public Law99-335, FERS went into effect on January 1, 1987.Employees hired after December 31, 1983 areautomatically covered by FERS while employees hired
prior to that date could elect to either join FERS or remainin CSRS.
One of the primary differences between FERS and CSRSis that FERS offers a savings plan to which SSA isrequired to contribute 1 percent of pay and matchemployee contributions up to an additional 4 percent ofbasic pay. SSA contributions to CSRS were $156.6 and$158.4 million for FY 2000 and 1999, respectively. SSAcontributions to FERS were $123.1 and $108.5 million forFY 2000 and 1999, respectively. In addition, SSAcontributions to the FERS savings plan were $45.9 and$40.9 million for FY 2000 and 1999, respectively. Thesestatements do not reflect CSRS or FERS assets oraccumulated plan benefits applicable to SSA employeessince these data are only reported in total by the Office ofPersonnel Management.
Trust fund balances not required to meet currentexpenditures are invested on a daily basis in interest-bearing obligations of the U.S. Government. Trust fundbalances may be invested only in interest-bearingobligations of the United States or in obligationsguaranteed as to both principal and interest by the UnitedStates as provided by Section 201(d) of the Social SecurityAct. These investments consist of U.S. Treasury specialissues and bonds. Special issues are special public debtobligations for purchase exclusively by the trust funds andfor which interest is computed semi-annually (June andDecember). They are purchased and redeemed at facevalue, which is the same as their carrying value on theBalance Sheet. U.S. Treasury bonds are carried atamortized cost.
Treasury’s methodology uses an average market yield tocalculate interest rates for non-marketable Treasurysecurities, including the Social Security Trust Funds.Investments held for the trust funds mature at variousdates ranging from the present to the year 2015. Theinterest rates on these investments range from5 7/8 percent to 11 3/4 percent.
3 Centralized Federal Financing Activities
4 Investments
2000 1999Special Issue U.S. Treasury Securities $ 1,007,186 $ 854,848U.S. Treasury Bonds - Carrying value 40 44Total Investments $ 1,007,226 $ 854,892
(In Millions)
Principal Financial Statements and Notes 43

Interest Receivable
Intragovernmental receivables consist primarily ofaccrued interest receivable on investments. These were$16,382 and $14,029 million on trust fund investmentswith the U.S. Treasury for the period June 30 throughSeptember 30, 2000 and 1999, respectively.
Accounts Receivable
Intragovernmental
Intragovernmental accounts receivable consist primarilyof $255 million to be transferred to the OASI and DI trustfunds from the Department of Defense for military servicewage credits and $195 million of pending collections fromretroactive OASI and DI benefit payments for SSI benefitpayments paid for the same period (See Note 6, Non-Entity Assets). Intragovernmental accounts receivable forOther is also discussed in Note 6, Non-Entity Assets.
With the Public
Accounts receivable with the public consist mainly ofmonies due to SSA from individuals who received benefitsin excess of their entitlement under the OASI, DI, SSI andBL programs. The SSI State Supplementationoverpayment amount due from beneficiaries is presentedas SSI while the Federal portion of SSI overpayments ispresented as Other. The BL receivable is also presented asOther. See Note 6, Non-Entity Assets, for a discussion ofthe SSI Federal overpayments presented as Other.
The estimated allowance for doubtful accounts isdetermined using a 5-year average of write-offs divided byclearances comprised of write-offs, waivers andcollections. That percentage is then applied to outstandingreceivables.
SSA’s Non-Entity Assets consist of SSI benefitoverpayments classified as accounts receivable. TheFY 1991 Appropriations Act, Public Law 101-517,requires that collections from repayment of SSI benefitoverpayments be deposited in the General Fund of theTreasury. These funds, upon deposit, are assets of theGeneral Fund of the Treasury and shall not be used bySSA as an SSI budgetary resource to pay SSI benefit oradministrative costs. Accordingly, they are classified asnon-entity assets and also presented as Other.
The Intragovernmental Accounts Receivable portion ofSSA’s non-entity assets represents the offset of retroactiveOASI and DI benefits if a beneficiary received SSIpayments for the same period. Prior to July 1, 1981, abeneficiary eligible for SSI and OASI or DI, whose OASIand DI benefit payments were delayed and resulted inretroactive benefits, could receive full payment under bothprograms for the same months. To prevent this windfall,
5 Interest and Accounts Receivables
6 Non-Entity Assets
Accounts Receivable by Major Program:
2000(In Millions) Gross Allowance for Net
Rec. Doubtful Accts. Rec.
OASI $ 1,710 $ (109) $ 1,601DI 2,264 (944) 1,320SSI 501 (64) 437Other* 3,134 (1,295) 1,839
All Programs $ 7,609 $ (2,412) $ 5,197
Accounts Receivable net of intra-agency eliminations.*See Note 6, Non-Entity Assets
1999(In Millions) Gross Allowance for Net
Rec. Doubtful Accts. Rec.
OASI $ 1,457 $ (111) $ 1,346DI 1,886 (764) 1,122SSI 332 (84) 248Other* 2,851 (1,010) 1,841
All Programs $ 6,526 $ (1,969) $ 4,557
Accounts Receivable net of intra-agency eliminations.
*See Note 6, Non-Entity Assets
44 SSA’s FY 2000 Performance and Accountability Report

Public Law 96-265 (Disability Amendments of 1980)contained a provision that requires SSA to offsetretroactive OASI and DI benefits.
SSA’s property, plant and equipment are considered assetsof the OASI and DI Trust Funds. User charges areallocated to all programs based on each program’s use ofcapital assets during the period. All general fund activitiesreimburse the trust funds for their use of trust fund assetsthrough the calculation of user charge credits. SSAcapitalizes new property, plant and equipment costing over$100,000.
For FY 1999, the Balance Sheet contains a reclassificationof $48 million for multi-contract purchases of informationtechnology software and hardware. This capital asset wasmoved from Other Assets to Property, Plant andEquipment, Net.
7 Property, Plant and Equipment
2000 1999
Intragovernmental: Accounts Receivable - Other 195$ 260$ Total Intragovernmental 195 260Accounts Receivable - Other 1,640 1,578
Total 1,835$ 1,838$
(In Millions)
8 Liabilities
2000Accum. Book
Major Classes: Cost Deprec ValueLand 5$ -- 5$ Buildings 350 (155)$ 195Equipment (incl. ADP 264 (162) 102 Hardware and Software)Leasehold Improvements 111 (72) 39Total 730$ (389)$ 341$
1999Accum. Book
Major Classes: Cost Deprec ValueLand 5$ -- 5$ Buildings 345 (147)$ 198Equipment (incl. ADP 233 (137) 96 Hardware and Software)Leasehold Improvements 101 (60) 41Total 684$ (344)$ 340$
Estim. DeprecLife* Method**
Land N/A --Buildings >20 SLEquipment 6-10 MSLLeasehold Improvements >20 SL* Estimated Useful Life ** Method of Depreciation1-5 1 to 5 years SL Straight Line6-10 6 to 10 years MSL Modified Straight Line11-20 11 to 20 years (Cost by Property Office>20 over 20 years Code divided by 12)
(In Millions)
(In Millions)
2000Not
Covered Covered TotalIntragovernmental:Accrued RR Retirement Inter 3,096$ -$ 3,096$ Accounts Payable 70 1,836 1,906Other 27 358 385
Total Intragovernmental 3,193 2,194 5,387Benefits Due and Payable 38,706 940 39,646Accounts Payable 231 0 231Other 360 480 840Total 42,490$ 3,614$ 46,104$
(In Millions)
Principal Financial Statements and Notes 45

Liabilities Covered by Budgetary Resources
Accrued Railroad Retirement Interchange
The Accrued Railroad Retirement Interchange representsan accrued liability due the Railroad Retirement Board(RRB) for the annual interchange from the OASI and DITrust Funds. Refer to Note 12, Intra-GovernmentalFinancing Sources, for a description of the RRB transfer.
Accounts Payable
Intragovernmental Accounts Payable consist of amountsdue Federal agencies for goods received or servicesrendered.
Other Liabilities
SSA’s Other Liabilities is comprised of accrued payroll,lease liability for purchase contract buildings, andunapplied deposit funds.
Benefits Due and Payable
Benefits Due and Payable for SSA’s major programs as ofSeptember 30, 2000 and 1999 are shown in the tablebelow. These amounts include an estimate forunadjudicated cases that will be payable in the future.Except for the SSI program, the unadjudicated cases arecovered by budgetary resources.
Liabilities Not Covered by Budgetary Resources
Accounts Payable
Included in Intragovernmental Accounts Payable notcovered by budgetary resources is SSI Receivables Owedto Treasury. This liability is recorded for the collection ofSSI benefit overpayments that are payable from SSA tothe General Fund of the Treasury. It directly relates to theaccounts receivable established in the asset portion of theBalance Sheet. Refer to Note 6, Non-Entity Assets, for adescription of the SSI receivables established for therepayment of SSI benefit overpayments.
Other Liabilities
The Federal Employees’ Compensation Act (FECA),administered by the Department of Labor, providesincome and medical cost protection to covered Federalcivilian employees injured on the job, employees whohave incurred a work-related injury or occupationaldisease, and beneficiaries of employees whose death isattributable to a job-related injury or occupational disease.For payment purposes, claims incurred for benefits forSSA employees under FECA are divided into current andnon-current portions. Current fiscal year claim amounts tobe paid by SSA within two years are the current portion;these are included in the Intragovernmental, OtherLiabilities line item. SSA’s current portion of FECAliability was $44 and $40 million as ofSeptember 30, 2000 and 1999, respectively. The non-current portion of FECA actuarial liability is comprised ofclaims that will be paid more than two years in the future.The non-current portion, of $239 and $185 million as ofSeptember 30, 2000 and 1999, respectively, is recorded inthe Other Liabilities line item. This actuarial liability wascalculated using historical payment data to project futurecosts.
The remaining portion of Other Liabilities Not Covered byBudgetary Resources is comprised of: leave earned butnot taken, vocational rehabilitation services, and accruedadministrative costs in the SSI program.
Contingent Liabilities
Class action suits have been filed against SSA, which mayaffect major client populace. These suits may be lost, inwhole or in part, in lower courts and/or on appeal and mayrequire a future implementation plan. Any finalunfavorable court decisions will be funded from theappropriate trust fund or from the general funds for the SSIprogram. However, at this time, SSA is unable to
1999Not
Covered Covered TotalIntragovernmental:Accrued RR Retirement Inter 3,587$ -$ 3,587$ Accounts Payable 119 1,838 1,957Other 200 257 457
Total Intragovernmental 3,906 2,095 6,001Benefits Due and Payable 36,110 996 37,106Accounts Payable 285 0 285Other 276 462 738Total 40,577$ 3,553$ 44,130$
(In Millions)
2000 1999OASI $ 31,004 $ 29,017DI 7,352 6,684SSI 1,247 1,360Other 43 45Total $ 39,646 $ 37,106
(In Millions)
46 SSA’s FY 2000 Performance and Accountability Report

determine an estimate of loss for any class action suits. Inthe opinion of management and legal counsel, theresolution of the class actions and other claims andlawsuits will not materially affect the financial position oroperations of SSA.
SSA’s net position consists of unexpended appropriationsand cumulative results of operations. Unexpendedappropriations represent appropriated spending authoritythat is unobligated and has not been withdrawn byTreasury, and obligations that have not been paid.Cumulative results of operations represent the excess offinancing sources over expenses since inception.
Revenue from exchange transactions is recognized whengoods and services are provided. Total exchange revenuewas $3,905 and $3,467 million for FY 2000 and 1999,respectively. SSA exchange revenue primarily consists ofSSI State Supplementation. SSA has agreements with25 States and the District of Columbia to administer someor all of the States’ supplement to Federal SSI benefits.Total supplemental SSI benefits paid by SSA on behalf ofthe States were $3,640 and $3,219 million for FY 2000and 1999, respectively. SSA is reimbursed by the States infull and earned administration fee revenue in the amountof $236 and $222 million for FY 2000 and 1999,respectively. In addition, SSA earned $29 and $26 millionin other exchange revenue in FY 2000 and 1999,respectively. The goods and services provided in thesetransactions are priced so that charges do not exceed theAgency’s cost.
Employment tax revenues are estimated monthly by theDepartment of the Treasury based on SSA’s quarterlyestimate of taxable earnings. These estimates are used bythe Department of the Treasury to credit the SocialSecurity trust funds with tax receipts received during themonth. Treasury makes adjustments to the amounts
previously credited to the trust funds based on actual wagedata certified quarterly by SSA.
As required by current law, the Social Security trust fundsare due the total amount of employment taxes payableregardless of whether they have been collected. Theseestimated amounts are subject to adjustments for wagesthat were previously unreported, employersmisunderstanding the wage reporting instructions,businesses terminating operations during the year or errorsmade and corrected with either the Internal RevenueService or SSA but not both. Revenues to the trust fundsare reduced for excess employment taxes, which arerefunded by offset against income taxes.
Other tax revenues include certain military wage credits,Taxation of Social Security Benefits and FICA/SECA taxcredits. The amounts for estimated employment taxes,adjustments for actual taxes payable, and refunds as wellas other tax revenues are contained in the following table.
SSA receives financing sources that are other thanExchange and Non-Exchange Revenue that increase netresults of operations during the reporting period. The mostsignificant financing source received from another Federalentity is the drawdown of funds from the HI/SMI TrustFunds for the Health Care Financing Administration’s(HCFA) Medicare program. For FY 2000 and 1999,respectively, $998 and $953 million were drawn down tocover SSA’s operating expenses. These amounts representthe majority of the Transfers-In for Trust Fund Draws andOther line item as presented on the Statement of Changesin Net Position.
Financing outflows may result from transfers of thereporting entity’s assets to other Government entities,without reimbursement. SSA financing outflows mainly
9 Net Position
10 Exchange Revenues
11 Tax Revenues
12 Intra-Governmental Financing Sources
2000 1999
Estimated Employment Taxes Credited to SSA $ 486,227 $ 451,904Adjustments 3,999 1,234Refunds (2,015) (1,548)Employment Tax Revenues 488,211 451,590Other Tax Revenues 13,496 11,067
Total Tax Revenues $ 501,707 $ 462,657
(In Millions)
Principal Financial Statements and Notes 47

consist of transfers to the Railroad Retirement Board(RRB) for the annual interchange and SSI receivabletransferred to the Department of the Treasury.
The RRB transfer is for the annual interchange required toplace the OASI and DI Trust Funds in the same positionthey would have been if railroad employment had beencovered by SSA. The law requires the transfer, includinginterest accrued from the end of the preceding fiscal year,to be made in June. SSA transferred the railroad retirementinterchange (RRI) in the amount of $3.2 and $3.7 billionfor FY 2000 and 1999, respectively. The accrued liabilityof $3.1 and $3.6 billion for FY 2000 and 1999,respectively, on the Balance Sheet represents amounts dueRRB for the period. Also, amounts for railroad workers,who have qualified for and are receiving OASI and DIbenefit payments, are included in the benefit paymentexpenses on the Statement of Net Cost. However, theRRB makes the payments to the qualifying railroadworkers on behalf of SSA. SSA compensated RRB in theamount of $1.1 and $1.0 billion for FY 2000 and 1999,respectively.
SSA transfers to the Department of the Treasury consist ofcollections for SSI benefit overpayments that aredeposited in the General Fund. These transfers are $1.4and $1.3 billion for FY 2000 and 1999, respectively. Inaddition, a portion of the administrative fees charged tothe States to administer the supplemental SSI benefitsprogram is returned to the U.S. Treasury and amounted to$149 and $147 million for FY 2000 and 1999,respectively.
Shown below are SSA’s gross costs, earned revenue andnet costs displayed by budget function. Social Securityincludes the costs and revenues associated with the OASIand DI programs. Income Security includes the costs andrevenues associated with the SSI and BL programs.Medicare includes the costs and revenues that SSA incursin performing work for the HCFA’s Medicare program.
The Statement of Net Cost recognizes post-employmentbenefit expenses, as a portion of operating expenses, of$570 and $555 million for FY 2000 and 1999,respectively. The expense represents SSA’s share of thecurrent and estimated future outlays for employeepensions, life and health insurance. The Statement ofChanges in Net Position recognizes an imputed financingsource of $291 and $288 million for FY 2000 and 1999,respectively. The imputed financing source representsannual service cost not paid by SSA.
SSA’s obligations incurred consist of expended authority,recoveries of prior year obligations and the change inundelivered orders. The net amount of budgetaryresources obligated for undelivered orders as ofSeptember 30, 2000 and 1999 are $745 and $696 million,respectively.
During FY 2000, adjustments were made to SSA’sbudgetary resources to increase the indefinite authority forthe SSI appropriation for $2,575 million. The
13 Cost and Revenue by Budget Function
14 Imputed Financing
15 Status of Budgetary Resources
2000(In Millions)
Gross Less Earned NetCost Revenue Cost
Social Security $ 408,250 $ (14) $ 408,236Income Security 37,361 (3,886) 33,475Medicare 1,121 (5) 1,116Total $ 446,732 $ (3,905) $ 442,827
1999(In Millions)
Gross Less Earned NetCost Revenue Cost
Social Security $ 386,425 $ (12) $ 386,413Income Security 34,572 (3,451) 31,121Medicare 1,067 (4) 1,063Total $ 422,064 $ (3,467) $ 418,597
48 SSA’s FY 2000 Performance and Accountability Report

reapportionment assured that adequate funding would beavailable for the remainder of the fiscal year.
Trust Fund Receipts, Obligations and Balances
All Trust Fund receipts collected in the FY are reported asnew budget authority in the Statement of BudgetaryResources. As beneficiaries pass the various entitlementtests prescribed by the Social Security Act, benefitpayments and other outlays are obligated in the TrustFunds. The portion of Trust Fund receipts collected in theFY that exceeds the amount needed to pay benefits andother valid obligations in that FY is precluded by law frombeing available for obligation. This excess of receiptsover obligations is reported as Temporarily Not Availablein the Statement of Budgetary Resources and, therefore, isnot classified as budgetary resources in the FY collected.However, all such excess receipts are assets of the TrustFunds and will become available for obligation as neededin the future. The entire Trust Fund balances in theamounts of $965,170 and $815,458 million as ofSeptember 30, 2000 and 1999, respectively, are includedin Investments on the Balance Sheet.
The following table presents Trust Fund activities andbalances for fiscal years 2000 and 1999:
In FY 1999, SSA reported beginning and ending TrustFund balances in the Statement of Budgetary Resources asUnobligated Balances - Beginning of the Period andUnobligated Balances - Available, respectively. SSA hasreclassified these amounts so that the Statement ofBudgetary Resources for FY 1999 is consistent with thatfor FY 2000.
2000 1999 Trust Fund Balance, Beginning $ 815,458 $ 690,927 Receipts 563,245 516,259 Less Obligations 413,533 391,728 Excess of Receipts Over Obligations 149,712 124,531Trust Fund Balance, Ending $ 965,170 $ 815,458
(In Millions)
Principal Financial Statements and Notes 49

50 SSA’s FY 2000 Performance and Accountability Report

Balance Sheet by Major Program as of September 30, 2000
Intra-Agency Assets OASI DI SSI Other Eliminations Consolidated
Intragovernmental:Fund Balance with Treasury $ (309) $ (62) $ 340 $ 121 $ 90Investments 893,519 113,707 0 0 1,007,226Interest Receivable, Net 14,603 1,779 0 0 16,382Accounts Receivable, Net 31,578 7,629 0 195 $ (38,901) 501Other 0 157 220 2 (379) 0
Total Intragovernmental 939,391 123,210 560 318 (39,280) 1,024,199Accounts Receivable, Net 1,334 1,281 437 1,644 4,696Property, Plant and Equip., Net 190 151 0 0 341Other 0 0 0 0 0
Total Assets 940,915 124,642 997 1,962 (39,280) 1,029,236
Liabilities
Intragovernmental:Accrued RRI 3,091 5 0 0 3,096Accounts Payable 31,317 7,612 41 1,837 (38,901) 1,906Other 411 25 309 19 (379) 385
Total Intragovernmental 34,819 7,642 350 1,856 (39,280) 5,387Benefits Due and Payable 31,004 7,352 1,247 43 39,646Accounts Payable 9 8 209 5 231Other 218 175 303 144 840Total 66,050 15,177 2,109 2,048 (39,280) 46,104
Net Position
Unexpended Appropriations 0 0 332 63 395Cumulative Results of Operations 874,865 109,465 (1,444) (149) 982,737
Total Net Position 874,865 109,465 (1,112) (86) 983,132
Total Liabilities and Net Position $ 940,915 $ 124,642 $ 997 $ 1,962 $ (39,280) $ 1,029,236
(Dollars in Millions)
Supplemental Schedules to the Financial Statements 51

Schedule of Changes in Net Position for the Year Ended September 30, 2000
Intra-Agency OASI DI SSI Other Eliminations Consolidated
Net Cost of Operations $ 351,947 $ 56,289 $ 32,956 $ 1,635 $ 442,827
Financing Sources (other than Exchange Revenues)
Appropriations Used 0 0 32,921 533 33,454
Tax Revenues 430,914 70,793 0 0 501,707
Imputed Financing 78 62 105 46 291
Interest, Donations and Other Revenues 55,561 6,609 0 0 62,170
Transfers-In
Trust Fund Draws and Other 351,239 56,475 0 999 $ (407,703) 1,010
SSI Receivables Recovered 0 0 0 1,410 1,410
Transfers-Out
Trust Fund Draws and Other (351,290) (56,472) 0 0 407,703 (59)
Railroad Retirement Interchange (3,177) (30) 0 0 (3,207)
SSI Receivables Transferredto Treasury 0 0 0 (1,410) (1,410)
SSI Administrative Fees Transferredto Treasury 0 0 (149) 0 (149)
Total Financing Sources 483,325 77,437 32,877 1,578 595,217
Net Results of Operations 131,378 21,148 (79) (57) 152,390
Increase (Decrease) in UnexpendedAppropriations 0 0 10 5 15
Change in Net Position 131,378 21,148 (69) (52) 152,405
Net Position, Beginning Balance 743,487 88,317 (1,043) (34) 830,727
Net Position, Ending Balance $ 874,865 $ 109,465 $ (1,112) $ (86) $ 0 $ 983,132
(Dollars in Millions)
52 SSA’s FY 2000 Performance and Accountability Report

Schedule of Financing for the Year Ended September 30, 2000
OASI DI SSI Other Consolidated
Obligations and Non-Budgetary Resources
Obligations Incurred $ 356,793 $ 56,740 $ 36,664 $ 1,582 $ 451,779Other Spending Authority 0 0 (3,747) (56) (3,803)Imputed Financing 78 62 105 46 291Transfers In (Out) (4,872) (301) (149) 0 (5,322)Exchange Revenue (8) (162) 0 0 (170)
Total Obligations and Non-Budgetary Resources 351,991 56,339 32,873 1,572 442,775
Resources Not Funding Net Cost of Operations
Change in Undelivered Orders (39) (26) 5 11 (49)Capitalized Costs 0 (1) 0 0 (1)Financing Sources that Fund Costs of Prior Periods 0 (22) (78) 0 (100)
Total Resources Not Funding Net Cost of Operations (39) (49) (73) 11 (150)
Costs Not Requiring Resources
Depreciation and Amortization 27 21 35 16 99Other (49) (36) 0 25 (60)
Total Costs Not Requiring Resources (22) (15) 35 41 39
Financing Sources Yet to Be Provided 17 14 121 11 163
Net Cost of Operations $ 351,947 $ 56,289 $ 32,956 $ 1,635 $ 442,827
(Dollars in Millions)
Supplemental Schedules to the Financial Statements 53

Required Supplementary Information: Schedule of Budgetary Resourcesas of September 30, 2000
OASI DI SSI Other Consolidated
Budgetary Resources Made Available
Budget Authority $ 485,939 $ 77,306 $ 33,147 $ 1,517 $ 597,909
Unobligated Balances - Beginning of the Period 0 0 42 44 86
Spending Authority from Offsetting Collections 0 0 3,739 70 3,809
Temporarily Not Available and Adjustments (129,146) (20,566) 10 18 (149,684)
Total Budgetary Resources Made Available 356,793 56,740 36,938 1,649 452,120
Status of Budgetary Resources
Obligations Incurred 356,793 56,740 36,664 1,582 451,779
Unobligated Balances - Available 0 0 264 55 319
Unobligated Balances - Not Available 0 0 10 12 22
Total Status of Budgetary Resources 356,793 56,740 36,938 1,649 452,120
Outlays
Obligations Incurred 356,793 56,740 36,664 1,582 451,779
Less: Spending Authority 0 0 (3,747) (56) (3,803)
Obligated Balances - Beginning of the Period 32,804 7,111 544 240 40,699
Less: Obligated Balance - End of the Period (34,440) (7,653) (271) (246) (42,610)
Total Outlays $ 355,157 $ 56,198 $ 33,190 $ 1,520 $ 446,065
(Dollars in Millions)
54 SSA’s FY 2000 Performance and Accountability Report

Required Supplementary Information: Intragovernmental Amounts as of September 30, 2000
Fund Balance Interest Accountswith Treasury Investments Receivable, Net Receivable, Net
Intragovernmental Assets
Department of the Treasury $90 $1,007,226 $16,382Other $501
Total Intragovernmental Assets $90 $1,007,226 $16,382 $501
Accrued RailroadRetirement Accounts OtherInterchange Payable Liabilities
Intragovernmental Liabilities
Department of the Treasury, General Fund $1,748Railroad Retirement Board $3,096Other 158 $385
Total Intragovernmental Liabilities $3,096 $1,906 $385
Transfers-In Transfers-Out
Intragovernmental Revenues:
Department of the Treasury ($11)
Railroad Retirement Board $3,207
Department of Health and Human Services (999)
Total Intragovernmental Revenues: ($1,010) $3,207
Non-Exchange Revenue
(Dollars in Millions)
Supplemental Schedules to the Financial Statements 55