key evidence relevant to the standard model observation verdict extra yes noassumption cmb acoustic...
TRANSCRIPT

KEY EVIDENCE RELEVANT TO THE STANDARD MODELObservation Verdict Extra
Yes No Assumption
CMB Acoustic Peaks X
Baryon Acoustic Peak X Cold Dark MatterType 1a Supernova X +
Big Bang Nucleosynthesis X Dark EnergyMatter Power Spectrum X
Euclidean Geometry X
CMB Global Uniformity X InflationHubble constant X
Age of stars X
Evolution of Clusters X
Matter Budget of Groups X
CMB Lensing X
CMB SZ Effects (WMAP) X
Other Foregrounds (HI !) X
Baryons low z X
Baryons in Clusters X
Axis of Evil X
Bullet Cluster X Quasar polarization X
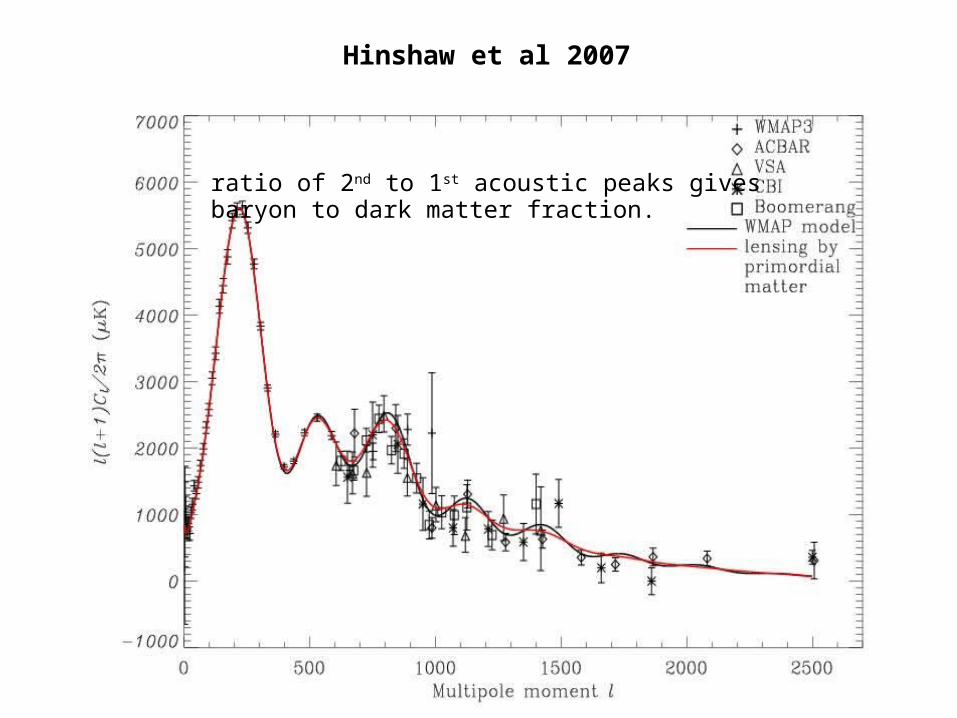
Hinshaw et al 2007
ratio of 2nd to 1st acoustic peaks givesbaryon to dark matter fraction.

Bob NicholOne
parameter Standard ruler
(flat,h=0.73,b=0.17)
Percival et al. 2006
Best fit m=0.2699.74% detection (3)

SN1a Hubble diagram (Tonry et al 2003)Reviewed in this conference by Reynald Pain

Hubble constant from
Sunyaev-Zeldovich Effect
(Bonamente et al 2006)
(Cre
dit
: B
on
am
en
te e
t al.
20
06
)
M=0.3,=0.7
H0=76.9±
3.4
3.9±8.0
10.0
(Cre
dit
: Fr
eed
man
et
al. (
20
01
)
2006
CEPHEIDS SZE
Cepheid-based and SZE-based
agree on H0 ,
current uncertainty is 10-15%

Cosmochronometers• Detections of radioactive elements (Th & U) allow age
estimates for oldest stars: putting limits on the age of the Galaxy & Universe
• Using chronometer pairs Th/U, Th/Eu, etc. we find an average age of <13-14> +/- ~ 3 Gyr for the oldest stars
• Technique independent of cosmological models & parameters
• We are seeing dramatic improvements in abundance values due to new experimental atomic data
• Experimental nuclear data along with the improved stellar data are also constraining nuclear predictions for initial radioactive abundances
• These new experimental data are driving down age uncertainties
• Eventually these improvements will allow for very accurate chronometric age determinations
• These new more precise values could constrain cosmological parameters (Hubble constant, etc.) and cosmological models

2dF/WMAP1 matter spectrum (Cole et al 2005)

+ve curvature Flat -ve curvature

Basics of the Sunyaev-Zeldovich Effect CMB
41
)1()(2 x
x
eTeCMB e
exndl
cm
kT
T
T
The electron density of the hot gas is obtained by fitting ROSAT X-raysurface brightness profiles with the 2 parameter isothermal -modelignoring the central cooling flow
)(XI
2
132
20
23
2
0 1)(1)(
CX
ee nI
r
rnrn
The decrement in TCMB is then given by
2
32
1
2
3
2
)(
10
2
1
2
32
338.38)0(where1)0()(
xj
Mpc
r
keV
kT
cm
nSZ
CSZSZ
CKTTT
with 41
)1()(
x
x
e
exxj

Absence of WMAP1 SZE in 31 low z clusters (Lieu, Mittaz, & Zhang ApJ 2006)Absence of WMAP1 SZE in 31 low z clusters (Lieu, Mittaz, & Zhang ApJ 2006)

Bielby & Shanks 2007 MNRAS submitted
ROSAT sample of 30 low z clusters Chanda sample of 38 z=0.3 clusters

Bielby & Shanks 2007 MNRAS submitted

Chandra A3112 cluster central soft X-ray excessBonamente et al 2007 ApJ submitted

Equal emission flux from cluster non-thermal & thermal components (Bonamente et al 2007 ApJ submitted)
This can upset cluster gas massbudget: Quenby OQSCM

Afshordi et al 2007 MNRAS in press
WMAP3 clusters can match the SZ prediction of models on X-ray gas fraction,But even then the baryon-to-matter ratio is 30% smaller than CMB cosmic.

Chandra X-ray gas fraction (Vikhlinin et al ApJ 2003)

Cen & Ostriker ApJ 1999, on `Where are the baryons?’

Zappacosta filament strikes back

Overlay WMAP +ve contours on HI inverted gray-scale map
180 160 140 120 100 80 60
70
65
60
55
50
45
40
35
30
col
row
0.02.55.07.510.012.515.017.520.022.525.027.5Whole_area__130to_1290_rs
Whole area -130 to -120 km/s 1:28 @ 2
160 140 120 100 80 60
70
60
50
40
30
col
row
WMAP pruned, raw data .08 : 0.22 @ 0.03HI -130 to -120 km/s
In general, anomalous vel. HI are in the proximity of WMAP peaks.
Gerrit Verschuur 2007 ApJ submitted

(a) (b)
116 114 112 110 108
62
60
58
56
54
Galactic longitude (°)
Galactic latitude (°)
116 114 112 110 108
62
60
58
56
54
Galactic longitude (°)
Galactic latitude (°)
V= - 118 km/s v= - 87 km/s
Verschuur 2007 ApJ submitted

WHY THE PRIMORDIAL P(k) SPECTRUM DOES NOT ACCOUNT FORLENSING BY NON-LINEAR GROWTHS AT Z < 1
Homogeneous Universe
Mass Compensation(swiss cheese)
Poisson Limit

Consider a tube of non-evolving randomly placed lenses
ndV
LL bdbdDzn 20 )1(2.
sD
M
bs
s drbr
rrbdbdD
D
DDDzGn
0 0220
)(4)()1(4
)20
9
2
11(
822
0022
0 smssm DHDHDH
Thus
The magnification by the lenses and demagnification at the voids exactly compensate each other.
The average beam is Euclidean if the mean density is critical. (Kibble & Lieu 2005, Lieu & Mittaz 2005)
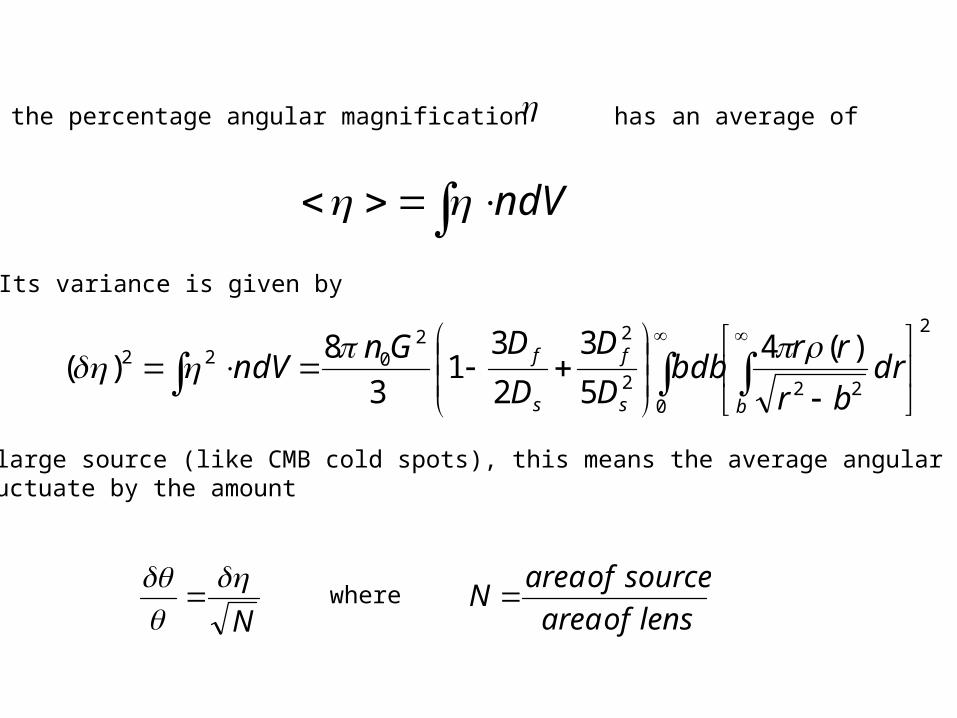
While the percentage angular magnification has an average of
Its variance is given by
For a large source (like CMB cold spots), this means the average angular sizecan fluctuate by the amount
ndV
2
0222
22022 )(4
5
3
2
31
3
8)(
bs
f
s
f drbr
rrbdb
D
D
D
DGnndV
N
where lensofarea
sourceofareaN

Shanks 2007 MNRAS in press


Shanks 2007 MNRAS in press
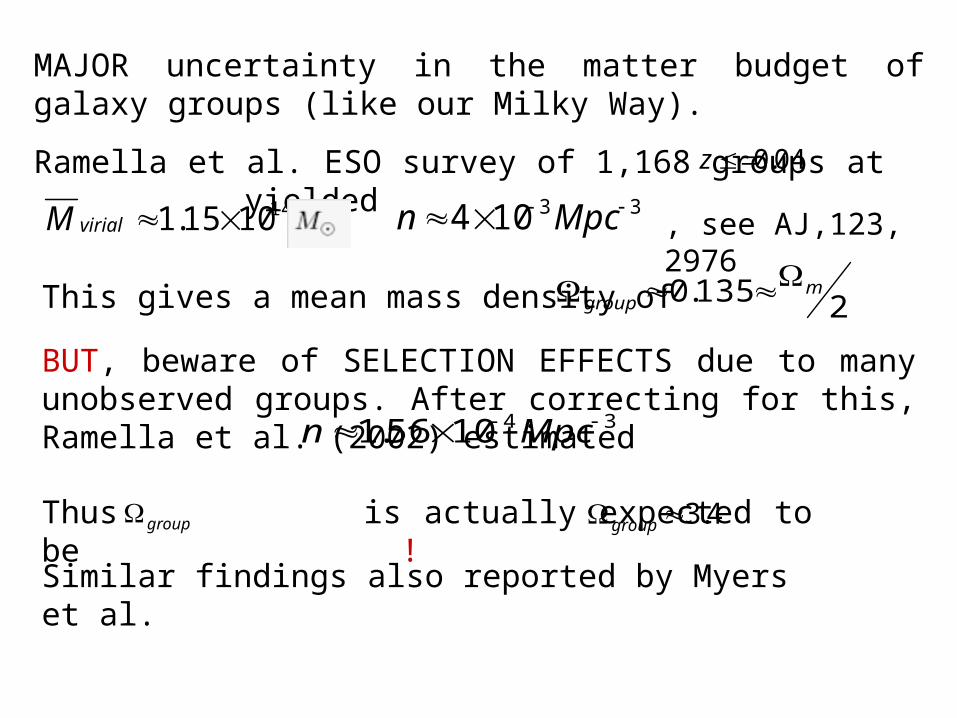
MAJOR uncertainty in the matter budget of galaxy groups (like our Milky Way).
Ramella et al. ESO survey of 1,168 groups at yielded141015.1 virialM
341056.1 Mpcn
, see AJ,123, 2976
This gives a mean mass density of 2135.0 mgroup
BUT, beware of SELECTION EFFECTS due to many unobserved groups. After correcting for this, Ramella et al. (2002) estimated
33104 Mpcn
Thus is actually expected to be !group 4.3group
Similar findings also reported by Myers et al.
04.0z

MACS: 22 000 deg² fx 10-12 erg/s/cm²
RDCS: 50 deg², fx 3. 10-14 erg/s/cm²Concordance model
+Standard M-T scaling law
Concordance model+
Revised M-T scaling law

XMM Lx-Tx evolutionXMM Lx-Tx evolution
+ localXMM Chandra
D.Lumb et al., 2003
remarkable remarkable convergenceconvergence Lx/Tx)Lx/Tx)
zz = Lx/Tx) = Lx/Tx)z = z =
00(1+z)(1+z)
withwith = 0.65 = 0.65 0.28 0.28
in full agreement with in full agreement with Chandra Chandra (Vikhlinin et al, 2002)(Vikhlinin et al, 2002), , ASCA ASCA (Sadat et al., 1998; Novicki et al., (Sadat et al., 1998; Novicki et al., 2003....)2003....)

Systematic on Ωm- Ω (2 c.l.)
fgas method is good for Ωm, but…
pay attention to systematics
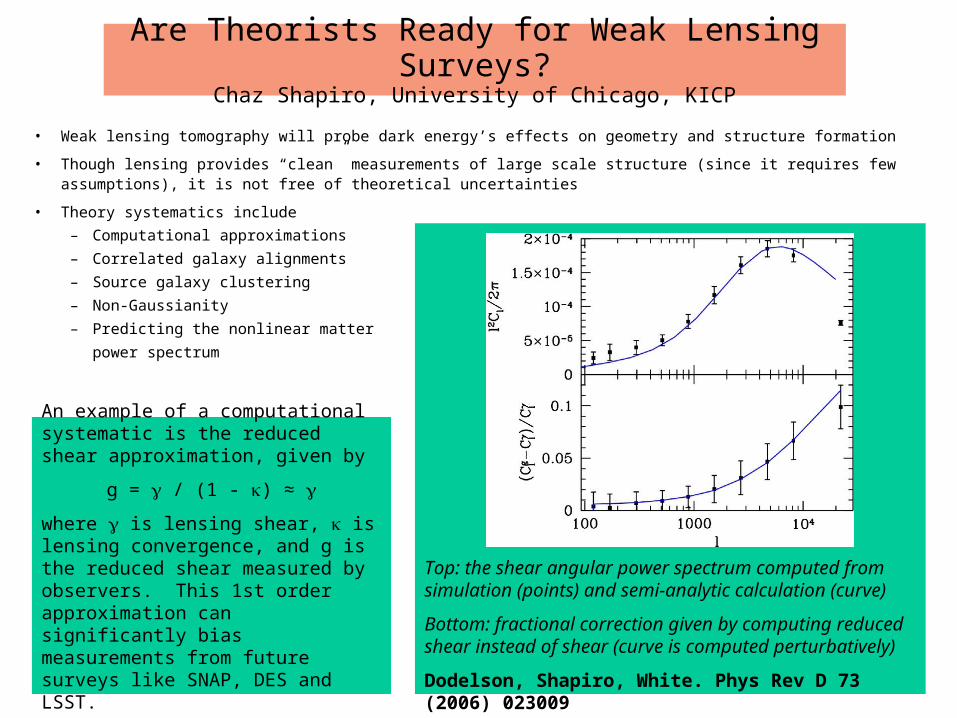
Are Theorists Ready for Weak Lensing Surveys?Chaz Shapiro, University of Chicago, KICP
• Weak lensing tomography will probe dark energy’s effects on geometry and structure formation
• Though lensing provides “clean” measurements of large scale structure (since it requires few assumptions), it is not free of theoretical uncertainties
• Theory systematics include
– Computational approximations
– Correlated galaxy alignments
– Source galaxy clustering
– Non-Gaussianity
– Predicting the nonlinear matter
power spectrum
An example of a computational systematic is the reduced shear approximation, given by
g = / (1 - ) ≈
where is lensing shear, is lensing convergence, and g is the reduced shear measured by observers. This 1st order approximation can significantly bias measurements from future surveys like SNAP, DES and LSST.
Top: the shear angular power spectrum computed from simulation (points) and semi-analytic calculation (curve)
Bottom: fractional correction given by computing reduced shear instead of shear (curve is computed perturbatively)
Dodelson, Shapiro, White. Phys Rev D 73 (2006) 023009

The Axis of Evil II - Summary
Correlations seen for l = 2,3,4,5
But how do we test the significance?Propose a model
Frequentist Bayesian
m-preference
Planarity

Dark Matter Exists
The Bullet Cluster - an object whose visible mass and center of gravity
are spatially separated.
But, nature of Dark Matter is still
unknown
Also does not prove that gravity
is Newtonian
Courtesy Sean Carroll (cosmicvariance.com)
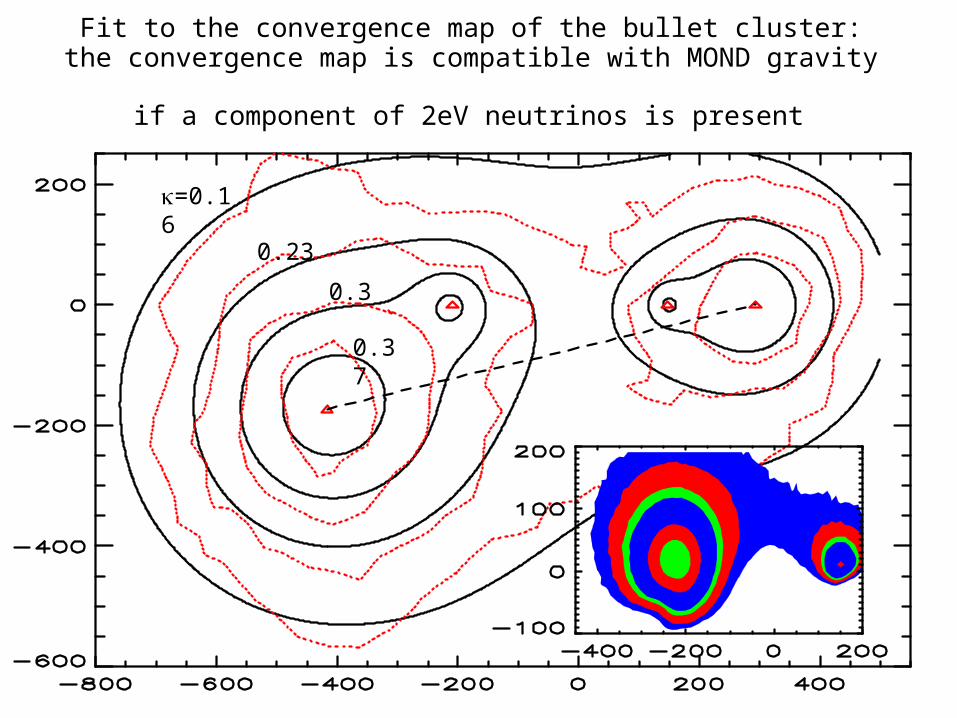
Fit to the convergence map of the bullet cluster: the convergence map is compatible with MOND gravity
if a component of 2eV neutrinos is present
0.37
0.3
0.23
=0.16

April 19, 2006 AstroTheo Meeting Liege 35
Large-scale alignments of quasar polarization vectorsLarge-scale alignments of quasar polarization vectors
• Evidence for large-scale angular correlations of quasar polarization vectors (in regions of ~ 1 Gpc size at z ~ 1)
• The mean polarization angle changes with redshift
• The effect is statistically significant (> 99.9%) in a sample of 355 quasars
• Instrumental and interstellar polarization cannot produce a redshift dependent effect
• The effect seems stronger along an axis close to the CMB dipole and the “axis of evil”
• A large-scale origin might be due to a modification of the quasar polarization along the line of sight (photon-pseudoscalar conversion? large-scale rotation?) and/or assuming intrinsic remnant alignments of quasar axes
• The regions of alignments might be among the largest structures in the Universe and indicate departures to the fundamental cosmological assumption of large-scale isotropy
(Reference : Hutsemékers et al. A&A 2005, 441, 915)

Do CMB & LSS data require dark energy?- Subir Sarkar (Oxford)
If the fluctuations from inflation have a small ‘bump’ in their spectrum
… caused perhaps by SUSY phase transitions in the cooling universe
To explain large-scale structure requires 15% hot dark matter (3x 0.8 eV mass ’s)
The WMAP data can be fitted with Ωmrequires only that h ~ 0.46

Rasanen 2007
• The FRW equations do not describe the average expansion of inhomogeneous spaces.
• The equations for inhomogeneous space show that even when the local expansion decelerates everywhere, the average expansion can accelerate.
• Acceleration can be due to collapsing regions.
• Structure formation involve collapsing regions and has a preferred time around the observed acceleration era.
GRAND SUMMARY
• Over several precision cosmology datasets the standard cosmological model has staggering success.
• Yet there are definitely major problems concerning many other observations the model cannot explain. It would be a mistake to undermine this.
• Perhaps the standard model as it stands is like Bohr’s model of the H-atom. The Cophenhagen interpretation is yet to come.
Future Priorities Dark Matter• PLANCK: CMB polarization peaks • Acoustic nature of CMB peaks & DM potential• PLANCK: is the 3rd TT peak lensed?• Weak lensing shear maps• Strong lensing time delay• More bullet clusters• Mass and no. density of galaxy GROUPS Dark Energy• Integrated Sachs-Wolfe Effect – direct probe of
dark energy and constraint on w.

Missing Baryons
• Are they in a warm (10^6 K) gas?• Non-thermal activity in clusters?
Implications on SZ effect, scaling laws and cluster evolution.