key drivers of profitability on pasture based dairies -...
TRANSCRIPT

Key Drivers of Profitability on Pasture Based Dairies
Joe Horner
Extension Economist
MU Commercial Agriculture Program

If your goal is anything but profitability ‐if it's to be big, or to grow fast, or to become a technology leader ‐ you'll hit problems.
Michael PorterInstitute for Strategy & CompetitivenessHarvard Business School

1.) A simple forage system managed for quality
2.) Cows that calve in large seasonal batches
3.) High speed and low investment parlors
4.) A balance of volume, margin and overhead that creates attractive returns and a desirable lifestyle
4 Keys to Profitability

What is a Key Business Driver?
• Key business drivers are those factors that influence a farm’s profit the most.
• Why do some farms make more money?
• Managers need to focus attention on these areas to improve profitability the fastest.

Profitability
• Return on Assets % (ROA):(Net farm income + interest expense– value of operator labor & mgt.)/total farm assets
• Three distinct levels of ROA• Negative• Between 0 and the farm’s cost of capital ~ 6.5%• Above the cost of capital

Small ROA differences can make huge differences in wealth
Mr. Average• 25 years old• Inherits $200,000• Invests in his own dairy• Earns & reinvests at 4%
return over next 40 years • Retires at 65• Net Worth = $ 960,204
Mr. Excel• 25 years old• Inherits $200,000• Invests in his own dairy• Earns & reinvests at 6%
return over next 40 years • Retires at 65• Net Worth = $ 2,057,143

Bermuda Belt
Confinement Hybrid Belt
Fescue Belt

Fescue Belt
Apr Aug OctJun
Fora
ge Y
ield
Feb Dec
Tall Fescue Clover
Crabgrass
Cereal RyeHerd
DMI

Fescue Belt
Apr Aug OctJun
Fora
ge Y
ield
Feb Dec
Tall Fescue Clover
Crabgrass
Cereal Rye
Herd DMI
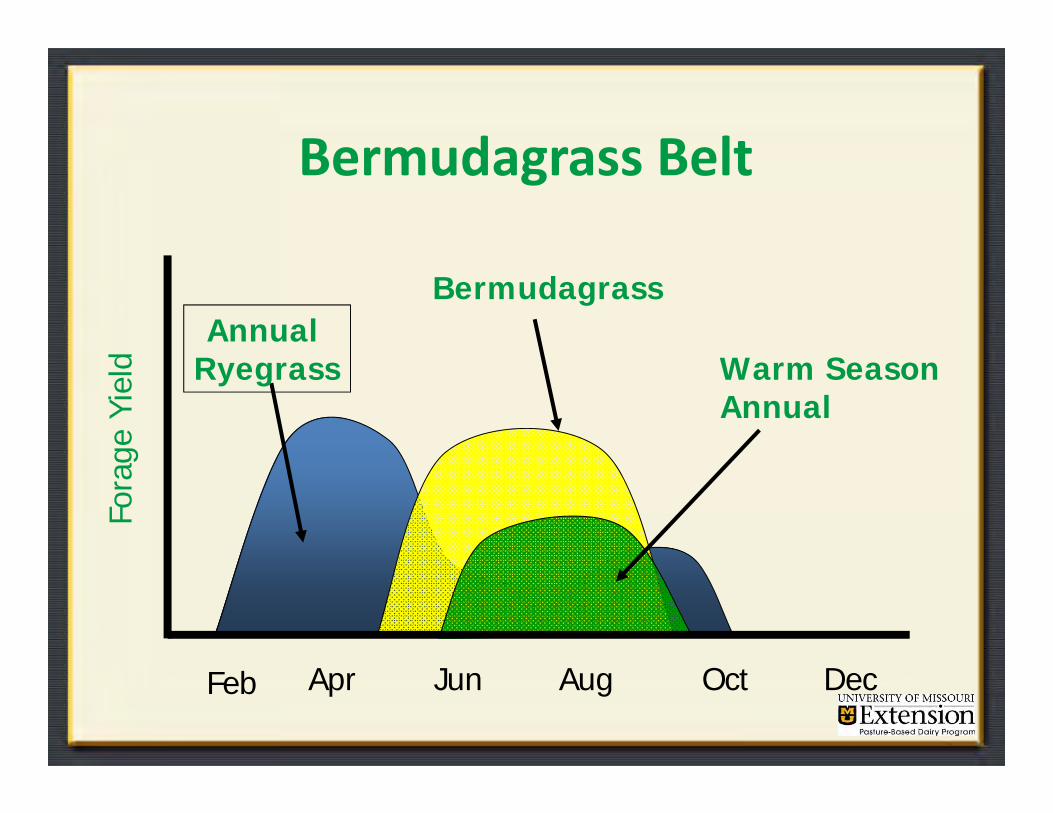
Bermudagrass Belt
Apr Aug OctJun
Fora
ge Y
ield
Feb Dec
Warm SeasonAnnual
BermudagrassAnnual
Ryegrass

Profit Margin Asset Turnover Leverage
Profitability Model
X X
Net IncomeSales
SalesAssets
Assets Equity
= Percentage Return on Equity (ROE)
X
Return on Equity=
X = Return on Equity
Operating Efficiency
Capital Efficiency
Financing

Profit Margin Asset Turnover Leverage
Profitability Model
X X
Net IncomeSales
SalesAssets
Assets Equity
X
Return on Equity=
X = Return on Equity
• Plant high energy but reliable pastures, fertilize as needed, allocate paddocks for annuals during seasonal flat spots
• Monitor, Measure & Manage pastures for high energy feed using a grazing wedge
• Calve in seasonal batches in sync with pasture growth curve.• Use good nutrition, right genetics, attention to health & assisted reproduction technologies to keep cows within 12 month windows
• To lower labor costs, invest in a labor efficient parlor, holding area, calf facilities, & preventative animal health care

Profit Margin Asset Turnover Leverage
Profitability Model
X X
Net IncomeSales
SalesAssets
Assets Equity
X
Return on Equity=
X = Return on Equity
• Stock the farm to its potential, given the constraints of resources, management, and the total system in place
• Avoid machinery purchases by hiring custom operators or buying forage crops• Raise asset turnover by overstocking and feeding partial TMR when systems are in place to do so without impacting other costs
• Avoid buying non‐performing “stranded assets” when purchasing farms, i.e.: wasteland, extra houses, silos, barns, etc.

Profit Margin Asset Turnover Leverage
Profitability Model
X X
Net IncomeSales
SalesAssets
Assets Equity
X
Return on Equity=
X = Return on Equity
• Use leverage to raise returns only if the expected long term returns on assets are above the long term cost of capital
• When ROA > cost of capital, use leverage, but mitigate risks with forward contracting and using fixed rate loans.

Standard 300 Cow MU Dairy Model
• 300 crossbred cows• 10 pounds grain mix• 12,700 pounds of milk sold per cow• Stocking rate = 1.25 cows per acre• 85 day average dry period• Forage purchased: Dry cows needs, plus 5 pounds hay per lactating cow during season
• $5,023 investment per cow

Profit Margin Asset Turnover Leverage
300 Cow MU Dairy Model
X X
Net IncomeSales
SalesAssets
Assets Equity
= Percentage Return on Equity (ROE)
19.4% 0.5
X
XX
Return on Equity=
X = Return on Equity
1/1 = 9.2% (ROE)

300 Cow MU Dairy Model
• 300 crossbred cows• 15 pounds grain mix• 12,700 pounds of milk sold per cow• Stocking rate = 1.25 cows per acre• 85 day average dry period• Forage purchased: Dry cows, + 5 pounds hay per lactating cow
• $5,023 investment per cow

Profit Margin Asset Turnover Leverage
300 Cow MU Dairy ModelAdd extra 5 lbs. grain/cow/day
X X
Net IncomeSales
SalesAssets
Assets Equity
= Percentage Return on Equity (ROE)
12.9% 0.5
X
XX
Return on Equity=
X = Return on Equity
1 = 6.4% (ROE)

300 Cow MU Dairy Model
• 300 crossbred cows• 10 pounds grain mix• 12,700 pounds of milk sold per cow• Stocking rate = 1.25 cows per acre• 85 day average dry period• Forage purchased: Dry cows, + 5 pounds hay per lactating cow
• $6,023 (+$1,000 machinery) investment per cow

Profit Margin Asset Turnover Leverage
300 Cow MU Dairy ModelAdd $1,000/cow more machinery
X X
Net IncomeSales
SalesAssets
Assets Equity
= Percentage Return on Equity (ROE)
12.8% 0.4
X
XX
Return on Equity=
X = Return on Equity
1 = 5.1% (ROE)

Profit Margin Asset Turnover Leverage
300 Cow MU Dairy ModelSummary
X X
Net IncomeSales
SalesAssets
Assets Equity
X
Return on Equity=
X = Return on Equity
Scenario Profit Margin
Asset Turnover
Leverage Return on Equity
Standard Model 19.4 0.5 None =1 9.2%
Grain raised from 10 to 15 pounds with no change in production
12.9 0.5 None =1 6.4%
Increase machinery investment per cow $1,000 with no change in production
12.8 0.4 None =1 5.1%
Leverage Standard Model with 50% debt at 6.5% per year
12.4 0.5 2.1 13.0%


A Balance of Volume, Margin and Overhead that creates Attractive Returns and a Desirable Lifestyle
Benchmark Conventional Dairy Grazing Dairy
Income/Cow $4,000 $2,250
Operation costs as % income 80% 65%
Milk sold per cow (lbs.) 24,000 12,250
Ownership equity (%) 50% 50%
Debt per cow $5,000 $3,000
Asset turnover 0.4 0.4
Investment per cow $7,500 to $15,000 $5,000 to $7,000
Return on assets 8% 10%
Conventional Source: The Dairy Dozen, 12 Key Financial Indicators, Gary Sipiorski, Hoards Dairyman, January 25, 2009
Grazing Dairy Source: Personal experience in Missouri, working with dairy grazing operations

Resources
• Measuring and Analyzing Farm Financial Performance (Purdue) Website: http://www.agecon.purdue.edu/extension/programs/fbm21/Ec712entry.htm
• Farm Analysis Solution Spreadsheets (Illinois) Website: http://www.farmdoc.illinois.edu/fasttools/index.asp
• Dairy Business Summary and Analysis (Cornell)Website: http://dfbs.aem.cornell.edu/
• Farm Accounting Software (Quicken, Quickbooks, etc.)

Questions?