key data - department of education · department of education key data 2016/2017 march 2017 key...
TRANSCRIPT

1
Department of Education Key Data 2016/2017
March 2017
KEY DATA
Department of Education

2
Department of Education Key Data 2016/2017
Key DataThe effective management and use of data is a key strategic priority for the Department, as it enables us to identify student need and measure success at an individual student, program, school and whole-of-system level. This is critical to
improving educational outcomes for Tasmania, ensuring that funding is distributed according to student need and programs and policies are developed and implemented appropriately to suit the requirements of all our students.
We are committed to continuing to manage our data in the most effective way possible and most importantly to reflect, review, plan and implement initiatives across the state.
School Data 3
School Rescource Package Allocations – Fairer Funding Model Component 3
Support School Resource Package Allocations – Fairer Funding Model Component 17
Senior Secondary Enrolments by School 18
Student Assistance Scheme (STAS) 22
Student Enrolments and Attendance by School 23
Support School Enrolments and Attendance by School 34
Total Enrolments 35
State Attendance and Suspension Rates 37
Class Sizes Kindergarten to Year 10 38
Table of Contents
School Satisfaction 39
Access to Computers in Classrooms 39
Workforce Data 40
Teachers Employed 43
Average Age of Teachers 44
Age Distribution Principals and Assistant Principals (Headcount) 44
Gender Distribution in Promoted Positions (Headcount) 45
Rate of Staff Attendance 45
Separation Rates for Staff Aged Less Than 55 Years 46
Supporting Student Need 47

3
Department of Education Key Data 2016/2017
School Data
School Resource Package Allocations 2016–17, including Fairer Funding Model Allocations and Enrolments
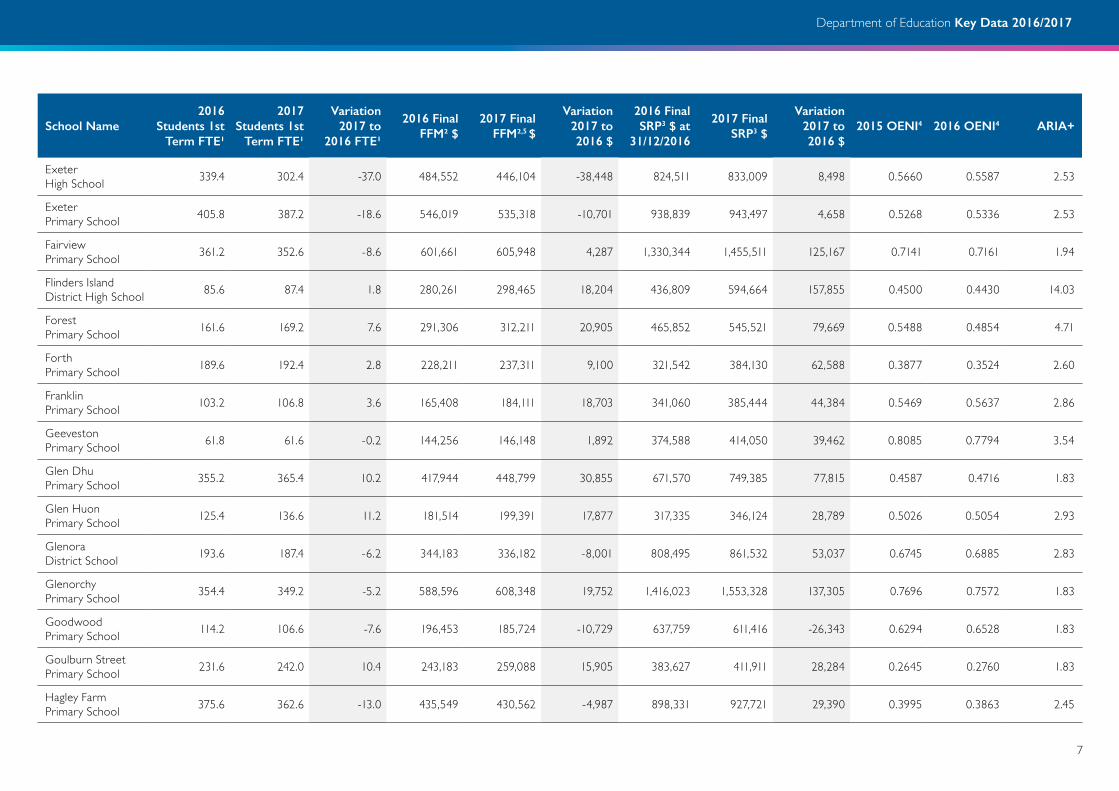
Funding for Tasmanian Government schools includes two separate elements – Approved Establishment Staffing and the School Resource Package (SRP). The SRP includes three allocations – the Fairer Funding Model (FFM) allocation, facility funding and discrete funding. Discrete funding includes funding which is dependent on the needs of the students in the school in that particular year, such as the Literacy and Numeracy Coaching Strategy. It can also include variable National Partnership funding as well as new initiatives funded through the SRP such as the Literacy and Numeracy – Middle Years initiative in 2017. In 2017, there was also a decision to move all payments to schools into the SRP. This was done to provide improved visibility and transparency of the various funding components that schools receive from various Branches within the Department. That change is a significant contributor to the increase in 2017 SRP funding to schools with other key factors for the increase being new initiatives, additional funding for energy costs, additional funding due to an increase in student with disability enrolments and all funding for the Years 11–12 extension school initiative now provided through the SRP (some was previously through Approved Establishment Staffing).
From January 2014, the FFM has been used by the Tasmanian Government to allocate funding under the Better Schools Tasmania Agreement (Gonski), which results in additional funding being available to meet student need. All schools are provided with a core allocation of funding based on the things all schools have in common. Fairer Funding will then consider things like how many students are enrolled at the school, whether the school offers primary, secondary, combined or senior secondary education, as well as the fact that some schools have students with greater needs than others and require extra funding to ensure that these students get the same opportunities as others. Because of this, the Department looks at each school and considers factors such as the socioeconomic status of the school, the location of the school, and the number of high or special needs students at the school. Socioeconomic status and student need is based on the Occupational Education Needs Index (OENI). The OENI is derived from parental background data collected from enrolment form information. A weight is assigned to each student according to the highest parental occupation group.
An average score is then determined for each school. The OENI score will range from zero to one with a score of one representing the highest level of need. What this means, is that while a school may have an increase in their enrolments compared to another school in any one year, their OENI may be lower meaning they receive less funding based on student need than a school with a higher level of student need. The total funding available under the model increased in both 2016 and 2017 therefore all schools received an increase in FFM funding rates per student. Any changes to a school’s FFM allocation is the result of changes to student enrolments and student need. Schools locational funding is distributed according to the geographic remoteness of the school using the Accessibility/ Remoteness Index of Australia (ARIA+) which is an ABS endorsed measure. The table following outlines details of schools’ total SRP, the FFM component of the SRP and school enrolments.
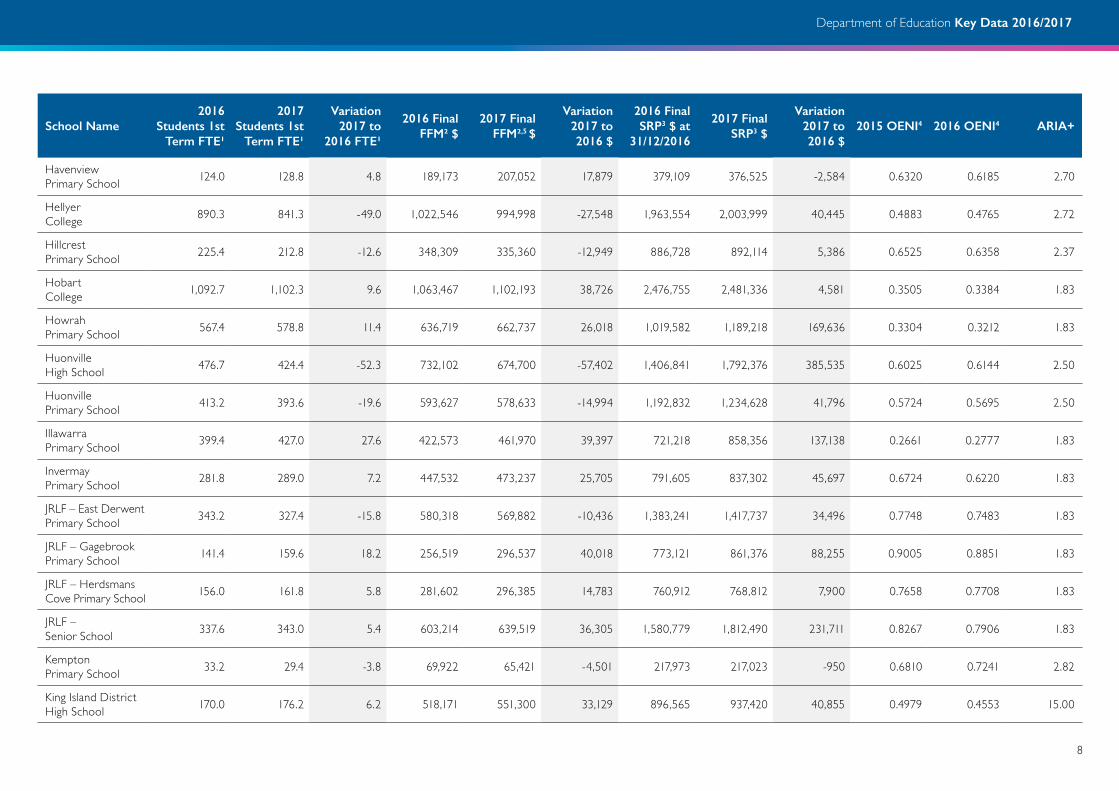
School Resource Package Allocations – Fairer Funding Model Component
School Name2016
Students 1st Term FTE¹
2017 Students 1st
Term FTE¹
Variation 2017 to
2016 FTE¹
2016 Final FFM² $
2017 Final FFM²,5 $
Variation 2017 to 2016 $
2016 Final SRP3 $ at
31/12/2016
2017 Final SRP3 $
Variation 2017 to 2016 $
2015 OENI4 2016 OENI4 ARIA+
Albuera Street Primary School 263.4 264.0 0.6 271,716 280,770 9,054 449,953 477,623 27,670 0.2563 0.2244 1.83
Andrews Creek Primary School 152.8 154.4 1.6 198,775 207,215 8,440 352,987 390,297 37,310 0.4167 0.3883 2.60
Austins Ferry Primary School 470.4 512.4 42.0 682,565 765,000 82,435 1,338,019 1,500,051 162,032 0.6088 0.5922 1.83

4
Department of Education Key Data 2016/2017
School Name2016
Students 1st Term FTE¹
2017 Students 1st
Term FTE¹
Variation 2017 to
2016 FTE¹
2016 Final FFM² $
2017 Final FFM²,5 $
Variation 2017 to 2016 $
2016 Final SRP3 $ at
31/12/2016
2017 Final SRP3 $
Variation 2017 to 2016 $
2015 OENI4 2016 OENI4 ARIA+
Avoca Primary School 21.6 21.8 0.2 58,453 62,040 3,587 128,813 133,495 4,682 0.5875 0.5227 5.00
Bagdad Primary School 129.8 138.8 9.0 188,498 212,962 24,464 363,530 410,359 46,829 0.5462 0.5625 2.34
Bayview Secondary College 171.0 219.6 48.6 302,035 400,522 98,487 641,332 987,011 345,679 0.7589 0.7633 1.83
Beaconsfield Primary School 253.2 261.2 8.0 396,026 406,185 10,159 729,702 757,871 28,169 0.5674 0.5941 2.74
Bellerive Primary School 460.6 476.0 15.4 522,064 540,346 18,282 808,189 887,384 79,195 0.3887 0.3636 1.83
Bicheno Primary School 87.2 89.2 2.0 185,035 187,955 2,920 284,515 294,027 9,512 0.4722 0.4853 7.03
Blackmans Bay Primary School 277.4 276.0 -1.4 297,583 310,112 12,529 621,629 632,735 11,106 0.3223 0.3151 1.83
Boat Harbour Primary School 248.8 257.4 8.6 329,145 349,656 20,511 526,046 560,258 34,212 0.4211 0.4121 3.48
Bothwell District High School 84.6 73.8 -10.8 173,877 160,327 -13,550 332,550 316,780 -15,770 0.7076 0.7123 4.14
Bowen Road Primary School 263.2 273.6 10.4 396,016 433,584 37,568 876,626 999,477 122,851 0.6363 0.6564 1.83
Bracknell Primary School 57.4 55.6 -1.8 95,929 97,841 1,912 197,458 222,556 25,098 0.5263 0.5519 2.93
Bridport Primary School 167.4 173.2 5.8 248,833 276,393 27,560 437,515 504,680 67,165 0.5202 0.5481 3.38
Brighton Primary School 572.4 574.2 1.8 737,365 763,109 25,744 1,478,290 1,557,079 78,789 0.5157 0.4862 1.85
Brooks High School 464.0 433.0 -31.0 788,828 758,148 -30,680 1,351,335 1,299,853 -51,482 0.7282 0.6993 1.83
Bruny Island District School 45.6 40.2 -5.4 100,328 91,856 -8,472 205,333 206,083 750 0.4231 0.3796 6.10

5
Department of Education Key Data 2016/2017
School Name2016
Students 1st Term FTE¹
2017 Students 1st
Term FTE¹
Variation 2017 to
2016 FTE¹
2016 Final FFM² $
2017 Final FFM²,5 $
Variation 2017 to 2016 $
2016 Final SRP3 $ at
31/12/2016
2017 Final SRP3 $
Variation 2017 to 2016 $
2015 OENI4 2016 OENI4 ARIA+
Burnie High School 545.0 526.2 -18.8 585,195 594,695 9,500 937,884 1,196,431 258,547 0.4291 0.4564 2.74
Burnie Primary School 349.4 359.6 10.2 373,550 400,640 27,090 623,279 667,515 44,236 0.3920 0.3571 2.74
Cambridge Primary School 336.6 347.8 1.2 359,806 379,051 19,245 578,228 627,745 49,517 0.2831 0.2841 1.83
Campania District School 175.4 179.8 4.4 310,465 327,033 16,568 709,078 919,558 210,480 0.6500 0.6558 2.70
Campbell Street Primary School 253.4 253.4 - 279,949 284,150 4,201 467,222 474,068 6,846 0.3636 0.3653 1.83
Campbell Town District High School 200.6 203.0 2.4 383,939 401,220 17,281 907,298 1,160,551 253,253 0.6323 0.6274 4.61
Cape Barren Island School 3.0 5.6 2.6 69,712 92,040 22,328 182,821 144,241 -38,580 0.5625 0.2500 13.36
Claremont College 599.6 531.9 -67.6 916,373 845,989 -70,384 1,903,785 1,819,831 -83,954 0.6581 0.6689 1.83
Clarence High School 508.0 468.9 -39.1 578,345 549,054 -29,291 1,123,591 1,144,321 20,730 0.4666 0.4634 1.83
Clarendon Vale Primary School 115.6 113.6 -2.0 209,662 212,544 2,882 563,987 613,673 49,686 0.8527 0.8299 1.83
Collinsvale Primary School 46.8 44.6 -2.2 72,212 71,145 -1,067 168,781 182,327 13,546 0.3980 0.4821 2.00
Cooee Primary School 155.6 150.6 -5.0 209,456 205,558 -3,898 367,416 366,549 -867 0.4828 0.5093 2.74
Cosgrove High School 223.4 188.4 -35.0 400,242 342,876 -57,366 857,810 796,964 -60,846 0.8029 0.7932 1.83
Cressy District High School 331.0 310.9 -20.1 550,854 517,406 -33,448 1,127,731 1,254,790 127,059 0.6196 0.6134 2.75
Cygnet Primary School 211.4 197.6 -13.8 288,602 289,870 1,268 434,500 513,904
79,404 0.5018 0.5099 3.06

6
Department of Education Key Data 2016/2017
School Name2016
Students 1st Term FTE¹
2017 Students 1st
Term FTE¹
Variation 2017 to
2016 FTE¹
2016 Final FFM² $
2017 Final FFM²,5 $
Variation 2017 to 2016 $
2016 Final SRP3 $ at
31/12/2016
2017 Final SRP3 $
Variation 2017 to 2016 $
2015 OENI4 2016 OENI4 ARIA+
Deloraine High School 241.0 240.6 -0.4 365,737 376,052 10,315 738,819 1,101,579 362,760 0.5539 0.5486 2.96
Deloraine Primary School 362.2 365.8 3.6 492,688 516,770 24,082 729,428 798,316 68,888 0.4984 0.4993 2.96
Devonport High School 532.0 505.0 -27.0 598,585 582,347 -16,238 1,018,122 1,130,337 112,215 0.4673 0.4639 2.37
Devonport Primary School 291.2 305.0 13.8 395,002 427,236 32,234 797,929 883,677 85,748 0.5756 0.5722 2.37
Dodges Ferry Primary School 399.4 413.4 14.0 502,378 534,071 31,693 884,959 1,058,175 173,216 0.4832 0.4559 2.36
Don College 976.9 930.8 -46.1 1,127,358 1,104,943 -22,415 2,257,373 2,300,532 43,159 0.4988 0.4739 2.37
Dover District School 94.8 75.4 -19.4 196,497 164,601 -31,896 395,289 365,498 -29,791 0.6231 0.6435 4.43
Dunalley Primary School 115.2 76.6 -38.6 157,070 114,355 -42,715 326,505 326,149 -356 0.4120 0.4349 3.11
East Devonport Primary School 231.8 250.6 18.8 389,305 437,632 48,327 993,009 1,179,066 186,057 0.7304 0.7361 2.37
East Launceston Primary School 591.6 562.4 -29.2 618,071 605,547 -12,524 881,553 923,698 42,145 0.3718 0.3276 1.83
East Tamar Primary School 310.2 319.6 9.4 537,453 573,093 35,640 1,227,112 1,350,368 123,256 0.8136 0.8033 1.83
East Ulverstone Primary School 245.0 246.4 1.4 323,793 326,293 2,500 503,976 530,236 26,260 0.5311 0.5226 2.63
Edith Creek Primary School 47.4 53.2 5.8 106,810 118,067 11,257 225,418 271,346 45,928 0.4808 0.5200 5.36
Elizabeth College 1,029.9 1,040.3 10.4 988,988 1,028,368 39,380 1,635,615 1,815,193 179,578 0.4067 0.4059 1.83
Evandale Primary School 160.2 156.8 -3.4 195,016 185,790 -9,226 347,371 333,425 -13,946 0.4051 0.4049 2.15
7
Department of Education Key Data 2016/2017
School Name2016
Students 1st Term FTE¹
2017 Students 1st
Term FTE¹
Variation 2017 to
2016 FTE¹
2016 Final FFM² $
2017 Final FFM²,5 $
Variation 2017 to 2016 $
2016 Final SRP3 $ at
31/12/2016
2017 Final SRP3 $
Variation 2017 to 2016 $
2015 OENI4 2016 OENI4 ARIA+
Exeter High School 339.4 302.4 -37.0 484,552 446,104 -38,448 824,511 833,009 8,498 0.5660 0.5587 2.53
Exeter Primary School 405.8 387.2 -18.6 546,019 535,318 -10,701 938,839 943,497 4,658 0.5268 0.5336 2.53
Fairview Primary School 361.2 352.6 -8.6 601,661 605,948 4,287 1,330,344 1,455,511 125,167 0.7141 0.7161 1.94
Flinders Island District High School 85.6 87.4 1.8 280,261 298,465 18,204 436,809 594,664 157,855 0.4500 0.4430 14.03
Forest Primary School 161.6 169.2 7.6 291,306 312,211 20,905 465,852 545,521 79,669 0.5488 0.4854 4.71
Forth Primary School 189.6 192.4 2.8 228,211 237,311 9,100 321,542 384,130 62,588 0.3877 0.3524 2.60
Franklin Primary School 103.2 106.8 3.6 165,408 184,111 18,703 341,060 385,444 44,384 0.5469 0.5637 2.86
Geeveston Primary School 61.8 61.6 -0.2 144,256 146,148 1,892 374,588 414,050 39,462 0.8085 0.7794 3.54
Glen Dhu Primary School 355.2 365.4 10.2 417,944 448,799 30,855 671,570 749,385 77,815 0.4587 0.4716 1.83
Glen Huon Primary School 125.4 136.6 11.2 181,514 199,391 17,877 317,335 346,124 28,789 0.5026 0.5054 2.93
Glenora District School 193.6 187.4 -6.2 344,183 336,182 -8,001 808,495 861,532 53,037 0.6745 0.6885 2.83
Glenorchy Primary School 354.4 349.2 -5.2 588,596 608,348 19,752 1,416,023 1,553,328 137,305 0.7696 0.7572 1.83
Goodwood Primary School 114.2 106.6 -7.6 196,453 185,724 -10,729 637,759 611,416 -26,343 0.6294 0.6528 1.83
Goulburn Street Primary School 231.6 242.0 10.4 243,183 259,088 15,905 383,627 411,911 28,284 0.2645 0.2760 1.83
Hagley Farm Primary School 375.6 362.6 -13.0 435,549 430,562 -4,987 898,331 927,721 29,390 0.3995 0.3863 2.45
8
Department of Education Key Data 2016/2017
School Name2016
Students 1st Term FTE¹
2017 Students 1st
Term FTE¹
Variation 2017 to
2016 FTE¹
2016 Final FFM² $
2017 Final FFM²,5 $
Variation 2017 to 2016 $
2016 Final SRP3 $ at
31/12/2016
2017 Final SRP3 $
Variation 2017 to 2016 $
2015 OENI4 2016 OENI4 ARIA+
Havenview Primary School 124.0 128.8 4.8 189,173 207,052 17,879 379,109 376,525 -2,584 0.6320 0.6185 2.70
Hellyer College 890.3 841.3 -49.0 1,022,546 994,998 -27,548 1,963,554 2,003,999 40,445 0.4883 0.4765 2.72
Hillcrest Primary School 225.4 212.8 -12.6 348,309 335,360 -12,949 886,728 892,114 5,386 0.6525 0.6358 2.37
Hobart College 1,092.7 1,102.3 9.6 1,063,467 1,102,193 38,726 2,476,755 2,481,336 4,581 0.3505 0.3384 1.83
Howrah Primary School 567.4 578.8 11.4 636,719 662,737 26,018 1,019,582 1,189,218 169,636 0.3304 0.3212 1.83
Huonville High School 476.7 424.4 -52.3 732,102 674,700 -57,402 1,406,841 1,792,376 385,535 0.6025 0.6144 2.50
Huonville Primary School 413.2 393.6 -19.6 593,627 578,633 -14,994 1,192,832 1,234,628 41,796 0.5724 0.5695 2.50
Illawarra Primary School 399.4 427.0 27.6 422,573 461,970 39,397 721,218 858,356 137,138 0.2661 0.2777 1.83
Invermay Primary School 281.8 289.0 7.2 447,532 473,237 25,705 791,605 837,302 45,697 0.6724 0.6220 1.83
JRLF – East Derwent Primary School 343.2 327.4 -15.8 580,318 569,882 -10,436 1,383,241 1,417,737 34,496 0.7748 0.7483 1.83
JRLF – Gagebrook Primary School 141.4 159.6 18.2 256,519 296,537 40,018 773,121 861,376 88,255 0.9005 0.8851 1.83
JRLF – Herdsmans Cove Primary School 156.0 161.8 5.8 281,602 296,385 14,783 760,912 768,812 7,900 0.7658 0.7708 1.83
JRLF – Senior School 337.6 343.0 5.4 603,214 639,519 36,305 1,580,779 1,812,490 231,711 0.8267 0.7906 1.83
Kempton Primary School 33.2 29.4 -3.8 69,922 65,421 -4,501 217,973 217,023 -950 0.6810 0.7241 2.82
King Island District High School 170.0 176.2 6.2 518,171 551,300 33,129 896,565 937,420 40,855 0.4979 0.4553 15.00

9
Department of Education Key Data 2016/2017
School Name2016
Students 1st Term FTE¹
2017 Students 1st
Term FTE¹
Variation 2017 to
2016 FTE¹
2016 Final FFM² $
2017 Final FFM²,5 $
Variation 2017 to 2016 $
2016 Final SRP3 $ at
31/12/2016
2017 Final SRP3 $
Variation 2017 to 2016 $
2015 OENI4 2016 OENI4 ARIA+
Kings Meadows High School 504.0 532.0 28.0 627,011 685,757 58,746 971,142 1,332,911 361,769 0.5174 0.5317 1.83
Kingston High School 714.0 710.0 -4.0 750,510 773,025 22,515 1,265,838 1,328,535 62,697 0.4029 0.3866 1.83
Kingston Primary School 388.2 382.4 -5.8 475,562 478,761 3,199 906,498 956,407 49,909 0.4895 0.4630 1.83
Lansdowne Crescent Primary School 388.2 411.4 23.2 399,646 439,328 39,682 675,890 762,416 86,526 0.2245 0.1878 1.83
Latrobe High School 412.6 408.1 -4.5 536,161 546,110 9,949 880,126 1,016,280 136,154 0.5239 0.4859 2.42
Latrobe Primary School 338.0 342.8 4.8 480,996 521,572 40,576 853,633 980,497 126,864 0.5651 0.5498 2.42
Lauderdale Primary School 598.4 618.0 19.6 660,542 695,883 35,341 1,042,158 1,143,069 100,911 0.3898 0.3833 1.83
Launceston Big Picture School 30.5 33.7 3.1 49,123 56,643 7,520 149,540 240,114 90,574 0.6324 0.4741 1.83
Launceston College 1,462.3 1,504.5 42.2 1,469,432 1,562,789 93,357 2,251,016 2,425,165 174,149 0.4524 0.4420 1.83
Lenah Valley Primary School 498.8 516.8 18.0 531,988 570,456 38,468 886,502 978,778 92,276 0.3069 0.3003 1.83
Lilydale District School 359.0 375.8 16.8 453,577 501,357 47,780 770,595 1,122,843 352,248 0.4788 0.4931 2.70
Lindisfarne North Primary School 293.0 301.0 8.0 327,380 353,261 25,881
639,192 709,640 70,448 0.4254 0.4352 1.83
Lindisfarne Primary School 312.2 324.4 12.2 345,561 365,699 20,138 611,926 661,633 49,707 0.3961 0.3624 1.83
Longford Primary School 238.6 231.6 -7.0 325,338 339,339 14,001 573,820 680,655 106,835 0.5457 0.5278 2.23
Margate Primary School 466.4 465.4 -1.0 513,461 514,414 953 921,486 1,007,852 86,366 0.3496 0.3633 1.95

10
Department of Education Key Data 2016/2017
School Name2016
Students 1st Term FTE¹
2017 Students 1st
Term FTE¹
Variation 2017 to
2016 FTE¹
2016 Final FFM² $
2017 Final FFM²,5 $
Variation 2017 to 2016 $
2016 Final SRP3 $ at
31/12/2016
2017 Final SRP3 $
Variation 2017 to 2016 $
2015 OENI4 2016 OENI4 ARIA+
Miandetta Primary School 306.2 323.6 17.4 381,602 416,408 34,806 578,725 651,055 72,330 0.4877 0.4642 2.39
Mole Creek Primary School 60.0 49.0 -11.0 110,114 96,475 -13,639 228,532 233,917 5,385 0.5571 0.5784 3.73
Molesworth Primary School 146.2 152.4 6.2 195,832 210,666 14,834 334,129 381,436 47,307 0.5102 0.5265 2.10
Montagu Bay Primary School 327.2 326.4 -0.8 347,771 342,406 -5,365 615,684 614,612 -1,072 0.2928 0.2889 1.83
Montello Primary School 307.2 334.2 27.0 490,914 553,936 63,022 1,028,287 1,166,609 138,322 0.6426 0.6779 2.72
Montrose Bay High School 605.6 590.6 -15.0 953,469 957,736 4,267 1,606,833 1,635,227 28,394 0.6314 0.6171 1.83
Moonah Primary School 275.0 271.4 -3.6 408,535 426,540 18,005 850,905 959,376 108,471 0.6227 0.6215 1.83
Mount Nelson Primary School 193.6 214.6 21.0 216,165 233,149 16,984 326,712 406,701 79,989 0.1578 0.1537 1.83
Mount Stuart Primary School 328.0 333.8 5.8 344,814 361,231 16,417 520,853 575,026 54,173 0.2785 0.1939 1.83
Mountain Heights School 207.0 200.2 -6.8 464,131 466,428 2,297 1,149,041 1,333,705 184,664 0.6548 0.6866 6.16
Mowbray Heights Primary School 457.8 485.2 27.4 709,618 778,851 69,233 1,342,992 1,396,146 53,154 0.6190 0.6357 1.83
Natone Primary School 36.0 30.2 -5.8 70,463 66,482 -3,981 139,953 150,051 10,098 0.5893 0.6786 3.14
New Norfolk High School 276.3 273.4 -2.9 452,765 467,065 14,300 941,973 1,162,578 220,605 0.6813 0.6770 1.94
New Norfolk Primary School 187.4 198.6 11.2 304,193 336,048 31,855 785,994 868,669 82,675 0.6419 0.6284 1.94
New Town High School 775.0 751.0 -24.0 865,293 863,594 -1,699 1,399,880 1,462,669 62,789 0.4604 0.4524 1.83

11
Department of Education Key Data 2016/2017
School Name2016
Students 1st Term FTE¹
2017 Students 1st
Term FTE¹
Variation 2017 to
2016 FTE¹
2016 Final FFM² $
2017 Final FFM²,5 $
Variation 2017 to 2016 $
2016 Final SRP3 $ at
31/12/2016
2017 Final SRP3 $
Variation 2017 to 2016 $
2015 OENI4 2016 OENI4 ARIA+
New Town Primary School 307.8 343.6 35.8 352,212 402,669 50,457 605,551 709,767 104,216 0.4009 0.3585 1.83
Newstead College 753.4 637.3 -116.1 952,887 830,653 -122,234 2,274,976 2,212,856 -62,120 0.5602 0.5463 1.83
Nixon Street Primary School 481.4 495.4 14.0 589,282 621,941 32,659 1,062,312 1,169,124 106,812 0.4942 0.5073 2.37
Norwood Primary School 468.0 470.6 2.6 505,379 516,011 10,632 819,622 845,786 26,164 0.3620 0.3634 1.83
Oatlands District High School 269.2 266.3 -2.9 473,570 492,054 18,484 1,030,911 1,323,947 293,036 0.6105 0.6114 4.55
Ogilvie High School 754.0 701.0 -53.0 880,973 863,033 -17,940 1,530,891 1,530,825 -66 0.5040 0.4946 1.83
Orford Primary School 76.2 68.0 -8.2 127,791 118,572 -9,219 216,607 228,196 11,589 0.4412 0.4125 4.29
Ouse District School 20.6 11.0 -9.6 59,873 40,503 -19,370 178,338 151,723 -26,615 0.6800 0.6923 4.38
Parklands High School 382.0 352.0 -30.0 577,608 557,514 -20,094 1,071,607 1,062,861 -8,746 0.6209 0.6430 2.72
Penguin District School 589.4 577.0 -12.4 721,761 716,869 -4,892 1,328,035 1,295,733 -32,302 0.4371 0.4353 2.76
Perth Primary School 233.4 232.8 -0.6 283,406 286,517 3,111 453,432 499,696 46,264 0.4648 0.4597 2.13
Port Dalrymple School 477.4 491.1 13.7 881,211 938,542 57,331 1,720,441 2,159,905 439,464 0.7332 0.7356 3.01
Port Sorell Primary School 304.0 282.2 -21.8 374,303 361,957 -12,346 522,605 550,362 27,757 0.4539 0.4051 2.63
Princes Street Primary School 356.0 375.2 19.2 362,123 392,952 30,829 581,599 650,272 68,673 0.1102 0.1371 1.83
Prospect High School 414.6 408.0 -6.6 493,176 512,569 19,393 994,513 905,452 -89,061 0.5071 0.5292 1.83

12
Department of Education Key Data 2016/2017
School Name2016
Students 1st Term FTE¹
2017 Students 1st
Term FTE¹
Variation 2017 to
2016 FTE¹
2016 Final FFM² $
2017 Final FFM²,5 $
Variation 2017 to 2016 $
2016 Final SRP3 $ at
31/12/2016
2017 Final SRP3 $
Variation 2017 to 2016 $
2015 OENI4 2016 OENI4 ARIA+
Punchbowl Primary School 326.4 318.2 -8.2 355,751 351,551 -4,200 590,245 649,918 59,673 0.3656 0.3578 1.83
Queechy High School 643.0 595.0 -48.0 812,119 777,664 -34,455 1,416,072 1,375,464 -40,608 0.5375 0.5359 1.83
Ravenswood Heights Primary School 279.2 302.4 23.2 487,694 535,921 48,227 1,221,858 1,269,770 47,912 0.7863 0.7772 1.83
Redpa Primary School 29.2 35.0 5.8 80,476 92,251 11,775 137,428 431,383 293,955 0.3438 0.3021 6.82
Reece High School 471.4 438.0 -33.4 648,009 622,886 -25,123 1,288,929 1,455,751 166,822 0.5899 0.5845 2.37
Riana Primary School 97.2 101.4 4.2 155,281 169,914 14,633 290,168 371,650 81,482 0.5471 0.5152 3.28
Richmond Primary School 236.8 252.8 16.0 280,149 299,208 19,059 455,565 499,114 43,549 0.3534 0.3738 2.40
Ridgley Primary School 100.0 109.6 9.6 163,907 190,136 26,229 285,958 332,734 46,776 0.5680 0.5901 3.17
Ringarooma Primary School 90.4 84.6 -5.8 148,615 146,467 -2,148 227,584 287,103 59,519 0.4968 0.4589 4.22
Risdon Vale Primary School 169.2 178.0 8.8 301,579 316,125 14,546 828,825 930,500 101,675 0.7764 0.7349 1.83
Riverside High School 711.0 727.0 16.0 710,402 748,464 38,062 983,944 1,043,261 59,317 0.3434 0.3347 1.83
Riverside Primary School 659.2 667.2 8.0 711,741 720,258 8,517 1,106,522 1,098,244 -8,278 0.3590 0.3385 1.83
Rokeby Primary School 236.8 218.2 -18.6 405,910 384,732 -21,178 938,309 1,000,741 62,432 0.7424 0.7429 1.83
Romaine Park Primary School 331.0 305.8 -25.2 512,279 485,349 -26,930 1,096,566 1,106,888 10,322 0.6280 0.6194 2.72
Rose Bay High School 724.0 709.0 -15.0 791,665 801,081 9,416 1,212,544 1,399,590 187,046 0.4508 0.4413 1.83

13
Department of Education Key Data 2016/2017
School Name2016
Students 1st Term FTE¹
2017 Students 1st
Term FTE¹
Variation 2017 to
2016 FTE¹
2016 Final FFM² $
2017 Final FFM²,5 $
Variation 2017 to 2016 $
2016 Final SRP3 $ at
31/12/2016
2017 Final SRP3 $
Variation 2017 to 2016 $
2015 OENI4 2016 OENI4 ARIA+
Rosebery District High School 90.8 70.2 -20.6 215,439 174,205 -41,234 677,626 714,147 36,521 0.7679 0.7188 5.25
Rosetta Primary School 415.2 450.6 35.4 515,889 580,901 65,012 909,775 1,039,496 129,721 0.5101 0.5068 1.83
Rosny College 1,133.2 1,058.9 -74.3 1,160,908 1,117,567 -43,341 2,456,238 2,563,620 107,382 0.4622 0.4425 1.83
Sandy Bay Infant School 63.8 74.6 10.8 86,206 102,430 16,224 157,060 210,828 53,768 0.2308 0.2898 1.83
Sassafras Primary School 53.0 54.4 1.4 87,415 91,130 3,715 204,479 217,451 12,972 0.5291 0.4583 2.75
Scottsdale High School 303.6 289.0 -14.6 451,737 446,146 -5,591 897,347 1,123,987 226,640 0.5202 0.5292 3.23
Scottsdale Primary School 300.0 291.8 -8.2 397,021 402,228 5,207 694,108 777,802 83,694 0.4707 0.4770 3.23
Sheffield School 489.0 480.2 - 8.8 703,273 712,100 8,827 1,373,635 1,647,244 273,609 0.5457 0.5410 2.76
Smithton High School 282.6 283.2 0.6 514,666 532,350 17,684 1,028,557 1,354,258 325,701 0.5653 0.5500 4.83
Smithton Primary School 171.8 183.0 11.2 310,914 343,226 32,312 729,909 754,854 24,945 0.5673 0.5844 4.83
Snug Primary School 342.8 334.2 -8.6 368,845 382,376 13,531 626,178 722,673 96,495 0.3689 0.3184 2.17
Somerset Primary School 329.8 365.6 35.8 430,345 480,923 50,578 666,154 760,976 94,822 0.5063 0.4845 2.77
Sorell School 723.6 762.6 39.0 1,063,907 1,150,693 86,786 2,074,687 2,450,654 375,967 0.5894 0.5618 1.99
South Arm Primary School 86.4 77.4 -9.0 112,205 105,615 -6,590 226,176 239,539 13,363 0.3844 0.3810 2.78
South George Town Primary School 267.4 260.4 -7.0 424,420 413,480 -10,940 758,070 761,117 3,047 0.5779 0.5714 3.01

14
Department of Education Key Data 2016/2017
School Name2016
Students 1st Term FTE¹
2017 Students 1st
Term FTE¹
Variation 2017 to
2016 FTE¹
2016 Final FFM² $
2017 Final FFM²,5 $
Variation 2017 to 2016 $
2016 Final SRP3 $ at
31/12/2016
2017 Final SRP3 $
Variation 2017 to 2016 $
2015 OENI4 2016 OENI4 ARIA+
South Hobart Primary School 357.2 372.0 14.8 383,783 395,185 11,402 597,021 603,117 6,096 0.2095 0.1514 1.83
Sprent Primary School 34.2 36.8 2.6 66,050 74,271 8,221 164,596 239,255 74,659 0.6121 0.6296 3.10
Spreyton Primary School 439.4 438.8 -0.6 480,865 505,023 24,158 789,785 880,510 90,725 0.4088 0.4270 2.38
Springfield Gardens Primary School 284.0 281.8 -2.2 454,750 451,915 -2,835 1,159,354 1,205,696 46,342 0.6770 0.6386 1.83
St Helens District High School 509.2 488.1 -21.1 867,893 875,164 7,271 1,600,642 1,859,266 258,624 0.5608 0.5829 5.07
St Leonards Primary School 239.4 252.6 13.2 345,903 367,733 21,830 625,091 687,537 62,446 0.5743 0.4925 1.83
St Marys District School 309.5 297.8 -11.7 612,122 605,816 -6,306 1,057,810 1,308,537 250,727 0.6477 0.6127 5.32
Stanley Primary School 52.8 54.0 1.2 104,900 107,429 2,529 153,966 163,036 9,070 0.4904 0.4516 5.10
Strahan Primary School 56.6 63.0 6.4 142,157 164,915 22,758 290,694 340,629 49,935 0.5319 0.5200 7.85
Summerdale Primary School 515.0 511.6 -3.4 656,641 657,546 905 1,252,693 1,299,608 46,915 0.5294 0.4975 1.83
Swansea Primary School 55.4 60.4 5.0 132,913 149,638 16,725 234,739 268,634 33,895 0.5444 0.5318 7.18
Table Cape Primary School 353.0 350.2 -2.8 544,809 554,363 9,554 1,080,163 1,147,781 67,618 0.5387 0.5320 3.03
Taroona High School 953.6 1,007.8 54.2 924,291 1,006,086 81,795 1,282,446 1,320,030 37,584 0.2122 0.2012 1.83
Taroona Primary School 377.2 365.4 -11.8 384,364 382,248 -2,116 581,986 614,155 32,169 0.1796 0.1890 1.83
Tasman District School 229.8 247.8 18.0 402,178 453,381 51,203 848,226 1,083,383 235,157 0.5388 0.5444 5.08

15
Department of Education Key Data 2016/2017
School Name2016
Students 1st Term FTE¹
2017 Students 1st
Term FTE¹
Variation 2017 to
2016 FTE¹
2016 Final FFM² $
2017 Final FFM²,5 $
Variation 2017 to 2016 $
2016 Final SRP3 $ at
31/12/2016
2017 Final SRP3 $
Variation 2017 to 2016 $
2015 OENI4 2016 OENI4 ARIA+
Tasmanian eSchool 50.0 61.8 11.8 250,749 324,991 74,242 593,099 838,298 245,199 0.5156 0.5053 1.83
Trevallyn Primary School 480.0 470.8 -9.2 508,609 503,846 -4,763 806,272 807,411 1,139 0.3058 0.3206 1.83
Triabunna District School 162.4 163.0 0.6 321,756 328,278 6,522 710,213 870,710 160,497 0.6480 0.6529 4.70
Ulverstone High School 443.0 501.5 58.5 580,260 668,264 88,004 1,067,296 1,433,378 366,082 0.5273 0.5232 2.63
Ulverstone Primary School 396.6 401.4 4.8 493,779 509,292 15,513 805,217 854,576 49,359 0.4826 0.4657 2.63
Waimea Heights Primary School 358.4 373.4 15.0 371,991 397,367 25,376 562,490 618,159 55,669 0.1491 0.1437 1.83
Warrane Primary School 159.4 175.8 16.4 276,626 312,359 35,733 925,024 1,018,255 93,231 0.7671 0.7205 1.83
Waverley Primary School 147.2 141.0 -6.2 253,641 246,513 -7,128 593,944 677,758 83,814 0.6797 0.7056 1.83
West Launceston Primary School 362.0 363.4 1.4 403,706 412,194 8,488 669,261 671,435 2,174 0.4180 0.3920 1.83
West Ulverstone Primary School 185.4 200.4 15.0 291,092 321,852 30,760 768,002 880,569 112,567 0.6490 0.6355 2.63
Westbury Primary School 103.6 104.0 0.4 154,279 154,696 417 248,136 292,021 43,885 0.4871 0.5000 2.53
Westerway Primary School 65.8 67.6 1.8 141,069 149,772 8,703 275,240 280,629 5,389 0.8158 0.7784 3.28
Wilmot Primary School 22.0 17.2 -4.8 57,901 48,914 -8,987 135,928 137,012 1,084 0.6765 0.6591 3.78
Windermere Primary School 478.4 492.0 13.6 744,139 791,332 47,193 1,370,121 1,521,190 151,069 0.5446 0.5530 1.83
Winnaleah District High School 116.8 98.0 -18.8 249,854 217,920 -31,934 570,514 553,302 -17,212 0.7303 0.7147 4.75

16
Department of Education Key Data 2016/2017
School Name2016
Students 1st Term FTE¹
2017 Students 1st
Term FTE¹
Variation 2017 to
2016 FTE¹
2016 Final FFM² $
2017 Final FFM²,5 $
Variation 2017 to 2016 $
2016 Final SRP3 $ at
31/12/2016
2017 Final SRP3 $
Variation 2017 to 2016 $
2015 OENI4 2016 OENI4 ARIA+
Woodbridge School 219.6 265.6 46.0 364,516 454,357 89,841 661,810 765,160 103,350 0.5232 0.4956 2.75
Wynyard High School 261.0 235.0 -26.0 377,472 348,146 -29,326 645,916 780,127 134,211 0.5349 0.5243 3.03
Yolla District High School 211.4 204.6 -6.8 338,060 321,216 -16,844 733,696 977,167 243,471 0.5733 0.5541 3.44
Youngtown Primary School 338.0 322.2 -15.8 415,864 407,538 -8,326 677,842 696,495 18,653 0.5057 0.5062 1.83
Zeehan Primary School 51.4 50.2 -1.2 137,919 141,570 3,651 260,119 294,174 34,055 0.7303 0.7083 6.49
1. FTE stands for Full Time Equivalent
2. FFM stands for Fairer Funding Model
3. SRP stands for School Resource Package. The 2017 Final SRP information is as at 19 April 2017 and is when the first term census and FFM funding calculations had been completed. There can be minor variations in the SRP throughout the course of the year for discrete funding items. The 2016 and 2017 SRP includes Microsoft Licence Fees which is a transactional element of the SRP (other transactional elements are excluded).
4. The OENI is updated in August each year for application in the following years’ SRP. To ensure that schools received a minimum 3% increase in the FFM in 2017 no negative adjustments were made as a result of needs ratings changes.
5. In 2017, there was also a decision to move all payments to schools into the SRP. This was done to provide improved visibility and transparency of the various funding components that schools receive from various Branches within the Department. That change is a significant contributor to the increase in 2017 SRP funding to schools with other key factors for the increase being new initiatives, additional funding for energy costs, additional funding due to an increase in student with disability enrolments and all funding for the Years 11–12 extension school initiative now provided through the SRP (some was previously through Approved Establishment Staffing).

17
Department of Education Key Data 2016/2017
Support School Resource Package Allocations – Fairer Funding Model Component
School Name2016
Students 1st Term FTE1
2017 Students 1st
Term FTE1
Variation 2017 to
2016 FTE1
2016 Final SRP2,5 $ at
31/12/2016
2017 Final SRP2 $
Variation 2017 to 2016 $
2015 OENI 2016 OENI ARIA+
Ashley School3 14.0 15.0 1.0 216,311 218,200 1,889 0.8929 0.9063 2.96
Early Childhood Intervention Service – Tasmania Burnie4 18.9 17.5 -1.4 249,605 265,629 16,024 0.5268 0.6471 2.72
Early Childhood Intervention Service – Tasmania Devonport4 24.6 21.7 -2.9 204,329 231,813 27,484 0.6689 0.6351 2.37
Early Childhood Intervention Service – Tasmania Hobart5 74.5 73.2 -1.3 735,911 817,630 81,719 0.5308 0.4927 1.83
Early Childhood Intervention Service – Tasmania Launceston4 32.9 38.0 5.1 322,952 384,768 61,816 0.6550 0.6393 1.83
Northern Support School5 91.8 87.8 -4.0 2,149,837 2,295,971 146,134 0.6218 0.6250 1.83
School of Special Education North West5 73.5 84.4 10.9 1,726,000 2,151,839 425,839 0.6739 0.6364 2.72
Southern Support School5 85.5 85.6 0.1 2,071,204 2,346,922 275,718 0.5404 0.5035 1.83
1. FTE stands for Full Time Equivalent
2. SRP stands for School Resource Package. The 2017 Final SRP information is as at 19 April 2017. There can be minor variations in the SRP throughout the course of the year for discrete funding items. The 2016 and 2017 SRP includes Microsoft Licence Fees which is a transactional element of the SRP (other transactional elements are excluded).
3. Ashley School is resourced using an agreed FTE and this may differ to the First Term census.
4. Early Childhood Intervention Services are resourced in the SRP using August enrolments.
5. The 2016 Final SRP may vary for some schools to that reported in the 2015–2016 Key Data Report due to movements in funding since the 2015–2016 data was prepared in May 2016 and this reported date of 31 December 2016. The 2016–2017 Final SRP data was prepared as at 19 April 2017.

18
Department of Education Key Data 2016/2017
Senior Secondary Enrolments by School
2016 2017
11 12 13 Adult Total 11 12 13 Total
School Name Headcount FTE Headcount FTE Headcount FTE Headcount FTE Headcount FTE Headcount FTE Headcount FTE Headcount FTE Headcount FTE
College
Claremont College 322 313.6 272 266.9 19 19.0 - - 613 599.6 276 271.1 253 246.3 16 14.6 545 531.9
Don College 547 541.9 436 430.1 4 4.0 1 0.8 988 976.9 532 522.2 418 404.4 5 4.2 955 930.8
Elizabeth College 587 577.1 452 441.9 12 10.8 - - 1051 1029.9 547 538.6 502 496.0 11 5.7 1060 1040.3
Hellyer College 482 476.7 410 405.8 6 6.0 2 1.8 900 890.3 462 453.9 387 380.4 7 7.0 856 841.3
Hobart College 573 569.3 515 507.9 16 15.6 - - 1104 1092.7 569 565.3 527 522.7 16 14.3 1112 1102.3
Launceston College 853 850.2 607 605.1 7 7.0 - - 1467 1462.3 810 796.0 706 696.8 13 11.7 1529 1504.5
Newstead College 432 412.6 355 324.8 18 13.8 3 2.2 808 753.4 335 306.1 360 325.4 9 5.8 704 637.3
Rosny College 613 607.7 517 503.5 26 22.0 - - 1156 1133.2 567 548.2 509 492.1 23 18.6 1099 1058.9
Secondary/Combined
Deloraine High School 5 5.0 - - - - - - 5 5.0 4 2.4 5 3.2 - - 9 5.6
Flinders Island District High School 1 1.0 - - - - - - 1 1.0 - - 1 1.0 - - 1 1.0
Launceston Big Picture School 6 5.8 12 11.8 - - - - 18 17.5 7 4.9 4 2.7 - - 11 7.7
Tasmanian eSchool - - - - - - - - - - - - 1 1.0 - - 1 1.0

19
Department of Education Key Data 2016/2017
2016 2017
11 12 13 Adult Total 11 12 13 Total
School Name Headcount FTE Headcount FTE Headcount FTE Headcount FTE Headcount FTE Headcount FTE Headcount FTE Headcount FTE Headcount FTE
Secondary/Combined 2015 Extension Schools
Huonville High School 54 50.6 47 43.1 2 2.0 - - 103 95.7 44 41.2 34 32.2 2 2.0 80 75.4
Scottsdale High School 19 18.8 19 18.8 1 1.0 - - 39 38.6 26 26.0 12 12.0 1 1.0 39 39.0
Smithton High School 20 18.7 20 19.1 - - - - 40 37.8 29 28.5 18 16.8 - - 47 45.4
St Helens District High School 32 30.6 28 22.0 5 3.9 - - 65 56.6 20 18.1 18 14.0 2 1.2 40 33.3
St Marys District School - - - - - - - - - - 12 2.4 6 1.2 - - 18 3.6
Secondary/Combined 2016 Extension Schools
Campbell Town District High School 5 3.8 4 3.2 - - - - 9 7.0 15 11.4 3 2.0 - - 18 13.4
Mountain Heights School 11 11.0 3 3.0 - - - - 14 14.0 13 13.0 8 7.8 - - 21 20.8
New Norfolk High School 17 13.3 - - - - - - 17 13.3 19 17.9 8 7.8 1 0.8 28 26.4
Rosebery District High School 1 1.0 4 4.0 - - - - 5 5.0 2 1.8 - - - - 2 1.8
Tasman District School 1 1.0 1 1.0 - - - - 2 2.0 7 5.7 2 1.5 - - 9 7.2

20
Department of Education Key Data 2016/2017
2016 2017
11 12 13 Adult Total 11 12 13 Total
School Name Headcount FTE Headcount FTE Headcount FTE Headcount FTE Headcount FTE Headcount FTE Headcount FTE Headcount FTE Headcount FTE
Secondary/Combined 2017 Extension Schools
Bayview Secondary College - - - - - - - - - - 22 12.3 4 1.9 1 0.5 27 14.6
Burnie High School - - - - - - - - - - 11 10.8 - - - - 11 10.8
Campania District School - - - - - - - - - - 2 1.8 - - - - 2 1.8
Clarence High School - - - - - - - - - - 3 3.0 5 4.7 - - 8 7.7
Cressy District High School - - - - - - - - - - 9 7.3 - - - - 9 7.3
Devonport High School - - - - - - - - - - 1 1.0 - - - - 1 1.0
JRLF – Senior School 34 32.3 38 35.5 6 5.6 - - 78 73.4 51 50.3 29 28.7 9 9.0 89 88.0
Latrobe High School - - - - - - - - - - 1 0.5 - - - - 1 0.5
Lilydale District School 18 9.7 9 6.5 5 4.0 - - 32 20.2 22 9.5 16 8.1 - - 38 17.6
Oatlands District High School - - - - - - - - - - 7 6.3 - - - - 7 6.3
Port Dalrymple School - - - - - - - - - - 11 9.5 3 2.6 - - 14 12.1
Reece High School - - - - - - - - - - 3 3.0 - - - - 3 3.0
Rose Bay High School - - - - - - - - - - 7 7.0 - - - - 7 7.0

21
Department of Education Key Data 2016/2017
2016 2017
11 12 13 Adult Total 11 12 13 Total
School Name Headcount FTE Headcount FTE Headcount FTE Headcount FTE Headcount FTE Headcount FTE Headcount FTE Headcount FTE Headcount FTE
Sheffield School - - - - - - - - - - 18 13.0 7 3.6 - - 25 16.6
Sorell School - - - - - - - - - - 32 18.3 21 12.4 2 1.3 55 32.0
Ulverstone High School - - - - - - - - - - 51 48.5 16 15.2 1 0.5 68 64.1
Yolla District High School - - - - - - - - - - 15 6.5 11 4.9 - - 26 11.4
Notes relating to student enrolments:
This data is taken from First Term census.
School names reflect the most recent name. Does not include support schools.
School counts include students studying at more than one school. Therefore, the sum of students by school is greater than the total for “all schools”.
Student enrolment full-time equivalent (FTE) is calculated to six decimals but displayed to one decimal. Components may not add to totals due to rounding.

22
Department of Education Key Data 2016/2017
Student Assistance Scheme (STAS)The Student Assistance Scheme (STAS) provides assistance for low-income families towards the cost of levies for students enrolled from Kindergarten through to Year 12. The provision of assistance within non-government schools is in accordance with procedures as determined by Independent and Catholic Schools.From 2014, funding for the State Government Student Assistance Scheme is incorporated into the overall Students First funding pool and distributed to schools as part of the new needs based funding arrangements.
Number of students receiving STAS Assistance (including proportion across education sectors):
STAS 2016 to 31 Dec 2017 at 31 March
Government 23,938 (96.9%)
22,35397.20%
Non-Government 7503.04%
6372.80%
Total 24,688 22,990

23
Department of Education Key Data 2016/2017
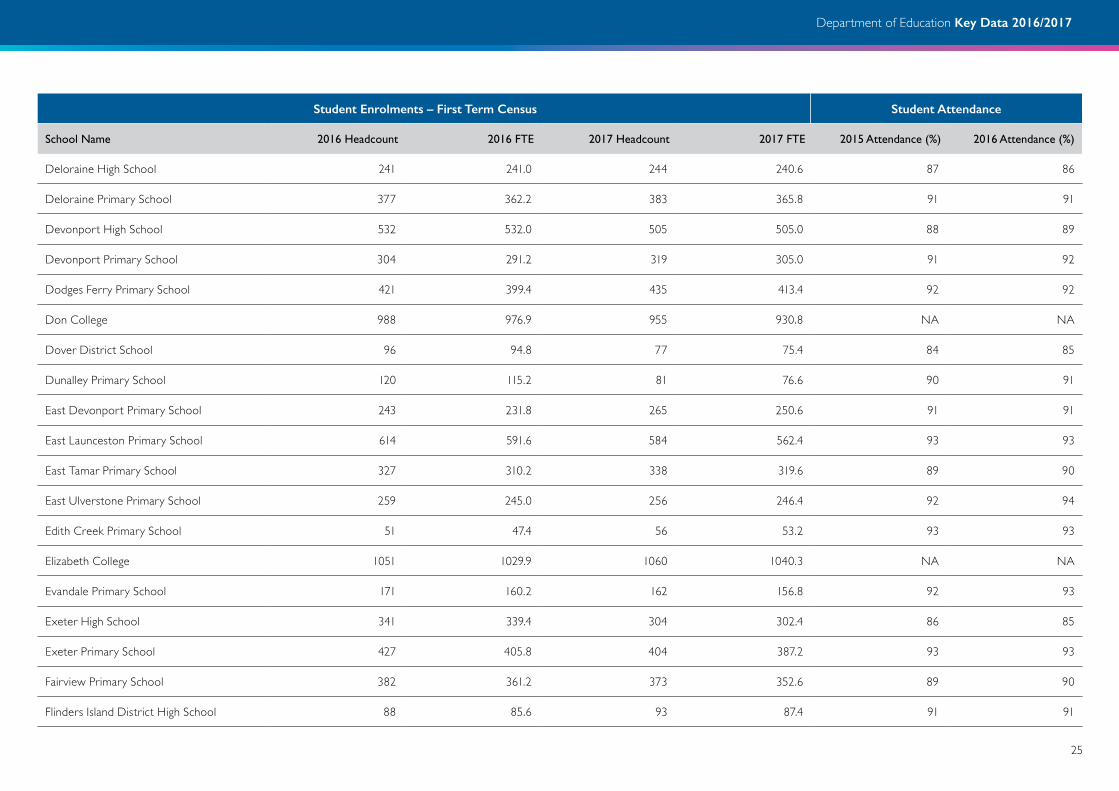
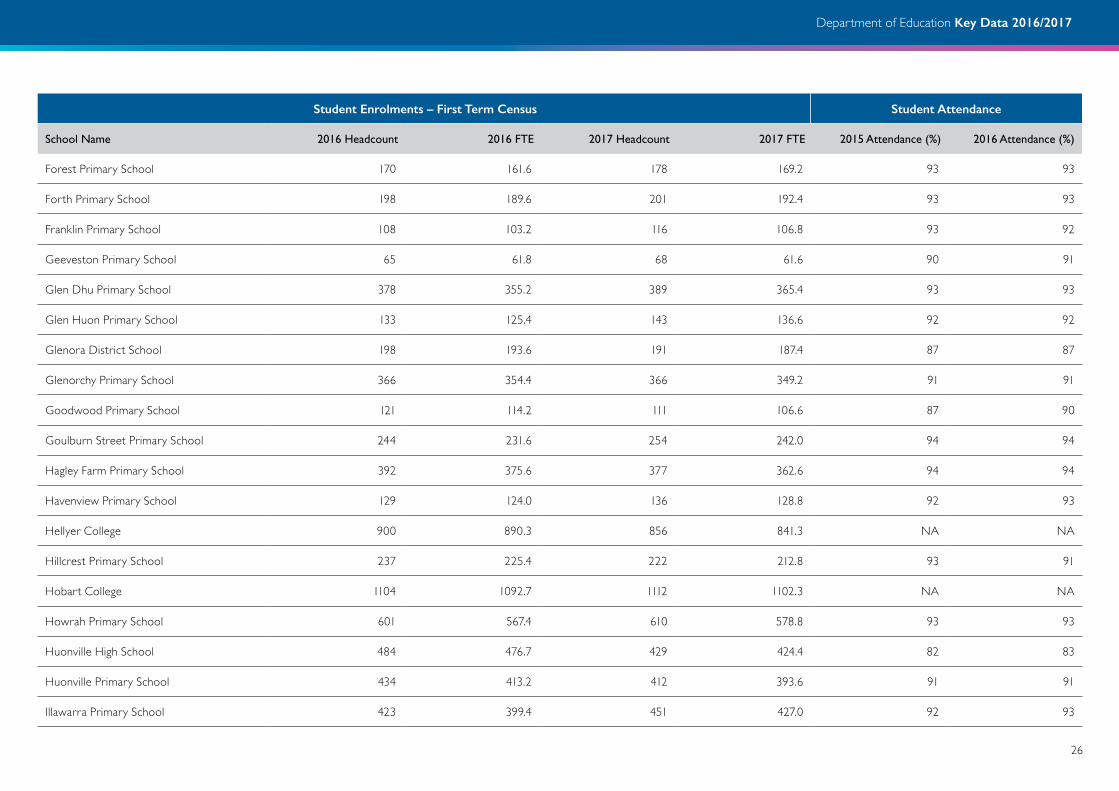
Student Enrolments and Attendance by SchoolNotes relating to student enrolments:
School names reflect the most recent name.School counts include students studying at more than one school. Therefore, the sum of students by school is greater than the total for “all schools”.
Student enrolment full-time equivalent (FTE) is calculated to six decimals but displayed to one decimal. Components may not add to totals due to rounding.
Student Enrolments – First Term Census Student Attendance
School Name 2016 Headcount 2016 FTE 2017 Headcount 2017 FTE 2015 Attendance (%) 2016 Attendance (%)
Albuera Street Primary School 276 263.4 277 264.0 93 93
Andrews Creek Primary School 161 152.8 163 154.4 95 94
Austins Ferry Primary School 496 470.4 540 512.4 90 91
Avoca Primary School 22 21.6 23 21.8 93 89
Bagdad Primary School 137 129.8 148 138.8 93 93
Bayview Secondary College 171 171.0 232 219.6 76 74
Beaconsfield Primary School 269 253.2 270 261.2 92 93
Bellerive Primary School 489 460.6 498 476.0 93 94
Bicheno Primary School 94 87.2 92 89.2 93 94
Blackmans Bay Primary School 291 277.4 292 276.0 93 93
Boat Harbour Primary School 262 248.8 270 257.4 92 93
Bothwell District High School 87 84.6 77 73.8 89 89
Bowen Road Primary School 276 263.2 286 273.6 93 93
Bracknell Primary School 59 57.4 58 55.6 94 95

24
Department of Education Key Data 2016/2017
Student Enrolments – First Term Census Student Attendance
School Name 2016 Headcount 2016 FTE 2017 Headcount 2017 FTE 2015 Attendance (%) 2016 Attendance (%)
Bridport Primary School 177 167.4 182 173.2 92 93
Brighton Primary School 605 572.4 608 574.2 91 92
Brooks High School 465 464.0 433 433.0 79 81
Bruny Island District School 48 45.6 41 40.2 90 92
Burnie High School 545 545.0 527 526.2 90 90
Burnie Primary School 365 349.4 378 359.6 94 94
Cambridge Primary School 357 336.6 367 347.8 93 95
Campania District School 179 175.4 184 179.8 87 88
Campbell Street Primary School 269 253.4 267 253.4 93 92
Campbell Town District High School 209 200.6 216 203.0 92 88
Cape Barren Island School 3 3.0 6 5.6 95 91
Claremont College 613 599.6 545 531.9 NA NA
Clarence High School 509 508.0 470 468.9 87 86
Clarendon Vale Primary School 122 115.6 120 113.6 90 89
Collinsvale Primary School 50 46.8 47 44.6 92 94
Cooee Primary School 166 155.6 159 150.6 92 92
Cosgrove High School 224 223.4 189 188.4 73 74
Cressy District High School 343 331.0 317 310.9 91 90
Cygnet Primary School 221 211.4 208 197.6 90 90
25
Department of Education Key Data 2016/2017
Student Enrolments – First Term Census Student Attendance
School Name 2016 Headcount 2016 FTE 2017 Headcount 2017 FTE 2015 Attendance (%) 2016 Attendance (%)
Deloraine High School 241 241.0 244 240.6 87 86
Deloraine Primary School 377 362.2 383 365.8 91 91
Devonport High School 532 532.0 505 505.0 88 89
Devonport Primary School 304 291.2 319 305.0 91 92
Dodges Ferry Primary School 421 399.4 435 413.4 92 92
Don College 988 976.9 955 930.8 NA NA
Dover District School 96 94.8 77 75.4 84 85
Dunalley Primary School 120 115.2 81 76.6 90 91
East Devonport Primary School 243 231.8 265 250.6 91 91
East Launceston Primary School 614 591.6 584 562.4 93 93
East Tamar Primary School 327 310.2 338 319.6 89 90
East Ulverstone Primary School 259 245.0 256 246.4 92 94
Edith Creek Primary School 51 47.4 56 53.2 93 93
Elizabeth College 1051 1029.9 1060 1040.3 NA NA
Evandale Primary School 171 160.2 162 156.8 92 93
Exeter High School 341 339.4 304 302.4 86 85
Exeter Primary School 427 405.8 404 387.2 93 93
Fairview Primary School 382 361.2 373 352.6 89 90
Flinders Island District High School 88 85.6 93 87.4 91 91
26
Department of Education Key Data 2016/2017
Student Enrolments – First Term Census Student Attendance
School Name 2016 Headcount 2016 FTE 2017 Headcount 2017 FTE 2015 Attendance (%) 2016 Attendance (%)
Forest Primary School 170 161.6 178 169.2 93 93
Forth Primary School 198 189.6 201 192.4 93 93
Franklin Primary School 108 103.2 116 106.8 93 92
Geeveston Primary School 65 61.8 68 61.6 90 91
Glen Dhu Primary School 378 355.2 389 365.4 93 93
Glen Huon Primary School 133 125.4 143 136.6 92 92
Glenora District School 198 193.6 191 187.4 87 87
Glenorchy Primary School 366 354.4 366 349.2 91 91
Goodwood Primary School 121 114.2 111 106.6 87 90
Goulburn Street Primary School 244 231.6 254 242.0 94 94
Hagley Farm Primary School 392 375.6 377 362.6 94 94
Havenview Primary School 129 124.0 136 128.8 92 93
Hellyer College 900 890.3 856 841.3 NA NA
Hillcrest Primary School 237 225.4 222 212.8 93 91
Hobart College 1104 1092.7 1112 1102.3 NA NA
Howrah Primary School 601 567.4 610 578.8 93 93
Huonville High School 484 476.7 429 424.4 82 83
Huonville Primary School 434 413.2 412 393.6 91 91
Illawarra Primary School 423 399.4 451 427.0 92 93

27
Department of Education Key Data 2016/2017
Student Enrolments – First Term Census Student Attendance
School Name 2016 Headcount 2016 FTE 2017 Headcount 2017 FTE 2015 Attendance (%) 2016 Attendance (%)
Invermay Primary School 295 281.8 303 289.0 92 92
JRLF – East Derwent Primary School 358 343.2 345 327.4 89 90
JRLF – Gagebrook Primary School 149 141.4 168 159.6 86 89
JRLF – Herdsmans Cove Primary School 166 156.0 169 161.8 87 87
JRLF – Senior School 343 337.6 344 343.0 73 71
Kempton Primary School 34 33.2 31 29.4 90 89
King Island District High School 178 170.0 185 176.2 92 92
Kings Meadows High School 504 504.0 532 532.0 88 87
Kingston High School 714 714.0 710 710.0 86 88
Kingston Primary School 411 388.2 404 382.4 91 91
Lansdowne Crescent Primary School 407 388.2 433 411.4 93 93
Latrobe High School 413 412.6 409 408.1 91 91
Latrobe Primary School 350 338.0 364 342.8 93 93
Lauderdale Primary School 636 598.4 654 618.0 93 93
Launceston Big Picture School 31 30.5 37 33.7 60 63
Launceston College 1467 1462.3 1529 1504.5 NA NA
Lenah Valley Primary School 528 498.8 550 516.8 93 94
Lilydale District School 382 359.0 409 375.8 90 91
Lindisfarne North Primary School 309 293.0 319 301.0 93 92

28
Department of Education Key Data 2016/2017
Student Enrolments – First Term Census Student Attendance
School Name 2016 Headcount 2016 FTE 2017 Headcount 2017 FTE 2015 Attendance (%) 2016 Attendance (%)
Lindisfarne Primary School 331 312.2 342 324.4 94 94
Longford Primary School 251 238.6 250 231.6 92 92
Margate Primary School 496 466.4 487 465.4 92 93
Miandetta Primary School 323 306.2 342 323.6 93 94
Mole Creek Primary School 62 60.0 51 49.0 92 91
Molesworth Primary School 155 146.2 160 152.4 91 91
Montagu Bay Primary School 346 327.2 338 326.4 93 94
Montello Primary School 325 307.2 355 334.2 90 90
Montrose Bay High School 606 605.6 591 590.6 80 80
Moonah Primary School 287 275.0 289 271.4 90 91
Mount Nelson Primary School 208 193.6 227 214.6 91 93
Mount Stuart Primary School 346 328.0 353 333.8 93 94
Mountain Heights School 209 207.0 205 200.2 85 85
Mowbray Heights Primary School 481 457.8 512 485.2 92 92
Natone Primary School 38 36.0 31 30.2 93 93
New Norfolk High School 280 276.3 275 273.4 81 80
New Norfolk Primary School 195 187.4 209 198.6 89 89
New Town High School 775 775.0 751 751.0 86 87
New Town Primary School 327 307.8 364 343.6 92 92

29
Department of Education Key Data 2016/2017
Student Enrolments – First Term Census Student Attendance
School Name 2016 Headcount 2016 FTE 2017 Headcount 2017 FTE 2015 Attendance (%) 2016 Attendance (%)
Newstead College 808 753.4 704 637.3 NA NA
Nixon Street Primary School 510 481.4 520 495.4 93 93
Norwood Primary School 492 468.0 491 470.6 93 93
Oatlands District High School 272 269.2 273 266.3 90 91
Ogilvie High School 754 754.0 701 701.0 86 87
Orford Primary School 79 76.2 70 68.0 95 95
Ouse District School 21 20.6 11 11.0 88 92
Parklands High School 382 382.0 352 352.0 85 84
Penguin District School 607 589.4 593 577.0 91 90
Perth Primary School 247 233.4 244 232.8 94 95
Port Dalrymple School 487 477.4 509 491.1 88 89
Port Sorell Primary School 318 304.0 297 282.2 93 93
Princes Street Primary School 372 356.0 392 375.2 93 93
Prospect High School 415 414.6 408 408.0 87 89
Punchbowl Primary School 346 326.4 335 318.2 94 94
Queechy High School 643 643.0 595 595.0 85 84
Ravenswood Heights Primary School 296 279.2 316 302.4 90 89
Redpa Primary School 32 29.2 37 35.0 95 92
Reece High School 472 471.4 438 438.0 86 86

30
Department of Education Key Data 2016/2017
Student Enrolments – First Term Census Student Attendance
School Name 2016 Headcount 2016 FTE 2017 Headcount 2017 FTE 2015 Attendance (%) 2016 Attendance (%)
Riana Primary School 102 97.2 109 101.4 94 94
Richmond Primary School 252 236.8 266 252.8 92 93
Ridgley Primary School 105 100.0 117 109.6 92 92
Ringarooma Primary School 94 90.4 89 84.6 94 95
Risdon Vale Primary School 180 169.2 184 178.0 90 91
Riverside High School 711 711.0 727 727.0 89 89
Riverside Primary School 696 659.2 694 667.2 93 93
Rokeby Primary School 248 236.8 229 218.2 91 91
Romaine Park Primary School 349 331.0 322 305.8 91 91
Rose Bay High School 724 724.0 709 709.0 85 85
Rosebery District High School 94 90.8 72 70.2 85 83
Rosetta Primary School 438 415.2 477 450.6 92 92
Rosny College 1156 1133.2 1099 1058.9 NA NA
Sandy Bay Infant School 73 63.8 85 74.6 93 92
Sassafras Primary School 57 53.0 58 54.4 96 93
Scottsdale High School 304 303.6 289 289.0 89 90
Scottsdale Primary School 312 300.0 307 291.8 93 93
Sheffield School 501 489.0 503 480.2 90 90
Smithton High School 286 282.6 286 283.2 87 86

31
Department of Education Key Data 2016/2017
Student Enrolments – First Term Census Student Attendance
School Name 2016 Headcount 2016 FTE 2017 Headcount 2017 FTE 2015 Attendance (%) 2016 Attendance (%)
Smithton Primary School 183 171.8 193 183.0 90 92
Snug Primary School 354 342.8 351 334.2 93 92
Somerset Primary School 351 329.8 384 365.6 94 94
Sorell School 742 723.6 804 762.6 87 89
South Arm Primary School 90 86.4 81 77.4 91 93
South George Town Primary School 283 267.4 270 260.4 92 92
South Hobart Primary School 382 357.2 390 372.0 91 92
Sprent Primary School 35 34.2 38 36.8 92 90
Spreyton Primary School 456 439.4 459 438.8 94 94
Springfield Gardens Primary School 300 284.0 291 281.8 90 90
St Helens District High School 536 509.2 508 488.1 88 88
St Leonards Primary School 255 239.4 265 252.6 93 93
St Marys District School 318 309.5 319 297.8 89 88
Stanley Primary School 56 52.8 56 54.0 95 95
Strahan Primary School 59 56.6 69 63.0 90 90
Summerdale Primary School 546 515.0 537 511.6 93 93
Swansea Primary School 57 55.4 64 60.4 94 94
Table Cape Primary School 373 353.0 369 350.2 93 93
Taroona High School 954 953.6 1009 1007.8 89 90

32
Department of Education Key Data 2016/2017
Student Enrolments – First Term Census Student Attendance
School Name 2016 Headcount 2016 FTE 2017 Headcount 2017 FTE 2015 Attendance (%) 2016 Attendance (%)
Taroona Primary School 394 377.2 381 365.4 92 93
Tasman District School 234 229.8 256 247.8 87 88
Tasmanian eSchool 50 50.0 63 61.8 NA NA
Trevallyn Primary School 508 480.0 492 470.8 93 93
Triabunna District School 167 162.4 166 163.0 91 92
Ulverstone High School 443 443.0 506 501.5 89 88
Ulverstone Primary School 417 396.6 420 401.4 93 94
Waimea Heights Primary School 378 358.4 393 373.4 94 94
Warrane Primary School 167 159.4 185 175.8 90 89
Waverley Primary School 160 147.2 150 141.0 90 90
West Launceston Primary School 382 362.0 381 363.4 93 94
West Ulverstone Primary School 195 185.4 210 200.4 93 94
Westbury Primary School 112 103.6 110 104.0 93 93
Westerway Primary School 69 65.8 70 67.6 87 90
Wilmot Primary School 24 22.0 18 17.2 91 93
Windermere Primary School 502 478.4 518 492.0 91 91
Winnaleah District High School 120 116.8 100 98.0 91 91
Woodbridge School 224 219.6 272 265.6 88 89
Wynyard High School 261 261.0 235 235.0 83 85

33
Department of Education Key Data 2016/2017
Student Enrolments – First Term Census Student Attendance
School Name 2016 Headcount 2016 FTE 2017 Headcount 2017 FTE 2015 Attendance (%) 2016 Attendance (%)
Yolla District High School 221 211.4 224 204.6 90 88
Youngtown Primary School 354 338.0 337 322.2 92 92
Zeehan Primary School 53 51.4 53 50.2 92 92
From 2014 attendance figures include half day absences and suspension as absences to align with the National Standards for Student Attendance Report.
Previous to 2015 the Launceston Big Picture School was known as Kings Meadows High School – City Campus.
Attendance data is not recorded for colleges.
Attendance data is not recorded for the Tasmanian eSchool.

34
Department of Education Key Data 2016/2017
Support School Enrolments and Attendance by School
School Name 2016 Headcount
2016 FTE
2017 Headcount
2017 FTE
2015 Attendance (%)
2016 Attendance (%)
Ashley School 14 14.0 15 15.0 NA NA
Early Childhood Intervention Service – Tasmania Burnie 54 18.9 49 17.5 NA NA
Early Childhood Intervention Service – Tasmania Devonport 73 24.6 63 21.7 NA NA
Early Childhood Intervention Service – Tasmania Hobart 215 74.5 208 73.2 NA NA
Early Childhood Intervention Service – Tasmania Launceston 96 32.9 107 38.0 NA NA
Northern Support School 99 91.8 96 87.8 87 87
School of Special Education North West 85 73.5 94 84.4 86 88
Southern Support School 97 85.5 100 85.6 87 88
From 2014 attendance figures include half day absences and suspension as absences to align with the National Standards for Student Attendance Report.
Attendance data is not recorded for Ashley or the Early Childhood Intervention Services.
35
Department of Education Key Data 2016/2017
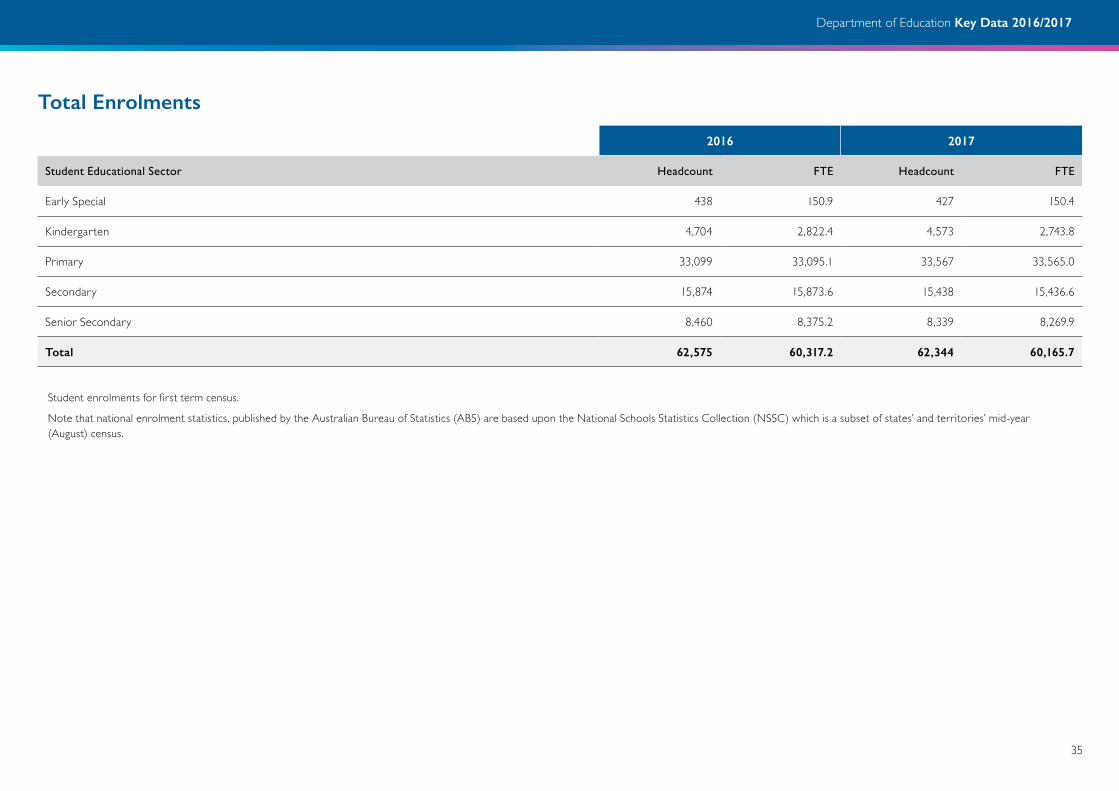
Total Enrolments
2016 2017
Student Educational Sector Headcount FTE Headcount FTE
Early Special 438 150.9 427 150.4
Kindergarten 4,704 2,822.4 4,573 2,743.8
Primary 33,099 33,095.1 33,567 33,565.0
Secondary 15,874 15,873.6 15,438 15,436.6
Senior Secondary 8,460 8,375.2 8,339 8,269.9
Total 62,575 60,317.2 62,344 60,165.7
Student enrolments for first term census.
Note that national enrolment statistics, published by the Australian Bureau of Statistics (ABS) are based upon the National Schools Statistics Collection (NSSC) which is a subset of states’ and territories’ mid-year (August) census.

36
Department of Education Key Data 2016/2017
Student Enrolments – First term census
2016 2017
Gender Headcount FTE Headcount FTE
Female 30,133 48.2% 30,115 48.3%
Male 32,442 51.8% 32,229 51.7%
Total 62,575 100.0% 62,344 100.0%
2016 2017
Headcount FTE Headcount FTE
Aboriginal & Torres Strait Islander 6,088 9.7% 6,234 10.0%
Non-Aboriginal & Torres Strait Islander 56,487 90.3% 56,110 90.0%
Total 62,575 100.0% 62,344 100.0%
A student is considered to be ‘Indigenous’ if he or she identifies as being of Aboriginal and/or Torres Strait Islander origin. The term ‘origin’ is considered to relate to people’s Australian Aboriginal or Torres Strait Islander descent and for some, but not all, their cultural identity. This information is collected from student’s parents or guardians via enrolment forms for students.
2016 2017
Headcount FTE Headcount FTE
Language Background Other Than English 3,058 4.9% 3,333 5.3%
Non-Language Background Other Than English 59,517 95.1% 59,011 94.7%
Total 62,575 100.0% 62,344 100.0%
A student is considered to have a Language Background Other than English (LBOTE) if either the student or a parent/guardian speaks a language other than English at home. Non-LBOTE students includes some students for which status is not stated. This information is collected from students’ parents (or guardians) via enrolment forms.
37
Department of Education Key Data 2016/2017
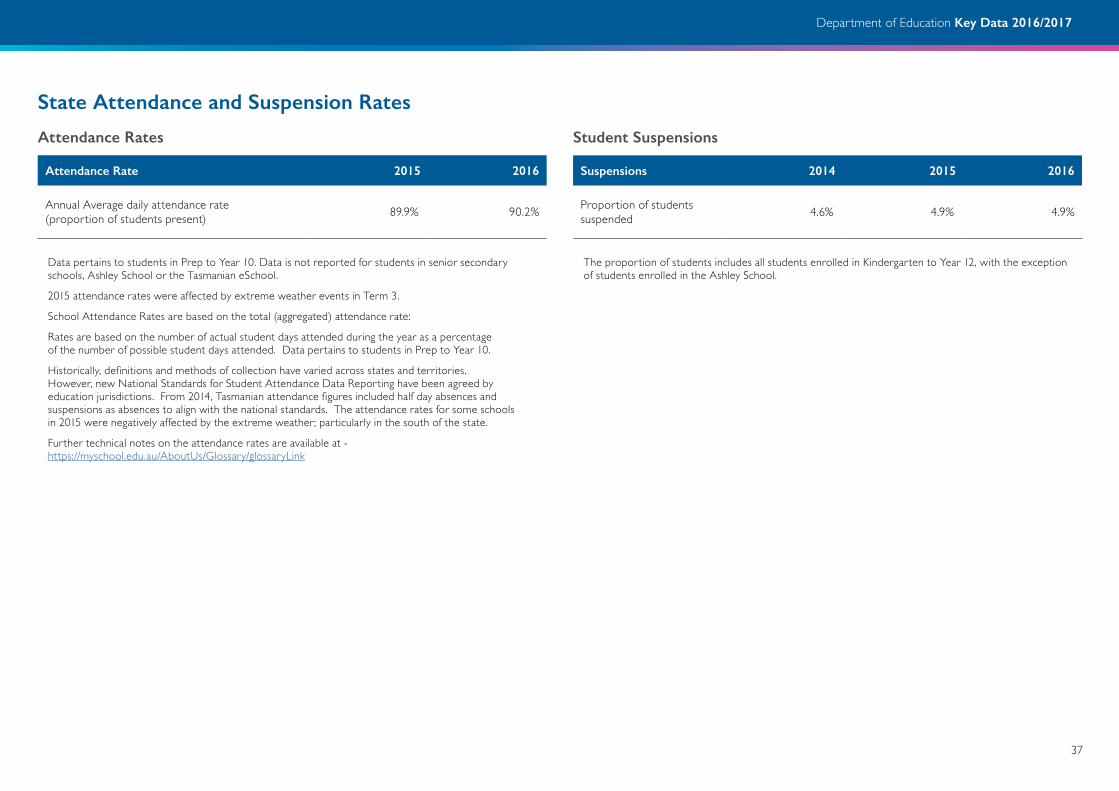
State Attendance and Suspension Rates
Attendance Rates
Attendance Rate 2015 2016
Annual Average daily attendance rate (proportion of students present) 89.9% 90.2%
Data pertains to students in Prep to Year 10. Data is not reported for students in senior secondary schools, Ashley School or the Tasmanian eSchool.
2015 attendance rates were affected by extreme weather events in Term 3.
School Attendance Rates are based on the total (aggregated) attendance rate:
Rates are based on the number of actual student days attended during the year as a percentage of the number of possible student days attended. Data pertains to students in Prep to Year 10.
Historically, definitions and methods of collection have varied across states and territories. However, new National Standards for Student Attendance Data Reporting have been agreed by education jurisdictions. From 2014, Tasmanian attendance figures included half day absences and suspensions as absences to align with the national standards. The attendance rates for some schools in 2015 were negatively affected by the extreme weather; particularly in the south of the state.
Further technical notes on the attendance rates are available at - https://myschool.edu.au/AboutUs/Glossary/glossaryLink
Student Suspensions
Suspensions 2014 2015 2016
Proportion of students suspended 4.6% 4.9% 4.9%
The proportion of students includes all students enrolled in Kindergarten to Year 12, with the exception of students enrolled in the Ashley School.
38
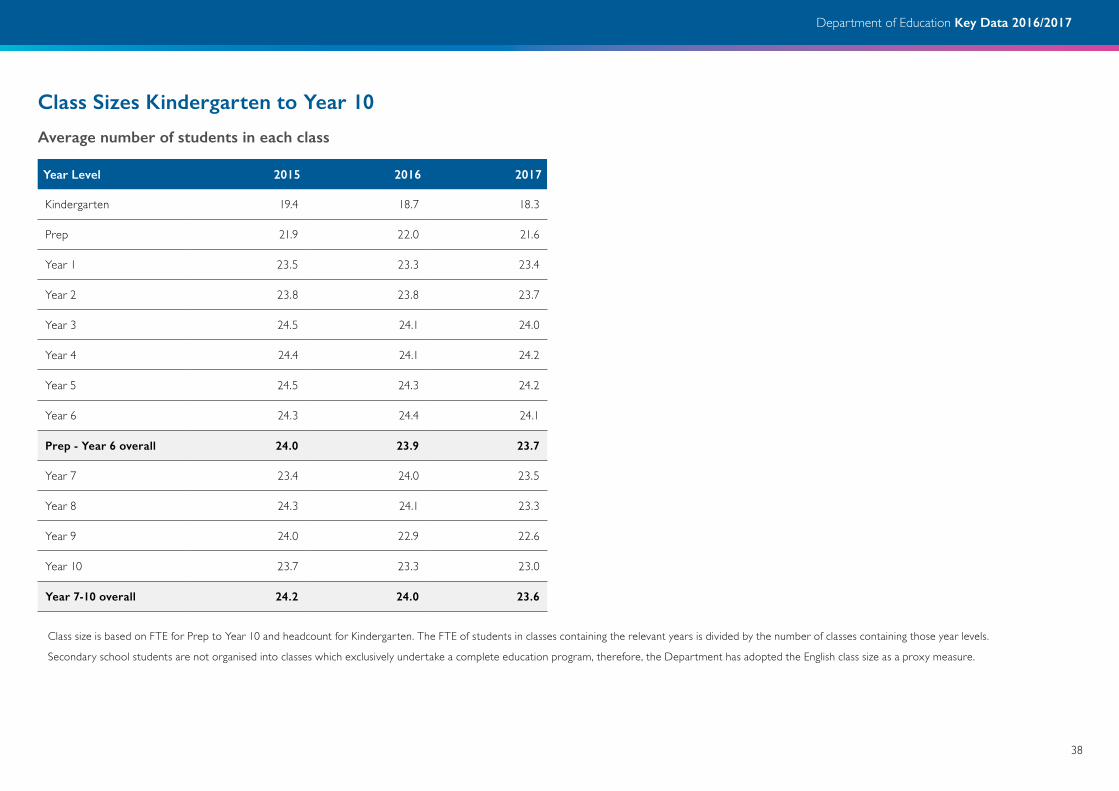
Department of Education Key Data 2016/2017
Class Sizes Kindergarten to Year 10
Average number of students in each class
Year Level 2015 2016 2017
Kindergarten 19.4 18.7 18.3
Prep 21.9 22.0 21.6
Year 1 23.5 23.3 23.4
Year 2 23.8 23.8 23.7
Year 3 24.5 24.1 24.0
Year 4 24.4 24.1 24.2
Year 5 24.5 24.3 24.2
Year 6 24.3 24.4 24.1
Prep - Year 6 overall 24.0 23.9 23.7
Year 7 23.4 24.0 23.5
Year 8 24.3 24.1 23.3
Year 9 24.0 22.9 22.6
Year 10 23.7 23.3 23.0
Year 7-10 overall 24.2 24.0 23.6
Class size is based on FTE for Prep to Year 10 and headcount for Kindergarten. The FTE of students in classes containing the relevant years is divided by the number of classes containing those year levels.
Secondary school students are not organised into classes which exclusively undertake a complete education program, therefore, the Department has adopted the English class size as a proxy measure.

39
Department of Education Key Data 2016/2017
School Satisfaction School Satisfaction information is an important element of school improvement planning. School satisfaction data was collected from students, parents and staff in all Tasmanian Government schools.
Satisfaction Ratings 2014 2015 2016
Student 83% 82% 81%
Parent 91% 91% 90%
Staff 89% 88% 88%
Access to Computers in ClassroomsRatio of number of students per computer device provided by the Department1 (Pentium level computers [desktops, laptops and netbooks])
2014 2015 2016 2017
Primary 2.4 2.6 2.4 1.9
Secondary 1.4 1.4 1.2 1.4
Combined 1.5 1.6 1.6 1.2
Senior Secondary 1.2 1.1 1.3 1.2
Special 0.3 0.3 0.3 0.3
Total K-12 1.7 1.7 1.6 1.5
1. Ratios shows the average number of students per one computer e.g. 2.4 students per one computer. iPads for Students with Disability Project are counted against the special school sector.

40
Department of Education Key Data 2016/2017
Workforce Data
Staff employed as at 31 March 2017
Staff employed in the Department of Education, grouped by Division and Business Unit.
Learning Division FTE Number
Office of the Deputy Secretary Learning 1 1
Learning Services (Northern Region)
Primary Schools 1578.17 2,129
Combined Schools 545.17 693
Secondary Schools 800.09 957
Senior Secondary Schools 378.51 452
Special Schools 143.41 220
Student Support 76.81 98
Learning Services 24.67 24
Principal Network Leaders 3 3
School Support (in Learning Services) 13.01 12
Child and Family Centres 14.43 21
Learning Division FTE Number
Learning Services (Southern Region)
Primary Schools 1660 2,189
Combined Schools 328.45 416
Secondary Schools 705.13 836
Senior Secondary Schools 377.83 502
Special Schools 87.01 120
Student Support 83.77 117
Learning Services 13.90 16
Principal Network Leaders 3 3
School Support (in Learning Services) 17.35 19
Child and Family Centres 14.44 19
LINC Tasmania
LINC Tasmania 281.20 372
Learning Division Total 7,150.35 9,219

41
Department of Education Key Data 2016/2017
Strategy and Performance Division FTE Number
Office of the Deputy Secretary Strategy and Performance 7.70 8
Education and Care Unit 19.93 21
Educational Performance and Review 31.5 33
Regulatory Support 6.21 8
Strategic Marketing, Communications and Media 13.60 17
Strategic Policy and Planning 9.10 10
Government Education Training International 19.03 22
Strategy and Performance Division Total 107.07 119
Support and Development Division FTE Number
Office of the Deputy Secretary Support and Development 8 8
Curriculum Services
Curriculum Services 42.50 43
Swimming Program 4.75 6
Professional Learning Institute
Professional Learning Institute 11.80 12
eLearning 3 4
Support Programs
Aboriginal Education Services 15.20 16
Disability Programs 52.90 66
Early Years Unit 2 2
English as an Additional Language 33.01 42
VETiS/TTC 3.70 4
Support and Development Division Total 176.86 203

42
Department of Education Key Data 2016/2017
Corporate and Business Services Division FTE Number
Office of the Deputy Secretary Department Services 2 2
Quality Assurance
Internal Audit and Risk Management Services 5.81 6
Finance and Budget Services
Finance and Business Services 2 2
Finance
Budget and Resource Services 10.7 11
Financial Services 24.62 26
Information Technology Services
Information Support Services 7.82 8
Information Technology Services 1 1
School and Client IT Support 63 65
Systems Infrastructure and Project Services 27.4 30
Facility Services
Facility Services 2 2
Asset Planning 10.14 11
Operations and Business Services 84.74 90
Human Resource Services
Human Resource Services 2 2
HR Injury Management 3.51 4
Corporate and Business Services Division FTE Number
HR Operations Systems and Reporting 32.44 34
HR Policy and Consultancy 5.21 6
Vacancy and Staffing Services 16.72 19
Industrial Relations 1 1
Safety and Risk Management 2.8 3
Workplace Relations 4.2 4
Legal Services 2.1 3
Corporate and Business Services Division Total 311.21 330
Office of the Secretary and Statutory Authorities FTE Number
Office of the Secretary 8.08 8
Ministerial Services 5 5
Statutory Authorities
Tasmanian Assessment Standards and Certification 11.27 12
Teachers Registration Board 9.77 11
Office of the Secretary and Statutory Authorities Total 34.12 36
Department of Education Total 7,779.61 9,907
43
Department of Education Key Data 2016/2017
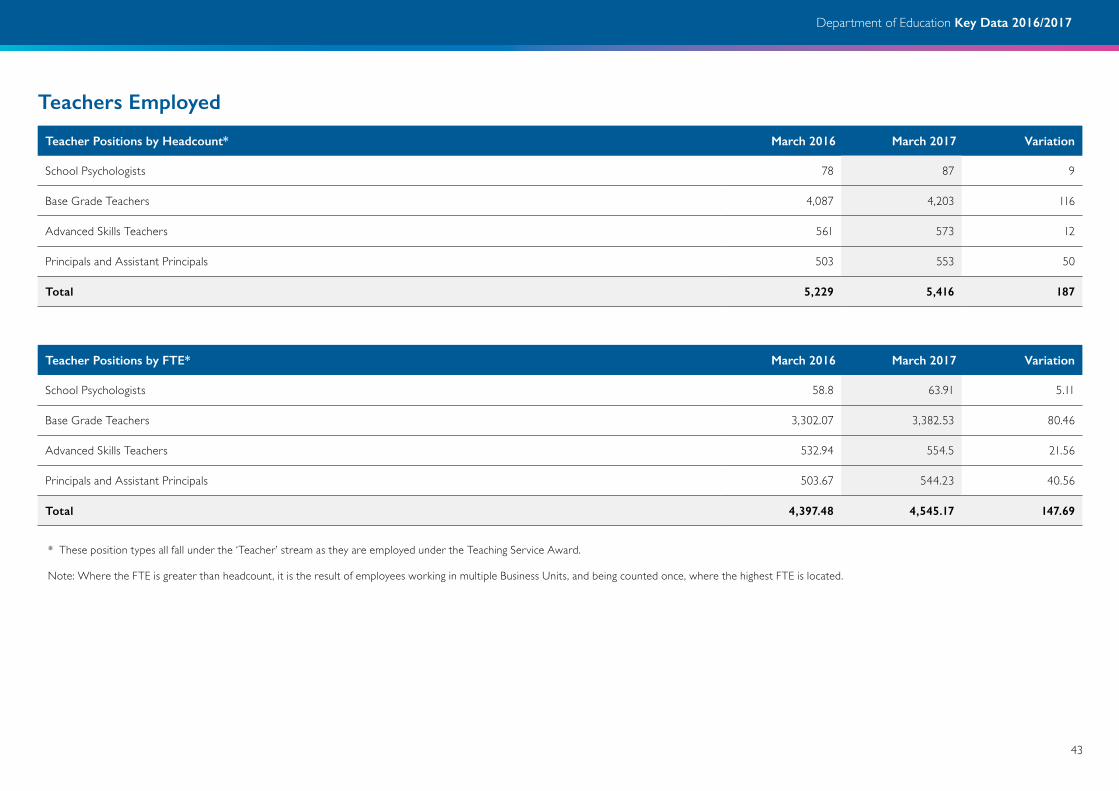
Teachers Employed
Teacher Positions by Headcount* March 2016 March 2017 Variation
School Psychologists 78 87 9
Base Grade Teachers 4,087 4,203 116
Advanced Skills Teachers 561 573 12
Principals and Assistant Principals 503 553 50
Total 5,229 5,416 187
Teacher Positions by FTE* March 2016 March 2017 Variation
School Psychologists 58.8 63.91 5.11
Base Grade Teachers 3,302.07 3,382.53 80.46
Advanced Skills Teachers 532.94 554.5 21.56
Principals and Assistant Principals 503.67 544.23 40.56
Total 4,397.48 4,545.17 147.69
* These position types all fall under the ‘Teacher’ stream as they are employed under the Teaching Service Award.
Note: Where the FTE is greater than headcount, it is the result of employees working in multiple Business Units, and being counted once, where the highest FTE is located.

44
Department of Education Key Data 2016/2017
Average Age of Teachers
Teacher Positions by FTE* March 2016 March 2017
Teacher Positions Female Male Female Male
School Psychologists 42.06 45.64 40.54 44.67
Base Grade Teachers 44.12 42.84 43.71 42.71
Advanced Skills Teachers 45.83 43.1 45.81 43.05
Principals and Assistant Principals 50.42 46.27 50.43 46.36
Age Distribution Principals and Assistant Principals (Headcount)
Age Group March 2016 March 2017
25 – 34 29 46
35 – 44 110 113
45 – 54 200 198
55 – 64 163 192
65 + 1 4

45
Department of Education Key Data 2016/2017
Gender Distribution in Promoted Positions (Headcount)
Teacher Positions by FTE* March 2016 March 2017
Promoted Positions Female Male Total Female Male Total
Advanced Skills Teachers 381 180 561 393 180 573
Principals and Assistant Principals 331 172 503 374 179 553
Total 712 352 1,064 767 359 1126
Rate of Staff AttendanceThe rate of staff attendance is based on a whole calendar year
2012 2013 2014 2015 2016
All Department Staff 97.70% 96.50% 96.20% 95.70% 95.60%
Teaching Staff 97.40% 96.40% 96.10% 95.80% 95.80%

46
Department of Education Key Data 2016/2017
Separation Rates for Staff Aged Less Than 55 YearsThe following separation rates are based on separations which occurred between April 2015 to March 2016 and April 2016 to March 2017.
Classification Stream April 2015 – March 2016 April 2016 – March 2017
Allied Health 3.10% 0.70%
Facility Attendants 2.00% 1.40%
Teacher Assistants 1.50% 1.20%
Teaching Service 1.20% 1.30%
TSSA General 5.20% 1.80%
TSSA Professional 0.00% 0.00%
Average (all employment classifications) 2.00% 1.40%

47
Department of Education Key Data 2016/2017
Supporting Student NeedIt is important to note that the Early Childhood Intervention Service (ECIS) is a statewide service working in partnership with very young children (0-4 years) and their families, maximising developmental achievements of young children with developmental disabilities and delays. While ECIS is managed through the Department’s Learning Services, ECIS is a service for families with children prior to these reaching compulsory school age.
Student 2014 2015 2016 2017
Students attending Early Childhood Intervention Service centres1
Number 606 583 605 630
Full-time Equivalents 211.0 198.7 210.2 217.0
Students with the highest support needs (Register for Students with Severe Disabilities) in special schools
Number 235 252 265 274
Full-time Equivalents 216.0 228.2 240.8 246.2
Students with the highest support needs (Register for Students with Severe Disabilities) in regular schools
Number 781 775 7632 816
Full-time Equivalents 752.4 747.7 736.52 784.2
1. Enrolment numbers are as at August of the year prior
2. Students enrolled at Giant Steps are no longer included on the Severe Disability Register (17 in 2015)

48
Department of Education Key Data 2016/2017
Element 2014 Allocated FTE - as at March
2015 Allocated FTE - as at March
2016 Allocated FTE - as at March
2017 Allocated FTE - as at March
Teachers 235.49 249.66 253.44 265.16
Respectful Schools Support Team1 10.00 10.00 10.00 10.00
Specialist Staff (School Psychologists, Speech and Language Pathologists, Social Workers)2 146.50 145.55 145.75 151.55
School Nurses3 NA 10.00 10.00 20.00
Total FTE 391.99 415.21 419.19 446.71
Special Needs Funding Allocations 2014 Allocation - as at March $’000
2015 Allocation - as at March $’000
2016 Allocation - as at March $’000
2017 Allocation - as at March $’000
Severe Disability Register Per Capita Funding 18,068 18,807 20,431 22,253
Severe Disability Register Support Teachers 18,562 20,627 21,017 22,577
IQ 55-704 7,500 7,500 7,500 7,685
Students with Disabilities Support 8,421 7,537 8,345 8,489
Learning Services Support 2,656 2,683 2,884 2,913
Specialist Staff 14,157 14,746 14,815 15,143
Additional Funding - Ministerial Taskforce5 NA NA 1,000 3,000
Total 69,364 71,900 75,992 82,060
1. The Respectful Schools Support Team (RSST) established in 2014 is providing extra specialist services in each Learning Service. This includes a School Psychologist, Behavioural Learning Leader and a Teacher Learning Leader (this role replaced the role on Inclusive Learning Leaders).
2. The figures do not include specialist staff employed through the Safe Homes, Safe Families program and Strong Families, Safe Kids program. As at 30 March 2017 there were 12.8 FTE allocated under these programs.
3. As at March 2017, the School Health Nurse Program operated across 81 schools. The schools nurses budget is not included in the funding allocation table below for students with disability.
4. In 2017 the Department has seen an increase in enrolments of students with cognitive capacity between 55-70 full scale IQ. This has prompted a higher allocation in this area than in previous years.
5. Ministerial Taskforce funding reported in 2016 was allocated from the Department’s internal budget. In its 2016/17 budget, the Government announced a new budget initiative of $12 million over 4 years to progress reforms that flow from the Ministerial Taskforce for Students With Disability.