keskusteluaiheita – discussion papers issn, 0781-6847; ... carpenter and petersen 2002) and that...
TRANSCRIPT

Keskusteluaiheita – Discussion papers
No. 820
Ari Hyytinen – Otto Toivanen
DO FINANCIAL CONSTRAINTS HOLD BACK INNOVATION AND GROWTH?
Evidence on the Role of Public Policy*
First version: September 17, 2002
This revised version: April 7, 2003
* We thank David de Meza, Katrin Hussinger, Eva Liljeblom, Heikki Kauppi, Markus Koskenlinna, Mika Kuismanen, Mika Maliranta, Jarle Møen, Anu Nokso-Koivisto, Vesa Puttonen, Petri Rouvinen, Pekka Ylä-Anttila and seminar participants at the Helsinki School of Economics, the Finnish Ministry of Trade and Industry, XXV Symposium of Finnish Economists (Oulu), The Research Institute of the Finnish Economy, and ZEW Workshop on Empirical Economics of Innovation and Patenting for useful comments. We also thank Mika Pajarinen and Lotta Väänänen for excellent research assistance. Financial support from the National Technology Agency (TEKES) and the Finnish Na-tional Fund for Research and Development (SITRA) is gratefully acknowledged. Toivanen also acknowledges financial support from the Yrjö Jahnsson Foundation. The views expressed in the paper are those of the authors, and do not reflect those of the funding bodies. The usual caveat applies.
ISSN 0781-6847 07.04.2003
ETLAELINKEINOELÄMÄN TUTKIMUSLAITOS THE RESEARCH INSTITUTE OF THE FINNISH ECONOMY Lönnrotinkatu 4 B 00120 Helsinki Finland Tel. 358-9-609 900 Telefax 358-9-601 753 World Wide Web: http://www.etla.fi/

HYYTINEN, Ari – TOIVANEN, Otto, DO FINANCIAL CONSTRAINTS HOLD BACK INNOVATION AND GROWTH? Evidence on the Role of Public Policy. Helsinki: ETLA, Elinkeinoelämän Tutkimuslaitos, The Research Institute of the Finnish Economy, 2003, 54 p. (Keskusteluaiheita, Discussion Pa-pers, ISSN, 0781-6847; no.820). ABSTRACT: This paper provides evidence that capital market imperfections hold back innovation and growth, and that public policy can complement capital markets. We deliver the evidence by studying the effects of government funding on the behavior of SMEs in Finland. By adapting the methodology recently pro-posed by Rajan and Zingales (1998) to firm-level data, we show that government funding disproportionately helps firms from industries that are dependent on ex-ternal finance. We demonstrate that the result is economically significant and ro-bust to a variety of tests. JEL: E50, G21, G24, G32
KEYWORDS: corporate finance, financial constraints, innovation, firm growth, subsidies HYYTINEN, Ari – TOIVANEN, Otto, DO FINANCIAL CONSTRAINTS HOLD BACK INNOVATION AND GROWTH? Evidence on the Role of Public Policy. Helsinki: ETLA, Elinkeinoelämän Tutkimuslaitos, The Research Institute of the Finnish Economy, 2003, 54 s. (Keskusteluaiheita, Discussion Pa-pers, ISSN, 0781-6847; no. 820). TIIVISTELMÄ: Tässä tutkimuksessa osoitetaan, että pääomamarkkinoiden epä-täydellisyydet saattavat jarruttaa yritysten innovatiivisuutta ja kasvua ja että elin-keinopolitiikalla voidaan näiden epätäydellisyyksien tuomia ongelmia vähentää. Tutkimuksen tulokset perustuvat analyysiin, jossa tarkastellaan julkisen yritysra-hoituksen vaikutusta pk-yritysten toimintaan Suomessa. Soveltamalla Rajanin ja Zingalesin (1998) kehittämää menetelmää yritystason aineistoon osoitamme, että julkinen yritysrahoitus on auttanut suhteellisesti enemmän yrityksiä niillä toimi-aloilla, jotka toimivat ulkoisen rahoituksen turvin. Osoitamme myös, että tämä tulos on taloudellisesti merkittävä ja tilastollisesti vahva. JEL: E50, G21, G24, G32
AVAINSANAT: yritysrahoitus, rahoitusrajoitteet, innovaatiot, yritysten kasvu, julkinen rahoitus


1
1 Introduction Does enterprise lead and finance follow, as Joan Robinson (1952) and others after
her have argued? Or is it the other way around? The extent to which imperfections
in capital markets restrain investment and growth has been the objective of inten-
sive research both at the firm (see Hubbard 1998 for a survey), industry (Rajan
and Zingales 1998, RZ henceforth) and country level (King and Levine, 1993).
This strand of research, and its complement, the research studying the effects of
public policy on firm performance (see, e.g., Lerner 1999, and Wallsten 2000 who
study the US SBIR program but reach opposite conclusions, and Lach 2002 and
Jaffe 2002)1, have been hampered by a number of problems in trying to establish
the causality between finance and firm growth. Although the two literatures have
so far developed relatively independently from each other, the objective of this
paper is to provide evidence on the question of causality by borrowing insights
from both. To deliver the evidence we study the effects of public policy (meas-
ured by government funding) on the behavior of privately owned, small and me-
dium sized enterprises (SMEs) in Finland.2
Governments around the globe seem to express downright skepticism on
Joan Robinson’s and others’ conclusion, as they have been keen to provide fund-
ing to SMEs. This seems to imply that governments think that where government
1 See also David, Hall and Toole (2000), and Klette, Møen and Griliches (2000), for surveys. 2 A skeptical reader might ask what’s different or interesting about Finland. In our (obviously not objective) view, Finland is different and interesting for a good reason. Finland is currently consid-ered one of the most competitive countries in the world both by World Economic Forum (WEF 2001) and International Institute of Management Development (IMD 2002), not least because of the perceived ‘innovativeness’ of its business sector and ‘efficiency’ of its government. In particu-lar, Finland’s basic, technological and scientific infrastructure as well as its government institu-tions and programs, including ‘public sector contracts’, ‘government subsidies to firms’, and ‘edu-cational system’, rank high in the well-known international comparisons of WEF, IMD and those of Global Entrepreneurship Monitor (GEM 2001). These comparisons suggest that the efforts of the Finnish government are perceived as an important element of the recent economic develop-ment in Finland.

2
finance leads, innovation and growth follow (see, e.g., OECD 2000). It is indeed a
long-standing view that imperfections in capital markets create a wedge between
the cost of internal and external finance to SMEs (Hubbard 1998, Lerner 1999,
Carpenter and Petersen 2002) and that the wider the wedge, the more likely that
SMEs dependent on external finance fail to pursue some innovations and growth
potential. The existence of this ‘funding cap’ is a primary rationale for the provi-
sion of government funding to SMEs (for a differing view, see de Meza and Webb
2000, and de Meza 2002).
This paper’s analysis tests this positive view of the role of active public pol-
icy in capital markets. We argue that if there are economically significant imper-
fections in capital markets and if ‘government finance leads’ (i.e. if it successfully
complements capital markets), government funding should disproportionately
help innovation (R&D) and growth of firms in industries that are dependent on
external finance. It is this hypothesis that we develop and test in this paper.
In a recent paper, RZ (1998) made an important methodological contribu-
tion by creating a way to identify industries’ technological demand for external
finance (by measuring it in the US). They then estimate industry-level growth
equations on data from other countries and include industry and country fixed
effects, and an interaction term between an industry’s technological demand for
external finance and a measure of a country’s financial development.3 RZ find
that after controlling for industry and country fixed effects, the coefficient of the
interaction term is positive and statistically significant. Their result suggests that
3 Recently Cetorelli and Gampera (2001) have extended RZ’s framework to examine the effects of banking market structure on growth. See also Carlin and Mayer (2002) who build on RZ’s frame-work to evaluate the relationship between industrial activity and the structure of countries’ finan-cial and legal systems

3
industries that are relatively more in need of external finance develop dispropor-
tionately faster in countries with better-developed capital markets.
We build on RZ’s methodology and amend it in two ways. First, in place of
their financial development -variable, we use a measure of the regional availabil-
ity of government funding to SMEs within a country. They argue that financial
development liberates firms from the drudgery of generating funds internally by
helping firms raise capital from sources external to the firms at a reasonable cost.
We think that government funding should lead to the same outcome, if it success-
fully augments capital markets. Second, we shift the focus to the effects of cross-
regional, between-industry differences on a firm-level variable. By focusing on
firm-level performance we can correct for region and industry characteristics. Im-
portantly, we can simultaneously address the problem of reverse causality, which
has been an important concern in the studies on finance and growth (see RZ
1998), and selection effects, which have been an important concern in the litera-
ture on government funding and firm performance (see Wallsten 2000).
We apply the amended methodology to recently collected firm-level data on
Finnish SMEs that allow us to disaggregate SME funding by its sources, including
external sources and the government. Using these data, we identify an industry’s
need for external finance from data on SMEs operating in the metropolitan Hel-
sinki area that is the financial center and capital of Finland. Under the assumption
that capital markets in Helsinki are relatively frictionless, this method allows us to
identify an industry’s technological demand for external financing. Under the fur-
ther assumption that such technological demand carries over to other geographical
areas in Finland, we examine whether the availability of government funding
(outside the metropolitan Helsinki area) especially helps firms in industries that
are technologically dependent on external finance.

4
The findings of this paper suggest that SMEs face an upward-sloping capital
supply curve and hence that the market for SME finance is imperfect. The evi-
dence is consistent with the view that financial constraints hold back innovation
and growth, and the hypothesis that government funding can alleviate capital
market imperfections. Beyond these conclusions, our results have no implications
for public policy. In particular, one cannot draw conclusions about the welfare
effects of government funding (cf. de Meza and Webb 1987, 2000 and de Meza
2002).
The paper is organized as follows. Section 2 discusses sources of capital
market imperfections and various motives for providing government funding to
SMEs. Section 3 explains our empirical approach, and section 4 describes the
data. In this section, the main sources of government funding in Finland are also
briefly described. Section 5 presents the regression results and investigates the
robustness of our findings. Section 6 summarizes the paper.
2 Theoretical Background
2.1 Why Do Capital Market Imperfections Matter?
To understand why capital market imperfections might constrain the growth and
‘innovativeness’ of firms, consider a simple model of firm level investment (see,
e.g., David et al. 2000) and growth (Carpenter and Petersen 2002). Figure 1 illus-
trates the main elements of the model. The horizontal axis measures both R&D
investment and/or the growth of sales.4 The vertical axis measures both the (pri-
4 Following the ‘percentage of sales approach’ we assume that the ratio of assets used to achieve a given level of sales is constant (see Higgins 1977, Demirkgüç-Kunt and Maksimovic 1998, 2002). The assumption implies that the growth of sales is proportional to the change in assets, allowing us to measure sales growth on the horizontal axis rather than the change in assets as in Carpenter and Petersen (2002).

5
vate) marginal rate of return on investment and expansion as well as the marginal
cost of capital.
The marginal cost of capital schedule, MCC, reflects the opportunity cost of
investment and expansion. It is horizontal to the extent a firm has internal funds
available but becomes upward sloping at some level of R&D investment and ex-
pansion. Standard textbook considerations about asymmetric information, adverse
selection and moral hazard suggest that the marginal cost of financing is an in-
creasing function of the amount raised. The MCC schedule captures the idea that
in the presence of capital market imperfections, the firm’s increased use of exter-
nal financing eventually pushes the marginal cost of capital upwards. In perfect
capital markets, the MCC schedule would be horizontal.
The marginal rate of return schedule, MRR, slops downwards, as it ranks
the R&D projects and expansion possibilities of firms in descending order of ex-
pected return. The MRR schedule for growth could be more elastic than the MRR
schedule for investment (Carpenter and Petersen 2002).
[Insert Figure 1 here]
In Figure 1, the firm’s profit maximizing levels of R&D investment (expansion)
are found at A and B, where A refers to a firm facing imperfect and B to a firm
facing perfect capital markets. It is evident that a firm facing a more elastic MCC
schedule invests more in R&D (pursues more growth). The model thus predicts
that SMEs that are dependent on external finance are more likely to fail to pursue
some innovations and growth potential than SMEs that are not.5
5 Especially growth-oriented, technology-intensive SMEs may face a steeply upward sloping MCC schedule because the profitability of growth opportunities is unknown and because R&D projects are highly uncertain investments in untapped market niches and in tacit knowledge that becomes embedded in the human capital of employees (see, e.g., Hall 2002). These tend to worsen the ad-verse selection problem and increase the lemons premium (Myers and Majluf 1984). They also create scope for moral hazard problems, especially because agency and contracting costs may be a characteristic feature of R&D projects (Holmström 1989) and because it is difficult, if not impos-

6
2.2 Why Subsidize SMEs?
Economic theory suggests various rationales for governments to provide (subsi-
dized) funding to SMEs, especially to technology intensive SMEs (see e.g.
Lerner, 1999). First, public finance theory posits that if SMEs are a unique source
of new ideas and growth that generate positive externalities to other industries and
firms, supporting them is appropriate. For example, because the social return from
the SMEs’ R&D expenditures may exceed their private returns due to ‘knowl-
edge’ spillovers (Griliches 1992, Lach 2002), firms will tend to underinvest in
R&D. Second, capital market imperfections may constrain investment and growth
of SMEs.
Figure 2 illustrates the rationale for providing government funding to SMEs
facing capital market imperfections. Holding the MRR schedule constant, award-
ing government funding to an SME has two effects on the MCC schedule. They
both depend on whether the firm is dependent on external finance or not. First, the
award of government funding has a direct effect by shifting the MCC to the right,
because it permits the undertaking of additional projects using capital that has a
lower marginal cost than at the pre-award equilibrium. Second, the award may
have an indirect effect (as suggested by Lerner’s (1999) results) as it may convey
information about the quality of the firm both to the equity holders of the firm and
to other (potential) investors. This reduces informational asymmetries and lowers
the cost of internal and external funds, implying both a downward shift in the
MCC schedule (the effect on the required rate of return by current owners and
sible, to contract for a delivery of a specific innovation (Aghion and Tirole 1994). Finally, tech-nology-intensive small businesses may find it difficult to convey the quality of their ventures to the providers of external finance due to appropriability problems and the confidential nature of R&D projects (Anton and Yao 1994, Bhattacharya and Chiesa 1995).

7
other corporate insiders) and a change in the slope of the upward sloping part of
the schedule (the effect on the required rate of return by corporate outsiders).
[Insert Figure 2 here]
Figure 2 shows the first of these two effects. The direct effect is larger for
firms positioned on the upward sloping part of the MCC schedule, i.e., for firms
dependent on external finance, than for firms positioned on the horizontal part.
When the MCC schedule shifts to right, the position of a firm who is originally on
the horizontal part (at point C) does not change, whereas those firms that initially
are on the upward sloping part of the MCC schedule (such as point D) increase
their R&D (growth) investments (to point *D ).6
There are thus reasons to think that the effects of government funding
should vary with the elasticity of the marginal cost of capital schedule that firms
face. The hypothesis put forward by the model is that if there are significant im-
perfections in capital markets, government funding should disproportionately help
firms in industries that are (more) dependent on external finance. These firms are
more likely to face a less elastic marginal cost of capital schedule than firms that
are less dependent on external finance. This is the distinctive channel on which
the test of this paper focuses.
3 The Empirical Approach To test our hypothesis we estimate several variants of the following basic model:
1 2 3
( )i j a
j a i
i
Y External dependence Government funding
Industry dummies Area dummies ControlsError
α β= + ⋅ ⋅
+Φ ⋅ + Φ ⋅ + Φ ⋅
+
(1)
6 Provided that the downward shift in the MCC schedule is moderate compared to the change in the schedule’s slope, also the indirect effect works to the same direction as the direct effect.

8
In (1), subscript i refers to firm, j to industry and a to area; α and β are parame-
ters, and uppercase coefficients kΦ (k = 1, 2, 3) indicate vectors of parameters.
The dependent variable is a measure of firm i’s investments in R&D or its
growth (we define the various measures in section 4.1). The independent variable
of primary interest is the interaction term between an industry (External depend-
encej) and an area (Government fundinga) characteristic. If we can measure indus-
try j’s dependence on external finance and the amount of government funding
available in area a, then - provided that we correct for area and industry effects -
we should find that the coefficient estimate for the interaction is positive in the
presence of capital market imperfections. To correct for area and industry specific
effects, we include Industry dummiesj and Area dummiesa. The vector of Controlsi
(described in detail below) is included to control for a number of firm specific
effects that potentially affect the dependent variable(s).
Model (1) differs from that of RZ in two ways, as already mentioned in the
Introduction. First, in place of RZ’s financial development -variable, we use a
measure of the local availability of government funding to SMEs.7 If it success-
fully augments capital markets, government funding should help firms grow by
liberating firms from the drudgery of generating funds internally. Second, we shift
the focus to the effects of cross-regional, between industry differences on a firm-
level variable. In RZ’s model, the dependent variable is measured in industry j of
area (country) a, whereas our dependent variable refers to firm i from industry j
and area a. Together with the inclusion of industry and area fixed effects this
7 Unlike RZ’s financial development -variable that varies across countries, our measure of the availability of government funding only varies within a country. This allows us to abstract from the problem of country-specific omitted variables.

9
means that iError measures firm-level deviations (those not controlled for by the
vector of firm-level iControls ) from the industry-area mean.
RZ’s methodology and our modifications to it allow us to simultaneously address
a number of econometric issues that arise in standard firm-level analyses of the
effects of government funding on firm performance in which some measure of
firms’ performance is regressed on a measure of government funding (the sub-
sidy) awarded to the firm:
• Reverse causality and selection: Receiving government funding may be
endogenous to a firm’s activities: e.g., firms that do more R&D could be
more likely to receive government funding. This may either result in a se-
lectivity problem that may bias upward econometric estimates of the ef-
fect of government funding on firm R&D in standard firm-level regres-
sions (David et al. 2000, Klette et al. 2000, Wallsten 2000) or indicate
reverse causality. Our specification controls for the selectivity problem
because the interaction term is measured at industry and area level, not at
the level of individual firms. Recall, in particular, that the error term in
equation (1) measures the firm-level deviation from the area-industry
mean of R&D or growth. It is hard to imagine a channel through which
the availability of government funding in area a or the external depend-
ence of industry j would be correlated with the deviation in R&D expen-
ditures or growth of firm i from its industry-area mean. Thus, should we
find a positive coefficient for the interaction term, reverse causality is
unlikely to explain it.
• Omitted variables: Omitted latent variables that are correlated with both
R&D or growth decisions and government funding could give arise to
endogeneity (David et al. 2000, and Klette et al. 2000). Because the in-

10
dustry and area dummies capture first-order effects, i.e., the effects of po-
tentially omitted industry and area regressors, our analysis of the interac-
tion term should be relatively immune to criticism about an omitted vari-
able bias.
• Identification: Because government funding may shift MRR and MCC
schedules simultaneously (David et al. 2000), it may be difficult to say
whether government funding matters because it alleviates capital market
imperfections or because it opens up additional R&D and growth oppor-
tunities. Our framework should be able to deal with this issue for two
reasons. First, we analyze government funding, not public contracts that
are expected to assist a public agency in better fulfilling its mission ob-
jectives. As David et al. (2000) argue, government funding is less likely
to have an effect on the MRR schedule than public contracts. Second,
and more importantly, by looking at interaction effects rather than direct
effects (as usually is done), we reduce the possibility that government
funding shifts the MRR schedule. The only effects, if any, of government
funding that are identified are those that arise because there is within re-
gion variation in external dependence across industries.
• Measurement error: One of the most difficult tasks in RZ’s approach is
measuring industry j’s technological dependence on external finance. If it
is measured inaccurately, measurement error might be a cause of concern
to us. However, we have no a priori reason to believe that the industry
level measurement error would be correlated with the deviation in R&D
expenditures or growth of firm i from its industry-area mean. Moreover,
had we a bad proxy for the technological dependence on external finance,
we would presumably be biased against finding any statistically signifi-

11
cant effects for the interaction term. And, finally, to the extent that there
is systematic variation in the industry level measurement error, the indus-
try dummies should capture the first-order effects of that. These same
considerations apply also to measuring the amount of government fund-
ing available in area a.
4 The Data The empirical evidence of this paper is based on new data originating from a re-
cently conducted primary survey. It resulted in a dataset that covers 724 SMEs
from all major sectors of the Finnish economy.8 In what follows we develop our
measures of i) innovativeness and growth, ii) dependence on external finance, and
iii) government funding. The data are described in detail thereafter.
4.1 Measures of Innovativeness and Firm Growth
We measure (investments in) innovativeness as the R&D expenditure of firm i,
(denoted & iR D ). Because & iR D is a source of future technological improve-
ments and a manifestation of systematic search for inventions and innovations, the
variable should be useful when studying whether government funding matters for
firms’ investments in innovativeness. We could also view & iR D as a measure of
long-term growth opportunities and future expansion, as R&D investments are a
means to acquire corporate growth opportunities.
8 The survey was administrated by the Research Institute of the Finnish Economy (ETLA) and its subsidiary Etlatieto Ltd. It was conducted between December 2001 and January 2002. Only farm (agricultural), financial, and real-estate sectors are fully excluded. The data only cover SMEs that are not proprietorships, partnerships, or subsidiaries. A detailed description of the survey, data and the Finnish SME finance is presented in Hyytinen ja Pajarinen (2002), available at www.etla.fi. For recent developments in the Finnish financial system, see Hyytinen, Kuosa and Takalo (2003).

12
The second dependent variable is the average sales growth rate over the next
three years, as projected by the entrepreneurs themselves (denoted iGROWTH ).9
It is a measure of mid-term growth opportunities.
4.2 Measures of Dependence on External Finance
Unlike Carlin and Mayer (2002) and Cetorelli and Gambera (2001), we do not
have the option of using RZ’s estimates of external dependence for manufacturing
industries. In our view, it would not be prudent to assume that the patterns of ex-
ternal finance that RZ identify using large listed US firms would also apply to the
Finnish SME sector. For example, firms in the RZ data are at a much later stage in
their lifecycle than the firms in our data. The option is also precluded because we
have only very few, if any, observations for many of RZ’s manufacturing indus-
tries.
There are two problems that we need to overcome before we can construct
our own estimates for external dependence. First, like RZ, we do not have data on
actual use of external financing at industry level. Even if data on actual use of
external financing were available by industry, it would not be useable because it
would reflect the equilibrium between the demand for external finance and sup-
ply. Because our test rests on the assumption that government funding matters
because of market failure in capital markets, we cannot identify an industry’s de-
pendence on external financing by simply computing it for each industry using a
selected measure.
Second, our data are based on a survey that includes only few items from
financial statements. This fact is a mixed blessing for us. On the one hand, it im-
plies that we cannot use the same measure for external dependence as RZ. More-
9 The variable is based on Question 11 of the survey, in which entrepreneurs were asked: “What is your average annual target rate of sales growth for the next three years?”.

13
over, because our data consists of a cross-section, we would not be able to smooth
temporal fluctuations.10 On the other hand, the data is rich in other details, includ-
ing the sources of equity (ownership) and debt.
We overcome the first problem in the same way as RZ do. We assume that
there is a technological reason why some industries rely more on external finance
than others and that these technological differences persist across different geo-
graphical areas. Provided that the differences persist, we can identify an industry’s
need for external finance from data on SMEs operating in the metropolitan Hel-
sinki area under the assumption that capital markets in Helsinki are relatively fric-
tionless. If they are, the actual amount of external funds raised by an SME resid-
ing the Helsinki metropolitan area equals its desired amount.
While we are not claiming that the capital markets in Helsinki are as perfect
as the US capital markets are, the assumption is not inconsistent with the facts.
First, Helsinki is the financial center and capital of Finland where the only stock
exchange resides and where all major deposit banks, finance companies, venture
capital firms as well as investment banks have their headquarters. Second, almost
all foreign financial institutions that are present in Finland also have their offices
in Helsinki. Finland and particularly the Helsinki metropolitan area have also at-
tracted a non-negligible amount of foreign capital, including cross-border venture
capital, since long-term capital movements were liberalized in 1993. Third, ven-
ture capital activity is concentrated to southern Finland, as 65% of all Finnish ven-
ture capital investments in 2000 were made in firms residing there. Fourth, house-
hold and corporate wealth, which are a potential source of initial finance to start-
10 To the extent that an industry’s technological dependence on external finance changes as it emerges, matures and dies (like industries typically do), we would probably like to measure the degree of dependence for industry j that is currently prevailing. In this sense, having just one cross-section is not as problematic as it may first sound.

14
ups, angel finance and trade credit, are also concentrated in the Helsinki metro-
politan area. Finally, even if the supply of capital was not perfectly elastic in the
metropolitan Helsinki area, the methodology provides a reasonable measure of the
relative demand for funds by different industries under the weaker assumption
that the elasticity of the supply curve does not change substantially in the cross-
section of industries (RZ, p. 564). As we already discussed earlier, also the inclu-
sion of industry dummies into the regression and our focus on the interaction term
alleviate the concerns that an industry level measurement error might give a raise
to.
In order to overcome the second problem, we measure dependence on ex-
ternal finance in four different ways. First, we utilize our survey questions (and
the information on firms’ balance sheets available to us) to calculate the fraction
of total debt and equity that is attributable to corporate outsiders, i.e., to investors
that belong neither to the management nor the personnel of the firm. This fraction,
denoted iEXDEPOUT , is computed as the sum of outside equity and credit sup-
plied by corporate outsiders. Outside equity consists of the fraction of total share-
holders’ equity not owned by the management or personnel of a firm.11 Outside
loan financing consists of credit supplied by financial institutions (such as banks,
finance firms, other domestic financial institutions), non-financial businesses
(trade credit, loans from other firms) and government.
Second, we estimate a firm’s dependence on external finance using a finan-
cial planning model (called also the ‘percentage of sales’ approach; see Higgins
11 Because shareholders’ equity consists mainly of share capital and retained earnings and because outsiders would have been entitled to receive retained earnings as dividends in proportion to their ownership in the firm, we assume that the part of the retained earnings that can be attributed to outside owners on the basis of their ownership represents capital infusions by outsiders.

15
1977, Demirkgüç-Kunt and Maksimovic 1998, 2002). Under certain assumptions,
the financial planning model allows us to compute the ‘excess growth’ made pos-
sible by external finance. The measure, denoted iEXDEPSG , is defined as a
dummy set to one if the difference between a firm’s realized sales growth rate,
iS∆ , and its maximum sustainable growth, SGi, is positive. The maximum sus-
tainable growth rate assumes that the firm does not pay dividends and that it ob-
tains enough short-term and long-term credit to maintain a constant ratio of debt
to equity. It is computed as /(1 )i i iSG ROE ROE= − , where ROEi is defined as the
ratio of profit (loss) for the fiscal period to shareholders’ equity. Whilst this meas-
ure is attractive because it is based on a standard model, and because it has been
extensively used before, it does have the drawback that it does not take into ac-
count the long-term nature of R&D investments. We expect it to perform less well
in the R&D than in the growth regressions, as the latter are explicitly taking a
mid-term view, consistent with this measure of financial dependence.
The remaining two of our four measures for dependence for external finance
are profitability-based. The third measure, denoted iEXDEPLOSS , classifies firm
i as dependent on external finance if its return on assets was negative in the last
fiscal year. The fourth one, denoted iEXDEPPROF , classifies firm i as dependent
on external finance if the entrepreneur answered in the survey that her firm’s cur-
rent profitability is not better than it has been over the last three years on aver-
age.12
To aggregate iEXDEPOUT , iEXDEPSG , iEXDEPLOSS , and
iEXDEPPROF across companies in the metropolitan Helsinki region we calculate

16
industry averages.13 The resulting industry-level variables (denoted with subscript
j, not i), provide us with four alternative measures for industry j’s need for exter-
nal finance. In other words, External dependencej is a generic measure, taking
four different forms: jExternal dependence ∈ { ,j jEXDEPOUT EXDEPSG ,
},j jEXDEPLOSS EXDEPPROF . Under the assumption that capital markets in
Helsinki are relatively frictionless, the first two measure a technological reason
why some industries rely more on external finance than others. The latter two are
measures for ‘technological profitability’, and adverse changes to it. While these
measures have the problem of being based on an accounting definition of profit-
ability, they should capture the fact that for some industries relying on internal
financing may be next to impossible due to low current industry profitability, or
due to a recent adverse change in it. What is important is that capital market im-
perfections should not affect the costs of capital in the metropolitan Helsinki area
and thereby bias our measures for (typically hard-to-observe) industry profitabil-
ity.
We present descriptive statistics for the measures of external dependence
both at the firm-level and industry-level in section 4.4, where the data are de-
scribed.
12 The variable is based on Question 20 in the survey. In the question, entrepreneurs were asked: “Is the current profitability of your firm better than the firm’s profitability has been over the last three years on average?”. 13 We group the firms into 14 broad industry categories based on two- and three-digit SIC-like industry codes. We end up with 14 industries, because we need to have industries for which there are firms operating within the metropolitan Helsinki area (so that we can estimate industry j’s dependence for external finance) and for which there are firms operating outside the metropolitan Helsinki area (so that we can estimate equation (1)). The industries are listed in section 4.4, where the data are described.

17
4.3 Measures of Government Funding
Ideally, the availability of government funding should be measured with the ease
at which SMEs, especially those suffering from capital market imperfections, ob-
tain finance from various government sources. There is little agreement on how
this kind of availability is appropriately measured and, typically, even less data
available.
To develop a measure for the regional availability of government funding,
we begin by estimating the amount of government funding received by each SME
in our sample from all the agencies providing public SME support in Finland. The
National Technology Agency (Tekes), Finnvera plc (a specialised financing com-
pany owned entirely by the Finnish state), and the Finnish National Fund for Re-
search and Development (Sitra), are the most prominent sources of public support
to firms in Finland. Tekes finances R&D projects of companies and universities
and its funds are awarded from state budget via the Ministry of Trade and Indus-
try. It grants loans and capital loans, which are not gratuitous (i.e. they are repay-
able and priced at a below-market interest rate), as well as pure R&D subsidies,
which are gratuitous (i.e. they are not repayable). Sitra provides government ven-
ture capital funding for early stage technology companies and for commercializa-
tion of innovations. It uses equity and equity-linked instruments, which are not
gratuitous (i.e. capital is injected only in exchange for a ownership stake in the
company). Through its nationwide branch network, Finnvera offers various fi-
nancing services, such as subsidized loans and guarantees, to promote the domes-
tic operations and internationalization of Finnish SMEs. Some of its financial ser-
vices are gratuitous (guarantees) while some are not (loans). Of these agencies,
Tekes and Finnvera explicitly take the location of the firm into account in making
their decisions. In addition to Tekes, Sitra and Finnvera, there are 15 Regional

18
Employment and Economic Development Centres (‘TE Centres’) that provide
public support, both financial and non-financial, to SMEs. The financial support
that TE Centres provide is mainly awarded from state budget via the Ministry of
Labour. They all are gratuitous. Finally, some government funding to SMEs is
provided through Finnish Industry Investment (FII) Ltd, a government-owned
fund of funds, which also invests directly in (larger) Finnish firms, as well as
through relatively small regional, semi-governmental and municipal -owned ven-
ture capital firms. Financing provided by these organizations is typically non-
gratuitous.
The survey data allows us to compute for each firm in the sample the frac-
tion of total debt and equity that is attributable to any of the above described gov-
ernment agencies providing public SME support and R&D finance in Finland. We
denote the fraction iGOVFUN . The measure captures only the extent to which
firm i relies on government funding that is not gratuitous, i.e. that is either repay-
able or that is provided only in exchange for an ownership stake and is thus re-
corded in their balance sheets. We address this issue and other characteristics of
iGOVFUN below.
In similar vein to RZ’s financial development variable, we measure gov-
ernment funding regionally. To aggregate iGOVFUN geographically, we com-
pute area averages of it within each of the 15 TE Centres. TE Centres together
cover the entire Finland and naturally, the areas in which individual TE Centres
are active do not overlap.14 Aggregation provides us with a measure for the
amount of governmental funding available in area a, aGOVFUN .
14 The TE Centres are the natural unit of analysis, because their primary function is the provision of public support, both financial and non-financial, to local economies and especially to firms. The Business Departments of TE Centres advise start-ups, provide services to promote internationali-

19
It is important to emphasize the nature and limitations of aGOVFUN :
• aGOVFUN does not account for government funding that is not recorded
in the balance sheet of firms. Examples of such government funding in-
clude subsidies (aid) that are recognized as revenue when received and
that effectively are gratuitous. While we do not have data on the amount
of such subsidies, the survey data include qualitative information on
them. We can therefore address the limitation by showing that an omitted
subsidy variable is not driving our results (see section 5.2);
• Previous analyses, including Lichtenberg (1988) and Wallsten (2000),
have used government funds ‘potentially awardable’ to firms as an in-
strument for a firm-level subsidy variable like iGOVFUN when estimat-
ing the effects of government funding on firm performance. Our
aGOVFUN is similar in nature to the instrument. However, firms may do
more R&D or pursue stronger growth (by running down current cash
holdings and using short-term credit etc.) in areas where there is a lot of
‘potentially awardable’ government funds around, anticipating that they
can rely on government funding in future if needed. The exclusion re-
striction used in the previous analyses is therefore not totally unproblem-
atic, because aGOVFUN can, similarly to financial development in RZ,
be an important determinant of R&D and growth decisions, especially to
firms in industries that are more dependent on external finance. The
benefit of the definition of aGOVFUN is, from our point of view, that it
zation of firms, encourage firms to adopt new technologies and supply capital to partially finance firm’s investment and development projects. By design, the geographical distribution of TE Cen-tres reflects the geographical distribution of the relevant local capital markets better than that of municipalities or provinces. While TE Centres are a preferred regional unit of ours, we show in section 5.2 that our results are robust to using an alternative geographical division.

20
captures this kind of (previously overlooked) indirect effects (not unlike
the financial development -variable in RZ).15
• By relying on aGOVFUN we only observe the equilibrium between the
demand for government funding and its supply in each TE Centre. In ar-
eas where capital market imperfections are more severe, firms are keener
to rely on government funding. aGOVFUN also provides us with infor-
mation about the regional supply of government funding because the
more government funding is available, the easier it is for SMEs to obtain
some. Whichever of these is the more important source of variation,
aGOVFUN is relatively more important for firms in industries that are
more dependent on external finance. If there were no variation cross TE
Centres in capital market conditions, the measure for government fund-
ing would only reflect variation in the regional supply of government
funding. Similarly, if there were no variation in the regional supply, our
measure would only reflect variation in capital market conditions cross
TE Centres. In other words, even if there was no deliberate public policy
to allocate different amounts of funding to different regions, we can pro-
ceed with our tests as long as there is variation in the data.
Finally, we need to emphasize the assumption that the capital markets for
SMEs are at least partly local. While a growing number of studies support the
assumption (Lerner 1995, Petersen and Rajan 2001), it is a potential source of
bias. A violation of this assumption creates a bias against finding any statistically
significant effects.

21
4.4 Descriptive Statistics
We present firm-level summary statistics in Table 1. A first thing to note is that
the number of observations for an explanatory variable may exceed the number
observations for the dependent variables. The reason is that we lack data on
& iR D for some firms for which we have data on iGROWTH , and vice versa.
The mean of & iR D is 0.11 millions of euro, while that of iGROWTH is as high
as 19%.16 There is more variation in & iR D than in iGROWTH , and the maxi-
mum of both variables is large relative to the mean. Although not shown in the
table, 38% of the 618 & iR D observations are zero. The corresponding number
for iGROWTH is 27%. We explicitly allow for the possibility that R&D expendi-
tures or expected growth is zero by using censored regression (Tobit) model.17
Table 1 also reports descriptive statistics for iEXDEPOUT , iEXDEPSG ,
iEXDEPLOSS , and iEXDEPPROF , as well as iGOVFUN , measured here at the
firm-level. What the table reveals is that on average, 40% of the total funds of
SMEs can be attributed to outside investors; 36% of firms have grown using ex-
ternal finance, i.e. faster than the maximum sustainable growth rate; 10% of the
firms are making losses; and the profitability of every third firm is currently lower
than or the same as it has been during the past three years. Finally, on average, 7%
of the total funds of SMEs can be attributed to government sources.
As Table 1 reveals, the data also include several firm-level control variables.
Firms in our sample are on average 16 years old ( iAGE ), and have 17 employees
15 We address the potential limitation of model (1) that it does not include the firm-level GOVFUNi in the estimating equation by showing that our results remain intact even if it is in-cluded. The results of this robustness test are presented in section 5.2. 16 Median of R&Di and GROWTHi are .008 million euros and 10%.

22
( iEMP ). The current CEOs have managed the firm nine years on average
( iCEOAGE ), and 29% of them have a university degree ( iCEOEDUC ). 69% of
firms have a strong principal, controlling, owner ( iPRINSOWN ); in 96% of firms
the combined ownership of the three largest shareholders exceeds 50%
( iCONOWN ); four per cent have foreign shareholders ( iFOREOWN ); and in
88% of firms, board members ownership exceeds 50% ( iBOARDOWN ). The
average number of board members (BOARDi) is 2.85, and that of firm’s execu-
tives and other personnel on the board ( iBOARDINS ) is 1.76. The CEO is the
chairman of the board ( iCEOCHAIR ) in half of the firms. 44% of firms have
made a product innovation during the last three years ( iINPROD ), and 30% have
made a process innovation during the last three years ( iINPROC ). Every eighth
firm has patents ( iPATENT ), and 22% have intangible assets ( iINTANG =
dummy set to 1 if the entrepreneur evaluates that his/her firm owns other intangi-
ble assets than patents). The firms in the sample seem to be what we would expect
for a group of small, high-tech firms.18
[Insert Table 1 here]
In Table 2 we continue our analysis of firm-level data. The table reports the
correlation coefficients between the dependent variables, the measures for exter-
nal dependence and government funding. The correlation between & iR D and
17 No firm reported a negative expected growth. We treat this as a reporting bias: it is likely that some of the firms that report zero expected growth actually expect negative growth, but were re-luctant to answer so. Our framework allows for such a possibility. 18 Finally, Table 1 reports descriptive statistics for three variables that will be used to evaluate the robustness of our results. The variables are AUDITi (= dummy set to 1 if firm is audited by one of the internationally recognized ‘Big Five’ accounting firms), LOANDENi (= dummy set to 1 if firm’s loan applications has been turned down because of lack of collateral and/or guarantees dur-ing the last two years) and AWARDi (= dummy set to 1 if firm has during the last fiscal year or prior to it received gratuitous government awards of any kind (or if it has loans guaranteed by a governmental agency) that are not recorded in the balance sheet).

23
iGROWTH is 0.80 and significant at the 1% level. This suggests that R&D firms
have more growth opportunities, which is what we expected to find. The measures
of external dependence are also highly correlated with each other; the only excep-
tion is the zero correlation between iEXDEPPROF and iEXTDEPOUT . The de-
pendent variables and the measures for external dependence correlate positively
with each other; five out of the eight correlations are statistically significant. Be-
cause growth-oriented and R&D-intensive firms are on average likely to be de-
pendent on external finance, these findings lend credence to our measures of fi-
nancial dependence. Finally, iGOVFUN is positively correlated (at the 1 % level)
both with the dependent variables as well as the measures for external depend-
ence; the only exception is the correlation with iEXDEPPROF , which is next to
zero. The positive correlations are precisely what one would expect to find if there
are positive selection effects (Wallsten 2000) and if government awards tended to
be allocated to firms that are dependent on external finance.
[Insert Table 2 here]
Table 3 reports the external dependence for each of our industries, as meas-
ured using data on SMEs residing in the metropolitan Helsinki area. The table
shows that according to jEXDEPOUT , ‘ICT services, excluding software’ is the
most and ‘Services n.e.c.‘ the least dependent industry on external finance. The
ranking of the industries naturally varies with the measure used. The measures
are, however, positively correlated. While not reported in the table, the largest
correlation (between jEXDEPSG and jEXDEPLOSS ) is 0.52, while the smallest
24
one (between jEXDEPOUT and jEXDEPSG ) is 0.12. Note, finally, that
jEXDEPLOSS has more variation cross industries than the other three measures.
[Insert Table 3 here]
Finally, Table 4 reports the average reliance by firms on government fund-
ing for each TE Centre. The table shows that in a TE Centre situated in ‘Kainuu’
firms rely most (on average 17%) and in ‘Uusimaa’ and in ‘Pohjanmaa’ least (to
be precise, on average 4.0% and 4.2%, respectively) on government funding.
These patterns are remarkably intuitive, because ‘Uusimaa’ includes the metro-
politan Helsinki area and because ‘Kainuu’ lies in North-Eastern Finland (located
nearby the Russian border) and suffers from shrinking a economy and high unem-
ployment. The mean of aGOVFUN cross TE Centres is 8%.
[Insert Table 4 here]
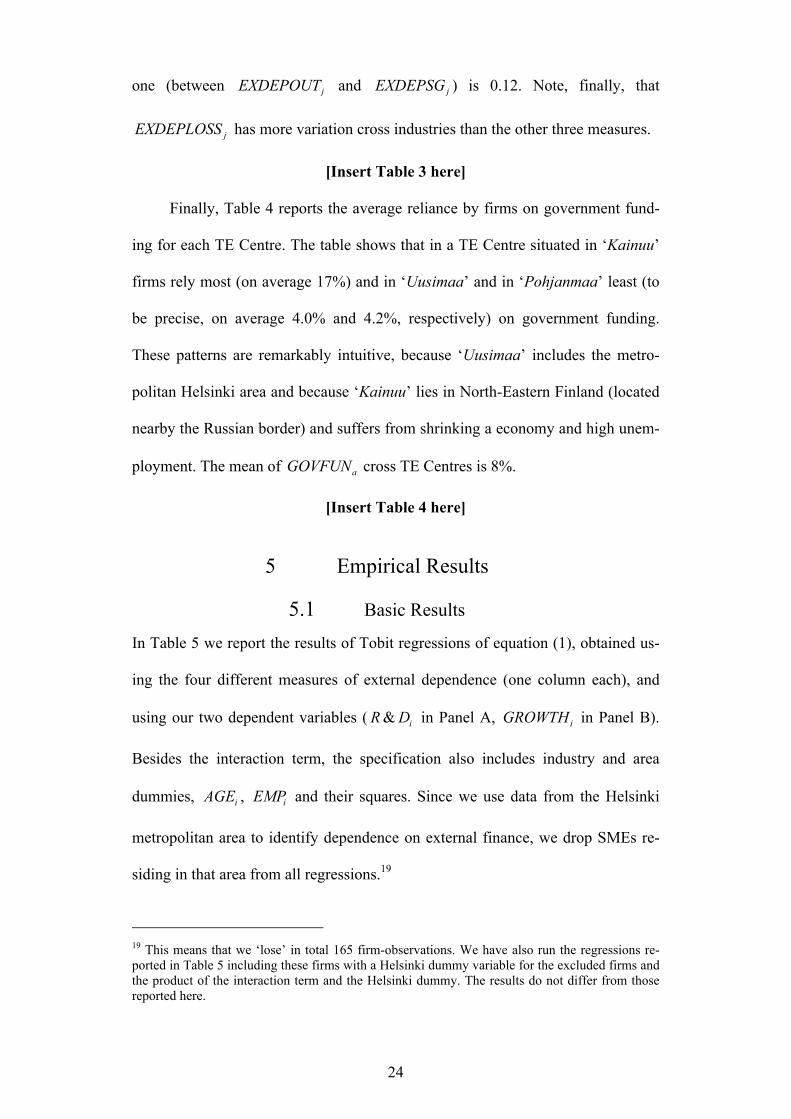
5 Empirical Results
5.1 Basic Results In Table 5 we report the results of Tobit regressions of equation (1), obtained us-
ing the four different measures of external dependence (one column each), and
using our two dependent variables ( & iR D in Panel A, iGROWTH in Panel B).
Besides the interaction term, the specification also includes industry and area
dummies, iAGE , iEMP and their squares. Since we use data from the Helsinki
metropolitan area to identify dependence on external finance, we drop SMEs re-
siding in that area from all regressions.19
19 This means that we ‘lose’ in total 165 firm-observations. We have also run the regressions re-ported in Table 5 including these firms with a Helsinki dummy variable for the excluded firms and the product of the interaction term and the Helsinki dummy. The results do not differ from those reported here.

25
[Insert Table 5 here]
In the first column the measure for external dependence is jEXDEPOUT .
We find that the coefficient for the interaction term is positive and statistically
significant at the 5% level in the R&D and at the 10% level in the growth equa-
tion. As the second column shows, when our measure for external dependence is
jEXDEPSG , the interaction term is significant at standard levels only in the
growth equation. As we discussed earlier, this measure of financial dependence
does not take into account the long-term nature of R&D, and was therefore ex-
pected to perform less well in the R&D equation. In column three, external de-
pendence is measured using jEXDEPLOSS . The interaction term carries a highly
significant positive coefficient in both equations. Finally, in column four, external
dependence is measured using jEXDEPPROF . Again, the interaction terms’ coef-
ficients are positive and highly significant. These results suggest that the R&D
investments and perceived growth prospects of firms that operate in industries that
are dependent on external financing are disproportionately positively affected by
the availability of government funding in their area. This is evidence both for im-
perfections in (local) capital markets, as well as for positive (additionality) effects
of government funding.
Table 5 also reveals that & iR D and iGROWTH are initially directly related
to the size of the SME, as measured by iEMP , but begin to decrease with size
after a threshold. iAGE has a non-linear effect only on iGROWTH .
Table 6 repeats the exercise but now the results are based on an extended
specification with 14 additional firm characteristics. We lose 28 observations
compared to Table 5. Whilst the extended vector of firm characteristics allows us
further to control for the characteristics of firms, this does come at the price of

26
possible endogeneity problems. Our main interest is however in the coefficient of
the interaction term, not in the coefficients of the firm characteristics. It is promis-
ing to note that the results do not change; even the point estimates are very close
to those in Table 5. Our results on capital market imperfections and effects of
government financing are not driven by omitted firm level characteristics.
[Insert Table 6 here]
It is of some independent interest to observe that iCEOEDUC , iBOARD ,
iPATENT and iINTANG have a statistically significant positive correlation with
& iR D , while iBOARDINS correlates negatively with it. These qualitative results
are similar in the iGROWTH regression, with the exception that correlation with
iCEOEDUC is not statistically significant. These findings are what one would
expect, though the positive correlation with board size is a bit surprising. The
other firm-level control variables do not obtain statistically significant coefficients
in either equation.
5.2 Economic Significance of Results
Are the documented effects economically significant? To address the question, we
display in Table 7 a set of marginal effects evaluated at the means of the inde-
pendent variables for the models reported in Table 6 (i.e. using the full set of firm-
level control variables and the four measures for external dependence). The mar-
ginal effects are presented for the expected value of the dependent variable condi-
tional on being uncensored, the unconditional expected value of the dependent
variable, and the probability of being uncensored.
To begin with, consider the marginal effects reported in Panel A for the in-
teraction term that is based on jEXDEPOUT . If there was a two percentage point
(half the cross area standard deviation) increase in government funding in the area

27
where a firm resides, then in an industry where, say, every fifth euro is attribut-
able to outside financiers, i) the firm would, on average, invest about 0.05 million
euros more in R&D ( 0.2*0.02*11.460 0.046≈ ), ii) the firm would, provided that
it already does R&D, invest about 0.04 million euros more in R&D
( 0.2*0.02*9.005 0.036≈ ) on the top it is currently investing, and iii) the prob-
ability of the firm doing R&D would be around 5% higher
( 0.2*0.02*13.374 0.053≈ ). Given that the unconditional mean R&D in the esti-
mation sample is 0.10 million euros, the mean R&D conditional on doing R&D is
0.15 million euros and the probability of being censored is 0.35, the effects are
economically not negligible. The effects are of similar magnitude for the other
measures of external dependence and for the growth equation.
[Insert Table 7 here]
What the reported marginal effects also illustrate is that government funding
disproportionately helps firms in industries that are more dependent on external
finance. For example, in an area where every thirtieth euro of the total debt and
equity is attributable to government agencies, the differential in the probability of
doing R&D is about 5 percentage points ( (0.33 0.2)*0.03*13.374 0.052− ≈ ) be-
tween firms in industries where every third euro is attributable to outside financi-
ers and firms in industries where every fifth euro is attributable to outside financi-
ers. The corresponding differential in the probability of becoming a growth firm is
nearly four percentage points ( (0.33 0.2)*0.03*9.415 0.036− ≈ ).
5.3 Robustness Tests
Are the documented effects statistically robust? To address this question, we con-
duct a number of robustness tests. We have run the tests using the full vector of
firm level control variables. To save space, we only report the coefficients of the
interaction variable in most of what follows.

28
A. Varying the Measure of External Dependence
Our results have so far been shown to hold for four different measures of external
dependence. We undertake an additional robustness check to make sure that our
measures of external dependence are reasonable. In Table 8, external dependence
is measured in relative terms, i.e., on the basis of the ranking of the industries that
the industry means imply. The highest rank indicates the strongest dependence on
external finance. The use of the ranking is motivated by the qualitative nature of
our basic hypothesis suggesting that if capital markets are imperfect, firms in in-
dustries that are more dependent on external financing will invest relatively more
in R&D and are relatively more growth-oriented had they more government fund-
ing around. As the table shows, the interaction variables remain positive and the
patterns of statistical significance are similar to those in Table 6.
[Insert Table 8 here]
B. Varying the Measure of Government Funding
It is reasonable to ask whether the results depend on how we measure the reliance
by firms on government funding. In what follows, we run three tests to show that
the results are not sensitive to the choice of this measure.
First, we measure the availability of government funding in relative terms,
i.e., on the basis of the ranking of TE Centres that the area means imply. Specifi-
cally, we compute for each TE Centre the mean fraction of total debt and equity
attributable to governmental sources (as before) and then assign a ranking to each
TE Centre according to the means, with the highest rank indicating the heaviest
reliance on government funding. As above, the use of the ranking is motivated by
the qualitative nature of our basic hypothesis suggesting that if capital markets are
imperfect, firms in industries that are more dependent on external financing will

29
invest relatively more in R&D and are relatively more growth-oriented had they
more government funding around.
Second, as we already discussed, one limitation of the measure is that it
does not include gratuitous government awards that are not recorded in the bal-
ance sheet of firms. To address the limitation, we include iAWARD (= dummy set
to 1 if firm has during the last fiscal year or prior to it received gratuitous gov-
ernment awards of any kind (or if it has loans guaranteed by a government
agency) that are not recorded in the balance sheet) to the regressions reported in
Table 5 and 6. We expect the dummy variable to be endogenous due to positive or
negative selection bias.20 Despite the possible bias, we include the dummy to il-
lustrate that our results are not driven by an omitted award variable.
Third, because model (1) does not include the firm-level subsidy variable
( iGOVFUN ), a skeptical reader might think that we have so far demonstrated
nothing but an omitted iGOVFUN problem. To show that this is not the case, we
repeat the above exercise by including it to the regressions. We expect iGOVFUN
to be endogenous due to positive selection bias.
Tables 9-11 report the results for the three tests. Table 9 shows that the re-
sults are robust to using the alternative, rank-based definition for the availability
of government funding. The regressions with iAWARD , reported in Table 10,
show that the interaction term is positive and significant as before and that the
dummy obtains a positive coefficient that is never statistically significant. Finally,
the regressions with iGOVFUN , reported in Table 11, show that the interaction
20 The positive selection bias may arise if firms apply for awards because they have discovered promising projects. Similarly, the chance of the firm winning an award may also increase with the amount of R&D it does and the growth options it has. However, because the dummy also captures government employment subsidies, negative selection bias may also arise.

30
term is positive and significant as before. The firm-level iGOVFUN always ob-
tains a positive coefficient that is statistically significant in the growth but not in
R&D equation. We conclude that an omitted subsidy variable is not driving the
results.
[Insert Tables 9-11 here]
As a final robustness check of how to measure government funding, we ad-
dress the concern that we cannot be sure that the geographical distribution of TE
Centres truly reflects the geographical distribution of the relevant local capital
markets. We therefore re-run the basic regressions using Finnish regions instead
of TE Centres.21 Although not reported, we found few, if any, changes in the re-
sults.
C. Do Capital Market Imperfections Drive the Results?
We have claimed that government funding disproportionately helps firms in in-
dustries that are dependent on external finance because capital markets are imper-
fect. The aim of the following robustness test is to deliver evidence supporting
this claim. To derive a proper test, we make a new prediction: Holding other
things constant, firms in industries that are more prone to suffer from capital mar-
ket imperfections will invest relatively more in R&D and are relatively more
growth-oriented, the more they have government funding around. We test this
prediction using the following modified version of model (1):
1 2 3
( )i j a
j a i
i
Y Market imperfection Government funding
Industry dummies Area dummies ControlsError
α β= + ⋅ ⋅
+Φ ⋅ + Φ ⋅ + Φ ⋅
+
(2)
21 Finland consists of 20 ‘regions’, which are kind of small provinces. While the geographical distribution of regions resembles that of TE Centres, there are some differences. They stem from the fact that regions outnumber TE Centres and TE Centres are a governmental organization whereas regions are more like coalitions of municipalities.

31
In model (2), jMarket imperfection has replaced jExternal dependence .
The new industry level -variable measures the extent to which an industry is prone
to suffer from capital market imperfections. We compute it for each industry us-
ing data on SMEs residing outside the metropolitan Helsinki area. Two alternative
measures are used. The first one is based on industry average of iAUDIT (dummy
set to 1 if firm is audited by one of the internationally recognized ‘Big Five’ ac-
counting firms; see Table 1 for descriptive statistics). The justification for this
measure is that the use of such auditors should be more prevalent in industries that
have a higher need to demonstrate their creditworthiness to outsiders, i.e., the
measure should be correlated with an industry’s difficulties in attracting outside
financing (see, e.g., Titman and Trueman 1986 and Core 2001).22 The second
measure is the industry average of iLOANDEN (= dummy set to 1 if a firm’s loan
application has been turned down because of lack of collateral and/or guarantees
during the last two years; see Table 1 for descriptive statistics).23 This measure
aims to capture industry specific difficulties in attracting outside debt finance.
We reran the regressions reported in Table 5 using these two measures of
Market imperfectionj and report the results in Table 12. In all cases, the coefficient
of the interaction term is positive and significant. It remains so even if we include
(firm-level) iAUDIT or iLOANDEN in the estimation equation. We have also
rerun the regressions reported in Table 12 using the full set of explanatory vari-
22 High quality disclosure may be especially important for firms with high growth options because for them standard disclosure is of too low quality and alleviates information asymmetry only to a limited extent (see, e.g., Core 2001). Because of the costs of high quality disclosure, such as the premium charged by the internationally recognized auditors, the firms that choose the high quality disclosure (e.g., a prestigious auditor) are, in equilibrium, those with favorable information about the firm’s future and its growth opportunities (see Titman and Trueman 1986 for a formal model). 23 In the survey, entrepreneurs were asked: “Has your firm’s application for a loan been turned down by a bank or some other credit institution because of lack of collateral (or guarantees) during the last two years?” The question was asked in two parts, first suggesting lack of collateral (Ques-tion 30) and then lack of guarantees (Question 31) as the reason for denial.

32
ables (as in Table 6); the results were almost identical to those reported in Table
12. The results suggest that firms in industries that are more prone to suffer from
capital market imperfections will invest relatively more in R&D and are relatively
more growth-oriented, the more they have government funding around.
[Insert Table 12]
D. Additional Robustness Tests
Because of the censored nature of our dependent variables, we have (up until
now) employed the old and well-known Tobit maximum likelihood estimator
when estimating model (1). While very widely used, a potential problem with this
estimator is that it entails a rather stringent distributional assumption (normality)
and relies on the assumption that the error terms are homoskedastic. If these as-
sumptions are violated, the maximum likelihood estimator will not provide con-
sistent estimates. We tackle this potential problem in a number of ways. First, we
estimate our basic model, i.e., model (1) with the full vector of firm-level control
variables, using OLS. Despite the potential inconsistency of this estimator in the
presence of censoring, this method provides us with a first check of the potential
problems with the Tobit model. There is, in fact, evidence that miss-specifying the
errors as being normally distributed and using the maximum likelihood method
may result in more biased estimates than ignoring the censoring problem entirely
and using OLS (Chay and Powell 2001; see also Chay and Honore 1998). Second,
we log-transform the dependent variable and re-estimate the basic model both
using OLS and the Tobit maximum likelihood estimator. This way of transform-
ing the dependent variable is a means to account for the non-normality of the er-
rors also when the dependent variable is censored (see Maddala 1983, pp. 190-
192, for a discussion). Third, we estimate a version of our model using the cen-

33
sored least absolute deviations (CLAD) estimation method proposed by Powell
(1984). This estimator both accounts for censoring and permits non-normal, het-
eroscedastic and asymmetric errors.
We perform each of the above-described robustness tests for our two de-
pendent variables and for the four different measures of external dependence. We
therefore obtain over thirty new estimates for the interaction term of model (1),
the term on which our analysis focuses. The results of the tests can be summarized
as follows:
• When the basic model is estimated by OLS, the coefficient of the interac-
tion term is positive and statistically significant at better than the 10%
level in each of the eight regressions we run. In five of these regressions,
it is significant at the 5% level.
• When the dependent variables are log-transformed and the estimation
method is OLS, the coefficient of the interaction term is positive and sta-
tistically significant at better than the 10% level in seven out of the eight
cases and at better than the 5% level in six out of the eight cases. With
the log-transformed dependent variables and the Tobit estimator, the
same pattern of statistical significance holds.
• It turns out that we cannot resort to Powell’s CLAD estimator without a
cost. The cost arises because the objective function that the estimator
solves (minimizes) is not convex and because the problems that this non-
convexity give a rise to are likely to increase with the number of regres-
sors (see also Buchinsky and Hahn 1998). In our case, the estimator fails
to converge when we try to estimate our basic model, both with the
smaller set (cf. Table 5) and full vector (cf. Table 6) of firm-level control
variables. To apply the estimator, we proceed as follows. We only con-

34
sider the small set of firm-level controls. We then estimate the model us-
ing the Tobit estimator without industry and area dummies to check how
our results change if they are not controlled for. It turns out that in all
cases, the coefficient of the interaction term decreases quite a lot, but
remains clearly positive. In fact, its statistical significance increases in all
eight regressions we run: the term is now significant at the 5% level in all
cases and at better than the 1% level in seven out of the eight regressions.
When we apply Powell’s CLAD estimator to this “trimmed” model and
bootstrap the standard errors, we find that the size of the coefficient of
the interaction term decreases further in both R&D and growth equations.
However, the term is positive and significant at better than the 10% level
in six out of the eight regressions.
Taken together, the foregoing tests show that our results are driven neither
by the normality nor homoskedasticity assumption.
As a final robustness test, we investigate whether “biotechnology-related”
SMEs are driving our results. Biotechnology firms are typically R&D intensive
and growth-oriented, and dependent on external finance. In Finland, they are also
clustered on certain geographical areas (see the Academy of Finland 2002). The
reason we investigate the effects of this group of SMEs on our results is that a
closer look at the unconditional R&D and growth distributions revealed that “bio-
technology-related” SMEs are clearly more R&D-intensive and growth-oriented
than other SMEs in our sample.24 Given that the Finnish government has through
various agencies and means invested heavily in such firms since the early 1990s,
it is of interest to include a dummy for SMEs in biotechnology business in our

35
basic regression models (cf. Tables 5 and 6). Doing so does not change the basic
results: the interaction remains statistically significant. The dummy obtains, how-
ever, a positive and in most cases statistically significant coefficient. This finding
indicates that the “biotechnology-related” SMEs are very R&D intensive and
growth-oriented even after controlling for their age, size and other characteristics.
E. Summary of Robustness Tests
We have shown that our results are robust to a variety of alternative definitions of
key variables and to including (possibly endogenous) firm-level subsidy variables
in the estimating equation. We also provided supporting evidence for the claim
that government funding disproportionately helps firms in industries that are de-
pendent on external finance because capital markets are imperfect. The results
hold also when we allow for non-normal, heteroscedastic and asymmetric errors
when estimating our censored regression model.
Overall, the results support the view that the growth and innovativeness of
small firms is constrained by access to external finance, and that government
funding is able to alleviate these constraints.
6 Conclusions The hypothesis put forward and tested in this paper is that if there are economi-
cally significant imperfections in capital markets, government funding should
disproportionately help firms in industries that are dependent on external finance.
We deliver evidence supporting the hypothesis by studying the effects of govern-
ment funding on the R&D investments and growth orientation of SMEs in
Finland.
24 We cannot identify “biotechnology-related” SMEs using the standard industry classifications. However, the survey on which our data is based included a question about whether the respondent firm is in “biotechnology business”.

36
We adapt the methodology put forward by Rajan and Zingales (1998). First,
in place of their financial development -variable, we use a measure of the avail-
ability of government funding to privately owned SMEs. We also shift the focus
to the effects of cross-regional, between industry differences on a firm-level vari-
able. Finally, we identify industries’ technological demand for external finance,
but using data on SMEs in the metropolitan Helsinki area that has the most devel-
oped capital market within Finland.
Our analysis shows that firms in industries that are more dependent on ex-
ternal financing invest relatively more in R&D and are relatively more growth-
oriented when they have more government funding (potentially) available. The
result is robust to a number of tests. We also demonstrate that the effects are eco-
nomically significant.
The findings of this paper suggest that SMEs face an upward-sloping capital
supply curve and hence that the market for SME finance is imperfect. The evi-
dence is consistent with the view that financial constraints hold back innovation
and growth, and the hypothesis that government funding can alleviate capital
market imperfections. The latter finding is of special policy interest, not only be-
cause it contributes to the recent research studying the effects of public policy on
firm performance but also because it qualifies the picture portrayed by the recent
papers of La Porta, Lopez-de-Silanes and Shleifer (2002) and Sapienza (2003) on
the effects of government ownership of financial institutions. While these papers
have convincingly shown that the government ownership of financial institutions
leads to misallocation of capital that can be detrimental to economic growth, our
findings suggest that the type of government involvement may matter. Beyond
these conclusions, our results have no implications for public policy. In particular,
one cannot draw conclusions about the welfare effects of government funding (cf.

37
de Meza and Webb 1987, 2000 and de Meza 2002). Measuring these remains a
challenging topic for future research.
So, to conclude, does enterprise lead and finance follow? Our answer to this
long-standing question is ‘no’, as for Finnish SMEs it seems to be the other way
around.

References
Academy of Finland. “Biotechnology in Finland. Impact of Public Research Funding and Strate-gies for the Future.” Evaluation report, Publications of the Academy of Finland 11/02, 2002.
Aghion, Philippe and Tirole, Jean. “The Management of Innovation.” Quarterly Journal of Eco-nomics, November 1994, pp. 1185-1209.
Anton, James J. and Yao, Dennis A. “Expropriation and Inventions: Appropriable Rents in the Absence of Property Rights.” American Economic Review, March 1994, 80(1), pp. 190-209.
Bhattacharya, Sudipto and Chiesa, Gabriella. “Proprietary Information, Financial Intermediation, and Research Incentives.” Journal of Financial Intermediation, 1995, 4, pp. 328-357.
Buchinsky, Moshe and Hahn, Jinyong. “An Alternative Estimator for the Censored Quantile Re-gression Model.” Econometrica, May 1998, 66(3), pp. 653-671.
Carpenter Robert E. and Petersen, Bruce C. “ Is the Growth of Small Firms Constrained by Inter-nal Finance?” Review of Economics and Statistics, May 2002, 84(2), pp. 298-309. 2002.
Carlin, Wendy and Mayer, Colin. “Finance, Investment and Growth.” Journal of Financial Eco-nomics, 2002, forthcoming.
Cetorelli, Nicola and Gampera, Michele. “Banking Market Structure, Financial Dependence and Growth; International Evidence from Industry Data.” Journal of Finance, April 2001, 56(2), pp. 617-648.
Chay, Kenneth Y. and Powell, James L. “Semiparametric Regression Models.” mimeo, 2001, University of California at Berkeley.
Chay, Kenneth Y. and Honore, Bo E. “Estimation of Semiparametric Regression Models: An Application to Changes in Black-White Earnings Inequality During the 1960s” Journal of Human Resources, Winter 1998, pp. 4-38.
Core, John E. “A Review of the Empirical Disclosure Literature: Discussion.” Journal of Account-ing and Economics, 2001, 31, pp. 441-456.
David, Paul A., Hall, Bronwyn H. and Toole, Andrew A. “Is Public R&D a Complement or Sub-stitute for Private R&D? A Review of Econometric Evidence.” Research Policy, 2000, 29, pp. 497-529.
de Meza, David. “Overlending?” Economic Journal, 2002, 112, pp. F17-F31.
de Meza, David and Webb, David C., “Too Much Investment: A Problem of Asymmetric Informa-tion?” Quarterly Journal of Economics, 1987, 102, pp. 375-386.
de Meza, David and Webb, David C., “Does Credit Rationing Imply Insufficient Lending?” Jour-nal of Public Economics, 2000, 78, pp. 215-234.
Demirkgüç-Kunt, Asli, and Maksimovic, Vojislav. “Law, Finance and Firm Growth.” Journal of Finance, 1998, 53, pp. 2107-2137.
Demirkgüç-Kunt, Asli, and Maksimovic, Vojislav. “Funding Growth in Bank-based and Market-based Financial Systems: Evidence from Firm Level Data, Journal of Financial Economics, forthcoming.
Griliches, Zvi. “The Search for R&D Spillovers.” Scandinavian Journal of Economics, 1992, 94, pp. 29-47.

39
GEM, Global Entrepreneurship Monitor 2001: International Executive Report, (Reynolds, P., Camp, M., Bygrave, B., Autio, E., and Hay, M.), Ewing Marion Kauffman Foundation, Kansas City.
Hall, Bronwyn H. “The Financing of Research and Development” Oxford Review of Economic Policy, 2002, 18(1), pp. 35-51.
Higgins, Robert C. “How Much Growth a Firm Can Afford?” Financial Management, 1977, 6, pp. 3-16.
Holmström, Bengt. “Agency Costs and Innovation”, Journal of Economic Behavior and Organiza-tion, 1989, 12, pp. 305-327.
Hubbart, Glenn R. “Capital-market Imperfections and Investment.” Journal of Economic Litera-ture, 1998, 36, 193-225.
Hyytinen, Ari and Pajarinen, Mika. “Small Business Finance in Finland: A Descriptive Study.” The Research Institute of the Finnish Economy Discussion papers, 2002, No. 812.
Hyytinen, Ari, Kuosa, Iikka and Takalo, Tuomas. ”Law or Finance: Evidence from Finland.” European Journal of Law and Economics, 2003, forthcoming.
IMD, World Competitiveness Yearbook 2002, Lausanne.
Jaffe, Adam B. “Building Programme Evaluation into the Design of Public Research-Support Programmes.” Oxford Review of Economic Policy, 2002, 18, pp. 22-34.
Klette, Tor Jacob, Møen, Jarle, and Griliches, Zvi. “Do Subsidies to Commercial R&D Reduce Market Failures? Microeconomic Evaluation Studies.” Research Policy, 2000, 29, pp. 471-495.
King, Robert G., and Levine, Ross. “Finance and Growth: Schumpeter Might Be Right.” Quar-terly Journal of Economics, 1993, 108, pp. 713-37.
Lach, Saul. “Do R&D Subsidies Stimulate or Displace Private R&D? Evidence from Israel.” Journal of Industrial Economics, 2002, 50, pp. 369-390.
La Porta, Rafael, Lopez-de-Silanes, Florencio, and Shleifer, Andrei. “Government Ownership of Banks.” Journal of Finance, 2002, 56, pp. 265-301.
Lerner, Josh. “Venture Capitalists and the Oversight of Private Firms.” Journal of Finance, March 1995, 50, pp. 301-318.
Lerner, Josh. “The Government as Venture Capitalist: The Long-Run Impact of the SBIR Pro-gram.” Journal of Business, 1999, 72 (3), pp. 285-318.
Lichtenberg, F. “The Private R&D Investment Response to Federal Design and Technical Compe-titions.” American Economic Review, 1988, 78, pp. 550-559.
Maddala, G. S. “Limited-Dependent and Qualitative Variables in Econometrics”, 1983, Cam-bridge University Press, Cambridge.
Myers, Steward C. and Majluf, Nicholas. “Corporate Financing and Investment When Firms Have Information That Investors Do Not Have.” Journal of Financial Economics, 1984, 13, pp. 187-221.
Organization for Economic Co-operation and Development. “OECD Small and Medium Enter-prise Outlook 2000.” Paris, 2000.
Petersen, Mitchell A. and Rajan, Raghuram. “Does Distance Still Matter: The Information Revolu-tion in Small Business Lending.” Journal of Finance, December 2002, 57, pp. 2533-2570.

40
Powell, James L. “Least Absolute Deviations Estimation for the Censored Regression Model.” Journal of Econometrics, 1984, 25, pp. 303-325.
Rajan, Raghuram G. and Zingales, Luigi. “Financial Dependence and Growth.” American Eco-nomic Review, 1998, 88, pp. 559-587.
Robinson, Joan. “The Generalization of the General Theory.” The rate of interest and other essays. London: Macmillan, 1952, pp. 67-142.
Sapienza, Paola. “The Effects of Government Ownership on Bank Lending.” Journal of Financial Economics, 2003, forthcoming.
Titman, Sheridan and Trueman, Brett. ”Information Quality and Valuation of New Issues.” Jour-nal of Accounting and Economics, 1986, 8, pp. 159-172.
Wallsten, Scott. ”The Effects of Government-industry R&D Programs on Private R&D: The Case of the Small Business Innovation Research Program.” RAND Journal of Economics, Spring 2000, 31 (1), pp. 82-100.
World Economic Forum, Global Competitiveness Report 2001, Davos.

Figure 1 The Effect of Financial Market Imperfections
Cost of funds
Rate of return
R&D Investment
Sales growth
MCC (imperfect)MRR
A
B
MCC (perfect)
Cost of funds
Rate of return
R&D Investment
Sales growth
MCC (imperfect)MRR
A
B
MCC (perfect)
Figure 2 The (Direct) Effect of Shifting the MCC Schedule
Cost of funds
Rate of return
R&D Investment
Sales growth
MCCMRR
MRR
C
D
D*
Cost of funds
Rate of return
R&D Investment
Sales growth
MCCMRR
MRR
C
D
D*

42
Table 1 Firm-level Descriptive Statistics
Obs Mean Std. Dev. Min Max
R&Di 618 0.11 0.69 0.00 15.47GROWTHi 675 0.19 0.49 0.00 10.00EXDEPOUTi 723 0.40 0.34 0 1EXDEPSGi 646 0.36 0.48 0 1EXDEPLOSSi 724 0.10 0.31 0 1EXDEPPROFi 675 0.33 0.47 0 1GOVFUNi 715 0.07 0.16 0 1AGEi 723 15.92 16.69 0 118EMPi 724 17.16 26.60 1 230CEOAGEi 706 9.34 7.07 0 42CEOEDUCi 709 0.29 0.45 0 1PRINSOWNi 724 0.69 0.46 0 1SHAREAGRi 712 0.24 0.43 0 1CONCOWNi 723 0.96 0.21 0 1FOREOWNi 724 0.04 0.20 0 1BOARDOWNi 723 0.88 0.33 0 1BOARDi 723 2.85 1.49 0 12BOARDINSi 723 1.76 1.03 0 8CEOCHAIRi 722 0.50 0.50 0 1INPRODi 720 0.44 0.50 0 1INPROCi 716 0.30 0.46 0 1PATENTi 723 0.12 0.33 0 1INTANGi 722 0.22 0.41 0 1LOANDENi 724 0.05 0.21 0 1AUDITi 721 0.24 0.43 0 1AWARDi 724 0.45 0.50 0 1
Notes: This table reports firm-level descriptive statistics (number of observations, mean, standard deviation, minimum and maximum). The number of observations for an explanatory variable may exceed the number observations for the dependent variables, because we lack data on R&Di for some firms for which we have data on GROWTHi, and vice versa. All the information is obtained from a primary survey administrated by the Research Institute of the Finnish Economy (ETLA) and its subsidiary Etlatieto Ltd between December 2001 and January 2002. The survey covered SMEs that are not proprietorships, partnerships, or subsidiaries and that are not from farm, finan-cial, or real-estate sectors.

43
Table 2 Selected Firm-level Correlations
R&Di GROWTHi EXDEPOUTi EXDEPLOSSi EXDEPSGi EXDEPPROFi GOVFUNi
R&Di 1.00
618
GROWTHi 0.80 1.00 (0.00)
569 675
EXDEPOUTi 0.03 0.05 1.00 (0.49) (0.23)
617 674 723
EXDEPLOSSi 0.17 0.25 0.19 1.00 (0.00) (0.00) (0.00)
618 675 723 724
EXDEPSGi 0.09 0.20 0.16 0.40 1.00 (0.03) (0.00) (0.00) (0.00)
553 610 646 646 646
EXDEPPROFi 0.08 0.05 0.00 0.19 0.09 1.00 (0.05) (0.26) (0.97) (0.00) (0.03)
577 631 674 675 607 675
GOVFUNi 0.18 0.28 0.38 0.21 0.24 -0.02 1.00 (0.00) (0.00) (0.00) (0.00) (0.00) (0.69)
611 669 715 715 640 667 715
Notes: This table reports firm-level pairwise correlations (coefficient of correlation, p-value and number of observations) for dependent variables and selected firm-level variables measuring ex-ternal dependence and government funding. The number of observations vary, because we lack data on R&Di for some firms for which we have data on GROWTHi, and vice versa. All the infor-mation is obtained from a primary survey administrated by the Research Institute of the Finnish Economy (ETLA) and its subsidiary Etlatieto Ltd between December 2001 and January 2002. The survey covered SMEs that are not proprietorships, partnerships, or subsidiaries and that are not from farm, financial, or real-estate sectors.

44
Table 3 Industry-level Descriptive Statistics for External Dependence
PANEL A
EXDEPOUTj EXDEPSGj EXDEPLOSSj EXDEPPROFj
ICT services, excluding software 0.49 0.33 0.14 0.29 R&D services 0.49 0.38 0.22 0.75 Wood-processing and chemicals 0.46 0.50 0.50 0.67 Printing and publishing 0.46 0.67 0.20 0.50 Mechanical engineering 0.46 0.22 0.00 0.20 Trade and transport 0.40 0.29 0.04 0.36 Electrical engineering n.e.c. 0.40 0.00 0.00 0.50 Food, beverages, textiles 0.37 0.33 0.00 0.50 Scientific instruments 0.34 0.60 0.00 0.20 ICT manufacturing n.e.c. 0.32 0.36 0.00 0.31 Computers 0.31 0.60 0.29 0.57 Software 0.27 0.43 0.21 0.43 Metals, construction, energy supply 0.18 0.25 0.00 0.33 Services n.e.c. 0.16 0.26 0.05 0.35
Means
PANEL B
Mean Std. Dev. Min Max
EXDEPOUTj 0.37 0.11 0.16 0.49 EXDEPSGj 0.37 0.18 0.00 0.67 EXDEPLOSSj 0.12 0.15 0.00 0.50 EXDEPPROFj 0.43 0.17 0.20 0.75
Summary statistics
Notes: n.e.c = not elsewhere cited. Panel A of this table reports the mean of the four measures of external dependence for 14 industries (defined using two-level SIC-like industry codes), measured using data on SMEs residing in the metropolitan Helsinki area. Panel B of the table reports sum-mary statistics for the four measures. All the information is obtained from a primary survey admin-istrated by the Research Institute of the Finnish Economy (ETLA) and its subsidiary Etlatieto Ltd between December 2001 and January 2002. The survey covered SMEs that are not proprietorships, partnerships, or subsidiaries and that are not from farm, financial, or real-estate sectors.

45
Table 4 TE Centre-level Descriptive Statistics for Government Funding
PANEL A Mean
GOVFUNa
Kainuu 0.17 Pohjois-Pohjanmaa 0.12 Etelä-Savo 0.11 Varsinais-Suomi 0.11 Keski-Suomi 0.11 Pohjois-Karjala 0.10 Pohjois-Savo 0.09 Lappi 0.06 Häme 0.06 Etelä-Pohjanmaa 0.05 Satakunta 0.05 Pirkanmaa 0.04 Kaakkois-Suomi 0.04 Pohjanmaa 0.04 Uusimaa 0.04
PANEL B
Mean Std. Dev. Min Max
GOVFUNa 0.08 0.04 0.04 0.17
Summary statistics
Notes: n.e.c = not elsewhere cited. Panel A of this table reports the mean of government funding for 15 TE Centres, measured using data on SMEs residing in each TE-Centre. Panel B of the table reports summary statistics for the measure. All the information is obtained from a primary survey administrated by the Research Institute of the Finnish Economy (ETLA) and its subsidiary Etlati-eto Ltd between December 2001 and January 2002. The survey covered SMEs that are not proprie-torships, partnerships, or subsidiaries and that are not from farm, financial, or real-estate sectors.

46
Table 5 R&D and Firm Growth Regressions
PANEL A
Coeff. t-stat. Coeff. t-stat. Coeff. t-stat. Coeff. t-stat.
GOVFUNa *
EXDEPOUTj 26.88 2.04 - - -EXDEPSGj - 13.02 1.54 - -EXDEPLOSSj - - 29.73 3.46 -EXDEPPROFj - - - 22.21 2.41
AGEi -8.5E-03 -1.11 -7.7E-03 -1.01 -6.9E-03 -0.91 -7.4E-03 -0.96AGE^2i 3.7E-05 0.43 3.0E-05 0.35 2.0E-05 0.24 2.4E-05 0.29EMPi 0.02 5.29 0.02 5.13 0.02 5.24 0.02 5.25EMP^2i -1.0E-04 -3.49 -1.0E-04 -3.44 -1.0E-04 -3.45 -1.0E-04 -3.50
Ind. dummiesArea dummies
ObservationsCensored obs.Log likelihoodLR Chi2
degr. of freedomsignificance
R2pseudo
Dependent variable: R&Di
(1) (2) (4)(3)
Yes Yes YesYes Yes Yes
YesYes
476 476 476 476 173 173 173 173
-472.28 -473.19 -468.43 -471.49 82.14 80.33 89.84 83.73
32 32 32 32 0.00 0.00 0.00 0.00 0.08 0.08 0.09 0.08
PANEL B
Coeff. t-stat. Coeff. t-stat. Coeff. t-stat. Coeff. t-stat.
GOVFUNa *
EXDEPOUTj 12.22 1.80 - - -EXDEPSGj - 10.39 2.20 - -EXDEPLOSSj - - 19.93 4.15 -EXDEPPROFj - - - 14.83 2.89
AGEi -0.01 -3.30 -0.01 -3.19 -0.01 -3.06 -0.01 -3.21AGE^2i 1.1E-04 2.28 1.1E-04 2.19 9.8E-05 2.05 1.1E-04 2.19EMPi 8.2E-03 3.58 7.8E-03 3.43 7.9E-03 3.53 7.9E-03 3.51EMP^2i -4.1E-05 -2.74 -4.0E-05 -2.68 -3.9E-05 -2.68 -4.0E-05 -2.74
Ind. dummiesArea dummies
ObservationsCensored obs.Log likelihoodLR Chi2
degr. of freedomsignificance
R2pseudo
Yes Yes YesYes Yes Yes
YesYes
Dependent variable: GROWTHi
(1) (2) (4)(3)
519 519 519 519 97 97 97 97
-398.09 -397.30 -391.28 -395.56 69.45 71.04 83.07 74.51
32 32 32 32 0.00 0.00 0.00 0.00 0.08 0.08 0.10 0.09
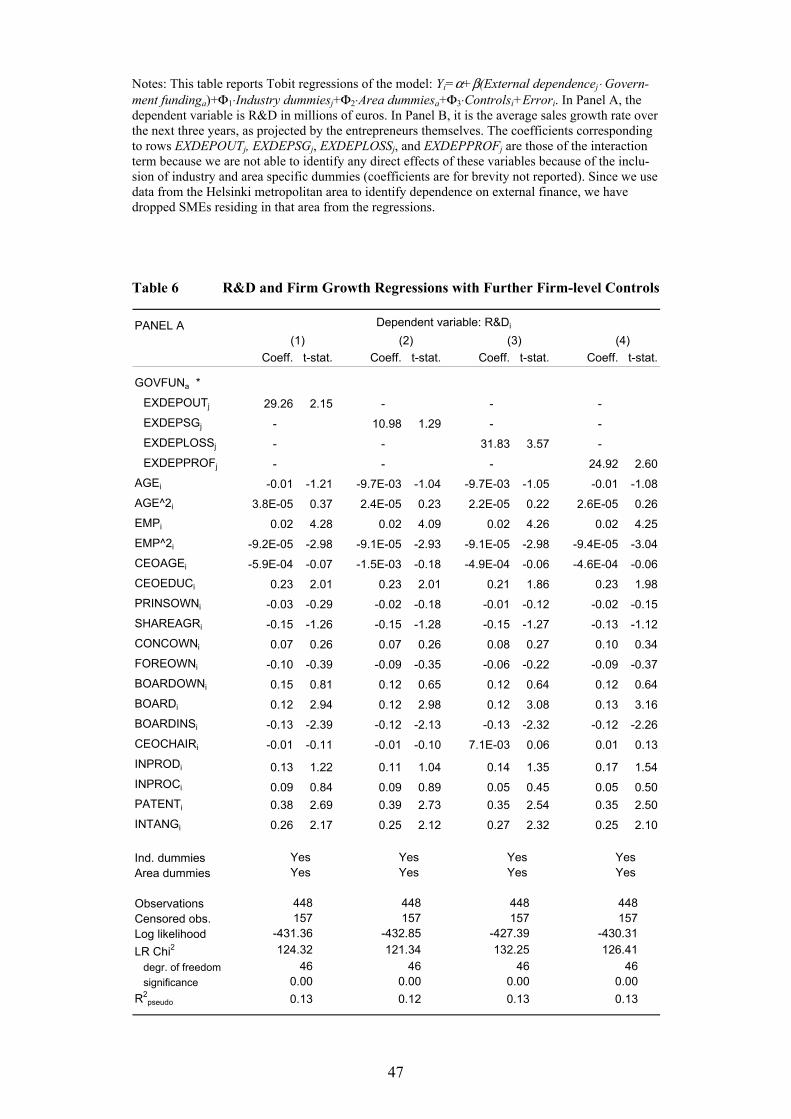
47
Notes: This table reports Tobit regressions of the model: Yi=α+β(External dependencej⋅ Govern-ment fundinga)+Φ1⋅Industry dummiesj+Φ2⋅Area dummiesa+Φ3⋅Controlsi+Errori. In Panel A, the dependent variable is R&D in millions of euros. In Panel B, it is the average sales growth rate over the next three years, as projected by the entrepreneurs themselves. The coefficients corresponding to rows EXDEPOUTj, EXDEPSGj, EXDEPLOSSj, and EXDEPPROFj are those of the interaction term because we are not able to identify any direct effects of these variables because of the inclu-sion of industry and area specific dummies (coefficients are for brevity not reported). Since we use data from the Helsinki metropolitan area to identify dependence on external finance, we have dropped SMEs residing in that area from the regressions.
Table 6 R&D and Firm Growth Regressions with Further Firm-level Controls
PANEL A
Coeff. t-stat. Coeff. t-stat. Coeff. t-stat. Coeff. t-stat.
GOVFUNa *
EXDEPOUTj 29.26 2.15 - - -EXDEPSGj - 10.98 1.29 - -EXDEPLOSSj - - 31.83 3.57 -EXDEPPROFj - - - 24.92 2.60
AGEi -0.01 -1.21 -9.7E-03 -1.04 -9.7E-03 -1.05 -0.01 -1.08AGE^2i 3.8E-05 0.37 2.4E-05 0.23 2.2E-05 0.22 2.6E-05 0.26EMPi 0.02 4.28 0.02 4.09 0.02 4.26 0.02 4.25EMP^2i -9.2E-05 -2.98 -9.1E-05 -2.93 -9.1E-05 -2.98 -9.4E-05 -3.04CEOAGEi -5.9E-04 -0.07 -1.5E-03 -0.18 -4.9E-04 -0.06 -4.6E-04 -0.06CEOEDUCi 0.23 2.01 0.23 2.01 0.21 1.86 0.23 1.98PRINSOWNi -0.03 -0.29 -0.02 -0.18 -0.01 -0.12 -0.02 -0.15SHAREAGRi -0.15 -1.26 -0.15 -1.28 -0.15 -1.27 -0.13 -1.12CONCOWNi 0.07 0.26 0.07 0.26 0.08 0.27 0.10 0.34FOREOWNi -0.10 -0.39 -0.09 -0.35 -0.06 -0.22 -0.09 -0.37BOARDOWNi 0.15 0.81 0.12 0.65 0.12 0.64 0.12 0.64BOARDi 0.12 2.94 0.12 2.98 0.12 3.08 0.13 3.16BOARDINSi -0.13 -2.39 -0.12 -2.13 -0.13 -2.32 -0.12 -2.26CEOCHAIRi -0.01 -0.11 -0.01 -0.10 7.1E-03 0.06 0.01 0.13INPRODi 0.13 1.22 0.11 1.04 0.14 1.35 0.17 1.54INPROCi 0.09 0.84 0.09 0.89 0.05 0.45 0.05 0.50PATENTi 0.38 2.69 0.39 2.73 0.35 2.54 0.35 2.50INTANGi 0.26 2.17 0.25 2.12 0.27 2.32 0.25 2.10
Ind. dummiesArea dummies
ObservationsCensored obs.Log likelihoodLR Chi2
degr. of freedomsignificance
R2pseudo
Yes Yes YesYes Yes Yes
YesYes
Dependent variable: R&Di
(1) (2) (4)(3)
448 448 448 448 157 157 157 157
-431.36 -432.85 -427.39 -430.31 124.32 121.34 132.25 126.41
46 46 46 46 0.00 0.00 0.00 0.00 0.13 0.12 0.13 0.13

48
PANEL B
Coeff. t-stat. Coeff. t-stat. Coeff. t-stat. Coeff. t-stat.
GOVFUNa *
EXDEPOUTj 12.39 1.80 - - -EXDEPSGj - 9.94 2.10 - -EXDEPLOSSj - - 20.99 4.28 -EXDEPPROFj - - - 16.17 3.10
AGEi -0.01 -2.61 -0.01 -2.45 -0.01 -2.40 -0.01 -2.51AGE^2i 8.5E-05 1.56 7.7E-05 1.43 7.2E-05 1.35 7.8E-05 1.45EMPi 5.6E-03 2.27 5.0E-03 2.07 5.5E-03 2.31 5.4E-03 2.22EMP^2i -2.9E-05 -1.87 -2.7E-05 -1.76 -2.8E-05 -1.86 -2.9E-05 -1.89CEOAGEi -5.5E-03 -1.23 -6.0E-03 -1.35 -5.8E-03 -1.34 -5.5E-03 -1.26CEOEDUCi 0.09 1.36 0.08 1.31 0.08 1.24 0.09 1.39PRINSOWNi 8.5E-03 0.13 0.02 0.26 0.01 0.23 0.01 0.20SHAREAGRi -0.06 -0.91 -0.06 -0.97 -0.06 -0.93 -0.05 -0.70CONCOWNi 0.03 0.20 0.03 0.21 0.03 0.19 0.04 0.26FOREOWNi -0.16 -1.13 -0.15 -1.04 -0.12 -0.88 -0.15 -1.05BOARDOWNi 0.10 1.04 0.09 0.88 0.08 0.83 0.08 0.82BOARDi 0.06 2.54 0.06 2.49 0.06 2.58 0.06 2.70BOARDINSi -0.05 -1.84 -0.05 -1.61 -0.05 -1.77 -0.05 -1.84CEOCHAIRi -0.03 -0.53 -0.04 -0.64 -0.02 -0.39 -0.03 -0.41INPRODi -0.02 -0.26 -0.02 -0.42 5.3E-04 0.01 4.2E-03 0.07INPROCi -3.3E-03 -0.06 -3.4E-03 -0.06 -0.04 -0.69 -0.03 -0.59PATENTi 0.31 3.82 0.32 3.87 0.29 3.60 0.29 3.54INTANGi 0.13 1.87 0.13 1.93 0.14 2.06 0.13 1.87
Ind. dummiesArea dummies
ObservationsCensored obs.Log likelihoodLR Chi2
degr. of freedomsignificance
R2pseudo
Dependent variable: GROWTHi
(1) (2) (4)(3)
Yes Yes YesYes Yes Yes
YesYes
491 491 491 491 90 90 90 90
-363.28 -362.72 -356.00 -360.17 109.06 110.18 123.63 115.28
46 46 46 46 0.00 0.00 0.00 0.00 0.13 0.13 0.15 0.14
Notes: see Table 5.

49
Table 7 Marginal Effects
PANEL A
GOVFUNa *
EXDEPOUTj 11.46 9.00 13.37 EXDEPSGj 4.31 3.39 5.01 EXDEPLOSSj 12.49 9.80 14.76 EXDEPPROFj 9.78 7.68 11.45
R&Di 0.10 0.15 0.65
PANEL B
GOVFUNa x
EXDEPOUTj 7.10 5.02 9.42 EXDEPSGj 5.71 4.04 7.58 EXDEPLOSSj 12.11 8.56 16.25 EXDEPPROFj 9.29 6.57 12.38
GROWTHi 0.18 0.21 0.82
Dependent variable: R&Di
Marginal effects at the means of explanatory variables
Unconditional expected value
Conditional on being uncensored
Probability uncensored
Unconditional mean value
Mean conditional on being uncensored
Probability uncensored
Dependent variable: GROWTHi
Marginal effects at the means of explanatory variables
Unconditional expected value
Conditional on being uncensored
Probability uncensored
Unconditional mean value
Mean conditional on being uncensored
Probability uncensored
Notes: This table reports the marginal effects of the Tobit regressions for the models that include area and industry fixed effects and the full vector of control variables (reported in Table 6): In Panel A, the dependent variable is R&D in millions of euros. In Panel B, it is the average sales growth rate over the next three years, as projected by the entrepreneurs themselves. The marginal effects have been evaluated at the means of the explanatory variables. The unconditional mean, mean conditional on being uncensored and probability uncensored of the dependent variables refer to the estimating sample.

50
Table 8 Robustness: Rank-based External Dependence
Dependent variable:
Coeff. t-stat. Coeff. t-stat.
GOVFUNa *
EXDEPOUTj 0.96 2.49 0.42 2.11EXDEPSGj 0.62 1.59 0.56 2.65EXDEPLOSSj 1.52 3.05 1.04 3.76EXDEPPROFj 1.00 2.22 0.64 2.58
R&Di GROWTHi
Notes: This table reports a modified version of the basic regressions that include area and industry fixed effects and the full vector of control variables (reported in Table 6): In Panel A, the depend-ent variable is R&D in millions of euros. In Panel B, it is the average sales growth rate over the next three years, as projected by the entrepreneurs themselves. The modification is that the four measures for external dependence are based on the ranking of the industries that the industry aver-ages imply.
Table 9 Robustness: Rank-based Government Funding
Dependent variable:
Coeff. t-stat. Coeff. t-stat.
GOVFUNa *
EXDEPOUTj 0.24 2.33 0.10 1.98EXDEPSGj 0.08 1.22 0.10 1.98EXDEPLOSSj 0.22 3.46 0.15 4.24EXDEPPROFj 0.19 2.64 0.13 3.26
R&Di GROWTHi
Notes: This table reports a modified version of the basic regressions that include area and industry fixed effects and the full vector of control variables (reported in Table 6): In Panel A, the depend-ent variable is R&D in millions of euros. In Panel B, it is the average sales growth rate over the next three years, as projected by the entrepreneurs themselves. The modification is that the meas-ure for government funding is based on the ranking of the TE Centres that the area averages imply.

51
Table 10 Robustness: The inclusion of AWARDi
PANEL A
Coeff. t-stat. Coeff. t-stat. Coeff. t-stat. Coeff. t-stat.
GOVFUNa *
EXDEPOUTj 29.68 2.17 - - -EXDEPSGj - 11.21 1.31 - -EXDEPLOSSj - - 32.70 3.65 -EXDEPPROFj - - - 25.25 2.63
AWARDi 0.07 0.70 0.07 0.66 0.10 0.96 0.07 0.73
PANEL B
Coeff. t-stat. Coeff. t-stat. Coeff. t-stat. Coeff. t-stat.
GOVFUNa *
EXDEPOUTj 12.47 1.82 - - -EXDEPSGj - 10.19 2.15 - -EXDEPLOSSj - - 21.19 4.32 -EXDEPPROFj - - - 16.22 3.11
AWARDi 0.06 1.01 0.06 1.09 0.06 1.15 0.06 1.03
Dependent variable: R&Di
(1) (2) (4)(3)
Dependent variable: GROWTHi
(1) (2) (3) (4)
Notes: This table reports a modified version of the basic regressions that include area and industry fixed effects and the full vector of control variables (reported in Table 6): In Panel A, the depend-ent variable is R&D in millions of euros. In Panel B, it is the average sales growth rate over the next three years, as projected by the entrepreneurs themselves. The modification is that a new variable AWARDi (= dummy set to 1 if firm has during the last fiscal year or prior to it received gratuitous government awards of any kind (or if it has loans guaranteed by a government agency) that are not recorded in the balance sheet) is included in the model.

52
Table 11 Robustness: The inclusion of GOVFUNi
PANEL A
Coeff. t-stat. Coeff. t-stat. Coeff. t-stat. Coeff. t-stat.
GOVFUNa *
EXDEPOUTj 31.04 2.23 - - -EXDEPSGj - 10.92 1.26 - -EXDEPLOSSj - - 31.63 3.54 -EXDEPPROFj - - - 25.37 2.62
GOVFUNi 0.50 1.70 0.48 1.64 0.46 1.61 0.49 1.68
PANEL B
Coeff. t-stat. Coeff. t-stat. Coeff. t-stat. Coeff. t-stat.
GOVFUNa *
EXDEPOUTj 13.54 1.95 - - -EXDEPSGj - 9.31 1.97 - -EXDEPLOSSj - - 20.96 4.32 -EXDEPPROFj - - - 16.56 3.18
GOVFUNi 0.58 3.58 0.57 3.50 0.58 3.63 0.59 3.66
Dependent variable: GROWTHi
(1) (2) (3) (4)
Dependent variable: R&Di
(1) (2) (4)(3)
Notes: This table reports a modified version of the basic regressions that include area and industry fixed effects and the full vector of control variables (reported in Table 6): In Panel A, the depend-ent variable is R&D in millions of euros. In Panel B, it is the average sales growth rate over the next three years, as projected by the entrepreneurs themselves. The modification is that a new variable GOVFUNi (=the fraction of total debt and equity, as recorded in firms’ balance sheets, that is attributable to the government agencies that provide public SME support and R&D finance in Finland) is included in the model.

53
Table 12 Robustness: Capital Market Imperfection
PANEL A
Coeff. t-stat. Coeff. t-stat. Coeff. t-stat. Coeff. t-stat.
GOVFUNa *
AUDITj 49.82 2.27 - 48.46 2.21 -LOANDENj - 76.99 2.35 - 77.43 2.36
AUDITi - - 0.18 1.69 -LOANDENi - - - -0.15 -0.71AGEi -8.6E-03 -1.13 -7.6E-03 -1.00 -7.4E-03 -0.96 -7.9E-03 -1.04AGE^2i 3.8E-05 0.44 2.8E-05 0.33 2.7E-05 0.31 3.1E-05 0.36EMPi 0.02 5.30 0.02 5.23 0.02 4.82 0.02 5.27EMP^2i -1.0E-04 -3.50 -1.0E-04 -3.49 -9.5E-05 -3.22 -1.0E-04 -3.54
Ind. dummiesArea dummies
ObservationsCensored obs.Log likelihoodLR Chi2
degr. of freedomsignificance
R2pseudo 0.08 0.08 0.08 0.08
0.00 0.00 0.00 0.00 32 32 33 33
83.12 83.47 86.10 83.98 -471.79 -471.62 -469.39 -471.36
173 173 173 173 476 476 475 476
Dependent variable: R&Di
(1) (2) (4)(3)
Yes Yes YesYes Yes Yes
YesYes
PANEL B
Coeff. t-stat. Coeff. t-stat. Coeff. t-stat. Coeff. t-stat.
GOVFUNa *
AUDITj 37.00 3.02 - 35.33 2.89 -LOANDENj - 43.67 2.42 - 43.64 2.42
AUDITi - - 0.12 2.02 -LOANDENi - - - 0.04 0.37AGEi -0.01 -3.26 -0.01 -3.25 -0.01 -3.12 -0.01 -3.23AGE^2i 1.1E-04 2.28 1.1E-04 2.24 1.0E-04 2.17 1.1E-04 2.22EMPi 8.0E-03 3.55 7.9E-03 3.46 7.1E-03 3.06 7.8E-03 3.44EMP^2i -3.9E-05 -2.64 -4.0E-05 -2.70 -3.5E-05 -2.39 -4.0E-05 -2.68
Ind. dummiesArea dummies
ObservationsCensored obs.Log likelihoodLR Chi2
degr. of freedomsignificance
R2pseudo 0.09 0.08 0.09 0.08
0.00 0.00 0.00 0.00 32 32 33 33
75.25 72.06 79.53 72.20 -395.19 -396.79 -391.87 -396.72
97 97 96 97 519 519 517 519
Yes Yes YesYes Yes Yes
YesYes
Dependent variable: GROWTHi
(1) (2) (4)(3)

54
Notes: This table reports a modified version of the basic regressions that include area and industry fixed effects and the full vector of control variables (reported in Table 6): In Panel A, the depend-ent variable is R&D in millions of euros. In Panel B, it is the average sales growth rate over the next three years, as projected by the entrepreneurs themselves. The modification is that Market Imperfectionj replaces External Dependencej. The new industry level -variable measures the extent to which an industry is prone to suffer from capital market imperfections. We compute it for each industry using data on SMEs residing outside the metropolitan Helsinki area. It is based on indus-try average of AUDITi (dummy set to 1 if firm is audited by one of the internationally recognized ‘Big Five’ accounting firms) or LOANDENi (= dummy set to 1 if a firm’s loan application has been turned down because of lack of collateral and/or guarantees during the last two years). SMEs residing in the metropolitan Helsinki area have been dropped from the regressions.

E L I N K E I N O E L Ä M Ä N T U T K I M U S L A I T O S (ETLA) THE RESEARCH INSTITUTE OF THE FINNISH ECONOMY LÖNNROTINKATU 4 B, FIN-00120 HELSINKI ____________________________________________________________________________ Puh./Tel. (09) 609 900 Telefax (09) 601753 Int. 358-9-609 900 Int. 358-9-601 753 http://www.etla.fi KESKUSTELUAIHEITA - DISCUSSION PAPERS ISSN 0781-6847
No 787 PASI HUOVINEN – HANNU PIEKKOLA, Early Retirement and Use of Time by Older Finns. 25.02.2002. 19 p.
No 788 PANU PELKONEN, Esitutkimus rekrytointiongelmien ja tuotannon yhteyksistä Suomen teolli-
suudessa 1987-2000. 18.02.2002. 24 s. No 789 ERKKI KOSKELA – MARKKU OLLIKAINEN – MIKKO PUHAKKA, Saddles, Indetermi-
nacy and Bifurcations in an Overlapping Generations Economy with a Renewable Resource. 18.02.2002. 30 p.
No 790 MINNA JUKOMAA – JUSSI KOIVISTO – MARJA TAHVANAINEN, Recruitment of For-
eign IT Professionals in Finland. 22.02.2002. 23 p. No 791 KARI E.O. ALHO, EU Labour Markets and Immigration Connected to Enlargement.
28.02.2002. 18 p. No 792 JYRKI ALI-YRKKÖ, Mergers and Acquisitions – Reasons and Results. 05.03.2002. 32 p. No 793 ANTTI KAUHANEN – HANNU PIEKKOLA, Rent Sharing as Part of Incentive Payments and
Recruitment. 20.03.2002. 26 p. No 794 HANNU PIEKKOLA, Transferability of Human Capital and Job Switches. 20.03.2002. 22 p. No 795 MIKA MALIRANTA, From R&D to Productivity Through Micro Level Restructuring.
18.03.2002. 39 p. No 796 MIKA MALIRANTA, Factor Income Shares and Micro-Level Restructuring. An analysis of
Finnish Manufacturing. 18.03.2002. 23 p. No 797 LAURA EHRLICH, The EU Single Market and Customs Policy: Impact on Estonian Foreign
Trade. 19.03.2002. 24 p. No 798 PETRI BÖCKERMAN, Understanding Regional Productivity in a Nordic Welfare State: Does
ICT Matter? 22.03.2002. 20 p. No 799 JYRKI ALI-YRKKÖ – RAINE HERMANS, Nokia Suomen innovaatiojärjestelmässä.
11.04.2002. 35 S. No 800 JUHA FORSSTRÖM – JUHA HONKATUKIA, Energiaverotuksen kehittämistarpeet Kioton
pöytäkirjan toteuttamiseksi. 26.03.2002. 31 s. No 801 JUHA FORSSTRÖM – JUHA HONKATUKIA – ANTTI LEHTILÄ, Maakaasun hinnan vaiku-
tukset ilmastopolitiikan kustannuksiin. 27.03.2002. 26 s. No 802 ELINA RISSANEN, Reflections of Globalisation – The Influence of Economic Factors on the
International Development Assistance Allocations. 09.04.2002. 19 p.

No 803 ELINA RISSANEN, Foreign Aid Policies – Comparing Finland and Ireland. 09.04.2002. 22 p. No 804 RAIMO LOVIO, Suomalaisten monikansallisten yritysten T&K-toiminnan kansainvälistyminen
– perustietoja ja kysymyksenasetteluja. 11.04.2002. 22 s. No 805 ARI HYYTINEN – MIKA PAJARINEN, External Finance, Firm Growth and The Benefits of
Information Disclosure: Evidence from Finland. 24.04.2002. 40 p. No 806 MATTI LAMPINEN, Uusi talous – tapaustutkimuksia suomalaisyrityksissä. 25.04.2002. 13 s. No 807 OLAVI RANTALA, Kansantalouden ja toimialojen pitkän ajan kasvu – Vertailua ilmastostra-
tegian BAU-skenaarioon. 06.05.2002. 11 s. No 808 JUSSI V. KOIVISTO – MATTI LAMPINEN, Comparative Analysis of Finno-Sinic Manage-
ment: In-Depth Study of the Dimensions of Cross-Cultural Friction and Synergy in Manage-ment of Finnish Firms in Hong Kong. 22.05.2002. 18 p.
No 809 JUKKA LIIKANEN – PAUL STONEMAN – OTTO TOIVANEN, Intergenerational Effects in
the Diffusion of New Technology: The Case of Mobile Phones. 22.05.2002. 16 p. No 810 TIMO KAISANLAHTI, Minority Shareholders in the Finnish System of Corporate Govern-
ance. 10.06.2002. 71 p. No 811 JYRKI ALI-YRKKÖ – RAINE HERMANS, Nokia in the Finnish Innovation System.
19.06.2002. 35 p. No 812 ARI HYYTINEN – MIKA PAJARINEN, Small Business Finance in Finland. A Descriptive
Study. 25.06.2002. 59 p. No 813 ARI HYYTINEN – MIKA PAJARINEN, Financing of Technology-Intensive Small Businesses:
Some Evidence on the Uniqueness of the ICT Industry. 29.07.2002. 22 p. No 814 ARI HYYTINEN – OTTO TOIVANEN, Does Distance Matter in Deposit Supply? A Bank-
level Study. 30.07.2002. 14 p. No 815 ERKKI KOSKELA – MARKKU OLLIKAINEN, Optimal Forest Taxation under Private and
Social Amenity Valuation. 13.08.2002. 23 p. No 816 TARMO VALKONEN, Demographic Uncertainty and Taxes. 21.08.2002. 20 p. No 817 ANTTI KAUHANEN – HANNU PIEKKOLA, Profit Sharing in Finland: Earnings and Produc-
tivity Effects. 03.09.2002. 18 p. No 818 ISMO LINNOSMAA – RAINE HERMANS – TARU KARHUNEN, Price-Cost Margin in the
Pharmaceutical Industry: Empirical Evidence from Finland. 03.09.2002. 20 p. No 819 RAINE HERMANS – TERTTU LUUKKONEN, Findings of the ETLA Survey on Finnish Bio-
technology Firms. 10.09.2002. 30 p. No 820 ARI HYYTINEN – OTTO TOIVANEN, Do Financial Constraints Hold Back Innovation and
Growth? Evidence on the Role of Public Policy. 17.09.2002. 31 p.
Elinkeinoelämän Tutkimuslaitoksen julkaisemat "Keskusteluaiheet" ovat raportteja alustavista tutkimustuloksista ja väliraportteja tekeillä olevista tutkimuksista. Tässä sarjassa julkaistuja mo-nisteita on mahdollista ostaa Taloustieto Oy:stä kopiointi- ja toimituskuluja vastaavaan hintaan.
Papers in this series are reports on preliminary research results and on studies in progress. They are sold by Taloustieto Oy for a nominal fee covering copying and postage costs.