kernel machines for multi-class classi cation: a joint ... · kernel machines for multi-class...
TRANSCRIPT

Kernel Machines for Multi-ClassClassification: A Joint Kernel
Approach
Antolin Thomas Janssen
Radboud UniversityInstitute for Computing and Information Sciences
Nijmegen, The Netherlands, 6525 AJ
2009

Supervisors
Evgeni TsivtsivadzeInstitute for Computing and Information ScienceRadboud UniversityNijmegen, 6525 AJThe Netherlands
Tom HeskesInstitute for Computing and Information ScienceRadboud UniversityNijmegen, 6525 AJThe Netherlands
i

ii
Abstract
Pattern analysis is about the automatic detection of patterns in data, andplays an important role in many modern artificial intelligence and com-puter science problems. With patterns we mean any relations, regularitiesor structures that are present within a source of data. By detecting signif-icant patterns in the data, a system can make predictions about new datacoming from the same source. We can say that the system has acquired gen-eralisation power by learning a pattern in the data from that source. Thereare many important problems that can only be solved using this approach,ranging from bio informatics to web retrieval. In recent years, pattern anal-ysis has become a standard method for software engineering, and is used inmany commercial products.
This thesis describes several algorithms and compares their performanceson different datasets. This to research the possibilities that we have whenwe want to extract possibly interesting relationships between datapoints.The improvement of these kind of techniques can be important for futureresearch because with increasing computational power, increasingly largerdatasets can be analyzed, so that we can find relationships we never knewexisted. One of these datasets is called SCOP, or the Structured Classi-fication of Proteins, which we can analyze to better understand how ourbody works and how different proteins are related. To detect these rela-tionships we use an algorithm called Regularized Least Squares. Also itsperformance is compared to a very similar algorithm, called SVMLight, andseveral other machine learning techniques, namely Naive Bayes, KStar andRandom Forest. We show that the performance depends on the problemthat is analyzed, where things like linear separability and the number ofexamples in the dataset have a notable influence. Nevertheless, the resultsare stable on most datasets, resulting in a prediction system that can beconsidered as a reliable advise-tool for making decisions about that dataset.A rapidly developing field within this research is multiclass classification,which extends the binary classification into a method that can handle prob-lems with multiple classes. The multiclass extension for the algorithm thatwe consider is a joint kernel approach which also provides stable results andcould be optimized to improve performance even more.
iii

iv

Contents
1 Introduction 11.1 RLS - Binary . . . . . . . . . . . . . . . . . . . . . . . . . . . 1
1.1.1 Linear Regression . . . . . . . . . . . . . . . . . . . . . 21.1.2 Regularized Regression . . . . . . . . . . . . . . . . . . 5
1.2 SVMLight . . . . . . . . . . . . . . . . . . . . . . . . . . . . . 71.3 RLS - Multiclass . . . . . . . . . . . . . . . . . . . . . . . . . 8
1.3.1 Joint Kernel . . . . . . . . . . . . . . . . . . . . . . . . 101.4 Naive Bayes . . . . . . . . . . . . . . . . . . . . . . . . . . . . 121.5 K Star . . . . . . . . . . . . . . . . . . . . . . . . . . . . . . . 131.6 Random Forest . . . . . . . . . . . . . . . . . . . . . . . . . . 14
2 Research 172.1 Experiments . . . . . . . . . . . . . . . . . . . . . . . . . . . . 17
2.1.1 RLS on SCOP . . . . . . . . . . . . . . . . . . . . . . 182.1.2 RLS on other datasets . . . . . . . . . . . . . . . . . . 192.1.3 SVMLight . . . . . . . . . . . . . . . . . . . . . . . . . 212.1.4 Bayes . . . . . . . . . . . . . . . . . . . . . . . . . . . 212.1.5 K* . . . . . . . . . . . . . . . . . . . . . . . . . . . . . 212.1.6 Random Forest . . . . . . . . . . . . . . . . . . . . . . 222.1.7 AUC . . . . . . . . . . . . . . . . . . . . . . . . . . . . 22
2.2 Results . . . . . . . . . . . . . . . . . . . . . . . . . . . . . . . 232.2.1 SCOP . . . . . . . . . . . . . . . . . . . . . . . . . . . 232.2.2 RLS vs. SVMLight . . . . . . . . . . . . . . . . . . . . 282.2.3 RLS vs. Rest . . . . . . . . . . . . . . . . . . . . . . . 29
3 Conclusion 31
4 Appendix 334.1 Python . . . . . . . . . . . . . . . . . . . . . . . . . . . . . . 334.2 Algorithm . . . . . . . . . . . . . . . . . . . . . . . . . . . . . 35
4.2.1 RLS on SCOP . . . . . . . . . . . . . . . . . . . . . . 354.2.2 RLS on Rest . . . . . . . . . . . . . . . . . . . . . . . 354.2.3 SVMLight and SVMMulti . . . . . . . . . . . . . . . . 36
v

Chapter 1
Introduction
In this chapter we describe the methods and tools used during this researchproject. First of all there is an extended description of the technique thatwe implemented and its theoretical foundations. Second, there is a lessextended description of the SVMLight algorithm, a similar algorithm toours that has been optimized and has been shown to have good empiricalperformance on a wide variety of datasets. In the third section we propose amulti-class extension applicable to various kernel-based methods and brieflystate the ideas behind that technique. To finish the first chapter the otherinvestigated algorithms are described.
The goal of all examined algorithms is to detect patterns in datasets, orto be more exact, to determine the relations between datapoints by usingtheir properties to calculate the similarities between those datapoints. Tostart our research into the field of pattern analysis, first of all we need aproblem setting in which we are conducting our experiments, which is thefollowing: There is a dataset, which consists of a number of datapoints thateach have a class and a certain number of features. These features representthe important properties of the datapoint. We want to analyze the relationbetween the features of a datapoint and its class label, creating a modelwhich describes the estimated predicted relationships for that dataset. Afterthat we can use this model to predict the class label for a datapoint whichwe haven’t seen before.
1.1 RLS - Binary
The algorithm on which most of this thesis is based is called RegularizedLeast Squares. It is described in details in [14] and in principle is an ”ex-tended form” of Least Squares Linear Regression. It is also known as ker-nelized version of Ridge Regression and has been given different names bydifferent authors, namely LS-SVM [23] and Regularized Least-Squares [22],
1
1.1. RLS - BINARY CHAPTER 1. INTRODUCTION
[21]. This technique uses dot products (also called kernel functions) to calcu-late the similarity between training examples. There are some mathematicaltricks to optimize this technique but the basic idea is pretty straightforward,and consists of two steps:
• Mapping into feature space
• Computing similarities
The first step makes sure that the datapoints are linearly separable by map-ping them into a higher dimension, which is done by a so called kernelfunction. The second part consists of the learning algorithm which will dothe actual pattern recognition. This goes, as said above, by creating a modelusing the dot products between the different datapoints. Once this is donewe can run the linear algorithm on unseen datapoints and make a predictionwith respect to the class of that datapoint.
1.1.1 Linear Regression
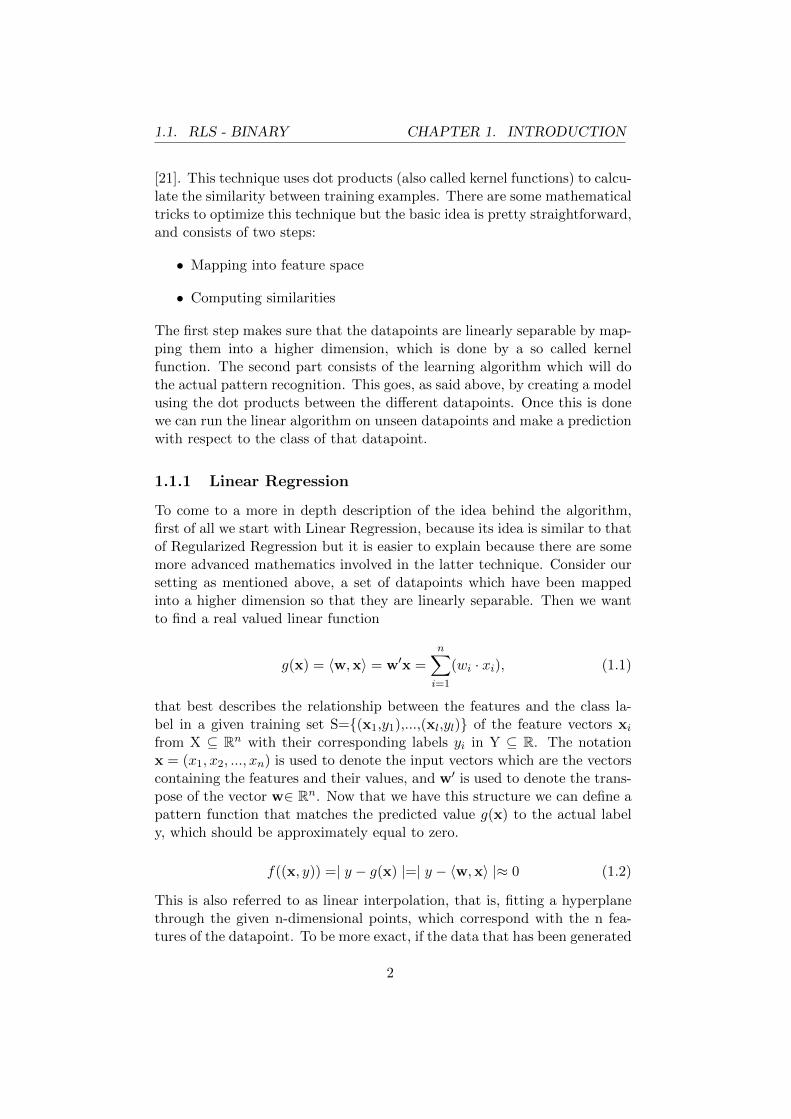
To come to a more in depth description of the idea behind the algorithm,first of all we start with Linear Regression, because its idea is similar to thatof Regularized Regression but it is easier to explain because there are somemore advanced mathematics involved in the latter technique. Consider oursetting as mentioned above, a set of datapoints which have been mappedinto a higher dimension so that they are linearly separable. Then we wantto find a real valued linear function
g(x) = 〈w,x〉 = w′x =n∑i=1
(wi · xi), (1.1)
that best describes the relationship between the features and the class la-bel in a given training set S={(x1,y1),...,(xl,yl)} of the feature vectors xifrom X ⊆ Rn with their corresponding labels yi in Y ⊆ R. The notationx = (x1, x2, ..., xn) is used to denote the input vectors which are the vectorscontaining the features and their values, and w′ is used to denote the trans-pose of the vector w∈ Rn. Now that we have this structure we can define apattern function that matches the predicted value g(x) to the actual labely, which should be approximately equal to zero.
f((x, y)) =| y − g(x) |=| y − 〈w,x〉 |≈ 0 (1.2)
This is also referred to as linear interpolation, that is, fitting a hyperplanethrough the given n-dimensional points, which correspond with the n fea-tures of the datapoint. To be more exact, if the data that has been generated
2

CHAPTER 1. INTRODUCTION 1.1. RLS - BINARY
is of the form (x, g(x)) where g(x) = 〈w,x〉 and there are exactly l = n lin-early independent points, the parameters of w can be found by solving theequation
Xw = y, (1.3)
where X is used to denote the matrix which rows are the transposed inputvectors (x1
′, ...xl′) and y to denote the vector (y1, ..., yl)
′ which contains thelabels for each datapoint. After having said this, we can translate our errorfunction
f((x, y)) =| y − g(x) |=| ξ |, (1.4)
that gives the error for one particular training example, into a functionwhere we take all training errors for that set into account. As the name ofthe algorithm says, the loss of a prediction is measured with the squarederror of the error function, which results in the following definition
L(g, S) = L(w, S) =l∑
i=1
(yi − g(xi))2 =
l∑i=1
ξi2 =
l∑i=i
L((xi, yi), g)), (1.5)
where L((xi, yi), g) = ξ2 is used to denote the squared error of the predictionfunction g for one example (xi, yi) and L(f, S) to denote the summed lossof the error function on the training set S. Now it becomes clear that thesolution to the problem is to choose a weight vector w ∈W that minimisesthe total loss of the function. If we rewrite the error function using the othernotation we get the following equation
ξ = Xw− y, (1.6)
so that we can rewrite the loss function as
L(w, S) = || ξ ||2 = (y−Xw)′(y−Xw), (1.7)
where X′ denotes the transpose of X. Now we can seek the w that minimisesthe loss by taking the derivative of this function with respect to w and settingit equal to the zero vector
δL(w, S)
δw= −2X′I(y−Xw) = −2X′y + 2X′Xw = 0, (1.8)
as we can see from equation (76) in [19]:
δ
δs(x−As)′W(x−As) = −2A′W(x−As), (1.9)
so that we, after simplifying, get the equation
X′Xw = X′y, (1.10)
3

1.1. RLS - BINARY CHAPTER 1. INTRODUCTION
and if the inverse of X′X exists we can find the solution to the minimizingof the loss by solving the following equation
w = (X′X)−1X′y. (1.11)
One large downside of this approach, which is also called primal regression,is that solving this equation requires the computation of the inverse of an×n matrix, that is features × features, which will be very inefficient whenthere are more features then datapoints. This is because X is of dimensionsl × n, which makes X′ of dimensions n × l so that X′X is of dimensionsn× n. This results in a complexity of O(n3) which means that the numberof operations t(n) is bounded by t(n) ≤ Cn3 for some constant C.
Now that the optimal w is known, the actual predictions can now bedone by using the prediction function as mentioned above
g(x) = 〈w,x〉 . (1.12)
To end this first section we take a look into a way how to reduce the com-putational complexity by rewriting equation (1.11) so that it becomes a socalled dual regression problem, which is done in the following way
w = (X′X)−1X′y
= X′X(X′X)−1(X′X)−1X′y
= X′X(X′X)−2X′y
= X′α,
so that we obtain a linear combination of the training examples (l × l)
w =l∑
i=1
αi · xi. (1.13)
Now that the principle of Regression is known, we can proceed to thenext section where this algorithm will be expanded to Regularized Regres-sion, where we add an extra parameter to restrict the choice of functionswhen computing a solution to the problem. The reason why we do this is be-cause there usually isn’t an exact relationship between the features and theclasses, but an approximate one. To make sure that the algorithm doesn’ttry to match every datapoint exactly we introduce a parameter to controlthe number of errors on the training- vs. the number of errors on the test-set. If we optimize this parameter we get a more appropriate approximationof the relationship, by creating a smoother function that doesn’t overfit thedata. Overfitting means that the function tries to match each datapoint ex-actly, which results in a prediction function with not enough generalisationpower to predict accurately.
4

CHAPTER 1. INTRODUCTION 1.1. RLS - BINARY
1.1.2 Regularized Regression
As mentioned in the last part of the previous section, we introduce anotherparameter to restrict the functions being chosen as solutions for the problem,the so called regularisation parameter. After introducing this parameter theoptimization problem that we need to solve for Regularized Regression is
minwLλ(w, S) = min
wλ|| w ||2 +
l∑i=1
(yi − g(xi))2, (1.14)
where λ is a positive r ∈ R that defines the relative trade-off between theloss and the norm and thus controls the degree of regularisation, so thatthe problem is reduced to an optimization problem over Rn. The loss ofthe function is the measure described in the previous section, the summedsquared error that the loss function returns. The (Euclidean) norm of avector z is also known as
|| z ||=√z · z =
√z12 + z22 + ...+ zn2. (1.15)
The loss function can be rewritten so that the relationship between Linearand Regularized Regression becomes more apparent
L(w, S) = (minwλ|| w ||2 +
l∑i=1
(yi − g(xi))2
= (y−Xw)′(y−Xw) + λ|| w ||2
= (y−Xw)′(y−Xw) + λw′w,
where || w ||2 is equal to w′w because of
|| z ||2 =√z · z ·
√z · z = 〈z, z〉 = z′z, (1.16)
so that the derivative of λw′w is λw. Now that we know what we need tooptimize, the reasoning is parallel to the one of the Linear Regression. Firstwe need to take the derivatives of the function that we need to optimize,according to the same equation (76) in [19]:
δ
δs(x−As)′W(x−As) = −2A′W(x−As), (1.17)
which results in the equations
X′Xw + λw = (X′X + λIn)w = X′y, (1.18)
where I is the n×n identity matrix. Because X′X+λIn is always invertible ifλ > 0 the solution to this problem can be calculated by solving the equation
5

1.1. RLS - BINARY CHAPTER 1. INTRODUCTION
(1.19), because the addition of λI ensures that the matrix is not singular. Ifa square matrix is singular, which means that it has a determinant that isequal to zero, it is not invertible.
w = (X′X + λI)−1X′y = Xy′(X′X + λI)−1 (1.19)
So that the prediction function is defined by
g(x) = 〈w,x〉 = Xy′(X′X + λI)−1x. (1.20)
Notice that this equation again needs to invert a n×n matrix, similar to theprimal solution of the Linear Regression problem. But again we can rewriteit to make sure that the inversion only needs to be done on a l × l matrix.In order to do this we must rewrite equation (1.15) in terms of w so thatwe obtain
w = λ−1X′(y−Xw) = X′α, (1.21)
so that we again get the weightvector w in terms of a linear combination ofthe training examples (l × l)
w =l∑
i=1
αi · xi, (1.22)
with α = λ−1(y = Xw). We can then rewrite this equation as following
α = λ−1(y−Xw) (1.23)
λα = y−XX′α (1.24)
(XX′ + λIl)α = y (1.25)
α = (XX′ + λIl)−1y (1.26)
α = (G + λIl)−1y, (1.27)
which results in the following prediction function
g(x) = 〈w,x〉 =
⟨l∑
i=1
αi · xi,x
⟩=
l∑i=1
αi 〈xi,x〉 = y′(G+λIn)−1k, (1.28)
where ki = 〈xi,x〉. It can be seen that the matrix XX′ is denoted as G,which is also known as the Gram matrix. Both the Gram matrix and thematrix (G+λIl) are of dimensions l×l so that the computational complexityof the computing of its inverse will be a lot less than when computing theinverse of (X′X + λIn) which has dimensions (n × n). This is because thenumber of examples is limited most of the time, but the number of featurescan be of that vast numbers that computing it with the primal method is a
6

CHAPTER 1. INTRODUCTION 1.2. SVMLIGHT
futile job. There’s one disadvantage, which is that the prediction of a newexample will always be more computationally expensive (O(nl)) versus theO(n) of the primal solution. Nevertheless it shows that the dual solutioncan offer huge advantages because of the reduction of required computationsto calculate the vector α.
1.2 SVMLight
The next algorithm is very similar to ours, with only small differences, whichwe note when we encounter them. Again we consider a dataset with data-points which have a set of features and a class label. One important dif-ference to note is that this implementation solves a classification probleminstead of a regression problem, which means that the predicted value is ei-ther 1 or -1 instead of being a real value with our implementation. Suppose[4] there is some hyperplane that divides the positive and negative examples:
∀iyi(xi ·w + b)− 1 ≥ 0, (1.29)
where w is the normal to the hyperplane and | b | / || w || is the perpendic-ular distance from the origin to the hyperplane, with || w || the Euclideannorm of w (as mentioned in the last section). Next we define the marginmargin = d− + d+ where d+(d−) stands for the distance from the closestpositive(negative) example to the hyperplane separating the two classes ofdatapoints. We can now formulate the problem as looking for the hyper-plane that has the biggest margin, so that our distance between possiblepredictions is as big as possible. To get a better picture of the mentionedparameters consider Figure 1.21.
Figure 1.21 Principle of the Support Vector Machine
7

1.3. RLS - MULTICLASS CHAPTER 1. INTRODUCTION
Now we continue to the actual definition of the algorithm. Suppose weassume that all datapoints in the training set satisfy the following equations:
x ·w + b ≥ +1 for yi = +1 (1.30)
x ·w + b ≥ −1 for yi = −1, (1.31)
which we can combine into the following inequality
∀iyi(xi ·w + b)− 1 ≥ 0, (1.32)
where we can intuitively see that if the prediction xi ·w + b is equal to theactual class label yi the the inequality holds, namely (−1 ·−1)−1 = (1 ·1)−1 = 0 ≥ 0. The solution to the problem now again lies in minimizing the losswith respect to the w and b parameters so that the margin is maximized.We can formulate this as:
minf∈H
1
l
l∑i−1
(1− yif(xi))+ + λ|| f ||2K , (1.33)
where (k)+ = max(k, 0) and λ|| f ||2K is the regularization parameter. If wecompare this formula with the one of the Dual RLS solution we can see thatthey both use a similar formulation:
minf∈H
1
l
l∑i−1
V (yi, f(xi)) + λ|| f ||2K , (1.34)
where V (yi, f(xi)) is the function that is used to calculate the loss, whichis the squared error in RLS ((y − g(xi))
2) and (1 − yif(xi))+ in this case.This kind of problem is called a convex quadratic programming problem, ofwhich a detailed description is not considered in this thesis. For a detaileddescription we refer to [4].
1.3 RLS - Multiclass
So far in the thesis we discussed binary classification problems. However,frequently the problem at hand requires considering more than two-classclassification - e.g. the case when the label y is chosen from the set Y ofcardinality k > 2. Several methods have been proposed to address thisproblem. Most of these methods aim to reduce the multi-class classificationproblem into a problem that deals with binary classes and then in some waycombines the obtained results. For instance, we can create a binary classi-fication problem for each of the k classes. In this situation we consider theexamples y = l1 to belong to a positive class and all other examples having
8

CHAPTER 1. INTRODUCTION 1.3. RLS - MULTICLASS
class labels l2,...,k belonging to the negative class. This type of approach isusually called one-versus-all [20].
There are other possibilities to deal with the multi-class learning prob-lem, for example the all-pairs approach. In this case [11] we consider allpossible pairs of classes l1, l2 ∈ Y. We run the algorithm for these twoclasses considering them as positive and negative ones, respectively. Thismeans that
(k2
)hypothesis have to be generated and combined. Tibshirani
calls this the all-pairs-approach.Finally there are more general suggestions how to treat multi-class clas-
sification problems. Initially proposed in [7] and later extended by Allwein[1] the approach is know as ECOC - error correcting output codes. The mainidea behind this method is to construct a coding matrix M ∈ {−1,+1}k×c,where c is some positive integer and where every row of the coding matrix isassociated with a single class l ∈ Y. The binary learning algorithm is thenrun once for each column of the matrix on the induced binary problem inwhich the label of each example labeled y is mapped to M(y, s). This givesa number of prediction functions for each column of the matrix M, namelyfc. Now, given an example x, we then predict the label y for which row ofthe matrix is closest to (f1(x) . . . fc(x)).
Allwein proposed a generalization of this approach, by allowing the cod-ing matrix to contain also 0 elements in addition to −1,+1. By doing so theysuggest that some entries in the coding matrix constructed on all data pointsM(y, s) may be zero, indicating that we are not interested how the predic-tion function fs categorizes examples with label l. For every s = 1, . . . l thealgorithmA has labeled data in the form (xi,M(yi, s)) for all examples in thetraining set and omitting all examples where M(yi, s) = 0. The algorithmA uses this information to generate the prediction functions fs : X → R.
We also introduce the loss function similar to Allwein [1] so that fs onexample xi with the label M(yi, s) ∈ {−1,+1} is L(M(yi, s), fs(x)). WhenM(yi, s) = 0 we simply want to ignore the appropriate prediction function,and for convenience can select the loss to be equal to 0. The average lossfor all of the training examples can be written as follows:
1
nl
n∑i=1
l∑s=1
L(M(yi, s), fs(x))
Let us by M(r) denote the row of the coding matrix M constructed on thetraining data points. Also we denote the prediction vector of the examplex as follows: f(x) = (f1(x) . . . fl(x)). The question to be raised is giventhe predictions for a single example how can we determine the appropriateclass label? To answer this one can possibly come up with several methods,however, here we follow Allwein who suggested to use so called loss-baseddecoding. The basic approach here is to find which row corresponding to
9

1.3. RLS - MULTICLASS CHAPTER 1. INTRODUCTION
M(r) is ”closest” to the prediction vector f(x). Formally we need to findthe label which minimizes the distance d(M(r), f(x)). One way of doing thisis to compute the Hamming distance between these two vectors:
dH(M(r), f(x)) =l∑
s=1
(1− sign(M(r), s), fs(x)))
2,
where sign refers to the function sign(k), which returns −1 when k < 0, 0when k = 0 and +1 when k > 0. This would correspond to the approachproposed in [7]. However one can possibly ”improve” distance metric, thisby also taking into account the magnitudes of the differences between thepredicted labels and the appropriate rows of the coding matrix. Formallywe can write
dL(M(r), f(x)) =
l∑s=1
L(M(M(r), s), fs(x)).
By using this approach together with joint kernel maps to deal with multi-class classification problems we are able to show notably better performanceof our algorithm compared to several baseline methods.
1.3.1 Joint Kernel
In this section we briefly describe the joint kernel used in this study. Weintend to describe the algorithm and the approach in details in a separatepublication which is currently under preparation.
Joint kernel is a nonlinear similarity measure between input-output pairs,i.e., J((x, y), (x′, y′)) where (x, y) and (x′, y′) are labeled training examples.We can write:
J((x, y), (x′, y′)) = 〈ΦXY(x, y)ΦXY(x′, y′)〉,
where ΦYX is the map into dot product space. The function taking formof the kernel as described above is positive definite and can be written as adot product.
As it can be seen in the definition above, the main idea behind the jointkernel is to describe the similarity between input-output pairs by mappingpairs into a joint space. A joint kernel can encode more than just informationabout inputs or outputs independent of each other: it can also encode knowndependencies/correlations between inputs and outputs. Joint Kernels havebeen already studied and several variations are proposed in [25]. In ouralgorithm the joint kernels are used to construct the joint similarity spacebetween the input data point features and their multi-class encoding. Oneof the kernels we use in our experiments is the following modification ofGaussian:
10

CHAPTER 1. INTRODUCTION 1.3. RLS - MULTICLASS
JRBF ((x, y), (x′, y′)) = exp− ||(x, y)− (x′, y′)||2
σ2.
One can notice that we could define two separate similarity measures(kernels) on inputs and the outputs (in this case the encoded labels of thedata points). However, it is more difficult for the algorithm to infer whichdata points are related when providing this information separately. Also wesuggest several ways how to further improve performance of the method bytweaking kernel function such that prior knowledge about particular datasetis incorporated into the learning problem.
11
1.4. NAIVE BAYES CHAPTER 1. INTRODUCTION
1.4 Naive Bayes
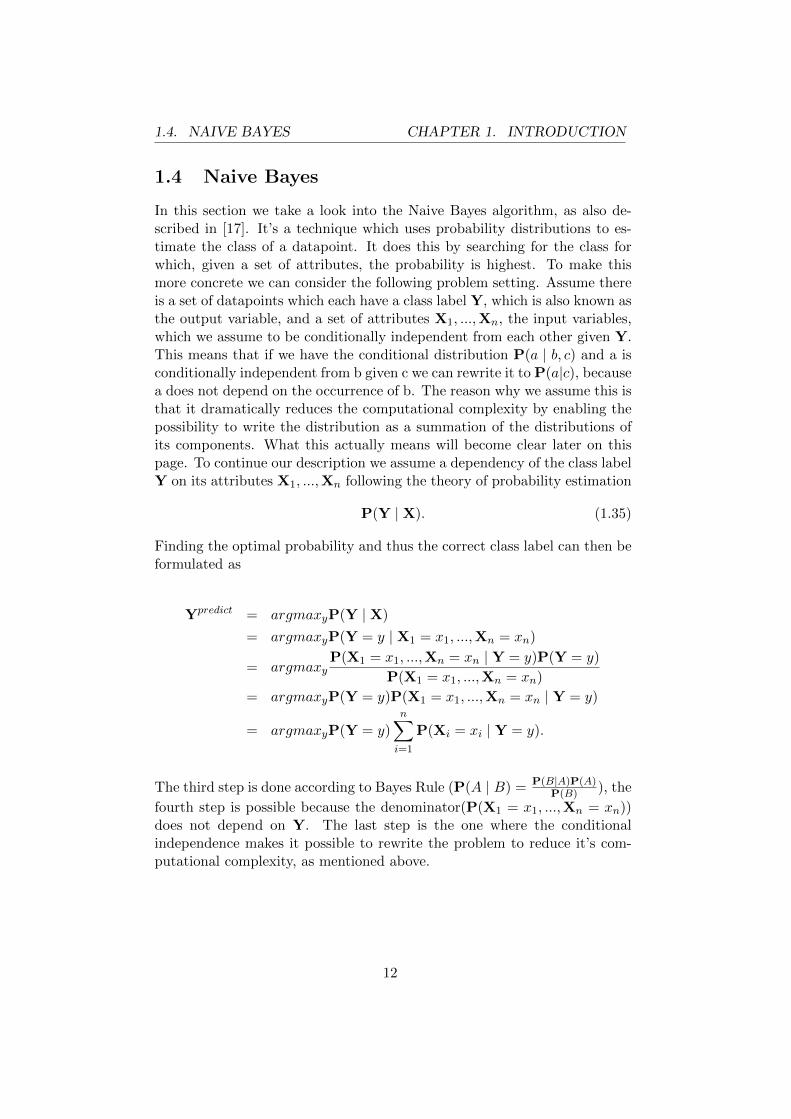
In this section we take a look into the Naive Bayes algorithm, as also de-scribed in [17]. It’s a technique which uses probability distributions to es-timate the class of a datapoint. It does this by searching for the class forwhich, given a set of attributes, the probability is highest. To make thismore concrete we can consider the following problem setting. Assume thereis a set of datapoints which each have a class label Y, which is also known asthe output variable, and a set of attributes X1, ...,Xn, the input variables,which we assume to be conditionally independent from each other given Y.This means that if we have the conditional distribution P(a | b, c) and a isconditionally independent from b given c we can rewrite it to P(a|c), becausea does not depend on the occurrence of b. The reason why we assume this isthat it dramatically reduces the computational complexity by enabling thepossibility to write the distribution as a summation of the distributions ofits components. What this actually means will become clear later on thispage. To continue our description we assume a dependency of the class labelY on its attributes X1, ...,Xn following the theory of probability estimation
P(Y | X). (1.35)
Finding the optimal probability and thus the correct class label can then beformulated as
Ypredict = argmaxyP(Y | X)
= argmaxyP(Y = y | X1 = x1, ...,Xn = xn)
= argmaxyP(X1 = x1, ...,Xn = xn | Y = y)P(Y = y)
P(X1 = x1, ...,Xn = xn)
= argmaxyP(Y = y)P(X1 = x1, ...,Xn = xn | Y = y)
= argmaxyP(Y = y)n∑i=1
P(Xi = xi | Y = y).
The third step is done according to Bayes Rule (P(A | B) = P(B|A)P(A)P(B) ), the
fourth step is possible because the denominator(P(X1 = x1, ...,Xn = xn))does not depend on Y. The last step is the one where the conditionalindependence makes it possible to rewrite the problem to reduce it’s com-putational complexity, as mentioned above.
12
CHAPTER 1. INTRODUCTION 1.5. K STAR
1.5 K Star
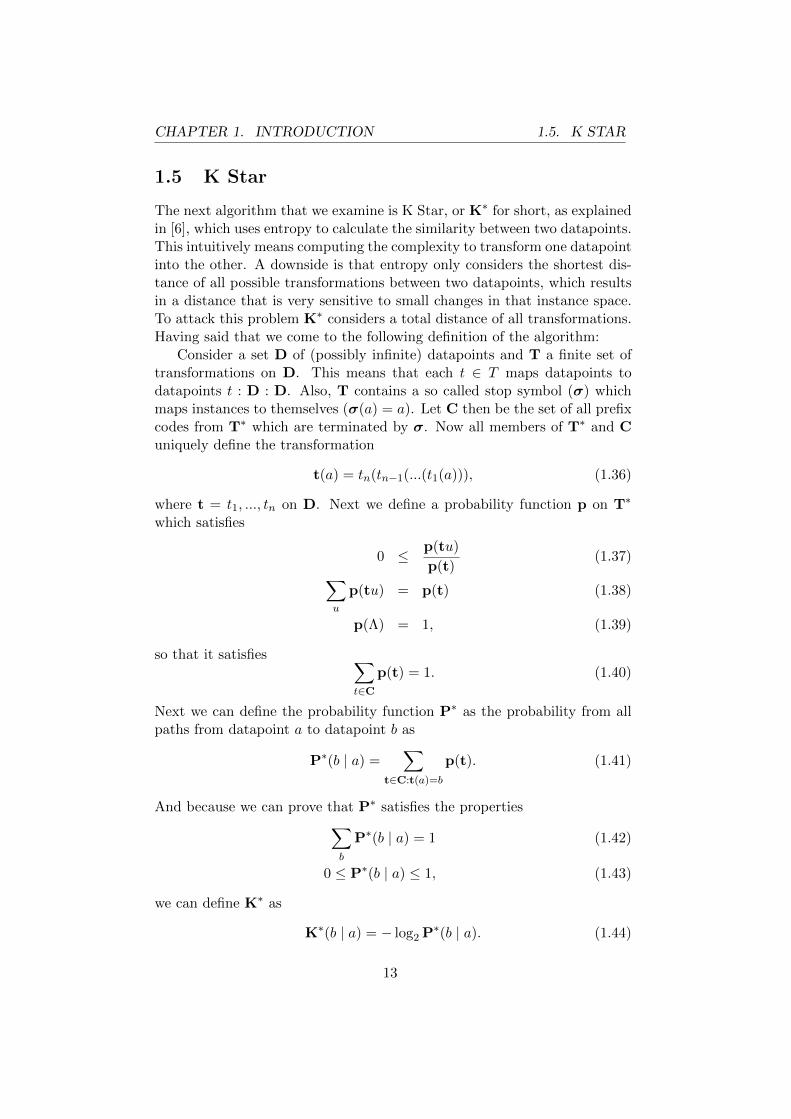
The next algorithm that we examine is K Star, or K∗ for short, as explainedin [6], which uses entropy to calculate the similarity between two datapoints.This intuitively means computing the complexity to transform one datapointinto the other. A downside is that entropy only considers the shortest dis-tance of all possible transformations between two datapoints, which resultsin a distance that is very sensitive to small changes in that instance space.To attack this problem K∗ considers a total distance of all transformations.Having said that we come to the following definition of the algorithm:
Consider a set D of (possibly infinite) datapoints and T a finite set oftransformations on D. This means that each t ∈ T maps datapoints todatapoints t : D : D. Also, T contains a so called stop symbol (σ) whichmaps instances to themselves (σ(a) = a). Let C then be the set of all prefixcodes from T∗ which are terminated by σ. Now all members of T∗ and Cuniquely define the transformation
t(a) = tn(tn−1(...(t1(a))), (1.36)
where t = t1, ..., tn on D. Next we define a probability function p on T∗
which satisfies
0 ≤ p(tu)
p(t)(1.37)∑
u
p(tu) = p(t) (1.38)
p(Λ) = 1, (1.39)
so that it satisfies ∑t∈C
p(t) = 1. (1.40)
Next we can define the probability function P∗ as the probability from allpaths from datapoint a to datapoint b as
P∗(b | a) =∑
t∈C:t(a)=b
p(t). (1.41)
And because we can prove that P∗ satisfies the properties∑b
P∗(b | a) = 1 (1.42)
0 ≤ P∗(b | a) ≤ 1, (1.43)
we can define K∗ as
K∗(b | a) = − log2P∗(b | a). (1.44)
13

1.6. RANDOM FOREST CHAPTER 1. INTRODUCTION
1.6 Random Forest
To finalize the descriptions of the used algorithms, the last one that weconsider is the one called Random Forest. Because this is an algorithmthat consists of a set of so called Decision Trees, we examine those firstand then get to the extension of that method, the Random Forest. Asdescribed in[17], Decision Trees use a tree structure with nodes that havea test for one of the attributes of a datapoint at each non-terminal node.The branches that come from each node represent an answer to that test.For each datapoint each attribute is checked and the associated branch ischosen until it reaches a terminal node, which is also referred to as a ”leaf”.That leaf decides to which class the datapoint belongs. To construct thisstructure, we simply use a lot of datapoints from which the class labels areknown and save the values of the attributes as a path in the tree leading tothe leaf with that class label. As can be expected, these attributes can be ofdifferent types, from Boolean values to ranges in real values. To make theidea more apparent we consider an example as also written in [17]. Figure1.61 shows a trained Decision Tree for a possible solution to the problemwhen the weather conditions are suitable to play tennis.
Figure 1.61 Trained Decision Tree
As you can see there are three nodes: Outlook, humidity and wind, withtwo answers each, yes or no, which means that this is a binary Decision Tree.If the attributes of the datapoint, or in this case, the weather condition(I.e. the set of attributes {Outlook, Humidity, Wind}) are checked and thecorresponding answers are chosen it will reach the class of that datapoint,or in this case, the decision whether or not the weather is suitable to playtennis.
14

CHAPTER 1. INTRODUCTION 1.6. RANDOM FOREST
Now that the idea of the Decision Tree is clear we can continue to theRandom forest, which uses exactly the same technique of deciding whethera datapoint belongs to a certain class or not. Like described in [3] it nowsimply constructs an arbitrary number of Decision Trees. It does this bygenerating a random vector θk for each of the k trees. This vector is in-dependent of the past generated random vectors θ1, ...,θk−1 but it has thesame distribution. This means that all random generated vectors are ina vector space which has some defined distribution (normal,Gaussian,etc.).Now a tree is constructed with the training set and this random vector θk,so that we obtain a number of trees that all used a different vector to beconstructed, hence the name Random Forest. After we trained the tree wecan use the classifier h(x,θk) for each k, to classify the unknown datapoint,also referred to as the input vector x. When we do this for each of the ktrees we can simply count votes and see which class label y is predicted mostfrequently for that datapoint x.
15

1.6. RANDOM FOREST CHAPTER 1. INTRODUCTION
16

Chapter 2
Research
In this chapter we discuss the performed experiments and the associatedresults, as well as the datasets being used. Because we compare the per-formances of several algorithms on different datasets, this chapter is struc-tured according to those comparisons. Also there is a division between theactual algorithms and the results of the performed experiments. First we de-scribe our algorithm and the SCOP (Structural Classification of Proteins)dataset[18]. Second, we apply the algorithm to several datasets from theLIBSVM website[5], so that we can compare our results with those of theother algorithms. In the third section we describe the Python implemen-tation of the wrapper for the SVMLight algorithm on the same datasets.To finish the first part of this chapter we describe the algorithms from theWEKA[10] program. The second part of this chapter consists of the ob-tained results and the comparison between these results.
2.1 Experiments
As mentioned above, the first section of this chapter is about the experi-ments, datasets and implementations which this thesis is based upon. Weuse the programming language Python to implement the Regularized LeastSquares algorithm in two different ways, the first one is for the SCOP datasetand the second to make it possible to run it on some datasets from the LIB-SVM website. We also implement a Python script to run a ten fold versionof the SVMLight algorithm for a fair comparison. For the WEKA we choosenot to create a script because of the need for yet another programming lan-guage called Jython.
17

2.1. EXPERIMENTS CHAPTER 2. RESEARCH
2.1.1 RLS on SCOP
The SCOP [18] database contains a detailed description of the structuraland evolutionary relationships between all proteins of which the structure isknown. Because almost all proteins have structural similarities with otherproteins and sometimes share a common evolutionary origin, this is an inter-esting dataset to consider when we want to analyze relationships between theclass label and the features of a set of datapoints. Furthermore, the results ofthese experiments can contribute to a better understanding of the evolutionof proteins. Because not all relationships can be identified automatically,the SCOP is constructed manually by visual inspection and comparison ofstructures. There are many levels in the hierarchy, but the principal levelsare family, superfamily and fold, as described below. The exact position ofboundaries between these levels is to some degree subjective, but the SCOPevolutionary classification is generally conservative: where any doubt aboutrelatedness exists, make new divisions at the family and superfamily levels.
• Family : proteins are clearly evolutionarily related
• Superfamily: Probable common evolutionary origin
• Fold: Major structural similarity
As described in [15], the dataset consists of 54 families which each have atleast 10 family members (positive test examples) and 5 superfamily membersoutside of the family (positive train examples). Negative examples are takenfrom outside of the positive examples and are split into the training and testsets in the same ratio as the positive examples. A more detailed descriptionof the SCOP dataset and the families is written in the second section of thischapter, where we discuss the results.
18

CHAPTER 2. RESEARCH 2.1. EXPERIMENTS
We now describe our implementation of the Regularized Least Squaresalgorithm. We start with the algorithm described in [24] and expand it soit uses cross validation to find a prediction function that isn’t biased on thetest set, which means that it uses information from the test set to optimizeits parameters. Cross validation means that we divide the training set intotwo parts, a cross validation- test and training set[8]. Then we run thealgorithm and save the performance measure for each chosen lambda. Werepeat this for the number of folds being used and average the performancefor each lambda over the number of folds. This intuitively means addingall performance measures for each lambda together and dividing them bythe number of folds. Then we can use that lambda that has the highestperformance measure to create the real model, i.e. training the predictionfunction with that one lambda on the full training set and evaluating the realperformance on the real test set. To find out which number of folds worksbest on this kind of problem we try 5 folds, 10 folds and a pseudo-30 folds.The latter is a technique where we use 10 fold cross validation three times,and shuffle the training set before we start one of each three runs. The reasonthat we do this is because to calculate our performance measure (AUC) weneed both positive and negative class members in the test set, and someof the SCOP families do not have enough members(≤ 11) in their trainingset to ensure this is the fact when we use more than 10 folds. This AreaUnder Curve performance measure, or AUC for short, as described in[24],is a measure that represents true positives as a function of false positivesfor varying classification thresholds. When the classification is perfect, theAUC will have a value of 1, if the classification is done random, the valueof the AUC measure will be 0,5. There is a more extended description inthe last part of this section. On the SCOP dataset we choose to use a linearkernel because of the need of optimizing yet another parameter σ, whichis explained in the next section, where we use a Gaussian Kernel. Thereason why we choose to do this is that the SCOP database is of that vastsize that adding this extra optimization parameter results in increasing thecomputational complexity by a notable amount, making computation timeseven longer.
2.1.2 RLS on other datasets
Because of the size of the SCOP dataset, comparing our algorithm with othermachine learning algorithms using this dataset would be a time consumingjob. For this reason we choose to adapt our implementation so that it can usedatasets from the LIBSVM website [5], so that we have access to a varietyof datasets. Because of the possibility to choose smaller datasets, we canoptimize our algorithm even more by using the extra optimization parameterσ as mentioned in the last section. The use of this Gaussian Kernel makes
19

2.1. EXPERIMENTS CHAPTER 2. RESEARCH
the algorithm more able to cope with non-linearly separable problems. Thedifference between the linear kernel and the Gaussian kernel is that theGaussian doesn’t use the dot product K(x,x′) = 〈x, x′〉 to compute thekernel matrix, but the equation
K(x,x′) = e−(x−x′)2
σ2 , (2.1)
where σ is the new parameter that controls the width of the function. Tomake this more apparent we consider the general Gaussian function
K(x,x′) = a · e−(x−b)2
2c2 , (2.2)
which results in a characteristic symmetric ”bell curve” shape that is shownin figure 2.1.1. The parameter a is the height of the curve’s peak(which isone in our case), b is the position of the centre of the peak(the real classvalue, x′), and c (σ/2) controls the width of the ”bell”.
Figure 2.1.1 Gaussian curve
What this means in our situation is that x is the predicted value, x′ is thereal value, and as a result the similarity measure produced by this functionis smaller when the value of σ is higher. This is because e−x is smaller if thevalue of x is higher. To make a fairer comparison we choose to use severaldatasets, five to be exact, named australian, diabetes, fourclass, ionosphereand splice for the binary classification and six for the multiclass classifica-tion. These datasets are called DNA, iris, vehicle, vowel, wine and glass.The binary datasets are compared with all described algorithms and the mul-ticlass datasets only with the multiclass implementation of SVMLight[13].This is because of the good empirical performance of the SVMLight algo-rithm and the similarity between that algorithm and our implementation.An important note is that the AUC measure can not be used when evaluat-ing multiclass predictions because of the form of the predictions, which wedescribe in the separate section about the AUC performance measure. Thus,we use another, simpler performance measure to measure the performance,called the error rate, which is simply the number of false predictions dividedby the total number of predictions.
20

CHAPTER 2. RESEARCH 2.1. EXPERIMENTS
2.1.3 SVMLight
If we want to evaluate the performance of our algorithm, we need to havea similar method with which we can compare it. The one we choose, SVM-Light, is an efficient, well known algorithm, which has been shown to havegood empirical performance. To make a fair comparison we need to imple-ment the same way of evaluating the performance. To do this, we use aPython script to implement the optimizing of the parameters λ and σ, thecross validation and the Area Under Curve measure (or error rate for themulticlass) which we also use in our RLS. To make an even fairer comparisonwe let our algorithm create files with the same training- and test sets that ituses for it’s cross validation, so that we can use exactly the same test- andtraining partitions for the SVMLight algorithm.
2.1.4 Bayes
WEKA is a program which contains a number of different machine learningalgorithms, a full list can be found here [10]. The reason why we choose touse this program is the simplicity to use the LIBSVM datasets with differentkinds of algorithms without having to implement the methods. Because ofthe low number of parameters on the Naive Bayes algorithm the optimizingof the algorithm is easy. The first of the two Booleans is the use of akernel estimation for numeric values instead of a normal distribution. Thesecond is the use of supervised discretization to convert numeric attributes tonormal ones. Both are preprocessing parameters and do have an effect on theperformance. These two parameters are mutually exclusive, which meansthat they can’t both be true. So this results in three different experiments,one where both are false, one where the one is true and one where the other istrue. After we conduct these experiments we can simply get the output fromthe program and use a script to calculate the AUC performance measure forthis algorithm.
2.1.5 K*
The second algorithm we use in our experiments does have some more pa-rameters that can be set, like the globalBlend, missingMode and entropi-cAutoBlend. The latter is a Boolean, the second is a 4 choice parameterthat determines how missing attribute values are treated and the first is aninteger in the range [0, 100]. Because of the need for another programminglanguage to write a script to optimize the parameters, we choose not toconsider every possible combination, but just optimize incrementally. Thismeans that we first choose the best performance for the minimum choice(which is entropicAutoBlend or not), which results in two performance mea-sures. When we see which gives the best performance we keep that setting
21

2.1. EXPERIMENTS CHAPTER 2. RESEARCH
and continue optimizing the next minimum choice, which is missing mode.After we know the optimal choice for this parameter we continue to the op-timizing of the last parameter, globalBlend, which we choose to do in stepsof 20, because the default value of this parameter is 20. This reduction inoptimization is because we conduct it manually, i.e. the entering of param-eters, extracting predictions and using the same script as with Naive Bayesto compute the AUC performance.
2.1.6 Random Forest
The last algorithm that we use in the experiments is also from the WEKAprogram. The parameters that need to be optimized are: the maximumdepth of the trees, the number of features to be used in random selection,the number of trees to be generated. There also is the random number seed,which just makes sure that one can produce the same results by entering thesame random seed. Because the maximum depth can be unlimited and thenumber of features can be set to random (and are by default) we optimizeusing the number of trees first and then incrementally optimize the otherparameters using the optimal number of trees. This means that we takea look into the effect of changing the number of features first and finallyoptimize by changing the maximum depth. This way we try to reach optimalperformance without having to try each possible combination, which is afutile job when no script is used.
2.1.7 AUC
In this section we describe the performance measure which we use to comparethe performance of the different techniques. This is because this measurehas been proven to be a better performance measure than accuracy[16].AUC[2], as mentioned above, stands for Area Under Curve. The curve thatis being referred to is the Receiver Operating Characteristic curve, or ROCfor short. This curve details the rate of true positives against false positivesover the range of possible threshold values for a prediction function f , withthe area under that curve (AUC) being the probability that a randomlychosen positive example(x+) has a higher decision value than a randomlychosen negative example(x−). This can also be expressed as
AUC(f) = P (f(x+) > f(x−)), (2.3)
and refers to the true distribution of positive and negative examples. Thiscomes down to that this comparison of decision values is done for eachcombination of examples. Which means that for each positive example, it ischecked that it’s higher than each negative example and for each negativevalue it’s checked if it’s lower than each positive example.
22

CHAPTER 2. RESEARCH 2.2. RESULTS
2.2 Results
In the last part of this chapter we describe the results that we obtainedfrom our experiments. Similar to the last section we divide these in theway that we conduct our comparisons. First, we consider our results of theexperiments on the SCOP dataset, using the different cross validation meth-ods and the normal use (biased on the test set). Second, we compare ouralgorithm with the SVMLight algorithm on both the binary and multiclassclassification problems and in the third section we compare our results withthe other machine learning algorithms described in this thesis.
2.2.1 SCOP
Like mentioned in the last section this dataset consists of 54 families, whicheach are a classification problem. The detailed information about the fam-ilies is described in the tables 2.2.1a and 2.2.1b, which can also be foundin [15].
Table 2.2.1a SCOP Family details
23

2.2. RESULTS CHAPTER 2. RESEARCH
Table 2.2.1b SCOP Family details
The reason we choose this dataset is that it’s an extensively used one andthe improvement on classifying this dataset can influence the developmentof better techniques for those who are active in this field of research. Toachieve a fair prediction, we choose to let the machine learning algorithm beunbiased with respect to the test set. This means that the construction ofthe model is only dependent on the training set, of which the class labels arenot known. This can result in a worse performance than when not using thistechnique, but it is fairer because we only consider the real relationship be-tween the features and the class label and does not optimize with knowledgeof the class label. One reason performance can significantly drop is whenthere is no clear link between the class and the features either due to a lot ofnoise in the dataset or due to the true absence of a relationship. The lattercomes down to the point of looking for a relationship where it doesn’t exist,which could be found if we use a biased prediction function that uses infor-mation about the class labels of the real test set to construct its model. Assaid in the last chapter, we implemented 30-pseudo-fold cross validation toimprove performance, because we thought that the performance might sta-bilize when we obtain better averaged parameters by shuffling the dataset.
24

CHAPTER 2. RESEARCH 2.2. RESULTS
Unfortunately, after trying it out on a small family and seeing no improve-ment we dropped the idea and don’t present any results about that. Insteadwe focused on the comparison between the biased algorithm and the five andten fold ones. We present the results of these experiments below in table2.2.2. As mentioned above, a score of 0.5 means that the predictions aredone randomly, and a score of 1 means the predictions are done perfectly.
Table 2.2.2 SCOP Results
If we use a graphical representation to present the performances for eachfamily we get the following separate plots:
SCOP 5 fold Results
25

2.2. RESULTS CHAPTER 2. RESEARCH
SCOP 10 fold Results
SCOP biased Results
This results in a joint plot where the families are not uniquely identifiedbut where the performance ratings are ordered in descending order to ensurea clear overview of the comparison between the different techniques, whichis presented below in figure 2.2.3.
Figure 2.2.3 SCOP all Results
26

CHAPTER 2. RESEARCH 2.2. RESULTS
As we can see, the 10 fold performs significantly better than the 5 fold,but doesn’t perform as well as the normal biased mode of predicting classlabels. This can be accounted to the noise in that particular family or to thefact that there’s no apparent relation between the features of the datapointsand their corresponding class labels. If there were enough datapoints avail-able we could improve the performance of the cross validation approach byincreasing the folds used to attain a better estimate of the prediction func-tion. To research the true cause of this drop in performance one could useother algorithms to build a model for these families to see if it’s a problem inthe dataset or not. In [15], they also find an outlier family on which resultsare notably worse using their method (SVM-pairwise). The reason why thebiased algorithm isn’t affected by this is that this is optimized using the realtest set, so that it recognizes relationships which aren’t apparent when onlyconsidering the examples in the training set. Also, this performance couldbe improved by using a Gaussian Kernel, so that relationships that aren’tbeing considered by this approach (linear kernel) are found. The reasonwhy we did not do this, as mentioned above, is the notable increment incomputational complexity, because of the need to optimize with respect toyet another parameter.
27

2.2. RESULTS CHAPTER 2. RESEARCH
2.2.2 RLS vs. SVMLight
This section consists of two parts, one being the comparison between ourbinary algorithm and the SVMLight algorithm, and the other being thecomparison between the proposed multiclass algorithm and the SVMMultiimplementation. One parameter that isn’t fair in our comparison betweenthe multiclass algorithms is the fact that we use a Gaussian Kernel and theSVMMulti uses a linear kernel. This is because the SVMLight/SVMMultialgorithm can only use a Gaussian kernel when the problem is reformulatedinto multiple binary classification problems. Because of this the SVMMultidoes not perform as well when considering datasets which are non-linearlyseparable. One could also implement a linear kernel to make the comparisonmore fair, but this thesis aims for an improvement in practical applicability.Because of this reason we decide to make the limitations and possibilities ofeach technique as clear as possible.
First we consider the binary problems where we use the Area UnderCurve (AUC) to determine the performance of the two different algorithms.As mentioned before in this section, we want the value to be as close to oneas possible, which means that the predictions are as precise as possible. Theresults of the experiments on the binary classification problems are presentedin table 2.2.4.
Table 2.2.4 AUC RLS vs. SVMLight
It can be seen that the performance of the algorithms is almost the same,with some really small variation on three of the five experiments and com-pletely the same result on the remaining two experiments. Because of thesimilarity of the algorithms, we can expect to see similar results on a prob-lem being analysed by both the Least Squares Ridge Regression and theSVMLight algorithm. These experiments confirm this expectation, so thatwe have a nice baseline for the comparisons with the other algorithms.
Second we consider the multi-class problems, which results in table 2.2.5,containing the Error rates for each problem, which should be as close to zeroas possible, since it is the number of false predictions divided by the totalnumber of predictions.
28

CHAPTER 2. RESEARCH 2.2. RESULTS
Table 2.2.5 Error rates RLS vs. SVMMulti
As you can see most of the performances of our algorithm are reasonable,except the glass and the vehicle problems. The SVMMulticlass performs no-tably worse on all datasets but one, which can probably be accounted to theuse of a Gaussian Kernel with our method. This is because a Gaussian kernelresults in an algorithm that is more able to handle with nonlinear separabil-ity in datasets. The reason why one particular dataset gets a better resulton the SVMMulticlass is not completely apparent and could be researchedfurther. The reason why the two other datasets get such bad results canprobably be accounted to the strange or absent relationship between theclass label and the attributes.
2.2.3 RLS vs. Rest
To finalize our research, we present the results of the experiments with theother methods that we used, again comparing them with our results onthose particular datasets. Because the WEKA program doesn’t provide theAUC score, but rather outputs an average performance over 10 folds, weimplemented a Python script to compute the AUC values ourselves usingthe output predictions produced by WEKA. We consider table 2.2.5, withthe results for all algorithms. The performances in that table are optimizedas described in the previous section. This again are AUC scores, whichmeans that 0.5 is a random prediction and 1 is a perfect one.
Table 2.2.5 AUC RLS vs. Rest Optimized
It can be seen that the performance depends on the dataset that is beinganalyzed. This is because each algorithm uses his own methods to detectthe relationships. This is exactly the reason why we try to consider as many
29

2.2. RESULTS CHAPTER 2. RESEARCH
different datasets as possible. Another important thing to note is that themost problems from the LIBSVM website are relatively easy compared toa dataset like SCOP. This means that the relationship between the classlabels and the features is mostly linearly separable. This is probably thereason that the performance of the researched algorithms is similar to theperformance of the Regularized Least Squares algorithm on most datasets.On the Diabetes dataset there is a notable drop in performance probablybecause this problem is more difficult.
30

Chapter 3
Conclusion
We present an algorithm that can be used for both binary and multi-classclassification. The latter is done using a joint kernel approach. We showthat it has similar results as the other machine learning algorithms thatwe research, and even significantly outperforms them on one dataset. Thisis probably because of the fact that this dataset is non-linearly separable.We have also shown that it slightly outperforms SVMLight on all the cho-sen binary datasets but one. In terms of computation time it was hard tocompare the performance of the two algorithms, mainly because we useddifferent computers to compute the results. Next to that would the compar-ison not be completely fair because the SVMLight algorithm is optimizedextensively and our implementation is not. One thing we can consider is thecomputational complexity of both algorithms, which is O(qlf) for each iter-ation of SVMLight[12], where q is the number of rows in the Hessian matrix,l is the number of training examples and f is the maximum number of non-zero features in any of the training examples. For RLS the complexity[14]of calculating α is O(n3), where n is the number of features. The disadvan-tage is that these complexities are not that suited for comparison becauseof the different variables that influence them. Nevertheless, one could runall algorithms on the same computer and compare the computation timeneeded for each one. With respect to the memory use one can say thatthe algorithms need more memory as the problems get larger, where morethan 1 GB is no exception (on a SCOP family), but a precise comparisonis not considered in this thesis. The comparison of the multiclass part alsoresulted in a notable better performance of the Regularized Least Squaresalgorithm. One can say that this comparison isn’t completely fair becauseof the fact that the SVMMulti algorithm doesn’t support a Gaussian kernelunless it splits up the problem in multiple binary classification problems. Tocounter that, one can say that the possibility to use a Gaussian kernel grantspermission to use one. One could always implement our algorithm with a
31

CHAPTER 3. CONCLUSION
linear kernel to compare those results. We also research the performance ofthe algorithm on the SCOP database, on which we also get stable resultson most families. Some do give an AUC of under 0.5, which can probablybe accounted to the non-linear separability of those families, or the absenceof a real relationship between the features and the class labels. The rea-son why the normal version did get all AUC scores above 0.5 is probablybecause this algorithm is biased on the test set, meaning that it uses thetest data to optimize the parameters. Another reason could be that we donot use a Gaussian kernel while researching SCOP because of the increaseof computational complexity when optimizing the σ parameter. Because ofthe increase of computational power this could be an interesting extensionto be researched in future work.
32

Chapter 4
Appendix
4.1 Python
In this section we give a brief description of the programming languagePython, which we use to implement all our code. The goal of this sectionis not to give a full overview of all the functions, which can be found on[9],but to give someone who is familiar with imperative programming an ideahow the language is built up.
Python is a very clean language, which is very easy to learn when oneknows C++ or Java. It uses a simple syntax that’s the same on all basiccontrol structures. It also uses the modularity by enabling the possibilityto use different files (filename.py) for the different classes. One downside isthat debugging has to be done manually, with a lot of output to the consolescreen. We begin with the hello world program, which can not be moreintuitive:
print ”hello world” or print ’hello world’
As we can see there is no semicolon and Python does it with both (”) and(””). To get a better idea of the complete structure next we will considerthe basic statements, like the conditional statement:
if condition:body
elif condition:body
As we can see there is again no semicolon, the structure of the statement isonly done with the indent in the body of the if statement. The conditioncan be an (in)equality, a Boolean or a concatenation of those using one ofthe keywords and or or. The elif condition: can also be replaced by else: if
33

4.1. PYTHON CHAPTER 4. APPENDIX
you don’t want to use another condition. Next we have the for-loop, whichcan be used in different ways making it very convenient to work with:
for element in list:body
This just picks each element from a list, which can either be a real listor a string (which essentially is a list of characters), and assigns it to theelement variable. Another nice thing is that Python does all the typing ofthe variables for you, if you assign something(y) to a variable x, that variablex will get the same type as y, overwriting the old type. The second way touse the for loop is with the index of the list, where we can again also use itto identify the index of a character in a string:
for index in range(0,len(list):body
It’s important to note that the names index, element and list are arbi-trary and that body is a way to denote another statement. len(), on the otherhand, is a function from Python. All statements that you want to be insidethe for loop need the same indentation in the beginning as the last statementin that for loop. If you want to exit the loop you just begin the statementon the same indent as the for statement itself. This works the same with allfunctions. Another important function of a programming language, espe-cially in our case, is to read and write files, which is also very easy in Python.One simply decides what to do with the file (read,(over)write,append) andchoose the corresponding parameter for option (‘w’ for write, ‘r’ for read, ‘a’for append). Write creates a file if it doesn’t exist and read and append willgive an error if it doesn’t exist. Write will also overwrite if the file exists.Now one can simply use the function
file = open(filename, option)
and then use lines = file.readlines() to read or file.write(string) to write (astring!) to a file. The function readlines() returns a list with all the lines inthe file.
34

CHAPTER 4. APPENDIX 4.2. ALGORITHM
4.2 Algorithm
This section does not consist of an overview of the code, because there is somuch code that it would become a mess. Instead, the code is available onrequest and this section describes how to use the different scripts that we useto research the algorithms. Because all is written in Python, you will needthe Python program (http://www.python.org/), as well as the NumPy pack-age (http://numpy.scipy.org/). NumPy is the fundamental package neededfor scientific computing with Python.
4.2.1 RLS on SCOP
For this script we can run the program by entering
python Run.py from to folds
Here from is the family where the algorithm starts, to is the family untilwhere the algorithm will run and folds is the number of folds used. Wherefrom ∈ [2, 54], to ∈ [3, 55] and folds is 1, 5 or 10, 1 being normal, 5 and10 being 5 and 10 fold cross validation. The program outputs several files,on the cross validation first of all it creates a folder for the family beingconsidered, 1 file for each fold, containing a list of AUC scores for eachlambda and one file with the final lambda and the AUC score on the realtest set. On the normal mode it creates a single file with all AUC scoresand another script can be run to calculate all the maximum AUC scores forall families in families.info by typing
python AUC curve.py
4.2.2 RLS on Rest
To run the RLS algorithm on other datasets from the LIBSVM website[5],both binary and multi-class the methods are the same. There are two waysto run the program, either using
python Run.pyor using
python Rls auc.py x
Where Run.py runs it for all problems and the latter uses x, an integer vari-able, which in our binary script can range from 0 to 4, to choose one of fiveproblems. In the multi-class script it can range from 0 to 5, because there are6 multi-class problems which we consider. If one wants to use the latter way,the file Rls auc.py has to be edited slightly by removing the comment symbol,(#), before the line #filechoice = int(sys.argv[1]) #first argument (choose file).
35

4.2. ALGORITHM CHAPTER 4. APPENDIX
To change the datasets that are being used one can simply edit the same fileand assign other names to the filename variable. This script uses one inputfile and next to creating an output file .out, it also creates the input files forthe SVMLight and SVMMulti scripts. As mentioned above, this works onboth the binary and the multiclass classification script.
4.2.3 SVMLight and SVMMulti
The SVMLight wrapper consists of two files, one to train the algorithmand the second to run the real performance test. The first one, called bypython SVMLightWrapper.py, runs the algorithm for all problems in thelist subprobs[]. The second one, called by python SVMLightWrapperTest.py,does the same but now does it only once, and uses the parameters in the listslambdas and sigmas, which have to be entered manually. This script uses in-put files created by the binary RLS script and creates one file results $name$where $name$ is the name of the problem. It also creates a .model file foreach fold. There’s also a file named SVMLightWrapper(linear).py, which canbe used to run the SVMLight algorithm with a linear kernel. The SVMMultiwrapper works the same, but here there is no possibility to use a Gaussiankernel.
36

Bibliography
[1] Erin L. Allwein, Robert E. Schapire, and Yoram Singer. Reducingmulticlass to binary: a unifying approach for margin classifiers. Journalof Machine Learning Research, 1:113–141, 2001.
[2] Ulf Brefeld and Tobias Scheffer. Auc maximizing support vector learn-ing. In In Proceedings ICML workshop on ROC Analysis in MachineLearning, 2005.
[3] Leo Breiman. Random forests. Machine Learning, 45(1):5–32, 2001.
[4] Christopher J. C. Burges. A tutorial on support vector machines forpattern recognition. Data Mining and Knowledge Discovery, 2(2):121–167, 1998.
[5] Chih-Chung Chang and Chih-Jen Lin. Libsvm. http://www.csie.
ntu.edu.tw/~cjlin/libsvm/.
[6] John G. Cleary and Leonard E. Trigg. K*: An instance-based learnerusing and entropic distance measure. In ICML, pages 108–114, 1995.
[7] Thomas G. Dietterich and Ghulum Bakiri. Solving multiclass learn-ing problems via error-correcting output codes. Journal of ArtificialIntelligence Research, 2:263–286, 1995.
[8] Bradley Efron and Gail Gong. A leisurely look at the bootstrap, thejackknife, and cross-validation. The American Statistician, 37(1):36–48,1983.
[9] Python Software Foundation. Python documentation. http://docs.
python.org/.
[10] Eibe Frank, Mark Hall, and Len Trigg. Weka. http://www.cs.
waikato.ac.nz/ml/weka/.
[11] Trevor Hastie and Robert Tibshirani. Classification by pairwise cou-pling. In NIPS ’97: Proceedings of the 1997 conference on Advances in
37

BIBLIOGRAPHY BIBLIOGRAPHY
neural information processing systems 10, pages 507–513, Cambridge,MA, USA, 1998. MIT Press.
[12] Thorsten Joachims. Making large-scale support vector machine learningpractical. pages 169–184, 1999.
[13] Thorsten Joachims. A support vector method for multivariate perfor-mance measures. In Luc De Raedt and Stefan Wrobel, editors, Proceed-ings of the 22nd International Conference on Machine learning, volume119 of ACM International Conference Proceeding Series, pages 377–384,New York, NY, USA, 2005. ACM Press.
[14] Shawe-Taylor John and Cristianini Nello. Kernel Methods for PatternAnalysis. Cambridge University Press, June 2004.
[15] Li Liao and William Stafford Noble. Combining pairwise sequence sim-ilarity and support vector machines for detecting remote protein evolu-tionary and structural relationships. Journal of Computational Biology,10(6):857–868, 2003.
[16] Charles X. Ling, Jin Huang, and Harry Zhang. Auc: a statistically con-sistent and more discriminating measure than accuracy. In IJCAI’03:Proceedings of the 18th international joint conference on Artificial intel-ligence, pages 519–524, San Francisco, CA, USA, 2003. Morgan Kauf-mann Publishers Inc.
[17] Tom M. Mitchell. Machine Learning. McGraw-Hill, New York, 1997.
[18] Alexey G. Murzin, John-Marc Chandonia, Antonina Andreeva, DaveHoworth, Loredana Lo Conte, Bartlett G. Ailey, Steven E. Brenner,Tim J. P. Hubbard, and Cyrus Chothia. Scop. www.bio.cam.ac.uk/
scop/.
[19] K. B. Petersen and M. S. Pedersen. The matrix cookbook, oct 2008.
[20] Ryan Rifkin and Aldebaro Klautau. In defense of one-vs-all classifica-tion. Journal of Machine Learning Research, 5:101–141, 2004.
[21] Ryan Rifkin, Gene Yeo, and Tomaso Poggio. Regularized least-squaresclassification. In Advances in Learning Theory: Methods, Models andApplications, volume 190. IOS Press, 2003.
[22] Ryan Michael Rifkin. Everything Old is New Again: A Fresh Look atHistorical Approaches in Machine Learning. PhD thesis, MIT, 2002.
[23] Johan A K Suykens, Tony Van Gestel, Jos De Brabanter, Bart DeMoor, and Joos Vandewalle. Least Squares Support Vector Machines.World Scientific Publishing, Singapore, 2002.
38

BIBLIOGRAPHY BIBLIOGRAPHY
[24] Evgeni Tsivtsivadze, Jorma Boberg, and Tapio Salakoski. Locality ker-nels for protein classification. In Raffaele Giancarlo and Sridhar Han-nenhalli, editors, Proceedings of the 7th International Workshop on Al-gorithms in Bioinformatics, (WABI 2007), pages 2–11. Springer, 2007.
[25] Jason Weston, Bernhard Scholkopf, and Olivier Bousquet. Joint ker-nel maps. In Joan Cabestany, Alberto Prieto, and Francisco SandovalHernandez, editors, IWANN 2005, Vilanova i la Geltru, Barcelona,Spain, June 8-10, 2005, Proceedings, Lecture Notes in Computer Sci-ence, pages 176–191, 2005.
39

ISBN ?ISSN 1239-1883