kernel density analysis a tool for the visualization of
TRANSCRIPT
Kernel density analysis – a tool for the visualization of spatial patterns in regional studies
Rüdiger Budde
Robust-Workshop in Essen, 21st February, 2019

Theoretical background
21.02.2019 2Kernel density analysis – a tool for the visualization of spatial patterns in regional studies

Kernel Density Estimation (KDE) is a non-parametric technique
for density estimation in which a known density function (the
kernel) is averaged across the observed data points to create a
smooth approximation.
Theoretical background
Kernel Density Estimation (KDE)
21.02.2019 3Kernel density analysis – a tool for the visualization of spatial patterns in regional studies

Let b denote the bin-width then the histogram estimation at a point x from a random sample of size n is given by,
Theoretical background
Density Estimation and Histograms
bn
xcontainingbininnsobservatioofnumberbxfH =);(ˆ
Two choices have to be made when constructing a histogram:
• Positioning of the bin edges
• Bin-width
21.02.2019 4Kernel density analysis – a tool for the visualization of spatial patterns in regional studies
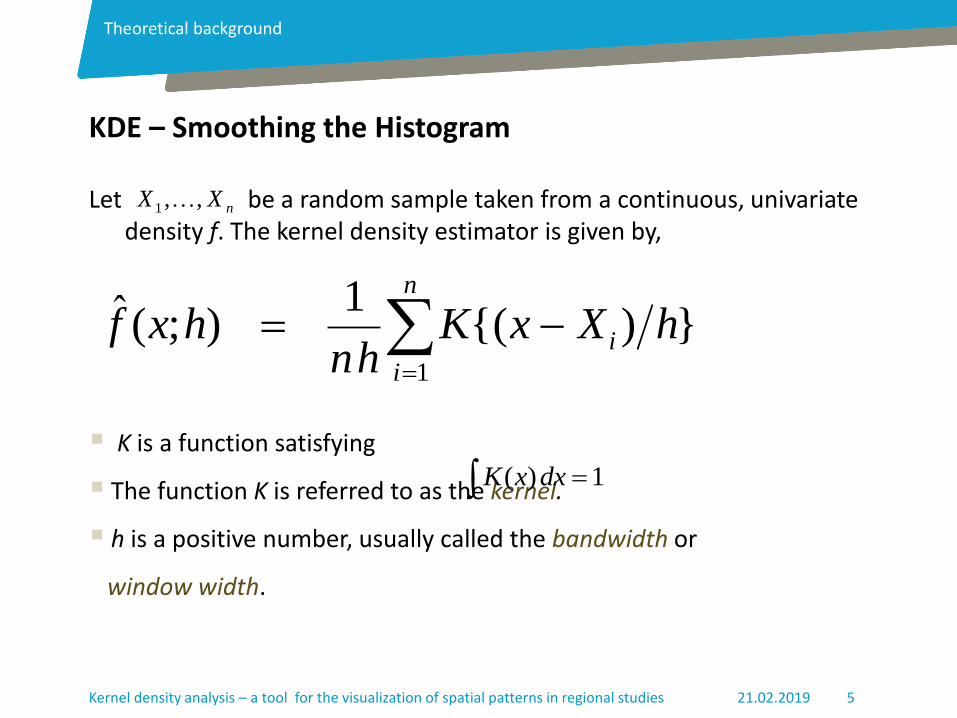
Let be a random sample taken from a continuous, univariate density f. The kernel density estimator is given by,
21.02.2019 5Kernel density analysis – a tool for the visualization of spatial patterns in regional studies
Theoretical background
KDE – Smoothing the Histogram
})({1
);(ˆ
1
hXxKhn
hxf i
n
i
−= =
nXX ,,1
▪ K is a function satisfying
▪ The function K is referred to as the kernel.
▪ h is a positive number, usually called the bandwidth or
window width.
=1)( dxxK
21.02.2019 6Kernel density analysis – a tool for the visualization of spatial patterns in regional studies
Theoretical background
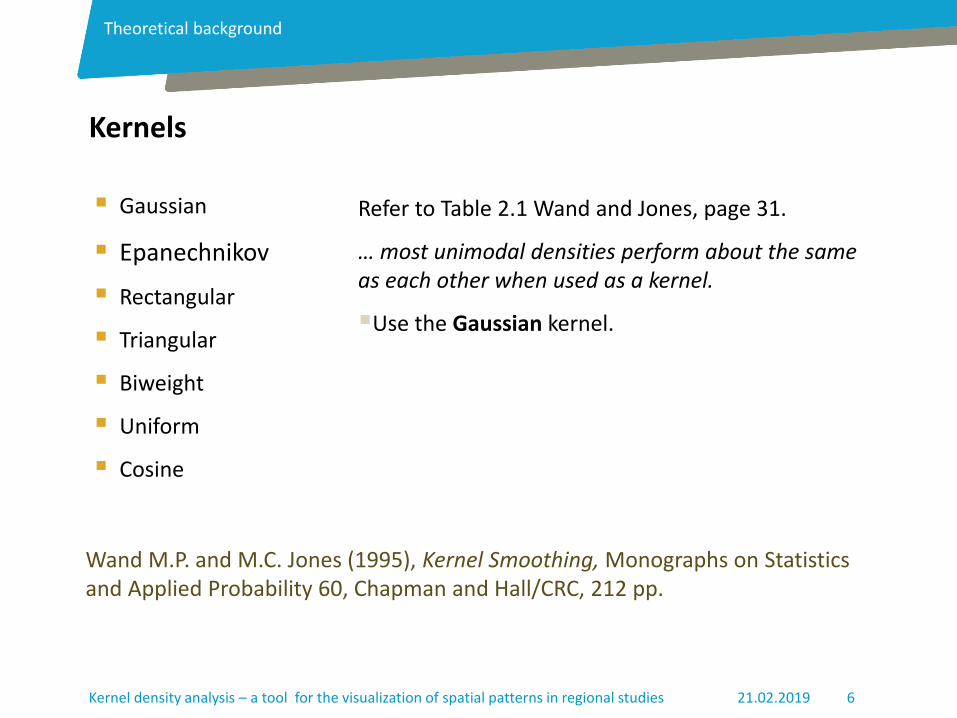
Kernels
▪ Gaussian
▪ Epanechnikov
▪ Rectangular
▪ Triangular
▪ Biweight
▪ Uniform
▪ Cosine
Wand M.P. and M.C. Jones (1995), Kernel Smoothing, Monographs on Statistics and Applied Probability 60, Chapman and Hall/CRC, 212 pp.
Refer to Table 2.1 Wand and Jones, page 31.
… most unimodal densities perform about the same as each other when used as a kernel.
▪Use the Gaussian kernel.

The problem of choosing 𝒉 is crucial in density estimation
–A large ℎ will over-smooth the DE and mask the structure of the data
–A small ℎ will yield a DE that is spiky and very hard to interpret
21.02.2019 7Kernel density analysis – a tool for the visualization of spatial patterns in regional studies
Theoretical background
Bandwidth selection

21.02.2019 8Kernel density analysis – a tool for the visualization of spatial patterns in regional studies
Theoretical background
Optimal bandwith
Theoretical Constructs
• Mean Integrated Squared Error (MISE)
• Asymptotic Mean Integrated Squared Error (AMISE)The formulas are not able to be used directly since they involve the unknown density function.
A rule-of-thumb bandwidth estimator
• If Gaussian basis functions are used to approximate univariate data, and theunderlying density being estimated is Gaussian, the optimal choice for h
ොσ standard deviation of the samples.

A rule-of-thumb bandwidth estimator. where is the standard deviation of the samples. The estimate based on the rule-of-thumb bandwidth is significantly oversmoothed.
Generally these test are constructed for samples with 1 dimension, while spatial problems have got at least two dimensions.
21.02.2019 9Kernel density analysis – a tool for the visualization of spatial patterns in regional studies
Theoretical background

Jukka M. krisp, stefan peters, Christian e. Murphy & hongChao fan, Visual Bandwidth Selection for Kernel Density Maps, Geoinformation 5/2009, S. 445–454
10
Helpful literature related to the choice of bandwidth.
21.02.2019Kernel density analysis – a tool for the visualization of spatial patterns in regional studies
Practical application of Kernel Density Analysis
21.02.2019 11Kernel density analysis – a tool for the visualization of spatial patterns in regional studies
21.02.2019 12Kernel density analysis – a tool for the visualization of spatial patterns in regional studies
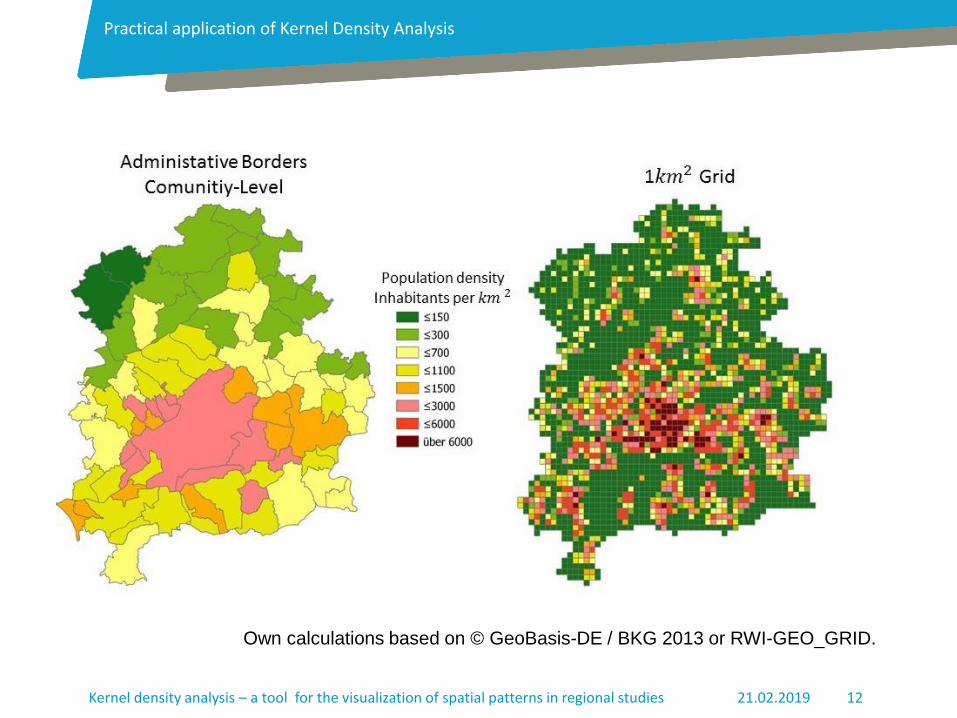
Practical application of Kernel Density Analysis
Own calculations based on © GeoBasis-DE / BKG 2013 or RWI-GEO_GRID.
21.02.2019 13Kernel density analysis – a tool for the visualization of spatial patterns in regional studies
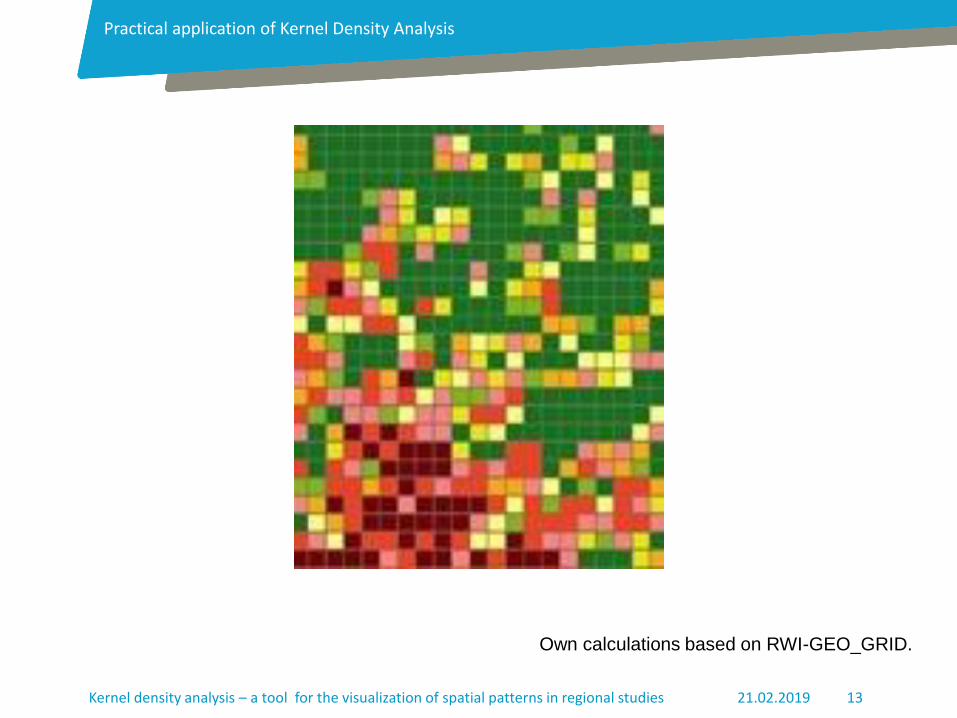
Practical application of Kernel Density Analysis
Own calculations based on RWI-GEO_GRID.

21.02.2019 14Kernel density analysis – a tool for the visualization of spatial patterns in regional studies
Practical application of Kernel Density Analysis
Own calculations based on RWI-GEO_GRID.

21.02.2019 15Kernel density analysis – a tool for the visualization of spatial patterns in regional studies
Practical application of Kernel Density Analysis
Own calculations based on RWI-GEO_GRID.
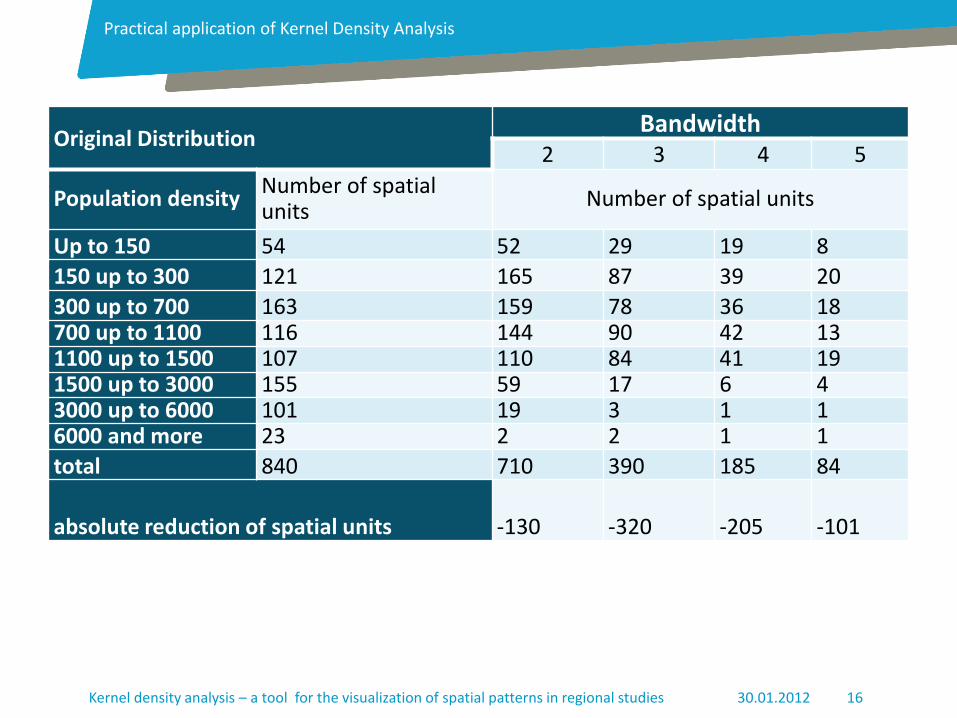
Original DistributionBandwidth
2 3 4 5
Population densityNumber of spatial units
Number of spatial units
Up to 150 54 52 29 19 8
150 up to 300 121 165 87 39 20
300 up to 700 163 159 78 36 18700 up to 1100 116 144 90 42 131100 up to 1500 107 110 84 41 191500 up to 3000 155 59 17 6 43000 up to 6000 101 19 3 1 16000 and more 23 2 2 1 1
total 840 710 390 185 84
absolute reduction of spatial units -130 -320 -205 -101
30.01.2012 16Kernel density analysis – a tool for the visualization of spatial patterns in regional studies
Practical application of Kernel Density Analysis

21.02.2019 17Kernel density analysis – a tool for the visualization of spatial patterns in regional studies
Practical application of Kernel Density Analysis
Own calculations based on RWI-GEO_GRID.

Application of the found results
21.02.2019 18Hier steht der Titel der Präsentation und optional der Name des Verfassers
21.02.2019 19Kernel density analysis – a tool for the visualization of spatial patterns in regional studies
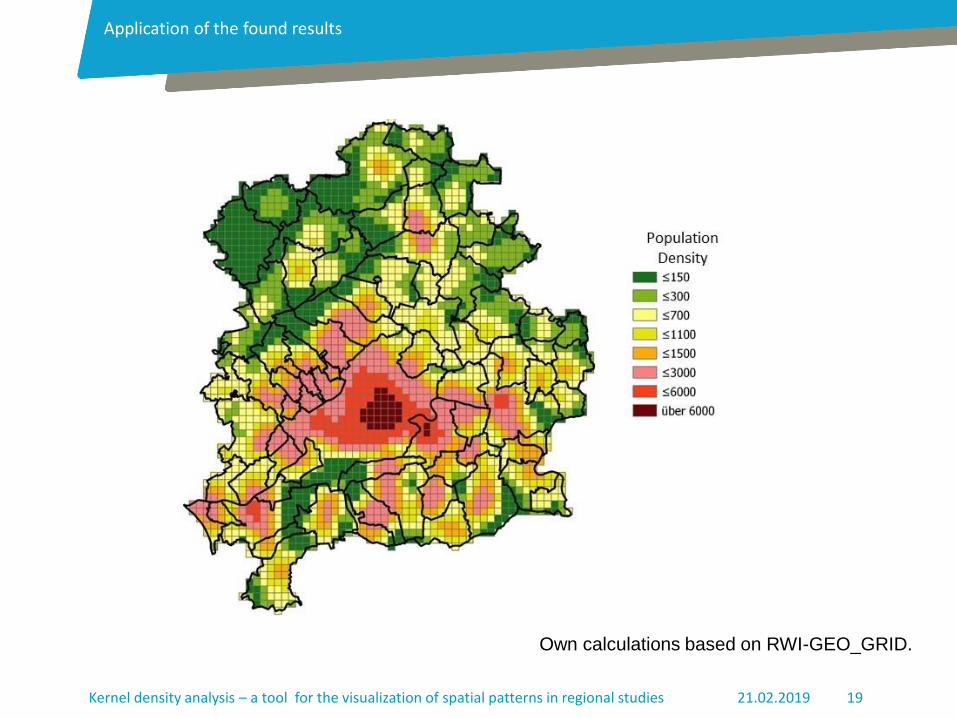
Application of the found results
Own calculations based on RWI-GEO_GRID.

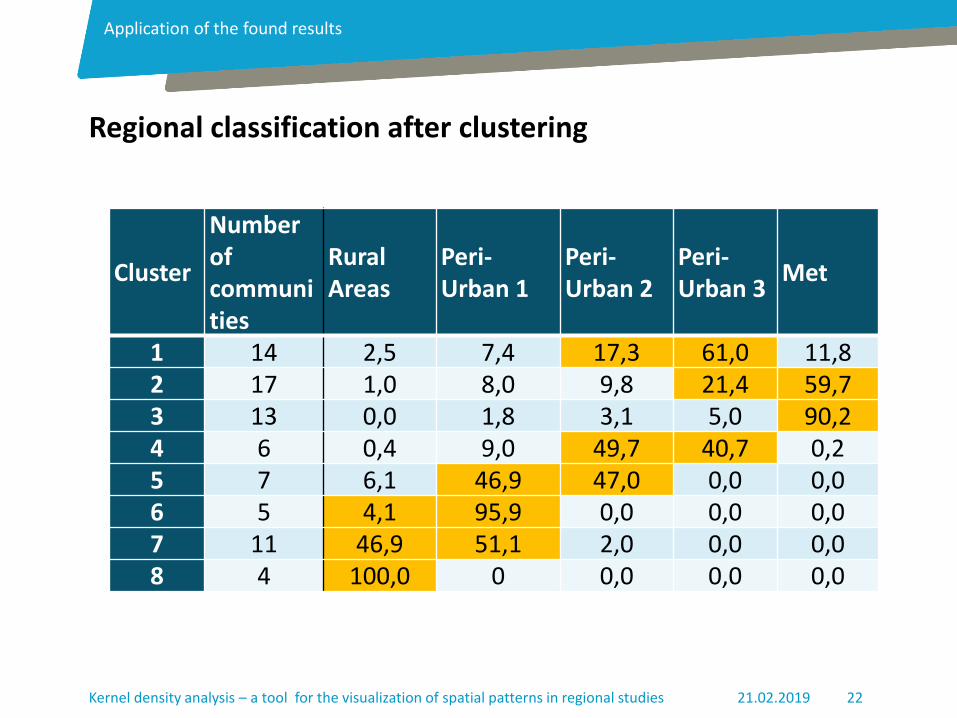
• For each municipality, the proportions of the total area can be
determined in the density classes.
• In order to further compress the information and to summarize
similarly structured municipalities, the municipalities have been
clustered according to these shares.
• For this purpose it seems reasonable to consider 8 clusters. They are
characterized in the following table by the mean values of the
individual parts.
21.02.2019 20Kernel density analysis – a tool for the visualization of spatial patterns in regional studies
To bridge the gap between two themes
Analytic regions versus administrative regions
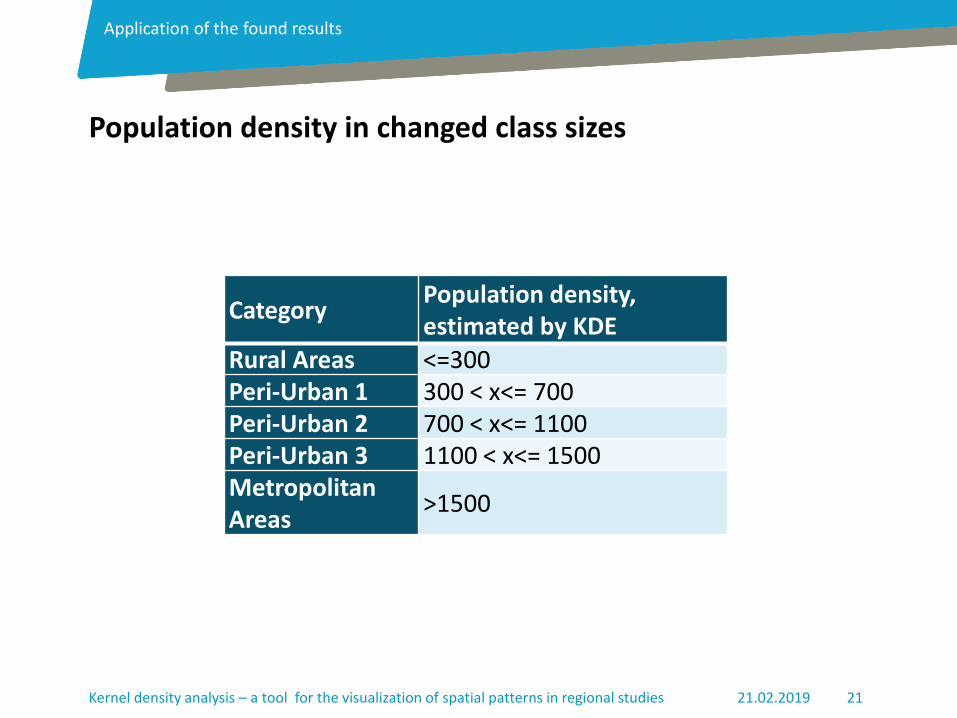
CategoryPopulation density, estimated by KDE
Rural Areas <=300Peri-Urban 1 300 < x<= 700Peri-Urban 2 700 < x<= 1100Peri-Urban 3 1100 < x<= 1500Metropolitan Areas
>1500
21.02.2019 21Kernel density analysis – a tool for the visualization of spatial patterns in regional studies
Application of the found results
Population density in changed class sizes
Cluster
Numberofcommunities
Rural Areas
Peri-Urban 1
Peri-Urban 2
Peri-Urban 3
Met
1 14 2,5 7,4 17,3 61,0 11,82 17 1,0 8,0 9,8 21,4 59,73 13 0,0 1,8 3,1 5,0 90,24 6 0,4 9,0 49,7 40,7 0,25 7 6,1 46,9 47,0 0,0 0,06 5 4,1 95,9 0,0 0,0 0,07 11 46,9 51,1 2,0 0,0 0,08 4 100,0 0 0,0 0,0 0,0
21.02.2019 22Kernel density analysis – a tool for the visualization of spatial patterns in regional studies
Application of the found results
Regional classification after clustering

21.02.2019 23Kernel density analysis – a tool for the visualization of spatial patterns in regional studies
Application of the found results
Own calculations based on © GeoBasis-DE / BKG.

Thank you, for your attention!
24Kernel density analysis – a tool for the visualization of spatial patterns in regional studies 21.02.2019