kenya’s national viral load & eid dashboard technology tools to support the scale up of viral...
TRANSCRIPT

Information Technology Tools to Support the Scale Up of Viral Load Testing and Early Infant Diagnosis
Kenya’s National Viral Load & EID Dashboard
James Batuka, USAID Kenya and East Africa Jackson Hungu, CHAI
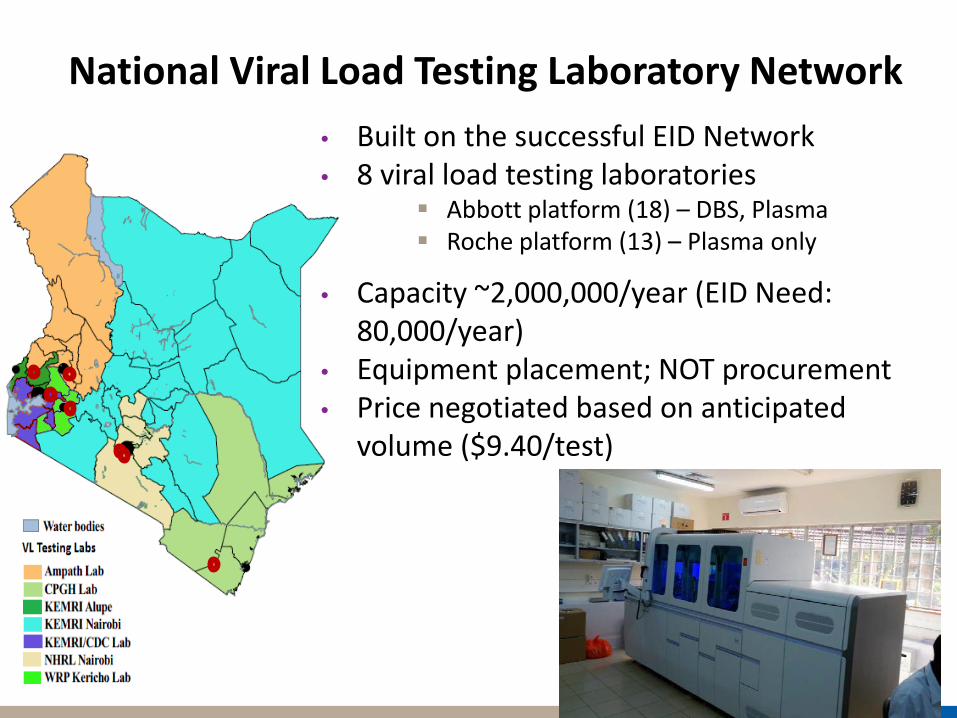
National Viral Load Testing Laboratory Network • Built on the successful EID Network • 8 viral load testing laboratories
Abbott platform (18) – DBS, Plasma Roche platform (13) – Plasma only
• Capacity ~2,000,000/year (EID Need: 80,000/year)
• Equipment placement; NOT procurement • Price negotiated based on anticipated
volume ($9.40/test)
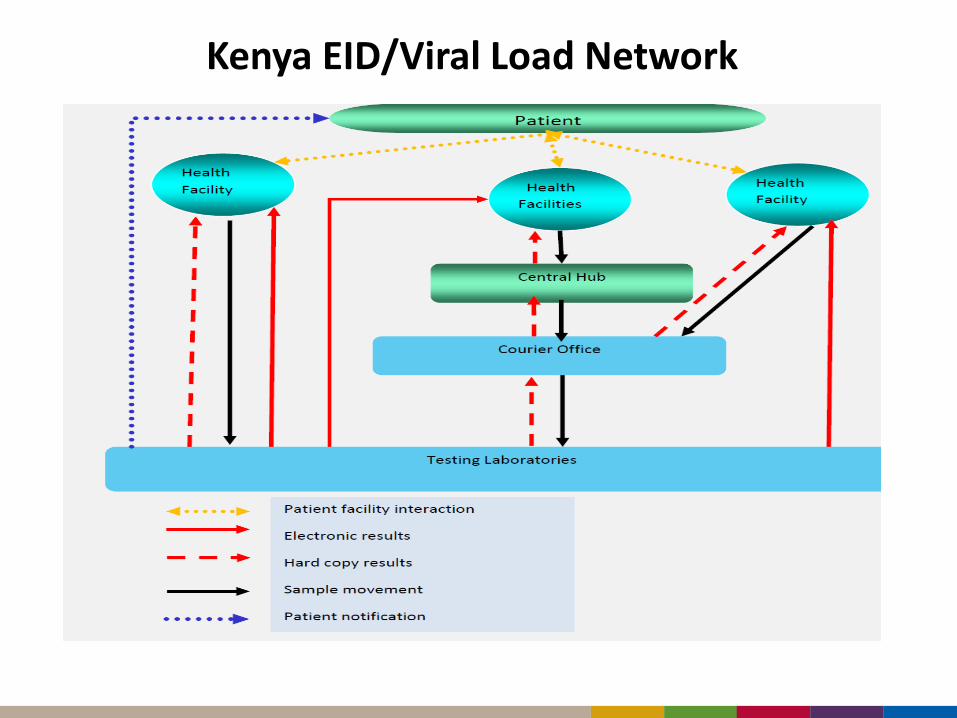
Kenya EID/Viral Load Network

NASCOP Website – Dashboards
Behind the Dashboards • Started with EID testing in
the lab • Evolved to national
dashboard • Linked to courier system • Notification of sample
receipt by the lab • Notification of testing
completion • Email result delivery
Motivation • Impossible to run testing
for thousands of facilities without automation
• Results lost of couldn’t be tracked with scale up
• Delayed return of results • Basic data summary on
excel insufficient • Great demand for data by
programs
http://eid.nascop.org/ | http://viralload.nascop.org/
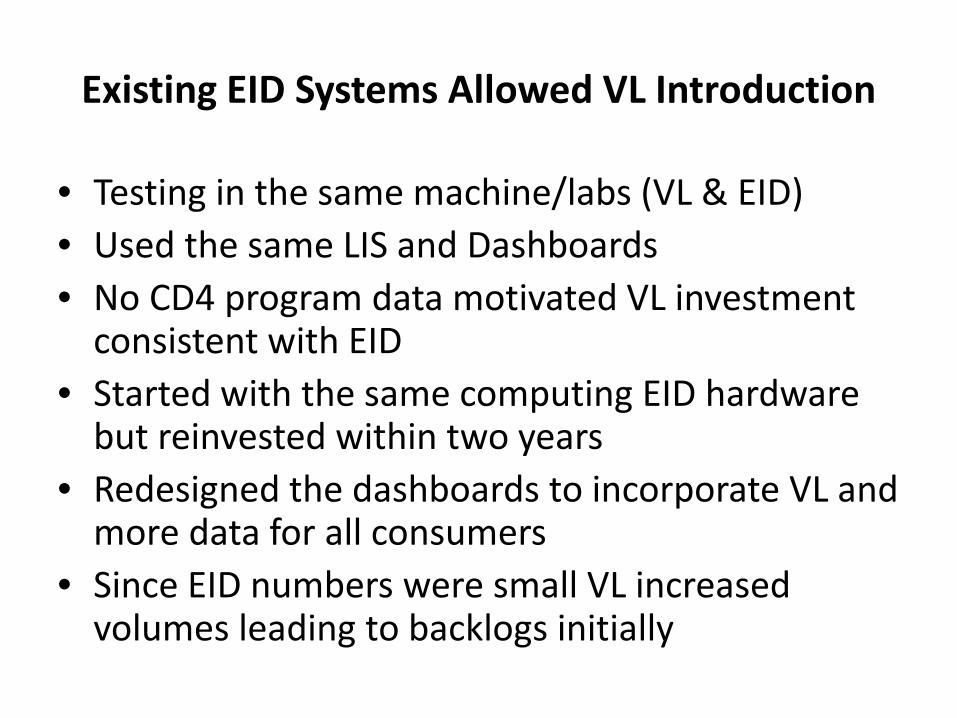
Existing EID Systems Allowed VL Introduction
• Testing in the same machine/labs (VL & EID) • Used the same LIS and Dashboards • No CD4 program data motivated VL investment
consistent with EID • Started with the same computing EID hardware
but reinvested within two years • Redesigned the dashboards to incorporate VL and
more data for all consumers • Since EID numbers were small VL increased
volumes leading to backlogs initially

Program Innovations Behind the System
• Data clerks at labs slowly being eliminated – Data entry at facilities by the facilities – Connection to EMRs for data (sample & results) transfer automation
• Sample receipt hubs – Sample transport coordinated – Access to results via online portal and printing for last mile
• Mobile phone access to retrieve results – USSD code used by clinician to check past & present results
• Electronic notifications – Notifications to facilities to log on and download results – Notification to patients on availability of results (EID) – Delivery of VL results to patients
• Monitoring of labs, partners, and facilities – Real time monitoring of testing and backlogs at the labs – Program monitoring of IPs – Program monitoring at facility, sub-county, and county levels

The National Viral Load Dashboard
Summary Trends Regimen Age County/Sub-County Partners Lab Performance Non-suppression Login
National TAT (Days)
Source: http://viralload.nascop.org/
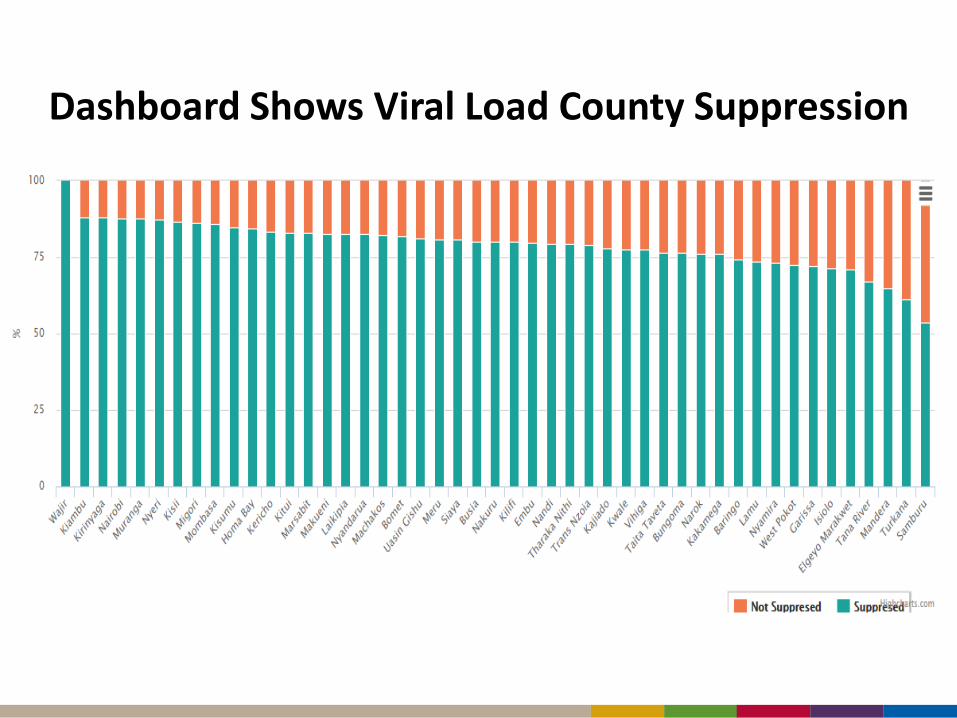
Dashboard Shows Viral Load County Suppression

Dashboard Allows Analysis of Trends Over Time

Dashboard Allows Analysis of VL Suppression Across Regimens
Can assess: • Number of tests per
regimen • Suppression rate • Gender • Age distribution

Dashboard Allows Analysis by Age & by Implementing Partner
Can assess: • Age categories • Tests done • Suppression • Per county • Partner
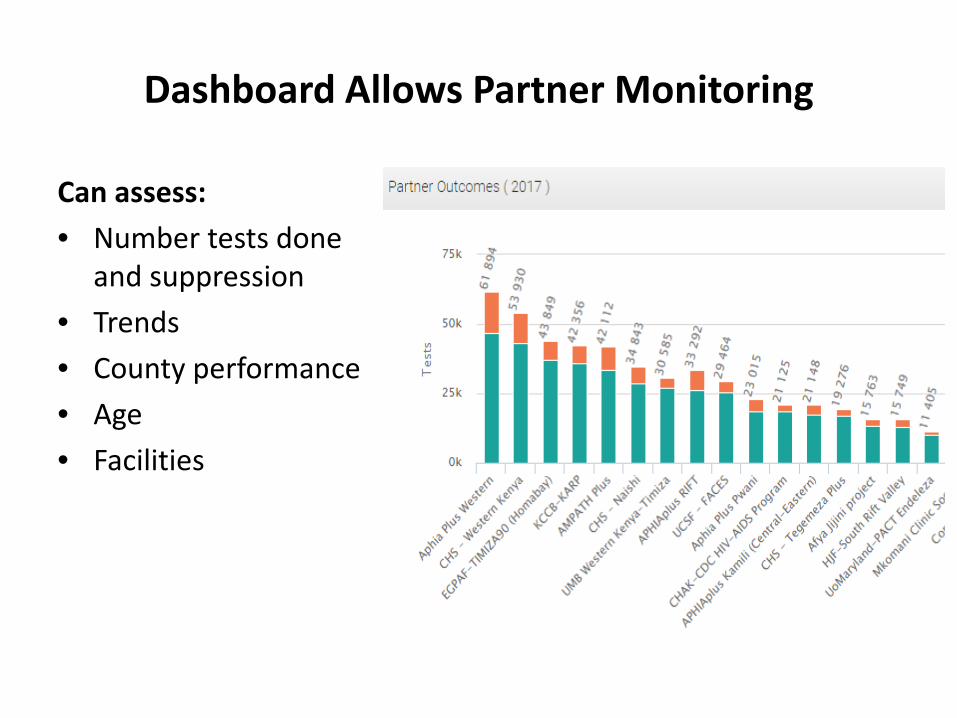
Dashboard Allows Partner Monitoring
Can assess: • Number tests done
and suppression • Trends • County performance • Age • Facilities
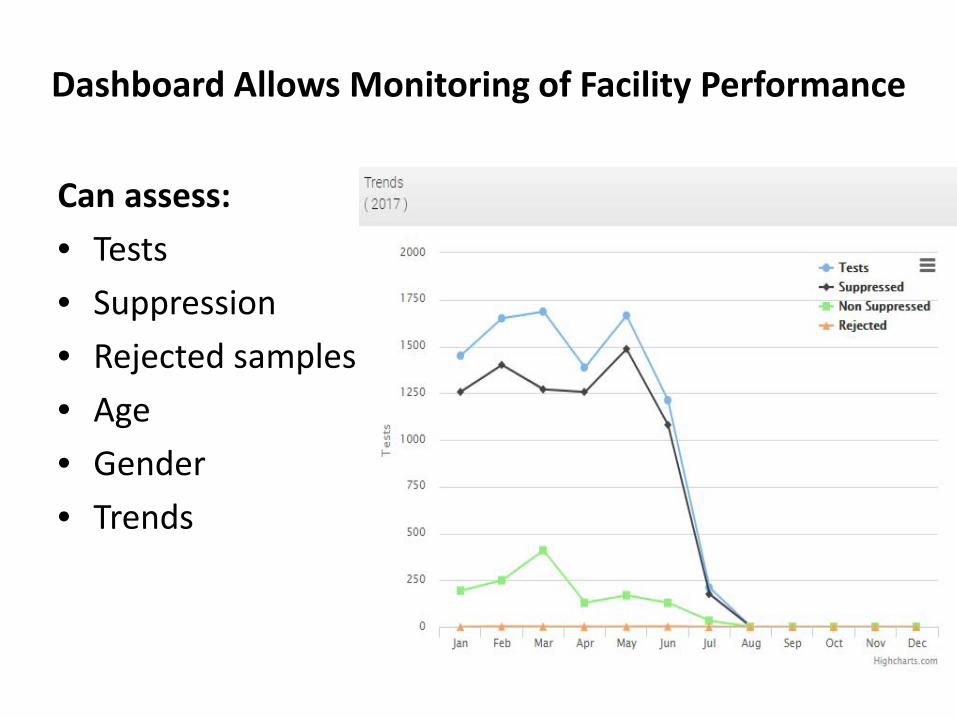
Dashboard Allows Monitoring of Facility Performance
Can assess: • Tests • Suppression • Rejected samples • Age • Gender • Trends
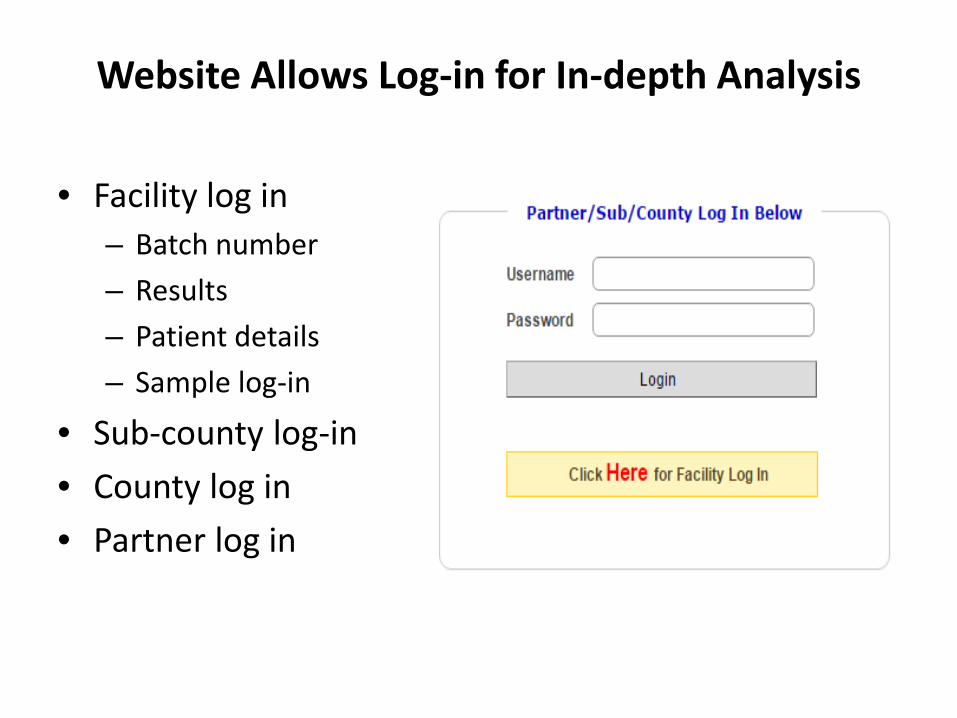
Website Allows Log-in for In-depth Analysis
• Facility log in – Batch number – Results – Patient details – Sample log-in
• Sub-county log-in • County log in • Partner log in
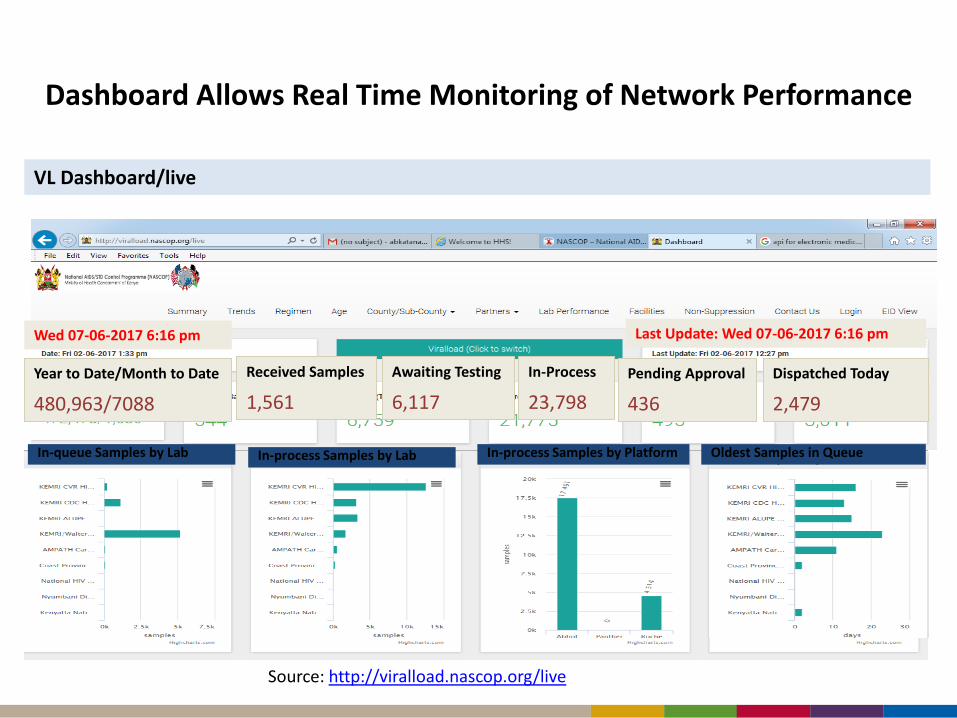
Dashboard Allows Real Time Monitoring of Network Performance
VL Dashboard/live
Year to Date/Month to Date
480,963/7088
Received Samples
1,561 Awaiting Testing
6,117 In-Process
23,798 Pending Approval
436 Dispatched Today
2,479
In-queue Samples by Lab In-process Samples by Platform In-process Samples by Lab Oldest Samples in Queue
Source: http://viralload.nascop.org/live
Wed 07-06-2017 6:16 pm Last Update: Wed 07-06-2017 6:16 pm
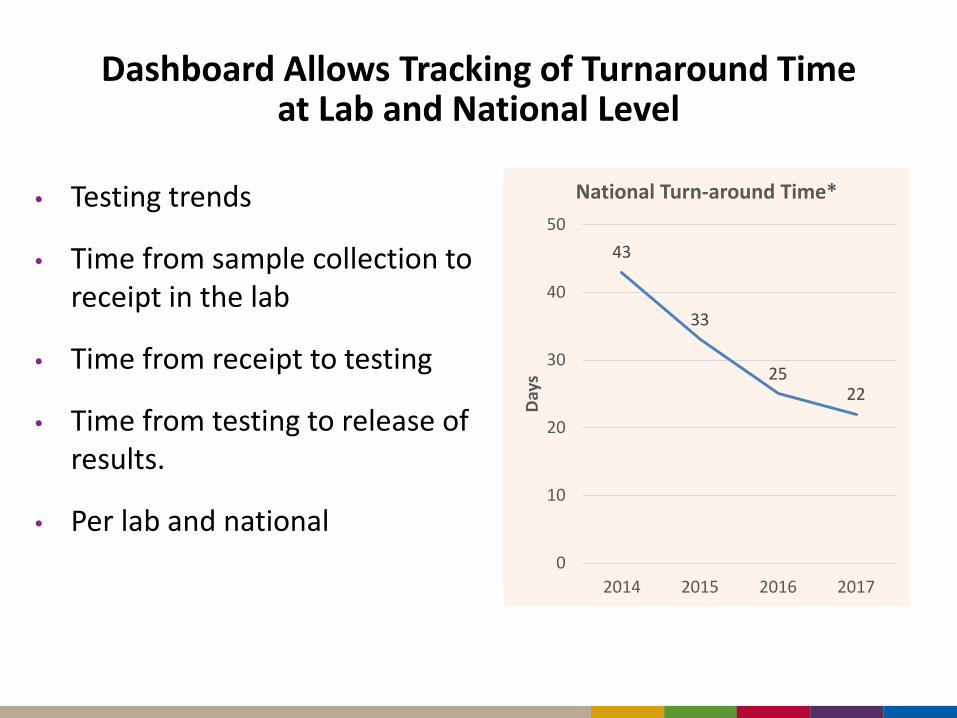
Dashboard Allows Tracking of Turnaround Time at Lab and National Level
• Testing trends
• Time from sample collection to receipt in the lab
• Time from receipt to testing
• Time from testing to release of results.
• Per lab and national
43
33
25 22
0
10
20
30
40
50
2014 2015 2016 2017
Day
s
National Turn-around Time*
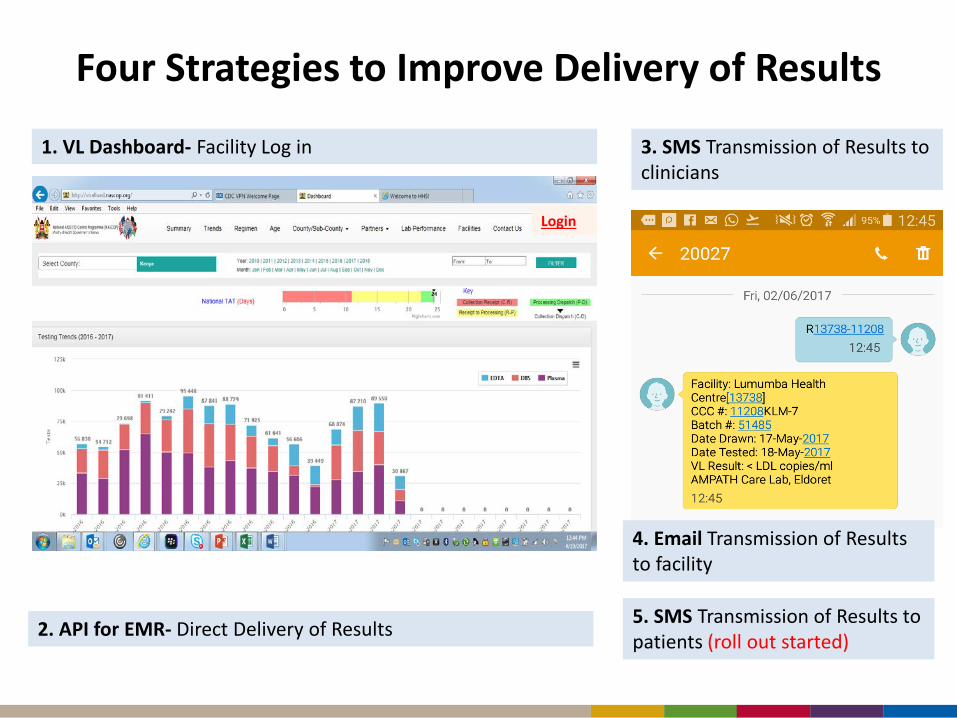
Four Strategies to Improve Delivery of Results
1. VL Dashboard- Facility Log in 3. SMS Transmission of Results to clinicians
2. API for EMR- Direct Delivery of Results
4. Email Transmission of Results to facility
Login
5. SMS Transmission of Results to patients (roll out started)
Interesting Facts with the EID/VL Electronic System
• Designed/maintained by Kenyan students • API for data exchange to EMRs, DHIS, etc. • Continuous improvement based on increasing country
need – Anyone can build their own monitoring systems by using
data available through the API • No names in the system, only patient numbers • Open system, no licensing fees • Cost-effective, not dependent on high maintenance
fees dependent on an external party • Revolutionary, changes as needs evolve
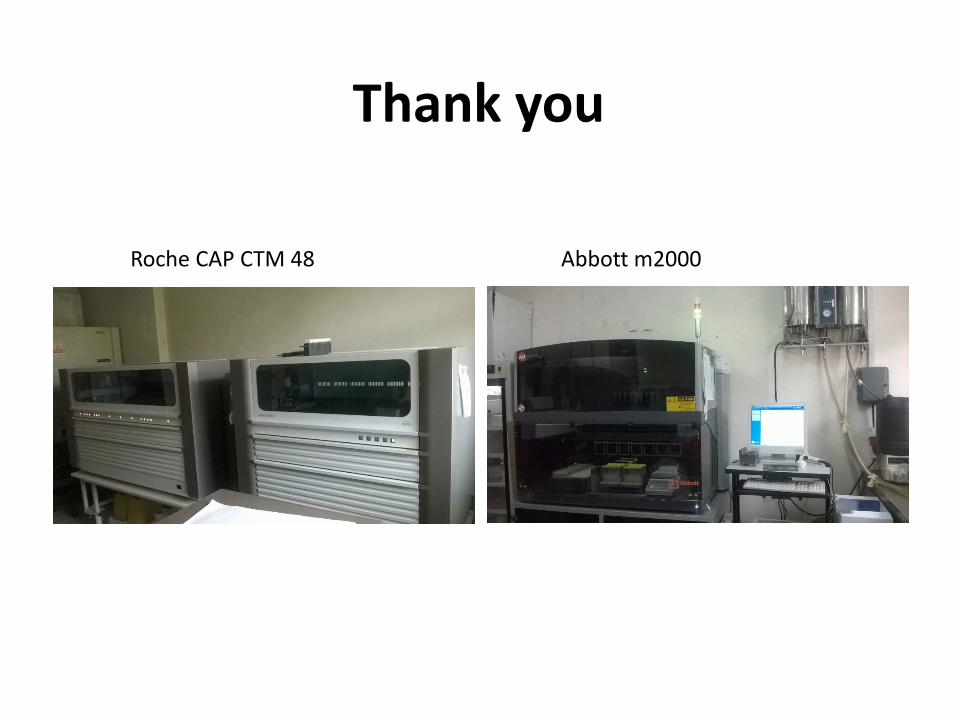
Thank you
Roche CAP CTM 48 Abbott m2000