kenya teachers’ saccos association … · 3.2 independent electricity production in kenya ......
TRANSCRIPT

KENYA TEACHERS’ SACCOS ASSOCIATION
COPRORATE STRATEGIC PLAN 2017-2021

TABLE OF CONTENTS
1 INTRODUCTION ...................................................................................................................... 3
2 PURPOSE OF THE STRATEGIC PLAN ...................................................................................... 3
3 CONTEXTUAL FRAMEWORK .................................................................................................. 6
3.1 REAL ESTATE VALUE CHAIN AND STAKEHOLDER MAPPING ..................................... 12
3.2 INDEPENDENT ELECTRICITY PRODUCTION IN KENYA ................................................ 15
4 ORGANIZATIONAL CAPACITY ASSESSMENT ..................................................................... 18
5 KEY BUSINESS DRIVERS & RESULT AREAS ............................................................................ 20
6 STRATEGIC PLAN DELIVERY ................................................................................................. 20
7 IMPLEMENTATION PLAN ...................................................................................................... 22
8 MONITORING, EVALUATION, RESEARCH, & LEARNING FRAMEWORK........................... 30
9 STRATEGY PLANNING TEAM ................................................................................................ 32

1 INTRODUCTION
The Kenya Teachers’ Sacco’s Association was registered in 2012 to provide a
collaborative forum for sharing and learning from one another, as well as addressing
operating challenges of the primary member SACCOs. KETSA also provides common
investment opportunities geared towards improving their general welfare. KETSA
membership currently comprises 12 Teachers’ Saccos in Kenya, with the possibility of
growing outreach to more SACCOS. The current membership includes the following;
1. New Fortis Sacco Society Ltd
2. Mentor Sacco Society Ltd
3. Tower Sacco Society Ltd
4. Solution Sacco Society Ltd
5. WinasSacco Society Ltd
6. TransnationalSacco Society Ltd
7. CosmopolitanSacco Society Ltd
8. OllinSacco Society Ltd
9. IdealSacco Society Ltd
10. Kitui Teachers Sacco Society Ltd
11. XXX
The board of directors is drawn from all the 12 founding Saccos with the respective CEOs
of each Sacco playing the role of the technical team.
2 PURPOSE OF THE STRATEGIC PLAN
To date, KETSA does not have a dedicated secretariat and activities have centered
around advocating for favorable legislative and operating framework, knowledge
sharing and learning, and mobilizing monthly share capital contribution. KETSA has seen
if fit to harness and consolidate the gains made so far by structuring its operations with a
clear Vision and Mission.
At a 2 day, strategic planning workshop, board members, delegates and the technical
team comprising Sacco Chief ExecutiveOfficers, KETSA brainstormed on the future look
of the association, defined its Vision, Mission, Values and Key Business Drivers using a
participatory approach to co learning and creation which entails bringing on board the
diverse views and dreams of the board members and secretariat, while tapping into the
Consultant’s experience.

Vision Statement
‘To be the leading Association in Kenya championing Sacco growth’
Mission statement
‘To innovatively promote unity and social economic growth to Sacco fraternity through
advocacy, resource mobilization and investments, for maximum shareholders’ returns.’
Motto
‘Unity our strength’
Key Business Drivers
Members discussed at length the business activities that they wish to engage in in the
coming years as below. The preferred activities were then ranked in order of priority to
determine what they would focus on, by each member voting for their preferred and
priority business driver
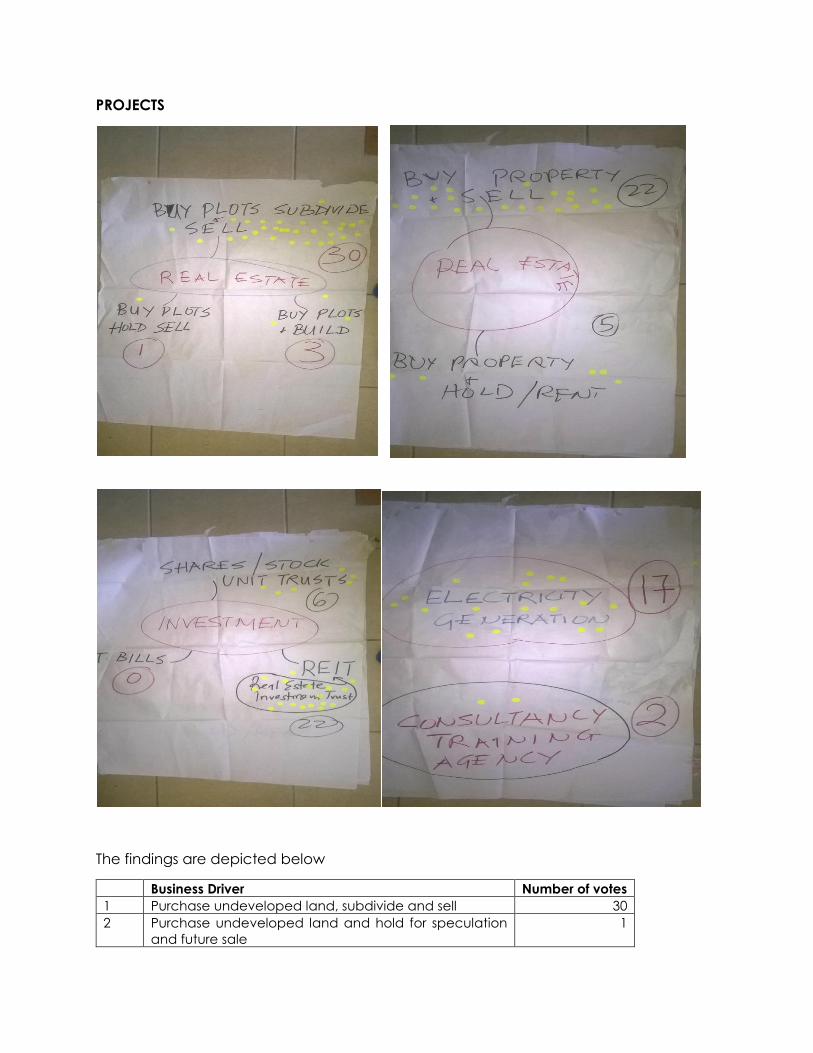
PROJECTS
The findings are depicted below
Business Driver Number of votes
1 Purchase undeveloped land, subdivide and sell 30
2 Purchase undeveloped land and hold for speculation
and future sale
1

3 Purchase undeveloped land and develop for sale 3
4 Purchase developed property and sell 22
5 Purchase developed property and manage for lease 5
5 Establish Consultancy, training, and Agent Banking unit 2
6 Generate electricity and sell to the grid 17
7 Investment inShares, Stocks, Unit Trusts 6
8 Investments in REITS 22
9 Investment in Government instruments 0
The members agreed to invest in the following projects in order of priority, # 1 given the
highest priority.
1. Purchase undeveloped land, subdivide and sell
2. Purchase developed property and sell
3. Generate electricity and sell to the grid
For investment of surpluses, idle, or funds held on behalf of members, KETSA will;
1. Investments in REITS (Real Estate Investment Trusts)
2. Investment in stocks and shares at the NSE
3 CONTEXTUAL FRAMEWORK
The State of Real Estate in Kenya
The current real estate and housing situation in Kenya can be traced back to the colonial
years. Until about 1939, the colonial government did not consider black Africans to be
permanent residents of the urban areas, nor did they encourage families to move to
urban areas. Employers and state agencies provided bed spaces for workers coming to
town. Local laws prohibited Africans from residing in European or white areas. They were
forced to live in “Native Locations”. After 1940, the permanent presence of Africans in
town was accepted, due to the workforce needed for the country’s growth.
Municipalities got the responsibility of providing housing for families and single men.
Several thousand units were built but very few were for families. Women and children had
no choice but to stay in the “bachelor” accommodation, which was basically single
rooms. That set the precedent for poor housing. Informal settlements started to be built.
The first housing response from the government after independence was to encourage
the private sector to build houses and to assist the public sector to expand their programs
through the National Housing Corporation (NHC). The first national housing policy was
formulated in 1966 in the Sessional Paper No. 5, which called on local authorities,
government departments and public corporations to implement their own programs to
supply rental housing. This was a time of centralized government initiatives and, during
the three decades from the 1950s through the 1970s, local authorities built several
subsidized rental housing units. After independence, local authorities were given the

power to implement the Graduated Personal Tax to secure their financial base, which
allowed them to pursue their housing initiatives. However, the tax was abolished in 1973
and never replaced, leaving local authorities with the responsibility of housing without
financial resources.
In the mid-1970s with funding from the International Monetary Fund (IMF) large-scale site
and service projects were implemented. These projects were low-cost housing for the
urban poor and provided full development, including servicing the lots; building the
roads and necessary infrastructure, housing units, sanitary facilities, community facilities;
providing loans for materials and technical assistance.
The actual number of houses constructed by both the private and public sectors was
disappointing compared to the increased need due to urbanization. Moreover, these
housing initiatives were too often not affordable for low-income earners, which meant
that informal settlements continued to grow. In the mid-1980s local authorities stopped
investing in rental housing.
The government’s administration began to be questioned in the late 1980s and early
1990s about human rights, economic performance and corruption. Both the population
and external funders asked for political reform, including the introduction of multi-party
democracy. Throughout the 1990s poverty grew, life expectancy declined, school
enrolment dropped, health services decreased and Kenya showed one of the highest
disparities between rich and poor.
During this period, several approaches were adopted by the government to respond to
the growing housing challenges. These initiatives involved partnerships with local
authorities, Community Based Organizations (CBO) and Non-Governmental
Organizations (NGO). Some initiatives were more successful than others and reached
poorer people. But lack of finances and political interference contributed to the failure
of many. The adoption in 2004 of the new National Housing Policy and KENSUP – the
Kenya Slum Upgrading Program brought hope, as the government made a commitment
to improve living conditions by 2020.
Housing co-operatives were introduced to Kenya in early 1980s. The National
Cooperative Housing Union (NACHU) was established by the Central Organization of
Trade Unions (COTU) which wanted to facilitate better housing for its members. NACHU
was limited in its activities. A restriction from the Commissioner of Cooperatives prevented
NACHU from generating income through general housing development services in
addition to its original mandate of housing co-operative development services. As with
the other cooperative sectors, NACHU’s activities were much under the control of the
government.
From the start, NACHU developed successful partnerships with external housing co-op
movements which aided in capacity building, housing development and community
delivery programs, and organizational support. This partnership is still strong today. The
co-op housing movement has grown in numbers due to the work of NACHU and its
partners.

Description
Key characteristics of the Kenyan Primary Housing Co-operatives (PHC) are:
a) Mostly urban; rural housing co-ops are linked to the agriculture marketing co-
operative sector;
b) The typical size of urban PHCs is 25-50 members;
c) Land is transferred for individual ownership upon full repayment of the loan;
d) Any member cannot hold more than one-fifth of the share capital as required by
the Act;
e) Development done incrementally i.e. land is acquired, services are installed and
houses are built room by room according the money saved and the financial
assistance (loans) available;
f) Development can also be done incrementally for larger buildings;
g) Members often build more rooms and sublet them to generate income;
h) Each member is responsible for taking care of his or her housing unit. NACHU is
considering ways to manage common services such as bore holes / water supply
and shared septic systems. Co-ops also play a role in managing savings collection
and loan repayment;
Some very large rural housing co-ops are saving, with NACHU’s help, for building
investment properties, typically a mix of residential and commercial properties in towns
or cities.
Key players in financing
Co-operatives interested in providing real estate opportunities to members are financed
by members’ savings and housing microfinance (HMF) loans from NACHU. Housing co-
ops have also access to loans from the Savings and Credit Co-operative Society
(SACCOs) they are associated with.
NACHU works with the Co-operative Bank of Kenya (Co-op Bank) on an external
guarantees model and leverages loans for Housing cooperatives on borrower deposits
Co-op Bank (20% of loan amount) is also lending funds for middle-income housing
development done by NACHU, development done as an income generating activity.
NACHU housing microfinance products include loans for new construction, housing
upgrading and expansion, land purchase and resettlement and, group loans for
commercial purpose and infrastructure. Several mechanisms and processes have been
put in place to protect the financial investment administered by NACHU. This includes
financial training provided to the participants in the savings scheme. NACHU savings and
loans scheme is proving to be quite successful to date – the portfolio at risk is within
industry standards. Based on this success, NACHU is attracting the interest of donors and
investors, which will assist NACHU to continue offering housing loans.

NACHU’s lending facility is financed from numerous sources including NACHU’s own
equity and member savings. Rooftops Canada has provided a guarantee and direct
lending facility totaling USD $500,000. Most recently, Homeless International, a UK
organization, has provided substantial funding for several projects through the
Community Led Infrastructure Finance Facility (CLIFF).
Legal framework
The legal instruments for the co-operative housing sector in Kenya are:
a) Cooperative Societies Act (Amended), 2004: guides the formation and operations
of housing co-operatives;
b) Rules and regulations issued: complement the Act;
c) Co-operative By-laws from NACHU: provides standard by-laws to new PHCs which
are readily accepted by the Department responsible for cooperatives;
d) Cooperative Tribunal: arbitrates disputes when the internal co-operative process
fails;
e) Code of Conduct and Ethics for Cooperative Societies: overseen and supervised
for compliance by the Ethics Commission for Cooperative Societies;
f) Land Bill 2012 – Land Registration Bill 2012 – Natural Land Commission Bill 2012;
g) Housing Act: provides for the effective coordination, facilitation, capacity building
and monitoring of the housing and human settlement sector. The Act also
establishes the Kenya Housing Authority and the National Social Housing and
Infrastructure Fund for the provision of housing and related purposes;
h) Local Government Act: deals with housing approvals in the relevant local
authorities;
i) Public Health Act: deals with the issues of sanitation and house occupation;
j) Physical Planning Act enacted in 1996, replaced the Town Planning Act (urban
areas) and the Land Planning Act (rural areas): provides for physical planning and
development control for both urban and rural areas;
k) Draft Eviction and Resettlement Guidelines, 2010
l) The National Construction Authority Act 2014- 0.5% of total cost of building for
properties with construction cost of over Ksh 5 million
m) Finance Act 2014- regarding 5% Capital Gains tax on sale of land, property etc.
n) National Environmental Management Authority NEMA
o) Capital Markets Authority under the Capital Markets Real Estate Investment Trusts,
Collective Investment Schemes Regulations 2013
Challenges
Kenya has faced major challenges in the housing sector but at the same time provided
opportunities for the same. The annual demand for housing is 200,000 urban units and
300,000 rural units. It is expected that the number of units needed over the next 10 years
will be 2.9 million, due to population growth and urbanization. By 2050, 50% of the
population will live in cities. The current annual production is 50,000 units.

Per the Ministry of Housing, 80% of the new houses built are for high-and middle-income
people, whereas 83% of the demand is coming from low-income families. 89% of the
urban population cannot afford a mortgage. In 2010, 50% of the urban households had
monthly incomes below $375. Very few rural people would be able to afford a mortgage.
However, there are challenges that come with real estate investment in Kenya. These
include
a) Expansive growth of slums and informal settlements
b) Distorted access to land, high cost of finance
c) Existence of rigid building laws and regulations
d) Deterioration of housing stock due to lack of a maintenance framework due to
the poor maintenance culture and both the public and residential buildings are
the most affected. To curb this, the ministry has finalized the maintenance policy
whereby all buildings are to be inspected in every 5 years.
e) Lack of affordable finance due to high interest rates and lending conditions that
do not respond to the needs of the population
f) The increasing cost of building materials;
g) The lack of affordable land
Opportunities
Access to both prime and virgin land for housing have provided a perfect opportunity
for investors in the sector. Some laws and regulations have undergone through a review
process to keep up with the best global practices and the ever-growing demand and
challenges.
Such laws include the Housing Policy 2004, Housing Act, and the Building Code. Also, the
current Housing Policy Sessional Paper #3 of 2004 has been reviewed. This helps in
reflecting on the government strategies of wholesomely addressing the challenges
faced by the housing sector.
Interested developers such as the World Bank, UN Habitat, SIDA, AFD and Shelter Afrique
have come on board to help settle the lack of adequate social infrastructure in the
housing sector. Their hard work bore fruits as there has been a rapid growth in the number
of schools, markets, roads, lighting programs, sewer lines and dwelling houses hence
changing the lives of many Kenyans.
Some financial factors have improved in the country, such as a stronger banking and
mortgage sector, and a well-developed microfinance sector.
The government has put in place some modest incentives relating to infrastructure
development, housing finance, and saving mobilization to assist in the production of the
new housing units.
The licensing of Real Estate Investment Trusts in 2015
Kenya has become the 4th African country to provide for trade in REITs after South Africa,
Ghana and Nigeria, with the Stanlib (Fahari-I) IPO (http://www.stanlib.com)in October

2015 and the planned Fusion Real Estate Development Trust planned for 2016
(http://fusioninvestafrica.com)
A REIT is a Real Estate Company which owns, develops, or manages different types of
properties. RElTs are investment instruments that source funds to build or acquire real
estate assets which they sell or rent to generate income. The income generated is
distributed to the shareholders at the end of a financial year. REITs are regulated by the
Capital Markets Authority (CMA) under the Capital Markets Real Investment T- Collective
Investment Schemes Regulations 2013.
RElTs are traded like stocks and investors can buy and sell shares. RElTs may choose to
focus on one main genre of real estate or may diversify to all types. One of the
advantages of Real Estate Investment Trusts is that they are exempted from double
taxation; REIT schemes are exempt from corporation tax and are also exempted from
income tax except for the payment of withholding tax on interest income and dividends.
How will REITS benefit the Real Estate Sector
The capital markets can help mobilize and allocate resources. REITS will enable
mobilizations of savings from individuals and groups. This means savings groups and co-
operatives will be able to invest in the market. Individuals can also get a stake in real
estate with investments of sums of as low as Ksh. 5,000 depending on the structure of the
REIT. REITS will provide a chance for developers to go the capital market to raise funds.
This may make financing developments competitive and thus reduce interest rates for
developments. It may also force banks to review their mortgage rates downwards. RElTs
will also allow Kenya’s capital markets to have a strong role in the further development
of the real estate sector. Specialized RElTs will be encouraged especially those involved
in the low and medium cost residential properties. This will allow for more development
of housing for this group which is under supplied.

3.1 REAL ESTATE VALUE CHAIN AND STAKEHOLDER MAPPING
Figure 1: Real Estate Value Chain Analysis
Questions
a. Who is a valuable stakeholder in the Value Chain?
b. Which resources do we need at each level? List them
c. What challenges are you experiencing in operations and project management at
each of these stages?
d. What are the possible solutions to your challenges?
The members deliberated on the Real Estate Value Chain and mapped critical
stakeholders, challenges in penetrating this market and possible solutions
Findings
OWNERSHIP
Stakeholder Resources Challenges Solutions
o Ministry of lands
o Advocates
o Lands board
o Family
o Community
o Finance
o Savings
o Loans
o Income
o Donations
o Brokers
o Fake
documentation
o High prices
o Bureaucracy
o Due diligence
o Involvement of
family
o Property
valuation by
•Builder/ owner
•Developers Ownership
•Self
•Investors
•Banks
•Mortgage Schemes
Finance
•Contracts
•Procurement/ Supply
•Construction Firms
•Who else?
Construction
•Brokers
•Construction Firms
•Who else?
Transaction
•Use case- residential/ commercial/ commercial resdiential
•Tenant / Long term/ Short terms
•Owners
Use

o Developer
o Merry go
round
o Human
resource
Research
o High taxation
o Access to
finance
o Succession
land issues
independent
bodies
o Use of collateral
for finance
access
o Compliance
FINANCE
Stakeholders Resources Challenges Solutions
o Individual member
Saccos
o Investors
o Sacco
savings
o Sacco loans
o Bank loans /
KUSSCO
o Investor
funding
o High loan
interest
Unsustainable
loans
o Lack of
member
commitment
o Lack of
collateral
o Enforce simple
but strict project
financing
policies
o Co ownership
and charge to
financier as
collateral
o Regular
member
information and
training
o Negotiated
financing –
KUSSCO, Saccos
CONSTRUCTION
Stakeholders Resources Challenges Solutions
o Government agencies
Professionals: planner,
civil engineer,
architect, water,
sewerage etc.
o Community
o Developer
o Contractors
o Manufacturers
o Suppliers
o Feasibility
studies for
every project
Finance
o Skilled labor
o Personnel
o Materials
o End to end
Project plan
o Equipment
o Delay in
approvals
Untrusted
engineers
o Over valuation
of BQs
o High
Management
fees
o Material
sourcing Site
Security
Timeliness
o Lack of
contingency
planning
o Weather
changes
o Fluctuating
prices
o Due diligence
and Open
tendering
procurement
process
o Tender
committee
Professionals
o Consultant
o Clerk of works
o Efficient
accurate
budgets
o Improve
capacity of the
board to
manage
projects
o Project
Insurance
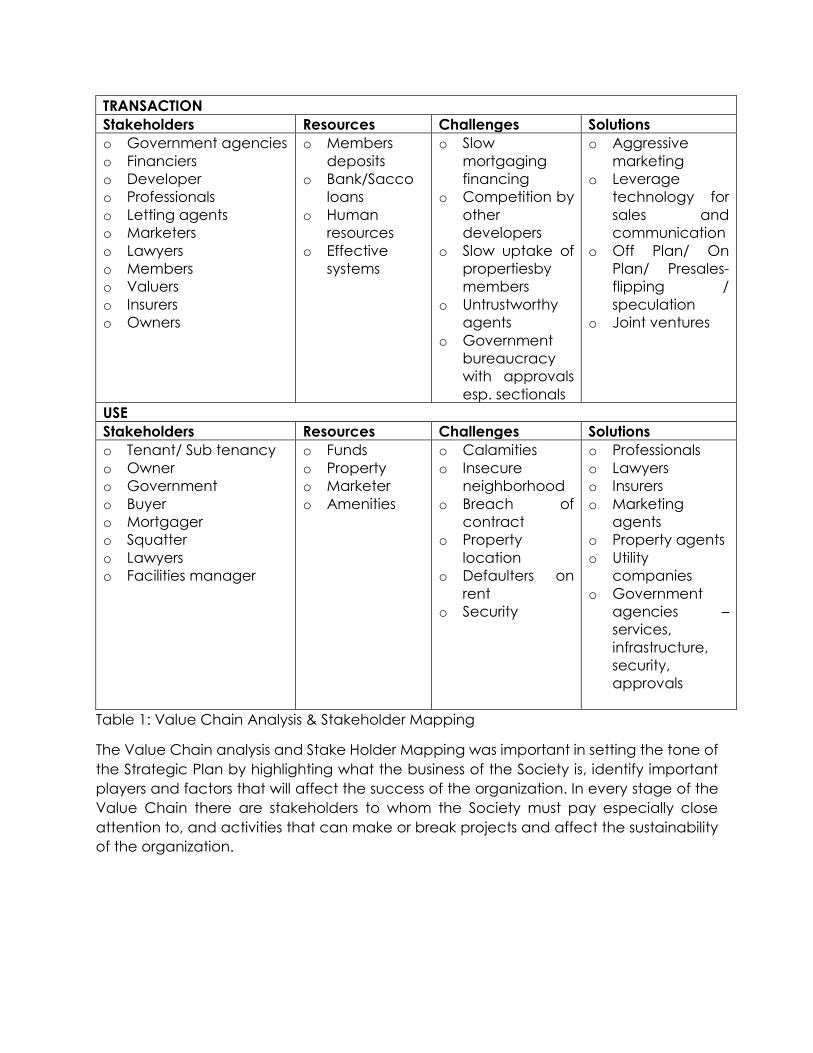
TRANSACTION
Stakeholders Resources Challenges Solutions
o Government agencies
o Financiers
o Developer
o Professionals
o Letting agents
o Marketers
o Lawyers
o Members
o Valuers
o Insurers
o Owners
o Members
deposits
o Bank/Sacco
loans
o Human
resources
o Effective
systems
o Slow
mortgaging
financing
o Competition by
other
developers
o Slow uptake of
propertiesby
members
o Untrustworthy
agents
o Government
bureaucracy
with approvals
esp. sectionals
o Aggressive
marketing
o Leverage
technology for
sales and
communication
o Off Plan/ On
Plan/ Presales-
flipping /
speculation
o Joint ventures
USE
Stakeholders Resources Challenges Solutions
o Tenant/ Sub tenancy
o Owner
o Government
o Buyer
o Mortgager
o Squatter
o Lawyers
o Facilities manager
o Funds
o Property
o Marketer
o Amenities
o Calamities
o Insecure
neighborhood
o Breach of
contract
o Property
location
o Defaulters on
rent
o Security
o Professionals
o Lawyers
o Insurers
o Marketing
agents
o Property agents
o Utility
companies
o Government
agencies –
services,
infrastructure,
security,
approvals
Table 1: Value Chain Analysis & Stakeholder Mapping
The Value Chain analysis and Stake Holder Mapping was important in setting the tone of
the Strategic Plan by highlighting what the business of the Society is, identify important
players and factors that will affect the success of the organization. In every stage of the
Value Chain there are stakeholders to whom the Society must pay especially close
attention to, and activities that can make or break projects and affect the sustainability
of the organization.
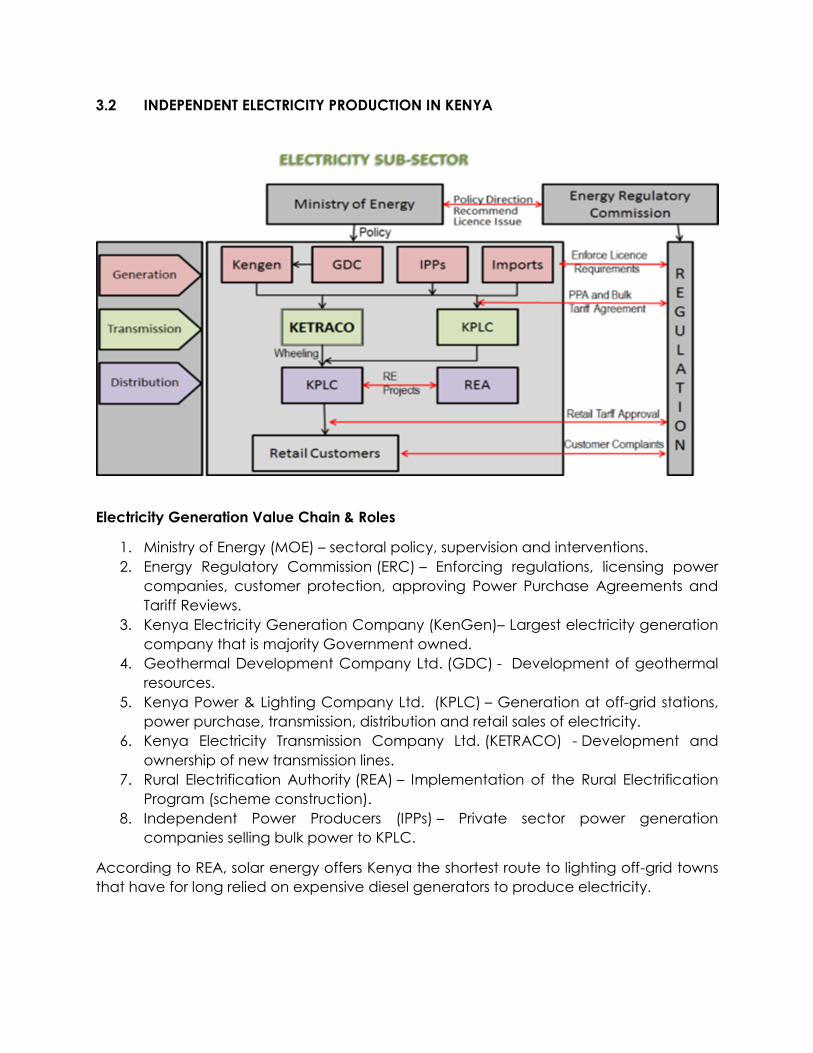
3.2 INDEPENDENT ELECTRICITY PRODUCTION IN KENYA
Electricity Generation Value Chain & Roles
1. Ministry of Energy (MOE) – sectoral policy, supervision and interventions.
2. Energy Regulatory Commission (ERC) – Enforcing regulations, licensing power
companies, customer protection, approving Power Purchase Agreements and
Tariff Reviews.
3. Kenya Electricity Generation Company (KenGen)– Largest electricity generation
company that is majority Government owned.
4. Geothermal Development Company Ltd. (GDC) - Development of geothermal
resources.
5. Kenya Power & Lighting Company Ltd. (KPLC) – Generation at off-grid stations,
power purchase, transmission, distribution and retail sales of electricity.
6. Kenya Electricity Transmission Company Ltd. (KETRACO) - Development and
ownership of new transmission lines.
7. Rural Electrification Authority (REA) – Implementation of the Rural Electrification
Program (scheme construction).
8. Independent Power Producers (IPPs) – Private sector power generation
companies selling bulk power to KPLC.
According to REA, solar energy offers Kenya the shortest route to lighting off-grid towns
that have for long relied on expensive diesel generators to produce electricity.

Kenya has more than 300 days of sunshine per year, double Germany’s — which is the
global leader in solar energy production with an installed capacity of more than 40,000
megawatts.
Kenya’s total power capacity stands at 2,333 megawatts, with solar power accounting
for less than one per cent. The country relies on a mix of hydropower priced at Sh3 per
unit, geothermal (Sh7) while thermal tops Sh20 per unit.
The government in 2013 set an ambitious plan to install additional 5,000 megawatts to
the grid by end of next year from renewable sources such as geothermal, solar, biomass,
and wind farms. Kenya targets to connect all homes to power by 2020. Kenya is banking
on such energy sources to halve the cost of electricity to Sh10 per kWh (¢10.45).
In addition to, Kenya Power also signed contracts to buy power from independent power
producers (IPPs). Independent Power Producers (IPPs) are private investors in the
electricity sector who seek to fill the growing gap between available and required power
under the 3 Feed-in -Tariff Policy. Current players comprise IberAfrica, Tsavo, Or-power,
Rabai, Imenti, and Mumias. Collectively, they account for about 25% of the country‟s
installed capacity from thermal, geothermal and bagasse, as follows: Iberafrica (108 MW
-thermal power plant), OrPower (48 MW -geothermal power plant), Tsavo (74 MW-
thermal power plant), Mumias 3 (26MW -Cogeneration), Imenti (900kW -Mini-Hydro), and
Rabai (90MW- Thermal power plant).
Strathmore University (20.82MW), Ol Ndanyat wind project (10MW), Kwale International
Sugar Company (10 MW) and 0.57MW from Mt Kenya, a community-based organization
are new players in the renewable energy sector, including the VP Group - a Naivasha-
based horticultural firm which became Kenya’s pioneer producer of biogas connected
to the national grid after it started selling 2MW to Kenya Power in March 2016.
Challenges
a) Investors experience financial loss and project delays when pursuing licensing to
be an IPP, PPAs, and the approval from local authorities, the off taker and energy
regulatory agencies
b) Unavailability of long term debt finance from commercial banks to finance the
high cost of renewable energy projects as well as the reluctance of industry to
inject corporate equity into RE projects.
c) Access to finance and ‘high interest rates’
d) Low investment in renewable energy options resulting from low generation tariffs
offered and policy uncertainty.
e) Demands for various forms of guarantees including sovereign guarantees and
letters of credit to cover capacity and energy payments and dedicated revenue
streams occasioning project delays.
f) Overreliance on external/ imported technology.
g) Acquisition of way leaves continues to be a major challenge in the
implementation of the projects and substantial delays have been experienced in
many of the projects.

h) Inadequate skilled financial capacity to develop project finance proposals and
business models
i) Scaling up renewable energy technologies in East Africa has been hampered by
acute shortage of suitable professionals trained in renewable energy.
Other challenges facing the power sector include; vandalism, lack of redundancy for
security of supplies, excessive delays in obtaining permissions to put infrastructure in the
jurisdiction of various local authorities and environmental issues Multiple state agencies
seek to make more revenue from transmission lines pushing up the cost of power. Such
include WARMA, Council charges.
Structure and duration of PPA negotiations
1. Lack of defined timelines when negotiating for PPA’s. KPLC does it in an undefined
time frame which sometimes is more than two years while ERC Does it in 90days.
The lengthy time pushes cost of power.
2. Solution: Restructuring of the PPAs’ negotiations to enhance predictability in the
process.
3. Quality of Training to Engineers: There is a mismatch between training provided to
young engineers and the requirements of the job market.
Opportunities
a) Technology partnerships and human capital development for local research,
development, production and installation of renewable energy generation
capacity.
b) Streamlined renewable energy policy and regulatory framework especially in
terms of tariff setting, PPA negotiation and licensing processes. All the negotiations
for PPA negotiations should be concluded within 120 days (4 months) from the
date of submitting the requisite documents.
c) Development of alternative financing mechanisms including the establishment of
a Clean Energy Fund to finance and /or guarantee development of RE resources
for power generation.
Issues for further discussion could include:
1. What are the constraints on funding an energy fund to serve as basis for providing
guarantees?
2. Should a levy be charged on the existing tariffs? While this may raise cost of
powering the short term, it will ensure sustainability and displacement of high cost
thermal and emergency generation in the long term
3. Implementation of favorable tariffs to attract investments in renewable energy
projects. A recent sector study recommended that a generation tariff of 10-12 us
cents based on technology should be sufficient to attract several projects except
for solar.

4. Development of a standardized guarantee and Letter of Credit (LC) process
through a clear understanding of the expectations of international banks and
DFI’s.
Questions include:
Why do financiers insist on sovereign guarantees?
Are there any alternatives?
When can a letter of Government support substitute for a sovereign guarantee?
What is the role of a MIGA type guarantee?
Does this relate to size of project, specific type of project?
Can the Partial Risk Guarantee suffice?
4 ORGANIZATIONAL CAPACITY ASSESSMENT
Strengths
Weaknesses
o Capital- internally generated capital from
our contributions
o Quality leadership
o Enlightened and knowledgeable
members
o United- KETSA has a common unity of
purpose
o Legally constituted- we are registered
o Dedication/ commitment to the
Association (patriotic members)
o KETSA has come from a region where
there is a rich co-operative movement
o Goodwill from Apex bodies and
government
o Poor communication
o Lack of adequate operating funds
o Inconsistent remittances
o Low membership 12 against all the
available Teacher Saccos in Kenya
o Lack of infrastructure; office
o Lack of road map/ blue print
o Weak capacity in envisioned projects’
management
o Lack of secretariat that will spearhead
establishment of operational structures
o Lack of investment plan
o Lack of policy guidelines
o Lack of committed technical team
o Lack of support by all board members in
the individual member Saccos
o Lack of national outlook
o Legal status of the Association not clear
o Lack of a succession plan
Opportunities
Threats
o Availability of funds for on lending and
ready market
o Potential members - Open membership to
all Teacher Saccos in Kenya
o Investment opportunities
o Partnership and collaborations
o Ability to influence policy on Sacco sector
o Limited funds by individual Sacco
members
o Political interference (internal and
external)
o Competition from external institutions
on investment matters

EXTERNAL ENVIRONMENT ASSESSMENT
POLITICAL ECONOMIC
Opportunities
o Increased interest in renewable energy
o Current government supports
powering all households
Opportunities
o Energy Bill 2014 providing for IPP
investors
o Renewable energy partnerships
o Availability of market leaders to
benchmark with
o Power needs embedded in Vision 2030
Threats
o Ever changing Land reforms
o Bureaucracy and corruption in
granting approvals
o Change of guard in 2017 may derail
existing power generation plans
Threats
o High cost of materials and production
o Inadequate local competence in
renewable energy generation
o Low tariffs offered by partners i.e. KPLC
reducing profitability and sustainability
o High prices of land for investment
purposes
o High taxes in land/ real estate
acquisition
SOCIAL TECHNOLOGY
o High Investment appetite for real
estate and money market
Opportunities
o Customized ERP software available
o Advancements in digital finance and
e- communication
Threats
o Lack of trust in alternative energy
provision by Kenyans
o Land fraud
o Slow resolution of land succession
issues leading to increased project
timelines
Threats
o High cost of technology
o High obsolescence of technology
LEGAL ENVIRONMENTAL
Opportunities
o Structured frameworks for
engagement
Opportunities
o Carbon points for investment in
renewable energy
o High interest and financing for
renewable energy projects
Threats
o Myriad legal frameworks to familiarize
and adhere to
o Unfavorable regulation especially in
Land acquisition
o Lack of binding SLAs with stakeholders
resulting in slow execution of PPAs,
project delays thereby increasing cost
of projects
Threats
o High costs for waste management
o Rigorous bureaucratic assessment by
environmental bodies

5 KEY BUSINESS DRIVERS & RESULT AREAS
1. Governance
a. Membership growth
b. Capacity strengthening and Learning
c. Partnerships
d. Compliance to legal framework
e. Research and Advocacy
2. Operations
a. Optimization of the Organization structure
b. Human Resource Management
c. Risk Management and Internal Control Frameworks
d. Operational Efficiency
3. Enterprise Development -Projects
a. Land purchase and sale
b. Developed property purchase and sale
c. Electricity Generation and sale
4. Finance
a. Share Capital growth
b. Deposits growth
c. Loan portfolio growth
d. Investment Mix and Income
6 STRATEGIC PLAN DELIVERY STRUCTURE
Board of Management Level
AGM
Supervisory Comm
Internal Audit
BOD
CEO
Sub Commitees

Management Structure
* Support staff in electricity plant includePlant Maintenance Technician, Electricity Utility System Operator, Distribution Specialist,
Environmental Engineer, Electric Line Technician, Environmental Compliance Coordinator, Heavy Equipment Operator, Solar Energy
Consultant, Energy Management Analyst, Energy Compliance Associate, Surveyors etc.
Chief Executive
Officer
Finance
& Planning
Accounts Assistant
Recoveries and
Reconciliation Officer
Customer Service
Manager
Support staff
Internal Audit
Audit Assistant
Commercial Director,
Marketing And PR
Credit Manager
Credit officer
Projects Manager/
Clerk of Works
Marketing Officers
Plant Manager-Electricity
Operations Manager
*Support staff
Maintenance Manager
*Support staff
ICT Manager

7 IMPLEMENTATION PLAN
KEY BUSINESS DRIVER: GOVERNANCE KEY RESULT AREA: MEMBERSHIP
OBJECTIVE 1:INCREASE MEMBERSHIP BY 10 SACCOS ANNUALLY TO 50 SACCOS BY 2021
STRATEGY ACTIVITIES KPI TIMELINE RESPONSIBLE
Recruit all teacher based Saccos into
membership
Identify and communicate with all
teacher based Saccos
Report February
2017 and
continuous
Communicate the KETSA widely Open an social media page Social media presence April 2017
Develop a KETSA website Interactive website
Communicate at co-operative days Reports
KEY RESULT AREA: CAPACITY STRENGHTHENING & LEARNING
OBJCETIVE 1: ENHANCE THE CAPACITY OF THE BOARD AND SECRETARIAT TO OVERSEE PROJECTS AND PERFORMANCE
Provide adequate exposure in business
lines to various committees, secretariat
and staff
Conduct an assessment to
understand learning needs and
objectives
Report February
2017
Identify potential learning partners February
2017
Benchmark to understand the various
business lines
April 2017
Conduct training Number of members
trained
May 2017
and
continuous
KEY RESULT AREA: RESEARCH & ADVOCACY
OBJECTIVE 1: PLAY A PIVOTAL ROLE IN CHAMPIONING THE GROWTH OF SACCOS
Consciously stay abreast of matters
affecting the Sacco sector
Establish a Research and Learning
function
Report Continuously
Partner with others in the sector Number of partnerships
Ensure representation at relevant
stakeholder forums
Number of forums
participated in
KEY RESULT AREA: PARTNERSHIPS
OBJECTIVE 1: ENSURE EFFICIENT DELIVERY OF OBJECTIVES
Partner with leaders in the various
business lines e.g. e-channels,
Identify key stakeholders and
manage relationships
Report Continuously

insurance, real estate, electricity
generation, advocacy. etc.
Establish networks with various relevant
sectors
Register with relevant member
association
Number of affiliations Continuously
KEY RESULT AREA: LEGAL COMPLIANCE
OBJECTIVE 1: ENSURE 100% COMPLIANCE WITH RELEVANT FRAMEWORK
Ensure legal compliance with all
relevant government and other
agencies requirements
Identify relevant legal framework Report January 2017
Procure/ avail required guidelines
and communicate to relevant
committees and staff
Number of legal
requirements
communicated
February
2017
Ensure 100% compliance with
requirements
Number of exceptions Continuously
KEY BUSINESS DRIVER: OPERATIONS KEY RESULT AREA: OPTIMIZATION OF THE ORGANIZATION STRUCTURE
OBJECTIVE 1: ENSURE 100% DELIVERY OF THE STRATEGIC PLAN
STRATEGY ACTIVITIES KPI TIMELINE RESPONSIBLE
Optimize organization structure Design optimal organizational
structure with clear delivery and
reporting lines
Org structure approved January 2017
Design role profiles and job
descriptions
February
2017
Recruit competent staff and onboard
Design a mentoring and coaching
program to ensure skills transfer
KEY RESULT AREA: HUMAN RESOURCE MANAGEMENT
OBJECTIVE 1: ENHANCE STAFF PRODUCTIVITY ANNUALLY
Schemes of work Conduct a comparator survey on
schemes of service and competency
frameworks in the industry
Report May 2017
Design and implement adequate
Schemes of Work
Report February
2017
Performance management Design and implement a
performance based personnel
management system complete with
reward/ remedial criteria
Report June 2017

Capacity enhancement Conduct training needs analysis TNA and Training Plan September
2017
Provide best practice adaptation
training
Number of staff trained January 2017
Leave management Develop and implement a
comprehensive leave management
schedule
Report February
2017
Ensure not more than 25% leave days
carried forward
Number of days carried
forward
December
2017
KEY RESULT AREA: RISK MANAGEMENT &INTERNAL CONTROLS
OBJECTIVE 1: ESTABLISH A COMPREHENSIVE RISK MANAGEMENT FRAMEWORK
STRATEGY ACTIVITIES KPI TIMELINE RESPONSIBLE
Standardize operations Assess the required operating
manuals
Report February
2017
Develop relevant manuals and
policies
Number of manuals and
policies developed
Communicate policy guideline and
operating manuals to BOD and staff
Number of BOD and
staff trained
March 2017
Ensure adequate security of KETSA
assets
Establish an internal audit structure Approved structure Mach 2017
Ensure data and information security Conduct daily data back up Number of exceptions
Ensure offsite data back up
Ensure comprehensive data access
rights and audit trail
KEY RESUT AREA: OPERATIONAL EFFICIENCY
OBJECTIVE 1: ENSURE 100% COMPLIANCE TO SERVICE CHARTER
STRATEGY ACTIVITIES KPI TIMELINE RESPONSIBLE
Establish and brand KETSA office Procure and set up KETSA office Office in place February
2017
Enhance processes efficiency Conduct Process Mapping exercise Report June 2017
Identify potential service bottlenecks
and resolve
Ensure adequate competence of
staff
Ensure proper placement of staff
Ensure automation of processes Identify areas that requireautomation February
2017

Conduct MIS Audit February
2017
Define software and hardware
requirements
Procure and install robust ERP system May 2017
Leverage technology Identify areas where mobile/ e
service can be of use and implement
Number of e service
channels
December
2017
Ensure adherence to the internal and
external Service Charter
Develop departmental/ project
based Service Level Agreements
Report June 2017
Monitor compliance to SLAs Exceptions report Continuously
KEY BUSINESS DRIVERS: ECO INCLUSIVE ENTERPRISE DEVELOPMENT KEY RESULT AREA: PROJECTS- LAND PURCHASE & SALE
OBJECTIVE 1: ACQUIRE & SELL 100 ACRES OF PRIME LAND ANNUALLY STRATEGY ACTIVITIES KPI TIMELINE RESPONSIBLE
Source for prime adequate clean land Select a Projects Finance &
Marketing Committee
Committee in place January 2017
Familiarize with Land Law and
requirements
Report on various land
legal requirements and
stakeholders
February
2017
Develop a stakeholder management
plan
Report
Develop a land procurement, pricing
policy, and sale policy
Policy in place
Conduct member survey on land
needs
Report April 2017
Develop land buying criteria and
policy
Policy May 2017
Identify land and conduct due
diligence
Report May 2017
and
continuously
Conduct Feasibility study into
profitability of the Venture
Viability report When land is
identified
Develop an end to end project plan Project Plan
Source for off take financing where
necessary
MOU/ Contracts

Subdivide and sell land Implement the Project plan and
monitor performance
Number of plots
sold/profitability
Per Project
Plan
Close and exit project plan Report
KEY RESULT AREA: PROJECTS- PROPERTY PURCHASE & SALE
OBJECTIVE 1: BUY & SELL ONE DEVELOPED PROPERTY ANNUALLY
Source for prime developed property Select a Projects Finance &
Marketing Committee
Committee in place January 2017
Ensure compliance with legal
framework
Familiarize with Property and Real
estate laws and requirements
Report on various land
legal requirements and
stakeholders
February
2017
Develop a stakeholder management
plan
Report
Conduct member survey on property
needs
Policy in place April 2017
Conduct Feasibility study into various
Venture options’ and profitability
Viability report
Develop a property procurement,
pricing policy, and sale policy
May 2017
Conduct market survey on pricing and
viable locations
Identify property and conduct due
diligence
Report May 2017
and
continuously
Source for off take financing where
necessary
Develop an end to end project plan Project Plan When land is
identified
Off Sell property Implement the Project plan and
monitor performance
Number of plots
sold/profitability
As per
Project Plan
Close and exit project plan Report
KEY RESULT AREA: PROJECTS- ELECTRICITY GENERATION & SALE TO NATIONAL GRID
OBJECTIVE 1: GENERATE ….MW OF ELECTRICITY ANNUALLY FROM 2018
Test viability of the project Select a Projects Finance and
Marketing Committee
Committee in place January 2017
Develop a Feasibility Plan complete
with type of power to be generated,
location, requirements, stakeholder
mapping, capital expenditure
requirements, cost projections, and
profitability measures.
Feasibility study report May 2017

Ensure adherence to legal framework Familiarize with legal and market
requirements for Electricity
Generation for Independent Power
Producers
Report on various legal
requirements and
stakeholders
February
2017 and
continuously
Enhance relationship management
practice
Develop a stakeholder management
plan
Report
February
2017
Enhance capacity of KETSA to
implement a successful project
Identify market leaders to benchmark
with
April 2017
Benchmark and record findings May 2017
Develop end to end Project Plan Project Plan June 2017
Obtain licensing and permits Number of licenses and
permits
June 2017
Enter Power Purchase agreements
(PPA) with buyer
Timely PPAs December
2017
Implement power generation project
plan
Report After PPAs
are in place
Monitor implementation for timelines,
adherence to budgets and
operating efficiency
Weekly performance
reports
Sell power to the national grid MW produced/ Cost
efficiency/ profitability
Enhance sustainability of the power
plat
Establish research, development and
learning function for designing and
constructing sustainable energy
production and delivery systems.
Learning and
improvement reports
Report
KEY BUSINESS DRIVER: FINANCE
KEY RESULT AREA: FINANCIAL INVESTMENTS
OBJECTIVE 1: ENSURE 100% RISK MANAGEMENT FRAMEWORK IN ASSET MIX
STRATEGY ACTIVITIES KPI TIMELINES RESPONSIBLE
Invest excess or idle funds in short term
viable vehicles
Select Investments Committee Committee in place Annual
Identify viable investment vehicles Report
Conduct trend research into viable
investment vehicles
Select investment vehicles by past,
current and projected performance

Enter favorable agreements
Monitor performance and take timely
corrective action
% non-earning assets
annually / % increase in
revenue / loss
Monthly
KEY RESULT AREA: LOAN PORTFOLIO GROWTH
OBJECTIVE 1: DISBURSE KSHS 40 MILLION IN CORPORATE LOANS BY 2017, 80M BY 2018, 120M BY 2019, 160M BY 2020, 180M BY 2021
Offer Bridging Loan products (at 5% per
month?) to Saccos to meet working
capital (WC) requirements
Select Credit Committee & Task
Force
Committee in place January 2017
Conduct member survey on short
term credit needs, tariffs, collaterals,
collection methods
Report February
2017
Develop product prototype
complete with application
requirements, terms, collateral,
appraisal and collection tools
Product prototype
ready for testing
Develop product stationery Stationery
Integrate in MIS system Report
Pilot product and refine Pilot report
Launch loan product Acceptance/
performance report
April 2017
Ensure NIL default rate Establish debt recovery and
reconciliation Team
% NPL/ PAR April 2017
Monitor loan performance on
monthly basis and generate
exception reports for the CEO
Number of payment
exceptions/ irregular
loans/ revenue
collection
Monthly
KEY RESULT AREA: SHARE CAPITAL GROWTH
OBJECTIVE 1: INCREASE SHARE CAPITAL TO KSHS 44M IN 2017, 56.4M BY 2018, 129.6M BY 2019, 172.8M BY 2020, & 216M BY 2021
Increase Share Capital contribution to
Ksh 300,000 per month
Develop Share Capital and Dividend
policy
Approved policy February
2017
Develop value proposition for
members
Report
Integrate Shares Capital into
member database
Number of outstanding
items
March 2017
Establish a Shares Collection system Report February
2017

Identify number of members who are
behind (currently)on their shares
contribution to date, communicate
and regularize
Report January
2017/
Monthly
Create awareness of the need for
Share Capital growth and value
proposition
Communicate to members Number of members
reached
February
2017
Monitor performance complete with
monthly exception reports
Report Monthly
KEY RESULT AREA: DEPOSITS PORTFOLIO GROWTH
OBJECTIVE 1: INCREASE DEPOSITS TO KSHS 14.4 MILLION IN 2017, 28.4M BY 2018, 43.2M BY 2019, 57.6M BY 2020, 72M BY 2021
Increase Deposits of Ksh 100,000 per
member per month
Develop Deposits and Interest policy Approved policy February
2017
Integrate Deposits into member
database
Report March 2017
Establish a Deposits Collection system February
2017
Develop value proposition and
communicate to members
April 2017
Ensure 100% monthly collections Monitor performance, complete with
exception reports and regularize
% monthly collection/
exceptions
February
2017/
Monthly

8 MONITORING, EVALUATION,RESEARCH, & LEARNING FRAMEWORK
Developing a Strategic is the easy fun part. Implementation, monitoring, evaluation,
research to facilitate for effective decision making, taking, sharing and learning from the
process is the hard part.
The MERL framework should guide the guiding the overall strategy and implementation
of related activities and provide timely and relevant information to the BOD. This entails
close communication with all involved, BOD, members, staff, Partners and service
providers.
The CEO will provide leadership and capacity building to the staff in the design and
implementation of monitoring, evaluation and reporting systems. He will develop
presentations and written reports based on evaluation findings and promote capacity
strengthening through mentoring, coaching, and training to staff and BOD to ensure they
have the technical skills and knowledge to provide increasingly professional and
technical support.
Responsibilities and tasks
Setting up the MERL system
a. Develop MERL matrix particularly in the areas of the objective hierarchy, indicators
and monitoring mechanisms.
b. Develop an overall framework for performance reviews based on the Strategic
Plan and Budget, participatory review of achievements, process monitoring,
operations monitoring and lessons-learned workshops.
c. Guide the process for designing the format of progress reports, identifying and
designing the key indicators for each component, to record and report physical
progress made against
d. Guide the process for identifying the key performance questions and parameters
for monitoring performance and comparing it to targets as well as design formats
for such performance reports.
e. Ensure that all service provider contracts include specifications for the internal
monitoring required of them, the reporting systems and the penalties for failure to
report as specified.
f. In consultation with the BOD develop a plan for activity-related capacity-building
for any computer-based support that may be required.
g. Organize and undertake training with stakeholders, including primary
stakeholders, in MERL skills, including participatory aspects.

h. Design the framework for the physical and process monitoring of project activities.
i. Guide staff and BOD in preparing progress reports. Together, analyze these reports
in terms of problems and actions needed. Prepare consolidated progress reports
for Society activities in accordance with approved reporting formats and timing.
j. Review monitoring reports; analyze them for impact on overall strategic plan to
identify the causes of potential bottlenecks and make recommendations
k. Collaborate with staff and implementing partners on qualitative monitoring to
provide relevant information for ongoing evaluation of project activities, effects
and impacts.
l. Plan for regular opportunities to identify lessons learned and the Plan’s most
significant change (MSC).
Figure 1: MERL Framework
We recommend monthly monitoring exercises at every BOD and staff meeting, and a
quarterly review. An annual review consolidates all gains made and takes a bird’s eye
view of the implementation process, and makes recommendation for overall change in
strategy, or enhancements based on the environmental scan, progress made in
achieving KPIs, regulations, and market factors.
Planning
Implementation-provide
resources/ MERL Training/ Develop
MERL tools
Monitor Progress using tools as
above
Communicate with staff and BOD, Identify bottlenecks ,
learning lessons
Evaluate: identify and resolve bottlencks,
Variances, Scan environment
Feedback into Planning

9 STRATEGY PLANNING TEAM
