kenya: debt sustainability analysis; imf country … · steps are also in train to address data...
TRANSCRIPT

KENYA FIRST REVIEW UNDER THE TWELVE-MONTH STAND-BY ARRANGEMENT AND THE ARRANGEMENT UNDER THE STANDBY CREDIT FACILITY, REQUEST FOR WAIVERS FOR NON-OBSERVANCE OF PERFORMANCE CRITERION, AND REQUEST FOR MODIFICATION OF PERFORMANCE CRITERIA—DEBT SUSTAINABILITY ANALYSIS UPDATE
This Debt Sustainability Analysis (DSA) update reflects revisions since the previous DSA update completed in January 2015 for the requests for the precautionary SBA-SCF arrangements, to reflect updated information on the fiscal deficit and debt path, the release of revised national accounts data, and prospective borrowings under a precautionary Fund arrangement. Kenya’s risk of external debt distress remains low, while overall public sector debt dynamics continue to be sustainable.1 However, the recent pace of public debt accumulation has been rapid; while this is financing infrastructure that should address bottlenecks and boost sustainable growth, containment of the fiscal deficit now and further medium-term consolidation efforts are also needed to limit and eventually reverse the rise in public debt. The authorities are taking steps to address capacity and coordination problems that led to the emergence in 2014–15 of temporary external payment arrears, since cleared. Steps are also in train to address data gaps in the financial accounts of the balance of payments and the international investment position, which is necessary to contain risks of an unmonitored buildup in nongovernment external debt.
1 The World Bank in 2013 upgraded its classification of Kenya to “strong” in terms of the quality of its policies and institutions as measured by a three-year average of the World Bank’s Country Policy and Institutional Assessment (CPIA) Index (average score in 2012–14: 3.84). This classification is unaffected by the slight decline in Kenya’s CPIA score from 3.9 in 2013 to 3.8 in 2014, which reflected a larger fiscal deficit. The relevant indicative thresholds for this category are: 50 percent for the NPV of debt-to-GDP ratio, 200 percent for the NPV of debt-to-exports ratio, 300 percent for the NPV of debt-to-revenue ratio, 25 percent for the debt service-to-exports ratio, and 22 percent for the debt service-to-revenue ratio. These thresholds are applicable to public and publicly guaranteed external debt.
Approved By Roger Nord and Chris Lane (IMF) and John Panzer (IDA)
Prepared by staffs of the International Monetary Fund and the International Development Association
September 1, 2015

KENYA
2 INTERNATIONAL MONETARY FUND
UNDERLYING ASSUMPTIONS 1. This DSA is based on macroeconomic assumptions that are consistent with the framework outlined in the accompanying staff report. Main changes compared with the January 2015 DSA update include (text table):
Further frontloading of public infrastructure spending. Projected spending on the Nairobi-Mombasa Standard Gauge Railway (SGR), is even more frontloaded than in the previous DSA, as the authorities target completion by June 2017. This results in a higher primary fiscal deficit in the near term, with the deficit being brought down in the medium to longer term consistent with the East African Community (EAC) Monetary Union convergence criteria.
Revised current account path. The current account deficit is significantly wider in 2014–16, reflecting a wider than projected current account deficit outturn in 2014, and additional frontloading of infrastructure-related imports in 2015 and 2016. The current account deficit is projected to narrow from 2017 with infrastructure-related imports tapering off.
EXTERNAL DEBT SUSTAINABILITY ANALYSIS 2. All indicators of public and publicly guaranteed external debt remain well below the policy-dependent debt burden thresholds under the baseline scenario, and no thresholds are breached under any of the standard stress tests. The main results of the external DSA are the following:
Under the baseline scenario, the debt burden remains sustainable over the 20-year projection period (Figure 1). As a result of the debut sovereign issuances and first disbursements of the railway-related loan package, the NPV of public and publicly guaranteed (PPG) external debt is estimated at 20 percent of GDP at end-2014. With additional project financing and moderate additional commercial financing, the NPV of PPG external debt is projected to peak at 22 percent of GDP in 2016–17 (well below the 50 percent indicative threshold). Nonresident holdings of domestic debt are reportedly low
2013 2014 2015 2016 Long term 1/
Real GDP GrowthCurrent DSA 5.7 5.3 6.5 6.8 6.8Previous DSA (January 2015) 5.7 5.3 6.9 7.2 6.8
Primary Fiscal Deficit (percent of GDP)Current DSA 3.0 4.8 5.4 4.3 0.7Previous DSA (January 2015) 3.0 4.5 5.1 3.8 0.7
Non-interest Current Account Deficit (percent of GDP)Current DSA 8.6 10.2 9.2 8.8 5.7Previous DSA (January 2015) 8.4 8.3 6.8 6.5 5.6
Source: IMF staff estimates.1/ For current DSA update, average 2021-34. For previous DSA update, average 2020-34.
Kenya: Selected Macroeconomic Assumptions

KENYA
INTERNATIONAL MONETARY FUND 3
(Annex I). The NPV of the debt-to-exports ratio would plateau at around 123 percent in the medium term, remaining well under an indicative threshold of 200 percent.
Standard stress tests do not reveal significant vulnerabilities as even the shocks with the highest impact would maintain debt levels below the relevant indicative thresholds (Table 2 and Figure 1). The shock that would have the largest near-term impact on external debt dynamics is a one-time 30 percent nominal depreciation of the exchange rate, increasing the PV of debt to GDP ratio from 22 percent in 2015 to 31 percent in 2016–17.
Temporary delays in external debt service payments emerged in 2014–15, reflecting a coordination failure rather than inability to pay. The external arrears reported between July 2014 and March 2015 cumulated to around US$64 million, but were individually small—signaling capacity constraints at the National Treasury’s Debt Management Office (DMO) and interagency coordination problems rather than an underlying inability to service external debt. All reported arrears have been cleared. The authorities are taking corrective measures to address the identified capacity and coordination problems.
3. As noted in previous DSAs, recent resource discoveries represent significant upside potential to Kenya’s external position. Kenya is currently a net oil importer, but significant oil resources were discovered in 2014. Oil and gas exploration activities are continuing, despite the large fall in oil prices over the past year. If recent discoveries are confirmed as commercially viable, Kenya’s medium- to long-term external position could improve by significantly more than currently projected.
4. The picture remains unclear for private sector debt. Available data from the Foreign Investment Survey (FIS) suggested nongovernment external debt of some 10 percent of GDP as at end-2011. Stock data for later years are not yet available, but the authorities are currently conducting a FIS covering 2012 and 2013, and plan to release the results in September 2015. As noted in the previous DSA update, addressing data gaps is essential to limit the risk of an unmonitored buildup of external vulnerabilities outside the government sector.
PUBLIC DEBT SUSTAINABILITY ANALYSIS 5. Public debt has been increasing rapidly owing to infrastructure-related borrowing, but under program policies is projected to taper off in 2015–16. Overall gross public debt1 reached 53 percent of GDP at end-2014, owing to the $2.75 billion in sovereign bond issuances2 in June and December, and initial disbursements of the SGR-related loan from China’s Eximbank. Taking into account
1 Including gross debt of the national government and the central bank. 2 The June 2014 issuance comprised two tranches: a five-year $500 million bond at a yield of 5.875 percent, and a 10-year $1.5 billion bond at 6.875 percent. In December 2014, Kenya added $250 million to the five-year tranche at a 5.0 percent yield and $500 million to the 10-year tranche at 5.9 percent.

KENYA
4 INTERNATIONAL MONETARY FUND
the frontloading of subsequent disbursements, overall public debt is projected to increase to 56 percent of GDP in 2015–16 (Table 3). In subsequent years, program policies envisage bringing the primary deficit back below 3 percent of GDP in 2017 and gradually further down thereafter, consistent with the EAC convergence criteria. Reflecting this medium-term fiscal consolidation and robust real GDP growth boosted by infrastructure spending and easing of bottlenecks, public debt would ease back below 50 percent of GDP after 2020. In PV terms, the public debt-to-GDP ratio would peak just below 50 percent in 2015–16 (Table 4), and fall thereafter. The PV of public debt-to-revenue ratio would gradually decline from around 240 percent in 2015 to around 200 percent in 2018–19.
6. The projected baseline path of public debt is sustainable in the Low-Income Country (LIC) DSA framework, but coverage issues also need to be taken into account.
As noted in the previous DSA update, the LIC DSA framework currently remains relevant for Kenya, since a majority of its external public debt remains concessional or semi-concessional. However, the 2014 sovereign bond issuances and the commercial component of the SGR have resulted in a significant rise in the share of commercial external debt.
The projected debt path remains below the EAC public debt convergence criterion (ceiling of 50 percent in PV terms), albeit with tighter margins than previously projected. Significant shocks could take the debt path above the 50 percent ceiling.
The projected debt path is also below the LIC DSA public debt benchmark for those countries whose CPIA score for quality of policies and institutions is assessed as strong (74 percent of GDP, also in PV terms) above which the risk of public debt distress is heightened. However, this public debt benchmark applies conceptually to the widest possible coverage of the public sector, and ideally should include the obligations of regional and local governments, and government-controlled enterprises (especially in cases where the government owns more than half of the voting shares).
The measured public debt path excludes legacy debts of the pre-devolution county governments, whose size is not yet fully clear. In addition, public debt should include planned annuities intended to finance road construction: although the annuity obligations may not necessarily be classified as debt under local law, they nevertheless represent public debt obligations for GFS purposes.
Excluding publicly guaranteed external debt, contingent liabilities are not conceptually part of the public debt but do represent a source of fiscal risk. The extent of contingent liabilities stemming from Public Private Partnerships (PPPs), mostly in the energy sector, is not yet fully assessed.
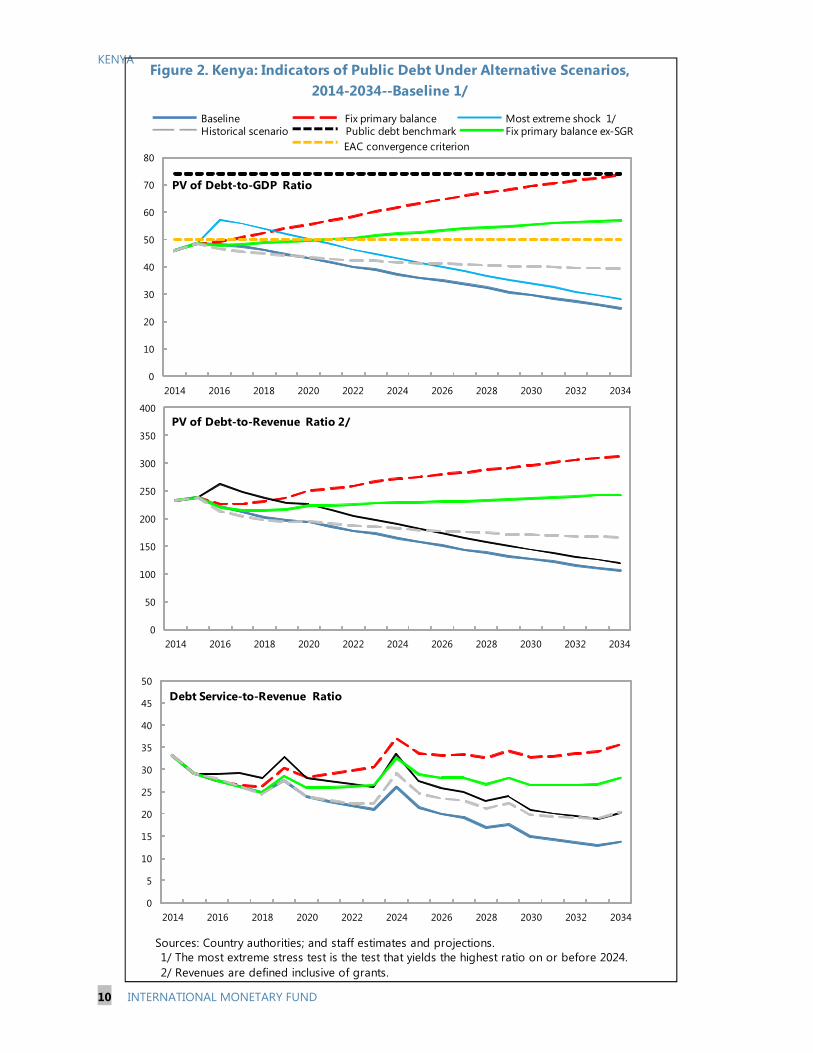
7. Excluding a fixed-primary-balance scenario that is distorted by temporary factors, the alternative scenarios and bound tests indicate that the projected paths for public debt indicators remain within the relevant thresholds (Table 4 and Figure 2). Under a standard scenario that keeps the primary balance unchanged from its 2015 level, the PV of public debt to GDP would remain on a steady

KENYA
INTERNATIONAL MONETARY FUND 5
upwards trajectory, remaining permanently above the EAC convergence criterion reference value and exceeding the 74 percent benchmark in the late 2020s. Since the 2015 primary deficit is boosted by temporary SGR-related spending, Figure 2 also includes a scenario fixing the primary balance excluding SGR-spending: public debt would remain on an increasing trend in this scenario, albeit more gradually, and remaining in PV terms under the 74 percent benchmark (subject to the coverage issues noted above).
MAIN FINDINGS AND CONCLUSIONS 8. This DSA update finds that Kenya remains at low risk of external debt distress. The recent emergence of temporary external payment arrears do not reflect an underlying inability to service debt and so do not change this conclusion, but do signal a need for prompt action to strengthen capacity at the Debt Management Office as well as interagency coordination. Standard stress tests suggest scenarios in which external debt would increase, but remain within sustainable bounds. Under such stress tests, a large exchange rate shock represents the largest upside risk to external debt. At the same time, Kenya has strong market foundations and long-standing sound macroeconomic policies—absence of price controls, flexible exchange rate and interest rates, limited budget subsidies—which give it scope to respond to shocks.
9. Overall public debt remains sustainable, though fiscal policy efforts are needed to ensure that the recent increases taper off. The baseline public debt path remains consistent with the EAC convergence criteria and below the relevant public debt benchmark, subject to coverage issues including outside the national government. Recent increases in public debt reflect increased borrowings to address infrastructure needs, and temporarily high primary deficits. Standard stress-testing scenarios show that if the primary deficit were to remain at current levels, public debt would remain on an upward path. These scenarios are more pessimistic than the authorities’ stated policy intentions—which are to reduce the primary balance in the medium term consistent with the convergence criteria for the EAC monetary union—but also highlight the need to follow through on the intended medium-term fiscal consolidation.
10. As noted in the previous DSA update, risks to debt dynamics are to the upside in the near to medium term. In the near term, the fiscal deficit and borrowing needs could widen further if execution rates on foreign-financed projects (for which debt has been contracted but not disbursed) rise faster than expected; if management of the devolution process falters and the new county borrowing framework lacks sufficient safeguards; and/or if risks materialize from contingent liabilities. In addition, the picture is particularly uncertain with regard to nongovernment external debt in view of long-standing data gaps that the authorities have begun to address; in the meantime, however, risks remain of an unmonitored buildup in external vulnerabilities.
11. In the medium to long term, however, natural resource discoveries represent positive potential. If confirmed as viable, resource discoveries could translate into exports that significantly improve Kenya’s external prospects, as well as an additional source of revenue. Prospects for viability could be tempered by the further declines in energy and commodity prices since mid-2015, especially if these are sustained.
12. The authorities agree with the conclusions of the DSA update. They concur that Kenya is at low risk of external debt distress. On this basis, they are requesting that the SBA-SCF arrangements discontinue the ceiling on nonconcessional external debt, in line with the Fund’s new debt limits policy.

Table 1. Kenya: External Debt Sustainability Framework, Baseline Scenario, 2012-2034 1/(In percent of GDP, unless otherwise indicated)
Actual Historical 6/ Standard 6/ ProjectionsAverage Deviation 2015-2020 2021-2034
2012 2013 2014 2015 2016 2017 2018 2019 2020 Average 2024 2034 Average
External debt (nominal) 1/ 31.6 32.5 42.0 48.8 49.4 49.5 49.5 49.1 49.2 47.1 45.3of which: public and publicly guaranteed (PPG) 19.3 19.5 26.4 29.8 29.9 29.8 29.5 28.9 28.7 25.7 21.4
Change in external debt 4.5 0.9 9.5 6.8 0.6 0.2 -0.1 -0.4 0.1 -1.1 0.0Identified net debt-creating flows 3.3 5.3 7.1 4.5 3.5 0.9 0.7 0.6 0.7 1.3 1.7
Non-interest current account deficit 8.2 8.6 10.2 4.6 3.3 9.2 8.8 6.5 6.0 5.9 5.9 6.0 5.3 5.7Deficit in balance of goods and services 13.7 14.0 15.5 15.1 14.9 12.6 12.2 12.0 11.9 11.5 9.8
Exports 21.9 19.6 18.2 18.4 17.9 17.7 17.5 17.3 17.0 16.5 16.1Imports 35.5 33.6 33.7 33.4 32.8 30.3 29.7 29.3 28.9 28.0 25.9
Net current transfers (negative = inflow) -5.6 -5.7 -6.2 -6.1 0.5 -6.6 -6.6 -6.4 -6.3 -6.1 -6.0 -5.6 -4.7 -5.3of which: official -0.4 -0.4 -0.5 -0.4 -0.3 -0.3 -0.3 -0.3 -0.3 -0.3 -0.2
Other current account flows (negative = net inflow) 0.1 0.3 0.9 0.7 0.5 0.3 0.1 0.0 0.0 0.1 0.2Net FDI (negative = inflow) -0.5 -0.9 -1.8 -0.7 0.7 -2.6 -3.1 -3.4 -3.1 -3.1 -3.0 -2.5 -1.4 -2.1Endogenous debt dynamics 2/ -4.3 -2.3 -1.3 -2.0 -2.2 -2.2 -2.2 -2.2 -2.2 -2.2 -2.2
Contribution from nominal interest rate 0.3 0.3 0.2 0.6 0.9 0.9 0.9 0.9 0.9 0.8 0.6Contribution from real GDP growth -1.0 -1.6 -1.6 -2.6 -3.1 -3.1 -3.1 -3.1 -3.1 -3.0 -2.8Contribution from price and exchange rate changes -3.5 -1.0 … … … … … … … … …
Residual (3-4) 3/ 1.1 -4.4 2.4 2.3 -3.0 -0.8 -0.7 -0.9 -0.6 -2.4 -1.7of which: exceptional financing 0.0 0.0 0.0 0.0 0.0 0.0 0.0 0.0 0.0 0.1 0.0
PV of external debt 4/ ... 34.9 35.2 41.1 41.5 41.5 41.5 41.4 41.3 39.6 38.3In percent of exports ... 178.0 192.9 224.1 232.1 234.5 236.9 239.0 242.7 240.4 238.4
PV of PPG external debt ... 22.0 19.6 22.1 22.1 21.8 21.5 21.2 20.8 18.2 14.4In percent of exports ... 111.9 107.7 120.4 123.4 123.2 122.9 122.3 122.5 110.3 89.5In percent of government revenues ... 114.0 102.2 110.9 103.6 99.1 96.3 94.8 95.2 81.3 62.1
Debt service-to-exports ratio (in percent) 14.1 17.9 27.8 29.9 31.9 32.7 33.3 39.0 36.2 41.4 38.1PPG debt service-to-exports ratio (in percent) 3.7 4.0 9.0 6.5 8.0 8.7 8.9 14.0 9.8 17.1 10.5PPG debt service-to-revenue ratio (in percent) 4.3 4.0 8.6 6.0 6.7 7.0 6.9 10.9 7.6 12.6 7.3Total gross financing need (Billions of U.S. dollars) 7.0 8.7 11.2 11.6 12.7 12.2 13.5 15.8 17.0 27.4 72.5Non-interest current account deficit that stabilizes debt ratio 3.7 7.7 0.7 2.3 8.3 6.4 6.1 6.3 5.8 7.1 5.3
Key macroeconomic assumptions
Real GDP growth (in percent) 4.6 5.7 5.3 5.2 2.2 6.5 6.8 7.0 7.0 7.0 6.9 6.9 6.8 6.8 6.8GDP deflator in US dollar terms (change in percent) 14.9 3.1 5.3 7.6 7.0 -2.5 1.9 4.2 3.8 3.4 3.2 2.3 3.0 2.9 3.0Effective interest rate (percent) 5/ 1.1 1.0 0.8 1.3 0.5 1.5 1.9 2.0 2.0 2.0 2.0 1.9 1.8 1.4 1.6Growth of exports of G&S (US dollar terms, in percent) 11.3 -2.3 3.1 10.5 11.2 4.6 6.1 10.3 9.8 9.3 8.5 8.1 9.3 9.9 9.6Growth of imports of G&S (US dollar terms, in percent) 9.6 2.9 11.4 15.1 11.6 3.0 6.7 3.2 8.8 9.1 8.7 6.6 9.2 9.1 9.2Grant element of new public sector borrowing (in percent) ... ... ... ... ... 29.8 29.9 31.2 26.9 16.6 28.8 27.2 13.6 25.2 25.8Government revenues (excluding grants, in percent of GDP) 18.7 19.3 19.2 19.9 21.3 22.0 22.3 22.3 21.9 22.4 23.2 22.8Aid flows (in Billions of US dollars) 7/ 0.2 0.3 0.3 2.3 1.8 2.0 1.7 1.5 2.2 1.9 7.4
of which: Grants 0.2 0.3 0.3 0.3 0.3 0.3 0.3 0.3 0.3 0.5 1.2of which: Concessional loans 0.0 0.0 0.0 2.0 1.5 1.7 1.4 1.2 1.9 1.4 6.2
Grant-equivalent financing (in percent of GDP) 8/ ... ... ... 1.9 1.5 1.6 1.3 1.0 1.3 0.7 1.0 1.0Grant-equivalent financing (in percent of external financing) 8/ ... ... ... 35.8 36.8 37.9 34.3 23.4 34.8 21.5 32.5 33.4
Memorandum items:Nominal GDP (Billions of US dollars) 50.4 54.9 60.9 63.3 68.9 76.8 85.3 94.3 104.0 152.7 395.6Nominal dollar GDP growth 20.2 9.0 10.9 3.9 8.8 11.5 11.1 10.6 10.3 9.4 10.0 10.0 10.0PV of PPG external debt (in Billions of US dollars) 12.0 11.6 13.6 15.2 16.7 18.3 19.9 21.6 27.7 56.8(PVt-PVt-1)/GDPt-1 (in percent) -0.8 3.3 2.4 2.2 2.1 1.9 1.8 2.3 0.9 1.2 1.3Gross workers' remittances (Billions of US dollars) 1.2 1.3 1.4 1.6 1.8 2.0 2.1 2.3 2.5 3.5 7.8PV of PPG external debt (in percent of GDP + remittances) ... 21.4 19.2 21.6 21.5 21.3 21.0 20.6 20.3 17.8 14.1PV of PPG external debt (in percent of exports + remittances) ... 99.8 95.3 106.0 107.9 107.6 107.5 107.0 107.2 96.9 79.7Debt service of PPG external debt (in percent of exports + remittance ... 3.5 8.0 5.7 7.0 7.6 7.8 12.3 8.5 15.0 9.4
Sources: Country authorities; and staff estimates and projections. 01/ Includes both public and private sector external debt.2/ Derived as [r - g - ρ(1+g)]/(1+g+ρ+gρ) times previous period debt ratio, with r = nominal interest rate; g = real GDP growth rate, and ρ = growth rate of GDP deflator in U.S. dollar terms. 3/ Includes exceptional financing (i.e., changes in arrears and debt relief); changes in gross foreign assets; and valuation adjustments. For projections also includes contribution from price and exchange rate 4/ Assumes that PV of private sector debt is equivalent to its face value.5/ Current-year interest payments divided by previous period debt stock. 6/ Historical averages and standard deviations are generally derived over the past 10 years, subject to data availability. 7/ Defined as grants, concessional loans, and debt relief.8/ Grant-equivalent financing includes grants provided directly to the government and through new borrowing (difference between the face value and the PV of new debt).
KENYA
6IN
TERNATIO
NAL
MO
NETARY
FUN
D
KENYA

KENYA
INTERNATIONAL MONETARY FUND 7
Sources: Country authorities; and staff estimates and projections.
Figure 1. Kenya: Indicators of Public and Publicly Guaranteed External Debt under Alternative Scenarios, 2014-2034--Baseline 1/
1/ The most extreme stress test is the test that yields the highest ratio on or before 2024. In figure b. it corresponds to a One-time depreciation shock; in c. to a Combination shock; in d. to a One-time depreciation shock; in e. to a Exports shock and in figure f. to a One-time depreciation shock
Baseline Historical scenario Most extreme shock 1/ Threshold
0
5
10
15
20
25
2014 2019 2024 2029 2034
f .Debt service-to-revenue ratio
0
5
10
15
20
25
30
35
0.0
0.5
1.0
1.5
2.0
2.5
3.0
3.5
2015 2020 2025 2030
Rate of Debt AccumulationGrant-equivalent financing (% of GDP)Grant element of new borrowing (% right scale)
a. Debt Accumulation
0
50
100
150
200
250
2014 2019 2024 2029 2034
c.PV of debt-to-exports ratio
0
10
20
30
40
50
60
2014 2019 2024 2029 2034
b.PV of debt-to GDP ratio
0
50
100
150
200
250
300
350
2014 2019 2024 2029 2034
d.PV of debt-to-revenue ratio
0
5
10
15
20
25
30
2014 2019 2024 2029 2034
e.Debt service-to-exports ratio

KENYA
8 INTERNATIONAL MONETARY FUND
Table 2. Kenya: Sensitivity Analysis for Key Indicators of Public and Publicly Guaranteed
External Debt, Baseline Scenario 2015–34 (In percent)
Projections2015 2016 2017 2018 2019 2020 2024 2034
Baseline 22 22 22 22 21 21 18 14
A. Alternative Scenarios
A1. Key variables at their historical averages in 2015-2034 1/ 22 21 22 23 23 24 24 23A2. New public sector loans on less favorable terms in 2015-2034 2 22 23 24 24 25 25 25 24
B. Bound Tests
B1. Real GDP growth at historical average minus one standard deviation in 2016-2017 22 23 23 23 23 22 20 15B2. Export value growth at historical average minus one standard deviation in 2016-2017 3/ 22 23 23 22 22 21 19 14B3. US dollar GDP deflator at historical average minus one standard deviation in 2016-2017 22 22 23 23 22 22 19 15B4. Net non-debt creating flows at historical average minus one standard deviation in 2016-2017 4/ 22 25 28 27 26 26 22 15B5. Combination of B1-B4 using one-half standard deviation shocks 22 25 28 27 27 26 23 16B6. One-time 30 percent nominal depreciation relative to the baseline in 2016 5/ 22 31 31 30 30 29 26 20
Baseline 120 123 123 123 122 122 110 90
A. Alternative Scenarios
A1. Key variables at their historical averages in 2015-2034 1/ 120 115 122 129 135 142 146 145A2. New public sector loans on less favorable terms in 2015-2034 2 117 129 134 138 142 147 149 150
B. Bound Tests
B1. Real GDP growth at historical average minus one standard deviation in 2016-2017 117 123 123 123 122 122 110 89B2. Export value growth at historical average minus one standard deviation in 2016-2017 3/ 117 137 151 151 150 150 134 107B3. US dollar GDP deflator at historical average minus one standard deviation in 2016-2017 117 123 123 123 122 122 110 89B4. Net non-debt creating flows at historical average minus one standard deviation in 2016-2017 4/ 117 140 157 155 152 151 134 96B5. Combination of B1-B4 using one-half standard deviation shocks 117 140 163 161 159 158 140 101B6. One-time 30 percent nominal depreciation relative to the baseline in 2016 5/ 117 123 123 123 122 122 110 89
Baseline 111 104 99 96 95 95 81 62
A. Alternative Scenarios
A1. Key variables at their historical averages in 2015-2034 1/ 111 97 98 101 105 110 108 100A2. New public sector loans on less favorable terms in 2015-2034 2 108 108 108 108 110 114 110 104
B. Bound Tests
B1. Real GDP growth at historical average minus one standard deviation in 2016-2017 108 107 106 103 102 102 87 67B2. Export value growth at historical average minus one standard deviation in 2016-2017 3/ 108 107 103 100 98 98 84 62B3. US dollar GDP deflator at historical average minus one standard deviation in 2016-2017 108 105 104 101 99 100 85 65B4. Net non-debt creating flows at historical average minus one standard deviation in 2016-2017 4/ 108 117 126 121 118 118 99 66B5. Combination of B1-B4 using one-half standard deviation shocks 108 117 128 123 120 119 101 68B6. One-time 30 percent nominal depreciation relative to the baseline in 2016 5/ 108 146 140 136 134 134 115 88
PV of debt-to-exports ratio
PV of debt-to-revenue ratio
PV of debt-to GDP ratio

KENYA
INTERNATIONAL MONETARY FUND 9
Table 2. Kenya: Sensitivity Analysis for Key Indicators of Public and Publicly Guaranteed
External Debt, Baseline Scenario 2015–34 (concluded) (In percent)
Baseline 7 8 9 9 14 10 17 11
A. Alternative Scenarios
A1. Key variables at their historical averages in 2015-2034 1/ 7 8 8 8 13 9 15 11A2. New public sector loans on less favorable terms in 2015-2034 2 7 8 8 9 14 9 18 12
B. Bound Tests
B1. Real GDP growth at historical average minus one standard deviation in 2016-2017 7 8 9 9 14 10 17 11B2. Export value growth at historical average minus one standard deviation in 2016-2017 3/ 7 9 10 11 17 12 20 13B3. US dollar GDP deflator at historical average minus one standard deviation in 2016-2017 7 8 9 9 14 10 17 11B4. Net non-debt creating flows at historical average minus one standard deviation in 2016-2017 4/ 7 8 9 10 15 11 18 12B5. Combination of B1-B4 using one-half standard deviation shocks 7 8 10 11 16 11 19 12B6. One-time 30 percent nominal depreciation relative to the baseline in 2016 5/ 7 8 9 9 14 10 17 11
Baseline 6 7 7 7 11 8 13 7
A. Alternative Scenarios
A1. Key variables at their historical averages in 2015-2034 1/ 6 6 6 7 10 7 11 8A2. New public sector loans on less favorable terms in 2015-2034 2 6 6 7 7 11 7 13 8
B. Bound Tests
B1. Real GDP growth at historical average minus one standard deviation in 2016-2017 6 7 8 7 12 8 14 8B2. Export value growth at historical average minus one standard deviation in 2016-2017 3/ 6 7 7 7 11 8 13 7B3. US dollar GDP deflator at historical average minus one standard deviation in 2016-2017 6 7 7 7 11 8 13 8B4. Net non-debt creating flows at historical average minus one standard deviation in 2016-2017 4/ 6 7 7 8 12 8 13 8B5. Combination of B1-B4 using one-half standard deviation shocks 6 7 8 8 12 9 14 8B6. One-time 30 percent nominal depreciation relative to the baseline in 2016 5/ 6 9 10 10 15 11 18 10
Memorandum item:Grant element assumed on residual financing (i.e., financing required above baseline) 6/ 20 20 20 20 20 20 20 20
Sources: Country authorities; and staff estimates and projections.
1/ Variables include real GDP growth, growth of GDP deflator (in U.S. dollar terms), non-interest current account in percent of GDP, and non-debt creating flows. 2/ Assumes that the interest rate on new borrowing is 2 percentage points higher than in the baseline, while grace and maturity periods are the same as in the baselin3/ Exports values are assumed to remain permanently at the lower level, but the current account as a share of GDP is assumed to return to its baseline level after the shock (implicitly assuming an offsetting adjustment in import levels). 4/ Includes official and private transfers and FDI.5/ Depreciation is defined as percentage decline in dollar/local currency rate, such that it never exceeds 100 percent.6/ Applies to all stress scenarios except for A2 (less favorable financing) in which the terms on all new financing are as specified in footnote 2.
Debt service-to-revenue ratio
Debt service-to-exports ratio
KENYA
10 INTERNATIONAL MONETARY FUND
EAC convergence criterion
Sources: Country authorities; and staff estimates and projections.1/ The most extreme stress test is the test that yields the highest ratio on or before 2024. 2/ Revenues are defined inclusive of grants.
Figure 2. Kenya: Indicators of Public Debt Under Alternative Scenarios, 2014-2034--Baseline 1/
BaselinePublic debt benchmark
Most extreme shock 1/Historical scenario
Fix primary balanceFix primary balance ex-SGR
0
50
100
150
200
250
300
350
400
2014 2016 2018 2020 2022 2024 2026 2028 2030 2032 2034
PV of Debt-to-Revenue Ratio 2/
0
10
20
30
40
50
60
70
80
2014 2016 2018 2020 2022 2024 2026 2028 2030 2032 2034
PV of Debt-to-GDP Ratio
0
5
10
15
20
25
30
35
40
45
50
2014 2016 2018 2020 2022 2024 2026 2028 2030 2032 2034
Debt Service-to-Revenue Ratio

Table 3. Kenya: Public Sector Debt Sustainability Framework, Baseline Scenario, 2012-2034(In percent of GDP, unless otherwise indicated)
Actual Projections
2012 2013 2014 Average5/ Standard
Deviation
5/
2015 2016 2017 2018 2019 20202015-20 Average 2024 2034
2021-34 Average
Public sector debt 1/ 41.7 44.2 52.6 56.2 56.0 55.3 54.0 52.2 51.0 44.8 31.8of which: foreign-currency denominated 19.3 19.5 26.4 29.8 29.9 29.8 29.5 28.9 28.7 25.7 21.4
Change in public sector debt 1.5 2.5 8.4 3.6 -0.2 -0.7 -1.4 -1.8 -1.2 -1.8 -1.3Identified debt-creating flows -0.1 1.6 2.9 3.9 0.9 -0.9 -1.7 -1.7 -1.4 -1.7 -1.5
Primary deficit 2.3 3.0 4.8 1.6 1.7 5.4 4.3 2.7 1.8 1.6 1.7 2.9 1.0 0.4 0.7Revenue and grants 19.1 19.8 19.7 20.4 21.7 22.4 22.7 22.6 22.2 22.7 23.5
of which: grants 0.4 0.5 0.5 0.5 0.4 0.4 0.4 0.3 0.3 0.3 0.3Primary (noninterest) expenditure 21.4 22.8 24.5 25.8 26.0 25.1 24.5 24.3 23.9 23.7 23.9
Automatic debt dynamics -2.4 -1.4 -1.9 -1.6 -3.5 -3.6 -3.5 -3.3 -3.1 -2.7 -1.9Contribution from interest rate/growth differential -1.3 -0.8 -1.7 -2.3 -2.7 -3.0 -3.1 -3.0 -2.8 -2.3 -1.6
of which: contribution from average real interest rate 0.4 1.4 0.5 0.9 0.9 0.7 0.5 0.5 0.6 0.7 0.5of which: contribution from real GDP growth -1.8 -2.2 -2.2 -3.2 -3.6 -3.7 -3.6 -3.5 -3.4 -3.0 -2.1
Contribution from real exchange rate depreciation -1.0 -0.6 -0.2 0.7 -0.8 -0.6 -0.4 -0.3 -0.3 ... ...Other identified debt-creating flows 0.0 0.0 0.0 0.0 0.0 0.0 0.0 0.0 0.0 0.0 0.0
Privatization receipts (negative) 0.0 0.0 0.0 0.0 0.0 0.0 0.0 0.0 0.0 0.0 0.0Recognition of implicit or contingent liabilities 0.0 0.0 0.0 0.0 0.0 0.0 0.0 0.0 0.0 0.0 0.0Debt relief (HIPC and other) 0.0 0.0 0.0 0.0 0.0 0.0 0.0 0.0 0.0 0.0 0.0Other (specify, e.g. bank recapitalization) 0.0 0.0 0.0 0.0 0.0 0.0 0.0 0.0 0.0 0.0 0.0
Residual, including asset changes 1.6 0.8 5.5 -0.3 -1.1 0.3 0.3 -0.1 0.2 -0.1 0.3
Other Sustainability IndicatorsPV of public sector debt ... 46.6 45.8 48.5 48.1 47.3 46.0 44.4 43.1 37.3 24.8
of which: foreign-currency denominated ... 22.0 19.6 22.1 22.1 21.8 21.5 21.2 20.8 18.2 14.4of which: external ... 22.0 19.6 22.1 22.1 21.8 21.5 21.2 20.8 18.2 14.4
PV of contingent liabilities (not included in public sector debt) ... ... ... ... ... ... ... ... ... ... ...Gross financing need 2/ 13.3 14.8 17.9 18.3 17.3 15.4 14.2 14.4 13.1 12.1 6.6PV of public sector debt-to-revenue and grants ratio (in percent) … 236.0 232.3 237.8 221.6 211.0 202.4 196.2 194.0 164.4 105.6PV of public sector debt-to-revenue ratio (in percent) … 242.2 238.7 243.3 225.9 214.8 205.8 199.2 196.7 166.6 107.0
of which: external 3/ … 114.0 102.2 110.9 103.6 99.1 96.3 94.8 95.2 81.3 62.1Debt service-to-revenue and grants ratio (in percent) 4/ 27.7 28.7 33.1 29.0 27.5 26.2 24.7 27.5 23.8 26.0 13.6Debt service-to-revenue ratio (in percent) 4/ 28.4 29.4 34.0 29.7 28.1 26.6 25.2 27.9 24.1 26.4 13.8Primary deficit that stabilizes the debt-to-GDP ratio 0.7 0.6 -3.6 1.8 4.5 3.3 3.2 3.4 2.9 2.8 1.6
Key macroeconomic and fiscal assumptionsReal GDP growth (in percent) 4.6 5.7 5.3 5.2 2.2 6.5 6.8 7.0 7.0 7.0 6.9 6.9 6.8 6.8 6.8Average nominal interest rate on forex debt (in percent) 1.5 1.4 1.0 1.4 0.5 2.3 2.9 3.1 3.1 3.2 3.3 3.0 3.2 2.9 3.1Average real interest rate on domestic debt (in percent) 2.3 6.6 2.6 1.8 3.7 2.2 1.9 1.4 1.2 1.3 1.4 1.6 1.5 2.1 1.7Real exchange rate depreciation (in percent, + indicates depreciation -5.9 -3.0 -1.1 -4.3 7.7 ... ... ... ... ... ... ... ... ... ...Inflation rate (GDP deflator, in percent) 9.4 5.0 7.5 8.6 3.8 6.7 6.3 6.3 5.9 5.5 5.3 6.0 5.1 5.0 5.1Growth of real primary spending (deflated by GDP deflator, in percen 5.9 12.6 13.3 3.4 5.3 12.2 7.6 3.1 4.7 5.8 5.1 6.4 7.6 6.7 6.8Grant element of new external borrowing (in percent) ... ... ... … … 29.8 29.9 31.2 26.9 16.6 28.8 27.2 13.6 25.2 ...
Sources: Country authorities; and staff estimates and projections.1/ Refers to gross debt of the central government.2/ Gross financing need is defined as the primary deficit plus debt service plus the stock of short-term debt at the end of the last period. 3/ Revenues excluding grants.4/ Debt service is defined as the sum of interest and amortization of medium and long-term debt.5/ Historical averages and standard deviations are generally derived over the past 10 years, subject to data availability.
KENYA
INTERN
ATION
ALM
ON
ETARYFU
ND
11

KENYA
12 INTERNATIONAL MONETARY FUND
Table 4. Kenya: Sensitivity Analysis for Key Indicators of Public Debt 2015–34
Projections2015 2016 2017 2018 2019 2020 2024 2034
PV of Debt-to-GDP Ratio
Baseline 49 48 47 46 44 43 37 25
A. Alternative scenarios
A1. Real GDP growth and primary balance are at historical averages 49 46 45 45 44 43 42 39A2. Primary balance is unchanged from 2015 49 49 51 52 54 55 62 73A3. Permanently lower GDP growth 1/ 49 48 48 47 46 45 42 41A4. Fix primary balance ex-SGR 49 48 48 49 49 49 52 57
B. Bound tests
B1. Real GDP growth is at historical average minus one standard deviations in 2016-2017 49 51 53 53 53 53 51 45B2. Primary balance is at historical average minus one standard deviations in 2016-2017 49 47 47 46 44 43 37 25B3. Combination of B1-B2 using one half standard deviation shocks 49 48 48 48 47 47 44 38B4. One-time 30 percent real depreciation in 2016 49 57 55 53 51 49 42 29B5. 10 percent of GDP increase in other debt-creating flows in 2016 49 57 56 54 52 50 43 28
PV of Debt-to-Revenue Ratio 2/
Baseline 238 222 211 202 196 194 164 106
A. Alternative scenarios
A1. Real GDP growth and primary balance are at historical averages 238 214 203 197 194 195 183 165A2. Primary balance is unchanged from 2015 238 226 226 231 238 250 272 312A3. Permanently lower GDP growth 1/ 238 223 214 207 203 204 187 173A4. Fix primary balance ex-SGR 238 220 215 214 216 223 229 243
B. Bound tests
B1. Real GDP growth is at historical average minus one standard deviations in 2016-2017 238 233 237 234 233 237 224 193B2. Primary balance is at historical average minus one standard deviations in 2016-2017 238 218 210 202 195 193 164 105B3. Combination of B1-B2 using one half standard deviation shocks 238 219 214 210 208 211 196 162B4. One-time 30 percent real depreciation in 2016 238 262 246 234 225 221 186 124B5. 10 percent of GDP increase in other debt-creating flows in 2016 238 263 248 237 229 226 189 119
Debt Service-to-Revenue Ratio 2/
Baseline 29 28 26 25 28 24 26 14
A. Alternative scenarios
A1. Real GDP growth and primary balance are at historical averages 29 28 26 24 27 24 29 20A2. Primary balance is unchanged from 2015 29 28 26 26 30 28 37 36A3. Permanently lower GDP growth 1/ 29 28 26 25 28 25 28 21A4. Fix primary balance ex-SGR 29 28 26 25 29 26 33 28
B. Bound tests
B1. Real GDP growth is at historical average minus one standard deviations in 2016-2017 29 29 28 27 31 28 33 23B2. Primary balance is at historical average minus one standard deviations in 2016-2017 29 28 26 24 27 24 26 14B3. Combination of B1-B2 using one half standard deviation shocks 29 28 27 25 28 25 30 20B4. One-time 30 percent real depreciation in 2016 29 29 29 28 33 28 33 20B5. 10 percent of GDP increase in other debt-creating flows in 2016 29 28 29 29 32 28 28 15
Sources: Country authorities; and staff estimates and projections.1/ Assumes that real GDP growth is at baseline minus one standard deviation divided by the square root of the length of the projection period.2/ Revenues are defined inclusive of grants.

Statement by Ms. Kapwepwe, Executive Director for Kenya
and Ms. Ngugi, Senior Advisor to the Executive Director for Kenya
September 16, 2015
On behalf of the Kenyan authorities, we thank staff for their constructive engagement during the first review of the economic program under the 12-month Stand-By Arrangement and an Arrangement under Standby Credit Facility. With the significant progress made in implementation of the program, the authorities look forward to the completion of this review, and the Executive Board support for the request for a modification of performance criteria for end-September 2015, and for waivers for non-observance of the performance criteria on external payments arrears.
1) Recent Economic Developments
Kenya’s economic growth remains resilient. The first quarter of 2015 recorded a 4.9 percent growth compared to 4.7 percent in 2014, supported by the expansion of activities of construction, finance and insurance, information and communication, electricity and water supply, wholesale and retail trade and transport and storage. However, there was contraction in tourism sector, mainly due to low hotel occupancy rates arising from insecurity concerns largely by international visitors.
Inflation has remained within the authorities’ target band, averaging 6.49 percent in the last one year. Inflation declined from 7.03 percent in June 2015 to 5.84 percent in August 2015 mainly due to a decline in several food items as a result of favorable weather. There was however an increase in the category of Housing, Water, Electricity, Gas and other Fuels due to the surge in fuel cost adjustments and foreign exchange charges per KwH of electricity. The central bank has tightened monetary policy since June 2015 to anchor inflation expectations especially with the exchange rate depreciation.
Both the fiscal and external current account deficits have widened compared to the projected program path. The fiscal deficit reflects shortfalls in revenue collections and additional expenditure pressures, especially those related to security spending. The deterioration in current account balance in percent of GDP to 9.6 in July 2015 (12 months cumulative) partly reflects imports of aircraft equipment fully financed by loans from the African Exim Bank. Excluding these imports the current account as a percent of GDP moderates to 7.7 percent of GDP which is within acceptable range for net importer comparator country.
Foreign reserves have declined although they remain within the statutory requirement. By August 27, 2015, the reserves were US$6.392 billion (4.05 months of import cover) from US$7.43 billion (4.85 months of import cover) since the beginning of January 2015. The tapering capital inflows, central bank interventions to smooth the foreign exchange market, and decline in tourism receipts have also seen the exchange rate depreciate and weakening of the balance of payment position.

2
2) Program performance
The authorities continue to demonstrate their commitment to successful implementation of the program despite the prevailing exogenous shocks. All the end-March 2015 performance criteria were met except for the continuance performance criteria on national government external payment arrears, where temporary delays were experienced in repayment of some of the external obligations, reflecting coordination rigidities among the relevant entities rather than inability to pay. These arrears have since been fully settled and corrective measures adopted to avoid such recurrence. All end-June 2015 indicative targets were met except for the net international reserve (NIR) following tapering capital inflows since April 2015 and central bank interventions to stabilize the foreign exchange market. The target for net domestic assets (NDA) was also missed given the increased domestic financing needs. In this regard, the authorities are requesting for waivers under both Arrangements for the temporary non-observance of end-March continuous performance criterion on external arrears, and modification of the performance criteria for NIR and NDA.
Significant progress was made with implementation of the structural benchmarks although there were delays in completing some of them and others have been reset. Of the seven structural benchmarks for end-March and end-June, three were completed on time, and two with some delays, and the rest were reset for end-September with only one reset for end-December. The authorities are making significant progress towards completing the end-September structural benchmarks. In addition, the authorities completed all the financial sector reforms set for the program although they were not set as structural benchmarks.
3) Prospects and Macroeconomic Policies
With the risks to outlook tilted to the downside, the macroeconomic framework has been revised. The revisions reflect a projected lower GDP growth rate, higher inflation, and weakening balance of payments. These reflects the low oil prices that may impact negatively on FDI inflows for new oil explorations, security risks affecting the tourism sector, international market risks with expected unwinding of the unconventional monetary policy, and regional economic distress.
a) Fiscal policy
The authorities remain committed to preserving fiscal sustainability by maintaining debt at sustainable levels, and attaining the East Africa Monetary Union convergence criteria of fiscal deficit in the medium term. In this regard, on the revenue side, various tax policy and tax administrative measures are being implemented to enhance mobilization of domestic resources. These including the review and modernization of the Income Tax Act, and ensuring the tax procedures for VAT, Excise Duty, and Income Tax are under one law. The passage of the 2015 Finance Bill has seen an introduction of a simplified and modern Excise Duty.

3
On the expenditure side, the authorities have embarked on large public investment projects aimed to close the existing infrastructure gaps in the process of transforming the economy. As such, it is expected that development spending as a share of the total national government spending will increase to 41 percent in the current fiscal year. Rationalizing current spending remains a priority and the recently approved Capacity Assessment and Rationalization of the Public Service implementation plan is expected to facilitate easing the current expenditure pressures.
Further, the national government continues to support building capacity at the county level, especially to improve efficiency in public finance management and service delivery and promote rapid local economic development in the devolution process. The implementation of a framework establishing limits and guidelines for county government borrowing consistent with the PFM Act commenced in June 2015. At the same time, counties can access the central bank overdraft facility but this does not pose a threat to monetary policy operations because they will not access the facility over and above the national government’s overdraft limit. The law sets a limit of 5 percent of recently audited accounts which cannot be exceeded by both the National and County Governments. Furthermore, the PFM regulations which have been gazette and awaiting parliament’s approval stipulate that the overdraft should be retired within the year it was accessed.
Efforts to strengthen the capacity of the Debt Management Office are ongoing. The authorities are taking steps to address staffing and enhance the risks and compliance functions of the office. A technical assistant from US Treasury is on the ground to help strengthen the capacity building process. A work plan has been finalized and is awaiting approval in order to commence implementation. Further, the process of recruiting the Director for the DMO has commenced.
In addition, the authorities have made progress in enhancing government cash management. A sub-account structure of TSA model is being implemented in line with the PFM legal and institutional framework. The preparations toward finalizing the Service Level Agreement between the Treasury and the Central Bank are geared for completion as proposed by end-September 2015.
Furthermore, there is progress towards implementation of the parastatal reforms. A new Code of Governance for State Corporations, “Mwongozo”, was launched by His Excellency the President in April 2015 to address governance and management challenges in parastatals. Further, the Government Owned Entities Bill 2014 which is meant to ensure parastatals adopt a leaner and more efficient management structure has been submitted to Cabinet, while the National Sovereign Wealth Fund Bill 2014 is being reviewed by the Attorney General before being submitted to Cabinet for discussion.
b) Monetary and financial policies
The key objective of monetary policy is to maintain price stability. In this regard, the authorities continue to monitor developments in the market and are prepared to take appropriate actions to anchor inflation expectations. At the same time, while they maintain a

4
floating exchange rate regime, the authorities are committed to intervene only to stabilize excess volatility in the exchange rate market.
Significant progress has been achieved towards modernizing the monetary policy framework. The proposed increase in frequency of submission by National Treasury to Central Bank of the cash flow plans is aimed to further improve liquidity forecasting.
Deepening financial sector reforms is also a priority to safeguarding financial stability. In this regard, the central bank continues to strengthen the prudential oversight framework, including the review and implementation of the prudential guidelines on risk classification of assets and provisioning supervision and regulations of the banking sector. The central bank has also enhanced its ability to conduct stress testing of the banking system and continues to strengthen consolidated supervision.
c) Business environment
Improving business environment to encourage private sector innovation, entrepreneurship and business expansion is viewed as a prerequisite to achieving strong and sustained economic growth and poverty reduction. In this regard, addressing security concerns remains a top priority and more resources have been allocated to this sector to continue with the modernization program and reforms. In addition, to deepen the governance reforms, all ministries, departments and agencies are required to use the e-procurement module of the IFMIS to safeguard loss of public finances through corruption. The National Electronic Single Window System declaration module is now operational. Since July 2015, all importers and exporters are required to process their transactions through the system. The aim is to facilitate international trade by reducing delays while at the same time maintaining the requisite controls and ensuring efficient revenue collection. Further, since March 2015, the authorities have been implementing a Business Regulatory Reform Strategy to raise Kenya’s global ranking under the World Bank’s doing business indicators.
d) Data quality
Improving data quality to support policy making remains a top priority. In addition to the progress made in balance of payments and government financial statistics, the Kenya Integrated Household Budget Survey 2015/16 commenced on September 1 2015, with the results expected to be published end 2016. The authorities plan to subscribe to the Fund’s Special Data Dissemination Standard by 2022.
4) Conclusion
Despite the prevailing downside risks, the authorities are committed to successful implementation of the two arrangements to achieve the objectives set for the program. They continue to treat these Arrangements as precautionary and will only draw under these Arrangements when an actual balance of payment need materializes. There is strong political ownership of the program and the authorities will continue their engagement with the Fund and other development partners in the process of meeting their development goals.