kenya - wesgro 03 food and bev kenya.pdf · 4 kenya is the east african community (eac)'s...
TRANSCRIPT

Kenya Food and Beverages
Executive Summary
SECTOR OVERVIEW IN KENYA
African countries spend more than USD60bn annually importing food for their growing populations, but
the continent has the potential to become a major food exporter.
Fresh cow’s milk was the leading agricultural product in Kenya valued at USD1.6bn in 2013.
Food sales over the forecast period will grow by 13%, from KEM1.2trn in 2016 to KEM2trn in 2020
The largest food sales in Kenya over the five year forecast period to 2020 are expected to be cooking oil
and fats (KEM137bn in 2016 to KEM321bn in 2020) and edible oils (KEM129bn in 2016 to KEM307bn in
2020).
Kenya’s beer sales represented the largest sales of beverages, increasing from 509 million litres in 2012
to a forecasted 791 million litres in 2020.
TRADE
Kenya is a net exporter of food and beverages. Kenya’s exports of food and beverages were valued at
ZAR24.2bn in 2014 compared to ZAR19.6bn in 2013, increasing by 20%.
South Africa and the Western Cape are net exporters of food and beverages to Kenya.
In 2014, South Africa exported food and beverages valued at ZAR673m compared to ZAR513m in 2013,
representing an increase of 31%.
The leading export product from the Western Cape to Kenya in the food and beverages sector was
undenatured ethyl alcohol, valued at ZAR122m.
The Western Cape also had a positive trade balance with Kenya from 2004 to 2014. Exports were valued
at around ZAR274m in 2014 compared to ZAR236m in 2013, increasing by 16%.
In 2014, the leading export product from the Western Cape to Kenya in the food and beverages sector
was fresh apples, pears and quinces, valued at ZAR92m.
FDI
Kenya is a net recipient of FDI in the food and beverage sector.
Between January 2003 and August 2015 a total of 36 FDI projects were recorded into the Kenyan food
and beverage sector.
Between January 2003 and August 2015 a total of 33 FDI projects were recorded into the food and
beverage sector by Kenya. These projects represent a total capital investment of ZAR6.88bn.
Between January 2003 and August 2015 a total of 2 FDI projects were recorded from South Africa into
Kenya’s food and beverage sector. These projects represent a total capital investment of ZAR365.57m.
There were no investments with Kenya in this sector from or into the Western Cape.

2
Table of Contents
1. Definitions/descriptions ................................................................................................................... 3
2. Overview of food and beverage market in Kenya ........................................................................... 3
2.1 SWOT analysis of Kenya’s food and beverage sector ........................................................... 7
2.2 Logistics .................................................................................................................................. 8
2.3 Companies .............................................................................................................................. 9
3. Trade ............................................................................................................................................. 10
3.1 Kenya’s Global Trade of Food and Beverages ..................................................................... 10
3.2 South African Trade of Food and Beverages with Kenya ..................................................... 13
3.3 Western Cape Trade of Food and Beverages with Kenya ................................................... 14
3.4 Trade Regulations Markings and Standards ......................................................................... 16
3.4.1. Standards ...................................................................................................................... 16
3.4.2. Labelling ........................................................................................................................ 16
3.5 Tariffs for South African food and beverages ....................................................................... 16
4. FDI ................................................................................................................................................. 18
4.1 Inward FDI into the Kenyan Food & Beverage Sector .......................................................... 18
4.2 Outward FDI .......................................................................................................................... 19
4.3 Bilateral FDI between South Africa and Kenya ..................................................................... 21
3
1. Definitions/descriptions
According to FDI.net (2012), the food and beverage processing sector refers to the manufacturing, processing and
preservation of meat, fish, fruit, vegetables, oils and fats; manufacture of dairy products; manufacture of grain mill
products, starches and starch products and prepared animals feeds; manufacture of other food products (e.g.
bread, sugar, chocolate, pasta, coffee, nuts and spices); and the manufacture of bottled and canned soft drinks,
fruit juices, beer, wines, etc. This analysis includes unprocessed food and beverages such as raw fruit and
vegetables, seeds and nuts.
African countries spend more than USD60bn annually importing food for their growing populations, but the
continent has the potential to become a major food exporter. Large areas of unused arable land, low fertiliser use
and poor irrigation mean there is scope for improving yields in Africa, which are among the lowest in the world. A
rising middle class continues to boost African demand for food products, especially for processed and packaged
food, creating a continental food market that the World Bank estimates could be worth USD1trn in 2030. While
exporters in Asia and Brazil stand to gain in the short term, BMI Research (2015) forecasts that food producers,
processors and shippers in Kenya and South Africa, and retailers in Nigeria are all well placed to serve the growing
African consumer market.
2. Overview of food and beverage market in Kenya
Kenya's food and drink industry will experience robust growth in 2016, as the country's positive economic outlook
drives consumer spending. Kenya's consumer confidence is expected to rise with the increase in household
spending due to growing disposable incomes. It is expected that Kenya's emerging middle class will boost sales
for non-essential goods (BMI, 2016).
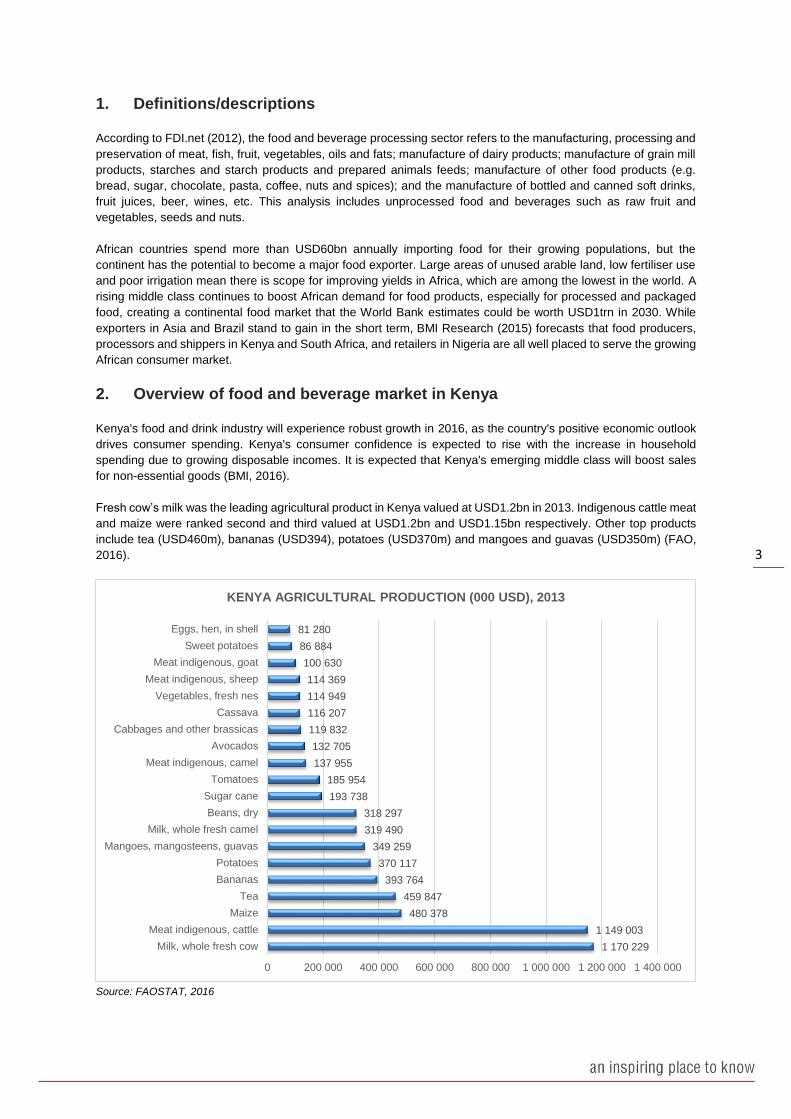
Fresh cow’s milk was the leading agricultural product in Kenya valued at USD1.2bn in 2013. Indigenous cattle meat
and maize were ranked second and third valued at USD1.2bn and USD1.15bn respectively. Other top products
include tea (USD460m), bananas (USD394), potatoes (USD370m) and mangoes and guavas (USD350m) (FAO,
2016).
Source: FAOSTAT, 2016
1 170 229
1 149 003
480 378
459 847
393 764
370 117
349 259
319 490
318 297
193 738
185 954
137 955
132 705
119 832
116 207
114 949
114 369
100 630
86 884
81 280
0 200 000 400 000 600 000 800 000 1 000 000 1 200 000 1 400 000
Milk, whole fresh cow
Meat indigenous, cattle
Maize
Tea
Bananas
Potatoes
Mangoes, mangosteens, guavas
Milk, whole fresh camel
Beans, dry
Sugar cane
Tomatoes
Meat indigenous, camel
Avocados
Cabbages and other brassicas
Cassava
Vegetables, fresh nes
Meat indigenous, sheep
Meat indigenous, goat
Sweet potatoes
Eggs, hen, in shell
KENYA AGRICULTURAL PRODUCTION (000 USD), 2013

4
Kenya is the East African Community (EAC)'s economic hub and comfortably its most dynamic consumer market.
It is expected that robust growth in Kenya's economy will drive positive growth in the food industry. Kenya's
diversified economy makes it one of the region's best performing, as it is less exposed to the downturn in
commodities prices and China's slowdown. Away from Kenya, there are very few countries, if any, in the region
that boast such a competitive food retailing industry that is dominated almost entirely by domestic companies (BMI,
2016).
Food sales over the forecast period to 2020 will grow by 13%, from KEM1.2trn in 2016 to KEM2trn in 2020, driven
primarily by 4.5% private consumption growth. The key drives will be the country's rising incomes, growing middle
class and favourable demographics, as well as growing financial inclusion.
Source: BMI Research, 2016
Kenya's market is exposed to a booming fast food sector, which will boost growth for convenience foods. Market
demand for oils and packaged foods will rise with Kenya's booming fast food industry and growing need for
convenience foods. The long-term opportunities on offer in Kenya, along with the fact that one can source a lot of
retail space locally given the relatively well developed nature of the wider food processing industry, suggest Kenya
is too good an opportunity to miss (BMI, 2016).
The increasing arrival of high-end travellers to Kenya are expected to drive premiumisation in the market and the
country's growing number of middle-income consumers will look to spend more on luxury goods offered by
international retailers.
The largest food sales in Kenya over the five year forecast period are expected to be cooking oil and fats
(KEM137bn in 2016 to KEM321bn in 2020), edible oils (KEM129bn in 2016 to KEM307bn in 2020), sugar
(KEM153bn in 2016 to KEM248bn in 2020) and beef (KEM145bn in 2016 to KEM233n in 2020).
2013 2014 2015 2016f 2017f 2018f 2019f 2020f
KEMbn 840.1 952.2 1 068.5 1 210.4 1 364.4 1 549.5 1 759.6 1 997.9
Growth 13.65% 13.35% 12.21% 13.28% 12.72% 13.57% 13.56% 13.54%
11.00%
11.50%
12.00%
12.50%
13.00%
13.50%
14.00%
0
500
1 000
1 500
2 000
2 500
Gro
wth
Valu
e (
KE
Mbn)
KENYA FOOD SALES, 2013-2020f

5
Source: BMI Research, 2016
2013 2014 2015 2016f 2017f 2018f 2019f 2020f
Cooking oils and fats 67.4 86.9 108.8 137.4 170.4 212.0 262.0 321.2
Edible oils and animal fats 61.4 80.1 101.2 128.8 160.7 201.1 249.5 307.1
Sugar 106.7 120.7 135.2 152.8 171.7 193.9 219.1 247.5
Beef 102.4 115.5 129.0 145.4 162.8 183.2 206.3 232.2
Dairy 146.3 155.9 163.9 171.7 179.8 189.9 198.1 205.8
Milk 126.4 134.6 141.5 148.3 155.6 164.7 171.9 178.5
Rice 65.6 74.6 84.0 95.4 107.7 122.4 139.0 157.9
Bread 47.4 53.3 59.4 66.7 74.5 83.5 93.7 105.1
Bananas (fresh), 40.0 45.6 51.5 58.7 66.6 75.9 86.5 98.6
Poultry 37.9 43.2 48.7 55.5 62.8 71.5 81.4 92.7
Other cereal products 30.5 34.8 39.3 44.8 50.8 57.9 66.1 75.3
Lamb 24.9 28.2 31.7 35.9 40.4 45.8 51.8 58.7
Citrus fruits (fresh) 23.1 26.4 29.8 34.0 38.6 44.1 50.3 57.4
Fresh vegetables 35.4 38.0 40.5 43.4 46.1 49.2 52.2 55.3
Stone fruits (fresh) 18.9 21.5 24.2 27.5 31.1 35.4 40.3 45.8
Fish 20.7 23.1 25.4 28.3 31.2 34.6 38.3 42.4
Salt, spices, herbs 7.5 9.6 11.9 15.0 18.5 22.9 28.2 34.5
Shellfish and preserved fish 14.0 15.8 17.8 20.2 22.8 25.8 29.3 33.2
Sauces and condiments 5.2 6.7 8.4 10.7 13.3 16.6 20.6 25.3
Other fruit 9.1 10.5 11.8 13.5 15.4 17.6 20.1 22.9
Margarine and spreads 9.9 11.1 12.4 13.9 15.6 17.5 19.7 22.1
Baked goods 10.3 11.5 12.7 14.1 15.5 17.1 19.0 20.9
Leaf and stem vegetables 8.9 10.0 11.3 12.8 14.4 16.3 18.4 20.8
Eggs 14.7 15.4 15.8 16.2 16.1 16.3 16.5 16.6
Root vegetables and mushrooms 11.9 12.6 13.1 13.7 14.3 14.9 15.4 15.8
0.0
50.0
100.0
150.0
200.0
250.0
300.0
350.0
Valu
e (
KE
Sbn)
TOP 25 KENYA FOOD SALES, 2013-2020f

6
Kenya's emerging middle-class will be the driver of beer sales, with premium beer experiencing positive growth
sales as reported by East African Breweries in H116. Kenyan consumers will switch up from home brewed beer
owing to rising disposable incomes to boost the low-end beer market (BMI, 2016).
Kenya’s beer sales represented the largest sales of beverages, increasing from 509 million litres in 2012 to a
forecasted 791 million litres in 2020. This relatively modest growth in volume may cause market leaders to focus
on premiumisation, even though the low-cost beer revolution is more established in East Africa than it is in West
Africa.
Source: BMI, 2016
Whiskey is expected to be the largest alcoholic beverage sales in Kenya over the five-year forecast period to 2020
with 12.1 million litres being sold in 2020, followed by liqueur and red wine with sales of 5.3 million litres and 3.9
million litres respectively. Overall wine consumption in Kenya grew by 5% during 2013, higher than 2012. The
growth in wine consumption was largely driven by the growing middle-class population in Kenya (Euromonitor,
2014). There is an opportunity for Western Cape wine companies to promote their wines in this growing market.
Kenya Wine Agencies Limited, however, has engaged in extensive marketing and branding to grow and protect its
market share amid increased competition (Euromonitor, 2014).
Source: BMI, 2016
2012 2013 2014 2015 2016f 2017f 2018f 2019f 2020f
Beer 508.6 531.9 557.6 589.4 622.4 657.9 697.6 741.6 790.5
0
100
200
300
400
500
600
700
800
900
litre
s m
illio
n
KENYA BEER SALES, 2012-2020f
2012 2013 2014 2015 2016f 2017f 2018f 2019f 2020f
Whiskey 12.4 12.5 12.3 12.4 12.3 12.3 12.2 12.2 12.1
Liqueur 5.4 5.4 5.4 5.4 5.3 5.3 5.3 5.3 5.3
Red Wine 2.5 2.6 2.8 3.0 3.1 3.3 3.5 3.7 3.9
Gin 3.3 3.5 3.5 3.5 3.5 3.5 3.5 3.5 3.5
White Wine 2.1 2.1 2.2 2.3 2.5 2.6 2.7 2.9 3.1
Vodka 2.3 2.3 2.3 2.3 2.3 2.3 2.2 2.2 2.2
Other Wine 1.0 1.0 0.9 1.0 1.0 1.1 1.1 1.2 1.3
Rum 1.2 1.2 1.1 1.1 1.1 1.1 1.1 1.1 1.1
Vermouth 0.7 0.6 0.6 0.6 0.6 0.6 0.6 0.6 0.6
Sparkling Wine 0.2 0.1 0.2 0.2 0.2 0.2 0.2 0.2 0.2
Fermented drinks 0.2 0.0 0.0 0.0 0.1 0.1 0.1 0.1 0.1
0.0
2.0
4.0
6.0
8.0
10.0
12.0
14.0
Litre
s m
illio
n
KENYA ALCOHOLIC BEVERAGE SALES, 2012-2020f

7
Kenya's tea and coffee industry will drive non-alcoholic drinks sales, as hot drinks sales grow by 11% over the five-
year forecast period to 2020. Soft drinks sales will experience positive growth, led by bottled water sales. It is
forecasted that mineral or spring water sales will remain high owing to the country's unsafe tap water. Kenya's
growing fast food industry will boost carbonated drinks sales, which are forecast to grow by 7.5% over our five-
year forecast period to 2020 (BMI, 2016).
Source: BMI, 2016
2.1 SWOT analysis of Kenya’s food and beverage sector
The table below shows the SWOT analysis of Kenya’s food and beverage sector:
STRENGTHS WEAKNESSES
Kenya is the East African Community (EAC)'s economic hub and comfortably its most dynamic consumer market. Its food and drink industry is well developed by regional standards and has many Kenyan companies.
Nakumatt, Uchumi, Tuskys and Naivas, are well established domestic companies in the food retail sector.
Close trade links with Uganda and Tanzania and with large markets in Europe have seen the country develop a major food export industry.
Kenyan firms' ability to manage complex supply chains and experience dealing with European import and health requirements.
Per capita food consumption in Kenya still has a long way to go to match some of Sub-Saharan Africa's wealthiest countries, such as Botswana, Namibia and South Africa.
Kenya ranks 12th out of 14 sub-Saharan African countries in the food and drinks risk-reward rating.
The distribution of products across sub-Saharan Africa to retailers remains challenging hampered further by poor infrastructure and refrigeration systems.
OPPORTUNITIES THREATS
Premiumisation will play a major part in the growth of many segments of the Kenyan food and drink industry.
Kenya's dominant beer company East African Breweries Limited is facing some major issues in Kenya following the introduction of an excise tax
2013 2014 2015 2016f 2017f 2018f 2019f 2020f
Tea 17.8 19.9 22.2 24.9 27.9 31.7 36.0 41.0
Soft Drinks 4.3 4.8 5.3 6.0 6.7 7.6 8.7 9.9
Carbonated Drinks 11.5 12.3 13.2 14.3 15.4 16.4 17.7 18.9
Hot chocolate and other hot drinks 1.4 1.6 1.7 1.8 1.9 2.1 2.3 2.4
Fruit and vegetable juices 1.2 1.3 1.4 1.5 1.6 1.8 1.9 2.1
Mineral or spring waters 8.8 9.5 10.2 11.0 11.8 12.6 13.5 14.4
0.0
5.0
10.0
15.0
20.0
25.0
30.0
35.0
40.0
45.0
Valu
e (
KE
Mbn)
KENYA NON-ALCOHOLIC BEVERAGE SALES, 2013-2020f

8
Opportunities for M&A with domestic food retailers
Rising middle class boosts African demand for food products (especially for processed and packaged food).
The well-developed dairy industry has the capacity to expand its operation.
Kenya is developing a domestic packaging and processing industry based around firms such as meat producer Farmers' Choice.
levied against its key Senator Keg brand in October 2013.
Source: BMI Research, 2015
2.2 Logistics
There are two Trans-African highways running through Kenya, which form the main international transport routes
and allow for smoother cross-border road transit. The first is the Cairo-Cape Town Highway (number 4), which runs
north to south and connects the country to Ethiopia and Tanzania. This route is largely paved south of Tanzania,
and is mostly used from Nairobi southwards. Northern sections in Kenya and Sudan are of poorer quality. The
second is the Lagos-Mombasa Highway (number 8), which runs east to west and connects Kenya to Uganda and
West Africa. The usage of this route remains limited beyond Uganda, however, as it is largely unpaved through the
Democratic Republic of Congo (EAC, 2015). The road network in Kenya is still below the standard of more
developed countries, and supply chains face serious risks of congestion, checkpoint bribes and armed robbery.
The port delays are especially worrisome for perishable food and beverage products (PwC, 2013). Kenya also has
many established private companies who specialise in the transport of perishable items, these include Sonic Fresh
Co.
Source: Northern Corridor Transit and Transport Coordination Authority, 2014
The Northern corridor, pictured above, is the transport corridor linking the land locked countries of Uganda, Rwanda
and Burundi with Kenya’s maritime port of Mombasa. Similarly, the Northern Corridor serves the eastern part of
the Democratic Republic of Congo, southern Sudan and northern Tanzania. The Northern Corridor infrastructure
connects all the five countries of the East African Community and links around 200 million people to global markets
through the Mombasa port (Northern Corridor Transit and Transport Coordination Authority, 2014).
In terms of port upgrades, Kenya is spending USD366m to construct a new container terminal in Mombassa that
will more than double the capacity of the current port, from handling 900,000 20-foot equivalent unit (TEU)

9
containers to 2,1 million containers (Financial Mail, 2013). A new terminal is also being built on land reclaimed from
the sea by Japan Ports Consultants, with the third phase expected to be completed in 2020. The new terminal will
enable the country to handle larger vessels.
2.3 Companies
The table below gives the key companies in Kenya’s food and beverage sector:
East African Breweries Limited (EABL) is East Africa's leading branded alcohol beverage business with an
outstanding collection of brands that range from beer, spirits and adult non-alcoholic drinks (ANADs) reaffirming
our standing as a total adult beverage (TAB) company.
Unga Group Limited is a Kenya-based holding company that has a majority shareholding in companies involved
with the manufacture and marketing of a broad range of human nutrition, animal nutrition and animal health
products.
Mumias Sugar Company is primarily engaged in the manufacture and sale of sugar. The company grows some
sugar cane; its own estates provide up to 7% of its annual output. Its primary source of sugarcane is over 50,000
registered "out growers" with over 400 square kilometres (99,000 acres) under cultivation.
Sasini has controlling stacks in Tea and Coffee production in Kenya comprising an area of over 2,000 hectares.
Kenya is one of the largest exporters of tea. With an active participation in the weekly Mombasa Tea Auctions,
Sasini supplies increasingly large volumes of tea to the expanding markets of Europe, the Middle East, Egypt and
Pakistan (Moneyhub, 2015).
KENYA FOOD AND BEVERAGE COMPANIES, 2016
COMPANY OWNERSHIP SUBSECTOR SALES (USDm)
East African Breweries Parent company: Diageo Alcohol - beer 707.0
Unga Group Partnership: US-based Seaboard Corporation (35%)
Food - diversified 185.1
Mumias Sugar
Shareholders: Kenyan Government (71%); Commonwealth Development Corp (17%)
Food - sugar 60.6
Sasini - Tea and coffee 31.8
Williamson Tea - Tea 29.0
Kakuzi Parent company: UKbased Camellia PLC (50.7%)
Tea and diversified agribusiness
19.2
Kapchorua Tea - Tea 12.0
Eaagads - Coffee 1.1
Limuru Tea - Tea 1.0
Kenya Orchards - Food - diversified 0.7
Source: BMI, 2016

10
3. Trade
3.1 Kenya’s Global Trade of Food and Beverages
Kenya experienced a positive trade balance from 2004 to 2014, making Kenya a net exporter of food and
beverages. Kenya’s exports of food and beverages were valued at ZAR24.2bn in 2014 compared to ZAR19.6bn in
2013, increasing by 20%, while imports were valued at ZAR21bn in 2014 increasing by 24%.
Source: Trade Map, 2016
Egypt was the leading export market for food and beverages from Kenya in 2014, valued at ZAR3.4bn and growing
by 12% per annum over the last five years. The United Kingdom and Pakistan were ranked second and third,
valued at ZAR3bn and ZAR2.7bn respectively. Other top export markets were Uganda (ZAR953m), Germany
(ZAR1.1bn) and Netherlands (ZAR1bn). The top food and beverage exports to the top three destination markets
are as follows:
Egypt
Tea, ZAR3.3bn
Pipe, chewing , tobacco, ZAR113m
Coconut, abaca, ramie & other vegetable fibers, ZAR17m
United Kingdom:
Tea, ZAR2bn
Cut flowers and flower buds, ZAR987m
Leguminous vegetables, ZAR889m
Pakistan
Tea, ZAR2.5bn
Dried vegetables, ZAR208m
Carbonate; peroxocarbonate, ZAR91m
2004 2005 2006 2007 2008 2009 2010 2011 2012 2013 2014
Exports (ZARm) 7 035 7 795 8 494 9 917 15 029 14 221 14 111 16 296 18 468 19 633 24 205
Imports (ZARm) 3 187 2 979 4 032 5 523 8 885 10 993 8 250 13 239 14 428 16 713 21 356
Trade balance (ZARm) 3 848 4 816 4 462 4 395 6 144 3 228 5 861 3 056 4 041 2 920 2 849
0
5 000
10 000
15 000
20 000
25 000
30 000
Valu
e (
ZA
Rm
)
KENYA FOOD & BEVERAGE TRADE, 2004-2014

11
KENYA’S EXPORT MARKETS OF FOOD & BEVERAGES, 2014
RANK DESTINATION MARKETS VALUE
2014 (ZARm)
% GROWTH 2010-2014
1 Egypt 3 354 17.83%
2 United Kingdom 2 962 0.42%
3 Pakistan 2 731 18.69%
4 Uganda 1 232 13.62%
5 United States 1 181 19.98%
6 Germany 1 103 10.02%
7 Netherlands 1 017 10.14%
8 Russian 958 23.27%
9 Tanzania 928 32.44%
10 France 912 8.46%
34 South Africa 88 22.80%
TOTAL EXPORTS 24 205 11.53%
Source: Trade Map, 2016
Pakistan was the leading source market for food and beverages to Kenya valued at ZAR2.9bn, followed by
Tanzania and Uganda valued at ZAR2.8bn and ZAR1.5bn respectively. Other top import markets were Russia
(ZAR1.4bn), Malaysia (ZAR1.4bn) and Indonesia (ZAR1.2bn). The top food and beverage imports from the top
three source markets are as follows:
Pakistan:
Rice, ZAR2.8bn
Knotted nettg of twine, ZAR111m
Woven cotton fabrics, ZAR73m
Tanzania
Maize (corn), ZAR1bn
Twine, cordge and cable, ZAR675m
Frozen vegetables, ZAR573m
Uganda
Tea, ZAR896m
Tobacco unmanufactured; tobacco refuse, ZAR513m
Electrical energy, ZAR312m

12
Source: Trade Map, 2015
Tea was the leading export product from Kenya in 2014, valued at ZAR11bn. Kenya currently exports 14% of the
world’s share of tea, the 3rd largest exporter after Sri Lanka and China. Unilever is the world’s leading tea
manufacturer and buys on average around 12 percent of global supply, which it markets worldwide under the
Lipton, PG Tips and Brooke Bond brand names. In this capacity they are partnering with a New York based
company Nature Source Genetics to create more resilient, “future-proof,” tea crops using a natural breeding
method known as genomic selection in their tea plantations in Kenya. This will likely further the growth of tea
exports from Kenya into the future. Coffee (ZAR3bn) and leguminous vegetables (ZAR1.9bn) were the second
and third largest export products from Kenya. The fastest growing food and beverage exports in 2014 were nuts
and vegetables.
The leading import product into Kenya was wheat and meslin, valued at ZAR4bn. Rice (ZAR3.3bn) and palm oil
(ZAR2.4bn) were the second and third largest imported products in the sector. There was strong growth in the
import of frozen vegetables and tea.
KENYA’S GLOBAL EXPORTS OF FOOD & BEVERAGES, 2014 KENYA’S GLOBAL IMPORTS OF FOOD & BEVERAGES, 2014
RANK PRODUCT VALUE
2014 (ZARm)
% GROWTH 2013-2014
RANK PRODUCT VALUE
2014 (ZARm)
% GROWTH 2013-2014
1 Tea 11 335 -3.10% 1 Wheat and meslin 4 070 65.41%
2 Coffee 2 517 37.36% 2 Rice 3 250 106.52%
3 Leguminous vegetables 1 918 57.60% 3 Palm oil & its fraction 2 433 -51.17%
4 Preserved fruits 843 24.04% 4 Tea 1 997 983.85%
5 Nuts nes 754 3907.64% 5 Maize (corn) 1 312 413.70%
6 Dried vegetables, shelled 494 -5.54% 6 Cane or beet sugar 1 072 -36.56%
7 Dates, figs,pineapples, mangoes, avocadoes, guavas
441 5.73% 7 Frozen vegetables 579 109629.55%
8 Sugar confectionery 410 -31.98% 8 Food preparations, nes 413 -9.43%
9 Vegetables nes, fresh or chilled 398 565.19% 9 Dried vegetables, shelled 356 7.90%
10 Margarine 390 53.63% 10 Fish, frozen, whole 329 257.12%
TOTAL EXPORTS 24 205 11.53% TOTAL IMPORTS 21 356 35.40%
Source: TradeMap, 2016
KENYA’S SOURCE MARKETS OF FOOD & BEVERAGES, 2014
RANK SOURCE MARKETS VALUE
2014 (ZARm)
% GROWTH 2010-2014
1 Pakistan 2 900 37.29%
2 Tanzania 2 815 94.79%
3 Uganda 1 447 14.41%
4 Russian 1 434 80.95%
5 Malaysia 1 390 54.37%
6 Indonesia 1 200 184.27%
7 India 890 51.43%
8 Ukraine 873 111.12%
9 United States of America 687 -6.37%
10 Thailand 674 59.41%
13 South Africa 674 -10.53%
TOTAL IMPORTS 21 356 17.62%

13
3.2 South African Trade of Food and Beverages with Kenya
South Africa has a positive trade balance with Kenya and is a net exporter of food and beverage products from the
country. In 2014, South Africa exported food and beverages valued at ZAR673m compared to ZAR513m in 2013,
representing an increase of 31%.
South Africa imported food and beverages from Kenya valued at ZAR88m in 2014 compared to ZAR118m in 2013,
representing a decrease of 25%. The exports from South Africa in 2009 are so high due to a spike in the export of
maize worth ZAR2.3bn.
Source: Quantec, 2016
The leading export product to Kenya was undenatured ethyl alcohol, valued at ZAR122m, followed by apples, pears
and quinces (ZAR117m) and wine (ZAR95m). The largest growing export to Kenya per annum from 2010 to 2014
was cane or beet sugar (197%), followed by chocolate and other food containing cocoa (162%). The leading import
product into South Africa from Kenya was dried and shelled leguminous vegetables valued at ZAR19m, followed
by tea (ZAR17m). Fresh or chilled leguminous vegetables (ZAR15m) were the third largest import in value terms.
Cabbages, cauliflowers, kohlrabi and kale were the largest growing import into South Africa growing at 348% per
annum over the last five years.
SOUTH AFRICA’S EXPORTS OF FOOD & BEVERAGES TO KENYA, 2014
SOUTH AFRICA’S IMPORTS OF FOOD & BEVERAGES FROM KENYA, 2014
RANK PRODUCT VALUE
2014 (ZARm)
GROWTH 2010-2014
RANK PRODUCT VALUE
2014 (ZARm)
GROWTH 2010-2014
1 Undenatured ethyl alcohol; ethyl alcohol
122 55.24% 1 Dried leguminous vegetables, shelled 19.0 -
2 Apples, pears and quinces, fresh 117 24.70% 2 Tea, whether or not flavoured 16.8 1.88%
3 Wine 95 25.13% 3 Leguminous vegetables, shelled or unshelled, fresh or chilled
15.0 57.05%
4 Cane or beet sugar 79 38.62% 4 Cabbages, cauliflowers, kohlrabi, kale 9.6 348.06%
5 Chocolate 29 225.27% 5 Vegetables frozen 7.7 -
6 Undenatured ethyl alcohol; spirits, liqueurs
27 5.86% 6 Coffee 4.5 29.48%
7 Food preparations nes 26 13.51% 7 Other vegetables, fresh or chilled 3.7 44.03%
8 Preparations of a kind used in animal feeding
23 24.35% 8 Jams, fruit jellies, marmalades, fruit or nut pureé
2.5 -
9 Citrus fruit, fresh or dried 23 26.63% 9 Onions, shallots, garlic, leeks and other alliaceous vegetables
2.4 173.39%
2004 2005 2006 2007 2008 2009 2010 2011 2012 2013 2014
Exports (ZARm) 392 286 245 287 1 008 2 714 780 382 392 513 673
Imports (ZARm) 25 34 38 35 54 41 58 58 100 118 88
Trade balance (ZARm) 367 252 207 252 955 2 673 722 324 292 394 585
0
500
1 000
1 500
2 000
2 500
3 000
Valu
e (
ZA
Rm
)
SOUTH AFRICAN EXPORTS OF FOOD &BEVERAGES WITH KENYA, 2004-2014
14
SOUTH AFRICA’S EXPORTS OF FOOD & BEVERAGES TO KENYA, 2014
SOUTH AFRICA’S IMPORTS OF FOOD & BEVERAGES FROM KENYA, 2014
RANK PRODUCT VALUE
2014 (ZARm)
GROWTH 2010-2014
RANK PRODUCT VALUE
2014 (ZARm)
GROWTH 2010-2014
10 Maize (corn) 21 -3.72% 10 Prepared foods obtained by the swelling or roasting of cereals
2.2 -
TOTAL EXPORTS 673 -11.53% TOTAL IMPORTS 88 21.56%
Source: Quantec, 2016
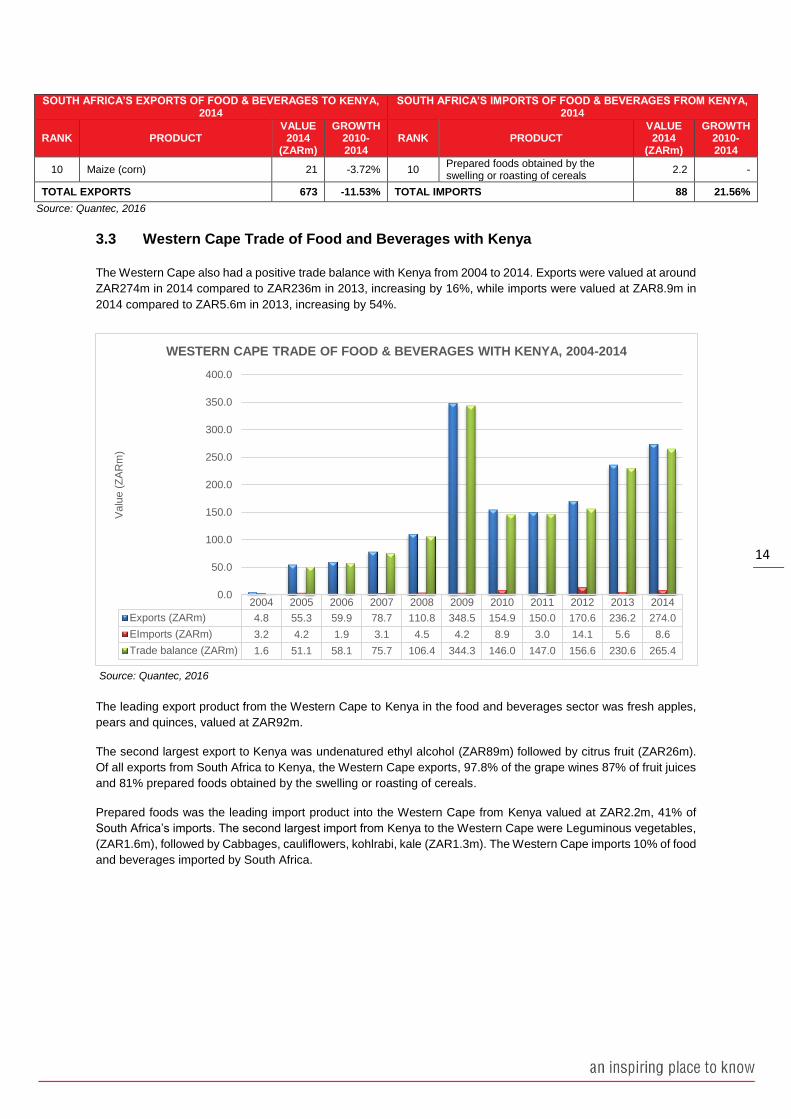
3.3 Western Cape Trade of Food and Beverages with Kenya
The Western Cape also had a positive trade balance with Kenya from 2004 to 2014. Exports were valued at around
ZAR274m in 2014 compared to ZAR236m in 2013, increasing by 16%, while imports were valued at ZAR8.9m in
2014 compared to ZAR5.6m in 2013, increasing by 54%.
Source: Quantec, 2016
The leading export product from the Western Cape to Kenya in the food and beverages sector was fresh apples,
pears and quinces, valued at ZAR92m.
The second largest export to Kenya was undenatured ethyl alcohol (ZAR89m) followed by citrus fruit (ZAR26m).
Of all exports from South Africa to Kenya, the Western Cape exports, 97.8% of the grape wines 87% of fruit juices
and 81% prepared foods obtained by the swelling or roasting of cereals.
Prepared foods was the leading import product into the Western Cape from Kenya valued at ZAR2.2m, 41% of
South Africa’s imports. The second largest import from Kenya to the Western Cape were Leguminous vegetables,
(ZAR1.6m), followed by Cabbages, cauliflowers, kohlrabi, kale (ZAR1.3m). The Western Cape imports 10% of food
and beverages imported by South Africa.
2004 2005 2006 2007 2008 2009 2010 2011 2012 2013 2014
Exports (ZARm) 4.8 55.3 59.9 78.7 110.8 348.5 154.9 150.0 170.6 236.2 274.0
EImports (ZARm) 3.2 4.2 1.9 3.1 4.5 4.2 8.9 3.0 14.1 5.6 8.6
Trade balance (ZARm) 1.6 51.1 58.1 75.7 106.4 344.3 146.0 147.0 156.6 230.6 265.4
0.0
50.0
100.0
150.0
200.0
250.0
300.0
350.0
400.0
Valu
e (
ZA
Rm
)
WESTERN CAPE TRADE OF FOOD & BEVERAGES WITH KENYA, 2004-2014

15
WESTERN CAPE’S EXPORTS OF FOOD & BEVERAGES TO KENYA, 2014
WESTERN CAPE’S IMPORTS OF FOOD & BEVERAGES FROM KENYA, 2014
RANK PRODUCT VALUE
2014 (ZARm)
GROWTH 2010-2014
RANK PRODUCT VALUE
2014 (ZARm)
GROWTH 2010-2014
1 Apples, pears and quinces, fresh 91.6 25.60% 1 Prepared foods obtained by the swelling or roasting of cereals
2.2 #DIV/0!
2 Undenatured ethyl alcohol; spirits, liqueurs
88.8 28.66% 2 Other vegetables, fresh or chilled
1.8 55.51%
3 Citrus fruit, fresh or dried 25.9 5.35% 3 Leguminous vegetables 1.6 62.94%
4 Fruit juices 13.1 25.12% 4 Cabbages, cauliflowers, kohlrabi, kale
1.3 491.35%
5 Grapes, fresh or dried 9.6 7.33% 5 Coffee 0.9 620.00%
6 Food preparations nes 8.5 39.79% 6 Jams, fruit jellies, marmalades, fruit or nut pureé
0.7 #DIV/0!
7 Preparations of a kind used in animal feeding
7.0 39.95% 7 Vegetables frozen 0.14 #DIV/0!
8 Sugar confectionery 6.0 52.11% 8 Tea, whether or not flavoured 0.03 17.59%
9 Prepared foods obtained by the swelling or roasting of cereals o
4.9 149.93% 9 - -
-
10 Sauces and preparations 3.5 14.68% 10 - - -
TOTAL EXPORTS 274 1.89% TOTAL IMPORTS 8.6 81.45%
Source: Quantec, 2016
Other fresh fruit was the fastest growing export products in the short term (2013 to 2014), growing at 332% followed
by food preparations and malt preparations, food preparations of flour growing at 130% and 75% respectively. In
the medium term (2010-2014), the fastest growing export product category was also other fresh fruit at 489%
growth.
Source: Quantec, 2016
-19.01%
-9.75%
11.89%
28.06%
29.31%
30.25%
36.83%
38.29%
48.47%
51.27%
51.63%
74.91%
129.65%
332.03%
14.68%
5.35%
39.79%
7.33%
25.12%
52.11%
50.38%
28.66%
26.16%
149.93%
39.86%
295.41%
39.95%
488.80%
-100% 0% 100% 200% 300% 400% 500% 600%
Prepared foods obtained by the swelling or roasting ofcereals
Undenatured ethyl alcohol; spirits, liqueurs
Grapes, fresh or dried
Fruit juices
Citrus fruit, fresh or dried
Preparations of a kind used in animal feeding
Ginger, saffron, turmeric (curcuma), thyme, bay leaves, curry
Apples, pears and quinces, fresh
Sauces and preparations
Sugar confectionery
Other fermented beverages
Malt extract; food preparations of flour, groats, meal, starch
Food preparations nes
Other fruit, fresh
GROWTH OF WESTERN CAPE EXPORTS OF FOOD & BEVERAGES TO KENYA, 2010-2014
2010-2014 2013-2014

16
3.4 Trade Regulations Markings and Standards
Currently there is no FTA between South Africa and Kenya.
In October 2008, SADC joined with the Common Market for Eastern and Southern Africa and the East African
Community to form the African Free Trade Zone, including all members of each of the organizations including
South Africa and Kenya. The African Free Trade Zone, consists of 26 countries with a GDP of an estimated
USD624bn. It is expected to become operational in 2018.
3.4.1. Standards
The Kenya Bureau of Standards (KEBS) is the government regulatory body under Kenya's Ministry of Trade
mandated to develop and ensure compliance with the International Standards Organization (ISO) product
standards. The National Environment Management Authority, under the Ministry of Environment and Natural
Resources, the Department of Public Health, and the Ministry of Health are all government organisations that
develop environmental and public health standards in partnership with KEBS.
The Kenya Plant Health Inspectorate Service (KEPHIS) deals with the certification of all imported plant materials
as well as implementing sanitary & phytosanitary requirements.
3.4.2. Labelling
Special labelling is required for certain goods including condensed milk, vegetables, and butter. Weights and
measure indicators must be in metric form or display both metric and imperial units. Manufacturers are required to
indicate the date of manufacture and expiry on the labels of consumable products.
3.5 Tariffs for South African food and beverages
Kenya imposes the highest tariffs on the import of sugars and sugar confectionary from South Africa at 71.9%. This
is followed by dairy products, eggs, honey and other edible animal product with an imposed tariff of 53.1%.
TARIFFS IMPOSED BY KENYA TO SOUTH AFRICAN FOOD AND BEVERAGE IMPORTS
HS CODE
PRODUCT EQUIVALENT AD
VALOREM TARIFF
02 Meat and edible meat offal 25
03 Fish, crustaceans, molluscs, aquatic invertebrates nes 25
04 Dairy products, eggs, honey, edible animal product nes 53.1
07 Edible vegetables and certain roots and tubers 25
08 Edible fruit, nuts, peel of citrus fruit, melons 24.9
09 Coffee, tea, mate and spices 25
10 Cereals 24
11 Milling products, malt, starches, inulin, wheat gluten 34.1
15 Animal,vegetable fats and oils, cleavage products, etc 13.3
16 Meat, fish and seafood food preparations nes 25
17 Sugars and sugar confectionery 71.9
18 Cocoa and cocoa preparations 11.6
19 Cereal, flour, starch, milk preparations and products 21.4
20 Vegetable, fruit, nut, etc food preparations 25
21 Miscellaneous edible preparations 15.3
22 Beverages, spirits and vinegar 25
Source: TradeMap, 2016

17
The excise duty for alcoholic beverages in Kenya according to the Kenyan treasury (2015) are as follows:
Whiskies, rum, gin and geneva, vodka cordials and distilled spirits like Konyagi and Uganda Waragi will
attract the highest tax rates, that is, Ksh120 per litre or 35 percent whichever is higher.
Beer will attract a tax of Ksh70 per litre or 50 percent per litre, whichever is higher.
Stout and porter beer made from malt and cider will be charged Ksh70 per litre or 50 percent whichever
is higher.
Wine and vermouth will be charges Ksh80 per litre or 50%.

18
4. FDI
4.1 Inward FDI into the Kenyan Food & Beverage Sector
Between January 2003 and August 2015 a total of 36 FDI projects were recorded into the Kenyan food and
beverage sector. These projects represent a total capital investment of ZAR8bn which is an average investment
of ZAR223m per project. During the period, a total of 6,839 jobs were created. Kenya is a net recipient of investment
in this sector.
Source: FDI Intelligence, 2016
The United States was the leading source market for Kenya’s food and beverage sector investments with 9
investment projects representing a capital investment of ZAR2.2bn from 2003 to August 2015, followed by Egypt
and Switzerland with 4 investment projects each. South Africa was the 6th largest global source market for inward
FDI into the Kenya’s food and beverage sector.
GLOBAL FDI INTO KENYA’S FOOD, BEVERAGE & TOBACCO SECTORS, 2003- AUGUST 2015
RANK SOURCE COUNTRY PROJECTS % PROJECTS CAPEX (ZARm) % CAPEX COMPANIES
1 United States 10 27.78% 3 109 38.75% 6
2 Egypt 4 11.11% 412 5.14% 1
3 Switzerland 4 11.11% 677 8.44% 2
4 France 2 5.56% 211 2.63% 2
5 Netherlands 2 5.56% 326 4.06% 2
6 South Africa 2 5.56% 366 4.56% 2
7 UAE 2 5.56% 389 4.85% 1
8 UK 2 5.56% 176 2.19% 2
9 Bermuda 1 2.78% 223 2.78% 1
10 China 1 2.78% 27 0.34% 1
TOTAL 36 100.0 8 022 100.0 26
Source: FDI Intelligence, 2016
Coca-Cola was the largest investor into Kenya’s beverage, food and tobacco sector, with 5 projects worth
ZAR1.7bn. In November 2014 it was announced that Switzerland-based food company Nestlé's (3rd) Kenyan unit
had partnered with Coffee Management Services (CMS) to boost coffee yields and crop production in the country.
Nestlé and CMS will implement the programme in the rural counties of Kiambu, Murang'a, Kirinyaga, Nyeri, Embu
and Meru (BMI Research, 2015).
2003 2004 2005 2006 2008 2009 2010 2011 2012 2013 2014 2015
Capex (ZARm) 306 469 1 640 274 702 141 443 1 059 223 1 105 764 898
Projects 4 3 1 2 2 2 2 2 1 10 5 2
2
4
6
8
10
12
0
200
400
600
800
1 000
1 200
1 400
1 600
1 800
Pro
jects
Valu
e (
ZA
Rm
)
INWARD FDI INTO KENYA'S FOOD & BEVERAGE SECTOR, 2003-AUGUST 2015

19
COMPANIES INVESTING INTO KENYA’S FOOD & BEVERAGE SECTOR, 2003-AUGUST 2015
INVESTING COMPANY ACTIVITY PROJECTS CAPEX (ZARbn)
Coca-Cola United States 5 1 717
Wadi Egypt 4 412
Nestle Switzerland 3 562
Majid Al Futtaim Group (MAF Group) UAE 2 389
Asia Plantation Capital Singapore 1 197
Bacardi Bermuda 1 223
British American Tobacco (BAT) United Kingdom 1 73
Carrefour France 1 195
Clarion Merchandise Italy 1 37
Coca-Cola Sabco South Africa 1 293
TOTAL FROM TOP 10 INVESTORS 36 8 022
Source: FDI Intelligence, 2016
4.2 Outward FDI
Between January 2003 and August 2015 a total of 33 FDI projects were recorded into the food and beverage sector
by Kenya. These projects represent a total capital investment of ZAR6.88bn which is an average investment of
ZAR209m per project. During the period, a total of 6,329 jobs were created.
Source: FDI Intelligence, 2016
2003 2005 2006 2008 2010 2011 2012 2013 2014 2015
Capex (ZARm) 422 117 223 1 073 184 867 1 503 1 619 389 480
Projects 1 1 1 5 1 4 8 7 2 3
1
2
3
4
5
6
7
8
9
0
200
400
600
800
1 000
1 200
1 400
1 600
1 800
Pro
jects
Valu
e (
ZA
Rm
)
KENYA'S OUTWARD FDI INTO FOOD & BEVERAGE SECTOR, 2003-AUGUST 2015

20
Uganda was the largest destination FDI market for food and beverages from Kenya from 2003 to August 2015,
followed by Tanzania and Rwanda with 8 investment projects and 3 investment projects each. Approximately 91%
of all investments outward of Kenya were to fellow East African markets.
OUTWARD FDI FROM KENYA INTO THE FOOD, BEVERAGE & TOBACCO SECTOR, 2003- AUGUST 2015
RANK DESTINATION COUNTRY PROJECTS % PROJECTS CAPEX (ZARm) % CAPEX COMPANIES
1 Uganda 15 45.45% 2 822.6 41.04% 8
2 Tanzania 8 24.24% 1 452.9 21.12% 3
3 Rwanda 3 9.09% 448.8 6.52% 2
4 South Sudan 3 9.09% 583.5 8.48% 2
5 Ethiopia 1 3.03% 194.5 2.83% 1
6 Germany 1 3.03% 421.8 6.13% 1
7 India 1 3.03% 301.1 4.38% 1
8 Nigeria 1 3.03% 652.6 9.49% 1
TOTAL 33 100.0 6 877.9 100.0 11
Source: FDI Intelligence, 2016
The food and beverages stores subsector received the largest investments from Kenya both in terms of projects
(76% share) and capex (63% share) from 2003 to August 2015. This was followed by fruit and vegetables and
dairy products.
Source: FDI Intelligence, 2016
75.76%
9.09%
6.06%
6.06%
3.03%
62.69%
14.63%
13.61%
5.83%
3.24%
0% 10% 20% 30% 40% 50% 60% 70% 80%
Food & Beverage Stores
Fruits & vegetables & specialist foods
Dairy products
Grains & oilseed
Breweries & distilleries
KENYA OUTWARD FDI INTO THE FOOD & BEVERAGE SECTOR BY SUBSECTORS, 2003-AUGUST 2015
% Capex % Projects

21
Uchumi Supermarkets was the largest investor from Kenya accounting for 36% of all projects from 2003 to August
2015, followed by Nakumatt Holdings with 27% share.
COMPANIES INVESTING FROM KENYA INTO THE FOOD & BEVERAGE SECTOR, 2003-AUGUST 2015
INVESTING COMPANY PROJECTS CAPEX (ZARbn)
Uchumi Supermarkets 12 2 277
Nakumatt Holdings 9 1 257
Naivas Supermarket 4 778
Bidco Oil Refineries (BIDCO) 1 284
BIDCO Uganda 1 117
Brookside Dairy 1 653
Kenn Foods 1 422
Kenya Maltings 1 223
SAMEER Agriculture and Livestock Limited (SALL)
1 284
Sameer Group 1 284
TOTAL FROM TOP 10 INVESTORS 33 6 878
Source: FDI Intelligence, 2016
4.3 Bilateral FDI between South Africa and Kenya
Between January 2003 and August 2015 a total of 2 FDI projects were recorded from South Africa into Kenya’s
food and beverage sector. These projects represent a total capital investment of ZAR365.57m which is an average
investment of ZAR182.79m per project. During the period, a total of 360 jobs were created.
FDI FROM SOUTH AFRICA INTO THE KENYAN FOOD & BEVERAGES SECTOR, 2003- AUG 2015
DATE INVESTING COMPANY SOURCE
PROVINCE INDUSTRY SECTOR
SUB-SECTOR INDUSTRY ACTIVITY
VALUE (ZARm)
Aug 2004 Nutro Manufacturing EPZ Gauteng Food & Tobacco Grains & oilseed Manufacturing 72.65
May 2004 Coca-Cola Sabco Eastern Cape Beverages Soft drinks & ice Manufacturing 292.93
Source: FDI Intelligence, 2016
There was no FDI from Kenya into the South African food and beverages sector.
There was no inward investment into the food and beverage sector from Kenya into the Western Cape, nor was
there outward investment from the Western Cape to Kenya.
For more information on this publication and other Wesgro publications please contact [email protected] or for more
publications visit the Wesgro publications portal on our website at http://wesgro.co.za/publications