kentuckyretirementsystems b t r q m d ecember r … action items/12... · hazardous, cers...
TRANSCRIPT

*Board Action required
KENTUCKY RETIREMENT SYSTEMSBOARD OF TRUSTEES
REGULAR QUARTERLY MEETING
DECEMBER 17, 2018 AT 9:00 A.M., ET(ORIGINALLY SCHEDULED FOR DECEMBER 6, 2018)
1270 LOUISVILLE ROAD, FRANKFORT, KENTUCKY 40601
1. Roll Call
2. Approval of Minutes – November 8, 2018*
3. Public Comment
4. Actuarial Valuations- GRS/ Ms. Karen Roggenkamp
∑ Approval of GRS Actuarial Valuations for Year Ending June 30, 2018*
∑ Fiscal Year 2020 Contribution Rates for CERS HAZ and CERS Non-HAZ*
5. Retiree Health Care Committee Report- Mr. David Rich
6. Audit Committee Report- Mr. John Chilton/ Ms. Kristen Coffey
∑ Ratify Audit Committee’s Approval Audited Financial Statements for Year Ending June 30, 2018*
∑ Ratify Audit Committee’s Approval of the Comprehensive Annual Report (CAFR) for Year Ending June 30, 2018*
7. Investment Committee and Investment Portfolio Quarterly Report*- Mr. Neil Ramsey
8. Legislative Issues Update- Mr. David Eager
9. KRS Retirement Trends/Informational Update- Mr. David Eager
10. Creation of Investment Committee Advisory Role*- Mr. Mark Blackwell/Mr. David Eager
11. Closed Session [Pending or Proposed Litigation KRS 61.810(1)(c)]
12. Adjourn
Board Meeting- December 17, 2018 - Agenda
1

MINUTES OF MEETING #419 BOARD OF TRUSTEES KENTUCKY RETIREMENT SYSTEMS
MEETING NOVEMBER 8, 2018 AT 10:00A.M. 1270 LOUISVILLE ROAD, FRANKFORT, KENTUCKY 40601
At a Regular Meeting of the Board of Trustees held on November 8, 2018 the following members
were present: David Harris (Chair), Joe Brothers, John Chilton, Raymond Connell (arrived at
10:14), Kelly Downard, John Farris, JT Fulkerson, David Gallagher, Sherry Kremer, Keith Peercy,
Jerry Powell, Neil Ramsey, David Rich, and Sec. Thomas Stephens. Staff members present were
David Eager, Karen Roggenkamp, Mark Blackwell, Erin Surratt, Connie Davis, Kristen Coffey,
Connie Pettyjohn, Katherine Rupinen, Joseph Bowman, Shaun Case, Shawn Sparks, Jared
Crawford, D’Juan Surratt, Elizabeth Smith and Alane Foley. Also present were Michele Hill,
Shellie Hampton, Steve Starkweather, Paul Stropkay, Janie Shaw (GRS) and Danny White (GRS).
***
Mr. Harris called the meeting to order.
Ms. Alane Foley called roll.
***
Mr. Harris introduced agenda item Approval of Minutes- September 13, 2018. Mr. Peercy moved
and was seconded by Secretary Stephens to approve the minutes as presented. The motion passed
unanimously.
***
Mr. Harris announced that the December 6, 2018 Board Meeting would be moved to December
17, 2018 at 10:00 a.m.
It was also announced that the Investment Committee will be conducting a CIO search. Mr. Rich
Robben will now be the Director of Investments overseeing Fixed Income.
***
Mr. Harris introduced agenda item Draft 2018 Actuarial Valuations. Ms. Karen Roggenkamp
introduced Ms. Janie Shaw and Mr. Danny White from GRS. They provided an overview of the
actuarial valuations including valuations for KERS, CERS and SPRS. A presentation detailing
the upcoming experience study was also provided. These were provided for informational
purposes only.
Board Meeting- December 17, 2018 - Approval of Minutes- November 8, 2018
2

2
***
Mr. Harris introduced agenda item Audit Committee Report.
Ms. Karen Roggenkamp provided information on Hazardous Duty Position Requests. Mr. Powell
moved and was seconded by Ms. Pendergrass to approve the position requests. The motion passed
unanimously.
Ms. Karen Roggenkamp provided an overview of the Financial Statements. This was for
informational purposes only.
***
Mr. Harris introduced agenda item Legislative Update. Mr. David Eager discussed the following
with the Board Members; Housekeeping bill, level dollar funding, compensation for Board
Members and electronic balloting.
***
Mr. D’Juan Surratt provided an educational presentation on the Employer Reporting, Compliance
and Education Division.
***
Mr. Harris introduced agenda item Closed Session. Mr. Powell moved and was seconded by Ms.
Kremer to go in to closed session. The motion passed unanimously.
Mr. Harris read the following statement and the meeting moved into closed session: A motion
having been made in open session to move into closed session for a specific purpose, and such
motion having carried by majority vote in open, public session, the Board shall now enter closed
session to consider litigation, pursuant to KRS 61.810(1)(c), because of the necessity of protecting
the confidentiality of the Systems’ litigation strategy and preserving any available attorney-client
privilege. All public attendees exited the meeting.
Mr. Harris called the meeting back in to open session.
Board Meeting- December 17, 2018 - Approval of Minutes- November 8, 2018
3

3
***
There being no further business, a motion was made, seconded and carried to adjourn the meeting
at 12:35 p.m. to meet again on December 17, 2018 or upon the call of the Executive Director or
the Chair of the Board of Trustees.
***
Copies of all documents presented are incorporated as part of the Minutes of the Board of Trustees
as of November 8, 2018
The remainder of this page is intentionally blank.
Board Meeting- December 17, 2018 - Approval of Minutes- November 8, 2018
4

4
CERTIFICATION
I do certify that I was present at this meeting, and I have recorded the above actions of the Directors
on the various items considered by it at this meeting. Further, I certify that all requirements of
KRS 61.805-61.850 were met in conjunction with this meeting.
________________________________ Recording Secretary
We, the Chair of the Board of Directors of the Kentucky Retirement Systems and Executive
Director of the Kentucky Retirement Systems, do certify that the Minutes of Meeting Number 419,
held on November 8, 2018, were approved on December 17, 2018.
________________________________ Chair of the Board of Directors
________________________________ Executive Director
I have reviewed the Minutes of the November 8, 2018 Board of Trustees Meeting for content,
form, and legality.
________________________________ Executive Director
Office of Legal Services
Board Meeting- December 17, 2018 - Approval of Minutes- November 8, 2018
5

Copyright © 2018 GRS – All rights reserved.
Kentucky Retirement Systems
Janie Shaw, ASA, MAAA Danny White, FSA, EA, MAAA
2018 Actuarial Valuation Results November 8, 2018
Board Meeting- December 17, 2018 - Actuarial Valuations- GRS/ Ms. Karen Roggenkamp
6

Agenda • Summary of Valuation Results
– Comments on valuation results
– Demographic experience
– Contribution rates and funded status
• Projection Information for Pension and Insurance – Unfunded liability and funded ratio
– Contribution dollars and rate of pay
• Closing Comments on 2018 Valuation Results
• Experience Study Process and Timeline
2
Board Meeting- December 17, 2018 - Actuarial Valuations- GRS/ Ms. Karen Roggenkamp
7

Comment on KERS Non-Haz Retirement Fund
• Imperative to maintain or increase contribution effort for the KERS Non-Hazardous Retirement Fund – Current assets cover two years of benefit payments
June 30, 2018 assets were $2,004 million (excluding the 401(h) assets)
Benefit payments for the 2018 fiscal year were $981 million
• Expected FY 2019 employer and member contributions are $1,031 million
3
Board Meeting- December 17, 2018 - Actuarial Valuations- GRS/ Ms. Karen Roggenkamp
8

Comments on Valuation Results • There were no assumption changes since the prior valuation • Legislation and benefit changes
– HB 185: Provided increased benefits for members who die in the line of duty
– HB 265: Maintain FY 2019 contribution rate at 49.47% for Regional Mental Health/Mental Retardation Boards, Local and District Health Departments, State Universities, Community Colleges and any other agency in KERS 114 entities representing approximately 25% of covered payroll
– HB 362: Phase-in the contribution rates for CERS – SB 151: Not reflected in the 2018 actuarial valuation (currently in
appeals in the State Supreme Court)
4
Board Meeting- December 17, 2018 - Actuarial Valuations- GRS/ Ms. Karen Roggenkamp
9

Comments on Valuation Results (continued) • Investment return was 7.4% to 9.3% (return varies by fund)
– $410 million more in plan assets than expected ($279 million for pension and $131 million for insurance funds)
– Recognized in the contribution rates over the next five-years
• Change in active membership and covered payroll – Active membership declined in all five systems
– Covered payroll decreased in both KERS Systems, and the CERS Haz
– Small change in covered payroll for CERS Non-Haz and SPRS
5
Board Meeting- December 17, 2018 - Actuarial Valuations- GRS/ Ms. Karen Roggenkamp
10

Comments on Valuation Results (continued) • Retirement fund liability experience
– $196 million loss for all retirement funds combined
– 0.4% to 0.6% of liability loss for KERS and CERS funds, and a 2.0% of liability loss for SPRS
• Insurance fund liability experience – Lower than expected health insurance premiums for 2019 resulting
in liability gains and slightly lower than forecasted contribution rates
– $989 million liability gain (9% to 11% of liability gain) $940 million of which is due to the premium experience
6
Board Meeting- December 17, 2018 - Actuarial Valuations- GRS/ Ms. Karen Roggenkamp
11
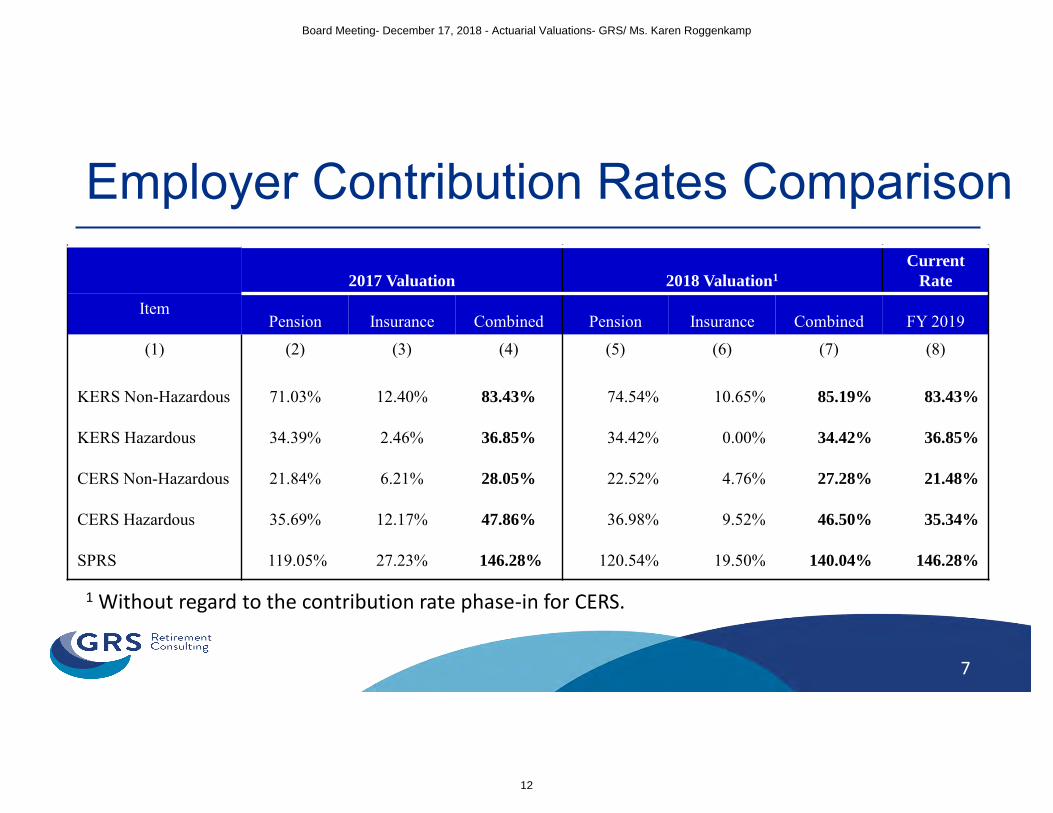
Employer Contribution Rates Comparison
2017 Valuation 2018 Valuation1
Current
Rate
Item Pension Insurance Combined Pension Insurance Combined FY 2019
(1) (2) (3) (4) (5) (6) (7) (8)
KERS Non-Hazardous 71.03% 12.40% 83.43% 74.54% 10.65% 85.19% 83.43%
KERS Hazardous 34.39% 2.46% 36.85% 34.42% 0.00% 34.42% 36.85%
CERS Non-Hazardous 21.84% 6.21% 28.05% 22.52% 4.76% 27.28% 21.48%
CERS Hazardous 35.69% 12.17% 47.86% 36.98% 9.52% 46.50% 35.34%
SPRS 119.05% 27.23% 146.28% 120.54% 19.50% 140.04% 146.28%
1 Without regard to the contribution rate phase-in for CERS.
7
Board Meeting- December 17, 2018 - Actuarial Valuations- GRS/ Ms. Karen Roggenkamp
12
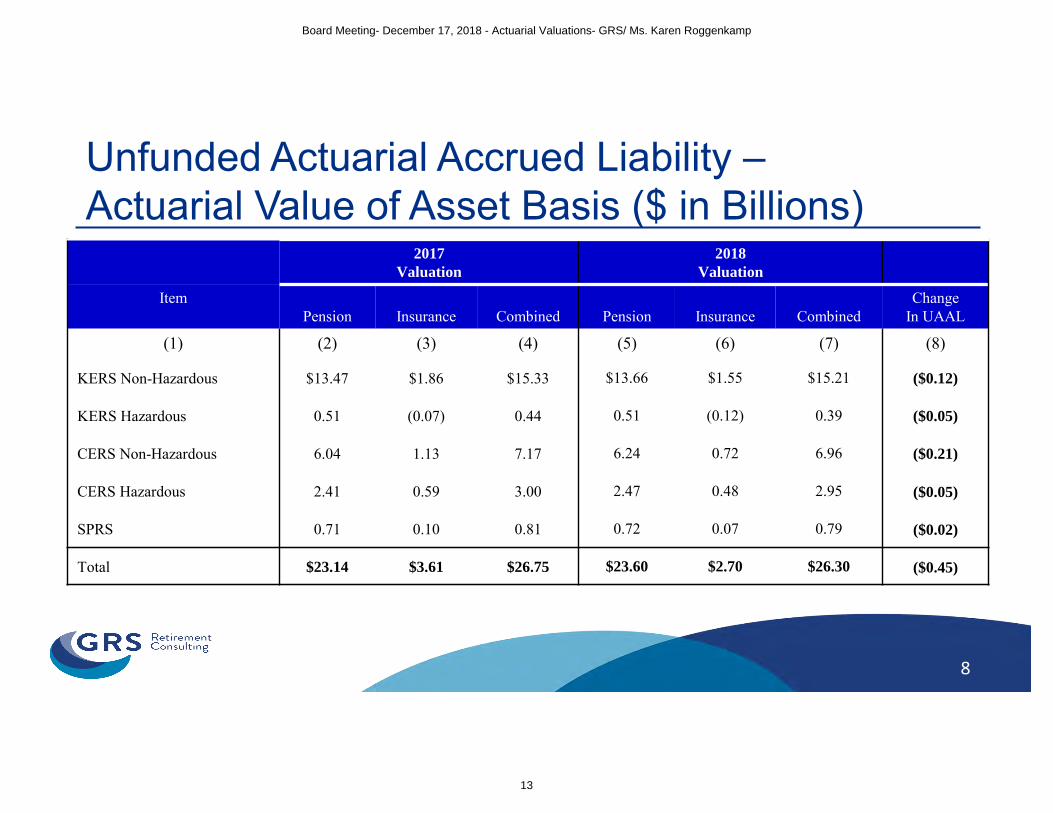
Unfunded Actuarial Accrued Liability – Actuarial Value of Asset Basis ($ in Billions)
2017
Valuation
2018
Valuation
Item Pension Insurance Combined Pension Insurance Combined
Change In UAAL
(1) (2) (3) (4) (5) (6) (7) (8)
KERS Non-Hazardous $13.47 $1.86 $15.33 $13.66 $1.55 $15.21 ($0.12)
KERS Hazardous 0.51 (0.07) 0.44 0.51 (0.12) 0.39 ($0.05)
CERS Non-Hazardous 6.04 1.13 7.17 6.24 0.72 6.96 ($0.21)
CERS Hazardous 2.41 0.59 3.00 2.47 0.48 2.95 ($0.05)
SPRS 0.71 0.10 0.81 0.72 0.07 0.79 ($0.02)
Total $23.14 $3.61 $26.75 $23.60 $2.70 $26.30 ($0.45)
8
Board Meeting- December 17, 2018 - Actuarial Valuations- GRS/ Ms. Karen Roggenkamp
13

Active Membership Count
9
82,198
81,818
37,234
35,139
0
10,000
20,000
30,000
40,000
50,000
60,000
70,000
80,000
90,000
2009 2010 2011 2012 2013 2014 2015 2016 2017 2018
Me
mb
ers
hip
Co
un
t
YearCERS Non-Hazardous KERS Non-Hazardous
9,495
9,263
4,047
3,929
903 886
0
2,000
4,000
6,000
8,000
10,000
12,000
2009 2010 2011 2012 2013 2014 2015 2016 2017 2018M
em
be
rsh
ip C
ou
nt
YearCERS Hazardous KERS Hazardous SPRS
(5.6% Decrease)
(0.5% Decrease)
(2.4% Decrease)
(2.9% Decrease)
(1.9% Decrease)
Board Meeting- December 17, 2018 - Actuarial Valuations- GRS/ Ms. Karen Roggenkamp
14

Covered Payroll ($ in Millions)
10
$2,452
$2,467
$1,532
$1,471
$0
$500
$1,000
$1,500
$2,000
$2,500
$3,000
2009 2010 2011 2012 2013 2014 2015 2016 2017 2018
Co
vere
d P
ayro
ll
YearCERS Non-Hazardous KERS Non-Hazardous
$542 $534
$162 $158
$49 $49
$0
$100
$200
$300
$400
$500
$600
2009 2010 2011 2012 2013 2014 2015 2016 2017 2018C
ove
red
Pay
roll
YearCERS Hazardous KERS Hazardous SPRS
(0.6% Increase)
(3.9% Decrease)
(0.4% Increase)
(1.5% Decrease)
(2.6% Decrease)
Board Meeting- December 17, 2018 - Actuarial Valuations- GRS/ Ms. Karen Roggenkamp
15

Retired Membership Count
11
8,998
9,587
4,093 4,370
1,536 1,600
0
2,000
4,000
6,000
8,000
10,000
2009 2010 2011 2012 2013 2014 2015 2016 2017 2018M
em
be
rsh
ip C
ou
nt
YearCERS Hazardous KERS Hazardous SPRS
Board Meeting- December 17, 2018 - Actuarial Valuations- GRS/ Ms. Karen Roggenkamp
16

Benefit Distributions ($ in Millions)
12
960 981
702
741
$0
$200
$400
$600
$800
$1,000
2009 2010 2011 2012 2013 2014 2015 2016 2017 2018
FYE
Be
ne
fit
Dis
trib
uti
on
Fiscal Year EndKERS Non-Hazardous CERS Non-Hazardous
229
248
63 68
57 59
$0
$50
$100
$150
$200
$250
2009 2010 2011 2012 2013 2014 2015 2016 2017 2018
FYE
Be
ne
fit
Dis
trib
uti
on
Fisal Year EndCERS Hazardous KERS Hazardous SPRS
Board Meeting- December 17, 2018 - Actuarial Valuations- GRS/ Ms. Karen Roggenkamp
17

Funding Results – KERS ($ in millions) NonHazardous System Hazardous System
Pension Insurance Pension Insurance
Item 2018 2017 2018 2017 2018 2017 2018 2017
(1) (2) (3) (4) (5) (6) (7) (8) (9)
Total Normal Cost Rate 12.25% 12.45% 2.83% 3.06% 16.62% 17.10% 5.73% 6.40%
Member Rate (5.00%) (5.00%) (0.40%) (0.35%) (8.00%) (8.00%) (0.58%) (0.52%)
Employer Normal Cost Rate 7.25% 7.45% 2.43% 2.71% 8.62% 9.10% 5.15% 5.88%
Administrative Expenses 0.73% 0.72% 0.05% 0.06% 0.62% 0.57% 0.07% 0.06%
Amortization Cost 66.56% 62.86% 8.17% 9.63% 25.18% 24.72% (6.09%) (3.48%)
Total Employer Contribution Rate 74.54% 71.03% 10.65% 12.40% 34.42% 34.39% 0.00% 2.46%
Actuarial Accrued Liability $15,675 $15,592 $2,436 $2,683 $1,152 $1,121 $393 $419
Actuarial Value of Assets 2,019 2,124 887 824 639 607 511 493
Unfunded Actuarial Accrued Liability
$13,656 $13,468 $1,548 $1,859 $513 $514 ($118) ($74)
Funded Ratio 12.9% 13.6% 36.4% 30.7% 55.5% 54.1% 130.0% 117.6%
Board Meeting- December 17, 2018 - Actuarial Valuations- GRS/ Ms. Karen Roggenkamp
18

Funding Results – CERS ($ in millions) NonHazardous System Hazardous System
Pension Insurance Pension Insurance
Item 2018 2017 2018 2017 2018 2017 2018 2017
(1) (2) (3) (4) (5) (6) (7) (8) (9)
Total Normal Cost Rate 10.01% 10.05% 3.32% 3.57% 14.07% 14.52% 4.74% 5.38%
Member Rate (5.00%) (5.00%) (0.46%) (0.41%) (8.00%) (8.00%) (0.41%) (0.35%)
Employer Normal Cost Rate 5.01% 5.05% 2.86% 3.16% 6.07% 6.52% 4.33% 5.03%
Administrative Expenses 0.79% 0.80% 0.03% 0.03% 0.28% 0.26% 0.07% 0.07%
Amortization Cost 16.72% 15.99% 1.87% 3.02% 30.63% 28.91% 5.12% 7.07%
Total Employer Contribution Rate 22.52% 21.84% 4.76% 6.21% 36.98% 35.69% 9.52% 12.17%
Actuarial Accrued Liability $13,191 $12,804 $3,093 $3,355 $4,793 $4,649 $1,684 $1,788
Actuarial Value of Assets 6,950 6,765 2,371 2,227 2,322 2,238 1,256 1,197
Unfunded Actuarial Accrued Liability
$6,241 $6,039 $721 $1,128 $2,471 $2,411 $428 $592
Funded Ratio 52.7% 52.8% 76.7% 66.4% 48.4% 48.1% 74.6% 66.9%
Board Meeting- December 17, 2018 - Actuarial Valuations- GRS/ Ms. Karen Roggenkamp
19

Funding Results – SPRS ($ in millions) Pension Insurance
Item 2018 2017 2018 2017
(1) (2) (3) (4) (5)
Total Normal Cost Rate 23.41% 23.84% 8.29% 11.48%
Member Rate (8.00%) (8.00%) (0.35%) (0.30%)
Employer Normal Cost Rate 15.41% 15.84% 7.94% 11.18%
Administrative Expenses 0.40% 0.37% 0.13% 0.14%
Amortization Cost 104.73% 102.84% 11.43% 15.91%
Total Employer Contribution Rate 120.54% 119.05% 19.50% 27.23%
Actuarial Accrued Liability $989 $967 262 277
Actuarial Value of Assets 268 261 188 180
Unfunded Actuarial Accrued Liability $721 $706 $74 $96
Funded Ratio 27.1% 27.0% 71.6% 65.2%
15
Board Meeting- December 17, 2018 - Actuarial Valuations- GRS/ Ms. Karen Roggenkamp
20

Projection Information Pension and Insurance
16
Board Meeting- December 17, 2018 - Actuarial Valuations- GRS/ Ms. Karen Roggenkamp
21

KERS Non-Hazardous Pension Insurance
0%
10%
20%
30%
40%
50%
60%
70%
80%
90%
$-
$2,000
$4,000
$6,000
$8,000
$10,000
$12,000
$14,000
2018 2020 2022 2024 2026 2028 2030 2032 2034 2036
Fun
de
d R
atio
Un
fun
de
d L
iab
ility
($
in M
illio
ns)
Year
Unfunded Liability and Funded Ratio
Unfunded Liability Funded Ratio
0%
10%
20%
30%
40%
50%
60%
70%
80%
$-
$300
$600
$900
$1,200
$1,500
2019 2021 2023 2025 2027 2029 2031 2033 2035 2037
Co
ntr
ibu
tio
n R
ate
Co
ntr
ibu
tio
ns
($ in
Mill
ion
s)
Fiscal Year Ending June 30,
Contribution Dollars and Rate of Pay
Employer Contributions $ Employer Contributions %
0%
10%
20%
30%
40%
50%
60%
70%
80%
90%
$-
$2,000
$4,000
$6,000
$8,000
$10,000
$12,000
$14,000
2018 2020 2022 2024 2026 2028 2030 2032 2034 2036
Fun
de
d R
atio
Un
fun
de
d L
iab
ility
($
in M
illio
ns)
Year
Unfunded Liability and Funded Ratio
Unfunded Liability Funded Ratio
0%
10%
20%
30%
40%
50%
60%
70%
80%
$-
$300
$600
$900
$1,200
$1,500
2019 2021 2023 2025 2027 2029 2031 2033 2035 2037
Co
ntr
ibu
tio
n R
ate
Co
ntr
ibu
tio
ns
($ in
Mill
ion
s)
Fiscal Year Ending June 30,
Contribution Dollars and Rate of Pay
Employer Contributions $ Employer Contributions %
Board Meeting- December 17, 2018 - Actuarial Valuations- GRS/ Ms. Karen Roggenkamp
22

KERS Non-Hazardous – Alternative Scenario Constant Future Membership 2% Annual Membership Decline
0%
10%
20%
30%
40%
50%
60%
70%
80%
90%
$-
$2,000
$4,000
$6,000
$8,000
$10,000
$12,000
$14,000
2018 2020 2022 2024 2026 2028 2030 2032 2034 2036
Fun
de
d R
atio
Un
fun
de
d L
iab
ility
($
in M
illio
ns)
Year
Unfunded Liability and Funded Ratio
Unfunded Liability Funded Ratio
0%
10%
20%
30%
40%
50%
60%
70%
80%
90%
$-
$2,000
$4,000
$6,000
$8,000
$10,000
$12,000
$14,000
2018 2020 2022 2024 2026 2028 2030 2032 2034 2036
Fun
de
d R
atio
Un
fun
de
d L
iab
ility
($
in M
illio
ns)
Year
Unfunded Liability and Funded Ratio
Unfunded Liability Funded Ratio
0%
10%
20%
30%
40%
50%
60%
70%
80%
$-
$300
$600
$900
$1,200
$1,500
2019 2021 2023 2025 2027 2029 2031 2033 2035 2037
Co
ntr
ibu
tio
n R
ate
Co
ntr
ibu
tio
ns
($ in
Mill
ion
s)
Fiscal Year Ending June 30,
Contribution Dollars and Rate of Pay
Employer Contributions $ Employer Contributions %
0%
10%
20%
30%
40%
50%
60%
70%
80%
$-
$300
$600
$900
$1,200
$1,500
2019 2021 2023 2025 2027 2029 2031 2033 2035 2037
Co
ntr
ibu
tio
n R
ate
Co
ntr
ibu
tio
ns
($ in
Mill
ion
s)
Fiscal Year Ending June 30,
Contribution Dollars and Rate of Pay
Employer Contributions $ Employer Contributions %
Board Meeting- December 17, 2018 - Actuarial Valuations- GRS/ Ms. Karen Roggenkamp
23

KERS Hazardous Pension Insurance
0%
20%
40%
60%
80%
100%
120%
140%
$(200)
$(100)
$-
$100
$200
$300
$400
$500
$600
2018 2020 2022 2024 2026 2028 2030 2032 2034 2036
Fun
de
d R
atio
Un
fun
de
d L
iab
ility
($
in M
illio
ns)
Year
Unfunded Liability and Funded Ratio
Unfunded Liability Funded Ratio
0%
20%
40%
60%
80%
100%
120%
140%
$(200)
$(100)
$-
$100
$200
$300
$400
$500
$600
2018 2020 2022 2024 2026 2028 2030 2032 2034 2036
Fun
de
d R
atio
Un
fun
de
d L
iab
ility
($
in M
illio
ns)
Year
Unfunded Liability and Funded Ratio
Unfunded Liability Funded Ratio
0%
5%
10%
15%
20%
25%
30%
35%
40%
$-
$10
$20
$30
$40
$50
$60
$70
2019 2021 2023 2025 2027 2029 2031 2033 2035 2037
Co
ntr
ibu
tio
n R
ate
Co
ntr
ibu
tio
ns
($ in
Mill
ion
s)
Fiscal Year Ending June 30,
Contribution Dollars and Rate of Pay
Employer Contributions $ Employer Contributions %
0%
5%
10%
15%
20%
25%
30%
35%
40%
$-
$10
$20
$30
$40
$50
$60
$70
2019 2021 2023 2025 2027 2029 2031 2033 2035 2037
Co
ntr
ibu
tio
n R
ate
Co
ntr
ibu
tio
ns
($ in
Mill
ion
s)
Fiscal Year Ending June 30,
Contribution Dollars and Rate of Pay
Employer Contributions $ Employer Contributions %
Board Meeting- December 17, 2018 - Actuarial Valuations- GRS/ Ms. Karen Roggenkamp
24

CERS Non-Hazardous Pension Insurance
0%
5%
10%
15%
20%
25%
$-
$100
$200
$300
$400
$500
$600
$700
$800
2019 2021 2023 2025 2027 2029 2031 2033 2035 2037
Co
ntr
ibu
tio
n R
ate
Co
ntr
ibu
tio
ns
($ in
Mill
ion
s)
Fiscal Year Ending June 30,
Contribution Dollars and Rate of Pay
Employer Contributions $ Employer Contributions %
0%
20%
40%
60%
80%
100%
$-
$1,000
$2,000
$3,000
$4,000
$5,000
$6,000
$7,000
2018 2020 2022 2024 2026 2028 2030 2032 2034 2036
Fun
de
d R
atio
Un
fun
de
d L
iab
ility
($
in M
illio
ns)
Year
Unfunded Liability and Funded Ratio
Unfunded Liability Funded Ratio
0%
5%
10%
15%
20%
25%
$-
$100
$200
$300
$400
$500
$600
$700
$800
2019 2021 2023 2025 2027 2029 2031 2033 2035 2037
Co
ntr
ibu
tio
n R
ate
Co
ntr
ibu
tio
ns
($ in
Mill
ion
s)
Fiscal Year Ending June 30,
Contribution Dollars and Rate of Pay
Employer Contributions $ Employer Contributions %
0%
20%
40%
60%
80%
100%
$-
$1,000
$2,000
$3,000
$4,000
$5,000
$6,000
$7,000
2018 2020 2022 2024 2026 2028 2030 2032 2034 2036
Fun
de
d R
atio
Un
fun
de
d L
iab
ility
($
in M
illio
ns)
Year
Unfunded Liability and Funded Ratio
Unfunded Liability Funded Ratio
Board Meeting- December 17, 2018 - Actuarial Valuations- GRS/ Ms. Karen Roggenkamp
25

CERS Hazardous Pension Insurance
0%
20%
40%
60%
80%
100%
$-
$500
$1,000
$1,500
$2,000
$2,500
$3,000
2018 2020 2022 2024 2026 2028 2030 2032 2034 2036
Fun
de
d R
atio
Un
fun
de
d L
iab
ility
($
in M
illio
ns)
Year
Unfunded Liability and Funded Ratio
Unfunded Liability Funded Ratio
0%
10%
20%
30%
40%
50%
$-
$50
$100
$150
$200
$250
$300
2019 2021 2023 2025 2027 2029 2031 2033 2035 2037
Co
ntr
ibu
tio
n R
ate
Co
ntr
ibu
tio
ns
($ in
Mill
ion
s)
Fiscal Year Ending June 30,
Contribution Dollars and Rate of Pay
Employer Contributions $ Employer Contributions %
0%
10%
20%
30%
40%
50%
$-
$50
$100
$150
$200
$250
$300
2019 2021 2023 2025 2027 2029 2031 2033 2035 2037
Co
ntr
ibu
tio
n R
ate
Co
ntr
ibu
tio
ns
($ in
Mill
ion
s)
Fiscal Year Ending June 30,
Contribution Dollars and Rate of Pay
Employer Contributions $ Employer Contributions %
0%
20%
40%
60%
80%
100%
$-
$500
$1,000
$1,500
$2,000
$2,500
$3,000
2018 2020 2022 2024 2026 2028 2030 2032 2034 2036
Fun
de
d R
atio
Un
fun
de
d L
iab
ility
($
in M
illio
ns)
Year
Unfunded Liability and Funded Ratio
Unfunded Liability Funded Ratio
Board Meeting- December 17, 2018 - Actuarial Valuations- GRS/ Ms. Karen Roggenkamp
26
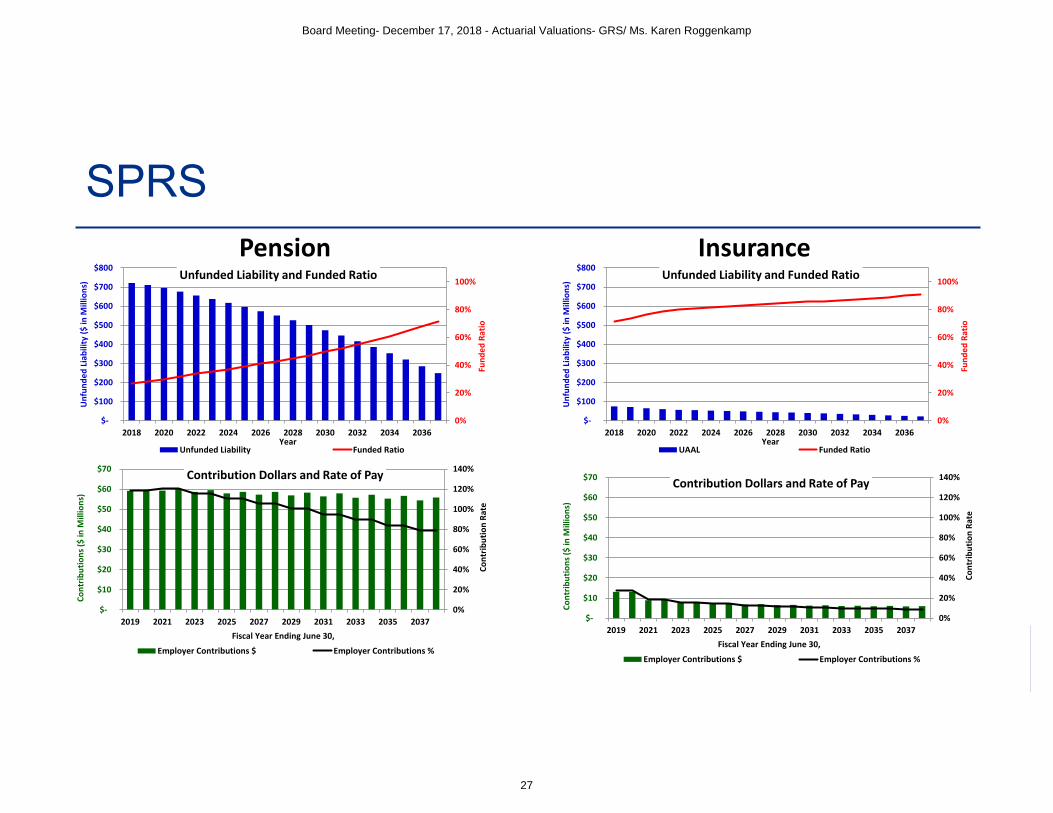
SPRS Pension Insurance
0%
20%
40%
60%
80%
100%
120%
140%
$-
$10
$20
$30
$40
$50
$60
$70
2019 2021 2023 2025 2027 2029 2031 2033 2035 2037
Co
ntr
ibu
tio
n R
ate
Co
ntr
ibu
tio
ns
($ in
Mill
ion
s)
Fiscal Year Ending June 30,
Contribution Dollars and Rate of Pay
Employer Contributions $ Employer Contributions %
0%
20%
40%
60%
80%
100%
$-
$100
$200
$300
$400
$500
$600
$700
$800
2018 2020 2022 2024 2026 2028 2030 2032 2034 2036
Fun
de
d R
atio
Un
fun
de
d L
iab
ility
($
in M
illio
ns)
Year
Unfunded Liability and Funded Ratio
UAAL Funded Ratio
0%
20%
40%
60%
80%
100%
$-
$100
$200
$300
$400
$500
$600
$700
$800
2018 2020 2022 2024 2026 2028 2030 2032 2034 2036
Fun
de
d R
atio
Un
fun
de
d L
iab
ility
($
in M
illio
ns)
Year
Unfunded Liability and Funded Ratio
Unfunded Liability Funded Ratio
0%
20%
40%
60%
80%
100%
120%
140%
$-
$10
$20
$30
$40
$50
$60
$70
2019 2021 2023 2025 2027 2029 2031 2033 2035 2037
Co
ntr
ibu
tio
n R
ate
Co
ntr
ibu
tio
ns
($ in
Mill
ion
s)
Fiscal Year Ending June 30,
Contribution Dollars and Rate of Pay
Employer Contributions $ Employer Contributions %
Board Meeting- December 17, 2018 - Actuarial Valuations- GRS/ Ms. Karen Roggenkamp
27

Closing Comments on 2018 Valuation Results • It is imperative the State and participating employers in the
Systems contribute the actuarial determined contribution in each future year to improve the System’s financial security
• We recommend KRS investigate into a method to allocate the amortization cost to participating employers that is not associated with covered payroll – Needed most for the KERS Non-Hazardous System
– Legislative action will be required.
23
Board Meeting- December 17, 2018 - Actuarial Valuations- GRS/ Ms. Karen Roggenkamp
28
Experience Study Process and Timing
24
Board Meeting- December 17, 2018 - Actuarial Valuations- GRS/ Ms. Karen Roggenkamp
29

25
Experience Study Process • Compare actual experience to current actuarial assumptions
and recommend changes to assumptions to better align with future expectations
• Review past experience over a given timeframe – Review will include experience of all five systems
– Identify how many members retired, terminated, became disabled, or died, including their age/service
– Identify salary increases received by active members
– Greater emphasis on forward-looking expectations for economic assumptions
Board Meeting- December 17, 2018 - Actuarial Valuations- GRS/ Ms. Karen Roggenkamp
30
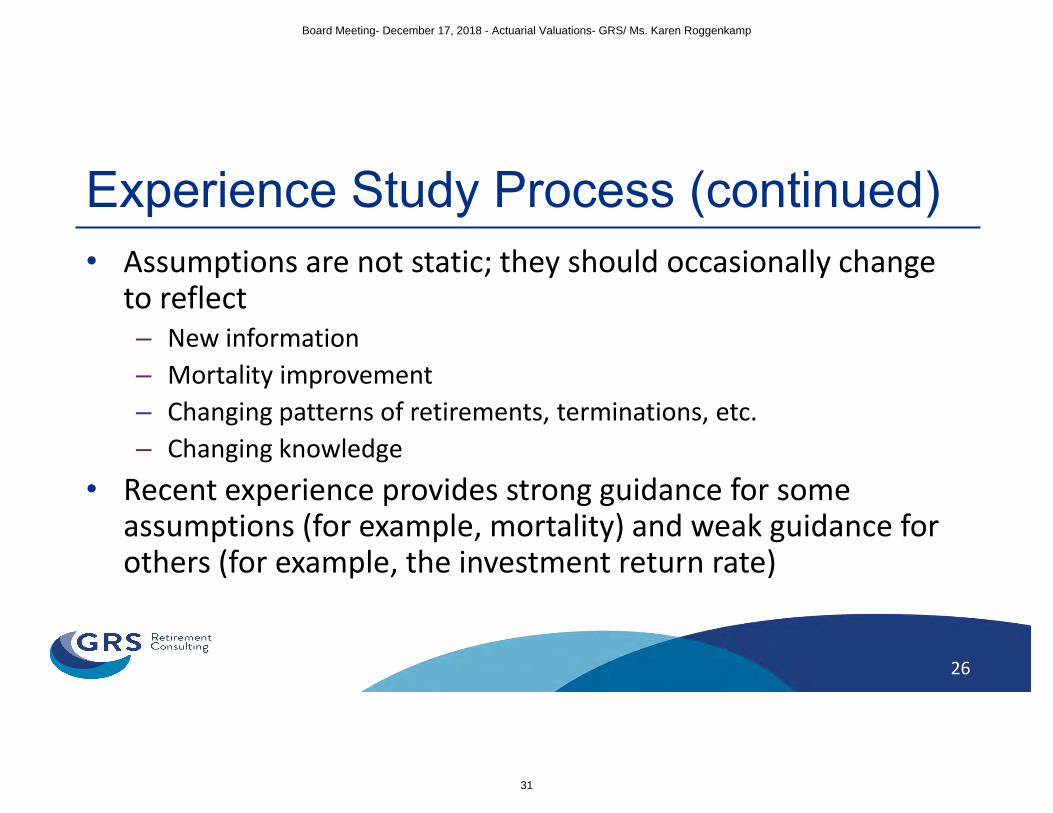
Experience Study Process (continued) • Assumptions are not static; they should occasionally change
to reflect – New information
– Mortality improvement
– Changing patterns of retirements, terminations, etc.
– Changing knowledge
• Recent experience provides strong guidance for some assumptions (for example, mortality) and weak guidance for others (for example, the investment return rate)
26
Board Meeting- December 17, 2018 - Actuarial Valuations- GRS/ Ms. Karen Roggenkamp
31

27
Mortality Assumption • An actuary makes two considerations in recommending a
mortality assumption: – Identify the current life expectancy (data dependent)
– Make an assumption about the rate of improvement in life expectancy (anticipated trends)
• Actuarial standards of practice require actuaries to include a margin for future improvement in life expectancy
Board Meeting- December 17, 2018 - Actuarial Valuations- GRS/ Ms. Karen Roggenkamp
32

28
Mortality Review Process • Review KRS mortality experience to identify the current life
expectancy (data dependent) – The number of observed deaths will dictate the credibility actual
experience Industry standards generally considers 1,000 observed deaths in a
5-year period to be fully credible
• Review the change in the life expectancy since the last experience study (anticipated trends) – Identify the appropriate assumption for future improvement in
mortality – Use a published improvement assumption
Board Meeting- December 17, 2018 - Actuarial Valuations- GRS/ Ms. Karen Roggenkamp
33

29
Mortality Rates by Geographic Location
Source: National Vital Statistics
Board Meeting- December 17, 2018 - Actuarial Valuations- GRS/ Ms. Karen Roggenkamp
34

Life Expectancy Assumption Comparison - Males
30
Board Meeting- December 17, 2018 - Actuarial Valuations- GRS/ Ms. Karen Roggenkamp
35
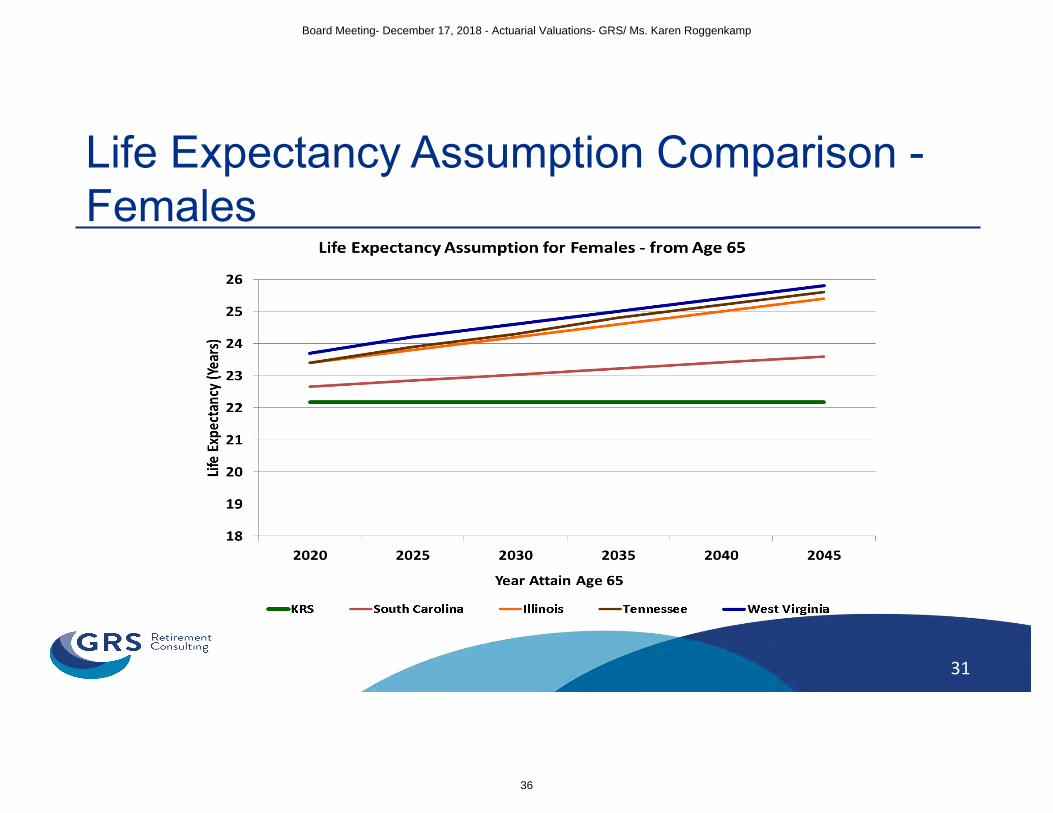
Life Expectancy Assumption Comparison - Females
31
Board Meeting- December 17, 2018 - Actuarial Valuations- GRS/ Ms. Karen Roggenkamp
36

32
KRS Experience Study Timing • GRS will provide the Board a report with the analysis and
recommendations in February or March 2019 – Board has the authority to adopt, reject, or modify the recommended
assumptions
• The Board adopted assumptions will be first used to perform the June 30, 2019 actuarial valuation – Determines the contribution requirements for the 2020/2021 fiscal year
Board Meeting- December 17, 2018 - Actuarial Valuations- GRS/ Ms. Karen Roggenkamp
37

Disclaimers • This presentation is intended to be used in conjunction with
the actuarial valuations as of June 30, 2018. This presentation should not be relied on for any purpose other than the purpose described in the valuation report.
• Readers are cautioned to examine original source materials and to consult with subject matter experts before making decisions related to the subject matter of this presentation.
• This presentation shall not be construed to provide tax advice, legal advice or investment advice.
33
Board Meeting- December 17, 2018 - Actuarial Valuations- GRS/ Ms. Karen Roggenkamp
38

October 31, 2018
Board of Trustees Kentucky Retirement Systems Perimeter Park West 1260 Louisville Road Frankfort, KY 40601
Subject: Certification of the June 30, 2018 Actuarial Valuation Results
Dear Trustees of the Board:
Enclosed are the June 30, 2018 actuarial valuation reports for the Kentucky Employees Retirement
System (KERS), the County Employees Retirement System (CERS), and the State Police Retirement
System (SPRS). These reports provide the current actuarial and financial condition of the Kentucky
Retirement Systems (KRS) and analyze fluctuations in the employer contribution rates since the
prior actuarial valuation.
Under Kentucky Statute, the Board must approve the employer contribution rates for the CERS Systems for the fiscal year beginning July 1, 2018 and ending June 30, 2019. The June 30, 2018 actuarial valuations for the KERS and SPRS were used by the Board for informational purposes only as the employer contribution rates for these systems were certified in the June 30, 2017 actuarial for the fiscal years ending June 30, 2019 and June 30, 2020.
These contribution rates are calculated based on the membership data and plan assets as of June
30, 2018. These calculations are also based on the benefit provisions in effect as of June 30, 2018.
If new legislation is enacted between the valuation date and the date the contribution rates
become effective, the Board may adjust the calculated rates for CERS to reflect this new legislation.
Such adjustments are based on information supplied by the actuary.
FINANCING OBJECTIVES AND FUNDING POLICY
KRS administers a pension and health insurance fund to provide for monthly retirement income and
retiree health insurance benefits. The total employer contribution rate is comprised of a
contribution to each respective fund.
The contribution rate for each fund consists of a normal cost that is net of employee contributions
and an amortization payment on the unfunded actuarial accrued liability (UAAL). In accordance
with Section 61.565 of Kentucky Statute, the amortization payment is based on a closed thirty-year
amortization period beginning July 1, 2013. As a result, the amortization period used in the 2018
actuarial valuation is 25 years. The amortization period used in subsequent actuarial valuations will
decrease by one each future year.
Board Meeting- December 17, 2018 - Actuarial Valuations- GRS/ Ms. Karen Roggenkamp
39
Board of Trustees October 31, 2018 Page 3
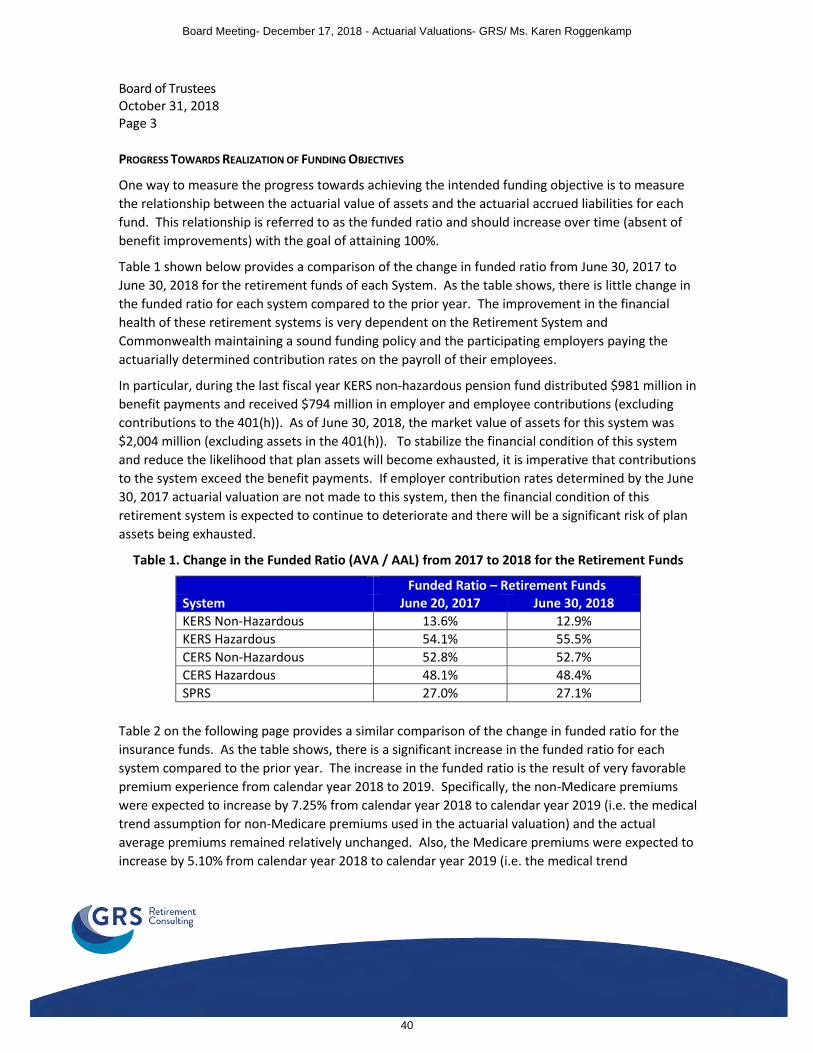
PROGRESS TOWARDS REALIZATION OF FUNDING OBJECTIVES
One way to measure the progress towards achieving the intended funding objective is to measure
the relationship between the actuarial value of assets and the actuarial accrued liabilities for each
fund. This relationship is referred to as the funded ratio and should increase over time (absent of
benefit improvements) with the goal of attaining 100%.
Table 1 shown below provides a comparison of the change in funded ratio from June 30, 2017 to
June 30, 2018 for the retirement funds of each System. As the table shows, there is little change in
the funded ratio for each system compared to the prior year. The improvement in the financial
health of these retirement systems is very dependent on the Retirement System and
Commonwealth maintaining a sound funding policy and the participating employers paying the
actuarially determined contribution rates on the payroll of their employees.
In particular, during the last fiscal year KERS non-hazardous pension fund distributed $981 million in
benefit payments and received $794 million in employer and employee contributions (excluding
contributions to the 401(h)). As of June 30, 2018, the market value of assets for this system was
$2,004 million (excluding assets in the 401(h)). To stabilize the financial condition of this system
and reduce the likelihood that plan assets will become exhausted, it is imperative that contributions
to the system exceed the benefit payments. If employer contribution rates determined by the June
30, 2017 actuarial valuation are not made to this system, then the financial condition of this
retirement system is expected to continue to deteriorate and there will be a significant risk of plan
assets being exhausted.
Table 1. Change in the Funded Ratio (AVA / AAL) from 2017 to 2018 for the Retirement Funds
Funded Ratio – Retirement Funds System June 20, 2017 June 30, 2018
KERS Non-Hazardous 13.6% 12.9%
KERS Hazardous 54.1% 55.5%
CERS Non-Hazardous 52.8% 52.7%
CERS Hazardous 48.1% 48.4%
SPRS 27.0% 27.1%
Table 2 on the following page provides a similar comparison of the change in funded ratio for the
insurance funds. As the table shows, there is a significant increase in the funded ratio for each
system compared to the prior year. The increase in the funded ratio is the result of very favorable
premium experience from calendar year 2018 to 2019. Specifically, the non-Medicare premiums
were expected to increase by 7.25% from calendar year 2018 to calendar year 2019 (i.e. the medical
trend assumption for non-Medicare premiums used in the actuarial valuation) and the actual
average premiums remained relatively unchanged. Also, the Medicare premiums were expected to
increase by 5.10% from calendar year 2018 to calendar year 2019 (i.e. the medical trend
Board Meeting- December 17, 2018 - Actuarial Valuations- GRS/ Ms. Karen Roggenkamp
40
Board of Trustees October 31, 2018 Page 4
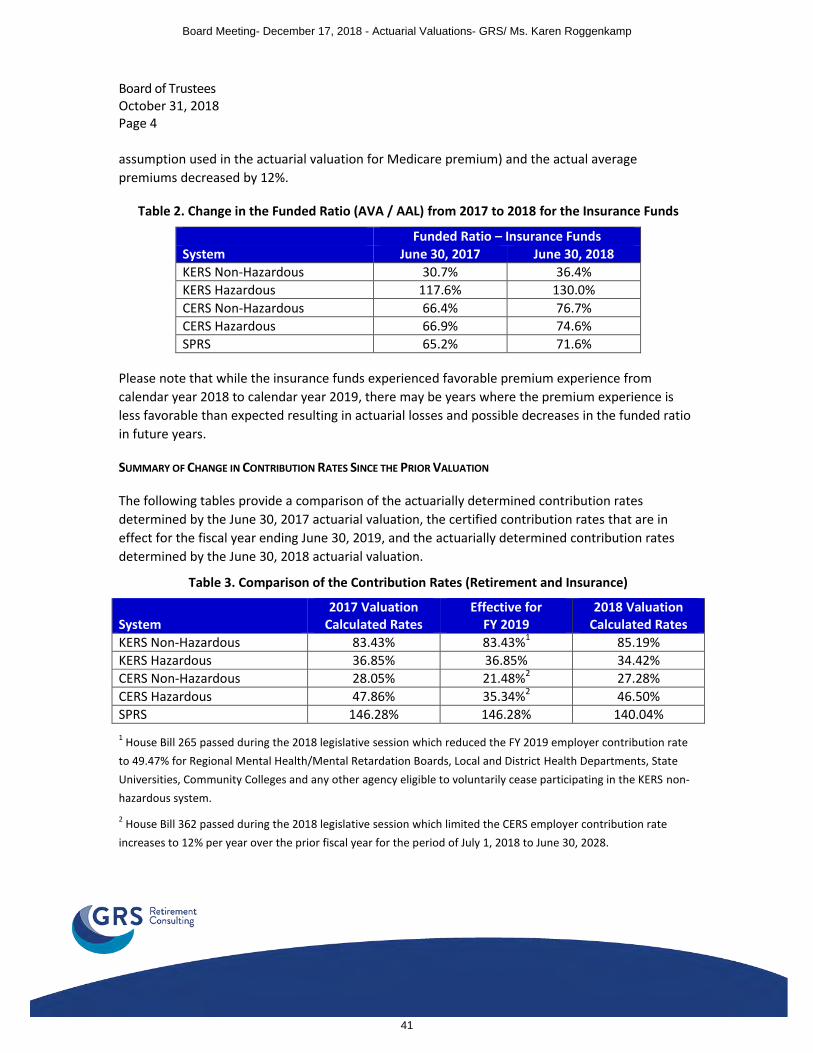
assumption used in the actuarial valuation for Medicare premium) and the actual average
premiums decreased by 12%.
Table 2. Change in the Funded Ratio (AVA / AAL) from 2017 to 2018 for the Insurance Funds
Funded Ratio – Insurance Funds System June 30, 2017 June 30, 2018
KERS Non-Hazardous 30.7% 36.4%
KERS Hazardous 117.6% 130.0%
CERS Non-Hazardous 66.4% 76.7%
CERS Hazardous 66.9% 74.6%
SPRS 65.2% 71.6%
Please note that while the insurance funds experienced favorable premium experience from
calendar year 2018 to calendar year 2019, there may be years where the premium experience is
less favorable than expected resulting in actuarial losses and possible decreases in the funded ratio
in future years.
SUMMARY OF CHANGE IN CONTRIBUTION RATES SINCE THE PRIOR VALUATION
The following tables provide a comparison of the actuarially determined contribution rates
determined by the June 30, 2017 actuarial valuation, the certified contribution rates that are in
effect for the fiscal year ending June 30, 2019, and the actuarially determined contribution rates
determined by the June 30, 2018 actuarial valuation.
Table 3. Comparison of the Contribution Rates (Retirement and Insurance)
System 2017 Valuation
Calculated Rates Effective for
FY 2019 2018 Valuation
Calculated Rates
KERS Non-Hazardous 83.43% 83.43%1 85.19%
KERS Hazardous 36.85% 36.85% 34.42%
CERS Non-Hazardous 28.05% 21.48%2 27.28%
CERS Hazardous 47.86% 35.34%2 46.50%
SPRS 146.28% 146.28% 140.04%
1 House Bill 265 passed during the 2018 legislative session which reduced the FY 2019 employer contribution rate
to 49.47% for Regional Mental Health/Mental Retardation Boards, Local and District Health Departments, State
Universities, Community Colleges and any other agency eligible to voluntarily cease participating in the KERS non-
hazardous system.
2 House Bill 362 passed during the 2018 legislative session which limited the CERS employer contribution rate
increases to 12% per year over the prior fiscal year for the period of July 1, 2018 to June 30, 2028.
Board Meeting- December 17, 2018 - Actuarial Valuations- GRS/ Ms. Karen Roggenkamp
41

Board of Trustees October 31, 2018 Page 4
The actuarially determined contribution rate for the KERS Non-Hazardous System increase by 1.76%
from the prior year primarily due to the 4.0% decrease in covered payroll. However, the expected
contribution dollars on the calculated contribution rates remain relatively unchanged from the prior
year (i.e. $1,277 million based on the 2017 valuation and $1,254 million based on the 2018
valuation). The actuarially determined contribution rates for the other four systems (i.e. KERS
Hazardous, CERS Non-Hazardous and Hazardous, and SPRS) slightly decreased due to the favorable
experience with the insurance funds.
Also note that while the actuarially determined contribution rates decreased for both CERS
Systems, the actual certified contribution rate will increase from fiscal year 2019 to fiscal year 2020
as the contribution rate increases due to the assumption changes from the June 30, 2017 valuation
are being phased-in in accordance with HB 362.
ASSUMPTIONS AND METHODS
There were no changes in the actuarial assumptions or methods since the last actuarial valuation. It
is our opinion that the current assumptions are internally consistent and reasonably reflect the
anticipated future experience of the System.
Kentucky Statutes require that an actuarial investigation be performed at least every five years to
review the economic and demographic assumptions. An experience study was conducted as of
June 30, 2013 and the next experience study will be conducted as of June 30, 2018 and the results
of that analysis will be first used to prepare the actuarial valuation as of June 30, 2019.
The results of the actuarial valuation are dependent on the actuarial assumptions used. Actual
results can, and almost certainly will, differ as actual experience deviates from the
assumptions. Even seemingly minor changes in the assumptions can materially change the
liabilities, calculated contribution rate, and funding periods. The actuarial calculations are intended
to provide information for rational decision making.
BENEFIT PROVISIONS
The benefit provisions reflected in these valuations are those which were in effect on June 30, 2018.
During the 2018 legislative session House Bill 185 was enacted which increased the benefit
provisions for active members who die in the line of duty. House Bill 265 reduced the FY 2019
employer contribution rate to 49.47% for Regional Mental Health/Mental Retardation Boards, Local
and District Health Departments, State Universities, Community Colleges and any other agency
eligible to voluntarily cease participating in the KERS. Also, House Bill 362 limits the increase in the
CERS employer contribution rate to 12% per year over the prior fiscal year for the period of July 1,
2018 to June 30, 2028.
This actuarial valuation was determined without regard to the enactment of SB 151 in 2018, which
is currently being reviewed by the State Supreme Court.
Board Meeting- December 17, 2018 - Actuarial Valuations- GRS/ Ms. Karen Roggenkamp
42

Board of Trustees October 31, 2018 Page 4
DATA
Member data for retired, active and inactive members was supplied as of June 30, 2018, by the KRS
staff. The staff also supplied asset information as of June 30, 2018. We did not audit this data, but
we did apply a number of tests to the data, and we concluded that it was reasonable and consistent
with the prior year's data. GRS is not responsible for the accuracy or completeness of the
information provided to us by KRS.
CERTIFICATION
We certify that the information presented herein is accurate and fairly portrays the actuarial
position of KERS as of June 30, 2018. All of our work conforms with generally accepted actuarial
principles and practices, and is in conformity with the Actuarial Standards of Practice issued by the
Actuarial Standards Board. In our opinion, our calculations also comply with the requirements of
Kentucky Code of Laws and, where applicable, the Internal Revenue Code, ERISA, and the
Statements of the Governmental Accounting Standards Board.
The undersigned are independent actuaries and consultants. Mr. Newton and Mr. White are Enrolled Actuaries. All three of the undersigned are Members of the American Academy of Actuaries and meet the Qualification Standards of the American Academy of Actuaries. All of the undersigned are experienced in performing valuations for large public retirement systems. Sincerely, Gabriel, Roeder, Smith & Co. Joseph P. Newton, FSA, MAAA, EA Daniel J. White, FSA, MAAA, EA Senior Consultant Senior Consultant Janie Shaw, ASA, MAAA Consultant
Board Meeting- December 17, 2018 - Actuarial Valuations- GRS/ Ms. Karen Roggenkamp
43

Kentucky Retirement Systems
Actuarial Valuation – June 30, 2018
Summary of
Results
5
Summary of June 30, 2018 Actuarial Valuation Results
Actuarially Determined Contribution:
Pension Fund Contribution 74.54% 34.42% 22.52% 36.98% 120.54%
Insurance Fund Contribution 10.65% 0.00% 4.76% 9.52% 19.50%
Total Calculated Employer Contribution 85.19% 34.42% 27.28% 46.50% 140.04%
Certified Contribution Rate for Fiscal Year Ending 20201 83.43% 36.85% 24.06% 39.58% 146.28%
Assets:
Retirement
• Actuarial value (AVAR) $2,019,277,832 $639,261,848 $6,950,225,236 $2,321,720,761 $268,258,835
• Market value (MVAR) $2,004,445,981 $645,484,989 $7,018,963,357 $2,348,336,623 $267,572,480
• Ratio of actuarial to market value of assets 100.7% 99.0% 99.0% 98.9% 100.3%
Insurance
• Actuarial value (AVAI) $887,121,270 $511,441,262 $2,371,430,361 $1,256,306,056 $187,535,217
• Market value (MVAI) $891,204,988 $519,072,283 $2,414,126,203 $1,280,981,973 $190,846,553
• Ratio of actuarial to market value of assets 99.5% 98.5% 98.2% 98.1% 98.3%
Funded Status:
Retirement
• Actuarial accrued liability $15,675,231,694 $1,151,922,950 $13,191,504,861 $4,792,547,709 $989,528,282
• Unfunded accrued liability on AVAR $13,655,953,862 $512,661,102 $6,241,279,625 $2,470,826,948 $721,269,447
• Funded ratio on AVAR 12.9% 55.5% 52.7% 48.4% 27.1%
• Unfunded accrued liability on MVAR $13,670,785,713 $506,437,961 $6,172,541,504 $2,444,211,086 $721,955,802
• Funded ratio on MVAR 12.8% 56.0% 53.2% 49.0% 27.0%
Insurance
• Actuarial accrued liability $2,435,505,788 $393,480,563 $3,092,623,449 $1,684,028,461 $262,088,421
• Unfunded accrued liability on AVAI $1,548,384,518 ($117,960,699) $721,193,088 $427,722,405 $74,553,204
• Funded ratio on AVAI 36.4% 130.0% 76.7% 74.6% 71.6%
• Unfunded accrued liability on MVAI $1,544,300,800 ($125,591,720) $678,497,246 $403,046,488 $71,241,868
• Funded ratio on MVAI 36.6% 131.9% 78.1% 76.1% 72.8%
Membership:
• Number of
- Active Members 35,139 3,929 81,818 9,263 886
- Retirees and Beneficiaries 46,526 4,370 61,938 9,587 1,600
- Inactive Members 50,435 5,727 87,160 3,067 499
- Total 132,100 14,026 230,916 21,917 2,985
• Projected payroll of active members $1,471,477,482 $158,212,710 $2,466,801,417 $533,617,790 $48,808,080
• Average salary of active members $41,876 $40,268 $30,150 $57,607 $55,088
1 Based on contribution rates budgeted in House Bill 200 for the KERS and SPRS systems and on a 12% increase in the certified contribution rates from fiscal year
ending 2019 in accordance with House Bill 362 for the CERS system
Non-Hazardous Hazardous Non-Hazardous Hazardous SPRS
KERS KERS CERS CERS
Board Meeting- December 17, 2018 - Actuarial Valuations- GRS/ Ms. Karen Roggenkamp
44

Kentucky Employees Retirement System (KERS) Actuarial Valuation Report as of June 30, 2018
Board Meeting- December 17, 2018 - Actuarial Valuations- GRS/ Ms. Karen Roggenkamp
45

October 31, 2018
Board of Trustees Kentucky Retirement Systems Perimeter Park West 1260 Louisville Road Frankfort, KY 40601
Subject: Actuarial Valuation as of June 30, 2018
Dear Trustees of the Board:
This report describes the current actuarial condition of the Kentucky Employees Retirement System
(KERS), provides the actuarially determined employer contribution rates for fiscal year ending June
30, 2020, and analyzes changes in the System’s financial condition. In addition, the report provides
various summaries of the data. The results of this actuarial valuation, including the calculated
employer contribution rates will be used by the Board and stakeholders for informational purposes
only as the employer contribution rate for the fiscal years ending June 30, 2019 and June 30, 2020
were certified in the June 30, 2017 actuarial valuation and adopted by the Board.
Separate reports are issued with regard to valuation results determined in accordance with
Governmental Accounting Standards Board (GASB) Statements 67, 68, 74 and 75. Results of this
report should not be used for any other purpose without consultation with the undersigned.
Valuations are prepared annually as of June 30, the first day of the plan year for KRS. This report
was prepared at the request of the Board of Trustees of the Kentucky Retirement System (Board)
and is intended for use by the KRS staff and those designated or approved by the Board.
FINANCING OBJECTIVES AND FUNDING POLICY
The employer contribution rate is determined in accordance with Section 61.565 of Kentucky
Statute. As specified by the Statute, the employer contribution rate is determined based on a closed
thirty-year amortization period beginning July 1, 2013. As a result, the amortization period used in
the 2018 actuarial valuation is 25 years. As noted above, the contribution rate determined by this
actuarial valuation is for informational purposes and may be useful in tracking the change in the
calculated contribution rate since the prior valuation performed as of June 30, 2017.
Board Meeting- December 17, 2018 - Actuarial Valuations- GRS/ Ms. Karen Roggenkamp
46

Kentucky Retirement Systems October 31, 2018 Page 2
ASSUMPTIONS AND METHODS
There were no changes in actuarial assumptions since the prior actuarial valuation. It is our opinion
that the current assumptions are internally consistent and reasonably reflect the anticipated future
experience of the System.
Kentucky Statutes also require that an actuarial investigation be performed at least every five years
to review the economic and demographic assumptions. An experience study was conducted as of
June 30, 2013 and the next experience study will be conducted as of June 30, 2018 and the Board
adopted assumptions as a result of that analysis will be first used to prepare the June 30, 2019
actuarial valuation. The Board also has the authority to review the assumptions on a more frequent
basis and adopt new assumptions prior to the next scheduled experience study.
The results of the actuarial valuation are dependent on the actuarial assumptions used. Actual
results can, and almost certainly will, differ as actual experience deviates from the
assumptions. Even seemingly minor changes in the assumptions can materially change the
liabilities, calculated contribution rate, and funding periods. The actuarial calculations are intended
to provide information for rational decision making.
BENEFIT PROVISIONS
The benefit provisions reflected in these valuations are those which were in effect on June 30, 2018.
During the 2018 legislative session House Bill 185 was enacted which increased the benefit
provisions for active members who die in the line of duty. House Bill 265 maintained the FY 2019
employer contribution rate at 49.47% for Regional Mental Health/Mental Retardation Boards, Local
and District Health Departments, State Universities, Community Colleges and any other agency
eligible to voluntarily cease participating in the KERS non-hazardous retirement and insurance
funds.
This actuarial valuation was determined without regard to the enactment of SB 151 in 2018, which
is currently being reviewed by the State Supreme Court.
DATA
Member data for retired, active and inactive members was supplied as of June 30, 2018, by the KRS
staff. The staff also supplied asset information as of June 30, 2018. We did not audit this data, but
we did apply a number of tests to the data, and we concluded that it was reasonable and consistent
with the prior year's data. GRS is not responsible for the accuracy or completeness of the
information provided to us by KRS.
Board Meeting- December 17, 2018 - Actuarial Valuations- GRS/ Ms. Karen Roggenkamp
47

Kentucky Retirement Systems October 31, 2018 Page 3
CERTIFICATION
We certify that the information presented herein is accurate and fairly portrays the actuarial
position of KERS as of June 30, 2018.
All of our work conforms with generally accepted actuarial principles and practices, and is in
conformity with the Actuarial Standards of Practice issued by the Actuarial Standards Board. In our
opinion, our calculations also comply with the requirements of Kentucky Code of Laws and, where
applicable, the Internal Revenue Code, ERISA, and the Statements of the Governmental Accounting
Standards Board.
The undersigned are independent actuaries and consultants. Mr. Newton and Mr. White are
Enrolled Actuaries. All three of the undersigned are Members of the American Academy of
Actuaries and meet the Qualification Standards of the American Academy of Actuaries. All of the
undersigned are experienced in performing valuations for large public retirement systems.
Sincerely, Gabriel, Roeder, Smith & Co. Joseph P. Newton, FSA, MAAA, EA Daniel J. White, FSA, MAAA, EA Senior Consultant Senior Consultant Janie Shaw, ASA, MAAA Consultant
Board Meeting- December 17, 2018 - Actuarial Valuations- GRS/ Ms. Karen Roggenkamp
48

Kentucky Employees Retirement System
Actuarial Valuation – June 30, 2018
I
Table of Contents
Page
Section 1 Executive Summary ....................................................................................................... 2
Section 2 Discussion ...................................................................................................................... 7
Section 3 Actuarial Tables ........................................................................................................... 16
Section 4 Membership Information ........................................................................................... 40
Appendix A Actuarial Assumptions and Methods
Appendix B Benefit Provisions
Appendix C Glossary
Board Meeting- December 17, 2018 - Actuarial Valuations- GRS/ Ms. Karen Roggenkamp
49

SECTION 1
EXECUTIVE SUMMARY
Board Meeting- December 17, 2018 - Actuarial Valuations- GRS/ Ms. Karen Roggenkamp
50
Kentucky Employees Retirement System
Actuarial Valuation – June 30, 2018
Section 1 2
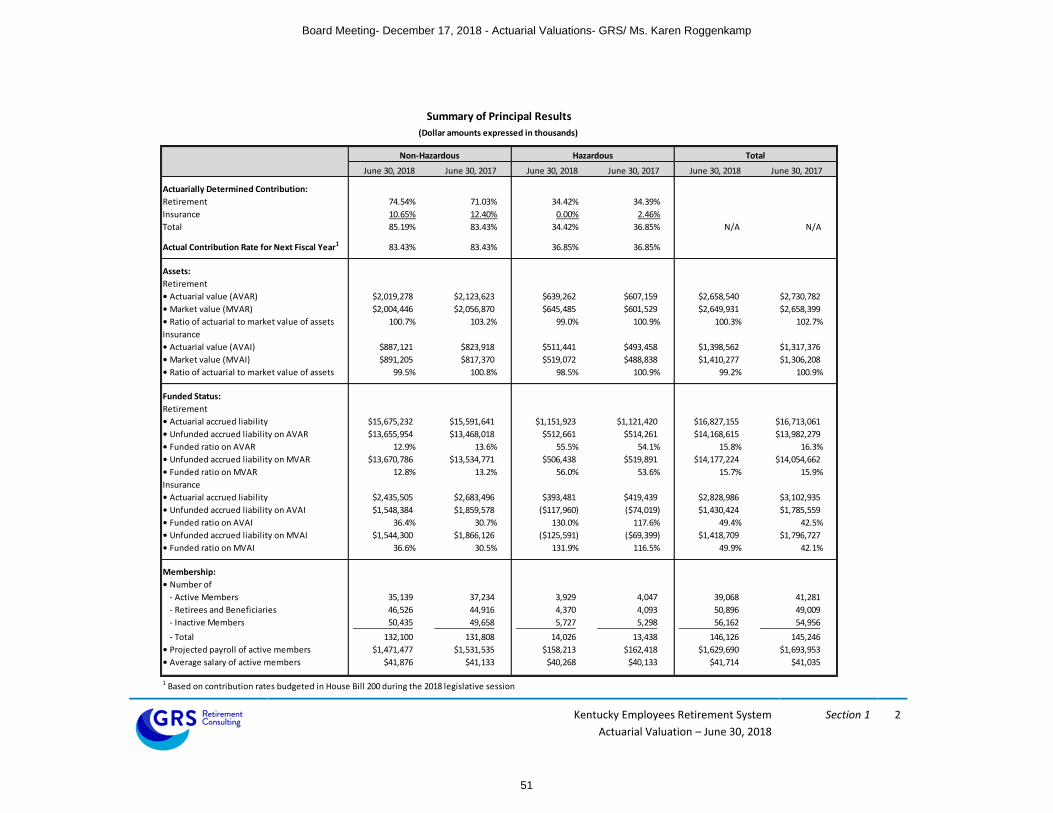
Summary of Principal Results Summary of Principal Results
(Dollar amounts expressed in thousands) (Dollar amounts expressed in thousands)
Actuarially Determined Contribution:
Retirement 74.54% 71.03% 34.42% 34.39%
Insurance 10.65% 12.40% 0.00% 2.46%
Total 85.19% 83.43% 34.42% 36.85% N/A N/A
Actual Contribution Rate for Next Fiscal Year1 83.43% 83.43% 36.85% 36.85%
Assets:
Retirement
• Actuarial value (AVAR) $2,019,278 $2,123,623 $639,262 $607,159 $2,658,540 $2,730,782
• Market value (MVAR) $2,004,446 $2,056,870 $645,485 $601,529 $2,649,931 $2,658,399
• Ratio of actuarial to market value of assets 100.7% 103.2% 99.0% 100.9% 100.3% 102.7%
Insurance
• Actuarial value (AVAI) $887,121 $823,918 $511,441 $493,458 $1,398,562 $1,317,376
• Market value (MVAI) $891,205 $817,370 $519,072 $488,838 $1,410,277 $1,306,208
• Ratio of actuarial to market value of assets 99.5% 100.8% 98.5% 100.9% 99.2% 100.9%
Funded Status:
Retirement
• Actuarial accrued liability $15,675,232 $15,591,641 $1,151,923 $1,121,420 $16,827,155 $16,713,061
• Unfunded accrued liability on AVAR $13,655,954 $13,468,018 $512,661 $514,261 $14,168,615 $13,982,279
• Funded ratio on AVAR 12.9% 13.6% 55.5% 54.1% 15.8% 16.3%
• Unfunded accrued liability on MVAR $13,670,786 $13,534,771 $506,438 $519,891 $14,177,224 $14,054,662
• Funded ratio on MVAR 12.8% 13.2% 56.0% 53.6% 15.7% 15.9%
Insurance
• Actuarial accrued liability $2,435,505 $2,683,496 $393,481 $419,439 $2,828,986 $3,102,935
• Unfunded accrued liability on AVAI $1,548,384 $1,859,578 ($117,960) ($74,019) $1,430,424 $1,785,559
• Funded ratio on AVAI 36.4% 30.7% 130.0% 117.6% 49.4% 42.5%
• Unfunded accrued liability on MVAI $1,544,300 $1,866,126 ($125,591) ($69,399) $1,418,709 $1,796,727
• Funded ratio on MVAI 36.6% 30.5% 131.9% 116.5% 49.9% 42.1%
Membership:
• Number of
- Active Members 35,139 37,234 3,929 4,047 39,068 41,281
- Retirees and Beneficiaries 46,526 44,916 4,370 4,093 50,896 49,009
- Inactive Members 50,435 49,658 5,727 5,298 56,162 54,956
- Total 132,100 131,808 14,026 13,438 146,126 145,246
• Projected payroll of active members $1,471,477 $1,531,535 $158,213 $162,418 $1,629,690 $1,693,953
• Average salary of active members $41,876 $41,133 $40,268 $40,133 $41,714 $41,035
1 Based on contribution rates budgeted in House Bill 200 during the 2018 legislative session
Non-Hazardous Hazardous Total
June 30, 2018 June 30, 2017 June 30, 2018 June 30, 2017 June 30, 2018 June 30, 2017
Board Meeting- December 17, 2018 - Actuarial Valuations- GRS/ Ms. Karen Roggenkamp
51

Kentucky Employees Retirement System
Actuarial Valuation – June 30, 2018
Section 1 3
Executive Summary (Continued)
Non-Hazardous Retirement Fund
The unfunded actuarial accrued liability for the non-hazardous retirement fund increased by $0.188 billion
since the prior year’s valuation to $13.656 billion. The largest source of this increase includes the FY 2018
contribution effort being $0.099 billion less than the interest on the prior year’s unfunded actuarial accrued
liability (i.e. negative amortization of $0.099 billion), followed by a $0.066 increase due to a liability
experience. Below is a chart with the historical actuarial value of assets and actuarial accrued liability for
the non-hazardous fund. The divergence in the assets and liability over the last eight years has generally
been due to a combination of: (i) actual contribution rates being insufficient to completely finance the
interest on the unfunded actuarial accrued liability, (ii) the actual investment experience being less than the
return assumption, and (iii) a decrease in the assumed rate of return in 2015, 2016 and again in 2017.
2011 2012 2013 2014 2015 2016 2017 2018
AAL 11.2 11.4 11.4 11.6 12.4 13.2 15.6 15.7
AVA 3.7 3.1 2.6 2.4 2.4 2.1 2.1 2.0
$0
$2
$4
$6
$8
$10
$12
$14
$16
$18
History of Actuarial Assets vs. Actuarial Accrued Liability (Dollars in Billions)
For FY 2018, the KERS non-hazardous pension system distributed $981 million in benefit payments and
received $794 million in employer and employee contributions (excluding contributions to the 401(h)). As
of June 30, 2018, the market value of assets for this system was $2,004 million (excluding assets in the
401(h)). To stabilize the financial condition of this system and reduce the likelihood that plan assets will
become exhausted, it is imperative that contributions to the system exceed the benefit payments. To
stabilize the financial condition of this system and reduce the likelihood that plan assets will become
exhausted, it is imperative that contributions to the system exceed the benefit payments. If employer
contribution amounts determined by the June 30, 2017 actuarial valuation are not made to this system,
then the financial condition of this retirement system is expected to continue to deteriorate and there will
be a significant risk of plan assets being exhausted.
Board Meeting- December 17, 2018 - Actuarial Valuations- GRS/ Ms. Karen Roggenkamp
52

Kentucky Employees Retirement System
Actuarial Valuation – June 30, 2018
Section 1 4
Executive Summary (Continued)
Hazardous Retirement Fund
The unfunded actuarial accrued liability for the hazardous retirement fund decreased by $1.6 million
since the prior year’s valuation to $512.7 million. The largest source of this decrease includes a $1.9
million gain due to realized investment experience. Below is a chart with the historical actuarial value
of assets and actuarial accrued liability for the hazardous retirement fund. The divergence in the assets
and liability over the last eight years has generally been due to a combination of: (i) actual contribution
rates being insufficient to finance, or pay down the unfunded actuarial accrued liability, (ii) the actual
investment experience being less than the fund’s expected investment return assumption, and (iii) a
decrease in the assumed rate of return in 2015 and again in 2017.
2011 2012 2013 2014 2015 2016 2017 2018
AAL 0.7 0.8 0.8 0.8 0.9 0.9 1.1 1.2
AVA 0.5 0.5 0.5 0.5 0.6 0.6 0.6 0.6
$0.0
$0.2
$0.4
$0.6
$0.8
$1.0
$1.2
History of Actuarial Assets vs. Actuarial Accrued Liability (Dollars in Billions)
Board Meeting- December 17, 2018 - Actuarial Valuations- GRS/ Ms. Karen Roggenkamp
53

Kentucky Employees Retirement System
Actuarial Valuation – June 30, 2018
Section 1 5
Executive Summary (Continued)
Summary of Change in Financial Condition of the Insurance Funds
Both the Non-Hazardous and Hazardous Insurance funds experience extremely favorable premium
experience from calendar year 2018 to 2019. Specifically, the non-Medicare premiums were expected
to increase by 7.25% from calendar year 2018 to calendar year 2019 (i.e. the medical trend assumption
for non-Medicare premiums used in the actuarial valuation) and the actual average premiums remained
relatively unchanged. Also, the Medicare premiums were expected to increase by 5.10% from calendar
year 2018 to calendar year 2019 (i.e. the medical trend assumption used in the actuarial valuation for
Medicare premium) and the actual average premiums decreased by 12%.
Non-Hazardous Insurance Fund
Since the prior year’s valuation, the unfunded actuarial accrued liability for the nonhazardous insurance
fund decreased by $0.312 billion to $1.548 billion with $0.311 billion of that decrease attributable to
the favorable premium experience. The corresponding funded ratio increased from 30.7% at June 30,
2017 to 36.4% at June 30, 2018.
Hazardous Insurance Fund
Since the prior year’s valuation, the actuarial value of assets in excess of the actuarial accrued liability
for the hazardous insurance fund increased by $0.044 billion to $0.118 billion with $0.041 billion of that
increase attributable to the favorable premium experience. The corresponding funded ratio increased
from 117.6% at June 30, 2017 to 130.0% at June 30, 2018.
Board Meeting- December 17, 2018 - Actuarial Valuations- GRS/ Ms. Karen Roggenkamp
54

SECTION 2
DISCUSSION
Board Meeting- December 17, 2018 - Actuarial Valuations- GRS/ Ms. Karen Roggenkamp
55

Kentucky Employees Retirement System
Actuarial Valuation – June 30, 2018
Section 2 7
Discussion
The Kentucky Employees Retirement System (KERS) is a defined benefit pension fund that provides
pensions and health care coverage for employees of state government, non-teaching staff at regional state
supported universities, local health departments, regional mental health/mental retardation agencies, and
other quasi-state agencies. KERS includes both non-hazardous and hazardous duty benefits. This report
presents the result of the June 30, 2018 actuarial funding valuation for both the Retirement and Insurance
Funds.
The primary purposes of the valuation report are to depict the current financial condition of the System and
analyze changes in the System’s financial condition. In addition, the report provides various summaries of
the data. The results of this actuarial valuation, including the calculated employer contribution rates will be
used by the Board and stakeholders for informational purposes only as the employer contribution rate for
the fiscal years ending June 30, 2019 and June 30, 2020 were certified in the June 30, 2017 actuarial
valuation and adopted by the Board.
The actuarially determined contribution rates consist of two components: a normal cost rate and an
amortization cost to finance the unfunded actuarial accrued liability. The normal cost rate is the theoretical
amount which would be required to pay the members’ benefits, based on the current plan provisions, if
this amount had been contributed from each member’s entry date and if the fund’s experience exactly
followed the actuarial assumptions. This is the amount it should cost to provide the benefits for an average
new member. Since members contribute to the fund, only the excess of the normal rate over the member
contribution rate is included in the employer contribution rate. The amortization cost is the amount,
expressed as a percentage of payroll, necessary to amortize the unfunded actuarial accrued liability. The
payroll growth rate and discount rate assumptions are selected by the Board. The funding period is
specified in Section 61.565 of Kentucky Statute.
All of the actuarial and financial tables referenced by the other sections of this Report appear in Section 3.
Section 4 provides member data and statistical information. Appendices A and B provide summaries of the
principle actuarial assumptions and methods and plan provisions. Finally, Appendix C provides a glossary of
technical terms that are used throughout this report.
Board Meeting- December 17, 2018 - Actuarial Valuations- GRS/ Ms. Karen Roggenkamp
56

Kentucky Employees Retirement System
Actuarial Valuation – June 30, 2018
Section 2 8
Funding Progress
The following charts provide an eight-year history of the funds’ funded ratio (i.e. the Actuarial Value of
Assets divided by the Actuarial Accrued Liability). The decline in the funded ratio over the last eight years
for the retirement funds has generally been due to a combination of: (i) actual contribution rates being
insufficient to completely finance, or pay down, the unfunded actuarial accrued liability, (ii) the actual
investment experience being less than assumed, and (iii) a decrease in the assumed rate of return in 2015,
2016 and again in 2017.
Non-Hazardous Retirement Fund
2011 2012 2013 2014 2015 2016 2017 2018
Funded Ratio 33.3% 27.3% 23.2% 21.0% 19.0% 16.0% 13.6% 12.9%
0%
10%
20%
30%
40%
50%
60%
70%
80%
90%
100%
Funded RatioActuarial Assets as a percentage of Actuarial Accrued Liability
Board Meeting- December 17, 2018 - Actuarial Valuations- GRS/ Ms. Karen Roggenkamp
57

Kentucky Employees Retirement System
Actuarial Valuation – June 30, 2018
Section 2 9
Funding Progress (Continued)
Hazardous Retirement Fund
2011 2012 2013 2014 2015 2016 2017 2018
Funded Ratio 70.8% 66.1% 64.5% 64.6% 62.2% 59.7% 54.1% 55.5%
0%
10%
20%
30%
40%
50%
60%
70%
80%
90%
100%
Funded RatioActuarial Assets as a percentage of Actuarial Accrued Liability
Assuming the actuarial determined contributions are actually paid in future years and absent future
unfavorable investment or demographic experience, we expect the funded ratio to begin improving. Table
9, Schedule of Funding Progress, in the following section of the report provides additional detail regarding
the funding progress of the Retirement System.
Board Meeting- December 17, 2018 - Actuarial Valuations- GRS/ Ms. Karen Roggenkamp
58

Kentucky Employees Retirement System
Actuarial Valuation – June 30, 2018
Section 2 10
Asset Gains/ (Losses)
The actuarial value of assets (“AVA”) is based on a smoothed market value of assets, using a systematic
approach to phase-in the difference between the actual and expected investment return on the market
value of assets (adjusted for receipts and disbursements during the year). This is appropriate because it
dampens the short-term volatility inherent in investment markets. The returns are computed net of
investment expenses. The actuarial value of assets for the non-hazardous retirement fund slightly
decreased from $2.124 billion to $2.019 billion since the prior valuation. Table 7 in the following section of
the report provides the development of the actuarial value of assets.
The rate of return on the market value of assets on a dollar-weighted basis for fiscal year 2018 was 7.4% for
the non-hazardous retirement fund which is greater than the 5.25% expected annual return. The return on
an actuarial (smoothed) asset value was 4.6%, which resulted in a $0.013 billion loss for the fiscal year. This
difference in the estimated return on market value and actuarial value illustrates the smoothing effect of
the asset valuation method.
The market value of assets for the non-hazardous retirement fund is $0.015 billion less than the actuarial
value of assets, which signifies that the retirement system is in a position of deferred losses. Therefore,
unless the System experiences investment returns in excess of the assumed rate of return in an amount
that is at least equal to the outstanding deferred losses, the future recognition of these deferred losses is
expected to increase the unfunded actuarial accrued liability.
The actuarial value of assets for the hazardous retirement fund increased from $607 million to $639 million
since the prior valuation. The rate of return on the market value of assets on a dollar-weighted basis for
fiscal year 2018 was 8.6% which is greater than the 6.25% expected annual return. The return on the
actuarial (smoothed) asset value was 6.6%, which resulted in a $2 million gain for the fiscal year. The
market value of assets for the hazardous fund is $6 million greater than the actuarial value of assets, which
signifies that this system has some net deferred investment gains to be realized in future years.
Table 6 in the following section of this report provides asset information that was included in the annual
financial statements of the System. Also, Tables 6 and 7 show the estimated yield on a market value basis
and on the actuarial asset valuation method.
Board Meeting- December 17, 2018 - Actuarial Valuations- GRS/ Ms. Karen Roggenkamp
59

Kentucky Employees Retirement System
Actuarial Valuation – June 30, 2018
Section 2 11
Actuarial Gains/ (Losses)
The annual actuarial valuation is a snapshot analysis of the benefit liabilities, assets and funded position of
the System as of the first day of the plan year. In any one fiscal year, the experience can be better or worse
from that which is assumed or expected. The actuarial assumptions do not necessarily attempt to model
what the experience will be for any one given fiscal year, but instead try to model the overall experience
over many years. Therefore, as long as the actual experience of the retirement system is reasonably close
to the current assumptions, the long-term funding requirements of the System will remain relatively
consistent.
Below are tables that separately show a reconciliation of the actuarial gains / (loss) since the prior actuarial
valuation for the retirement and health insurance funds, which include the effect of asset and liability gains
and losses, changes in assumptions, changes in plan provisions, etc.
Non-Hazardous Hazardous
A. Calculation of total actuarial gain or loss
1. Unfunded actuarial accrued liability (UAAL),
previous year 13,468,018$ 514,261$
2. Normal cost and administrative expenses 201,703 28,699
3. Less: contributions for the year (794,416) (61,585)
4. Interest accrual 691,512 31,114
5. Expected UAAL (Sum of Items 1 - 4) 13,566,817$ 512,489$
6. Actual UAAL as of June 30,2018 13,655,954$ 512,661$
7. Total gain (loss) for the year (Item 5 - Item 6) (89,137)$ (172)$
B. Source of gains and losses
8. Asset gain (loss) for the year (13,404)$ 1,897$
9. Liability experience gain (loss) for the year (66,109) (1,364)
10. Plan Change (9,624) (705)
11. Assumption change 0 0
12. Total (89,137)$ (172)$
Retirement Experience Gain or (Loss)(Dollar amounts expressed in thousands)
The UAAL for the non-hazardous retirement fund was expected to increase since the prior year as the FY 2018 contribution effort was less than the interest on the prior year’s unfunded actuarial accrued liability (i.e. negative amortization). Once the higher contribution rates are effective on July 1, 2018, the UAAL for the non-hazardous fund is expecting to begin decreasing in future years (absent other gains or losses).
Board Meeting- December 17, 2018 - Actuarial Valuations- GRS/ Ms. Karen Roggenkamp
60

Kentucky Employees Retirement System
Actuarial Valuation – June 30, 2018
Section 2 12
Actuarial Gains/ (Losses) (Continued)
Non-Hazardous Hazardous
A. Calculation of total actuarial gain or loss
1. Unfunded actuarial accrued liability (UAAL),
previous year 1,859,578$ (74,019)$
2. Normal cost and administrative expenses 47,560 10,467
3. Less: contributions for the year (142,237) (6,215)
4. Interest accrual 113,265 (4,493)
5. Expected UAAL (Sum of Items 1 - 4) 1,878,166$ (74,260)$
6. Actual UAAL as of June 30,2018 1,548,384$ (117,960)$
7. Total gain (loss) for the year (Item 5 - Item 6) 329,782$ 43,700$
B. Source of gains and losses
8. Asset gain (loss) for the year 1,596$ 254$
9. Liability experience gain (loss) for the year 329,415 43,612
10. Plan Change (1,229) (166)
11. Assumption change 0 0
12. Total 329,782$ 43,700$
Insurance Experience Gain or (Loss)(Dollar amounts expressed in thousands)
The favorable premium experience from calendar year 2018 to calendar year 2019 resulted in a $311 million liability gain for the non-hazardous insurance fund and a $41 million liability gain for the hazardous insurance fund.
Board Meeting- December 17, 2018 - Actuarial Valuations- GRS/ Ms. Karen Roggenkamp
61

Kentucky Employees Retirement System
Actuarial Valuation – June 30, 2018
Section 2 13
Actuarial Assumptions and Methods
In determining costs and liabilities, actuaries use assumptions about the future, such as rates of salary
increase, probabilities of retirement, termination, death and disability, and an annual investment return
assumption. There were no changes to the actuarial assumptions and methods since the last actuarial
valuation. It is our opinion that the assumptions are internally consistent, reasonable, and reflect
anticipated future experience of the System. Appendix A includes a summary of the actuarial assumptions
and methods used in this valuation.
An experience study was conducted as of June 30, 2013 and the next experience study will be conducted as
of June 30, 2018, the results of which will be first used in preparing the June 30, 2019 actuarial valuation.
However, the Board has the authority to review the assumptions on a more frequent basis and adopt new
assumptions prior to the next scheduled experience study.
Future actuarial measurements may differ significantly from the current measurements presented in this
report due to such factors as the following: plan experience differing from that anticipated by the economic
or demographic assumptions; changes in economic or demographic assumptions; increases or decreases
expected as part of the natural operation of the methodology used for these measurements (such as the
end of an amortization period or additional cost or contribution requirements based on the plan’s funded
status); and changes in plan provisions or applicable law. This report does not include a more robust
assessment of the risks of future experience not meeting the actuarial assumptions. Additional assessment
of risks was outside the scope of this assignment.
Board Meeting- December 17, 2018 - Actuarial Valuations- GRS/ Ms. Karen Roggenkamp
62

Kentucky Employees Retirement System
Actuarial Valuation – June 30, 2018
Section 2 14
Benefit Provisions
Appendix B of this report includes a summary of the benefit provisions for KERS.
During the 2018 legislative session, House Bill 185 was enacted, which updated the benefit provisions for
active members who die in the line of duty. Benefits paid to the spouses of deceased members paid from
the retirement fund have been increased from 25% of the member’s final rate of pay to 75% of the
member’s average pay. If the member does not have a surviving spouse, benefits paid to surviving
dependent children have been increased from 10% of the member’s final pay rate to 50% of average pay
for one child, 65% of average pay for two children, or 75% of average pay for three children. The insurance
fund shall also now pay 100% of the insurance premium for spouses and children of all active members
who die in the line of duty.
House Bill 265 maintained the FY 2019 employer contribution rate at 49.47% for Regional Mental
Health/Mental Retardation Boards, Local and District Health Departments, State Universities, Community
Colleges and any other agency eligible to voluntarily cease participating in the KERS. This legislation
impacts the contribution rates for approximately 114 employers participating in the KERS non-hazardous
retirement and insurance funds. The covered payroll for these employers exempt from the higher
contribution rate is approximately 25% of the total covered payroll for the KERS non-hazardous system.
This actuarial valuation was determined without regard to enactment of SB 151 in 2018, which is currently
being reviewed by the State Supreme Court.
This valuation reflects all benefits promised to KERS members, either by the statutes or by the Board.
There are no ancillary benefits that might be deemed a KERS liability if continued beyond the availability of
funding by the current funding source.
Board Meeting- December 17, 2018 - Actuarial Valuations- GRS/ Ms. Karen Roggenkamp
63
SECTION 3
ACTUARIAL TABLES
Board Meeting- December 17, 2018 - Actuarial Valuations- GRS/ Ms. Karen Roggenkamp
64

Kentucky Employees Retirement System
Actuarial Valuation – June 30, 2018
Section 3 16
Actuarial Tables TABLE
NUMBER
PAGE
CONTENT OF TABLE
RETIREMENT BENEFITS
1 18 DEVELOPMENT OF UNFUNDED ACTUARIAL ACCRUED LIABILITY
2 19 ACTUARIAL PRESENT VALUE OF FUTURE BENEFITS
3 20 DEVELOPMENT OF REQUIRED CONTRIBUTION RATE
4 21 ACTUARIAL BALANCE SHEET – NON-HAZARDOUS MEMBERS
5 22 ACTUARIAL BALANCE SHEET – HAZARDOUS MEMBERS
6 23 RECONCILIATION OF SYSTEM NET ASSETS
7 24 DEVELOPMENT OF ACTUARIAL VALUE OF ASSETS – NON-HAZARDOUS MEMBERS
8 25 DEVELOPMENT OF ACTUARIAL VALUE OF ASSETS – HAZARDOUS MEMBERS
9 26 SCHEDULE OF FUNDING PROGRESS
10 27 SUMMARY OF PRINCIPAL ASSUMPTIONS AND METHODS
11 28 SOLVENCY TEST
INSURANCE BENEFITS
12 30 DEVELOPMENT OF UNFUNDED ACTUARIAL ACCRUED LIABILITY
13 31 DEVELOPMENT OF REQUIRED CONTRIBUTION RATE
14 32 ACTUARIAL BALANCE SHEET – NON-HAZARDOUS MEMBERS
15 33 ACTUARIAL BALANCE SHEET – HAZARDOUS MEMBERS
16 34 RECONCILIATION OF SYSTEM NET ASSETS
17 35 DEVELOPMENT OF ACTUARIAL VALUE OF ASSETS – NON-HAZARDOUS MEMBERS
18 36 DEVELOPMENT OF ACTUARIAL VALUE OF ASSETS – HAZARDOUS MEMBERS
19 37 SCHEDULE OF FUNDING PROGRESS
20 38 SOLVENCY TEST
Board Meeting- December 17, 2018 - Actuarial Valuations- GRS/ Ms. Karen Roggenkamp
65
RETIREMENT BENEFITS
ACTUARIAL TABLES
Board Meeting- December 17, 2018 - Actuarial Valuations- GRS/ Ms. Karen Roggenkamp
66

Kentucky Employees Retirement System
Actuarial Valuation – June 30, 2018
Table 1 18
Development of Unfunded Actuarial Accrued Liability Development of Unfunded Actuarial Accrued Liability
Retirement Benefits Retirement Benefits
(Dollar amounts expressed in thousands) (Dollar amounts expressed in thousands)
June 30, 2018
Non-Hazardous Hazardous
(1) (2)
1. Projected payroll of active members 1,471,477$ 158,213$
2. Present value of future pay 12,557,065$ 1,367,492$
3. Normal cost rate
a. Total normal cost rate 12.25% 16.62%
b. Less: member contribution rate -5.00% -8.00%
c. Employer normal cost rate 7.25% 8.62%
4. Actuarial accrued liability for active members
a. Present value of future benefits 5,202,677$ 552,514$
b. Less: present value of future normal costs (1,456,464) (210,902)
c. Actuarial accrued liability 3,746,213$ 341,612$
5. Total actuarial accrued liability
a. Retirees and beneficiaries 11,419,229$ 771,706$
b. Inactive members 509,790 38,605
c. Active members (Item 4c) 3,746,213 341,612
d. Total 15,675,232$ 1,151,923$
6. Actuarial value of assets 2,019,278$ 639,262$
7. Unfunded actuarial accrued liability (UAAL)
(Item 5d - Item 6) 13,655,954$ 512,661$
8. Funded Ratio 12.9% 55.5%
Board Meeting- December 17, 2018 - Actuarial Valuations- GRS/ Ms. Karen Roggenkamp
67

Kentucky Employees Retirement System
Actuarial Valuation – June 30, 2018
Table 2 19
Actuarial Present Value of Future Benefits Actuarial Present Value of Future Benefits
Retirement Benefits Retirement Benefits(Dollar amounts expressed in thousands) (Dollar amounts expressed in thousands)
June 30, 2018
Non-Hazardous Hazardous
(1) (2)
1. Active members
a. Service retirement 4,700,863$ 498,190$
b. Deferred termination benefits and refunds 345,804 40,012
c. Survivor benefits 64,161 5,220
d. Disability benefits 91,849 9,092
e. Total 5,202,677$ 552,514$
2. Retired members
a. Service retirement 10,472,173$ 711,832$
b. Disability retirement 290,266 16,817
c. Beneficiaries 656,790 43,057
d. Total 11,419,229$ 771,706$
3. Inactive members
a. Vested terminations 450,060$ 31,174$
b. Nonvested terminations 59,730 7,431
c. Total 509,790$ 38,605$
4. Total actuarial present value of future benefits 17,131,696$ 1,362,825$
Board Meeting- December 17, 2018 - Actuarial Valuations- GRS/ Ms. Karen Roggenkamp
68

Kentucky Employees Retirement System
Actuarial Valuation – June 30, 2018
Table 3 20
Development of Actuarially Determined Contribution Rate Development of Actuarially Determined Contribution Rate
Retirement Benefits Retirement Benefits
June 30, 2018
Non-Hazardous Hazardous
(1) (2)
1. Total normal cost rate
a. Service retirement 9.45% 13.46%
b. Deferred termination benefits and refunds 2.17% 2.49%
c. Survivor benefits 0.28% 0.28%
d. Disability benefits 0.35% 0.39%
e. Total 12.25% 16.62%
2. Less: member contribution rate -5.00% -8.00%
3. Total employer normal cost rate 7.25% 8.62%
4. Administrative expenses 0.73% 0.62%
5. Net employer normal cost rate 7.98% 9.24%
6. UAAL amortization contribution 66.56% 25.18%
7. Total calculated employer contribution 74.54% 34.42%
Board Meeting- December 17, 2018 - Actuarial Valuations- GRS/ Ms. Karen Roggenkamp
69

Kentucky Employees Retirement System
Actuarial Valuation – June 30, 2018
Table 4 21
Actuarial Balance Sheet Actuarial Balance Sheet
Non-Hazardous Members Retirement Hazardous Members Retirement
(Dollar amounts expressed in thousands) (Dollar amounts expressed in thousands)
June 30, 2018 June 30, 2017
(1) (2)
1. Assets - Present and Expected Future Resources
a. Current assets (actuarial value) 2,019,278$ 2,123,623$
b. Present value of future member contributions 627,853$ 643,468$
c. Present value of future employer contributions
i. Normal cost contributions 828,611$ 887,737$
ii. Unfunded accrued liability contributions 13,655,954 13,468,018
iii. Total future employer contributions 14,484,565$ 14,355,755$
d. Total assets 17,131,696$ 17,122,846$
2. Liabilities - Present Value of Expected Future Benefit Payments
a. Active members
i. Present value of future normal costs 1,456,464$ 1,531,205$
ii. Accrued liability 3,746,213 3,983,295
iii. Total present value of future benefits 5,202,677$ 5,514,500$
b. Present value of benefits payable on account of
current retired members and beneficiaries 11,419,229$ 11,120,669$
c. Present value of benefits payable on account of
current inactive members 509,790$ 487,677$
d. Total liabilities 17,131,696$ 17,122,846$
Board Meeting- December 17, 2018 - Actuarial Valuations- GRS/ Ms. Karen Roggenkamp
70

Kentucky Employees Retirement System
Actuarial Valuation – June 30, 2018
Table 5 22
Actuarial Balance Sheet Actuarial Balance Sheet
Hazardous Members Retirement Non-Hazardous Members Retirement
(Dollar amounts expressed in thousands) (Dollar amounts expressed in thousands)
June 30, 2018 June 30, 2017
(1) (2)
1. Assets - Present and Expected Future Resources
a. Current assets (actuarial value) 639,262$ 607,159$
b. Present value of future member contributions 109,399$ 109,126$
c. Present value of future employer contributions
i. Normal cost contributions 101,503$ 108,685$
ii. Unfunded accrued liability contributions 512,661 514,261
iii. Total future employer contributions 614,164$ 622,946$
d. Total assets 1,362,825$ 1,339,231$
2. Liabilities - Present Value of Expected Future Benefit Payments
a. Active members
i. Present value of future normal costs 210,902$ 217,811$
ii. Accrued liability 341,612 375,070
iii. Total present value of future benefits 552,514$ 592,881$
b. Present value of benefits payable on account of
current retired members and beneficiaries 771,706$ 712,284$
c. Present value of benefits payable on account of
current inactive members 38,605$ 34,066$
d. Total liabilities 1,362,825$ 1,339,231$
Board Meeting- December 17, 2018 - Actuarial Valuations- GRS/ Ms. Karen Roggenkamp
71

Kentucky Employees Retirement System
Actuarial Valuation – June 30, 2018
Table 6 23
Reconciliation of Retirement Net Assets Reconciliation of Retirement Net Assets (Dollar amounts expressed in thousands)* (Dollar amounts expressed in thousands)*
Year Ending
June 30, 2018 June 30, 2018
(1) (2)
Non-Hazardous Hazardous
1. Value of assets at beginning of year 2,056,870$ 601,529$
2. Revenue for the year
a. Contributions
i. Member contributions 104,972$ 17,891$
ii. Employer contributions 619,988 32,790
iii. Other contributions (less 401h) 69,456 10,904
iii. Total 794,416$ 61,585$
b. Income
i. Interest, dividends, and other income 47,741$ 14,013$
ii. Investment expenses (13,157) (4,833)
iii. Net 34,584$ 9,180$
c. Net realized and unrealized gains (losses) 110,246 42,283
d. Total revenue 939,245$ 113,048$
3. Expenditures for the year
a. Disbursements
i. Refunds 13,603$ 2,501$
ii. Regular annuity benefits 967,375 65,616
iii. Other benefit payments 0 0
iv. Transfers to other systems 0 0
v. Total 980,977$ 68,117$
b. Administrative expenses and depreciation 10,692 975
c. Total expenditures 991,669$ 69,092$
4. Increase in net assets
(Item 2. - Item 3.) (52,424)$ 43,956$
5. Value of assets at end of year
(Item 1. + Item 4.) 2,004,446$ 645,485$
6. Net external cash flow
a. Dollar amount (197,253)$ (7,507)$
b. Percentage of market value -9.7% -1.2%
7. Estimated annual return on net assets 7.4% 8.6%
* Amounts may not add due to rounding
* Excludes 401h assets
Board Meeting- December 17, 2018 - Actuarial Valuations- GRS/ Ms. Karen Roggenkamp
72
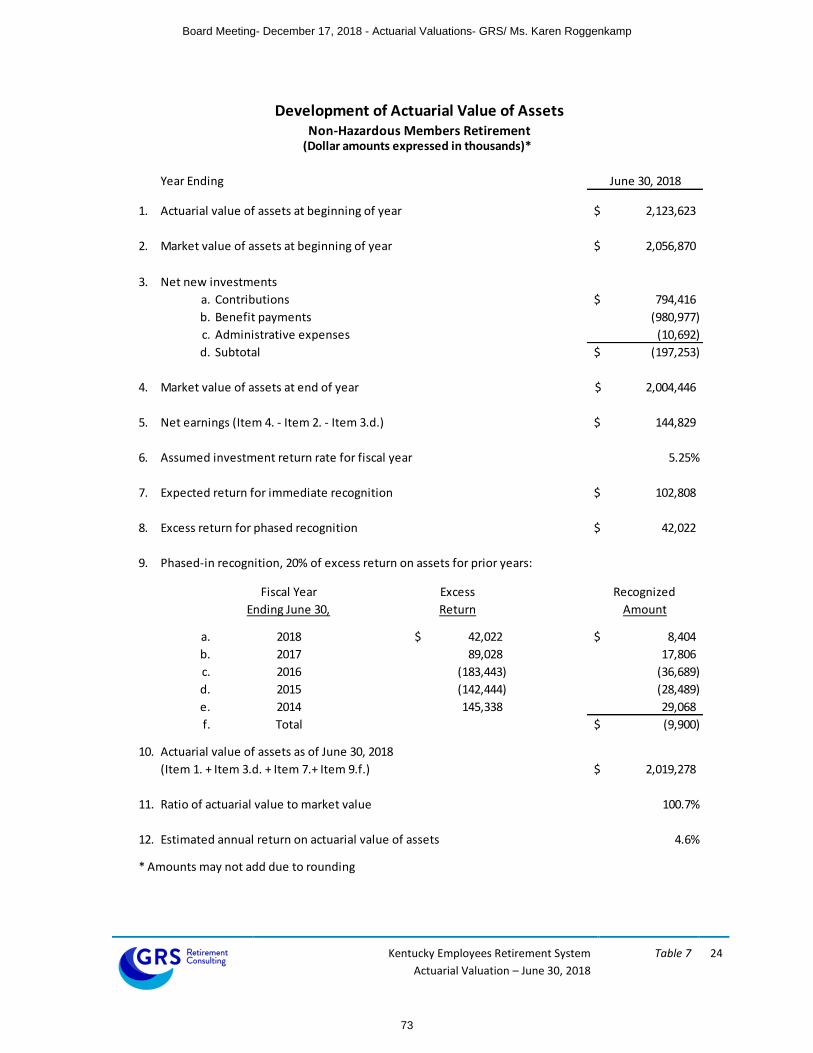
Kentucky Employees Retirement System
Actuarial Valuation – June 30, 2018
Table 7 24
17
Development of Actuarial Value of Assets Development of Actuarial Value of AssetsNon-Hazardous Members Retirement Hazardous Members Retirement
(Dollar amounts expressed in thousands)* (Dollar amounts expressed in thousands)*
Year Ending June 30, 2018
1. Actuarial value of assets at beginning of year 2,123,623$
2. Market value of assets at beginning of year 2,056,870$
3. Net new investments
a. Contributions 794,416$
b. Benefit payments (980,977)
c. Administrative expenses (10,692)
d. Subtotal (197,253)$
4. Market value of assets at end of year 2,004,446$
5. Net earnings (Item 4. - Item 2. - Item 3.d.) 144,829$
6. Assumed investment return rate for fiscal year 5.25%
7. Expected return for immediate recognition 102,808$
8. Excess return for phased recognition 42,022$
9. Phased-in recognition, 20% of excess return on assets for prior years:
Fiscal Year
Ending June 30,
Excess
Return
Recognized
Amount
a. 2018 42,022$ 8,404$
b. 2017 89,028 17,806
c. 2016 (183,443) (36,689)
d. 2015 (142,444) (28,489)
e. 2014 145,338 29,068
f. Total (9,900)$
10. Actuarial value of assets as of June 30, 2018
(Item 1. + Item 3.d. + Item 7.+ Item 9.f.) 2,019,278$
11. Ratio of actuarial value to market value 100.7%
12. Estimated annual return on actuarial value of assets 4.6%
* Amounts may not add due to rounding
Board Meeting- December 17, 2018 - Actuarial Valuations- GRS/ Ms. Karen Roggenkamp
73

Kentucky Employees Retirement System
Actuarial Valuation – June 30, 2018
Table 8 25
Development of Actuarial Value of Assets Development of Actuarial Value of AssetsHazardous Members Retirement Non-Hazardous Members Retirement
(Dollar amounts expressed in thousands)* (Dollar amounts expressed in thousands)*
Year Ending June 30, 2018
1. Actuarial value of assets at beginning of year 607,159$
2. Market value of assets at beginning of year 601,529$
3. Net new investments
a. Contributions 61,585$
b. Benefit payments (68,117)
c. Administrative expenses (975)
d. Subtotal (7,507)$
4. Market value of assets at end of year 645,485$
5. Net earnings (Item 4. - Item 2. - Item 3.d.) 51,463$
6. Assumed investment return rate for fiscal year 6.25%
7. Expected return for immediate recognition 37,361$
8. Excess return for phased recognition 14,102$
9. Phased-in recognition, 20% of excess return on assets for prior years:
Fiscal Year
Ending June 30,
Excess
Return
Recognized
Amount
a. 2018 14,102$ 2,820$
b. 2017 31,023 6,205
c. 2016 (42,195) (8,439)
d. 2015 (33,972) (6,794)
e. 2014 42,286 8,457
f. Total 2,249$
10. Actuarial value of assets as of June 30, 2018
(Item 1. + Item 3.d. + Item 7.+ Item 9.f.) 639,262$
11. Ratio of actuarial value to market value 99.0%
12. Estimated annual return on actuarial value of assets 6.6%
* Amounts may not add due to rounding
Board Meeting- December 17, 2018 - Actuarial Valuations- GRS/ Ms. Karen Roggenkamp
74

Kentucky Employees Retirement System
Actuarial Valuation – June 30, 2018
Table 10 26
Schedule of Funding Progress Schedule of Funding Progress
Retirement Benefits Retirement Benefits
Unfunded Actuarial
Actuarial Value of Actuarial Accrued Accrued Liability Funded Ratio Annual Covered UAAL as % of
June 30, Assets (AVA) Liability (AAL) (UAAL) (3) - (2) (2)/(3) Payroll Payroll (4)/(6)
(1) (2) (3) (4) (5) (6) (7)
Non-Hazardous Members Non-Hazardous Members
2011 3,726,986$ 11,182,142$ 7,455,156$ 33.3% 1,731,633$ 430.5%
2012 3,101,317 11,361,048 8,259,731 27.3% 1,644,897 502.1%
2013 2,636,123 11,386,602 8,750,479 23.2% 1,644,409 532.1%
2014 2,423,957 11,550,110 9,126,154 21.0% 1,577,496 578.5%
2015 2,350,990 12,359,673 10,008,683 19.0% 1,544,234 648.1%
2016 2,112,286 13,224,698 11,112,412 16.0% 1,529,249 726.7%
2017 2,123,623 15,591,641 13,468,018 13.6% 1,531,535 879.4%
2018 2,019,278 15,675,232 13,655,954 12.9% 1,471,477 928.0%
Hazardous Members Hazardous Members
2011 510,749$ 721,293$ 210,545$ 70.8% 133,054$ 158.2%
2012 497,226 752,699 255,473 66.1% 131,977 193.6%
2013 505,657 783,981 278,324 64.5% 132,015 210.8%
2014 527,897 816,850 288,953 64.6% 129,076 223.9%
2015 556,688 895,433 338,746 62.2% 128,680 263.2%
2016 559,487 936,706 377,219 59.7% 147,563 255.6%
2017 607,159 1,121,420 514,261 54.1% 162,418 316.6%
2018 639,262 1,151,923 512,661 55.5% 158,213 324.0%
Total KERS Members Total CERS Members
2011 4,237,735$ 11,903,435$ 7,665,700$ 35.6% 1,864,687$ 411.1%
2012 3,598,543 12,113,747 8,515,204 29.7% 1,776,874 479.2%
2013 3,141,780 12,170,583 9,028,803 25.8% 1,776,424 508.3%
2014 2,951,854 12,366,960 9,415,106 23.9% 1,706,572 551.7%
2015 2,907,678 13,255,106 10,347,428 21.9% 1,672,914 618.5%
2016 2,671,773 14,161,404 11,489,631 18.9% 1,676,812 685.2%
2017 2,730,782 16,713,061 13,982,279 16.3% 1,693,953 825.4%
2018 2,658,540 16,827,155 14,168,615 15.8% 1,629,690 869.4%
(Dollar amounts expressed in thousands)
Board Meeting- December 17, 2018 - Actuarial Valuations- GRS/ Ms. Karen Roggenkamp
75
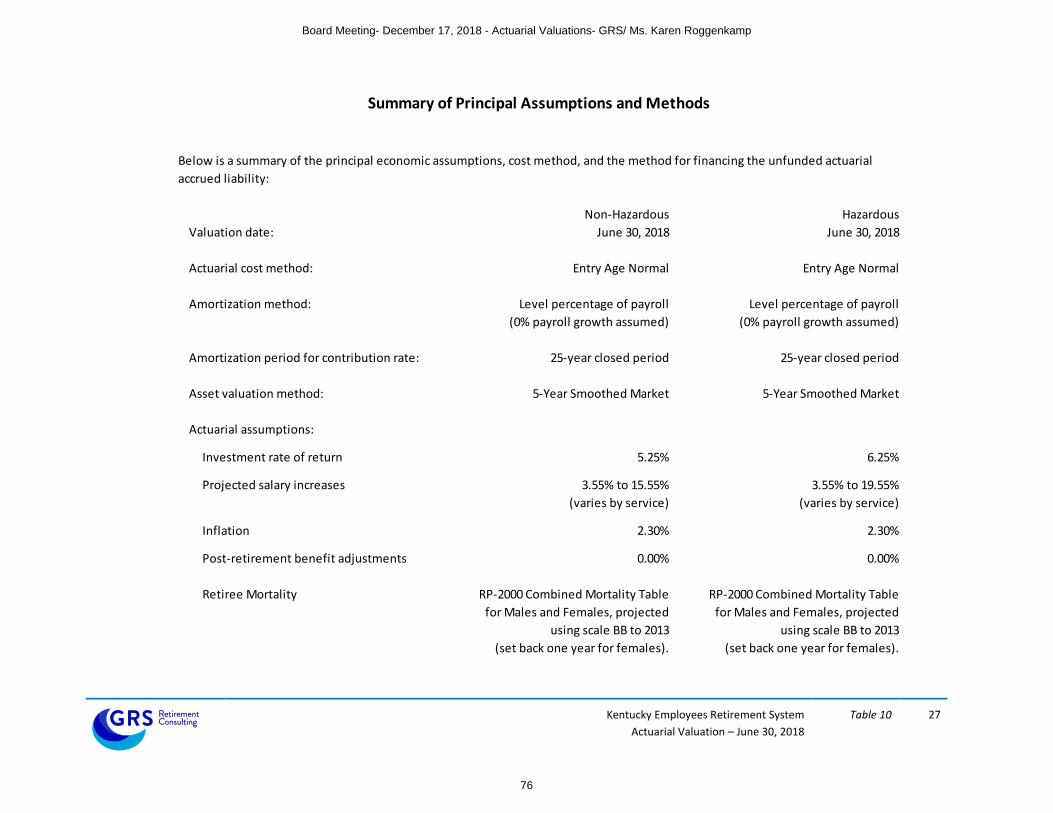
Kentucky Employees Retirement System
Actuarial Valuation – June 30, 2018
Table 10 27
Non-Hazardous Hazardous
Valuation date: June 30, 2018 June 30, 2018
Actuarial cost method: Entry Age Normal Entry Age Normal
Amortization method: Level percentage of payroll Level percentage of payroll
(0% payroll growth assumed) (0% payroll growth assumed)
Amortization period for contribution rate: 25-year closed period 25-year closed period
Asset valuation method: 5-Year Smoothed Market 5-Year Smoothed Market
Actuarial assumptions:
Investment rate of return 5.25% 6.25%
Projected salary increases 3.55% to 15.55% 3.55% to 19.55%
(varies by service) (varies by service)
Inflation 2.30% 2.30%
Post-retirement benefit adjustments 0.00% 0.00%
Retiree Mortality RP-2000 Combined Mortality Table RP-2000 Combined Mortality Table
for Males and Females, projected for Males and Females, projected
using scale BB to 2013 using scale BB to 2013
(set back one year for females). (set back one year for females).
Summary of Principal Assumptions and Methods
Below is a summary of the principal economic assumptions, cost method, and the method for financing the unfunded actuarial
accrued liability:
Board Meeting- December 17, 2018 - Actuarial Valuations- GRS/ Ms. Karen Roggenkamp
76

Kentucky Employees Retirement System
Actuarial Valuation – June 30, 2018
Table 11 28
Active Retired Active
Member Members & Members Valuation
June 30, Contributions Beneficiaries (Employer Financed) Assets Active Retired ER Financed
(1) (2) (3) (4) (5) (6) (7) (8)
Non-Hazardous Members Non-Hazardous Members
2009 793,575$ 8,205,156$ 1,659,819$ 4,794,611$ 100.0% 48.8% 0.0%
2010 869,484 8,329,758 1,805,553 4,210,216 100.0% 40.1% 0.0%
2011 916,569 8,482,714 1,782,859 3,726,986 100.0% 33.1% 0.0%
2012 885,137 8,708,536 1,767,375 3,101,317 100.0% 25.4% 0.0%
2013 922,928 8,709,324 1,754,351 2,636,123 100.0% 19.7% 0.0%
2014 928,558 8,870,693 1,750,860 2,423,957 100.0% 16.9% 0.0%
2015 925,934 9,437,468 1,996,271 2,350,990 100.0% 15.1% 0.0%
2016 920,120 10,010,168 2,294,410 2,112,286 100.0% 11.9% 0.0%
2017 934,559 11,608,346 3,048,736 2,123,623 100.0% 10.2% 0.0%
2018 892,033 11,929,019 2,854,180 2,019,278 100.0% 9.4% 0.0%
Hazardous Members Hazardous Members
2009 87,780$ 413,972$ 172,659$ 502,503$ 100.0% 100.0% 0.4%
2010 88,511 441,657 157,981 502,729 100.0% 93.8% 0.0%
2011 86,614 490,395 144,284 510,749 100.0% 86.5% 0.0%
2012 82,101 521,689 148,910 497,226 100.0% 79.6% 0.0%
2013 82,146 545,597 156,238 505,657 100.0% 77.6% 0.0%
2014 83,664 581,231 151,955 527,897 100.0% 76.4% 0.0%
2015 83,606 633,189 178,638 556,688 100.0% 74.7% 0.0%
2016 86,705 648,482 201,519 559,487 100.0% 72.9% 0.0%
2017 93,350 746,350 281,720 607,159 100.0% 68.8% 0.0%
2018 89,106 810,311 252,506 639,262 100.0% 67.9% 0.0%
Solvency Test
Retirement Benefits(Dollar amounts expressed in thousands)
Actuarial Accrued Liability
Portion of Aggregate Accrued
Liabilities Covered by Assets
Board Meeting- December 17, 2018 - Actuarial Valuations- GRS/ Ms. Karen Roggenkamp
77

INSURANCE BENEFITS
ACTUARIAL TABLES
Board Meeting- December 17, 2018 - Actuarial Valuations- GRS/ Ms. Karen Roggenkamp
78

Kentucky Employees Retirement System
Actuarial Valuation – June 30, 2018
Table 12 30
Development of Unfunded Actuarial Accrued Liability Development of Unfunded Actuarial Accrued Liability
Insurance Benefits Insurance Benefits
(Dollar amounts expressed in thousands) (Dollar amounts expressed in thousands)
June 30, 2018
Non-Hazardous Hazardous
(1) (2)
1. Projected payroll of active members 1,471,477$ 158,213$
2. Present value of future pay 11,638,890$ 1,357,261$
3. Normal cost rate
a. Total normal cost rate 2.83% 5.73%
b. Less: member contribution rate -0.40% -0.58%
c. Employer normal cost rate 2.43% 5.15%
4. Actuarial accrued liability for active members
a. Present value of future benefits 1,261,721$ 209,922$
b. Less: present value of future normal costs (302,169) (65,216)
c. Actuarial accrued liability 959,552$ 144,706$
5. Total actuarial accrued liability
a. Retirees and beneficiaries 1,357,311$ 238,885$
b. Inactive members 118,642 9,890
c. Active members (Item 4c) 959,552 144,706
d. Total 2,435,505$ 393,481$
6. Actuarial value of assets 887,121$ 511,441$
7. Unfunded actuarial accrued liability (UAAL)
(Item 5d - Item 6) 1,548,384$ (117,960)$
8. Funded Ratio 36.4% 130.0%
Board Meeting- December 17, 2018 - Actuarial Valuations- GRS/ Ms. Karen Roggenkamp
79

Kentucky Employees Retirement System
Actuarial Valuation – June 30, 2018
Table 13 31
Development of Actuarially Determined Contribution Rate Development of Actuarially Determined Contribution Rate
Insurance Benefits Insurance Benefits
June 30, 2018
Non-Hazardous Hazardous
(1) (2)
1. Total normal cost rate 2.83% 5.73%
2. Less: member contribution rate -0.40% -0.58%
3. Total employer normal cost rate 2.43% 5.15%
4. Administrative expenses 0.05% 0.07%
5. Net employer normal cost rate 2.48% 5.22%
6. UAAL amortization contribution 8.17% -6.09%
7. Total calculated employer contribution 10.65% 0.00%
Max (0%, item 5. + item6.)
Board Meeting- December 17, 2018 - Actuarial Valuations- GRS/ Ms. Karen Roggenkamp
80

Kentucky Employees Retirement System
Actuarial Valuation – June 30, 2018
Table 14 32
Actuarial Balance Sheet Actuarial Balance Sheet
Non-Hazardous Members Insurance Hazardous Members Insurance
(Dollar amounts expressed in thousands) (Dollar amounts expressed in thousands)
June 30, 2018 June 30, 2017
(1) (2)
1. Assets - Present and Expected Future Resources
a. Current assets (actuarial value) 887,121$ 823,918$
b. Present value of future member contributions 58,117$ 53,847$
c. Present value of future employer contributions
i. Normal cost contributions 244,052$ 282,814$
ii. Unfunded accrued liability contributions 1,548,384 1,859,578
iii. Total future employer contributions 1,792,436$ 2,142,392$
d. Total assets 2,737,674$ 3,020,157$
2. Liabilities - Present Value of Expected Future Benefit Payments
a. Active members
i. Present value of future normal costs 302,169$ 336,661$
ii. Accrued liability 959,552 1,108,202
iii. Total present value of future benefits 1,261,721$ 1,444,863$
b. Present value of benefits payable on account of
current retired members and beneficiaries 1,357,311$ 1,452,876$
c. Present value of benefits payable on account of
current inactive members 118,642$ 122,418$
d. Total liabilities 2,737,674$ 3,020,157$
Board Meeting- December 17, 2018 - Actuarial Valuations- GRS/ Ms. Karen Roggenkamp
81

Kentucky Employees Retirement System
Actuarial Valuation – June 30, 2018
Table 15 33
Actuarial Balance Sheet Actuarial Balance Sheet
Hazardous Members Insurance Non-Hazardous Members Insurance
(Dollar amounts expressed in thousands) (Dollar amounts expressed in thousands)
June 30, 2018 June 30, 2017
(1) (2)
1. Assets - Present and Expected Future Resources
a. Current assets (actuarial value) 511,441$ 493,458$
b. Present value of future member contributions 9,821$ 9,088$
c. Present value of future employer contributions
i. Normal cost contributions 55,395$ 61,771$
ii. Unfunded accrued liability contributions (117,960) (74,019)
iii. Total future employer contributions (62,565)$ (12,248)$
d. Total assets 458,697$ 490,298$
2. Liabilities - Present Value of Expected Future Benefit Payments
a. Active members
i. Present value of future normal costs 65,216$ 70,859$
ii. Accrued liability 144,706 175,623
iii. Total present value of future benefits 209,922$ 246,482$
b. Present value of benefits payable on account of
current retired members and beneficiaries 238,885$ 233,808$
c. Present value of benefits payable on account of
current inactive members 9,890$ 10,008$
d. Total liabilities 458,697$ 490,298$
Board Meeting- December 17, 2018 - Actuarial Valuations- GRS/ Ms. Karen Roggenkamp
82
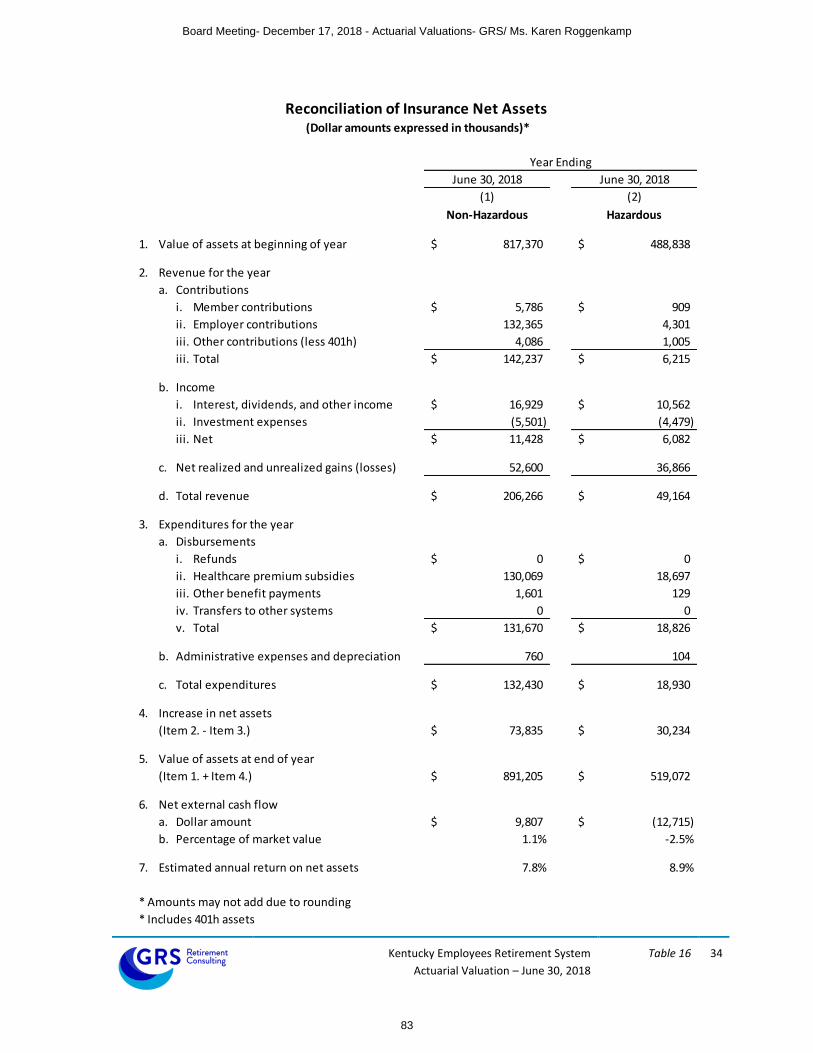
Kentucky Employees Retirement System
Actuarial Valuation – June 30, 2018
Table 16 34
Reconciliation of Insurance Net Assets Reconciliation of Insurance Net Assets (Dollar amounts expressed in thousands)* (Dollar amounts expressed in thousands)*
Year Ending
June 30, 2018 June 30, 2018
(1) (2)
Non-Hazardous Hazardous
1. Value of assets at beginning of year 817,370$ 488,838$
2. Revenue for the year
a. Contributions
i. Member contributions 5,786$ 909$
ii. Employer contributions 132,365 4,301
iii. Other contributions (less 401h) 4,086 1,005
iii. Total 142,237$ 6,215$
b. Income
i. Interest, dividends, and other income 16,929$ 10,562$
ii. Investment expenses (5,501) (4,479)
iii. Net 11,428$ 6,082$
c. Net realized and unrealized gains (losses) 52,600 36,866
d. Total revenue 206,266$ 49,164$
3. Expenditures for the year
a. Disbursements
i. Refunds 0$ 0$
ii. Healthcare premium subsidies 130,069 18,697
iii. Other benefit payments 1,601 129
iv. Transfers to other systems 0 0
v. Total 131,670$ 18,826$
b. Administrative expenses and depreciation 760 104
c. Total expenditures 132,430$ 18,930$
4. Increase in net assets
(Item 2. - Item 3.) 73,835$ 30,234$
5. Value of assets at end of year
(Item 1. + Item 4.) 891,205$ 519,072$
6. Net external cash flow
a. Dollar amount 9,807$ (12,715)$
b. Percentage of market value 1.1% -2.5%
7. Estimated annual return on net assets 7.8% 8.9%
* Amounts may not add due to rounding
* Includes 401h assets
Board Meeting- December 17, 2018 - Actuarial Valuations- GRS/ Ms. Karen Roggenkamp
83

Kentucky Employees Retirement System
Actuarial Valuation – June 30, 2018
Table 17 35
17
Development of Actuarial Value of Assets Development of Actuarial Value of AssetsNon-Hazardous Members Insurance Hazardous Members Insurance
(Dollar amounts expressed in thousands)* (Dollar amounts expressed in thousands)*
Year Ending June 30, 2018
1. Actuarial value of assets at beginning of year 823,918$
2. Market value of assets at beginning of year 817,370$
3. Net new investments
a. Contributions 142,237$
b. Benefit payments (131,670)
c. Administrative expenses (760)
d. Subtotal 9,807$
4. Market value of assets at end of year 891,205$
5. Net earnings (Item 4. - Item 2. - Item 3.d.) 64,028$
6. Assumed investment return rate for fiscal year 6.25%
7. Expected return for immediate recognition 51,392$
8. Excess return for phased recognition 12,636$
9. Phased-in recognition, 20% of excess return on assets for prior years:
Fiscal Year
Ending June 30,
Excess
Return
Recognized
Amount
a. 2018 12,636$ 2,527$
b. 2017 41,687 8,337
c. 2016 (55,901) (11,180)
d. 2015 (43,387) (8,677)
e. 2014 54,989 10,998
f. Total 2,005$
10. Actuarial value of assets as of June 30, 2018
(Item 1. + Item 3.d. + Item 7.+ Item 9.f.) 887,121$
11. Ratio of actuarial value to market value 99.5%
12. Estimated annual return on actuarial value of assets 6.4%
* Amounts may not add due to rounding
Board Meeting- December 17, 2018 - Actuarial Valuations- GRS/ Ms. Karen Roggenkamp
84
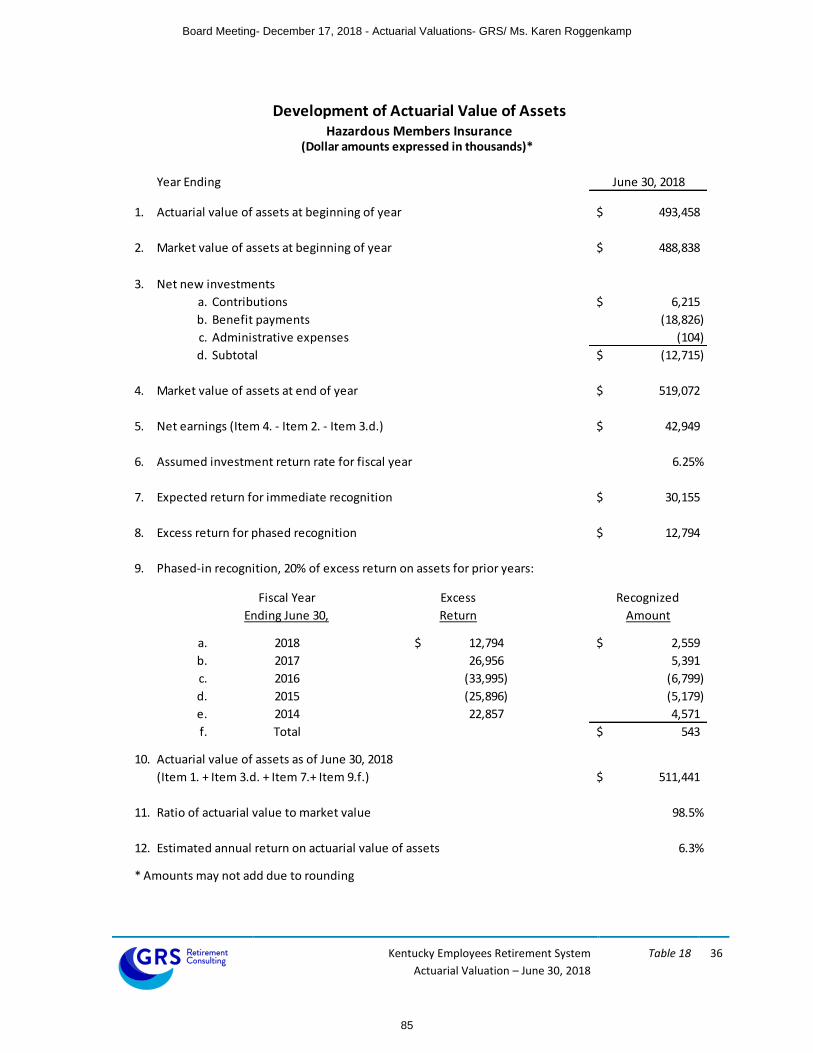
Kentucky Employees Retirement System
Actuarial Valuation – June 30, 2018
Table 18 36
17
Development of Actuarial Value of Assets Development of Actuarial Value of AssetsHazardous Members Insurance Non-Hazardous Members Insurance
(Dollar amounts expressed in thousands)* (Dollar amounts expressed in thousands)*
Year Ending June 30, 2018
1. Actuarial value of assets at beginning of year 493,458$
2. Market value of assets at beginning of year 488,838$
3. Net new investments
a. Contributions 6,215$
b. Benefit payments (18,826)
c. Administrative expenses (104)
d. Subtotal (12,715)$
4. Market value of assets at end of year 519,072$
5. Net earnings (Item 4. - Item 2. - Item 3.d.) 42,949$
6. Assumed investment return rate for fiscal year 6.25%
7. Expected return for immediate recognition 30,155$
8. Excess return for phased recognition 12,794$
9. Phased-in recognition, 20% of excess return on assets for prior years:
Fiscal Year
Ending June 30,
Excess
Return
Recognized
Amount
a. 2018 12,794$ 2,559$
b. 2017 26,956 5,391
c. 2016 (33,995) (6,799)
d. 2015 (25,896) (5,179)
e. 2014 22,857 4,571
f. Total 543$
10. Actuarial value of assets as of June 30, 2018
(Item 1. + Item 3.d. + Item 7.+ Item 9.f.) 511,441$
11. Ratio of actuarial value to market value 98.5%
12. Estimated annual return on actuarial value of assets 6.3%
* Amounts may not add due to rounding
Board Meeting- December 17, 2018 - Actuarial Valuations- GRS/ Ms. Karen Roggenkamp
85

Kentucky Employees Retirement System
Actuarial Valuation – June 30, 2018
Table 19 37
Schedule of Funding Progress Schedule of Funding Progress
Insurance Benefits Insurance Benefits
Unfunded Actuarial
Actuarial Value of Actuarial Accrued Accrued Liability Funded Ratio Annual Covered UAAL as % of
June 30, Assets (AVA) Liability (AAL) (UAAL) (3) - (2) (2)/(3) Payroll Payroll (4)/(6)
(1) (2) (3) (4) (5) (6) (7)
Non-Hazardous Members Non-Hazardous Members
2011 451,620$ 4,280,090$ 3,828,469$ 10.6% 1,731,633$ 221.1%
2012 446,081 3,125,330 2,679,250 14.3% 1,644,897 162.9%
2013 497,584 2,128,754 1,631,170 23.4% 1,644,409 99.2%
2014 621,237 2,226,760 1,605,523 27.9% 1,577,496 101.8%
2015 695,018 2,413,705 1,718,687 28.8% 1,544,234 111.3%
2016 743,270 2,456,678 1,713,408 30.3% 1,529,249 112.0%
2017 823,918 2,683,496 1,859,578 30.7% 1,531,535 121.4%
2018 887,121 2,435,505 1,548,384 36.4% 1,471,477 105.2%
Hazardous Members Hazardous Members
2011 329,962$ 507,059$ 177,097$ 65.1% 133,054$ 133.1%
2012 345,574 384,592 39,018 89.9% 131,977 29.6%
2013 370,774 385,518 14,743 96.2% 132,015 11.2%
2014 419,396 396,987 (22,409) 105.6% 129,076 -17.4%
2015 451,514 374,904 (76,610) 120.4% 128,680 -59.5%
2016 473,160 377,745 (95,415) 125.3% 147,563 -64.7%
2017 493,458 419,439 (74,019) 117.6% 162,418 -45.6%
2018 511,441 393,481 (117,960) 130.0% 158,213 -74.6%
Total KERS Members Total CERS Members
2011 781,582$ 4,787,149$ 4,005,567$ 16.3% 1,864,687$ 214.8%
2012 791,655 3,509,922 2,718,267 22.6% 1,776,874 153.0%
2013 868,358 2,514,272 1,645,914 34.5% 1,776,424 92.7%
2014 1,040,633 2,623,747 1,583,114 39.7% 1,706,572 92.8%
2015 1,146,532 2,788,609 1,642,077 41.1% 1,672,914 98.2%
2016 1,216,430 2,834,423 1,617,993 42.9% 1,676,812 96.5%
2017 1,317,376 3,102,935 1,785,559 42.5% 1,693,953 105.4%
2018 1,398,562 2,828,986 1,430,424 49.4% 1,629,690 87.8%
(Dollar amounts expressed in thousands)
Board Meeting- December 17, 2018 - Actuarial Valuations- GRS/ Ms. Karen Roggenkamp
86

Kentucky Employees Retirement System
Actuarial Valuation – June 30, 2018
Table 20 38
Active Retired Active
Member Members & Members Valuation
June 30, Contributions Beneficiaries (Employer Financed) Assets Active Retired ER Financed
(1) (2) (3) (4) (5) (6) (7) (8)
Non-Hazardous Members Non-Hazardous Members
2009 -$ 2,861,867$ 1,645,458$ 534,173$ 100.0% 18.7% 0.0%
2010 - 2,744,534 1,721,602 471,342 100.0% 17.2% 0.0%
2011 - 2,568,003 1,712,087 451,620 100.0% 17.6% 0.0%
2012 - 1,924,069 1,201,262 446,081 100.0% 23.2% 0.0%
2013 - 1,338,773 789,981 497,584 100.0% 37.2% 0.0%
2014 - 1,425,605 801,155 621,237 100.0% 43.6% 0.0%
2015 - 1,428,350 985,355 695,018 100.0% 48.7% 0.0%
2016 - 1,483,636 973,042 743,270 100.0% 50.1% 0.0%
2017 - 1,575,294 1,108,202 823,918 100.0% 52.3% 0.0%
2018 - 1,475,953 959,552 887,121 100.0% 60.1% 0.0%
Hazardous Members Hazardous Members
2009 -$ 242,123$ 249,009$ 301,635$ 100.0% 100.0% 23.9%
2010 - 268,511 224,787 314,427 100.0% 100.0% 20.4%
2011 - 285,540 221,519 329,962 100.0% 100.0% 20.1%
2012 - 196,579 188,013 345,574 100.0% 100.0% 79.2%
2013 - 202,032 183,486 370,774 100.0% 100.0% 92.0%
2014 - 206,477 190,509 419,396 100.0% 100.0% 100.0%
2015 - 221,115 153,789 451,514 100.0% 100.0% 100.0%
2016 - 228,361 149,384 473,160 100.0% 100.0% 100.0%
2017 - 243,816 175,623 493,458 100.0% 100.0% 100.0%
2018 - 248,775 144,706 511,441 100.0% 100.0% 100.0%
Liabilities Covered by Assets
Actuarial Accrued Liability
Portion of Aggregate Accrued
Solvency Test
Insurance Benefits(Dollar amounts expressed in thousands)
Board Meeting- December 17, 2018 - Actuarial Valuations- GRS/ Ms. Karen Roggenkamp
87

SECTION 4
MEMBERSHIP INFORMATION
Board Meeting- December 17, 2018 - Actuarial Valuations- GRS/ Ms. Karen Roggenkamp
88

Kentucky Employees Retirement System
Actuarial Valuation – June 30, 2018
Section 4 40
Membership Tables TABLE
NUMBER
PAGE
CONTENT OF TABLE
21 41 SUMMARY OF MEMBERSHIP DATA
22 42 SUMMARY OF HISTORICAL ACTIVE MEMBERSHIP
23 43 DISTRIBUTION OF ACTIVE MEMBERS BY AGE AND SERVICE – NON-HAZARDOUS
MEMBERS
24 44 DISTRIBUTION OF ACTIVE MEMBERS BY AGE AND SERVICE – HAZARDOUS MEMBERS
25 45 SCHEDULE OF ANNUITANTS BY AGE – NON-HAZARDOUS MEMBERS
26 46 SCHEDULE OF ANNUITANTS BY AGE – HAZARDOUS MEMBERS
27 47 SCHEDULE OF ANNUITANTS BY BENEFIT TYPE – NON-HAZARDOUS RETIREES
28 48 SCHEDULE OF ANNUITANTS BY BENEFIT TYPE – HAZARDOUS RETIREES
29 49 SCHEDULE OF ANNUITANTS BY BENEFIT TYPE – NON-HAZARDOUS BENEFICIARIES
30 50 SCHEDULE OF ANNUITANTS BY BENEFIT TYPE – HAZARDOUS BENEFICIARIES
31 51 SCHEDULE OF ANNUITANTS ADDED TO AND REMOVED FROM ROLLS
Board Meeting- December 17, 2018 - Actuarial Valuations- GRS/ Ms. Karen Roggenkamp
89

Kentucky Employees Retirement System
Actuarial Valuation – June 30, 2018
Table 21 41
Non-Hazardous Hazardous Total Total
June 30, 2018 June 30, 2018 June 30, 2018 June 30, 2017
(1) (2) (3) (4)
1. Active members
a. Males 13,374 2,706 16,080 16,991
b. Females 21,765 1,223 22,988 24,290
c. Total members 35,139 3,929 39,068 41,281
d. Total annualized prior year salaries 1,471,477$ 158,213$ 1,629,690$ 1,693,953$
e. Average salary 41,876$ 40,268$ 41,714$ 41,035$
f. Average age 45.2 39.8 44.7 44.9
g. Average service 10.8 7.3 10.4 10.6
h. Member contributions with interest 892,033$ 89,106$ 981,139$ 1,027,910$
i. Average contributions with interest 25,386$ 22,679$ 25,114$ 24,900$
2. Vested inactive members
a. Number 13,230 886 14,116 11,299
b. Total annual deferred benefits 73,955$ 4,084$ 78,039$ 73,067$
c. Average annual deferred benefit 5,590$ 4,610$ 5,528$ 6,467$
d. Average age at the valuation date 48.8 44.0 48.5 48.6
3. Nonvested inactive members
a. Number 37,205 4,841 42,046 43,657
b. Total member contributions with interest 59,730$ 7,431$ 67,161$ 72,457$
c. Average contributions with interest 1,605$ 1,535$ 1,597$ 1,660$
4. Service retirees
a. Number 39,702 3,760 43,462 41,675
b. Total annual benefits 857,037$ 58,157$ 915,193$ 881,896$
c. Average annual benefit 21,587$ 15,467$ 21,057$ 21,161$
d. Average age at the valuation date 69.0 64.5 68.6 68.5
5. Disabled retirees
a. Number 1,969 160 2,129 2,137
b. Total annual benefits 25,766$ 1,463$ 27,229$ 27,183$
c. Average annual benefit 13,086$ 9,146$ 12,790$ 12,720$
d. Average age at the valuation date 65.5 60.2 65.1 64.8
6. Beneficiaries
a. Number 4,855 450 5,305 5,197
b. Total annual benefits 70,148$ 4,430$ 74,578$ 71,385$
c. Average annual benefit 14,449$ 9,844$ 14,058$ 13,736$
d. Average age at the valuation date 70.5 66.0 70.2 70.6
(Total dollar amounts expressed in thousands)
Summary of Membership Data
Board Meeting- December 17, 2018 - Actuarial Valuations- GRS/ Ms. Karen Roggenkamp
90

Kentucky Employees Retirement System
Actuarial Valuation – June 30, 2018
Table 22 42
Percent Percent Percent
Increase Amount in Increase Increase
June 30, Number /(Decrease) Thousands /(Decrease) Amount /(Decrease)
(1) (2) (3) (4) (5) (6) (7)
2011 46,617 1,731,633 37,146$
2012 42,196 -9.5% 1,644,897 -5.0% 38,982 4.9%
2013 42,226 0.1% 1,644,409 0.0% 38,943 -0.1%
2014 40,365 -4.4% 1,577,496 -4.1% 39,081 0.4%
2015 39,056 -3.2% 1,544,234 -2.1% 39,539 1.2%
2016 37,779 -3.3% 1,529,249 -1.0% 40,479 2.4%
2017 37,234 -1.4% 1,531,535 0.1% 41,133 1.6%
2018 35,139 -5.6% 1,471,477 -3.9% 41,876 1.8%
2011 4,291 133,054$ 31,008$
2012 4,086 -4.8% 131,977 -0.8% 32,300 4.2%
2013 4,127 1.0% 132,015 0.0% 31,988 -1.0%
2014 4,024 -2.5% 129,076 -2.2% 32,077 0.3%
2015 3,886 -3.4% 128,680 -0.3% 33,114 3.2%
2016 3,959 1.9% 147,563 14.7% 37,273 12.6%
2017 4,047 2.2% 162,418 10.1% 40,133 7.7%
2018 3,929 -2.9% 158,213 -2.6% 40,268 0.3%
Non-Hazardous Members
Hazardous Members
Active Members Covered Payroll1 Average Annual Pay
Summary of Historical Active Membership
Board Meeting- December 17, 2018 - Actuarial Valuations- GRS/ Ms. Karen Roggenkamp
91

Kentucky Employees Retirement System
Actuarial Valuation – June 30, 2018
Table 23 43
0 1 2 3 4 5-9 10-14 15-19 20-24 25-29 30-34 35 & Over TotalAttained Count & Count & Count & Count & Count & Count & Count & Count & Count & Count & Count & Count & Count &
Age Avg. Comp. Avg. Comp. Avg. Comp. Avg. Comp. Avg. Comp. Avg. Comp. Avg. Comp. Avg. Comp. Avg. Comp. Avg. Comp. Avg. Comp. Avg. Comp. Avg. Comp.
Under 20 14 2 0 0 0 0 0 0 0 0 0 0 16
$22,301 $24,102 $0 $0 $0 $0 $0 $0 $0 $0 $0 $0 $22,526
20-24 437 243 84 48 17 2 1 0 0 0 0 0 832
$23,505 $30,683 $33,249 $32,676 $34,649 $34,709 $36,667 $0 $0 $0 $0 $0 $27,385
25-29 612 606 510 413 279 347 1 0 0 0 0 0 2,768
$26,304 $32,155 $34,692 $34,985 $35,379 $35,953 $33,855 $0 $0 $0 $0 $0 $32,553
30-34 386 392 402 394 323 1,312 312 7 0 0 0 0 3,528
$27,664 $33,818 $37,118 $37,597 $35,776 $39,665 $40,117 $45,686 $0 $0 $0 $0 $36,877
35-39 316 347 302 305 245 1,200 1,354 472 32 0 0 0 4,573
$28,032 $35,721 $40,884 $37,025 $38,474 $40,407 $43,711 $44,465 $50,070 $0 $0 $0 $40,363
40-44 271 265 274 221 217 864 1,129 1,310 427 18 2 0 4,998
$27,943 $35,234 $40,702 $37,298 $36,520 $42,223 $45,125 $47,886 $49,329 $56,396 $71,845 $0 $43,339
45-49 239 277 225 210 164 855 944 1,161 943 303 27 2 5,350
$27,724 $34,386 $38,218 $36,694 $36,005 $40,316 $45,231 $47,986 $51,897 $54,340 $65,033 $95,033 $44,596
50-54 178 189 204 162 203 701 864 863 787 435 115 8 4,709
$28,508 $36,896 $38,530 $37,014 $36,605 $40,577 $43,294 $45,779 $51,587 $56,031 $61,386 $62,035 $44,855
55-59 131 150 130 117 119 661 826 855 637 321 126 22 4,095
$29,429 $35,971 $39,296 $37,564 $38,001 $39,189 $42,922 $44,738 $48,846 $54,722 $62,378 $68,557 $44,184
60-64 86 99 89 70 71 475 628 632 433 197 71 38 2,889
$29,217 $36,759 $53,219 $40,946 $36,321 $42,722 $42,264 $45,496 $47,996 $54,312 $60,358 $73,616 $45,167
65 & Over 45 39 37 43 34 246 304 319 154 85 42 33 1,381
$34,944 $44,391 $69,895 $40,441 $49,018 $38,870 $46,090 $45,982 $54,432 $52,951 $67,485 $74,156 $47,576
Total 2,715 2,609 2,257 1,983 1,672 6,663 6,363 5,619 3,413 1,359 383 103 35,139
$27,047 $34,206 $38,900 $36,847 $36,764 $40,256 $43,820 $46,437 $50,537 $54,908 $62,502 $72,225 $41,876
Distribution of Active Members by Age and by Years of Service
Years of Credited Service
Non-Hazardous Members
Board Meeting- December 17, 2018 - Actuarial Valuations- GRS/ Ms. Karen Roggenkamp
92

Kentucky Employees Retirement System
Actuarial Valuation – June 30, 2018
Table 24 44
0 1 2 3 4 5-9 10-14 15-19 20-24 25-29 30-34 35 & Over TotalAttained Count & Count & Count & Count & Count & Count & Count & Count & Count & Count & Count & Count & Count &
Age Avg. Comp. Avg. Comp. Avg. Comp. Avg. Comp. Avg. Comp. Avg. Comp. Avg. Comp. Avg. Comp. Avg. Comp. Avg. Comp. Avg. Comp. Avg. Comp. Avg. Comp.
Under 20 1 0 0 0 0 0 0 0 0 0 0 0 1
$15,000 $0 $0 $0 $0 $0 $0 $0 $0 $0 $0 $0 $15,000
20-24 144 73 27 4 0 0 0 0 0 0 0 0 248
$23,029 $39,018 $42,451 $36,095 $0 $0 $0 $0 $0 $0 $0 $0 $30,060
25-29 171 136 105 103 73 70 0 0 0 0 0 0 658
$26,954 $38,250 $39,560 $40,761 $40,872 $42,776 $0 $0 $0 $0 $0 $0 $36,689
30-34 102 67 63 66 57 181 49 0 0 0 0 0 585
$26,447 $36,257 $40,527 $40,249 $40,211 $40,932 $44,935 $0 $0 $0 $0 $0 $38,015
35-39 55 40 41 28 24 144 187 36 1 0 0 0 556
$25,686 $36,978 $42,024 $38,792 $40,065 $42,127 $43,375 $46,140 $42,450 $0 $0 $0 $40,546
40-44 45 18 33 28 21 97 131 131 16 0 0 0 520
$26,160 $37,285 $37,737 $38,225 $41,973 $41,453 $46,046 $48,854 $53,564 $0 $0 $0 $42,991
45-49 35 34 33 26 16 90 121 107 42 8 0 0 512
$26,257 $36,846 $37,987 $39,821 $35,673 $41,764 $48,025 $49,540 $53,554 $53,760 $0 $0 $44,104
50-54 21 29 23 24 20 75 85 65 20 13 1 0 376
$28,037 $38,885 $38,299 $42,265 $37,794 $43,078 $44,259 $45,946 $50,783 $62,048 $54,115 $0 $43,147
55-59 19 11 18 9 13 50 55 51 13 6 1 0 246
$30,533 $38,743 $39,170 $44,932 $34,547 $40,331 $46,495 $47,910 $54,150 $72,784 $112,168 $0 $44,044
60-64 4 5 3 10 12 43 43 39 7 3 0 0 169
$25,997 $42,677 $43,512 $39,580 $41,194 $39,712 $41,949 $46,637 $46,435 $75,608 $0 $0 $42,723
65 & Over 2 0 3 2 3 13 20 9 2 1 3 0 58
$16,276 $0 $67,671 $35,239 $45,911 $35,270 $42,385 $47,090 $69,085 $96,877 $65,095 $0 $44,899
Total 599 413 349 300 239 763 691 438 101 31 5 0 3,929
$25,797 $37,893 $40,099 $40,253 $39,860 $41,497 $45,046 $48,023 $52,788 $64,423 $72,314 $0 $40,268
Distribution of Active Members by Age and by Years of ServiceHazardous Members
Years of Credited Service
Board Meeting- December 17, 2018 - Actuarial Valuations- GRS/ Ms. Karen Roggenkamp
93

Kentucky Employees Retirement System
Actuarial Valuation – June 30, 2018
Table 25 45
Distribution of Annuitant Monthly Benefit by Status and Age Distribution of Annuitant Monthly Benefit by Status and Age
Non-Hazardous Retirees and Beneficiaries Hazardous Retirees and Beneficiaries(Dollar amounts expressed in thousands) (Dollar amounts expressed in thousands)
Current Number of Number of Number of Number ofAge Annuitants Annuitants Annuitants Annuitants(1) (2) (4) (6) (8)
Under 50 525 $ 12,861 110 $ 1,547 498 $ 5,730 1,133 $ 20,138
50 - 54 1,753 47,528 187 2,819 181 2,183 2,121 52,530
55 - 59 3,913 101,415 268 3,566 314 4,245 4,495 109,226
60 - 64 6,946 165,460 405 5,475 511 7,569 7,862 178,504
65 - 69 9,685 212,463 384 4,994 629 10,798 10,698 228,255
70 - 74 7,534 156,803 261 3,236 659 11,130 8,454 171,169
75 - 79 4,501 85,661 188 2,339 652 10,290 5,341 98,290
80 - 84 2,593 43,131 112 1,272 576 8,723 3,281 53,126
85 - 89 1,466 22,115 42 444 471 6,073 1,979 28,632
90 And Over 786 9,600 12 75 364 3,408 1,162 13,083
Total 39,702 $ 857,037 1,969 $ 25,766 4,855 $ 70,148 46,526 $ 952,951
Retirement Disability
Amount
Total
Total Total Total
Survivors & Beneficiaries
Total
(9)
Annual Benefit
(3)
Annual BenefitAmount
(5) (7)
Annual BenefitAmount
Annual BenefitAmount
Board Meeting- December 17, 2018 - Actuarial Valuations- GRS/ Ms. Karen Roggenkamp
94

Kentucky Employees Retirement System
Actuarial Valuation – June 30, 2018
Table 26 46
Distribution of Annuitant Monthly Benefit by Status and Age Distribution of Annuitant Monthly Benefit by Status and Age
Hazardous Retirees and Beneficiaries Non-Hazardous Retirees and Beneficiaries(Dollar amounts expressed in thousands) (Dollar amounts expressed in thousands)
Current Number of Number of Number of Number ofAge Annuitants Annuitants Annuitants Annuitants(1) (2) (4) (6) (8)
Under 50 252 $ 4,813 27 $ 368 55 $ 536 334 $ 5,717
50 - 54 384 7,313 25 220 19 191 428 7,724
55 - 59 516 9,503 26 266 51 586 593 10,355
60 - 64 701 11,827 28 237 52 541 781 12,605
65 - 69 864 12,273 30 248 76 920 970 13,441
70 - 74 615 8,227 12 82 73 632 700 8,941
75 - 79 262 2,784 6 17 62 573 330 3,374
80 - 84 120 1,054 5 22 37 293 162 1,369
85 - 89 38 248 1 3 19 92 58 343
90 And Over 8 116 0 - 6 67 14 183
Total 3,760 $ 58,157 160 $ 1,463 450 $ 4,430 4,370 $ 64,050
(3) (5) (7) (9)
Annual Benefit Annual Benefit Annual Benefit Annual BenefitAmount Amount Amount Amount
Retirement Disability Survivors & Beneficiaries Total
Total Total Total Total
Board Meeting- December 17, 2018 - Actuarial Valuations- GRS/ Ms. Karen Roggenkamp
95
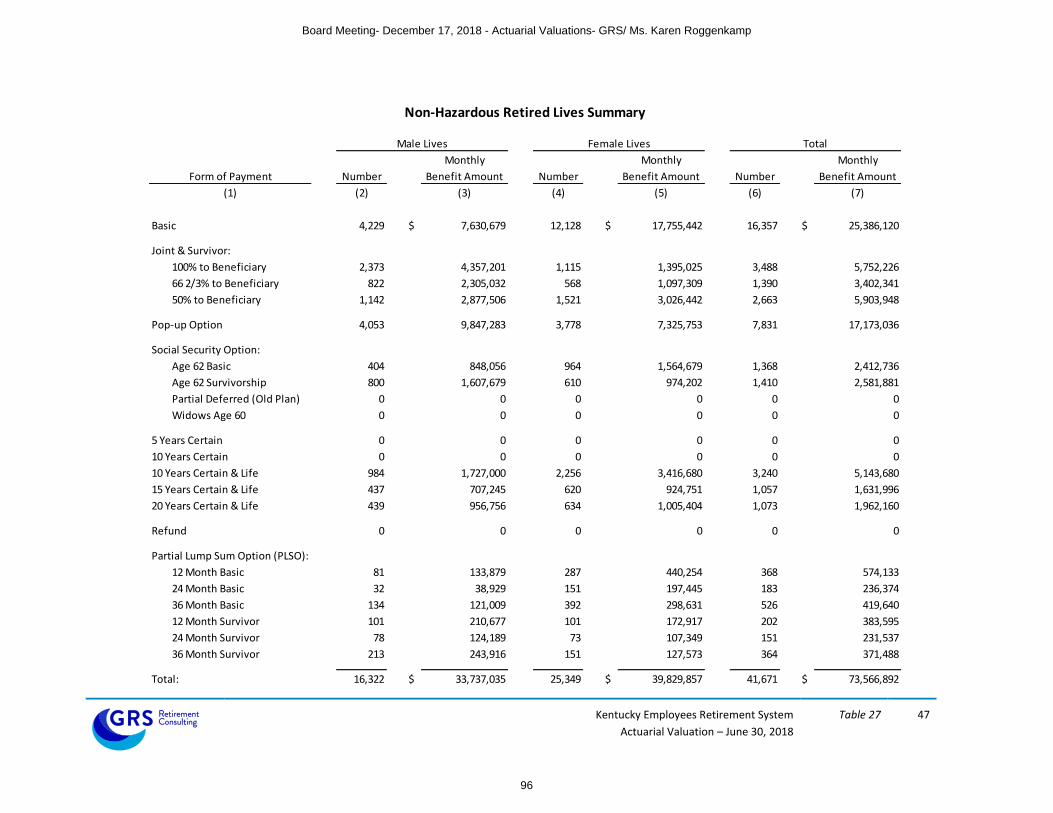
Kentucky Employees Retirement System
Actuarial Valuation – June 30, 2018
Table 27 47
Non-Hazardous Retired Lives Summary Hazardous Retired Lives Summary
Male Lives Female Lives Total
Monthly Monthly Monthly
Form of Payment Number Benefit Amount Number Benefit Amount Number Benefit Amount
(1) (2) (3) (4) (5) (6) (7)
Basic 4,229 $ 7,630,679 12,128 $ 17,755,442 16,357 $ 25,386,120
Joint & Survivor:
100% to Beneficiary 2,373 4,357,201 1,115 1,395,025 3,488 5,752,226
66 2/3% to Beneficiary 822 2,305,032 568 1,097,309 1,390 3,402,341
50% to Beneficiary 1,142 2,877,506 1,521 3,026,442 2,663 5,903,948
Pop-up Option 4,053 9,847,283 3,778 7,325,753 7,831 17,173,036
Social Security Option:
Age 62 Basic 404 848,056 964 1,564,679 1,368 2,412,736
Age 62 Survivorship 800 1,607,679 610 974,202 1,410 2,581,881
Partial Deferred (Old Plan) 0 0 0 0 0 0
Widows Age 60 0 0 0 0 0 0
5 Years Certain 0 0 0 0 0 0
10 Years Certain 0 0 0 0 0 0
10 Years Certain & Life 984 1,727,000 2,256 3,416,680 3,240 5,143,680
15 Years Certain & Life 437 707,245 620 924,751 1,057 1,631,996
20 Years Certain & Life 439 956,756 634 1,005,404 1,073 1,962,160
Refund 0 0 0 0 0 0
Partial Lump Sum Option (PLSO):
12 Month Basic 81 133,879 287 440,254 368 574,133
24 Month Basic 32 38,929 151 197,445 183 236,374
36 Month Basic 134 121,009 392 298,631 526 419,640
12 Month Survivor 101 210,677 101 172,917 202 383,595
24 Month Survivor 78 124,189 73 107,349 151 231,537
36 Month Survivor 213 243,916 151 127,573 364 371,488
Total: 16,322 $ 33,737,035 25,349 $ 39,829,857 41,671 $ 73,566,892
Board Meeting- December 17, 2018 - Actuarial Valuations- GRS/ Ms. Karen Roggenkamp
96

Kentucky Employees Retirement System
Actuarial Valuation – June 30, 2018
Table 28 48
Hazardous Retired Lives Summary Non-Hazardous Retired Lives Summary
Male Lives Female Lives Total
Monthly Monthly Monthly
Form of Payment Number Benefit Amount Number Benefit Amount Number Benefit Amount
(1) (2) (3) (4) (5) (6) (7)
Basic 647 $ 735,853 509 $ 553,691 1,156 $ 1,289,544
Joint & Survivor:
100% to Beneficiary 345 409,449 44 49,058 389 458,507
66 2/3% to Beneficiary 113 140,881 30 34,303 143 175,184
50% to Beneficiary 173 270,893 71 107,998 244 378,891
Pop-up Option 905 1,384,064 191 254,396 1,096 1,638,461
Social Security Option:
Age 62 Basic 58 69,929 32 29,856 90 99,786
Age 62 Survivorship 139 176,034 18 14,464 157 190,498
Partial Deferred (Old Plan) 0 0 0 0 0 0
Widows Age 60 0 0 0 0 0 0
5 Years Certain 0 0 0 0 0 0
10 Years Certain 47 67,579 13 17,031 60 84,610
10 Years Certain & Life 116 139,766 78 69,006 194 208,771
15 Years Certain & Life 49 61,660 25 25,079 74 86,739
20 Years Certain & Life 62 84,327 32 42,001 94 126,328
Refund 0 0 0 0 0 0
Partial Lump Sum Option (PLSO):
12 Month Basic 10 10,601 13 10,878 23 21,479
24 Month Basic 14 14,040 9 7,948 23 21,987
36 Month Basic 43 37,150 23 20,016 66 57,166
12 Month Survivor 20 26,786 6 5,151 26 31,937
24 Month Survivor 18 25,731 9 11,029 27 36,760
36 Month Survivor 43 42,999 15 18,695 58 61,695
Total: 2,802 $ 3,697,742 1,118 $ 1,270,600 3,920 $ 4,968,342
Board Meeting- December 17, 2018 - Actuarial Valuations- GRS/ Ms. Karen Roggenkamp
97

Kentucky Employees Retirement System
Actuarial Valuation – June 30, 2018
Table 30 49
Non-Hazardous Beneficiary Lives Summary Hazardous Beneficiary Lives Summary
Male Lives Female Lives Total
Monthly Monthly Monthly
Form of Payment Number Benefit Amount Number Benefit Amount Number Benefit Amount
(1) (2) (3) (4) (5) (6) (7)
Basic 16 $ 8,783 33 $ 35,052 49 $ 43,835
Joint & Survivor:
100% to Beneficiary 372 317,653 1,444 1,600,258 1,816 1,917,911
66 2/3% to Beneficiary 82 87,250 308 380,611 390 467,861
50% to Beneficiary 175 136,519 429 346,393 604 482,912
Pop-up Option 225 333,328 709 1,239,721 934 1,573,049
Social Security Option:
Age 62 Basic 1 1,293 10 9,527 11 10,820
Age 62 Survivorship 71 97,069 313 541,231 384 638,299
Partial Deferred (Old Plan) 0 0 0 0
Widows Age 60 0 0 3 1,475 3 1,475
5 Years Certain 28 43,626 64 54,336 92 97,962
10 Years Certain 81 64,364 103 70,223 184 134,587
10 Years Certain & Life 34 31,325 43 41,756 77 73,081
15 Years Certain & Life 18 23,921 41 39,145 59 63,066
20 Years Certain & Life 24 42,985 62 115,242 86 158,227
Refund 0 0 0 0 0 0
Partial Lump Sum Option (PLSO):
12 Month Basic 0 0 1 1,792 1 1,792
24 Month Basic 0 0 0 0 0 0
36 Month Basic 0 0 2 3,357 2 3,357
12 Month Survivor 6 10,098 26 43,945 32 54,044
24 Month Survivor 12 15,777 28 27,132 40 42,909
36 Month Survivor 20 16,520 71 63,986 91 80,506
Total: 1,165 $ 1,230,513 3,690 $ 4,615,180 4,855 $ 5,845,692
Board Meeting- December 17, 2018 - Actuarial Valuations- GRS/ Ms. Karen Roggenkamp
98

Kentucky Employees Retirement System
Actuarial Valuation – June 30, 2018
Table 30 50
Hazardous Beneficiary Lives Summary Non-Hazardous Beneficiary Lives Summary
Male Lives Female Lives Total
Monthly Monthly Monthly
Form of Payment Number Benefit Amount Number Benefit Amount Number Benefit Amount
(1) (2) (3) (4) (5) (6) (7)
Basic 2 $ 1,052 7 $ 4,483 9 $ 5,535
Joint & Survivor:
100% to Beneficiary 12 4,283 148 107,980 160 112,263
66 2/3% to Beneficiary 0 0 21 11,377 21 11,377
50% to Beneficiary 3 1,862 33 12,194 36 14,057
Pop-up Option 13 13,893 102 107,548 115 121,441
Social Security Option:
Age 62 Basic 0 0 0 0 0 0
Age 62 Survivorship 1 483 36 40,982 37 41,465
Partial Deferred (Old Plan) 0 0 0 0 0 0
Widows Age 60 0 0 0 0 0 0
5 Years Certain 1 635 6 5,089 7 5,723
10 Years Certain 3 3,405 16 16,102 19 19,507
10 Years Certain & Life 5 3,601 4 2,824 9 6,425
15 Years Certain & Life 2 819 4 2,627 6 3,445
20 Years Certain & Life 0 0 7 5,926 7 5,926
Refund 0 0 0 0 0 0
Partial Lump Sum Option (PLSO):
12 Month Basic 0 0 0 0 0 0
24 Month Basic 0 0 0 0 0 0
36 Month Basic 0 0 1 126 1 126
12 Month Survivor 0 0 4 4,145 4 4,145
24 Month Survivor 1 995 3 2,022 4 3,017
36 Month Survivor 2 706 13 13,996 15 14,702
Total: 45 $ 31,733 405 $ 337,420 450 $ 369,153
Board Meeting- December 17, 2018 - Actuarial Valuations- GRS/ Ms. Karen Roggenkamp
99

Kentucky Employees Retirement System
Actuarial Valuation – June 30, 2018
Table 31 51
Added to Removed
Rolls from Rolls % Increase Average
Year Annual in Annual Annual
Ended Number Number Number Benefits Benefit Benefit
(1) (2) (3) (4) (5) (6) (7)
2011 1,592 940 38,597 821,197$ 21,276$
2012 1,707 1,078 39,226 844,881 2.9% 21,539
2013 1,982 1,014 40,194 872,140 3.2% 21,698
2014 2,067 1,038 41,223 866,047 -0.7% 21,009
2015 2,140 1,094 42,269 883,578 2.0% 20,904
2016 2,441 706 44,004 934,930 5.8% 21,246
2017 2,181 1,269 44,916 921,302 -1.5% 20,512
2018 2,853 1,243 46,526 952,951 3.4% 20,482
2011 288 59 3,064 45,609$ 14,885$
2012 243 54 3,253 49,231 7.9% 15,134
2013 229 52 3,430 51,122 3.8% 14,904
2014 256 66 3,620 54,272 6.2% 14,992
2015 203 65 3,758 56,431 4.0% 15,016
2016 237 29 3,966 59,001 4.6% 14,877
2017 206 79 4,093 59,162 0.3% 14,454
2018 321 44 4,370 64,050 8.3% 14,657
Schedule of Retirants Added to And Removed from Rolls(Dollar amounts except average allowance expressed in thousands)
Non-Hazardous
Hazardous
Rolls End of the Year
Board Meeting- December 17, 2018 - Actuarial Valuations- GRS/ Ms. Karen Roggenkamp
100

APPENDIX A
ACTUARIAL ASSUMPTIONS AND METHODS
Board Meeting- December 17, 2018 - Actuarial Valuations- GRS/ Ms. Karen Roggenkamp
101

Kentucky Employees Retirement System
Actuarial Valuation – June 30, 2018
Appendix A 53
Summary of Actuarial Methods and Assumptions
The following presents a summary of the actuarial assumptions and methods used in the valuation of the
Kentucky Employees Retirement System.
In general, the assumptions and methods used in the valuation are based on the actuarial experience study for the five-year period ending June 30, 2013, submitted April 30, 2014, and adopted by the Board on December 4, 2014. The investment return, price inflation, and payroll growth assumption were adopted by the Board in May and July 2017 for use with the June 30, 2017 valuation in order to reflect future economic expectations. Investment return rate:
Assumed annual rate of 5.25% net of investment expenses for the non-hazardous retirement fund Assumed annual rate of 6.25% net of investment expenses for the hazardous retirement fund, non-hazardous insurance fund, and hazardous insurance fund
Price Inflation:
Assumed annual rate of 2.30%
Rates of Annual Salary Increase:
Assumed rates of annual salary increases are shown below.
Service Years
Annual Rates of Salary Increases
Merit & Seniority Price Inflation & Productivity
Total Increase
Non-Hazardous Hazardous Non-Hazardous Hazardous
0 12.50% 16.50% 3.05% 15.55% 19.55%
1 4.50% 4.50% 3.05% 7.55% 7.55%
2 2.00% 2.50% 3.05% 5.05% 5.55%
3 1.50% 2.00% 3.05% 4.55% 5.05%
4 1.50% 1.50% 3.05% 4.55% 4.55%
5 1.50% 1.00% 3.05% 4.55% 4.05%
6 1.00% 0.50% 3.05% 4.05% 3.55%
7 1.00% 0.50% 3.05% 4.05% 3.55%
8 1.00% 0.50% 3.05% 4.05% 3.55%
9 0.50% 0.50% 3.05% 3.55% 3.55%
10 & Over 0.50% 0.50% 3.05% 3.55% 3.55%
Board Meeting- December 17, 2018 - Actuarial Valuations- GRS/ Ms. Karen Roggenkamp
102

Kentucky Employees Retirement System
Actuarial Valuation – June 30, 2018
Appendix A 54
Retirement rates:
Assumed annual rates of retirement are shown below. Rates are only applicable for members who are eligible for a service retirement.
Age
Non-Hazardous
Service
Hazardous
Members participating
before 9/1/20081
Members participating on or after 9/1/20082
Members participating
before 9/1/20083
Members participating on or after 9/1/20084
55 8.0% 20 40.0%
56 8.0% 21 40.0%
57 8.0% 22 40.0%
58 8.0% 23 40.0%
59 8.0% 24 40.0%
60 10.0% 10.0% 25 47.0% 40.0%
61 20.0% 20.0% 26 47.0% 40.0%
62 20.0% 20.0% 27 47.0% 40.0%
63 20.0% 20.0% 28 47.0% 40.0%
64 20.0% 20.0% 29 47.0% 40.0%
65 20.0% 25.0% 30 47.0% 47.0%
66 20.0% 25.0% 31 47.0% 47.0%
67 20.0% 25.0% 32 50.0% 47.0%
68 20.0% 25.0% 33 50.0% 47.0%
69 20.0% 25.0% 34 50.0% 47.0%
70 20.0% 25.0% 35 60.0% 47.0%
71 20.0% 25.0% 36 60.0% 47.0%
72 20.0% 25.0% 37 60.0% 50.0%
73 20.0% 25.0% 38 60.0% 50.0%
74 20.0% 25.0% 39 60.0% 50.0%
75 100.0% 100.0% 40 60.0% 60.0%
1 If service is at least 27 years, the rate is 35%. 2 If age plus service is at least 87, the rate is 35%. 3 The annual rate of service retirement is 100% at age 65. 4 The annual rate of service retirement is 100% at age 60.
Board Meeting- December 17, 2018 - Actuarial Valuations- GRS/ Ms. Karen Roggenkamp
103
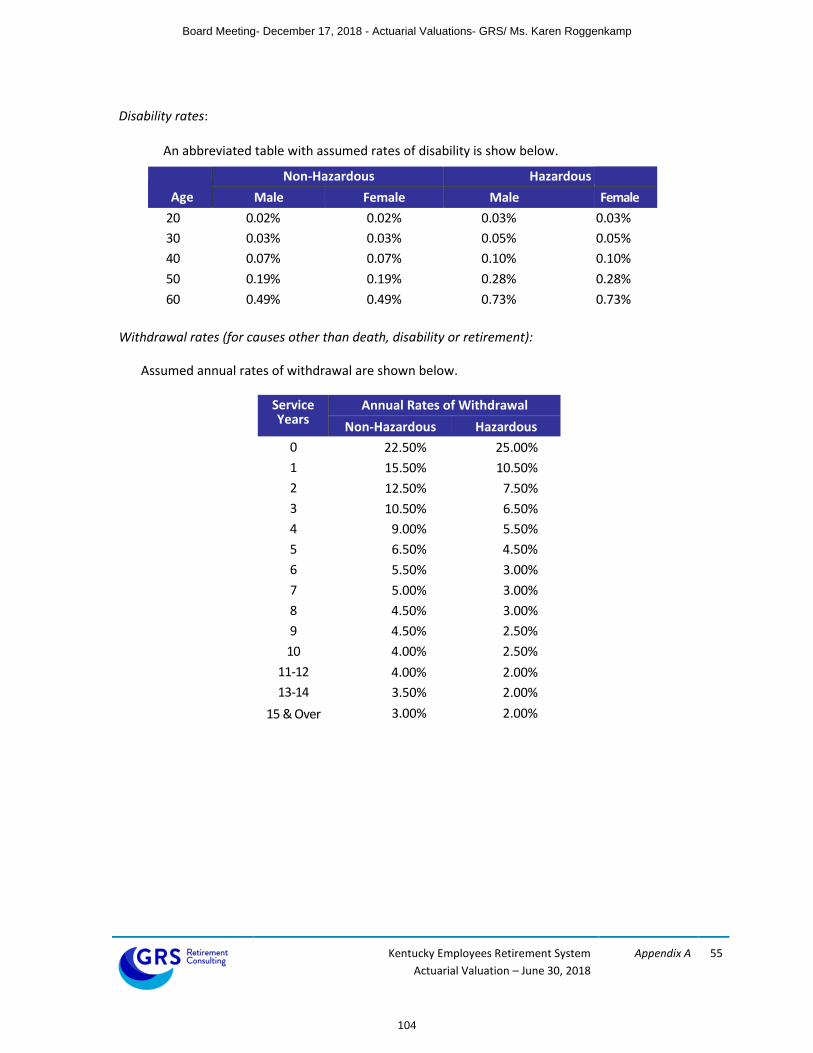
Kentucky Employees Retirement System
Actuarial Valuation – June 30, 2018
Appendix A 55
Disability rates:
An abbreviated table with assumed rates of disability is show below.
Age
Non-Hazardous Hazardous
Male Female Male Female
20 0.02% 0.02% 0.03% 0.03%
30 0.03% 0.03% 0.05% 0.05%
40 0.07% 0.07% 0.10% 0.10%
50 0.19% 0.19% 0.28% 0.28%
60 0.49% 0.49% 0.73% 0.73%
Withdrawal rates (for causes other than death, disability or retirement):
Assumed annual rates of withdrawal are shown below.
Service Years
Annual Rates of Withdrawal
Non-Hazardous Hazardous
0 22.50% 25.00%
1 15.50% 10.50%
2 12.50% 7.50%
3 10.50% 6.50%
4 9.00% 5.50%
5 6.50% 4.50%
6 5.50% 3.00%
7 5.00% 3.00%
8 4.50% 3.00%
9 4.50% 2.50%
10 4.00% 2.50%
11-12 4.00% 2.00%
13-14 3.50% 2.00%
15 & Over 3.00% 2.00%
Board Meeting- December 17, 2018 - Actuarial Valuations- GRS/ Ms. Karen Roggenkamp
104

Kentucky Employees Retirement System
Actuarial Valuation – June 30, 2018
Appendix A 56
Mortality Assumption:
Pre-retirement mortality: RP-2000 Combined Mortality Table projected with Scale BB to 2013. Male mortality rates are multiplied by 50% and female mortality rates are multiplied by 30%.
Post-retirement mortality (non-disabled): RP-2000 Combined Mortality Table projected with Scale BB to 2013. Female mortality rates are set back one year.
Post-retirement mortality (disabled): RP-2000 Combined Disabled Mortality Table projected with Scale BB to 2013. Male mortality rates are set back four years.
At the time of the last experience study, performed as of June 30, 2013, this mortality assumption provided 37% and 19% margin for future improvement for males and females, respectively.
Marital status:
100% of employees are assumed to be married, with the female spouse 3 years younger than the male spouse.
Line of Duty Disability
0% of disabilities are assumed to occur in the line of duty
Line of Duty Death
25% of deaths are assumed to occur in the line of duty
Dependent Children:
For members in the Hazardous Plan who receive a duty-related death benefit, the member is assumed to be survived by two dependent children, each age 6 with payments for 15 years.
Form of Payment:
Members are assumed to elect a life-only annuity at retirement.
Board Meeting- December 17, 2018 - Actuarial Valuations- GRS/ Ms. Karen Roggenkamp
105

Kentucky Employees Retirement System
Actuarial Valuation – June 30, 2018
Appendix A 57
Actuarial Cost Method:
Entry Age Normal, Level Percentage of Pay. The Entry Age Normal actuarial cost method allocates the System’s actuarial present value of future benefits to various periods based upon service. The portion of the present value of future benefits allocated to years of service prior to the valuation date is the actuarial accrued liability, and the portion allocated to years following the valuation date is the present value of future normal costs. The normal cost is determined for each active member as the level percent of pay necessary to fully fund the expected benefits to be earned over the career of each individual active member. The normal cost is partially funded with active member contributions with the remainder funded by employer contributions.
Health Care Age Related Morbidity/Claims Utilization:
To model the impact of aging on the underlying health care costs for Medicare retirees, the valuation relied on the Society of Actuaries’ 2013 Study “Health Care Costs – From Birth to Death”. Table 4 (Development of Plan Specific Medicare Age Curve) was used to model the impact of aging for ages 65 and over.
Board Meeting- December 17, 2018 - Actuarial Valuations- GRS/ Ms. Karen Roggenkamp
106

Kentucky Employees Retirement System
Actuarial Valuation – June 30, 2018
Appendix A 58
Health Care Cost Trend Rates1:
January 1
Non-Medicare Plans
Medicare Plans
Dollar Contribution2
2020 7.00% 5.00% 1.50%
2021 6.75% 4.90% 1.50%
2022 6.50% 4.80% 1.50%
2023 6.25% 4.70% 1.50%
2024 6.00% 4.60% 1.50%
2025 5.75% 4.50% 1.50%
2026 5.50% 4.40% 1.50%
2027 5.25% 4.30% 1.50%
2028 5.00% 4.20% 1.50%
2029 4.75% 4.10% 1.50%
2030 4.50% 4.05% 1.50%
2031 4.25% 4.05% 1.50%
2032 & Beyond 4.05% 4.05% 1.50%
1All increases are assumed to occur on January 1. The 2019 premiums were known at the time of the valuation and were incorporated into the liability measurement. 2Applies to members participating on or after July 1, 2003
Health care trend assumptions are based on the model issued by the Society of Actuaries “Getzen model of Long-Run Medical Cost Trends for the SOA; Thomas E. Getzen, iHEA and Temple University 2014 © Society of Actuaries.
The underlying assumptions used to develop the health care trend rates include:
A short run period-this is a period for which anticipated health care trend rates are manually set based on local information as well as plan-specific and carrier information.
Long term real GDP growth- 1.75%
Long term rate of inflation- 2.30%
Long term nominal GDP growth – 4.05%
Year that excess rate converges to 0- 15 years from the valuation
Health care trend rates are thus the manually set rates for the short run period and rates which decline to an ultimate trend rate which equals the assumed nominal long term GDP growth rate.
Board Meeting- December 17, 2018 - Actuarial Valuations- GRS/ Ms. Karen Roggenkamp
107
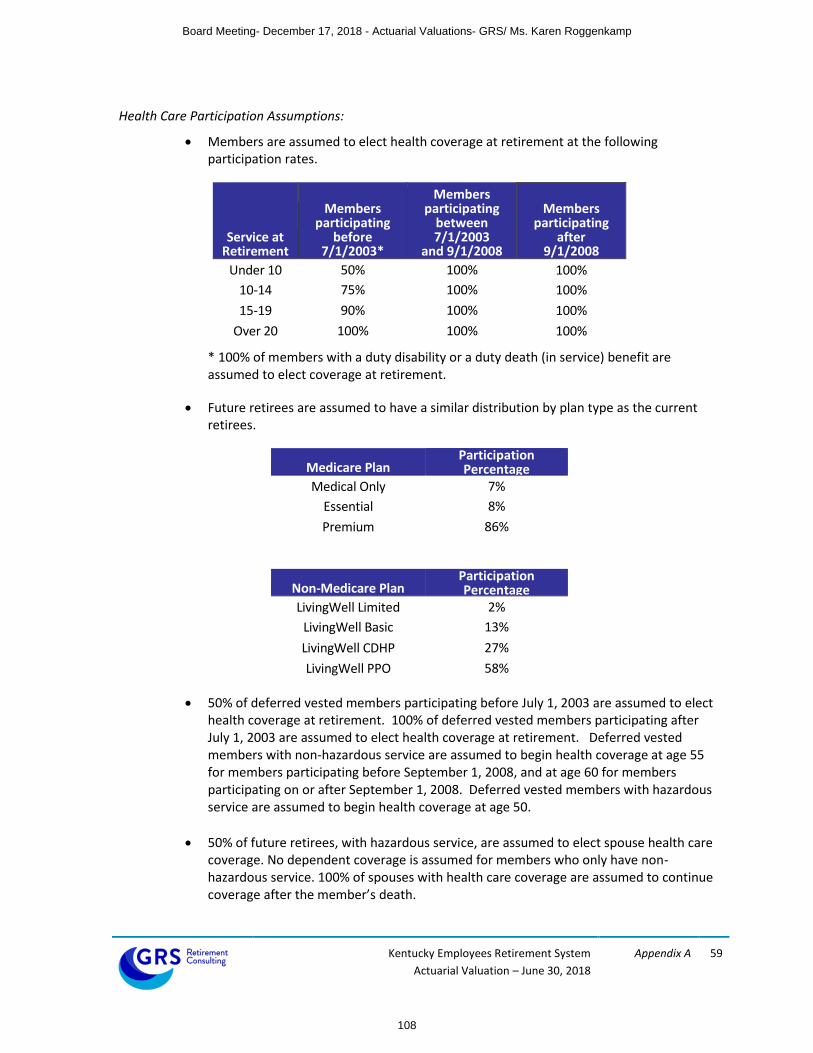
Kentucky Employees Retirement System
Actuarial Valuation – June 30, 2018
Appendix A 59
Health Care Participation Assumptions:
Members are assumed to elect health coverage at retirement at the following participation rates.
Service at Retirement
Members participating
before 7/1/2003*
Members participating
between 7/1/2003
and 9/1/2008
Members participating
after 9/1/2008
Under 10 50% 100% 100%
10-14 75% 100% 100%
15-19 90% 100% 100%
Over 20 100% 100% 100%
* 100% of members with a duty disability or a duty death (in service) benefit are assumed to elect coverage at retirement.
Future retirees are assumed to have a similar distribution by plan type as the current retirees.
Medicare Plan Participation Percentage
Medical Only 7%
Essential 8%
Premium 86%
Non-Medicare Plan Participation Percentage
LivingWell Limited 2%
LivingWell Basic 13%
LivingWell CDHP 27%
LivingWell PPO 58%
50% of deferred vested members participating before July 1, 2003 are assumed to elect health coverage at retirement. 100% of deferred vested members participating after July 1, 2003 are assumed to elect health coverage at retirement. Deferred vested members with non-hazardous service are assumed to begin health coverage at age 55 for members participating before September 1, 2008, and at age 60 for members participating on or after September 1, 2008. Deferred vested members with hazardous service are assumed to begin health coverage at age 50.
50% of future retirees, with hazardous service, are assumed to elect spouse health care coverage. No dependent coverage is assumed for members who only have non-hazardous service. 100% of spouses with health care coverage are assumed to continue coverage after the member’s death.
Board Meeting- December 17, 2018 - Actuarial Valuations- GRS/ Ms. Karen Roggenkamp
108

Kentucky Employees Retirement System
Actuarial Valuation – June 30, 2018
Appendix A 60
Excise (“Cadillac”) Tax:
For taxable years beginning after December 31, 2021, a 40% excise tax will be required to be paid (by the employer and/or insurer) on the aggregate cost of the health plan in excess of certain legislated thresholds. For 2018, the thresholds are $850 per month for individual coverage and $2,292 per month for family coverage.
Both Actuarial Standard of Practice No. 6 and GASB Statement Nos. 74 and 75 reference this tax, and, in accordance with these standards an estimate of the impact of the Cadillac tax has been included in this valuation.
Assumptions and methods used to determine the impact of the Cadillac Tax include:
2018 thresholds of $850/$2,292 were indexed annually by 2.30%.
Premium data submitted was not adjusted for permissible exclusions to the Cadillac Tax.
There were no special adjustments to the dollar limit other than those permissible for non-Medicare retirees over 55.
In this valuation, the impact of the Cadillac Tax has been calculated by increasing the employer paid premiums for Non-Medicare retirees, who became participants before July 1, 2003, by 3.6%. Non-Medicare retirees who became participants after July 1, 2003 receive dollar subsidies per year of service, which are not expected to exceed the overall Non-Medicare premiums. As a result, the costs attributable to the Cadillac Tax for members who became participants after July 1, 2003 will be paid by the retirees.
Changes in Assumptions since the prior valuation:
None.
Board Meeting- December 17, 2018 - Actuarial Valuations- GRS/ Ms. Karen Roggenkamp
109

Kentucky Employees Retirement System
Actuarial Valuation – June 30, 2018
Appendix A 61
Development of Baseline Claims Cost
For non-Medicare retirees, the initial per capita costs were based on the plan premiums effective
January 1, 2019, and are used for both current and future retirees. An inherent assumption in this
methodology is that the projected future retirees will have a similar distribution by plan type as the
current retirees. The spouse/dependent premium of $865.74 for non-Medicare retirees is based on a
blending of Family and Couple premiums for the current retirees that have over 4 years of hazardous
service. The fully-insured premiums KRS pays the Kentucky Employees’ Health Plan (KEHP) are blended
rates based on the combined experience of active and retired members. Because the average cost of
providing health care benefits to retirees under age 65 is higher than the average cost of providing
health care benefits to active employees, there is an implicit rate subsidy for the non-Medicare eligible
retirees. Actuarial Standard of Practice No. 6 (ASOP No. 6) requires aging subsidies (or implicit rate
subsidies) to be recognized. However, the KRS health insurance trusts are only used to reimburse KEHP
for the employer’s portion of the blended premiums. Said another way, the trusts are not used to fund
the difference between the underlying retiree claims and the blended KEHP premiums. As a result, the
retiree health care liabilities developed in this report for the non-Medicare retirees are based solely on
the premiums charged by KEHP, without any age-adjustment. GASB Statements No. 74 and No. 75
prohibit such a deviation from ASOP No. 6. The liabilities developed in this report are solely for the
purpose of funding the benefits paid by the health insurance funds and are not appropriate for financial
statement disclosures required by GASB. GRS provides separate GASB reports to KRS which include the
liabilities associated with the implicit rate subsidy.
FOR THOSE NOT ELIGIBLE FOR MEDICARE
AGE MEMBER SPOUSE/DEPENDENTS
<65 $717.39 $865.74
For Medicare retirees, the initial per capita costs were estimated based on the plan premiums effective
January 1, 2019, and are used for both current and future retirees. An inherent assumption in this
methodology is that the projected future retirees will have a similar distribution by plan type as the
current retirees. Age graded and sex distinct premiums are utilized for retirees over the age of 65.
These costs are appropriate for the unique age and sex distribution currently existing. Over the future
years covered by this valuation, the age and sex distribution will most likely change. Therefore, our
process “distributes” the average premium over all age/sex combinations and assigns a unique
premium for each combination. The age/sex specific costs more accurately reflect the health care
utilization and cost at that age.
FOR THOSE ELIGIBLE FOR MEDICARE
AGE MALE FEMALE
65 75 85
$183.50 214.69 227.02
$173.08 209.49 229.07
Board Meeting- December 17, 2018 - Actuarial Valuations- GRS/ Ms. Karen Roggenkamp
110
Kentucky Employees Retirement System
Actuarial Valuation – June 30, 2018
Appendix A 62
Appendix B of the report provides a full schedule of premiums.
Mehdi Riazi is a Member of the American Academy of Actuaries (MAAA) and meets the Qualification Standards of the American Academy of Actuaries to render the actuarial opinions contained herein.
Mehdi Riazi, FSA, EA, MAAA
Board Meeting- December 17, 2018 - Actuarial Valuations- GRS/ Ms. Karen Roggenkamp
111

APPENDIX B
BENEFIT PROVISIONS
Board Meeting- December 17, 2018 - Actuarial Valuations- GRS/ Ms. Karen Roggenkamp
112
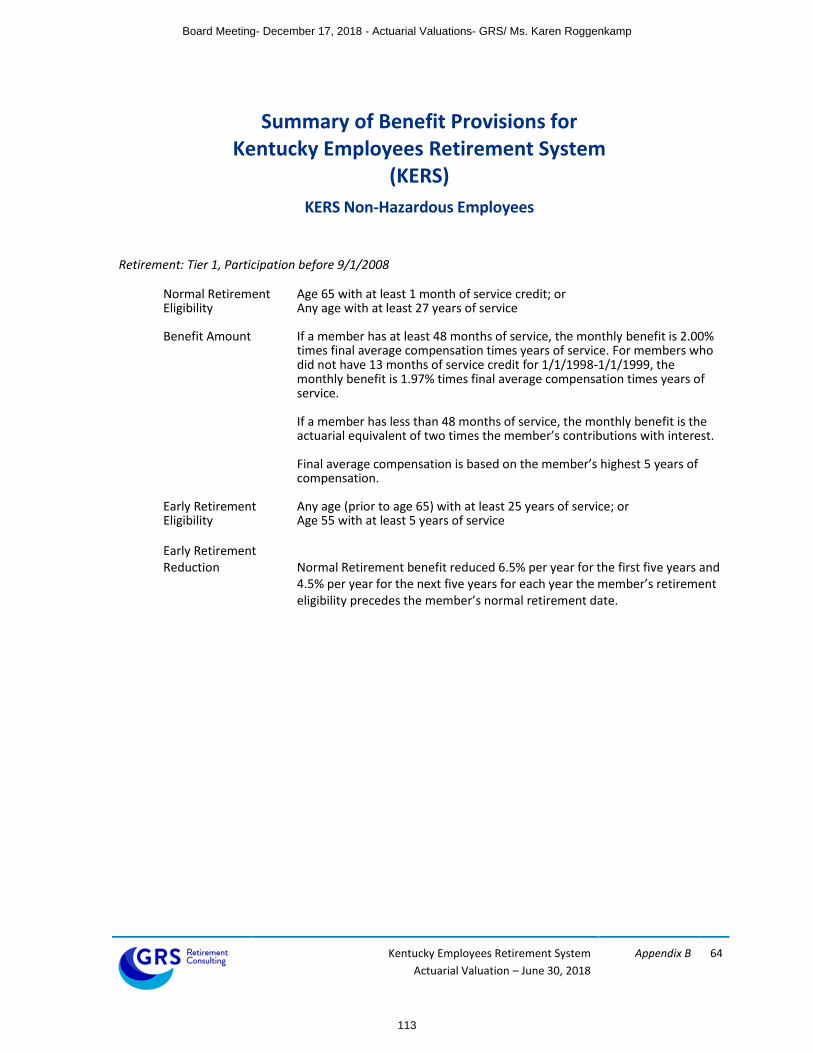
Kentucky Employees Retirement System
Actuarial Valuation – June 30, 2018
Appendix B 64
Summary of Benefit Provisions for Kentucky Employees Retirement System
(KERS)
KERS Non-Hazardous Employees
Retirement: Tier 1, Participation before 9/1/2008
Normal Retirement Age 65 with at least 1 month of service credit; or Eligibility Any age with at least 27 years of service
Benefit Amount If a member has at least 48 months of service, the monthly benefit is 2.00% times final average compensation times years of service. For members who did not have 13 months of service credit for 1/1/1998-1/1/1999, the monthly benefit is 1.97% times final average compensation times years of service.
If a member has less than 48 months of service, the monthly benefit is the actuarial equivalent of two times the member’s contributions with interest.
Final average compensation is based on the member’s highest 5 years of compensation.
Early Retirement Any age (prior to age 65) with at least 25 years of service; or Eligibility Age 55 with at least 5 years of service Early Retirement Reduction Normal Retirement benefit reduced 6.5% per year for the first five years and
4.5% per year for the next five years for each year the member’s retirement eligibility precedes the member’s normal retirement date.
Board Meeting- December 17, 2018 - Actuarial Valuations- GRS/ Ms. Karen Roggenkamp
113

Kentucky Employees Retirement System
Actuarial Valuation – June 30, 2018
Appendix B 65
KERS Non-Hazardous Employees (continued)
Retirement: Tier 2, Participation on or after 9/1/2008 but before 1/1/2014
Normal Retirement Age 65 with at least 5 years of service; or Eligibility Rule of 87 (Age 57 or older if age plus service equals 87)
Benefit Amount The monthly benefit is equal to the applicable benefit multiplier times final average compensation times years of service.
Years of Service Benefit Multiplier 10 or less 1.10%
10-20 1.30% 20-26 1.50% 26-30 1.75%
Greater than 30* 2.00%
* The 2.00% benefit multiplier only applies to service credit in excess of 30 years. If a member has greater than 30 years of service at retirement, service prior to 30 years will be multiplied by the 1.75% benefit multiplier.
Final compensation is based on the member’s last 5 years of compensation.
Early Retirement Eligibility Age 60 with at least 10 years of service Early Retirement Reduction Normal Retirement benefit reduced 6.5% per year for the first five years
and 4.5% per year for the next five years for each year the member’s retirement date precedes the member’s normal retirement eligibility.
Retirement: Tier 3, Participation on or after 1/1/2014
Normal Retirement Age 65 with at least 5 years of service; or Eligibility Rule of 87 (Age 57 or older if age plus service equals 87)
Benefit Amount Each year that the member is active, a 4.00% employer pay credit and the employee’s 5.00% contribution will be credited to each member’s hypothetical cash balance account. The hypothetical account will earn interest at a minimum rate of 4%, annually. If the System’s geometric average net investment return for the previous five years exceeds 4%, then the hypothetical account will be credited with an additional amount of interest in that year equal to 75% of the amount of the return which exceeds 4%. All interest credits will be applied to the hypothetical account balance on June 30 based on the account balance as of June 30 of the previous year.
At retirement, the member’s hypothetical account balance may be converted into an annuity based on an actuarial factor.
Early Retirement Eligibility N/A
Board Meeting- December 17, 2018 - Actuarial Valuations- GRS/ Ms. Karen Roggenkamp
114

Kentucky Employees Retirement System
Actuarial Valuation – June 30, 2018
Appendix B 66
KERS Non-Hazardous Employees (continued)
Deferred Vested Benefit: Tier 1, Participation before 9/1/2008
Eligibility At least 1 month of service credit
Benefit Amount Normal retirement benefit deferred to normal retirement age, or a reduced retirement benefit at an early retirement age
Deferred Vested Benefit: Tier 2, Participation on or after 9/1/2008 but before 1/1/2014
Eligibility 5 years of service
Benefit Amount Normal retirement benefit deferred to normal retirement age, or a reduced retirement benefit at an early retirement age
Deferred Vested Benefit Tier 3, Participation on or after 1/1/2014
Eligibility 5 years of service
Benefit Amount At termination of employment, members may choose to leave their account balance with the System and retire once they are eligible. The hypothetical account balance will earn 4% annual interest after termination. Members may also choose to withdrawal their entire accumulated balance. If a member does not have 5 years of service at termination, the member is eligible to receive a partial refund of their account balance. This refund includes the member’s contributions with interest.
Disability Retirement: Participation before 8/1/2004
Eligibility 60 months of service (requirement is waived if line of duty disability)
Disability Benefit Disability benefits are calculated in the same manner as the normal retirement benefit with years of service and final compensation being determined as of the date of disability, except that service credit shall be added to the person’s total service beginning with the last date of paid employment and continuing to the member’s 65th birthday, with total service not exceeding 25 years. Total service credit added shall not be greater than the member’s actual service at disability. For members with at least 25 years of service on the last day of paid employment but less than 27 years of service, total service shall be 27 years. For members with 27 or more years of service credit, actual service will be used.
Board Meeting- December 17, 2018 - Actuarial Valuations- GRS/ Ms. Karen Roggenkamp
115

Kentucky Employees Retirement System
Actuarial Valuation – June 30, 2018
Appendix B 67
KERS Non-Hazardous Employees (continued)
Disability Retirement: Participation on or after 8/1/2004 but before 1/1/2014
Eligibility 60 months of service (requirement is waived if line of duty disability)
Disability Benefit The higher of 20% of the member’s final monthly rate of pay or the member’s normal retirement benefit (without reduction for early retirement) with years and final compensation being determined as of the date of disability.
Disability Retirement: Participation on or after 1/1/2014
Eligibility 60 months of service (requirement is waived if line of duty disability)
Disability Benefit The higher of 20% of the member’s final monthly rate of pay or the member’s retirement benefit calculated at the member’s normal retirement date.
Line of Duty Disability Benefit
Disability Benefit If the disability is a direct result of an act in the line of duty, the benefit shall not be less than 25% of the member’s final monthly rate of pay. Additionally, each eligible dependent child will receive 10% of the member’s monthly final rate of pay up to a maximum of 40%.
Pre-Retirement Death Benefit
Eligibility Eligible for early or normal retirement; or Under age 55 with at least 60 months of service and actively working at the
time of death; or At least 144 months of service, if no longer actively working
Spouse Benefit The member’s retirement benefit calculated in the same manner as if the member had retired on the day of the member’s death and elected a 100% joint and survivor benefit. The benefit is actuarially reduced if the member dies prior to their normal retirement age.
Pre-Retirement Death Benefit (Death in the Line of Duty)
Eligibility One month of service credit
Spouse Benefit A $10,000 lump sum payment plus a monthly payment of 75% of the deceased member’s final monthly average pay. Each dependent child will receive 10% of average pay (not to exceed a total child benefit of 25% while the spouse is alive). A spouse may also elect the non-line of duty death benefit.
Child Benefit In the event there is no surviving spouse, the benefit is 50% of final monthly average pay for one child, 65% of final average pay for two children, or 75% of final average pay for three or more eligible children.
Board Meeting- December 17, 2018 - Actuarial Valuations- GRS/ Ms. Karen Roggenkamp
116

Kentucky Employees Retirement System
Actuarial Valuation – June 30, 2018
Appendix B 68
KERS Non-Hazardous Employees (continued)
Post-Retirement Death Benefit
Eligibility 48 months of service, and in receipt of retirement benefits
Death Benefit A $5,000 lump sum payment Member Contributions
Tier 1, Participation before 9/1/2008 5% of creditable compensation. Members who do not receive a retirement
benefit are entitled to a full refund of contributions with interest. The annual interest rate is set by the KRS board, not less than 2.0%.
Tier 2, Participation on or after 9/1/2008 but before 1/1/2014 5% of creditable compensation plus 1% of creditable compensation, which is
deposited into the 401(h) account and is not refundable. Members who do not receive a retirement benefit are entitled to a refund of non-401(h) contributions with interest. The annual interest rate is 2.5%.
Tier 3, Participation after 1/1/2014 5% of creditable compensation plus 1% of creditable compensation, which is
deposited into the 401(h) account and is not refundable. Members who do not receive a retirement benefit are entitled to a refund of non-401(h) contributions with interest.
Changes since the Prior Valuation
During the 2018 legislative session, House Bill 185 was enacted, which updated the benefit provisions for active members who die in the line of duty. Benefits paid to the spouses of deceased members paid from the retirement fund have been increased from 25% of the member’s final rate of pay to 75% of the member’s average pay. If the member does not have a surviving spouse, benefits paid to surviving dependent children have been increased from 10% of the member’s final pay rate to 50% of average pay for one child, 65% of average pay for two children, or 75% of average pay for three children.
Board Meeting- December 17, 2018 - Actuarial Valuations- GRS/ Ms. Karen Roggenkamp
117
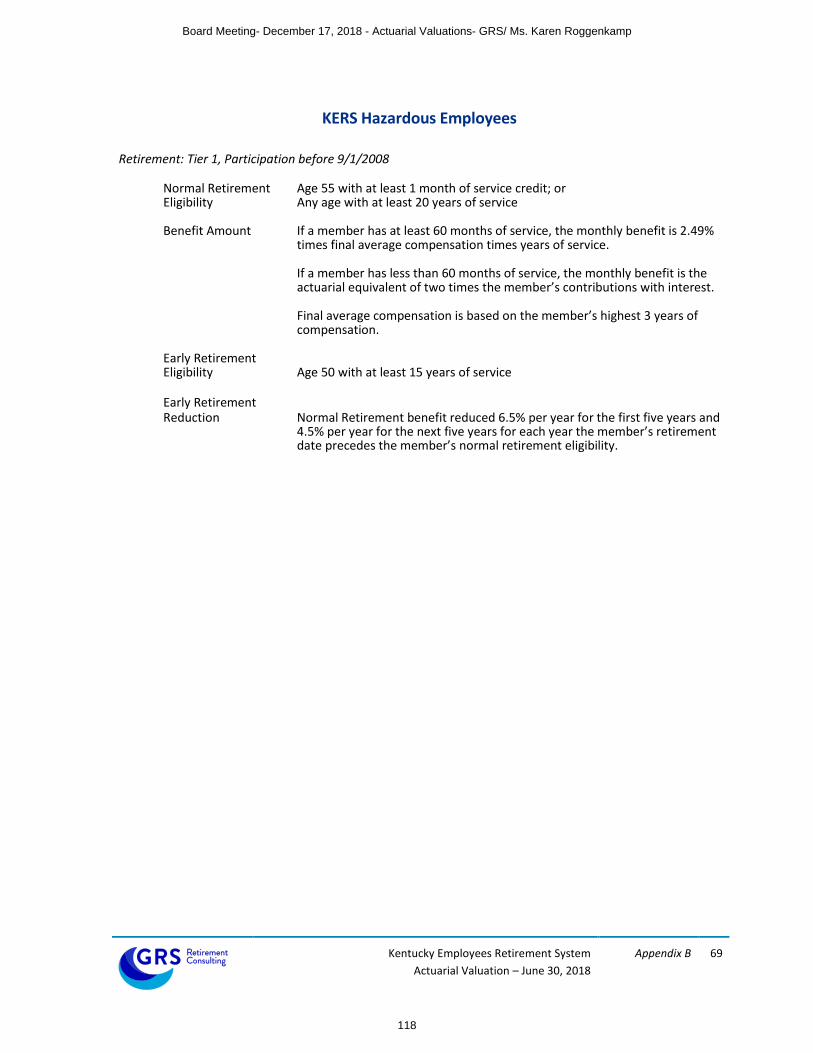
Kentucky Employees Retirement System
Actuarial Valuation – June 30, 2018
Appendix B 69
KERS Hazardous Employees
Retirement: Tier 1, Participation before 9/1/2008
Normal Retirement Age 55 with at least 1 month of service credit; or Eligibility Any age with at least 20 years of service
Benefit Amount If a member has at least 60 months of service, the monthly benefit is 2.49% times final average compensation times years of service.
If a member has less than 60 months of service, the monthly benefit is the actuarial equivalent of two times the member’s contributions with interest.
Final average compensation is based on the member’s highest 3 years of compensation.
Early Retirement Eligibility Age 50 with at least 15 years of service Early Retirement Reduction Normal Retirement benefit reduced 6.5% per year for the first five years and
4.5% per year for the next five years for each year the member’s retirement date precedes the member’s normal retirement eligibility.
Board Meeting- December 17, 2018 - Actuarial Valuations- GRS/ Ms. Karen Roggenkamp
118

Kentucky Employees Retirement System
Actuarial Valuation – June 30, 2018
Appendix B 70
KERS Hazardous Employees (continued)
Retirement: Tier 2, Participation on or after 9/1/2008 but before 1/1/2014
Normal Retirement Age 60 with at least 5 years of service; or Eligibility Any age with at least 25 years of service
Benefit Amount The monthly benefit is equal to the applicable benefit multiplier times final average compensation times years of service.
Years of Service Benefit Multiplier 10 or less 1.30%
10-20 1.50% 20-25 2.25%
Greater than 25 2.50%
Final average compensation is based on the member’s highest 3 years of compensation.
Early Retirement Eligibility Age 50 with at least 15 years of service Early Retirement Reduction Normal Retirement benefit reduced 6.5% per year for the first five years
and 4.5% per year for the next five years for each year the member’s retirement date precedes the member’s normal retirement eligibility.
Retirement: Tier 3, Participation on or after 1/1/2014
Normal Retirement Age 60 with at least 5 years of service; or Eligibility Any age with at least 25 years of service
Benefit Amount Each year that the member is active, a 7.50% employer pay credit and the employee’s 8.00% contribution will be credited to each member’s hypothetical cash balance account. The hypothetical account will earn interest at a minimum rate of 4%, annually. If the System’s geometric average net investment return for the previous five years exceeds 4%, then the hypothetical account will be credited with an additional amount of interest in that year equal to 75% of the amount of the return which exceeds 4%. All interest credits will be applied to the hypothetical account balance on June 30 based on the account balance as of June 30 of the previous year.
At retirement, the member’s hypothetical account balance may be converted into an annuity based on an actuarial factor.
Early Retirement Eligibility N/A
Board Meeting- December 17, 2018 - Actuarial Valuations- GRS/ Ms. Karen Roggenkamp
119

Kentucky Employees Retirement System
Actuarial Valuation – June 30, 2018
Appendix B 71
KERS Hazardous Employees (continued)
Deferred Vested Benefit: Tier 1, Participation before 9/1/2008
Eligibility At least 1 month of service credit
Benefit Amount Normal retirement benefit deferred to normal retirement age, or a reduced retirement benefit at an early retirement age
Deferred Vested Benefit: Tier 2, Participation on or after 9/1/2008 but before 1/1/2014
Eligibility 5 years of service
Benefit Amount Normal retirement benefit deferred to normal retirement age, or a reduced retirement benefit at an early retirement age
Deferred Vested Benefit Tier 3, Participation on or after 1/1/2014
Eligibility 5 years of service
Benefit Amount At termination of employment, members may choose to leave their account balance with the System and retire once they are eligible. The hypothetical account balance will earn 4% annual interest after termination. Members may also choose to withdrawal their entire accumulated balance. If a member does not have 5 years of service at termination, the member is eligible to receive a partial refund of their account balance. This refund includes the member’s contributions with interest.
Disability Retirement: Participation before 8/1/2004
Eligibility 60 months of service (requirement is waived if line of duty disability)
Disability Benefit Disability benefits are calculated in the same manner as the normal retirement benefit with years of service and final compensation being determined as of the date of disability, except that if the member has less than 20 years of service at disability, service credit shall be added to the person’s total service beginning with the last date of paid employment and continuing to the member’s 55th birthday, with total service not exceeding 20 years. Total service credit added shall not be greater than the member’s actual service at disability.
Board Meeting- December 17, 2018 - Actuarial Valuations- GRS/ Ms. Karen Roggenkamp
120

Kentucky Employees Retirement System
Actuarial Valuation – June 30, 2018
Appendix B 72
KERS Hazardous Employees (continued)
Disability Retirement: Participation on or after 8/1/2004 but before 1/1/2014
Eligibility 60 months of service (requirement is waived if line of duty disability)
Disability Benefit The higher of 25% of the member’s final monthly rate of pay or the member’s normal retirement benefit (without reduction for early retirement) with years and final compensation being determined as of the date of disability.
Disability Retirement: Participation on or after 1/1/2014
Eligibility 60 months of service (requirement is waived if line of duty disability)
Disability Benefit The higher of 25% of the member’s final monthly rate of pay or the member’s retirement benefit calculated at the member’s normal retirement date.
Line of Duty Disability Benefit
Disability Benefit If the disability is a direct result of an act in the line of duty, the benefit shall not be less than 25% of the member’s final monthly rate of pay. Additionally, each eligible dependent child will receive 10% of the member’s monthly final rate of pay up to a maximum of 40%.
Pre-Retirement Death Benefit
Eligibility Eligible for early or normal retirement; or Under age 55 with at least 60 months of service and actively working at the
time of death; or At least 144 months of service, if no longer actively working
Spouse Benefit The member’s retirement benefit calculated in the same manner as if the member had retired on the day of the member’s death and elected a 100% joint and survivor benefit. The benefit is actuarially reduced if the member dies prior to their normal retirement age.
Pre-Retirement Death Benefit (Death in the Line of Duty)
Eligibility One month of service credit
Spouse Benefit A $10,000 lump sum payment plus a monthly payment of 75% of the deceased member’s final average pay. Each dependent child will receive 10% of average pay (not to exceed a total child benefit of 25% while the spouse is alive). A spouse may also elect the non-line of duty death benefit.
Non-Spouse Benefit If the beneficiary is only one person who is a dependent receiving at least 50% of his or her support from the member, the beneficiary may elect a lump-sum payment of $10,000.
Child Benefit In the event there is no surviving spouse, the benefit is 50% of final monthly average pay for one child, 65% of final average pay for two children, or 75% of final average pay for three or more eligible children.
Board Meeting- December 17, 2018 - Actuarial Valuations- GRS/ Ms. Karen Roggenkamp
121

Kentucky Employees Retirement System
Actuarial Valuation – June 30, 2018
Appendix B 73
KERS Hazardous Employees (continued)
Post-Retirement Death Benefit
Eligibility 48 months of service, and in receipt of retirement benefits
Death Benefit A $5,000 lump sum payment Member Contributions
Tier 1, Participation before 9/1/2008 8% of creditable compensation. Members who do not receive a retirement
benefit are entitled to a full refund of contributions with interest. The annual interest rate is set by the KRS board, not less than 2.0%.
Tier 2, Participation on or after 9/1/2008 but before 1/1/2014 8% of creditable compensation plus 1% of creditable compensation, which is
deposited into the 401(h) account and is not refundable. Members who do not receive a retirement benefit are entitled to a refund of non-401(h) contributions with interest. The annual interest rate is 2.5%.
Tier 3, Participation after 1/1/2014 8% of creditable compensation plus 1% of creditable compensation, which is
deposited into the 401(h) account and is not refundable. Members who do not receive a retirement benefit are entitled to a refund of non-401(h) contributions with interest.
Changes since the Prior Valuation
During the 2018 legislative session, House Bill 185 was enacted, which updated the benefit
provisions for active members who die in the line of duty. Benefits paid to the spouses of deceased
members paid from the retirement fund have been increased from 25% of the member’s final rate
of pay to 75% of the member’s average pay. If the member does not have a surviving spouse,
benefits paid to surviving dependent children have been increased from 10% of the member’s final
pay rate to 50% of average pay for one child, 65% of average pay for two children, or 75% of average
pay for three children.
Board Meeting- December 17, 2018 - Actuarial Valuations- GRS/ Ms. Karen Roggenkamp
122

Kentucky Employees Retirement System
Actuarial Valuation – June 30, 2018
Appendix B 74
Summary of Main Retiree Insurance Benefit Provisions
Insurance Tier 1: Participation began before 7/1/2003
Benefit Eligibility Recipient of a retirement allowance
Benefit Amount
Non-Hazardous Service
Percentage of Member Premium Paid by
Retirement System
Hazardous Service
Percentage of Member & Dependent Premium Paid by
Retirement System Less than 4 years 0% Less than 4 years 0%
4 – 9 years
25% 4 – 9 years
25%
10 – 14 years 50% 10 – 14 years 50%
15 – 19 years 75% 15 – 19 years 75%
20 or more years 100% 20 or more years 100%
The percentage paid by the retirement system is applied to the ‘contribution’ plan selected by the KRS Board.
Duty Disability Retirement If disability was a result of injuries sustained while in the line of duty, the member receives 100% of the maximum contribution for the member and dependents. This benefit is provided to members in the Non-hazardous and Hazardous plans alike.
Duty Death in Service If an active employee’s death was a result of injuries sustained while in the line of duty, the member’s spouse and children receive a fully subsidized health insurance benefit. This benefit is provided to members in the Non-hazardous and Hazardous plans alike.
Non-Duty Death in Service If the surviving spouses is in receipt of a pension allowance, he or she is eligible for continued health coverage. The percentage of the premium paid for by the retirement system is based on the member’s years of hazardous service at the time of death.
Surviving Spouse of a Retiree A surviving spouse of a retiree, who is in receipt of a pension allowance, will receive a premium subsidy based on the member’s years of hazardous service.
Hazardous employees who System’s contribution for spouse and dependents is based on total retired prior to August 1, 1998 service.
Board Meeting- December 17, 2018 - Actuarial Valuations- GRS/ Ms. Karen Roggenkamp
123

Kentucky Employees Retirement System
Actuarial Valuation – June 30, 2018
Appendix B 75
Insurance Tier 2: Participation began on or after 7/1/2003, but before 9/1/2008
Benefit Eligibility Recipient of a retirement allowance with at least 120 months of service at retirement
Non-Hazardous Subsidy Monthly contribution of $10 for each year of earned service. The
monthly contribution is increased by 1.5% each July 1. As of July 1, 2017, the Non-Hazardous monthly contribution was $13.18/year of service. Upon the retiree’s death, the surviving spouse may continue coverage (if in receipt of a retirement allowance) but will be 100% responsible for the premiums.
Hazardous Subsidy Monthly contribution of $15 for each year of earned hazardous service.
The monthly contribution is increased by 1.5% each July 1. As of July 1, 2017, the Non-Hazardous monthly contribution was $19.77/year of service. Upon the retiree’s death, the surviving spouse of a hazardous duty member will receive a monthly contribution of $10 ($13.18 as of July 1, 2017) for each year of hazardous service.
Duty Disability Retirement If disability was a result of injuries sustained while in the line of duty, the member receives a benefit equal to at least 20 times the Non-Hazardous monthly contribution. This benefit is provided to members in the Non-hazardous and Hazardous plans alike.
Duty Death in Service If an active employee’s death was a result of injuries sustained while in the line of duty, the member’s spouse and children receive a fully subsidized health insurance benefit. This benefit is provided to members in the Non-hazardous and Hazardous plans alike.
Non-Duty Death in Service If the surviving spouse is in receipt of a pension allowance, he or she is eligible for continued health coverage. The percentage of the premium paid for by the retirement system is based on the member’s years of hazardous service at the time of death.
Insurance Tier 3: Participation began on or after 9/1/2008 Tier 3 insurance benefits are identical to Tier 2, except Tier 3 members are required to have at least 180 months of service in order to be eligible.
Board Meeting- December 17, 2018 - Actuarial Valuations- GRS/ Ms. Karen Roggenkamp
124

Kentucky Employees Retirement System
Actuarial Valuation – June 30, 2018
Appendix B 76
Monthly Health Plan Premiums – Effective January 1, 2019
Non-Medicare Plan Options
Plan Option Single Parent Plus Couple Family Family X-Ref
LivingWell PPO* $729.34 $1,037.08 $1,589.10 $1,767.60 $876.68
LivingWell CDHP 709.46 978.50 1,333.64 1,479.76 818.96
LivingWell Basic 682.80 940.64 1,450.02 1,615.30 800.94
Living Well Limited 607.54 865.08 1,327.16 1,477.04 730.90
Medicare Plan Options
Kentucky Retirement Systems - Medical Only Plan $175.22
Kentucky Retirement Systems – Medicare Advantage/Essential Plan 53.73
Kentucky Retirement Systems – Medicare Advantage/Premium Plan* 220.11
*For 2019, the contribution plans selected by the KRS Board were the LivingWell PPO plan option for non-Medicare retirees and the Medicare Advantage Premium plan option for Medicare retirees.
Dollar Contribution Amount for Insurance Tier 2 and Tier 3 Monthly contribution amounts per year of service as of July 1, 2018.
Non-Hazardous Service
Hazardous Service
$13.38 $20.07
Changes since the Prior Valuation
During the 2018 legislative session, House Bill 185 was enacted, which updated the benefit
provisions for active members who die in the line of duty. The insurance fund shall now pay 100%
of the insurance premium for spouses and children of all active members who die in the line of
duty.
Board Meeting- December 17, 2018 - Actuarial Valuations- GRS/ Ms. Karen Roggenkamp
125

APPENDIX C
GLOSSARY
Board Meeting- December 17, 2018 - Actuarial Valuations- GRS/ Ms. Karen Roggenkamp
126
Kentucky Employees Retirement System
Actuarial Valuation – June 30, 2018
Appendix C 78
Glossary
Actuarial Accrued Liability (AAL): That portion, as determined by a particular Actuarial Cost Method, of
the Actuarial Present Value of Future Plan Benefits which is not provided for by future Normal Costs. It is
equal to the Actuarial Present Value of Future Plan Benefits minus the actuarial present value of future
Normal Costs.
Actuarial Assumptions: Assumptions as to future experience under the Fund. These include assumptions
about the occurrence of future events affecting costs or liabilities, such as:
mortality, withdrawal, disablement, and retirement;
future increases in salary;
future rates of investment earnings and future investment and administrative expenses;
characteristics of members not specified in the data, such as marital status;
characteristics of future members;
future elections made by members; and
other relevant items.
Actuarial Cost Method or Funding Method: A procedure for allocating the Actuarial Present Value of
Future Benefits to various time periods; a method used to determine the Normal Cost and the Actuarial
Accrued Liability. These items are used to determine the ADC.
Actuarial Gain or Actuarial Loss: A measure of the difference between actual experience and that
expected based upon a set of Actuarial Assumptions, during the period between two Actuarial Valuation
dates. Through the actuarial assumptions, rates of decrements, rates of salary increases, and rates of fund
earnings have been forecasted. To the extent that actual experience differs from that assumed, Actuarial
Accrued Liabilities emerge which may be the same as forecasted, or may be larger or smaller than
projected. Actuarial gains are due to favorable experience, e.g., the fund's assets earn more than
projected, salaries do not increase as fast as assumed, members retire later than assumed, etc. Favorable
experience means actual results produce actuarial liabilities not as large as projected by the actuarial
assumptions. On the other hand, actuarial losses are the result of unfavorable experience, i.e., actual
results that produce actuarial liabilities which are larger than projected. Actuarial gains will shorten the
time required for funding of the actuarial balance sheet deficiency while actuarial losses will lengthen the
funding period.
Actuarially Equivalent: Of equal actuarial present value, determined as of a given date and based on a given set of Actuarial Assumptions.
Board Meeting- December 17, 2018 - Actuarial Valuations- GRS/ Ms. Karen Roggenkamp
127

Kentucky Employees Retirement System
Actuarial Valuation – June 30, 2018
Appendix C 79
Actuarial Present Value (APV): The value of an amount or series of amounts payable or receivable at
various times, determined as of a given date by the application of a particular set of Actuarial
Assumptions. For purposes of this standard, each such amount or series of amounts is:
a. adjusted for the probable financial effect of certain intervening events (such as changes in
compensation levels, marital status, etc.)
b. multiplied by the probability of the occurrence of an event (such as survival, death, disability,
termination of employment, etc.) on which the payment is conditioned, and
c. discounted according to an assumed rate (or rates) of return to reflect the time value of money.
Actuarial Present Value of Future Plan Benefits: The Actuarial Present Value of those benefit amounts
which are expected to be paid at various future times under a particular set of Actuarial Assumptions,
taking into account such items as the effect of advancement in age and past and anticipated future
compensation and service credits. The Actuarial Present Value of Future Plan Benefits includes the
liabilities for active members, retired members, beneficiaries receiving benefits, and inactive, non-retired
members either entitled to a refund or a future retirement benefit. Expressed another way, it is the value
that would have to be invested on the valuation date so that the amount invested plus investment
earnings would provide sufficient assets to pay all projected benefits and expenses when due.
Actuarial Valuation: The determination, as of a valuation date, of the Normal Cost, Actuarial Accrued
Liability, Actuarial Value of Assets, and related Actuarial Present Values for a plan. An Actuarial valuation
for a governmental retirement system typically also includes calculations that provide the financial
information of the plan, such as the funded ratio, unfunded actuarial accrued liability and the ADC.
Actuarial Value of Assets or Valuation Assets: The value of the Fund’s assets as of a given date, used by
the actuary for valuation purposes. This may be the market or fair value of plan assets, but commonly
actuaries use a smoothed value in order to reduce the year-to-year volatility of calculated results, such as
the funded ratio and the ADC.
Actuarially Determined: Values which have been determined utilizing the principles of actuarial science.
An actuarially determined value is derived by application of the appropriate actuarial assumptions to
specified values determined by provisions of the law.
Actuarially Determined Contribution (ADC): The employer’s periodic required contributions, expressed as
a dollar amount or a percentage of covered plan compensation. The ADC consists of the Employer Normal
Cost and the Amortization Payment.
Amortization Method: A method for determining the Amortization Payment. The most common methods
used are level dollar and level percentage of payroll. Under the Level Dollar method, the Amortization
Payment is one of a stream of payments, all equal, whose Actuarial Present Value is equal to the UAAL.
Under the Level Percentage of Pay method, the Amortization payment is one of a stream of increasing
payments, whose Actuarial Present Value is equal to the UAAL. Under the Level Percentage of Pay
method, the stream of payments increases at the assumed rate at which total covered payroll of all active
members will increase.
Board Meeting- December 17, 2018 - Actuarial Valuations- GRS/ Ms. Karen Roggenkamp
128

Kentucky Employees Retirement System
Actuarial Valuation – June 30, 2018
Appendix C 80
Amortization Payment: The portion of the pension plan contribution or ADC which is designed to pay
interest on and to amortize the Unfunded Actuarial Accrued Liability.
Closed Amortization Period: A specific number of years that is counted down by one each year, and
therefore declines to zero with the passage of time. For example if the amortization period is initially set
at 30 years, it is 29 years at the end of one year, 28 years at the end of two years, etc. See Funding Period
and Open Amortization Period.
Decrements: Those causes/events due to which a member’s status (active-inactive-retiree-beneficiary)
changes, that is: death, retirement, disability, or termination.
Defined Benefit Plan: A retirement plan that is not a Defined Contribution Plan. Typically a defined
benefit plan is one in which benefits are defined by a formula applied to the member’s compensation
and/or years of service.
Defined Contribution Plan: A retirement plan, such as a 401(k) plan, a 403(b) plan, or a 457 plan, in which
the contributions to the plan are assigned to an account for each member, and the plan’s earnings are
allocated to each account, and each member’s benefits are a direct function of the account balance.
Employer Normal Cost: The portion of the Normal Cost to be paid by the employers. This is equal to the
Normal Cost less expected member contributions.
Experience Study: A periodic review and analysis of the actual experience of the Fund which may lead to a
revision of one or more actuarial assumptions. Actual rates of decrement and salary increases are
compared to the actuarially assumed values and modified as deemed appropriate by the Actuary.
Funded Ratio: The ratio of the actuarial value of assets (AVA) to the actuarial accrued liability (AAL). Plans
sometimes calculate a market funded ratio, using the market value of assets (MVA), rather than the AVA.
Funding Period or Amortization Period: The term “Funding Period” is used two ways. In the first sense, it
is the period used in calculating the Amortization Payment as a component of the ADC. This funding
period is specified in State statute. In the second sense, it is a calculated item: the number of years in the
future that will theoretically be required to amortize (i.e., pay off or eliminate) the Unfunded Actuarial
Accrued Liability, based on a statutory employer contribution rate, and assuming no future actuarial gains
or losses.
GASB: Governmental Accounting Standards Board.
GASB 67 and GASB 68: Governmental Accounting Standards Board Statements No. 67 and No. 68. These
are the governmental accounting standards that set the accounting and reporting rules for public
retirement systems and the employers that sponsor, participate in, or contribute to them. Statement No.
67 sets the accounting rules for the financial reporting of the retirement systems, while Statement No. 68
sets the rules for the employers that sponsor, participate in, or contribute to public retirement systems.
Normal Cost: That portion of the Actuarial Present Value of pension plan benefits and expenses which is
allocated to a valuation year by the Actuarial Cost Method. Any payment in respect of an Unfunded
Board Meeting- December 17, 2018 - Actuarial Valuations- GRS/ Ms. Karen Roggenkamp
129

Kentucky Employees Retirement System
Actuarial Valuation – June 30, 2018
Appendix C 81
Actuarial Accrued Liability is not part of Normal Cost (see Amortization Payment). For pension plan
benefits which are provided in part by employee contributions, Normal Cost refers to the total of
employee contributions and employer Normal Cost unless otherwise specifically stated. Under the entry
age normal cost method, the Normal Cost is intended to be the level cost (when expressed as a
percentage of pay) needed to fund the benefits of a member from hire until ultimate termination, death,
disability or retirement.
Open Amortization Period: An open amortization period is one which is used to determine the
Amortization Payment but may not decrease by exactly one year in the subsequent year’s actuarial
valuation. For instance, if the initial period is set as 30 years, the same 30-year period is used in
determining the Amortization Period each year.
Unfunded Actuarial Accrued Liability: The excess of the Actuarial Accrued Liability over the Actuarial
Value of Assets. This value may be negative in which case it may be expressed as a negative Unfunded
Actuarial Accrued Liability, also called the Funding Surplus.
Valuation Date or Actuarial Valuation Date: The date as of which the value of assets is determined and
as of which the Actuarial Present Value of Future Plan Benefits is determined. The expected benefits to be
paid in the future are discounted to this date.
Board Meeting- December 17, 2018 - Actuarial Valuations- GRS/ Ms. Karen Roggenkamp
130

County Employees Retirement System (CERS) Actuarial Valuation Report as of June 30, 2018
Board Meeting- December 17, 2018 - Actuarial Valuations- GRS/ Ms. Karen Roggenkamp
131

October 31, 2018
Board of Trustees Kentucky Retirement Systems Perimeter Park West 1260 Louisville Road Frankfort, KY 40601
Subject: Actuarial Valuation as of June 30, 2018
Dear Trustees of the Board:
This report describes the current actuarial condition of the County Employees Retirement System
(CERS), provides the actuarially determined employer contribution rates for fiscal year ending June
30, 2020, and analyzes changes in the System’s financial condition. In addition, the report provides
various summaries of the data.
Separate reports are issued with regard to valuation results determined in accordance with
Governmental Accounting Standards Board (GASB) Statements 67, 68, 74 and 75. Results of this
report should not be used for any other purpose without consultation with the undersigned.
Valuations are prepared annually as of June 30, the first day of the plan year for KRS. This report
was prepared at the request of the Board of Trustees of the Kentucky Retirement System (Board)
and is intended for use by the KRS staff and those designated or approved by the Board.
FINANCING OBJECTIVES AND FUNDING POLICY
The employer contribution rate is determined in accordance with Section 61.565 of Kentucky
Statute. As specified by the Statute, the employer contribution rate is determined based on a closed
thirty-year amortization period beginning July 1, 2013. As a result, the amortization period used in
the 2018 actuarial valuation is 25 years. The contribution rate determined by this actuarial
valuation becomes effective twelve months after the valuation date. In other words, the
contribution rate determined by this June 30, 2018 actuarial valuation will be used by the Board to
certify the participating employer’s contribution rates for the fiscal year July 1, 2019 and ending
June 30, 2020.
If new legislation is enacted between the valuation date and the date the contribution rate
becomes effective, the Board may adjust the calculated rate before certifying them, in order to
reflect this new legislation. Such adjustments are based on information supplied by the actuary.
Board Meeting- December 17, 2018 - Actuarial Valuations- GRS/ Ms. Karen Roggenkamp
132

Kentucky Retirement Systems October 31, 2018 Page 2
ASSUMPTIONS AND METHODS
There were no changes in actuarial assumptions since the prior actuarial valuation. It is our opinion
that the current assumptions are internally consistent and reasonably reflect the anticipated future
experience of the System.
Kentucky Statutes also require that an actuarial investigation be performed at least every five years
to review the economic and demographic assumptions. An experience study was conducted as of
June 30, 2013 and the next experience study will be conducted as of June 30, 2018 and the Board
adopted assumptions as a result of that analysis will be first used to prepare the June 30, 2019
actuarial valuation. The Board also has the authority to review the assumptions on a more frequent
basis and adopt new assumptions prior to the next scheduled experience study.
The results of the actuarial valuation are dependent on the actuarial assumptions used. Actual
results can, and almost certainly will, differ as actual experience deviates from the
assumptions. Even seemingly minor changes in the assumptions can materially change the
liabilities, calculated contribution rate, and funding periods. The actuarial calculations are intended
to provide information for rational decision making.
BENEFIT PROVISIONS
The benefit provisions reflected in these valuations are those which were in effect on June 30, 2018.
During the 2018 legislative session House Bill 185 was enacted which provided increased retirement
and health insurance benefits for active members who die in the line of duty. House Bill 362 limits
the increase in the CERS employer contribution rate over the prior fiscal year to 12% per year for
the period of July 1, 2018 to June 30, 2028.
This actuarial valuation was determined without regard to the enactment of SB 151 in 2018, which
is currently being reviewed by the State Supreme Court.
DATA
Member data for retired, active and inactive members was supplied as of June 30, 2018, by the KRS
staff. The staff also supplied asset information as of June 30, 2018. We did not audit this data, but
we did apply a number of tests to the data, and we concluded that it was reasonable and consistent
with the prior year's data. GRS is not responsible for the accuracy or completeness of the
information provided to us by KRS.
Board Meeting- December 17, 2018 - Actuarial Valuations- GRS/ Ms. Karen Roggenkamp
133

Kentucky Retirement Systems October 31, 2018 Page 3
CERTIFICATION
We certify that the information presented herein is accurate and fairly portrays the actuarial
position of CERS as of June 30, 2018.
All of our work conforms with generally accepted actuarial principles and practices, and is in
conformity with the Actuarial Standards of Practice issued by the Actuarial Standards Board. In our
opinion, our calculations also comply with the requirements of Kentucky Code of Laws and, where
applicable, the Internal Revenue Code, ERISA, and the Statements of the Governmental Accounting
Standards Board.
The undersigned are independent actuaries and consultants. Mr. Newton and Mr. White are Enrolled Actuaries. All three of the undersigned are Members of the American Academy of Actuaries and meet the Qualification Standards of the American Academy of Actuaries. All of the undersigned are experienced in performing valuations for large public retirement systems. Sincerely, Gabriel, Roeder, Smith & Co. Joseph P. Newton, FSA, MAAA, EA Daniel J. White, FSA, MAAA, EA Senior Consultant Senior Consultant Janie Shaw, ASA, MAAA Consultant
Board Meeting- December 17, 2018 - Actuarial Valuations- GRS/ Ms. Karen Roggenkamp
134

County Employees Retirement System
Actuarial Valuation – June 30, 2017
I
Table of Contents
Page
Section 1 Executive Summary ....................................................................................................... 2
Section 2 Discussion ...................................................................................................................... 7
Section 3 Actuarial Tables ........................................................................................................... 16
Section 4 Membership Information ........................................................................................... 40
Appendix A Actuarial Assumptions and Methods
Appendix B Benefit Provisions
Appendix C Glossary
Board Meeting- December 17, 2018 - Actuarial Valuations- GRS/ Ms. Karen Roggenkamp
135

SECTION 1
EXECUTIVE SUMMARY
Board Meeting- December 17, 2018 - Actuarial Valuations- GRS/ Ms. Karen Roggenkamp
136
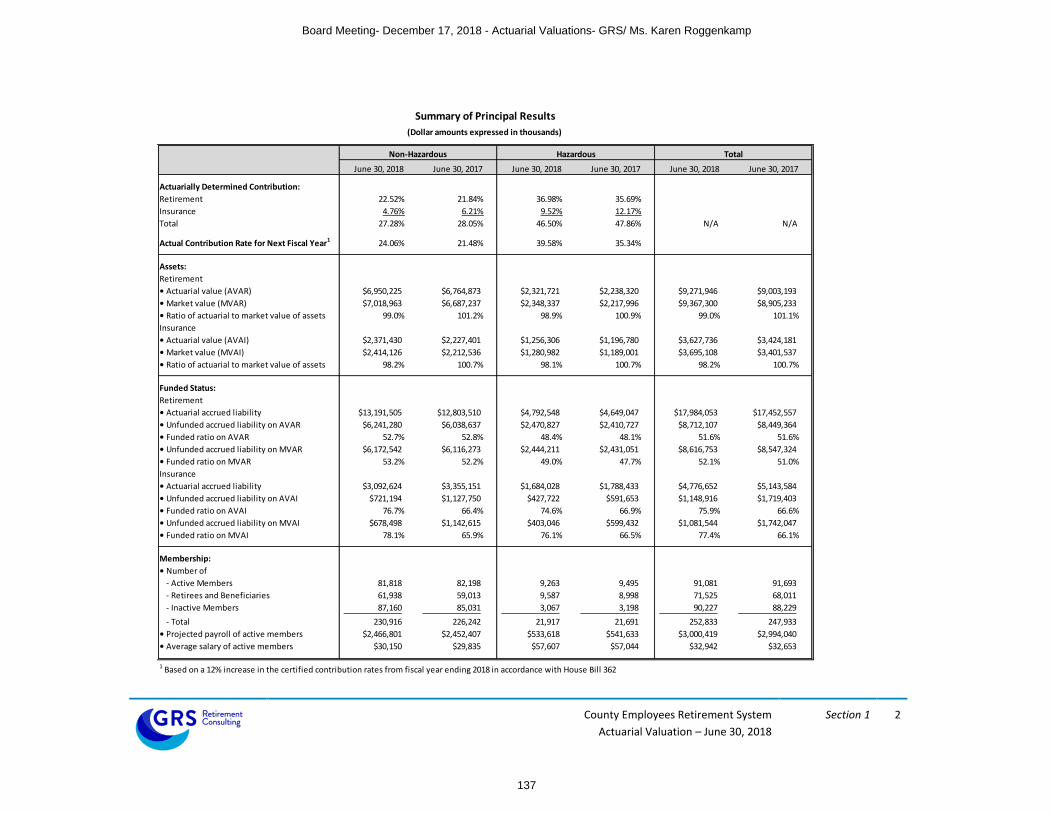
County Employees Retirement System
Actuarial Valuation – June 30, 2018
Section 1 2
Summary of Principal Results Summary of Principal Results
(Dollar amounts expressed in thousands) (Dollar amounts expressed in thousands)
Actuarially Determined Contribution:
Retirement 22.52% 21.84% 36.98% 35.69%
Insurance 4.76% 6.21% 9.52% 12.17%
Total 27.28% 28.05% 46.50% 47.86% N/A N/A
Actual Contribution Rate for Next Fiscal Year1 24.06% 21.48% 39.58% 35.34%
Assets:
Retirement
• Actuarial value (AVAR) $6,950,225 $6,764,873 $2,321,721 $2,238,320 $9,271,946 $9,003,193
• Market value (MVAR) $7,018,963 $6,687,237 $2,348,337 $2,217,996 $9,367,300 $8,905,233
• Ratio of actuarial to market value of assets 99.0% 101.2% 98.9% 100.9% 99.0% 101.1%
Insurance
• Actuarial value (AVAI) $2,371,430 $2,227,401 $1,256,306 $1,196,780 $3,627,736 $3,424,181
• Market value (MVAI) $2,414,126 $2,212,536 $1,280,982 $1,189,001 $3,695,108 $3,401,537
• Ratio of actuarial to market value of assets 98.2% 100.7% 98.1% 100.7% 98.2% 100.7%
Funded Status:
Retirement
• Actuarial accrued liability $13,191,505 $12,803,510 $4,792,548 $4,649,047 $17,984,053 $17,452,557
• Unfunded accrued liability on AVAR $6,241,280 $6,038,637 $2,470,827 $2,410,727 $8,712,107 $8,449,364
• Funded ratio on AVAR 52.7% 52.8% 48.4% 48.1% 51.6% 51.6%
• Unfunded accrued liability on MVAR $6,172,542 $6,116,273 $2,444,211 $2,431,051 $8,616,753 $8,547,324
• Funded ratio on MVAR 53.2% 52.2% 49.0% 47.7% 52.1% 51.0%
Insurance
• Actuarial accrued liability $3,092,624 $3,355,151 $1,684,028 $1,788,433 $4,776,652 $5,143,584
• Unfunded accrued liability on AVAI $721,194 $1,127,750 $427,722 $591,653 $1,148,916 $1,719,403
• Funded ratio on AVAI 76.7% 66.4% 74.6% 66.9% 75.9% 66.6%
• Unfunded accrued liability on MVAI $678,498 $1,142,615 $403,046 $599,432 $1,081,544 $1,742,047
• Funded ratio on MVAI 78.1% 65.9% 76.1% 66.5% 77.4% 66.1%
Membership:
• Number of
- Active Members 81,818 82,198 9,263 9,495 91,081 91,693
- Retirees and Beneficiaries 61,938 59,013 9,587 8,998 71,525 68,011
- Inactive Members 87,160 85,031 3,067 3,198 90,227 88,229
- Total 230,916 226,242 21,917 21,691 252,833 247,933
• Projected payroll of active members $2,466,801 $2,452,407 $533,618 $541,633 $3,000,419 $2,994,040
• Average salary of active members $30,150 $29,835 $57,607 $57,044 $32,942 $32,653
1 Based on a 12% increase in the certified contribution rates from fiscal year ending 2018 in accordance with House Bill 362
Non-Hazardous Hazardous Total
June 30, 2018 June 30, 2017 June 30, 2018 June 30, 2017 June 30, 2018 June 30, 2017
Board Meeting- December 17, 2018 - Actuarial Valuations- GRS/ Ms. Karen Roggenkamp
137

County Employees Retirement System
Actuarial Valuation – June 30, 2018
Section 1 3
Executive Summary (Continued)
Non-Hazardous Retirement Fund
The unfunded actuarial accrued liability for the non-hazardous retirement fund increased by $0.202
billion since the prior year’s valuation to $6.241 billion. The largest source of this increase includes the
FY 2018 contribution effort to finance the unfunded liability being $0.117 billion less than the interest
on the prior year’s unfunded actuarial accrued liability (i.e. negative amortization of $0.117 billion) and
a $0.082 billion increase due to liability experience. Below is a chart with the historical actuarial value
of assets and actuarial accrued liability for the non-hazardous fund. The divergence in the assets and
liability over the last eight years has generally been due to a combination of the actual investment
experience being less than the fund’s expected investment return assumption, and a decrease in the
assumed rate of return in 2015 and again in 2017.
2011 2012 2013 2014 2015 2016 2017 2018
AAL 8.9 9.1 9.4 9.8 10.7 11.1 12.8 13.2
AVA 5.6 5.5 5.6 6.1 6.5 6.5 6.8 7.0
$0
$2
$4
$6
$8
$10
$12
$14
History of Actuarial Assets vs. Actuarial Accrued Liability (Dollars in Billions)
Board Meeting- December 17, 2018 - Actuarial Valuations- GRS/ Ms. Karen Roggenkamp
138

County Employees Retirement System
Actuarial Valuation – June 30, 2018
Section 1 4
Executive Summary (Continued)
Hazardous Retirement Fund
The unfunded actuarial accrued liability for the hazardous retirement fund increased by $0.060 billion
since the prior year’s valuation to $2.471 billion. The largest source of this increase includes the FY
2018 contribution effort to finance the unfunded liability being $0.039 billion less than the interest on
the prior year’s unfunded actuarial accrued liability (i.e. negative amortization of $0.039 billion) and
$0.026 billion increase due to liability experience. Below is a chart with the historical actuarial value of
assets and actuarial accrued liability for the hazardous retirement fund. The divergence in the assets
and liability over the last eight years has generally been due to a combination of the actual contribution
rates being less than the fund’s expected investment return assumption, and a decrease in the assumed
rate of return in 2015 and again in 2017.
2011 2012 2013 2014 2015 2016 2017 2018
AAL 2.9 3.0 3.1 3.3 3.6 3.7 4.6 4.8
AVA 1.8 1.7 1.8 2.0 2.1 2.1 2.2 2.3
$0.0
$0.5
$1.0
$1.5
$2.0
$2.5
$3.0
$3.5
$4.0
$4.5
$5.0
History of Actuarial Assets vs. Actuarial Accrued Liability (Dollars in Billions)
Board Meeting- December 17, 2018 - Actuarial Valuations- GRS/ Ms. Karen Roggenkamp
139

County Employees Retirement System
Actuarial Valuation – June 30, 2018
Section 1 5
Executive Summary (Continued)
Summary of Change in Financial Condition of the Insurance Funds
Both the Non-Hazardous and Hazardous Insurance funds experience extremely favorable premium
experience from calendar year 2018 to 2019. Specifically, the non-Medicare premiums were expected
to increase by 7.25% from calendar year 2018 to calendar year 2019 (i.e. the medical trend assumption
for non-Medicare premiums used in the actuarial valuation) and the actual average premiums remained
relatively unchanged. Also, the Medicare premiums were expected to increase by 5.10% from calendar
year 2018 to calendar year 2019 (i.e. the medical trend assumption used in the actuarial valuation for
Medicare premium) and the actual average premiums decreased by 12%.
Non-Hazardous Insurance Fund
Since the prior year’s valuation the unfunded actuarial accrued liability for the nonhazardous insurance
fund decreased by $0.407 billion to $0.721 billion with $0.389 billion of that decrease attributable to
the favorable premium experience. The corresponding funded ratio increased from 66.4% at June 30,
2017 to 76.7% at June 30, 2018.
Hazardous Insurance Fund
Since the prior year’s valuation the unfunded actuarial accrued liability for the hazardous insurance
fund decreased by $0.164 billion to $0.428 billion with $0.172 billion of that decrease attributable to
the favorable premium experience. The corresponding funded ratio increased from 66.9% at June 30,
2017 to 74.6% at June 30, 2018.
Board Meeting- December 17, 2018 - Actuarial Valuations- GRS/ Ms. Karen Roggenkamp
140

SECTION 2
DISCUSSION
Board Meeting- December 17, 2018 - Actuarial Valuations- GRS/ Ms. Karen Roggenkamp
141

County Employees Retirement System
Actuarial Valuation – June 30, 2018
Section 2 7
Discussion
The County Employees Retirement System (CERS) is a defined benefit pension fund that provides pensions
and health care coverage for employees of state government, non-teaching staff at regional state
supported universities, local health departments, regional mental health/mental retardation agencies, and
other quasi-state agencies. CERS includes both non-hazardous and hazardous duty benefits. This report
presents the result of the June 30, 2018 actuarial funding valuation for both the Retirement and Insurance
Funds.
The primary purposes of the valuation report are to depict the current financial condition of the System,
determine the annual required contribution, and analyze changes in the System’s financial condition. In
addition, the report provides various summaries of the data.
The actuarially determined contribution rates consist of two components: a normal cost rate and an
amortization cost to finance the unfunded actuarial accrued liability. The normal cost rate is the theoretical
amount which would be required to pay the members’ benefits, based on the current plan provisions, if
this amount had been contributed from each member’s entry date and if the fund’s experience exactly
followed the actuarial assumptions. This is the amount it should cost to provide the benefits for an average
new member. Since members contribute to the fund, only the excess of the normal rate over the member
contribution rate is included in the employer contribution rate. The amortization cost is the amount,
expressed as a percentage of payroll, necessary to amortize the unfunded actuarial accrued liability. The
payroll growth rate and discount rate assumptions are selected by the Board. The funding period is
specified in Section 61.565 of Kentucky Statute.
All of the actuarial and financial tables referenced by the other sections of this Report appear in Section 3.
Section 4 provides member data and statistical information. Appendices A and B provide summaries of the
principle actuarial assumptions and methods and plan provisions. Finally, Appendix C provides a glossary of
technical terms that are used throughout this report.
Board Meeting- December 17, 2018 - Actuarial Valuations- GRS/ Ms. Karen Roggenkamp
142

County Employees Retirement System
Actuarial Valuation – June 30, 2018
Section 2 8
Funding Progress
The following charts provide an eight-year history of the funded ratio (i.e. the Actuarial Value of Assets
divided by the Actuarial Accrued Liability) for the retirement funds. The decline in the funded ratio over the
last eight years for the retirement funds has generally been due to actual investment experience being less
than the investment return assumption, and a decrease in the assumed rate of return in 2015 and again in
2017.
Non-Hazardous Retirement Fund
2011 2012 2013 2014 2015 2016 2017 2018
Funded Ratio 63.1% 60.7% 60.1% 62.6% 60.3% 59.0% 52.8% 52.7%
0%
10%
20%
30%
40%
50%
60%
70%
80%
90%
100%
Funded RatioActuarial Assets as a percentage of Actuarial Accrued Liability
Board Meeting- December 17, 2018 - Actuarial Valuations- GRS/ Ms. Karen Roggenkamp
143

County Employees Retirement System
Actuarial Valuation – June 30, 2018
Section 2 9
Funding Progress (Continued)
Hazardous Retirement Fund
2011 2012 2013 2014 2015 2016 2017 2018
Funded Ratio 62.2% 58.1% 57.7% 59.8% 58.0% 57.7% 48.1% 48.4%
0%
10%
20%
30%
40%
50%
60%
70%
80%
90%
100%
Funded RatioActuarial Assets as a percentage of Actuarial Accrued Liability
Assuming the actuarial determined contributions are actually paid in future years and absent future
unfavorable investment or demographic experience, we expect the funded ratio to slowly improve for both
the nonhazardous and hazardous systems. Table 9, Schedule of Funding Progress, in the following section
of the report provides additional detail regarding the funding progress of the Retirement System.
Board Meeting- December 17, 2018 - Actuarial Valuations- GRS/ Ms. Karen Roggenkamp
144

County Employees Retirement System
Actuarial Valuation – June 30, 2018
Section 2 10
Asset Gains/ (Losses)
The actuarial value of assets (“AVA”) is based on a smoothed market value of assets, using a systematic
approach to phase-in the difference between the actual and expected investment return on the market
value of assets (adjusted for receipts and disbursements during the year). This is appropriate because it
dampens the short-term volatility inherent in investment markets. The returns are computed net of
investment expenses. The actuarial value of assets for the non-hazardous retirement fund increased from
$6.765 billion to $6.950 billion since the prior valuation. Table 7 in the following section of the report
provides the development of the actuarial value of assets.
The rate of return on the market value of assets on a dollar-weighted basis for fiscal year 2018 was 8.7% for
the non-hazardous retirement fund which is greater than the 6.25% expected rate of return. The return on
an actuarial (smoothed) asset value was 6.4%, which resulted in a $0.012 billion gain for the fiscal year.
This difference in the estimated return on market value and actuarial value illustrates the smoothing effect
of the asset valuation method.
The market value of assets is $0.069 billion more than the actuarial value of assets, which signifies that this
system has some net deferred investment gains to be realized in future years.
Likewise, the actuarial value of assets for the hazardous retirement fund increased from $2.238 billion to
$2.322 billion since the prior valuation. The rate of return on the market value of assets on a dollar-
weighted basis for fiscal year 2018 was 8.7% which is greater than the 6.25% expected return. The return
on the actuarial (smoothed) asset value was 6.5%, which resulted in a $6 million gain for the fiscal year.
The market value of assets is $0.027 billion greater than the actuarial value of assets, which signifies that
this system has some net deferred investment gains to be realized in future years.
Table 6 in the following section of this report provides asset information that was included in the annual
financial statements of the System. Also, Tables 6 and 7 shows the estimated yield on a market value basis
and on the actuarial asset valuation method.
Board Meeting- December 17, 2018 - Actuarial Valuations- GRS/ Ms. Karen Roggenkamp
145

County Employees Retirement System
Actuarial Valuation – June 30, 2018
Section 2 11
Actuarial Gains/ (Losses) The annual actuarial valuation is a snapshot analysis of the benefit liabilities, assets and funded position of the System as of the first day of the plan year. In any one fiscal year, the experience can be better or worse from that which is assumed or expected. The actuarial assumptions do not necessarily attempt to model what the experience will be for any one given fiscal year, but instead try to model the overall experience over many years. Therefore, as long as the actual experience of the retirement system is reasonably close to the current assumptions, the long-term funding requirements of the System will remain relatively consistent.
Below are tables that separately show a reconciliation of the actuarial gains / (loss) since the prior actuarial valuation for the retirement and health insurance funds, which include the effect of asset and liability gains and losses, changes in assumptions, changes in plan provisions, etc.
Non-Hazardous Hazardous
A. Calculation of total actuarial gain or loss
1. Unfunded actuarial accrued liability (UAAL),
previous year 6,038,636$ 2,410,727$
2. Normal cost and administrative expenses 266,086 80,053
3. Less: contributions for the year (518,748) (188,860)
4. Interest accrual 369,519 147,270
5. Expected UAAL (Sum of Items 1 - 4) 6,155,493$ 2,449,190$
6. Actual UAAL as of June 30,2018 6,241,280$ 2,470,827$
7. Total gain (loss) for the year (Item 5 - Item 6) (85,787)$ (21,637)$
B. Source of gains and losses
8. Asset gain (loss) for the year 12,130$ 6,388$
9. Liability experience gain (loss) for the year (82,209) (25,853)
10. Plan Change (15,708) (2,172)
11. Assumption change 0 0
12. Total (85,787)$ (21,637)$
Retirement Experience Gain or (Loss)(Dollar amounts expressed in thousands)
The UAAL for both retirement funds was expected to increase since the prior year as the FY 2018 contribution effort was less than the interest on the prior year’s unfunded actuarial accrued liability (i.e. negative amortization). The UAAL is expected to remain relatively unchanged for the next few years until it begins to decrease after the phase-in to the higher contribution rates become effective.
Board Meeting- December 17, 2018 - Actuarial Valuations- GRS/ Ms. Karen Roggenkamp
146

County Employees Retirement System
Actuarial Valuation – June 30, 2018
Section 2 12
Actuarial Gains/ (Losses) (Continued)
Non-Hazardous Hazardous
A. Calculation of total actuarial gain or loss
1. Unfunded actuarial accrued liability (UAAL),
previous year 1,127,750$ 591,653$
2. Normal cost and administrative expenses 87,442 29,502
3. Less: contributions for the year (135,519) (58,215)
4. Interest accrual 68,982 36,081
5. Expected UAAL (Sum of Items 1 - 4) 1,148,655$ 599,021$
6. Actual UAAL as of June 30,2018 721,194$ 427,722$
7. Total gain (loss) for the year (Item 5 - Item 6) 427,461$ 171,299$
B. Source of gains and losses
8. Asset gain (loss) for the year 5,309$ 3,159$
9. Liability experience gain (loss) for the year 424,524 168,622
10. Plan Change (2,372) (482)
11. Assumption change 0 0
12. Total 427,461$ 171,299$
Insurance Experience Gain or (Loss)(Dollar amounts expressed in thousands)
The favorable premium experience from calendar year 2018 to calendar year 2019 resulted in a $389 million liability gain for the non-hazardous insurance fund and a $172 million liability gain for the hazardous insurance fund.
Board Meeting- December 17, 2018 - Actuarial Valuations- GRS/ Ms. Karen Roggenkamp
147

County Employees Retirement System
Actuarial Valuation – June 30, 2018
Section 2 13
Actuarial Assumptions and Methods
In determining costs and liabilities, actuaries use assumptions about the future, such as rates of salary
increase, probabilities of retirement, termination, death and disability, and an annual investment return
assumption. There were no changes to the actuarial assumptions and methods since the last actuarial
valuation. It is our opinion that the assumptions are internally consistent, reasonable, and reflect
anticipated future experience of the System. Appendix A includes a summary of the actuarial assumptions
and methods used in this valuation.
An experience study was conducted as of June 30, 2013 and the next experience study will be conducted as
of June 30, 2018, the results of which will be first used in preparing the June 30, 2019 actuarial valuation.
However, the Board has the authority to review the assumptions on a more frequent basis and adopt new
assumptions prior to the next scheduled experience study.
Future actuarial measurements may differ significantly from the current measurements presented in this
report due to such factors as the following: plan experience differing from that anticipated by the economic
or demographic assumptions; changes in economic or demographic assumptions; increases or decreases
expected as part of the natural operation of the methodology used for these measurements (such as the
end of an amortization period or additional cost or contribution requirements based on the plan’s funded
status); and changes in plan provisions or applicable law. This report does not include a more robust
assessment of the risks of future experience not meeting the actuarial assumptions. Additional assessment
of risks was outside the scope of this assignment.
Board Meeting- December 17, 2018 - Actuarial Valuations- GRS/ Ms. Karen Roggenkamp
148

County Employees Retirement System
Actuarial Valuation – June 30, 2018
Section 2 14
Benefit Provisions
Appendix B of this report includes a summary of the benefit provisions for CERS.
During the 2018 legislative session, House Bill 185 was enacted, which updated the benefit provisions for
active members who die in the line of duty. Benefits paid to the spouses of deceased members paid from
the retirement fund have been increased from 25% of the member’s final rate of pay to 75% of the
member’s average pay. If the member does not have a surviving spouse, benefits paid to surviving
dependent children have been increased from 10% of the member’s final pay rate to 50% of average pay
for one child, 65% of average pay for two children, or 75% of average pay for three children. The insurance
fund shall also now pay 100% of the insurance premium for spouses and children of all active members
who die in the line of duty.
Also, House Bill 362 was enacted during the 2018 legislative session that limits the increase in the CERS
employer contribution rate over the prior fiscal year to 12% per year for the period of July 1, 2018 to June
30, 2028.
Please note that this actuarial valuation was determined without regard to enactment of SB 151 in 2018,
which is currently being reviewed by the State Supreme Court.
This valuation reflects all benefits promised to CERS members, either by the statutes or by the Board.
There are no ancillary benefits that might be deemed a CERS liability if continued beyond the availability of
funding by the current funding source.
Board Meeting- December 17, 2018 - Actuarial Valuations- GRS/ Ms. Karen Roggenkamp
149

SECTION 3
ACTUARIAL TABLES
Board Meeting- December 17, 2018 - Actuarial Valuations- GRS/ Ms. Karen Roggenkamp
150
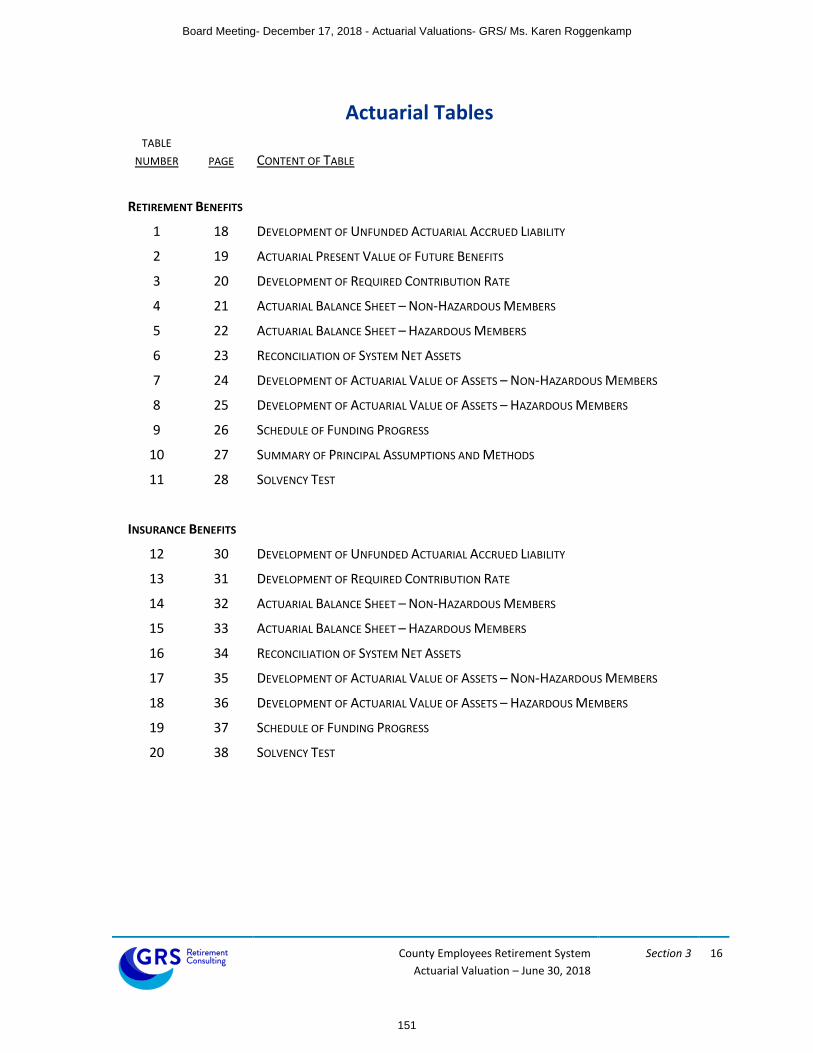
County Employees Retirement System
Actuarial Valuation – June 30, 2018
Section 3 16
Actuarial Tables TABLE
NUMBER
PAGE
CONTENT OF TABLE
RETIREMENT BENEFITS
1 18 DEVELOPMENT OF UNFUNDED ACTUARIAL ACCRUED LIABILITY
2 19 ACTUARIAL PRESENT VALUE OF FUTURE BENEFITS
3 20 DEVELOPMENT OF REQUIRED CONTRIBUTION RATE
4 21 ACTUARIAL BALANCE SHEET – NON-HAZARDOUS MEMBERS
5 22 ACTUARIAL BALANCE SHEET – HAZARDOUS MEMBERS
6 23 RECONCILIATION OF SYSTEM NET ASSETS
7 24 DEVELOPMENT OF ACTUARIAL VALUE OF ASSETS – NON-HAZARDOUS MEMBERS
8 25 DEVELOPMENT OF ACTUARIAL VALUE OF ASSETS – HAZARDOUS MEMBERS
9 26 SCHEDULE OF FUNDING PROGRESS
10 27 SUMMARY OF PRINCIPAL ASSUMPTIONS AND METHODS
11 28 SOLVENCY TEST
INSURANCE BENEFITS
12 30 DEVELOPMENT OF UNFUNDED ACTUARIAL ACCRUED LIABILITY
13 31 DEVELOPMENT OF REQUIRED CONTRIBUTION RATE
14 32 ACTUARIAL BALANCE SHEET – NON-HAZARDOUS MEMBERS
15 33 ACTUARIAL BALANCE SHEET – HAZARDOUS MEMBERS
16 34 RECONCILIATION OF SYSTEM NET ASSETS
17 35 DEVELOPMENT OF ACTUARIAL VALUE OF ASSETS – NON-HAZARDOUS MEMBERS
18 36 DEVELOPMENT OF ACTUARIAL VALUE OF ASSETS – HAZARDOUS MEMBERS
19 37 SCHEDULE OF FUNDING PROGRESS
20 38 SOLVENCY TEST
Board Meeting- December 17, 2018 - Actuarial Valuations- GRS/ Ms. Karen Roggenkamp
151

RETIREMENT BENEFITS
ACTUARIAL TABLES
Board Meeting- December 17, 2018 - Actuarial Valuations- GRS/ Ms. Karen Roggenkamp
152

County Employees Retirement System
Actuarial Valuation – June 30, 2018
Table 1 18
Development of Unfunded Actuarial Accrued Liability
Retirement Benefits Development of Unfunded Actuarial Accrued Liability
(Dollar amounts expressed in thousands) (Dollar amounts expressed in thousands)
June 30, 2018
Non-Hazardous Hazardous
(1) (2)
1. Projected payroll of active members 2,466,801$ 533,618$
2. Present value of future pay 19,527,842$ 3,460,652$
3. Normal cost rate
a. Total normal cost rate 10.01% 14.07%
b. Less: member contribution rate -5.00% -8.00%
c. Employer normal cost rate 5.01% 6.07%
4. Actuarial accrued liability for active members
a. Present value of future benefits 6,821,795$ 2,098,696$
b. Less: present value of future normal costs (1,827,009) (457,206)
c. Actuarial accrued liability 4,994,786$ 1,641,490$
5. Total actuarial accrued liability
a. Retirees and beneficiaries 7,754,521$ 3,094,100$
b. Inactive members 442,198 56,958
c. Active members (Item 4c) 4,994,786 1,641,490
d. Total 13,191,505$ 4,792,548$
6. Actuarial value of assets 6,950,225$ 2,321,721$
7. Unfunded actuarial accrued liability (UAAL)
(Item 5d - Item 6) 6,241,280$ 2,470,827$
8. Funded Ratio 52.7% 48.4%
Board Meeting- December 17, 2018 - Actuarial Valuations- GRS/ Ms. Karen Roggenkamp
153
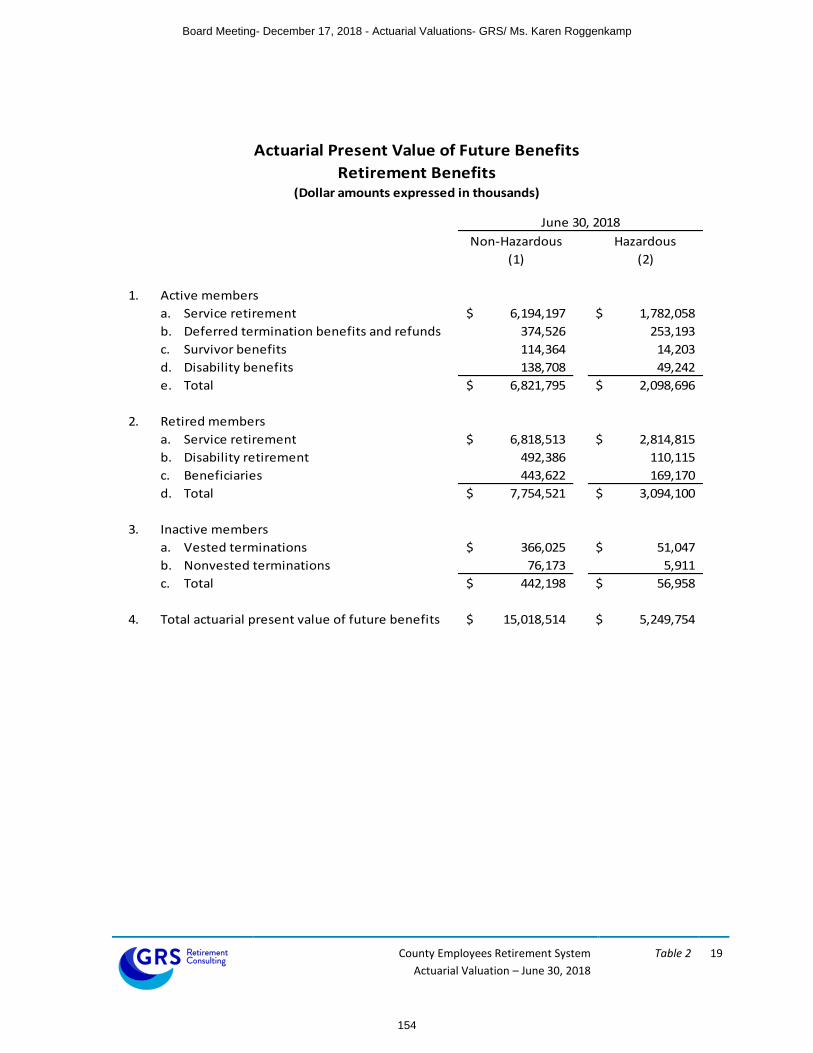
County Employees Retirement System
Actuarial Valuation – June 30, 2018
Table 2 19
Actuarial Present Value of Future Benefits
Retirement Benefits Actuarial Present Value of Future Benefits(Dollar amounts expressed in thousands) (Dollar amounts expressed in thousands)
June 30, 2018
Non-Hazardous Hazardous
(1) (2)
1. Active members
a. Service retirement 6,194,197$ 1,782,058$
b. Deferred termination benefits and refunds 374,526 253,193
c. Survivor benefits 114,364 14,203
d. Disability benefits 138,708 49,242
e. Total 6,821,795$ 2,098,696$
2. Retired members
a. Service retirement 6,818,513$ 2,814,815$
b. Disability retirement 492,386 110,115
c. Beneficiaries 443,622 169,170
d. Total 7,754,521$ 3,094,100$
3. Inactive members
a. Vested terminations 366,025$ 51,047$
b. Nonvested terminations 76,173 5,911
c. Total 442,198$ 56,958$
4. Total actuarial present value of future benefits 15,018,514$ 5,249,754$
Board Meeting- December 17, 2018 - Actuarial Valuations- GRS/ Ms. Karen Roggenkamp
154

County Employees Retirement System
Actuarial Valuation – June 30, 2018
Table 3 20
Development of Actuarially Determined Contribution Rate
Retirement Benefits Development of Actuarially Determined Contribution Rate
June 30, 2018
Non-Hazardous Hazardous
(1) (2)
1. Total normal cost rate
a. Service retirement 7.59% 8.57%
b. Deferred termination benefits and refunds 1.76% 4.76%
c. Survivor benefits 0.32% 0.20%
d. Disability benefits 0.34% 0.54%
e. Total 10.01% 14.07%
2. Less: member contribution rate -5.00% -8.00%
3. Total employer normal cost rate 5.01% 6.07%
4. Administrative expenses 0.79% 0.28%
5. Net employer normal cost rate 5.80% 6.35%
6. UAAL amortization contribution 16.72% 30.63%
7. Total calculated employer contribution 22.52% 36.98%
Board Meeting- December 17, 2018 - Actuarial Valuations- GRS/ Ms. Karen Roggenkamp
155

County Employees Retirement System
Actuarial Valuation – June 30, 2018
Table 4 21
Actuarial Balance Sheet Actuarial Balance Sheet
Non-Hazardous Members Retirement Hazardous Members Retirement
(Dollar amounts expressed in thousands) (Dollar amounts expressed in thousands)
June 30, 2018 June 30, 2017
(1) (2)
1. Assets - Present and Expected Future Resources
a. Current assets (actuarial value) 6,950,225$ 6,764,873$
b. Present value of future member contributions 976,392$ 961,800$
c. Present value of future employer contributions
i. Normal cost contributions 850,617$ 870,845$
ii. Unfunded accrued liability contributions 6,241,280 6,038,637
iii. Total future employer contributions 7,091,897$ 6,909,482$
d. Total assets 15,018,514$ 14,636,155$
2. Liabilities - Present Value of Expected Future Benefit Payments
a. Active members
i. Present value of future normal costs 1,827,009$ 1,832,645$
ii. Accrued liability 4,994,786 5,071,828
iii. Total present value of future benefits 6,821,795$ 6,904,473$
b. Present value of benefits payable on account of
current retired members and beneficiaries 7,754,521$ 7,313,076$
c. Present value of benefits payable on account of
current inactive members 442,198$ 418,606$
d. Total liabilities 15,018,514$ 14,636,155$
Board Meeting- December 17, 2018 - Actuarial Valuations- GRS/ Ms. Karen Roggenkamp
156

County Employees Retirement System
Actuarial Valuation – June 30, 2018
Table 5 22
Actuarial Balance Sheet Actuarial Balance Sheet
Hazardous Members Retirement Retirement Benefits
(Dollar amounts expressed in thousands) (Dollar amounts expressed in thousands)
June 30, 2018 June 30, 2017
(1) (2)
1. Assets - Present and Expected Future Resources
a. Current assets (actuarial value) 2,321,721$ 2,238,320$
b. Present value of future member contributions 276,852$ 272,353$
c. Present value of future employer contributions
i. Normal cost contributions 180,354$ 194,134$
ii. Unfunded accrued liability contributions 2,470,827 2,410,727
iii. Total future employer contributions 2,651,181$ 2,604,861$
d. Total assets 5,249,754$ 5,115,534$
2. Liabilities - Present Value of Expected Future Benefit Payments
a. Active members
i. Present value of future normal costs 457,206$ 466,487$
ii. Accrued liability 1,641,490 1,738,446
iii. Total present value of future benefits 2,098,696$ 2,204,933$
b. Present value of benefits payable on account of
current retired members and beneficiaries 3,094,100$ 2,851,704$
c. Present value of benefits payable on account of
current inactive members 56,958$ 58,897$
d. Total liabilities 5,249,754$ 5,115,534$
Board Meeting- December 17, 2018 - Actuarial Valuations- GRS/ Ms. Karen Roggenkamp
157

County Employees Retirement System
Actuarial Valuation – June 30, 2018
Table 6 23
Reconciliation of Retirement Net Assets Reconciliation of Retirement Net Assets (Dollar amounts expressed in thousands)* (Dollar amounts expressed in thousands)*
Year Ending
June 30, 2018 June 30, 2018
(1) (2)
Non-Hazardous Hazardous
1. Value of assets at beginning of year 6,687,237$ 2,217,996$
2. Revenue for the year
a. Contributions
i. Member contributions 160,370$ 61,089$
ii. Employer contributions 355,473 124,953
iii. Other contributions (less 401h) 2,905 2,818
iii. Total 518,748$ 188,860$
b. Income
i. Interest, dividends, and other income 155,876$ 51,582$
ii. Investment expenses (54,718) (18,196)
iii. Net 101,158$ 33,386$
c. Net realized and unrealized gains (losses) 472,587 157,932
d. Total revenue 1,092,494$ 380,178$
3. Expenditures for the year
a. Disbursements
i. Refunds 14,608$ 4,214$
ii. Regular annuity benefits 726,569 244,118
iii. Other benefit payments 0 0
iv. Transfers to other systems 0 0
v. Total 741,176$ 248,333$
b. Administrative expenses and depreciation 19,592 1,504
c. Total expenditures 760,768$ 249,837$
4. Increase in net assets
(Item 2. - Item 3.) 331,726$ 130,340$
5. Value of assets at end of year
(Item 1. + Item 4.) 7,018,963$ 2,348,337$
6. Net external cash flow
a. Dollar amount (242,020)$ (60,977)$
b. Percentage of market value -3.5% -2.7%
7. Estimated annual return on net assets 8.7% 8.7%
* Amounts may not add due to rounding
* Excludes 401h assets
Board Meeting- December 17, 2018 - Actuarial Valuations- GRS/ Ms. Karen Roggenkamp
158

County Employees Retirement System
Actuarial Valuation – June 30, 2018
Table 7 24
17
Development of Actuarial Value of Assets Development of Actuarial Value of AssetsNon-Hazardous Members Retirement Hazardous Members Retirement
(Dollar amounts expressed in thousands)* (Dollar amounts expressed in thousands)*
Year Ending June 30, 2018
1. Actuarial value of assets at beginning of year 6,764,873$
2. Market value of assets at beginning of year 6,687,237$
3. Net new investments
a. Contributions 518,748$
b. Benefit payments (741,176)
c. Administrative expenses (19,592)
d. Subtotal (242,020)$
4. Market value of assets at end of year 7,018,963$
5. Net earnings (Item 4. - Item 2. - Item 3.d.) 573,746$
6. Assumed investment return rate for fiscal year 6.25%
7. Expected return for immediate recognition 410,389$
8. Excess return for phased recognition 163,357$
9. Phased-in recognition, 20% of excess return on assets for prior years:
Fiscal Year
Ending June 30,
Excess
Return
Recognized
Amount
a. 2018 163,357$ 32,671$
b. 2017 369,213 73,843
c. 2016 (515,652) (103,130)
d. 2015 (386,073) (77,215)
e. 2014 454,067 90,813
f. Total 16,983$
10. Actuarial value of assets as of June 30, 2018
(Item 1. + Item 3.d. + Item 7.+ Item 9.f.) 6,950,225$
11. Ratio of actuarial value to market value 99.0%
12. Estimated annual return on actuarial value of assets 6.4%
* Amounts may not add due to rounding
Board Meeting- December 17, 2018 - Actuarial Valuations- GRS/ Ms. Karen Roggenkamp
159

County Employees Retirement System
Actuarial Valuation – June 30, 2018
Table 8 25
Development of Actuarial Value of Assets Development of Actuarial Value of Assets
Hazardous Members Retirement Retirement Benefits(Dollar amounts expressed in thousands)* (Dollar amounts expressed in thousands)*
Year Ending June 30, 2018
1. Actuarial value of assets at beginning of year 2,238,320$
2. Market value of assets at beginning of year 2,217,996$
3. Net new investments
a. Contributions 188,860$
b. Benefit payments (248,333)
c. Administrative expenses (1,504)
d. Subtotal (60,977)$
4. Market value of assets at end of year 2,348,337$
5. Net earnings (Item 4. - Item 2. - Item 3.d.) 191,318$
6. Assumed investment return rate for fiscal year 6.25%
7. Expected return for immediate recognition 136,719$
8. Excess return for phased recognition 54,598$
9. Phased-in recognition, 20% of excess return on assets for prior years:
Fiscal Year
Ending June 30,
Excess
Return
Recognized
Amount
a. 2018 54,598$ 10,920$
b. 2017 120,774 24,155
c. 2016 (162,540) (32,508)
d. 2015 (122,554) (24,511)
e. 2014 148,014 29,603
f. Total 7,658$
10. Actuarial value of assets as of June 30, 2018
(Item 1. + Item 3.d. + Item 7.+ Item 9.f.) 2,321,721$
11. Ratio of actuarial value to market value 98.9%
12. Estimated annual return on actuarial value of assets 6.5%
* Amounts may not add due to rounding
Board Meeting- December 17, 2018 - Actuarial Valuations- GRS/ Ms. Karen Roggenkamp
160

County Employees Retirement System
Actuarial Valuation – June 30, 2018
Table 9 26
Schedule of Funding Progress
Retirement Benefits Schedule of Funding Progress
Unfunded Actuarial
Actuarial Value of Actuarial Accrued Accrued Liability Funded Ratio Annual Covered UAAL as % of
June 30, Assets (AVA) Liability (AAL) (UAAL) (3) - (2) (2)/(3) Payroll Payroll (4)/(6)
(1) (2) (3) (4) (5) (6) (7)
Non-Hazardous Members Retirement
2011 5,629,611$ 8,918,085$ 3,288,474$ 63.1% 2,276,596$ 144.4%
2012 5,547,236 9,139,568 3,592,332 60.7% 2,236,546 160.6%
2013 5,637,094 9,378,876 3,741,782 60.1% 2,236,277 167.3%
2014 6,117,134 9,772,523 3,655,389 62.6% 2,272,270 160.9%
2015 6,474,849 10,740,325 4,265,477 60.3% 2,296,716 185.7%
2016 6,535,372 11,076,457 4,541,084 59.0% 2,352,762 193.0%
2017 6,764,873 12,803,510 6,038,637 52.8% 2,452,407 246.2%
2018 6,950,225 13,191,505 6,241,280 52.7% 2,466,801 253.0%
Hazardous Members Insurance
2011 1,779,545$ 2,859,041$ 1,079,496$ 62.2% 466,964$ 231.2%
2012 1,747,379 3,009,992 1,262,613 58.1% 464,229 272.0%
2013 1,801,691 3,124,206 1,322,514 57.7% 461,673 286.5%
2014 1,967,640 3,288,826 1,321,186 59.8% 479,164 275.7%
2015 2,096,783 3,613,308 1,516,525 58.0% 483,641 313.6%
2016 2,139,119 3,704,456 1,565,337 57.7% 492,851 317.6%
2017 2,238,320 4,649,047 2,410,727 48.1% 541,633 445.1%
2018 2,321,721 4,792,548 2,470,827 48.4% 533,618 463.0%
Total CERS Members
2011 7,409,156$ 11,777,126$ 4,367,970$ 62.9% 2,743,560$ 159.2%
2012 7,294,615 12,149,560 4,854,945 60.0% 2,700,775 179.8%
2013 7,438,785 12,503,082 5,064,297 59.5% 2,697,950 187.7%
2014 8,084,774 13,061,349 4,976,575 61.9% 2,751,434 180.9%
2015 8,571,632 14,353,633 5,782,001 59.7% 2,780,357 208.0%
2016 8,674,491 14,780,913 6,106,422 58.7% 2,845,613 214.6%
2017 9,003,193 17,452,557 8,449,364 51.6% 2,994,040 282.2%
2018 9,271,946 17,984,053 8,712,107 51.6% 3,000,419 290.4%
(Dollar amounts expressed in thousands)
Board Meeting- December 17, 2018 - Actuarial Valuations- GRS/ Ms. Karen Roggenkamp
161

County Employees Retirement System
Actuarial Valuation – June 30, 2018
Table 10 27
Non-Hazardous Hazardous
Valuation date: June 30, 2018 June 30, 2018
Actuarial cost method: Entry Age Normal Entry Age Normal
Amortization method: Level percentage of payroll Level percentage of payroll
(2% payroll growth assumed) (2% payroll growth assumed)
Amortization period for contribution rate: 25-year closed period 25-year closed period
Asset valuation method: 5-Year Smoothed Market 5-Year Smoothed Market
Actuarial assumptions:
Investment rate of return 6.25% 6.25%
Projected salary increases 3.30% to 11.55% 3.05% to 18.55%
(varies by service) (varies by service)
Inflation 2.30% 2.30%
Post-retirement benefit adjustments 0.00% 0.00%
Retiree Mortality RP-2000 Combined Mortality Table RP-2000 Combined Mortality Table
for Males and Females, projected for Males and Females, projected
using scale BB to 2013 using scale BB to 2013
(set back one year for females). (set back one year for females).
Summary of Principal Assumptions and Methods
Below is a summary of the principal economic assumptions, cost method, and the method for financing the unfunded actuarial
accrued liability:
Board Meeting- December 17, 2018 - Actuarial Valuations- GRS/ Ms. Karen Roggenkamp
162

County Employees Retirement System
Actuarial Valuation – June 30, 2018
Table 11 28
Active Retired Active
Member Members & Members Valuation
June 30, Contributions Beneficiaries (Employer Financed) Assets Active Retired ER Financed
(1) (2) (3) (4) (5) (6) (7) (8)
Non-Hazardous Members Retirement
2009 991,629$ 4,542,483$ 2,378,802$ 5,650,790$ 100.0% 100.0% 4.9%
2010 1,063,747 4,890,659 2,504,616 5,546,857 100.0% 91.7% 0.0%
2011 1,110,967 5,209,784 2,597,334 5,629,611 100.0% 86.7% 0.0%
2012 1,117,549 5,416,933 2,605,085 5,547,236 100.0% 81.8% 0.0%
2013 1,149,611 5,638,371 2,590,894 5,637,094 100.0% 79.6% 0.0%
2014 1,204,383 5,873,279 2,694,860 6,117,134 100.0% 83.6% 0.0%
2015 1,216,585 6,489,863 3,033,878 6,474,849 100.0% 81.0% 0.0%
2016 1,231,027 6,785,530 3,059,900 6,535,372 100.0% 78.2% 0.0%
2017 1,277,432 7,731,682 3,794,396 6,764,873 100.0% 71.0% 0.0%
2018 1,269,287 8,196,719 3,725,499 6,950,225 100.0% 69.3% 0.0%
Hazardous Members Insurance
2009 350,309$ 1,540,263$ 687,873$ 1,751,488$ 100.0% 91.0% 0.0%
2010 369,613 1,622,684 679,855 1,749,464 100.0% 85.0% 0.0%
2011 382,072 1,768,512 708,457 1,779,545 100.0% 79.0% 0.0%
2012 381,672 1,889,884 738,435 1,747,379 100.0% 72.3% 0.0%
2013 390,471 1,988,030 745,705 1,801,691 100.0% 71.0% 0.0%
2014 415,070 2,077,517 796,239 1,967,640 100.0% 74.7% 0.0%
2015 422,359 2,297,703 893,246 2,096,783 100.0% 72.9% 0.0%
2016 428,713 2,388,712 887,031 2,139,119 100.0% 71.6% 0.0%
2017 458,808 2,910,601 1,279,638 2,238,320 100.0% 61.1% 0.0%
2018 442,637 3,151,058 1,198,853 2,321,721 100.0% 59.6% 0.0%
Liabilities Covered by Assets
Solvency Test
Retirement Benefits(Dollar amounts expressed in thousands)
Actuarial Accrued Liability
Portion of Aggregate Accrued
Board Meeting- December 17, 2018 - Actuarial Valuations- GRS/ Ms. Karen Roggenkamp
163

INSURANCE BENEFITS
ACTUARIAL TABLES
Board Meeting- December 17, 2018 - Actuarial Valuations- GRS/ Ms. Karen Roggenkamp
164

County Employees Retirement System
Actuarial Valuation – June 30, 2018
Table 12 30
Development of Unfunded Actuarial Accrued Liability
Insurance Benefits
(Dollar amounts expressed in thousands)
June 30, 2018
Non-Hazardous Hazardous
(1) (2)
1. Projected payroll of active members 2,466,801$ 533,618$
2. Present value of future pay 19,346,340$ 3,452,875$
3. Normal cost rate
a. Total normal cost rate 3.32% 4.74%
b. Less: member contribution rate -0.46% -0.41%
c. Employer normal cost rate 2.86% 4.33%
4. Actuarial accrued liability for active members
a. Present value of future benefits 2,172,566$ 816,206$
b. Less: present value of future normal costs (605,265) (133,895)
c. Actuarial accrued liability 1,567,301$ 682,311$
5. Total actuarial accrued liability
a. Retirees and beneficiaries 1,374,325$ 983,359$
b. Inactive members 150,998 18,358
c. Active members (Item 4c) 1,567,301 682,311
d. Total 3,092,624$ 1,684,028$
6. Actuarial value of assets 2,371,430$ 1,256,306$
7. Unfunded actuarial accrued liability (UAAL)
(Item 5d - Item 6) 721,194$ 427,722$
8. Funded Ratio 76.7% 74.6%
Board Meeting- December 17, 2018 - Actuarial Valuations- GRS/ Ms. Karen Roggenkamp
165

County Employees Retirement System
Actuarial Valuation – June 30, 2018
Table 13 31
Development of Actuarially Determined Contribution Rate
Insurance Benefits
June 30, 2018
Non-Hazardous Hazardous
(1) (2)
1. Total normal cost rate 3.32% 4.74%
2. Less: member contribution rate -0.46% -0.41%
3. Total employer normal cost rate 2.86% 4.33%
4. Administrative expenses 0.03% 0.07%
5. Net employer normal cost rate 2.89% 4.40%
6. UAAL amortization contribution 1.87% 5.12%
7. Total calculated employer contribution 4.76% 9.52%
Max (0%, item 5. + item6.)
Board Meeting- December 17, 2018 - Actuarial Valuations- GRS/ Ms. Karen Roggenkamp
166

County Employees Retirement System
Actuarial Valuation – June 30, 2018
Table 14 32
Actuarial Balance Sheet Actuarial Balance Sheet
Non-Hazardous Members Insurance Hazardous Members Insurance
(Dollar amounts expressed in thousands) (Dollar amounts expressed in thousands)
June 30, 2018 June 30, 2017
(1) (2)
1. Assets - Present and Expected Future Resources
a. Current assets (actuarial value) 2,371,430$ 2,227,401$
b. Present value of future member contributions 106,356$ 94,725$
c. Present value of future employer contributions
i. Normal cost contributions 498,909$ 544,406$
ii. Unfunded accrued liability contributions 721,194 1,127,750
iii. Total future employer contributions 1,220,103$ 1,672,156$
d. Total assets 3,697,889$ 3,994,282$
2. Liabilities - Present Value of Expected Future Benefit Payments
a. Active members
i. Present value of future normal costs 605,265$ 639,131$
ii. Accrued liability 1,567,301 1,751,713
iii. Total present value of future benefits 2,172,566$ 2,390,844$
b. Present value of benefits payable on account of
current retired members and beneficiaries 1,374,325$ 1,445,497$
c. Present value of benefits payable on account of
current inactive members 150,998$ 157,941$
d. Total liabilities 3,697,889$ 3,994,282$
Board Meeting- December 17, 2018 - Actuarial Valuations- GRS/ Ms. Karen Roggenkamp
167

County Employees Retirement System
Actuarial Valuation – June 30, 2018
Table 15 33
Actuarial Balance Sheet Actuarial Balance Sheet
Hazardous Members Insurance Insurance Benefits
(Dollar amounts expressed in thousands) (Dollar amounts expressed in thousands)
June 30, 2018 June 30, 2017
(1) (2)
1. Assets - Present and Expected Future Resources
a. Current assets (actuarial value) 1,256,306$ 1,196,780$
b. Present value of future member contributions 19,064$ 16,300$
c. Present value of future employer contributions
i. Normal cost contributions 114,831$ 134,540$
ii. Unfunded accrued liability contributions 427,722 591,653
iii. Total future employer contributions 542,553$ 726,193$
d. Total assets 1,817,923$ 1,939,273$
2. Liabilities - Present Value of Expected Future Benefit Payments
a. Active members
i. Present value of future normal costs 133,895$ 150,840$
ii. Accrued liability 682,311 793,669
iii. Total present value of future benefits 816,206$ 944,509$
b. Present value of benefits payable on account of
current retired members and beneficiaries 983,359$ 973,103$
c. Present value of benefits payable on account of
current inactive members 18,358$ 21,661$
d. Total liabilities 1,817,923$ 1,939,273$
Board Meeting- December 17, 2018 - Actuarial Valuations- GRS/ Ms. Karen Roggenkamp
168
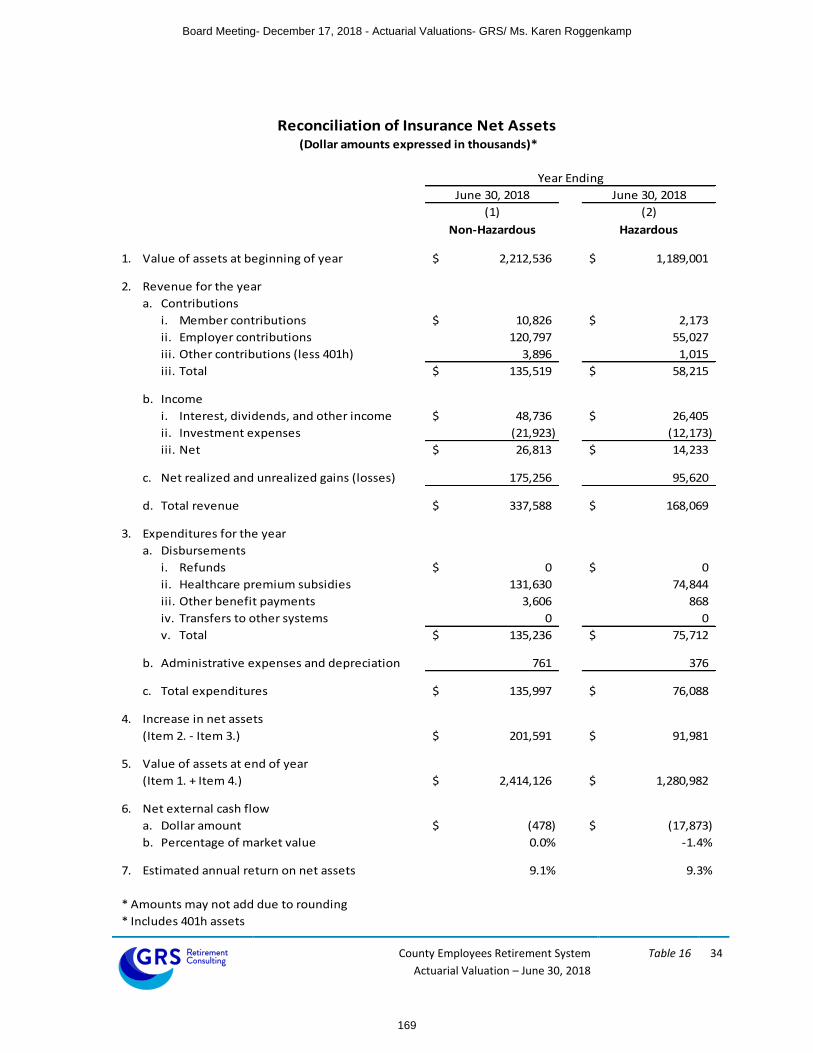
County Employees Retirement System
Actuarial Valuation – June 30, 2018
Table 16 34
Reconciliation of Insurance Net Assets
(Dollar amounts expressed in thousands)*
Year Ending
June 30, 2018 June 30, 2018
(1) (2)
Non-Hazardous Hazardous
1. Value of assets at beginning of year 2,212,536$ 1,189,001$
2. Revenue for the year
a. Contributions
i. Member contributions 10,826$ 2,173$
ii. Employer contributions 120,797 55,027
iii. Other contributions (less 401h) 3,896 1,015
iii. Total 135,519$ 58,215$
b. Income
i. Interest, dividends, and other income 48,736$ 26,405$
ii. Investment expenses (21,923) (12,173)
iii. Net 26,813$ 14,233$
c. Net realized and unrealized gains (losses) 175,256 95,620
d. Total revenue 337,588$ 168,069$
3. Expenditures for the year
a. Disbursements
i. Refunds 0$ 0$
ii. Healthcare premium subsidies 131,630 74,844
iii. Other benefit payments 3,606 868
iv. Transfers to other systems 0 0
v. Total 135,236$ 75,712$
b. Administrative expenses and depreciation 761 376
c. Total expenditures 135,997$ 76,088$
4. Increase in net assets
(Item 2. - Item 3.) 201,591$ 91,981$
5. Value of assets at end of year
(Item 1. + Item 4.) 2,414,126$ 1,280,982$
6. Net external cash flow
a. Dollar amount (478)$ (17,873)$
b. Percentage of market value 0.0% -1.4%
7. Estimated annual return on net assets 9.1% 9.3%
* Amounts may not add due to rounding
* Includes 401h assets
Board Meeting- December 17, 2018 - Actuarial Valuations- GRS/ Ms. Karen Roggenkamp
169

County Employees Retirement System
Actuarial Valuation – June 30, 2018
Table 17 35
17
Development of Actuarial Value of Assets Development of Actuarial Value of AssetsNon-Hazardous Members Insurance Hazardous Members Insurance
(Dollar amounts expressed in thousands)* (Dollar amounts expressed in thousands)*
Year Ending June 30, 2018
1. Actuarial value of assets at beginning of year 2,227,401$
2. Market value of assets at beginning of year 2,212,536$
3. Net new investments
a. Contributions 135,519$
b. Benefit payments (135,236)
c. Administrative expenses (761)
d. Subtotal (478)$
4. Market value of assets at end of year 2,414,126$
5. Net earnings (Item 4. - Item 2. - Item 3.d.) 202,069$
6. Assumed investment return rate for fiscal year 6.25%
7. Expected return for immediate recognition 138,269$
8. Excess return for phased recognition 63,800$
9. Phased-in recognition, 20% of excess return on assets for prior years:
Fiscal Year
Ending June 30,
Excess
Return
Recognized
Amount
a. 2018 63,800$ 12,760$
b. 2017 121,364 24,273
c. 2016 (147,421) (29,484)
d. 2015 (110,970) (22,194)
e. 2014 104,420 20,884
f. Total 6,239$
10. Actuarial value of assets as of June 30, 2018
(Item 1. + Item 3.d. + Item 7.+ Item 9.f.) 2,371,430$
11. Ratio of actuarial value to market value 98.2%
12. Estimated annual return on actuarial value of assets 6.5%
* Amounts may not add due to rounding
Board Meeting- December 17, 2018 - Actuarial Valuations- GRS/ Ms. Karen Roggenkamp
170

County Employees Retirement System
Actuarial Valuation – June 30, 2018
Table 18 36
17
Development of Actuarial Value of Assets Development of Actuarial Value of AssetsHazardous Members Insurance Insurance Benefits
(Dollar amounts expressed in thousands)* (Dollar amounts expressed in thousands)*
Year Ending June 30, 2018
1. Actuarial value of assets at beginning of year 1,196,780$
2. Market value of assets at beginning of year 1,189,001$
3. Net new investments
a. Contributions 58,215$
b. Benefit payments (75,712)
c. Administrative expenses (376)
d. Subtotal (17,873)$
4. Market value of assets at end of year 1,280,982$
5. Net earnings (Item 4. - Item 2. - Item 3.d.) 109,853$
6. Assumed investment return rate for fiscal year 6.25%
7. Expected return for immediate recognition 73,754$
8. Excess return for phased recognition 36,099$
9. Phased-in recognition, 20% of excess return on assets for prior years:
Fiscal Year
Ending June 30,
Excess
Return
Recognized
Amount
a. 2018 36,099$ 7,220$
b. 2017 65,383 13,077
c. 2016 (78,507) (15,701)
d. 2015 (60,152) (12,030)
e. 2014 55,401 11,080
f. Total 3,645$
10. Actuarial value of assets as of June 30, 2018
(Item 1. + Item 3.d. + Item 7.+ Item 9.f.) 1,256,306$
11. Ratio of actuarial value to market value 98.1%
12. Estimated annual return on actuarial value of assets 6.5%
* Amounts may not add due to rounding
Board Meeting- December 17, 2018 - Actuarial Valuations- GRS/ Ms. Karen Roggenkamp
171

County Employees Retirement System
Actuarial Valuation – June 30, 2018
Table 19 37
Schedule of Funding Progress
Insurance Benefits
Unfunded Actuarial
Actuarial Value of Actuarial Accrued Accrued Liability Funded Ratio Annual Covered UAAL as % of
June 30, Assets (AVA) Liability (AAL) (UAAL) (3) - (2) (2)/(3) Payroll Payroll (4)/(6)
(1) (2) (3) (4) (5) (6) (7)
Non-Hazardous Members
2011 1,433,451$ 3,073,973$ 1,640,522$ 46.6% 2,276,596$ 72.1%
2012 1,512,854 2,370,771 857,917 63.8% 2,236,546 38.4%
2013 1,628,244 2,443,894 815,650 66.6% 2,236,277 36.5%
2014 1,831,199 2,616,915 785,715 70.0% 2,272,270 34.6%
2015 1,997,456 2,907,827 910,371 68.7% 2,296,716 39.6%
2016 2,079,811 2,988,121 908,310 69.6% 2,352,762 38.6%
2017 2,227,401 3,355,151 1,127,750 66.4% 2,452,407 46.0%
2018 2,371,430 3,092,624 721,194 76.7% 2,466,801 29.2%
Hazardous Members
2011 770,790$ 1,647,703$ 876,912$ 46.8% 466,964$ 187.8%
2012 829,041 1,364,843 535,802 60.7% 464,229 115.4%
2013 892,774 1,437,333 544,558 62.1% 461,673 118.0%
2014 997,733 1,493,864 496,131 66.8% 479,164 103.5%
2015 1,087,707 1,504,015 416,308 72.3% 483,641 86.1%
2016 1,135,784 1,558,818 423,034 72.9% 492,851 85.8%
2017 1,196,780 1,788,433 591,653 66.9% 541,633 109.2%
2018 1,256,306 1,684,028 427,722 74.6% 533,618 80.2%
Total CERS Members
2011 2,204,241$ 4,721,676$ 2,517,435$ 46.7% 2,743,560$ 91.8%
2012 2,341,895 3,735,614 1,393,719 62.7% 2,700,775 51.6%
2013 2,521,018 3,881,227 1,360,209 65.0% 2,697,950 50.4%
2014 2,828,932 4,110,779 1,281,847 68.8% 2,751,434 46.6%
2015 3,085,163 4,411,842 1,326,679 69.9% 2,780,357 47.7%
2016 3,215,595 4,546,939 1,331,344 70.7% 2,845,613 46.8%
2017 3,424,181 5,143,584 1,719,403 66.6% 2,994,040 57.4%
2018 3,627,736 4,776,652 1,148,916 75.9% 3,000,419 38.3%
(Dollar amounts expressed in thousands)
Board Meeting- December 17, 2018 - Actuarial Valuations- GRS/ Ms. Karen Roggenkamp
172

County Employees Retirement System
Actuarial Valuation – June 30, 2018
Table 20 38
Active Retired Active
Member Members & Members Valuation
June 30, Contributions Beneficiaries (Employer Financed) Assets Active Retired ER Financed
(1) (2) (3) (4) (5) (6) (7) (8)
Non-Hazardous Members
2009 -$ 1,478,783$ 1,591,603$ 1,216,632$ 100.0% 82.3% 0.0%
2010 - 1,526,533 1,631,807 1,293,039 100.0% 84.7% 0.0%
2011 - 1,460,808 1,613,165 1,433,451 100.0% 98.1% 0.0%
2012 - 1,146,908 1,223,864 1,512,854 100.0% 100.0% 29.9%
2013 - 1,205,599 1,238,295 1,628,244 100.0% 100.0% 34.1%
2014 - 1,318,183 1,298,732 1,831,199 100.0% 100.0% 39.5%
2015 - 1,372,597 1,535,231 1,997,456 100.0% 100.0% 40.7%
2016 - 1,484,937 1,503,184 2,079,811 100.0% 100.0% 39.6%
2017 - 1,603,438 1,751,713 2,227,401 100.0% 100.0% 35.6%
2018 - 1,525,323 1,567,301 2,371,430 100.0% 100.0% 54.0%
Hazardous Members
2009 -$ 725,900$ 867,648$ 651,131$ 100.0% 89.7% 0.0%
2010 - 814,300 860,403 692,770 100.0% 85.1% 0.0%
2011 - 771,631 876,071 770,790 100.0% 99.9% 0.0%
2012 - 575,099 789,744 829,041 100.0% 100.0% 32.2%
2013 - 660,955 776,377 892,774 100.0% 100.0% 29.9%
2014 - 700,312 793,553 997,733 100.0% 100.0% 37.5%
2015 - 790,714 713,301 1,087,707 100.0% 100.0% 41.6%
2016 - 879,360 679,458 1,135,784 100.0% 100.0% 37.7%
2017 - 994,764 793,669 1,196,780 100.0% 100.0% 25.5%
2018 - 1,001,717 682,311 1,256,306 100.0% 100.0% 37.3%
Liabilities Covered by Assets
Actuarial Accrued Liability
Portion of Aggregate Accrued
Solvency Test
Insurance Benefits(Dollar amounts expressed in thousands)
Board Meeting- December 17, 2018 - Actuarial Valuations- GRS/ Ms. Karen Roggenkamp
173

SECTION 4
MEMBERSHIP INFORMATION
Board Meeting- December 17, 2018 - Actuarial Valuations- GRS/ Ms. Karen Roggenkamp
174

County Employees Retirement System
Actuarial Valuation – June 30, 2018
Section 4 40
Membership Tables TABLE
NUMBER
PAGE
CONTENT OF TABLE
21 41 SUMMARY OF MEMBERSHIP DATA
22 42 SUMMARY OF HISTORICAL ACTIVE MEMBERSHIP
23 43 DISTRIBUTION OF ACTIVE MEMBERS BY AGE AND SERVICE – NON-HAZARDOUS
MEMBERS
24 44 DISTRIBUTION OF ACTIVE MEMBERS BY AGE AND SERVICE – HAZARDOUS MEMBERS
25 45 SCHEDULE OF ANNUITANTS BY AGE – NON-HAZARDOUS MEMBERS
26 46 SCHEDULE OF ANNUITANTS BY AGE – HAZARDOUS MEMBERS
27 47 SCHEDULE OF ANNUITANTS BY BENEFIT TYPE – NON-HAZARDOUS RETIREES
28 48 SCHEDULE OF ANNUITANTS BY BENEFIT TYPE – HAZARDOUS RETIREES
29 49 SCHEDULE OF ANNUITANTS BY BENEFIT TYPE – NON-HAZARDOUS BENEFICIARIES
30 50 SCHEDULE OF ANNUITANTS BY BENEFIT TYPE – HAZARDOUS BENEFICIARIES
31 51 SCHEDULE OF ANNUITANTS ADDED TO AND REMOVED FROM ROLLS
Board Meeting- December 17, 2018 - Actuarial Valuations- GRS/ Ms. Karen Roggenkamp
175

County Employees Retirement System
Actuarial Valuation – June 30, 2018
Table 21 41
Non-Hazardous Hazardous Total Total
June 30, 2018 June 30, 2018 June 30, 2018 June 30, 2017
(1) (2) (3) (4)
1. Active members
a. Males 29,252 8,137 37,389 37,655
b. Females 52,566 1,126 53,692 54,038
c. Total members 81,818 9,263 91,081 91,693
d. Total annualized prior year salaries 2,466,801$ 533,618$ 3,000,419$ 2,994,040$
e. Average salary 30,150$ 57,607$ 32,942$ 32,653$
f. Average age 47.7 38.5 46.8 47.0
g. Average service 9.2 10.2 9.3 9.5
h. Member contributions with interest 1,269,287$ 442,637$ 1,711,924$ 1,736,240$
i. Average contributions with interest 15,514$ 47,786$ 18,796$ 18,935$
2. Vested inactive members
a. Number 17,621 954 18,575 15,358
b. Total annual deferred benefits 66,670$ 7,194$ 73,864$ 69,010$
c. Average annual deferred benefit 3,784$ 7,540$ 3,977$ 4,493$
d. Average age at the valuation date 50.6 43.4 50.3 50.6
3. Nonvested inactive members
a. Number 69,539 2,113 71,652 72,871
b. Total member contributions with interest 76,173$ 5,911$ 82,084$ 86,252$
c. Average contributions with interest 1,095$ 2,797$ 1,146$ 1,184$
4. Service retirees
a. Number 52,123 7,916 60,039 56,977
b. Total annual benefits 611,865$ 219,838$ 831,703$ 776,476$
c. Average annual benefit 11,739$ 27,771$ 13,853$ 13,628$
d. Average age at the valuation date 70.3 61.8 69.2 69.1
5. Disabled retirees
a. Number 4,165 564 4,729 4,640
b. Total annual benefits 47,368$ 9,328$ 56,695$ 55,008$
c. Average annual benefit 11,373$ 16,539$ 11,989$ 11,855$
d. Average age at the valuation date 65.2 56.6 64.1 63.8
6. Beneficiaries
a. Number 5,650 1,107 6,757 6,394
b. Total annual benefits 51,141$ 16,509$ 67,650$ 62,664$
c. Average annual benefit 9,052$ 14,913$ 10,012$ 9,800$
d. Average age at the valuation date 68.1 57.7 66.4 66.9
Summary of Membership Data(Total dollar amounts expressed in thousands)
Board Meeting- December 17, 2018 - Actuarial Valuations- GRS/ Ms. Karen Roggenkamp
176

County Employees Retirement System
Actuarial Valuation – June 30, 2018
Table 22 42
Percent Percent Percent
Increase Amount in Increase Increase
June 30, Number /(Decrease) Thousands /(Decrease) Amount /(Decrease)
(1) (2) (3) (4) (5) (6) (7)
Non-Hazardous Members
2011 85,285 2,276,596 26,694$
2012 83,052 -2.6% 2,236,546 -1.8% 26,929 0.9%
2013 81,815 -1.5% 2,236,277 0.0% 27,333 1.5%
2014 81,115 -0.9% 2,272,270 1.6% 28,013 2.5%
2015 80,852 -0.3% 2,296,716 1.1% 28,406 1.4%
2016 80,664 -0.2% 2,352,762 2.4% 29,167 2.7%
2017 82,198 1.9% 2,452,407 4.2% 29,835 2.3%
2018 81,818 -0.5% 2,466,801 0.6% 30,150 1.1%
Hazardous Members
2011 9,407 466,964$ 49,640$
2012 9,130 -2.9% 464,229 -0.6% 50,847 2.4%
2013 9,123 -0.1% 461,673 -0.6% 50,605 -0.5%
2014 9,194 0.8% 479,164 3.8% 52,117 3.0%
2015 9,172 -0.2% 483,641 0.9% 52,730 1.2%
2016 9,084 -1.0% 492,851 1.9% 54,255 2.9%
2017 9,495 4.5% 541,633 9.9% 57,044 5.1%
2018 9,263 -2.4% 533,618 -1.5% 57,607 1.0%
Summary of Historical Active Membership
Active Members Covered Payroll1 Average Annual Pay
Board Meeting- December 17, 2018 - Actuarial Valuations- GRS/ Ms. Karen Roggenkamp
177

County Employees Retirement System
Actuarial Valuation – June 30, 2018
Table 23 43
0 1 2 3 4 5-9 10-14 15-19 20-24 25-29 30-34 35 & Over TotalAttained Count & Count & Count & Count & Count & Count & Count & Count & Count & Count & Count & Count & Count &
Age Avg. Comp. Avg. Comp. Avg. Comp. Avg. Comp. Avg. Comp. Avg. Comp. Avg. Comp. Avg. Comp. Avg. Comp. Avg. Comp. Avg. Comp. Avg. Comp. Avg. Comp.
Under 20 125 9 0 0 1 0 1 0 0 0 0 0 136
$13,084 $15,227 $0 $0 $15,544 $0 $13,319 $0 $0 $0 $0 $0 $13,245
20-24 1,422 652 276 124 46 21 2 0 0 0 0 0 2,543
$17,513 $23,339 $26,154 $25,222 $30,370 $29,907 $14,475 $0 $0 $0 $0 $0 $20,653
25-29 1,554 1,156 813 586 374 580 13 0 1 1 0 0 5,078
$19,952 $24,791 $26,249 $29,167 $31,193 $34,050 $41,333 $0 $1,508 $79,781 $0 $0 $25,626
30-34 1,411 1,021 801 650 470 1,434 532 13 1 0 0 0 6,333
$19,571 $24,118 $26,024 $29,085 $32,022 $35,706 $39,938 $39,466 $57,456 $0 $0 $0 $28,432
35-39 1,308 1,063 826 743 528 1,757 1,310 530 20 1 0 0 8,086
$19,590 $24,341 $25,348 $25,478 $27,983 $32,872 $40,828 $43,959 $59,147 $89,817 $0 $0 $29,922
40-44 1,139 973 798 720 562 2,026 1,585 1,203 417 13 0 0 9,436
$20,756 $23,342 $24,929 $26,327 $27,139 $31,370 $36,888 $44,154 $48,782 $59,770 $0 $0 $31,445
45-49 936 882 731 688 577 2,316 2,198 1,720 1,006 214 9 0 11,277
$20,415 $24,525 $25,765 $27,342 $28,905 $29,682 $34,032 $40,110 $49,254 $55,423 $90,203 $0 $32,794
50-54 830 718 594 570 475 2,048 2,250 2,396 1,379 411 82 11 11,764
$20,040 $23,321 $25,834 $26,860 $27,267 $29,559 $31,969 $34,222 $40,821 $49,621 $61,156 $76,222 $31,791
55-59 698 610 518 558 440 1,895 2,225 2,608 1,800 642 120 41 12,155
$18,616 $25,026 $24,928 $27,025 $27,386 $30,060 $31,483 $32,373 $36,283 $44,360 $55,998 $62,973 $31,496
60-64 512 441 368 399 326 1,587 1,615 1,724 1,289 595 109 54 9,019
$17,828 $21,130 $24,516 $25,827 $26,135 $28,076 $31,599 $33,870 $34,872 $40,514 $47,746 $62,859 $30,816
65 & Over 411 345 266 323 241 1,249 1,169 965 530 326 98 68 5,991
$13,194 $18,037 $19,335 $22,333 $20,380 $24,064 $27,610 $31,433 $34,276 $36,031 $39,891 $53,730 $26,549
Total 10,346 7,870 5,991 5,361 4,040 14,913 12,900 11,159 6,443 2,203 418 174 81,818
$19,110 $23,686 $25,287 $26,810 $28,036 $30,426 $33,633 $35,941 $39,710 $44,273 $51,818 $60,163 $30,150
Distribution of Active Members by Age and by Years of ServiceNon-Hazardous Members
Years of Credited Service
Board Meeting- December 17, 2018 - Actuarial Valuations- GRS/ Ms. Karen Roggenkamp
178

County Employees Retirement System
Actuarial Valuation – June 30, 2018
Table 24 44
0 1 2 3 4 5-9 10-14 15-19 20-24 25-29 30-34 35 & Over TotalAttained Count & Count & Count & Count & Count & Count & Count & Count & Count & Count & Count & Count & Count &
Age Avg. Comp. Avg. Comp. Avg. Comp. Avg. Comp. Avg. Comp. Avg. Comp. Avg. Comp. Avg. Comp. Avg. Comp. Avg. Comp. Avg. Comp. Avg. Comp. Avg. Comp.
Under 20 3 1 0 0 0 0 0 0 0 0 0 0 4
$27,500 $24,839 $0 $0 $0 $0 $0 $0 $0 $0 $0 $0 $26,835
20-24 208 128 66 14 8 6 0 0 0 0 0 0 430
$32,837 $43,725 $43,019 $50,558 $42,294 $40,110 $0 $0 $0 $0 $0 $0 $38,495
25-29 216 274 244 199 191 236 1 0 0 0 0 0 1,361
$34,908 $44,642 $47,898 $50,820 $50,737 $52,714 $48,992 $0 $0 $0 $0 $0 $46,842
30-34 113 154 120 149 133 765 252 1 0 0 0 0 1,687
$34,909 $44,540 $48,276 $52,159 $52,702 $57,267 $61,643 $46,208 $0 $0 $0 $0 $53,804
35-39 50 62 55 62 68 425 711 220 13 0 0 0 1,666
$36,373 $45,227 $47,569 $51,950 $50,786 $57,788 $62,280 $65,830 $80,391 $0 $0 $0 $58,993
40-44 23 27 27 26 29 223 448 581 197 16 0 0 1,597
$29,630 $45,790 $51,249 $49,746 $53,251 $55,585 $62,007 $67,981 $78,511 $84,626 $0 $0 $64,265
45-49 21 24 23 20 19 126 267 492 320 51 5 0 1,368
$35,587 $39,617 $48,544 $44,839 $48,577 $56,201 $59,941 $65,806 $77,431 $86,080 $96,227 $0 $65,604
50-54 10 14 9 7 12 70 141 215 105 65 11 0 659
$28,753 $42,939 $37,105 $57,315 $45,121 $56,091 $57,113 $64,279 $72,814 $87,685 $83,445 $0 $64,078
55-59 9 1 7 6 5 33 70 83 55 27 12 1 309
$39,932 $69,292 $47,400 $48,773 $52,971 $50,822 $53,798 $63,068 $63,261 $77,362 $94,694 $123,210 $60,917
60-64 4 3 0 3 1 15 31 28 16 10 5 2 118
$31,110 $59,168 $0 $54,765 $34,127 $44,701 $53,033 $59,578 $62,051 $69,201 $92,672 $118,612 $58,208
65 & Over 1 1 3 1 1 8 16 20 5 2 2 4 64
$29,880 $28,673 $66,092 $21,011 $44,502 $38,312 $48,834 $70,117 $73,697 $58,985 $72,703 $103,827 $60,308
Total 658 689 554 487 467 1,907 1,937 1,640 711 171 35 7 9,263
$34,113 $44,384 $47,473 $51,094 $51,058 $56,165 $60,863 $66,175 $75,634 $83,873 $89,832 $110,820 $57,607
Distribution of Active Members by Age and by Years of ServiceHazardous Members
Years of Credited Service
Board Meeting- December 17, 2018 - Actuarial Valuations- GRS/ Ms. Karen Roggenkamp
179

County Employees Retirement System
Actuarial Valuation – June 30, 2018
Table 25 45
Distribution of Annuitant Monthly Benefit by Status and Age Distribution of Annuitant Monthly Benefit by Status and Age
Non-Hazardous Retirees and Beneficiaries Hazardous Retirees and Beneficiaries(Dollar amounts expressed in thousands) (Dollar amounts expressed in thousands)
Current Number of Number of Number of Number ofAge Annuitants Annuitants Annuitants Annuitants(1) (2) (4) (6) (8)
Under 50 306 $ 6,911 206 $ 2,574 694 $ 5,482 1,206 $ 14,967
50 - 54 1,241 29,780 293 3,758 270 2,509 1,804 36,047
55 - 59 4,147 72,485 694 8,847 441 4,444 5,282 85,776
60 - 64 8,594 121,258 937 11,205 626 6,396 10,157 138,859
65 - 69 12,599 148,601 827 9,338 795 8,171 14,221 166,110
70 - 74 10,505 108,480 577 5,932 773 7,714 11,855 122,126
75 - 79 7,332 67,318 386 3,743 791 7,338 8,509 78,399
80 - 84 4,308 35,457 182 1,540 587 4,666 5,077 41,663
85 - 89 2,101 15,581 54 384 430 3,110 2,585 19,075
90 And Over 990 5,994 9 47 243 1,310 1,242 7,351
Total 52,123 $ 611,865 4,165 $ 47,368 5,650 $ 51,141 61,938 $ 710,374
(5) (7) (9)Amount Amount Amount Amount
Annual Benefit Annual Benefit Annual BenefitTotal Total Total Total
Disability Survivors & Beneficiaries TotalRetirement
Annual Benefit
(3)
Board Meeting- December 17, 2018 - Actuarial Valuations- GRS/ Ms. Karen Roggenkamp
180

County Employees Retirement System
Actuarial Valuation – June 30, 2018
Table 26 46
Distribution of Annuitant Monthly Benefit by Status and Age Distribution of Annuitant Monthly Benefit by Status and Age
Hazardous Retirees and Beneficiaries Retirees and Beneficiaries(Dollar amounts expressed in thousands) (Dollar amounts expressed in thousands)
Current Number of Number of Number of Number ofAge Annuitants Annuitants Annuitants Annuitants(1) (2) (4) (6) (8)
Under 50 954 $ 31,680 157 $ 2,757 279 $ 2,323 1,390 $ 36,760
50 - 54 1,253 41,021 97 1,720 77 1,120 1,427 43,861
55 - 59 1,265 37,939 105 1,788 93 1,665 1,463 41,392
60 - 64 1,410 37,533 96 1,396 152 2,469 1,658 41,398
65 - 69 1,420 36,526 65 977 150 2,890 1,635 40,393
70 - 74 896 19,959 29 491 143 2,477 1,068 22,927
75 - 79 478 10,123 7 83 99 1,875 584 12,081
80 - 84 180 3,665 7 96 73 1,014 260 4,775
85 - 89 50 1,195 0 - 33 516 83 1,711
90 And Over 10 196 1 20 8 160 19 376
Total 7,916 $ 219,838 564 $ 9,328 1,107 $ 16,509 9,587 $ 245,675
(7) (9)
Annual Benefit Annual Benefit
Survivors & Beneficiaries Total
(3) (5)Amount Amount Amount Amount
Annual Benefit Annual BenefitTotal Total Total Total
Retirement Disability
Board Meeting- December 17, 2018 - Actuarial Valuations- GRS/ Ms. Karen Roggenkamp
181

County Employees Retirement System
Actuarial Valuation – June 30, 2018
Table 27 47
Non-Hazardous Retired Lives Summary Hazardous Retired Lives Summary
Male Lives Female Lives Total
Monthly Monthly Monthly
Form of Payment Number Benefit Amount Number Benefit Amount Number Benefit Amount
(1) (2) (3) (4) (5) (6) (7)
Basic 5,709 $ 6,016,003 20,431 $ 15,327,748 26,140 $ 21,343,751
Joint & Survivor:
100% to Beneficiary 3,264 3,795,295 1,888 1,239,053 5,152 5,034,348
66 2/3% to Beneficiary 863 1,590,528 668 717,280 1,531 2,307,808
50% to Beneficiary 1,183 1,936,508 1,735 2,007,149 2,918 3,943,658
Pop-up Option 4,237 6,797,888 3,945 4,213,658 8,182 11,011,547
Social Security Option:
Age 62 Basic 249 429,948 543 570,090 792 1,000,038
Age 62 Survivorship 599 1,066,262 367 375,074 966 1,441,336
Partial Deferred (Old Plan) 0 0 0 0 0 0
Widows Age 60 0 0 0 0 0 0
5 Years Certain 0 0 0 0 0 0
10 Years Certain 0 0 1 236 1 236
10 Years Certain & Life 1,461 1,549,983 3,582 2,781,656 5,043 4,331,639
15 Years Certain & Life 661 685,408 925 717,857 1,586 1,403,265
20 Years Certain & Life 496 686,107 789 595,322 1,285 1,281,429
Refund 0 0 0 0 0 0
Partial Lump Sum Option (PLSO):
12 Month Basic 91 108,237 360 308,541 451 416,779
24 Month Basic 56 38,167 238 192,634 294 230,801
36 Month Basic 241 119,288 691 316,436 932 435,724
12 Month Survivor 137 170,256 88 88,115 225 258,371
24 Month Survivor 85 87,067 59 37,965 144 125,032
36 Month Survivor 372 244,946 274 125,381 646 370,327
Total: 19,704 $ 25,321,895 36,584 $ 29,614,195 56,288 $ 54,936,090
Board Meeting- December 17, 2018 - Actuarial Valuations- GRS/ Ms. Karen Roggenkamp
182

County Employees Retirement System
Actuarial Valuation – June 30, 2018
Table 28 48
Hazardous Retired Lives Summary Retired Lives Summary
Male Lives Female Lives Total
Monthly Monthly Monthly
Form of Payment Number Benefit Amount Number Benefit Amount Number Benefit Amount
(1) (2) (3) (4) (5) (6) (7)
Basic 1,163 $ 2,421,416 343 $ 543,755 1,506 $ 2,965,171
Joint & Survivor:
100% to Beneficiary 999 2,165,629 43 56,826 1,042 2,222,455
66 2/3% to Beneficiary 336 856,258 21 52,813 357 909,072
50% to Beneficiary 485 1,185,427 51 113,274 536 1,298,700
Pop-up Option 3,334 8,575,121 158 318,383 3,492 8,893,504
Social Security Option:
Age 62 Basic 109 169,548 13 12,930 122 182,477
Age 62 Survivorship 296 487,661 19 32,950 315 520,610
Partial Deferred (Old Plan) 0 0 0 0 0 0
Widows Age 60 0 0 0 0 0 0
5 Years Certain 0 0 0 0 0 0
10 Years Certain 94 175,991 4 4,175 98 180,166
10 Years Certain & Life 241 507,015 68 121,260 309 628,275
15 Years Certain & Life 97 188,809 18 30,961 115 219,770
20 Years Certain & Life 168 352,277 29 45,859 197 398,136
Refund 0 0 0 0 0 0
Partial Lump Sum Option (PLSO):
12 Month Basic 22 35,421 9 12,127 31 47,548
24 Month Basic 20 42,817 6 6,336 26 49,154
36 Month Basic 49 82,198 19 22,651 68 104,849
12 Month Survivor 57 146,341 4 8,080 61 154,422
24 Month Survivor 66 108,868 2 2,248 68 111,117
36 Month Survivor 131 205,458 6 6,249 137 211,707
Total: 7,667 $ 17,706,255 813 $ 1,390,877 8,480 $ 19,097,132
Board Meeting- December 17, 2018 - Actuarial Valuations- GRS/ Ms. Karen Roggenkamp
183
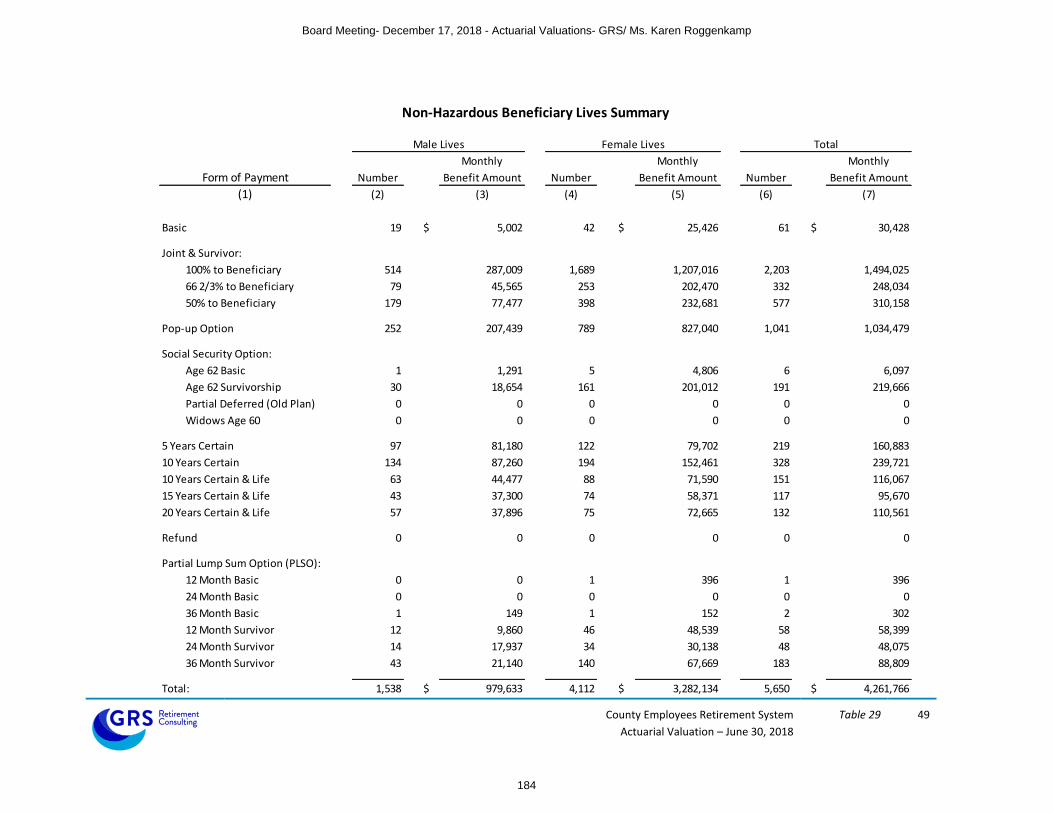
County Employees Retirement System
Actuarial Valuation – June 30, 2018
Table 29 49
Non-Hazardous Beneficiary Lives Summary Hazardous Beneficiary Lives Summary
Male Lives Female Lives Total
Monthly Monthly Monthly
Form of Payment Number Benefit Amount Number Benefit Amount Number Benefit Amount
(1) (2) (3) (4) (5) (6) (7)
Basic 19 $ 5,002 42 $ 25,426 61 $ 30,428
Joint & Survivor:
100% to Beneficiary 514 287,009 1,689 1,207,016 2,203 1,494,025
66 2/3% to Beneficiary 79 45,565 253 202,470 332 248,034
50% to Beneficiary 179 77,477 398 232,681 577 310,158
Pop-up Option 252 207,439 789 827,040 1,041 1,034,479
Social Security Option:
Age 62 Basic 1 1,291 5 4,806 6 6,097
Age 62 Survivorship 30 18,654 161 201,012 191 219,666
Partial Deferred (Old Plan) 0 0 0 0 0 0
Widows Age 60 0 0 0 0 0 0
5 Years Certain 97 81,180 122 79,702 219 160,883
10 Years Certain 134 87,260 194 152,461 328 239,721
10 Years Certain & Life 63 44,477 88 71,590 151 116,067
15 Years Certain & Life 43 37,300 74 58,371 117 95,670
20 Years Certain & Life 57 37,896 75 72,665 132 110,561
Refund 0 0 0 0 0 0
Partial Lump Sum Option (PLSO):
12 Month Basic 0 0 1 396 1 396
24 Month Basic 0 0 0 0 0 0
36 Month Basic 1 149 1 152 2 302
12 Month Survivor 12 9,860 46 48,539 58 58,399
24 Month Survivor 14 17,937 34 30,138 48 48,075
36 Month Survivor 43 21,140 140 67,669 183 88,809
Total: 1,538 $ 979,633 4,112 $ 3,282,134 5,650 $ 4,261,766
Board Meeting- December 17, 2018 - Actuarial Valuations- GRS/ Ms. Karen Roggenkamp
184

County Employees Retirement System
Actuarial Valuation – June 30, 2018
Table 30 50
Hazardous Beneficiary Lives Summary Beneficiary Lives Summary
Male Lives Female Lives Total
Monthly Monthly Monthly
Form of Payment Number Benefit Amount Number Benefit Amount Number Benefit Amount
(1) (2) (3) (4) (5) (6) (7)
Basic 11 $ 5,268 47 $ 38,598 58 $ 43,866
Joint & Survivor:
100% to Beneficiary 36 28,175 258 320,020 294 348,195
66 2/3% to Beneficiary 4 4,477 55 75,909 59 80,387
50% to Beneficiary 14 10,925 83 77,328 97 88,254
Pop-up Option 49 39,605 290 495,927 339 535,532
Social Security Option:
Age 62 Basic 0 0 0 0 0 0
Age 62 Survivorship 3 3,234 106 145,847 109 149,081
Partial Deferred (Old Plan) 0 0 0 0 0 0
Widows Age 60 0 0 3 2,669 3 2,669
5 Years Certain 1 1,784 2 1,333 3 3,116
10 Years Certain 28 23,769 12 10,875 40 34,644
10 Years Certain & Life 5 3,607 7 4,285 12 7,893
15 Years Certain & Life 3 686 4 6,218 7 6,905
20 Years Certain & Life 3 1,403 14 12,772 17 14,174
Refund 0 0 0 0 0 0
Partial Lump Sum Option (PLSO):
12 Month Basic 0 0 2 2,641 2 2,641
24 Month Basic 0 0 1 1,467 1 1,467
36 Month Basic 2 562 2 1,296 4 1,858
12 Month Survivor 0 0 8 11,725 8 11,725
24 Month Survivor 1 1,295 12 7,949 13 9,244
36 Month Survivor 5 3,219 36 30,898 41 34,117
Total: 165 $ 128,008 942 $ 1,247,758 1,107 $ 1,375,767
Board Meeting- December 17, 2018 - Actuarial Valuations- GRS/ Ms. Karen Roggenkamp
185

County Employees Retirement System
Actuarial Valuation – June 30, 2018
Table 31 51
Added to Removed
Rolls from Rolls % Increase Average
Year Annual in Annual Annual
Ended Number Number Number Benefits Benefit Benefit
(1) (2) (3) (4) (5) (6) (7)
2011 3,250 1,077 43,211 483,594$ 11,191$
2012 3,300 1,207 45,304 515,008 6.5% 11,368
2013 3,570 1,198 47,676 557,979 8.3% 11,704
2014 3,480 1,221 49,935 582,958 4.5% 11,674
2015 4,020 1,304 52,651 617,551 5.9% 11,729
2016 4,409 721 56,339 661,217 7.1% 11,736
2017 4,141 1,467 59,013 667,468 0.9% 11,311
2018 4,650 1,725 61,938 710,374 6.4% 11,469
2011 502 102 6,468 160,259$ 24,777$
2012 483 73 6,878 173,221 8.1% 25,185
2013 519 104 7,293 182,635 5.4% 25,043
2014 469 116 7,646 191,008 4.6% 24,981
2015 526 138 8,034 202,153 5.8% 25,162
2016 604 75 8,563 215,302 6.5% 25,143
2017 576 141 8,998 226,681 5.3% 25,192
2018 779 190 9,587 245,675 8.4% 25,626
Hazardous
Schedule of Retirants Added to And Removed from Rolls(Dollar amounts except average allowance expressed in thousands)
Rolls End of the Year
Non-Hazardous
Board Meeting- December 17, 2018 - Actuarial Valuations- GRS/ Ms. Karen Roggenkamp
186

APPENDIX A
ACTUARIAL ASSUMPTIONS AND METHODS
Board Meeting- December 17, 2018 - Actuarial Valuations- GRS/ Ms. Karen Roggenkamp
187

County Employees Retirement System
Actuarial Valuation – June 30, 2018
Appendix A 53
Summary of Actuarial Methods and Assumptions
The following presents a summary of the actuarial assumptions and methods used in the valuation of the
County Employees Retirement System.
In general, the assumptions and methods used in the valuation are based on the actuarial experience study for the five-year period ending June 30, 2013, submitted April 30, 2014, and adopted by the Board on December 4, 2014. The investment return, price inflation, and payroll growth assumption were adopted by the Board in May and July 2017 for use with the June 30, 2017 valuation in order to reflect future economic expectations. Investment return rate:
Assumed annual rate of 6.25% net of investment expenses for the retirement funds and the insurance funds
Price Inflation:
Assumed annual rate of 2.30%
Payroll Growth Assumption (used for amortization of unfunded accrued liabilities):
Assumed annual rate of 2.00%
Rates of Annual Salary Increase:
Assumed rates of annual salary increases are shown below.
Service Years
Annual Rates of Salary Increases
Merit & Seniority Price Inflation & Productivity
Total Increase
Non-Hazardous Hazardous Non-Hazardous Hazardous
0 8.50% 15.50% 3.05% 11.55% 18.55%
1 5.00% 6.00% 3.05% 8.05% 9.05%
2 1.50% 2.00% 3.05% 4.55% 5.05%
3 1.50% 1.25% 3.05% 4.55% 4.30%
4 1.00% 1.00% 3.05% 4.05% 4.05%
5 1.00% 0.50% 3.05% 4.05% 3.55%
6 0.75% 0.00% 3.05% 3.80% 3.05%
7 0.75% 0.00% 3.05% 3.80% 3.05%
8 0.50% 0.00% 3.05% 3.55% 3.05%
9 0.50% 0.00% 3.05% 3.55% 3.05%
10 & Over 0.25% 0.00% 3.05% 3.30% 3.05%
Board Meeting- December 17, 2018 - Actuarial Valuations- GRS/ Ms. Karen Roggenkamp
188

County Employees Retirement System
Actuarial Valuation – June 30, 2018
Appendix A 54
Retirement rates:
Assumed annual rates of retirement are shown below. Rates are only applicable for members who are eligible for a service retirement.
Age
Non-Hazardous
Service
Hazardous
Members participating
before 9/1/20081
Members participating on or after 9/1/20082
Members participating
before 9/1/20083
Members participating on or after 9/1/20084
55 5.0% 20 22.5%
56 6.0% 21 22.5%
57 7.0% 22 22.5%
58 7.0% 23 22.5%
59 8.0% 24 30.0%
60 9.0% 9.0% 25 33.0% 22.5%
61 15.0% 15.0% 26 33.0% 22.5%
62 18.0% 18.0% 27 36.0% 22.5%
63 18.0% 18.0% 28 39.0% 22.5%
64 18.0% 18.0% 29 55.0% 30.0%
65 18.0% 18.0% 30 33.0% 33.0%
66 18.0% 18.0% 31 33.0% 33.0%
67 18.0% 18.0% 32 50.0% 36.0%
68 18.0% 18.0% 33 40.0% 39.0%
69 18.0% 18.0% 34 40.0% 55.0%
70 18.0% 18.0% 35 40.0% 33.0%
71 18.0% 18.0% 36 40.0% 33.0%
72 18.0% 18.0% 37 40.0% 50.0%
73 18.0% 18.0% 38 40.0% 40.0%
74 18.0% 18.0% 39 40.0% 40.0%
75 100.0% 100.0% 40 40.0% 40.0%
1 If service is at least 27 years, the rate is 30%. 2 If age plus service is at least 87, the rate is 30%. 3 The annual rate of service retirement is 100% at age 62. 4 The annual rate of service retirement is 100% at age 60.
Board Meeting- December 17, 2018 - Actuarial Valuations- GRS/ Ms. Karen Roggenkamp
189

County Employees Retirement System
Actuarial Valuation – June 30, 2018
Appendix A 55
Disability rates:
An abbreviated table with assumed rates of disability is show below.
Age
Non-Hazardous Hazardous
Male Female Male Female
20 0.02% 0.02% 0.05% 0.05%
30 0.03% 0.03% 0.09% 0.09%
40 0.07% 0.07% 0.20% 0.20%
50 0.19% 0.19% 0.56% 0.56%
60 0.49% 0.49% 1.46% 1.46%
Withdrawal rates (for causes other than death, disability or retirement):
Assumed annual rates of withdrawal are shown below.
Service Years
Annual Rates of Withdrawal
Non-Hazardous Hazardous
0 28.00% 20.50%
1 16.00% 13.00%
2 12.00% 10.50%
3 10.00% 9.00%
4 8.00% 8.00%
5 6.00% 7.00%
6 5.00% 7.00%
7 5.00% 6.00%
8-13 4.00% 6.00%
14 & Over 3.00% 6.00%
Board Meeting- December 17, 2018 - Actuarial Valuations- GRS/ Ms. Karen Roggenkamp
190

County Employees Retirement System
Actuarial Valuation – June 30, 2018
Appendix A 56
Mortality Assumption:
Pre-retirement mortality: RP-2000 Combined Mortality Table projected with Scale BB to 2013. Male mortality rates are multiplied by 50% and female mortality rates are multiplied by 30%.
Post-retirement mortality (non-disabled): RP-2000 Combined Mortality Table projected with Scale BB to 2013. Female mortality rates are set back one year.
Post-retirement mortality (disabled): RP-2000 Combined Disabled Mortality Table projected with Scale BB to 2013. Male mortality rates are set back four years.
At the time of the last experience study, performed as of June 30, 2013, this mortality assumption provided 37% and 19% margin for future improvement for males and females, respectively. Marital status:
100% of employees are assumed to be married, with the female spouse 3 years younger than the male spouse.
Line of Duty Disability
0% of disabilities are assumed to occur in the line of duty
Line of Duty Death
25% of deaths are assumed to occur in the line of duty
Dependent Children:
For members in the Hazardous Plan who receive a duty-related death benefit, the member is assumed to be survived by two dependent children, each age 6 with payments for 15 years.
Form of Payment:
Members are assumed to elect a life-only annuity at retirement.
Board Meeting- December 17, 2018 - Actuarial Valuations- GRS/ Ms. Karen Roggenkamp
191

County Employees Retirement System
Actuarial Valuation – June 30, 2018
Appendix A 57
Actuarial Cost Method:
Entry Age Normal, Level Percentage of Pay. The Entry Age Normal actuarial cost method allocates the System’s actuarial present value of future benefits to various periods based upon service. The portion of the present value of future benefits allocated to years of service prior to the valuation date is the actuarial accrued liability, and the portion allocated to years following the valuation date is the present value of future normal costs. The normal cost is determined for each active member as the level percent of pay necessary to fully fund the expected benefits to be earned over the career of each individual active member. The normal cost is partially funded with active member contributions with the remainder funded by employer contributions.
Health Care Age Related Morbidity/Claims Utilization:
To model the impact of aging on the underlying health care costs for Medicare retirees, the valuation relied on the Society of Actuaries’ 2013 Study “Health Care Costs – From Birth to Death”. Table 4 (Development of Plan Specific Medicare Age Curve) was used to model the impact of aging for ages 65 and over.
Board Meeting- December 17, 2018 - Actuarial Valuations- GRS/ Ms. Karen Roggenkamp
192

County Employees Retirement System
Actuarial Valuation – June 30, 2018
Appendix A 58
Health Care Cost Trend Rates1:
January 1
Non-Medicare Plans
Medicare Plans
Dollar Contribution2
2020 7.00% 5.00% 1.50%
2021 6.75% 4.90% 1.50%
2022 6.50% 4.80% 1.50%
2023 6.25% 4.70% 1.50%
2024 6.00% 4.60% 1.50%
2025 5.75% 4.50% 1.50%
2026 5.50% 4.40% 1.50%
2027 5.25% 4.30% 1.50%
2028 5.00% 4.20% 1.50%
2029 4.75% 4.10% 1.50%
2030 4.50% 4.05% 1.50%
2031 4.25% 4.05% 1.50%
2032 & Beyond 4.05% 4.05% 1.50%
1All increases are assumed to occur on January 1. The 2019 premiums were known at the time of the valuation and were incorporated into the liability measurement.
2Applies to members participating on or after July 1, 2003
Health care trend assumptions are based on the model issued by the Society of Actuaries “Getzen model of Long-Run Medical Cost Trends for the SOA; Thomas E. Getzen, iHEA and Temple University 2014 © Society of Actuaries.
The underlying assumptions used to develop the health care trend rates include:
A short run period-this is a period for which anticipated health care trend rates are manually set based on local information as well as plan-specific and carrier information.
Long term real GDP growth- 1.75%
Long term rate of inflation- 2.30%
Long term nominal GDP growth – 4.05%
Year that excess rate converges to 0- 15 years from the valuation
Health care trend rates are thus the manually set rates for the short run period and rates which decline to an ultimate trend rate which equals the assumed nominal long term GDP growth rate.
Board Meeting- December 17, 2018 - Actuarial Valuations- GRS/ Ms. Karen Roggenkamp
193

County Employees Retirement System
Actuarial Valuation – June 30, 2018
Appendix A 59
Health Care Participation Assumptions:
Members are assumed to elect health coverage at retirement at the following participation rates.
Service at Retirement
Members participating
before 7/1/2003*
Members participating
between 7/1/2003
and 9/1/2008
Members participating
after 9/1/2008
Under 10 50% 100% 100%
10-14 75% 100% 100%
15-19 90% 100% 100%
Over 20 100% 100% 100%
* 100% of members with a duty disability or a duty death (in service) benefit are assumed to elect coverage at retirement.
Future retirees are assumed to have a similar distribution by plan type as the current retirees.
Medicare Plan Participation Percentage
Medical Only 7%
Essential 8%
Premium 86%
Non-Medicare Plan Participation Percentage
LivingWell Limited 2%
LivingWell Basic 13%
LivingWell CDHP 27%
LivingWell PPO 58%
50% of deferred vested members participating before July 1, 2003 are assumed to elect health coverage at retirement. 100% of deferred vested members participating after July 1, 2003 are assumed to elect health coverage at retirement. Deferred vested members with non-hazardous service are assumed to begin health coverage at age 55 for members participating before September 1, 2008, and at age 60 for members participating on or after September 1, 2008. Deferred vested members with hazardous service are assumed to begin health coverage at age 50.
75% of future retirees, with hazardous service, are assumed to elect spouse health care coverage. No dependent coverage is assumed for members who only have non-hazardous service. 100% of spouses with health care coverage are assumed to continue coverage after the member’s death.
Board Meeting- December 17, 2018 - Actuarial Valuations- GRS/ Ms. Karen Roggenkamp
194

County Employees Retirement System
Actuarial Valuation – June 30, 2018
Appendix A 60
Excise (“Cadillac”) Tax:
For taxable years beginning after December 31, 2021, a 40% excise tax will be required to be paid (by the employer and/or insurer) on the aggregate cost of the health plan in excess of certain legislated thresholds. For 2018, the thresholds are $850 per month for individual coverage and $2,292 per month for family coverage.
Both Actuarial Standard of Practice No. 6 and GASB Statement Nos. 74 and 75 reference this tax, and, in accordance with these standards an estimate of the impact of the Cadillac tax has been included in this valuation.
Assumptions and methods used to determine the impact of the Cadillac Tax include:
2018 thresholds of $850/$2,292 were indexed annually by 2.30%.
Premium data submitted was not adjusted for permissible exclusions to the Cadillac Tax.
There were no special adjustments to the dollar limit other than those permissible for non-Medicare retirees over 55.
In this valuation, the impact of the Cadillac Tax has been calculated by increasing the employer paid premiums for Non-Medicare retirees, who became participants before July 1, 2003, by 3.6%. Non-Medicare retirees who became participants after July 1, 2003 receive dollar subsidies per year of service, which are not expected to exceed the overall Non-Medicare premiums. As a result, the costs attributable to the Cadillac Tax for members who became participants after July 1, 2003 will be paid by the retirees.
Changes in Assumptions since the prior valuation:
None.
Board Meeting- December 17, 2018 - Actuarial Valuations- GRS/ Ms. Karen Roggenkamp
195
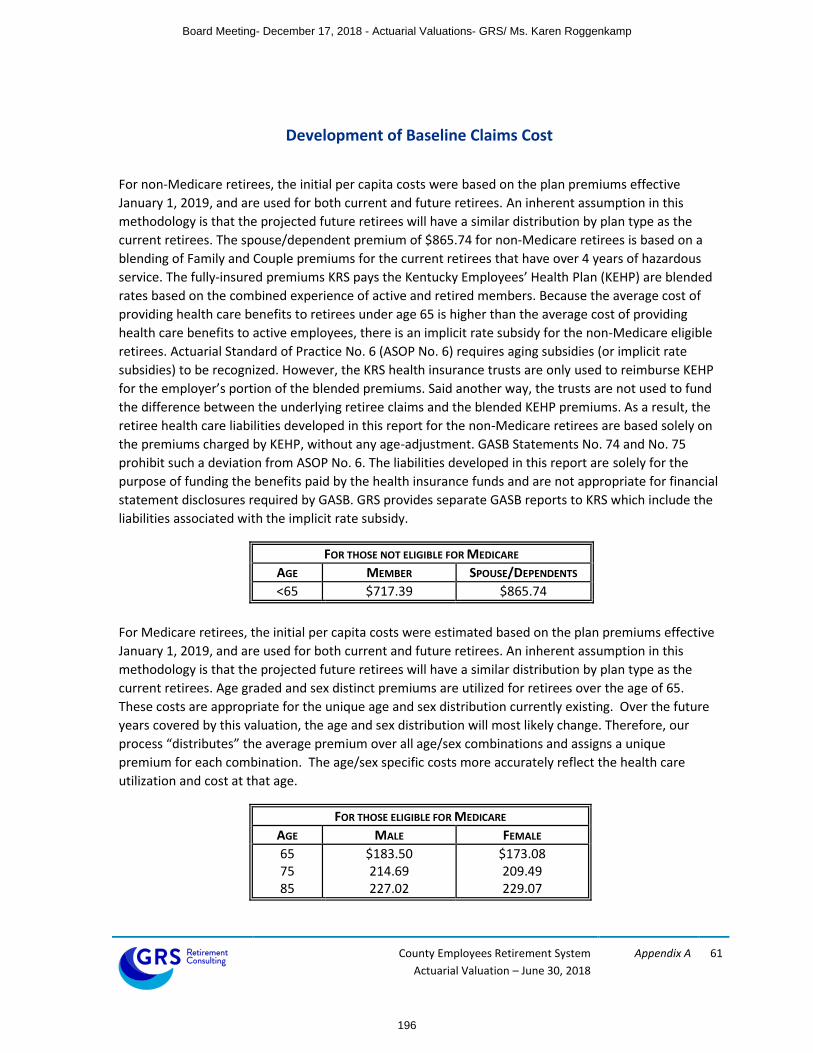
County Employees Retirement System
Actuarial Valuation – June 30, 2018
Appendix A 61
Development of Baseline Claims Cost
For non-Medicare retirees, the initial per capita costs were based on the plan premiums effective
January 1, 2019, and are used for both current and future retirees. An inherent assumption in this
methodology is that the projected future retirees will have a similar distribution by plan type as the
current retirees. The spouse/dependent premium of $865.74 for non-Medicare retirees is based on a
blending of Family and Couple premiums for the current retirees that have over 4 years of hazardous
service. The fully-insured premiums KRS pays the Kentucky Employees’ Health Plan (KEHP) are blended
rates based on the combined experience of active and retired members. Because the average cost of
providing health care benefits to retirees under age 65 is higher than the average cost of providing
health care benefits to active employees, there is an implicit rate subsidy for the non-Medicare eligible
retirees. Actuarial Standard of Practice No. 6 (ASOP No. 6) requires aging subsidies (or implicit rate
subsidies) to be recognized. However, the KRS health insurance trusts are only used to reimburse KEHP
for the employer’s portion of the blended premiums. Said another way, the trusts are not used to fund
the difference between the underlying retiree claims and the blended KEHP premiums. As a result, the
retiree health care liabilities developed in this report for the non-Medicare retirees are based solely on
the premiums charged by KEHP, without any age-adjustment. GASB Statements No. 74 and No. 75
prohibit such a deviation from ASOP No. 6. The liabilities developed in this report are solely for the
purpose of funding the benefits paid by the health insurance funds and are not appropriate for financial
statement disclosures required by GASB. GRS provides separate GASB reports to KRS which include the
liabilities associated with the implicit rate subsidy.
FOR THOSE NOT ELIGIBLE FOR MEDICARE
AGE MEMBER SPOUSE/DEPENDENTS
<65 $717.39 $865.74
For Medicare retirees, the initial per capita costs were estimated based on the plan premiums effective
January 1, 2019, and are used for both current and future retirees. An inherent assumption in this
methodology is that the projected future retirees will have a similar distribution by plan type as the
current retirees. Age graded and sex distinct premiums are utilized for retirees over the age of 65.
These costs are appropriate for the unique age and sex distribution currently existing. Over the future
years covered by this valuation, the age and sex distribution will most likely change. Therefore, our
process “distributes” the average premium over all age/sex combinations and assigns a unique
premium for each combination. The age/sex specific costs more accurately reflect the health care
utilization and cost at that age.
FOR THOSE ELIGIBLE FOR MEDICARE
AGE MALE FEMALE
65 75 85
$183.50 214.69 227.02
$173.08 209.49 229.07
Board Meeting- December 17, 2018 - Actuarial Valuations- GRS/ Ms. Karen Roggenkamp
196

County Employees Retirement System
Actuarial Valuation – June 30, 2018
Appendix A 62
Appendix B of the report provides a full schedule of premiums.
Mehdi Riazi is a Member of the American Academy of Actuaries (MAAA) and meets the Qualification Standards of the American Academy of Actuaries to render the actuarial opinions contained herein.
Mehdi Riazi, FSA, EA, MAAA
Board Meeting- December 17, 2018 - Actuarial Valuations- GRS/ Ms. Karen Roggenkamp
197

APPENDIX B
BENEFIT PROVISIONS
Board Meeting- December 17, 2018 - Actuarial Valuations- GRS/ Ms. Karen Roggenkamp
198

County Employees Retirement System
Actuarial Valuation – June 30, 2018
Appendix B 64
Summary of Benefit Provisions for County Employees Retirement System
(CERS)
CERS Non-Hazardous Employees
Retirement: Tier 1, Participation before 9/1/2008
Normal Retirement Age 65 with at least 1 month of service credit; or Eligibility Any age with at least 27 years of service
Benefit Amount If a member has at least 48 months of service, the monthly benefit is 2.00% times final average compensation times years of service. For members who began participating prior to 8/1/2004, the monthly benefit is 2.20% times final average compensation times years of service.
If a member has less than 48 months of service, the monthly benefit is the actuarial equivalent of two times the member’s contributions with interest.
Final average compensation is based on the member’s highest 5 years of compensation.
Early Retirement Any age (prior to age 65) with at least 25 years of service; or Eligibility Age 55 with at least 5 years of service Early Retirement Reduction Normal Retirement benefit reduced 6.5% per year for the first five years and
4.5% per year for the next five years for each year the member’s retirement eligibility precedes the member’s normal retirement date.
Board Meeting- December 17, 2018 - Actuarial Valuations- GRS/ Ms. Karen Roggenkamp
199
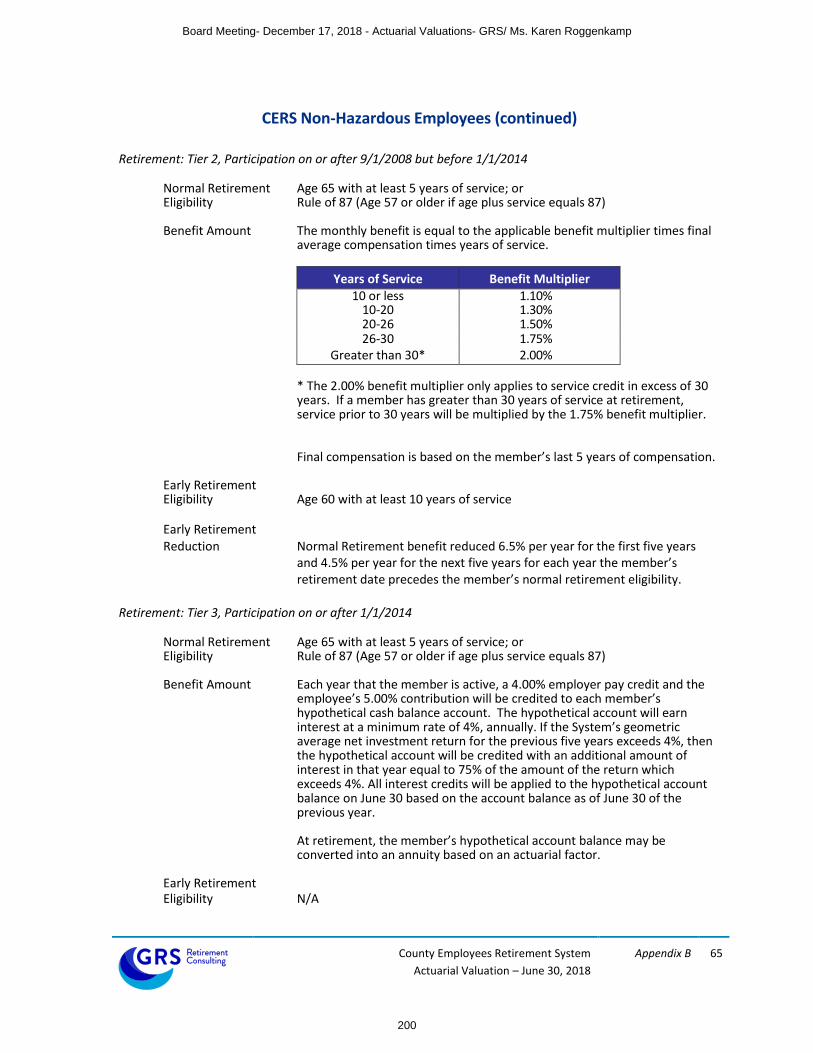
County Employees Retirement System
Actuarial Valuation – June 30, 2018
Appendix B 65
CERS Non-Hazardous Employees (continued)
Retirement: Tier 2, Participation on or after 9/1/2008 but before 1/1/2014
Normal Retirement Age 65 with at least 5 years of service; or Eligibility Rule of 87 (Age 57 or older if age plus service equals 87)
Benefit Amount The monthly benefit is equal to the applicable benefit multiplier times final average compensation times years of service.
Years of Service Benefit Multiplier 10 or less 1.10%
10-20 1.30% 20-26 1.50% 26-30 1.75%
Greater than 30* 2.00%
* The 2.00% benefit multiplier only applies to service credit in excess of 30 years. If a member has greater than 30 years of service at retirement, service prior to 30 years will be multiplied by the 1.75% benefit multiplier.
Final compensation is based on the member’s last 5 years of compensation.
Early Retirement Eligibility Age 60 with at least 10 years of service Early Retirement Reduction Normal Retirement benefit reduced 6.5% per year for the first five years
and 4.5% per year for the next five years for each year the member’s retirement date precedes the member’s normal retirement eligibility.
Retirement: Tier 3, Participation on or after 1/1/2014
Normal Retirement Age 65 with at least 5 years of service; or Eligibility Rule of 87 (Age 57 or older if age plus service equals 87)
Benefit Amount Each year that the member is active, a 4.00% employer pay credit and the employee’s 5.00% contribution will be credited to each member’s hypothetical cash balance account. The hypothetical account will earn interest at a minimum rate of 4%, annually. If the System’s geometric average net investment return for the previous five years exceeds 4%, then the hypothetical account will be credited with an additional amount of interest in that year equal to 75% of the amount of the return which exceeds 4%. All interest credits will be applied to the hypothetical account balance on June 30 based on the account balance as of June 30 of the previous year.
At retirement, the member’s hypothetical account balance may be converted into an annuity based on an actuarial factor.
Early Retirement Eligibility N/A
Board Meeting- December 17, 2018 - Actuarial Valuations- GRS/ Ms. Karen Roggenkamp
200

County Employees Retirement System
Actuarial Valuation – June 30, 2018
Appendix B 66
CERS Non-Hazardous Employees (continued)
Deferred Vested Benefit: Tier 1, Participation before 9/1/2008
Eligibility At least 1 month of service credit
Benefit Amount Normal retirement benefit deferred to normal retirement age, or a reduced retirement benefit at an early retirement age
Deferred Vested Benefit: Tier 2, Participation on or after 9/1/2008 but before 1/1/2014
Eligibility 5 years of service
Benefit Amount Normal retirement benefit deferred to normal retirement age, or a reduced retirement benefit at an early retirement age
Deferred Vested Benefit Tier 3, Participation on or after 1/1/2014
Eligibility 5 years of service
Benefit Amount At termination of employment, members may choose to leave their account balance with the System and retire once they are eligible. The hypothetical account balance will earn 4% annual interest after termination. Members may also choose to withdrawal their entire accumulated balance. If a member does not have 5 years of service at termination, the member is eligible to receive a partial refund of their account balance. This refund includes the member’s contributions with interest.
Disability Retirement: Participation before 8/1/2004
Eligibility 60 months of service (requirement is waived if line of duty disability)
Disability Benefit Disability benefits are calculated in the same manner as the normal retirement benefit with years of service and final compensation being determined as of the date of disability, except that service credit shall be added to the person’s total service beginning with the last date of paid employment and continuing to the member’s 65th birthday, with total service not exceeding 25 years. Total service credit added shall not be greater than the member’s actual service at disability. For members with at least 25 years of service on the last day of paid employment but less than 27 years of service, total service shall be 27 years. For members with 27 or more years of service credit, actual service will be used.
Board Meeting- December 17, 2018 - Actuarial Valuations- GRS/ Ms. Karen Roggenkamp
201

County Employees Retirement System
Actuarial Valuation – June 30, 2018
Appendix B 67
CERS Non-Hazardous Employees (continued)
Disability Retirement: Participation on or after 8/1/2004 but before 1/1/2014
Eligibility 60 months of service (requirement is waived if line of duty disability)
Disability Benefit The higher of 20% of the member’s final monthly rate of pay or the member’s normal retirement benefit (without reduction for early retirement) with years and final compensation being determined as of the date of disability.
Disability Retirement: Participation on or after 1/1/2014
Eligibility 60 months of service (requirement is waived if line of duty disability)
Disability Benefit The higher of 20% of the member’s final monthly rate of pay or the member’s retirement benefit calculated at the member’s normal retirement date.
Line of Duty Disability Benefit
Disability Benefit If the disability is a direct result of an act in the line of duty, the benefit shall not be less than 25% of the member’s final monthly rate of pay. Additionally, each eligible dependent child will receive 10% of the member’s monthly final rate of pay up to a maximum of 40%.
Pre-Retirement Death Benefit
Eligibility Eligible for early or normal retirement; or Under age 55 with at least 60 months of service and actively working at the
time of death; or At least 144 months of service, if no longer actively working
Spouse Benefit The member’s retirement benefit calculated in the same manner as if the member had retired on the day of the member’s death and elected a 100% joint and survivor benefit. The benefit is actuarially reduced if the member dies prior to their normal retirement age.
Pre-Retirement Death Benefit (Death in the Line of Duty)
Eligibility One month of service credit
Spouse Benefit A $10,000 lump sum payment plus a monthly payment of 75% of the deceased member’s final monthly average pay. Each dependent child will receive 10% of average pay (not to exceed a total child benefit of 25% while the spouse is alive). A spouse may also elect the non-line of duty death benefit.
Child Benefit In the event there is no surviving spouse, the benefit is 50% of final monthly average pay for one child, 65% of final average pay for two children, or 75% of final average pay for three or more eligible children.
Board Meeting- December 17, 2018 - Actuarial Valuations- GRS/ Ms. Karen Roggenkamp
202

County Employees Retirement System
Actuarial Valuation – June 30, 2018
Appendix B 68
CERS Non-Hazardous Employees (continued)
Post-Retirement Death Benefit
Eligibility 48 months of service, and in receipt of retirement benefits
Death Benefit A $5,000 lump sum payment Member Contributions
Tier 1, Participation before 9/1/2008 5% of creditable compensation. Members who do not receive a retirement
benefit are entitled to a full refund of contributions with interest. The annual interest rate is set by the KRS board, not less than 2.0%.
Tier 2, Participation on or after 9/1/2008 but before 1/1/2014 5% of creditable compensation plus 1% of creditable compensation, which is
deposited into the 401(h) account and is not refundable. Members who do not receive a retirement benefit are entitled to a refund of non-401(h) contributions with interest. The annual interest rate is 2.5%.
Tier 3, Participation after 1/1/2014 5% of creditable compensation plus 1% of creditable compensation, which is
deposited into the 401(h) account and is not refundable. Members who do not receive a retirement benefit are entitled to a refund of non-401(h) contributions with interest.
Changes since the Prior Valuation
During the 2018 legislative session, House Bill 185 was enacted, which updated the benefit provisions for active members who die in the line of duty. Benefits paid to the spouses of deceased members paid from the retirement fund have been increased from 25% of the member’s final rate of pay to 75% of the member’s average pay. If the member does not have a surviving spouse, benefits paid to surviving dependent children have been increased from 10% of the member’s final pay rate to 50% of average pay for one child, 65% of average pay for two children, or 75% of average pay for three children.
Board Meeting- December 17, 2018 - Actuarial Valuations- GRS/ Ms. Karen Roggenkamp
203

County Employees Retirement System
Actuarial Valuation – June 30, 2018
Appendix B 69
CERS Hazardous Employees
Retirement: Tier 1, Participation before 9/1/2008
Normal Retirement Age 55 with at least 1 month of service credit; or Eligibility Any age with at least 20 years of service
Benefit Amount If a member has at least 60 months of service, the monthly benefit is 2.50% times final average compensation times years of service.
If a member has less than 60 months of service, the monthly benefit is the actuarial equivalent of two times the member’s contributions with interest.
Final average compensation is based on the member’s highest 3 years of compensation.
Early Retirement Eligibility Age 50 with at least 15 years of service Early Retirement Reduction Normal Retirement benefit reduced 6.5% per year for the first five years and
4.5% per year for the next five years for each year the member’s retirement date precedes the member’s normal retirement eligibility.
Board Meeting- December 17, 2018 - Actuarial Valuations- GRS/ Ms. Karen Roggenkamp
204

County Employees Retirement System
Actuarial Valuation – June 30, 2018
Appendix B 70
CERS Hazardous Employees (continued)
Retirement: Tier 2, Participation on or after 9/1/2008 but before 1/1/2014
Normal Retirement Age 60 with at least 5 years of service; or Eligibility Any age with at least 25 years of service
Benefit Amount The monthly benefit is equal to the applicable benefit multiplier times final average compensation times years of service.
Years of Service Benefit Multiplier 10 or less 1.30%
10-20 1.50% 20-25 2.25%
Greater than 25 2.50%
Final average compensation is based on the member’s highest 3 years of compensation.
Early Retirement Eligibility Age 50 with at least 15 years of service Early Retirement Reduction Normal Retirement benefit reduced 6.5% per year for the first five years
and 4.5% per year for the next five years for each year the member’s retirement date precedes the member’s normal retirement eligibility.
Retirement: Tier 3, Participation on or after 1/1/2014
Normal Retirement Age 60 with at least 5 years of service; or Eligibility Any age with at least 25 years of service
Benefit Amount Each year that the member is active, a 7.50% employer pay credit and the employee’s 8.00% contribution will be credited to each member’s hypothetical cash balance account. The hypothetical account will earn interest at a minimum rate of 4%, annually. If the System’s geometric average net investment return for the previous five years exceeds 4%, then the hypothetical account will be credited with an additional amount of interest in that year equal to 75% of the amount of the return which exceeds 4%. All interest credits will be applied to the hypothetical account balance on June 30 based on the account balance as of June 30 of the previous year.
At retirement, the member’s hypothetical account balance may be converted into an annuity based on an actuarial factor.
Early Retirement Eligibility N/A
Board Meeting- December 17, 2018 - Actuarial Valuations- GRS/ Ms. Karen Roggenkamp
205

County Employees Retirement System
Actuarial Valuation – June 30, 2018
Appendix B 71
CERS Hazardous Employees (continued)
Deferred Vested Benefit: Tier 1, Participation before 9/1/2008
Eligibility At least 1 month of service credit
Benefit Amount Normal retirement benefit deferred to normal retirement age, or a reduced retirement benefit at an early retirement age
Deferred Vested Benefit: Tier 2, Participation on or after 9/1/2008 but before 1/1/2014
Eligibility 5 years of service
Benefit Amount Normal retirement benefit deferred to normal retirement age, or a reduced retirement benefit at an early retirement age
Deferred Vested Benefit Tier 3, Participation on or after 1/1/2014
Eligibility 5 years of service
Benefit Amount At termination of employment, members may choose to leave their account balance with the System and retire once they are eligible. The hypothetical account balance will earn 4% annual interest after termination. Members may also choose to withdrawal their entire accumulated balance. If a member does not have 5 years of service at termination, the member is eligible to receive a partial refund of their account balance. This refund includes the member’s contributions with interest.
Disability Retirement: Participation before 8/1/2004
Eligibility 60 months of service (requirement is waived if line of duty disability)
Disability Benefit Disability benefits are calculated in the same manner as the normal retirement benefit with years of service and final compensation being determined as of the date of disability, except that if the member has less than 20 years of service at disability, service credit shall be added to the person’s total service beginning with the last date of paid employment and continuing to the member’s 55th birthday, with total service not exceeding 20 years. Total service credit added shall not be greater than the member’s actual service at disability.
Board Meeting- December 17, 2018 - Actuarial Valuations- GRS/ Ms. Karen Roggenkamp
206

County Employees Retirement System
Actuarial Valuation – June 30, 2018
Appendix B 72
CERS Hazardous Employees (continued)
Disability Retirement: Participation on or after 8/1/2004 but before 1/1/2014
Eligibility 60 months of service (requirement is waived if line of duty disability)
Disability Benefit The higher of 25% of the member’s final monthly rate of pay or the member’s normal retirement benefit (without reduction for early retirement) with years and final compensation being determined as of the date of disability.
Disability Retirement: Participation on or after 1/1/2014
Eligibility 60 months of service (requirement is waived if line of duty disability)
Disability Benefit The higher of 25% of the member’s final monthly rate of pay or the member’s retirement benefit calculated at the member’s normal retirement date.
Line of Duty Disability Benefit
Disability Benefit If the disability is a direct result of an act in the line of duty, the benefit shall not be less than 25% of the member’s final monthly rate of pay. Additionally, each eligible dependent child will receive 10% of the member’s monthly final rate of pay up to a maximum of 40%.
Pre-Retirement Death Benefit
Eligibility Eligible for early or normal retirement; or Under age 55 with at least 60 months of service and actively working at the
time of death; or At least 144 months of service, if no longer actively working
Spouse Benefit The member’s retirement benefit calculated in the same manner as if the member had retired on the day of the member’s death and elected a 100% joint and survivor benefit. The benefit is actuarially reduced if the member dies prior to their normal retirement age.
Pre-Retirement Death Benefit (Death in the Line of Duty)
Eligibility One month of service credit
Spouse Benefit A $10,000 lump sum payment plus a monthly payment of 75% of the deceased member’s final average pay. Each dependent child will receive 10% of average pay (not to exceed a total child benefit of 25% while the spouse is alive). A spouse may also elect the non-line of duty death benefit.
Non-Spouse Benefit If the beneficiary is only one person who is a dependent receiving at least 50% of his or her support from the member, the beneficiary may elect a lump sum payment of$10,000.
Child Benefit In the event there is no surviving spouse, the benefit is 50% of final monthly average pay for one child, 65% of final average pay for two children, or 75% of final average pay for three or more eligible children.
Board Meeting- December 17, 2018 - Actuarial Valuations- GRS/ Ms. Karen Roggenkamp
207

County Employees Retirement System
Actuarial Valuation – June 30, 2018
Appendix B 73
CERS Hazardous Employees (continued)
Post-Retirement Death Benefit
Eligibility 48 months of service, and in receipt of retirement benefits
Death Benefit A $5,000 lump sum payment Member Contributions
Tier 1, Participation before 9/1/2008 8% of creditable compensation. Members who do not receive a retirement
benefit are entitled to a full refund of contributions with interest. The annual interest rate is set by the KRS board, not less than 2.0%.
Tier 2, Participation on or after 9/1/2008 but before 1/1/2014 8% of creditable compensation plus 1% of creditable compensation, which is
deposited into the 401(h) account and is not refundable. Members who do not receive a retirement benefit are entitled to a refund of non-401(h) contributions with interest. The annual interest rate is 2.5%.
Tier 3, Participation after 1/1/2014 8% of creditable compensation plus 1% of creditable compensation, which is
deposited into the 401(h) account and is not refundable. Members who do not receive a retirement benefit are entitled to a refund of non-401(h) contributions with interest.
Changes since the Prior Valuation
During the 2018 legislative session, House Bill 185 was enacted, which updated the benefit
provisions for active members who die in the line of duty. Benefits paid to the spouses of deceased
members paid from the retirement fund have been increased from 25% of the member’s final rate
of pay to 75% of the member’s average pay. If the member does not have a surviving spouse,
benefits paid to surviving dependent children have been increased from 10% of the member’s final
pay rate to 50% of average pay for one child, 65% of average pay for two children, or 75% of average
pay for three children.
Board Meeting- December 17, 2018 - Actuarial Valuations- GRS/ Ms. Karen Roggenkamp
208
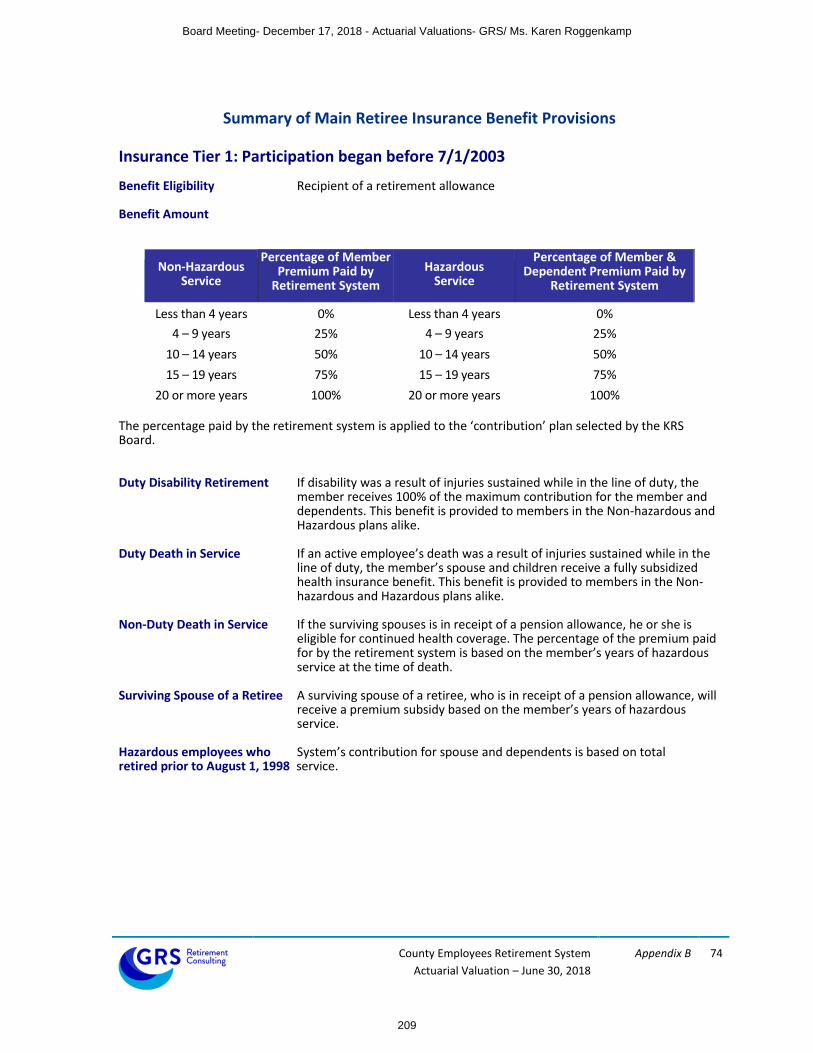
County Employees Retirement System
Actuarial Valuation – June 30, 2018
Appendix B 74
Summary of Main Retiree Insurance Benefit Provisions
Insurance Tier 1: Participation began before 7/1/2003
Benefit Eligibility Recipient of a retirement allowance
Benefit Amount
Non-Hazardous Service
Percentage of Member Premium Paid by
Retirement System
Hazardous Service
Percentage of Member & Dependent Premium Paid by
Retirement System Less than 4 years 0% Less than 4 years 0%
4 – 9 years
25% 4 – 9 years
25%
10 – 14 years 50% 10 – 14 years 50%
15 – 19 years 75% 15 – 19 years 75%
20 or more years 100% 20 or more years 100%
The percentage paid by the retirement system is applied to the ‘contribution’ plan selected by the KRS Board.
Duty Disability Retirement If disability was a result of injuries sustained while in the line of duty, the member receives 100% of the maximum contribution for the member and dependents. This benefit is provided to members in the Non-hazardous and Hazardous plans alike.
Duty Death in Service If an active employee’s death was a result of injuries sustained while in the line of duty, the member’s spouse and children receive a fully subsidized health insurance benefit. This benefit is provided to members in the Non-hazardous and Hazardous plans alike.
Non-Duty Death in Service If the surviving spouses is in receipt of a pension allowance, he or she is eligible for continued health coverage. The percentage of the premium paid for by the retirement system is based on the member’s years of hazardous service at the time of death.
Surviving Spouse of a Retiree A surviving spouse of a retiree, who is in receipt of a pension allowance, will receive a premium subsidy based on the member’s years of hazardous service.
Hazardous employees who System’s contribution for spouse and dependents is based on total retired prior to August 1, 1998 service.
Board Meeting- December 17, 2018 - Actuarial Valuations- GRS/ Ms. Karen Roggenkamp
209
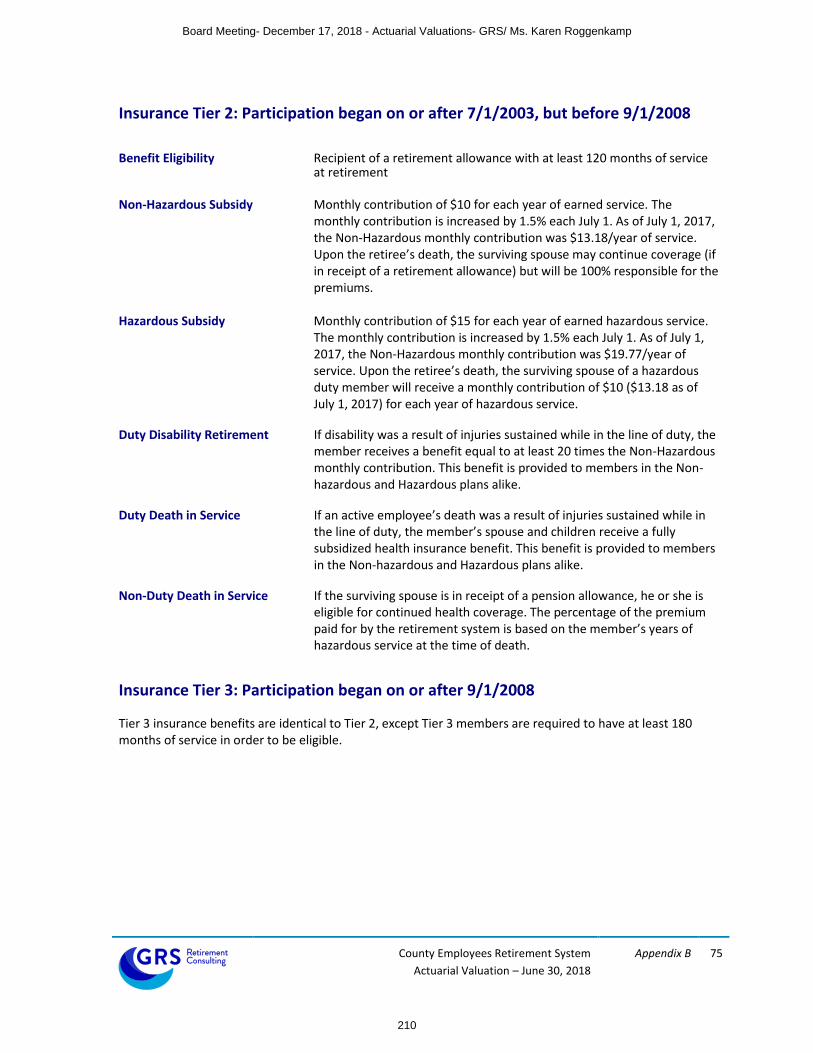
County Employees Retirement System
Actuarial Valuation – June 30, 2018
Appendix B 75
Insurance Tier 2: Participation began on or after 7/1/2003, but before 9/1/2008
Benefit Eligibility Recipient of a retirement allowance with at least 120 months of service at retirement
Non-Hazardous Subsidy Monthly contribution of $10 for each year of earned service. The
monthly contribution is increased by 1.5% each July 1. As of July 1, 2017, the Non-Hazardous monthly contribution was $13.18/year of service. Upon the retiree’s death, the surviving spouse may continue coverage (if in receipt of a retirement allowance) but will be 100% responsible for the premiums.
Hazardous Subsidy Monthly contribution of $15 for each year of earned hazardous service.
The monthly contribution is increased by 1.5% each July 1. As of July 1, 2017, the Non-Hazardous monthly contribution was $19.77/year of service. Upon the retiree’s death, the surviving spouse of a hazardous duty member will receive a monthly contribution of $10 ($13.18 as of July 1, 2017) for each year of hazardous service.
Duty Disability Retirement If disability was a result of injuries sustained while in the line of duty, the member receives a benefit equal to at least 20 times the Non-Hazardous monthly contribution. This benefit is provided to members in the Non-hazardous and Hazardous plans alike.
Duty Death in Service If an active employee’s death was a result of injuries sustained while in the line of duty, the member’s spouse and children receive a fully subsidized health insurance benefit. This benefit is provided to members in the Non-hazardous and Hazardous plans alike.
Non-Duty Death in Service If the surviving spouse is in receipt of a pension allowance, he or she is eligible for continued health coverage. The percentage of the premium paid for by the retirement system is based on the member’s years of hazardous service at the time of death.
Insurance Tier 3: Participation began on or after 9/1/2008 Tier 3 insurance benefits are identical to Tier 2, except Tier 3 members are required to have at least 180 months of service in order to be eligible.
Board Meeting- December 17, 2018 - Actuarial Valuations- GRS/ Ms. Karen Roggenkamp
210
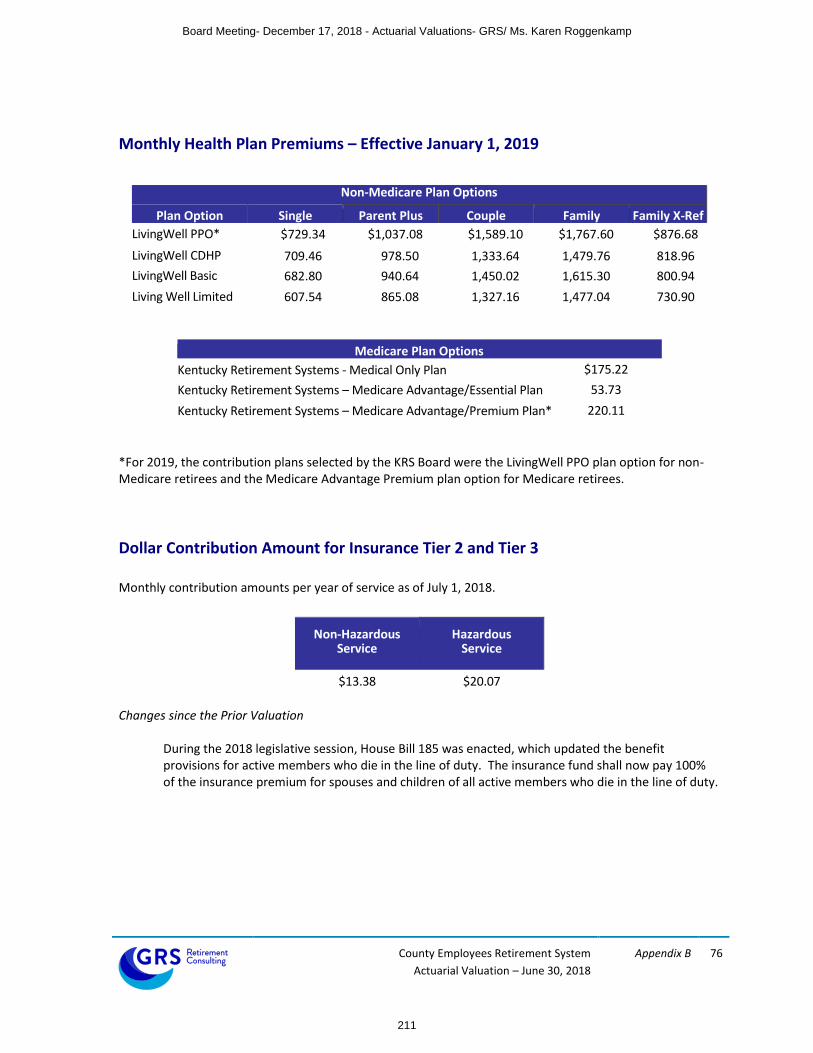
County Employees Retirement System
Actuarial Valuation – June 30, 2018
Appendix B 76
Monthly Health Plan Premiums – Effective January 1, 2019
Non-Medicare Plan Options
Plan Option Single Parent Plus Couple Family Family X-Ref
LivingWell PPO* $729.34 $1,037.08 $1,589.10 $1,767.60 $876.68
LivingWell CDHP 709.46 978.50 1,333.64 1,479.76 818.96
LivingWell Basic 682.80 940.64 1,450.02 1,615.30 800.94
Living Well Limited 607.54 865.08 1,327.16 1,477.04 730.90
Medicare Plan Options
Kentucky Retirement Systems - Medical Only Plan $175.22
Kentucky Retirement Systems – Medicare Advantage/Essential Plan 53.73
Kentucky Retirement Systems – Medicare Advantage/Premium Plan* 220.11
*For 2019, the contribution plans selected by the KRS Board were the LivingWell PPO plan option for non-Medicare retirees and the Medicare Advantage Premium plan option for Medicare retirees.
Dollar Contribution Amount for Insurance Tier 2 and Tier 3 Monthly contribution amounts per year of service as of July 1, 2018.
Non-Hazardous Service
Hazardous Service
$13.38 $20.07
Changes since the Prior Valuation
During the 2018 legislative session, House Bill 185 was enacted, which updated the benefit provisions for active members who die in the line of duty. The insurance fund shall now pay 100% of the insurance premium for spouses and children of all active members who die in the line of duty.
Board Meeting- December 17, 2018 - Actuarial Valuations- GRS/ Ms. Karen Roggenkamp
211
APPENDIX C
GLOSSARY
Board Meeting- December 17, 2018 - Actuarial Valuations- GRS/ Ms. Karen Roggenkamp
212

County Employees Retirement System
Actuarial Valuation – June 30, 2018
Appendix C 78
Glossary
Actuarial Accrued Liability (AAL): That portion, as determined by a particular Actuarial Cost Method, of
the Actuarial Present Value of Future Plan Benefits which is not provided for by future Normal Costs. It is
equal to the Actuarial Present Value of Future Plan Benefits minus the actuarial present value of future
Normal Costs.
Actuarial Assumptions: Assumptions as to future experience under the Fund. These include assumptions
about the occurrence of future events affecting costs or liabilities, such as:
mortality, withdrawal, disablement, and retirement;
future increases in salary;
future rates of investment earnings and future investment and administrative expenses;
characteristics of members not specified in the data, such as marital status;
characteristics of future members;
future elections made by members; and
other relevant items.
Actuarial Cost Method or Funding Method: A procedure for allocating the Actuarial Present Value of
Future Benefits to various time periods; a method used to determine the Normal Cost and the Actuarial
Accrued Liability. These items are used to determine the ADC.
Actuarial Gain or Actuarial Loss: A measure of the difference between actual experience and that
expected based upon a set of Actuarial Assumptions, during the period between two Actuarial Valuation
dates. Through the actuarial assumptions, rates of decrements, rates of salary increases, and rates of fund
earnings have been forecasted. To the extent that actual experience differs from that assumed, Actuarial
Accrued Liabilities emerge which may be the same as forecasted, or may be larger or smaller than
projected. Actuarial gains are due to favorable experience, e.g., the fund's assets earn more than
projected, salaries do not increase as fast as assumed, members retire later than assumed, etc. Favorable
experience means actual results produce actuarial liabilities not as large as projected by the actuarial
assumptions. On the other hand, actuarial losses are the result of unfavorable experience, i.e., actual
results that produce actuarial liabilities which are larger than projected. Actuarial gains will shorten the
time required for funding of the actuarial balance sheet deficiency while actuarial losses will lengthen the
funding period.
Actuarially Equivalent: Of equal actuarial present value, determined as of a given date and based on a given set of Actuarial Assumptions.
Board Meeting- December 17, 2018 - Actuarial Valuations- GRS/ Ms. Karen Roggenkamp
213

County Employees Retirement System
Actuarial Valuation – June 30, 2018
Appendix C 79
Actuarial Present Value (APV): The value of an amount or series of amounts payable or receivable at
various times, determined as of a given date by the application of a particular set of Actuarial
Assumptions. For purposes of this standard, each such amount or series of amounts is:
a. adjusted for the probable financial effect of certain intervening events (such as changes in
compensation levels, marital status, etc.)
b. multiplied by the probability of the occurrence of an event (such as survival, death, disability,
termination of employment, etc.) on which the payment is conditioned, and
c. discounted according to an assumed rate (or rates) of return to reflect the time value of money.
Actuarial Present Value of Future Plan Benefits: The Actuarial Present Value of those benefit amounts
which are expected to be paid at various future times under a particular set of Actuarial Assumptions,
taking into account such items as the effect of advancement in age and past and anticipated future
compensation and service credits. The Actuarial Present Value of Future Plan Benefits includes the
liabilities for active members, retired members, beneficiaries receiving benefits, and inactive, non-retired
members either entitled to a refund or a future retirement benefit. Expressed another way, it is the value
that would have to be invested on the valuation date so that the amount invested plus investment
earnings would provide sufficient assets to pay all projected benefits and expenses when due.
Actuarial Valuation: The determination, as of a valuation date, of the Normal Cost, Actuarial Accrued
Liability, Actuarial Value of Assets, and related Actuarial Present Values for a plan. An Actuarial valuation
for a governmental retirement system typically also includes calculations that provide the financial
information of the plan, such as the funded ratio, unfunded actuarial accrued liability and the ADC.
Actuarial Value of Assets or Valuation Assets: The value of the Fund’s assets as of a given date, used by
the actuary for valuation purposes. This may be the market or fair value of plan assets, but commonly
actuaries use a smoothed value in order to reduce the year-to-year volatility of calculated results, such as
the funded ratio and the ADC.
Actuarially Determined: Values which have been determined utilizing the principles of actuarial science.
An actuarially determined value is derived by application of the appropriate actuarial assumptions to
specified values determined by provisions of the law.
Actuarially Determined Contribution (ADC): The employer’s periodic required contributions, expressed as
a dollar amount or a percentage of covered plan compensation. The ADC consists of the Employer Normal
Cost and the Amortization Payment.
Amortization Method: A method for determining the Amortization Payment. The most common methods
used are level dollar and level percentage of payroll. Under the Level Dollar method, the Amortization
Payment is one of a stream of payments, all equal, whose Actuarial Present Value is equal to the UAAL.
Under the Level Percentage of Pay method, the Amortization payment is one of a stream of increasing
payments, whose Actuarial Present Value is equal to the UAAL. Under the Level Percentage of Pay
method, the stream of payments increases at the assumed rate at which total covered payroll of all active
members will increase.
Board Meeting- December 17, 2018 - Actuarial Valuations- GRS/ Ms. Karen Roggenkamp
214

County Employees Retirement System
Actuarial Valuation – June 30, 2018
Appendix C 80
Amortization Payment: The portion of the pension plan contribution or ADC which is designed to pay
interest on and to amortize the Unfunded Actuarial Accrued Liability.
Closed Amortization Period: A specific number of years that is counted down by one each year, and
therefore declines to zero with the passage of time. For example if the amortization period is initially set
at 30 years, it is 29 years at the end of one year, 28 years at the end of two years, etc. See Funding Period
and Open Amortization Period.
Decrements: Those causes/events due to which a member’s status (active-inactive-retiree-beneficiary)
changes, that is: death, retirement, disability, or termination.
Defined Benefit Plan: A retirement plan that is not a Defined Contribution Plan. Typically a defined
benefit plan is one in which benefits are defined by a formula applied to the member’s compensation
and/or years of service.
Defined Contribution Plan: A retirement plan, such as a 401(k) plan, a 403(b) plan, or a 457 plan, in which
the contributions to the plan are assigned to an account for each member, and the plan’s earnings are
allocated to each account, and each member’s benefits are a direct function of the account balance.
Employer Normal Cost: The portion of the Normal Cost to be paid by the employers. This is equal to the
Normal Cost less expected member contributions.
Experience Study: A periodic review and analysis of the actual experience of the Fund which may lead to a
revision of one or more actuarial assumptions. Actual rates of decrement and salary increases are
compared to the actuarially assumed values and modified as deemed appropriate by the Actuary.
Funded Ratio: The ratio of the actuarial value of assets (AVA) to the actuarial accrued liability (AAL). Plans
sometimes calculate a market funded ratio, using the market value of assets (MVA), rather than the AVA.
Funding Period or Amortization Period: The term “Funding Period” is used two ways. In the first sense, it
is the period used in calculating the Amortization Payment as a component of the ADC. This funding
period specified in State statute. In the second sense, it is a calculated item: the number of years in the
future that will theoretically be required to amortize (i.e., pay off or eliminate) the Unfunded Actuarial
Accrued Liability, based on a statutory employer contribution rate, and assuming no future actuarial gains
or losses.
GASB: Governmental Accounting Standards Board.
GASB 67 and GASB 68: Governmental Accounting Standards Board Statements No. 67 and No. 68. These
are the governmental accounting standards that set the accounting and reporting rules for public
retirement systems and the employers that sponsor, participate in, or contribute to them. Statement No.
67 sets the accounting rules for the financial reporting of the retirement systems, while Statement No. 68
sets the rules for the employers that sponsor, participate in, or contribute to public retirement systems.
Normal Cost: That portion of the Actuarial Present Value of pension plan benefits and expenses which is
allocated to a valuation year by the Actuarial Cost Method. Any payment in respect of an Unfunded
Board Meeting- December 17, 2018 - Actuarial Valuations- GRS/ Ms. Karen Roggenkamp
215

County Employees Retirement System
Actuarial Valuation – June 30, 2018
Appendix C 81
Actuarial Accrued Liability is not part of Normal Cost (see Amortization Payment). For pension plan
benefits which are provided in part by employee contributions, Normal Cost refers to the total of
employee contributions and employer Normal Cost unless otherwise specifically stated. Under the entry
age normal cost method, the Normal Cost is intended to be the level cost (when expressed as a
percentage of pay) needed to fund the benefits of a member from hire until ultimate termination, death,
disability or retirement.
Open Amortization Period: An open amortization period is one which is used to determine the
Amortization Payment but may not decrease by exactly one year in the subsequent year’s actuarial
valuation. For instance, if the initial period is set as 30 years, the same 30-year period is used in
determining the Amortization Period each year.
Unfunded Actuarial Accrued Liability: The excess of the Actuarial Accrued Liability over the Actuarial
Value of Assets. This value may be negative in which case it may be expressed as a negative Unfunded
Actuarial Accrued Liability, also called the Funding Surplus.
Valuation Date or Actuarial Valuation Date: The date as of which the value of assets is determined and
as of which the Actuarial Present Value of Future Plan Benefits is determined. The expected benefits to be
paid in the future are discounted to this date.
Board Meeting- December 17, 2018 - Actuarial Valuations- GRS/ Ms. Karen Roggenkamp
216

State Police Retirement System (SPRS) Actuarial Valuation Report as of June 30, 2018
Board Meeting- December 17, 2018 - Actuarial Valuations- GRS/ Ms. Karen Roggenkamp
217

October 31, 2018
Board of Trustees Kentucky Retirement Systems Perimeter Park West 1260 Louisville Road Frankfort, KY 40601
Subject: Actuarial Valuation as of June 30, 2018
Dear Trustees of the Board:
This report describes the current actuarial condition of the State Police Retirement System (SPRS),
provides the actuarially determined employer contribution rates for fiscal year ending June 30,
2020, and analyzes changes in the System’s financial condition. In addition, the report provides
various summaries of the data. The results of this actuarial valuation, including the calculated
employer contribution rates will be used by the Board and stakeholders for informational purposes
only as the employer contribution rate for the fiscal years ending June 30, 2019 and June 30, 2020
were certified in the June 30, 2017 actuarial valuation and adopted by the Board.
Separate reports are issued with regard to valuation results determined in accordance with
Governmental Accounting Standards Board (GASB) Statements 67, 68, 74 and 75. Results of this
report should not be used for any other purpose without consultation with the undersigned.
Valuations are prepared annually as of June 30, the first day of the plan year for KRS. This report
was prepared at the request of the Board of Trustees of the Kentucky Retirement System (Board)
and is intended for use by the KRS staff and those designated or approved by the Board.
FINANCING OBJECTIVES AND FUNDING POLICY
The employer contribution rate is determined in accordance with Section 61.565 of Kentucky
Statute. As specified by the Statute, the employer contribution rate is determined based on a closed
thirty-year amortization period beginning July 1, 2013. As a result, the amortization period used in
the 2018 actuarial valuation is 25 years. As noted above, the contribution rate determined by this
actuarial valuation is for informational purposes and may be useful in tracking the change in in the
calculated contribution rate since the prior valuation performed as of June 30, 2017.
Board Meeting- December 17, 2018 - Actuarial Valuations- GRS/ Ms. Karen Roggenkamp
218

Kentucky Retirement Systems October 31, 2018 Page 2
ASSUMPTIONS AND METHODS
There were no changes in actuarial assumptions since the prior actuarial valuation. It is our opinion
that the current assumptions are internally consistent and reasonably reflect the anticipated future
experience of the System.
Kentucky Statutes also require that an actuarial investigation be performed at least every five years
to review the economic and demographic assumptions. An experience study was conducted as of
June 30, 2013 and the next experience study will be conducted as of June 30, 2018 and the Board
adopted assumptions as a result of that analysis will be first used to prepare the June 30, 2019
actuarial valuation. The Board also has the authority to review the assumptions on a more frequent
basis and adopt new assumptions prior to the next scheduled experience study.
The results of the actuarial valuation are dependent on the actuarial assumptions used. Actual
results can, and almost certainly will, differ as actual experience deviates from the
assumptions. Even seemingly minor changes in the assumptions can materially change the
liabilities, calculated contribution rate, and funding periods. The actuarial calculations are intended
to provide information for rational decision making.
BENEFIT PROVISIONS
The benefit provisions reflected in these valuations are those which were in effect on June 30, 2018.
During the 2018 legislative session House Bill 185 was enacted which provides increased the
retirement and health insurance benefits for active members who die in the line of duty.
This actuarial valuation was determined without regard to the enactment of SB 151 in 2018, which
is currently being reviewed by the State Supreme Court.
DATA
Member data for retired, active and inactive members was supplied as of June 30, 2018, by the KRS
staff. The staff also supplied asset information as of June 30, 2018. We did not audit this data, but
we did apply a number of tests to the data, and we concluded that it was reasonable and consistent
with the prior year's data. GRS is not responsible for the accuracy or completeness of the
information provided to us by KRS.
Board Meeting- December 17, 2018 - Actuarial Valuations- GRS/ Ms. Karen Roggenkamp
219

Kentucky Retirement Systems October 31, 2018 Page 3
CERTIFICATION
We certify that the information presented herein is accurate and fairly portrays the actuarial
position of SPRS as of June 30, 2018.
All of our work conforms with generally accepted actuarial principles and practices, and is in conformity with the Actuarial Standards of Practice issued by the Actuarial Standards Board. In our opinion, our calculations also comply with the requirements of Kentucky Code of Laws and, where applicable, the Internal Revenue Code, ERISA, and the Statements of the Governmental Accounting Standards Board. The undersigned are independent actuaries and consultants. Mr. Newton and Mr. White are Enrolled Actuaries. All three of the undersigned are Members of the American Academy of Actuaries and meet the Qualification Standards of the American Academy of Actuaries. All of the undersigned are experienced in performing valuations for large public retirement systems. Sincerely, Gabriel, Roeder, Smith & Co. Joseph P. Newton, FSA, MAAA, EA Daniel J. White, FSA, MAAA, EA Pension Market Leader and Actuary Senior Consultant and Actuary Janie Shaw, ASA, MAAA Consultant and Actuary
Board Meeting- December 17, 2018 - Actuarial Valuations- GRS/ Ms. Karen Roggenkamp
220

State Police Retirement System
Actuarial Valuation – June 30, 2018
I
Table of Contents
Page
Section 1 Executive Summary ....................................................................................................... 2
Section 2 Discussion ...................................................................................................................... 6
Section 3 Actuarial Tables ........................................................................................................... 13
Section 4 Membership Information ........................................................................................... 26
Appendix A Actuarial Assumptions and Methods
Appendix B Benefit Provisions
Appendix C Glossary
Board Meeting- December 17, 2018 - Actuarial Valuations- GRS/ Ms. Karen Roggenkamp
221

SECTION 1
EXECUTIVE SUMMARY
Board Meeting- December 17, 2018 - Actuarial Valuations- GRS/ Ms. Karen Roggenkamp
222

State Police Retirement System
Actuarial Valuation – June 30, 2018
Section 1 2
Summary of Principal Results
(Dollar amounts expressed in thousands)
Actuarially Determined Contribution:
Retirement 120.54% 119.05%
Insurance 19.50% 27.23%
Total 140.04% 146.28%
Actual Contribution Rate for Next Fiscal Year1 146.28% 146.28%
Assets:
Retirement
• Actuarial value (AVAR) $268,259 $261,320
• Market value (MVAR) $267,572 $255,737
• Ratio of actuarial to market value of assets 100.3% 102.2%
Insurance
• Actuarial value (AVAI) $187,535 $180,464
• Market value (MVAI) $190,847 $178,838
• Ratio of actuarial to market value of assets 98.3% 100.9%
Funded Status:
Retirement
• Actuarial accrued liability $989,528 $967,145
• Unfunded accrued liability on AVAR $721,269 $705,825
• Funded ratio on AVAR 27.1% 27.0%
• Unfunded accrued liability on MVAR $721,956 $711,408
• Funded ratio on MVAR 27.0% 26.4%
Insurance
• Actuarial accrued liability $262,088 $276,641
• Unfunded accrued liability on AVAI $74,553 $96,177
• Funded ratio on AVAI 71.6% 65.2%
• Unfunded accrued liability on MVAI $71,241 $97,803
• Funded ratio on MVAI 72.8% 64.6%
Membership:
• Number of
- Active Members 886 903
- Retirees and Beneficiaries 1,600 1,536
- Inactive Members 499 480
- Total 2,985 2,919
• Projected payroll of active members $48,808 $48,598
• Average salary of active members $55,088 $53,818
1 Based on contribution rates budgeted in House Bill 200 during the 2018 legislative session
SPRS
June 30, 2018 June 30, 2017
Board Meeting- December 17, 2018 - Actuarial Valuations- GRS/ Ms. Karen Roggenkamp
223

State Police Retirement System
Actuarial Valuation – June 30, 2018
Section 1 3
Executive Summary (Continued)
Retirement Fund
The unfunded actuarial accrued liability of the retirement system increased by $15 million since the
prior year’s valuation to $721 million. The largest source of this increase due to a $20 million loss due
to liability experience. Below is a chart with the historical actuarial value of assets and actuarial
accrued liability. The divergence in the assets and liability over the last eight years has generally been
due to a combination of the actual investment experience being less than the fund’s expected
investment return assumption, a decrease in the assumed rate of return in 2015, 2016 and again in
2017, and contributions that were insufficient to amortize the unfunded actuarial accrued liability.
2011 2012 2013 2014 2015 2016 2017 2018
AAL 634.4 647.7 651.6 681.1 734.2 775.2 967.1 989.5
AVA 285.6 259.8 241.8 242.7 248.4 234.6 261.3 268.3
$0
$200
$400
$600
$800
$1,000
$1,200
History of Actuarial Assets vs. Actuarial Accrued Liability (Dollars in Millions)
Board Meeting- December 17, 2018 - Actuarial Valuations- GRS/ Ms. Karen Roggenkamp
224

State Police Retirement System
Actuarial Valuation – June 30, 2018
Section 1 4
Executive Summary (Continued)
Insurance Fund
The Insurance fund experience extremely favorable premium experience from calendar year 2018 to
2019. Specifically, the non-Medicare premiums were expected to increase by 7.25% from calendar year
2018 to calendar year 2019 (i.e. the medical trend assumption for non-Medicare premiums used in the
actuarial valuation) and the actual average premiums remained relatively unchanged. Also, the
Medicare premiums were expected to increase by 5.10% from calendar year 2018 to calendar year
2019 (i.e. the medical trend assumption used in the actuarial valuation for Medicare premium) and the
actual average premiums decreased by 12%.
Since the prior year’s valuation, the unfunded actuarial accrued liability for the insurance fund
decreased by $22 million to $75 million with $27 million of that decrease attributable to the favorable
premium experience. The corresponding funded ratio increased from 65.2% at June 30, 2017 to 71.6%
at June 30, 2018.
Board Meeting- December 17, 2018 - Actuarial Valuations- GRS/ Ms. Karen Roggenkamp
225

SECTION 2
DISCUSSION
Board Meeting- December 17, 2018 - Actuarial Valuations- GRS/ Ms. Karen Roggenkamp
226

State Police Retirement System
Actuarial Valuation – June 30, 2018
Section 2 6
Discussion
The State Police Retirement System (SPRS) is a defined benefit pension fund that provides pensions and
health care coverage for uniformed state police officers. SPRS includes both non-hazardous and hazardous
duty benefits. This report presents the result of the June 30, 2018 actuarial funding valuation for both the
Retirement Plan and Insurance Funds.
The primary purposes of the valuation report are to depict the current financial condition of the System and
analyze changes in the System’s financial condition. In addition, the report provides various summaries of
the data. The results of this actuarial valuation, including the calculated employer contribution rates will be
used by the Board and stakeholders for informational purposes only as the employer contribution rate for
the fiscal years ending June 30, 2019 and June 30, 2020 were certified in the June 30, 2017 actuarial
valuation and adopted by the Board.
The actuarially determined contribution rates consist of two components: a normal cost rate and an
amortization cost to finance the unfunded actuarial accrued liability. The normal cost rate is the theoretical
amount which would be required to pay the members’ benefits, based on the current plan provisions, if
this amount had been contributed from each member’s entry date and if the fund’s experience exactly
followed the actuarial assumptions. This is the amount it should cost to provide the benefits for an average
new member. Since members contribute to the fund, only the excess of the normal rate over the member
contribution rate is included in the employer contribution rate. The amortization cost is the amount,
expressed as a percentage of payroll, necessary to amortize the unfunded actuarial accrued liability. The
payroll growth rate and discount rate assumptions are selected by the Board. The funding period is
specified in Section 61.565 of Kentucky Statute.
All of the actuarial and financial tables referenced by the other sections of this Report appear in Section 3.
Section 4 provides member data and statistical information. Appendices A and B provide summaries of the
principle actuarial assumptions and methods and plan provisions. Finally, Appendix C provides a glossary of
technical terms that are used throughout this report.
Board Meeting- December 17, 2018 - Actuarial Valuations- GRS/ Ms. Karen Roggenkamp
227
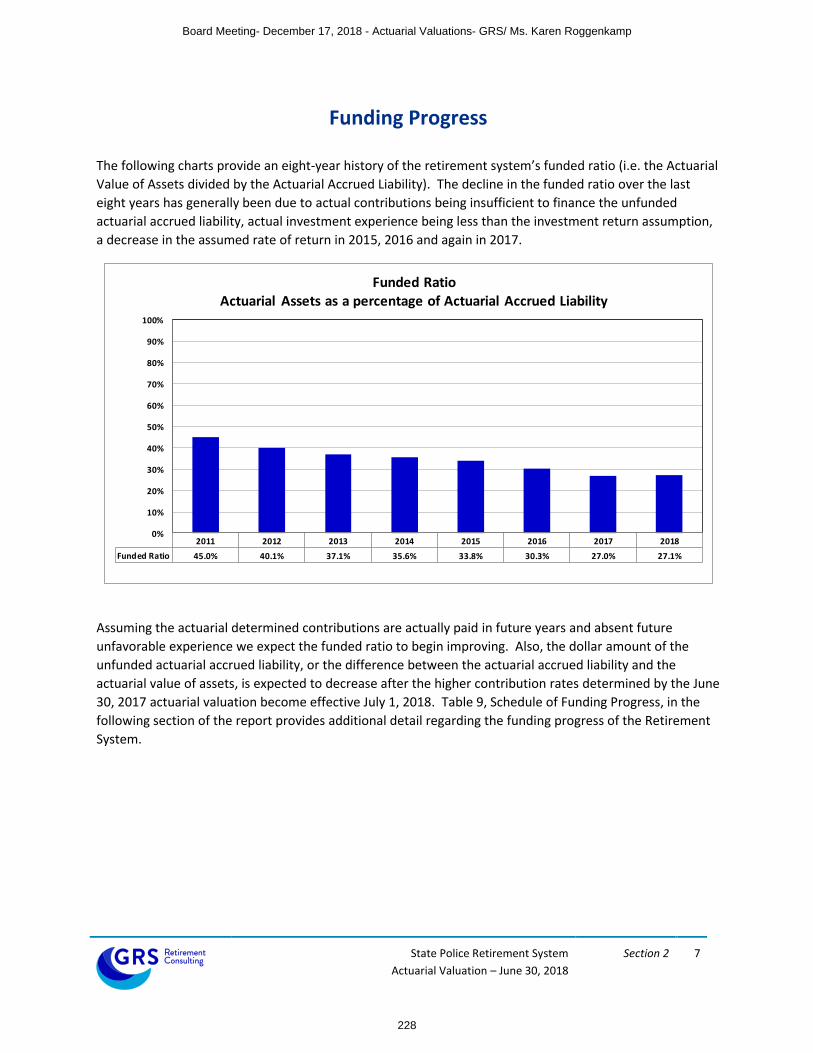
State Police Retirement System
Actuarial Valuation – June 30, 2018
Section 2 7
Funding Progress
The following charts provide an eight-year history of the retirement system’s funded ratio (i.e. the Actuarial
Value of Assets divided by the Actuarial Accrued Liability). The decline in the funded ratio over the last
eight years has generally been due to actual contributions being insufficient to finance the unfunded
actuarial accrued liability, actual investment experience being less than the investment return assumption,
a decrease in the assumed rate of return in 2015, 2016 and again in 2017.
2011 2012 2013 2014 2015 2016 2017 2018
Funded Ratio 45.0% 40.1% 37.1% 35.6% 33.8% 30.3% 27.0% 27.1%
0%
10%
20%
30%
40%
50%
60%
70%
80%
90%
100%
Funded RatioActuarial Assets as a percentage of Actuarial Accrued Liability
Assuming the actuarial determined contributions are actually paid in future years and absent future
unfavorable experience we expect the funded ratio to begin improving. Also, the dollar amount of the
unfunded actuarial accrued liability, or the difference between the actuarial accrued liability and the
actuarial value of assets, is expected to decrease after the higher contribution rates determined by the June
30, 2017 actuarial valuation become effective July 1, 2018. Table 9, Schedule of Funding Progress, in the
following section of the report provides additional detail regarding the funding progress of the Retirement
System.
Board Meeting- December 17, 2018 - Actuarial Valuations- GRS/ Ms. Karen Roggenkamp
228

State Police Retirement System
Actuarial Valuation – June 30, 2018
Section 2 8
Asset Gains/ (Losses)
The actuarial value of assets (“AVA”) is based on a smoothed market value of assets, using a systematic
approach to phase-in the difference between the actual and expected investment return on the market
value of assets (adjusted for receipts and disbursements during the year). This is appropriate because it
dampens the short-term volatility inherent in investment markets. The returns are computed net of
investment expenses. The actuarial value of assets for the retirement fund increased from $261.3 million
to $268.3 million since the prior valuation. Table 7 in the following section of the report provides the
development of the actuarial value of assets.
The rate of return on the market value of assets on a dollar-weighted basis for fiscal year 2018 was a 7.3%
which is greater than the 5.25% expected annual return. The return on an actuarial (smoothed) asset value
was 5.2%, which resulted in a $7 thousand loss for the fiscal year. This difference in the estimated return
on market value and actuarial value illustrates the smoothing effect of the asset valuation method.
The market value of assets is $0.7 million less than the actuarial value of assets, which signifies that the
retirement fund is in a position of deferred losses. Therefore, unless the fund experiences investment
returns in excess of the assumed rate of return in an amount that is at least equal to the outstanding
deferred losses, the future recognition of these deferred losses is expected to increase the unfunded
actuarial accrued liability.
Table 6 in the following section of this report provides asset information that was included in the annual
financial statements of the System. Also, Tables 6 and 7 shows the estimated yield on a market value basis
and on the actuarial asset valuation method.
Board Meeting- December 17, 2018 - Actuarial Valuations- GRS/ Ms. Karen Roggenkamp
229

State Police Retirement System
Actuarial Valuation – June 30, 2018
Section 2 9
Actuarial Gains/ (Losses) The annual actuarial valuation is a snapshot analysis of the benefit liabilities, assets and funded position of the System as of the first day of the plan year. In any one fiscal year, the experience can be better or worse from that which is assumed or expected. The actuarial assumptions do not necessarily attempt to model what the experience will be for any one given fiscal year, but instead try to model the overall experience over many years. Therefore, as long as the actual experience of the retirement system is reasonably close to the current assumptions, the long-term funding requirements of the System will remain relatively consistent.
Below are tables that separately show a reconciliation of the actuarial gains / (loss) since the prior actuarial valuation for the retirement and health insurance funds, which include the effect of asset and liability gains and losses, changes in assumptions, changes in plan provisions, etc.
Retirement Insurance
A. Calculation of total actuarial gain or loss
1. Unfunded actuarial accrued liability (UAAL),
previous year 705,825$ 96,177$
2. Normal cost and administrative expenses 11,766 5,597
3. Less: contributions for the year (52,421) (9,560)
4. Interest accrual 35,989 5,887
5. Expected UAAL (Sum of Items 1 - 4) 701,159$ 98,101$
6. Actual UAAL as of June 30,2018 721,269$ 74,553$
7. Total gain (loss) for the year (Item 5 - Item 6) (20,110)$ 23,548$
B. Source of gains and losses
8. Asset gain (loss) for the year (7)$ 393$
9. Liability experience gain (loss) for the year (19,919) 23,190
10. Plan Change (184) (35)
11. Assumption change 0 0
12. Total (20,110)$ 23,548$
Experience Gain or (Loss)(Dollar amounts expressed in thousands)
The favorable premium experience from calendar year 2018 to calendar year 2019 resulted in a $27 million liability gain for the insurance fund.
Board Meeting- December 17, 2018 - Actuarial Valuations- GRS/ Ms. Karen Roggenkamp
230
State Police Retirement System
Actuarial Valuation – June 30, 2018
Section 2 10
Actuarial Assumptions and Methods
In determining costs and liabilities, actuaries use assumptions about the future, such as rates of salary
increase, probabilities of retirement, termination, death and disability, and an annual investment return
assumption. There were no changes to the actuarial assumptions and methods since the last actuarial
valuation. It is our opinion that the assumptions are internally consistent, reasonable, and reflect
anticipated future experience of the System. Appendix A includes a summary of the actuarial assumptions
and methods used in this valuation.
An experience study was conducted as of June 30, 2013 and the next experience study will be conducted as
of June 30, 2018, the results of which will be first used in preparing the June 30, 2019 actuarial valuation.
However, the Board has the authority to review the assumptions on a more frequent basis and adopt new
assumptions prior to the next scheduled experience study.
Future actuarial measurements may differ significantly from the current measurements presented in this
report due to such factors as the following: plan experience differing from that anticipated by the economic
or demographic assumptions; changes in economic or demographic assumptions; increases or decreases
expected as part of the natural operation of the methodology used for these measurements (such as the
end of an amortization period or additional cost or contribution requirements based on the plan’s funded
status); and changes in plan provisions or applicable law. This report does not include a more robust
assessment of the risks of future experience not meeting the actuarial assumptions. Additional assessment
of risks was outside the scope of this assignment.
Board Meeting- December 17, 2018 - Actuarial Valuations- GRS/ Ms. Karen Roggenkamp
231

State Police Retirement System
Actuarial Valuation – June 30, 2018
Section 2 11
Benefit Provisions
Appendix B of this report includes a summary of the benefit provisions for SPRS.
During the 2018 legislative session, House Bill 185 was enacted, which updated the benefit provisions for
active members who die in the line of duty. Benefits paid to the spouses of deceased members paid from
the retirement fund have been increased from 25% of the member’s final rate of pay to 75% of the
member’s average pay. If the member does not have a surviving spouse, benefits paid to surviving
dependent children have been increased from 10% of the member’s final pay rate to 50% of average pay
for one child, 65% of average pay for two children, or 75% of average pay for three children. The insurance
fund shall also now pay 100% of the insurance premium for spouses and children of all active members
who die in the line of duty.
This actuarial valuation was determined without regard to enactment of SB 151 in 2018, which is currently
being reviewed by the State Supreme Court.
This valuation reflects all benefits promised to SPRS members, either by the statutes or by the Board.
There are no ancillary benefits that might be deemed a SPRS liability if continued beyond the availability of
funding by the current funding source.
Board Meeting- December 17, 2018 - Actuarial Valuations- GRS/ Ms. Karen Roggenkamp
232

SECTION 3
ACTUARIAL TABLES
Board Meeting- December 17, 2018 - Actuarial Valuations- GRS/ Ms. Karen Roggenkamp
233

State Police Retirement System
Actuarial Valuation – June 30, 2018
Section 3 13
Actuarial Tables TABLE
NUMBER
PAGE
CONTENT OF TABLE
1 14 DEVELOPMENT OF UNFUNDED ACTUARIAL ACCRUED LIABILITY
2 15 ACTUARIAL PRESENT VALUE OF FUTURE BENEFITS
3 16 DEVELOPMENT OF REQUIRED CONTRIBUTION RATE
4 17 ACTUARIAL BALANCE SHEET – RETIREMENT
5 18 ACTUARIAL BALANCE SHEET – INSURANCE
6 19 RECONCILIATION OF SYSTEM NET ASSETS
7 20 DEVELOPMENT OF ACTUARIAL VALUE OF ASSETS – RETIREMENT
8 21 DEVELOPMENT OF ACTUARIAL VALUE OF ASSETS – INSURANCE
9 22 SCHEDULE OF FUNDING PROGRESS
10 23 SUMMARY OF PRINCIPAL ASSUMPTIONS AND METHODS
11 24 SOLVENCY TEST
Board Meeting- December 17, 2018 - Actuarial Valuations- GRS/ Ms. Karen Roggenkamp
234

State Police Retirement System
Actuarial Valuation – June 30, 2018
Table 1 14
Development of Unfunded Actuarial Accrued Liability
(Dollar amounts expressed in thousands)
June 30, 2018
Retirement Insurance
(1) (2)
1. Projected payroll of active members 48,808$ 48,808$
2. Present value of future pay 436,669$ 398,014$
3. Normal cost rate
a. Total normal cost rate 23.41% 8.29%
b. Less: member contribution rate -8.00% -0.35%
c. Employer normal cost rate 15.41% 7.94%
4. Actuarial accrued liability for active members
a. Present value of future benefits 282,511$ 103,561$
b. Less: present value of future normal costs (93,771) (24,624)
c. Actuarial accrued liability 188,740$ 78,937$
5. Total actuarial accrued liability
a. Retirees and beneficiaries 793,303$ 179,760$
b. Inactive members 7,485 3,391
c. Active members (Item 4c) 188,740 78,937
d. Total 989,528$ 262,088$
6. Actuarial value of assets 268,259$ 187,535$
7. Unfunded actuarial accrued liability (UAAL)
(Item 5d - Item 6) 721,269$ 74,553$
8. Funded Ratio 27.1% 71.6%
Board Meeting- December 17, 2018 - Actuarial Valuations- GRS/ Ms. Karen Roggenkamp
235

State Police Retirement System
Actuarial Valuation – June 30, 2018
Table 2 15
Actuarial Present Value of Future Benefits(Dollar amounts expressed in thousands)
June 30, 2018
Retirement Insurance
(1) (2)
1. Active members
a. Service retirement 259,601$
b. Deferred termination benefits and refunds 14,945
c. Survivor benefits 1,931
d. Disability benefits 6,034
e. Total 282,511$ 103,561$
2. Retired members
a. Service retirement 723,302$
b. Disability retirement 11,337
c. Beneficiaries 58,664
d. Total 793,303$ 179,760$
3. Inactive members
a. Vested terminations 7,158$ 3,391$
b. Nonvested terminations 327 N/A
c. Total 7,485$ 3,391$
4. Total actuarial present value of future benefits 1,083,299$ 286,712$
Board Meeting- December 17, 2018 - Actuarial Valuations- GRS/ Ms. Karen Roggenkamp
236
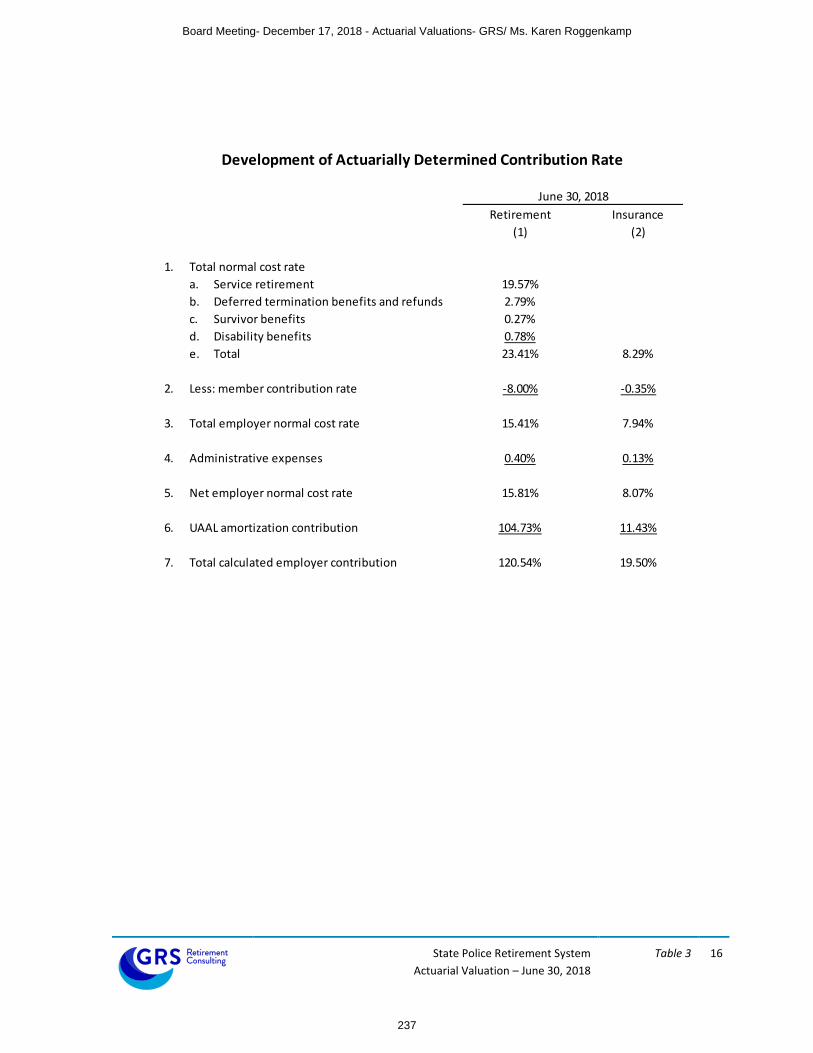
State Police Retirement System
Actuarial Valuation – June 30, 2018
Table 3 16
Development of Actuarially Determined Contribution Rate
June 30, 2018
Retirement Insurance
(1) (2)
1. Total normal cost rate
a. Service retirement 19.57%
b. Deferred termination benefits and refunds 2.79%
c. Survivor benefits 0.27%
d. Disability benefits 0.78%
e. Total 23.41% 8.29%
2. Less: member contribution rate -8.00% -0.35%
3. Total employer normal cost rate 15.41% 7.94%
4. Administrative expenses 0.40% 0.13%
5. Net employer normal cost rate 15.81% 8.07%
6. UAAL amortization contribution 104.73% 11.43%
7. Total calculated employer contribution 120.54% 19.50%
Board Meeting- December 17, 2018 - Actuarial Valuations- GRS/ Ms. Karen Roggenkamp
237

State Police Retirement System
Actuarial Valuation – June 30, 2018
Table 4 17
Actuarial Balance Sheet
Retirement Benefits
(Dollar amounts expressed in thousands)
June 30, 2018 June 30, 2017
(1) (2)
1. Assets - Present and Expected Future Resources
a. Current assets (actuarial value) 268,259$ 261,320$
b. Present value of future member contributions 34,933$ 33,935$
c. Present value of future employer contributions
i. Normal cost contributions 58,838$ 59,745$
ii. Unfunded accrued liability contributions 721,269 705,825
iii. Total future employer contributions 780,107$ 765,570$
d. Total assets 1,083,299$ 1,060,825$
2. Liabilities - Present Value of Expected Future Benefit Payments
a. Active members
i. Present value of future normal costs 93,771$ 93,680$
ii. Accrued liability 188,740 193,163
iii. Total present value of future benefits 282,511$ 286,843$
b. Present value of benefits payable on account of
current retired members and beneficiaries 793,303$ 766,899$
c. Present value of benefits payable on account of
current inactive members 7,485$ 7,083$
d. Total liabilities 1,083,299$ 1,060,825$
Board Meeting- December 17, 2018 - Actuarial Valuations- GRS/ Ms. Karen Roggenkamp
238

State Police Retirement System
Actuarial Valuation – June 30, 2018
Table 5 18
Actuarial Balance Sheet
Insurance Benefits
(Dollar amounts expressed in thousands)
June 30, 2018 June 30, 2017
(1) (2)
1. Assets - Present and Expected Future Resources
a. Current assets (actuarial value) 187,535$ 180,464$
b. Present value of future member contributions 2,186$ 1,905$
c. Present value of future employer contributions
i. Normal cost contributions 22,438$ 30,836$
ii. Unfunded accrued liability contributions 74,553 96,177
iii. Total future employer contributions 96,991$ 127,013$
d. Total assets 286,712$ 309,382$
2. Liabilities - Present Value of Expected Future Benefit Payments
a. Active members
i. Present value of future normal costs 24,624$ 32,741$
ii. Accrued liability 78,937 90,251
iii. Total present value of future benefits 103,561$ 122,992$
b. Present value of benefits payable on account of
current retired members and beneficiaries 179,760$ 183,156$
c. Present value of benefits payable on account of
current inactive members 3,391$ 3,234$
d. Total liabilities 286,712$ 309,382$
Board Meeting- December 17, 2018 - Actuarial Valuations- GRS/ Ms. Karen Roggenkamp
239

State Police Retirement System
Actuarial Valuation – June 30, 2018
Table 6 19
Reconciliation of Retirement Net Assets (Dollar amounts expressed in thousands)*
Year Ending
June 30, 2018 June 30, 2018
(1) (2)
Retirement Insurance
1. Value of assets at beginning of year 255,737$ 178,838$
2. Revenue for the year
a. Contributions
i. Member contributions 5,522$ 155$
ii. Employer contributions 36,486 9,397
iii. Other contributions (less 401h) 10,413 8
iii. Total 52,421$ 9,560$
b. Income
i. Interest, dividends, and other income 5,683$ 3,972$
ii. Investment expenses (1,692) (1,841)
iii. Net 3,991$ 2,131$
c. Net realized and unrealized gains (losses) 14,446 14,338
d. Total revenue 70,857$ 26,030$
3. Expenditures for the year
a. Disbursements
i. Refunds 22$ 0$
ii. Regular annuity benefits / Healthcare premiums 58,805 13,880
iii. Other benefit payments 0 79
iv. Transfers to other systems 0 0
v. Total 58,827$ 13,959$
b. Administrative expenses and depreciation 194 62
c. Total expenditures 59,021$ 14,021$
4. Increase in net assets
(Item 2. - Item 3.) 11,836$ 12,008$
5. Value of assets at end of year
(Item 1. + Item 4.) 267,572$ 190,847$
6. Net external cash flow
a. Dollar amount (6,600)$ (4,461)$
b. Percentage of market value -2.5% -2.4%
7. Estimated annual return on net assets 7.3% 9.3%
* Amounts may not add due to rounding
* Retirement assets exclude 401h assets and insurance assets include 401h assets
Board Meeting- December 17, 2018 - Actuarial Valuations- GRS/ Ms. Karen Roggenkamp
240

State Police Retirement System
Actuarial Valuation – June 30, 2018
Table 7 20
17
Development of Actuarial Value of AssetsRetirement Benefits
(Dollar amounts expressed in thousands)*
Year Ending June 30, 2018
1. Actuarial value of assets at beginning of year 261,320$
2. Market value of assets at beginning of year 255,737$
3. Net new investments
a. Contributions 52,421$
b. Benefit payments (58,827)
c. Administrative expenses (194)
d. Subtotal (6,600)$
4. Market value of assets at end of year 267,572$
5. Net earnings (Item 4. - Item 2. - Item 3.d.) 18,436$
6. Assumed investment return rate for fiscal year 5.25%
7. Expected return for immediate recognition 13,253$
8. Excess return for phased recognition 5,183$
9. Phased-in recognition, 20% of excess return on assets for prior years:
Fiscal Year
Ending June 30,
Excess
Return
Recognized
Amount
a. 2018 5,183$ 1,037$
b. 2017 11,623 2,325
c. 2016 (21,455) (4,291)
d. 2015 (16,122) (3,224)
e. 2014 22,202 4,440
f. Total 286$
10. Actuarial value of assets as of June 30, 2018
(Item 1. + Item 3.d. + Item 7.+ Item 9.f.) 268,259$
11. Ratio of actuarial value to market value 100.3%
12. Estimated annual return on actuarial value of assets 5.2%
* Amounts may not add due to rounding
Board Meeting- December 17, 2018 - Actuarial Valuations- GRS/ Ms. Karen Roggenkamp
241

State Police Retirement System
Actuarial Valuation – June 30, 2018
Table 8 21
Development of Actuarial Value of AssetsInsurance Benefits
(Dollar amounts expressed in thousands)*
Year Ending June 30, 2018
1. Actuarial value of assets at beginning of year 180,464$
2. Market value of assets at beginning of year 178,838$
3. Net new investments
a. Contributions 9,560$
b. Benefit payments (13,959)
c. Administrative expenses (62)
d. Subtotal (4,461)$
4. Market value of assets at end of year 190,847$
5. Net earnings (Item 4. - Item 2. - Item 3.d.) 16,469$
6. Assumed investment return rate for fiscal year 6.25%
7. Expected return for immediate recognition 11,038$
8. Excess return for phased recognition 5,431$
9. Phased-in recognition, 20% of excess return on assets for prior years:
Fiscal Year
Ending June 30,
Excess
Return
Recognized
Amount
a. 2018 5,431$ 1,086$
b. 2017 9,723 1,945
c. 2016 (12,288) (2,458)
d. 2015 (9,762) (1,952)
e. 2014 9,368 1,874
f. Total 494$
10. Actuarial value of assets as of June 30, 2018
(Item 1. + Item 3.d. + Item 7.+ Item 9.f.) 187,535$
11. Ratio of actuarial value to market value 98.3%
12. Estimated annual return on actuarial value of assets 6.5%
* Amounts may not add due to rounding
Board Meeting- December 17, 2018 - Actuarial Valuations- GRS/ Ms. Karen Roggenkamp
242

State Police Retirement System
Actuarial Valuation – June 30, 2018
Table 9 22
Schedule of Funding Progress
Unfunded Actuarial
Actuarial Value of Actuarial Accrued Accrued Liability Funded Ratio Annual Covered UAAL as % of
June 30, Assets (AVA) Liability (AAL) (UAAL) (3) - (2) (2)/(3) Payroll Payroll (4)/(6)
(1) (2) (3) (4) (5) (6) (7)
Retirement
2011 285,581$ 634,379$ 348,799$ 45.0% 48,693$ 716.3%
2012 259,792 647,689 387,897 40.1% 48,373 801.9%
2013 241,800 651,581 409,780 37.1% 45,256 905.5%
2014 242,742 681,118 438,377 35.6% 44,616 982.6%
2015 248,388 734,156 485,769 33.8% 45,765 1061.4%
2016 234,568 775,160 540,593 30.3% 45,551 1186.8%
2017 261,320 967,145 705,825 27.0% 48,598 1452.4%
2018 268,259 989,528 721,269 27.1% 48,808 1477.8%
Insurance
2011 123,687$ 438,428$ 314,740$ 28.2% 48,693$ 646.4%
2012 124,372 333,904 209,532 37.2% 48,373 433.2%
2013 136,321 222,327 86,006 61.3% 45,256 190.0%
2014 155,595 234,271 78,676 66.4% 44,616 176.3%
2015 167,775 254,839 87,064 65.8% 45,765 190.2%
2016 172,704 257,197 84,494 67.1% 45,551 185.5%
2017 180,464 276,641 96,177 65.2% 48,598 197.9%
2018 187,535 262,088 74,553 71.6% 48,808 152.7%
(Dollar amounts expressed in thousands)
Board Meeting- December 17, 2018 - Actuarial Valuations- GRS/ Ms. Karen Roggenkamp
243

State Police Retirement System
Actuarial Valuation – June 30, 2018
Table 10 23
Valuation date: June 30, 2018
Actuarial cost method: Entry Age Normal
Amortization method: Level percentage of payroll
(0% payroll growth assumed)
Amortization period for contribution rate: 25-year closed period
Asset valuation method: 5-Year Smoothed Market
Actuarial assumptions:
Investment rate of return 5.25%
Projected salary increases 3.05% to 15.55%
(varies by service)
Inflation 2.30%
Post-retirement benefit adjustments 0.00%
Retiree Mortality RP-2000 Combined Mortality Table
for Males and Females, projected
using scale BB to 2013
(set back one year for females).
Summary of Principal Assumptions and Methods
Below is a summary of the principal economic assumptions, cost method, and the method
for financing the unfunded actuarial accrued liability:
Board Meeting- December 17, 2018 - Actuarial Valuations- GRS/ Ms. Karen Roggenkamp
244

State Police Retirement System
Actuarial Valuation – June 30, 2018
Table 11 24
Active Retired Active
Member Members & Members Valuation
June 30, Contributions Beneficiaries (Employer Financed) Assets Active Retired ER Financed
(1) (2) (3) (4) (5) (6) (7) (8)
Retirement
2009 41,664$ 459,585$ 101,079$ 329,967$ 100.0% 62.7% 0.0%
2010 42,012 475,893 94,541 304,577 100.0% 55.2% 0.0%
2011 43,574 499,194 91,611 285,581 100.0% 48.5% 0.0%
2012 41,139 523,017 83,533 259,792 100.0% 41.8% 0.0%
2013 39,788 535,720 76,072 241,800 100.0% 37.7% 0.0%
2014 41,831 563,011 76,276 242,742 100.0% 35.7% 0.0%
2015 41,567 605,855 86,734 248,388 100.0% 34.1% 0.0%
2016 41,871 636,499 96,791 234,568 100.0% 30.3% 0.0%
2017 44,798 773,982 148,365 261,320 100.0% 28.0% 0.0%
2018 43,835 800,788 144,905 268,259 100.0% 28.0% 0.0%
Insurance
2009 -$ 167,091$ 196,940$ 123,527$ 100.0% 73.9% 0.0%
2010 - 253,581 181,380 121,175 100.0% 47.8% 0.0%
2011 - 252,440 185,988 123,687 100.0% 49.0% 0.0%
2012 - 190,259 143,645 124,372 100.0% 65.4% 0.0%
2013 - 139,509 82,818 136,321 100.0% 97.7% 0.0%
2014 - 143,402 90,869 155,595 100.0% 100.0% 13.4%
2015 - 170,447 84,392 167,775 100.0% 98.4% 0.0%
2016 - 177,094 80,103 172,704 100.0% 97.5% 0.0%
2017 - 186,390 90,251 180,464 100.0% 96.8% 0.0%
2018 - 183,151 78,937 187,535 100.0% 100.0% 5.6%
Liabilities Covered by Assets
Solvency Test(Dollar amounts expressed in thousands)
Actuarial Accrued Liability
Portion of Aggregate Accrued
Board Meeting- December 17, 2018 - Actuarial Valuations- GRS/ Ms. Karen Roggenkamp
245

SECTION 4
MEMBERSHIP INFORMATION
Board Meeting- December 17, 2018 - Actuarial Valuations- GRS/ Ms. Karen Roggenkamp
246

State Police Retirement System
Actuarial Valuation – June 30, 2018
Section 4 26
Membership Tables TABLE
NUMBER
PAGE
CONTENT OF TABLE
12 27 SUMMARY OF MEMBERSHIP DATA
13 28 SUMMARY OF HISTORICAL ACTIVE MEMBERSHIP
14 29 DISTRIBUTION OF ACTIVE MEMBERS BY AGE AND SERVIC
15 30 SCHEDULE OF ANNUITANTS BY AGE
16 31 SCHEDULE OF ANNUITANTS BY BENEFIT TYPE – RETIREES
17 32 SCHEDULE OF ANNUITANTS BY BENEFIT TYPE – BENEFICIARIES
18 33 SCHEDULE OF ANNUITANTS ADDED TO AND REMOVED FROM ROLLS
Board Meeting- December 17, 2018 - Actuarial Valuations- GRS/ Ms. Karen Roggenkamp
247

State Police Retirement System
Actuarial Valuation – June 30, 2018
Table 12 27
June 30, 2018 June 30, 2017
(1) (4)
1. Active members
a. Males 857 873
b. Females 29 30
c. Total members 886 903
d. Total annualized prior year salaries 48,808$ 48,598$
e. Average salary 55,088$ 53,819$
f. Average age 37.3 37.5
g. Average service 10.5 10.6
h. Member contributions with interest 43,835$ 44,798$
i. Average contributions with interest 49,476$ 49,610$
2. Vested inactive members
a. Number 176 86
b. Total annual deferred benefits 815$ 762$
c. Average annual deferred benefit 4,632$ 8,860$
d. Average age at the valuation date 41.0 42.5
3. Nonvested inactive members
a. Number 323 394
b. Total member contributions with interest 327$ 520$
c. Average contributions with interest 1,012$ 1,320$
4. Service retirees
a. Number 1,331 1,279
b. Total annual benefits 52,821$ 50,871$
c. Average annual benefit 39,686$ 39,774$
d. Average age at the valuation date 62.8 62.7
5. Disabled retirees
a. Number 52 53
b. Total annual benefits 909$ 968$
c. Average annual benefit 17,473$ 18,264$
d. Average age at the valuation date 59.3 59.2
6. Beneficiaries
a. Number 217 204
b. Total annual benefits 5,896$ 5,414$
c. Average annual benefit 27,168$ 26,539$
d. Average age at the valuation date 65.9 65.6
Summary of Membership Data(Total dollar amounts expressed in thousands)
Board Meeting- December 17, 2018 - Actuarial Valuations- GRS/ Ms. Karen Roggenkamp
248
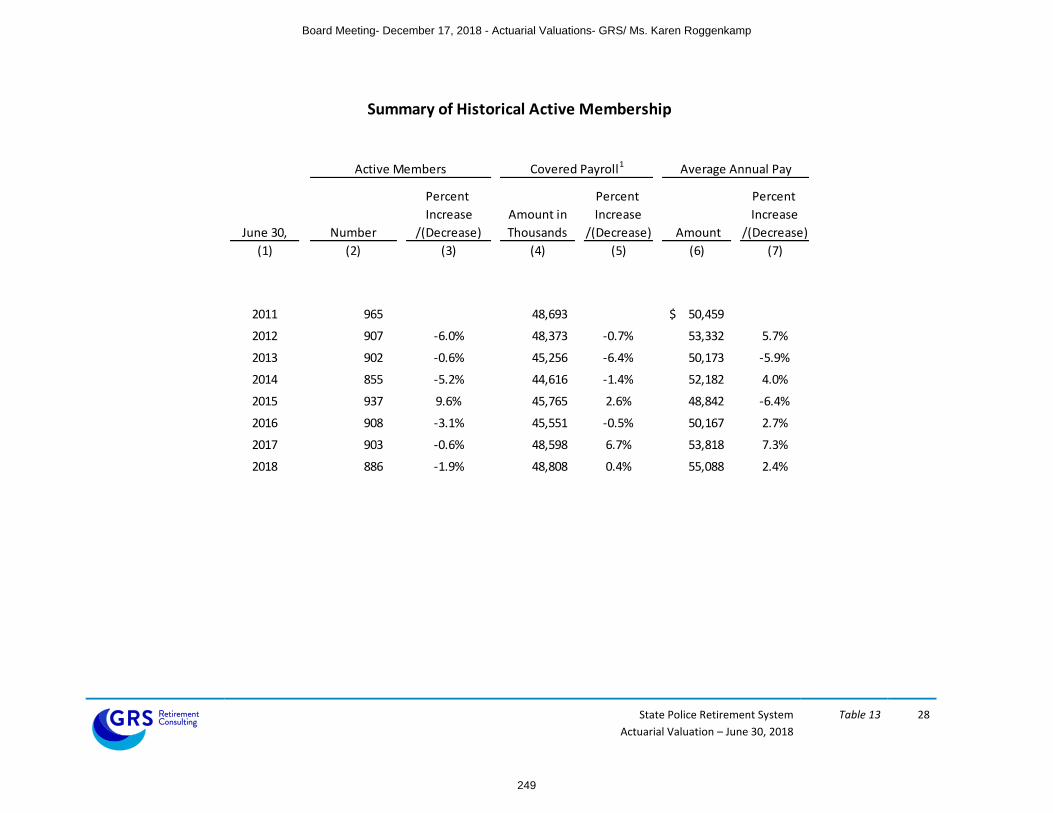
State Police Retirement System
Actuarial Valuation – June 30, 2018
Table 13 28
Percent Percent Percent
Increase Amount in Increase Increase
June 30, Number /(Decrease) Thousands /(Decrease) Amount /(Decrease)
(1) (2) (3) (4) (5) (6) (7)
2011 965 48,693 50,459$
2012 907 -6.0% 48,373 -0.7% 53,332 5.7%
2013 902 -0.6% 45,256 -6.4% 50,173 -5.9%
2014 855 -5.2% 44,616 -1.4% 52,182 4.0%
2015 937 9.6% 45,765 2.6% 48,842 -6.4%
2016 908 -3.1% 45,551 -0.5% 50,167 2.7%
2017 903 -0.6% 48,598 6.7% 53,818 7.3%
2018 886 -1.9% 48,808 0.4% 55,088 2.4%
Summary of Historical Active Membership
Active Members Covered Payroll1 Average Annual Pay
Board Meeting- December 17, 2018 - Actuarial Valuations- GRS/ Ms. Karen Roggenkamp
249

State Police Retirement System
Actuarial Valuation – June 30, 2018
Table 14 29
0 1 2 3 4 5-9 10-14 15-19 20-24 25-29 30-34 35 & Over TotalAttained Count & Count & Count & Count & Count & Count & Count & Count & Count & Count & Count & Count & Count &
Age Avg. Comp. Avg. Comp. Avg. Comp. Avg. Comp. Avg. Comp. Avg. Comp. Avg. Comp. Avg. Comp. Avg. Comp. Avg. Comp. Avg. Comp. Avg. Comp. Avg. Comp.
Under 20 0 0 0 0 0 0 0 0 0 0 0 0 0
$0 $0 $0 $0 $0 $0 $0 $0 $0 $0 $0 $0 $0
20-24 24 0 7 2 0 0 0 0 0 0 0 0 33
$26,135 $0 $45,956 $44,734 $0 $0 $0 $0 $0 $0 $0 $0 $31,467
25-29 25 15 19 51 0 22 0 0 0 0 0 0 132
$33,400 $42,072 $45,125 $45,838 $0 $50,807 $0 $0 $0 $0 $0 $0 $43,780
30-34 9 16 9 30 3 100 14 0 0 0 0 0 181
$36,488 $42,754 $42,602 $46,500 $43,508 $51,404 $52,670 $0 $0 $0 $0 $0 $48,614
35-39 3 7 1 8 0 56 78 25 1 0 0 0 179
$39,111 $43,372 $44,771 $49,097 $0 $51,611 $57,427 $61,890 $72,510 $0 $0 $0 $55,015
40-44 1 3 0 6 1 24 44 89 21 1 0 0 190
$32,329 $44,641 $0 $45,184 $46,310 $52,538 $57,395 $65,128 $74,627 $73,812 $0 $0 $61,618
45-49 0 2 0 3 0 7 18 37 43 7 0 0 117
$0 $42,277 $0 $52,589 $0 $50,844 $55,449 $64,645 $77,191 $83,394 $0 $0 $67,446
50-54 0 0 0 0 0 1 9 10 13 6 0 0 39
$0 $0 $0 $0 $0 $50,095 $57,021 $65,904 $75,960 $83,303 $0 $0 $69,478
55-59 0 0 0 0 0 0 4 4 2 1 0 0 11
$0 $0 $0 $0 $0 $0 $51,375 $58,642 $74,011 $95,206 $0 $0 $62,118
60-64 0 0 0 0 0 0 0 0 1 0 1 2 4
$0 $0 $0 $0 $0 $0 $0 $0 $79,745 $0 $95,902 $88,371 $88,097
65 & Over 0 0 0 0 0 0 0 0 0 0 0 0 0
$0 $0 $0 $0 $0 $0 $0 $0 $0 $0 $0 $0 $0
Total 62 43 36 100 4 210 167 165 81 15 1 2 886
$31,295 $42,726 $44,646 $46,438 $44,209 $51,501 $56,640 $64,419 $76,224 $83,506 $95,902 $88,371 $55,088
Distribution of Active Members by Age and by Years of ServiceSPRS Members
Years of Credited Service
Board Meeting- December 17, 2018 - Actuarial Valuations- GRS/ Ms. Karen Roggenkamp
250
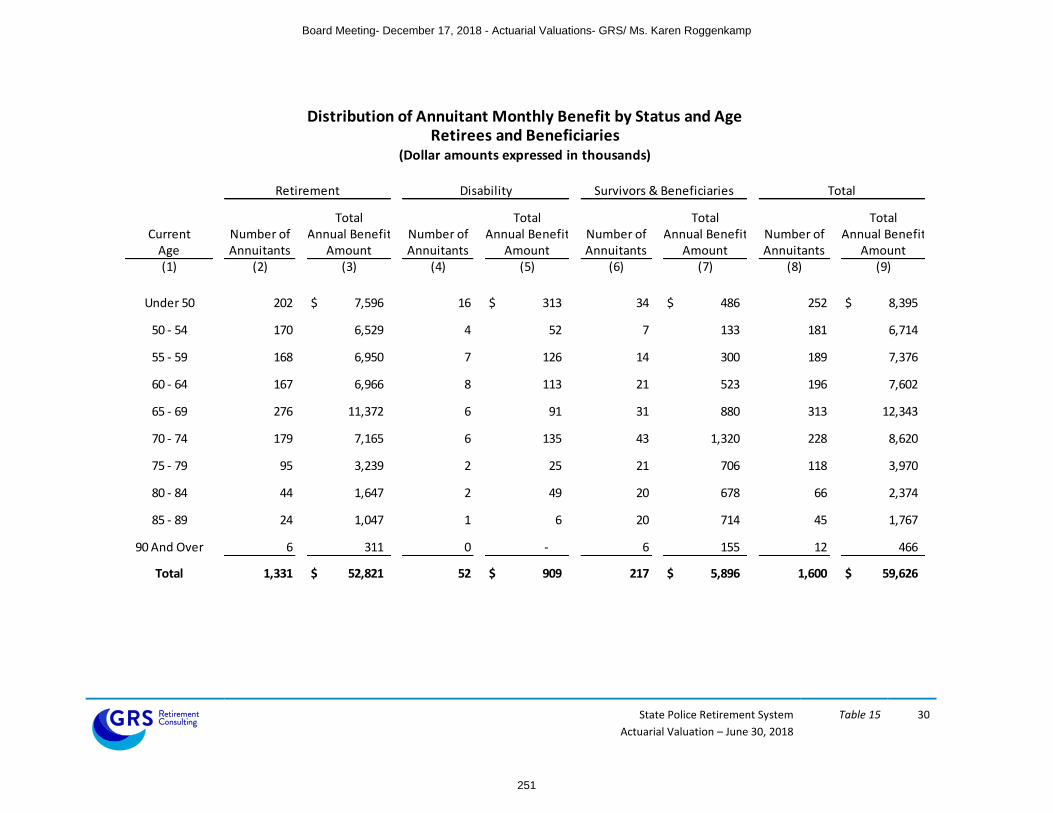
State Police Retirement System
Actuarial Valuation – June 30, 2018
Table 15 30
Distribution of Annuitant Monthly Benefit by Status and Age
Retirees and Beneficiaries(Dollar amounts expressed in thousands)
Current Number of Number of Number of Number ofAge Annuitants Annuitants Annuitants Annuitants(1) (2) (4) (6) (8)
Under 50 202 $ 7,596 16 $ 313 34 $ 486 252 $ 8,395
50 - 54 170 6,529 4 52 7 133 181 6,714
55 - 59 168 6,950 7 126 14 300 189 7,376
60 - 64 167 6,966 8 113 21 523 196 7,602
65 - 69 276 11,372 6 91 31 880 313 12,343
70 - 74 179 7,165 6 135 43 1,320 228 8,620
75 - 79 95 3,239 2 25 21 706 118 3,970
80 - 84 44 1,647 2 49 20 678 66 2,374
85 - 89 24 1,047 1 6 20 714 45 1,767
90 And Over 6 311 0 - 6 155 12 466
Total 1,331 $ 52,821 52 $ 909 217 $ 5,896 1,600 $ 59,626
(9)
Annual BenefitAmount Amount Amount Amount
Total
Total Total Total Total
Retirement Disability Survivors & Beneficiaries
Annual Benefit Annual Benefit Annual Benefit
(3) (5) (7)
Board Meeting- December 17, 2018 - Actuarial Valuations- GRS/ Ms. Karen Roggenkamp
251

State Police Retirement System
Actuarial Valuation – June 30, 2018
Table 16 31
Retired Lives Summary
Male Lives Female Lives Total
Monthly Monthly Monthly
Form of Payment Number Benefit Amount Number Benefit Amount Number Benefit Amount
(1) (2) (3) (4) (5) (6) (7)
Basic 149 $ 438,125 17 $ 50,826 166 $ 488,952
Joint & Survivor:
100% to Beneficiary 146 465,865 1 4,814 147 470,678
66 2/3% to Beneficiary 89 339,906 2 7,542 91 347,448
50% to Beneficiary 82 298,968 1 2,605 83 301,573
Pop-up Option 614 2,169,493 5 10,874 619 2,180,368
Social Security Option:
Age 62 Basic 31 78,625 0 0 31 78,625
Age 62 Survivorship 120 230,066 1 4,416 121 234,482
Partial Deferred (Old Plan) 0 0 0 0 0 0
Widows Age 60 0 0 0 0 0 0
5 Years Certain 0 0 0 0 0 0
10 Years Certain 6 28,112 0 0 6 28,112
10 Years Certain & Life 37 124,726 3 6,759 40 131,485
15 Years Certain & Life 16 45,041 1 3,919 17 48,960
20 Years Certain & Life 39 118,730 2 3,979 41 122,709
Refund 0 0 0 0 0 0
Partial Lump Sum Option (PLSO):
12 Month Basic 0 0 0 0 0 0
24 Month Basic 0 0 0 0 0 0
36 Month Basic 0 0 2 466 2 466
12 Month Survivor 6 20,781 0 0 6 20,781
24 Month Survivor 4 5,953 0 0 4 5,953
36 Month Survivor 9 16,914 0 0 9 16,914
Total: 1,348 $ 4,381,307 35 $ 96,200 1,383 $ 4,477,507
Board Meeting- December 17, 2018 - Actuarial Valuations- GRS/ Ms. Karen Roggenkamp
252

State Police Retirement System
Actuarial Valuation – June 30, 2018
Table 17 32
Beneficiary Lives Summary
Male Lives Female Lives Total
Monthly Monthly Monthly
Form of Payment Number Benefit Amount Number Benefit Amount Number Benefit Amount
(1) (2) (3) (4) (5) (6) (7)
Basic 2 $ 821 8 $ 7,052 10 $ 7,872
Joint & Survivor:
100% to Beneficiary 8 11,031 61 167,263 69 178,294
66 2/3% to Beneficiary 2 1,206 13 27,456 15 28,662
50% to Beneficiary 1 3,110 19 27,538 20 30,649
Pop-up Option 2 1,154 44 125,259 46 126,413
Social Security Option:
Age 62 Basic 0 0 2 2,281 2 2,281
Age 62 Survivorship 1 2,199 43 88,984 44 91,183
Partial Deferred (Old Plan) 0 0 0 0 0 0
Widows Age 60 0 0 0 0 0 0
5 Years Certain 0 0 0 0 0 0
10 Years Certain 2 4,076 0 0 2 4,076
10 Years Certain & Life 0 0 1 390 1 390
15 Years Certain & Life 0 0 1 721 1 721
20 Years Certain & Life 1 6,686 5 6,716 6 13,402
Refund 0 0 0 0 0 0
Partial Lump Sum Option (PLSO):
12 Month Basic 0 0 0 0 0 0
24 Month Basic 0 0 0 0 0 0
36 Month Basic 0 0 0 0 0 0
12 Month Survivor 0 0 0 0 0 0
24 Month Survivor 0 0 1 7,351 1 7,351
36 Month Survivor 0 0 0 0 0 0
Total: 19 $ 30,282 198 $ 461,011 217 $ 491,293
Board Meeting- December 17, 2018 - Actuarial Valuations- GRS/ Ms. Karen Roggenkamp
253

State Police Retirement System
Actuarial Valuation – June 30, 2018
Table 18 33
Added to Removed
Rolls from Rolls % Increase Average
Year Annual in Annual Annual
Ended Number Number Number Benefits Benefit Benefit
(1) (2) (3) (4) (5) (6) (7)
2011 52 12 1,263 47,467$ 37,583$ 2012 52 16 1,299 49,887 5.1% 38,404
2013 63 16 1,346 50,906 2.0% 37,820
2014 95 28 1,413 53,432 5.0% 37,815
2015 62 15 1,460 54,930 2.8% 37,623
2016 65 10 1,515 56,650 3.1% 37,393
2017 30 9 1,536 57,253 1.1% 37,274
2018 81 17 1,600 59,626 4.1% 37,266
Schedule of Retirants Added to And Removed from Rolls(Dollar amounts except average allowance expressed in thousands)
Rolls End of the Year
Board Meeting- December 17, 2018 - Actuarial Valuations- GRS/ Ms. Karen Roggenkamp
254

APPENDIX A
ACTUARIAL ASSUMPTIONS AND METHODS
Board Meeting- December 17, 2018 - Actuarial Valuations- GRS/ Ms. Karen Roggenkamp
255

State Police Retirement System
Actuarial Valuation – June 30, 2018
Appendix A 35
Summary of Actuarial Methods and Assumptions
The following presents a summary of the actuarial assumptions and methods used in the valuation of the
State Police Retirement System.
In general, the assumptions and methods used in the valuation are based on the actuarial experience study for the five-year period ending June 30, 2013, submitted April 30, 2014, and adopted by the Board on December 4, 2014. The investment return, price inflation, and payroll growth assumption were adopted by the Board in May and July 2017 for use with the June 30, 2017 valuation in order to reflect future economic expectations. Investment return rate:
Assumed annual rate of 5.25% net of investment expenses for the retirement fund Assumed annual rate of 6.25% net of investment expenses for the insurance fund
Price Inflation:
Assumed annual rate of 2.30%
Rates of Annual Salary Increase:
Assumed rates of annual salary increases are shown below.
Service Years
Annual Rates of Salary Increases
Merit & Seniority Price Inflation & Productivity
Total Increase
0 12.50% 3.05% 15.55%
1 7.50% 3.05% 10.55%
2 5.50% 3.05% 8.55%
3 4.50% 3.05% 7.55%
4 3.50% 3.05% 6.55%
5 2.50% 3.05% 5.55%
6 2.00% 3.05% 5.05%
7 2.00% 3.05% 5.05%
8 1.00% 3.05% 4.05%
9 0.50% 3.05% 3.55%
10 & Over 0.00% 3.05% 3.05%
Board Meeting- December 17, 2018 - Actuarial Valuations- GRS/ Ms. Karen Roggenkamp
256

State Police Retirement System
Actuarial Valuation – June 30, 2018
Appendix A 36
Retirement rates:
Assumed annual rates of retirement are shown below. Rates are only applicable for members who are eligible for a service retirement.
Service
Members participating
before 9/1/20081
Members participating on or after 9/1/20082
20 22.0%
21 22.0%
22 22.0%
23 28.0%
24 28.0%
25 28.0% 22.0%
26 28.0% 22.0%
27 28.0% 22.0%
28 44.0% 28.0%
29 44.0% 28.0%
30 44.0% 28.0%
31 58.0% 28.0%
32 58.0% 28.0%
33 58.0% 44.0%
34 58.0% 44.0%
35 58.0% 44.0%
36 58.0% 58.0%
37 58.0% 58.0%
38 58.0% 58.0%
39 58.0% 58.0%
40 58.0% 58.0% 1 The annual rate of service retirement is 100% at age 55. 2 The annual rate of service retirement is 100% at age 60.
Board Meeting- December 17, 2018 - Actuarial Valuations- GRS/ Ms. Karen Roggenkamp
257

State Police Retirement System
Actuarial Valuation – June 30, 2018
Appendix A 37
Disability rates:
An abbreviated table with assumed rates of disability is show below.
Age
Annual Rates of Disability
Male Female
20 0.05% 0.05%
30 0.09% 0.09%
40 0.20% 0.20%
50 0.56% 0.56%
60 1.46% 1.46%
Withdrawal rates (for causes other than death, disability or retirement):
Assumed annual rates of withdrawal are shown below.
Service Annual Rates of Withdrawal
0 20.00%
1 7.00%
2-8 3.00%
9 & Over 2.50%
Board Meeting- December 17, 2018 - Actuarial Valuations- GRS/ Ms. Karen Roggenkamp
258

State Police Retirement System
Actuarial Valuation – June 30, 2018
Appendix A 38
Mortality Assumption:
Pre-retirement mortality: RP-2000 Combined Mortality Table projected with Scale BB to 2013. Male mortality rates are multiplied by 50% and female mortality rates are multiplied by 30%.
Post-retirement mortality (non-disabled): RP-2000 Combined Mortality Table projected with Scale BB to 2013. Female mortality rates are set back one year.
Post-retirement mortality (disabled): RP-2000 Combined Disabled Mortality Table projected with Scale BB to 2013. Male mortality rates are set back four years.
At the time of the last experience study performed as of June 30, 2013, this mortality assumption provided 37% and 19% margin for future improvement for males and females, respectively.
Marital status:
100% of employees are assumed to be married, with the female spouse 3 years younger than the male spouse.
Line of Duty Disability
0% of disabilities are assumed to occur in the line of duty
Line of Duty Death
25% of deaths are assumed to occur in the line of duty
Dependent Children:
For members in the Hazardous Plan who receive a duty-related death benefit, the member is assumed to be survived by two dependent children, each age 6 with payments for 15 years.
Form of Payment:
Members are assumed to elect a life-only annuity at retirement.
Board Meeting- December 17, 2018 - Actuarial Valuations- GRS/ Ms. Karen Roggenkamp
259

State Police Retirement System
Actuarial Valuation – June 30, 2018
Appendix A 39
Actuarial Cost Method:
Entry Age Normal, Level Percentage of Pay. The Entry Age Normal actuarial cost method allocates the System’s actuarial present value of future benefits to various periods based upon service. The portion of the present value of future benefits allocated to years of service prior to the valuation date is the actuarial accrued liability, and the portion allocated to years following the valuation date is the present value of future normal costs. The normal cost is determined for each active member as the level percent of pay necessary to fully fund the expected benefits to be earned over the career of each individual active member. The normal cost is partially funded with active member contributions with the remainder funded by employer contributions.
Health Care Age Related Morbidity/Claims Utilization:
To model the impact of aging on the underlying health care costs for Medicare retirees, the valuation relied on the Society of Actuaries’ 2013 Study “Health Care Costs – From Birth to Death”. Table 4 (Development of Plan Specific Medicare Age Curve) was used to model the impact of aging for ages 65 and over.
Board Meeting- December 17, 2018 - Actuarial Valuations- GRS/ Ms. Karen Roggenkamp
260

State Police Retirement System
Actuarial Valuation – June 30, 2018
Appendix A 40
Health Care Cost Trend Rates1:
1All increases are assumed to occur on January 1. The 2019 premiums were known at the time of the valuation and were incorporated into the liability measurement.
2Applies to members participating on or after July 1, 2003
Health care trend assumptions are based on the model issued by the Society of Actuaries “Getzen model of Long-Run Medical Cost Trends for the SOA; Thomas E. Getzen, iHEA and Temple University 2014 © Society of Actuaries.
The underlying assumptions used to develop the health care trend rates include:
A short run period-this is a period for which anticipated health care trend rates are manually set based on local information as well as plan-specific and carrier information.
Long term real GDP growth- 1.75%
Long term rate of inflation- 2.30%
Long term nominal GDP growth – 4.05%
Year that excess rate converges to 0- 15 years from the valuation
Health care trend rates are thus the manually set rates for the short run period and rates which decline to an ultimate trend rate which equals the assumed nominal long term GDP growth rate.
Year
Non-Medicare Plans
Medicare Plans
Dollar Contribution2
2020 7.00% 5.00% 1.50%
2021 6.75% 4.90% 1.50%
2022 6.50% 4.80% 1.50%
2023 6.25% 4.70% 1.50%
2024 6.00% 4.60% 1.50%
2025 5.75% 4.50% 1.50%
2026 5.50% 4.40% 1.50%
2027 5.25% 4.30% 1.50%
2028 5.00% 4.20% 1.50%
2029 4.75% 4.10% 1.50%
2030 4.50% 4.05% 1.50%
2031 4.25% 4.05% 1.50%
2032 & Beyond 4.05% 4.05% 1.50%
Board Meeting- December 17, 2018 - Actuarial Valuations- GRS/ Ms. Karen Roggenkamp
261

State Police Retirement System
Actuarial Valuation – June 30, 2018
Appendix A 41
Health Care Participation Assumptions:
Members are assumed to elect health coverage at retirement at the following participation rates.
Service at Retirement
Members participating
before 7/1/2003*
Members participating
between 7/1/2003
and 9/1/2008
Members participating
after 9/1/2008
Under 10 100% 100% 100%
10-14 100% 100% 100%
15-19 100% 100% 100%
Over 20 100% 100% 100%
* 100% of members with a duty disability or a duty death (in service) benefit are assumed to elect coverage at retirement.
Future retirees are assumed to have a similar distribution by plan type as the current retirees.
Medicare Plan Participation
Medical Only 7%
Essential 8%
Premium 86%
Non-Medicare Plan Participation
LivingWell Limited 2%
LivingWell Basic 13%
LivingWell CDHP 27%
LivingWell PPO 58%
100% of deferred vested members participating are assumed to elect health coverage at retirement. Deferred vested members are assumed to begin health coverage at age 50.
75% of future retirees, with hazardous service, are assumed to elect spouse health care coverage. No dependent coverage is assumed for members who only have non-hazardous service. 100% of spouses with health care coverage are assumed to continue coverage after the member’s death.
Board Meeting- December 17, 2018 - Actuarial Valuations- GRS/ Ms. Karen Roggenkamp
262
State Police Retirement System
Actuarial Valuation – June 30, 2018
Appendix A 42
Excise (“Cadillac”) Tax:
For taxable years beginning after December 31, 2021, a 40% excise tax will be required to be paid (by the employer and/or insurer) on the aggregate cost of the health plan in excess of certain legislated thresholds. For 2018, the thresholds are $850 per month for individual coverage and $2,292 per month for family coverage.
Both Actuarial Standard of Practice No. 6 and GASB Statement Nos. 74 and 75 reference this tax, and, in accordance with these standards an estimate of the impact of the Cadillac tax has been included in this valuation.
Assumptions and methods used to determine the impact of the Cadillac Tax include:
2018 thresholds of $850/$2,292 were indexed annually by 2.30%.
Premium data submitted was not adjusted for permissible exclusions to the Cadillac Tax.
There were no special adjustments to the dollar limit other than those permissible for non-Medicare retirees over 55.
In this valuation, the impact of the Cadillac Tax has been calculated by increasing the employer paid premiums for Non-Medicare retirees, who became participants before July 1, 2003, by 3.6%. Non-Medicare retirees who became participants after July 1, 2003 receive dollar subsidies per year of service, which are not expected to exceed the overall Non-Medicare premiums. As a result, the costs attributable to the Cadillac Tax for members who became participants after July 1, 2003 will be paid by the retirees.
Changes in Assumptions since the prior valuation:
None.
Board Meeting- December 17, 2018 - Actuarial Valuations- GRS/ Ms. Karen Roggenkamp
263

State Police Retirement System
Actuarial Valuation – June 30, 2018
Appendix A 43
Development of Baseline Claims Cost
For non-Medicare retirees, the initial per capita costs were based on the plan premiums effective
January 1, 2019, and are used for both current and future retirees. An inherent assumption in this
methodology is that the projected future retirees will have a similar distribution by plan type as the
current retirees. The spouse/dependent premium of $865.74 for non-Medicare retirees is based on a
blending of Family and Couple premiums for the current retirees that have over 4 years of hazardous
service. The fully-insured premiums KRS pays the Kentucky Employees’ Health Plan (KEHP) are blended
rates based on the combined experience of active and retired members. Because the average cost of
providing health care benefits to retirees under age 65 is higher than the average cost of providing
health care benefits to active employees, there is an implicit rate subsidy for the non-Medicare eligible
retirees. Actuarial Standard of Practice No. 6 (ASOP No. 6) requires aging subsidies (or implicit rate
subsidies) to be recognized. However, the KRS health insurance trusts are only used to reimburse KEHP
for the employer’s portion of the blended premiums. Said another way, the trusts are not used to fund
the difference between the underlying retiree claims and the blended KEHP premiums. As a result, the
retiree health care liabilities developed in this report for the non-Medicare retirees are based solely on
the premiums charged by KEHP, without any age-adjustment. GASB Statements No. 74 and No. 75
prohibit such a deviation from ASOP No. 6. The liabilities developed in this report are solely for the
purpose of funding the benefits paid by the health insurance funds and are not appropriate for financial
statement disclosures required by GASB. GRS provides separate GASB reports to KRS which include the
liabilities associated with the implicit rate subsidy.
FOR THOSE NOT ELIGIBLE FOR MEDICARE
AGE MEMBER SPOUSE/DEPENDENTS
<65 $717.39 $865.74
For Medicare retirees, the initial per capita costs were estimated based on the plan premiums effective
January 1, 2019, and are used for both current and future retirees. An inherent assumption in this
methodology is that the projected future retirees will have a similar distribution by plan type as the
current retirees. Age graded and sex distinct premiums are utilized for retirees over the age of 65.
These costs are appropriate for the unique age and sex distribution currently existing. Over the future
years covered by this valuation, the age and sex distribution will most likely change. Therefore, our
process “distributes” the average premium over all age/sex combinations and assigns a unique
premium for each combination. The age/sex specific costs more accurately reflect the health care
utilization and cost at that age.
FOR THOSE ELIGIBLE FOR MEDICARE
AGE MALE FEMALE
65 75 85
$183.50 214.69 227.02
$173.08 209.49 229.07
Board Meeting- December 17, 2018 - Actuarial Valuations- GRS/ Ms. Karen Roggenkamp
264

State Police Retirement System
Actuarial Valuation – June 30, 2018
Appendix A 44
Appendix B of the report provides a full schedule of premiums.
Mehdi Riazi is a Member of the American Academy of Actuaries (MAAA) and meets the Qualification Standards of the American Academy of Actuaries to render the actuarial opinions contained herein.
Mehdi Riazi, FSA, EA, MAAA
Board Meeting- December 17, 2018 - Actuarial Valuations- GRS/ Ms. Karen Roggenkamp
265
APPENDIX B
BENEFIT PROVISIONS
Board Meeting- December 17, 2018 - Actuarial Valuations- GRS/ Ms. Karen Roggenkamp
266

State Police Retirement System
Actuarial Valuation – June 30, 2018
Appendix B 46
Summary of Benefit Provisions for State Police Retirement System
(SPRS)
SPRS Employees
Retirement: Tier 1, Participation before 9/1/2008
Normal Retirement Age 55 with at least 1 month of service credit; or Eligibility Any age with at least 20 years of service
Benefit Amount If a member has at least 60 months of service, the monthly benefit is 2.50% times final average compensation times years of service.
If a member has less than 60 months of service, the monthly benefit is the actuarial equivalent of two times the member’s contributions with interest.
Final average compensation is based on the member’s highest 3 years of compensation.
Early Retirement Eligibility Age 50 with at least 15 years of service Early Retirement Reduction Normal Retirement benefit reduced 6.5% per year for the first five years and
4.5% per year for the next five years for each year the member’s retirement eligibility precedes the member’s normal retirement date.
Board Meeting- December 17, 2018 - Actuarial Valuations- GRS/ Ms. Karen Roggenkamp
267

State Police Retirement System
Actuarial Valuation – June 30, 2018
Appendix B 47
SPRS Employees (continued)
Retirement: Tier 2, Participation on or after 9/1/2008 but before 1/1/2014
Normal Retirement Age 60 with at least 5 years of service; or Eligibility Any age with at least 25 years of service
Benefit Amount The monthly benefit is equal to the applicable benefit multiplier times final average compensation times years of service.
Years of Service Benefit Multiplier 10 or less 1.10%
10-20 1.30% 20-25 1.50%
Greater than 25* 2.00%
Final compensation is based on the member’s highest 3 years of compensation.
Early Retirement Eligibility Age 50 with at least 15 years of service Early Retirement Reduction Normal Retirement benefit reduced 6.5% per year for the first five years
and 4.5% per year for the next five years for each year the member’s retirement date precedes the member’s normal retirement eligibility.
Retirement: Tier 3, Participation on or after 1/1/2014
Normal Retirement Age 60 with at least 5 years of service; or Eligibility Any age with at least 25 years of service
Benefit Amount Each year that the member is active, a 7.50% employer pay credit and the employee’s 5.00% contribution will be credited to each member’s hypothetical cash balance account. The hypothetical account will earn interest at a minimum rate of 4%, annually. If the System’s geometric average net investment return for the previous five years exceeds 4%, then the hypothetical account will be credited with an additional amount of interest in that year equal to 75% of the amount of the return which exceeds 4%. All interest credits will be applied to the hypothetical account balance on June 30 based on the account balance as of June 30 of the previous year.
At retirement, the member’s hypothetical account balance may be converted into an annuity based on an actuarial factor.
Early Retirement Eligibility N/A
Board Meeting- December 17, 2018 - Actuarial Valuations- GRS/ Ms. Karen Roggenkamp
268

State Police Retirement System
Actuarial Valuation – June 30, 2018
Appendix B 48
SPRS Employees (continued)
Deferred Vested Benefit: Tier 1, Participation before 9/1/2008
Eligibility At least 1 month of service credit
Benefit Amount Normal retirement benefit deferred to normal retirement age, or a reduced retirement benefit at an early retirement age
Deferred Vested Benefit: Tier 2, Participation on or after 9/1/2008 but before 1/1/2014
Eligibility 5 years of service
Benefit Amount Normal retirement benefit deferred to normal retirement age, or a reduced retirement benefit at an early retirement age
Deferred Vested Benefit Tier 3, Participation on or after 1/1/2014
Eligibility 5 years of service
Benefit Amount At termination of employment, members may choose to leave their account balance with the System and retire once they are eligible. The hypothetical account balance will earn 4% annual interest after termination. Members may also choose to withdrawal their entire accumulated balance. If a member does not have 5 years of service at termination, the member is eligible to receive a partial refund of their account balance. This refund includes the member’s contributions with interest.
Disability Retirement: Participation before 8/1/2004
Eligibility 60 months of service (requirement is waived if line of duty disability)
Disability Benefit Disability benefits are calculated in the same manner as the normal retirement benefit with years of service and final compensation being determined as of the date of disability, except that if the member has less than 20 years of service at disability, service credit shall be added to the person’s total service beginning with the last date of paid employment and continuing to the member’s 55th birthday, with total service not exceeding 20 years. Total service credit added shall not be greater than the member’s actual service at disability.
Board Meeting- December 17, 2018 - Actuarial Valuations- GRS/ Ms. Karen Roggenkamp
269

State Police Retirement System
Actuarial Valuation – June 30, 2018
Appendix B 49
SPRS Employees (continued)
Disability Retirement: Participation on or after 8/1/2004 but before 1/1/2014
Eligibility 60 months of service (requirement is waived if line of duty disability)
Disability Benefit The higher of 25% of the member’s final monthly rate of pay or the member’s normal retirement benefit (without reduction for early retirement) with years and final compensation being determined as of the date of disability.
Disability Retirement: Participation on or after 1/1/2014
Eligibility 60 months of service (requirement is waived if line of duty disability)
Disability Benefit The higher of 25% of the member’s final monthly rate of pay or the member’s retirement benefit calculated at the member’s normal retirement date.
Line of Duty Disability Benefit
Disability Benefit If the disability is a direct result of an act in the line of duty, the benefit shall not be less than 25% of the member’s final monthly rate of pay. Additionally, each eligible dependent child will receive 10% of the member’s monthly final rate of pay up to a maximum of 40%.
Pre-Retirement Death Benefit
Eligibility Eligible for early or normal retirement; or Under age 55 with at least 60 months of service and actively working at the
time of death; or At least 144 months of service, if no longer actively working
Spouse Benefit The member’s retirement benefit calculated in the same manner as if the member had retired on the day of the member’s death and elected a 100% joint and survivor benefit. The benefit is actuarially reduced if the member dies prior to their normal retirement age.
Pre-Retirement Death Benefit (Death in the Line of Duty)
Eligibility One month of service credit
Spouse Benefit A $10,000 lump sum payment plus a monthly payment of 75% of the deceased member’s final monthly average pay. Each dependent child will receive 10% of average pay (not to exceed a total child benefit of 25% while the spouse is alive). A spouse may also elect the non-line of duty death benefit.
Non-Spouse Benefit If the beneficiary is only one person who is a dependent receiving at least 50% of his or her support from the member, the beneficiary may elect a lump sum payment of $10,000.
Child Benefit In the event there is no surviving spouse, the benefit is 50% of final monthly average pay for one child, 65% of final average pay for two children, or 75% of final average pay for three or more eligible children.
Board Meeting- December 17, 2018 - Actuarial Valuations- GRS/ Ms. Karen Roggenkamp
270
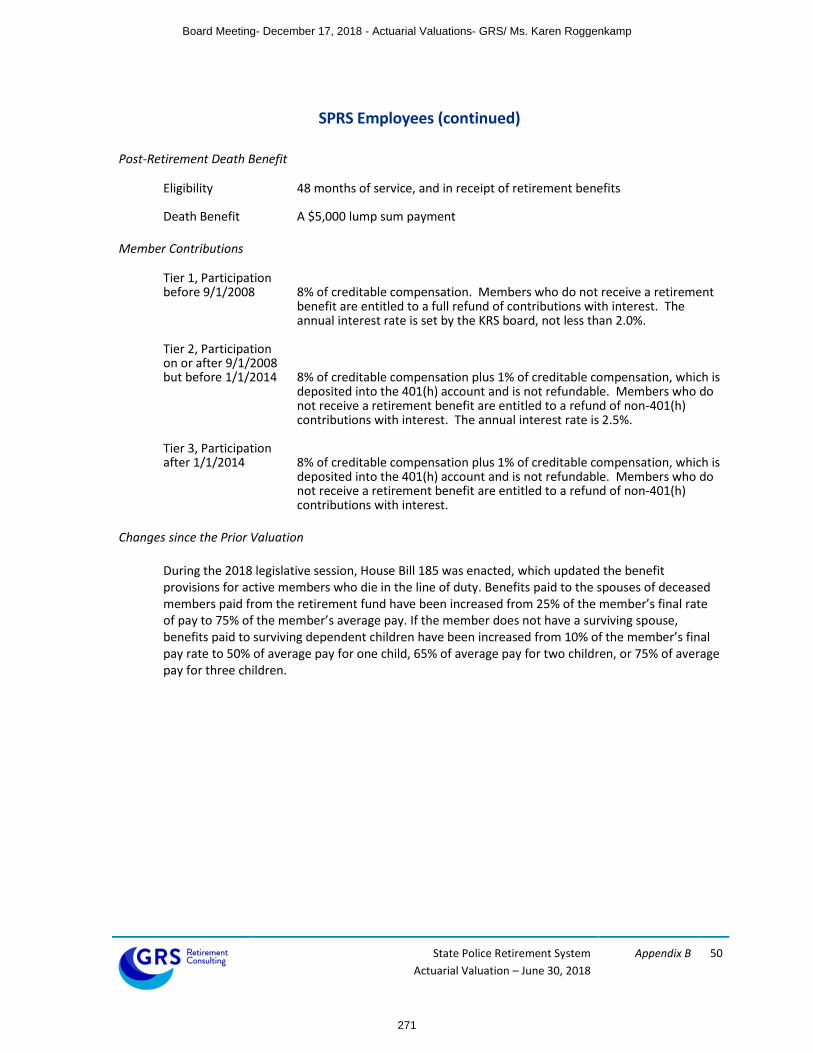
State Police Retirement System
Actuarial Valuation – June 30, 2018
Appendix B 50
SPRS Employees (continued)
Post-Retirement Death Benefit
Eligibility 48 months of service, and in receipt of retirement benefits
Death Benefit A $5,000 lump sum payment Member Contributions
Tier 1, Participation before 9/1/2008 8% of creditable compensation. Members who do not receive a retirement
benefit are entitled to a full refund of contributions with interest. The annual interest rate is set by the KRS board, not less than 2.0%.
Tier 2, Participation on or after 9/1/2008 but before 1/1/2014 8% of creditable compensation plus 1% of creditable compensation, which is
deposited into the 401(h) account and is not refundable. Members who do not receive a retirement benefit are entitled to a refund of non-401(h) contributions with interest. The annual interest rate is 2.5%.
Tier 3, Participation after 1/1/2014 8% of creditable compensation plus 1% of creditable compensation, which is
deposited into the 401(h) account and is not refundable. Members who do not receive a retirement benefit are entitled to a refund of non-401(h) contributions with interest.
Changes since the Prior Valuation
During the 2018 legislative session, House Bill 185 was enacted, which updated the benefit provisions for active members who die in the line of duty. Benefits paid to the spouses of deceased members paid from the retirement fund have been increased from 25% of the member’s final rate of pay to 75% of the member’s average pay. If the member does not have a surviving spouse, benefits paid to surviving dependent children have been increased from 10% of the member’s final pay rate to 50% of average pay for one child, 65% of average pay for two children, or 75% of average pay for three children.
Board Meeting- December 17, 2018 - Actuarial Valuations- GRS/ Ms. Karen Roggenkamp
271

State Police Retirement System
Actuarial Valuation – June 30, 2018
Appendix B 51
Summary of Main Retiree Insurance Benefit Provisions
Insurance Tier 1: Participation began before 7/1/2003
Benefit Eligibility Recipient of a retirement allowance
Benefit Amount
Non-Hazardous Service
Percentage of Member Premium Paid by
Retirement System
Hazardous Service
Percentage of Member & Dependent Premium Paid by
Retirement System Less than 4 years 0% Less than 4 years 0%
4 – 9 years
25% 4 – 9 years
25%
10 – 14 years 50% 10 – 14 years 50%
15 – 19 years 75% 15 – 19 years 75%
20 or more years 100% 20 or more years 100%
The percentage paid by the retirement system is applied to the ‘contribution’ plan selected by the KRS Board.
Duty Disability Retirement If disability was a result of injuries sustained while in the line of duty, the member receives 100% of the maximum contribution for the member and dependents.
Duty Death in Service If an active employee’s death was a result of injuries sustained while in the line of duty, the member’s spouse and children receive a fully subsidized health insurance benefit.
Non-Duty Death in Service If the surviving spouses is in receipt of a pension allowance, he or she is eligible for continued health coverage. The percentage of the premium paid for by the retirement system is based on the member’s years of hazardous service at the time of death.
Surviving Spouse of a Retiree A surviving spouse of a retiree, who is in receipt of a pension allowance, will receive a premium subsidy based on the member’s years of hazardous service.
Hazardous employees who System’s contribution for spouse and dependents is based on total retired prior to August 1, 1998 service.
Board Meeting- December 17, 2018 - Actuarial Valuations- GRS/ Ms. Karen Roggenkamp
272
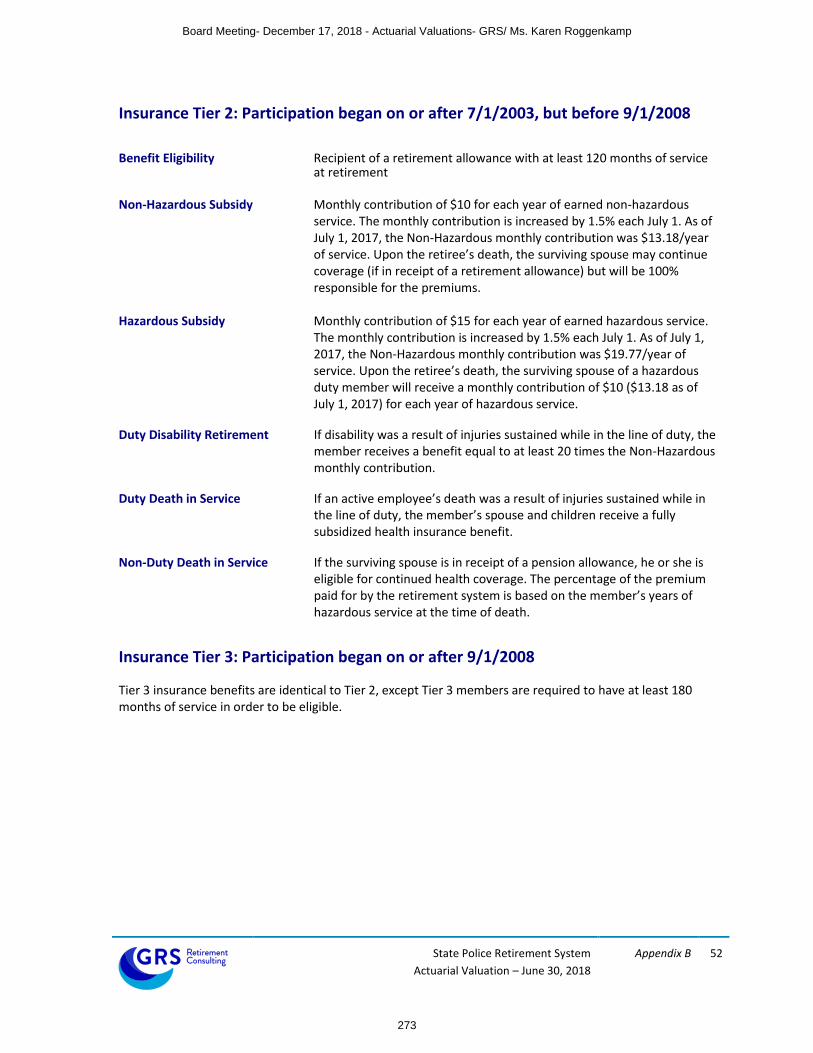
State Police Retirement System
Actuarial Valuation – June 30, 2018
Appendix B 52
Insurance Tier 2: Participation began on or after 7/1/2003, but before 9/1/2008
Benefit Eligibility Recipient of a retirement allowance with at least 120 months of service at retirement
Non-Hazardous Subsidy Monthly contribution of $10 for each year of earned non-hazardous
service. The monthly contribution is increased by 1.5% each July 1. As of July 1, 2017, the Non-Hazardous monthly contribution was $13.18/year of service. Upon the retiree’s death, the surviving spouse may continue coverage (if in receipt of a retirement allowance) but will be 100% responsible for the premiums.
Hazardous Subsidy Monthly contribution of $15 for each year of earned hazardous service.
The monthly contribution is increased by 1.5% each July 1. As of July 1, 2017, the Non-Hazardous monthly contribution was $19.77/year of service. Upon the retiree’s death, the surviving spouse of a hazardous duty member will receive a monthly contribution of $10 ($13.18 as of July 1, 2017) for each year of hazardous service.
Duty Disability Retirement If disability was a result of injuries sustained while in the line of duty, the member receives a benefit equal to at least 20 times the Non-Hazardous monthly contribution.
Duty Death in Service If an active employee’s death was a result of injuries sustained while in the line of duty, the member’s spouse and children receive a fully subsidized health insurance benefit.
Non-Duty Death in Service If the surviving spouse is in receipt of a pension allowance, he or she is eligible for continued health coverage. The percentage of the premium paid for by the retirement system is based on the member’s years of hazardous service at the time of death.
Insurance Tier 3: Participation began on or after 9/1/2008 Tier 3 insurance benefits are identical to Tier 2, except Tier 3 members are required to have at least 180 months of service in order to be eligible.
Board Meeting- December 17, 2018 - Actuarial Valuations- GRS/ Ms. Karen Roggenkamp
273

State Police Retirement System
Actuarial Valuation – June 30, 2018
Appendix B 53
Monthly Health Plan Premiums – Effective January 1, 2019
Non-Medicare Plan Options
Plan Option Single Parent Plus Couple Family Family X-Ref
LivingWell PPO* $729.34 $1,037.08 $1,589.10 $1,767.60 $876.68
LivingWell CDHP 709.46 978.50 1,333.64 1,479.76 818.96
LivingWell Basic 682.80 940.64 1,450.02 1,615.30 800.94
Living Well Limited 607.54 865.08 1,327.16 1,477.04 730.90
Medicare Plan Options
Kentucky Retirement Systems - Medical Only Plan $175.22
Kentucky Retirement Systems – Medicare Advantage/Essential Plan 53.73
Kentucky Retirement Systems – Medicare Advantage/Premium Plan* 220.11
*For 2019, the contribution plans selected by the KRS Board were the LivingWell PPO plan option for non-Medicare retirees and the Medicare Advantage Premium plan option for Medicare retirees.
Dollar Contribution Amount for Insurance Tier 2 and Tier 3 Monthly contribution amounts per year of service as of July 1, 2018.
Non-Hazardous Service
Hazardous Service
$13.38 $20.07
Note: Non-Hazardous benefits are applicable to SPRS members with prior service in a Non-Hazardous
System.
Changes since the Prior Valuation
During the 2018 legislative session, House Bill 185 was enacted, which updated the benefit provisions
for active members who die in the line of duty. The insurance fund shall now pay 100% of the
insurance premium for spouses and children of all active members who die in the line of duty.
Board Meeting- December 17, 2018 - Actuarial Valuations- GRS/ Ms. Karen Roggenkamp
274

APPENDIX C
GLOSSARY
Board Meeting- December 17, 2018 - Actuarial Valuations- GRS/ Ms. Karen Roggenkamp
275

State Police Retirement System
Actuarial Valuation – June 30, 2018
Appendix C 55
Glossary
Actuarial Accrued Liability (AAL): That portion, as determined by a particular Actuarial Cost Method, of
the Actuarial Present Value of Future Plan Benefits which is not provided for by future Normal Costs. It is
equal to the Actuarial Present Value of Future Plan Benefits minus the actuarial present value of future
Normal Costs.
Actuarial Assumptions: Assumptions as to future experience under the Fund. These include assumptions
about the occurrence of future events affecting costs or liabilities, such as:
mortality, withdrawal, disablement, and retirement;
future increases in salary;
future rates of investment earnings and future investment and administrative expenses;
characteristics of members not specified in the data, such as marital status;
characteristics of future members;
future elections made by members; and
other relevant items.
Actuarial Cost Method or Funding Method: A procedure for allocating the Actuarial Present Value of
Future Benefits to various time periods; a method used to determine the Normal Cost and the Actuarial
Accrued Liability. These items are used to determine the ADC.
Actuarial Gain or Actuarial Loss: A measure of the difference between actual experience and that
expected based upon a set of Actuarial Assumptions, during the period between two Actuarial Valuation
dates. Through the actuarial assumptions, rates of decrements, rates of salary increases, and rates of fund
earnings have been forecasted. To the extent that actual experience differs from that assumed, Actuarial
Accrued Liabilities emerge which may be the same as forecasted, or may be larger or smaller than
projected. Actuarial gains are due to favorable experience, e.g., the fund's assets earn more than
projected, salaries do not increase as fast as assumed, members retire later than assumed, etc. Favorable
experience means actual results produce actuarial liabilities not as large as projected by the actuarial
assumptions. On the other hand, actuarial losses are the result of unfavorable experience, i.e., actual
results that produce actuarial liabilities which are larger than projected. Actuarial gains will shorten the
time required for funding of the actuarial balance sheet deficiency while actuarial losses will lengthen the
funding period.
Actuarially Equivalent: Of equal actuarial present value, determined as of a given date and based on a given set of Actuarial Assumptions.
Board Meeting- December 17, 2018 - Actuarial Valuations- GRS/ Ms. Karen Roggenkamp
276

State Police Retirement System
Actuarial Valuation – June 30, 2018
Appendix C 56
Actuarial Present Value (APV): The value of an amount or series of amounts payable or receivable at
various times, determined as of a given date by the application of a particular set of Actuarial
Assumptions. For purposes of this standard, each such amount or series of amounts is:
a. adjusted for the probable financial effect of certain intervening events (such as changes in
compensation levels, marital status, etc.)
b. multiplied by the probability of the occurrence of an event (such as survival, death, disability,
termination of employment, etc.) on which the payment is conditioned, and
c. discounted according to an assumed rate (or rates) of return to reflect the time value of money.
Actuarial Present Value of Future Plan Benefits: The Actuarial Present Value of those benefit amounts
which are expected to be paid at various future times under a particular set of Actuarial Assumptions,
taking into account such items as the effect of advancement in age and past and anticipated future
compensation and service credits. The Actuarial Present Value of Future Plan Benefits includes the
liabilities for active members, retired members, beneficiaries receiving benefits, and inactive, non-retired
members either entitled to a refund or a future retirement benefit. Expressed another way, it is the value
that would have to be invested on the valuation date so that the amount invested plus investment
earnings would provide sufficient assets to pay all projected benefits and expenses when due.
Actuarial Valuation: The determination, as of a valuation date, of the Normal Cost, Actuarial Accrued
Liability, Actuarial Value of Assets, and related Actuarial Present Values for a plan. An Actuarial valuation
for a governmental retirement system typically also includes calculations that provide the financial
information of the plan, such as the funded ratio, unfunded actuarial accrued liability and the ADC.
Actuarial Value of Assets or Valuation Assets: The value of the Fund’s assets as of a given date, used by
the actuary for valuation purposes. This may be the market or fair value of plan assets, but commonly
actuaries use a smoothed value in order to reduce the year-to-year volatility of calculated results, such as
the funded ratio and the ADC.
Actuarially Determined: Values which have been determined utilizing the principles of actuarial science.
An actuarially determined value is derived by application of the appropriate actuarial assumptions to
specified values determined by provisions of the law.
Actuarially Determined Contribution (ADC): The employer’s periodic required contributions, expressed as
a dollar amount or a percentage of covered plan compensation. The ADC consists of the Employer Normal
Cost and the Amortization Payment.
Amortization Method: A method for determining the Amortization Payment. The most common methods
used are level dollar and level percentage of payroll. Under the Level Dollar method, the Amortization
Payment is one of a stream of payments, all equal, whose Actuarial Present Value is equal to the UAAL.
Under the Level Percentage of Pay method, the Amortization payment is one of a stream of increasing
payments, whose Actuarial Present Value is equal to the UAAL. Under the Level Percentage of Pay
method, the stream of payments increases at the assumed rate at which total covered payroll of all active
members will increase.
Board Meeting- December 17, 2018 - Actuarial Valuations- GRS/ Ms. Karen Roggenkamp
277

State Police Retirement System
Actuarial Valuation – June 30, 2018
Appendix C 57
Amortization Payment: The portion of the pension plan contribution or ADC which is designed to pay
interest on and to amortize the Unfunded Actuarial Accrued Liability.
Closed Amortization Period: A specific number of years that is counted down by one each year, and
therefore declines to zero with the passage of time. For example if the amortization period is initially set
at 30 years, it is 29 years at the end of one year, 28 years at the end of two years, etc. See Funding Period
and Open Amortization Period.
Decrements: Those causes/events due to which a member’s status (active-inactive-retiree-beneficiary)
changes, that is: death, retirement, disability, or termination.
Defined Benefit Plan: A retirement plan that is not a Defined Contribution Plan. Typically a defined
benefit plan is one in which benefits are defined by a formula applied to the member’s compensation
and/or years of service.
Defined Contribution Plan: A retirement plan, such as a 401(k) plan, a 403(b) plan, or a 457 plan, in which
the contributions to the plan are assigned to an account for each member, and the plan’s earnings are
allocated to each account, and each member’s benefits are a direct function of the account balance.
Employer Normal Cost: The portion of the Normal Cost to be paid by the employers. This is equal to the
Normal Cost less expected member contributions.
Experience Study: A periodic review and analysis of the actual experience of the Fund which may lead to a
revision of one or more actuarial assumptions. Actual rates of decrement and salary increases are
compared to the actuarially assumed values and modified as deemed appropriate by the Actuary.
Funded Ratio: The ratio of the actuarial value of assets (AVA) to the actuarial accrued liability (AAL). Plans
sometimes calculate a market funded ratio, using the market value of assets (MVA), rather than the AVA.
Funding Period or Amortization Period: The term “Funding Period” is used two ways. In the first sense, it
is the period used in calculating the Amortization Payment as a component of the ADC. This funding
period is specified in State statute. In the second sense, it is a calculated item: the number of years in the
future that will theoretically be required to amortize (i.e., pay off or eliminate) the Unfunded Actuarial
Accrued Liability, based on a statutory employer contribution rate, and assuming no future actuarial gains
or losses.
GASB: Governmental Accounting Standards Board.
GASB 67 and GASB 68: Governmental Accounting Standards Board Statements No. 67 and No. 68. These
are the governmental accounting standards that set the accounting and reporting rules for public
retirement systems and the employers that sponsor, participate in, or contribute to them. Statement No.
67 sets the accounting rules for the financial reporting of the retirement systems, while Statement No. 68
sets the rules for the employers that sponsor, participate in, or contribute to public retirement systems.
Normal Cost: That portion of the Actuarial Present Value of pension plan benefits and expenses which is
allocated to a valuation year by the Actuarial Cost Method. Any payment in respect of an Unfunded
Board Meeting- December 17, 2018 - Actuarial Valuations- GRS/ Ms. Karen Roggenkamp
278
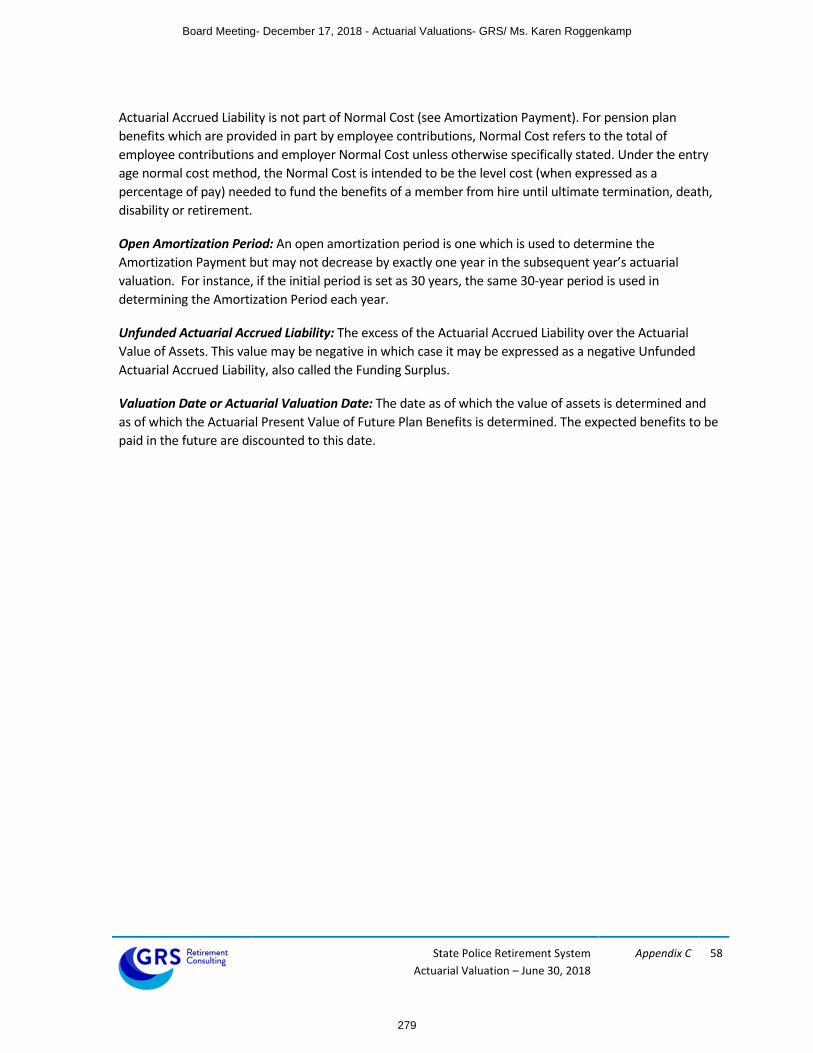
State Police Retirement System
Actuarial Valuation – June 30, 2018
Appendix C 58
Actuarial Accrued Liability is not part of Normal Cost (see Amortization Payment). For pension plan
benefits which are provided in part by employee contributions, Normal Cost refers to the total of
employee contributions and employer Normal Cost unless otherwise specifically stated. Under the entry
age normal cost method, the Normal Cost is intended to be the level cost (when expressed as a
percentage of pay) needed to fund the benefits of a member from hire until ultimate termination, death,
disability or retirement.
Open Amortization Period: An open amortization period is one which is used to determine the
Amortization Payment but may not decrease by exactly one year in the subsequent year’s actuarial
valuation. For instance, if the initial period is set as 30 years, the same 30-year period is used in
determining the Amortization Period each year.
Unfunded Actuarial Accrued Liability: The excess of the Actuarial Accrued Liability over the Actuarial
Value of Assets. This value may be negative in which case it may be expressed as a negative Unfunded
Actuarial Accrued Liability, also called the Funding Surplus.
Valuation Date or Actuarial Valuation Date: The date as of which the value of assets is determined and
as of which the Actuarial Present Value of Future Plan Benefits is determined. The expected benefits to be
paid in the future are discounted to this date.
Board Meeting- December 17, 2018 - Actuarial Valuations- GRS/ Ms. Karen Roggenkamp
279

November 19, 2018 Board of Trustees Kentucky Retirement Systems Perimeter Park West 1260 Louisville Road Frankfort, KY 40601
Re: GASB 67 Reporting – Actuarial Information Dear Members of the Board: The reports provided herein contain certain information for the Kentucky Employees Retirement System (KERS), the County Employees Retirement System (CERS), and the State Police Retirement System (SPRS) in connection with the Governmental Accounting Standards Board (GASB) Statement No. 67, “Financial Reporting for Pension Plans” for the fiscal year ending June 30, 2018. Separate reports will be provided at a later date with additional accounting information determined in accordance with GASB Statement No. 68, “Accounting and Financial Reporting for Pensions”. Basis of Calculations The liability calculations presented in the reports were performed for the purpose of satisfying the requirements of GASB No. 67 and are not applicable for other purposes, such as determining the plans’ funding requirements. The plan’s liability for other purposes may produce significantly different results. The total pension liability, net pension liability, and sensitivity information are based on an actuarial valuation date of June 30, 2017. The total pension liability was rolled-forward from the valuation date to the plan’s fiscal year ending June 30, 2018 using generally accepted actuarial principles. Assumptions There have been no changes in actuarial assumptions since June 30, 2017. Plan Provisions During the 2018 legislative session, House Bill 185 was enacted, which updated the benefit provisions for active members who die in the line of duty. Benefits paid to the spouses of deceased members have been increased from 25% of the member’s final rate of pay to 75% of the member’s average pay. If the member does not have a surviving spouse, benefits paid to surviving dependent children have been increased from 10% of the member’s final pay rate to 50% of average pay for one child, 65% of average pay for two children, or 75% of average pay for three children. The Total Pension liability as of June 30, 2018 is determined using these updated benefit provisions.
Board Meeting- December 17, 2018 - Actuarial Valuations- GRS/ Ms. Karen Roggenkamp
280

Board of Trustees November 19, 2018 Page 2
Discount Rates A single discount rate of 5.25% was used for the non-hazardous KERS system and the SPRS system and a single discount rate of 6.25% was used for the hazardous KERS system, the non-hazardous CERS system and the hazardous CERS system to measure the total pension liability for the fiscal year ending June 30, 2018. These single discount rates are based on the expected rate of return on pension plan investments for each system. Based on the stated assumptions and the projection of cash flows as of each fiscal year ending, the pension plan’s fiduciary net position and future contributions were projected to be sufficient to finance all the future benefit payments of the current plan members. Therefore, the long-term expected rate of return on pension plan investments was applied to all periods of the projected benefit payments to determine the total pension liability for each system. The projection of cash flows used to determine the single discount rate assumes that the State contributes the actuarially determined contribution rate in all future years (determined without regard to enactment of SB 151 in 2018, which is currently being reviewed by the State Supreme Court). 401(h) Subaccount Based on guidance issued by GASB in connection with GASB Statement No. 74, the 1% of pay member contributions for Tier 2 and Tier 3 members to a 401(h) subaccount is considered as an OPEB asset. As a result, the reported fiduciary net positions as of June 30, 2017 and later are net of the 401(h) asset balance. Additional Disclosures The reports are based upon information, furnished to us by the Retirement System, which includes benefit provisions, membership information, and financial data. We did not audit this data and information, but we did apply a number of tests and concluded that it was reasonable and consistent. GRS is not responsible for the accuracy or completeness of the information provided by the Retirement System. Please see the “Actuarial Valuation Report as of June 30, 2017” for additional discussion of the nature of actuarial calculation and more information related to participant data, economic and demographic assumptions, and benefit provisions. These reports should be considered together as a complete report for KRS’s fiscal year ending June 30, 2018. To the best of our knowledge, the reports are complete and accurate and are in accordance with generally recognized actuarial practices and methods. Mr. Newton and Mr. White are Enrolled Actuaries. All three of the undersigned are independent actuaries and consultants and members of the American Academy of Actuaries and meet the Qualification Standards of the American Academy of Actuaries to render the actuarial opinion herein. They are also experienced in performing valuations for large public retirement system. This communication shall not be construed to provide tax advice, legal advice or investment advice. Sincerely, Joseph P. Newton, FSA, EA, MAAA Daniel J. White, FSA, EA, MAAA Janie Shaw, ASA, MAAA Pension Market Leader and Actuary Senior Consultant and Actuary Consultant and Actuary
Board Meeting- December 17, 2018 - Actuarial Valuations- GRS/ Ms. Karen Roggenkamp
281

Kentucky Employees Retirement System GASB No. 67 Accounting Valuation Report As of June 30, 2018
Board Meeting- December 17, 2018 - Actuarial Valuations- GRS/ Ms. Karen Roggenkamp
282

November 19, 2018 Board of Trustees Kentucky Retirement Systems Perimeter Park West 1260 Louisville Road Frankfort, KY 40601
Re: GASB 67 Reporting – Actuarial Information Dear Members of the Board: This report provided herein contains certain information for the Kentucky Employees Retirement System (KERS) in connection with the Governmental Accounting Standards Board (GASB) Statement No. 67, “Financial Reporting for Pension Plans” for the fiscal year ending June 30, 2018. A separate report will provided at a later date with additional accounting information determined in accordance with GASB Statement No. 68, “Accounting and Financial Reporting for Pensions”. The liability calculations presented in this report were performed for the purpose of satisfying the requirements of GASB No. 67 and are not applicable for other purposes, such as determining the plans’ funding requirements. The plan’s liability for other purposes may produce significantly different results. This report may be provided to parties other than the Board of Trustees of the Kentucky Retirement Systems only in its entirety and only with the permission of the Board. The total pension liability, net pension liability, and sensitivity information shown in this report are based on an actuarial valuation date of June 30, 2017. The total pension liability was rolled-forward from the valuation date to the plan’s fiscal year ending June 30, 2018 using generally accepted actuarial principles. GASB 67 requires Kentucky Retirement Systems to disclose a 10-year history of certain information in the Required Supplementary Information within their comprehensive annual financial report. The exhibits provided in this report include the applicable information for historical years that were calculated in accordance with this accounting standard. Information disclosed for years prior to June 30, 2017 were prepared by KRS’s prior actuary. There have been no changes in actuarial assumptions since June 30, 2017. However, during the 2018 legislative session, House Bill 185 was enacted, which updated the benefit provisions for active members who die in the line of duty. Benefits paid to the spouses of deceased members have been increased from 25% of the member’s final rate of pay to 75% of the member’s average pay. If the member does not have a surviving spouse, benefits paid to surviving dependent children have been increased from 10% of the member’s final pay rate to 50% of average pay for one child, 65% of average pay for two children, or 75% of average pay for three children. The Total Pension liability as of June 30, 2018 is determined using these updated benefit provisions. It is our opinion that this procedure is reasonable, appropriate, and complies with applicable requirements under GASB Statement No. 67.
Board Meeting- December 17, 2018 - Actuarial Valuations- GRS/ Ms. Karen Roggenkamp
283

Board of Trustees November 19, 2018 Page 2
This report is based upon information, furnished to us by the Retirement System, which includes benefit provisions, membership information, and financial data. We did not audit this data and information, but we did apply a number of tests and concluded that it was reasonable and consistent. GRS is not responsible for the accuracy or completeness of the information provided by the Retirement System. Please see the “Actuarial Valuation Report as of June 30, 2017” for additional discussion of the nature of actuarial calculation and more information related to participant data, economic and demographic assumptions, and benefit provisions. These two reports should be considered together as a complete report for KRS’s fiscal year ending June 30, 2018. Single discount rates of 5.25% for the non-hazardous and 6.25% for the hazardous system were used to measure the total pension liability for the fiscal year ending June 30, 2018. This single discount rate was based on the expected rate of return on pension plan investments for each system. Based on the stated assumptions and the projection of cash flows as of each fiscal year ending, the pension plan’s fiduciary net position and future contributions were projected to be sufficient to finance all the future benefit payments of the current plan members. Therefore, the long-term expected rate of return on pension plan investments was applied to all periods of the projected benefit payments to determine the total pension liability for each system. The projection of cash flows used to determine the single discount rate assumes that the State contributes the actuarially determined contribution rate in all future years (determined without regard to enactment of SB 151 in 2018, which is currently being reviewed by the State Supreme Court). Based on guidance issued by GASB in connection with GASB Statement No. 74, the 1% of pay member contributions for Tier 2 and Tier 3 members to a 401(h) subaccount is considered as an OPEB asset. As a result, the reported fiduciary net positions as of June 30, 2017 and later are net of the 401(h) asset balance. To the best of our knowledge, this report is complete and accurate and is in accordance with generally recognized actuarial practices and methods. Mr. Newton and Mr. White are Enrolled Actuaries. All three of the undersigned are independent actuaries and consultants and members of the American Academy of Actuaries and meet the Qualification Standards of the American Academy of Actuaries to render the actuarial opinion herein. They are also experienced in performing valuations for large public retirement system. This communication shall not be construed to provide tax advice, legal advice or investment advice. Sincerely, Joseph P. Newton, FSA, EA, MAAA Daniel J. White, FSA, EA, MAAA Pension Market Leader and Actuary Senior Consultant and Actuary Janie Shaw, ASA, MAAA Consultant and Actuary
Board Meeting- December 17, 2018 - Actuarial Valuations- GRS/ Ms. Karen Roggenkamp
284

Table of Contents
Kentucky Employees Retirement System
Page
COVER LETTER
SECTION 1 SUPPORTING EXHIBITS
EXHIBIT 1 — SCHEDULE OF EMPLOYERS’ NET PENSION LIABILITY
EXHIBIT 2 — SCHEDULE OF CHANGES IN EMPLOYERS’ NET PENSION LIABILITY
EXHIBIT 3 — SCHEDULE OF EMPLOYERS’ CONTRIBUTIONS
EXHIBIT 4 — SENSITIVITY OF THE NET PENSION LIABILITY TO CHANGES IN THE DISCOUNT RATE
2
4
6
9
Board Meeting- December 17, 2018 - Actuarial Valuations- GRS/ Ms. Karen Roggenkamp
285

SECTION 1
Board Meeting- December 17, 2018 - Actuarial Valuations- GRS/ Ms. Karen Roggenkamp
286

Kentucky Employees Retirement System 2
EXHIBIT 1a
Schedule of the Employers’ Net Pension Liability – KERS Non-Hazardous Plan ($ in thousands)
Fiscal Year
Ending
June 30,
Total
Pension
Liability
Plan
Fiduciary Net
Position
Employers'
Net Pension
Liability (Asset)
Plan Fiduciary
Net Position as a
Percentage of
the Total
Pension Liability
Covered
Employee
Payroll1
Net Pension
Liability as a
Percentage of
Covered Employee
Payroll
(1) (2) (1) - (2) (2) / (1) (3) [(1) - (2)] / (3)
2018 15,608,221$ 2,004,446$ 13,603,775$ 12.84% 1,509,955$ 900.94%
2017 15,445,206 2,056,870 13,388,336 13.32% 1,602,396 835.52%
2016 13,379,781 1,980,292 11,399,489 14.80% 1,631,025 698.92%
2015 12,359,673 2,327,783 10,031,890 18.83% 1,544,234 649.64%
2014 11,550,110 2,578,291 8,971,819 22.32% 1,577,496 568.74%
Note:1 Based on derived compensation using the provided employer contribution information for fiscal years 2017 and later.
Board Meeting- December 17, 2018 - Actuarial Valuations- GRS/ Ms. Karen Roggenkamp
287

Kentucky Employees Retirement System 3
EXHIBIT 1b
Schedule of the Employers’ Net Pension Liability – KERS Hazardous Plan ($ in thousands)
Fiscal Year
Ending
June 30,
Total
Pension
Liability
Plan
Fiduciary Net
Position
Employers'
Net Pension
Liability (Asset)
Plan Fiduciary
Net Position as a
Percentage of
the Total
Pension Liability
Covered
Employee
Payroll1
Net Pension
Liability as a
Percentage of
Covered Employee
Payroll
(1) (2) (1) - (2) (2) / (1) (3) [(1) - (2)] / (3)
2018 1,150,610$ 645,485$ 505,125$ 56.10% 152,936$ 330.29%
2017 1,098,630 601,529 497,101 54.75% 178,511 278.47%
2016 919,517 527,879 391,638 57.41% 158,828 246.58%
2015 895,433 552,468 342,965 61.70% 128,680 266.53%
2014 816,850 561,484 255,366 68.74% 129,076 197.84%
Note:1 Based on derived compensation using the provided employer contribution information for fiscal years 2017 and later.
Board Meeting- December 17, 2018 - Actuarial Valuations- GRS/ Ms. Karen Roggenkamp
288

Kentucky Employees Retirement System 4
EXHIBIT 2a
Schedule of the Employers’ Net Pension Liability – KERS Non-Hazardous Plan ($ in thousands)
Change in the Net Pension Liability 2018 2017 2016 2015 2014
Total pension liabilityService Cost 195,681$ 143,858$ 139,631$ 143,847$ 133,361$
Interest 785,123 870,725 891,897 859,509 853,653
Benefit Changes 9,624 0 0 0 0
Difference between actual and expected experience 153,565 (134,379) 0 30,958 0
Assumption Changes 0 2,145,530 923,999 694,592 0
Benefit Payments (980,978) (960,309) (935,419) (919,343) (903,564)
Net Change in Total Pension Liability 163,015$ 2,065,425$ 1,020,108$ 809,563$ 83,450$
Total Pension Liability - Beginning 15,445,206$ 13,379,781$ 12,359,673$ 11,550,110$ 11,466,660$ Total Pension Liability - Ending (a) 15,608,221$ 15,445,206$ 13,379,781$ 12,359,673$ 11,550,110$
Plan Fiduciary Net Position
Contributions - Employer 689,143$ 757,121$ 513,084$ 521,691$ 296,836$
Contributions - Member2104,972 100,543 106,495 104,606 97,487
Refunds of contributions to members (13,603) (11,819) (12,130) (13,552) (13,627)
Retirement benefits (967,375) (948,490) (923,288) (905,791) (889,937)
Net Investment Income2144,881 220,985 (20,663) 44,570 337,923
Administrative Expense (10,692) (10,957) (10,989) (10,474) (11,145)
Other 301 4 (30,805) 0 8,442 0
Net Change in Plan Fiduciary Net Position (52,373)$ 76,578$ (347,491)$ (250,508)$ (182,463)$
Plan Fiduciary Net Position - Beginning 2,056,870$ 1,980,292$ 2,327,783$ 2,578,291$ 2,760,754$
Prior Year Adjustment (51) - - - -
Plan Fiduciary Net Position - Ending1 (b) 2,004,446$ 2,056,870$ 1,980,292$ 2,327,783$ 2,578,291$
Net Pension Liability - Ending (a) - (b) 13,603,775$ 13,388,336$ 11,399,489$ 10,031,890$ 8,971,819$ Plan Fiduciary Net Position as a Percentage 12.84% 13.32% 14.80% 18.83% 22.32%
Covered Employee Payroll31,509,955$ 1,602,396$ 1,631,025$ 1,544,234$ 1,577,496$
Net Pension Liability as a Percentage of
Covered Employee Payroll 900.94% 835.52% 698.92% 649.64% 568.74%
Notes:1 Does not include 401(h) assets for fiscal years 2017 and later2 Does not include 401(h) contributions and investment income on 401(h) contributions for fiscal years 2017 and later3 Based on derived compensation using the provided employer contribution information for fiscal years 2017 and later4 Northern Trust Settlement
Board Meeting- December 17, 2018 - Actuarial Valuations- GRS/ Ms. Karen Roggenkamp
289

Kentucky Employees Retirement System 5
EXHIBIT 2b
Schedule of the Employers’ Net Pension Liability – KERS Hazardous Plan ($ in thousands)
Change in the Net Pension Liability 2018 2017 2016 2015 2014
Total pension liability
Service Cost 28,641$ 21,081$ 20,751$ 18,729$ 16,880$
Interest 66,536 66,589 64,851 61,005 59,594
Benefit Changes 705 0 0 0 0
Difference between actual and expected experience 24,215 26,902 0 6,067 0
Assumption Changes 0 127,878 0 52,165 0
Benefit Payments (68,117) (63,338) (61,518) (59,383) (57,151)
Net Change in Total Pension Liability 51,980$ 179,112$ 24,084$ 78,583$ 19,323$
Total Pension Liability - Beginning 1,098,630$ 919,517$ 895,433$ 816,850$ 797,527$ Total Pension Liability - Ending (a) 1,150,610$ 1,098,630$ 919,517$ 895,433$ 816,850$
Plan Fiduciary Net Position1
Contributions - Employer 43,661$ 52,974$ 23,759$ 28,536$ 11,670$
Contributions - Member217,891 17,524 15,739 13,207 12,546
Refunds of contributions to members (2,501) (2,106) (2,211) (2,610) (2,830)
Retirement benefits (65,616) (61,231) (59,306) (56,773) (54,320)
Net Investment Income251,467 70,994 (1,653) 8,701 80,724
Administrative Expense (975) (919) (916) (844) (897)
Other 33 4 (3,586) 0 767 0
Net Change in Plan Fiduciary Net Position 43,960$ 73,650$ (24,588)$ (9,016)$ 46,893$
Plan Fiduciary Net Position - Beginning 601,529$ 527,879$ 552,468$ 561,484$ 514,591$
Prior Year Adjustment (4) - - - - Plan Fiduciary Net Position - Ending (b) 645,485$ 601,529$ 527,879$ 552,468$ 561,484$
Net Pension Liability - Ending (a) - (b) 505,125$ 497,101$ 391,638$ 342,965$ 255,366$ Plan Fiduciary Net Position as a Percentage 56.10% 54.75% 57.41% 61.70% 68.74%
Covered Employee Payroll3152,936$ 178,511$ 158,828$ 128,680$ 129,076$
Net Pension Liability as a Percentage of
Covered Employee Payroll 330.29% 278.47% 246.58% 266.53% 197.84%
Notes:1 Does not include 401(h) assets for fiscal years 2017 and later2 Does not include 401(h) contributions and investment income on 401(h) contributions for fiscal years 2017 and later3 Based on derived compensation using the provided employer contribution information for fiscal years 2017 and later4 Northern Trust Settlement
Board Meeting- December 17, 2018 - Actuarial Valuations- GRS/ Ms. Karen Roggenkamp
290

Kentucky Employees Retirement System 6
EXHIBIT 3a
Schedule of Employers’ Contributions – KERS Non-Hazardous Plan ($ in thousands)
Fiscal
Year
Ending
Actuarially
Determined
Contribution1Total Employer
Contributions
Contribution
Deficiency
(Excess)
Covered
Employee
Payroll2
Actual
Contributions
as a Percentage
of Covered
Payroll
2018 633,879$ 689,143$ (55,264)$ 1,509,955$ 45.64%
2017 623,813 757,121 (133,308) 1,602,396 47.25%
2016 512,670 513,084 (414) 1,631,025 31.46%
2015 520,948 521,691 (743) 1,544,234 33.78%
2014 520,765 296,836 223,929 1,577,496 18.82%
2013 485,396 280,874 204,522 1,644,409 17.08%
2012 441,094 214,786 226,308 1,644,897 13.06%
2011 381,915 193,754 188,161 1,731,633 11.19%
2010 348,495 144,051 204,444 1,815,146 7.94%
2009 294,495 112,383 182,112 1,754,413 6.41%
Notes:1 Actuarially determined contribution rate for fiscal year ending 2018 is based on the
contribution rate calculated with the the June 30, 2016 actuarial valuation.
2 Based on derived compensation using the provided employer contribution information for
fiscal years 2017 and later
Board Meeting- December 17, 2018 - Actuarial Valuations- GRS/ Ms. Karen Roggenkamp
291

Kentucky Employees Retirement System 7
EXHIBIT 3b
Schedule of Employers’ Contributions – KERS Hazardous Plan ($ in thousands)
Fiscal
Year
Ending
Actuarially
Determined
Contribution1Total Employer
Contributions
Contribution
Deficiency
(Excess)
Covered
Employee
Payroll2
Actual
Contributions
as a Percentage
of Covered
Payroll
2018 31,321$ 43,661$ (12,340)$ 152,936$ 28.55%
2017 37,630 52,974 (15,344) 178,511 29.68%
2016 23,690 23,759 (69) 158,828 14.96%
2015 28,374 28,536 (162) 128,680 22.18%
2014 13,570 11,670 1,900 129,076 9.04%
2013 21,502 27,334 (5,832) 131,015 20.86%
2012 20,265 20,809 (544) 131,977 15.77%
2011 20,605 19,141 1,464 133,054 14.39%
2010 17,815 17,658 157 143,558 12.30%
2009 15,708 15,843 (135) 146,044 10.85%
Notes:1 Actuarially determined contribution rate for fiscal year ending 2018 is based on the
contribution rate calculated with the the June 30, 2016 actuarial valuation.
2 Based on derived compensation using the provided employer contribution information for
fiscal years 2017 and later
Board Meeting- December 17, 2018 - Actuarial Valuations- GRS/ Ms. Karen Roggenkamp
292

Kentucky Employees Retirement System 8
Notes to Schedule of Employers’ Contributions for FY 2018
The actuarially determined contribution rates effective for fiscal year ending 2018 that are documented in the schedule on the previous pages are calculated as of June 30, 2016. Based on the June 30, 2016 actuarial valuation report (produced by the prior actuary), the actuarial methods and assumptions used to calculate these contribution rates are below:
Item
KERS Non-Hazardous
KERS Hazardous
Determined by the Actuarial Valuation as of:
June 30, 2016
June 30, 2016
Actuarial Cost Method: Entry Age Normal Entry Age Normal
Asset Valuation Method: 20% of the difference between the market value of assets and the expected actuarial value of assets is recognized
20% of the difference between the market value of assets and the expected actuarial value of assets is recognized
Amortization Method: Level Percent of Pay Level Percent of Pay
Amortization Period: 27 Years, Closed 27 Years, Closed
Investment Return: 6.75% 7.50%
Inflation: 3.25% 3.25%
Salary Increases: 4.00%, average 4.00%, average
Mortality: RP-2000 Combined Mortality Table, projected to 2013 with Scale BB (set back 1 year for females)
RP-2000 Combined Mortality Table, projected to 2013 with Scale BB (set back 1 year for females)
Board Meeting- December 17, 2018 - Actuarial Valuations- GRS/ Ms. Karen Roggenkamp
293

Kentucky Employees Retirement System 9
EXHIBIT 4
Sensitivity of the Net Pension Liability to Changes in the Discount Rate ($ in thousands)
Table 1. Sensitivity of the Net Pension Liability to Changes in the Discount Rate for KERS (Non-Hazardous)
1.00%
Decrease
(4.25%)
Current
Discount Rate
(5.25%)
1.00%
Increase
(6.25%)
15,497,813$ 13,603,775$ 12,026,279$
Table 2. Sensitivity of the Net Pension Liability to Changes in the Discount Rate for KERS (Hazardous)
1.00%
Decrease
(5.25%)
Current
Discount Rate
(6.25%)
1.00%
Increase
(7.25%)
646,326$ 505,125$ 387,876$
Board Meeting- December 17, 2018 - Actuarial Valuations- GRS/ Ms. Karen Roggenkamp
294

Kentucky County Employees Retirement System GASB No. 67 Accounting Valuation Report As of June 30, 2018
Board Meeting- December 17, 2018 - Actuarial Valuations- GRS/ Ms. Karen Roggenkamp
295

November 19, 2018 Board of Trustees Kentucky Retirement Systems Perimeter Park West 1260 Louisville Road Frankfort, KY 40601
Re: GASB 67 Reporting – Actuarial Information Dear Members of the Board: This report provided herein contains certain information for the County Employees Retirement System (CERS) in connection with the Governmental Accounting Standards Board (GASB) Statement No. 67, “Financial Reporting for Pension Plans” for the fiscal year ending June 30, 2018. A separate report will provided at a later date with additional accounting information determined in accordance with GASB Statement No. 68, “Accounting and Financial Reporting for Pensions”. The liability calculations presented in this report were performed for the purpose of satisfying the requirements of GASB No. 67 and are not applicable for other purposes, such as determining the plans’ funding requirements. The plan’s liability for other purposes may produce significantly different results. This report may be provided to parties other than the Board of Trustees of the Kentucky Retirement Systems only in its entirety and only with the permission of the Board. The total pension liability, net pension liability, and sensitivity information shown in this report are based on an actuarial valuation date of June 30, 2017. The total pension liability was rolled-forward from the valuation date to the plan’s fiscal year ending June 30, 2018 using generally accepted actuarial principles. GASB 67 requires Kentucky Retirement Systems to disclose a 10-year history of certain information in the Required Supplementary Information within their comprehensive annual financial report. The exhibits provided in this report include the applicable information for historical years that were calculated in accordance with this accounting standard. Information disclosed for years prior to June 30, 2017 were prepared by KRS’s prior actuary. There have been no changes in actuarial assumptions since June 30, 2017. However, during the 2018 legislative session, House Bill 185 was enacted, which updated the benefit provisions for active members who die in the line of duty. Benefits paid to the spouses of deceased members have been increased from 25% of the member’s final rate of pay to 75% of the member’s average pay. If the member does not have a surviving spouse, benefits paid to surviving dependent children have been increased from 10% of the member’s final pay rate to 50% of average pay for one child, 65% of average pay for two children, or 75% of average pay for three children. The Total Pension liability as of June 30, 2018 is determined using these updated benefit provisions. It is our opinion that this procedure is reasonable, appropriate, and complies with applicable requirements under GASB Statement No. 67.
Board Meeting- December 17, 2018 - Actuarial Valuations- GRS/ Ms. Karen Roggenkamp
296

Board of Trustees November 19, 2018 Page 2
This report is based upon information, furnished to us by the Retirement System, which includes benefit provisions, membership information, and financial data. We did not audit this data and information, but we did apply a number of tests and concluded that it was reasonable and consistent. GRS is not responsible for the accuracy or completeness of the information provided by the Retirement System. Please see the “Actuarial Valuation Report as of June 30, 2017” for additional discussion of the nature of actuarial calculation and more information related to participant data, economic and demographic assumptions, and benefit provisions. These two reports should be considered together as a complete report for KRS’s fiscal year ending June 30, 2018. A single discount rate of 6.25% was used to measure the total pension liability for the fiscal year ending June 30, 2018. This single discount rate was based on the expected rate of return on pension plan investments for each system. Based on the stated assumptions and the projection of cash flows as of each fiscal year ending, the pension plan’s fiduciary net position and future contributions were projected to be sufficient to finance all the future benefit payments of the current plan members. Therefore, the long-term expected rate of return on pension plan investments was applied to all periods of the projected benefit payments to determine the total pension liability for each system. The projection of cash flows used to determine the single discount rate assumes that the State contributes the actuarially determined contribution rate in all future years (determined without regard to enactment of SB 151 in 2018, which is currently being reviewed by the State Supreme Court). Based on guidance issued by GASB in connection with GASB Statement No. 74, the 1% of pay member contributions for Tier 2 and Tier 3 members to a 401(h) subaccount is considered as an OPEB asset. As a result, the reported fiduciary net positions as of June 30, 2017 and later are net of the 401(h) asset balance. To the best of our knowledge, this report is complete and accurate and is in accordance with generally recognized actuarial practices and methods. Mr. Newton and Mr. White are Enrolled Actuaries. All three of the undersigned are independent actuaries and consultants and members of the American Academy of Actuaries and meet the Qualification Standards of the American Academy of Actuaries to render the actuarial opinion herein. They are also experienced in performing valuations for large public retirement system. This communication shall not be construed to provide tax advice, legal advice or investment advice. Sincerely, Joseph P. Newton, FSA, EA, MAAA Daniel J. White, FSA, EA, MAAA Pension Market Leader and Actuary Senior Consultant and Actuary Janie Shaw, ASA, MAAA Consultant and Actuary
Board Meeting- December 17, 2018 - Actuarial Valuations- GRS/ Ms. Karen Roggenkamp
297

Table of Contents
Kentucky County Employees Retirement System
Page
COVER LETTER
SECTION 1 SUPPORTING EXHIBITS
EXHIBIT 1 — SCHEDULE OF EMPLOYERS’ NET PENSION LIABILITY
EXHIBIT 2 — SCHEDULE OF CHANGES IN EMPLOYERS’ NET PENSION LIABILITY
EXHIBIT 3 — SCHEDULE OF EMPLOYERS’ CONTRIBUTIONS
EXHIBIT 4 — SENSITIVITY OF THE NET PENSION LIABILITY TO CHANGES IN THE DISCOUNT RATE
2
4
6
9
Board Meeting- December 17, 2018 - Actuarial Valuations- GRS/ Ms. Karen Roggenkamp
298

SECTION 1
Board Meeting- December 17, 2018 - Actuarial Valuations- GRS/ Ms. Karen Roggenkamp
299
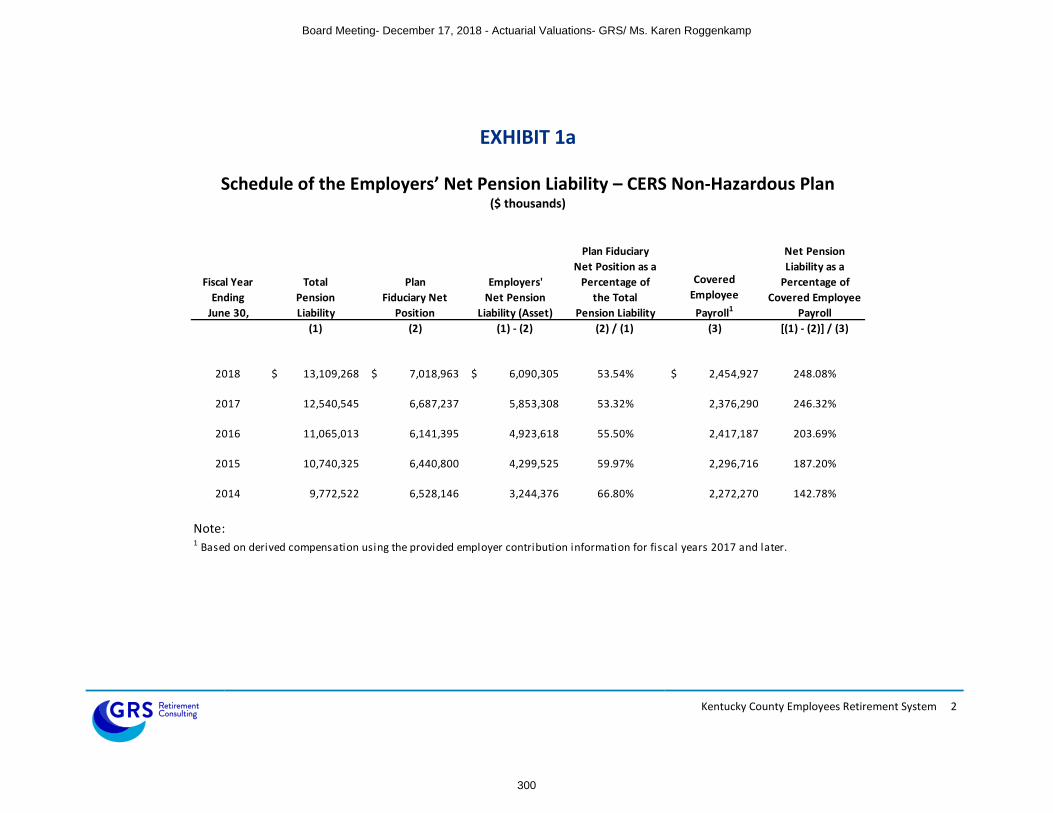
Kentucky County Employees Retirement System 2
EXHIBIT 1a
Schedule of the Employers’ Net Pension Liability – CERS Non-Hazardous Plan ($ thousands)
Fiscal Year
Ending
June 30,
Total
Pension
Liability
Plan
Fiduciary Net
Position
Employers'
Net Pension
Liability (Asset)
Plan Fiduciary
Net Position as a
Percentage of
the Total
Pension Liability
Covered
Employee
Payroll1
Net Pension
Liability as a
Percentage of
Covered Employee
Payroll
(1) (2) (1) - (2) (2) / (1) (3) [(1) - (2)] / (3)
2018 13,109,268$ 7,018,963$ 6,090,305$ 53.54% 2,454,927$ 248.08%
2017 12,540,545 6,687,237 5,853,308 53.32% 2,376,290 246.32%
2016 11,065,013 6,141,395 4,923,618 55.50% 2,417,187 203.69%
2015 10,740,325 6,440,800 4,299,525 59.97% 2,296,716 187.20%
2014 9,772,522 6,528,146 3,244,376 66.80% 2,272,270 142.78%
Note:1 Based on derived compensation using the provided employer contribution information for fiscal years 2017 and later.
Board Meeting- December 17, 2018 - Actuarial Valuations- GRS/ Ms. Karen Roggenkamp
300

Kentucky County Employees Retirement System 3
EXHIBIT 1b
Schedule of the Employers’ Net Pension Liability – CERS Hazardous Plan ($ thousands)
Fiscal Year
Ending
June 30,
Total
Pension
Liability
Plan
Fiduciary Net
Position
Employers'
Net Pension
Liability (Asset)
Plan Fiduciary
Net Position as a
Percentage of
the Total
Pension Liability
Covered
Employee
Payroll1
Net Pension
Liability as a
Percentage of
Covered Employee
Payroll
(1) (2) (1) - (2) (2) / (1) (3) [(1) - (2)] / (3)
2018 4,766,794$ 2,348,337$ 2,418,457$ 49.26% 562,853$ 429.68%
2017 4,455,275 2,217,996 2,237,279 49.78% 526,559 424.89%
2016 3,726,115 2,010,174 1,715,941 53.95% 526,334 326.02%
2015 3,613,308 2,078,202 1,535,106 57.52% 483,641 317.41%
2014 3,288,826 2,087,002 1,201,824 63.46% 479,164 250.82%
Note:1 Based on derived compensation using the provided employer contribution information for fiscal years 2017 and later.
Board Meeting- December 17, 2018 - Actuarial Valuations- GRS/ Ms. Karen Roggenkamp
301

Kentucky County Employees Retirement System 4
EXHIBIT 2a
Schedule of the Employers’ Net Pension Liability – CERS Non-Hazardous Plan ($ thousands)
Change in the Net Pension Liability 2018 2017 2016 2015 2014
Total pension liability
Service Cost 254,169$ 193,082$ 209,101$ 207,400$ 192,482$
Interest 760,622 803,555 780,587 733,002 710,526
Benefit Changes 15,708 0 0 0 0
Difference between actual and expected experience 279,401 (208,015) 0 49,966 0
Assumption Changes 0 1,388,800 0 606,293 0
Benefit Payments (741,177) (701,891) (665,000) (628,858) (597,136)
Net Change in Total Pension Liability 568,723$ 1,475,532$ 324,687$ 967,803$ 305,872$
Total Pension Liability - Beginning 12,540,545$ 11,065,013$ 10,740,325$ 9,772,522$ 9,466,650$ Total Pension Liability - Ending (a) 13,109,268$ 12,540,545$ 11,065,013$ 10,740,325$ 9,772,522$
Plan Fiduciary Net Position1
Contributions - Employer 358,017$ 333,554$ 284,105$ 298,565$ 324,231$
Contributions - Member2160,370 150,715 141,674 140,311 128,568
Refunds of contributions to members (14,608) (14,430) (13,753) (13,523) (14,286)
Retirement benefits (726,569) (687,461) (651,246) (615,335) (582,850)
Net Investment Income2573,829 825,900 (40,800) 110,568 895,530
Administrative Expense (19,592) (19,609) (19,385) (18,212) (18,615)
Other 361 4 (42,827) 0 10,280 0
Net Change in Plan Fiduciary Net Position 331,808$ 545,843$ (299,405)$ (87,346)$ 732,578$
Plan Fiduciary Net Position - Beginning 6,687,237$ 6,141,395$ 6,440,800$ 6,528,146$ 5,795,568$
Prior Year Adjustment (82) - - - - Plan Fiduciary Net Position - Ending (b) 7,018,963$ 6,687,237$ 6,141,395$ 6,440,800$ 6,528,146$
Net Pension Liability - Ending (a) - (b) 6,090,305$ 5,853,308$ 4,923,618$ 4,299,525$ 3,244,376$ Plan Fiduciary Net Position as a Percentage 53.54% 53.32% 55.50% 59.97% 66.80%
Covered Employee Payroll32,454,927$ 2,376,290$ 2,417,187$ 2,296,716$ 2,272,270$
Net Pension Liability as a Percentage of
Covered Employee Payroll 248.08% 246.32% 203.69% 187.20% 142.78%
Notes:1 Does not include 401(h) assets for fiscal years 2017 and later2 Does not include 401(h) contributions and investment income on 401(h) contributions for fiscal years 2017 and later3 Based on derived compensation using the provided employer contribution information for fiscal years 2017 and later4 Northern Trust Settlement
Board Meeting- December 17, 2018 - Actuarial Valuations- GRS/ Ms. Karen Roggenkamp
302

Kentucky County Employees Retirement System 5
EXHIBIT 2b
Schedule of the Employers’ Net Pension Liability – CERS Hazardous Plan ($ thousands)
Change in the Net Pension Liability 2018 2017 2016 2015 2014
Total pension liability
Service Cost 81,103$ 58,343$ 66,249$ 71,934$ 66,761$
Interest 270,694 270,860 262,886 247,008 238,665
Benefit Changes 2,172 0 0 0 0
Difference between actual and expected experience 205,882 92,588 0 41,935 0
Assumption Changes 0 536,667 0 166,849 0
Benefit Payments (248,332) (229,299) (216,327) (203,244) (192,299)
Net Change in Total Pension Liability 311,519$ 729,159$ 112,807$ 324,482$ 113,127$
Total Pension Liability - Beginning 4,455,275$ 3,726,115$ 3,613,308$ 3,288,826$ 3,175,699$ Total Pension Liability - Ending (a) 4,766,794$ 4,455,275$ 3,726,115$ 3,613,308$ 3,288,826$
Plan Fiduciary Net Position1
Contributions - Employer 127,660$ 115,947$ 105,713$ 108,071$ 115,240$
Contributions - Member261,089 60,101 52,972 47,692 43,722
Refunds of contributions to members (4,214) (2,315) (2,879) (3,111) (2,664)
Retirement benefits (244,118) (226,984) (213,448) (200,134) (189,635)
Net Investment Income2191,324 270,473 (9,020) 37,104 288,490
Administrative Expense (1,504) (1,421) (1,366) (1,288) (1,721)
Other 111 4 (7,979) 0 2,865 0
Net Change in Plan Fiduciary Net Position 130,348$ 207,822$ (68,028)$ (8,801)$ 253,432$
Plan Fiduciary Net Position - Beginning 2,217,996$ 2,010,174$ 2,078,202$ 2,087,002$ 1,833,570$
Prior Year Adjustment (7) - - - - Plan Fiduciary Net Position - Ending (b) 2,348,337$ 2,217,996$ 2,010,174$ 2,078,202$ 2,087,002$
Net Pension Liability - Ending (a) - (b) 2,418,457$ 2,237,279$ 1,715,941$ 1,535,106$ 1,201,824$ Plan Fiduciary Net Position as a Percentage 49.26% 49.78% 53.95% 57.52% 63.46%
Covered Employee Payroll3562,853$ 526,559$ 526,334$ 483,641$ 479,164$
Net Pension Liability as a Percentage of
Covered Employee Payroll 429.68% 424.89% 326.02% 317.41% 250.82%
Notes:1 Does not include 401(h) assets for fiscal years 2017 and later2 Does not include 401(h) contributions and investment income on 401(h) contributions for fiscal years 2017 and later3 Based on derived compensation using the provided employer contribution information for fiscal years 2017 and later4 Northern Trust Settlement
Board Meeting- December 17, 2018 - Actuarial Valuations- GRS/ Ms. Karen Roggenkamp
303

Kentucky County Employees Retirement System 6
EXHIBIT 3a
Schedule of Employers’ Contributions – CERS Non-Hazardous Plan ($ thousands)
Fiscal
Year
Ending
Actuarially
Determined
Contribution1Total Employer
Contributions
Contribution
Deficiency
(Excess)
Covered
Employee
Payroll2
Actual
Contributions
as a Percentage
of Covered
Payroll
2018 355,473$ 358,017$ (2,544)$ 2,454,927$ 14.58%
2017 331,492 333,554 (2,062) 2,376,290 14.04%
2016 282,767 284,106 (1,339) 2,417,187 11.75%
2015 297,715 298,566 (851) 2,296,716 13.00%
2014 324,231 324,231 0 2,272,270 14.27%
2013 294,914 294,914 0 2,236,277 13.19%
2012 261,764 275,736 (13,972) 2,236,546 12.33%
2011 218,985 248,519 (29,534) 2,276,596 10.92%
2010 186,724 207,076 (20,352) 2,236,855 9.26%
2009 161,097 179,285 (18,188) 2,183,612 8.21%
Notes:1 Actuarially determined contribution rate for fiscal year ending 2018 is based on the
contribution rate calculated with the the June 30, 2016 actuarial valuation.
2 Based on derived compensation using the provided employer contribution information for
fiscal years 2017 and later
Board Meeting- December 17, 2018 - Actuarial Valuations- GRS/ Ms. Karen Roggenkamp
304
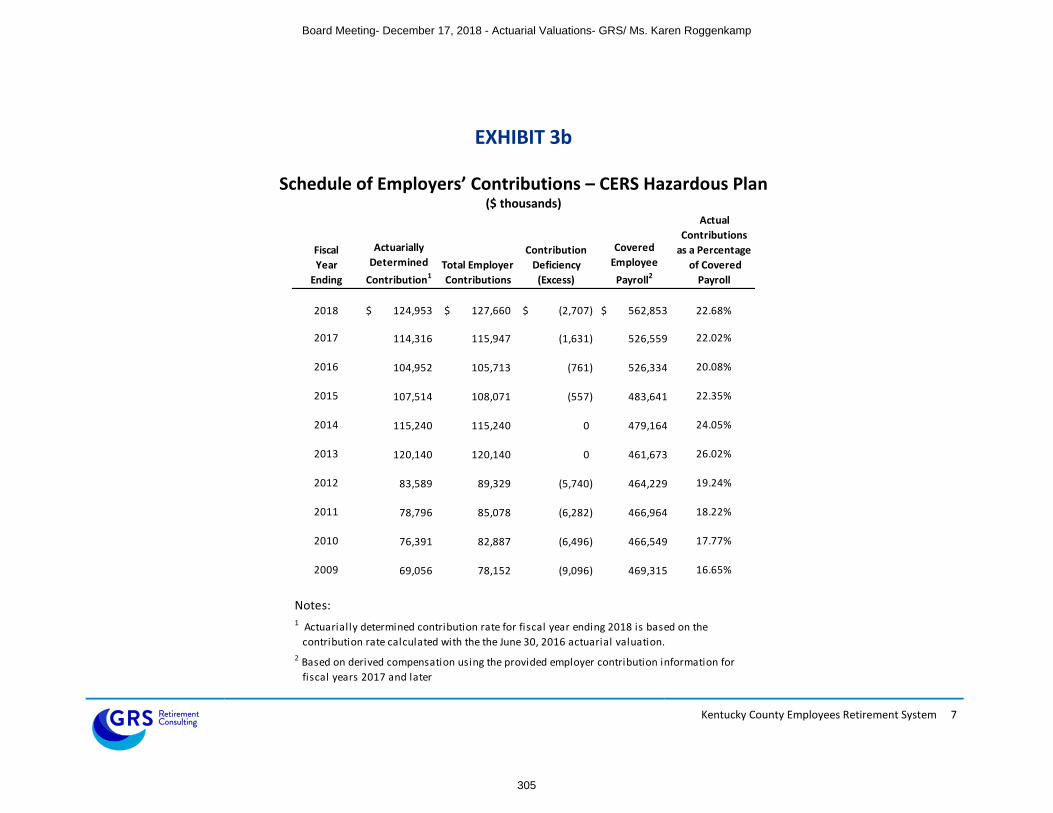
Kentucky County Employees Retirement System 7
EXHIBIT 3b
Schedule of Employers’ Contributions – CERS Hazardous Plan ($ thousands)
Fiscal
Year
Ending
Actuarially
Determined
Contribution1Total Employer
Contributions
Contribution
Deficiency
(Excess)
Covered
Employee
Payroll2
Actual
Contributions
as a Percentage
of Covered
Payroll
2018 124,953$ 127,660$ (2,707)$ 562,853$ 22.68%
2017 114,316 115,947 (1,631) 526,559 22.02%
2016 104,952 105,713 (761) 526,334 20.08%
2015 107,514 108,071 (557) 483,641 22.35%
2014 115,240 115,240 0 479,164 24.05%
2013 120,140 120,140 0 461,673 26.02%
2012 83,589 89,329 (5,740) 464,229 19.24%
2011 78,796 85,078 (6,282) 466,964 18.22%
2010 76,391 82,887 (6,496) 466,549 17.77%
2009 69,056 78,152 (9,096) 469,315 16.65%
Notes:1 Actuarially determined contribution rate for fiscal year ending 2018 is based on the
contribution rate calculated with the the June 30, 2016 actuarial valuation.
2 Based on derived compensation using the provided employer contribution information for
fiscal years 2017 and later
Board Meeting- December 17, 2018 - Actuarial Valuations- GRS/ Ms. Karen Roggenkamp
305

Kentucky County Employees Retirement System 8
Notes to Schedule of Employers’ Contributions for FY 2018
The actuarially determined contribution rates effective for fiscal year ending 2018 that are documented in the schedule on the previous pages are calculated as of June 30, 2016. Based on the June 30, 2016 actuarial valuation report (produced by the prior actuary), the actuarial methods and assumptions used to calculate these contribution rates are below:
Item
CERS Non-Hazardous
CERS Hazardous
Determined by the Actuarial Valuation as of:
June 30, 2016
June 30, 2016
Actuarial Cost Method: Entry Age Normal Entry Age Normal
Asset Valuation Method: 20% of the difference between the market value of assets and the expected actuarial value of assets is recognized
20% of the difference between the market value of assets and the expected actuarial value of assets is recognized
Amortization Method: Level Percent of Pay Level Percent of Pay
Amortization Period: 27 Years, Closed 27 Years, Closed
Investment Return: 7.50% 7.50%
Inflation: 3.25% 3.25%
Salary Increases: 4.00%, average 4.00%, average
Mortality: RP-2000 Combined Mortality Table, projected to 2013 with Scale BB (set back 1 year for females)
RP-2000 Combined Mortality Table, projected to 2013 with Scale BB (set back 1 year for females)
Board Meeting- December 17, 2018 - Actuarial Valuations- GRS/ Ms. Karen Roggenkamp
306

Kentucky County Employees Retirement System 9
EXHIBIT 4
Sensitivity of the Net Pension Liability to Changes in the Discount Rate ($ thousands)
Table 1. Sensitivity of the Net Pension Liability to Changes in the Discount Rate for CERS (Non-Hazardous)
1.00%
Decrease
(5.25%)
Current
Discount Rate
(6.25%)
1.00%
Increase
(7.25%)
7,667,063$ 6,090,305$ 4,769,258$
Table 2. Sensitivity of the Net Pension Liability to Changes in the Discount Rate for CERS (Hazardous)
1.00%
Decrease
(5.25%)
Current
Discount Rate
(6.25%)
1.00%
Increase
(7.25%)
3,030,168$ 2,418,457$ 1,912,763$
Board Meeting- December 17, 2018 - Actuarial Valuations- GRS/ Ms. Karen Roggenkamp
307
Kentucky State Police Retirement System GASB No. 67 Accounting Valuation Report As of June 30, 2018
Board Meeting- December 17, 2018 - Actuarial Valuations- GRS/ Ms. Karen Roggenkamp
308

November 19, 2018 Board of Trustees Kentucky Retirement Systems Perimeter Park West 1260 Louisville Road Frankfort, KY 40601
Re: GASB 67 Reporting – Actuarial Information Dear Members of the Board: This report provided herein contains certain information for the State Police Retirement System (SPRS) in connection with the Governmental Accounting Standards Board (GASB) Statement No. 67, “Financial Reporting for Pension Plans” for the fiscal year ending June 30, 2018. A separate report will provided at a later date with additional accounting information determined in accordance with GASB Statement No. 68, “Accounting and Financial Reporting for Pensions”. The liability calculations presented in this report were performed for the purpose of satisfying the requirements of GASB No. 67 and are not applicable for other purposes, such as determining the plans’ funding requirements. The plan’s liability for other purposes may produce significantly different results. This report may be provided to parties other than the Board of Trustees of the Kentucky Retirement Systems only in its entirety and only with the permission of the Board. The total pension liability, net pension liability, and sensitivity information shown in this report are based on an actuarial valuation date of June 30, 2017. The total pension liability was rolled-forward from the valuation date to the plan’s fiscal year ending June 30, 2018 using generally accepted actuarial principles. GASB 67 requires Kentucky Retirement Systems to disclose a 10-year history of certain information in the Required Supplementary Information within their comprehensive annual financial report. The exhibits provided in this report include the applicable information for historical years that were calculated in accordance with this accounting standard. Information disclosed for years prior to June 30, 2017 were prepared by KRS’s prior actuary. There have been no changes in actuarial assumptions since June 30, 2017. However, during the 2018 legislative session, House Bill 185 was enacted, which updated the benefit provisions for active members who die in the line of duty. Benefits paid to the spouses of deceased members have been increased from 25% of the member’s final rate of pay to 75% of the member’s average pay. If the member does not have a surviving spouse, benefits paid to surviving dependent children have been increased from 10% of the member’s final pay rate to 50% of average pay for one child, 65% of average pay for two children, or 75% of average pay for three children. The Total Pension liability as of June 30, 2018 is determined using these updated benefit provisions. It is our opinion that this procedure is reasonable, appropriate, and complies with applicable requirements under GASB Statement No. 67.
Board Meeting- December 17, 2018 - Actuarial Valuations- GRS/ Ms. Karen Roggenkamp
309
Board of Trustees November 19, 2018 Page 2
This report is based upon information, furnished to us by the Retirement System, which includes benefit provisions, membership information, and financial data. We did not audit this data and information, but we did apply a number of tests and concluded that it was reasonable and consistent. GRS is not responsible for the accuracy or completeness of the information provided by the Retirement System. Please see the “Actuarial Valuation Report as of June 30, 2017” for additional discussion of the nature of actuarial calculation and more information related to participant data, economic and demographic assumptions, and benefit provisions. These two reports should be considered together as a complete report for KRS’s fiscal year ending June 30, 2018. A single discount rate of 5.25% was used to measure the total pension liability for the fiscal year ending June 30, 2018. This single discount rate was based on the expected rate of return on pension plan investments for each system. Based on the stated assumptions and the projection of cash flows as of each fiscal year ending, the pension plan’s fiduciary net position and future contributions were projected to be sufficient to finance all the future benefit payments of the current plan members. Therefore, the long-term expected rate of return on pension plan investments was applied to all periods of the projected benefit payments to determine the total pension liability for each system. The projection of cash flows used to determine the single discount rate assumes that the State contributes the actuarially determined contribution rate in all future years (determined without regard to enactment of SB 151 in 2018, which is currently being reviewed by the State Supreme Court). Based on guidance issued by GASB in connection with GASB Statement No. 74, the 1% of pay member contributions for Tier 2 and Tier 3 members to a 401(h) subaccount is considered as an OPEB asset. As a result, the reported fiduciary net positions as of June 30, 2017 and later are net of the 401(h) asset balance. To the best of our knowledge, this report is complete and accurate and is in accordance with generally recognized actuarial practices and methods. Mr. Newton and Mr. White are Enrolled Actuaries. All three of the undersigned are independent actuaries and consultants and members of the American Academy of Actuaries and meet the Qualification Standards of the American Academy of Actuaries to render the actuarial opinion herein. They are also experienced in performing valuations for large public retirement system. This communication shall not be construed to provide tax advice, legal advice or investment advice. Sincerely, Joseph P. Newton, FSA, EA, MAAA Daniel J. White, FSA, EA, MAAA Pension Market Leader and Actuary Senior Consultant and Actuary Janie Shaw, ASA, MAAA Consultant and Actuary
Board Meeting- December 17, 2018 - Actuarial Valuations- GRS/ Ms. Karen Roggenkamp
310

Table of Contents
Kentucky State Police Retirement System
Page
COVER LETTER
SECTION 1 SUPPORTING EXHIBITS
EXHIBIT 1 — SCHEDULE OF EMPLOYERS’ NET PENSION LIABILITY
EXHIBIT 2 — SCHEDULE OF CHANGES IN EMPLOYERS’ NET PENSION LIABILITY
EXHIBIT 3 — SCHEDULE OF EMPLOYERS’ CONTRIBUTIONS
EXHIBIT 4 — SENSITIVITY OF THE NET PENSION LIABILITY TO CHANGES IN THE DISCOUNT RATE
2
3
4
6
Board Meeting- December 17, 2018 - Actuarial Valuations- GRS/ Ms. Karen Roggenkamp
311

SECTION 1
Board Meeting- December 17, 2018 - Actuarial Valuations- GRS/ Ms. Karen Roggenkamp
312

Kentucky State Police Retirement System 2
EXHIBIT 1
Schedule of the Employers’ Net Pension Liability – SPRS ($ thousands)
Fiscal Year
Ending
June 30,
Total
Pension
Liability
Plan
Fiduciary Net
Position
Employers'
Net Pension
Liability (Asset)
Plan Fiduciary
Net Position as a
Percentage of
the Total
Pension Liability
Covered
Employee
Payroll1
Net Pension
Liability as a
Percentage of
Covered Employee
Payroll
(1) (2) (1) - (2) (2) / (1) (3) [(1) - (2)] / (3)
2018 969,622$ 267,572$ 702,050$ 27.60% 50,346$ 1,394.45%
2017 943,271 255,737 687,534 27.11% 54,065 1,271.68%
2016 795,421 218,012 577,409 27.41% 46,685 1,236.82%
2015 734,156 247,228 486,928 33.68% 45,765 1,063.97%
2014 681,118 260,974 420,144 38.32% 44,616 941.69%
Note:1 Based on derived compensation using the provided employer contribution information for fiscal years 2017 and later.
Board Meeting- December 17, 2018 - Actuarial Valuations- GRS/ Ms. Karen Roggenkamp
313

Kentucky State Police Retirement System 3
EXHIBIT 2
Schedule of the Employers’ Net Pension Liability – SPRS ($ thousands)
Change in the Net Pension Liability 2018 2017 2016 2015 2014
Total pension liability
Service Cost 11,890$ 8,297$ 8,402$ 7,695$ 7,142$
Interest 47,978 51,769 52,951 50,661 50,391
Benefit Changes 184 0 0 0 0
Difference between actual and expected experience 25,126 8,143 0 9,331 0
Assumption Changes 0 136,602 56,191 40,201 0
Benefit Payments (58,827) (56,960) (56,279) (54,850) (53,239)
Net Change in Total Pension Liability 26,351$ 147,850$ 61,265$ 53,038$ 4,294$
Total Pension Liability - Beginning 943,271$ 795,421$ 734,156$ 681,118$ 676,824$ Total Pension Liability - Ending (a) 969,622$ 943,271$ 795,421$ 734,156$ 681,118$
Plan Fiduciary Net Position1
Contributions - Employer 46,877$ 63,239$ 25,822$ 31,990$ 20,279$
Contributions - Member25,522 5,348 5,263 5,244 5,075
Refunds of contributions to members (22) (26) (11) (85) (213)
Retirement benefits (58,805) (56,934) (56,268) (54,765) (53,026)
Net Investment Income218,437 26,795 (3,843) 3,426 40,374
Administrative Expense (194) (181) (178) (201) (215)
Other 21 4 (517) 0 645 0
Net Change in Plan Fiduciary Net Position 11,836$ 37,724$ (29,215)$ (13,746)$ 12,274$
Plan Fiduciary Net Position - Beginning 255,737$ 218,012$ 247,228$ 260,974$ 248,700$
Prior Year Adjustment (1) - - - - Plan Fiduciary Net Position - Ending (b) 267,572$ 255,737$ 218,012$ 247,228$ 260,974$
Net Pension Liability - Ending (a) - (b) 702,050$ 687,534$ 577,409$ 486,928$ 420,144$ Plan Fiduciary Net Position as a Percentage 27.60% 27.11% 27.41% 33.68% 38.32%
Covered Employee Payroll350,346$ 54,065$ 46,685$ 45,765$ 44,616$
Net Pension Liability as a Percentage of
Covered Employee Payroll 1394.45% 1271.68% 1236.82% 1063.97% 941.69%
Notes:1 Does not include 401(h) assets for fiscal years 2017 and later2 Does not include 401(h) contributions and investment income on 401(h) contributions for fiscal years 2017 and later3 Based on derived compensation using the provided employer contribution information for fiscal years 2017 and later4 Northern Trust Settlement
Board Meeting- December 17, 2018 - Actuarial Valuations- GRS/ Ms. Karen Roggenkamp
314

Kentucky State Police Retirement System 4
EXHIBIT 3
Schedule of Employers’ Contributions – SPRS ($ thousands)
Fiscal
Year
Ending
Actuarially
Determined
Contribution1Total Employer
Contributions
Contribution
Deficiency
(Excess)
Covered
Employee
Payroll2
Actual
Contributions
as a Percentage
of Covered
Payroll
2018 36,033$ 46,877$ (10,844)$ 50,346$ 93.11%
2017 35,937 63,240 (27,303) 54,065 116.97%
2016 25,723 25,822 (99) 46,685 55.31%
2015 31,444 31,990 (546) 45,765 69.90%
2014 25,808 20,279 5,529 44,616 45.45%
2013 23,117 18,501 4,616 45,256 40.88%
2012 20,498 15,362 5,136 48,373 31.76%
2011 18,463 12,657 5,806 48,693 25.99%
2010 18,765 9,489 9,276 51,507 18.42%
2009 15,952 8,186 7,766 51,660 15.85%
Notes:1 Actuarially determined contribution rate for fiscal year ending 2018 is based on the
contribution rate calculated with the the June 30, 2016 actuarial valuation.
2 Based on derived compensation using the provided employer contribution information for
fiscal years 2017 and later
Board Meeting- December 17, 2018 - Actuarial Valuations- GRS/ Ms. Karen Roggenkamp
315

Kentucky State Police Retirement System 5
Notes to Schedule of Employers’ Contributions
The actuarially determined contribution rates effective for fiscal year ending 2018 that are documented in the schedule on the previous pages are calculated as of June 30, 2016. Based on the June 30, 2016 actuarial valuation report (produced by the prior actuary), the actuarial methods and assumptions used to calculate these contribution rates are below:
Item
SPRS
Determined by the Actuarial Valuation as of:
June 30, 2016
Actuarial Cost Method: Entry Age Normal
Asset Valuation Method: 20% of the difference between the market value of assets and the expected actuarial value of assets is recognized
Amortization Method: Level Percent of Pay
Amortization Period: 27 Years, Closed
Investment Return: 6.75%
Inflation: 3.25%
Salary Increases: 4.00%, average
Mortality: RP-2000 Combined Mortality Table, projected to 2013 with Scale BB (set back 1 year for females)
Board Meeting- December 17, 2018 - Actuarial Valuations- GRS/ Ms. Karen Roggenkamp
316

Kentucky State Police Retirement System 6
EXHIBIT 4
Sensitivity of the Net Pension Liability to Changes in the Discount Rate ($ thousands)
1.00%
Decrease
(4.25%)
Current
Discount Rate
(5.25%)
1.00%
Increase
(6.25%)
823,796$ 702,050$ 601,850$
Board Meeting- December 17, 2018 - Actuarial Valuations- GRS/ Ms. Karen Roggenkamp
317

November 19, 2018 Mr. David Eager Interim Executive Director Kentucky Retirement Systems 1260 Louisville Road Frankfort, KY 40601 Re: Documentation regarding the Single Discount Rate used for Certain Actuarial Information
Provided in Accordance with GASB 67 as of June 30, 2018 Dear Mr. Eager: Attached are exhibits that provide documentation to support the use of the long-term investment return assumption for calculating the Total Pension Liability as of June 30, 2018 for purposes of GASB Statement Nos. 67 and 68. Per Paragraph 40 of GASB No. 67, the discount rate is a single rate that reflects the long-term expected rate of return on plan investments, to the extent they are projected to be available to make the projected benefit payments, and a discount rate based on a long-term, high-quality, general obligation municipal bond index to the extent there are benefit payments that will not be provided by projected plan assets. These calculations were performed in accordance with the requirements specified by GASB No. 67 for each pension system maintained by Kentucky Retirement Systems (KRS). The results of these calculations are presented in a two page exhibit for each retirement system; KERS (Non-Hazardous and Hazardous), CERS (Non-Hazardous and Hazardous), and the State Police Retirement System). The future contributions are projected in accordance with the Board’s current funding policy, which includes the requirement that each participating employer in the System contribute the actuarially determined contribution rate (except where noted below), which is determined using a closed funding period (26 years as of June 30, 2017) and the actuarial assumptions and methods adopted be the Board of Trustees. The contribution rates were determined without regard to enactment of SB 151 in 2018, which is currently being reviewed by the State Supreme Court. They do, however, reflect the following contribution rates budgeted for the KERS and SPRS systems in HB 200 for fiscal years ending 2019 and 2020. Plan FYE 2019 FYE 2020 KERS Non-Hazardous 71.03%* 71.03% KERS Hazardous 34.39% 34.39% SPRS 119.05%** 119.05%** * Per HB 285, contribution rates for certain agencies are reduced to 41.06% for FYE 2019 ** Per HB 200, an additional contribution equal to $1,086,200 was budgeted for FYE 2019 and 2020
Board Meeting- December 17, 2018 - Actuarial Valuations- GRS/ Ms. Karen Roggenkamp
318

Mr. David Eager November 19, 2018 Page 2
The contribution rates for the CERS system reflect the phase-in provisions in HB 362 that do not allow the contribution rates to increase by more than 12% each year through fiscal year ending 2028. The contribution rate for fiscal year ending 2019 was assumed to be 16.22% for the CERS Non-Hazardous system and 24.87% for the CERS Hazardous system. As these exhibits show, current assets, future contributions, and investment earnings are projected to be sufficient to pay the projected benefit payments from the retirement system. As a result, the single discount rate for determining the Total Pension Liability KERS Non-Hazardous and the State Police Retirement System will be 5.25% and the discount rate for the KERS Hazardous and CERS (Non-Hazardous and Hazardous) will be 6.25%. These exhibits are not required disclosures in KRS’s financial statements. Rather, we expect this information will be requested by your external auditor as part of their audit process. These projections are performed in accordance with the procedures specified by GASB. Their sole purpose is to document that current assets and future contributions will be sufficient to cover the projected benefits payments from the Plan. These projections have no other meaningful use and should not be used to project or communicate the long-term financial status of the Plan. It is important to note that an important assumption in this demonstration is the participating employers will contribute the full actuarially determined contribution rate over a closed amortization period. If there is a legislative change that results in the participating employers contributing an amount that is less than the actuarially determined contributions then this demonstration may need to be updated to reflect the new funding policy. Certification We certify that the undersigned are members of the American Academy of Actuaries and that we meet all of the Qualification Standards of the American Academy of Actuaries to render the actuarial opinion contained herein. In addition, both of the undersigned are experienced in performing valuations for large public retirement systems. If you have any questions, or require any additional or clarifying information, please do not hesitate to contact either of us. Sincerely, Joseph P. Newton, FSA, EA, MAAA Daniel J. White, FSA, EA, MAAA Pension Market Leader Senior Consultant Janie Shaw, ASA, MAAA Consultant
Board Meeting- December 17, 2018 - Actuarial Valuations- GRS/ Ms. Karen Roggenkamp
319

Kentucky Employees Retirement System (KERS) - Non-Hazardous
GASB - Discount Rate Development as of June 30, 2018 (Year 1 is FYE June 30, 2019)
Kentucky Retirement Systems
Table 1. Projection of the Retirement System's Fiduciary Net Position
Year
Projected
Beginning Plan Net
Position
Projected Total
Contributions1
Projected
Benefit Payments2
Projected
Administrative
Expenses3
Projected
Investment
Earnings at 5.25%
Projected
Ending Plan
Net Position
(1) (2) (3) (4) (5) (6) (7)
1 2,004,445,981$ 978,452,363$ (1,017,862,404)$ (10,275,542)$ 103,945,850$ 2,058,706,248$ 2 2,058,706,248 1,139,447,183 (977,977,665) (9,653,870) 112,016,263 2,322,538,159 3 2,322,538,159 1,147,451,426 (990,709,103) (9,102,038) 125,759,237 2,595,937,681 4 2,595,937,681 1,138,293,167 (1,002,915,971) (8,592,639) 139,572,252 2,862,294,491 5 2,862,294,491 1,126,415,912 (1,015,189,866) (8,104,342) 152,942,780 3,118,358,975 6 3,118,358,975 1,116,652,277 (1,026,111,492) (7,647,980) 165,861,949 3,367,113,728 7 3,367,113,728 1,107,861,171 (1,035,563,022) (7,204,269) 178,460,328 3,610,667,936 8 3,610,667,936 1,099,368,381 (1,043,869,343) (6,776,584) 190,822,671 3,850,213,062 9 3,850,213,062 1,091,005,545 (1,051,378,332) (6,356,223) 202,998,378 4,086,482,429 10 4,086,482,429 1,082,523,067 (1,058,879,435) (5,931,385) 214,999,327 4,319,194,003 11 4,319,194,003 1,074,081,866 (1,065,632,631) (5,509,819) 226,833,858 4,548,967,277 12 4,548,967,277 1,065,842,186 (1,070,550,706) (5,098,592) 238,566,638 4,777,726,803 13 4,777,726,803 1,058,069,236 (1,072,536,897) (4,710,383) 250,333,673 5,008,882,432 14 5,008,882,432 1,050,962,252 (1,072,052,724) (4,354,988) 262,306,928 5,245,743,900 15 5,245,743,900 1,043,953,031 (1,069,957,250) (4,004,332) 274,623,906 5,490,359,255 16 5,490,359,255 1,037,224,645 (1,066,928,482) (3,666,556) 287,379,093 5,744,367,955 17 5,744,367,955 1,030,394,171 (1,062,748,050) (3,322,395) 300,654,795 6,009,346,475 18 6,009,346,475 1,023,919,660 (1,054,536,884) (2,993,977) 314,619,681 6,290,354,955 19 6,290,354,955 1,018,736,010 (1,041,405,445) (2,725,392) 329,585,548 6,594,545,676 20 6,594,545,676 1,014,558,349 (1,024,423,727) (2,501,983) 345,893,157 6,928,071,472 21 6,928,071,472 1,011,014,045 (1,004,656,627) (2,305,469) 363,828,755 7,295,952,177 22 7,295,952,177 1,007,786,410 (983,607,173) (2,119,656) 383,609,146 7,701,620,904 23 7,701,620,904 1,004,681,181 (961,446,082) (1,933,975) 405,405,384 8,148,327,412 24 8,148,327,412 1,001,612,075 (938,762,812) (1,743,820) 429,370,690 8,638,803,545 25 8,638,803,545 998,580,573 (916,191,012) (1,550,817) 455,632,060 9,175,274,349 26 9,175,274,349 18,826,620 (892,748,535) (1,356,969) 459,019,728 8,759,015,193 27 8,759,015,193 15,947,467 (868,702,506) (1,164,332) 437,719,637 8,342,815,459 28 8,342,815,459 13,273,213 (844,091,491) (981,372) 416,442,367 7,927,458,177 29 7,927,458,177 10,770,105 (818,633,320) (807,110) 395,235,488 7,514,023,341 30 7,514,023,341 8,537,814 (792,157,111) (648,689) 374,162,527 7,103,917,881 31 7,103,917,881 6,612,963 (764,257,839) (509,527) 353,308,704 6,699,072,182 32 6,699,072,182 5,009,768 (735,197,012) (390,875) 332,768,923 6,301,262,985 33 6,301,262,985 3,681,364 (705,337,440) (290,020) 312,625,917 5,911,942,806 34 5,911,942,806 2,620,942 (674,876,314) (207,821) 292,950,633 5,532,430,246 35 5,532,430,246 1,829,879 (644,054,216) (145,843) 273,806,062 5,163,866,128 36 5,163,866,128 1,257,048 (613,194,591) (100,536) 255,242,479 4,807,070,528 37 4,807,070,528 850,343 (582,384,713) (68,163) 237,299,423 4,462,767,418 38 4,462,767,418 565,714 (551,622,012) (45,392) 220,013,915 4,131,679,643 39 4,131,679,643 374,663 (521,029,321) (30,088) 203,420,039 3,814,414,936 40 3,814,414,936 247,567 (490,753,097) (19,903) 187,545,197 3,511,434,699 41 3,511,434,699 163,236 (461,007,088) (13,142) 172,407,569 3,222,985,275 42 3,222,985,275 107,302 (431,777,773) (8,654) 158,020,096 2,949,326,247 43 2,949,326,247 70,207 (403,200,148) (5,676) 144,392,680 2,690,583,310 44 2,690,583,310 45,660 (375,480,047) (3,705) 131,526,436 2,446,671,654 45 2,446,671,654 29,376 (348,692,279) (2,395) 119,414,870 2,217,421,226 46 2,217,421,226 18,673 (322,860,666) (1,533) 108,048,374 2,002,626,074 47 2,002,626,074 11,560 (298,028,618) (959) 97,414,962 1,802,023,020 48 1,802,023,020 7,000 (274,237,945) (587) 87,499,711 1,615,291,198 49 1,615,291,198 4,066 (251,503,682) (345) 78,285,361 1,442,076,598 50 1,442,076,598 2,271 (229,834,597) (194) 69,753,090 1,281,997,168 51 1,281,997,168 1,159 (209,239,979) (100) 61,882,587 1,134,640,835 52 1,134,640,835 532 (189,727,096) (46) 54,652,026 999,566,251 53 999,566,251 241 (171,302,859) (21) 48,038,053 876,301,665 54 876,301,665 100 (153,972,848) (9) 42,015,753 764,344,661 55 764,344,661 33 (137,739,903) (3) 36,558,672 663,163,461 56 663,163,461 4 (122,602,868) (0) 31,638,923 572,199,520 57 572,199,520 - (108,556,548) - 27,227,316 490,870,288 58 490,870,288 - (95,590,599) - 23,293,534 418,573,222 59 418,573,222 - (83,688,569) - 19,806,370 354,691,022 60 354,691,022 - (72,826,539) - 16,734,035 298,598,518 61 298,598,518 - (62,973,704) - 14,044,507 249,669,322 62 249,669,322 - (54,092,359) - 11,705,878 207,282,841 63 207,282,841 - (46,139,639) - 9,686,676 170,829,879 64 170,829,879 - (39,067,912) - 7,956,154 139,718,121 65 139,718,121 - (32,825,879) - 6,484,544 113,376,786 66 113,376,786 - (27,359,301) - 5,243,286 91,260,771 67 91,260,771 - (22,611,467) - 4,205,232 72,854,536 68 72,854,536 - (18,524,415) - 3,344,817 57,674,939 69 57,674,939 - (15,039,613) - 2,638,194 45,273,520 70 45,273,520 - (12,098,429) - 2,063,338 35,238,429 71 35,238,429 - (9,642,292) - 1,600,145 27,196,283 72 27,196,283 - (7,613,523) - 1,230,506 20,813,266 73 20,813,266 - (5,956,144) - 938,348 15,795,470 74 15,795,470 - (4,617,074) - 709,614 11,888,010 75 11,888,010 - (3,547,073) - 532,201 8,873,137 76 8,873,137 - (2,701,081) - 395,843 6,567,899 77 6,567,899 - (2,039,004) - 291,975 4,820,871 78 4,820,871 - (1,525,941) - 213,552 3,508,482 79 3,508,482 - (1,132,041) - 154,859 2,531,301 80 2,531,301 - (832,289) - 111,325 1,810,337 81 1,810,337 - (606,255) - 79,332 1,283,414 82 1,283,414 - (437,402) - 56,044 902,056 83 902,056 - (312,555) - 39,258 628,759 84 628,759 - (221,268) - 27,276 434,767 85 434,767 - (155,205) - 18,803 298,365 86 298,365 - (107,931) - 12,867 203,302 87 203,302 - (74,465) - 8,744 137,580 88 137,580 - (51,000) - 5,901 92,482 89 92,482 - (34,695) - 3,956 61,743 90 61,743 - (23,459) - 2,634 40,918 91 40,918 - (15,764) - 1,740 26,893 92 26,893 - (10,532) - 1,139 17,500 93 17,500 - (7,001) - 737 11,237 94 11,237 - (4,626) - 470 7,081 95 7,081 - (3,038) - 293 4,336 96 4,336 - (1,981) - 176 2,531 97 2,531 - (1,291) - 99 1,340 98 1,340 - (846) - 48 542 99 542 - (556) - 14 0
100 0 - - - 0 0
Notes and Assumptions:1 Future employer contributions are assumed to be equal to the projected payroll times the actuarially determined contribution rate (the amortization
cost on the payroll of future active members of the system). Contributions are determined without regard to enactment of SB 151 in 2018, which is currently being reviewed by the State Supreme Court. Future member contributions are equal to 5.00% of payroll.
2 Expected future benefit payments based on the 2017 actuarial valuation, adjusted to reflect HB 185 passed during the 2018 legislative session.3 Assumed to be equal to 0.72% of current payroll.
Board Meeting- December 17, 2018 - Actuarial Valuations- GRS/ Ms. Karen Roggenkamp
320

Kentucky Employees Retirement System (KERS) - Non-Hazardous
GASB - Discount Rate Development as of June 30, 2018 (Year 1 is FYE June 30, 2019)
Kentucky Retirement Systems
Table 2. Actuarial Present Values of Projected Benefit Payments
Year
Projected
Beginning Plan Net
Position1
Projected
Benefit
Payments2
"Funded"
Portion of
Benefit Payments
"Unfunded"
Portion of
Benefit Payments
Present Value
of "Funded"
Benefit Payments
Present Value
of "Unfunded"
Benefit Payments
Present Value of
Benefit Payments
Using the Single
Discount Rate3
(1) (2) (3) (4) (5) (6) (7) (8)
1 2,004,445,981$ 1,017,862,404$ 1,017,862,404$ -$ 992,151,564$ -$ 992,151,564$ 2 2,058,706,248 977,977,665 977,977,665 - 905,723,800 - 905,723,800 3 2,322,538,159 990,709,103 990,709,103 - 871,747,865 - 871,747,865 4 2,595,937,681 1,002,915,971 1,002,915,971 - 838,469,330 - 838,469,330 5 2,862,294,491 1,015,189,866 1,015,189,866 - 806,394,958 - 806,394,958 6 3,118,358,975 1,026,111,492 1,026,111,492 - 774,413,610 - 774,413,610 7 3,367,113,728 1,035,563,022 1,035,563,022 - 742,562,229 - 742,562,229 8 3,610,667,936 1,043,869,343 1,043,869,343 - 711,181,350 - 711,181,350 9 3,850,213,062 1,051,378,332 1,051,378,332 - 680,567,388 - 680,567,388 10 4,086,482,429 1,058,879,435 1,058,879,435 - 651,233,182 - 651,233,182 11 4,319,194,003 1,065,632,631 1,065,632,631 - 622,695,050 - 622,695,050 12 4,548,967,277 1,070,550,706 1,070,550,706 - 594,364,744 - 594,364,744 13 4,777,726,803 1,072,536,897 1,072,536,897 - 565,764,815 - 565,764,815 14 5,008,882,432 1,072,052,724 1,072,052,724 - 537,301,105 - 537,301,105 15 5,245,743,900 1,069,957,250 1,069,957,250 - 509,502,020 - 509,502,020 16 5,490,359,255 1,066,928,482 1,066,928,482 - 482,717,106 - 482,717,106 17 5,744,367,955 1,062,748,050 1,062,748,050 - 456,841,546 - 456,841,546 18 6,009,346,475 1,054,536,884 1,054,536,884 - 430,700,073 - 430,700,073 19 6,290,354,955 1,041,405,445 1,041,405,445 - 404,120,527 - 404,120,527 20 6,594,545,676 1,024,423,727 1,024,423,727 - 377,701,397 - 377,701,397 21 6,928,071,472 1,004,656,627 1,004,656,627 - 351,936,662 - 351,936,662 22 7,295,952,177 983,607,173 983,607,173 - 327,375,700 - 327,375,700 23 7,701,620,904 961,446,082 961,446,082 - 304,037,801 - 304,037,801 24 8,148,327,412 938,762,812 938,762,812 - 282,056,700 - 282,056,700 25 8,638,803,545 916,191,012 916,191,012 - 261,543,822 - 261,543,822 26 9,175,274,349 892,748,535 892,748,535 - 242,139,411 - 242,139,411 27 8,759,015,193 868,702,506 868,702,506 - 223,864,539 - 223,864,539 28 8,342,815,459 844,091,491 844,091,491 - 206,672,003 - 206,672,003 29 7,927,458,177 818,633,320 818,633,320 - 190,440,555 - 190,440,555 30 7,514,023,341 792,157,111 792,157,111 - 175,089,153 - 175,089,153 31 7,103,917,881 764,257,839 764,257,839 - 160,496,555 - 160,496,555 32 6,699,072,182 735,197,012 735,197,012 - 146,692,342 - 146,692,342 33 6,301,262,985 705,337,440 705,337,440 - 133,714,511 - 133,714,511 34 5,911,942,806 674,876,314 674,876,314 - 121,558,039 - 121,558,039 35 5,532,430,246 644,054,216 644,054,216 - 110,219,852 - 110,219,852 36 5,163,866,128 613,194,591 613,194,591 - 99,704,235 - 99,704,235 37 4,807,070,528 582,384,713 582,384,713 - 89,971,125 - 89,971,125 38 4,462,767,418 551,622,012 551,622,012 - 80,967,862 - 80,967,862 39 4,131,679,643 521,029,321 521,029,321 - 72,662,635 - 72,662,635 40 3,814,414,936 490,753,097 490,753,097 - 65,026,431 - 65,026,431 41 3,511,434,699 461,007,088 461,007,088 - 58,037,991 - 58,037,991 42 3,222,985,275 431,777,773 431,777,773 - 51,646,744 - 51,646,744 43 2,949,326,247 403,200,148 403,200,148 - 45,822,760 - 45,822,760 44 2,690,583,310 375,480,047 375,480,047 - 40,543,881 - 40,543,881 45 2,446,671,654 348,692,279 348,692,279 - 35,773,273 - 35,773,273 46 2,217,421,226 322,860,666 322,860,666 - 31,470,916 - 31,470,916 47 2,002,626,074 298,028,618 298,028,618 - 27,601,336 - 27,601,336 48 1,802,023,020 274,237,945 274,237,945 - 24,131,126 - 24,131,126 49 1,615,291,198 251,503,682 251,503,682 - 21,026,756 - 21,026,756 50 1,442,076,598 229,834,597 229,834,597 - 18,256,656 - 18,256,656 51 1,281,997,168 209,239,979 209,239,979 - 15,791,682 - 15,791,682 52 1,134,640,835 189,727,096 189,727,096 - 13,604,763 - 13,604,763 53 999,566,251 171,302,859 171,302,859 - 11,670,894 - 11,670,894 54 876,301,665 153,972,848 153,972,848 - 9,966,933 - 9,966,933 55 764,344,661 137,739,903 137,739,903 - 8,471,398 - 8,471,398 56 663,163,461 122,602,868 122,602,868 - 7,164,301 - 7,164,301 57 572,199,520 108,556,548 108,556,548 - 6,027,082 - 6,027,082 58 490,870,288 95,590,599 95,590,599 - 5,042,480 - 5,042,480 59 418,573,222 83,688,569 83,688,569 - 4,194,431 - 4,194,431 60 354,691,022 72,826,539 72,826,539 - 3,467,963 - 3,467,963 61 298,598,518 62,973,704 62,973,704 - 2,849,193 - 2,849,193 62 249,669,322 54,092,359 54,092,359 - 2,325,287 - 2,325,287 63 207,282,841 46,139,639 46,139,639 - 1,884,485 - 1,884,485 64 170,829,879 39,067,912 39,067,912 - 1,516,061 - 1,516,061 65 139,718,121 32,825,879 32,825,879 - 1,210,293 - 1,210,293 66 113,376,786 27,359,301 27,359,301 - 958,423 - 958,423 67 91,260,771 22,611,467 22,611,467 - 752,591 - 752,591 68 72,854,536 18,524,415 18,524,415 - 585,804 - 585,804 69 57,674,939 15,039,613 15,039,613 - 451,879 - 451,879 70 45,273,520 12,098,429 12,098,429 - 345,376 - 345,376 71 35,238,429 9,642,292 9,642,292 - 261,530 - 261,530 72 27,196,283 7,613,523 7,613,523 - 196,203 - 196,203 73 20,813,266 5,956,144 5,956,144 - 145,835 - 145,835 74 15,795,470 4,617,074 4,617,074 - 107,409 - 107,409 75 11,888,010 3,547,073 3,547,073 - 78,401 - 78,401 76 8,873,137 2,701,081 2,701,081 - 56,724 - 56,724 77 6,567,899 2,039,004 2,039,004 - 40,684 - 40,684 78 4,820,871 1,525,941 1,525,941 - 28,928 - 28,928 79 3,508,482 1,132,041 1,132,041 - 20,390 - 20,390 80 2,531,301 832,289 832,289 - 14,244 - 14,244 81 1,810,337 606,255 606,255 - 9,858 - 9,858 82 1,283,414 437,402 437,402 - 6,757 - 6,757 83 902,056 312,555 312,555 - 4,588 - 4,588 84 628,759 221,268 221,268 - 3,086 - 3,086 85 434,767 155,205 155,205 - 2,057 - 2,057 86 298,365 107,931 107,931 - 1,359 - 1,359 87 203,302 74,465 74,465 - 891 - 891 88 137,580 51,000 51,000 - 580 - 580 89 92,482 34,695 34,695 - 375 - 375 90 61,743 23,459 23,459 - 241 - 241 91 40,918 15,764 15,764 - 154 - 154 92 26,893 10,532 10,532 - 98 - 98 93 17,500 7,001 7,001 - 62 - 62 94 11,237 4,626 4,626 - 39 - 39 95 7,081 3,038 3,038 - 24 - 24 96 4,336 1,981 1,981 - 15 - 15 97 2,531 1,291 1,291 - 9 - 9 98 1,340 846 846 - 6 - 6 99 542 556 556 - 4 - 4
100 0 - - - - - - Total 17,055,896,898$ -$ 17,055,896,898$
Notes and Assumptions:1 Table 1. Column (2).2 Table 1. Column (4).3 The single discount rate that produces a total actuarial present value that equals the sum of the present values in columns (6) and (7).
Board Meeting- December 17, 2018 - Actuarial Valuations- GRS/ Ms. Karen Roggenkamp
321

Kentucky Employees Retirement System (KERS) - Hazardous
GASB - Discount Rate Development as of June 30, 2018 (Year 1 is FYE June 30, 2019)
Kentucky Retirement Systems
Table 1. Projection of the Retirement System's Fiduciary Net Position
Year
Projected
Beginning Plan Net
Position
Projected Total
Contributions1
Projected
Benefit Payments2
Projected
Administrative
Expenses3
Projected
Investment
Earnings at 6.25%
Projected
Ending Plan
Net Position
(1) (2) (3) (4) (5) (6) (7)
1 645,484,989$ 63,765,460$ (72,140,912)$ (857,427)$ 40,058,657$ 676,310,767$ 2 676,310,767 65,442,219 (69,123,389) (816,031) 42,131,015 713,944,582 3 713,944,582 64,458,712 (71,464,421) (781,560) 44,381,872 750,539,185 4 750,539,185 63,072,975 (73,826,058) (745,743) 46,554,807 785,595,166 5 785,595,166 61,005,142 (76,424,246) (712,199) 48,603,234 818,067,097 6 818,067,097 59,582,257 (78,735,240) (680,627) 50,518,786 848,752,274 7 848,752,274 58,665,605 (81,109,342) (656,094) 52,336,087 877,988,530 8 877,988,530 57,301,662 (83,943,110) (618,652) 54,035,315 904,763,746 9 904,763,746 55,969,079 (87,008,169) (582,739) 55,574,528 928,716,444 10 928,716,444 54,433,161 (90,076,415) (541,284) 56,931,148 949,463,054 11 949,463,054 52,973,100 (92,638,853) (502,707) 58,105,200 967,399,793 12 967,399,793 51,894,447 (94,303,325) (473,728) 59,142,714 983,659,901 13 983,659,901 51,097,583 (95,270,779) (451,626) 60,105,352 999,140,430 14 999,140,430 50,439,497 (95,766,575) (433,127) 61,037,942 1,014,418,167 15 1,014,418,167 49,982,066 (95,925,491) (420,520) 61,974,220 1,030,028,441 16 1,030,028,441 49,577,986 (96,032,217) (408,619) 62,934,508 1,046,100,099 17 1,046,100,099 49,107,072 (96,557,044) (394,293) 63,908,781 1,062,164,615 18 1,062,164,615 48,427,511 (97,310,294) (372,068) 64,869,401 1,077,779,166 19 1,077,779,166 47,808,788 (98,257,907) (351,986) 65,797,723 1,092,775,784 20 1,092,775,784 46,997,503 (99,777,382) (325,461) 66,664,095 1,106,334,539 21 1,106,334,539 46,044,416 (101,570,400) (293,362) 67,427,990 1,117,943,183 22 1,117,943,183 45,005,510 (103,468,592) (256,000) 68,064,286 1,127,288,387 23 1,127,288,387 43,832,541 (105,486,140) (208,811) 68,551,622 1,133,977,599 24 1,133,977,599 42,472,784 (107,556,118) (150,659) 68,865,932 1,137,609,538 25 1,137,609,538 41,082,512 (108,660,889) (89,491) 69,018,022 1,138,959,692 26 1,138,959,692 1,199,291 (108,298,597) (53,068) 67,887,216 1,099,694,535 27 1,099,694,535 700,890 (107,041,019) (31,122) 65,457,183 1,058,780,467 28 1,058,780,467 396,198 (105,271,072) (17,656) 62,945,564 1,016,833,502 29 1,016,833,502 217,913 (103,204,441) (9,760) 60,382,238 974,219,453 30 974,219,453 109,619 (100,941,750) (4,924) 57,785,313 931,167,711 31 931,167,711 53,685 (98,536,233) (2,424) 55,166,968 887,849,708 32 887,849,708 26,175 (95,873,643) (1,188) 52,540,729 844,541,780 33 844,541,780 12,319 (92,961,623) (564) 49,923,199 801,515,111 34 801,515,111 5,405 (89,859,804) (249) 47,329,291 758,989,754 35 758,989,754 2,254 (86,554,705) (104) 44,773,083 717,210,282 36 717,210,282 806 (83,155,840) (37) 42,266,429 676,321,639 37 676,321,639 190 (79,748,771) (9) 39,815,727 636,388,777 38 636,388,777 32 (76,348,704) (1) 37,424,560 597,464,664 39 597,464,664 - (72,962,406) - 35,096,021 559,598,279 40 559,598,279 - (69,593,954) - 32,833,041 522,837,366 41 522,837,366 - (66,248,101) - 30,638,457 487,227,721 42 487,227,721 - (62,932,010) - 28,514,911 452,810,623 43 452,810,623 - (59,652,993) - 26,464,759 419,622,390 44 419,622,390 - (56,417,537) - 24,490,070 387,694,923 45 387,694,923 - (53,231,649) - 22,592,654 357,055,928 46 357,055,928 - (50,101,137) - 20,774,063 327,728,854 47 327,728,854 - (47,031,243) - 19,035,601 299,733,211 48 299,733,211 - (44,026,738) - 17,378,341 273,084,815 49 273,084,815 - (41,092,227) - 15,803,130 247,795,718 50 247,795,718 - (38,232,048) - 14,310,587 223,874,257 51 223,874,257 - (35,450,167) - 12,901,112 201,325,203 52 201,325,203 - (32,749,912) - 11,574,901 180,150,191 53 180,150,191 - (30,134,330) - 10,331,961 160,347,821 54 160,347,821 - (27,606,524) - 9,172,109 141,913,406 55 141,913,406 - (25,170,033) - 8,094,945 124,838,318 56 124,838,318 - (22,828,895) - 7,099,803 109,109,226 57 109,109,226 - (20,587,851) - 6,185,707 94,707,081 58 94,707,081 - (18,451,777) - 5,351,313 81,606,617 59 81,606,617 - (16,425,831) - 4,594,886 69,775,672 60 69,775,672 - (14,515,477) - 3,914,245 59,174,441 61 59,174,441 - (12,726,046) - 3,306,741 49,755,135 62 49,755,135 - (11,062,470) - 2,769,233 41,461,898 63 41,461,898 - (9,528,922) - 2,298,103 34,231,078 64 34,231,078 - (8,128,181) - 1,889,286 27,992,183 65 27,992,183 - (6,861,756) - 1,538,331 22,668,759 66 22,668,759 - (5,729,918) - 1,240,451 18,179,292 67 18,179,292 - (4,731,020) - 990,602 14,438,874 68 14,438,874 - (3,861,445) - 783,588 11,361,017 69 11,361,017 - (3,115,470) - 614,181 8,859,727 70 8,859,727 - (2,485,121) - 477,250 6,851,856 71 6,851,856 - (1,960,600) - 367,901 5,259,156 72 5,259,156 - (1,530,851) - 281,583 4,009,888 73 4,009,888 - (1,184,024) - 214,178 3,040,043 74 3,040,043 - (908,127) - 162,054 2,293,970 75 2,293,970 - (691,649) - 122,087 1,724,407 76 1,724,407 - (523,784) - 91,655 1,292,278 77 1,292,278 - (394,891) - 68,614 966,002 78 966,002 - (296,710) - 51,243 720,535 79 720,535 - (222,372) - 38,190 536,353 80 536,353 - (166,333) - 28,403 398,423 81 398,423 - (124,202) - 21,079 295,299 82 295,299 - (92,587) - 15,607 218,319 83 218,319 - (68,895) - 11,525 160,949 84 160,949 - (51,171) - 8,484 118,263 85 118,263 - (37,926) - 6,224 86,561 86 86,561 - (28,042) - 4,547 63,066 87 63,066 - (20,665) - 3,306 45,707 88 45,707 - (15,165) - 2,390 32,933 89 32,933 - (11,076) - 1,717 23,574 90 23,574 - (8,053) - 1,226 16,747 91 16,747 - (5,832) - 867 11,782 92 11,782 - (4,205) - 607 8,184 93 8,184 - (3,014) - 419 5,589 94 5,589 - (2,146) - 283 3,726 95 3,726 - (1,519) - 186 2,393 96 2,393 - (1,060) - 117 1,450 97 1,450 - (730) - 68 789 98 789 - (498) - 34 325 99 325 - (335) - 10 (0)
100 (0) - - - (0) (0)
Notes and Assumptions:1 Future employer contributions are assumed to be equal to the projected payroll times the actuarially determined contribution rate (the amortization
cost on the payroll of future active members of the system). Contributions are determined without regard to enactment of SB 151 in 2018, which is currently being reviewed by the State Supreme Court. Future member contributions are equal to 8.00% of payroll.
2 Expected future benefit payments based on the 2017 actuarial valuation, adjusted to reflect HB 185 passed during the 2018 legislative session.3 Assumed to be equal to 0.57% of current payroll.
Board Meeting- December 17, 2018 - Actuarial Valuations- GRS/ Ms. Karen Roggenkamp
322

Kentucky Employees Retirement System (KERS) - Hazardous
GASB - Discount Rate Development as of June 30, 2018 (Year 1 is FYE June 30, 2019)
Kentucky Retirement Systems
Table 2. Actuarial Present Values of Projected Benefit Payments
Year
Projected
Beginning Plan Net
Position1
Projected
Benefit
Payments2
"Funded"
Portion of
Benefit Payments
"Unfunded"
Portion of
Benefit Payments
Present Value
of "Funded"
Benefit Payments
Present Value
of "Unfunded"
Benefit Payments
Present Value of
Benefit Payments
Using the Single
Discount Rate3
(1) (2) (3) (4) (5) (6) (7) (8)
1 645,484,989$ 72,140,912$ 72,140,912$ -$ 69,986,965$ -$ 69,986,965$ 2 676,310,767 69,123,389 69,123,389 - 63,114,859 - 63,114,859 3 713,944,582 71,464,421 71,464,421 - 61,414,021 - 61,414,021 4 750,539,185 73,826,058 73,826,058 - 59,711,556 - 59,711,556 5 785,595,166 76,424,246 76,424,246 - 58,176,948 - 58,176,948 6 818,067,097 78,735,240 78,735,240 - 56,410,505 - 56,410,505 7 848,752,274 81,109,342 81,109,342 - 54,693,130 - 54,693,130 8 877,988,530 83,943,110 83,943,110 - 53,274,332 - 53,274,332 9 904,763,746 87,008,169 87,008,169 - 51,971,356 - 51,971,356 10 928,716,444 90,076,415 90,076,415 - 50,639,123 - 50,639,123 11 949,463,054 92,638,853 92,638,853 - 49,016,163 - 49,016,163 12 967,399,793 94,303,325 94,303,325 - 46,961,743 - 46,961,743 13 983,659,901 95,270,779 95,270,779 - 44,652,727 - 44,652,727 14 999,140,430 95,766,575 95,766,575 - 42,244,803 - 42,244,803 15 1,014,418,167 95,925,491 95,925,491 - 39,825,792 - 39,825,792 16 1,030,028,441 96,032,217 96,032,217 - 37,524,802 - 37,524,802 17 1,046,100,099 96,557,044 96,557,044 - 35,510,474 - 35,510,474 18 1,062,164,615 97,310,294 97,310,294 - 33,682,348 - 33,682,348 19 1,077,779,166 98,257,907 98,257,907 - 32,009,740 - 32,009,740 20 1,092,775,784 99,777,382 99,777,382 - 30,592,699 - 30,592,699 21 1,106,334,539 101,570,400 101,570,400 - 29,310,547 - 29,310,547 22 1,117,943,183 103,468,592 103,468,592 - 28,101,944 - 28,101,944 23 1,127,288,387 105,486,140 105,486,140 - 26,964,619 - 26,964,619 24 1,133,977,599 107,556,118 107,556,118 - 25,876,472 - 25,876,472 25 1,137,609,538 108,660,889 108,660,889 - 24,604,484 - 24,604,484 26 1,138,959,692 108,298,597 108,298,597 - 23,079,951 - 23,079,951 27 1,099,694,535 107,041,019 107,041,019 - 21,470,065 - 21,470,065 28 1,058,780,467 105,271,072 105,271,072 - 19,872,991 - 19,872,991 29 1,016,833,502 103,204,441 103,204,441 - 18,336,804 - 18,336,804 30 974,219,453 100,941,750 100,941,750 - 16,879,794 - 16,879,794 31 931,167,711 98,536,233 98,536,233 - 15,508,269 - 15,508,269 32 887,849,708 95,873,643 95,873,643 - 14,201,613 - 14,201,613 33 844,541,780 92,961,623 92,961,623 - 12,960,244 - 12,960,244 34 801,515,111 89,859,804 89,859,804 - 11,790,875 - 11,790,875 35 758,989,754 86,554,705 86,554,705 - 10,689,128 - 10,689,128 36 717,210,282 83,155,840 83,155,840 - 9,665,302 - 9,665,302 37 676,321,639 79,748,771 79,748,771 - 8,724,042 - 8,724,042 38 636,388,777 76,348,704 76,348,704 - 7,860,795 - 7,860,795 39 597,464,664 72,962,406 72,962,406 - 7,070,254 - 7,070,254 40 559,598,279 69,593,954 69,593,954 - 6,347,145 - 6,347,145 41 522,837,366 66,248,101 66,248,101 - 5,686,583 - 5,686,583 42 487,227,721 62,932,010 62,932,010 - 5,084,177 - 5,084,177 43 452,810,623 59,652,993 59,652,993 - 4,535,784 - 4,535,784 44 419,622,390 56,417,537 56,417,537 - 4,037,433 - 4,037,433 45 387,694,923 53,231,649 53,231,649 - 3,585,355 - 3,585,355 46 357,055,928 50,101,137 50,101,137 - 3,176,003 - 3,176,003 47 327,728,854 47,031,243 47,031,243 - 2,806,020 - 2,806,020 48 299,733,211 44,026,738 44,026,738 - 2,472,247 - 2,472,247 49 273,084,815 41,092,227 41,092,227 - 2,171,732 - 2,171,732 50 247,795,718 38,232,048 38,232,048 - 1,901,714 - 1,901,714 51 223,874,257 35,450,167 35,450,167 - 1,659,613 - 1,659,613 52 201,325,203 32,749,912 32,749,912 - 1,443,012 - 1,443,012 53 180,150,191 30,134,330 30,134,330 - 1,249,661 - 1,249,661 54 160,347,821 27,606,524 27,606,524 - 1,077,491 - 1,077,491 55 141,913,406 25,170,033 25,170,033 - 924,606 - 924,606 56 124,838,318 22,828,895 22,828,895 - 789,276 - 789,276 57 109,109,226 20,587,851 20,587,851 - 669,925 - 669,925 58 94,707,081 18,451,777 18,451,777 - 565,099 - 565,099 59 81,606,617 16,425,831 16,425,831 - 473,461 - 473,461 60 69,775,672 14,515,477 14,515,477 - 393,785 - 393,785 61 59,174,441 12,726,046 12,726,046 - 324,932 - 324,932 62 49,755,135 11,062,470 11,062,470 - 265,841 - 265,841 63 41,461,898 9,528,922 9,528,922 - 215,519 - 215,519 64 34,231,078 8,128,181 8,128,181 - 173,024 - 173,024 65 27,992,183 6,861,756 6,861,756 - 137,473 - 137,473 66 22,668,759 5,729,918 5,729,918 - 108,045 - 108,045 67 18,179,292 4,731,020 4,731,020 - 83,962 - 83,962 68 14,438,874 3,861,445 3,861,445 - 64,498 - 64,498 69 11,361,017 3,115,470 3,115,470 - 48,977 - 48,977 70 8,859,727 2,485,121 2,485,121 - 36,769 - 36,769 71 6,851,856 1,960,600 1,960,600 - 27,302 - 27,302 72 5,259,156 1,530,851 1,530,851 - 20,064 - 20,064 73 4,009,888 1,184,024 1,184,024 - 14,605 - 14,605 74 3,040,043 908,127 908,127 - 10,543 - 10,543 75 2,293,970 691,649 691,649 - 7,558 - 7,558 76 1,724,407 523,784 523,784 - 5,387 - 5,387 77 1,292,278 394,891 394,891 - 3,822 - 3,822 78 966,002 296,710 296,710 - 2,703 - 2,703 79 720,535 222,372 222,372 - 1,907 - 1,907 80 536,353 166,333 166,333 - 1,342 - 1,342 81 398,423 124,202 124,202 - 943 - 943 82 295,299 92,587 92,587 - 662 - 662 83 218,319 68,895 68,895 - 463 - 463 84 160,949 51,171 51,171 - 324 - 324 85 118,263 37,926 37,926 - 226 - 226 86 86,561 28,042 28,042 - 157 - 157 87 63,066 20,665 20,665 - 109 - 109 88 45,707 15,165 15,165 - 75 - 75 89 32,933 11,076 11,076 - 52 - 52 90 23,574 8,053 8,053 - 35 - 35 91 16,747 5,832 5,832 - 24 - 24 92 11,782 4,205 4,205 - 16 - 16 93 8,184 3,014 3,014 - 11 - 11 94 5,589 2,146 2,146 - 7 - 7 95 3,726 1,519 1,519 - 5 - 5 96 2,393 1,060 1,060 - 3 - 3 97 1,450 730 730 - 2 - 2 98 789 498 498 - 1 - 1 99 325 335 335 - 1 - 1
100 (0) - - - - - - Total 1,356,989,788$ -$ 1,356,989,788$
Notes and Assumptions:1 Table 1. Column (2).2 Table 1. Column (4).3 The single discount rate that produces a total actuarial present value that equals the sum of the present values in columns (6) and (7).
Board Meeting- December 17, 2018 - Actuarial Valuations- GRS/ Ms. Karen Roggenkamp
323
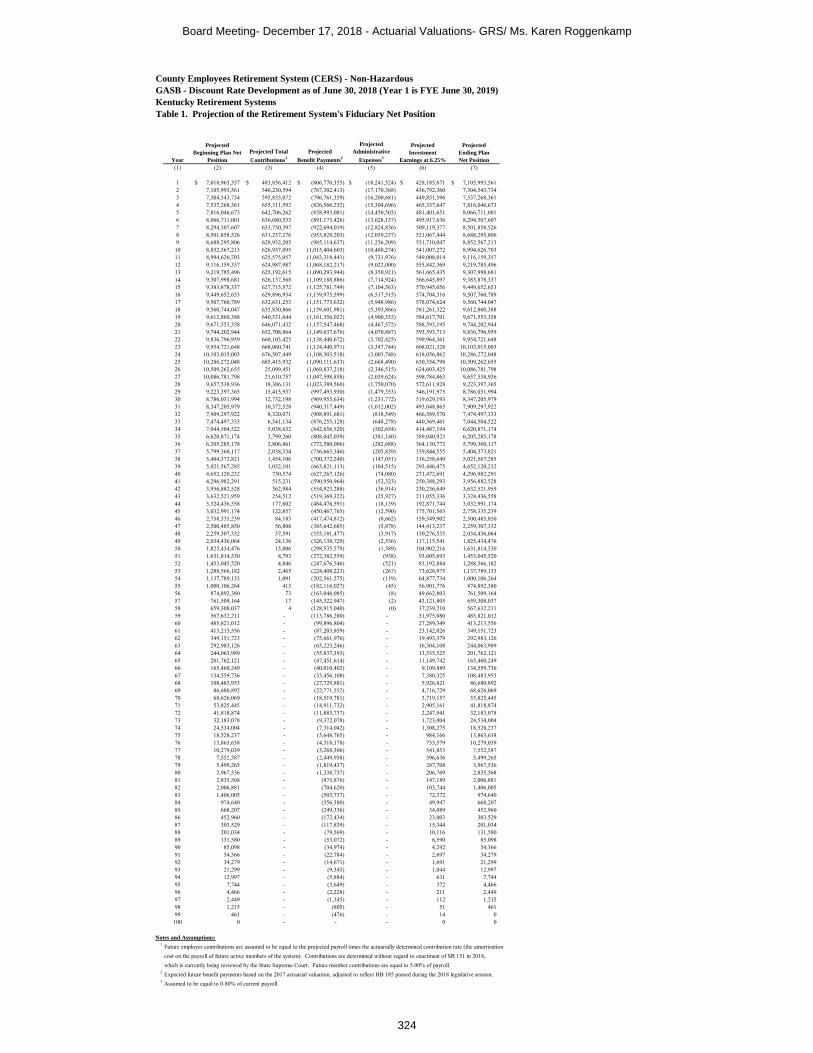
County Employees Retirement System (CERS) - Non-Hazardous
GASB - Discount Rate Development as of June 30, 2018 (Year 1 is FYE June 30, 2019)
Kentucky Retirement Systems
Table 1. Projection of the Retirement System's Fiduciary Net Position
Year
Projected
Beginning Plan Net
Position
Projected Total
Contributions1
Projected
Benefit Payments2
Projected
Administrative
Expenses3
Projected
Investment
Earnings at 6.25%
Projected
Ending Plan
Net Position
(1) (2) (3) (4) (5) (6) (7)
1 7,018,963,357$ 483,856,412$ (806,770,355)$ (18,241,524)$ 428,185,671$ 7,105,993,561$ 2 7,105,993,561 546,230,594 (767,302,413) (17,170,368) 436,792,360 7,304,543,734 3 7,304,543,734 595,835,072 (796,761,359) (16,200,681) 449,851,596 7,537,268,361 4 7,537,268,361 655,311,592 (826,566,232) (15,304,696) 465,337,647 7,816,046,673 5 7,816,046,673 642,706,262 (858,993,081) (14,450,503) 481,401,651 8,066,711,001 6 8,066,711,001 636,680,533 (891,173,426) (13,628,137) 495,917,636 8,294,507,607 7 8,294,507,607 633,750,397 (922,694,019) (12,824,836) 509,119,377 8,501,858,526 8 8,501,858,526 631,237,276 (953,828,203) (12,039,237) 521,067,444 8,688,295,806 9 8,688,295,806 628,932,205 (985,114,637) (11,256,209) 531,710,047 8,852,567,213 10 8,852,567,213 626,937,095 (1,015,404,603) (10,480,274) 541,007,272 8,994,626,703 11 8,994,626,703 625,575,057 (1,043,318,441) (9,731,976) 549,008,014 9,116,159,357 12 9,116,159,357 624,987,987 (1,068,182,217) (9,022,000) 555,842,369 9,219,785,496 13 9,219,785,496 625,192,615 (1,090,293,944) (8,350,921) 561,665,435 9,307,998,681 14 9,307,998,681 626,137,568 (1,109,188,886) (7,714,924) 566,645,897 9,383,878,337 15 9,383,878,337 627,715,572 (1,125,781,749) (7,104,563) 570,945,056 9,449,652,653 16 9,449,652,653 629,896,934 (1,139,975,599) (6,517,515) 574,704,316 9,507,760,789 17 9,507,760,789 632,631,253 (1,151,773,632) (5,948,986) 578,074,624 9,560,744,047 18 9,560,744,047 635,850,866 (1,159,601,981) (5,393,866) 581,261,322 9,612,860,388 19 9,612,860,388 640,331,644 (1,161,356,022) (4,900,352) 584,617,701 9,671,553,358 20 9,671,553,358 646,071,432 (1,157,547,468) (4,467,572) 588,593,195 9,744,202,944 21 9,744,202,944 652,708,864 (1,149,637,676) (4,070,887) 593,593,713 9,836,796,959 22 9,836,796,959 660,103,425 (1,138,440,672) (3,702,425) 599,964,361 9,954,721,648 23 9,954,721,648 668,060,741 (1,124,440,971) (3,347,744) 608,021,328 10,103,015,003 24 10,103,015,003 676,507,449 (1,108,303,518) (3,003,748) 618,056,862 10,286,272,048 25 10,286,272,048 685,415,932 (1,090,111,633) (2,668,490) 630,354,798 10,509,262,655 26 10,509,262,655 25,099,451 (1,069,837,218) (2,346,515) 624,603,425 10,086,781,798 27 10,086,781,798 21,610,757 (1,047,598,858) (2,039,624) 598,784,863 9,657,538,936 28 9,657,538,936 18,386,131 (1,023,389,560) (1,750,070) 572,611,928 9,223,397,365 29 9,223,397,365 15,415,937 (997,493,930) (1,479,353) 546,191,975 8,786,031,994 30 8,786,031,994 12,732,198 (969,955,634) (1,231,772) 519,629,193 8,347,205,979 31 8,347,205,979 10,372,528 (940,317,449) (1,012,002) 493,048,865 7,909,297,922 32 7,909,297,922 8,320,071 (908,891,681) (818,549) 466,589,570 7,474,497,333 33 7,474,497,333 6,541,134 (876,255,128) (648,278) 440,369,461 7,044,504,522 34 7,044,504,522 5,038,632 (842,656,520) (502,654) 414,487,194 6,620,871,174 35 6,620,871,174 3,799,260 (808,045,039) (381,140) 389,040,923 6,205,285,178 36 6,205,285,178 2,806,861 (772,580,006) (282,688) 364,130,772 5,799,360,117 37 5,799,360,117 2,038,334 (736,663,346) (205,839) 339,844,555 5,404,373,821 38 5,404,373,821 1,454,106 (700,372,240) (147,051) 316,258,649 5,021,567,285 39 5,021,567,285 1,032,101 (663,821,113) (104,515) 293,446,475 4,652,120,232 40 4,652,120,232 730,574 (627,267,126) (74,080) 271,472,691 4,296,982,291 41 4,296,982,291 515,231 (590,950,964) (52,323) 250,388,293 3,956,882,528 42 3,956,882,528 362,984 (554,923,288) (36,914) 230,236,649 3,632,521,959 43 3,632,521,959 254,512 (519,369,322) (25,927) 211,055,336 3,324,436,558 44 3,324,436,558 177,602 (484,476,591) (18,139) 192,871,744 3,032,991,174 45 3,032,991,174 122,857 (450,467,765) (12,590) 175,701,563 2,758,335,239 46 2,758,335,239 84,183 (417,474,812) (8,662) 159,549,902 2,500,485,850 47 2,500,485,850 56,808 (385,642,685) (5,878) 144,413,237 2,259,307,332 48 2,259,307,332 37,591 (355,181,477) (3,917) 130,276,535 2,034,436,064 49 2,034,436,064 24,136 (326,138,729) (2,536) 117,115,541 1,825,434,476 50 1,825,434,476 15,006 (298,535,579) (1,589) 104,902,216 1,631,814,530 51 1,631,814,530 8,793 (272,382,559) (938) 93,605,693 1,453,045,520 52 1,453,045,520 4,846 (247,676,546) (521) 83,192,884 1,288,566,182 53 1,288,566,182 2,465 (224,408,223) (267) 73,628,975 1,137,789,133 54 1,137,789,133 1,091 (202,561,575) (119) 64,877,734 1,000,106,264 55 1,000,106,264 413 (182,116,027) (45) 56,901,776 874,892,380 56 874,892,380 73 (163,046,085) (8) 49,662,803 761,509,164 57 761,509,164 17 (145,322,947) (2) 43,121,805 659,308,037 58 659,308,037 4 (128,915,040) (0) 37,239,210 567,632,211 59 567,632,211 - (113,786,280) - 31,975,080 485,821,012 60 485,821,012 - (99,896,804) - 27,289,349 413,213,556 61 413,213,556 - (87,203,859) - 23,142,026 349,151,723 62 349,151,723 - (75,661,976) - 19,493,379 292,983,126 63 292,983,126 - (65,223,246) - 16,304,108 244,063,989 64 244,063,989 - (55,837,393) - 13,535,525 201,762,121 65 201,762,121 - (47,451,614) - 11,149,742 165,460,249 66 165,460,249 - (40,010,402) - 9,109,889 134,559,736 67 134,559,736 - (33,456,108) - 7,380,325 108,483,953 68 108,483,953 - (27,729,881) - 5,926,821 86,680,892 69 86,680,892 - (22,771,552) - 4,716,729 68,626,069 70 68,626,069 - (18,519,781) - 3,719,157 53,825,445 71 53,825,445 - (14,911,732) - 2,905,161 41,818,874 72 41,818,874 - (11,883,737) - 2,247,941 32,183,078 73 32,183,078 - (9,372,078) - 1,723,004 24,534,004 74 24,534,004 - (7,314,042) - 1,308,275 18,528,237 75 18,528,237 - (5,648,765) - 984,166 13,863,638 76 13,863,638 - (4,318,178) - 733,579 10,279,039 77 10,279,039 - (3,268,306) - 541,853 7,552,587 78 7,552,587 - (2,449,958) - 396,636 5,499,265 79 5,499,265 - (1,819,437) - 287,708 3,967,536 80 3,967,536 - (1,338,737) - 206,769 2,835,568 81 2,835,568 - (975,876) - 147,189 2,006,881 82 2,006,881 - (704,620) - 103,744 1,406,005 83 1,406,005 - (503,737) - 72,372 974,640 84 974,640 - (356,380) - 49,947 668,207 85 668,207 - (249,336) - 34,089 452,960 86 452,960 - (172,434) - 23,003 303,529 87 303,529 - (117,839) - 15,344 201,034 88 201,034 - (79,569) - 10,116 131,580 89 131,580 - (53,072) - 6,590 85,098 90 85,098 - (34,974) - 4,242 54,366 91 54,366 - (22,784) - 2,697 34,279 92 34,279 - (14,671) - 1,691 21,299 93 21,299 - (9,345) - 1,044 12,997 94 12,997 - (5,884) - 631 7,744 95 7,744 - (3,649) - 372 4,466 96 4,466 - (2,228) - 211 2,449 97 2,449 - (1,345) - 112 1,215 98 1,215 - (805) - 51 461 99 461 - (476) - 14 0
100 0 - - - 0 0
Notes and Assumptions:1 Future employer contributions are assumed to be equal to the projected payroll times the actuarially determined contribution rate (the amortization
cost on the payroll of future active members of the system). Contributions are determined without regard to enactment of SB 151 in 2018, which is currently being reviewed by the State Supreme Court. Future member contributions are equal to 5.00% of payroll.
2 Expected future benefit payments based on the 2017 actuarial valuation, adjusted to reflect HB 185 passed during the 2018 legislative session.3 Assumed to be equal to 0.80% of current payroll.
Board Meeting- December 17, 2018 - Actuarial Valuations- GRS/ Ms. Karen Roggenkamp
324

County Employees Retirement System (CERS) - Non-Hazardous
GASB - Discount Rate Development as of June 30, 2018 (Year 1 is FYE June 30, 2019)
Kentucky Retirement Systems
Table 2. Actuarial Present Values of Projected Benefit Payments
Year
Projected
Beginning Plan Net
Position1
Projected
Benefit
Payments2
"Funded"
Portion of
Benefit Payments
"Unfunded"
Portion of
Benefit Payments
Present Value
of "Funded"
Benefit Payments
Present Value
of "Unfunded"
Benefit Payments
Present Value of
Benefit Payments
Using the Single
Discount Rate3
(1) (2) (3) (4) (5) (6) (7) (8)
1 7,018,963,357$ 806,770,355$ 806,770,355$ -$ 782,682,209$ -$ 782,682,209$ 2 7,105,993,561 767,302,413 767,302,413 - 700,604,877 - 700,604,877 3 7,304,543,734 796,761,359 796,761,359 - 684,708,812 - 684,708,812 4 7,537,268,361 826,566,232 826,566,232 - 668,538,424 - 668,538,424 5 7,816,046,673 858,993,081 858,993,081 - 653,897,146 - 653,897,146 6 8,066,711,001 891,173,426 891,173,426 - 638,488,478 - 638,488,478 7 8,294,507,607 922,694,019 922,694,019 - 622,185,096 - 622,185,096 8 8,501,858,526 953,828,203 953,828,203 - 605,345,223 - 605,345,223 9 8,688,295,806 985,114,637 985,114,637 - 588,424,562 - 588,424,562 10 8,852,567,213 1,015,404,603 1,015,404,603 - 570,839,753 - 570,839,753 11 8,994,626,703 1,043,318,441 1,043,318,441 - 552,030,441 - 552,030,441 12 9,116,159,357 1,068,182,217 1,068,182,217 - 531,939,877 - 531,939,877 13 9,219,785,496 1,090,293,944 1,090,293,944 - 511,012,903 - 511,012,903 14 9,307,998,681 1,109,188,886 1,109,188,886 - 489,288,306 - 489,288,306 15 9,383,878,337 1,125,781,749 1,125,781,749 - 467,395,570 - 467,395,570 16 9,449,652,653 1,139,975,599 1,139,975,599 - 445,447,992 - 445,447,992 17 9,507,760,789 1,151,773,632 1,151,773,632 - 423,584,093 - 423,584,093 18 9,560,744,047 1,159,601,981 1,159,601,981 - 401,377,036 - 401,377,036 19 9,612,860,388 1,161,356,022 1,161,356,022 - 378,338,040 - 378,338,040 20 9,671,553,358 1,157,547,468 1,157,547,468 - 354,915,122 - 354,915,122 21 9,744,202,944 1,149,637,676 1,149,637,676 - 331,755,204 - 331,755,204 22 9,836,796,959 1,138,440,672 1,138,440,672 - 309,199,100 - 309,199,100 23 9,954,721,648 1,124,440,971 1,124,440,971 - 287,432,280 - 287,432,280 24 10,103,015,003 1,108,303,518 1,108,303,518 - 266,642,057 - 266,642,057 25 10,286,272,048 1,090,111,633 1,090,111,633 - 246,837,975 - 246,837,975 26 10,509,262,655 1,069,837,218 1,069,837,218 - 227,997,332 - 227,997,332 27 10,086,781,798 1,047,598,858 1,047,598,858 - 210,125,200 - 210,125,200 28 9,657,538,936 1,023,389,560 1,023,389,560 - 193,194,682 - 193,194,682 29 9,223,397,365 997,493,930 997,493,930 - 177,229,294 - 177,229,294 30 8,786,031,994 969,955,634 969,955,634 - 162,199,002 - 162,199,002 31 8,347,205,979 940,317,449 940,317,449 - 147,993,235 - 147,993,235 32 7,909,297,922 908,891,681 908,891,681 - 134,632,701 - 134,632,701 33 7,474,497,333 876,255,128 876,255,128 - 122,163,105 - 122,163,105 34 7,044,504,522 842,656,520 842,656,520 - 110,568,429 - 110,568,429 35 6,620,871,174 808,045,039 808,045,039 - 99,790,037 - 99,790,037 36 6,205,285,178 772,580,006 772,580,006 - 89,797,892 - 89,797,892 37 5,799,360,117 736,663,346 736,663,346 - 80,586,594 - 80,586,594 38 5,404,373,821 700,372,240 700,372,240 - 72,109,706 - 72,109,706 39 5,021,567,285 663,821,113 663,821,113 - 64,326,055 - 64,326,055 40 4,652,120,232 627,267,126 627,267,126 - 57,208,353 - 57,208,353 41 4,296,982,291 590,950,964 590,950,964 - 50,725,861 - 50,725,861 42 3,956,882,528 554,923,288 554,923,288 - 44,831,368 - 44,831,368 43 3,632,521,959 519,369,322 519,369,322 - 39,490,842 - 39,490,842 44 3,324,436,558 484,476,591 484,476,591 - 34,670,808 - 34,670,808 45 3,032,991,174 450,467,765 450,467,765 - 30,340,724 - 30,340,724 46 2,758,335,239 417,474,812 417,474,812 - 26,464,492 - 26,464,492 47 2,500,485,850 385,642,685 385,642,685 - 23,008,560 - 23,008,560 48 2,259,307,332 355,181,477 355,181,477 - 19,944,618 - 19,944,618 49 2,034,436,064 326,138,729 326,138,729 - 17,236,491 - 17,236,491 50 1,825,434,476 298,535,579 298,535,579 - 14,849,562 - 14,849,562 51 1,631,814,530 272,382,559 272,382,559 - 12,751,694 - 12,751,694 52 1,453,045,520 247,676,546 247,676,546 - 10,913,010 - 10,913,010 53 1,288,566,182 224,408,223 224,408,223 - 9,306,138 - 9,306,138 54 1,137,789,133 202,561,575 202,561,575 - 7,906,037 - 7,906,037 55 1,000,106,264 182,116,027 182,116,027 - 6,689,921 - 6,689,921 56 874,892,380 163,046,085 163,046,085 - 5,637,081 - 5,637,081 57 761,509,164 145,322,947 145,322,947 - 4,728,781 - 4,728,781 58 659,308,037 128,915,040 128,915,040 - 3,948,113 - 3,948,113 59 567,632,211 113,786,280 113,786,280 - 3,279,797 - 3,279,797 60 485,821,012 99,896,804 99,896,804 - 2,710,065 - 2,710,065 61 413,213,556 87,203,859 87,203,859 - 2,226,563 - 2,226,563 62 349,151,723 75,661,976 75,661,976 - 1,818,226 - 1,818,226 63 292,983,126 65,223,246 65,223,246 - 1,475,176 - 1,475,176 64 244,063,989 55,837,393 55,837,393 - 1,188,605 - 1,188,605 65 201,762,121 47,451,614 47,451,614 - 950,680 - 950,680 66 165,460,249 40,010,402 40,010,402 - 754,445 - 754,445 67 134,559,736 33,456,108 33,456,108 - 593,746 - 593,746 68 108,483,953 27,729,881 27,729,881 - 463,175 - 463,175 69 86,680,892 22,771,552 22,771,552 - 357,981 - 357,981 70 68,626,069 18,519,781 18,519,781 - 274,015 - 274,015 71 53,825,445 14,911,732 14,911,732 - 207,653 - 207,653 72 41,818,874 11,883,737 11,883,737 - 155,752 - 155,752 73 32,183,078 9,372,078 9,372,078 - 115,608 - 115,608 74 24,534,004 7,314,042 7,314,042 - 84,914 - 84,914 75 18,528,237 5,648,765 5,648,765 - 61,723 - 61,723 76 13,863,638 4,318,178 4,318,178 - 44,408 - 44,408 77 10,279,039 3,268,306 3,268,306 - 31,634 - 31,634 78 7,552,587 2,449,958 2,449,958 - 22,319 - 22,319 79 5,499,265 1,819,437 1,819,437 - 15,600 - 15,600 80 3,967,536 1,338,737 1,338,737 - 10,803 - 10,803 81 2,835,568 975,876 975,876 - 7,412 - 7,412 82 2,006,881 704,620 704,620 - 5,037 - 5,037 83 1,406,005 503,737 503,737 - 3,389 - 3,389 84 974,640 356,380 356,380 - 2,257 - 2,257 85 668,207 249,336 249,336 - 1,486 - 1,486 86 452,960 172,434 172,434 - 967 - 967 87 303,529 117,839 117,839 - 622 - 622 88 201,034 79,569 79,569 - 395 - 395 89 131,580 53,072 53,072 - 248 - 248 90 85,098 34,974 34,974 - 154 - 154 91 54,366 22,784 22,784 - 94 - 94 92 34,279 14,671 14,671 - 57 - 57 93 21,299 9,345 9,345 - 34 - 34 94 12,997 5,884 5,884 - 20 - 20 95 7,744 3,649 3,649 - 12 - 12 96 4,466 2,228 2,228 - 7 - 7 97 2,449 1,345 1,345 - 4 - 4 98 1,215 805 805 - 2 - 2 99 461 476 476 - 1 - 1
100 0 - - - - - - Total 14,843,141,383$ -$ 14,843,141,383$
Notes and Assumptions:1 Table 1. Column (2).2 Table 1. Column (4).3 The single discount rate that produces a total actuarial present value that equals the sum of the present values in columns (6) and (7).
Board Meeting- December 17, 2018 - Actuarial Valuations- GRS/ Ms. Karen Roggenkamp
325

County Employees Retirement System (CERS) - Hazardous
GASB - Discount Rate Development as of June 30, 2018 (Year 1 is FYE June 30, 2019)
Kentucky Retirement Systems
Table 1. Projection of the Retirement System's Fiduciary Net Position
Year
Projected
Beginning Plan Net
Position
Projected Total
Contributions1
Projected
Benefit Payments2
Projected
Administrative
Expenses3
Projected
Investment
Earnings at 6.25%
Projected
Ending Plan
Net Position
(1) (2) (3) (4) (5) (6) (7)
1 2,348,336,623$ 160,694,072$ (260,379,255)$ (1,271,082)$ 143,663,968$ 2,391,044,326$ 2 2,391,044,326 184,932,779 (271,152,814) (1,163,535) 146,750,918 2,450,411,675 3 2,450,411,675 201,115,425 (284,094,967) (1,065,514) 150,564,125 2,516,930,743 4 2,516,930,743 220,906,896 (296,391,791) (973,444) 154,955,059 2,595,427,463 5 2,595,427,463 228,132,102 (308,639,322) (886,444) 159,709,212 2,673,743,010 6 2,673,743,010 225,873,330 (320,071,977) (806,089) 164,185,034 2,742,923,308 7 2,742,923,308 224,880,531 (331,049,954) (730,042) 168,142,726 2,804,166,569 8 2,804,166,569 224,157,222 (341,838,968) (657,385) 171,618,357 2,857,445,796 9 2,857,445,796 223,687,745 (352,159,994) (587,451) 174,618,369 2,903,004,465 10 2,903,004,465 223,598,759 (361,533,213) (522,473) 177,176,572 2,941,724,109 11 2,941,724,109 223,935,514 (369,744,105) (462,725) 179,356,052 2,974,808,845 12 2,974,808,845 224,830,158 (376,000,157) (410,708) 181,260,443 3,004,488,581 13 3,004,488,581 226,393,213 (380,533,282) (367,860) 183,025,338 3,033,005,990 14 3,033,005,990 228,357,702 (383,730,164) (329,512) 184,770,927 3,062,074,942 15 3,062,074,942 230,797,077 (385,615,904) (297,545) 186,605,759 3,093,564,329 16 3,093,564,329 233,638,662 (386,579,068) (270,527) 188,632,489 3,128,985,885 17 3,128,985,885 236,740,981 (386,995,317) (245,654) 190,929,769 3,169,415,664 18 3,169,415,664 240,066,904 (387,068,514) (222,312) 193,557,456 3,215,749,198 19 3,215,749,198 243,537,622 (387,052,005) (199,299) 196,561,334 3,268,596,850 20 3,268,596,850 247,139,907 (387,157,592) (176,469) 199,972,631 3,328,375,327 21 3,328,375,327 250,820,354 (387,040,850) (152,726) 203,826,380 3,395,828,485 22 3,395,828,485 254,634,693 (386,284,001) (129,259) 208,183,610 3,472,233,528 23 3,472,233,528 258,587,308 (384,686,214) (105,736) 213,130,470 3,559,159,356 24 3,559,159,356 262,695,274 (382,087,271) (82,843) 218,770,454 3,658,454,971 25 3,658,454,971 266,989,301 (378,327,588) (61,443) 225,224,952 3,772,280,193 26 3,772,280,193 1,778,570 (373,481,250) (44,399) 224,326,473 3,624,859,587 27 3,624,859,587 1,237,481 (367,954,327) (31,183) 215,266,538 3,473,378,095 28 3,473,378,095 813,585 (361,928,769) (20,703) 205,971,666 3,318,213,873 29 3,318,213,873 501,200 (355,005,586) (12,867) 196,477,600 3,160,174,220 30 3,160,174,220 297,592 (347,277,704) (7,714) 186,831,850 3,000,018,244 31 3,000,018,244 169,157 (338,786,778) (4,420) 177,079,570 2,838,475,773 32 2,838,475,773 88,994 (329,183,946) (2,337) 167,276,304 2,676,654,788 33 2,676,654,788 42,170 (318,430,298) (1,115) 157,492,047 2,515,757,593 34 2,515,757,593 17,545 (306,507,619) (467) 147,802,172 2,357,069,223 35 2,357,069,223 8,493 (293,681,207) (228) 138,278,628 2,201,674,909 36 2,201,674,909 3,411 (280,378,649) (92) 128,975,737 2,050,275,317 37 2,050,275,317 913 (266,835,684) (25) 119,929,991 1,903,370,512 38 1,903,370,512 253 (253,146,395) (7) 111,169,729 1,761,394,092 39 1,761,394,092 56 (239,430,774) (1) 102,718,313 1,624,681,686 40 1,624,681,686 5 (225,741,664) (0) 94,595,089 1,493,535,116 41 1,493,535,116 1 (212,145,605) (0) 86,816,865 1,368,206,378 42 1,368,206,378 - (198,691,015) - 79,397,903 1,248,913,265 43 1,248,913,265 - (185,427,338) - 72,350,292 1,135,836,220 44 1,135,836,220 - (172,424,882) - 65,683,145 1,029,094,484 45 1,029,094,484 - (159,742,589) - 59,402,102 928,753,997 46 928,753,997 - (147,435,704) - 53,509,584 834,827,877 47 834,827,877 - (135,553,782) - 48,004,884 747,278,979 48 747,278,979 - (124,139,854) - 42,884,358 666,023,483 49 666,023,483 - (113,229,615) - 38,141,667 590,935,535 50 590,935,535 - (102,851,096) - 33,768,084 521,852,522 51 521,852,522 - (93,025,018) - 29,752,807 458,580,311 52 458,580,311 - (83,764,571) - 26,083,297 400,899,037 53 400,899,037 - (75,075,356) - 22,745,640 348,569,321 54 348,569,321 - (66,957,008) - 19,724,886 301,337,199 55 301,337,199 - (59,404,675) - 17,005,313 258,937,837 56 258,937,837 - (52,410,503) - 14,570,608 221,097,942 57 221,097,942 - (45,964,886) - 12,403,987 187,537,043 58 187,537,043 - (40,056,397) - 10,488,273 157,968,919 59 157,968,919 - (34,671,869) - 8,805,982 132,103,033 60 132,103,033 - (29,796,111) - 7,339,422 109,646,345 61 109,646,345 - (25,411,701) - 6,070,816 90,305,460 62 90,305,460 - (21,499,163) - 4,982,424 73,788,721 63 73,788,721 - (18,036,808) - 4,056,687 59,808,599 64 59,808,599 - (15,000,180) - 3,276,386 48,084,805 65 48,084,805 - (12,362,437) - 2,624,829 38,347,197 66 38,347,197 - (10,094,692) - 2,086,021 30,338,526 67 30,338,526 - (8,166,018) - 1,644,837 23,817,346 68 23,817,346 - (6,544,203) - 1,287,177 18,560,319 69 18,560,319 - (5,196,358) - 1,000,095 14,364,056 70 14,364,056 - (4,089,459) - 771,895 11,046,493 71 11,046,493 - (3,191,329) - 592,188 8,447,352 72 8,447,352 - (2,471,193) - 451,905 6,428,064 73 6,428,064 - (1,900,225) - 343,272 4,871,110 74 4,871,110 - (1,452,338) - 259,747 3,678,519 75 3,678,519 - (1,104,481) - 195,915 2,769,954 76 2,769,954 - (836,577) - 147,375 2,080,752 77 2,080,752 - (631,695) - 110,606 1,559,663 78 1,559,663 - (475,880) - 82,833 1,166,616 79 1,166,616 - (357,838) - 61,901 870,679 80 870,679 - (268,639) - 46,150 648,190 81 648,190 - (201,339) - 34,315 481,166 82 481,166 - (150,598) - 25,438 356,006 83 356,006 - (112,364) - 18,792 262,434 84 262,434 - (83,589) - 13,830 192,674 85 192,674 - (61,967) - 10,135 140,842 86 140,842 - (45,758) - 7,394 102,479 87 102,479 - (33,650) - 5,369 74,199 88 74,199 - (24,639) - 3,879 53,439 89 53,439 - (17,966) - 2,787 38,260 90 38,260 - (13,050) - 1,990 27,199 91 27,199 - (9,441) - 1,409 19,168 92 19,168 - (6,801) - 989 13,356 93 13,356 - (4,875) - 685 9,166 94 9,166 - (3,479) - 466 6,153 95 6,153 - (2,469) - 309 3,992 96 3,992 - (1,740) - 196 2,448 97 2,448 - (1,217) - 116 1,347 98 1,347 - (844) - 58 562 99 562 - (579) - 17 (0)
100 (0) - - - (0) (0)
Notes and Assumptions:1 Future employer contributions are assumed to be equal to the projected payroll times the actuarially determined contribution rate (the amortization
cost on the payroll of future active members of the system). Contributions are determined without regard to enactment of SB 151 in 2018, which is currently being reviewed by the State Supreme Court. Future member contributions are equal to 8.00% of payroll.
2 Expected future benefit payments based on the 2017 actuarial valuation, adjusted to reflect HB 185 passed during the 2018 legislative session.3 Assumed to be equal to 0.26% of current payroll.
Board Meeting- December 17, 2018 - Actuarial Valuations- GRS/ Ms. Karen Roggenkamp
326
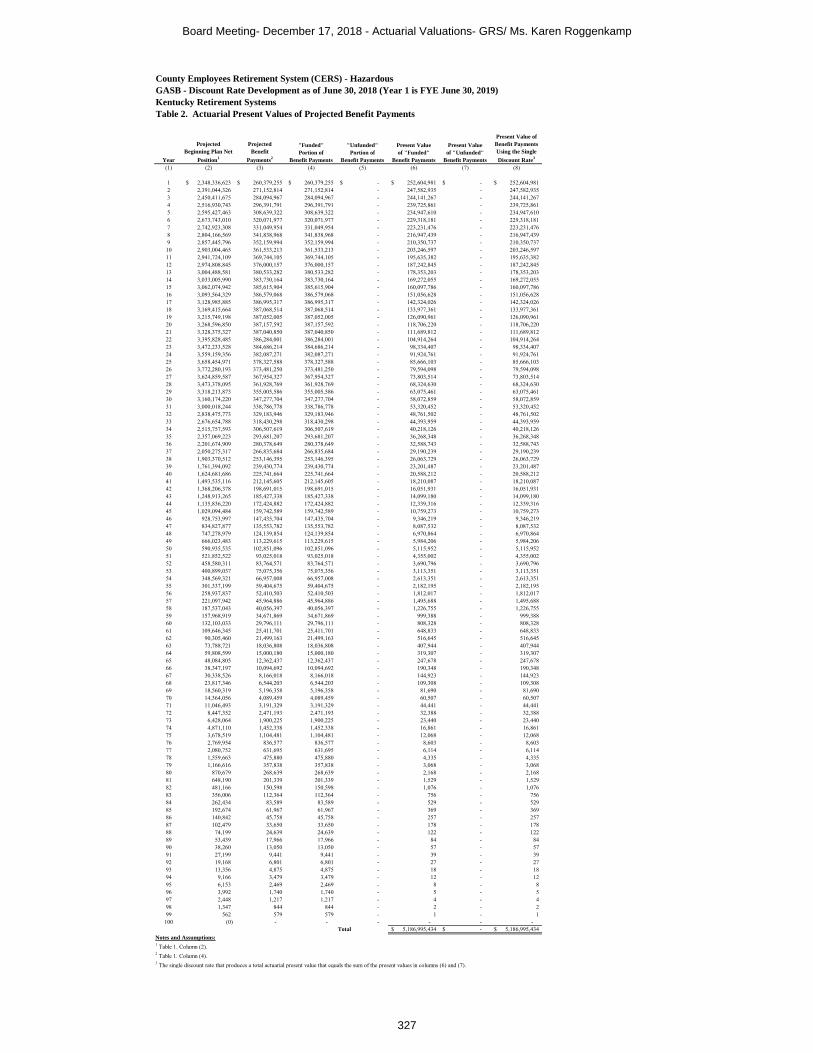
County Employees Retirement System (CERS) - Hazardous
GASB - Discount Rate Development as of June 30, 2018 (Year 1 is FYE June 30, 2019)
Kentucky Retirement Systems
Table 2. Actuarial Present Values of Projected Benefit Payments
Year
Projected
Beginning Plan Net
Position1
Projected
Benefit
Payments2
"Funded"
Portion of
Benefit Payments
"Unfunded"
Portion of
Benefit Payments
Present Value
of "Funded"
Benefit Payments
Present Value
of "Unfunded"
Benefit Payments
Present Value of
Benefit Payments
Using the Single
Discount Rate3
(1) (2) (3) (4) (5) (6) (7) (8)
1 2,348,336,623$ 260,379,255$ 260,379,255$ -$ 252,604,981$ -$ 252,604,981$ 2 2,391,044,326 271,152,814 271,152,814 - 247,582,935 - 247,582,935 3 2,450,411,675 284,094,967 284,094,967 - 244,141,267 - 244,141,267 4 2,516,930,743 296,391,791 296,391,791 - 239,725,861 - 239,725,861 5 2,595,427,463 308,639,322 308,639,322 - 234,947,610 - 234,947,610 6 2,673,743,010 320,071,977 320,071,977 - 229,318,181 - 229,318,181 7 2,742,923,308 331,049,954 331,049,954 - 223,231,476 - 223,231,476 8 2,804,166,569 341,838,968 341,838,968 - 216,947,439 - 216,947,439 9 2,857,445,796 352,159,994 352,159,994 - 210,350,737 - 210,350,737 10 2,903,004,465 361,533,213 361,533,213 - 203,246,597 - 203,246,597 11 2,941,724,109 369,744,105 369,744,105 - 195,635,382 - 195,635,382 12 2,974,808,845 376,000,157 376,000,157 - 187,242,845 - 187,242,845 13 3,004,488,581 380,533,282 380,533,282 - 178,353,203 - 178,353,203 14 3,033,005,990 383,730,164 383,730,164 - 169,272,055 - 169,272,055 15 3,062,074,942 385,615,904 385,615,904 - 160,097,786 - 160,097,786 16 3,093,564,329 386,579,068 386,579,068 - 151,056,628 - 151,056,628 17 3,128,985,885 386,995,317 386,995,317 - 142,324,026 - 142,324,026 18 3,169,415,664 387,068,514 387,068,514 - 133,977,361 - 133,977,361 19 3,215,749,198 387,052,005 387,052,005 - 126,090,961 - 126,090,961 20 3,268,596,850 387,157,592 387,157,592 - 118,706,220 - 118,706,220 21 3,328,375,327 387,040,850 387,040,850 - 111,689,812 - 111,689,812 22 3,395,828,485 386,284,001 386,284,001 - 104,914,264 - 104,914,264 23 3,472,233,528 384,686,214 384,686,214 - 98,334,407 - 98,334,407 24 3,559,159,356 382,087,271 382,087,271 - 91,924,761 - 91,924,761 25 3,658,454,971 378,327,588 378,327,588 - 85,666,103 - 85,666,103 26 3,772,280,193 373,481,250 373,481,250 - 79,594,098 - 79,594,098 27 3,624,859,587 367,954,327 367,954,327 - 73,803,514 - 73,803,514 28 3,473,378,095 361,928,769 361,928,769 - 68,324,630 - 68,324,630 29 3,318,213,873 355,005,586 355,005,586 - 63,075,461 - 63,075,461 30 3,160,174,220 347,277,704 347,277,704 - 58,072,859 - 58,072,859 31 3,000,018,244 338,786,778 338,786,778 - 53,320,452 - 53,320,452 32 2,838,475,773 329,183,946 329,183,946 - 48,761,502 - 48,761,502 33 2,676,654,788 318,430,298 318,430,298 - 44,393,959 - 44,393,959 34 2,515,757,593 306,507,619 306,507,619 - 40,218,126 - 40,218,126 35 2,357,069,223 293,681,207 293,681,207 - 36,268,348 - 36,268,348 36 2,201,674,909 280,378,649 280,378,649 - 32,588,743 - 32,588,743 37 2,050,275,317 266,835,684 266,835,684 - 29,190,239 - 29,190,239 38 1,903,370,512 253,146,395 253,146,395 - 26,063,729 - 26,063,729 39 1,761,394,092 239,430,774 239,430,774 - 23,201,487 - 23,201,487 40 1,624,681,686 225,741,664 225,741,664 - 20,588,212 - 20,588,212 41 1,493,535,116 212,145,605 212,145,605 - 18,210,087 - 18,210,087 42 1,368,206,378 198,691,015 198,691,015 - 16,051,931 - 16,051,931 43 1,248,913,265 185,427,338 185,427,338 - 14,099,180 - 14,099,180 44 1,135,836,220 172,424,882 172,424,882 - 12,339,316 - 12,339,316 45 1,029,094,484 159,742,589 159,742,589 - 10,759,273 - 10,759,273 46 928,753,997 147,435,704 147,435,704 - 9,346,219 - 9,346,219 47 834,827,877 135,553,782 135,553,782 - 8,087,532 - 8,087,532 48 747,278,979 124,139,854 124,139,854 - 6,970,864 - 6,970,864 49 666,023,483 113,229,615 113,229,615 - 5,984,206 - 5,984,206 50 590,935,535 102,851,096 102,851,096 - 5,115,952 - 5,115,952 51 521,852,522 93,025,018 93,025,018 - 4,355,002 - 4,355,002 52 458,580,311 83,764,571 83,764,571 - 3,690,796 - 3,690,796 53 400,899,037 75,075,356 75,075,356 - 3,113,351 - 3,113,351 54 348,569,321 66,957,008 66,957,008 - 2,613,351 - 2,613,351 55 301,337,199 59,404,675 59,404,675 - 2,182,195 - 2,182,195 56 258,937,837 52,410,503 52,410,503 - 1,812,017 - 1,812,017 57 221,097,942 45,964,886 45,964,886 - 1,495,688 - 1,495,688 58 187,537,043 40,056,397 40,056,397 - 1,226,755 - 1,226,755 59 157,968,919 34,671,869 34,671,869 - 999,388 - 999,388 60 132,103,033 29,796,111 29,796,111 - 808,328 - 808,328 61 109,646,345 25,411,701 25,411,701 - 648,833 - 648,833 62 90,305,460 21,499,163 21,499,163 - 516,645 - 516,645 63 73,788,721 18,036,808 18,036,808 - 407,944 - 407,944 64 59,808,599 15,000,180 15,000,180 - 319,307 - 319,307 65 48,084,805 12,362,437 12,362,437 - 247,678 - 247,678 66 38,347,197 10,094,692 10,094,692 - 190,348 - 190,348 67 30,338,526 8,166,018 8,166,018 - 144,923 - 144,923 68 23,817,346 6,544,203 6,544,203 - 109,308 - 109,308 69 18,560,319 5,196,358 5,196,358 - 81,690 - 81,690 70 14,364,056 4,089,459 4,089,459 - 60,507 - 60,507 71 11,046,493 3,191,329 3,191,329 - 44,441 - 44,441 72 8,447,352 2,471,193 2,471,193 - 32,388 - 32,388 73 6,428,064 1,900,225 1,900,225 - 23,440 - 23,440 74 4,871,110 1,452,338 1,452,338 - 16,861 - 16,861 75 3,678,519 1,104,481 1,104,481 - 12,068 - 12,068 76 2,769,954 836,577 836,577 - 8,603 - 8,603 77 2,080,752 631,695 631,695 - 6,114 - 6,114 78 1,559,663 475,880 475,880 - 4,335 - 4,335 79 1,166,616 357,838 357,838 - 3,068 - 3,068 80 870,679 268,639 268,639 - 2,168 - 2,168 81 648,190 201,339 201,339 - 1,529 - 1,529 82 481,166 150,598 150,598 - 1,076 - 1,076 83 356,006 112,364 112,364 - 756 - 756 84 262,434 83,589 83,589 - 529 - 529 85 192,674 61,967 61,967 - 369 - 369 86 140,842 45,758 45,758 - 257 - 257 87 102,479 33,650 33,650 - 178 - 178 88 74,199 24,639 24,639 - 122 - 122 89 53,439 17,966 17,966 - 84 - 84 90 38,260 13,050 13,050 - 57 - 57 91 27,199 9,441 9,441 - 39 - 39 92 19,168 6,801 6,801 - 27 - 27 93 13,356 4,875 4,875 - 18 - 18 94 9,166 3,479 3,479 - 12 - 12 95 6,153 2,469 2,469 - 8 - 8 96 3,992 1,740 1,740 - 5 - 5 97 2,448 1,217 1,217 - 4 - 4 98 1,347 844 844 - 2 - 2 99 562 579 579 - 1 - 1
100 (0) - - - - - - Total 5,186,995,434$ -$ 5,186,995,434$
Notes and Assumptions:1 Table 1. Column (2).2 Table 1. Column (4).3 The single discount rate that produces a total actuarial present value that equals the sum of the present values in columns (6) and (7).
Board Meeting- December 17, 2018 - Actuarial Valuations- GRS/ Ms. Karen Roggenkamp
327

State Police Retirement System (SPRS)
GASB - Discount Rate Development as of June 30, 2018 (Year 1 is FYE June 30, 2019)
Kentucky Retirement Systems
Table 1. Projection of the Retirement System's Fiduciary Net Position
Year
Projected
Beginning Plan Net
Position
Projected Total
Contributions1
Projected
Benefit Payments2
Projected
Administrative
Expenses3
Projected
Investment
Earnings at 5.25%
Projected
Ending Plan
Net Position
(1) (2) (3) (4) (5) (6) (7)
1 267,572,480$ 59,435,228$ (60,048,391)$ (169,926)$ 14,027,262$ 280,816,653$ 2 280,816,653 61,753,252 (60,468,332) (163,251) 14,771,941 296,710,263 3 296,710,263 59,945,391 (61,372,731) (155,317) 15,536,275 310,663,881 4 310,663,881 59,477,762 (62,162,631) (148,306) 16,236,434 324,067,140 5 324,067,140 58,614,221 (62,917,583) (140,692) 16,898,360 336,521,446 6 336,521,446 57,928,337 (63,650,993) (132,656) 17,515,641 348,181,776 7 348,181,776 57,295,223 (64,419,966) (124,042) 18,091,696 359,024,687 8 359,024,687 56,559,608 (65,105,624) (113,967) 18,624,380 368,989,083 9 368,989,083 55,960,209 (65,425,105) (105,708) 19,123,912 378,542,391 10 378,542,391 55,495,686 (65,643,321) (99,294) 19,607,934 387,903,395 11 387,903,395 55,021,672 (65,777,992) (92,783) 20,083,783 397,138,075 12 397,138,075 54,575,883 (65,722,582) (86,619) 20,558,646 406,463,403 13 406,463,403 54,209,275 (65,503,483) (81,559) 21,044,534 416,132,170 14 416,132,170 53,886,108 (65,233,973) (77,070) 21,550,871 426,258,106 15 426,258,106 53,501,811 (64,881,502) (71,650) 22,081,798 436,888,562 16 436,888,562 53,207,488 (64,330,526) (67,598) 22,646,653 448,344,579 17 448,344,579 52,954,643 (63,812,202) (63,791) 23,255,072 460,678,301 18 460,678,301 52,637,514 (63,316,445) (58,913) 23,907,348 473,847,804 19 473,847,804 52,331,616 (62,668,812) (53,873) 24,607,733 488,064,467 20 488,064,467 52,082,811 (61,979,270) (49,818) 25,365,634 503,483,824 21 503,483,824 51,769,581 (61,250,084) (44,306) 26,186,073 520,145,088 22 520,145,088 51,532,579 (60,512,955) (40,283) 27,073,854 538,198,283 23 538,198,283 51,202,831 (59,844,913) (33,576) 28,030,587 557,553,211 24 557,553,211 50,872,973 (59,072,616) (26,731) 29,058,364 578,385,201 25 578,385,201 50,568,804 (58,142,581) (20,472) 30,168,424 600,959,377 26 600,959,377 703,944 (57,056,331) (15,019) 30,089,650 574,681,621 27 574,681,621 494,504 (55,808,125) (10,624) 28,737,100 548,094,476 28 548,094,476 342,918 (54,447,047) (7,413) 27,372,701 521,355,635 29 521,355,635 223,417 (53,045,344) (4,883) 26,002,205 494,531,030 30 494,531,030 142,450 (51,598,511) (3,165) 24,629,353 467,701,156 31 467,701,156 74,180 (50,040,695) (1,705) 23,259,423 440,992,359 32 440,992,359 36,029 (48,327,327) (847) 21,900,646 414,600,860 33 414,600,860 15,422 (46,476,691) (379) 20,562,527 388,701,738 34 388,701,738 5,443 (44,535,962) (138) 19,252,863 363,423,945 35 363,423,945 1,201 (42,549,379) (31) 17,977,153 338,852,889 36 338,852,889 306 (40,553,193) (8) 16,738,880 315,038,874 37 315,038,874 78 (38,553,782) (2) 15,540,451 292,025,619 38 292,025,619 5 (36,554,519) (0) 14,384,063 269,855,168 39 269,855,168 - (34,562,159) - 13,271,745 248,564,753 40 248,564,753 - (32,580,683) - 12,205,346 228,189,417 41 228,189,417 - (30,615,058) - 11,186,579 208,760,938 42 208,760,938 - (28,671,424) - 10,216,951 190,306,465 43 190,306,465 - (26,757,070) - 9,297,701 172,847,095 44 172,847,095 - (24,879,875) - 8,429,730 156,396,950 45 156,396,950 - (23,048,072) - 7,613,567 140,962,445 46 140,962,445 - (21,269,806) - 6,849,338 126,541,977 47 126,541,977 - (19,552,578) - 6,136,764 113,126,163 48 113,126,163 - (17,903,100) - 5,475,179 100,698,241 49 100,698,241 - (16,326,958) - 4,863,557 89,234,840 50 89,234,840 - (14,828,570) - 4,300,558 78,706,829 51 78,706,829 - (13,411,120) - 3,784,570 69,080,279 52 69,080,279 - (12,076,586) - 3,313,759 60,317,452 53 60,317,452 - (10,825,606) - 2,886,129 52,377,974 54 52,377,974 - (9,657,818) - 2,499,569 45,219,726 55 45,219,726 - (8,571,964) - 2,151,900 38,799,661 56 38,799,661 - (7,566,194) - 1,840,910 33,074,377 57 33,074,377 - (6,638,321) - 1,564,378 28,000,434 58 28,000,434 - (5,786,103) - 1,320,080 23,534,411 59 23,534,411 - (5,007,325) - 1,105,796 19,632,882 60 19,632,882 - (4,299,975) - 919,296 16,252,203 61 16,252,203 - (3,662,215) - 758,337 13,348,326 62 13,348,326 - (3,091,991) - 620,661 10,876,995 63 10,876,995 - (2,586,889) - 504,005 8,794,111 64 8,794,111 - (2,144,110) - 406,128 7,056,129 65 7,056,129 - (1,760,361) - 324,828 5,620,596 66 5,620,596 - (1,431,832) - 257,976 4,446,741 67 4,446,741 - (1,154,178) - 203,544 3,496,107 68 3,496,107 - (922,555) - 159,638 2,733,191 69 2,733,191 - (731,757) - 124,530 2,125,963 70 2,125,963 - (576,459) - 96,675 1,646,178 71 1,646,178 - (451,438) - 74,726 1,269,467 72 1,269,467 - (351,757) - 57,531 975,241 73 975,241 - (272,967) - 44,126 746,400 74 746,400 - (211,125) - 33,715 568,990 75 568,990 - (162,822) - 25,653 431,820 76 431,820 - (125,206) - 19,426 326,039 77 326,039 - (95,962) - 14,630 244,707 78 244,707 - (73,244) - 10,949 182,412 79 182,412 - (55,632) - 8,135 134,916 80 134,916 - (42,016) - 5,994 98,894 81 98,894 - (31,521) - 4,375 71,749 82 71,749 - (23,460) - 3,159 51,448 83 51,448 - (17,293) - 2,253 36,408 84 36,408 - (12,599) - 1,585 25,393 85 25,393 - (9,056) - 1,098 17,436 86 17,436 - (6,408) - 749 11,778 87 11,778 - (4,460) - 503 7,821 88 7,821 - (3,050) - 332 5,102 89 5,102 - (2,048) - 215 3,269 90 3,269 - (1,349) - 137 2,057 91 2,057 - (872) - 85 1,270 92 1,270 - (552) - 52 770 93 770 - (342) - 32 459 94 459 - (209) - 19 269 95 269 - (127) - 11 153 96 153 - (76) - 6 82 97 82 - (45) - 3 40 98 40 - (27) - 1 15 99 15 - (15) - 0 0
100 0 - - - 0 0
Notes and Assumptions:1 Future employer contributions are assumed to be equal to the projected payroll times the actuarially determined contribution rate (the amortization
cost on the payroll of future active members of the system). Contributions are determined without regard to enactment of SB 151 in 2018, which is currently being reviewed by the State Supreme Court. Future member contributions are equal to 8.00% of payroll.
2 Expected future benefit payments based on the 2017 actuarial valuation, adjusted to reflect HB 185 passed during the 2018 legislative session.3 Assumed to be equal to 0.37% of current payroll.
Board Meeting- December 17, 2018 - Actuarial Valuations- GRS/ Ms. Karen Roggenkamp
328

State Police Retirement System (SPRS)
GASB - Discount Rate Development as of June 30, 2018 (Year 1 is FYE June 30, 2019)
Kentucky Retirement Systems
Table 2. Actuarial Present Values of Projected Benefit Payments
Year
Projected
Beginning Plan Net
Position1
Projected
Benefit
Payments2
"Funded"
Portion of
Benefit Payments
"Unfunded"
Portion of
Benefit Payments
Present Value
of "Funded"
Benefit Payments
Present Value
of "Unfunded"
Benefit Payments
Present Value of
Benefit Payments
Using the Single
Discount Rate3
(1) (2) (3) (4) (5) (6) (7) (8)
1 267,572,480$ 60,048,391$ 60,048,391$ -$ 58,531,590$ -$ 58,531,590$ 2 280,816,653 60,468,332 60,468,332 - 56,000,878 - 56,000,878 3 296,710,263 61,372,731 61,372,731 - 54,003,286 - 54,003,286 4 310,663,881 62,162,631 62,162,631 - 51,969,917 - 51,969,917 5 324,067,140 62,917,583 62,917,583 - 49,977,273 - 49,977,273 6 336,521,446 63,650,993 63,650,993 - 48,037,855 - 48,037,855 7 348,181,776 64,419,966 64,419,966 - 46,193,069 - 46,193,069 8 359,024,687 65,105,624 65,105,624 - 44,356,036 - 44,356,036 9 368,989,083 65,425,105 65,425,105 - 42,350,305 - 42,350,305 10 378,542,391 65,643,321 65,643,321 - 40,372,027 - 40,372,027 11 387,903,395 65,777,992 65,777,992 - 38,436,914 - 38,436,914 12 397,138,075 65,722,582 65,722,582 - 36,488,870 - 36,488,870 13 406,463,403 65,503,483 65,503,483 - 34,553,185 - 34,553,185 14 416,132,170 65,233,973 65,233,973 - 32,694,554 - 32,694,554 15 426,258,106 64,881,502 64,881,502 - 30,895,867 - 30,895,867 16 436,888,562 64,330,526 64,330,526 - 29,105,461 - 29,105,461 17 448,344,579 63,812,202 63,812,202 - 27,430,834 - 27,430,834 18 460,678,301 63,316,445 63,316,445 - 25,860,070 - 25,860,070 19 473,847,804 62,668,812 62,668,812 - 24,318,822 - 24,318,822 20 488,064,467 61,979,270 61,979,270 - 22,851,537 - 22,851,537 21 503,483,824 61,250,084 61,250,084 - 21,456,236 - 21,456,236 22 520,145,088 60,512,955 60,512,955 - 20,140,633 - 20,140,633 23 538,198,283 59,844,913 59,844,913 - 18,924,739 - 18,924,739 24 557,553,211 59,072,616 59,072,616 - 17,748,708 - 17,748,708 25 578,385,201 58,142,581 58,142,581 - 16,597,885 - 16,597,885 26 600,959,377 57,056,331 57,056,331 - 15,475,339 - 15,475,339 27 574,681,621 55,808,125 55,808,125 - 14,381,748 - 14,381,748 28 548,094,476 54,447,047 54,447,047 - 13,331,114 - 13,331,114 29 521,355,635 53,045,344 53,045,344 - 12,340,061 - 12,340,061 30 494,531,030 51,598,511 51,598,511 - 11,404,732 - 11,404,732 31 467,701,156 50,040,695 50,040,695 - 10,508,704 - 10,508,704 32 440,992,359 48,327,327 48,327,327 - 9,642,652 - 9,642,652 33 414,600,860 46,476,691 46,476,691 - 8,810,830 - 8,810,830 34 388,701,738 44,535,962 44,535,962 - 8,021,772 - 8,021,772 35 363,423,945 42,549,379 42,549,379 - 7,281,664 - 7,281,664 36 338,852,889 40,553,193 40,553,193 - 6,593,869 - 6,593,869 37 315,038,874 38,553,782 38,553,782 - 5,956,075 - 5,956,075 38 292,025,619 36,554,519 36,554,519 - 5,365,524 - 5,365,524 39 269,855,168 34,562,159 34,562,159 - 4,820,031 - 4,820,031 40 248,564,753 32,580,683 32,580,683 - 4,317,050 - 4,317,050 41 228,189,417 30,615,058 30,615,058 - 3,854,250 - 3,854,250 42 208,760,938 28,671,424 28,671,424 - 3,429,509 - 3,429,509 43 190,306,465 26,757,070 26,757,070 - 3,040,879 - 3,040,879 44 172,847,095 24,879,875 24,879,875 - 2,686,499 - 2,686,499 45 156,396,950 23,048,072 23,048,072 - 2,364,563 - 2,364,563 46 140,962,445 21,269,806 21,269,806 - 2,073,279 - 2,073,279 47 126,541,977 19,552,578 19,552,578 - 1,810,824 - 1,810,824 48 113,126,163 17,903,100 17,903,100 - 1,575,354 - 1,575,354 49 100,698,241 16,326,958 16,326,958 - 1,365,002 - 1,365,002 50 89,234,840 14,828,570 14,828,570 - 1,177,891 - 1,177,891 51 78,706,829 13,411,120 13,411,120 - 1,012,159 - 1,012,159 52 69,080,279 12,076,586 12,076,586 - 865,976 - 865,976 53 60,317,452 10,825,606 10,825,606 - 737,550 - 737,550 54 52,377,974 9,657,818 9,657,818 - 625,168 - 625,168 55 45,219,726 8,571,964 8,571,964 - 527,200 - 527,200 56 38,799,661 7,566,194 7,566,194 - 442,131 - 442,131 57 33,074,377 6,638,321 6,638,321 - 368,561 - 368,561 58 28,000,434 5,786,103 5,786,103 - 305,222 - 305,222 59 23,534,411 5,007,325 5,007,325 - 250,965 - 250,965 60 19,632,882 4,299,975 4,299,975 - 204,763 - 204,763 61 16,252,203 3,662,215 3,662,215 - 165,694 - 165,694 62 13,348,326 3,091,991 3,091,991 - 132,916 - 132,916 63 10,876,995 2,586,889 2,586,889 - 105,657 - 105,657 64 8,794,111 2,144,110 2,144,110 - 83,204 - 83,204 65 7,056,129 1,760,361 1,760,361 - 64,905 - 64,905 66 5,620,596 1,431,832 1,431,832 - 50,158 - 50,158 67 4,446,741 1,154,178 1,154,178 - 38,415 - 38,415 68 3,496,107 922,555 922,555 - 29,174 - 29,174 69 2,733,191 731,757 731,757 - 21,986 - 21,986 70 2,125,963 576,459 576,459 - 16,456 - 16,456 71 1,646,178 451,438 451,438 - 12,244 - 12,244 72 1,269,467 351,757 351,757 - 9,065 - 9,065 73 975,241 272,967 272,967 - 6,684 - 6,684 74 746,400 211,125 211,125 - 4,912 - 4,912 75 568,990 162,822 162,822 - 3,599 - 3,599 76 431,820 125,206 125,206 - 2,629 - 2,629 77 326,039 95,962 95,962 - 1,915 - 1,915 78 244,707 73,244 73,244 - 1,389 - 1,389 79 182,412 55,632 55,632 - 1,002 - 1,002 80 134,916 42,016 42,016 - 719 - 719 81 98,894 31,521 31,521 - 513 - 513 82 71,749 23,460 23,460 - 362 - 362 83 51,448 17,293 17,293 - 254 - 254 84 36,408 12,599 12,599 - 176 - 176 85 25,393 9,056 9,056 - 120 - 120 86 17,436 6,408 6,408 - 81 - 81 87 11,778 4,460 4,460 - 53 - 53 88 7,821 3,050 3,050 - 35 - 35 89 5,102 2,048 2,048 - 22 - 22 90 3,269 1,349 1,349 - 14 - 14 91 2,057 872 872 - 9 - 9 92 1,270 552 552 - 5 - 5 93 770 342 342 - 3 - 3 94 459 209 209 - 2 - 2 95 269 127 127 - 1 - 1 96 153 76 76 - 1 - 1 97 82 45 45 - 0 - 0 98 40 27 27 - 0 - 0 99 15 15 15 - 0 - 0
100 0 - - - - - - Total 1,057,019,831$ -$ 1,057,019,831$
Notes and Assumptions:1 Table 1. Column (2).2 Table 1. Column (4).3 The single discount rate that produces a total actuarial present value that equals the sum of the present values in columns (6) and (7).
Board Meeting- December 17, 2018 - Actuarial Valuations- GRS/ Ms. Karen Roggenkamp
329

November 19, 2018 Board of Trustees Kentucky Retirement Systems Perimeter Park West 1260 Louisville Road Frankfort, KY 40601
Re: GASB 74 Reporting – Actuarial Information Dear Members of the Board: The reports provided herein contain certain information for the Kentucky Employees Retirement System (KERS), the County Employees Retirement System (CERS), and the State Police Retirement System (SPRS) in connection with the Governmental Accounting Standards Board (GASB) Statement No. 74, “Financial Reporting for Postemployment Benefit Plans Other than Pension Plans” for the fiscal year ending June 30, 2018. Separate reports will be provided at a later date with additional accounting information determined in accordance with GASB Statement No. 75, “Accounting and Financial Reporting for Postemployment Benefits Other Than Pensions”. Basis of Calculations The liability calculations presented in the reports were performed for the purpose of satisfying the requirements of GASB No. 74 and are not applicable for other purposes, such as determining the plans’ funding requirements. The plan’s liability for other purposes may produce significantly different results. The total OPEB liability, net OPEB liability, and sensitivity information are based on an actuarial valuation date of June 30, 2017. The total OPEB liability was rolled-forward from the valuation date to the plan’s fiscal year ending June 30, 2018 using generally accepted actuarial principles. Assumptions There have been no changes in actuarial assumptions since June 30, 2017. Plan Provisions During the 2018 legislative session, House Bill 185 was enacted, which updated the benefit provisions for active members who die in the line of duty. The system shall now pay 100% of the insurance premium for spouses and children of all active members who die in the line of duty. The Total OPEB liability as of June 30, 2018 is determined using these updated benefit provisions.
Board Meeting- December 17, 2018 - Actuarial Valuations- GRS/ Ms. Karen Roggenkamp
330

Board of Trustees November 19, 2018 Page 2
Implicit Employer Subsidy for non-Medicare retirees The fully-insured premiums KRS pays for the Kentucky Employees’ Health Plan are blended rates based on the combined experience of active and retired members. Because the average cost of providing health care benefits to retirees under age 65 is higher than the average cost of providing health care benefits to active employees, there is an implicit employer subsidy for the non-Medicare eligible retirees. GASB 74 requires that the liability associated with this implicit subsidy be included in the calculation of the Total OPEB Liability. Discount Rates The following single discount rates were used to measure the total OPEB liability as of June 30, 2017.
KERS Non-Hazardous 5.86% KERS Hazardous 5.88% CERS Non-Hazardous 5.85% CERS Hazardous 5.97% SPRS 6.02%
The single discount rates are based on the expected rate of return on OPEB plan investments of 6.25% and a municipal bond rate of 3.62%, as reported in Fidelity Index’s “20-Year Municipal GO AA Index” as of June 30, 2018. Future contributions are projected in accordance with the Board’s current funding policy, which includes the requirement that each participating employer in the System contribute the actuarially determined contribution rate, which is determined using a closed funding period (25 years as of June 30, 2018) and the actuarial assumptions and methods adopted by the Board of Trustees. These projected contributions are determined without regard to the enactment of SB 151 in 2018, which is currently being reviewed by the State Supreme Court. Current assets, future contributions, and investment earnings are projected to be sufficient to pay the projected benefit payments from the retirement system. However, the cost associated with the implicit employer subsidy is not currently being included in the calculation of the System’s actuarial determined contributions, and it is our understanding that any cost associated with the implicit subsidy will not be paid out of the System’s trust. Therefore, the municipal bond rate was applied to future expected benefit payments associated with the implicit subsidy. 401(h) Subaccount Based on guidance issued by GASB in connection with GASB Statement No. 74, the 1% of pay member contributions for Tier 2 and Tier 3 members to a 401(h) subaccount is considered as an OPEB asset. As a result, the reported fiduciary net position includes these 401(h) assets. Additionally, these member contributions and associated investment income are included in the reconciliation of the fiduciary net position.
Board Meeting- December 17, 2018 - Actuarial Valuations- GRS/ Ms. Karen Roggenkamp
331

Board of Trustees November 19, 2018 Page 2
Additional Disclosures The reports are based upon information, furnished to us by the Retirement System, which includes benefit provisions, membership information, and financial data. We did not audit this data and information, but we did apply a number of tests and concluded that it was reasonable and consistent. GRS is not responsible for the accuracy or completeness of the information provided by the Retirement System. Please see the “Actuarial Valuation Report as of June 30, 2017” for additional discussion of the nature of actuarial calculation and more information related to participant data, economic and demographic assumptions, and benefit provisions. These reports should be considered together as a complete report for KRS’s fiscal year ending June 30, 2018. To the best of our knowledge, the reports are complete and accurate and are in accordance with generally recognized actuarial practices and methods. Mr. Newton, Mr. Riazi, and Mr. White are Enrolled Actuaries. All of the undersigned are independent actuaries and consultants and members of the American Academy of Actuaries and meet the Qualification Standards of the American Academy of Actuaries to render the actuarial opinion herein. They are also experienced in performing valuations for large public retirement system. This communication shall not be construed to provide tax advice, legal advice or investment advice. Sincerely, Joseph P. Newton, FSA, EA, MAAA Daniel J. White, FSA, EA, MAAA Pension Market Leader and Actuary Senior Consultant and Actuary Janie Shaw, ASA, MAAA Mehdi Riazi, FSA, EA, MAAA Consultant and Actuary Consultant and Actuary
Board Meeting- December 17, 2018 - Actuarial Valuations- GRS/ Ms. Karen Roggenkamp
332
Kentucky Employees Retirement System GASB No. 74 Accounting Valuation Report As of June 30, 2018
Board Meeting- December 17, 2018 - Actuarial Valuations- GRS/ Ms. Karen Roggenkamp
333

November 19, 2018 Board of Trustees Kentucky Retirement Systems Perimeter Park West 1260 Louisville Road Frankfort, KY 40601
Re: GASB 74 Reporting – Actuarial Information – Kentucky Employees’ Retirement System Dear Members of the Board: This report provided herein contains certain information for the Kentucky Employees’ Retirement System (KERS) in connection with the Governmental Accounting Standards Board (GASB) Statement No. 74, “Financial Reporting for Postemployment Benefit Plans Other than Pension Plans” for the fiscal year ending June 30, 2018. A separate report will provided at a later date with additional accounting information determined in accordance with GASB Statement No. 75, “Accounting and Financial Reporting for Postemployment Benefits Other Than Pensions”. The liability calculations presented in this report were performed for the purpose of satisfying the requirements of GASB No. 74 and are not applicable for other purposes, such as determining the plans’ funding requirements. The plan’s liability for other purposes may produce significantly different results. This report may be provided to parties other than the Board of Trustees of the Kentucky Retirement Systems only in its entirety and only with the permission of the Board. GRS is not responsible for unauthorized use of this report. The total OPEB liability, net OPEB liability, and sensitivity information shown in this report are based on an actuarial valuation date of June 30, 2017. The total OPEB liability was rolled-forward from the valuation date to the plan’s fiscal year ending June 30, 2018 using generally accepted actuarial principles. GASB 74 requires Kentucky Retirement Systems to disclose a 10-year history of certain information in the Required Supplementary Information within their comprehensive annual financial report. The exhibits provided in this report include the applicable information for historical years that were calculated in accordance with this accounting standard. Information disclosed for years prior to June 30, 2017 were prepared by KRS’s prior actuary. There have been no changes in actuarial assumptions since June 30, 2017. However, during the 2018 legislative session, House Bill 185 was enacted, which updated the benefit provisions for active members who die in the line of duty. The system shall now pay 100% of the insurance premium for spouses and children of all active members who die in the line of duty. The Total OPEB liability as of June 30, 2018 is determined using these updated benefit provisions. It is our opinion that this procedure is reasonable, appropriate, and complies with applicable requirements under GASB Statement No. 74.
Board Meeting- December 17, 2018 - Actuarial Valuations- GRS/ Ms. Karen Roggenkamp
334

Board of Trustees November 19, 2018 Page 2
The fully-insured premiums KRS pays for the Kentucky Employees’ Health Plan are blended rates based on the combined experience of active and retired members. Because the average cost of providing health care benefits to retirees under age 65 is higher than the average cost of providing health care benefits to active employees, there is an implicit employer subsidy for the non-Medicare eligible retirees. GASB 74 requires that the liability associated with this implicit subsidy be included in the calculation of the Total OPEB Liability. This report is based upon information, furnished to us by the Retirement System, which includes benefit provisions, membership information, and financial data. We did not audit this data and information, but we did apply a number of tests and concluded that it was reasonable and consistent. GRS is not responsible for the accuracy or completeness of the information provided by the Retirement System. Please see the “Actuarial Valuation Report as of June 30, 2017” for additional discussion of the nature of actuarial calculation and more information related to participant data, economic and demographic assumptions, and benefit provisions. These two reports should be considered together as a complete report for KRS’s fiscal year ending June 30, 2018. A single discount rate of 5.86% for the non-hazardous system and 5.88% for hazardous system was used to measure the total OPEB liability as of June 30, 2017. The single discount rate is based on the expected rate of return on OPEB plan investments of 6.25% and a municipal bond rate of 3.62%, as reported in Fidelity Index’s “20-Year Municipal GO AA Index” as of June 30, 2018. Future contributions are projected in accordance with the Board’s current funding policy, which includes the requirement that each participating employer in the System contribute the actuarially determined contribution rate, which is determined using a closed funding period (25 years as of June 30, 2018) and the actuarial assumptions and methods adopted by the Board of Trustees. These projected contributions are determined without regard to the enactment of SB 151 in 2018, which is currently being reviewed by the State Supreme Court. Current assets, future contributions, and investment earnings are projected to be sufficient to pay the projected benefit payments from the retirement system. However, the cost associated with the implicit employer subsidy is not currently being included in the calculation of the System’s actuarial determined contributions, and it is our understanding that any cost associated with the implicit subsidy will not be paid out of the System’s trust. Therefore, the municipal bond rate was applied to future expected benefit payments associated with the implicit subsidy. Based on guidance issued by GASB in connection with GASB Statement No. 74, the 1% of pay member contributions for Tier 2 and Tier 3 members to a 401(h) subaccount is considered as an OPEB asset. As a result, the reported fiduciary net position includes these 401(h) assets. Additionally, these member contributions and associated investment income are included in the reconciliation of the fiduciary net position. Future actuarial measurements may differ significantly from the current measurements presented in this report due to such factors as the following: plan experience differing from that anticipated by the economic or demographic assumptions; changes in economic or demographic assumptions; increases or decreases expected as part of the natural operation of the methodology used for these measurements; and changes in plan provisions or applicable law.
Board Meeting- December 17, 2018 - Actuarial Valuations- GRS/ Ms. Karen Roggenkamp
335
Board of Trustees November 19, 2018 Page 3
To the best of our knowledge, this report is complete and accurate and is in accordance with generally recognized actuarial practices and methods. Mr. Newton, Mr. White, and Mr. Riazi are Enrolled Actuaries. All of the undersigned are independent actuaries and consultants and members of the American Academy of Actuaries and meet the Qualification Standards of the American Academy of Actuaries to render the actuarial opinion herein. They are also experienced in performing valuations for large public retirement systems. This communication shall not be construed to provide tax advice, legal advice or investment advice. Sincerely, Joseph P. Newton, FSA, EA, MAAA Daniel J. White, FSA, EA, MAAA Pension Market Leader and Actuary Senior Consultant and Actuary Janie Shaw, ASA, MAAA Mehdi Riazi, FSA, EA, MAAA Consultant and Actuary Consultant and Actuary
Board Meeting- December 17, 2018 - Actuarial Valuations- GRS/ Ms. Karen Roggenkamp
336

Table of Contents
Kentucky Employees Retirement System
Page
COVER LETTER
SECTION 1 SUPPORTING EXHIBITS
EXHIBIT 1 — SCHEDULE OF EMPLOYERS’ NET OPEB LIABILITY
EXHIBIT 2 — DEVELOPMENT OF THE SINGLE DISCOUNT RATE
EXHIBIT 3 — SCHEDULE OF CHANGES IN EMPLOYERS’ NET OPEB LIABILITY
EXHIBIT 4 — SCHEDULE OF EMPLOYERS’ CONTRIBUTIONS
EXHIBIT 5 — SENSITIVITY OF THE NET OPEB LIABILITY TO CHANGES IN THE DISCOUNT RATE AND HEALTHCARE TREND RATE
2
4
5
7
10
APPENDIX 1 DEVELOPMENT OF BASELINE CLAIMS COST
Board Meeting- December 17, 2018 - Actuarial Valuations- GRS/ Ms. Karen Roggenkamp
337

SECTION 1
Board Meeting- December 17, 2018 - Actuarial Valuations- GRS/ Ms. Karen Roggenkamp
338

Kentucky Employees Retirement System 2
EXHIBIT 1a
Schedule of the Employers’ Net OPEB Liability – KERS Non-Hazardous Plan ($ in thousands)
Year
Total
OPEB
Liability
Plan
Fiduciary Net
Position
Net OPEB
Liability/(Asset)
Plan Fiduciary
Net Position as a
Percentage of
the Total
OPEB Liability
Covered
Employee
Payroll1
Net OPEB Liability
as a Percentage of
Covered Employee
Payroll
(1) (2) (1) - (2) (2) / (1) (3) [(1) - (2)] / (3)
2018 3,262,117$ 891,205$ 2,370,912$ 27.32% 1,573,898$ 150.64%
2017 3,353,332$ 817,370$ 2,535,962$ 24.37% 1,593,097$ 159.18%
Note:1 Based on derived compensation using the provided employer contribution information.
Board Meeting- December 17, 2018 - Actuarial Valuations- GRS/ Ms. Karen Roggenkamp
339

Kentucky Employees Retirement System 3
EXHIBIT 1b
Schedule of the Employers’ Net OPEB Liability – KERS Hazardous Plan ($ in thousands)
Year
Total
OPEB
Liability
Plan
Fiduciary Net
Position
Net OPEB
Liability/(Asset)
Plan Fiduciary
Net Position as a
Percentage of
the Total
OPEB Liability
Covered
Employee
Payroll1
Net OPEB Liability
as a Percentage of
Covered Employee
Payroll
(1) (2) (1) - (2) (2) / (1) (3) [(1) - (2)] / (3)
2018 485,904$ 519,072$ (33,168)$ 106.83% 190,317$ -17.43%
2017 494,869$ 488,838$ 6,031$ 98.78% 171,087$ 3.53%
Note:1 Based on derived compensation using the provided employer contribution information.
Board Meeting- December 17, 2018 - Actuarial Valuations- GRS/ Ms. Karen Roggenkamp
340

Kentucky Employees Retirement System 4
EXHIBIT 2
Development of Single Discount Rate
KERS
Non-Hazardous
KERS
Hazardous
Single Discount Rate 5.86% 5.88%
Long-Term Expected Rate of Return 6.25% 6.25%
Long-Term Municipal Bond Rate1 3.62% 3.62%
Notes:
1 Fixed-income municipal bonds with 20 years to maturity that include only federally tax-exempt municipal bonds as
reported in Fidelity Index’s “20-Year Municipal GO AA Index” as of June 30, 2018.
Board Meeting- December 17, 2018 - Actuarial Valuations- GRS/ Ms. Karen Roggenkamp
341

Kentucky Employees Retirement System 5
EXHIBIT 3a Schedule of the Employers’ Net OPEB Liability – KERS Non-Hazardous Plan
($ in thousands)
Change in the Net OPEB Liability 2018 2017
Total OPEB liability
Service Cost 66,360$ 46,992$
Interest on the total OPEB liability 191,178 192,911
Benefit Changes 1,865 0
Difference between actual and expected experience (191,147) (3,921)
Assumption Changes (11,235) 414,835
Benefit Payments1(148,236) (139,601)
Net Change in Total OPEB Liability (91,215) 511,216
Total OPEB Liability - Beginning 3,353,332$ 2,842,116$ Total OPEB Liability - Ending (a) 3,262,117$ 3,353,332$
Plan Fiduciary Net Position
Contributions - Employer2 152,985$ 162,636$
Contributions - Member 5,786 5,156
Benefit Payments1 (148,236) (139,601)
OPEB Plan Net Investment Income 64,028 94,239
OPEB Plan Administrative Expense (760) (861)
Other 32 4 0
Net Change in Plan Fiduciary Net Position 73,835 121,569
Plan Fiduciary Net Position - Beginning 817,370$ 695,801$
Plan Fiduciary Net Position - Ending (b) 891,205$ 817,370$
Net OPEB Liability - Ending (a) - (b) 2,370,912 2,535,962
Plan Fiduciary Net Position as a Percentage
of the Total OPEB Liability 27.32% 24.37%
Covered Employee Payroll3 1,573,898$ 1,593,097$
Net OPEB Liability as a Percentage of
Covered Employee Payroll 150.64% 159.18%
Notes:
1 Benefit payments are also offset by insurance premiums received from retirees and by Medicare Drug Reimbursements.
1 Includes expected benefits due to the implicit subsidy for members under age 65.
2 Includes expected benefits due to the implicit subsidy for members under age 65.3 Based on derived compensation using the provided employer contribution information.4 Northern Trust Settlement
Board Meeting- December 17, 2018 - Actuarial Valuations- GRS/ Ms. Karen Roggenkamp
342

Kentucky Employees Retirement System 6
EXHIBIT 3b Schedule of the Employers’ Net OPEB Liability – KERS Hazardous Plan
($ in thousands)
Change in the Net OPEB Liability 2018 2017
Total OPEB liability
Service Cost 12,893$ 8,002$
Interest on the total OPEB liability 28,500 27,591
Benefit Changes 167 0
Difference between actual and expected experience (31,240) (1,029)
Assumption Changes (581) 89,401
Benefit Payments1(18,704) (16,618)
Net Change in Total OPEB Liability (8,965) 107,347
Total OPEB Liability - Beginning 494,869$ 387,522$ Total OPEB Liability - Ending (a) 485,904$ 494,869$
Plan Fiduciary Net Position
Contributions - Employer2 5,165$ 4,579$
Contributions - Member 909 811
Benefit Payments1 (18,704) (16,618)
OPEB Plan Net Investment Income 42,950 59,614
OPEB Plan Administrative Expense (104) (105)
Other 18 4 0
Net Change in Plan Fiduciary Net Position 30,234 48,281
Plan Fiduciary Net Position - Beginning 488,838$ 440,557$
Plan Fiduciary Net Position - Ending (b) 519,072$ 488,838$
Net OPEB Liability - Ending (a) - (b) (33,168) 6,031
Plan Fiduciary Net Position as a Percentage
of the Total OPEB Liability 106.83% 98.78%
Covered Employee Payroll3 190,317$ 171,087$
Net OPEB Liability as a Percentage of
Covered Employee Payroll -17.43% 3.53%
Notes:
4 Northern Trust Settlement
1 Includes expected benefits due to the implicit subsidy for members under age 65.1 Benefit payments are also offset by insurance premiums received from retirees and by Medicare Drug Reimbursements.2 Includes expected benefits due to the implicit subsidy for members under age 65.3 Based on derived compensation using the provided employer contribution information.
Board Meeting- December 17, 2018 - Actuarial Valuations- GRS/ Ms. Karen Roggenkamp
343

Kentucky Employees Retirement System 7
EXHIBIT 4a
Schedule of Employers’ Contributions – KERS Non-Hazardous Plan ($ in thousands)
Fiscal
Year
Ending1
Actuarially
Determined
Contribution2
Total Employer
Contributions3
Contribution
Deficiency
(Excess)
Covered
Employee
Payroll4
Actual
Contributions
as a Percentage
of Covered
Payroll
2018 132,365$ 136,419$ (4,054)$ 1,573,898$ 8.67%
2017 133,024 152,356 (19,332) 1,593,097 9.56%
2016 121,899 135,816 (13,917) 1,529,249 8.88%
2015 130,455 135,940 (5,485) 1,544,234 8.80%
2014 208,881 166,610 42,271 1,577,496 10.56%
2013 286,143 165,331 120,812 1,644,409 10.05%
2012 297,904 156,057 141,847 1,644,897 9.49%
2011 294,898 129,336 165,562 1,731,633 7.47%
2010 376,556 102,528 274,028 1,815,146 5.65%
2009 362,707 82,711 279,996 1,754,413 4.71%
Notes:1 Data for years prior to 2018 are based on contribution data provided in the 2017 CAFR, based
on calculations provided by the prior actuary.2 Actuarially determined contribution for fiscal year ending 2018 is based on the contribution
rate calculated with the the June 30, 2016 actuarial valuation.3 Employer contributions do not include the expected implicit subsidy included in exhibit 3.
4 Based on derived compensation using the provided employer contribution information.
Board Meeting- December 17, 2018 - Actuarial Valuations- GRS/ Ms. Karen Roggenkamp
344

Kentucky Employees Retirement System 8
EXHIBIT 4b
Schedule of Employers’ Contributions – KERS Hazardous Plan ($ in thousands)
Fiscal
Year
Ending1
Actuarially
Determined
Contribution2
Total Employer
Contributions3
Contribution
Deficiency
(Excess)
Covered
Employee
Payroll4
Actual
Contributions
as a Percentage
of Covered
Payroll
2018 2,550$ 5,288$ (2,738)$ 190,317$ 2.78%
2017 4,688 5,620 (932) 171,087 3.28%
2016 9,186 16,766 (7,580) 147,563 11.36%
2015 13,152 14,882 (1,730) 128,680 11.57%
2014 15,627 23,874 (8,247) 129,076 18.50%
2013 26,253 25,682 571 132,015 19.45%
2012 28,326 24,538 3,788 131,977 18.59%
2011 29,585 19,953 9,632 133,054 15.00%
2010 35,045 22,241 12,804 143,558 15.49%
2009 34,670 20,993 13,677 146,044 14.37%
Notes:1 Data for years prior to 2018 are based on contribution data provided in the 2017 CAFR, based
on calculations provided by the prior actuary.2 Actuarially determined contribution for fiscal year ending 2018 is based on the contribution
rate calculated with the the June 30, 2016 actuarial valuation.3 Employer contributions do not include the expected implicit subsidy included in exhibit 3.
4 Based on derived compensation using the provided employer contribution information.
Board Meeting- December 17, 2018 - Actuarial Valuations- GRS/ Ms. Karen Roggenkamp
345

Kentucky Employees Retirement System 9
Notes to Schedule of Employers’ Contributions for FY 2018
The actuarially determined contribution rates effective for fiscal year ending 2018 that are documented in the schedule on the previous pages are calculated as of June 30, 2016. Based on the June 30, 2016 actuarial valuation report (produced by the prior actuary), the actuarial methods and assumptions used to calculate these contribution rates are below:
Item KERS Non-Hazardous KERS Hazardous
Determine by the Actuarial Valuation as of:
June 30, 2016
June 30, 2016
Actuarial Cost Method: Entry Age Normal Entry Age Normal
Asset Valuation Method: 20% of the difference between the market value of assets and the expected actuarial value of assets is recognized
20% of the difference between the market value of assets and the expected actuarial value of assets is recognized
Amortization Method: Level Percent of Pay Level Percent of Pay
Amortization Period: 27 Years, Closed 27 Years, Closed
Payroll Growth Rate: 4.00% 4.00%
Investment Return: 7.50% 7.50%
Inflation: 3.25% 3.25%
Salary Increases: 4.00%, average 4.00%, average
Mortality:
RP-2000 Combined Mortality Table, projected to 2013 with Scale BB (set back 1 year for females)
RP-2000 Combined Mortality Table, projected to 2013 with Scale BB (set back 1 year for females)
Healthcare Trend Rates: Pre-65
Initial trend starting at 7.50% and gradually decreasing to an ultimate trend rate of 5.00% over a period of 5 years.
Initial trend starting at 7.50% and gradually decreasing to an ultimate trend rate of 5.00% over a period of 5 years.
Post-65 Initial trend starting at 5.50% and gradually decreasing to an ultimate trend rate of 5.00% over a period of 2 years.
Initial trend starting at 5.50% and gradually decreasing to an ultimate trend rate of 5.00% over a period of 2 years.
Board Meeting- December 17, 2018 - Actuarial Valuations- GRS/ Ms. Karen Roggenkamp
346

Kentucky Employees Retirement System 10
EXHIBIT 5a
Sensitivity of the Net OPEB Liability to Changes in the Discount Rate and Healthcare Trend Rate KERS Non-Hazardous Plan
($ in thousands)
Table 1. Sensitivity of the Net OPEB Liability to Changes in the Discount Rate
1.00%
Decrease,
Current
Discount Rate,
1.00%
Increase,
4.86% 5.86% 6.86%
2,781,765$ 2,370,912$ 2,028,977$
Table 2. Sensitivity of the Net OPEB Liability to Changes in the Healthcare Cost Trend Rate
1.00%
Decrease
Current Healthcare
Cost Trend Rate
1.00%
Increase
2,015,770$ 2,370,912$ 2,798,022$
Board Meeting- December 17, 2018 - Actuarial Valuations- GRS/ Ms. Karen Roggenkamp
347

Kentucky Employees Retirement System 11
EXHIBIT 5b
Sensitivity of the Net OPEB Liability to Changes in the Discount Rate and Healthcare Trend Rate KERS Hazardous Plan
($ in thousands)
Table 1. Sensitivity of the Net OPEB Liability to Changes in the Discount Rate
1.00%
Decrease,
Current
Discount Rate,
1.00%
Increase,
4.88% 5.88% 6.88%
33,379$ (33,168)$ (86,528)$
Table 2. Sensitivity of the Net OPEB Liability to Changes in the Healthcare Cost Trend Rate
1.00%
Decrease
Current Healthcare
Cost Trend Rate
1.00%
Increase
(85,174)$ (33,168)$ 31,172$
Board Meeting- December 17, 2018 - Actuarial Valuations- GRS/ Ms. Karen Roggenkamp
348

APPENDIX 1
Board Meeting- December 17, 2018 - Actuarial Valuations- GRS/ Ms. Karen Roggenkamp
349

Appendix 1
Kentucky Employees Retirement System 13
Development of Baseline Claims Cost
For non-Medicare retirees, the initial per capita costs were developed using retiree claims experience
for calendar years 2015 through 2017. It is our understanding that no plan changes occurred over this
time period; therefore, no adjustments were applied to the claims for plan changes. The claims were
projected on an incurred claim basis, adjusted for prescription drug rebates, and loaded for
administrative expense. The per capita costs shown in the table below also include a small adjustment
for HRA contributions for retirees on the CDHP plans. An inherent assumption in this methodology is
that the projected future retirees will have a similar distribution by plan type as the current retirees.
The fully-insured premiums KRS pays the Kentucky Employees’ Health Plan are blended rates based on
the combined experience of active and retired members. Because the average cost of providing health
care benefits to retirees under age 65 is higher than the average cost of providing health care benefits
to active employees, there is an implicit employer subsidy for the non-Medicare eligible retirees.
For Medicare retirees, the initial per capita costs were estimated based on the plan premiums effective
January 1, 2018, and are used for both current and future retirees. An inherent assumption in this
methodology is that the projected future retirees will have a similar distribution by plan type as the
current retirees.
Age graded and sex distinct premiums are utilized by this valuation. These costs are appropriate for the
unique age and sex distribution currently existing. Over the future years covered by this valuation, the
age and sex distribution will most likely change. Therefore, our process “distributes” the average
premium over all age/sex combinations and assigns a unique premium for each combination. The
age/sex specific costs more accurately reflect the health care utilization and cost at that age.
FOR THOSE NOT ELIGIBLE FOR MEDICARE
AGE MALE FEMALE
40 50 60 64
$301.81 489.22 831.46
1,011.08
$490.41 602.68 818.70 954.18
FOR THOSE ELIGIBLE FOR MEDICARE
AGE MALE FEMALE
65 75 85
$208.66 244.13 258.16
$196.81 238.22 261.20
Board Meeting- December 17, 2018 - Actuarial Valuations- GRS/ Ms. Karen Roggenkamp
350

Appendix 1
Kentucky Employees Retirement System 14
Mehdi Riazi is a Member of the American Academy of Actuaries (MAAA) and meets the Qualification Standards of the American Academy of Actuaries to render the actuarial opinions contained herein.
Mehdi Riazi, FSA, EA, MAAA
Board Meeting- December 17, 2018 - Actuarial Valuations- GRS/ Ms. Karen Roggenkamp
351

Kentucky County Employees Retirement System GASB No. 74 Accounting Valuation Report As of June 30, 2018
Board Meeting- December 17, 2018 - Actuarial Valuations- GRS/ Ms. Karen Roggenkamp
352

November 19, 2018 Board of Trustees Kentucky Retirement Systems Perimeter Park West 1260 Louisville Road Frankfort, KY 40601
Re: GASB 74 Reporting – Actuarial Information – Kentucky County Employees’ Retirement System Dear Members of the Board: This report provided herein contains certain information for the Kentucky County Employees’ Retirement System (CERS) in connection with the Governmental Accounting Standards Board (GASB) Statement No. 74, “Financial Reporting for Postemployment Benefit Plans Other than Pension Plans” for the fiscal year ending June 30, 2018. A separate report will provided at a later date with additional accounting information determined in accordance with GASB Statement No. 75, “Accounting and Financial Reporting for Postemployment Benefits Other Than Pensions”. The liability calculations presented in this report were performed for the purpose of satisfying the requirements of GASB No. 74 and are not applicable for other purposes, such as determining the plans’ funding requirements. The plan’s liability for other purposes may produce significantly different results. This report may be provided to parties other than the Board of Trustees of the Kentucky Retirement Systems only in its entirety and only with the permission of the Board. GRS is not responsible for unauthorized use of this report. The total OPEB liability, net OPEB liability, and sensitivity information shown in this report are based on an actuarial valuation date of June 30, 2017. The total OPEB liability was rolled-forward from the valuation date to the plan’s fiscal year ending June 30, 2018 using generally accepted actuarial principles. GASB 74 requires Kentucky Retirement Systems to disclose a 10-year history of certain information in the Required Supplementary Information within their comprehensive annual financial report. The exhibits provided in this report include the applicable information for historical years that were calculated in accordance with this accounting standard. Information disclosed for years prior to June 30, 2017 were prepared by KRS’s prior actuary. There have been no changes in actuarial assumptions since June 30, 2017. However, during the 2018 legislative session, House Bill 185 was enacted, which updated the benefit provisions for active members who die in the line of duty. The system shall now pay 100% of the insurance premium for spouses and children of all active members who die in the line of duty. The Total OPEB liability as of June 30, 2018 is determined using these updated benefit provisions. It is our opinion that this procedure is reasonable, appropriate, and complies with applicable requirements under GASB Statement No. 74.
Board Meeting- December 17, 2018 - Actuarial Valuations- GRS/ Ms. Karen Roggenkamp
353
Board of Trustees November 19, 2018 Page 2
The fully-insured premiums KRS pays for the Kentucky Employees’ Health Plan are blended rates based on the combined experience of active and retired members. Because the average cost of providing health care benefits to retirees under age 65 is higher than the average cost of providing health care benefits to active employees, there is an implicit employer subsidy for the non-Medicare eligible retirees. GASB 74 requires that the liability associated with this implicit subsidy be included in the calculation of the Total OPEB Liability. This report is based upon information, furnished to us by the Retirement System, which includes benefit provisions, membership information, and financial data. We did not audit this data and information, but we did apply a number of tests and concluded that it was reasonable and consistent. GRS is not responsible for the accuracy or completeness of the information provided by the Retirement System. Please see the “Actuarial Valuation Report as of June 30, 2017” for additional discussion of the nature of actuarial calculation and more information related to participant data, economic and demographic assumptions, and benefit provisions. These two reports should be considered together as a complete report for KRS’s fiscal year ending June 30, 2018. A single discount rate of 5.85% for the non-hazardous system and 5.97% for hazardous system was used to measure the total OPEB liability as of June 30, 2017. The single discount rate is based on the expected rate of return on OPEB plan investments of 6.25% and a municipal bond rate of 3.62%, as reported in Fidelity Index’s “20-Year Municipal GO AA Index” as of June 30, 2018. Future contributions are projected in accordance with the Board’s current funding policy, which includes the requirement that each participating employer in the System contribute the actuarially determined contribution rate, which is determined using a closed funding period (25 years as of June 30, 2018) and the actuarial assumptions and methods adopted by the Board of Trustees. These projected contributions are determined without regard to the enactment of SB 151 in 2018, which is currently being reviewed by the State Supreme Court. Current assets, future contributions, and investment earnings are projected to be sufficient to pay the projected benefit payments from the retirement system. However, the cost associated with the implicit employer subsidy is not currently being included in the calculation of the System’s actuarial determined contributions, and it is our understanding that any cost associated with the implicit subsidy will not be paid out of the System’s trust. Therefore, the municipal bond rate was applied to future expected benefit payments associated with the implicit subsidy. Based on guidance issued by GASB in connection with GASB Statement No. 74, the 1% of pay member contributions for Tier 2 and Tier 3 members to a 401(h) subaccount is considered as an OPEB asset. As a result, the reported fiduciary net position includes these 401(h) assets. Additionally, these member contributions and associated investment income are included in the reconciliation of the fiduciary net position. Future actuarial measurements may differ significantly from the current measurements presented in this report due to such factors as the following: plan experience differing from that anticipated by the economic or demographic assumptions; changes in economic or demographic assumptions; increases or decreases expected as part of the natural operation of the methodology used for these measurements; and changes in plan provisions or applicable law.
Board Meeting- December 17, 2018 - Actuarial Valuations- GRS/ Ms. Karen Roggenkamp
354

Board of Trustees November 19, 2018 Page 3
To the best of our knowledge, this report is complete and accurate and is in accordance with generally recognized actuarial practices and methods. Mr. Newton, Mr. White, and Mr. Riazi are Enrolled Actuaries. All of the undersigned are independent actuaries and consultants and members of the American Academy of Actuaries and meet the Qualification Standards of the American Academy of Actuaries to render the actuarial opinion herein. They are also experienced in performing valuations for large public retirement systems. This communication shall not be construed to provide tax advice, legal advice or investment advice. Sincerely, Joseph P. Newton, FSA, EA, MAAA Daniel J. White, FSA, EA, MAAA Pension Market Leader and Actuary Senior Consultant and Actuary Janie Shaw, ASA, MAAA Mehdi Riazi, FSA, EA, MAAA Consultant and Actuary Consultant and Actuary
Board Meeting- December 17, 2018 - Actuarial Valuations- GRS/ Ms. Karen Roggenkamp
355

Table of Contents
County Employees Retirement System
Page
COVER LETTER
SECTION 1 SUPPORTING EXHIBITS
EXHIBIT 1 — SCHEDULE OF EMPLOYERS’ NET OPEB LIABILITY
EXHIBIT 2 — DEVELOPMENT OF THE SINGLE DISCOUNT RATE
EXHIBIT 3 — SCHEDULE OF CHANGES IN EMPLOYERS’ NET OPEB LIABILITY
EXHIBIT 4 — SCHEDULE OF EMPLOYERS’ CONTRIBUTIONS
EXHIBIT 5 — SENSITIVITY OF THE NET OPEB LIABILITY TO CHANGES IN THE DISCOUNT RATE AND HEALTHCARE TREND RATE
2
4
5
7
10
APPENDIX 1 DEVELOPMENT OF BASELINE CLAIMS COST
Board Meeting- December 17, 2018 - Actuarial Valuations- GRS/ Ms. Karen Roggenkamp
356

SECTION 1
Board Meeting- December 17, 2018 - Actuarial Valuations- GRS/ Ms. Karen Roggenkamp
357
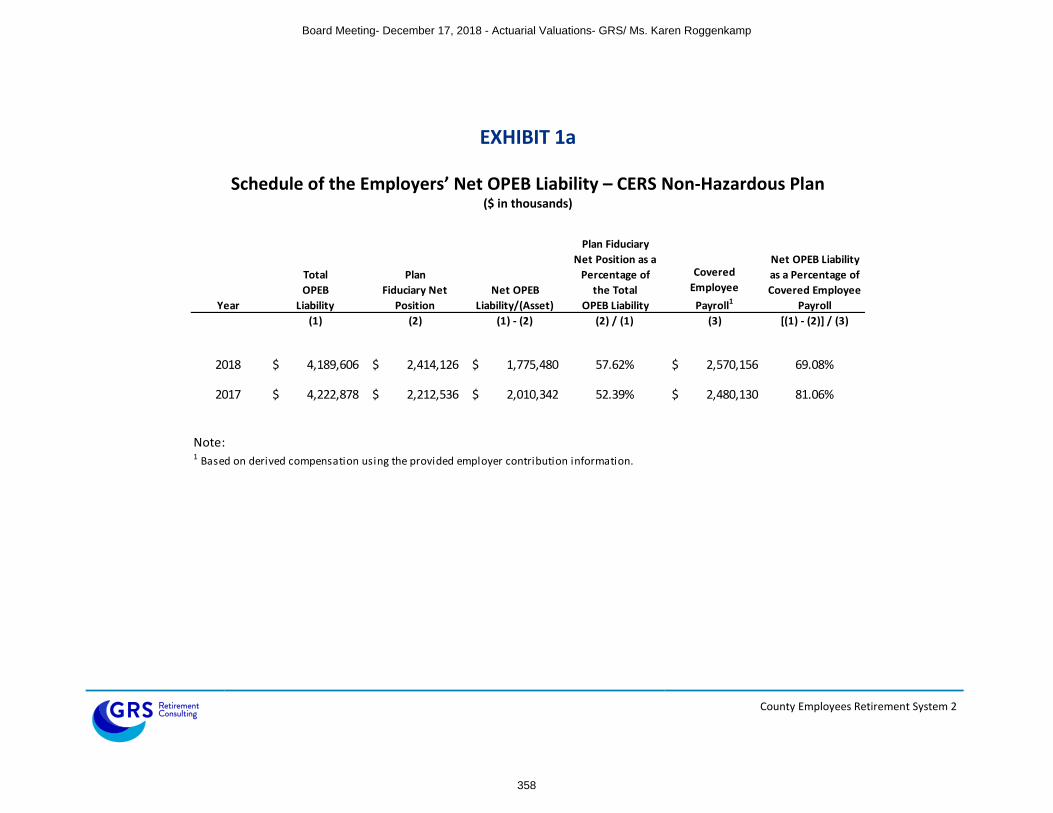
County Employees Retirement System 2
EXHIBIT 1a
Schedule of the Employers’ Net OPEB Liability – CERS Non-Hazardous Plan ($ in thousands)
Year
Total
OPEB
Liability
Plan
Fiduciary Net
Position
Net OPEB
Liability/(Asset)
Plan Fiduciary
Net Position as a
Percentage of
the Total
OPEB Liability
Covered
Employee
Payroll1
Net OPEB Liability
as a Percentage of
Covered Employee
Payroll
(1) (2) (1) - (2) (2) / (1) (3) [(1) - (2)] / (3)
2018 4,189,606$ 2,414,126$ 1,775,480$ 57.62% 2,570,156$ 69.08%
2017 4,222,878$ 2,212,536$ 2,010,342$ 52.39% 2,480,130$ 81.06%
Note:1 Based on derived compensation using the provided employer contribution information.
Board Meeting- December 17, 2018 - Actuarial Valuations- GRS/ Ms. Karen Roggenkamp
358

County Employees Retirement System 3
EXHIBIT 1b
Schedule of the Employers’ Net OPEB Liability – CERS Hazardous Plan ($ in thousands)
Year
Total
OPEB
Liability
Plan
Fiduciary Net
Position
Net OPEB
Liability/(Asset)
Plan Fiduciary
Net Position as a
Percentage of
the Total
OPEB Liability
Covered
Employee
Payroll1
Net OPEB Liability
as a Percentage of
Covered Employee
Payroll
(1) (2) (1) - (2) (2) / (1) (3) [(1) - (2)] / (3)
2018 1,993,941$ 1,280,982$ 712,959$ 64.24% 588,526$ 121.14%
2017 2,015,673$ 1,189,001$ 826,672$ 58.99% 542,710$ 152.32%
Note:1 Based on derived compensation using the provided employer contribution information.
Board Meeting- December 17, 2018 - Actuarial Valuations- GRS/ Ms. Karen Roggenkamp
359

County Employees Retirement System 4
EXHIBIT 2
Development of Single Discount Rate
CERS
Non-Hazardous
CERS
Hazardous
Single Discount Rate 5.85% 5.97%
Long-Term Expected Rate of Return 6.25% 6.25%
Long-Term Municipal Bond Rate1 3.62% 3.62%
Notes:
1 Fixed-income municipal bonds with 20 years to maturity that include only federally tax-exempt municipal bonds as
reported in Fidelity Index’s “20-Year Municipal GO AA Index” as of June 30, 2018.
Board Meeting- December 17, 2018 - Actuarial Valuations- GRS/ Ms. Karen Roggenkamp
360
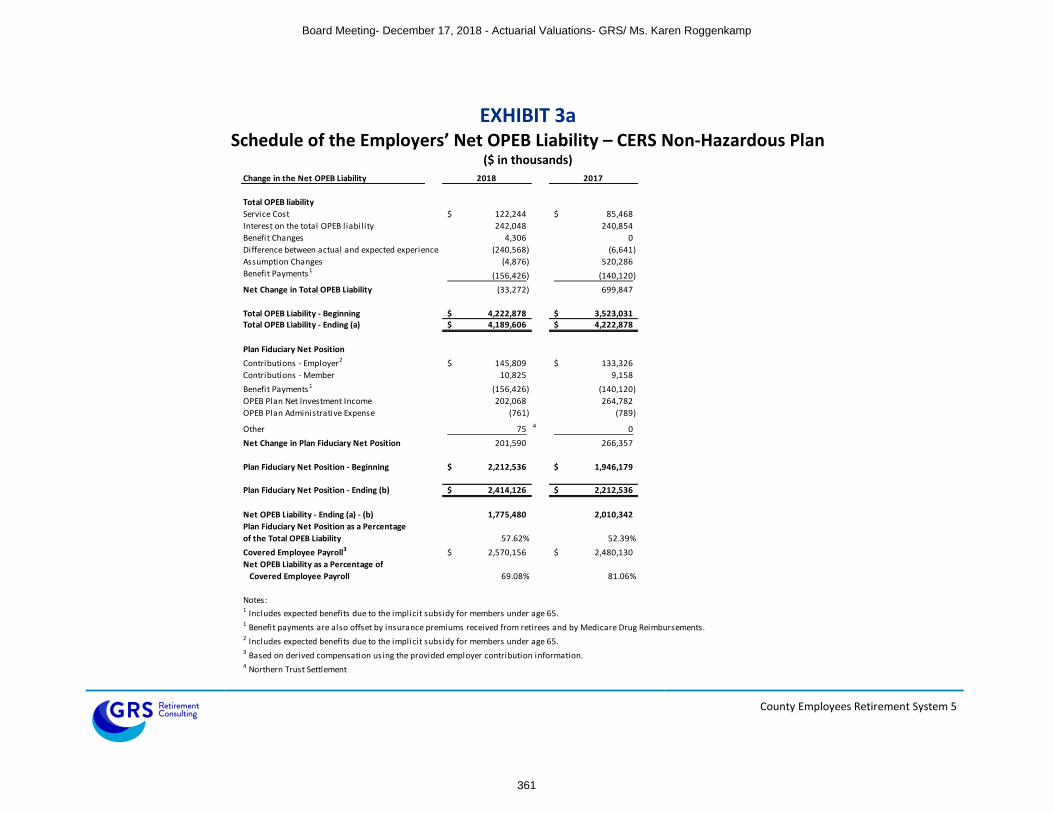
County Employees Retirement System 5
EXHIBIT 3a Schedule of the Employers’ Net OPEB Liability – CERS Non-Hazardous Plan
($ in thousands)
Change in the Net OPEB Liability 2018 2017
Total OPEB liability
Service Cost 122,244$ 85,468$
Interest on the total OPEB liability 242,048 240,854
Benefit Changes 4,306 0
Difference between actual and expected experience (240,568) (6,641)
Assumption Changes (4,876) 520,286
Benefit Payments1(156,426) (140,120)
Net Change in Total OPEB Liability (33,272) 699,847
Total OPEB Liability - Beginning 4,222,878$ 3,523,031$ Total OPEB Liability - Ending (a) 4,189,606$ 4,222,878$
Plan Fiduciary Net Position
Contributions - Employer2 145,809$ 133,326$
Contributions - Member 10,825 9,158
Benefit Payments1 (156,426) (140,120)
OPEB Plan Net Investment Income 202,068 264,782
OPEB Plan Administrative Expense (761) (789)
Other 75 4 0
Net Change in Plan Fiduciary Net Position 201,590 266,357
Plan Fiduciary Net Position - Beginning 2,212,536$ 1,946,179$
Plan Fiduciary Net Position - Ending (b) 2,414,126$ 2,212,536$
Net OPEB Liability - Ending (a) - (b) 1,775,480 2,010,342
Plan Fiduciary Net Position as a Percentage
of the Total OPEB Liability 57.62% 52.39%
Covered Employee Payroll3 2,570,156$ 2,480,130$
Net OPEB Liability as a Percentage of
Covered Employee Payroll 69.08% 81.06%
Notes:
4 Northern Trust Settlement
1 Includes expected benefits due to the implicit subsidy for members under age 65.1 Benefit payments are also offset by insurance premiums received from retirees and by Medicare Drug Reimbursements.2 Includes expected benefits due to the implicit subsidy for members under age 65.3 Based on derived compensation using the provided employer contribution information.
Board Meeting- December 17, 2018 - Actuarial Valuations- GRS/ Ms. Karen Roggenkamp
361

County Employees Retirement System 6
EXHIBIT 3b Schedule of the Employers’ Net OPEB Liability – CERS Hazardous Plan
($ in thousands)
Change in the Net OPEB Liability 2018 2017
Total OPEB liability
Service Cost 33,948$ 20,493$
Interest on the total OPEB liability 118,009 113,166
Benefit Changes 484 0
Difference between actual and expected experience (100,348) (2,470)
Assumption Changes (2,500) 391,061
Benefit Payments1(71,325) (63,656)
Net Change in Total OPEB Liability (21,732) 458,594
Total OPEB Liability - Beginning 2,015,673$ 1,557,079$ Total OPEB Liability - Ending (a) 1,993,941$ 2,015,673$
Plan Fiduciary Net Position
Contributions - Employer2 51,615$ 44,325$
Contributions - Member 2,173 1,708
Benefit Payments1 (71,325) (63,656)
OPEB Plan Net Investment Income 109,854 143,892
OPEB Plan Administrative Expense (376) (381)
Other 40 4 0
Net Change in Plan Fiduciary Net Position 91,981 125,888
Plan Fiduciary Net Position - Beginning 1,189,001$ 1,063,113$
Plan Fiduciary Net Position - Ending (b) 1,280,982$ 1,189,001$
Net OPEB Liability - Ending (a) - (b) 712,959 826,672
Plan Fiduciary Net Position as a Percentage
of the Total OPEB Liability 64.24% 58.99%
Covered Employee Payroll3 588,526$ 542,710$
Net OPEB Liability as a Percentage of
Covered Employee Payroll 121.14% 152.32%
Notes:
4 Northern Trust Settlement
3 Based on derived compensation using the provided employer contribution information.
1 Includes expected benefits due to the implicit subsidy for members under age 65.1 Benefit payments are also offset by insurance premiums received from retirees and by Medicare Drug Reimbursements.2 Includes expected benefits due to the implicit subsidy for members under age 65.
Board Meeting- December 17, 2018 - Actuarial Valuations- GRS/ Ms. Karen Roggenkamp
362

County Employees Retirement System 7
EXHIBIT 4a
Schedule of Employers’ Contributions – CERS Non-Hazardous Plan ($ in thousands)
Fiscal
Year
Ending1
Actuarially
Determined
Contribution2
Total Employer
Contributions3
Contribution
Deficiency
(Excess)
Covered
Employee
Payroll4
Actual
Contributions
as a Percentage
of Covered
Payroll
2018 120,797$ 124,619$ (3,822)$ 2,570,156$ 4.85%
2017 122,270 120,712 1,558 2,480,130 4.87%
2016 110,987 111,836 (849) 2,352,762 4.75%
2015 119,511 119,444 67 2,296,716 5.20%
2014 130,652 123,278 7,374 2,272,270 5.43%
2013 195,561 159,993 35,568 2,236,277 7.15%
2012 214,421 171,925 42,496 2,236,546 7.69%
2011 213,429 186,886 26,543 2,276,596 8.21%
2010 266,331 175,764 90,567 2,236,855 7.86%
2009 264,734 131,476 133,258 2,183,612 6.02%
Notes:
4 Based on derived compensation using the provided employer contribution information.
1 Data for years prior to 2018 are based on contribution data provided in the 2017 CAFR, based
on calculations provided by the prior actuary.2 Actuarially determined contribution for fiscal year ending 2018 is based on the contribution
rate calculated with the the June 30, 2016 actuarial valuation.3 Employer contributions do not include the expected implicit subsidy included in exhibit 3.
Board Meeting- December 17, 2018 - Actuarial Valuations- GRS/ Ms. Karen Roggenkamp
363

County Employees Retirement System 8
EXHIBIT 4b
Schedule of Employers’ Contributions – CERS Hazardous Plan ($ in thousands)
Fiscal
Year
Ending1
Actuarially
Determined
Contribution2
Total Employer
Contributions3
Contribution
Deficiency
(Excess)
Covered
Employee
Payroll4
Actual
Contributions
as a Percentage
of Covered
Payroll
2018 55,027$ 56,002$ (975)$ 588,526$ 9.52%
2017 53,131 51,537 1,594 542,710 9.50%
2016 64,253 67,619 (3,366) 492,851 13.72%
2015 69,103 71,778 (2,675) 483,641 14.84%
2014 74,360 74,792 (432) 479,164 15.61%
2013 102,011 85,319 16,692 461,673 18.48%
2012 110,763 92,564 18,199 464,229 19.94%
2011 109,227 98,592 10,635 466,964 21.11%
2010 129,227 84,536 44,691 466,549 18.12%
2009 126,757 71,413 55,344 469,315 15.22%
Notes:1 Data for years prior to 2018 are based on contribution data provided in the 2017 CAFR, based
on calculations provided by the prior actuary.2 Actuarially determined contribution for fiscal year ending 2018 is based on the contribution
rate calculated with the the June 30, 2016 actuarial valuation.3 Employer contributions do not include the expected implicit subsidy included in exhibit 3.
4 Based on derived compensation using the provided employer contribution information.
Board Meeting- December 17, 2018 - Actuarial Valuations- GRS/ Ms. Karen Roggenkamp
364

County Employees Retirement System 9
Notes to Schedule of Employers’ Contributions for FY 2018
The actuarially determined contribution rates effective for fiscal year ending 2018 that are documented in the schedule on the previous pages are calculated as of June 30, 2016. Based on the June 30, 2016 actuarial valuation report (produced by the prior actuary), the actuarial methods and assumptions used to calculate these contribution rates are below:
Item CERS Non-Hazardous CERS Hazardous
Determine by the Actuarial Valuation as of:
June 30, 2016
June 30, 2016
Actuarial Cost Method: Entry Age Normal Entry Age Normal
Asset Valuation Method: 20% of the difference between the market value of assets and the expected actuarial value of assets is recognized
20% of the difference between the market value of assets and the expected actuarial value of assets is recognized
Amortization Method: Level Percent of Pay Level Percent of Pay
Amortization Period: 27 Years, Closed 27 Years, Closed
Payroll Growth Rate: 4.00% 4.00%
Investment Return: 7.50% 7.50%
Inflation: 3.25% 3.25%
Salary Increases: 4.00%, average 4.00%, average
Mortality:
RP-2000 Combined Mortality Table, projected to 2013 with Scale BB (set back 1 year for females)
RP-2000 Combined Mortality Table, projected to 2013 with Scale BB (set back 1 year for females)
Healthcare Trend Rates: Pre-65
Initial trend starting at 7.50% and gradually decreasing to an ultimate trend rate of 5.00% over a period of 5 years.
Initial trend starting at 7.50% and gradually decreasing to an ultimate trend rate of 5.00% over a period of 5 years.
Post-65 Initial trend starting at 5.50% and gradually decreasing to an ultimate trend rate of 5.00% over a period of 2 years.
Initial trend starting at 5.50% and gradually decreasing to an ultimate trend rate of 5.00% over a period of 2 years.
Board Meeting- December 17, 2018 - Actuarial Valuations- GRS/ Ms. Karen Roggenkamp
365

County Employees Retirement System 10
EXHIBIT 5a
Sensitivity of the Net OPEB Liability to Changes in the Discount Rate and Healthcare Trend Rate CERS Non-Hazardous Plan
($ in thousands)
Table 1. Sensitivity of the Net OPEB Liability to Changes in the Discount Rate
1.00%
Decrease,
Current
Discount Rate,
1.00%
Increase,
4.85% 5.85% 6.85%
2,306,064$ 1,775,480$ 1,323,520$
Table 2. Sensitivity of the Net OPEB Liability to Changes in the Healthcare Cost Trend Rate
1.00%
Decrease
Current Healthcare
Cost Trend Rate
1.00%
Increase
1,321,863$ 1,775,480$ 2,310,165$
Board Meeting- December 17, 2018 - Actuarial Valuations- GRS/ Ms. Karen Roggenkamp
366

County Employees Retirement System 11
EXHIBIT 5b
Sensitivity of the Net OPEB Liability to Changes in the Discount Rate and Healthcare Trend Rate CERS Hazardous Plan
($ in thousands)
Table 1. Sensitivity of the Net OPEB Liability to Changes in the Discount Rate
1.00%
Decrease,
Current
Discount Rate,
1.00%
Increase,
4.97% 5.97% 6.97%
991,049$ 712,959$ 490,342$
Table 2. Sensitivity of the Net OPEB Liability to Changes in the Healthcare Cost Trend Rate
1.00%
Decrease
Current Healthcare
Cost Trend Rate
1.00%
Increase
485,560$ 712,959$ 994,603$
Board Meeting- December 17, 2018 - Actuarial Valuations- GRS/ Ms. Karen Roggenkamp
367

APPENDIX 1
Board Meeting- December 17, 2018 - Actuarial Valuations- GRS/ Ms. Karen Roggenkamp
368

Appendix 1
County Employees Retirement System 13
Development of Baseline Claims Cost
For non-Medicare retirees, the initial per capita costs were developed using retiree claims experience
for calendar years 2015 through 2017. It is our understanding that no plan changes occurred over this
time period; therefore, no adjustments were applied to the claims for plan changes. The claims were
projected on an incurred claim basis, adjusted for prescription drug rebates, and loaded for
administrative expense. The per capita costs shown in the table below also include a small adjustment
for HRA contributions for retirees on the CDHP plans. An inherent assumption in this methodology is
that the projected future retirees will have a similar distribution by plan type as the current retirees.
The fully-insured premiums KRS pays the Kentucky Employees’ Health Plan are blended rates based on
the combined experience of active and retired members. Because the average cost of providing health
care benefits to retirees under age 65 is higher than the average cost of providing health care benefits
to active employees, there is an implicit employer subsidy for the non-Medicare eligible retirees.
For Medicare retirees, the initial per capita costs were estimated based on the plan premiums effective
January 1, 2018, and are used for both current and future retirees. An inherent assumption in this
methodology is that the projected future retirees will have a similar distribution by plan type as the
current retirees.
Age graded and sex distinct premiums are utilized by this valuation. These costs are appropriate for the
unique age and sex distribution currently existing. Over the future years covered by this valuation, the
age and sex distribution will most likely change. Therefore, our process “distributes” the average
premium over all age/sex combinations and assigns a unique premium for each combination. The
age/sex specific costs more accurately reflect the health care utilization and cost at that age.
FOR THOSE NOT ELIGIBLE FOR MEDICARE
AGE MALE FEMALE
40 50 60 64
$301.81 489.22 831.46
1,011.08
$490.41 602.68 818.70 954.18
FOR THOSE ELIGIBLE FOR MEDICARE
AGE MALE FEMALE
65 75 85
$208.66 244.13 258.16
$196.81 238.22 261.20
Board Meeting- December 17, 2018 - Actuarial Valuations- GRS/ Ms. Karen Roggenkamp
369

Appendix 1
County Employees Retirement System 14
Mehdi Riazi is a Member of the American Academy of Actuaries (MAAA) and meets the Qualification Standards of the American Academy of Actuaries to render the actuarial opinions contained herein.
Mehdi Riazi, FSA, EA, MAAA
Board Meeting- December 17, 2018 - Actuarial Valuations- GRS/ Ms. Karen Roggenkamp
370

Kentucky State Police Retirement System GASB No. 74 Accounting Valuation Report As of June 30, 2018
Board Meeting- December 17, 2018 - Actuarial Valuations- GRS/ Ms. Karen Roggenkamp
371

November 19, 2018 Board of Trustees Kentucky Retirement Systems Perimeter Park West 1260 Louisville Road Frankfort, KY 40601
Re: GASB 74 Reporting – Actuarial Information – Kentucky State Police Retirement System Dear Members of the Board: This report provided herein contains certain information for the Kentucky State Police Retirement System (SPRS) in connection with the Governmental Accounting Standards Board (GASB) Statement No. 74, “Financial Reporting for Postemployment Benefit Plans Other than Pension Plans” for the fiscal year ending June 30, 2018. A separate report will provided at a later date with additional accounting information determined in accordance with GASB Statement No. 75, “Accounting and Financial Reporting for Postemployment Benefits Other Than Pensions”. The liability calculations presented in this report were performed for the purpose of satisfying the requirements of GASB No. 74 and are not applicable for other purposes, such as determining the plans’ funding requirements. The plan’s liability for other purposes may produce significantly different results. This report may be provided to parties other than the Board of Trustees of the Kentucky Retirement Systems only in its entirety and only with the permission of the Board. GRS is not responsible for unauthorized use of this report. The total OPEB liability, net OPEB liability, and sensitivity information shown in this report are based on an actuarial valuation date of June 30, 2017. The total OPEB liability was rolled-forward from the valuation date to the plan’s fiscal year ending June 30, 2018 using generally accepted actuarial principles. GASB 74 requires Kentucky Retirement Systems to disclose a 10-year history of certain information in the Required Supplementary Information within their comprehensive annual financial report. The exhibits provided in this report include the applicable information for historical years that were calculated in accordance with this accounting standard. Information disclosed for years prior to June 30, 2017 were prepared by KRS’s prior actuary. There have been no changes in actuarial assumptions since June 30, 2017. However, during the 2018 legislative session, House Bill 185 was enacted, which updated the benefit provisions for active members who die in the line of duty. The system shall now pay 100% of the insurance premium for spouses and children of all active members who die in the line of duty. The Total OPEB liability as of June 30, 2018 is determined using these updated benefit provisions. It is our opinion that this procedure is reasonable, appropriate, and complies with applicable requirements under GASB Statement No. 74.
Board Meeting- December 17, 2018 - Actuarial Valuations- GRS/ Ms. Karen Roggenkamp
372

Board of Trustees November 19, 2018 Page 2
The fully-insured premiums KRS pays for the Kentucky Employees’ Health Plan are blended rates based on the combined experience of active and retired members. Because the average cost of providing health care benefits to retirees under age 65 is higher than the average cost of providing health care benefits to active employees, there is an implicit employer subsidy for the non-Medicare eligible retirees. GASB 74 requires that the liability associated with this implicit subsidy be included in the calculation of the Total OPEB Liability. This report is based upon information, furnished to us by the Retirement System, which includes benefit provisions, membership information, and financial data. We did not audit this data and information, but we did apply a number of tests and concluded that it was reasonable and consistent. GRS is not responsible for the accuracy or completeness of the information provided by the Retirement System. Please see the “Actuarial Valuation Report as of June 30, 2017” for additional discussion of the nature of actuarial calculation and more information related to participant data, economic and demographic assumptions, and benefit provisions. These two reports should be considered together as a complete report for KRS’s fiscal year ending June 30, 2018. A single discount rate of 6.02% was used to measure the total OPEB liability as of June 30, 2017. The single discount rate is based on the expected rate of return on OPEB plan investments of 6.25% and a municipal bond rate of 3.62%, as reported in Fidelity Index’s “20-Year Municipal GO AA Index” as of June 30, 2018. Future contributions are projected in accordance with the Board’s current funding policy, which includes the requirement that each participating employer in the System contribute the actuarially determined contribution rate, which is determined using a closed funding period (25 years as of June 30, 2018) and the actuarial assumptions and methods adopted by the Board of Trustees. These projected contributions are determined without regard to the enactment of SB 151 in 2018, which is currently being reviewed by the State Supreme Court. Current assets, future contributions, and investment earnings are projected to be sufficient to pay the projected benefit payments from the retirement system. However, the cost associated with the implicit employer subsidy is not currently being included in the calculation of the System’s actuarial determined contributions, and it is our understanding that any cost associated with the implicit subsidy will not be paid out of the System’s trust. Therefore, the municipal bond rate was applied to future expected benefit payments associated with the implicit subsidy. Based on guidance issued by GASB in connection with GASB Statement No. 74, the 1% of pay member contributions for Tier 2 and Tier 3 members to a 401(h) subaccount is considered as an OPEB asset. As a result, the reported fiduciary net position includes these 401(h) assets. Additionally, these member contributions and associated investment income are included in the reconciliation of the fiduciary net position. Future actuarial measurements may differ significantly from the current measurements presented in this report due to such factors as the following: plan experience differing from that anticipated by the economic or demographic assumptions; changes in economic or demographic assumptions; increases or decreases expected as part of the natural operation of the methodology used for these measurements; and changes in plan provisions or applicable law.
Board Meeting- December 17, 2018 - Actuarial Valuations- GRS/ Ms. Karen Roggenkamp
373

Board of Trustees November 19, 2018 Page 3
To the best of our knowledge, this report is complete and accurate and is in accordance with generally recognized actuarial practices and methods. Mr. Newton, Mr. White, and Mr. Riazi are Enrolled Actuaries. All of the undersigned are independent actuaries and consultants and members of the American Academy of Actuaries and meet the Qualification Standards of the American Academy of Actuaries to render the actuarial opinion herein. They are also experienced in performing valuations for large public retirement systems. This communication shall not be construed to provide tax advice, legal advice or investment advice. Sincerely, Joseph P. Newton, FSA, EA, MAAA Daniel J. White, FSA, EA, MAAA Pension Market Leader and Actuary Senior Consultant and Actuary Janie Shaw, ASA, MAAA Mehdi Riazi, FSA, EA, MAAA Consultant and Actuary Consultant and Actuary
Board Meeting- December 17, 2018 - Actuarial Valuations- GRS/ Ms. Karen Roggenkamp
374

Table of Contents
State Police Retirement System
Page
COVER LETTER
SECTION 1 SUPPORTING EXHIBITS
EXHIBIT 1 — SCHEDULE OF EMPLOYERS’ NET OPEB LIABILITY
EXHIBIT 2 — DEVELOPMENT OF THE SINGLE DISCOUNT RATE
EXHIBIT 3 — SCHEDULE OF CHANGES IN EMPLOYERS’ NET OPEB LIABILITY
EXHIBIT 4 — SCHEDULE OF EMPLOYERS’ CONTRIBUTIONS
EXHIBIT 5 — SENSITIVITY OF THE NET OPEB LIABILITY TO CHANGES IN THE DISCOUNT RATE AND HEALTHCARE TREND RATE
2
3
4
5
7
APPENDIX 1 DEVELOPMENT OF BASELINE CLAIMS COST
Board Meeting- December 17, 2018 - Actuarial Valuations- GRS/ Ms. Karen Roggenkamp
375

SECTION 1
Board Meeting- December 17, 2018 - Actuarial Valuations- GRS/ Ms. Karen Roggenkamp
376

State Police Retirement System 2
EXHIBIT 1
Schedule of the Employers’ Net OPEB Liability ($ in thousands)
Year
Total
OPEB
Liability
Plan
Fiduciary Net
Position
Net OPEB
Liability/(Asset)
Plan Fiduciary
Net Position as a
Percentage of
the Total
OPEB Liability
Covered
Employee
Payroll1
Net OPEB Liability
as a Percentage of
Covered Employee
Payroll
(1) (2) (1) - (2) (2) / (1) (3) [(1) - (2)] / (3)
2018 301,012$ 190,847$ 110,165$ 63.40% 50,064$ 220.05%
2017 313,234$ 178,838$ 134,396$ 57.09% 48,873$ 274.99%
Note:1 Based on derived compensation using the provided employer contribution information.
Board Meeting- December 17, 2018 - Actuarial Valuations- GRS/ Ms. Karen Roggenkamp
377

State Police Retirement System 3
EXHIBIT 2
Development of Single Discount Rate
SPRS
Single Discount Rate 6.02%
Long-Term Expected Rate of Return 6.25%
Long-Term Municipal Bond Rate1 3.62%
Notes:
1 Fixed-income municipal bonds with 20 years to maturity that include only federally tax-exempt municipal bonds as
reported in Fidelity Index’s “20-Year Municipal GO AA Index” as of June 30, 2018.
Board Meeting- December 17, 2018 - Actuarial Valuations- GRS/ Ms. Karen Roggenkamp
378

State Police Retirement System 4
EXHIBIT 3 Schedule of the Employers’ Net OPEB Liability
($ in thousands)
Change in the Net OPEB Liability 2018 2017
Total OPEB liability
Service Cost 6,087$ 4,147$
Interest on the total OPEB liability 18,432 17,993
Benefit Changes 34 0
Difference between actual and expected experience (23,320) (573)
Assumption Changes (358) 57,312
Benefit Payments1(13,097) (12,123)
Net Change in Total OPEB Liability (12,222) 66,756
Total OPEB Liability - Beginning 313,234$ 246,478$ Total OPEB Liability - Ending (a) 301,012$ 313,234$
Plan Fiduciary Net Position
Contributions - Employer2 8,535$ 7,862$
Contributions - Member 155 131
Benefit Payments1 (13,097) (12,123)
OPEB Plan Net Investment Income 16,470 21,627
OPEB Plan Administrative Expense (62) (66)
Other 8 4 0
Net Change in Plan Fiduciary Net Position 12,009 17,431
Plan Fiduciary Net Position - Beginning 178,838$ 161,407$
Plan Fiduciary Net Position - Ending (b) 190,847$ 178,838$
Net OPEB Liability - Ending (a) - (b) 110,165 134,396
Plan Fiduciary Net Position as a Percentage
of the Total OPEB Liability 63.40% 57.09%
Covered Employee Payroll3 50,064$ 48,873$
Net OPEB Liability as a Percentage of
Covered Employee Payroll 220.05% 274.99%
Notes:
3 Based on derived compensation using the provided employer contribution information.4 Northern Trust Settlement
2 Includes expected benefits due to the implicit subsidy for members under age 65.
1 Includes expected benefits due to the implicit subsidy for members under age 65.1 Benefit payments are also offset by insurance premiums received from retirees and by Medicare Drug Reimbursements.
Board Meeting- December 17, 2018 - Actuarial Valuations- GRS/ Ms. Karen Roggenkamp
379

State Police Retirement System 5
EXHIBIT 4 Schedule of Employers’ Contributions
($ in thousands)
Fiscal
Year
Ending1
Actuarially
Determined
Contribution2
Total Employer
Contributions3
Contribution
Deficiency
(Excess)
Covered
Employee
Payroll4
Actual
Contributions
as a Percentage
of Covered
Payroll
2018 9,062$ 9,397$ (335)$ 50,064$ 18.77%
2017 9,222 9,222 0 48,873 18.87%
2016 8,553 10,237 (1,684) 45,551 22.47%
2015 9,890 10,382 (492) 45,765 22.69%
2014 20,879 14,493 6,386 44,616 32.48%
2013 27,234 16,829 10,405 45,256 37.19%
2012 28,247 11,960 16,287 48,373 24.72%
2011 25,773 11,051 14,722 48,693 22.70%
2010 30,302 8,643 21,659 51,507 16.78%
2009 29,325 7,643 21,682 51,660 14.79%
Notes:
3 Employer contributions do not include the expected implicit subsidy included in exhibit 3.
4 Based on derived compensation using the provided employer contribution information.
1 Data for years prior to 2018 are based on contribution data provided in the 2017 CAFR, based
on calculations provided by the prior actuary.2 Actuarially determined contribution for fiscal year ending 2018 is based on the contribution
rate calculated with the the June 30, 2016 actuarial valuation.
Board Meeting- December 17, 2018 - Actuarial Valuations- GRS/ Ms. Karen Roggenkamp
380

State Police Retirement System 6
Notes to Schedule of Employers’ Contributions for FY 2018
The actuarially determined contribution rates effective for fiscal year ending 2018 that are documented in the schedule on the previous pages are calculated as of June 30, 2016. Based on the June 30, 2016 actuarial valuation report (produced by the prior actuary), the actuarial methods and assumptions used to calculate these contribution rates are below:
Item SPRS
Determine by the Actuarial Valuation as of:
June 30, 2016
Actuarial Cost Method: Entry Age Normal
Asset Valuation Method: 20% of the difference between the market value of assets and the expected actuarial value of assets is recognized
Amortization Method: Level Percent of Pay
Amortization Period: 27 Years, Closed
Payroll Growth Rate: 4.00%
Investment Return: 7.50%
Inflation: 3.25%
Salary Increases: 4.00%, average
Mortality:
RP-2000 Combined Mortality Table, projected to 2013 with Scale BB (set back 1 year for females)
Healthcare Trend Rates: Pre-65
Initial trend starting at 7.50% and gradually decreasing to an ultimate trend rate of 5.00% over a period of 5 years.
Post-65 Initial trend starting at 5.50% and gradually decreasing to an ultimate trend rate of 5.00% over a period of 2 years.
Board Meeting- December 17, 2018 - Actuarial Valuations- GRS/ Ms. Karen Roggenkamp
381

State Police Retirement System 7
EXHIBIT 5
Sensitivity of the Net OPEB Liability to Changes in the Discount Rate and Healthcare Trend Rate ($ in thousands)
Table 1. Sensitivity of the Net OPEB Liability to Changes in the Discount Rate
1.00%
Decrease,
Current
Discount Rate,
1.00%
Increase,
5.02% 6.02% 7.02%
149,812$ 110,165$ 77,519$
Table 2. Sensitivity of the Net OPEB Liability to Changes in the Healthcare Cost Trend Rate
1.00%
Decrease
Current Healthcare
Cost Trend Rate
1.00%
Increase
75,342$ 110,165$ 152,264$
Board Meeting- December 17, 2018 - Actuarial Valuations- GRS/ Ms. Karen Roggenkamp
382

APPENDIX 1
Board Meeting- December 17, 2018 - Actuarial Valuations- GRS/ Ms. Karen Roggenkamp
383

Appendix 1
State Police Retirement System 9
Development of Baseline Claims Cost
For non-Medicare retirees, the initial per capita costs were developed using retiree claims experience
for calendar years 2015 through 2017. It is our understanding that no plan changes occurred over this
time period; therefore, no adjustments were applied to the claims for plan changes. The claims were
projected on an incurred claim basis, adjusted for prescription drug rebates, and loaded for
administrative expense. The per capita costs shown in the table below also include a small adjustment
for HRA contributions for retirees on the CDHP plans. An inherent assumption in this methodology is
that the projected future retirees will have a similar distribution by plan type as the current retirees.
The fully-insured premiums KRS pays the Kentucky Employees’ Health Plan are blended rates based on
the combined experience of active and retired members. Because the average cost of providing health
care benefits to retirees under age 65 is higher than the average cost of providing health care benefits
to active employees, there is an implicit employer subsidy for the non-Medicare eligible retirees.
For Medicare retirees, the initial per capita costs were estimated based on the plan premiums effective
January 1, 2018, and are used for both current and future retirees. An inherent assumption in this
methodology is that the projected future retirees will have a similar distribution by plan type as the
current retirees.
Age graded and sex distinct premiums are utilized by this valuation. These costs are appropriate for the
unique age and sex distribution currently existing. Over the future years covered by this valuation, the
age and sex distribution will most likely change. Therefore, our process “distributes” the average
premium over all age/sex combinations and assigns a unique premium for each combination. The
age/sex specific costs more accurately reflect the health care utilization and cost at that age.
FOR THOSE NOT ELIGIBLE FOR MEDICARE
AGE MALE FEMALE
40 50 60 64
$301.81 489.22 831.46
1,011.08
$490.41 602.68 818.70 954.18
FOR THOSE ELIGIBLE FOR MEDICARE
AGE MALE FEMALE
65 75 85
$208.66 244.13 258.16
$196.81 238.22 261.20
Board Meeting- December 17, 2018 - Actuarial Valuations- GRS/ Ms. Karen Roggenkamp
384

Appendix 1
State Police Retirement System 10
Mehdi Riazi is a Member of the American Academy of Actuaries (MAAA) and meets the Qualification Standards of the American Academy of Actuaries to render the actuarial opinions contained herein.
Mehdi Riazi, FSA, EA, MAAA
Board Meeting- December 17, 2018 - Actuarial Valuations- GRS/ Ms. Karen Roggenkamp
385
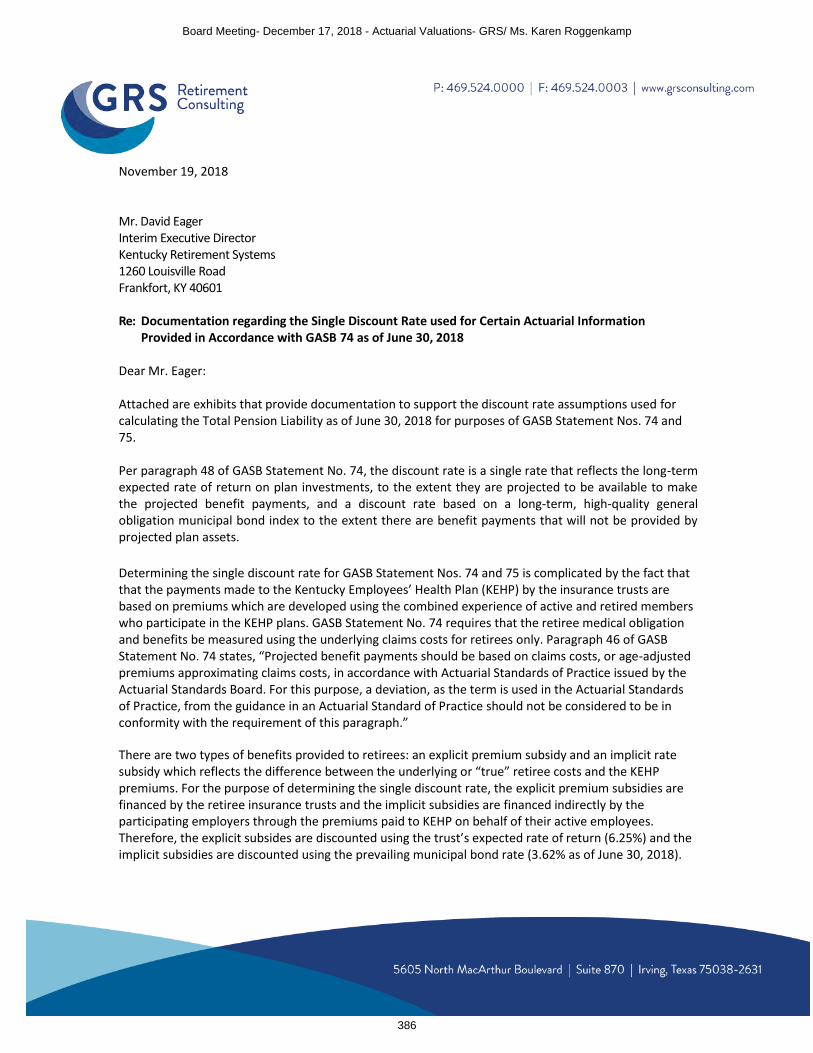
November 19, 2018 Mr. David Eager Interim Executive Director Kentucky Retirement Systems 1260 Louisville Road Frankfort, KY 40601 Re: Documentation regarding the Single Discount Rate used for Certain Actuarial Information
Provided in Accordance with GASB 74 as of June 30, 2018 Dear Mr. Eager: Attached are exhibits that provide documentation to support the discount rate assumptions used for calculating the Total Pension Liability as of June 30, 2018 for purposes of GASB Statement Nos. 74 and 75. Per paragraph 48 of GASB Statement No. 74, the discount rate is a single rate that reflects the long-term expected rate of return on plan investments, to the extent they are projected to be available to make the projected benefit payments, and a discount rate based on a long-term, high-quality general obligation municipal bond index to the extent there are benefit payments that will not be provided by projected plan assets.
Determining the single discount rate for GASB Statement Nos. 74 and 75 is complicated by the fact that that the payments made to the Kentucky Employees’ Health Plan (KEHP) by the insurance trusts are based on premiums which are developed using the combined experience of active and retired members who participate in the KEHP plans. GASB Statement No. 74 requires that the retiree medical obligation and benefits be measured using the underlying claims costs for retirees only. Paragraph 46 of GASB Statement No. 74 states, “Projected benefit payments should be based on claims costs, or age-adjusted premiums approximating claims costs, in accordance with Actuarial Standards of Practice issued by the Actuarial Standards Board. For this purpose, a deviation, as the term is used in the Actuarial Standards of Practice, from the guidance in an Actuarial Standard of Practice should not be considered to be in conformity with the requirement of this paragraph.” There are two types of benefits provided to retirees: an explicit premium subsidy and an implicit rate subsidy which reflects the difference between the underlying or “true” retiree costs and the KEHP premiums. For the purpose of determining the single discount rate, the explicit premium subsidies are financed by the retiree insurance trusts and the implicit subsidies are financed indirectly by the participating employers through the premiums paid to KEHP on behalf of their active employees. Therefore, the explicit subsides are discounted using the trust’s expected rate of return (6.25%) and the implicit subsidies are discounted using the prevailing municipal bond rate (3.62% as of June 30, 2018).
Board Meeting- December 17, 2018 - Actuarial Valuations- GRS/ Ms. Karen Roggenkamp
386

Mr. David Eager November 19, 2018 Page 2
The attached documentation provides two tables for each system. Table 1 demonstrates that current assets, future contributions, and investment earnings are projected to be sufficient to pay the projected explicit benefit payments under the Board’s current funding policy. Table 2 demonstrates how the present value of the combined explicit and implicit benefits using the single discount rate equals the present value of the explicit benefits discounted at the long-term rate of return plus the present value of the implicit subsidies discounted at the municipal bond rate. The future contributions in Table 1 are projected in accordance with the Board’s current funding policy, which includes the requirement that each participating employer in the System contribute the actuarially determined contribution rate (except where noted below), which is determined using a closed funding period (26 years as of June 30, 2017) and the actuarial assumptions and methods adopted be the Board of Trustees. The contribution rates were determined without regard to enactment of SB 151 in 2018, which is currently being reviewed by the State Supreme Court. They do, however, reflect the following contribution rates budgeted for the KERS and SPRS systems in HB 200 for fiscal years ending 2019 and 2020. Plan FYE 2019 FYE 2020 KERS Non-Hazardous 12.40%* 12.40% KERS Hazardous 2.46% 2.46% SPRS 27.23% 27.23% * Per HB 285, contribution rates for certain agencies are reduced to 8.41% for FYE 2019 The contribution rates for the CERS system reflect the phase-in provisions in HB 362 that do not allow the contribution rates to increase by more than 12% each year through fiscal year ending 2028. The contribution rate for fiscal year ending 2019 was assumed to be 5.26% for the CERS Non-Hazardous system and 10.47% for the CERS Hazardous system. As a result, the single discount rates used to determine the Total OPEB Liability at June 30, 2018 are as follows: KERS Non-Hazardous 5.86% KERS Hazardous 5.88% CERS Non-Hazardous 5.85% CERS Hazardous 5.97% SPRS 6.02% These exhibits are not required disclosures in KRS’s financial statements. Rather, we expect this information will be requested by your external auditor as part of their audit process. Their sole purpose is to document the calculation of the SDR used for calculating the Total OPEB Liability as of June 30, 2018 for purposes of GASB Statement Nos. 74 and 75. These projections have no other meaningful use and should not be used to project or communicate the long-term financial status of the Plan.
Board Meeting- December 17, 2018 - Actuarial Valuations- GRS/ Ms. Karen Roggenkamp
387

Mr. David Eager November 19, 2018 Page 3
It is important to note that an important assumption in this demonstration is the participating employers will contribute the full actuarially determined contribution rate over a closed amortization period. If there is a legislative change that results in the participating employers contributing an amount that is less than the actuarially determined contributions, then this demonstration may need to be updated to reflect the new funding policy. Certification We certify that the undersigned are members of the American Academy of Actuaries and that we meet all of the Qualification Standards of the American Academy of Actuaries to render the actuarial opinion contained herein. If you have any questions, or require any additional or clarifying information, please do not hesitate to contact either of us. Sincerely, Joseph P. Newton, FSA, EA, MAAA Daniel J. White, FSA, EA, MAAA Pension Market Leader Senior Consultant Janie Shaw, ASA, MAAA Mehdi Riazi, FSA, EA, MAAA Consultant Consultant
Board Meeting- December 17, 2018 - Actuarial Valuations- GRS/ Ms. Karen Roggenkamp
388

Kentucky Employees Retirement System (KERS) - Non-Hazardous
GASB 74 - Discount Rate Development as of June 30, 2018 (Year 1 is FYE June 30, 2019)
Kentucky Retirement Systems
Table 1. Projection of the System's Fiduciary Net Position
Year
Projected
Beginning Plan Net
Position
Projected Total
Contributions1
Projected
Explicit Benefit
Payments2
Projected
Administrative
Expenses3
Projected
Investment
Earnings at 6.25%
Projected
Ending Plan
Net Position
(1) (2) (3) (4) (5) (6) (7)
1 891,204,988$ 167,035,934$ (139,581,395)$ (852,314)$ 56,519,033$ 974,326,245$ 2 974,326,245 188,534,979 (148,791,951) (800,764) 62,093,893 1,075,362,402 3 1,075,362,402 187,860,419 (157,514,061) (754,997) 68,120,866 1,173,074,629 4 1,173,074,629 185,175,284 (166,026,179) (712,727) 73,884,570 1,265,395,577 5 1,265,395,577 181,544,595 (174,252,583) (672,202) 79,290,957 1,351,306,344 6 1,351,306,344 178,869,099 (182,782,511) (634,332) 84,316,683 1,431,075,283 7 1,431,075,283 176,489,364 (191,084,860) (597,534) 88,974,619 1,504,856,871 8 1,504,856,871 174,185,900 (199,102,873) (562,051) 93,269,402 1,572,647,249 9 1,572,647,249 171,911,899 (207,306,573) (527,172) 97,184,908 1,633,910,311
10 1,633,910,311 169,590,574 (216,217,048) (491,917) 100,669,260 1,687,461,181 11 1,687,461,181 167,272,250 (224,661,485) (456,944) 103,686,027 1,733,301,029 12 1,733,301,029 165,012,070 (232,793,355) (422,827) 106,232,237 1,771,329,154 13 1,771,329,154 162,912,871 (238,966,525) (390,620) 108,355,392 1,803,240,271 14 1,803,240,271 161,152,471 (243,028,547) (361,152) 110,171,551 1,831,174,595 15 1,831,174,595 159,573,548 (245,639,188) (332,090) 111,789,400 1,856,566,265 16 1,856,566,265 158,161,926 (247,613,926) (304,093) 113,273,021 1,880,083,193 17 1,880,083,193 156,820,111 (248,304,687) (275,556) 114,681,152 1,903,004,212 18 1,903,004,212 155,601,290 (246,950,297) (248,315) 116,118,727 1,927,525,617 19 1,927,525,617 154,641,099 (243,853,210) (226,057) 117,717,766 1,955,805,215 20 1,955,805,215 153,877,640 (239,952,011) (207,565) 119,582,378 1,989,105,657 21 1,989,105,657 153,245,851 (235,410,144) (191,300) 121,784,494 2,028,534,558 22 2,028,534,558 152,685,319 (230,125,040) (175,925) 124,394,679 2,075,313,591 23 2,075,313,591 152,159,777 (224,583,746) (160,541) 127,473,209 2,130,202,291 24 2,130,202,291 151,651,767 (218,876,862) (144,773) 131,064,241 2,193,896,664 25 2,193,896,664 151,156,082 (212,786,220) (128,789) 135,217,823 2,267,355,560 26 2,267,355,560 3,187,459 (207,229,210) (112,720) 135,426,582 2,198,627,671 27 2,198,627,671 2,720,082 (202,409,750) (96,743) 131,265,521 2,130,106,782 28 2,130,106,782 2,283,813 (198,156,751) (81,561) 127,100,899 2,061,253,182 29 2,061,253,182 1,873,257 (194,935,026) (67,098) 122,884,512 1,991,008,827 30 1,991,008,827 1,502,707 (192,084,519) (53,939) 118,570,968 1,918,944,044 31 1,918,944,044 1,178,634 (189,386,079) (42,373) 114,140,350 1,844,834,576 32 1,844,834,576 903,337 (186,625,927) (32,513) 109,585,286 1,768,664,759 33 1,768,664,759 669,772 (183,556,392) (24,126) 104,912,212 1,690,666,225 34 1,690,666,225 479,617 (179,987,865) (17,288) 100,141,489 1,611,282,177 35 1,611,282,177 336,362 (175,866,014) (12,132) 95,302,591 1,531,042,984 36 1,531,042,984 231,696 (171,246,082) (8,362) 90,426,721 1,450,446,958 37 1,450,446,958 157,029 (166,146,721) (5,670) 85,544,194 1,369,995,790 38 1,369,995,790 104,530 (160,664,738) (3,776) 80,683,154 1,290,114,961 39 1,290,114,961 69,260 (154,908,781) (2,503) 75,866,704 1,211,139,640 40 1,211,139,640 45,802 (148,941,101) (1,656) 71,113,714 1,133,356,400 41 1,133,356,400 30,234 (142,798,343) (1,093) 66,440,852 1,057,028,049 42 1,057,028,049 19,905 (136,554,351) (720) 61,862,191 982,355,074 43 982,355,074 13,055 (130,220,692) (472) 57,389,855 909,536,820 44 909,536,820 8,520 (123,789,411) (308) 53,036,510 838,792,132 45 838,792,132 5,509 (117,277,826) (199) 48,815,281 770,334,896 46 770,334,896 3,526 (110,691,163) (128) 44,739,359 704,386,491 47 704,386,491 2,206 (104,053,595) (80) 40,821,825 641,156,847 48 641,156,847 1,350 (97,391,286) (49) 37,074,990 580,841,851 49 580,841,851 794 (90,743,313) (29) 33,509,886 523,609,190 50 523,609,190 448 (84,147,389) (16) 30,135,833 469,598,066 51 469,598,066 230 (77,644,873) (8) 26,960,256 418,913,670 52 418,913,670 106 (71,277,639) (4) 23,988,438 371,624,572 53 371,624,572 48 (65,084,885) (2) 21,223,459 327,763,192 54 327,763,192 20 (59,099,174) (1) 18,666,340 287,330,377 55 287,330,377 7 (53,349,573) (0) 16,316,240 250,297,051 56 250,297,051 1 (47,865,314) (0) 14,170,443 216,602,181 57 216,602,181 - (42,668,707) - 12,224,447 186,157,921 58 186,157,921 - (37,783,797) - 10,472,021 158,846,145 59 158,846,145 - (33,230,895) - 8,905,157 134,520,407 60 134,520,407 - (29,017,816) - 7,514,461 113,017,052 61 113,017,052 - (25,151,042) - 6,289,507 94,155,517 62 94,155,517 - (21,629,725) - 5,219,035 77,744,827 63 77,744,827 - (18,444,780) - 4,291,388 63,591,435 64 63,591,435 - (15,589,186) - 3,494,686 51,496,935 65 51,496,935 - (13,046,963) - 2,817,020 41,266,992 66 41,266,992 - (10,801,156) - 2,246,766 32,712,602 67 32,712,602 - (8,837,264) - 1,772,558 25,647,896 68 25,647,896 - (7,139,838) - 1,383,255 19,891,313 69 19,891,313 - (5,693,100) - 1,067,994 15,266,207 70 15,266,207 - (4,480,326) - 816,250 11,602,131 71 11,602,131 - (3,481,477) - 617,986 8,738,640 72 8,738,640 - (2,673,218) - 463,893 6,529,315 73 6,529,315 - (2,031,085) - 345,573 4,843,803 74 4,843,803 - (1,530,179) - 255,644 3,569,268 75 3,569,268 - (1,146,339) - 187,799 2,610,729 76 2,610,729 - (854,557) - 136,870 1,893,042 77 1,893,042 - (632,710) - 98,843 1,359,174 78 1,359,174 - (464,414) - 70,655 965,415 79 965,415 - (337,505) - 49,951 677,861 80 677,861 - (242,671) - 34,898 470,089 81 470,089 - (172,380) - 24,075 321,784 82 321,784 - (120,853) - 16,392 217,323 83 217,323 - (83,550) - 11,011 144,784 84 144,784 - (56,972) - 7,296 95,107 85 95,107 - (38,284) - 4,766 61,589 86 61,589 - (25,354) - 3,069 39,304 87 39,304 - (16,551) - 1,947 24,700 88 24,700 - (10,648) - 1,216 15,268 89 15,268 - (6,749) - 747 9,266 90 9,266 - (4,210) - 450 5,506 91 5,506 - (2,581) - 265 3,190 92 3,190 - (1,549) - 152 1,793 93 1,793 - (909) - 84 968 94 968 - (516) - 45 496 95 496 - (282) - 22 236 96 236 - (143) - 10 103 97 103 - (67) - 4 41 98 41 - (30) - 2 12 99 12 - (13) - 0 0
100 0 - - - 0 0
Notes and Assumptions:1 Future employer contributions are assumed to be equal to the projected payroll times the actuarially determined contribution rate (the amortization
cost on the payroll of future active members of the system). Contributions are determined without regard to enactment of SB 151 in 2018, which is currently being reviewed by the State Supreme Court. Future member contributions are equal to 1.00% of Tier 2 and Tier 3 members' payroll.
2 Expected future benefit payments (without an implicit subsidy) based on the 2017 actuarial valuation, adjusted to reflect HB 185 passed during the 2018 legislative session.
3 Assumed to be equal to 0.06% of current payroll.
Board Meeting- December 17, 2018 - Actuarial Valuations- GRS/ Ms. Karen Roggenkamp
389

Kentucky Employees Retirement System (KERS) - Non-Hazardous
GASB 74 - Discount Rate Development as of June 30, 2018 (Year 1 is FYE June 30, 2019)
Kentucky Retirement Systems
Table 2. Actuarial Present Values of Projected Benefit Payments
Year
"Funded"/Explicit
Portion of
Benefit Payments1
"Unfunded"/Implicit
Portion of
Benefit Payments
Total Benefit
Payments
Present Value
of Explicit
Benefit Payments2
Present Value
of Implicit
Benefit Payments3
Present Value of
Benefit Payments
Using the Single
Discount Rate4
(1) (2) (3) (4) (5) (6) (7)
1 139,581,395$ 21,484,228$ 161,065,624$ 135,413,844$ 21,105,613$ 156,543,843$ 2 148,791,951 23,060,353 171,852,305 135,858,255 21,862,538 157,781,021 3 157,514,061 24,401,232 181,915,293 135,362,068 22,325,582 157,773,797 4 166,026,179 25,544,824 191,571,003 134,284,314 22,555,391 156,950,140 5 174,252,583 26,348,946 200,601,529 132,647,479 22,452,624 155,250,298 6 182,782,511 27,447,212 210,229,723 130,956,023 22,571,400 153,694,593 7 191,084,860 28,365,973 219,450,833 128,851,114 22,512,014 151,554,198 8 199,102,873 29,055,959 228,158,832 126,360,253 22,254,012 148,845,014 9 207,306,573 29,718,698 237,025,272 123,827,497 21,966,420 146,068,956
10 216,217,048 30,709,740 246,926,787 121,552,813 21,905,948 143,746,654 11 224,661,485 31,483,205 256,144,690 118,870,686 21,673,112 140,857,885 12 232,793,355 32,454,458 265,247,812 115,927,850 21,561,208 137,788,790 13 238,966,525 33,306,179 272,272,704 112,001,886 21,354,036 133,607,995 14 243,028,547 34,274,476 277,303,023 107,205,389 21,207,154 128,543,231 15 245,639,188 35,050,881 280,690,069 101,983,061 20,929,888 122,910,200 16 247,613,926 36,133,860 283,747,786 96,755,690 20,822,781 117,370,681 17 248,304,687 37,043,120 285,347,808 91,318,218 20,601,003 111,498,224 18 246,950,297 37,499,690 284,449,987 85,477,759 20,126,344 104,994,269 19 243,853,210 37,813,751 281,666,962 79,440,709 19,585,893 98,211,389 20 239,952,011 38,279,815 278,231,826 73,571,581 19,134,621 91,642,941 21 235,410,144 38,904,534 274,314,678 67,933,178 18,767,510 85,350,786 22 230,125,040 39,212,526 269,337,565 62,501,680 18,255,245 79,162,897 23 224,583,746 39,697,500 264,281,245 57,408,632 17,835,382 73,376,562 24 218,876,862 39,800,227 258,677,089 52,658,659 17,256,838 67,844,594 25 212,786,220 38,788,074 251,574,294 48,181,964 16,230,441 62,328,950 26 207,229,210 37,823,263 245,052,473 44,163,454 15,273,814 57,352,045 27 202,409,750 36,545,426 238,955,175 40,598,927 14,242,228 52,829,016 28 198,156,751 34,514,772 232,671,523 37,407,877 12,980,946 48,592,091 29 194,935,026 32,179,616 227,114,642 34,634,995 11,679,886 44,805,750 30 192,084,519 29,491,923 221,576,442 32,120,971 10,330,403 41,293,193 31 189,386,079 27,384,084 216,770,163 29,806,805 9,256,968 38,161,080 32 186,625,927 25,525,428 212,151,356 27,644,606 8,327,220 35,280,378 33 183,556,392 23,757,308 207,313,700 25,590,514 7,479,639 32,567,295 34 179,987,865 22,165,100 202,152,966 23,616,948 6,734,564 29,998,537 35 175,866,014 20,363,920 196,229,934 21,718,685 5,971,145 27,507,523 36 171,246,082 18,109,546 189,355,628 19,904,135 5,124,603 25,074,409 37 166,146,721 15,335,352 181,482,073 18,175,464 4,187,963 22,701,392 38 160,664,738 12,316,565 172,981,302 16,541,899 3,246,049 20,440,155 39 154,908,781 9,400,287 164,309,068 15,011,079 2,390,909 18,340,570 40 148,941,101 6,648,923 155,590,025 13,583,806 1,632,035 16,405,872 41 142,798,343 4,103,052 146,901,395 12,257,479 971,945 14,632,204 42 136,554,351 2,358,126 138,912,477 11,032,008 539,086 13,070,474 43 130,220,692 1,334,511 131,555,203 9,901,480 294,422 11,692,958 44 123,789,411 675,862 124,465,273 8,858,795 143,900 10,450,350 45 117,277,826 242,410 117,520,237 7,899,110 49,809 9,320,979 46 110,691,163 38,717 110,729,880 7,016,915 7,677 8,296,215 47 104,053,595 7,828 104,061,423 6,208,139 1,498 7,364,974 48 97,391,286 2,408 97,393,694 5,468,844 445 6,511,462 49 90,743,313 78 90,743,391 4,795,800 14 5,730,981 50 84,147,389 - 84,147,389 4,185,604 - 5,020,198 51 77,644,873 - 77,644,873 3,634,975 - 4,375,818 52 71,277,639 - 71,277,639 3,140,602 - 3,794,601 53 65,084,885 - 65,084,885 2,699,050 - 3,273,099 54 59,099,174 - 59,099,174 2,306,658 - 2,807,545 55 53,349,573 - 53,349,573 1,959,764 - 2,394,101 56 47,865,314 - 47,865,314 1,654,874 - 2,029,078 57 42,668,707 - 42,668,707 1,388,431 - 1,708,652 58 37,783,797 - 37,783,797 1,157,155 - 1,429,276 59 33,230,895 - 33,230,895 957,854 - 1,187,459 60 29,017,816 - 29,017,816 787,214 - 979,507 61 25,151,042 - 25,151,042 642,178 - 801,983 62 21,629,725 - 21,629,725 519,782 - 651,518 63 18,444,780 - 18,444,780 417,172 - 524,826 64 15,589,186 - 15,589,186 331,845 - 419,017 65 13,046,963 - 13,046,963 261,392 - 331,271 66 10,801,156 - 10,801,156 203,669 - 259,066 67 8,837,264 - 8,837,264 156,835 - 200,228 68 7,139,838 - 7,139,838 119,257 - 152,813 69 5,693,100 - 5,693,100 89,499 - 115,103 70 4,480,326 - 4,480,326 66,290 - 85,569 71 3,481,477 - 3,481,477 48,481 - 62,811 72 2,673,218 - 2,673,218 35,036 - 45,559 73 2,031,085 - 2,031,085 25,054 - 32,699 74 1,530,179 - 1,530,179 17,765 - 23,271 75 1,146,339 - 1,146,339 12,526 - 16,468 76 854,557 - 854,557 8,788 - 11,597 77 632,710 - 632,710 6,124 - 8,111 78 464,414 - 464,414 4,231 - 5,624 79 337,505 - 337,505 2,894 - 3,861 80 242,671 - 242,671 1,958 - 2,622 81 172,380 - 172,380 1,309 - 1,760 82 120,853 - 120,853 864 - 1,165 83 83,550 - 83,550 562 - 761 84 56,972 - 56,972 361 - 490 85 38,284 - 38,284 228 - 311 86 25,354 - 25,354 142 - 195 87 16,551 - 16,551 87 - 120 88 10,648 - 10,648 53 - 73 89 6,749 - 6,749 32 - 44 90 4,210 - 4,210 19 - 26 91 2,581 - 2,581 11 - 15 92 1,549 - 1,549 6 - 8 93 909 - 909 3 - 5 94 516 - 516 2 - 3 95 282 - 282 1 - 1 96 143 - 143 0 - 1 97 67 - 67 0 - 0 98 30 - 30 0 - 0 99 13 - 13 0 - 0
100 - - - - - - Total 3,077,155,975$ 637,720,166$ 3,714,876,141$
Notes and Assumptions:1 Table 1. Column (4).2 Based on the System's assumed investment return of 6.25%.3 Based on Fidelity’s 20-Year Municipal GO AA Index, which is equal to 3.62% at June 30, 2018.4 The single discount rate that produces a total actuarial present value that equals the sum of the present values in columns (6) and (7), which is 5.86%
Board Meeting- December 17, 2018 - Actuarial Valuations- GRS/ Ms. Karen Roggenkamp
390

Kentucky Employees Retirement System (KERS) - Hazardous
GASB 74 - Discount Rate Development as of June 30, 2018 (Year 1 is FYE June 30, 2019)
Kentucky Retirement Systems
Table 1. Projection of the System's Fiduciary Net Position
Year
Projected
Beginning Plan Net
Position
Projected Total
Contributions1
Projected
Explicit Benefit
Payments2
Projected
Administrative
Expenses3
Projected
Investment
Earnings at 6.25%
Projected
Ending Plan
Net Position
(1) (2) (3) (4) (5) (6) (7)
1 519,072,283$ 4,472,971$ (20,419,089)$ (90,036)$ 31,948,482$ 534,984,611$ 2 534,984,611 3,661,070 (22,476,595) (85,683) 32,854,827 548,938,230 3 548,938,230 2,615,439 (24,591,495) (82,057) 33,629,770 560,509,887 4 560,509,887 1,731,431 (26,713,537) (78,299) 34,260,598 569,710,080 5 569,710,080 727,810 (28,830,972) (74,776) 34,739,664 576,271,806 6 576,271,806 721,976 (30,833,499) (71,457) 35,088,064 581,176,890 7 581,176,890 720,498 (32,435,419) (68,876) 35,345,365 584,738,457 8 584,738,457 713,075 (33,949,985) (64,936) 35,521,242 586,957,854 9 586,957,854 709,851 (35,250,031) (61,155) 35,619,961 587,976,480
10 587,976,480 705,369 (36,444,156) (56,791) 35,646,871 587,827,772 11 587,827,772 704,949 (37,282,575) (52,729) 35,611,885 586,809,302 12 586,809,302 701,015 (37,842,317) (49,699) 35,530,976 585,149,277 13 585,149,277 694,594 (38,129,806) (47,371) 35,418,251 583,084,945 14 583,084,945 688,714 (37,987,459) (45,461) 35,293,489 581,034,227 15 581,034,227 685,325 (37,693,487) (44,145) 35,174,302 579,156,223 16 579,156,223 677,864 (37,627,828) (42,899) 35,058,757 577,222,117 17 577,222,117 662,990 (37,293,117) (41,394) 34,947,764 575,498,360 18 575,498,360 632,526 (36,886,005) (39,070) 34,851,693 574,057,504 19 574,057,504 604,644 (36,514,538) (36,968) 34,772,279 572,882,921 20 572,882,921 563,061 (36,050,506) (34,180) 34,711,954 572,073,249 21 572,073,249 509,657 (35,527,970) (30,804) 34,675,892 571,700,025 22 571,700,025 445,761 (35,354,763) (26,872) 34,656,051 571,420,202 23 571,420,202 363,937 (35,227,528) (21,905) 34,640,113 571,174,819 24 571,174,819 262,520 (35,249,985) (15,784) 34,621,152 570,792,722 25 570,792,722 155,987 (35,290,307) (9,374) 34,592,948 570,241,975 26 570,241,975 92,514 (35,001,890) (5,558) 34,565,567 569,892,609 27 569,892,609 54,257 (34,603,185) (3,259) 34,554,896 569,895,318 28 569,895,318 30,771 (34,007,842) (1,848) 34,572,708 570,489,108 29 570,489,108 17,002 (33,431,526) (1,021) 34,627,159 571,700,722 30 571,700,722 8,592 (33,031,439) (516) 34,714,955 573,392,313 31 573,392,313 4,239 (32,594,374) (254) 34,834,004 575,635,928 32 575,635,928 2,077 (32,173,497) (125) 34,987,121 578,451,505 33 578,451,505 985 (31,759,126) (59) 35,175,816 581,869,120 34 581,869,120 435 (31,280,095) (26) 35,404,143 585,993,578 35 585,993,578 182 (30,768,554) (11) 35,677,658 590,902,854 36 590,902,854 65 (30,248,686) (4) 36,000,485 596,654,713 37 596,654,713 15 (29,703,295) (1) 36,376,760 603,328,192 38 603,328,192 3 (29,089,830) (0) 36,812,731 611,051,096 39 611,051,096 - (28,419,081) - 37,316,056 619,948,071 40 619,948,071 - (27,724,036) - 37,893,508 630,117,544 41 630,117,544 - (26,983,041) - 38,551,905 641,686,407 42 641,686,407 - (26,216,353) - 39,298,555 654,768,610 43 654,768,610 - (25,455,287) - 40,139,616 669,452,939 44 669,452,939 - (24,681,385) - 41,081,204 685,852,758 45 685,852,758 - (23,891,701) - 42,130,497 704,091,554 46 704,091,554 - (23,086,930) - 43,295,189 724,299,813 47 724,299,813 - (22,259,619) - 44,583,667 746,623,861 48 746,623,861 - (21,400,102) - 46,005,373 771,229,132 49 771,229,132 - (20,503,090) - 47,570,809 798,296,852 50 798,296,852 - (19,572,836) - 49,291,172 828,015,188 51 828,015,188 - (18,615,648) - 51,178,027 860,577,567 52 860,577,567 - (17,637,299) - 53,243,285 896,183,552 53 896,183,552 - (16,642,522) - 55,499,275 935,040,306 54 935,040,306 - (15,636,313) - 57,958,790 977,362,783 55 977,362,783 - (14,624,258) - 60,635,092 1,023,373,616 56 1,023,373,616 - (13,610,704) - 63,541,962 1,073,304,875 57 1,073,304,875 - (12,600,658) - 66,693,752 1,127,397,968 58 1,127,397,968 - (11,597,835) - 70,105,433 1,185,905,566 59 1,185,905,566 - (10,606,742) - 73,792,660 1,249,091,485 60 1,249,091,485 - (9,633,930) - 77,771,720 1,317,229,275 61 1,317,229,275 - (8,686,799) - 82,059,481 1,390,601,957 62 1,390,601,957 - (7,773,196) - 86,673,391 1,469,502,152 63 1,469,502,152 - (6,899,046) - 91,631,557 1,554,234,663 64 1,554,234,663 - (6,069,528) - 96,952,868 1,645,118,002 65 1,645,118,002 - (5,289,186) - 102,657,093 1,742,485,910 66 1,742,485,910 - (4,561,918) - 108,764,970 1,846,688,961 67 1,846,688,961 - (3,891,480) - 115,298,294 1,958,095,775 68 1,958,095,775 - (3,280,613) - 122,280,020 2,077,095,182 69 2,077,095,182 - (2,730,537) - 129,734,413 2,204,099,059 70 2,204,099,059 - (2,240,786) - 137,687,228 2,339,545,501 71 2,339,545,501 - (1,810,620) - 146,165,869 2,483,900,751 72 2,483,900,751 - (1,440,051) - 155,199,477 2,637,660,177 73 2,637,660,177 - (1,127,157) - 164,819,071 2,801,352,091 74 2,801,352,091 - (867,553) - 175,057,806 2,975,542,343 75 2,975,542,343 - (657,915) - 185,951,148 3,160,835,576 76 3,160,835,576 - (493,285) - 197,537,042 3,357,879,333 77 3,357,879,333 - (366,544) - 209,856,177 3,567,368,966 78 3,567,368,966 - (271,456) - 222,952,206 3,790,049,717 79 3,790,049,717 - (201,273) - 236,871,913 4,026,720,356 80 4,026,720,356 - (149,191) - 251,665,431 4,278,236,595 81 4,278,236,595 - (109,982) - 267,386,402 4,545,513,015 82 4,545,513,015 - (80,229) - 284,092,094 4,829,524,881 83 4,829,524,881 - (57,844) - 301,843,525 5,131,310,562 84 5,131,310,562 - (41,165) - 320,705,643 5,451,975,041 85 5,451,975,041 - (28,879) - 340,747,551 5,792,693,713 86 5,792,693,713 - (19,952) - 362,042,743 6,154,716,504 87 6,154,716,504 - (13,562) - 384,669,364 6,539,372,306 88 6,539,372,306 - (9,067) - 408,710,490 6,948,073,729 89 6,948,073,729 - (5,958) - 434,254,425 7,382,322,196 90 7,382,322,196 - (3,848) - 461,395,019 7,843,713,367 91 7,843,713,367 - (2,445) - 490,232,010 8,333,942,932 92 8,333,942,932 - (1,529) - 520,871,386 8,854,812,789 93 8,854,812,789 - (940) - 553,425,770 9,408,237,619 94 9,408,237,619 - (565) - 588,014,834 9,996,251,888 95 9,996,251,888 - (334) - 624,765,733 10,621,017,288 96 10,621,017,288 - (192) - 663,813,575 11,284,830,671 97 11,284,830,671 - (103) - 705,301,914 11,990,132,481 98 11,990,132,481 - (53) - 749,383,278 12,739,515,707 99 12,739,515,707 - (24) - 796,219,731 13,535,735,413
100 13,535,735,413 - - - 845,983,463 14,381,718,877
Notes and Assumptions:1 Future employer contributions are assumed to be equal to the projected payroll times the actuarially determined contribution rate (the amortization
cost on the payroll of future active members of the system). Contributions are determined without regard to enactment of SB 151 in 2018, which is currently being reviewed by the State Supreme Court. Future member contributions are equal to 1.00% of Tier 2 and Tier 3 members' payroll.
2 Expected future benefit payments (without an implicit subsidy) based on the 2017 actuarial valuation, adjusted to reflect HB 185 passed during the 2018 legislative session.
3 Assumed to be equal to 0.06% of current payroll.
Board Meeting- December 17, 2018 - Actuarial Valuations- GRS/ Ms. Karen Roggenkamp
391

Kentucky Employees Retirement System (KERS) - Hazardous
GASB 74 - Discount Rate Development as of June 30, 2018 (Year 1 is FYE June 30, 2019)
Kentucky Retirement Systems
Table 2. Actuarial Present Values of Projected Benefit Payments
Year
"Funded"/Explicit
Portion of
Benefit Payments1
"Unfunded"/Implicit
Portion of
Benefit Payments
Total Benefit
Payments
Present Value
of Explicit
Benefit Payments2
Present Value
of Implicit
Benefit Payments3
Present Value of
Benefit Payments
Using the Single
Discount Rate4
(1) (2) (3) (4) (5) (6) (7)
1 20,419,089$ 364,661$ 20,783,750$ 19,809,426$ 358,235$ 20,198,218$ 2 22,476,595 365,387 22,841,982 20,522,824 346,408 20,965,308 3 24,591,495 435,114 25,026,608 21,133,069 398,101 21,694,405 4 26,713,537 442,885 27,156,422 21,606,286 391,055 22,232,924 5 28,830,972 500,199 29,331,171 21,947,197 426,232 22,679,409 6 30,833,499 643,113 31,476,612 22,090,912 528,869 22,986,276 7 32,435,419 711,798 33,147,217 21,871,643 564,902 22,861,568 8 33,949,985 833,884 34,783,869 21,546,292 638,673 22,657,664 9 35,250,031 974,338 36,224,369 21,055,401 720,177 22,285,191
10 36,444,156 1,174,527 37,618,684 20,488,161 837,817 21,857,346 11 37,282,575 1,445,205 38,727,780 19,726,591 994,882 21,251,752 12 37,842,317 1,935,099 39,777,417 18,844,947 1,285,589 20,615,174 13 38,129,806 2,467,452 40,597,258 17,871,165 1,581,990 19,871,261 14 37,987,459 2,884,973 40,872,432 16,757,127 1,785,062 18,894,592 15 37,693,487 3,337,294 41,030,781 15,649,364 1,992,794 17,914,105 16 37,627,828 3,980,539 41,608,368 14,703,157 2,293,857 17,157,117 17 37,293,117 4,387,684 41,680,801 13,715,170 2,440,148 16,232,222 18 36,886,005 4,630,018 41,516,023 12,767,480 2,484,963 15,269,892 19 36,514,538 4,829,193 41,343,731 11,895,438 2,501,314 14,361,778 20 36,050,506 4,824,954 40,875,460 11,053,430 2,411,810 13,410,330 21 35,527,970 4,644,716 40,172,686 10,252,438 2,240,607 12,447,611 22 35,354,763 4,518,896 39,873,659 9,602,311 2,103,755 11,668,620 23 35,227,528 4,216,963 39,444,490 9,004,945 1,894,606 10,901,796 24 35,249,985 3,862,321 39,112,306 8,480,645 1,674,650 10,209,476 25 35,290,307 3,834,998 39,125,305 7,990,914 1,604,713 9,645,529 26 35,001,890 4,324,571 39,326,461 7,459,394 1,746,351 9,156,542 27 34,603,185 5,092,541 39,695,725 6,940,635 1,984,629 8,729,084 28 34,007,842 5,761,908 39,769,750 6,419,974 2,167,044 8,259,544 29 33,431,526 6,401,688 39,833,214 5,939,932 2,323,551 7,813,163 30 33,031,439 7,000,905 40,032,345 5,523,620 2,452,270 7,416,019 31 32,594,374 7,505,457 40,099,831 5,129,913 2,537,159 7,015,856 32 32,173,497 7,975,557 40,149,055 4,765,810 2,601,885 6,634,248 33 31,759,126 8,312,362 40,071,488 4,427,698 2,617,025 6,253,601 34 31,280,095 8,517,148 39,797,243 4,104,390 2,587,819 5,865,783 35 30,768,554 8,458,250 39,226,803 3,799,782 2,480,143 5,460,523 36 30,248,686 8,210,987 38,459,673 3,515,841 2,323,528 5,056,327 37 29,703,295 7,914,253 37,617,549 3,249,364 2,161,320 4,670,877 38 29,089,830 7,191,391 36,281,221 2,995,063 1,895,302 4,254,692 39 28,419,081 6,058,170 34,477,251 2,753,886 1,540,861 3,818,538 40 27,724,036 4,892,945 32,616,981 2,528,502 1,201,016 3,411,824 41 26,983,041 3,464,127 30,447,168 2,316,162 820,594 3,007,932 42 26,216,353 2,068,116 28,284,468 2,117,977 472,787 2,639,049 43 25,455,287 1,168,742 26,624,030 1,935,522 257,850 2,346,127 44 24,681,385 597,568 25,278,953 1,766,285 127,231 2,103,851 45 23,891,701 248,167 24,139,868 1,609,197 50,992 1,897,445 46 23,086,930 59,318 23,146,248 1,463,523 11,763 1,718,277 47 22,259,619 - 22,259,619 1,328,073 - 1,560,661 48 21,400,102 - 21,400,102 1,201,687 - 1,417,050 49 20,503,090 - 20,503,090 1,083,592 - 1,282,233 50 19,572,836 - 19,572,836 973,579 - 1,156,058 51 18,615,648 - 18,615,648 871,499 - 1,038,442 52 17,637,299 - 17,637,299 777,127 - 929,211 53 16,642,522 - 16,642,522 690,160 - 828,094 54 15,636,313 - 15,636,313 610,290 - 734,807 55 14,624,258 - 14,624,258 537,213 - 649,069 56 13,610,704 - 13,610,704 470,570 - 570,527 57 12,600,658 - 12,600,658 410,023 - 498,847 58 11,597,835 - 11,597,835 355,192 - 433,640 59 10,606,742 - 10,606,742 305,731 - 374,552 60 9,633,930 - 9,633,930 261,355 - 321,301 61 8,686,799 - 8,686,799 221,799 - 273,619 62 7,773,196 - 7,773,196 186,797 - 231,241 63 6,899,046 - 6,899,046 156,038 - 193,835 64 6,069,528 - 6,069,528 129,201 - 161,056 65 5,289,186 - 5,289,186 105,967 - 132,553 66 4,561,918 - 4,561,918 86,021 - 107,976 67 3,891,480 - 3,891,480 69,062 - 86,990 68 3,280,613 - 3,280,613 54,796 - 69,261 69 2,730,537 - 2,730,537 42,926 - 54,445 70 2,240,786 - 2,240,786 33,154 - 42,198 71 1,810,620 - 1,810,620 25,214 - 32,203 72 1,440,051 - 1,440,051 18,874 - 24,189 73 1,127,157 - 1,127,157 13,904 - 17,882 74 867,553 - 867,553 10,072 - 12,999 75 657,915 - 657,915 7,189 - 9,310 76 493,285 - 493,285 5,073 - 6,593 77 366,544 - 366,544 3,548 - 4,627 78 271,456 - 271,456 2,473 - 3,236 79 201,273 - 201,273 1,726 - 2,266 80 149,191 - 149,191 1,204 - 1,586 81 109,982 - 109,982 835 - 1,105 82 80,229 - 80,229 573 - 761 83 57,844 - 57,844 389 - 518 84 41,165 - 41,165 261 - 348 85 28,879 - 28,879 172 - 231 86 19,952 - 19,952 112 - 151 87 13,562 - 13,562 72 - 97 88 9,067 - 9,067 45 - 61 89 5,958 - 5,958 28 - 38 90 3,848 - 3,848 17 - 23 91 2,445 - 2,445 10 - 14 92 1,529 - 1,529 6 - 8 93 940 - 940 3 - 5 94 565 - 565 2 - 3 95 334 - 334 1 - 2 96 192 - 192 1 - 1 97 103 - 103 0 - 0 98 53 - 53 0 - 0 99 24 - 24 0 - 0
100 - - - - - - Total 502,202,459$ 68,862,329$ 571,064,788$
Notes and Assumptions:1 Table 1. Column (4).2 Based on the System's assumed investment return of 6.25%.3 Based on Fidelity’s 20-Year Municipal GO AA Index, which is equal to 3.62% at June 30, 2018.4 The single discount rate that produces a total actuarial present value that equals the sum of the present values in columns (6) and (7), which is 5.88%
Board Meeting- December 17, 2018 - Actuarial Valuations- GRS/ Ms. Karen Roggenkamp
392

County Employees Retirement System (CERS) - Non-Hazardous
GASB 74 - Discount Rate Development as of June 30, 2018 (Year 1 is FYE June 30, 2019)
Kentucky Retirement Systems
Table 1. Projection of the System's Fiduciary Net Position
Year
Projected
Beginning Plan Net
Position
Projected Total
Contributions1
Projected
Explicit Benefit
Payments2
Projected
Administrative
Expenses3
Projected
Investment
Earnings at 6.25%
Projected
Ending Plan
Net Position
(1) (2) (3) (4) (5) (6) (7)
1 2,414,126,203$ 127,964,359$ (150,403,178)$ (677,625)$ 150,171,447$ 2,541,181,205$ 2 2,541,181,205 144,517,879 (165,806,951) (637,903) 158,148,992 2,677,403,222 3 2,677,403,222 151,004,290 (181,227,065) (601,931) 166,389,028 2,812,967,544 4 2,812,967,544 146,982,570 (196,470,713) (568,638) 174,269,904 2,937,180,667 5 2,937,180,667 140,925,472 (211,443,146) (536,921) 181,386,986 3,047,513,058 6 3,047,513,058 136,951,830 (226,250,408) (506,350) 187,705,693 3,145,413,823 7 3,145,413,823 134,148,264 (240,176,527) (476,467) 193,310,531 3,232,219,623 8 3,232,219,623 131,454,822 (253,661,409) (447,240) 198,238,883 3,307,804,679 9 3,307,804,679 128,793,059 (267,146,560) (418,128) 202,466,900 3,371,499,949
10 3,371,499,949 126,213,792 (279,779,572) (389,277) 205,980,563 3,423,525,456 11 3,423,525,456 123,840,609 (290,948,480) (361,458) 208,816,237 3,464,872,365 12 3,464,872,365 121,735,654 (300,991,840) (335,068) 211,027,349 3,496,308,460 13 3,496,308,460 119,928,066 (310,132,340) (310,124) 212,655,931 3,518,449,992 14 3,518,449,992 118,530,792 (317,899,103) (286,495) 213,758,467 3,532,553,653 15 3,532,553,653 117,488,944 (324,257,575) (263,828) 214,412,888 3,539,934,082 16 3,539,934,082 116,735,378 (329,220,567) (241,993) 214,698,902 3,541,905,802 17 3,541,905,802 116,223,293 (332,460,542) (220,851) 214,707,310 3,540,155,013 18 3,540,155,013 115,902,906 (333,927,068) (200,208) 214,543,526 3,536,474,168 19 3,536,474,168 115,948,709 (333,831,809) (181,897) 214,318,379 3,532,727,550 20 3,532,727,550 116,339,508 (333,699,322) (165,869) 214,100,813 3,529,302,680 21 3,529,302,680 116,968,910 (333,081,356) (151,182) 213,925,600 3,526,964,652 22 3,526,964,652 117,796,338 (331,539,682) (137,551) 213,852,806 3,526,936,561 23 3,526,936,561 118,757,716 (329,506,143) (124,402) 213,943,627 3,530,007,360 24 3,530,007,360 119,838,378 (327,008,928) (111,667) 214,246,058 3,536,971,201 25 3,536,971,201 121,018,456 (323,772,525) (99,246) 214,817,604 3,548,935,489 26 3,548,935,489 6,803,785 (320,197,636) (87,319) 212,160,644 3,447,614,963 27 3,447,614,963 5,888,763 (316,527,287) (75,944) 205,913,260 3,342,813,755 28 3,342,813,755 5,038,239 (312,659,022) (65,206) 199,456,391 3,234,584,158 29 3,234,584,158 4,250,327 (308,801,041) (55,146) 192,786,836 3,122,765,134 30 3,122,765,134 3,534,986 (304,707,242) (45,938) 185,902,407 3,007,449,346 31 3,007,449,346 2,903,514 (300,469,322) (37,761) 178,806,416 2,888,652,193 32 2,888,652,193 2,348,626 (296,016,813) (30,556) 171,501,771 2,766,455,221 33 2,766,455,221 1,860,702 (290,968,302) (24,210) 164,005,014 2,641,328,425 34 2,641,328,425 1,443,305 (285,019,054) (18,778) 156,355,007 2,514,088,905 35 2,514,088,905 1,094,740 (278,254,338) (14,243) 148,600,142 2,385,515,205 36 2,385,515,205 812,080 (270,661,183) (10,567) 140,789,390 2,256,444,925 37 2,256,444,925 591,240 (262,214,878) (7,695) 132,975,735 2,127,789,328 38 2,127,789,328 422,285 (253,025,857) (5,498) 125,212,433 2,000,392,690 39 2,000,392,690 300,076 (243,178,742) (3,909) 117,549,490 1,875,059,606 40 1,875,059,606 212,621 (232,843,171) (2,771) 110,031,608 1,752,457,893 41 1,752,457,893 150,167 (222,179,616) (1,957) 102,695,289 1,633,121,776 42 1,633,121,776 105,951 (211,325,474) (1,381) 95,569,491 1,517,470,364 43 1,517,470,364 74,428 (200,434,955) (970) 88,675,491 1,405,784,357 44 1,405,784,357 52,087 (189,616,582) (679) 82,027,388 1,298,246,572 45 1,298,246,572 36,169 (178,907,648) (471) 75,635,375 1,195,009,997 46 1,195,009,997 24,907 (168,348,893) (324) 69,507,707 1,096,193,394 47 1,096,193,394 16,922 (157,957,341) (220) 63,651,242 1,001,903,997 48 1,001,903,997 11,294 (147,721,525) (147) 58,073,005 912,266,624 49 912,266,624 7,326 (137,676,424) (95) 52,779,701 827,377,132 50 827,377,132 4,598 (127,864,404) (60) 47,776,004 747,293,271 51 747,293,271 2,718 (118,320,094) (35) 43,064,445 672,040,305 52 672,040,305 1,515 (109,076,138) (20) 38,645,593 601,611,255 53 601,611,255 778 (100,161,441) (10) 34,518,118 535,968,699 54 535,968,699 346 (91,591,941) (4) 30,679,183 475,056,284 55 475,056,284 131 (83,381,880) (2) 27,124,827 418,799,360 56 418,799,360 23 (75,549,052) (0) 23,849,833 367,100,164 57 367,100,164 5 (68,106,892) (0) 20,847,675 319,840,952 58 319,840,952 1 (61,068,052) (0) 18,110,604 276,883,505 59 276,883,505 - (54,444,081) - 15,629,626 238,069,050 60 238,069,050 - (48,243,738) - 13,394,547 203,219,859 61 203,219,859 - (42,472,046) - 11,394,104 172,141,917 62 172,141,917 - (37,129,791) - 9,616,148 144,628,274 63 144,628,274 - (32,216,350) - 8,047,764 120,459,688 64 120,459,688 - (27,731,355) - 6,675,259 99,403,592 65 99,403,592 - (23,662,691) - 5,484,472 81,225,373 66 81,225,373 - (19,997,094) - 4,461,147 65,689,426 67 65,689,426 - (16,723,725) - 3,590,893 52,556,594 68 52,556,594 - (13,831,460) - 2,859,104 41,584,238 69 41,584,238 - (11,302,890) - 2,251,153 32,532,500 70 32,532,500 - (9,118,197) - 1,752,656 25,166,959 71 25,166,959 - (7,258,691) - 1,349,539 19,257,807 72 19,257,807 - (5,699,892) - 1,028,191 14,586,106 73 14,586,106 - (4,415,587) - 775,736 10,946,254 74 10,946,254 - (3,379,240) - 580,140 8,147,154 75 8,147,154 - (2,559,334) - 430,430 6,018,250 76 6,018,250 - (1,920,615) - 317,031 4,414,666 77 4,414,666 - (1,430,037) - 231,905 3,216,535 78 3,216,535 - (1,058,433) - 168,459 2,326,560 79 2,326,560 - (779,859) - 121,409 1,668,111 80 1,668,111 - (571,192) - 86,678 1,183,596 81 1,183,596 - (414,458) - 61,219 830,358 82 830,358 - (297,579) - 42,739 575,517 83 575,517 - (211,197) - 29,470 393,790 84 393,790 - (147,992) - 20,057 265,855 85 265,855 - (102,310) - 13,467 177,013 86 177,013 - (69,742) - 8,917 116,188 87 116,188 - (46,865) - 5,819 75,143 88 75,143 - (31,030) - 3,741 47,854 89 47,854 - (20,234) - 2,368 29,988 90 29,988 - (12,988) - 1,475 18,474 91 18,474 - (8,212) - 902 11,165 92 11,165 - (5,106) - 541 6,599 93 6,599 - (3,120) - 316 3,795 94 3,795 - (1,871) - 180 2,104 95 2,104 - (1,092) - 98 1,110 96 1,110 - (614) - 50 546 97 546 - (332) - 24 238 98 238 - (170) - 10 77 99 77 - (80) - 2 0
100 0 - - - 0 0
Notes and Assumptions:1 Future employer contributions are assumed to be equal to the projected payroll times the actuarially determined contribution rate (the amortization
cost on the payroll of future active members of the system). Contributions are determined without regard to enactment of SB 151 in 2018, which is currently being reviewed by the State Supreme Court. Future member contributions are equal to 1.00% of Tier 2 and Tier 3 members' payroll.
2 Expected future benefit payments (without an implicit subsidy) based on the 2017 actuarial valuation, adjusted to reflect HB 185 passed during the 2018 legislative session.
3 Assumed to be equal to 0.03% of current payroll.
Board Meeting- December 17, 2018 - Actuarial Valuations- GRS/ Ms. Karen Roggenkamp
393
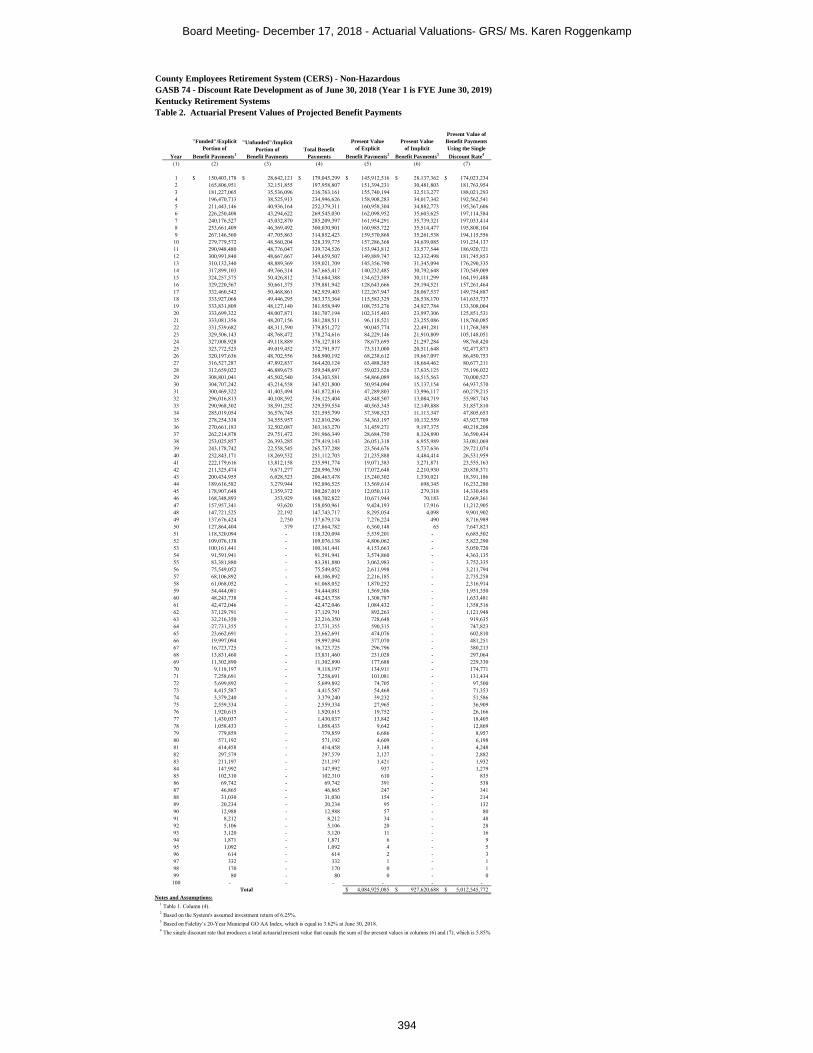
County Employees Retirement System (CERS) - Non-Hazardous
GASB 74 - Discount Rate Development as of June 30, 2018 (Year 1 is FYE June 30, 2019)
Kentucky Retirement Systems
Table 2. Actuarial Present Values of Projected Benefit Payments
Year
"Funded"/Explicit
Portion of
Benefit Payments1
"Unfunded"/Implicit
Portion of
Benefit Payments
Total Benefit
Payments
Present Value
of Explicit
Benefit Payments2
Present Value
of Implicit
Benefit Payments3
Present Value of
Benefit Payments
Using the Single
Discount Rate4
(1) (2) (3) (4) (5) (6) (7)
1 150,403,178$ 28,642,121$ 179,045,299$ 145,912,516$ 28,137,362$ 174,023,234$ 2 165,806,951 32,151,855 197,958,807 151,394,231 30,481,803 181,763,954 3 181,227,065 35,536,096 216,763,161 155,740,194 32,513,277 188,021,293 4 196,470,713 38,525,913 234,996,626 158,908,283 34,017,342 192,562,541 5 211,443,146 40,936,164 252,379,311 160,958,304 34,882,773 195,367,606 6 226,250,408 43,294,622 269,545,030 162,098,952 35,603,625 197,114,584 7 240,176,527 45,032,870 285,209,397 161,954,291 35,739,321 197,033,414 8 253,661,409 46,369,492 300,030,901 160,985,722 35,514,477 195,808,104 9 267,146,560 47,705,863 314,852,423 159,570,868 35,261,538 194,115,556
10 279,779,572 48,560,204 328,339,775 157,286,368 34,639,085 191,234,137 11 290,948,480 48,776,047 339,724,526 153,943,812 33,577,544 186,920,721 12 300,991,840 48,667,667 349,659,507 149,889,747 32,332,498 181,745,853 13 310,132,340 48,889,369 359,021,709 145,356,790 31,345,094 176,290,335 14 317,899,103 49,766,314 367,665,417 140,232,485 30,792,648 170,549,009 15 324,257,575 50,426,812 374,684,388 134,623,389 30,111,299 164,191,488 16 329,220,567 50,661,375 379,881,942 128,643,666 29,194,521 157,261,464 17 332,460,542 50,468,861 382,929,403 122,267,947 28,067,537 149,754,887 18 333,927,068 49,446,295 383,373,364 115,583,329 26,538,170 141,635,737 19 333,831,809 48,127,140 381,958,949 108,753,276 24,927,784 133,308,004 20 333,699,322 48,007,871 381,707,194 102,315,403 23,997,306 125,851,531 21 333,081,356 48,207,156 381,288,511 96,118,521 23,255,086 118,760,085 22 331,539,682 48,311,590 379,851,272 90,045,774 22,491,281 111,768,389 23 329,506,143 48,768,472 378,274,616 84,229,146 21,910,809 105,148,051 24 327,008,928 49,118,889 376,127,818 78,673,695 21,297,284 98,768,420 25 323,772,525 49,019,452 372,791,977 73,313,000 20,511,648 92,477,873 26 320,197,636 48,702,556 368,900,192 68,238,612 19,667,097 86,450,753 27 316,527,287 47,892,837 364,420,124 63,488,385 18,664,462 80,677,211 28 312,659,022 46,889,675 359,548,697 59,023,526 17,635,125 75,196,022 29 308,801,041 45,502,540 354,303,581 54,866,089 16,515,563 70,000,527 30 304,707,242 43,214,558 347,921,800 50,954,094 15,137,154 64,937,570 31 300,469,322 41,403,494 341,872,816 47,289,803 13,996,117 60,279,215 32 296,016,813 40,108,592 336,125,404 43,848,507 13,084,719 55,987,745 33 290,968,302 38,591,252 329,559,554 40,565,345 12,149,888 51,857,810 34 285,019,054 36,576,745 321,595,799 37,398,523 11,113,347 47,805,653 35 278,254,338 34,555,957 312,810,296 34,363,197 10,132,559 43,927,709 36 270,661,183 32,502,087 303,163,270 31,459,271 9,197,375 40,218,208 37 262,214,878 29,751,472 291,966,349 28,684,750 8,124,890 36,590,434 38 253,025,857 26,393,285 279,419,143 26,051,318 6,955,989 33,081,069 39 243,178,742 22,558,545 265,737,288 23,564,676 5,737,636 29,721,074 40 232,843,171 18,269,532 251,112,703 21,235,888 4,484,414 26,531,959 41 222,179,616 13,812,158 235,991,774 19,071,383 3,271,871 23,555,163 42 211,325,474 9,671,277 220,996,750 17,072,648 2,210,930 20,838,371 43 200,434,955 6,028,523 206,463,478 15,240,302 1,330,021 18,391,186 44 189,616,582 3,279,944 192,896,525 13,569,614 698,345 16,232,280 45 178,907,648 1,359,372 180,267,019 12,050,113 279,318 14,330,456 46 168,348,893 353,929 168,702,822 10,671,944 70,183 12,669,361 47 157,957,341 93,620 158,050,961 9,424,193 17,916 11,212,905 48 147,721,525 22,192 147,743,717 8,295,054 4,098 9,901,902 49 137,676,424 2,750 137,679,174 7,276,224 490 8,716,989 50 127,864,404 379 127,864,782 6,360,148 65 7,647,823 51 118,320,094 - 118,320,094 5,539,201 - 6,685,502 52 109,076,138 - 109,076,138 4,806,062 - 5,822,290 53 100,161,441 - 100,161,441 4,153,663 - 5,050,720 54 91,591,941 - 91,591,941 3,574,860 - 4,363,135 55 83,381,880 - 83,381,880 3,062,983 - 3,752,335 56 75,549,052 - 75,549,052 2,611,998 - 3,211,794 57 68,106,892 - 68,106,892 2,216,185 - 2,735,258 58 61,068,052 - 61,068,052 1,870,252 - 2,316,914 59 54,444,081 - 54,444,081 1,569,306 - 1,951,350 60 48,243,738 - 48,243,738 1,308,787 - 1,633,481 61 42,472,046 - 42,472,046 1,084,432 - 1,358,516 62 37,129,791 - 37,129,791 892,263 - 1,121,948 63 32,216,350 - 32,216,350 728,648 - 919,635 64 27,731,355 - 27,731,355 590,315 - 747,823 65 23,662,691 - 23,662,691 474,076 - 602,810 66 19,997,094 - 19,997,094 377,070 - 481,251 67 16,723,725 - 16,723,725 296,796 - 380,213 68 13,831,460 - 13,831,460 231,028 - 297,064 69 11,302,890 - 11,302,890 177,688 - 229,330 70 9,118,197 - 9,118,197 134,911 - 174,771 71 7,258,691 - 7,258,691 101,081 - 131,434 72 5,699,892 - 5,699,892 74,705 - 97,500 73 4,415,587 - 4,415,587 54,468 - 71,353 74 3,379,240 - 3,379,240 39,232 - 51,586 75 2,559,334 - 2,559,334 27,965 - 36,909 76 1,920,615 - 1,920,615 19,752 - 26,166 77 1,430,037 - 1,430,037 13,842 - 18,405 78 1,058,433 - 1,058,433 9,642 - 12,869 79 779,859 - 779,859 6,686 - 8,957 80 571,192 - 571,192 4,609 - 6,198 81 414,458 - 414,458 3,148 - 4,248 82 297,579 - 297,579 2,127 - 2,882 83 211,197 - 211,197 1,421 - 1,932 84 147,992 - 147,992 937 - 1,279 85 102,310 - 102,310 610 - 835 86 69,742 - 69,742 391 - 538 87 46,865 - 46,865 247 - 341 88 31,030 - 31,030 154 - 214 89 20,234 - 20,234 95 - 132 90 12,988 - 12,988 57 - 80 91 8,212 - 8,212 34 - 48 92 5,106 - 5,106 20 - 28 93 3,120 - 3,120 11 - 16 94 1,871 - 1,871 6 - 9 95 1,092 - 1,092 4 - 5 96 614 - 614 2 - 3 97 332 - 332 1 - 1 98 170 - 170 0 - 1 99 80 - 80 0 - 0
100 - - - - - - Total 4,084,925,085$ 927,620,688$ 5,012,545,772$
Notes and Assumptions:1 Table 1. Column (4).2 Based on the System's assumed investment return of 6.25%.3 Based on Fidelity’s 20-Year Municipal GO AA Index, which is equal to 3.62% at June 30, 2018.4 The single discount rate that produces a total actuarial present value that equals the sum of the present values in columns (6) and (7), which is 5.85%
Board Meeting- December 17, 2018 - Actuarial Valuations- GRS/ Ms. Karen Roggenkamp
394

County Employees Retirement System (CERS) - Hazardous
GASB 74 - Discount Rate Development as of June 30, 2018 (Year 1 is FYE June 30, 2019)
Kentucky Retirement Systems
Table 1. Projection of the System's Fiduciary Net Position
Year
Projected
Beginning Plan Net
Position
Projected Total
Contributions1
Projected
Explicit Benefit
Payments2
Projected
Administrative
Expenses3
Projected
Investment
Earnings at 6.25%
Projected
Ending Plan
Net Position
(1) (2) (3) (4) (5) (6) (7)
1 1,280,981,973$ 52,894,780$ (82,599,161)$ (342,036)$ 79,136,653$ 1,330,072,209$ 2 1,330,072,209 62,097,174 (91,682,509) (313,088) 82,209,347 1,382,383,134 3 1,382,383,134 61,688,806 (101,175,391) (286,704) 85,174,867 1,427,784,711 4 1,427,784,711 59,398,830 (110,938,161) (261,923) 87,642,288 1,463,625,746 5 1,463,625,746 56,083,301 (120,837,872) (238,506) 89,476,356 1,488,109,025 6 1,488,109,025 54,032,353 (130,187,313) (216,877) 90,656,363 1,502,393,551 7 1,502,393,551 52,873,686 (138,206,918) (196,408) 91,267,302 1,508,131,212 8 1,508,131,212 52,004,601 (145,416,512) (176,852) 91,377,875 1,505,920,325 9 1,505,920,325 51,355,285 (151,653,002) (158,029) 91,028,353 1,496,492,932
10 1,496,492,932 50,934,150 (156,486,517) (140,545) 90,277,961 1,481,077,980 11 1,481,077,980 50,749,925 (159,398,874) (124,489) 89,219,718 1,461,524,260 12 1,461,524,260 50,778,908 (160,778,243) (110,490) 87,956,482 1,439,370,917 13 1,439,370,917 51,022,845 (161,858,744) (98,962) 86,546,506 1,414,982,562 14 1,414,982,562 51,406,638 (161,778,349) (88,644) 85,036,837 1,389,559,044 15 1,389,559,044 51,924,691 (160,246,373) (80,044) 83,511,225 1,364,668,544 16 1,364,668,544 52,556,990 (158,481,167) (72,775) 82,029,579 1,340,701,171 17 1,340,701,171 53,256,649 (155,977,937) (66,083) 80,630,397 1,318,544,196 18 1,318,544,196 54,014,885 (152,343,449) (59,803) 79,380,972 1,299,536,801 19 1,299,536,801 54,813,905 (147,762,111) (53,613) 78,358,788 1,284,893,770 20 1,284,893,770 55,649,046 (143,613,503) (47,474) 77,597,170 1,274,479,009 21 1,274,479,009 56,503,826 (139,541,279) (41,085) 77,098,079 1,268,498,549 22 1,268,498,549 57,383,944 (134,754,151) (34,773) 76,898,913 1,267,992,481 23 1,267,992,481 58,287,364 (130,074,435) (28,452) 77,039,306 1,273,216,264 24 1,273,216,264 59,218,423 (125,741,156) (22,292) 77,527,999 1,284,199,237 25 1,284,199,237 60,185,979 (120,860,887) (16,534) 78,394,588 1,301,902,384 26 1,301,902,384 420,682 (116,379,554) (11,948) 77,799,734 1,263,731,298 27 1,263,731,298 296,178 (112,466,764) (8,391) 75,530,741 1,227,083,062 28 1,227,083,062 197,186 (109,013,992) (5,572) 73,343,530 1,191,604,214 29 1,191,604,214 122,892 (106,048,230) (3,463) 71,215,156 1,156,890,569 30 1,156,890,569 73,891 (103,779,079) (2,076) 69,113,924 1,122,297,229 31 1,122,297,229 42,437 (102,151,431) (1,190) 67,000,992 1,087,188,038 32 1,087,188,038 22,479 (100,907,066) (629) 64,844,368 1,051,147,189 33 1,051,147,189 10,742 (99,551,675) (300) 62,633,177 1,014,239,133 34 1,014,239,133 4,512 (98,354,798) (126) 60,363,074 976,251,795 35 976,251,795 2,202 (97,064,259) (61) 58,028,514 937,218,191 36 937,218,191 887 (95,651,013) (25) 55,632,369 897,200,409 37 897,200,409 238 (94,059,756) (7) 53,180,211 856,321,095 38 856,321,095 66 (92,247,770) (2) 50,681,016 814,754,405 39 814,754,405 14 (90,206,975) (0) 48,145,905 772,693,348 40 772,693,348 1 (87,947,311) (0) 45,586,632 730,332,670 41 730,332,670 - (85,472,232) (0) 43,015,264 687,875,702 42 687,875,702 - (82,813,437) - 40,443,531 645,505,796 43 645,505,796 - (79,973,931) - 37,882,802 603,414,667 44 603,414,667 - (76,953,454) - 35,345,066 561,806,279 45 561,806,279 - (73,780,663) - 32,842,189 520,867,805 46 520,867,805 - (70,467,264) - 30,385,509 480,786,049 47 480,786,049 - (67,014,485) - 27,986,663 441,758,227 48 441,758,227 - (63,443,734) - 25,657,319 403,971,812 49 403,971,812 - (59,777,860) - 23,408,491 367,602,443 50 367,602,443 - (56,041,716) - 21,250,390 332,811,117 51 332,811,117 - (52,267,493) - 19,192,089 299,735,713 52 299,735,713 - (48,490,055) - 17,241,132 268,486,790 53 268,486,790 - (44,741,880) - 15,403,430 239,148,340 54 239,148,340 - (41,051,376) - 13,683,357 211,780,321 55 211,780,321 - (37,448,659) - 12,083,735 186,415,398 56 186,415,398 - (33,962,243) - 10,605,727 163,058,882 57 163,058,882 - (30,613,141) - 9,249,018 141,694,759 58 141,694,759 - (27,419,298) - 8,012,055 122,287,515 59 122,287,515 - (24,398,272) - 6,892,079 104,781,322 60 104,781,322 - (21,560,724) - 5,885,271 89,105,869 61 89,105,869 - (18,915,271) - 4,986,973 75,177,572 62 75,177,572 - (16,468,747) - 4,191,749 62,900,574 63 62,900,574 - (14,223,441) - 3,493,539 52,170,672 64 52,170,672 - (12,178,589) - 2,885,854 42,877,937 65 42,877,937 - (10,333,029) - 2,361,858 34,906,766 66 34,906,766 - (8,682,946) - 1,914,443 28,138,263 67 28,138,263 - (7,224,270) - 1,536,304 22,450,297 68 22,450,297 - (5,946,959) - 1,220,118 17,723,455 69 17,723,455 - (4,841,405) - 958,715 13,840,766 70 13,840,766 - (3,896,631) - 745,124 10,689,258 71 10,689,258 - (3,096,367) - 572,784 8,165,675 72 8,165,675 - (2,427,428) - 435,647 6,173,894 73 6,173,894 - (1,877,725) - 328,079 4,624,248 74 4,624,248 - (1,433,902) - 244,885 3,435,231 75 3,435,231 - (1,082,487) - 181,387 2,534,131 76 2,534,131 - (808,941) - 133,487 1,858,677 77 1,858,677 - (599,819) - 97,707 1,356,565 78 1,356,565 - (443,022) - 71,151 984,694 79 984,694 - (326,389) - 51,498 709,803 80 709,803 - (239,460) - 36,993 507,336 81 507,336 - (174,769) - 26,330 358,896 82 358,896 - (126,539) - 18,537 250,894 83 250,894 - (90,611) - 12,892 173,176 84 173,176 - (64,103) - 8,851 117,924 85 117,924 - (44,751) - 5,993 79,165 86 79,165 - (30,798) - 4,000 52,367 87 52,367 - (20,885) - 2,630 34,112 88 34,112 - (13,938) - 1,703 21,877 89 21,877 - (9,159) - 1,085 13,804 90 13,804 - (5,926) - 680 8,558 91 8,558 - (3,768) - 419 5,209 92 5,209 - (2,358) - 253 3,103 93 3,103 - (1,452) - 149 1,801 94 1,801 - (875) - 86 1,011 95 1,011 - (517) - 47 542 96 542 - (295) - 25 271 97 271 - (163) - 12 120 98 120 - (85) - 5 40 99 40 - (41) - 1 0
100 0 - - - 0 0
Notes and Assumptions:1 Future employer contributions are assumed to be equal to the projected payroll times the actuarially determined contribution rate (the amortization
cost on the payroll of future active members of the system). Contributions are determined without regard to enactment of SB 151 in 2018, which is currently being reviewed by the State Supreme Court. Future member contributions are equal to 1.00% of Tier 2 and Tier 3 members' payroll.
2 Expected future benefit payments (without an implicit subsidy) based on the 2017 actuarial valuation, adjusted to reflect HB 185 passed during the 2018 legislative session.
3 Assumed to be equal to 0.07% of current payroll.
Board Meeting- December 17, 2018 - Actuarial Valuations- GRS/ Ms. Karen Roggenkamp
395

County Employees Retirement System (CERS) - Hazardous
GASB 74 - Discount Rate Development as of June 30, 2018 (Year 1 is FYE June 30, 2019)
Kentucky Retirement Systems
Table 2. Actuarial Present Values of Projected Benefit Payments
Year
"Funded"/Explicit
Portion of
Benefit Payments1
"Unfunded"/Implicit
Portion of
Benefit Payments
Total Benefit
Payments
Present Value
of Explicit
Benefit Payments2
Present Value
of Implicit
Benefit Payments3
Present Value of
Benefit Payments
Using the Single
Discount Rate4
(1) (2) (3) (4) (5) (6) (7)
1 82,599,161$ (2,838,740)$ 79,760,421$ 80,132,956$ (2,788,713)$ 77,481,912$ 2 91,682,509 (3,216,977) 88,465,531 83,713,034 (3,049,879) 81,098,487 3 101,175,391 (3,410,268) 97,765,123 86,946,588 (3,120,179) 84,576,243 4 110,938,161 (3,369,477) 107,568,684 89,728,349 (2,975,157) 87,816,489 5 120,837,872 (3,042,960) 117,794,913 91,986,235 (2,592,985) 90,749,141 6 130,187,313 (2,283,425) 127,903,888 93,273,764 (1,877,790) 92,987,701 7 138,206,918 (1,374,803) 136,832,115 93,194,800 (1,091,082) 93,876,217 8 145,416,512 (248,346) 145,168,165 92,288,308 (190,209) 93,986,333 9 151,653,002 1,035,983 152,688,985 90,584,738 765,741 93,288,219
10 156,486,517 2,247,533 158,734,050 87,973,528 1,603,216 91,519,779 11 159,398,874 3,239,067 162,637,941 84,339,572 2,229,781 88,489,657 12 160,778,243 4,250,786 165,029,029 80,065,327 2,824,021 84,733,815 13 161,858,744 6,100,564 167,959,308 75,862,025 3,911,336 81,381,609 14 161,778,349 8,091,923 169,870,272 71,364,089 5,006,835 77,672,154 15 160,246,373 9,709,413 169,955,786 66,530,164 5,797,770 73,334,730 16 158,481,167 11,623,671 170,104,838 61,926,867 6,698,348 69,265,374 17 155,977,937 13,414,036 169,391,974 57,363,506 7,460,025 65,090,577 18 152,343,449 14,524,293 166,867,742 52,731,164 7,795,289 60,509,485 19 147,762,111 15,070,768 162,832,879 48,136,856 7,806,008 55,721,006 20 143,613,503 15,921,415 159,534,918 44,033,273 7,958,509 51,517,927 21 139,541,279 16,890,856 156,432,135 40,267,944 8,148,133 47,671,012 22 134,754,151 17,479,677 152,233,829 36,599,063 8,137,599 43,778,950 23 130,074,435 18,107,191 148,181,626 33,249,937 8,135,240 40,213,725 24 125,741,156 18,890,084 144,631,240 30,251,533 8,190,484 37,039,732 25 120,860,887 19,291,707 140,152,594 27,366,974 8,072,402 33,871,360 26 116,379,554 19,905,450 136,285,004 24,802,117 8,038,231 31,081,742 27 112,466,764 20,717,781 133,184,544 22,558,350 8,073,989 28,664,005 28 109,013,992 21,381,111 130,395,103 20,579,576 8,041,399 26,483,178 29 106,048,230 21,769,094 127,817,324 18,842,072 7,901,292 24,497,644 30 103,779,079 21,742,152 125,521,231 17,354,261 7,615,820 22,702,703 31 102,151,431 21,356,771 123,508,202 16,077,252 7,219,484 21,080,551 32 100,907,066 20,472,506 121,379,572 14,947,206 6,678,793 19,550,485 33 99,551,675 18,813,194 118,364,868 13,878,996 5,923,057 17,991,216 34 98,354,798 17,433,193 115,787,991 12,905,538 5,296,839 16,608,369 35 97,064,259 15,861,824 112,926,083 11,987,013 4,651,032 15,285,636 36 95,651,013 13,857,704 109,508,717 11,117,631 3,921,425 13,988,261 37 94,059,756 11,974,132 106,033,888 10,289,579 3,270,040 12,781,608 38 92,247,770 10,033,864 102,281,635 9,497,749 2,644,440 11,634,942 39 90,206,975 8,105,704 98,312,679 8,741,299 2,061,639 10,553,631 40 87,947,311 6,225,746 94,173,057 8,021,018 1,528,163 9,539,921 41 85,472,232 4,359,042 89,831,273 7,336,738 1,032,585 8,587,593 42 82,813,437 2,873,708 85,687,146 6,690,366 656,952 7,730,104 43 79,973,931 1,799,110 81,773,042 6,080,910 396,922 6,961,545 44 76,953,454 957,960 77,911,414 5,507,053 203,963 6,259,250 45 73,780,663 442,697 74,223,360 4,969,409 90,964 5,627,139 46 70,467,264 196,132 70,663,396 4,467,049 38,892 5,055,537 47 67,014,485 59,092 67,073,577 3,998,278 11,308 4,528,455 48 63,443,734 12,579 63,456,313 3,562,576 2,323 4,042,957 49 59,777,860 4,393 59,782,254 3,159,271 783 3,594,367 50 56,041,716 - 56,041,716 2,787,590 - 3,179,709 51 52,267,493 - 52,267,493 2,446,923 - 2,798,552 52 48,490,055 - 48,490,055 2,136,546 - 2,450,079 53 44,741,880 - 44,741,880 1,855,432 - 2,133,376 54 41,051,376 - 41,051,376 1,602,247 - 1,847,169 55 37,448,659 - 37,448,659 1,375,654 - 1,590,161 56 33,962,243 - 33,962,243 1,174,195 - 1,360,902 57 30,613,141 - 30,613,141 996,146 - 1,157,615 58 27,419,298 - 27,419,298 839,735 - 978,450 59 24,398,272 - 24,398,272 703,260 - 821,612 60 21,560,724 - 21,560,724 584,913 - 685,168 61 18,915,271 - 18,915,271 482,961 - 567,247 62 16,468,747 - 16,468,747 395,759 - 466,064 63 14,223,441 - 14,223,441 321,696 - 379,853 64 12,178,589 - 12,178,589 259,244 - 306,926 65 10,333,029 - 10,333,029 207,019 - 245,748 66 8,682,946 - 8,682,946 163,727 - 194,875 67 7,224,270 - 7,224,270 128,209 - 153,006 68 5,946,959 - 5,946,959 99,333 - 118,860 69 4,841,405 - 4,841,405 76,110 - 91,314 70 3,896,631 - 3,896,631 57,654 - 69,355 71 3,096,367 - 3,096,367 43,118 - 52,008 72 2,427,428 - 2,427,428 31,815 - 38,476 73 1,877,725 - 1,877,725 23,162 - 28,087 74 1,433,902 - 1,433,902 16,647 - 20,240 75 1,082,487 - 1,082,487 11,828 - 14,419 76 808,941 - 808,941 8,319 - 10,169 77 599,819 - 599,819 5,806 - 7,115 78 443,022 - 443,022 4,036 - 4,959 79 326,389 - 326,389 2,798 - 3,448 80 239,460 - 239,460 1,932 - 2,387 81 174,769 - 174,769 1,327 - 1,644 82 126,539 - 126,539 905 - 1,123 83 90,611 - 90,611 610 - 759 84 64,103 - 64,103 406 - 507 85 44,751 - 44,751 267 - 334 86 30,798 - 30,798 173 - 217 87 20,885 - 20,885 110 - 139 88 13,938 - 13,938 69 - 87 89 9,159 - 9,159 43 - 54 90 5,926 - 5,926 26 - 33 91 3,768 - 3,768 16 - 20 92 2,358 - 2,358 9 - 12 93 1,452 - 1,452 5 - 7 94 875 - 875 3 - 4 95 517 - 517 2 - 2 96 295 - 295 1 - 1 97 163 - 163 0 - 1 98 85 - 85 0 - 0 99 41 - 41 0 - 0
100 - - - - - - Total 1,986,129,688$ 168,155,078$ 2,154,284,766$
Notes and Assumptions:1 Table 1. Column (4).2 Based on the System's assumed investment return of 6.25%.3 Based on Fidelity’s 20-Year Municipal GO AA Index, which is equal to 3.62% at June 30, 2018.4 The single discount rate that produces a total actuarial present value that equals the sum of the present values in columns (6) and (7), which is 5.97%
Board Meeting- December 17, 2018 - Actuarial Valuations- GRS/ Ms. Karen Roggenkamp
396

State Police Retirement System (SPRS)
GASB 74 - Discount Rate Development as of June 30, 2018 (Year 1 is FYE June 30, 2019)
Kentucky Retirement Systems
Table 1. Projection of the System's Fiduciary Net Position
Year
Projected
Beginning Plan Net
Position
Projected Total
Contributions1
Projected
Explicit Benefit
Payments2
Projected
Administrative
Expenses3
Projected
Investment
Earnings at 6.25%
Projected
Ending Plan
Net Position
(1) (2) (3) (4) (5) (6) (7)
1 190,846,553$ 12,534,357$ (14,280,673)$ (63,724)$ 11,872,203$ 200,908,717$ 2 200,908,717 12,787,406 (15,372,819) (61,183) 12,475,342 210,737,463 3 210,737,463 12,361,309 (16,593,979) (58,155) 13,039,036 219,485,674 4 219,485,674 11,859,695 (17,871,056) (55,481) 13,531,139 226,949,971 5 226,949,971 11,111,483 (19,177,086) (52,583) 13,934,525 232,766,310 6 232,766,310 10,540,949 (20,541,256) (49,531) 14,238,597 236,955,069 7 236,955,069 10,105,359 (21,854,296) (46,262) 14,446,678 239,606,548 8 239,606,548 9,720,532 (22,930,020) (42,441) 14,567,562 240,922,182 9 240,922,182 9,393,327 (23,860,586) (39,312) 14,611,177 241,026,788
10 241,026,788 9,154,309 (24,621,425) (36,882) 14,587,017 240,109,807 11 240,109,807 8,948,548 (25,262,000) (34,418) 14,503,735 238,265,671 12 238,265,671 8,765,219 (25,654,002) (32,086) 14,370,841 235,715,644 13 235,715,644 8,621,730 (25,969,198) (30,230) 14,197,405 232,535,351 14 232,535,351 8,507,334 (26,132,380) (28,565) 13,990,145 228,871,886 15 228,871,886 8,375,414 (26,114,472) (26,562) 13,757,731 224,863,997 16 224,863,997 8,281,986 (25,820,599) (25,075) 13,513,453 220,813,761 17 220,813,761 8,221,215 (25,487,353) (23,634) 13,268,743 216,792,732 18 216,792,732 8,139,782 (24,997,197) (21,789) 13,030,064 212,943,592 19 212,943,592 8,085,978 (24,184,488) (19,882) 12,812,908 209,638,109 20 209,638,109 8,038,048 (23,477,010) (18,349) 12,626,661 206,807,459 21 206,807,459 7,986,882 (22,788,530) (16,265) 12,469,424 204,458,969 22 204,458,969 7,949,103 (22,066,451) (14,745) 12,343,751 202,670,626 23 202,670,626 7,889,987 (21,384,915) (12,210) 12,251,212 201,414,701 24 201,414,701 7,830,253 (20,544,103) (9,622) 12,196,836 200,888,065 25 200,888,065 7,778,898 (19,618,358) (7,389) 12,190,901 201,232,116 26 201,232,116 123,114 (18,890,610) (5,400) 11,999,245 194,458,466 27 194,458,466 87,267 (17,976,532) (3,833) 11,602,969 188,168,338 28 188,168,338 60,945 (17,020,824) (2,680) 11,238,474 182,444,254 29 182,444,254 39,869 (16,372,939) (1,757) 10,900,038 177,009,464 30 177,009,464 26,010 (15,824,645) (1,149) 10,576,831 171,786,511 31 171,786,511 13,925 (15,392,240) (619) 10,263,348 166,670,925 32 166,670,925 7,029 (15,138,660) (313) 9,951,226 161,490,207 33 161,490,207 3,124 (14,938,881) (140) 9,633,464 156,187,774 34 156,187,774 1,159 (14,789,229) (52) 9,306,611 150,706,262 35 150,706,262 257 (14,603,017) (12) 8,969,721 145,073,211 36 145,073,211 65 (14,413,364) (3) 8,623,486 139,283,396 37 139,283,396 17 (14,210,793) (1) 8,267,856 133,340,475 38 133,340,475 1 (13,977,960) (0) 7,903,589 127,266,105 39 127,266,105 - (13,709,038) - 7,532,217 121,089,283 40 121,089,283 - (13,413,035) - 7,155,275 114,831,523 41 114,831,523 - (13,095,461) - 6,773,939 108,510,002 42 108,510,002 - (12,740,016) - 6,389,783 102,159,769 43 102,159,769 - (12,351,628) - 6,004,847 95,812,988 44 95,812,988 - (11,940,834) - 5,620,816 89,492,969 45 89,492,969 - (11,502,160) - 5,239,315 83,230,125 46 83,230,125 - (11,034,431) - 4,862,283 77,057,977 47 77,057,977 - (10,540,568) - 4,491,723 71,009,132 48 71,009,132 - (10,021,534) - 4,129,644 65,117,242 49 65,117,242 - (9,481,642) - 3,778,017 59,413,616 50 59,413,616 - (8,925,469) - 3,438,657 53,926,805 51 53,926,805 - (8,357,757) - 3,113,204 48,682,251 52 48,682,251 - (7,783,912) - 2,803,080 43,701,419 53 43,701,419 - (7,209,377) - 2,509,460 39,001,502 54 39,001,502 - (6,638,879) - 2,233,273 34,595,896 55 34,595,896 - (6,076,948) - 1,975,217 30,494,165 56 30,494,165 - (5,527,758) - 1,735,761 26,702,168 57 26,702,168 - (4,995,397) - 1,515,145 23,221,916 58 23,221,916 - (4,483,646) - 1,313,379 20,051,649 59 20,051,649 - (3,996,288) - 1,130,237 17,185,598 60 17,185,598 - (3,535,724) - 965,283 14,615,157 61 14,615,157 - (3,105,080) - 817,884 12,327,960 62 12,327,960 - (2,706,405) - 687,204 10,308,759 63 10,308,759 - (2,339,825) - 572,286 8,541,220 64 8,541,220 - (2,005,620) - 472,100 7,007,701 65 7,007,701 - (1,703,536) - 385,553 5,689,718 66 5,689,718 - (1,431,844) - 311,540 4,569,414 67 4,569,414 - (1,189,851) - 248,969 3,628,533 68 3,628,533 - (976,804) - 196,721 2,848,449 69 2,848,449 - (791,818) - 153,659 2,210,290 70 2,210,290 - (633,207) - 118,655 1,695,738 71 1,695,738 - (499,316) - 90,616 1,287,039 72 1,287,039 - (388,421) - 68,486 967,103 73 967,103 - (298,287) - 51,264 720,080 74 720,080 - (226,093) - 38,047 532,033 75 532,033 - (169,000) - 28,051 391,084 76 391,084 - (125,339) - 20,585 286,330 77 286,330 - (92,844) - 15,038 208,525 78 208,525 - (68,600) - 10,922 150,846 79 150,846 - (50,513) - 7,873 108,207 80 108,207 - (37,053) - 5,623 76,776 81 76,776 - (26,945) - 3,969 53,800 82 53,800 - (19,370) - 2,766 37,196 83 37,196 - (13,740) - 1,902 25,358 84 25,358 - (9,611) - 1,289 17,037 85 17,037 - (6,627) - 861 11,271 86 11,271 - (4,488) - 566 7,349 87 7,349 - (3,000) - 367 4,716 88 4,716 - (1,972) - 234 2,978 89 2,978 - (1,277) - 147 1,847 90 1,847 - (813) - 90 1,125 91 1,125 - (509) - 55 671 92 671 - (313) - 32 390 93 390 - (188) - 19 220 94 220 - (111) - 10 119 95 119 - (63) - 6 62 96 62 - (36) - 3 29 97 29 - (19) - 1 11 98 11 - (8) - 0 3 99 3 - (3) - 0 0
100 0 - - - 0 0
Notes and Assumptions:1 Future employer contributions are assumed to be equal to the projected payroll times the actuarially determined contribution rate (the amortization
cost on the payroll of future active members of the system). Contributions are determined without regard to enactment of SB 151 in 2018, which is currently being reviewed by the State Supreme Court. Future member contributions are equal to 1.00% of Tier 2 and Tier 3 members' payroll.
2 Expected future benefit payments (without an implicit subsidy) based on the 2017 actuarial valuation, adjusted to reflect HB 185 passed during the 2018 legislative session.
3 Assumed to be equal to 0.14% of current payroll.
Board Meeting- December 17, 2018 - Actuarial Valuations- GRS/ Ms. Karen Roggenkamp
397
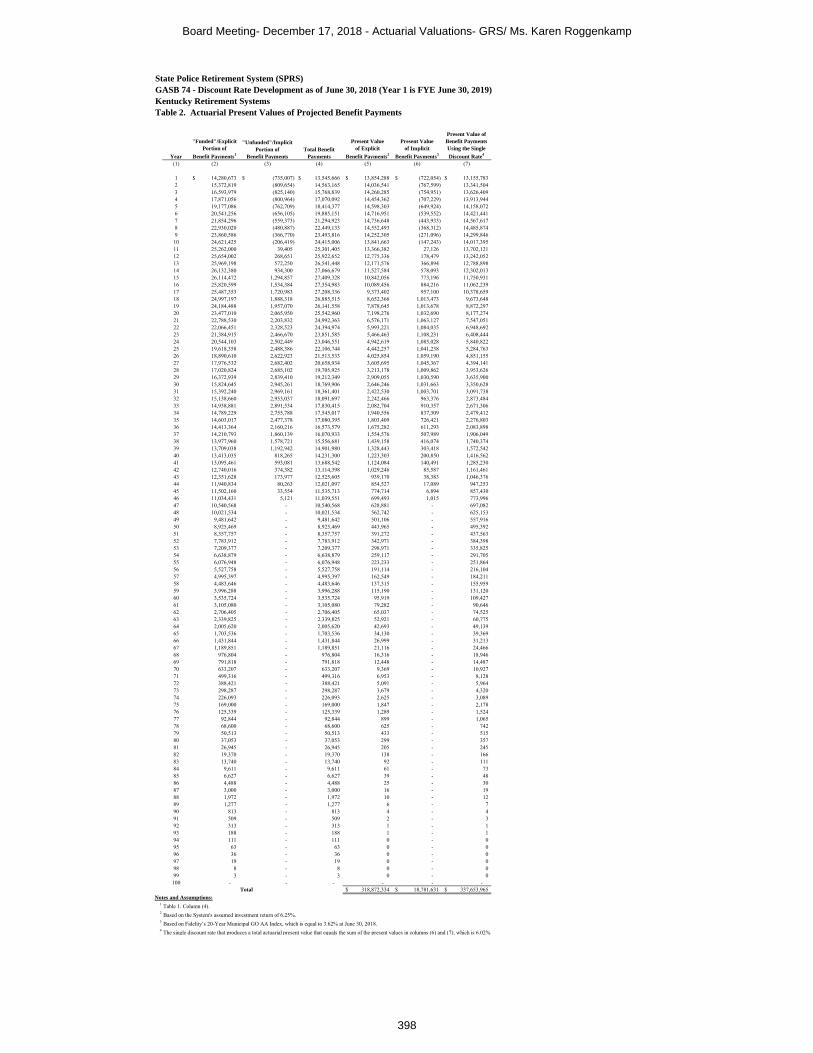
State Police Retirement System (SPRS)
GASB 74 - Discount Rate Development as of June 30, 2018 (Year 1 is FYE June 30, 2019)
Kentucky Retirement Systems
Table 2. Actuarial Present Values of Projected Benefit Payments
Year
"Funded"/Explicit
Portion of
Benefit Payments1
"Unfunded"/Implicit
Portion of
Benefit Payments
Total Benefit
Payments
Present Value
of Explicit
Benefit Payments2
Present Value
of Implicit
Benefit Payments3
Present Value of
Benefit Payments
Using the Single
Discount Rate4
(1) (2) (3) (4) (5) (6) (7)
1 14,280,673$ (735,007)$ 13,545,666$ 13,854,288$ (722,054)$ 13,155,783$ 2 15,372,819 (809,654) 14,563,165 14,036,541 (767,599) 13,341,504 3 16,593,979 (825,140) 15,768,839 14,260,285 (754,951) 13,626,409 4 17,871,056 (800,964) 17,070,092 14,454,362 (707,229) 13,913,944 5 19,177,086 (762,709) 18,414,377 14,598,303 (649,924) 14,158,072 6 20,541,256 (656,105) 19,885,151 14,716,951 (539,552) 14,421,441 7 21,854,296 (559,373) 21,294,923 14,736,648 (443,933) 14,567,617 8 22,930,020 (480,887) 22,449,133 14,552,493 (368,312) 14,485,874 9 23,860,586 (366,770) 23,493,816 14,252,305 (271,096) 14,299,846
10 24,621,425 (206,419) 24,415,006 13,841,663 (147,243) 14,017,395 11 25,262,000 39,405 25,301,405 13,366,382 27,126 13,702,121 12 25,654,002 268,651 25,922,652 12,775,336 178,479 13,242,052 13 25,969,198 572,250 26,541,448 12,171,576 366,894 12,788,898 14 26,132,380 934,300 27,066,679 11,527,584 578,093 12,302,013 15 26,114,472 1,294,857 27,409,328 10,842,056 773,196 11,750,931 16 25,820,599 1,534,384 27,354,983 10,089,456 884,216 11,062,239 17 25,487,353 1,720,983 27,208,336 9,373,402 957,100 10,378,659 18 24,997,197 1,888,318 26,885,515 8,652,366 1,013,473 9,673,648 19 24,184,488 1,957,070 26,141,558 7,878,645 1,013,678 8,872,297 20 23,477,010 2,065,950 25,542,960 7,198,276 1,032,690 8,177,274 21 22,788,530 2,203,832 24,992,363 6,576,171 1,063,127 7,547,051 22 22,066,451 2,328,523 24,394,974 5,993,221 1,084,035 6,948,692 23 21,384,915 2,466,670 23,851,585 5,466,463 1,108,231 6,408,444 24 20,544,103 2,502,449 23,046,551 4,942,619 1,085,028 5,840,822 25 19,618,358 2,488,386 22,106,744 4,442,257 1,041,238 5,284,763 26 18,890,610 2,622,923 21,513,533 4,025,854 1,059,190 4,851,155 27 17,976,532 2,682,402 20,658,934 3,605,695 1,045,367 4,394,141 28 17,020,824 2,685,102 19,705,925 3,213,178 1,009,862 3,953,626 29 16,372,939 2,839,410 19,212,349 2,909,055 1,030,590 3,635,900 30 15,824,645 2,945,261 18,769,906 2,646,246 1,031,663 3,350,628 31 15,392,240 2,969,161 18,361,401 2,422,530 1,003,701 3,091,738 32 15,138,660 2,953,037 18,091,697 2,242,466 963,376 2,873,484 33 14,938,881 2,891,534 17,830,415 2,082,704 910,357 2,671,306 34 14,789,229 2,755,788 17,545,017 1,940,556 837,309 2,479,412 35 14,603,017 2,477,378 17,080,395 1,803,409 726,421 2,276,803 36 14,413,364 2,160,216 16,573,579 1,675,282 611,293 2,083,898 37 14,210,793 1,860,139 16,070,933 1,554,576 507,989 1,906,049 38 13,977,960 1,578,721 15,556,681 1,439,158 416,074 1,740,374 39 13,709,038 1,192,942 14,901,980 1,328,443 303,418 1,572,542 40 13,413,035 818,265 14,231,300 1,223,303 200,850 1,416,562 41 13,095,461 593,081 13,688,542 1,124,084 140,491 1,285,230 42 12,740,016 374,382 13,114,398 1,029,246 85,587 1,161,461 43 12,351,628 173,977 12,525,605 939,170 38,383 1,046,376 44 11,940,834 80,263 12,021,097 854,527 17,089 947,253 45 11,502,160 33,554 11,535,713 774,714 6,894 857,430 46 11,034,431 5,121 11,039,551 699,493 1,015 773,996 47 10,540,568 - 10,540,568 628,881 - 697,082 48 10,021,534 - 10,021,534 562,742 - 625,153 49 9,481,642 - 9,481,642 501,106 - 557,916 50 8,925,469 - 8,925,469 443,965 - 495,392 51 8,357,757 - 8,357,757 391,272 - 437,563 52 7,783,912 - 7,783,912 342,971 - 384,398 53 7,209,377 - 7,209,377 298,971 - 335,825 54 6,638,879 - 6,638,879 259,117 - 291,705 55 6,076,948 - 6,076,948 223,233 - 251,864 56 5,527,758 - 5,527,758 191,114 - 216,104 57 4,995,397 - 4,995,397 162,549 - 184,211 58 4,483,646 - 4,483,646 137,315 - 155,959 59 3,996,288 - 3,996,288 115,190 - 131,120 60 3,535,724 - 3,535,724 95,919 - 109,427 61 3,105,080 - 3,105,080 79,282 - 90,646 62 2,706,405 - 2,706,405 65,037 - 74,525 63 2,339,825 - 2,339,825 52,921 - 60,775 64 2,005,620 - 2,005,620 42,693 - 49,139 65 1,703,536 - 1,703,536 34,130 - 39,369 66 1,431,844 - 1,431,844 26,999 - 31,213 67 1,189,851 - 1,189,851 21,116 - 24,466 68 976,804 - 976,804 16,316 - 18,946 69 791,818 - 791,818 12,448 - 14,487 70 633,207 - 633,207 9,369 - 10,927 71 499,316 - 499,316 6,953 - 8,128 72 388,421 - 388,421 5,091 - 5,964 73 298,287 - 298,287 3,679 - 4,320 74 226,093 - 226,093 2,625 - 3,089 75 169,000 - 169,000 1,847 - 2,178 76 125,339 - 125,339 1,289 - 1,524 77 92,844 - 92,844 899 - 1,065 78 68,600 - 68,600 625 - 742 79 50,513 - 50,513 433 - 515 80 37,053 - 37,053 299 - 357 81 26,945 - 26,945 205 - 245 82 19,370 - 19,370 138 - 166 83 13,740 - 13,740 92 - 111 84 9,611 - 9,611 61 - 73 85 6,627 - 6,627 39 - 48 86 4,488 - 4,488 25 - 30 87 3,000 - 3,000 16 - 19 88 1,972 - 1,972 10 - 12 89 1,277 - 1,277 6 - 7 90 813 - 813 4 - 4 91 509 - 509 2 - 3 92 313 - 313 1 - 1 93 188 - 188 1 - 1 94 111 - 111 0 - 0 95 63 - 63 0 - 0 96 36 - 36 0 - 0 97 19 - 19 0 - 0 98 8 - 8 0 - 0 99 3 - 3 0 - 0
100 - - - - - - Total 318,872,334$ 18,781,631$ 337,653,965$
Notes and Assumptions:1 Table 1. Column (4).2 Based on the System's assumed investment return of 6.25%.3 Based on Fidelity’s 20-Year Municipal GO AA Index, which is equal to 3.62% at June 30, 2018.4 The single discount rate that produces a total actuarial present value that equals the sum of the present values in columns (6) and (7), which is 6.02%
Board Meeting- December 17, 2018 - Actuarial Valuations- GRS/ Ms. Karen Roggenkamp
398
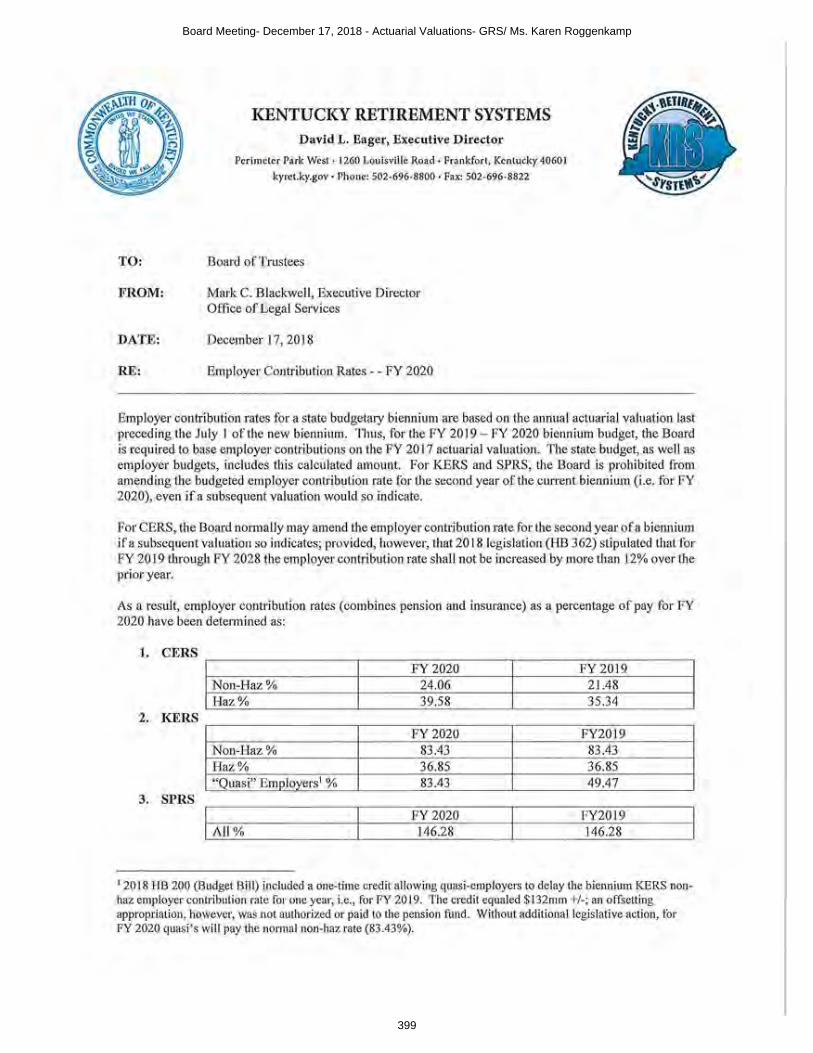
Board Meeting- December 17, 2018 - Actuarial Valuations- GRS/ Ms. Karen Roggenkamp
399

Board Meeting- December 17, 2018 - Actuarial Valuations- GRS/ Ms. Karen Roggenkamp
400

Board Meeting- December 17, 2018 - Actuarial Valuations- GRS/ Ms. Karen Roggenkamp
401
1
KENTUCKY RETIREMENT SYSTEMS
TO: Members of the of the Kentucky Retirement Systems Board of Trustees
FROM: Retiree Health Plan Committee
DATE: December 17, 2018
SUBJECT: Retiree Health Plan Committee Report
The Retiree Health Plan Committee met on Tuesday, November 13, 2018, and reviewed an informational presentation from Humana regarding the KRS Medicare Eligible Pharmacy Review for 2019, and Go365 Wellness Programs.
2019 Formulary changes:∑ Prior authorization changes have a 10.30% member impact - 25% in 2018. ∑ Negative tier changes has a 2.70% member impact - 4.14% in 2018. ∑ Positive tier changes have a 0.40% member impact - 0.80% in 2018.∑ Step therapy has a 1.50% member impact - 0.50% in 2018.
The Committee also reviewed a presentation from GRS regarding the benefits available for Medicare eligible retiree health insurance coverage. This included information about Medicare supplement plans, Medicare Advantage Prescription Drug Plans, and the Medicare Exchange options that allow retirees to select their own coverage. In the February 2019 Retiree Health Plan Committee meeting the Committee will determine if they would like to see a Request for Information (RFI) for any options other than the Medicare Advantage Prescription Plan design that is currently in place for the Medicare eligible KRS retirees.
Board Meeting- December 17, 2018 - Retiree Health Care Committee Report- Mr. David Rich
402

To: Kentucky Retirement Systems Board of Trustees From: John E. Chilton, CPA, Chair
Audit Committee of the Board of Trustees
Kristen N. Coffey, CICA Division Director, Internal Audit Administration
Date: December 17, 2018 Subject: November 29, 2018 Audit Committee Meeting The Audit Committee held a special called meeting on November 29, 2018. The purpose of the meeting was to review and discuss the following items: 1. Items with Requested Board Action
a. The Auditor of Public Accounts present the results of the fiscal year 2018 financial statement audit for the Kentucky Retirement Systems.
Committee Action: Approved the APA report as presented to the Committee and forwarded, as approved, to the Board of Trustees for ratification.
RECOMMENDATION: Ratify the actions of the Audit Committee.
b. Connie Davis presented a draft copy of the Comprehensive Annual Financial Report
(CAFR) to the Audit Committee. Committee Action: Approved the CAFR as presented, subject to finalization of formatting and technical revisions as needed (no changes will be made to the included financial statements), and authorized the release of said CAFR as approved to the Finance and Administration Cabinet, Office of the Controller, and further, forwarded approval of the CAFR to the Board of Trustees for ratification.
RECOMMENDATION: Ratify the actions of the Audit Commiteee.
2. Items with Audit Committee Action, but no Requested Board Action The Audit Committee reviewed the minutes of the prior Audit Committee meeting.
Committee Action: The Audit Committee approved the minutes of the prior Audit Committee meeting.
Board Meeting- December 17, 2018 - Audit Committee Report- Mr. John Chilton/ Ms. Kristen Coffey
403

Board Meeting- December 17, 2018 - Audit Committee Report- Mr. John Chilton/ Ms. Kristen Coffey
404
Kentucky Retirement SystemsA component unit of the Commonwealth of Kentucky
David L. Eager, Executive DirectorKaren D. Roggenkamp, Deputy Executive Director
Kentucky Employees Retirement System (KERS)County Employees Retirement System (CERS)
State Police Retirement System (SPRS)
2018FINANCIAL REPORT
For the Fiscal Year Ended June 30, 2018
Prepared by the Accounting, Investment and Communications Divisions
COMPREHENSIVE ANNUAL
Board Meeting- December 17, 2018 - Audit Committee Report- Mr. John Chilton/ Ms. Kristen Coffey
405

FINANCIAL
TAB
LE OF C
ON
TENTS
INTRODUCTION
20182018 Comprehensive Annual Financial Report
For The Fiscal Year Ended June 30, 2018
5 Management’s Responsibility for Financial Reporting
6 Letter of Transmittal9 Board of Trustees10 Agency Structure12 Pension Benefits by County13 System Highlights Total System14 KERS Non-Hazardous
KERS HazardousCERS Non-HazardousCERS HazardousSPRS
15 Fiduciary Net Position HighlightsLine
Line spaceing
Line Spacing
Line Spacing
Line Spacing
Line Spacing
Line Spacing
Line Spacing
Line
Line
Line
Line
Line
Line
Line
Line
Line
Line
line
17 Report of Independent Auditors20 Management’s Discussion & Analysis23 Fund Activities26 Historical Trends27 Combining Statements of Fiduciary Net
Position - Pension Funds28 Combining Statements of Changes In
Fiduciary Net Position - Pension Funds29 Combining Statements of Fiduciary Net
Position - Insurance Fund30 Combining Statements of Changes In
Fiduciary Net Position - Insurance Fund31 Note A. Summary of Significant
Accounting Policies34 Note B. Plan Descriptions & Contribution
Information40 Note C. Cash, Short-Term Investments &
Securities Lending Collateral41 Note D. Investments58 Note E. Securities Lending Transactions58 Note F. Risk of Loss58 Note G. Contingencies59 Note H. Defined Benefit Pension Plan59 Note I. Income Tax Status60 Note J. Equipment Expenses60 Note K. Intangible Assets61 Note L. Actuarial Valuation63 Note M. GASB 67 and GASB 74
Valuations74 Note N. Pension Legislation76 Note O. City of Fort Wright77 Note P. Reciprocity Agreement77 Note Q. Reimbursement Of Retired–
Reemployed Health Insurance78 Note R. Related Party78 Note S. Reduction of Receivables79 Note T. Governance Reorganization79 Note U. Subsequent Events81 Required Supplementary Information
Including GASB 67 and 74
Board Meeting- December 17, 2018 - Audit Committee Report- Mr. John Chilton/ Ms. Kristen Coffey
406
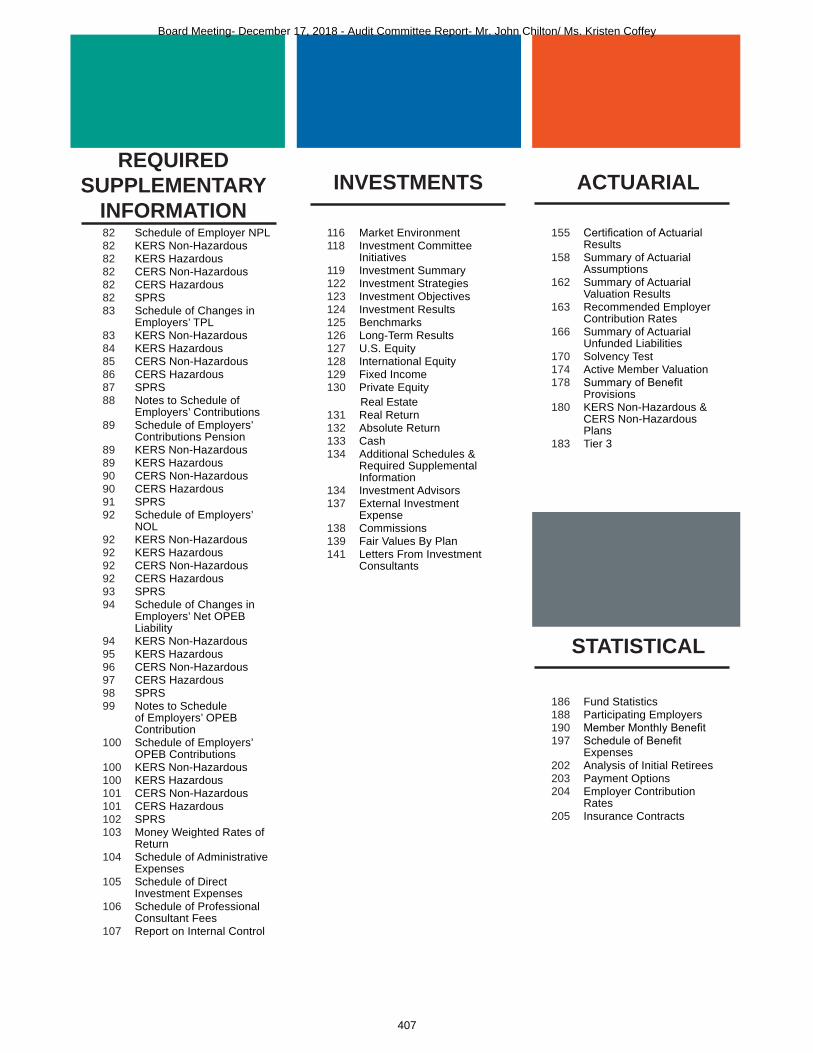
REQUIRED SUPPLEMENTARY
INFORMATIONINVESTMENTS ACTUARIAL
STATISTICAL
82 Schedule of Employer NPL82 KERS Non-Hazardous82 KERS Hazardous82 CERS Non-Hazardous82 CERS Hazardous82 SPRS83 Schedule of Changes in
Employers’ TPL83 KERS Non-Hazardous84 KERS Hazardous85 CERS Non-Hazardous86 CERS Hazardous87 SPRS88 Notes to Schedule of
Employers’ Contributions89 Schedule of Employers’
Contributions Pension89 KERS Non-Hazardous89 KERS Hazardous90 CERS Non-Hazardous90 CERS Hazardous91 SPRS92 Schedule of Employers’
NOL92 KERS Non-Hazardous92 KERS Hazardous92 CERS Non-Hazardous92 CERS Hazardous93 SPRS94 Schedule of Changes in
Employers’ Net OPEB Liability
94 KERS Non-Hazardous95 KERS Hazardous96 CERS Non-Hazardous97 CERS Hazardous98 SPRS99 Notes to Schedule
of Employers’ OPEB Contribution
100 Schedule of Employers’ OPEB Contributions
100 KERS Non-Hazardous100 KERS Hazardous101 CERS Non-Hazardous101 CERS Hazardous102 SPRS103 Money Weighted Rates of
Return104 Schedule of Administrative
Expenses105 Schedule of Direct
Investment Expenses106 Schedule of Professional
Consultant Fees107 Report on Internal Control
116 Market Environment118 Investment Committee
Initiatives119 Investment Summary122 Investment Strategies123 Investment Objectives124 Investment Results125 Benchmarks126 Long-Term Results127 U.S. Equity128 International Equity129 Fixed Income130 Private Equity
Real Estate131 Real Return132 Absolute Return133 Cash134 Additional Schedules &
Required Supplemental Information
134 Investment Advisors137 External Investment
Expense138 Commissions139 Fair Values By Plan141 Letters From Investment
Consultants
155 Certification of Actuarial Results
158 Summary of Actuarial Assumptions
162 Summary of Actuarial Valuation Results
163 Recommended Employer Contribution Rates
166 Summary of Actuarial Unfunded Liabilities
170 Solvency Test174 Active Member Valuation178 Summary of Benefit
Provisions180 KERS Non-Hazardous &
CERS Non-Hazardous Plans
183 Tier 3
186 Fund Statistics188 Participating Employers190 Member Monthly Benefit197 Schedule of Benefit
Expenses202 Analysis of Initial Retirees203 Payment Options204 Employer Contribution
Rates205 Insurance Contracts
Board Meeting- December 17, 2018 - Audit Committee Report- Mr. John Chilton/ Ms. Kristen Coffey
407

INTRODUCTION TABLE OF CONTENTS
4
5 MANAGEMENT’S RESPONSIBILITY FOR FINANCIAL REPORTING
6 LETTER OF TRANSMITTAL9 BOARD OF TRUSTEES10 AGENCY STRUCTURE12 PENSION BENEFITS BY COUNTY13 SYSTEM HIGHLIGHTS TOTAL SYSTEM14 KERS NON-HAZARDOUS
KERS HAZARDOUSCERS NON-HAZARDOUSCERS HAZARDOUSSPRS
15 FIDUCIARY NET POSITION HIGHLIGHTS
Board Meeting- December 17, 2018 - Audit Committee Report- Mr. John Chilton/ Ms. Kristen Coffey
408

5 INT
Board Meeting- December 17, 2018 - Audit Committee Report- Mr. John Chilton/ Ms. Kristen Coffey
409

6INT
Board Meeting- December 17, 2018 - Audit Committee Report- Mr. John Chilton/ Ms. Kristen Coffey
410

7 INT
Board Meeting- December 17, 2018 - Audit Committee Report- Mr. John Chilton/ Ms. Kristen Coffey
411
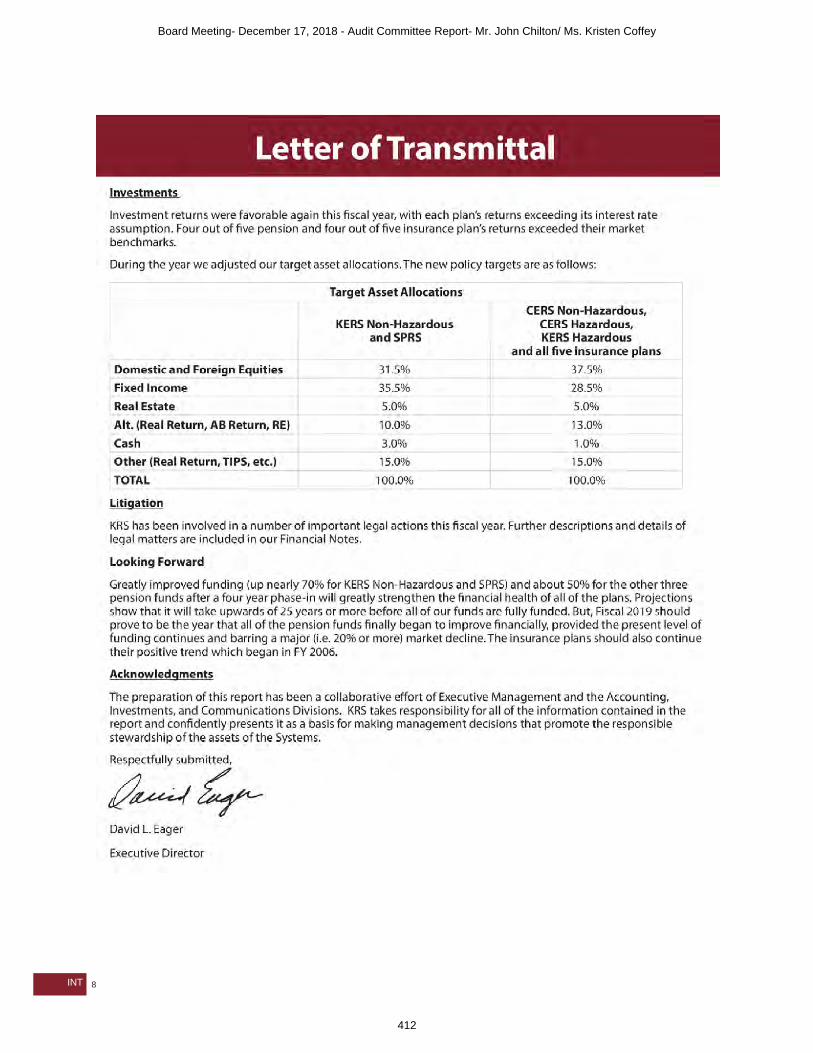
8INT
Board Meeting- December 17, 2018 - Audit Committee Report- Mr. John Chilton/ Ms. Kristen Coffey
412

9 INT
Board of Trustees as of November 29, 2018 Appointed Members: Elected Members: David L. Harris, Chair Raymond Campbell Connell Governor Appointee Elected by KERS Term ends 6/17/22 Term ends 3/31/22
2019 BOARD
MEETING SCHEDULE W. Joe Brothers Sherry Lynn Kremer Governor Appointee Elected by KERS
Regular Term ends 7/1/21 Term ends 3/31/22February 21
May 16 John E. Chilton Keith Peercy, Vice ChairSeptember 12 Governor Appointee Elected by SPRSNovember 14 Term ends 6/17/22 Term ends 3/31/19December 5
Annual William S. Cook Betty PendergrassApril 18 Governor Appointee Elected by CERS
*Dates subject to change. Term ends 6/17/19 Term ends 3/31/21Please visit our website for updates. Board meetings and Audit Committee Kelly Downard Jerry W. Powell
meetings begin at 10 am Eastern; Governor Appointee Elected by CERSall other Committee meetings begin at 9 am Term ends 6/17/19 Term ends 3/31/21
Eastern unless otherwise noted. John R. Farris David Rich
COMMITTEE Governor Appointee Elected by CERS
MEETING SCHEDULE Term ends 6/17/19 Term ends 10/31/21AUDIT INVESTMENT
February 7 February 5 J.T. Fulkerson May 2 May 7 Governor Appointee
August 22 August 27 Term ends 7/1/21 November 7 November 6
David M. Gallagher RETIREE HEALTH ADMINISTRATIVE Governor Appointee
PLAN & DISABILITY Term ends 7/1/21 February 12 APPEALS
May 14 Check website for Matthew Monteiro September 5 dates and times. Governor Appointee November 12 Term ends 6/17/19
Neil P. Ramsey Governor Appointee Pending Replacement Thomas B. Stephens Personnel Secretary Ex-Officio
Board Meeting- December 17, 2018 - Audit Committee Report- Mr. John Chilton/ Ms. Kristen Coffey
413

10INT
Board Meeting- December 17, 2018 - Audit Committee Report- Mr. John Chilton/ Ms. Kristen Coffey
414

11 INT
Board Meeting- December 17, 2018 - Audit Committee Report- Mr. John Chilton/ Ms. Kristen Coffey
415

12INT
2018 Total Fiscal Year KRS Pension Benefits Paid by County County Payees* Total County Payees* Total County Payees* Total Adair 462 $7,449,889 Grant 556 $10,128,969 McLean 295 $4,273,372 Allen 394 5,200,626 Graves 827 12,460,068 Meade 426 5,862,580 Anderson 1,322 32,840,147 Grayson 690 10,357,850 Menifee 205 2,807,645 Ballard 229 3,107,680 Green 273 3,710,635 Mercer 729 12,944,716 Barren 997 15,508,389 Greenup 617 8,235,626 Metcalfe 294 3,784,137 Bath 357 5,323,067 Hancock 220 2,727,382 Monroe 250 2,834,843 Bell 641 10,010,261 Hardin 2,041 33,450,921 Montgomery 613 9,521,154 Boone 1,665 33,492,701 Harlan 606 9,441,452 Morgan 589 10,053,121 Bourbon 523 8,592,168 Harrison 444 6,577,160 Muhlenberg 748 9,125,335 Boyd 1,013 16,478,032 Hart 295 4,303,266 Nelson 967 16,116,364 Boyle 844 14,720,633 Henderson 1,010 16,682,005 Nicholas 205 2,701,531 Bracken 216 2,710,239 Henry 897 19,761,701 Ohio 614 6,437,838 Breathitt 468 7,116,755 Hickman 91 1,711,184 Oldham 1,246 25,684,018 Breckinridge 437 6,272,755 Hopkins 1,187 18,108,152 Owen 515 11,716,512 Bullitt 1,440 25,594,316 Jackson 303 3,999,850 Owsley 205 3,033,893 Butler 309 4,202,494 Jefferson 15,860 338,380,910 Pendleton 338 5,512,127 Caldwell 506 7,586,347 Jessamine 1,006 17,048,293 Perry 743 10,873,665 Calloway 1,028 14,267,469 Johnson 604 8,959,881 Pike 1,196 17,400,119 Campbell 1,464 26,934,689 Kenton 2,163 44,736,168 Powell 331 4,271,386 Carlisle 112 1,522,938 Knott 417 6,382,919 Pulaski 2,126 35,481,447 Carroll 304 4,745,742 Knox 572 9,024,149 Robertson 67 1,049,939 Carter 764 9,779,908 LaRue 335 5,232,274 Rockcastle 375 4,963,320 Casey 345 4,386,774 Laurel 1,174 19,112,743 Rowan 831 14,070,484 Christian 1,492 25,544,533 Lawrence 308 3,792,499 Russell 544 8,203,026 Clark 783 13,160,609 Lee 227 3,221,756 Scott 1,175 23,922,577 Clay 567 8,093,547 Leslie 236 3,430,612 Shelby 1,607 39,755,858 Clinton 240 3,059,773 Letcher 567 7,562,681 Simpson 267 3,023,742 Crittenden 200 2,606,436 Lewis 310 3,727,447 Spencer 450 9,672,121 Cumberland 179 2,609,053 Lincoln 640 7,951,228 Taylor 600 8,560,151 Daviess 2,502 43,628,048 Livingston 243 4,123,938 Todd 250 3,370,725 Edmonson 222 3,054,788 Logan 580 7,983,274 Trigg 499 7,914,916 Elliott 171 2,450,620 Lyon 344 6,477,082 Trimble 258 3,862,495 Estill 375 5,176,148 Madison 2,233 36,881,757 Union 346 3,882,159 Fayette 5,293 113,602,031 Magoffin 328 4,619,282 Warren 2,656 46,603,933 Fleming 441 7,521,043 Marion 520 7,096,484 Washington 311 4,868,012 Floyd 844 12,961,273 Marshall 844 12,259,504 Wayne 506 7,201,731 Franklin 6,297 194,114,984 Martin 261 2,802,998 Webster 336 4,337,558 Fulton 166 2,164,135 Mason 393 6,368,023 Whitley 995 14,257,539 Gallatin 108 1,872,994 McCracken 1,506 27,017,840 Wolfe 308 5,039,314 Garrard 433 6,287,475 McCreary 393 3,931,857 Woodford 978 24,141,926
Pension Benefits paid to retirees and beneficiaries of Kentucky Retirement Systems have a wide ranging impact on the state’s economic health. In fiscal year 2018, KRS paid over $2 billion to its recipients. The majority, 93.73%, of these payments are issued to Kentucky residents. Each county in the Commonwealth receives at least $1 million annually from KRS, providing a stabilizing element for all local economies.
Total Retirement Payments As of June 30, 2018 (In Whole $)
Payees* % Payments Kentucky 104,268 93.73% $1,914,670,658 Out of State 7,786 6.27% 128,003,036 Grand Total 112,054 100.00% $2,042,673,694 *This table represents all payees receiving a monthly payment during the
fiscal year.
Board Meeting- December 17, 2018 - Audit Committee Report- Mr. John Chilton/ Ms. Kristen Coffey
416

13
Totals for All Systems
Members participating on or after September 1, 2008
through December 31, 2013
Members participating before September 1, 2008
3TIERTIER
TIER
BENEFIT TIERSKRS currently administers
three different pension benefit tiers within our
defined benefit plans. The Hybrid Cash Balance plan was established as a part
of Senate Bill 2, which was enacted by the Kentucky
General Assembly during the 2013 Regular Session.
3TIERTIER
TIER
Members participating on or after January 1, 2014
3TIERTIER
TIER
Tier 1 Tier 2 Tier 3
KERSNON-HAZ
CERSNON-HAZ
CERSHAZ
SPRS
KERSHAZ
byTIERS
bySYSTEM
INACTIVE
ACTIVERETI
RED
12
3
INT
ACTIVE INACTIVE RETIRED TOTAL Tier 1 63,547 88,274 110,553 262,374 Tier 2 26,589 27,297 352 54,238 Tier 3 43,283 19,392 1 62,676 Total 133,419 134,963 110,906 379,288
See comparative totals and more detailed information in the Statistical Section beginning on page 185.
Fiduciary Net Position ($ in Thousands) Fund 2012 2013 2014 2015 2016 2017 2018 Pension $10,758,706 $11,153,182 $12,015,897 $11,646,481 $10,877,758 $11,921,906 $12,415,856 Insurance 3,089,313 3,521,894 4,154,401 4,246,892 4,231,311 4,783,905 5,165,179 Total $13,848,019 $14,675,076 $16,170,298 $15,893,373 $15,109,069 $16,705,811 $17,581,035
Board Meeting- December 17, 2018 - Audit Committee Report- Mr. John Chilton/ Ms. Kristen Coffey
417

14INT
Board Meeting- December 17, 2018 - Audit Committee Report- Mr. John Chilton/ Ms. Kristen Coffey
418

15 INT
KERS was established on July 1, 1956 by the State Legislature.
KERS Non-Hazardous - Fiduciary Net Position* ($ in Thousands)
Fund 2012 2013 2014 2015 2016 2017 2018 Pension $2,977,069 $2,760,753 $2,578,291 $2,327,782 $1,980,292 $2,092,781 $2,048,890 Insurance 418,490 496,040 646,904 665,639 668,318 781,406 846,762 Total $3,395,559 $3,256,793 $3,225,195 $2,993,421 $2,648,610 $2,874,187 $2,895,652
KERS Hazardous - Fiduciary Net Position* ($ in Thousands) Fund 2012 2013 2014 2015 2016 2017 2018 Pension $476,589 $514,592 $561,484 $552,468 $527,880 $605,921 $651,173 Insurance 330,730 372,883 433,525 439,113 437,397 484,442 513,384 Total $807,319 $887,475 $995,009 $991,581 $965,277 $1,090,363 $1,164,557
CERS was established on July 1, 1958 by the State Legislature.
CERS Non-Hazardous - Fiduciary Net Position* ($ in Thousands)
Fund 2012 2013 2014 2015 2016 2017 2018 Pension $5,381,602 $5,795,568 $6,528,146 $6,440,800 $6,141,396 $6,739,142 $7,086,322 Insurance 1,428,821 1,618,960 1,878,711 1,920,946 1,908,550 2,160,553 2,346,767 Total $6,810,423 $7,414,528 $8,406,857 $8,361,746 $8,049,946 $8,899,695 $9,433,089
CERS Hazardous - Fiduciary Net Position* ($ in Thousands) Fund 2012 2013 2014 2015 2016 2017 2018 Pension $1,672,970 $1,833,571 $2,087,002 $2,078,202 $2,010,177 $2,227,679 $2,361,047 Insurance 785,874 891,320 1,030,303 1,056,480 1,056,097 1,179,313 1,268,272 Total $2,458,844 $2,724,891 $3,117,305 $3,134,682 $3,066,274 $3,406,992 $3,629,319
SPRS was established on July 1, 1958 by the State Legislature.
SPRS - Fiduciary Net Position* ($ in Thousands)
Fund 2012 2013 2014 2015 2016 2017 2018 Pension $250,476 $248,698 $260,974 $247,229 $218,013 $256,383 $268,425 Insurance 125,398 142,691 164,958 164,714 160,949 178,191 189,994 Total $375,874 $391,389 $425,932 $411,943 $378,962 $434,574 $458,419
* The Fiduciary Net Positions are the resources accumulated and held in trust to pay benefits.
Board Meeting- December 17, 2018 - Audit Committee Report- Mr. John Chilton/ Ms. Kristen Coffey
419

FINANCIAL TABLE OF CONTENTS
1616
17 REPORT OF INDEPENDENT AUDITORS20 MANAGEMENT’S DISCUSSION & ANALYSIS23 FUND ACTIVITIES26 HISTORICAL TRENDS27 COMBINING STATEMENT OF FIDUCIARY NET POSITION - PENSION FUNDS28 COMBINING STATEMENT OF CHANGES IN FIDUCIARY NET POSITION- PENSION
FUNDS29 COMBINING STATEMENT OF FIDUCIARY NET POSITION - INSURANCE FUND30 COMBINING STATEMENT OF CHANGES IN FIDUCIARY NET POSITION -
INSURANCE FUND31 NOTE A. SUMMARY OF SIGNIFICANT ACCOUNTING POLICIES34 NOTE B. PLAN DESCRIPTIONS & CONTRIBUTION INFORMATION40 NOTE C. CASH, SHORT-TERM INVESTMENTS & SECURITIES LENDING
COLLATERAL41 NOTE D. INVESTMENTS58 NOTE E. SECURITIES LENDING TRANSACTIONS58 NOTE F. RISK OF LOSS58 NOTE G. CONTINGENCIES59 NOTE H. DEFINED BENEFIT PENSION PLAN59 NOTE I. INCOME TAX STATUS60 NOTE J. EQUIPMENT EXPENSES60 NOTE K. INTANGIBLE ASSETS61 NOTE L. ACTUARIAL VALUATION63 NOTE M. GASB 67 AND GASB 74 VALUATIONS74 NOTE N. PENSION LITIGATION76 NOTE O. CITY OF FORT WRIGHT77 NOTE P. RECIPROCITY AGREEMENT77 NOTE Q. REIMBURSEMENT OF RETIRED REEMPLOYED HEALTH INSURANCE78 NOTE R. RELATED PARTY78 NOTE S. REDUCTION OF RECEIVABLES79 NOTE T. GOVERNANCE REORGANIZATION79 NOTE U. SUBSEQUENT EVENTS81 REQUIRED SUPPLEMENTARY INFORMATION INCLUDING GASB 67 AND 74
Board Meeting- December 17, 2018 - Audit Committee Report- Mr. John Chilton/ Ms. Kristen Coffey
420
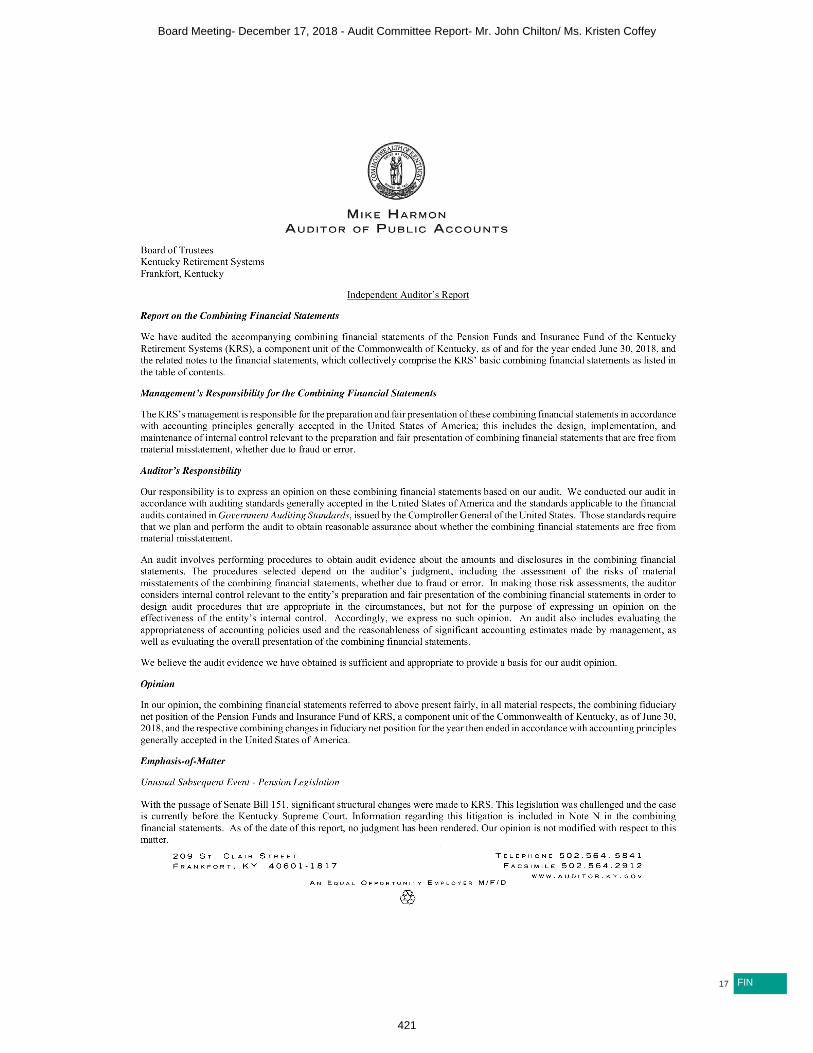
17 FIN
16
Board Meeting- December 17, 2018 - Audit Committee Report- Mr. John Chilton/ Ms. Kristen Coffey
421

18FIN
Board Meeting- December 17, 2018 - Audit Committee Report- Mr. John Chilton/ Ms. Kristen Coffey
422

19 FIN
Board Meeting- December 17, 2018 - Audit Committee Report- Mr. John Chilton/ Ms. Kristen Coffey
423

20FIN
Management'sDISCUSSION & ANALYSIS
Pension Funds The following highlights are explained in more detail later in this report.
Total Pension Fiduciary Net Position was $11.9 billion at the beginning of the fiscal year and increased by 4.14% to $12.4 billion as of June 30, 2018. The $0.5 billion increase is primarily attributable to positive investment income and higher contributions. The pension funds received $87.6 million in General Fund in fiscal year 2018 appropriations compared to $98.2 million in fiscal year 2017.
CONTRIBUTIONS ● Total contributions reported for fiscal year 2018 were $1,635.9 million compared to $1,674.0 million in
fiscal year 2017. Employer contributions, member contributions, pension spiking contributions, and health insurance contributions increased for the fiscal year. General Fund appropriations of $87.6 million for the KERS and SPRS plan, and the employer cessation contributions of $17 thousand were less than fiscal year 2017 resulting in lower total contributions for fiscal year 2018, partially offset by $1 million from a legal settlement with Northern Trust.
● The member health insurance 401(h) contributions totaled $19.8 million for fiscal year 2018 compared to $17.0 million in the prior fiscal year. This increase was mainly due to new active employees in Tier 3.
INVESTMENTS ● The investment portfolio for the Pension Plans reported a net return of 8.57% for fiscal year 2018 compared
to the 13.47% return for fiscal year 2017. The investment portfolio experienced realized gains across all of the portfolios.
● The net appreciation in the fair value of investments for fiscal year 2018 was $806.2 million compared to net appreciation of $1,164.1 million for the prior fiscal year.
● Interest, dividends, and net securities lending income for fiscal year 2018 was $274.9 million compared to $336.6 million in fiscal year 2017. The primary driver of this decrease was due to positive, but less favorable 2018 market conditions which resulted in decreased income and dividends across all portfolios.
● All investment returns are reported net of fees, including carried interest. Investment expenses totaled $92.6 million for fiscal year 2018 compared to $85.5 million in the prior fiscal year.
DEDUCTIONS ● Pension benefits paid to retirees and beneficiaries for fiscal year 2018 totaled $2,062.5 million compared
to $1,981.1 million in fiscal year 2017 (a 4.11% increase). The increase was due to a 4.58% increase in the number of retirees to 124,369. Refund of contributions paid to former members upon termination of employment for fiscal year 2018 totaled $34.9 million compared to $30.7 million in fiscal year 2017, a 13.85% increase, as more members elected a refund at employment termination.
● KRS 2018 Pension administrative expense totaled $33.0 million compared to $33.1 million in the prior year. The decrease was mainly due to lower technology expenditures and salary expense related to vacant positions.
ACTUARIALThe actuarial value of the total pension liability was determined as of June 30, 2018. The discount rate and assumed rate of return used to measure the total pension liability was 5.25% for the KERS Non-Hazardous and SPRS Pension plans. The rate of 6.25% was used for the KERS Hazardous and CERS Pension plans. The payroll growth assumptions for the KERS and SPRS Pension plans was 0.00% and 2.00% for the CERS Pension plans. The assumed inflation factor was 2.30% for all plans. The assumed real rate of return was 3.95% for the CERS systems, KERS Hazardous, and all Insurance plans, and 2.95% for KERS Non-Hazardous and State SPRS pension plans.
Board Meeting- December 17, 2018 - Audit Committee Report- Mr. John Chilton/ Ms. Kristen Coffey
424

21 FIN
Management'sDISCUSSION & ANALYSIS
Insurance Fund The following highlights are explained in more detail later in this report.
The combined fiduciary net position of the Insurance Fund increased by $381.3 million during fiscal year 2018. Total combined net position for the fiscal year was $5,165.2 million. Total contributions and net investment income of $759.3 million offset deductions of $378.0 million which resulted in the net position increase.
CONTRIBUTIONS ● Employer contributions of $321.9 million were received in fiscal year 2018 compared to $315.0 million in
fiscal year 2017. Total contributions increased 2.19% primarily due to the increased contribution rate for the KERS Non-hazardous plan and increased employer payroll for the CERS plans.
● The reimbursement of retired/re-employed health insurance for fiscal year 2018 totaled $9.8 million compared to $8.9 million in the prior fiscal year. The increase is due to an increase in retired/re-employed members for whom employers are paying health insurance reimbursements.
INVESTMENTS ● Interest, dividends, and net securities lending income for fiscal year 2018 was $106.6 million compared to
$128.1 million in fiscal year 2017. The primary driver of this decrease was due to market conditions resulting in decreased income and dividends across all portfolios.
● The investment portfolio reported a net return of 9.05% for the fiscal year, lower than fiscal year 2017 net of expense returns of 13.72%. The investment returns exceeded the 6.25% assumed rate of return.
● The net appreciation in the fair value of investments for fiscal year 2018 was $366.2 million compared to net appreciation of $480.3 million for the prior fiscal year. This $114.1 million decrease in fiscal year 2018 was due to lower market returns compared to fiscal year 2017 and portfolio rebalancing to reduce equity risk.
● Investment expenses totaled $45.9 million for fiscal year 2018 compared to $34.2 million in the prior fiscal year due to asset growth.
DEDUCTIONS ● Total insurance premiums paid plus self-funded reimbursements was $375.9 million for fiscal year 2018.
Although fiscal year 2018 insurance premiums were comparable to fiscal year 2017 rates, the number of covered lives increased by approximately 5% year-over-year.
● KRS’ insurance administrative expenses for retirees under age 65, decreased from $2.2 million in fiscal year 2017 to $2.1 million in fiscal year 2018.
ACTUARIALThe actuarial value of the total insurance liability was determined as of June 30, 2018. The discount rate and assumed investment rate of return used to measure the total insurance liability was 6.25% for all plans. Assumed payroll growth and inflation was 0% and 2.30% respectively for KERS Non-Hazardous, KERS Hazardous and SPRS. Assumed payroll growth and inflation for CERS Non-Hazardous and CERS Hazardous was 2.00% and 2.30% respectively. The assumed real rate of return was 3.95% for KERS Non-Hazardous, KERS Hazardous, and SPRS pension plans, 1.95% for the CERS systems.
Board Meeting- December 17, 2018 - Audit Committee Report- Mr. John Chilton/ Ms. Kristen Coffey
425

22FIN
Management'sDISCUSSION & ANALYSIS
Using This Financial Report Because of the long-term nature of a defined benefit pension plan and post-employment healthcare benefit plan, the combining financial statements alone cannot provide sufficient information to properly reflect the plans’ ongoing plan perspective. This financial report consists of two combining financial statements and two required schedules of historical trend information. All plans within KRS are included in the aforementioned combining financial statements. The Combining Statement of Fiduciary Net Position for the Pension Funds on page 27 and the Combining Statement of Fiduciary Net Position for the Insurance Fund on page 29 provide a snapshot of the financial position of each of the three systems as of fiscal year 2018. The Combining Statement of Changes in Fiduciary Net Position for the Pension Funds on page 28, and the Combining Statement of Changes in Fiduciary Net Position for the Insurance Fund on page 28, summarizes the additions and deductions that occurred for each of the three systems during fiscal year 2018. The economic assumptions for the Pension and Insurance Plans for fiscal year 2018 are on page 61, the Schedules of Changes in Employers’ Net Pension Liability on pages 83-87, the Schedules of the Employer Net Pension Liability on pages 82; the Schedule of Changes in Employers’ Net OPEB Liability are on pages 94-98; and, the Schedule of the Employers’ Net OPEB Liabilities are on page 72-73. These schedules include current and historical trend information about the actuarially funded status of each plan from a long-term, ongoing plan perspective and the progress made in accumulating sufficient assets to pay benefits and insurance premiums when due. The Schedules of the Employers’ Contributions – Pensions are on pages 89-91, and the Schedule of the Employers’ Contributions – OPEB are on pages 100-102. These schedules present current and historical trend information about the annual required contributions and the contributions made in relation to the requirement. These Schedules provide information that contributes to understanding the changes over time in the funded status of the plans.
Kentucky Retirement Systems CombinedKRS’ combined fiduciary net position increased $875.2 million in fiscal year 2018, compared to the fiduciary net position for the prior fiscal year. The increase in fiduciary net position for the fiscal year 2018 is primarily attributable to an increase in net investment incomes, higher contributions, and General Fund appropriations. The analysis focuses on net position table and changes in fiduciary net position table for KRS’ Pension and Insurance Funds.
Board Meeting- December 17, 2018 - Audit Committee Report- Mr. John Chilton/ Ms. Kristen Coffey
426

23 FIN
Management'sDISCUSSION & ANALYSIS
FUND ACTIVITIES
The net position of the Pension Funds increased by $494.0 million to $12,415.9 million in fiscal year 2018 compared to $11,921.9 million in fiscal year 2017. All of these assets are restricted in use to provide monthly retirement allowances to members who contributed to the Pension Funds as employees and on behalf of their beneficiaries. The net position of the Insurance Fund increased by $381.3 million to $5,165.2 million in fiscal year 2018 compared to $4,783.9 million in fiscal year 2017. All of these assets are restricted in use to provide hospital and medical insurance benefits to members of the Pension Funds who receive a monthly retirement allowance.
Financial data presented in this report is
abbreviated “in thousands” or “in millions.”
Fiduciary Net Positionas of June 30, 2018 ($ in Thousands) Pension Funds Insurance Fund Total
2018 2017 2016 2018 2017 2016 2018 2017 2016Cash & Invest. $12,859,431 $12,168,664 $11,410,516 $5,367,071 $4,936,439 $4,401,155 $18,226,502 $17,105,103 $15,811,671Receivables 349,172 347,620 442,464 148,883 103,747 171,033 498,055 451,367 613,497Equip/Int Assets, net of dep/amort. 4,437 6,311 8,232 - - - 4,437 6,311 8,232Total Assets 13,213,040 12,522,595 11,861,212 5,515,954 5,040,186 4,572,188 18,728,994 17,562,781 16,433,400Total Liabilities (797,184) (600,694) (983,454) (350,775) (256,279) (340,877) (1,147,959) (856,973) (1,324,331)Fiduciary Net Position $12,415,856 $11,921,901 $10,877,758 $5,165,179 $4,783,907 $4,231,311 $17,581,035 $16,705,808 $15,109,069
Pension Fund ActivitiesMember contributions increased by $15.6 million. This is primarily due to an increase in covered payroll in CERS Non-Hazardous and CERS Hazardous. Retirement contributions are calculated by applying a percentage factor to salary and are remitted by each employer on behalf of the member. Non-Hazardous members pay pension contributions of 5.00% of creditable compensation and Hazardous members contribute 8.00% of creditable compensation. Employer contributions increased by $3.4 million as a result of the increase in the contribution rates for all funds. Total Pension Funds deductions increased by $85.4 million. The 4.17% increase was primarily driven by higher retirements across all plans. Net investment income decreased by $426.7 million. This is illustrated in the Investment Income Pension table on the next page. The pension funds experienced a decrease in income when compared to fiscal year 2017, due to less favorable market conditions. KRS outperformed the benchmark in fiscal year 2018 and the plans’ actuarial assumed rates of return. KRS also has transitioned into new asset allocations with a higher cash allocation at fiscal year-end, resulting in a lower yielding portfolio.
Board Meeting- December 17, 2018 - Audit Committee Report- Mr. John Chilton/ Ms. Kristen Coffey
427

24FIN
Management'sDISCUSSION & ANALYSIS
Investment Income (Loss) - PensionAs of June 30, 2018 ($ in Thousands)Investment Income (Loss) - Pension 2018 2017 2016Increase (decrease) in fair value of investments $ (142,280) $603,703 $(270,041)Investment income net of investment expense 182,299 251,064 136,917Gain on sale of investments 948,444 560,380 57,149Net investment income (loss) $ 988,463 $1,415,147 $(75,975)
Changes in Fiduciary Net PositionAs of June 30, 2018 ($ in Thousands) Pension Funds Insurance Fund Total 2018 2017 2016 2018 2017 2016 2018 2017 2016Additions:Member Cont. $349,844 $334,232 $307,422 $- $- $- $349,844 $334,232 $307,422Employer Cont. 1,169,690 1,166,269 949,802 321,888 314,987 333,118 1,491,578 1,481,256 1,282,920Heath Ins. Cont. 19,849 16,964 14,719 - - - 19,849 16,964 14,719Pension Spiking Cont. 8,078 5,156 2,684 - - - 8,078 5,156 2,684Northern Trust Settlement 827 - - 173 - - 1,000 - -General Fund Appro. 87,574 98,193 - - - - 87,574 98,193 -Employer Cessation Cont. 17 53,215 - - 15,567 - 17 68,782 -Premiums Rec’d - - - 497 548 721 497 548 721Retired Re-emp Ins. - - - 9,837 8,893 9,155 9,837 8,893 9,155Medicare Subsidy - - - 16 2 - 16 2 -Invest. Inc. (net) 988,463 1,415,147 (75,975) 426,842 574,187 (5,154) 1,415,305 1,989,334 (81,129)Total Additions 2,624,342 3,089,176 1,198,652 759,253 914,184 337,840 3,383,595 4,003,360 1,536,492Deductions:Benefit payments 2,062,482 1,981,100 1,903,557 - - - 2,062,482 1,981,100 1,903,557Refunds 34,948 30,696 30,985 - - - 34,948 30,696 30,985Administrative Exp. 32,957 33,109 32,300 2,063 2,202 2,038 35,020 35,311 34,338Healthcare Costs - - - 375,918 359,388 351,383 375,918 359,388 351,383Capital Projects Exp. - 123 533 - - - - 123 533Total Deductions 2,130,387 2,045,028 1,967,375 377,981 361,590 353,421 2,508,368 2,406,618 2,320,796Inc. (Decrease) in Fiduciary Net Position $493,955 $1,044,148 $(768,723) $381,272 $552,594 $(15,581) $875,227 $1,596,742 $(784,304)
Board Meeting- December 17, 2018 - Audit Committee Report- Mr. John Chilton/ Ms. Kristen Coffey
428

25 FIN
Management'sDISCUSSION & ANALYSIS
Insurance Fund Activities Employer contributions paid into the Insurance Fund increased by $6.9 million in fiscal year 2018 over the prior fiscal year. This increase was a result of an increase in the employer covered payroll for CERS Non-Hazardous and Hazardous plans. Net investment income decreased $147.3 million in fiscal year 2018 compared to fiscal year 2017. Although KRS outperformed the benchmark in fiscal year 2018, market conditions were less favorable, and KRS rebalanced the portfolios resulted in a lower yielding portfolio. This is illustrated in the Investment Income Insurance table as follows:
Investment Income (Loss) - InsuranceAs of June 30, 2018 ($ in Thousands)Investment Income (Loss) - Insurance 2018 2017 2016Increase (decrease) in fair value of investments $25,516 $256,937 $(46,852)Investment income net of investment expense 60,688 93,902 49,380Gain (loss) on sale of investments 340,638 223,348 (7,682)
Net investment income (loss) $426,842 $574,187 $(5,154)
Board Meeting- December 17, 2018 - Audit Committee Report- Mr. John Chilton/ Ms. Kristen Coffey
429

26FIN
Management'sDISCUSSION & ANALYSIS
Historical TrendsAccounting standards require that the Combining Statement of Fiduciary Net Position state asset value at fair value and include only benefits and refunds due plan members and beneficiaries; accrued investment income (loss); and, administrative expense as of the reporting date. Information regarding the actuarial funding status of the Pension and Insurance Funds is provided in the schedules of Net Pension Liability on page 82 and Net OPEB Liability on pages 72-73. The asset value stated in the Schedules of Changes in Employers’ Total Pension Liability on pages 83-87 and Net OPEB Liability on pages 72-98 is the actuarial value of assets. The actuarial value of assets recognizes a portion of the difference between the market value of assets and the expected market value of assets based on the investment return assumption. The amount recognized each year is 20% of the difference between market value and expected market value. The actuarial accrued liability is calculated using the entry age normal cost funding method. This actuarial accrued liability is the measure of the cost of benefits that have been earned to date by KRS’ members, but not yet paid. The difference in value between the actuarial accrued liability and the actuarial value of assets is defined as the unfunded actuarial accrued liability. The unfunded actuarial accrued liability from the June 30, 2018 actuarial valuation in the Pension Plans increased by $464.5 million for a total unfunded amount of $23,602.0 million in fiscal year 2018, compared to an unfunded amount of $23,137.5 million in fiscal year 2017. In recent years, funding levels for the Pension Funds have decreased significantly due to a number of factors including: the change in assumptions for the 2017 valuations; investment returns that were less than the actuarially assumed rates; lower payroll growth; and, higher than anticipated retirement rates. In addition, KERS Non-Hazardous, KERS Hazardous, and SPRS were funded less than the actuarially determined rate until fiscal year 2015. The Insurance Plan’s unfunded actuarial accrued liability from the June 30, 2018, actuarial valuation for fiscal year 2018, was $2,653.9 million compared to $3,601.1 million for fiscal year 2017. This is a decrease in the unfunded actuarial accrued liability of $947.2 million. The deduction is primarily due to reduction in insurance premiums across all plans. Annual required contributions of the employers, as actuarially determined, and actual contributions made by employers and other contributing entities in relation to the required contributions, are provided in the Schedules of Employer Contributions - Pension on pages 89-91, and in the Schedules of Contributions - OPEB on pages 100 -102. The difference in the annual required contributions and actual contributions made by employers and other contributing entities in the KERS and SPRS funds is attributable to the fact that the employer contribution rate set by the Kentucky General Assembly was less than the rate recommended by the KRS Actuary in prior years and adopted by the KRS Board of Trustees.
Board Meeting- December 17, 2018 - Audit Committee Report- Mr. John Chilton/ Ms. Kristen Coffey
430
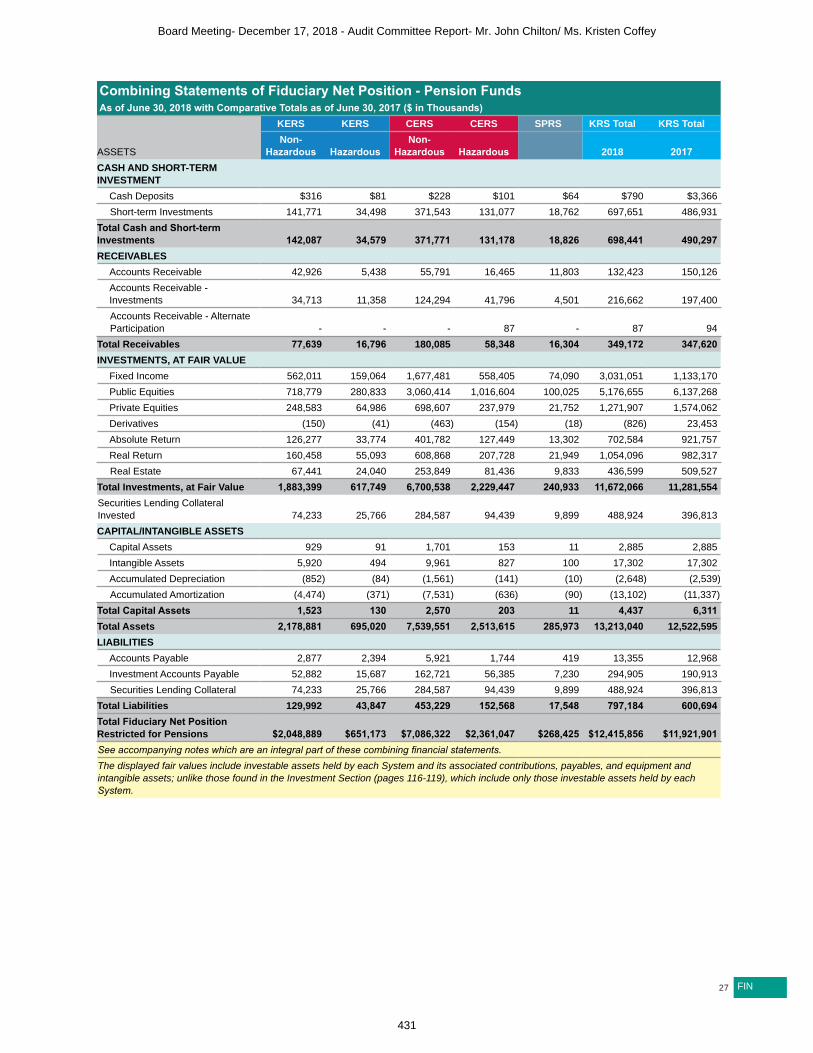
27 FIN
Combining Statements of Fiduciary Net Position - Pension FundsAs of June 30, 2018 with Comparative Totals as of June 30, 2017 ($ in Thousands)
ASSETS
KERS KERS CERS CERS SPRS KRS Total KRS TotalNon-
Hazardous HazardousNon-
Hazardous Hazardous 2018 2017CASH AND SHORT-TERM INVESTMENT
Cash Deposits $316 $81 $228 $101 $64 $790 $3,366Short-term Investments 141,771 34,498 371,543 131,077 18,762 697,651 486,931
Total Cash and Short-term Investments 142,087 34,579 371,771 131,178 18,826 698,441 490,297RECEIVABLES
Accounts Receivable 42,926 5,438 55,791 16,465 11,803 132,423 150,126Accounts Receivable - Investments 34,713 11,358 124,294 41,796 4,501 216,662 197,400Accounts Receivable - Alternate Participation - - - 87 - 87 94
Total Receivables 77,639 16,796 180,085 58,348 16,304 349,172 347,620INVESTMENTS, AT FAIR VALUE
Fixed Income 562,011 159,064 1,677,481 558,405 74,090 3,031,051 1,133,170Public Equities 718,779 280,833 3,060,414 1,016,604 100,025 5,176,655 6,137,268Private Equities 248,583 64,986 698,607 237,979 21,752 1,271,907 1,574,062Derivatives (150) (41) (463) (154) (18) (826) 23,453Absolute Return 126,277 33,774 401,782 127,449 13,302 702,584 921,757Real Return 160,458 55,093 608,868 207,728 21,949 1,054,096 982,317Real Estate 67,441 24,040 253,849 81,436 9,833 436,599 509,527
Total Investments, at Fair Value 1,883,399 617,749 6,700,538 2,229,447 240,933 11,672,066 11,281,554Securities Lending Collateral Invested 74,233 25,766 284,587 94,439 9,899 488,924 396,813CAPITAL/INTANGIBLE ASSETS
Capital Assets 929 91 1,701 153 11 2,885 2,885Intangible Assets 5,920 494 9,961 827 100 17,302 17,302Accumulated Depreciation (852) (84) (1,561) (141) (10) (2,648) (2,539)Accumulated Amortization (4,474) (371) (7,531) (636) (90) (13,102) (11,337)
Total Capital Assets 1,523 130 2,570 203 11 4,437 6,311Total Assets 2,178,881 695,020 7,539,551 2,513,615 285,973 13,213,040 12,522,595LIABILITIES
Accounts Payable 2,877 2,394 5,921 1,744 419 13,355 12,968Investment Accounts Payable 52,882 15,687 162,721 56,385 7,230 294,905 190,913Securities Lending Collateral 74,233 25,766 284,587 94,439 9,899 488,924 396,813
Total Liabilities 129,992 43,847 453,229 152,568 17,548 797,184 600,694Total Fiduciary Net Position Restricted for Pensions $2,048,889 $651,173 $7,086,322 $2,361,047 $268,425 $12,415,856 $11,921,901See accompanying notes which are an integral part of these combining financial statements.The displayed fair values include investable assets held by each System and its associated contributions, payables, and equipment and intangible assets; unlike those found in the Investment Section (pages 116-119), which include only those investable assets held by each System.
Board Meeting- December 17, 2018 - Audit Committee Report- Mr. John Chilton/ Ms. Kristen Coffey
431

28FIN
Combining Statements of Changes In Fiduciary Net Position - Pension Fundsfor the fiscal year ending June 30, 2018 with Comparative Totals for the fiscal year ending June 30, 2017 ($ in Thousands)
KERS KERS CERS CERS SPRS KRS Total KRS TotalNon-
Hazardous HazardousNon-
Hazardous Hazardous 2018 2017
ADDITIONS Member Contributions $104,972 $17,891 $160,370 $61,089 $5,522 $349,844 $334,232Employer Contributions 619,988 32,790 355,473 124,953 36,486 1,169,690 1,166,269General Fund Appropriations 67,574 10,000 - - 10,000 87,574 98,193Pension Spiking Contributions 1,564 871 2,544 2,707 392 8,078 5,156Northern Trust Settlement 301 33 361 111 21 827 Health Insurance Contributions (HB1) 5,786 909 10,826 2,173 155 19,849 16,964Employer Cessation Contributions 17 - - - - 17 53,215Total Contributions 800,202 62,494 529,574 191,033 52,576 1,635,879 1,674,029
INVESTMENT INCOME From Investing Activities
Net Appreciation in FV of Investments 112,993 42,668 477,218 158,788 14,497 806,164 1,164,083Interest/Dividends 46,969 13,800 154,008 50,956 5,605 271,338 334,599Total Investing Activities Income 159,962 56,468 631,226 209,744 20,102 1,077,502 1,498,682Investment Expense 6,487 2,852 32,464 10,624 1,070 53,497 85,520Performance Fees 6,670 1,981 22,254 7,572 623 39,100 -
Net Income from Investing Activities 146,805 51,635 576,508 191,548 18,409 984,905 1,413,162From Securities Lending Activities
Securities Lending Income 1,624 478 4,823 1,607 183 8,715 3,070Securities Lending Expense
Securities Lending Borrower Rebates 779 242 2,699 896 96 4,712 734Securities Lending Agent Fees 73 23 255 85 9 445 351
Net Income from Securities Lending 772 213 1,869 626 78 3,558 1,985Total Investment Income 147,577 51,848 578,377 192,174 18,487 988,463 1,415,147Total Additions 947,779 114,342 1,107,951 383,207 71,063 2,624,342 3,089,176
DEDUCTIONS Benefit Payments 967,374 65,616 726,568 244,119 58,805 2,062,482 1,981,100Refunds 13,603 2,501 14,608 4,214 22 34,948 30,696Administrative Expenses 10,692 975 19,592 1,504 194 32,957 33,109Capital Project Expenses - - - - - - 123
Total Deductions 991,669 69,092 760,768 249,837 59,021 2,130,387 2,045,028Net Increase(Decrease) in Fiduciary Net Position (43,890) 45,250 347,183 133,370 12,042 493,955 1,044,148FIDUCIARY NET POSITION HELD IN TRUST FOR PENSION BENEFITS Beginning of Period 2,092,779 605,923 6,739,139 2,227,677 256,383 11,921,901 10,877,753End of Period $2,048,889 $651,173 $7,086,322 $2,361,047 $268,425 $12,415,856 $11,921,901See accompanying notes which are an integral part of these combining financial statements.
Board Meeting- December 17, 2018 - Audit Committee Report- Mr. John Chilton/ Ms. Kristen Coffey
432

29 FIN
Combining Statements of Fiduciary Net Position - Insurance FundAs of June 30, 2018 with Comparative Totals as of June 30, 2017 ($ In Thousands)
ASSETS
KERS KERS CERS CERS SPRS KRS Total KRS TotalNon-
Hazardous HazardousNon-
Hazardous Hazardous 2018 2017CASH AND SHORT-TERM INVESTMENT
Cash Deposits $78 $33 $51 $45 $33 $240 $243Short-term Investments 45,856 26,665 118,284 63,000 7,607 261,412 184,860
Total Cash and Short-term Investments 45,934 26,698 118,335 63,045 7,640 261,652 185,103
RECEIVABLES Accounts Receivable 12,396 657 14,016 4,236 885 32,190 28,249Investment Accounts Receivable 20,229 11,178 52,013 28,790 4,483 116,693 75,498
Total Receivables 32,625 11,835 66,029 33,026 5,368 148,883 103,747
INVESTMENTS, AT FAIR VALUE Fixed Income 199,166 118,026 513,963 276,976 42,541 1,150,672 371,212Public Equities 399,932 225,391 1,014,654 548,164 82,690 2,270,831 2,614,142Private Equities 49,763 52,224 276,522 155,455 23,585 557,549 582,345Derivatives (57) (34) (153) (83) (12) (339) 9,575Absolute Return 45,185 29,938 128,204 71,761 11,221 286,309 388,353Real Return 72,701 42,936 206,376 107,249 14,839 444,101 395,367Real Estate 25,727 18,847 81,828 44,780 7,189 178,371 211,795
Total Investments, at Fair Value 792,417 487,328 2,221,394 1,204,302 182,053 4,887,494 4,572,789Securities Lending Collateral Invested 36,100 22,759 97,332 53,693 8,041 217,925 178,547Total Assets 907,076 548,620 2,503,090 1,354,066 203,102 5,515,954 5,040,186
LIABILITIES Accounts Payable 98 3 674 36 0 811 1,013Investment Accounts Payable 24,116 12,474 58,317 32,065 5,067 132,039 76,719Securities Lending Collateral 36,100 22,759 97,332 53,693 8,041 217,925 178,547
Total Liabilities 60,314 35,236 156,323 85,794 13,108 350,775 256,279Total Fiduciary Net Position Restricted for Insurance $846,762 $513,384 $2,346,767 $1,268,272 $189,994 $5,165,179 $4,783,907See accompanying notes which are an integral part of these combining financial statements.
Board Meeting- December 17, 2018 - Audit Committee Report- Mr. John Chilton/ Ms. Kristen Coffey
433

30FIN
Combining Statements of Changes In Fiduciary Net Position - Insurance Fundfor the fiscal year ending June 30, 2018 with Comparative Totals for the fiscal year ended June 30, 2017 ($ in Thousands)
KERS KERS CERS CERS SPRS KRS Total KRS TotalNon-
Hazardous HazardousNon-
Hazardous Hazardous 2018 2017
ADDITIONS Employer Contributions $132,364 $4,302 $120,798 $55,027 $9,397 $321,888 $314,987Medicare Drug Reimbursement 5 - 11 - - 16 2Insurance Premiums 216 (50) 637 (265) (41) 497 548Retired Re-employed Healthcare 4,055 986 3,821 975 - 9,837 8,893Northern Trust Settlement 32 18 75 40 8 173 Employer Cessation Contributions - - - - - - 15,567Total Contributions 136,672 5,256 125,342 55,777 9,364 332,411 339,997
INVESTMENT INCOME From Investing Activities
Net Appreciation in FV of Investments 49,902 36,484 170,708 94,771 14,289 366,154 480,285Interest/Dividends 16,700 10,420 48,144 26,083 3,922 105,269 127,379Total Investing Activities Income 66,602 46,904 218,852 120,854 18,211 471,423 607,664Investment Expense 3,959 2,784 12,923 7,087 1,086 27,839 34,228Performance Fees 1,542 1,695 9,001 5,085 755 18,078 -
Net Income from Investing Activities 61,101 42,425 196,928 108,682 16,370 425,506 573,436
From Securities Lending Activities Securities Lending Income 574 344 1,493 814 125 3,350 1,071
Securities Lending Expense Securities Lending Borrower Rebates 310 182 810 443 68 1,813 187Securities Lending Agent Fees 34 20 91 49 7 201 133
Net Income from Securities Lending 230 142 592 322 50 1,336 751Total Investment Income 61,331 42,567 197,520 109,004 16,420 426,842 574,187Total Additions 198,003 47,823 322,862 164,781 25,784 759,253 914,184
DEDUCTIONS Healthcare Premiums Subsidies 130,069 18,697 131,631 74,844 13,881 369,122 353,595Administrative Expenses 760 104 761 376 62 2,063 2,202Self-Funded Healthcare Costs 1,819 79 4,248 603 38 6,787 5,784Excise Tax Insurance 3 - 6 - - 9 9
Total Deductions 132,651 18,880 136,646 75,823 13,981 377,981 361,590Net Increase(Decrease) in Fiduciary Net Position 65,352 28,943 186,216 88,958 11,803 381,272 552,594FIDUCIARY NET POSITION HELD IN TRUST FOR INSURANCE BENEFITS Beginning of Period 781,410 484,441 2,160,551 1,179,314 178,191 4,783,907 4,231,313End of Period $846,762 $513,384 $2,346,767 $1,268,272 $189,994 $5,165,179 $4,783,907See accompanying notes which are an integral part of these combining financial statements.
Board Meeting- December 17, 2018 - Audit Committee Report- Mr. John Chilton/ Ms. Kristen Coffey
434

31 FIN
NOTE A. Summary of Significant Accounting PoliciesThis summary of KRS’ significant accounting policies is presented to assist in understanding KRS’ combining financial statements. The combining financial statements and notes are representations of KRS’ management, which is responsible for their integrity and objectivity. These accounting policies conform to GAAP and have been consistently applied in the preparation of the combining financial statements.
OrganizationUnder the provisions of Kentucky Revised Statute Section 61.645, the KRS Board administers the KERS, CERS, and SPRS in accordance with the provisions of Kentucky Revised Statute Sections 16.555, 61.570, and 78.630. The KRS’ assets are segregated by plan, where each system’s assets are used only for the payment of benefits to the members of that plan and a pro rata share of administrative costs. Under the provisions of Kentucky Revised Statute Section 61.701, the KRS Board administers the KRS Insurance Fund. The statutes provide for a single insurance fund to provide group hospital and medical benefits to retirees drawing a benefit from the three pension funds administered by KRS: (1) KERS; (2) CERS; and (3) SPRS. The assets of the Insurance Fund are also segregated by plan. The following notes apply to the various funds administered by KRS.
Basis of AccountingKRS’ combining financial statements are prepared using the accrual basis of accounting. Plan member contributions are recognized in the period in which contributions are due. Employer contributions to the plan are recognized when due and the employer has made a formal commitment to provide the contributions. Benefits and refunds are recognized when due and payable in accordance with terms of the plan. Premium payments are recognized when due and payable in accordance with terms of the plan. Administrative and investment expenses are recognized when incurred. The net position represents the funds KRS has accumulated thus far to pay pension benefits for retirees, active and inactive members, and health care premiums for current and future employees.
Method Used to Value InvestmentsInvestments are reported at fair value. Fair value is the price that would be received to sell an asset or paid to transfer a liability in an orderly transaction between market participants at the measurement date. Short-term investments are reported at cost, which approximates fair value. See Investments Note D for further discussion of fair value measurements. Purchases and sales of securities are recorded on a trade-date basis. Interest income is recorded on the accrual basis. Dividends are recorded on the dividend date. Gain (loss) on investments includes KRS’ gains and losses on investments bought and sold as well as held during the fiscal year. Investment returns are recorded in all plans net of investment fees.
EstimatesThe preparation of financial statements in accordance with Generally Accepted Accounting Principles (GAAP) requires management to make estimates and assumptions that affect certain reported amounts and disclosures. Accordingly, actual results could differ from those estimates.
EquipmentEquipment is valued at historical cost and depreciation is computed utilizing the straight-line method over the estimated useful lives of the assets ranging from three to ten years. Improvements, which increase the useful life of the equipment, are capitalized. Maintenance and repairs are charged as an expense when incurred. The capitalization threshold used in fiscal years 2018 and 2017 was $3,000 (see Equipment Note J for further information).
Intangible AssetsIntangible assets, currently computer software, are valued at historical cost and amortization is computed utilizing the straight-line method over the estimated useful lives of the assets which is 10 years. The capitalization threshold used in fiscal years 2018 and 2017 was $3,000 (see Intangible Assets Note K for further information).
Board Meeting- December 17, 2018 - Audit Committee Report- Mr. John Chilton/ Ms. Kristen Coffey
435

32FIN
Contributions ReceivableContributions receivable consist of amounts due from employers. KRS management considers contributions receivable to be fully collectible; accordingly, no allowance for doubtful accounts is considered necessary. If amounts become uncollectible, they will be charged to operations when that determination is made. If amounts previously written off are collected, they will be credited to income when received. The Investment Accounts Receivable and Investment Accounts Payable consist of all buys and sells of securities which have not closed, as well as all investment related accruals.
Payment of BenefitsBenefits are recorded when paid.
Expense AllocationKRS administrative expenses are allocated in proportion to the number of total members participating in each plan and direct investment manager expenses are allocated in proportion to the percentage of investment assets held by each plan.
Component UnitKRS is a component unit of the Commonwealth of Kentucky (Commonwealth) for financial reporting purposes. KERS was created by the Kentucky General Assembly pursuant to the provisions of Kentucky Revised Statute 61.515. CERS was created by the Kentucky General Assembly pursuant to the provisions of Kentucky Revised Statute 78.520. SPRS was created by the Kentucky General Assembly pursuant to the provisions of Kentucky Revised Statute 16.510. The Kentucky Retirement Systems Insurance Fund was created by the Kentucky General Assembly pursuant to the provisions of Kentucky Revised Statute 61.701. KRS’ administrative budget is subject to approval by the Kentucky General Assembly. Employer contribution rates for KERS and SPRS are also subject to legislative approval. Employer contribution rates for CERS are determined by the Board of KRS without further legislative review. The methods used to determine the employer rates for KRS are specified in Kentucky Revised Statute 61.565. Employee contribution rates are set by statute and may be changed only by the Kentucky General Assembly.
Recent Accounting PronouncementsIn June 2015, the Governmental Accounting Standards Board (GASB) issued Statement No. 75, Accounting and Financial Reporting for Post-employment Benefits Other Than Pensions. The objective of this Statement is to address accounting and financial reporting for Other Post-employment Benefits (OPEB) that are provided to the employees of state and local governmental employers. This Statement establishes standards for recognizing and measuring liabilities; deferred outflows of resources; deferred inflows of resources; and, expense/expenditures. For defined benefit OPEB, this Statement identifies the methods and assumptions that are required to be used to project benefit payments, discount projected benefit payments to their actuarial present value, and attribute that present value to periods of employee service. Note disclosure and required supplementary information requirements about defined benefit OPEB are also addressed. This Statement became effective for the fiscal year beginning July 1, 2017. KRS provided the agencies their proportionate share in the OPEB unfunded liability, calculated by Gabriel, Roeder, Smith & Co. (GRS), to be used in their financial reports for fiscal year ending June 30, 2018. In June 2017, the GASB issued Statement No. 87, Leases. The objective of this Statement is to address government lessee’s recognition of lease liabilities, intangible assets, and report amortization expense for using the lease, interest expense on the lease liability, and note disclosures about the lease. Another objective of this Statement is to address government lessor’s recognition of a lease receivable, deferred inflow, and report lease revenue, interest income, and note disclosures about the lease. This Statement becomes effective for the fiscal year beginning July 1, 2020. KRS is evaluating the impact of this Statement to the financial report.
Board Meeting- December 17, 2018 - Audit Committee Report- Mr. John Chilton/ Ms. Kristen Coffey
436

33 FIN
GASB Statement 84, Fiduciary Activities, establishes criteria for identifying fiduciary activities of all state and local governments and clarifies whether and how business type activities should report their fiduciary activities. This Statement becomes effective for the fiscal year beginning July 1, 2019. KRS meets the criteria as a fiduciary activity. KRS reports the plan’s assets, deferred outflows of resources, liabilities, deferred inflows of resources, and fiduciary net position in accordance with Statement 67 and Statement 74, as applicable. GASB Statement 82, Pension Issues, was designed to improve consistency in the application of the pension standards by clarifying or amending related areas of existing guidance. Specifically, the practice issues raised by stakeholders during implementation related to GASB 67, 68, and 73. This Statement became effective for the fiscal year beginning July 1, 2017. KRS has implemented GASB Statement 82. GASB 67 & 68 require the presentation of covered payroll as defined as the payroll on which contributions to a pension plan are based. There is no deviation from the guidance in an Actuarial Standard of Practice for financial reporting purposes with the requirements of Statement 67, 68, or 73. The member and contributions disclosed in GASB 67 & 68 reports are in conformity with plan member contributions classified as plan member contributions for purposes of Statement 67, and as employee contributions for purposes of Statement 68.
Board Meeting- December 17, 2018 - Audit Committee Report- Mr. John Chilton/ Ms. Kristen Coffey
437

34FIN
Note B. Plan Descriptions & Contribution Information
KERS Membership CombinedAs of June 30, 2018 2018 2017Members Non-Haz Hazardous Total Non-Haz Hazardous TotalRetirees and Beneficiaries Receiving Benefits 42,175 3,010 45,185 40,813 2,823 43,636Inactive Memberships 45,768 4,716 50,484 44,848 4,363 49,211Active Plan Members 34,845 3,963 38,808 36,725 4,061 40,786Total 122,788 11,689 134,477 122,386 11,247 133,633Number of Participating Employers 348 354
CERS Membership CombinedAs of June 30, 2018 2018 2017Members Non-Haz Hazardous Total Non-Haz Hazardous TotalRetirees and Beneficiaries Receiving Benefits 56,629 7,647 64,276 54,018 7,186 61,204Inactive Memberships 81,608 2,581 84,189 78,940 2,442 81,382Active Plan Members 84,435 9,285 93,720 84,401 9,321 93,722Total 222,672 19,513 242,185 217,359 18,949 236,308Number of Participating Employers 1,139 1,138
SPRSAs of June 30, 2018Members 2018 2017Retirees and Beneficiaries Receiving Benefits 1,445 1,393Inactive Memberships 290 278Active Plan Members 891 910Total 2,626 2,581Number of Participating Employers 1 1Note: Each person is only counted once in the Membership by System report. A member who has both a membership account and a retired account is included in retired count. Members who have multiple membership accounts are included under the system where they most recently contributed. Members who have more than one retirement account are included in the system with the greatest service credit. If the retired accounts have equal service credit, they are counted first in SPRS, CERS Hazardous, KERS Hazardous, CERS Non- Hazardous, then KERS Non-Hazardous.
Board Meeting- December 17, 2018 - Audit Committee Report- Mr. John Chilton/ Ms. Kristen Coffey
438

35 FIN
Number of Hospital & Medical ContractsAs of June 30, 2018
System SingleCouple/ Family Parent
Medicare Without
Prescription
Medicare With
PrescriptionKERS Non-Hazardous 8,638 696 460 1,179 21,117KERS Hazardous 686 478 96 73 1,495CERS Non-Hazardous 8,802 510 231 2,389 25,476CERS Hazardous 1,712 2,571 422 119 3,388SPRS 253 426 74 21 941
Totals 20,091 4,681 1,283 3,781 52,417
Number of Hospital & Medical ContractsAs of June 30, 2017
System SingleCouple/ Family Parent
Medicare Without
Prescription
Medicare With
PrescriptionKERS Non-Hazardous 8,627 663 411 1,229 20,215KERS Hazardous 667 432 88 72 1,401CERS Non-Hazardous 8,313 462 222 2,462 24,247CERS Hazardous 1,645 2,387 395 125 3,205SPRS 251 420 79 17 897
Totals 19,503 4,364 1,195 3,905 49,965Medical Insurance coverage is provided based on the member’s initial participation date and length of service. Members receive either a percentage or dollar amount for insurance coverage.
Board Meeting- December 17, 2018 - Audit Committee Report- Mr. John Chilton/ Ms. Kristen Coffey
439

36FIN
Pension Plan DescriptionsThese systems provide for retirement, disability, and death benefits to system members. Retirement benefits may be extended to beneficiaries of members under certain circumstances.
KERS - Kentucky Employees Retirement SystemThis system consists of two plans - Non-Hazardous and Hazardous. Each plan is a cost-sharing, multiple-employer defined benefit pension plan that covers all regular full-time members employed in positions of any state department, board, or agency directed by Executive Order to participate in KERS.
CERS - County Employees Retirement SystemThis system consists of two plans - Non-Hazardous and Hazardous. Each plan is a cost-sharing, multiple-employer defined benefit pension plan that covers all regular full-time members employed in positions of each participating county, city, and school board, and any additional eligible local agencies electing to participate in CERS.
SPRS - State Police Retirement SystemThis system is a single-employer defined benefit pension plan that covers all full-time state troopers employed in positions by the Kentucky State Police.
Cost of Living Adjustment (COLA) Prior to July 1, 2009, COLAs were provided annually equal to the percentage increase in the annual average of the consumer price index for all urban consumers for the most recent calendar year, not to exceed 5% in any plan year. After July 1, 2009, the COLAs were limited to 1.50%. No COLA has been granted since July 1, 2011.
Contributions The Commonwealth is required to contribute at an actuarially determined rate for KERS and SPRS pensions. Participating employers are required to contribute at an actuarially determined rate for CERS pensions. Per Kentucky Revised Statute Sections {KERS 61.565(3); CERS 78.545(33); SPRS 16.645(18)}, normal contribution and past service contribution rates shall be determined by the Board on the basis of an annual valuation last preceding July 1 of a new biennium. The Board may amend contribution rates as of the first day of July of the second year of a biennium, if it is determined on the basis of a subsequent actuarial valuation that amended contribution rates are necessary to satisfy requirements determined in accordance with actuarial bases adopted by the Board. However, formal commitment to provide the contributions by the employer is made through the biennial budget for KERS and SPRS. For the fiscal year ended June 30, 2018, participating employers contributed a percentage of each employee’s creditable compensation. The actuarially determined rates set by the Board for the fiscal year is a percentage of each employee’s creditable compensation. Administrative costs of KRS are financed through employer contributions and investment earnings. See the chart on the following page for the 2018 and 2017 fiscal year employer contribution rates, including the actuarially recommended rates.
Board Meeting- December 17, 2018 - Audit Committee Report- Mr. John Chilton/ Ms. Kristen Coffey
440
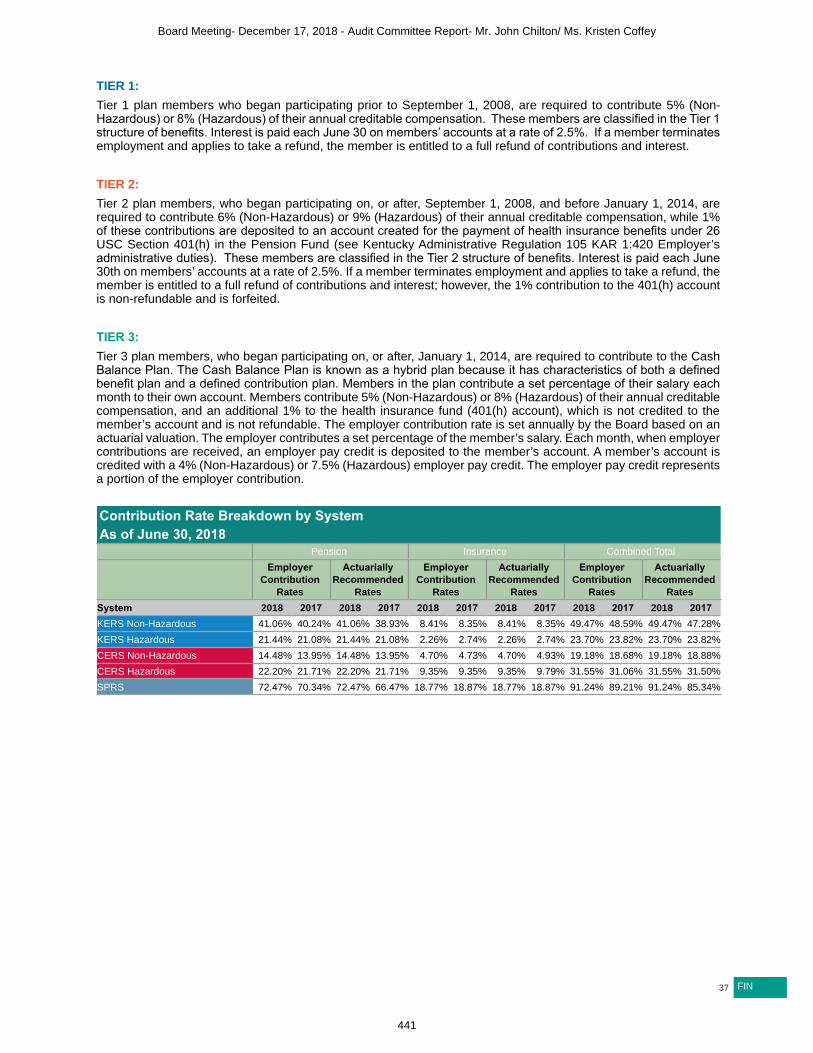
37 FIN
TIER 1: Tier 1 plan members who began participating prior to September 1, 2008, are required to contribute 5% (Non-Hazardous) or 8% (Hazardous) of their annual creditable compensation. These members are classified in the Tier 1 structure of benefits. Interest is paid each June 30 on members’ accounts at a rate of 2.5%. If a member terminates employment and applies to take a refund, the member is entitled to a full refund of contributions and interest. TIER 2: Tier 2 plan members, who began participating on, or after, September 1, 2008, and before January 1, 2014, are required to contribute 6% (Non-Hazardous) or 9% (Hazardous) of their annual creditable compensation, while 1% of these contributions are deposited to an account created for the payment of health insurance benefits under 26 USC Section 401(h) in the Pension Fund (see Kentucky Administrative Regulation 105 KAR 1:420 Employer’s administrative duties). These members are classified in the Tier 2 structure of benefits. Interest is paid each June 30th on members’ accounts at a rate of 2.5%. If a member terminates employment and applies to take a refund, the member is entitled to a full refund of contributions and interest; however, the 1% contribution to the 401(h) account is non-refundable and is forfeited. TIER 3: Tier 3 plan members, who began participating on, or after, January 1, 2014, are required to contribute to the Cash Balance Plan. The Cash Balance Plan is known as a hybrid plan because it has characteristics of both a defined benefit plan and a defined contribution plan. Members in the plan contribute a set percentage of their salary each month to their own account. Members contribute 5% (Non-Hazardous) or 8% (Hazardous) of their annual creditable compensation, and an additional 1% to the health insurance fund (401(h) account), which is not credited to the member’s account and is not refundable. The employer contribution rate is set annually by the Board based on an actuarial valuation. The employer contributes a set percentage of the member’s salary. Each month, when employer contributions are received, an employer pay credit is deposited to the member’s account. A member’s account is credited with a 4% (Non-Hazardous) or 7.5% (Hazardous) employer pay credit. The employer pay credit represents a portion of the employer contribution.
Contribution Rate Breakdown by SystemAs of June 30, 2018
Pension Insurance Combined Total
Employer Contribution
Rates
Actuarially Recommended
Rates
Employer Contribution
Rates
Actuarially Recommended
Rates
Employer Contribution
Rates
Actuarially Recommended
RatesSystem 2018 2017 2018 2017 2018 2017 2018 2017 2018 2017 2018 2017KERS Non-Hazardous 41.06% 40.24% 41.06% 38.93% 8.41% 8.35% 8.41% 8.35% 49.47% 48.59% 49.47% 47.28%KERS Hazardous 21.44% 21.08% 21.44% 21.08% 2.26% 2.74% 2.26% 2.74% 23.70% 23.82% 23.70% 23.82%CERS Non-Hazardous 14.48% 13.95% 14.48% 13.95% 4.70% 4.73% 4.70% 4.93% 19.18% 18.68% 19.18% 18.88%CERS Hazardous 22.20% 21.71% 22.20% 21.71% 9.35% 9.35% 9.35% 9.79% 31.55% 31.06% 31.55% 31.50%SPRS 72.47% 70.34% 72.47% 66.47% 18.77% 18.87% 18.77% 18.87% 91.24% 89.21% 91.24% 85.34%
Board Meeting- December 17, 2018 - Audit Committee Report- Mr. John Chilton/ Ms. Kristen Coffey
441

38FIN
Tier 3 PlanInterest is paid into the Tier 3 member’s account. The account currently earns 4% interest credit on the member’s account balance as of June 30th of the previous year. The member’s account may be credited with additional interest if the system’s five-year Geometric Average Net Investment Return (GANIR) exceeded 4%. If the member was actively employed and participating in the fiscal year, and if the systems’ GANIR for the previous five years exceeds 4%, then the member’s account will be credited with 75% of the amount of the returns over 4% on the account balance as of June 30th of the previous year (Upside Sharing Interest). It is possible that one system in KRS may get an Upside Sharing Interest, while one may not.
Upside Sharing Interest Upside Sharing Interest is credited to both the member contribution balance and Employer Pay Credit balance. Upside Sharing Interest is an additional interest credit. Member accounts automatically earn 4% interest annually. The GANIR is calculated on an individual system basis. The chart below shows the interest calculated on the members’ balances as of June 30, 2017, and credited to each member account on June 30, 2018.
(A-B) = C x 75% = D then B + D = Interest ($ in Thousands) A B C D
System
5 Year Geometric Average Return
Less Guarantee Rate of 4%
Upside Sharing Interest
Upside Sharing
Interest X 75% = Upside Gain
Interest Rate Earned (4% +
Upside)
Total Interest Credited
to Member Accounts
KERS Non-Hazardous 6.66% 4.00% 2.66% 2.00% 6.00% $2,379KERS Hazardous 7.53% 4.00% 3.53% 2.65% 6.65% 771CERS Non-Hazardous 7.39% 4.00% 3.39% 2.54% 6.54% 4,786CERS Hazardous 7.66% 4.00% 3.66% 2.75% 6.75% 1,284SPRS 6.95% 4.00% 2.95% 2.21% 6.21% $92
Board Meeting- December 17, 2018 - Audit Committee Report- Mr. John Chilton/ Ms. Kristen Coffey
442

39 FIN
Insurance Plan Description The Kentucky Retirement Systems’ Insurance Fund was established to provide hospital and medical insurance for eligible members receiving benefits from KERS, CERS, and SPRS. The eligible non-Medicare retirees are covered by the Department of Employee Insurance (DEI) plans. KRS submits the premium payments to DEI. The Board contracts with Humana to provide health care benefits to the eligible Medicare retirees through a Medicare Advantage Plan. The Insurance Fund pays a prescribed contribution for whole or partial payment of required premiums to purchase hospital and medical insurance. For the fiscal year ended June 30, 2018, insurance premiums withheld from benefit payments for members of the Systems were $20.8 million and $1.3 million for KERS Non-Hazardous and Hazardous, respectively; $23.8 million and $2.8 million for CERS Non-Hazardous and Hazardous, respectively; and, $329,330 for SPRS. For fiscal year 2017, insurance premiums withheld from benefit payments for members of the Systems were $20.3 million and $1.3 million for KERS Non-Hazardous and KERS Hazardous, respectively; $22.9 million and $2.7 million for CERS Non-Hazardous and CERS Hazardous, respectively, and $290,387 for SPRS. The Insurance Fund pays the same proportion of hospital and medical insurance premiums for the spouse and dependents of retired hazardous members killed in the line of duty. As a result of House Bill 290 (2004 Kentucky General Assembly), medical insurance benefits are calculated differently for members who began participating on, or after, July 1, 2003. Once members reach a minimum vesting period of 10 years, non-hazardous employees whose participation began on, or after, July 1, 2003, earn $10 per month for insurance benefits at retirement for every year of earned service without regard to a maximum dollar amount. Hazardous employees whose participation began on, or after, July 1, 2003 earn $15 per month for insurance benefits at retirement for every year of earned service without regard to a maximum dollar amount. Upon death of a hazardous employee, the employee’s spouse receives $10 per month for insurance benefits for each year of the deceased employee’s earned hazardous service. This dollar amount is subject to adjustment annually, which is currently 1.5%, based upon Kentucky Revised Statutes. See chart for current values for Dollar Contribution. This benefit is not protected under the inviolable contract provisions of Kentucky Revised Statute 16.652, 61.692 and 78.852. The Kentucky General Assembly reserves the right to suspend or reduce this benefit if, in its judgment, the welfare of the Commonwealth so demands.
The amount of contribution paid by the Insurance Fund is based on years of service. For members participating prior to July 1, 2003, years of service and respective percentages of the maximum contribution are as follows:
Portion Paid by Insurance FundAs of June 30, 2018
Years of ServicePaid by Insurance
Fund (%)20+ years 100.00%15-19 years 75.00%10-14 years 50.00%4-9 years 25.00%Less than 4 years 0.00%
The amount of contribution paid by the Insurance Fund is based on years of service. For members participating prior to July 1, 2003, years of service and respective percentages of the maximum contribution are as follows:
Dollar Contribution for Fiscal Year 2018 For Member participation date on or after July 1, 2003System (in Whole $)KERS Non-Hazardous $13.38KERS Hazardous $20.07CERS Non-Hazardous $13.38CERS Hazardous $20.07SPRS $20.07
Board Meeting- December 17, 2018 - Audit Committee Report- Mr. John Chilton/ Ms. Kristen Coffey
443

40FIN
Note C. Cash, Short-Term Investments & Securities Lending CollateralThe provisions of GASB Statement No. 28, Accounting and Financial Reporting for Securities Lending Transactions, require that cash received as collateral on securities lending transactions, and investments made with that cash, be reported as assets on the financial statements. In accordance with GASB No. 28, KRS classifies certain other investments, not related to the securities lending program, as short-term. Cash and short-term investments consist of the following as of June 30, 2018.
Cash, Short-Term Investments, & Securities Lending CollateralAs of June 30, 2018 ($ in Thousands)KERS - Pension 2018 2017Cash $397 $1,497Short-Term Investments 176,269 138,632Securities Lending Collateral Invested 99,999 82,349Total $276,665 $222,478 CERS - Pension 2018 2017Cash $329 $1,775Short-Term Investments 502,620 336,326Securities Lending Collateral Invested 379,026 306,661Total $881,975 $644,762 SPRS - Pension 2018 2017Cash $64 $94Short-Term Investments 18,762 11,973Securities Lending Collateral Invested 9,899 7,803Total $28,725 $19,870 KRS - Insurance Fund 2018 2017Cash $240 $243Short-Term Investments 261,412 184,858Securities Lending Collateral Invested 217,925 178,547Total $479,577 $363,648
Board Meeting- December 17, 2018 - Audit Committee Report- Mr. John Chilton/ Ms. Kristen Coffey
444

41 FIN
Note D. InvestmentsKentucky Revised Statute 61.650 grants the responsibility for the investment of plan assets to the KRS Board. The Board has established an Investment Committee which is specifically charged with the oversight and investment of plan assets. The Investment Committee recognizes their duty to invest the funds in accordance with the “Prudent Person Rule” (set forth in Kentucky Revised Statute 61.650) and manage those funds consistent with the long-term nature of the systems. The Investment Committee has adopted a Statement of Investment Policy that contains guidelines and restrictions for deposits and investments. By statute, all investments are to be registered and held in the name of KRS. The Statement of Investment Policy contains the specific guidelines for the investment of Pension and Insurance assets. Additionally, the Investment Committee establishes specific investment guidelines that are summarized below and are included in the Investment Management Agreement for each investment management firm.
Equity Investments Investments may be made in common stock; securities convertible into common stock; preferred stock of publicly traded companies on stock markets; asset class relevant Exchange Traded Funds (ETF); or any other type of security contained in a manager’s benchmark. Each individual equity account has a comprehensive set of investment guidelines prepared, which contains a listing of permissible investments, portfolio restrictions and standards of performance.
Fixed Income InvestmentsThe fixed income accounts may include, but are not limited to, the following fixed income securities: U.S. Government and Agency bonds; investment grade U.S. corporate credit; investment grade non-U.S. corporate credit; non-investment grade U.S. corporate credit including both bonds and bank loans; non-investment grade non-U.S. corporate credit including bonds and bank loans; municipal bonds; non-U.S. sovereign debt; mortgages, including residential mortgage backed securities; commercial mortgage backed securities and whole loans; asset-backed securities and emerging market debt (EMD), including both sovereign EMD and corporate EMD; and, asset class relevant ETFs.
Private Equity/Equity Real Estate/Real Return/Absolute Return Investments Subject to the specific approval of the Investment Committee, investments may be made for the purpose of creating a diversified portfolio of alternative investments. The Board may invest in real estate or alternative investments including, but not limited to and without limitation: venture capital, private equity, real assets, and absolute return investments. The Investment Committee believes absolute returns have the potential to generate substantial income, but may have a higher degree of risk. It is important to note that KERS (Non-Hazardous) and SPRS have not made any new investments in Private Equity since 2010 and 2016, respectively, due to the inability to invest in long-term investments as a result of cash flow constraints. Investments may be made in real estate mortgages on a direct basis or in the form of mortgage pool instruments.
Cash Equivalent Securities The following short-term investment vehicles are considered acceptable: publicly traded investment grade corporate bonds; variable rate demand notes; government and agency bonds; mortgages; municipal bonds; Short Term Investment Funds (STIFs); money market funds or instruments (including, but not limited to, certificates of deposit, bank notes, deposit notes, bankers’ acceptances and commercial paper); and repurchase agreements relating to the above instruments. Instruments may be selected from among those having an investment grade rating at the time of purchase by at least one recognized bond rating service. In cases where the instrument has a split rating, the lower of the two ratings is used.
Board Meeting- December 17, 2018 - Audit Committee Report- Mr. John Chilton/ Ms. Kristen Coffey
445

42FIN
All instruments shall have a maturity at the time of purchase that does not exceed two years. Repurchase agreements shall be deemed to have a maturity equal to the period remaining until the date on which the repurchase of the underlying securities is scheduled to occur. Variable rate securities shall be deemed to have a maturity equal to the time left until the next interest rate reset occurs, but in no case will any security have a stated final maturity of more than three years. KRS’ fixed income managers, who utilize cash equivalent securities as an integral part of their investment strategy, are exempt from the permissible investments contained in the preceding paragraph. Permissible short-term investments for fixed income managers shall be included in the investment manager’s investment guidelines.
Investment Expenses In accordance with GASB Statement Nos. 67 and 74, Financial Reporting for Pension Plans and Postemployment Benefit Plans Other Than Pension Plans, KRS has exercised professional judgment to report investment expenses. It is not cost-beneficial to separate certain investment expenses from either the related investment income or the general administrative expenses. In fiscal year 2015, KRS changed private equity investment fees from a gross basis to a net basis. KRS made this decision to enhance transparency reporting. Prior to 2015, the majority of KRS’ private equity investment fees were netted against investment activity which is the standard used within the private equity sector. KRS’ net investment income has always included these fees regardless of the reporting method used. During the 2017 Regular Session of the Kentucky General Assembly, legislators passed SB2 which requires the reporting of all investment fees and expenses. KRS staff continues to work with managers to enhance fees and expenses reporting.
DerivativesDerivative instruments are financial contracts that have various effective dates and maturity dates and whose values depend on the values of one or more underlying assets, reference rates, or financial indices. Investments may be made in derivative securities, or strategies which make use of derivative instruments, only if such investments do not cause the portfolio to be in any way leveraged beyond a 100% invested position. Investments in derivative securities are subject to large or unanticipated changes in duration or cash flows, and can be interest only, principal only, inverse floater, or structured note securities. These are permitted only to the extent that they are authorized in a contract or an alternative investment offering memorandum of agreement. Investments in securities such as collateralized mortgage obligations and planned amortization class issues are allowed if, in the judgment of the investment manager, they are not expected to be subject to large or unanticipated changes in duration or cash flows. Investment managers may make use of derivative securities for defensive or hedging purposes. Any derivative security shall be sufficiently liquid so that it can be expected to be sold at, or near, its most recently quoted market price. It is the KRS policy that investment managers may invest in derivative securities, or strategies which make use of derivative investments, only if such investments do not cause the portfolio to be in any way leveraged beyond a 100% invested position. Examples of such derivatives include, but are not limited to, foreign currency forward contracts, collateralized mortgage obligations, treasury inflation protected securities, futures, options, and swaps. For accounting and financial reporting purposes, all derivative instruments are considered investment derivative instruments. The derivatives have been segregated on the Combining Statement of Fiduciary Net Position for both the Pension and Insurance Funds. In accordance with GASB Statement No. 53, Accounting and Financial Reporting for Derivative Instruments, KRS provides additional disclosure regarding its derivatives. The following chart represents the derivatives by types as of June 30, 2018. The chart shows the change in fair value of each of the derivatives types as well as the current fair value and notional value. The notional value is the reference amount of the underlying asset times its current spot price. KRS holds investments in options, commitments, futures, and forward foreign exchange contracts. KRS is exposed to counterparty risk with the foreign exchange contracts that are held. As of June 30, 2018, the aggregate fair value of investment derivatives subject to counterparty credit risk was $1.8 million for the Pension Fund and $0.6 million for the Insurance Fund.
Board Meeting- December 17, 2018 - Audit Committee Report- Mr. John Chilton/ Ms. Kristen Coffey
446

43 FIN
Derivative InstrumentsAs of June 30, 2018 ($ in Thousands)Pension
Derivatives (by Type)Net Appreciation (Depreciation) in Fair Value for the Fiscal year Ended June 30, 2018 Fair Value
Notional Value
Futures $(826) Investment $(826) $(112,271)FX Spots and Forwards 966 Investment 1,791 (825)
Commits and Options - Investment 74 (84,469)Insurance
Derivatives (by Type)Net Appreciation (Depreciation) in Fair Value for the Fiscal year Ended June 30, 2018 Fair Value
Notional Value
Futures (339) Investment (339) (36,639)FX Spots and Forwards 378 Investment 550 (172)
Commits and Options $- Investment $13 $(11,106)Note: Commits and Options are recorded on the Financial Statements within the Fixed Income asset class as they are Government Loan Commitments.Derivatives foreign currency risk is comprised of the above FX Spots and Forwards. The risk associated is due to the potential decline in exchange rates.FX Spots and Forwards are recorded on the Financial Statements as Payable/Receivables because they represent the foreign exchange for the purchase/sales of securities.
Board Meeting- December 17, 2018 - Audit Committee Report- Mr. John Chilton/ Ms. Kristen Coffey
447
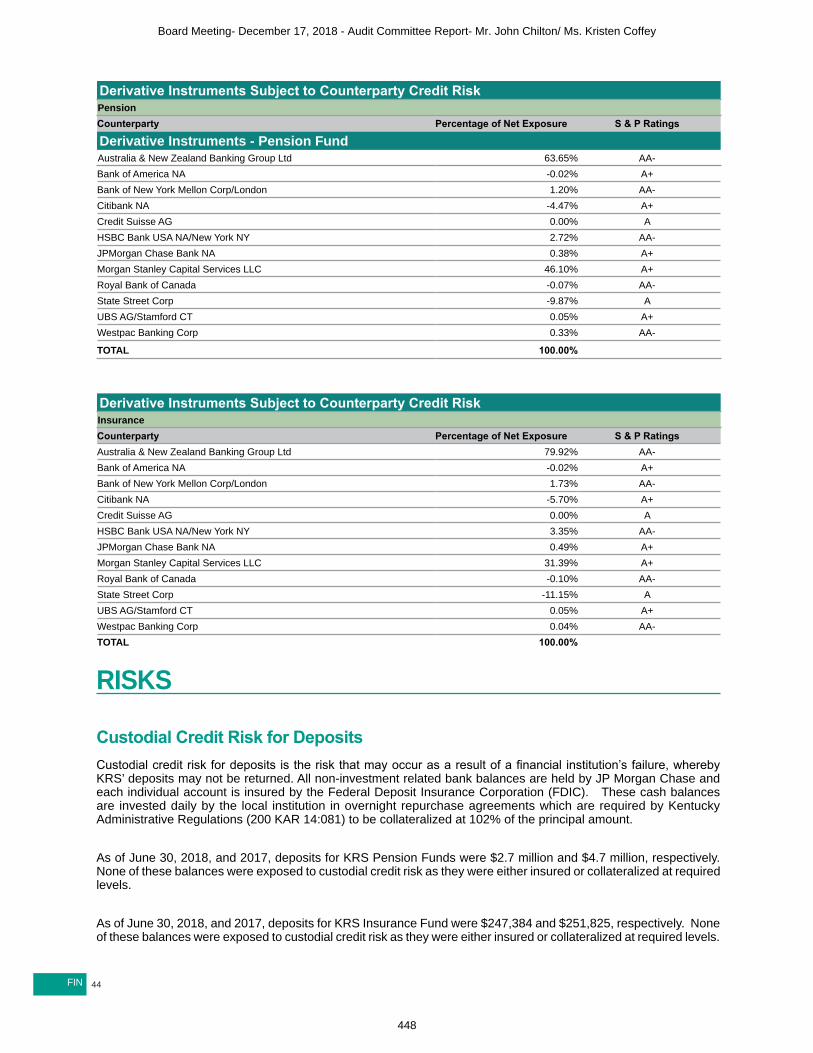
44FIN
Derivative Instruments Subject to Counterparty Credit RiskPensionCounterparty Percentage of Net Exposure S & P Ratings
Derivative Instruments - Pension FundAustralia & New Zealand Banking Group Ltd 63.65% AA-Bank of America NA -0.02% A+Bank of New York Mellon Corp/London 1.20% AA-Citibank NA -4.47% A+Credit Suisse AG 0.00% AHSBC Bank USA NA/New York NY 2.72% AA-JPMorgan Chase Bank NA 0.38% A+Morgan Stanley Capital Services LLC 46.10% A+Royal Bank of Canada -0.07% AA-State Street Corp -9.87% AUBS AG/Stamford CT 0.05% A+Westpac Banking Corp 0.33% AA-
TOTAL 100.00% Derivative Instruments Subject to Counterparty Credit RiskInsuranceCounterparty Percentage of Net Exposure S & P RatingsAustralia & New Zealand Banking Group Ltd 79.92% AA-Bank of America NA -0.02% A+Bank of New York Mellon Corp/London 1.73% AA-Citibank NA -5.70% A+Credit Suisse AG 0.00% AHSBC Bank USA NA/New York NY 3.35% AA-JPMorgan Chase Bank NA 0.49% A+Morgan Stanley Capital Services LLC 31.39% A+Royal Bank of Canada -0.10% AA-State Street Corp -11.15% AUBS AG/Stamford CT 0.05% A+Westpac Banking Corp 0.04% AA-TOTAL 100.00%
RISKS
Custodial Credit Risk for DepositsCustodial credit risk for deposits is the risk that may occur as a result of a financial institution’s failure, whereby KRS’ deposits may not be returned. All non-investment related bank balances are held by JP Morgan Chase and each individual account is insured by the Federal Deposit Insurance Corporation (FDIC). These cash balances are invested daily by the local institution in overnight repurchase agreements which are required by Kentucky Administrative Regulations (200 KAR 14:081) to be collateralized at 102% of the principal amount. As of June 30, 2018, and 2017, deposits for KRS Pension Funds were $2.7 million and $4.7 million, respectively. None of these balances were exposed to custodial credit risk as they were either insured or collateralized at required levels. As of June 30, 2018, and 2017, deposits for KRS Insurance Fund were $247,384 and $251,825, respectively. None of these balances were exposed to custodial credit risk as they were either insured or collateralized at required levels.
Board Meeting- December 17, 2018 - Audit Committee Report- Mr. John Chilton/ Ms. Kristen Coffey
448

45 FIN
As of June 30, 2018 and 2017, deposits for the Clearing account, were ($1,277,139) and $523,643, respectively. None of these balances were exposed to custodial credit risk as they were either insured or collateralized at required levels. As of June 30, 2018, and 2017, deposits for the Excess Benefit account, were $4,789 and $4,789, respectively. None of these balances were exposed to custodial credit risk as they were either insured or collateralized at required levels.
Board Meeting- December 17, 2018 - Audit Committee Report- Mr. John Chilton/ Ms. Kristen Coffey
449

46FIN
Custodial Credit Risk for InvestmentsCustodial credit risk for investments is the risk that, in the event of the failure of the counterparty to a transaction, a government will not be able to recover the value of an investment or collateral securities that are in the possession of an outside party. As of June 30, 2018, the currencies in the chart below were uninsured and unregistered, with securities held by the counterparty or by its trust department or agent but not in KRS’ name. These funds are cash held by KRS’ Global Managers and consist of various currencies.
Custodial Credit Risk
As of June 30, 2018 ($ in Thousands) 2018 2017 Pension Fund Foreign Currency $1,518,359 $1,408,163 Insurance Fund Foreign Currency $654,401 $557,016
Pension Fund Securities
Pension Funds Investment Summary
As of June 30, 2018 ($ in Thousands) Type 2018 2017Fixed Income $3,031,051 $1,133,170Public Equities 5,176,655 6,137,268Private Equities 1,271,907 1,574,062Derivatives (826) 23,453Absolute Return 702,584 921,757Real Return 1,054,096 982,317Real Estate 436,599 509,527Short-Term Investments 697,651 486,931Accounts Receivable (Payable), Net (78,243) 6,487Total $12,291,474 $11,774,972Note: Differences due to rounding.
Board Meeting- December 17, 2018 - Audit Committee Report- Mr. John Chilton/ Ms. Kristen Coffey
450

47 FIN
Insurance Fund Securities
Insurance Fund Investment SummaryAs of June 30, 2018 ($ in Thousands)Type 2018 2017Fixed Income $1,150,672 $371,213Public Equities 2,270,831 2,614,142Private Equities 557,549 582,345Derivatives (339) 9,574Absolute Return 286,309 388,353Real Return 444,101 395,369Real Estate 178,371 211,796Short-Term Investments 261,412 184,860Accounts Receivable (Payable), Net (15,346) (1,220)Total $5,133,560 $4,756,432Note: Differences due to rounding.
Credit Risk Debt Securities Credit risk is when the risk that an issuer or other counterparty to an investment will not fulfill its obligations. The debt security portfolios are managed by the Investment Division staff and by external investment management firms. All portfolio managers are required by the Statement of Investment Policy to maintain diversified portfolios. Each portfolio is also required to be in compliance with risk management guidelines that are assigned to them based upon the portfolio’s specific mandate. In total, the Pension and Insurance Funds’ debt securities portfolios are managed using the following guidelines adopted by the Board:
● Bonds, notes, or other obligations issued or guaranteed by the U.S. Government, its agencies or instrumentalities are permissible investments and may be held without restrictions.
● Fixed income investments will be similar in type to those securities found in the KRS fixed income benchmarks and the characteristics of the KRS Fixed Income portfolio will be similar to the KRS fixed income benchmarks. The duration of the total fixed income portfolio shall not deviate from the KRS Fixed Income by more than 25%.
● The duration of the TIPS portfolio shall not deviate from the KRS Fixed Income Index by more than 10%. ● The amount invested in the debt of a single corporation shall not exceed 5% of the total market value of KRS’
assets. ● No public fixed income manager shall invest more than 5% of the market value of assets held in any single
issue short-term instrument, with the exception of U.S. Government issued, guaranteed or agency obligations.
Board Meeting- December 17, 2018 - Audit Committee Report- Mr. John Chilton/ Ms. Kristen Coffey
451

48FIN
As of June 30, 2018, the KRS Pension portfolio had $2,161.9 million and $539.2 million respectively, in debt securities rated below BBB-. The government agencies in which KRS invested have credit ratings of AA+ or above.
Pension Funds Debt SecuritiesAs of June 30, 2018 ($ in Thousands)Rating 2018 2017AAA $67,216 $88,072AA+ 8,477 40,496AA 6,237 6,378AA- 5,719 13,342A+ 29,667 15,739A 14,087 35,514A- 43,933 27,005BBB+ 46,075 56,193BBB 93,300 63,483BBB- 74,459 73,754BB+ 88,775 73,429BB 79,681 68,279BB- 123,451 78,218B+ 86,570 75,043B 109,938 70,787B- 53,235 40,369CCC+ 13,104 14,997CCC 6,430 13,999CCC- 1,760 5,432CC 4,349 9,009C 2,389 D 5,073 18,596NR 1,587,144 71,095Total Credit Risk Debt Securities 2,551,069 959,229Government Agencies 24,109 901Government Mortgage-Backed Securities 163,641 82,149Government Issued Commercial Mortgage Backed 23,560 19,808Government Bonds 268,672 71,083Total $3,031,051 $1,133,170Note: These ratings are based on Standard & Poor’s (S&P) Global Ratings. Where S&P ratings are unavailable, equivalent Fitch and Moody’s Ratings are used as proxies.Note: Differences due to rounding.Note: Government Agencies, Government Mortgage-Backed Securities, Government Issued Commercial Mortgage Backed Securities, and Government Bonds are aggregates, therefore, credit ratings are not listed.Note: The increase in NR Debt Securities is because of the updated investment buckets created during FY2018 which reclassified several of our managers to different asset classes due to the underlying securities held by the managers. Our bond portfolio includes high yield bonds which are not rated. For example, in FY17 Cerberus was classified as Private Equity, but in FY18 they are classified as Specialty Credit which is part of Fixed Income.
Board Meeting- December 17, 2018 - Audit Committee Report- Mr. John Chilton/ Ms. Kristen Coffey
452

49 FIN
As of June 30, 2018, the KRS Insurance portfolio had $824.0 million and $165.9 million respectively, in debt securities rated below BBB-. The government agencies in which KRS invested have credit ratings of AA+ or above.
Insurance Fund Debt SecuritiesAs of June 30, 2018 ($ in Thousands)Rating 2018 2017AAA $33,225 $26,700AA+ 7,997 15,518AA 2,339 2,275AA- 1,966 4,337A+ 11,564 5,813A 4,859 12,369A- 17,084 9,554BBB+ 18,302 20,081BBB 36,025 22,688BBB- 27,886 26,914BB+ 29,025 22,620BB 24,614 19,733BB- 41,302 21,762B+ 27,240 20,999B 47,382 19,232B- 17,479 12,468CCC+ 3,395 3,545CCC 2,227 3,394CCC- 229 1,161CC 1,209 2,282C 367 0D 2,198 4,479NR 627,488 34,178Total Credit Risk Debt 985,402 312,102Government Agencies 9,385 322Government Mortgage-Backed Securities 37,949 27,723Government Issued Commercial Mortgage Backed 8,403 6,978Government Bonds 109,533 24,088Total $1,150,672 $371,213Note: These ratings are based on Standard & Poor’s (S&P) Global Ratings. Where S&P ratings are unavailable, equivalent Fitch and Moody’s Ratings are used as proxies.Note: Differences due to rounding.Note: Note: Government Agencies, Government Mortgage-Backed Securities, Government Issued Commercial Mortgage Backed Securities, and Government Bonds are aggregates, therefore, credit ratings are not listed.Note: The increase in NR Debt Securities is because of the updated investment buckets created during FY2018 which reclassified several of our managers to different asset classes due to the underlying securities held by the managers. For example, in FY17 Cerberus was classified as Private Equity, but in FY18 they are classified as Specialty Credit which is part of Fixed Income.
Board Meeting- December 17, 2018 - Audit Committee Report- Mr. John Chilton/ Ms. Kristen Coffey
453

50FIN
Concentration of Credit Risk Debt Securities Concentration of credit risk is the risk of loss attributed to the magnitude of an entity’s exposure in a single issuer. The total debt securities portfolio is managed using the following general guidelines adopted by the KRS Board:bonds, notes, or other obligations issued or guaranteed by the U.S. Government, its agencies, or instrumentalities are permissible investments and may be held without restrictions. Debt obligations of any single U.S. corporation is limited to a maximum of 5% of the total portfolio at market value.
Interest Rate RiskInterest rate risk is the risk that changes in interest rates will adversely affect the fair value of an investment. Duration measures the sensitivity of the market prices of fixed income securities to changes in the yield curve and can be measured using two methodologies: effective or modified duration. Effective duration uses the present value of cash flows, weighted for those cash flows as a percentage of the investment’s full price, and makes adjustments for any bond features that would retire the bonds prior to maturity. The modified duration, similar to effective duration, measures the sensitivity of the market prices to changes in the yield curve, but does not assume the securities will be called prior to maturity. The KRS Pension Funds benchmarks its fixed income securities portfolio to a 50/50 blend of the Barclays U.S. Universal Index and the Barclays U.S. High Yield Index. As of June 30, 2018, and 2017, the modified duration of the KRS Pension Funds’ fixed income benchmark was 4.81 and 4.71, respectively. At the same points in time, the modified duration of the KRS Pension Funds’ fixed income securities portfolio was 4.04 and 5.06, respectively.
Board Meeting- December 17, 2018 - Audit Committee Report- Mr. John Chilton/ Ms. Kristen Coffey
454

51 FIN
GASB 40 - Interest Rate Risk - Modified Duration for the Pension FundsAs of June 30, 2018 ($ in Thousands)
TYPE 2018
Weighted Avg Modified
Duration TYPE 2017
Weighted Avg Modified
DurationAsset Backed Securities $78,908 4.75 Asset Backed Securities $74,249 5.97Financial Institutions 286,701 1.89 Financial Institutions 195,269 4.48Collateralized Mortgage Obligations 18,420 3.37 Collateralized Mortgage Obligations 14,937 2.93Commercial Mortgage Backed Securities 89,317 4.77 Commercial Mortgage Backed Securities 90,171 2.97Corporate Bonds - Industrial 432,634 5.24 Corporate Bonds - Industrial 434,421 5.54Corporate Bonds - Utilities 34,929 5.47 Corporate Bonds - Utilities 31,381 5.99Agencies 24,109 4.57 Agencies 15,968 3.93Government Bonds - Sovereign Debt 14,549 4.57 Government Bonds - Sovereign Debt 4,533 8.42Mortgage Back Securities Pass-through - Not CMO’s 165,805 6.49
Mortgage Back Securities Pass-through - Not CMO’s 82,975 5.05
Local Authorities - Municipal Bonds 17,693 3.59 Local Authorities - Municipal Bonds 22,644 3.11Supranational - Multi-National Bonds 25,395 2.78 Supranational - Multi-National Bonds 18,672 2.78Treasuries 362,778 6.29 Treasuries 131,953 6.16Other 1,479,813 3.19 Other 15,996 3.59Total $3,031,051 4.04 Total $1,131,169 5.06
The KRS Insurance Fund benchmarks its fixed income securities portfolio to a 50/50 blend of the Barclays U.S. Universal Index and the Barclays U.S. High Yield Index. As of June 30, 2018, the modified duration of the KRS Insurance Fund fixed income benchmark was 4.81 and 4.85, respectively. At the same points in time, the modified duration of the KRS Insurance Fund fixed income securities portfolio was 3.84 and 4.85, respectively.
KRS Insurance Fund Interest Rate Risk as of June 30, 2018:
GASB 40 - Interest Rate Risk - Modified Duration for the Insurance FundAs of June 30, 2018 ($ in Thousands)
TYPE 2018
Weighted Avg Modified
Duration TYPE 2017
Weighted Avg Modified
DurationAsset Backed Securities $26,124 5.15 Asset Backed Securities $20,244 5.35Financial Institutions 117,895 1.61 Financial Institutions 73,800 4.18Collateralized Mortgage Obligations 6,665 2.90 Collateralized Mortgage Obligations 5,462 3.25Commercial Mortgage Backed Securities 32,780 4.61 Commercial Mortgage Backed Securities 33,521 3.13Corporate Bonds - Industrial 132,033 5.08 Corporate Bonds - Industrial 123,030 5.47Corporate Bonds - Utilities 11,249 5.25 Corporate Bonds - Utilities 10,482 5.92Agencies 9,385 4.48 Agencies 6,025 3.80Government Bonds - Sovereign Debt 5,620 4.62 Government Bonds - Sovereign Debt 1,738 8.19Mortgage Back Securities Pass-through - Not CMO’s 38,757 6.35
Mortgage Back Securities Pass-through - Not CMO’s 27,568 5.09
Local Authorities - Municipal Bonds 7,032 3.64 Local Authorities - Municipal Bonds 8,750 3.06Supranational - Multi-National Bonds 9,637 2.77 Supranational - Multi-National Bonds 7,211 2.72Treasuries 147,277 6.29 Treasuries 46,853 6.00Other 606,218 3.13 Other 6,529 3.38Total $1,150,672 3.84 Total $371,213 4.85
Board Meeting- December 17, 2018 - Audit Committee Report- Mr. John Chilton/ Ms. Kristen Coffey
455

52FIN
Foreign Currency Risk Foreign currency risk is the risk that occurs if exchange rates adversely affect the value of a non-U.S. dollar based investment or deposit within the KRS portfolio. KRS’ currency risk exposure, or exchange rate risk, primarily resides with KRS’ international equity holdings, but also affects other asset classes. KRS does not have a formal policy to limit foreign currency risk; however, some individual managers are given the latitude to hedge some currency exposures. All foreign currency transactions are classified as Short-Term Investments. All gains and losses associated with these transactions are recorded in the Net Appreciation (Depreciation) in the Fair Value of Investments on the combining financial statements.
GASB 40: Foreign Currency Risk for the Pension FundsAs of June 30, 2018 ($ in Thousands)
2018 2017Australian Dollar $63,425 $38,506Brazilian Real 28,320 18,032Canadian Dollar 101,784 75,198Chilean Peso 663 777Columbian Peso 2,406 1,001Czech Koruna 1 375Danish Krone 28,129 36,732Egyptian Pound 1,000 949Euro 476,752 445,443Hong Kong Dollar 71,857 61,886Indian Rupee 13,994 17,037Indonesian Rupiah 30,087 28,606Israeli Shekel 12,757 16,932Japanese Yen 203,521 228,164Malaysian Ringgit 14,463 6,284Mexican Peso 13,717 13,729New Zealand Dollar 13,067 17,149Norwegian Krone 19,887 21,189Philippine Peso 7,619 6,488Polish Zloty 1 1Pound Sterling 237,829 270,742Singapore Dollar 29,116 10,519South African Rand 8,535 7,574South Korean Won 32,527 34,465Swedish Krona 30,716 26,267Swiss Franc 41,116 55,668Taiwan Dollar 18,946 27,215Thai Bhat 9,444 9,779Turkish Lira 6,680 10,719Total Foreign Investment Securities 1,518,359 1,487,426U.S. Dollar 10,773,115 10,287,547Total Investment Securities $12,291,474 $11,774,973Note: Differences due to rounding.
Board Meeting- December 17, 2018 - Audit Committee Report- Mr. John Chilton/ Ms. Kristen Coffey
456

53 FIN
GASB 40: Foreign Currency Risk for the Insurance FundAs of June 30, 2018 ($ in Thousands) 2018 2017Australian Dollar $26,537 $15,723Brazilian Real 12,392 7,660Canadian Dollar 44,232 30,632Chilean Peso 263 312Columbian Peso 1,055 378Czech Koruna 0 153Danish Krone 12,202 15,048Egyptian Pound 347 329Euro 205,646 186,582Hong Kong Dollar 30,268 25,891Indian Rupee 5,911 7,206Indonesian Rupiah 12,578 11,865Israeli Shekel 5,461 6,949Japanese Yen 90,076 94,145Malaysian Ringgit 6,012 2,238Mexican Peso 5,803 5,157New Zealand Dollar 5,475 6,546Norwegian Krone 8,188 8,460Philippine Peso 2,962 2,429Pound Sterling 102,368 109,861Singapore Dollar 12,212 4,985South African Rand 4,193 3,590South Korean Won 14,173 15,685Swedish Krona 13,716 9,968Swiss Franc 17,715 23,446Taiwan Dollar 8,115 11,427Thai Bhat 3,795 4,164Turkish Lira 2,707 4,660Total Foreign Investment Securities 654,402 615,489U.S. Dollar 4,479,158 4,140,943Total Investment Securities $5,133,560 $4,756,432Note: Differences due to rounding
Board Meeting- December 17, 2018 - Audit Committee Report- Mr. John Chilton/ Ms. Kristen Coffey
457
54FIN
GASB 72 In accordance with GASB Statement No. 72, Fair Value Measurement and Application, KRS provides this additional disclosure regarding the fair value of its Pension and Insurance investments. KRS categorizes its fair value measurements within the fair value hierarchy established by GAAP.
KRS defined the Fair Value Hierarchy and Levels as follows:
Level 1 Quoted prices (unadjusted) in an active market for identical assets or liabilities that KRS has the ability to access at the measurement date (e.g., prices derived from NYSE, NASDAQ, Chicago Board of Trade, and Pink Sheets). Debt and equity securities classified in Level 1 of the fair value hierarchy are valued using quoted prices (unadjusted) in an active market for identical assets or liabilities that KRS has the ability to access at the measurement date.
Level 2 Inputs (other than quoted prices included within Level 1) that are observable for an asset or liability, either directly or indirectly. These inputs can include quoted prices for similar assets or liabilities in active or inactive markets, or market-corroborated inputs.
Level 3 Unobservable inputs for an asset or liability, which generally results in a government using the best information available and may include the government’s own data.
Net Asset Value (NAV) The remaining investments not categorized under the fair value hierarchy are shown as net asset value (NAV). These are investments in non-governmental entities for which a readily determinable fair value is not available, such as member units or an ownership interest in partners’ capital to which a proportionate share of net assets is attributed.
Board Meeting- December 17, 2018 - Audit Committee Report- Mr. John Chilton/ Ms. Kristen Coffey
458
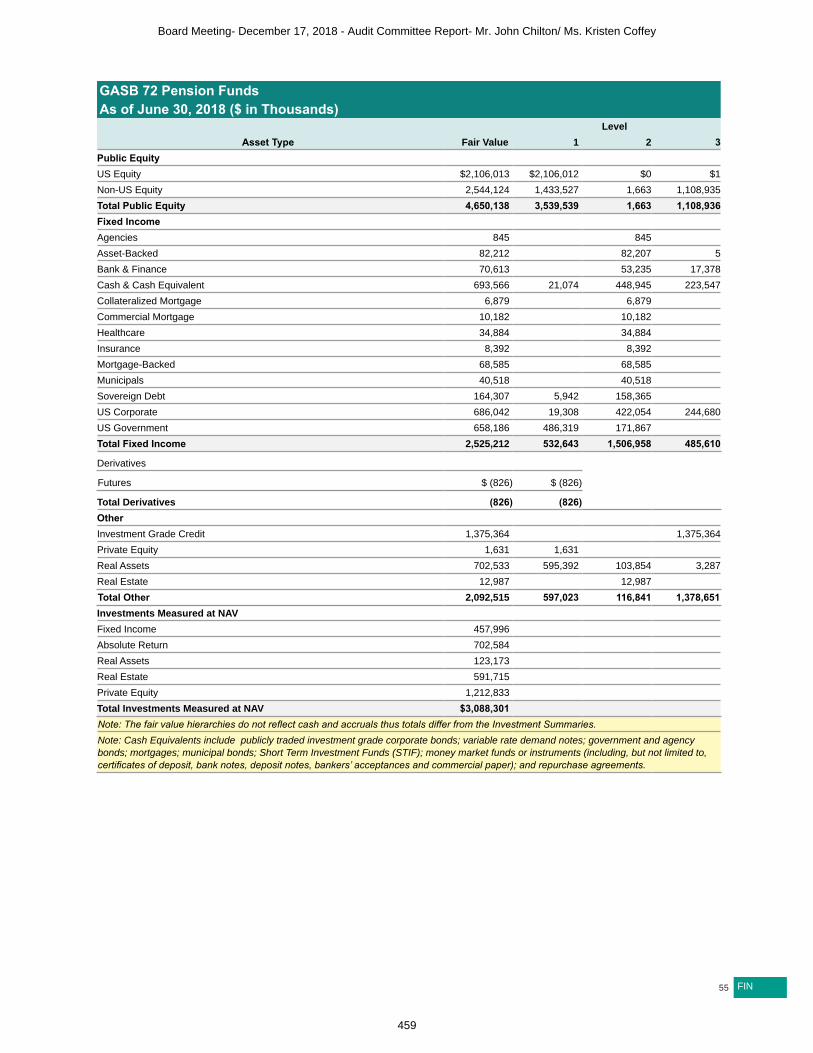
55 FIN
GASB 72 Pension FundsAs of June 30, 2018 ($ in Thousands)
Asset Type Fair ValueLevel
1 2 3Public Equity US Equity $2,106,013 $2,106,012 $0 $1Non-US Equity 2,544,124 1,433,527 1,663 1,108,935Total Public Equity 4,650,138 3,539,539 1,663 1,108,936Fixed Income Agencies 845 845 Asset-Backed 82,212 82,207 5Bank & Finance 70,613 53,235 17,378Cash & Cash Equivalent 693,566 21,074 448,945 223,547Collateralized Mortgage 6,879 6,879 Commercial Mortgage 10,182 10,182 Healthcare 34,884 34,884 Insurance 8,392 8,392 Mortgage-Backed 68,585 68,585 Municipals 40,518 40,518 Sovereign Debt 164,307 5,942 158,365 US Corporate 686,042 19,308 422,054 244,680US Government 658,186 486,319 171,867 Total Fixed Income 2,525,212 532,643 1,506,958 485,610
Derivatives Futures $ (826) $ (826) Total Derivatives (826) (826) Other Investment Grade Credit 1,375,364 1,375,364Private Equity 1,631 1,631 Real Assets 702,533 595,392 103,854 3,287Real Estate 12,987 12,987 Total Other 2,092,515 597,023 116,841 1,378,651Investments Measured at NAV Fixed Income 457,996 Absolute Return 702,584 Real Assets 123,173 Real Estate 591,715 Private Equity 1,212,833 Total Investments Measured at NAV $3,088,301 Note: The fair value hierarchies do not reflect cash and accruals thus totals differ from the Investment Summaries.Note: Cash Equivalents include publicly traded investment grade corporate bonds; variable rate demand notes; government and agency bonds; mortgages; municipal bonds; Short Term Investment Funds (STIF); money market funds or instruments (including, but not limited to, certificates of deposit, bank notes, deposit notes, bankers’ acceptances and commercial paper); and repurchase agreements.
Board Meeting- December 17, 2018 - Audit Committee Report- Mr. John Chilton/ Ms. Kristen Coffey
459

56FIN
GASB 72 InsuranceAs of June 30, 2018 ($ in Thousands)
Asset Type Fair ValueLevel
1 2 3Public Equity US Equity $934,946 $929,999 $0 $4,947Non-US Equity 1,112,002 627,771 585 483,646Total Public Equity 2,046,948 1,557,770 585 488,593Fixed Income Agencies 302 302 Asset-Backed 26,946 26,943 3
Bank & Finance 22,854 16,962 5,892Cash & Cash Equivalent 249,912 9,862 139,041 101,009
Collateralized Mortgage 2,518 2,518 Commercial Mortgage 4,052 4,052 Healthcare 11,604 11,604 Insurance 3,011 3,011 Mortgage-Backed 24,763 24,763 Municipals 11,704 11,704 Sovereign Debt 64,717 2,099 62,618 US Corporate 246,821 6,041 130,020 110,760
US Government 264,354 223,311 41,043 Total Fixed Income 933,558 241,313 474,581 217,664
Derivatives Futures $ (339) $ (339) Total Derivatives (339) (339) Other Investment Grade Credit 573,472 573,472Private Equity 181 181 Real Estate 3,237 3,237 Real Assets 274,892 229,448 43,221 2,223Total Other 851,782 229,629 46,458 575,695Investments Measured at NAV Fixed Income 224,333 Absolute Return 286,309 Real Assets 55,558 Real Estate 215,924 Private Equity 528,012 Total Investments Measured at NAV $1,310,136 Note: The fair value hierarchies do not reflect cash and accruals thus totals differ from the Investment Summaries.Note: Cash Equivalents include publicly traded investment grade corporate bonds; variable rate demand notes; government and agency bonds; mortgages; municipal bonds; Short Term Investment Funds (STIF); money market funds or instruments (including, but not limited to, certificates of deposit, bank notes, deposit notes, bankers’ acceptances and commercial paper); and repurchase agreements.
Board Meeting- December 17, 2018 - Audit Committee Report- Mr. John Chilton/ Ms. Kristen Coffey
460
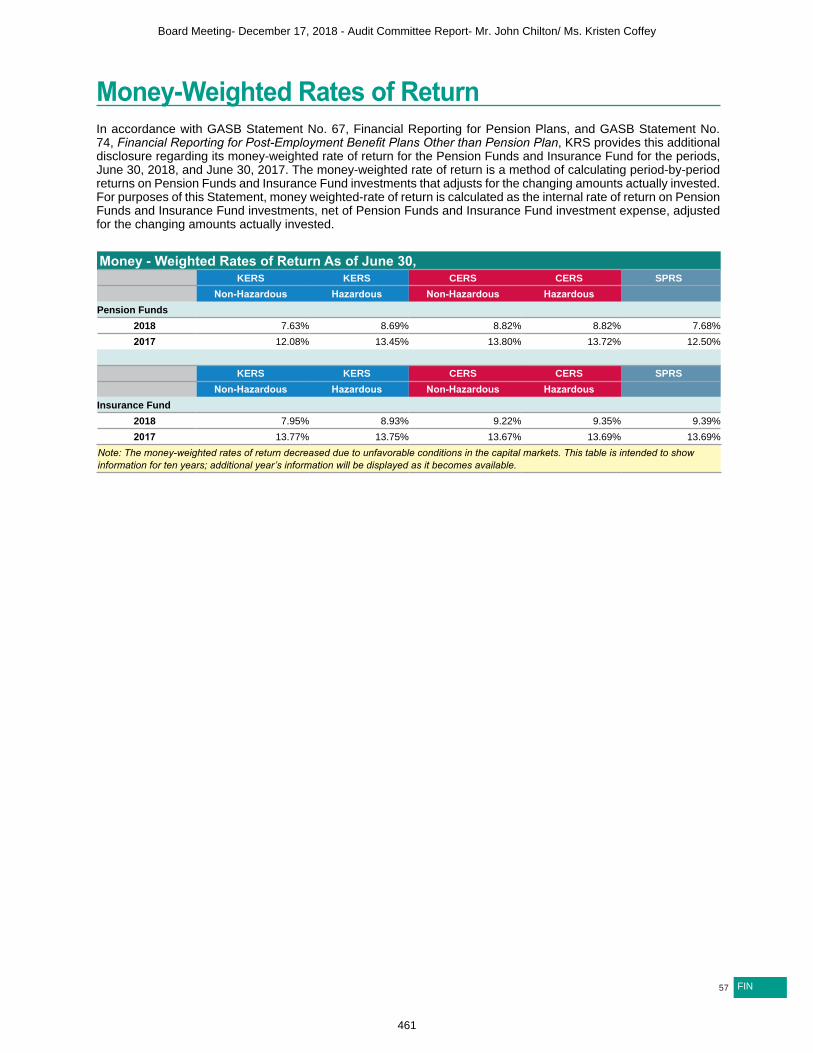
57 FIN
Money-Weighted Rates of ReturnIn accordance with GASB Statement No. 67, Financial Reporting for Pension Plans, and GASB Statement No. 74, Financial Reporting for Post-Employment Benefit Plans Other than Pension Plan, KRS provides this additional disclosure regarding its money-weighted rate of return for the Pension Funds and Insurance Fund for the periods, June 30, 2018, and June 30, 2017. The money-weighted rate of return is a method of calculating period-by-period returns on Pension Funds and Insurance Fund investments that adjusts for the changing amounts actually invested. For purposes of this Statement, money weighted-rate of return is calculated as the internal rate of return on Pension Funds and Insurance Fund investments, net of Pension Funds and Insurance Fund investment expense, adjusted for the changing amounts actually invested.
Money - Weighted Rates of Return As of June 30, KERS KERS CERS CERS SPRS
Non-Hazardous Hazardous Non-Hazardous Hazardous Pension Funds
2018 7.63% 8.69% 8.82% 8.82% 7.68%2017 12.08% 13.45% 13.80% 13.72% 12.50%
KERS KERS CERS CERS SPRS Non-Hazardous Hazardous Non-Hazardous Hazardous Insurance Fund
2018 7.95% 8.93% 9.22% 9.35% 9.39%2017 13.77% 13.75% 13.67% 13.69% 13.69%
Note: The money-weighted rates of return decreased due to unfavorable conditions in the capital markets. This table is intended to show information for ten years; additional year’s information will be displayed as it becomes available.
Board Meeting- December 17, 2018 - Audit Committee Report- Mr. John Chilton/ Ms. Kristen Coffey
461

58FIN
Note E. Securities Lending TransactionsKentucky Revised Statutes Sections 61.650 and 386.020(2) permit the Pension and Insurance Funds to lend their securities to broker-dealers and other entities. The borrowers of the securities agree to transfer to the Funds’ custodial banks either cash collateral or other securities with an initial fair value of 102% or 105% of the value of the borrowed securities. The borrowers of the securities simultaneously agree to return the borrowed securities in exchange for the collateral at a later date. The types of securities lent include U.S. Treasuries, U.S. Agencies, U.S. Corporate Bonds, U.S. Equities, Global Fixed Income Securities, and Global Equities Securities. The Statement of Investment Policy does not address any restrictions on the amount of loans that can be made. As of June 30, 2018, KRS had no credit risk exposure to borrowers because the collateral amounts received exceeded the amounts out on loan. The contracts with the custodial banks require them to indemnify KRS if the borrowers fail to return the securities and one or both of the custodial banks have failed to live up to their contractual responsibilities relating to the lending of securities. All securities loans can be terminated on demand by either party to the transaction. BNY Mellon invests cash collateral as permitted by state statute and Board policy. The agent of the Funds cannot pledge or sell collateral securities received unless the borrower defaults. KRS maintains a conservative approach to investing the cash collateral with BNY Mellon, emphasizing capital preservation, liquidity, and credit quality. As of June 30, 2018, the cash collateral received for the securities on loan for the Pension and Insurance Funds was $488.9 million and $217.9 million, respectively compared to the Fair Value of the underlying securities of $396.8 million and $178.5million, respectively.
Note F. Risk of LossKRS is exposed to various risks of loss related to torts; thefts of, damage to, and destruction of assets; errors and omissions; injuries to employees; and, natural disasters. Under the provisions of the Kentucky Revised Statutes, the Kentucky Claims Commission is vested with full power and authority to investigate, hear proof, and compensate persons for damages sustained to either person or property as a result of negligence of the agency or any of its employees. Awards are limited to $250,000 for a single claim and $400,000 in aggregate per occurrence. Awards and a pro rata share of the operating cost of the Kentucky Claims Commission are paid from the fund of the agency having a claim or claims before the Kentucky Claims Commission. Claims against the KRS Board, or any of its staff as a result of an actual or alleged breach of fiduciary duty, are insured with two commercial insurance policies. Hallmark Specialty provides coverage of up to $2.5 million and ANV Global Services provides coverage up to $2.5 million for a total coverage of $5 million, with a deductible/retention of $250,000 for each claim (the retention increases to $500,000 from $250,000 for any claims arising out of the (1) KERS plans and (2) any investment in any alternative investment - including any private equity funds or hedge funds for all plans). Defense costs incurred in defending such claims will be paid by the insurance company. However, the total defense cost and claims paid shall not exceed the total aggregate coverage of the policies. The aggregate limit for all loss is $5 million. The Voluntary Compliance Program (cyber privacy violations) sub-limit is $200,000, and the Health Insurance Portability and Accountability Act (HIPAA) and Patient Protection and Affordable Care Act (PPACA) fines and penalties sub-limit is $1.5 million. Claims for job-related illnesses or injuries to employees are insured by the state’s self-insured workers’ compensation program. Payments approved by the program are not subject to maximum limitations. A claimant may receive reimbursement for all medical expenses related to the illness or injury and up to 66.67% of wages for temporary disability. Each agency pays premiums based on fund reserves and payroll. Settlements did not exceed insurance coverage in any of the past three fiscal years. Thus, no secondary insurance had to be utilized. There were no claims which were appealed to the Kentucky Workers’ Compensation Board.
Note G. ContingenciesIn the normal course of business, KRS is involved in litigation concerning the right of participants, or their beneficiaries, to receive benefits. KRS does not anticipate any material losses as a result of the contingent liabilities.
Board Meeting- December 17, 2018 - Audit Committee Report- Mr. John Chilton/ Ms. Kristen Coffey
462

59 FIN
Note H. Defined Benefit Pension PlanAll eligible employees of KRS participate in KERS Non-Hazardous, a cost-sharing, multiple-employer defined pension plan that covers all regular full-time employees in non-hazardous positions of any Kentucky State Department, Board or Agency directed by Executive Order (EO) to participate in the system. The plan provides for retirement, disability, and death benefits to plan members. Plan benefits are extended to beneficiaries of plan members under certain circumstances. Tier 1 Plan members contributed 5% of creditable compensation for the fiscal years ended June 30, 2018, 2017, and 2016. Tier 2 and Tier 3 Plan members contributed 6% of creditable compensation for the fiscal years ended June 30, 2018, 2017, and 2016. The chart below includes the covered payroll and contribution amounts for KRS for the three periods ended June 30 included in this discussion.
Payroll and Contributions as of June 30, 2018 ($ in Thousands) 2018 2017 2016 Covered Payroll $13,287 $13,945 $14,579 Required Employer Contributions 6,570 6,776 5,652 Employer Percentage Contributed 100% 100% 100%
Note I. Income Tax StatusThe Internal Revenue Service has ruled that KRS qualifies under Section 401(a) of the Internal Revenue Code and is, generally, not subject to tax. KRS is subject to income tax on any unrelated business income; however, KRS had no unrelated business income in fiscal years 2018 and 2017.
Board Meeting- December 17, 2018 - Audit Committee Report- Mr. John Chilton/ Ms. Kristen Coffey
463

60FIN
Note J. Equipment Expenses
Equipment Expenses as of June 30, 2018 ($ in Thousands) 2018 2017 Equipment, cost $2,885 $2,885 Less Accumulated Depreciation (2,648) (2,540) Equipment, net $237 $345
Depreciation expenses rose to $2.6 million in fiscal year 2018, an increase of $108 thousand over fiscal year 2017.
Note K. Intangible AssetsThe provisions of GASB Statement No. 51, Accounting and Financial Reporting for Intangible Assets, requires that intangible assets be recognized in the Combining Statement of Plan Net Position only if they are considered identifiable. In accordance with GASB No. 51, KRS has capitalized software costs as indicated below for the Strategic Technology Advancements for the Retirement of Tomorrow (START) project.
Software Expenses as of June 30, 2018 ($ in Thousands) 2018 2017 Software, Cost $17,302 $17,301 Less Accumulated Amortization (13,102) (11,336) Intangible Assets, Net $4,200 $5,965
Amortization expense rose to $13.1 million in fiscal year 2018, an increase of $1.8 million over fiscal year 2017.
Board Meeting- December 17, 2018 - Audit Committee Report- Mr. John Chilton/ Ms. Kristen Coffey
464

61 FIN
Note L. Actuarial ValuationThe actuary, GRS, completed an actuarial valuation of the Pension and Insurance plans for the period ending June 30, 2018. There have been no changes in actuarial assumptions since June 30, 2017. However, during the 2018 legislative session, HB 185 was enacted, which updated the benefit provisions for active members who die in the line of duty. Benefits paid to the spouse of deceased members have increased and benefits paid to surviving dependent children, if the member doesn’t have a surviving spouse, also increased. The total Pension liability as of June 30, 2018, is determined using the updated benefit provisions. The following two charts show the economic assumptions and target asset allocations for the Pension Funds and Insurance Fund.
Economic Assumptions-Pension as of June 30, 2018 KERS KERS CERS CERS SPRS
Non-
Hazardous HazardousNon-
Hazardous Hazardous 2018 2017 2018 2017 2018 2017 2018 2017 2018 2017Assumed Investment Return 5.25% 5.25% 6.25% 6.25% 6.25% 6.25% 6.25% 6.25% 5.25% 5.25%Inflation Factor 2.30% 2.30% 2.30% 2.30% 2.30% 2.30% 2.30% 2.30% 2.30% 2.30%Payroll Growth 0.00% 0.00% 0.00% 0.00% 2.00% 2.00% 2.00% 2.00% 0.00% 0.00%
Economic Assumptions-Insurance as of June 30, 2018 KERS KERS CERS CERS SPRS
Non-
Hazardous HazardousNon-
Hazardous Hazardous 2018 2017 2018 2017 2018 2017 2018 2017 2018 2017Assumed Investment Return 6.25% 6.25% 6.25% 6.25% 6.25% 6.25% 6.25% 6.25% 6.25% 6.25%Inflation Factor 2.30% 2.30% 2.30% 2.30% 2.30% 2.30% 2.30% 2.30% 2.30% 2.30%Payroll Growth 0.00% 0.00% 0.00% 0.00% 2.00% 2.00% 2.00% 2.00% 0.00% 0.00%
Board Meeting- December 17, 2018 - Audit Committee Report- Mr. John Chilton/ Ms. Kristen Coffey
465
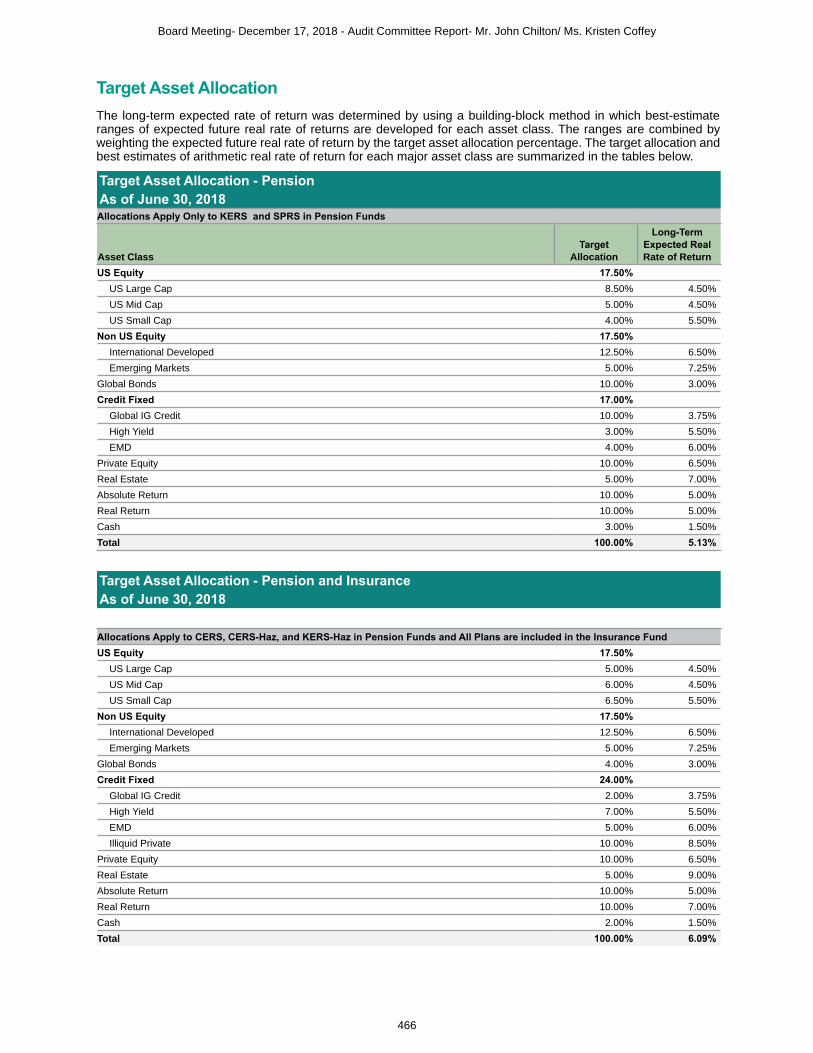
Target Asset AllocationThe long-term expected rate of return was determined by using a building-block method in which best-estimate ranges of expected future real rate of returns are developed for each asset class. The ranges are combined by weighting the expected future real rate of return by the target asset allocation percentage. The target allocation and best estimates of arithmetic real rate of return for each major asset class are summarized in the tables below.
Target Asset Allocation - PensionAs of June 30, 2018Allocations Apply Only to KERS and SPRS in Pension Funds
Asset ClassTarget
Allocation
Long-Term Expected Real Rate of Return
US Equity 17.50% US Large Cap 8.50% 4.50%US Mid Cap 5.00% 4.50%US Small Cap 4.00% 5.50%
Non US Equity 17.50% International Developed 12.50% 6.50%Emerging Markets 5.00% 7.25%
Global Bonds 10.00% 3.00%Credit Fixed 17.00%
Global IG Credit 10.00% 3.75%High Yield 3.00% 5.50%EMD 4.00% 6.00%
Private Equity 10.00% 6.50%Real Estate 5.00% 7.00%Absolute Return 10.00% 5.00%Real Return 10.00% 5.00%Cash 3.00% 1.50%Total 100.00% 5.13%
Target Asset Allocation - Pension and InsuranceAs of June 30, 2018
Allocations Apply to CERS, CERS-Haz, and KERS-Haz in Pension Funds and All Plans are included in the Insurance FundUS Equity 17.50%
US Large Cap 5.00% 4.50%US Mid Cap 6.00% 4.50%US Small Cap 6.50% 5.50%
Non US Equity 17.50% International Developed 12.50% 6.50%Emerging Markets 5.00% 7.25%
Global Bonds 4.00% 3.00%Credit Fixed 24.00%
Global IG Credit 2.00% 3.75%High Yield 7.00% 5.50%EMD 5.00% 6.00%Illiquid Private 10.00% 8.50%
Private Equity 10.00% 6.50%Real Estate 5.00% 9.00%Absolute Return 10.00% 5.00%Real Return 10.00% 7.00%Cash 2.00% 1.50%Total 100.00% 6.09%
Board Meeting- December 17, 2018 - Audit Committee Report- Mr. John Chilton/ Ms. Kristen Coffey
466

63 FIN
Note M. GASB 67 and GASB 74 Valuations GASB 67GRS completed reports by Plan in compliance with the GASB Statement No. 67 “Financial Reporting for Pension Plans.” The total pension liability, net pension liability, and sensitivity information shown in these reports are based on an actuarial valuation date of June 30, 2017. The total pension liability was rolled-forward from the valuation date to the plan’s fiscal year ending June 30, 2018, using generally accepted actuarial principles. Information disclosed for years prior to June 30, 2017, were prepared by KRS’ prior actuary. A single discount rate of 5.25% was used for the Non-Hazardous KERS system and the SPRS system and a single discount rate of 6.25% was used for the Hazardous KERS system, the non-Hazardous CERS system and the Hazardous CERS system to measure the total pension liability for the fiscal year ending June 30, 2018. These single discount rates are based on the expected rate of return on pension plan investments for each system. Certain benefit assumptions (see Actuarial Section) including the mortality assumptions (also see page 88 Required Supplementary Information) are from the 2013 experience study. A new experience study will be completed based on the 2018 actuarial valuation in 2019. GASB 67 pension liabilities are used to prepare GASB 68 – Accounting and Financial Reporting for Pension Liabilities for KRS employers.
GASB 74GRS completed reports by plan in compliance with the GASB Statement No. 74, “Financial Reporting for Postemployment Benefit Plans Other than Pension Plans” (OPEB) for the fiscal year ending June 30, 2018. The total OPEB liability, net OPEB liability, and sensitivity information shown in these reports were based on an actuarial valuation date of June 30, 2017. The total OPEB liability was rolled-forward from the valuation date to the plan’s fiscal year ending June 30, 2018, using generally accepted actuarial principles. The single discount rates used in the reports are based on the expected rate of return on OPEB plan investments of 6.25% and a municipal bond rate of 3.62%, as reported in Fidelity Index’s “20-Year Municipal GO AA Index” as of June 30, 2018. Certain benefit assumptions (see Actuarial Section) including the mortality assumptions (also see page 99 Required Supplementary Information) are from the 2013 experience study. A new experience study will be completed based on the 2018 actuarial valuation in 2019. GASB 74 OPEB liabilities are used to prepare GASB 75 - Accounting and Financial Reporting for Postemployment Benefits Plans Other than Pension for KRS employers.
Board Meeting- December 17, 2018 - Audit Committee Report- Mr. John Chilton/ Ms. Kristen Coffey
467
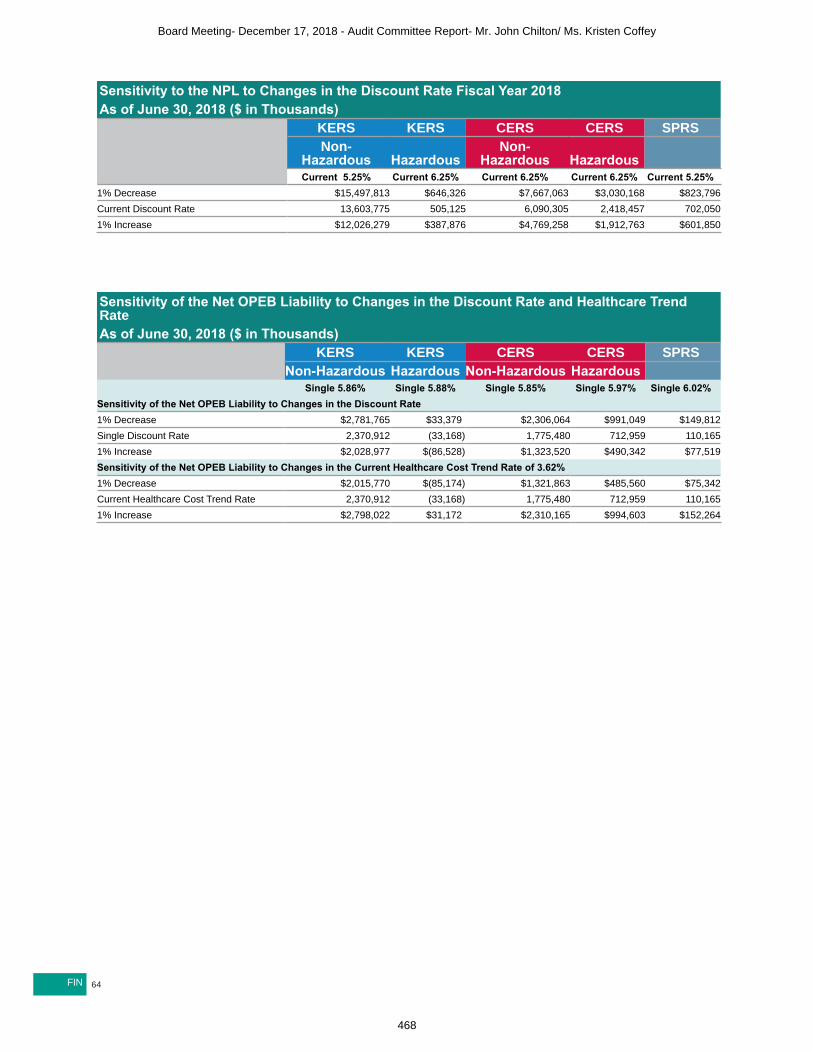
64FIN
Sensitivity to the NPL to Changes in the Discount Rate Fiscal Year 2018As of June 30, 2018 ($ in Thousands)
KERS KERS CERS CERS SPRSNon-
Hazardous HazardousNon-
Hazardous Hazardous Current 5.25% Current 6.25% Current 6.25% Current 6.25% Current 5.25%
1% Decrease $15,497,813 $646,326 $7,667,063 $3,030,168 $823,796Current Discount Rate 13,603,775 505,125 6,090,305 2,418,457 702,0501% Increase $12,026,279 $387,876 $4,769,258 $1,912,763 $601,850
Sensitivity of the Net OPEB Liability to Changes in the Discount Rate and Healthcare Trend RateAs of June 30, 2018 ($ in Thousands)
KERS KERS CERS CERS SPRS
Non-Hazardous Hazardous Non-Hazardous Hazardous Single 5.86% Single 5.88% Single 5.85% Single 5.97% Single 6.02%Sensitivity of the Net OPEB Liability to Changes in the Discount Rate1% Decrease $2,781,765 $33,379 $2,306,064 $991,049 $149,812Single Discount Rate 2,370,912 (33,168) 1,775,480 712,959 110,1651% Increase $2,028,977 $(86,528) $1,323,520 $490,342 $77,519Sensitivity of the Net OPEB Liability to Changes in the Current Healthcare Cost Trend Rate of 3.62%1% Decrease $2,015,770 $(85,174) $1,321,863 $485,560 $75,342Current Healthcare Cost Trend Rate 2,370,912 (33,168) 1,775,480 712,959 110,1651% Increase $2,798,022 $31,172 $2,310,165 $994,603 $152,264
Board Meeting- December 17, 2018 - Audit Committee Report- Mr. John Chilton/ Ms. Kristen Coffey
468

65 FIN
Board Meeting- December 17, 2018 - Audit Committee Report- Mr. John Chilton/ Ms. Kristen Coffey
469

66FIN
Board Meeting- December 17, 2018 - Audit Committee Report- Mr. John Chilton/ Ms. Kristen Coffey
470

67 FIN
Schedule of Employer NPL - KERS Non-HazardousAs of June 30, 2018 ($ in Thousands) 2018 2017Total Pension Liability (TPL) $15,608,221 $15,445,206Plan Net Position 2,004,446 2,056,870Net Pension Liability $13,603,775 $13,388,336Ratio of Plan Net Position to TPL 12.84% 13.32%Covered Employee Payroll $1,509,955 $1,602,396Net Pension Liability as a Percentage of Covered Employee Payroll 900.94% 835.52%
Schedule of Employer NPL - KERS HazardousAs of June 30, 2018 ($ in Thousands) 2018 2017Total Pension Liability (TPL) $1,150,610 $1,098,630Plan Net Position 645,485 601,529Net Pension Liability $505,125 $497,101Ratio of Plan Net Position to TPL 56.10% 54.75%Covered Employee Payroll $152,936 $178,511Net Pension Liability as a Percentage of Covered Employee Payroll 330.29% 278.47%
Schedule of Employers NPL - CERS Non-HazardousAs of June 30, 2018 ($ in Thousands) 2018 2017Total Pension Liability (TPL) $13,109,268 $12,540,545Plan Net Position 7,018,963 6,687,237Net Pension Liability $6,090,305 $5,853,308Ratio of Plan Net Position to TPL 53.54% 53.32%Covered Employee Payroll $2,454,927 $2,376,290Net Pension Liability as a Percentage of Covered Employee Payroll 248.08% 246.32%
Board Meeting- December 17, 2018 - Audit Committee Report- Mr. John Chilton/ Ms. Kristen Coffey
471
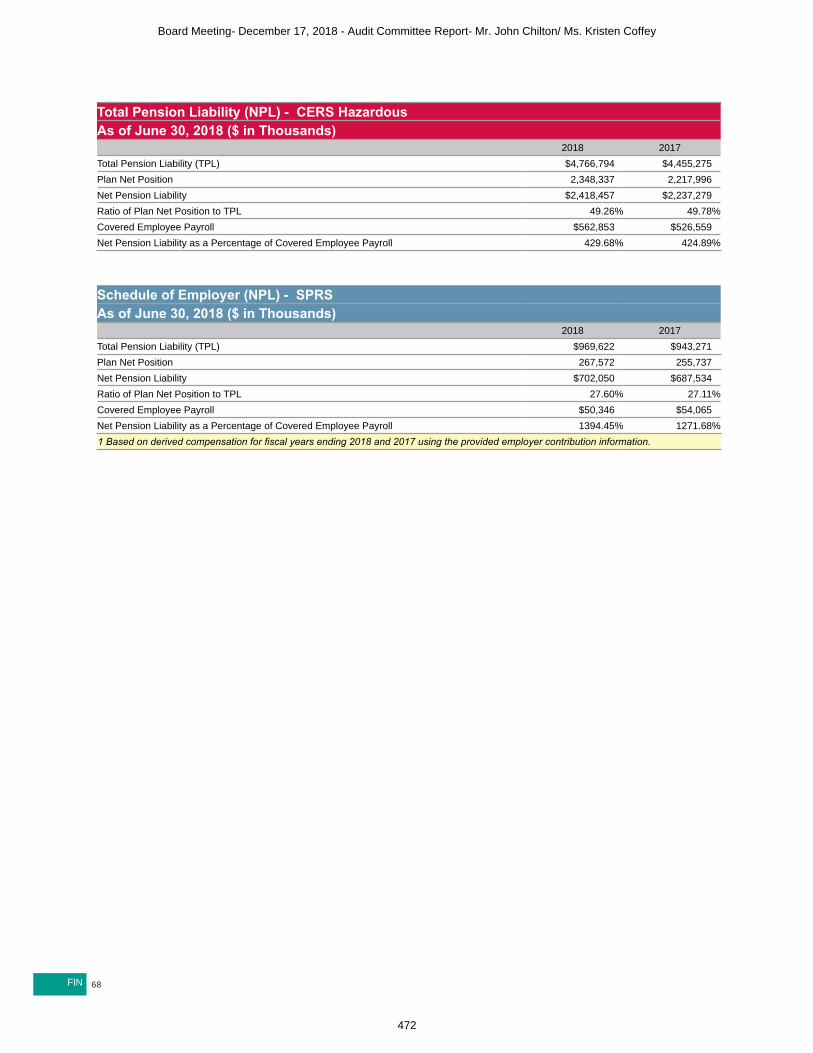
68FIN
Total Pension Liability (NPL) - CERS HazardousAs of June 30, 2018 ($ in Thousands) 2018 2017Total Pension Liability (TPL) $4,766,794 $4,455,275Plan Net Position 2,348,337 2,217,996Net Pension Liability $2,418,457 $2,237,279Ratio of Plan Net Position to TPL 49.26% 49.78%Covered Employee Payroll $562,853 $526,559Net Pension Liability as a Percentage of Covered Employee Payroll 429.68% 424.89%
Schedule of Employer (NPL) - SPRSAs of June 30, 2018 ($ in Thousands) 2018 2017Total Pension Liability (TPL) $969,622 $943,271Plan Net Position 267,572 255,737Net Pension Liability $702,050 $687,534Ratio of Plan Net Position to TPL 27.60% 27.11%Covered Employee Payroll $50,346 $54,065Net Pension Liability as a Percentage of Covered Employee Payroll 1394.45% 1271.68%1 Based on derived compensation for fiscal years ending 2018 and 2017 using the provided employer contribution information.
Board Meeting- December 17, 2018 - Audit Committee Report- Mr. John Chilton/ Ms. Kristen Coffey
472

69 FIN
Board Meeting- December 17, 2018 - Audit Committee Report- Mr. John Chilton/ Ms. Kristen Coffey
473

70FIN
Board Meeting- December 17, 2018 - Audit Committee Report- Mr. John Chilton/ Ms. Kristen Coffey
474

71 FIN
Board Meeting- December 17, 2018 - Audit Committee Report- Mr. John Chilton/ Ms. Kristen Coffey
475
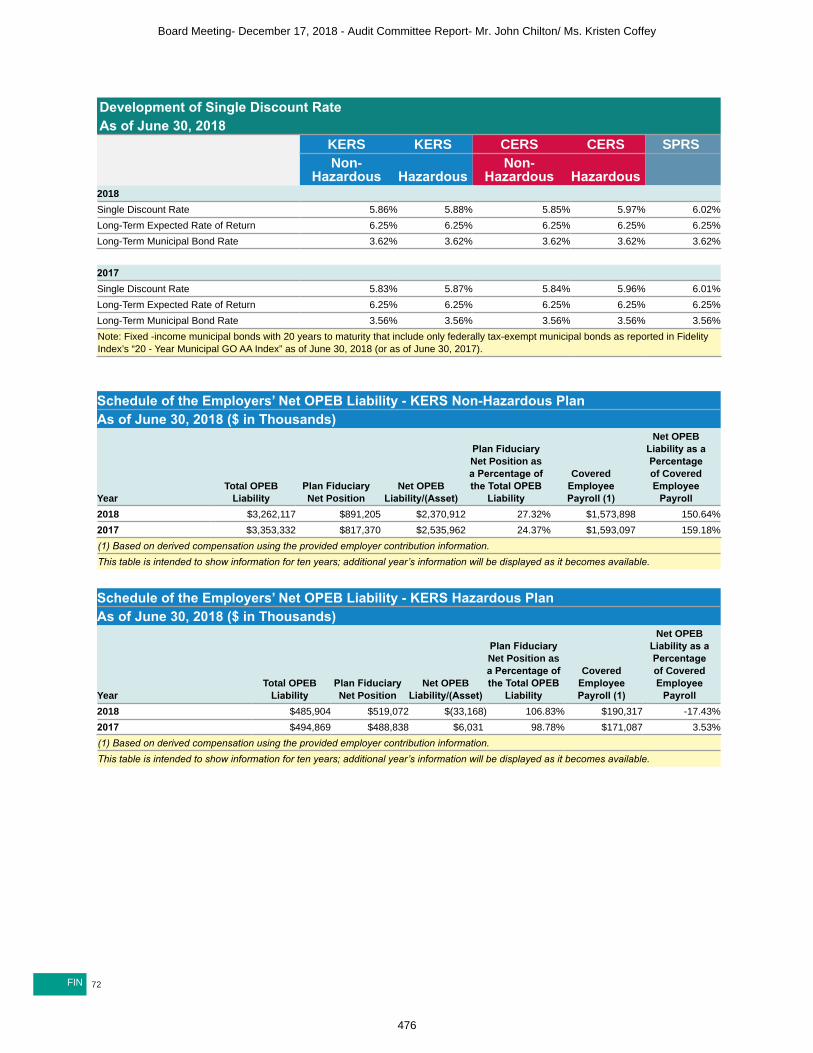
72FIN
Development of Single Discount RateAs of June 30, 2018
KERS KERS CERS CERS SPRSNon-
Hazardous HazardousNon-
Hazardous Hazardous 2018 Single Discount Rate 5.86% 5.88% 5.85% 5.97% 6.02%Long-Term Expected Rate of Return 6.25% 6.25% 6.25% 6.25% 6.25%Long-Term Municipal Bond Rate 3.62% 3.62% 3.62% 3.62% 3.62% 2017 Single Discount Rate 5.83% 5.87% 5.84% 5.96% 6.01%Long-Term Expected Rate of Return 6.25% 6.25% 6.25% 6.25% 6.25%Long-Term Municipal Bond Rate 3.56% 3.56% 3.56% 3.56% 3.56%Note: Fixed -income municipal bonds with 20 years to maturity that include only federally tax-exempt municipal bonds as reported in Fidelity Index’s “20 - Year Municipal GO AA Index” as of June 30, 2018 (or as of June 30, 2017).
Schedule of the Employers’ Net OPEB Liability - KERS Non-Hazardous PlanAs of June 30, 2018 ($ in Thousands)
YearTotal OPEB
LiabilityPlan Fiduciary Net Position
Net OPEB Liability/(Asset)
Plan Fiduciary Net Position as a Percentage of the Total OPEB
Liability
Covered Employee Payroll (1)
Net OPEB Liability as a Percentage of Covered Employee
Payroll2018 $3,262,117 $891,205 $2,370,912 27.32% $1,573,898 150.64%2017 $3,353,332 $817,370 $2,535,962 24.37% $1,593,097 159.18%(1) Based on derived compensation using the provided employer contribution information.This table is intended to show information for ten years; additional year’s information will be displayed as it becomes available.
Schedule of the Employers’ Net OPEB Liability - KERS Hazardous PlanAs of June 30, 2018 ($ in Thousands)
YearTotal OPEB
LiabilityPlan Fiduciary Net Position
Net OPEB Liability/(Asset)
Plan Fiduciary Net Position as a Percentage of the Total OPEB
Liability
Covered Employee Payroll (1)
Net OPEB Liability as a Percentage of Covered Employee
Payroll2018 $485,904 $519,072 $(33,168) 106.83% $190,317 -17.43%2017 $494,869 $488,838 $6,031 98.78% $171,087 3.53%(1) Based on derived compensation using the provided employer contribution information.This table is intended to show information for ten years; additional year’s information will be displayed as it becomes available.
Board Meeting- December 17, 2018 - Audit Committee Report- Mr. John Chilton/ Ms. Kristen Coffey
476

73 FIN
Schedule of the Employers’ Net OPEB Liability - CERS Non-Hazardous PlanAs of June 30, 2018 ($ in Thousands)
YearTotal OPEB
LiabilityPlan Fiduciary Net Position
Net OPEB Liability/(Asset)
Plan Fiduciary Net Position as a Percentage of the Total OPEB
Liability
Covered Employee Payroll (1)
Net OPEB Liability as a Percentage of Covered Employee
Payroll2018 $4,189,606 $2,414,126 $1,775,480 57.62% $2,570,156 69.08%2017 $4,222,878 $2,212,536 $2,010,342 52.39% $2,480,130 81.06%(1) Based on derived compensation using the provided employer contribution information.This table is intended to show information for ten years; additional year’s information will be displayed as it becomes available.
Schedule of the Employers’ Net OPEB Liability - CERS Hazardous PlanAs of June 30, 2018 ($ in Thousands)
YearTotal OPEB
LiabilityPlan Fiduciary Net Position
Net OPEB Liability/(Asset)
Plan Fiduciary Net Position as a Percentage of the Total OPEB
Liability
Covered Employee Payroll (1)
Net OPEB Liability as a Percentage of Covered Employee
Payroll2018 $1,993,941 $1,280,982 $712,959 64.24% $588,526 121.14%2017 $2,015,673 $1,189,001 $826,672 58.99% $542,710 152.32%(1) Based on derived compensation using the provided employer contribution information.This table is intended to show information for ten years; additional year’s information will be displayed as it becomes available.
Schedule of the Employers’ Net OPEB Liability-SPRS PlanAs of June 30, 2018 ($ in Thousands)
YearTotal OPEB
LiabilityPlan Fiduciary Net Position
Net OPEB Liability/(Asset)
Plan Fiduciary Net Position as a Percentage of the Total OPEB
Liability
Covered Employee Payroll
(1)
Net OPEB Liability as a Percentage of Covered
Employee Payroll2018 $301,012 $190,847 $110,165 63.40% $50,064 220.05%2017 $313,234 $178,838 $134,396 57.10% $48,873 275.00%(1) Based on derived compensation using the provided employer contribution information.This table is intended to show information for ten years; additional year’s information will be displayed as it becomes available.
Board Meeting- December 17, 2018 - Audit Committee Report- Mr. John Chilton/ Ms. Kristen Coffey
477

74FIN
Note N. Pension Legislation
BackgroundDuring the 2018 Regular Session of the General Assembly, Senate Bill 151 was passed changing retirement eligibility and benefits with various effective dates for active, inactive, and future members of the KRS. Other legislation enacted into law during the 2018 legislative session of importance to KRS members is summarized below. The Attorney General, the Kentucky Education Association and the Kentucky State Fraternal Order of Police filed a lawsuit regarding Senate Bill 151 asking the court to declare the new law unconstitutional and unenforceable. On June 20, 2018, Franklin Circuit Judge Shepherd ruled that Senate Bill 151 is unenforceable because the legislative process violated certain provisions of the Kentucky Constitution. This ruling has been appealed to the Kentucky Supreme Court. KRS staff is monitoring the lawsuit closely and will provide updates on pertinent developments while continuing to work diligently to meet the deadlines imposed by Senate Bill 151.
Timeline of Legislative ChangesThe following legislative changes became law as of the effective date.
Effective January 1, 2018 (Tax Year 2018)House Bill 366 reduced the pension income exclusion from $41,110 to $31,110 for taxable years beginning on or after January 1, 2018. Effective April 13, 2018 (Fiscal Year 2018)House Bill 185 made changes to death in the line of duty benefits for a surviving spouse and dependent children. Effective April 14, 2018 (Fiscal Year 2018)House Bill 366 added re-employment exceptions for county police departments and school resource officers. Effective April 14, 2018, the following exemptions apply to county police departments and participating agencies employing school resource officers: The employer is not required to reimburse KRS for the health insurance contribution paid on behalf of the retiree. The employer is not required to pay employer contributions on behalf of the retiree. Effective April 14, 2018 (Fiscal Year 2019)House Bill 362 caps CERS employer contribution rate increases up to 12% per year over the prior fiscal year for the period of July 1, 2018, to June 30, 2028. Effective April 27, 2018 (Fiscal Year 2019)House Bill 265 reduced the employer contribution rate for Regional Mental Health/Mental Retardation Boards, Local and District Health Departments, State Universities, Community Colleges and any other agency eligible to voluntarily cease participating in KERS. These agencies will continue to pay the same employer contribution rate that was paid in fiscal year 2018 in fiscal year 2019.
Timeline of Senate Bill 151 ChangesAn explanation and timeline of changes included in Senate Bill 151 are provided below. As noted above, Senate Bill 151 cannot be implemented at this time due to court proceedings.
Effective August 1, 2018 (Fiscal Year 2019)Tier 2 members retiring on or after August 1, 2018, cannot use sick leave service credit to reduce actuarial penalties for early retirement benefits.KERS and CERS agencies not participating in a KRS sick leave program cannot opt-in after this date.
Board Meeting- December 17, 2018 - Audit Committee Report- Mr. John Chilton/ Ms. Kristen Coffey
478

75 FIN
Effective January 1, 2019 (Fiscal Year 2019)There are changes to retired re-employed rules, employer contributions and employer health insurance reimbursement costs for members retiring on or after January 1, 2019, who later re-employ.Tier 1 members with a participation date on or after July 1, 2003, but before September 1, 2008, will begin paying a non-refundable 1% health insurance contribution.Tier 1 members retiring on or after January 1, 2019, must use the highest complete fiscal year-salaries (i.e. each fiscal year must have 12 months of service credit) to calculate the retirement benefit. Partial years will not be considered unless three or five complete fiscal years do not exist.Members who first began participating in a retirement system administered by KRS on or after January 1, 2014, are no longer eligible for the $5,000 death benefit.Uniform, equipment, and other expense allowances paid on or after January 1, 2019, are excluded from creditable compensation. Effective June 30, 2019 (Fiscal Year 2019)Tier 3 interest payment calculation changes for KERS non-hazardous and CERS non-hazardous members for fiscal year 2019. Effective July 1, 2019 (Fiscal Year 2020)Start date for optional Tier 4 defined contribution 401(a) Money Purchase Plan. Effective July 1, 2020 (Fiscal Year 2021)The employer contribution calculation changes so that employers will begin paying the normal cost as a percentage of payroll plus fixed dollar amount each year towards the unfunded liability. Effective July 1, 2023 (Fiscal Year 2024)Tier 1 members retiring on or after July 1, 2023, cannot use sick leave service credit for retirement eligibility service requirements or to reduce actuarial penalties for early retirement benefits. Sick leave credit will be used in the benefit calculation but is not considered for retirement eligibility. Effective August 1, 2023 (Fiscal Year 2024)Compensatory payouts at terminations for Tier 1 non-hazardous members retiring after July 1, 2023, will no longer be considered creditable compensation.
Board Meeting- December 17, 2018 - Audit Committee Report- Mr. John Chilton/ Ms. Kristen Coffey
479

76FIN
Note O. Litigation City of Fort WrightIn June 2014, the City of Fort Wright, a participating employer in CERS, filed a lawsuit against KRS alleging that the Board invested CERS funds in investments that were prohibited by both statutory and common law. In addition, the City of Fort Wright alleged that the Board paid substantial asset management fees, which the suit alleges were improper. On September 20, 2018, Franklin Circuit Court issued an Opinion and Order denying the City of Fort Wright’s Motion for Declaratory Judgment and granting the Kentucky Retirement Systems’ Cross-Motion for Declaratory Judgment. The Court stated in relevant part, “There is nothing in the record or in the City’s pleadings to this Court that persuades this Court that the Board did not follow the law or did not appropriately apply the facts to the law.” The City of Fort Wright filed its Notice of Appeal in this action on October 15, 2018.On September 2, 2015, a CERS member filed a complaint that is substantially similar in terms of allegation and ambiguous requests for relief to that of the City of Fort Wright. The exact nature and scope of the relief sought is unclear; therefore, no provision has been made in the combining financial statements. The member’s complaint is currently being held in abeyance pending the outcome of the City of Fort Wright’s appeal. No new action has been taken in this matter to date.
Seven CountiesSeven Counties Services, Inc. (“Seven Counties”) filed for Chapter 11 bankruptcy in the United States Bankruptcy Court for the Western District of Kentucky (the “Bankruptcy Court”) in April 2013. Seven Counties provides mental health services for the Cabinet for Health and Family Services for the greater Louisville, Kentucky area and surrounding counties. Seven Counties participated in the Kentucky Employees Retirement System (“KERS”) for approximately twenty-five years. Seven Counties identified KERS as a creditor with a primary objective of discharging its continuing obligation to remit retirement contributions for approximately 1,300 employees and to terminate its participation in KERS. If Seven Counties is successful in discharging its obligations to KERS, the estimated member pension and insurance actuarial accrued liability is in the range of $145 to $150 million. KERS opposed Seven Counties’ attempt to discharge its obligations and terminate its participation. KERS asserted that Seven Counties is a Governmental Unit properly participating in KERS by Executive Order issued in 1978 and thus ineligible for Chapter 11 relief. Consequently, Seven Counties would remain statutorily obligated to continue participation and remit contributions. On May 30, 2014, the Bankruptcy Court held that Seven Counties was not a Governmental Unit and could move forward with its Chapter 11 bankruptcy case. The Bankruptcy Court further held that Seven Counties’ statutory obligation to continue to participate in and remit contributions to KERS was a “contract” eligible for rejection. KRS appealed this decision. On August 24, 2018, the U.S. Court of Appeals for the Sixth Circuit (“the Sixth Circuit”) issued a two to one Opinion affirming the decision that Seven Counties is eligible to file under Chapter 11. However, the Sixth Circuit went on to state, “lacking state court precedent characterizing the nature of the relationship between Seven Counties and KERS, we CERTIFY that question to the Kentucky Supreme Court.” KERS filed a petition to have the Opinion Reheard En Banc by the entire Sixth Circuit. On October 5, 2018, the Sixth Circuit issued an order holding the petition in abeyance pending a response from the Kentucky Supreme Court on the certified question of law. On November 1, 2018, the Supreme Court of Kentucky issued an Order granting certification of the law. At the time of this note, the certified question of law is being briefed by the parties and will subsequently be set for oral arguments before the Supreme Court of Kentucky.
MayberryIn December 2017, Members and beneficiaries of the Kentucky Employee Retirement System (KERS) filed a derivative action suit in Franklin Circuit Court naming Kentucky Retirement Systems (KRS) as a nominal defendant. The suit alleges that investment managers actively pursued KRS while it was under the control of Trustees acting adversely to its interests, and recommended risky investments in alternative investment strategies, resulting in billions of dollars in losses to KRS. The Amended Complaint alleges numerous claims against KRS Trustees and Officers, hedge fund sellers, actuarial, fiduciary, and investment advisors, and an annual report certifier for breach of statutory, fiduciary, and other duties; claims against all defendants for civil conspiracy; claims against Officers, and hedge fund sellers, actuarial, fiduciary, and investment advisors, and an annual report certifier for aiding and abetting breaches of statutory, fiduciary, and other duties. Plaintiffs seek compensatory and punitive damages, as well as equitable relief. More specifically, Plaintiffs seek compensatory damages against defendants for the violations of statutory,
Board Meeting- December 17, 2018 - Audit Committee Report- Mr. John Chilton/ Ms. Kristen Coffey
480

77 FIN
fiduciary, and other duties; while also seeking punitive damages against hedge fund sellers, investment, actuarial, and fiduciary advisors and each of their principals/officers named as defendants. Further, Plaintiffs request several forms of equitable relief, which include directing a complete accounting of fees associated with fund of hedge funds, and other absolute return strategies. On April 19, 2018, KRS and Plaintiffs filed a Joint Notice to the Court and Parties notifying the parties that (1) KRS will not pursue the claims asserted by Plaintiffs; and (2) KRS would not have been in a position to pursue those claims had they been brought prior to the filing of the Complaint. Currently, defendants’ motions to dismiss are pending before the Court. While this suit does not seek any direct damages from KRS, and KRS has limited financial exposure, it is still named as a nominal defendant. Moreover, while this litigation was initiated a year ago, very limited discovery has taken place and motions to dismiss are still pending.
Northern Trust SettlementIn 2014, KRS filed litigation against Northern Trust disputing fees charged by Northern Trust to KRS when Northern Trust was acting as KRS’ securities lending agent from September 2007 until approximately December 2011. KRS alleged Northern Trust overcharged them by approximately $3.5 million. In December 2017, KRS reached a settlement agreement with Northern Trust where in Northern Trust agreed to pay KRS a lump sum payment of $1,000,000. In addition, Northern Trust agreed to waive asset management fees for asset management services for KRS at a rate of $125,000 per quarter, not to exceed $1,000,000.00 in total fee waivers. In exchange, KRS agreed to dismiss this action with prejudice. Both parties also agreed to release all claims arising from this action.
Western Kentucky UniversityOn November 17, 2016, Western Kentucky University (WKU), a participating employer, filed a petition for declaration of rights in the Franklin Circuit Court in Frankfort, KY. The petition involved a dispute as to whether WKU can terminate a group of its employees which participated in KERS and reutilize those same employees through a privatization process excusing WKU from its obligations to pay contributions to the KERS Fund. This matter is currently still in litigation. No substantive decisions have been issued on the merits of the case. The exact nature and scope of the relief sought is still unclear; therefore, no provision has been made in the combined financial statements.
Note P. Reciprocity AgreementKRS has a reciprocity agreement with Kentucky Teachers’ Retirement System (KTRS) for the payment of insurance benefits for those members who have creditable service in both systems.
Note Q. Reimbursement of Retired Re-Employed and Active Member Health InsuranceAs a result of the passage of House Bill 1 on September 1, 2008, if a retiree is re-employed in a regular full time position and has chosen health insurance coverage through KRS, the employer is required to reimburse KRS for the health insurance premium paid on the retiree’s behalf, not to exceed the cost of the single premium rate. For the fiscal years ended June 30, 2018, and 2017, the reimbursement totaled $9.8 million and $8.9 million respectively. Also, for new plan participants after August 31, 2008, House Bill 1 required an active member contribution of 1% in addition to the member pension contribution. This 1% is applicable to all non-hazardous and hazardous plans. For the fiscal years ended June 30, 2018, and 2017, the contribution totaled $19.8 million and $17.0 million, respectively.
Board Meeting- December 17, 2018 - Audit Committee Report- Mr. John Chilton/ Ms. Kristen Coffey
481

78FIN
Note R. Related PartyPerimeter Park West, Inc. (PPW) was established in 1998 as a 501(c) 25 corporation located at 1260 and 1270 Louisville Road, Frankfort, Kentucky. As such, the Corporation can only acquire and hold title to real property; it cannot have any employees. The only source of revenue for the Corporation is rent paid from Kentucky Retirement Systems (KRS). When excess cash is on hand at PPW, the money is paid back to its shareholders (Kentucky Employees Retirement System, County Employees Retirement System, and State Police Retirement System) in the form of dividends. The expenses of the Corporation are for the maintenance of the property. Title to the property is held in the name of PPW and no mortgage is on the property. KRS does not have title to the property, however, KRS maintains the Corporation as an investment on its books and its pension plans are the sole shareholders. The asset value as of June 30, 2018 was $5.4 million. PPW is audited annually and submits IRS Form 990 as required for this entity. The sole purpose of PPW is to protect the Pension and Insurance Trusts of KRS should someone become injured on the property. If this occurred and a lawsuit was filed against the property, the suit would be filed against PPW instead of the Pension and Insurance Trusts. The current lease between PPW and KRS was entered into as of May 16, 2013, and expires June 30, 2023. The premises, consisting of 85,357 square feet, are rented for the fiscal year period of July 1 to June 30. The contractual lease payments through June 30, 2023, are: FY 2018 - $722,776FY 2019 - $735,425FY 2020 - $748,295FY 2021 - $761,390FY 2022 - $774,714FY 2023 - $788,272
Note S. Reduction of ReceivablesEmployers in the KERS plans reported two weeks of June 2017 wages at the beginning of the 2018 fiscal year. Based on START programming, these wages had the 2018 increased Annual Required Contribution (ARC) rate applied. The Commonwealth’s approved budget guidelines paid contributions at the fiscal year 2017 ARC rate in effect when the wages were earned. It is unlikely that KRS will receive payments at the new ARC rate for that period; therefore, contribution receivables have been reduced as of June 30, 2018, as noted in the chart. This adjustment was also made in previous years and will be required if KERS ARC rates increase annually.
Reduction of Receivables
As of June 30, 2018 ($ in Thousands) 2018 2017
KERS Non-Hazardous $428 $4,645 SPRS 43 261
TOTAL $471 $4,906
Board Meeting- December 17, 2018 - Audit Committee Report- Mr. John Chilton/ Ms. Kristen Coffey
482

79 FIN
Note T. Governance ReorganizationSB2 passed in the 2017 legislative session codified Executive Order 2016-340 issued by Governor Matt Bevin on June 17, 2016, and made other changes.
● Expanded the Board of Trustees to seventeen members from thirteen; ● Investment experience is a prerequisite for six members of the Board; ● The Kentucky Senate must confirm gubernatorial board appointees; ● Requires that the Governor approve the Executive Director appointed by the Board of Directors; ● KRS employees were transferred to the Commonwealth’s personnel system under Kentucky Revised Statute
Chapter 18A; ● KRS must follow the Model Procurement Code for purchases and contracts; ● KRS must disclose net investment fees, investment returns, and commissions on its website and upon an open
records request; ● The Chair and Vice Chair of the Board are to be elected by the members of the Board of Trustees; and, ● Board, staff, and investment consultants should abide by the Chartered Financial Analyst code of conduct.
The Board of Trustees consists of ten members appointed by the Governor, six members elected by the membership, two from KERS; three from CERS; and one from SPRS; and, the Personnel Secretary Ex-Officio. All members have four-year term limits with various start dates. The Board of Trustees has established several committees; Audit; Investment; Retiree Health Plan; Administrative & Disability Appeal; and, the Actuarial Subcommittee to govern the affairs of the trusts. The Executive Director reports to the Board of Trustees. The Chief Investment Officer reports functionally to the Investment Committee and administratively to the Executive Director. The Director of Internal Audit reports functionally to the Audit Committee and administratively to the Executive Director. The Deputy Executive Director, the Executive Director Office of Benefits, Executive Director Office of Legal Services, Division Director Human Resources, and Division Director Communications report to the Executive Director. Detailed Board member information and an organizational chart is provided in the introduction of this document.
Note U. Subsequent EventsManagement has evaluated the period June 30, 2018, to November 29, 2018, (the date the combining financial statements were available to be issued) for items requiring recognition or disclosure in the combining financial statements.
Board Meeting- December 17, 2018 - Audit Committee Report- Mr. John Chilton/ Ms. Kristen Coffey
483

REQUIRED SUPPLEMENTARY INFORMATION
INCLUDING GASB 67 AND 74
80FIN
Schedule of Employer NPLKERS Non-HazardousKERS HazardousCERS Non-HazardousCERS HazardousSPRS
Schedule of Changes in Employers’ TPLKERS Non-HazardousKERS HazardousCERS Non-HazardousCERS HazardousSPRS
Notes to Schedule of Employers’ ContributionsSchedule of Employers’ Contributions Pension
KERS Non-HazardousKERS HazardousCERS Non-HazardousCERS HazardousSPRS
Schedule of Employers’ NOLKERS Non-HazardousKERS HazardousCERS Non-HazardousCERS HazardousSPRS
Schedule of Changes in Employers’ Net OPEB LiabilityKERS Non-HazardousKERS HazardousCERS Non-HazardousCERS HazardousSPRS
Notes to Schedule of Employers’ OPEB ContributionSchedule of Employers’ OPEB Contributions
KERS Non-HazardousKERS HazardousCERS Non-HazardousCERS HazardousSPRS
Money Weighted Rates of Return
Board Meeting- December 17, 2018 - Audit Committee Report- Mr. John Chilton/ Ms. Kristen Coffey
484

81 FIN
Additional Supporting Schedules
Schedule of Administrative ExpensesSchedule of Direct Investment ExpensesSchedule of Professional Consultant Fees
Report on Internal Control
Board Meeting- December 17, 2018 - Audit Committee Report- Mr. John Chilton/ Ms. Kristen Coffey
485

82FIN
Schedule of Employer NPL - KERS Non-Hazardous Pension FundsAs of June 30, 2018 ($ in Thousands) 2018 2017 2016 2015 2014Total Pension Liability (TPL) $15,608,221 $15,445,206 $13,379,781 $12,359,673 $11,550,110Fiduciary Net Position 2,004,446 2,056,870 1,980,292 2,327,783 2,578,291Net Pension Liability $13,603,775 $13,388,336 $11,399,489 $10,031,890 $8,971,819Ratio of Plan Net Position to TPL 12.84% 13.32% 14.80% 18.83% 22.32%Covered Employee Payroll (1) $1,509,955 $1,602,396 $1,631,025 $1,544,234 $1,577,496Net Pension Liability as a Percentage of Covered Employee Payroll 900.94% 835.52% 698.92% 649.64% 568.74%
Schedule of Employer NPL - KERS Hazardous Pension FundsAs of June 30, 2018 ($ in Thousands) 2018 2017 2016 2015 2014Total Pension Liability (TPL) $1,150,610 $1,098,630 $919,517 $895,433 $816,850Fiduciary Net Position 645,485 601,529 527,879 552,468 561,484Net Pension Liability $505,125 $497,101 $391,638 $342,965 $255,366Ratio of Plan Net Position to TPL 56.10% 54.75% 57.41% 61.70% 68.74%Covered Employee Payroll (1) $152,936 $178,511 $158,828 $128,680 $129,076Net Pension Liability as a Percentage of Covered Employee Payroll 330.29% 278.47% 246.58% 266.53% 197.84%
Schedule of Employer NPL - CERS Non-Hazardous Pension FundsAs of June 30, 2018 ($ in Thousands) 2018 2017 2016 2015 2014Total Pension Liability (TPL) $13,109,268 $12,540,545 $11,065,013 $10,740,325 $9,772,522Fiduciary Net Position 7,018,963 6,687,237 6,141,395 6,440,800 6,528,146Net Pension Liability $6,090,305 $5,853,308 $4,923,618 $4,299,525 $3,244,376Ratio of Plan Net Position to TPL 53.54% 53.32% 55.50% 59.97% 66.80%Covered Employee Payroll (1) $2,454,927 $2,376,290 $2,417,187 $2,296,716 $2,272,270Net Pension Liability as a Percentage of Covered Employee Payroll 248.08% 246.32% 203.69% 187.20% 142.78%
Schedule of Employer NPL - CERS Hazardous Pension FundsAs of June 30, 2018 ($ in Thousands) 2018 2017 2016 2015 2014Total Pension Liability (TPL) $4,766,794 $4,455,275 $3,726,116 $3,613,308 $3,288,826Fiduciary Net Position 2,348,337 2,217,996 2,010,177 2,078,202 2,087,002Net Pension Liability $2,418,457 $2,237,279 $1,715,941 $1,535,106 $1,201,824Ratio of Plan Net Position to TPL 49.26% 49.78% 53.95% 57.52% 63.46%Covered Employee Payroll (1) $562,853 $526,559 $526,334 $483,641 $479,164Net Pension Liability as a Percentage of Covered Employee Payroll 429.68% 424.89% 326.02% 317.41% 250.82%
Schedule of Employer NPL - SPRS Pension FundsAs of June 30, 2018 ($ in Thousands) 2018 2017 2016 2015 2014Total Pension Liability (TPL) $969,622 $943,271 $795,421 $734,156 $681,118Fiduciary Net Position 267,572 255,737 218,012 247,228 260,974Net Pension Liability $702,050 $687,534 $577,409 $486,928 $420,144Ratio of Plan Net Position to TPL 27.60% 27.11% 27.41% 33.68% 38.32%Covered Employee Payroll (1) $50,346 $54,065 $46,685 $45,765 $44,616Net Pension Liability as a Percentage of Covered Employee Payroll 1394.45% 1271.68% 1236.82% 1063.97% 941.69%(1) Based on derived compensation using the provided employer contribution information for fiscal years 2018 and later.These tables are intended to show information for ten years; additional year’s information will be displayed as it becomes available.
Board Meeting- December 17, 2018 - Audit Committee Report- Mr. John Chilton/ Ms. Kristen Coffey
486
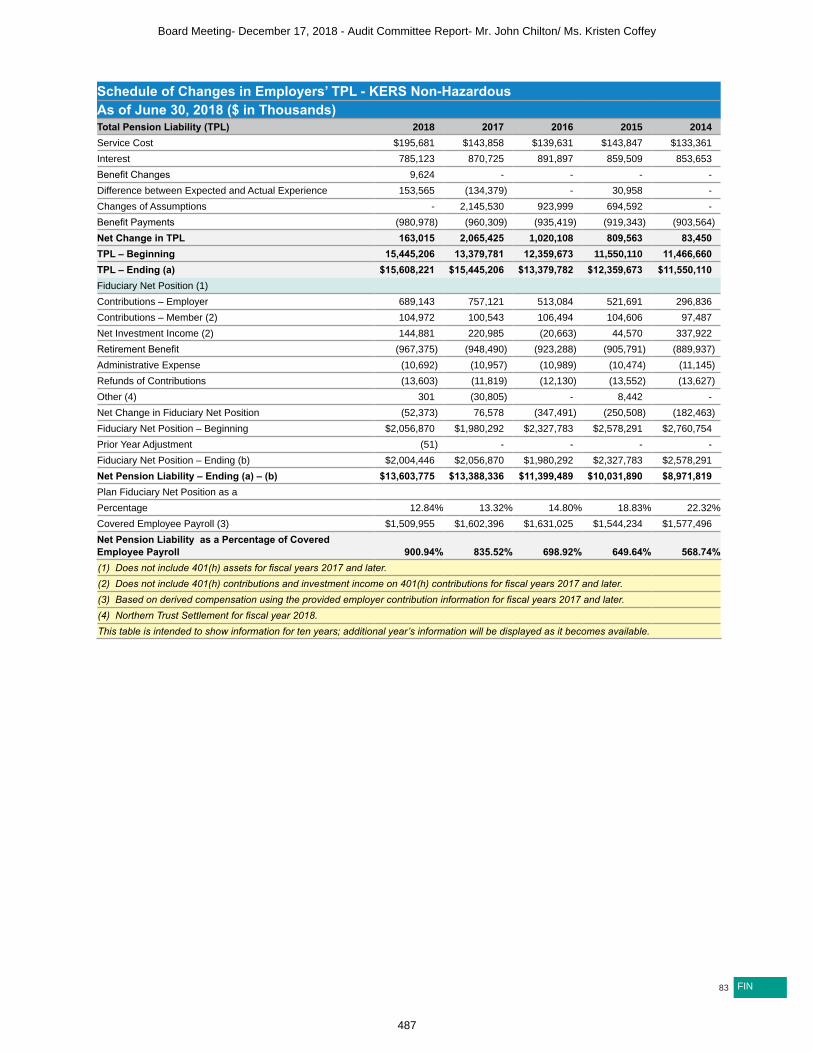
83 FIN
Schedule of Changes in Employers’ TPL - KERS Non-HazardousAs of June 30, 2018 ($ in Thousands)Total Pension Liability (TPL) 2018 2017 2016 2015 2014Service Cost $195,681 $143,858 $139,631 $143,847 $133,361Interest 785,123 870,725 891,897 859,509 853,653Benefit Changes 9,624 - - - -Difference between Expected and Actual Experience 153,565 (134,379) - 30,958 -Changes of Assumptions - 2,145,530 923,999 694,592 -Benefit Payments (980,978) (960,309) (935,419) (919,343) (903,564)Net Change in TPL 163,015 2,065,425 1,020,108 809,563 83,450TPL – Beginning 15,445,206 13,379,781 12,359,673 11,550,110 11,466,660TPL – Ending (a) $15,608,221 $15,445,206 $13,379,782 $12,359,673 $11,550,110Fiduciary Net Position (1) Contributions – Employer 689,143 757,121 513,084 521,691 296,836Contributions – Member (2) 104,972 100,543 106,494 104,606 97,487Net Investment Income (2) 144,881 220,985 (20,663) 44,570 337,922Retirement Benefit (967,375) (948,490) (923,288) (905,791) (889,937)Administrative Expense (10,692) (10,957) (10,989) (10,474) (11,145)Refunds of Contributions (13,603) (11,819) (12,130) (13,552) (13,627)Other (4) 301 (30,805) - 8,442 -Net Change in Fiduciary Net Position (52,373) 76,578 (347,491) (250,508) (182,463)Fiduciary Net Position – Beginning $2,056,870 $1,980,292 $2,327,783 $2,578,291 $2,760,754Prior Year Adjustment (51) - - - -Fiduciary Net Position – Ending (b) $2,004,446 $2,056,870 $1,980,292 $2,327,783 $2,578,291Net Pension Liability – Ending (a) – (b) $13,603,775 $13,388,336 $11,399,489 $10,031,890 $8,971,819Plan Fiduciary Net Position as a Percentage 12.84% 13.32% 14.80% 18.83% 22.32%Covered Employee Payroll (3) $1,509,955 $1,602,396 $1,631,025 $1,544,234 $1,577,496Net Pension Liability as a Percentage of Covered Employee Payroll 900.94% 835.52% 698.92% 649.64% 568.74%(1) Does not include 401(h) assets for fiscal years 2017 and later.(2) Does not include 401(h) contributions and investment income on 401(h) contributions for fiscal years 2017 and later.(3) Based on derived compensation using the provided employer contribution information for fiscal years 2017 and later.(4) Northern Trust Settlement for fiscal year 2018.This table is intended to show information for ten years; additional year’s information will be displayed as it becomes available.
Board Meeting- December 17, 2018 - Audit Committee Report- Mr. John Chilton/ Ms. Kristen Coffey
487

84FIN
Schedule of Changes in Employers’ TPL - KERS HazardousAs of June 30, 2018 ($ in Thousands)Total Pension Liability (TPL) 2018 2017 2016 2015 2014Service Cost $28,641 $21,081 $20,751 $18,729 $16,880Interest 66,536 66,589 64,851 61,005 59,594Benefit Changes 705 - - - -Difference between Expected and Actual Experience 24,215 26,902 - 6,067 -Changes of Assumptions - 127,878 - 52,165 -Benefit Payments (68,117) (63,338) (61,518) (59,383) (57,151)Net Change in TPL $51,980 $179,112 $24,084 $78,583 $19,323TPL – Beginning 1,098,630 919,517 895,433 816,850 797,527TPL – Ending (a) $1,150,610 $1,098,630 $919,517 $895,433 $816,850Fiduciary Net Position (1)Contributions – Employer $43,661 $52,974 $23,759 $28,536 $11,670Contributions - Member (2) 17,891 17,524 15,739 13,207 12,546Net Investment Income 51,467 70,994 (1,653) 8,701 80,724Retirement Benefit (65,616) (61,231) (59,306) (56,773) (54,320)Administrative Expense (975) (919) (916) (844) (897)Refunds of Contributions (2,501) (2,106) (2,211) (2,610) (2,830)Other (4) 33 (3,586) - 767 -Net Change in Fiduciary Net Position 43,960 73,650 (24,588) (9,016) 46,893Fiduciary Net Position – Beginning $601,529 $527,879 $552,468 $561,484 $514,591Prior Year Adjustment $(4) - - - -Fiduciary Net Position – Ending (b) $645,485 $601,529 $527,879 $552,468 $561,484Net Pension Liability – Ending (a) – (b) $505,125 $497,101 $391,638 $342,965 $255,366Plan Fiduciary Net Position as a Percentage 56.10% 54.75% 57.41% 61.70% 68.74%Covered Employee Payroll (3) $152,936 $178,511 $158,828 $128,680 $129,076Net Pension Liability as a Percentage of Covered Employee Payroll 330.29% 278.47% 246.58% 266.53% 197.84%(1) Does not include 401(h) assets for fiscal years 2017 and later.(2) Does not include 401(h) contributions and investment income on 401(h) contributions for fiscal years 2017 and later.(3) Based on derived compensation using the provided employer contribution information for fiscal years 2017 and later.(4) Northern Trust Settlement for fiscal year 2018.This table is intended to show information for ten years; additional year’s information will be displayed as it becomes available.
Board Meeting- December 17, 2018 - Audit Committee Report- Mr. John Chilton/ Ms. Kristen Coffey
488

85 FIN
Schedule of Changes in Employers’ TPL - CERS Non-HazardousAs of June 30, 2018 ($ in Thousands)Total Pension Liability (TPL) 2018 2017 2016 2015 2014Service Cost $254,169 $193,082 $209,101 $207,400 $192,482Interest 760,622 803,555 780,587 733,002 710,526Benefit Changes 15,708 - - - -Difference between Expected and Actual Experience 279,401 (208,015) - 49,966 -Changes of Assumptions - 1,388,800 - 606,293 -Benefit Payments (741,177) (701,891) (665,000) (628,858) (597,136)Net Change in TPL 568,723 1,475,532 324,687 967,803 305,872TPL – Beginning 12,540,545 11,065,013 10,740,325 9,772,522 9,466,650TPL – Ending (a) $13,109,268 $12,540,545 $11,065,013 $10,740,325 $9,772,522Fiduciary Net Position (1)Contributions – Employer $358,017 $333,554 $284,105 $298,565 $324,231Contributions – Member (2) 160,370 150,715 141,674 140,311 128,568Net Investment Income (2) 573,829 825,900 (40,800) 110,568 895,530Retirement Benefit (726,569) (687,461) (651,246) (615,335) (582,850)Administrative Expense (19,592) (19,609) (19,385) (18,212) (18,615)Refunds of Contributions (14,608) (14,430) (13,753) (13,523) (14,286)Other (4) 361 (42,827) - 10,280 -Net Change in Fiduciary Net Position 331,808 545,843 (299,405) (87,346) 732,578Fiduciary Net Position - Beginning $6,687,237 $6,141,395 $6,440,800 $6,528,146 $5,795,568Prior Year Adjustment (82) - - - -Fiduciary Net Position – Ending (b) $7,018,963 $6,687,237 $6,141,395 $6,440,800 $6,528,146Net Pension Liability – Ending (a) – (b) $6,090,305 $5,853,308 $4,923,618 $4,299,525 $3,244,376Plan Fiduciary Net Position as a Percentage 53.54% 53.32% 55.50% 59.97% 66.80%Covered Employee Payroll (3) $2,454,927 $2,376,290 $2,417,187 $2,296,716 $2,272,270Net Pension Liability as a Percentage of Covered Employee Payroll 248.08% 246.32% 203.69% 187.20% 142.78%(1) Does not include 401(h) assets for fiscal years 2017 and later.(2) Does not include 401(h) contributions and investment income on 401(h) contributions for fiscal years 2017 and later.(3) Based on derived compensation using the provided employer contribution information for fiscal years 2017 and later.(4) Northern Trust Settlement for fiscal year 2018.This table is intended to show information for ten years; additional year’s information will be displayed as it becomes available.
Board Meeting- December 17, 2018 - Audit Committee Report- Mr. John Chilton/ Ms. Kristen Coffey
489

86FIN
Schedule of Changes in Employers’ TPL - CERS HazardousAs of June 30, 2018 ($ in Thousands)Total Pension Liability (TPL) 2018 2017 2016 2015 2014Service Cost $81,103 $58,343 $66,249 $71,934 $66,761Interest 270,694 270,860 262,886 247,008 238,665Benefit Changes 2,172 - - - -Difference between Expected and Actual Experience 205,882 92,588 - 41,935 -Changes of Assumptions - 536,667 - 166,849 -Benefit Payments (248,332) (229,299) (216,327) (203,244) (192,299)Net Change in TPL 311,519 729,159 112,807 324,482 113,127TPL – Beginning 4,455,275 3,726,115 3,613,308 3,288,826 3,175,699TPL – Ending (a) 4,766,794 4,455,275 3,726,115 3,613,308 3,288,826Fiduciary Net Position (1)Contributions – Employer $127,660 $115,947 $105,713 $108,071 $115,240Contributions – Member (2) 61,089 60,101 52,972 47,692 43,722Net Investment Income (2) 191,324 270,473 (9,020) 37,104 288,490Retirement Benefit (244,118) (226,984) (213,448) (200,134) (189,635)Administrative Expense (1,504) (1,421) (1,366) (1,288) (1,721)Refunds of Contributions (4,214) (2,315) (2,879) (3,111) (2,664)Other (4) 111 (7,979) - 2,865 -Net Change in Fiduciary Net Position 130,348 207,822 (68,028) (8,801) 253,432Fiduciary Net Position – Beginning $2,217,996 $2,010,174 $2,078,202 $2,087,002 $1,833,570Prior Year Adjustment (7) - - - -Fiduciary Net Position – Ending (b) $2,348,337 $2,217,996 $2,010,174 $2,078,202 $2,087,002Net Pension Liability – Ending (a) – (b) $2,418,457 $2,237,279 $1,715,941 $1,535,106 $1,201,824Plan Fiduciary Net Position as a Percentage 49.26% 49.78% 53.95% 57.52% 63.46%Covered Employee Payroll (3) $562,853 $526,559 $526,334 $483,641 $479,164Net Pension Liability as a Percentage of Covered Employee Payroll 429.68% 424.89% 326.02% 317.41% 250.82%(1) Does not include 401(h) assets for fiscal years 2017 and later.(2) Does not include 401(h) contributions and investment income on 401(h) contributions for fiscal years 2017 and later.(3) Based on derived compensation using the provided employer contribution information for fiscal years 2017 and later.(4) Northern Trust Settlement for fiscal year 2018.This table is intended to show information for ten years; additional year’s information will be displayed as it becomes available.
Board Meeting- December 17, 2018 - Audit Committee Report- Mr. John Chilton/ Ms. Kristen Coffey
490

87 FIN
Total Pension Liability (TPL) - SPRSAs of June 30, 2018 ($ in Thousands)Total Pension Liability (TPL) 2018 2017 2016 2015 2014Service Cost $11,890 $8,297 $8,402 $7,695 $7,142Interest 47,978 51,769 52,951 50,661 50,391Benefit Changes 184 - - - -Difference between Expected and Actual Experience 25,126 8,143 - 9,331 -Changes of Assumptions - 136,602 56,191 40,201 -Benefit Payments (58,827) (56,960) (56,279) (54,850) (53,239)Net Change in TPL 26,351 147,850 61,265 53,038 4,294TPL - Beginning 943,271 795,421 734,156 681,118 676,824TPL – Ending (a) $969,622 $943,271 $795,421 $734,156 $681,118Fiduciary Net Position (1)Contributions – Employer $46,877 $63,239 $25,822 $31,990 $20,279Contributions - Member (2) 5,522 5,348 5,263 5,244 5,075Net Investment Income (2) 18,437 26,795 (3,843) 3,426 40,374Retirement Benefit (58,805) (56,934) (56,268) (54,765) (53,026)Administrative Expense (194) (181) (178) (201) (215)Refunds of Contributions (22) (26) (11) (85) (213)Other (4) 21 (517) - 645 -Net Change in Fiduciary Net Position 11,836 37,724 (29,215) (13,746) 12,274Plan Net Position - Beginning $255,737 $218,012 $247,228 $260,974 $248,700
Prior Year Adjustment (1) - - - -Fiduciary Net Position – Ending (b) $267,572 $255,737 $218,012 $247,228 $260,974Net Pension Liability – Ending (a) – (b) $702,050 $687,534 $577,409 $486,928 $420,144Plan Fiduciary Net Position as a Percentage 27.60% 27.11% 27.41% 33.68% 38.32%Covered Employee Payroll (3) $50,346 $54,065 $46,685 $45,765 $44,616Net Pension Liability as a Percentage of Covered Employee Payroll 1394.45% 1271.68% 1236.82% 1063.97% 941.69%(1) Does not include 401(h) assets for fiscal years 2017 and later.(2) Does not include 401(h) contributions and investment income on 401(h) contributions for fiscal years 2017 and later.(3) Based on derived compensation using the provided employer contribution information for fiscal years 2017 and later.(4) Northern Trust Settlement for fiscal year 2018.This table is intended to show information for ten years; additional year’s information will be displayed as it becomes available.
Board Meeting- December 17, 2018 - Audit Committee Report- Mr. John Chilton/ Ms. Kristen Coffey
491
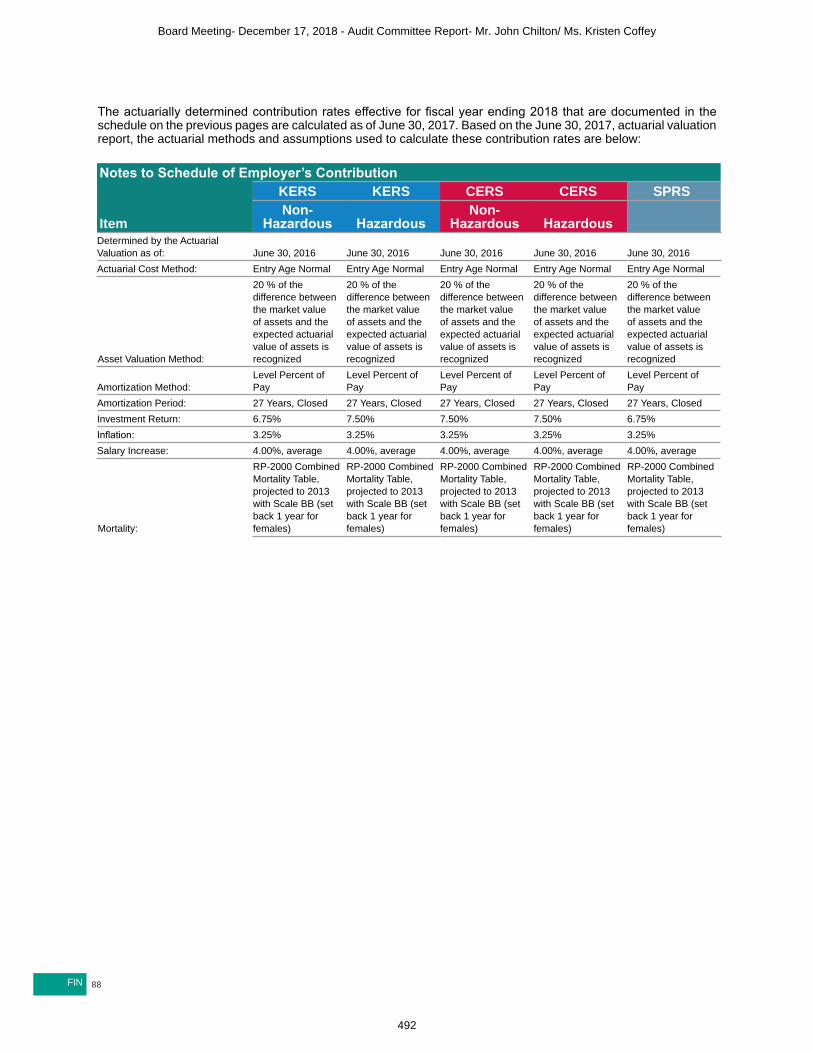
88FIN
The actuarially determined contribution rates effective for fiscal year ending 2018 that are documented in the schedule on the previous pages are calculated as of June 30, 2017. Based on the June 30, 2017, actuarial valuation report, the actuarial methods and assumptions used to calculate these contribution rates are below:
Notes to Schedule of Employer’s Contribution KERS KERS CERS CERS SPRS
ItemNon-
Hazardous HazardousNon-
Hazardous Hazardous Determined by the Actuarial Valuation as of: June 30, 2016 June 30, 2016 June 30, 2016 June 30, 2016 June 30, 2016Actuarial Cost Method: Entry Age Normal Entry Age Normal Entry Age Normal Entry Age Normal Entry Age Normal
Asset Valuation Method:
20 % of the difference between the market value of assets and the expected actuarial value of assets is recognized
20 % of the difference between the market value of assets and the expected actuarial value of assets is recognized
20 % of the difference between the market value of assets and the expected actuarial value of assets is recognized
20 % of the difference between the market value of assets and the expected actuarial value of assets is recognized
20 % of the difference between the market value of assets and the expected actuarial value of assets is recognized
Amortization Method:Level Percent of Pay
Level Percent of Pay
Level Percent of Pay
Level Percent of Pay
Level Percent of Pay
Amortization Period: 27 Years, Closed 27 Years, Closed 27 Years, Closed 27 Years, Closed 27 Years, ClosedInvestment Return: 6.75% 7.50% 7.50% 7.50% 6.75%Inflation: 3.25% 3.25% 3.25% 3.25% 3.25%Salary Increase: 4.00%, average 4.00%, average 4.00%, average 4.00%, average 4.00%, average
Mortality:
RP-2000 Combined Mortality Table, projected to 2013 with Scale BB (set back 1 year for females)
RP-2000 Combined Mortality Table, projected to 2013 with Scale BB (set back 1 year for females)
RP-2000 Combined Mortality Table, projected to 2013 with Scale BB (set back 1 year for females)
RP-2000 Combined Mortality Table, projected to 2013 with Scale BB (set back 1 year for females)
RP-2000 Combined Mortality Table, projected to 2013 with Scale BB (set back 1 year for females)
Board Meeting- December 17, 2018 - Audit Committee Report- Mr. John Chilton/ Ms. Kristen Coffey
492

89 FIN
Schedule of Employer Contribution Pension - KERS Non-HazardousAs of June 30, 2018 ($ in Thousands)
Fiscal Year Ending
Actuarially Determined Contribution
(1)Total Employer
Contribution
Contribution Deficiency (Excess)
Covered Employee Payroll (2)
Actual Contributions
as a Percentage of Covered
Payroll2018 $633,879 $689,143 $(55,264) $1,509,955 45.64%2017 623,813 757,121 (133,308) 1,602,396 47.25%2016 512,670 513,084 (414) 1,631,025 31.46%2015 520,948 521,691 (743) 1,544,234 33.78%2014 520,765 296,836 223,929 1,577,496 18.82%2013 485,396 280,874 204,522 1,644,409 17.08%2012 441,094 214,786 226,308 1,644,897 13.06%2011 381,915 193,754 188,161 1,731,633 11.19%2010 348,495 144,051 204,444 1,815,146 7.94%2009 $294,495 $112,383 $182,112 $1,754,413 6.41%
(1) Actuarially determined contribution rate for fiscal year ending 2018 is based on the contribution rate calculated with the June 30, 2016, actuarial valuation.(2) Based on derived compensation using the provided employer contribution information for fiscal year ending 2017 and later.
Schedule of Employer Contribution Pension - KERS HazardousAs of June 30, 2018 ($ in Thousands)
Fiscal Year Ending
Actuarially Determined Contribution
(1)Total Employer
Contribution
Contribution Deficiency (Excess)
Covered Employee Payroll (2)
Actual Contributions
as a Percentage of Covered
Payroll2018 $31,321 $43,661 $(12,340) $152,936 28.55%2017 37,630 52,974 (15,344) 178,511 29.68%2016 23,690 23,759 (69) 158,828 14.96%2015 28,374 28,536 (162) 128,680 22.18%2014 13,570 11,670 1,900 129,076 9.04%2013 21,502 27,334 (5,832) 131,015 20.86%2012 20,265 20,809 (544) 131,977 15.77%2011 20,605 19,141 1,464 133,054 14.39%2010 17,815 17,658 157 143,558 12.30%2009 $15,708 $15,843 $(135) $146,044 10.85%
(1) Actuarially determined contribution rate for fiscal year ending 2018 is based on the contribution rate calculated with the June 30, 2016, actuarial valuation.(2) Based on derived compensation using the provided employer contribution information for fiscal year ending 2017 and later.
Board Meeting- December 17, 2018 - Audit Committee Report- Mr. John Chilton/ Ms. Kristen Coffey
493

90FIN
Schedule of Employer Contribution Pension - CERS Non-HazardousAs of June 30, 2018 ($ in Thousands)
Fiscal Year Ending
Actuarially Determined Contribution
(1)Total Employer
Contribution
Contribution Deficiency (Excess)
Covered Employee Payroll (2)
Actual Contributions
as a Percentage of Covered
Payroll2018 $355,473 $358,017 $(2,544) $2,454,927 14.58%2017 331,492 333,554 (2,062) 2,376,290 14.04%2016 282,767 284,106 (1,339) 2,417,187 11.75%2015 297,715 298,566 (851) 2,296,716 13.00%2014 324,231 324,231 - 2,272,270 14.27%2013 294,914 294,914 - 2,236,277 13.19%2012 261,764 275,736 (13,972) 2,236,546 12.33%2011 218,985 248,519 (29,534) 2,276,596 10.92%2010 186,724 207,076 (20,352) 2,236,855 9.26%2009 $161,097 $179,285 $(18,188) $2,183,612 8.21%
(1) Actuarially determined contribution rate for fiscal year ending 2018 is based on the contribution rate calculated with the June 30, 2016, actuarial valuation.(2) Based on derived compensation using the provided employer contribution information for fiscal years 2017 and later.
Schedule of Employer Contribution Pension - CERS HazardousAs of June 30, 2018 ($ in Thousands)
Fiscal Year Ending
Actuarially Determined Contribution
(1)Total Employer
Contribution
Contribution Deficiency (Excess)
Covered Employee Payroll (2)
Actual Contributions
as a Percentage of Covered
Payroll2018 $124,953 $127,660 $(2,707) $562,853 22.68%2017 114,316 115,947 (1,631) 526,559 22.02%2016 104,952 105,713 (761) 526,334 20.08%2015 107,514 108,071 (557) 483,641 22.35%2014 115,240 115,240 - 479,164 24.05%2013 120,140 120,140 - 461,673 26.02%2012 83,589 89,329 (5,740) 464,229 19.24%2011 78,796 85,078 (6,282) 466,964 18.22%2010 76,391 82,887 (6,496) 466,549 17.77%2009 $69,056 $78,152 $(9,096) $469,315 16.65%
(1) Actuarially determined contribution rate for fiscal year ending 2018 is based on the contribution rate calculated with the June 30, 2016, actuarial valuation.(2) Based on derived compensation using the provided employer contribution information for fiscal years 2017 and later.
Board Meeting- December 17, 2018 - Audit Committee Report- Mr. John Chilton/ Ms. Kristen Coffey
494

91 FIN
Schedule of Employer Contribution Pension - SPRSAs of June 30, 2018 ($ in Thousands)
Fiscal Year Ending
Actuarially Determined Contribution
(1)Total Employer
Contribution
Contribution Deficiency (Excess)
Covered Employee Payroll (2)
Actual Contributions
as a Percentage of Covered
Payroll2018 $36,033 $46,877 $(10,844) $50,346 93.11%2017 35,937 63,240 (27,303) 54,065 116.97%2016 25,723 25,822 (99) 46,685 55.31%2015 31,444 31,990 (546) 45,765 69.90%2014 25,808 20,279 5,529 44,616 45.45%2013 23,117 18,501 4,616 45,256 40.88%2012 20,498 15,362 5,136 48,373 31.76%2011 18,463 12,657 5,806 48,693 25.99%2010 18,765 9,489 9,276 51,507 18.42%2009 $15,952 $8,186 $7,766 $51,660 15.85%
(1) Actuarially determined contribution rate for fiscal year ending 2018 is based on the contribution rate calculated with the June 30, 2016, actuarial valuation.(2) Based on derived compensation for fiscal year ending 2017 using the provided employer contribution information.
Board Meeting- December 17, 2018 - Audit Committee Report- Mr. John Chilton/ Ms. Kristen Coffey
495

92FIN
Schedule of the Employers’ Net OPEB Liability - KERS Non-Hazardous PlanAs of June 30, 2018 ($ in Thousands)
YearTotal OPEB
LiabilityPlan Fiduciary Net Position
Net OPEB Liability/(Asset)
Plan Fiduciary Net Position as a Percentage of the Total OPEB
Liability
Covered Employee Payroll (1)
Net OPEB Liability as a Percentage of Covered Employee
Payroll2018 $3,262,117 $891,205 $2,370,912 27.32% $1,573,898 150.64%2017 $3,353,332 $817,370 $2,535,962 24.37% $1,593,097 159.18%(1) Based on derived compensation using the provided employer contribution information.This table is intended to show information for ten years; additional year’s information will be displayed as it becomes available.
Schedule of the Employers’ Net OPEB Liability - KERS Hazardous PlanAs of June 30, 2018 ($ in Thousands)
YearTotal OPEB
LiabilityPlan Fiduciary Net Position
Net OPEB Liability/(Asset)
Plan Fiduciary Net Position as a Percentage of the Total OPEB
Liability
Covered Employee Payroll (1)
Net OPEB Liability as a Percentage of Covered Employee
Payroll2018 $485,904 $519,072 $(33,168) 106.83% $190,317 (17.43)%2017 $494,869 $488,838 $6,031 98.78% $171,087 3.53%(1) Based on derived compensation using the provided employer contribution information.This table is intended to show information for ten years; additional year’s information will be displayed as it becomes available.
Schedule of the Employers’ Net OPEB Liability - CERS Non-Hazardous PlanAs of June 30, 2018 ($ in Thousands)
YearTotal OPEB
LiabilityPlan Fiduciary Net Position
Net OPEB Liability/(Asset)
Plan Fiduciary Net Position as a Percentage of the Total OPEB
Liability
Covered Employee Payroll (1)
Net OPEB Liability as a Percentage of Covered Employee
Payroll2018 $4,189,606 $2,414,126 $1,775,480 57.62% $2,570,156 69.08%2017 $4,222,878 $2,212,536 $2,010,342 52.39% $2,480,130 81.06%(1) Based on derived compensation using the provided employer contribution information.This table is intended to show information for ten years; additional year’s information will be displayed as it becomes available.
Schedule of the Employers’ Net OPEB Liability - CERS Hazardous PlanAs of June 30, 2018 ($ in Thousands)
YearTotal OPEB
LiabilityPlan Fiduciary Net Position
Net OPEB Liability/(Asset)
Plan Fiduciary Net Position as a Percentage of the Total OPEB
Liability
Covered Employee Payroll (1)
Net OPEB Liability as a Percentage of Covered Employee
Payroll2018 $1,993,941 $1,280,982 $712,959 64.24% $588,526 121.14%2017 $2,015,673 $1,189,001 $826,672 58.99% $542,710 152.32%(1) Based on derived compensation using the provided employer contribution information.This table is intended to show information for ten years; additional year’s information will be displayed as it becomes available.
Board Meeting- December 17, 2018 - Audit Committee Report- Mr. John Chilton/ Ms. Kristen Coffey
496

93 FIN
Schedule of the Employer’s Net OPEB Liability-SPRS PlanAs of June 30, 2018 ($ in Thousands)
YearTotal OPEB
LiabilityPlan Fiduciary Net Position
Net OPEB Liability/(Asset)
Plan Fiduciary Net Position as a Percentage of the Total OPEB
Liability
Covered Employee Payroll
(1)
Net OPEB Liability as a Percentage of Covered
Employee Payroll2018 $301,012 $190,847 $110,165 63.40% $50,064 220.05%2017 $313,234 $178,838 $134,396 57.10% $48,873 275.00%(1) Based on derived compensation using the provided employer contribution information.This table is intended to show information for ten years; additional year’s information will be displayed as it becomes available.
Board Meeting- December 17, 2018 - Audit Committee Report- Mr. John Chilton/ Ms. Kristen Coffey
497

94FIN
Schedule of Changes in Employers’ Net OPEB Liability - KERS Non-Hazardous PlanAs of June 30, 2018 ($ in Thousands) 2018 2017Total OPEB Liability Service Cost $66,360 $46,992Interest 191,178 192,911Benefit Changes 1,865 -Difference between Expected and Actual Experience (191,147) (3,921)Changes of Assumptions (11,235) 414,835Benefit Payments (1) (148,236) (139,601)Net Change in Total OPEB Liability (91,215) 511,216Total OPEB Liability - Beginning 3,353,332 2,842,116Total OPEB Liability - Ending (a) $3,262,117 $3,353,332Plan Fiduciary Net Position Contributions – Employer (2) $152,985 $162,636Contributions – Member 5,786 5,156Benefit Payments (1) (148,236) (139,601)OPEB Plan Net Investment Income 64,028 94,239OPEB Plan Administrative Expense (760) (861)Other (4) 32 -Net Change in Plan Fiduciary Net Position 73,835 121,569Plan Fiduciary Net Position – Beginning 817,370 695,801Plan Fiduciary Net Position – Ending (b) 891,205 817,370Net OPEB Liability – Ending (a) – (b) $2,370,912 $2,535,962Plan Fiduciary Net Position as a Percentage of the Total OPEB Liability 27.32% 24.37%Covered Employee Payroll (3) $1,573,898 $1,593,097Net OPEB Liability as a Percentage of Covered Employee Payroll 150.64% 159.18%(1) Includes expected benefits due to the implicit subsidy for members under age 65.(1) Benefit payments are also offset by insurance premiums received from retirees and by Medicare Drug Reimbursements.(2) Includes expected benefits due to the implicit subsidy for members under age 65.(3) Based on derived compensation using the provided employer contribution information.(4) Northern Trust Settlement for fiscal year 2018.This table is intended to show information for ten years; additional year’s information will be displayed as it becomes available.
Board Meeting- December 17, 2018 - Audit Committee Report- Mr. John Chilton/ Ms. Kristen Coffey
498

95 FIN
Schedule of Changes in Employers’ Net OPEB Liability - KERS Hazardous PlanAs of June 30, 2018 ($ in Thousands) 2018 2017Total OPEB Liability Service Cost $12,893 $8,002Interest on Total OPEB liability 28,500 27,591Benefit Changes 167 -Difference between Expected and Actual Experience (31,240) (1,029)Assumption Changes (581) 89,401Benefit Payments (1) (18,704) (16,618)Net Change in Total OPEB Liability (8,965) 107,347Total OPEB Liability - Beginning 494,869 387,522Total OPEB Liability - Ending (a) $485,904 $494,869Plan Fiduciary Net Position -Contributions – Employer (2) 5,165 4,579Contributions – Member 909 811Benefit Payments (1) (18,704) (16,618)OPEB Plan Net Investment Income 42,950 59,614OPEB Plan Administrative Expense (104) (105)Other (4) 18 -Net Change in Plan Fiduciary Net Position 30,234 48,281Plan Fiduciary Net Position – Beginning 488,838 440,557Plan Fiduciary Net Position – Ending (b) 519,072 488,838Net OPEB Liability – Ending (a) – (b) $(33,168) $6,031Plan Fiduciary Net Position as a Percentage of the Total OPEB Liability 106.83% 98.78%Covered Employee Payroll (3) $190,317 $171,087Net OPEB Liability as a Percentage of Covered Employee Payroll (17.43)% 3.53%(1) Includes expected benefits due to the implicit subsidy for members under age 65.(1) Benefit payments are also offset by insurance premiums received from retirees and by Medicare Drug Reimbursements.(2) Includes expected benefits due to the implicit subsidy for members under age 65.(3) Based on derived compensation using the provided employer contribution information.(4) Northern Trust Settlement for fiscal year 2018.This table is intended to show information for ten years; additional year’s information will be displayed as it becomes available.
Board Meeting- December 17, 2018 - Audit Committee Report- Mr. John Chilton/ Ms. Kristen Coffey
499
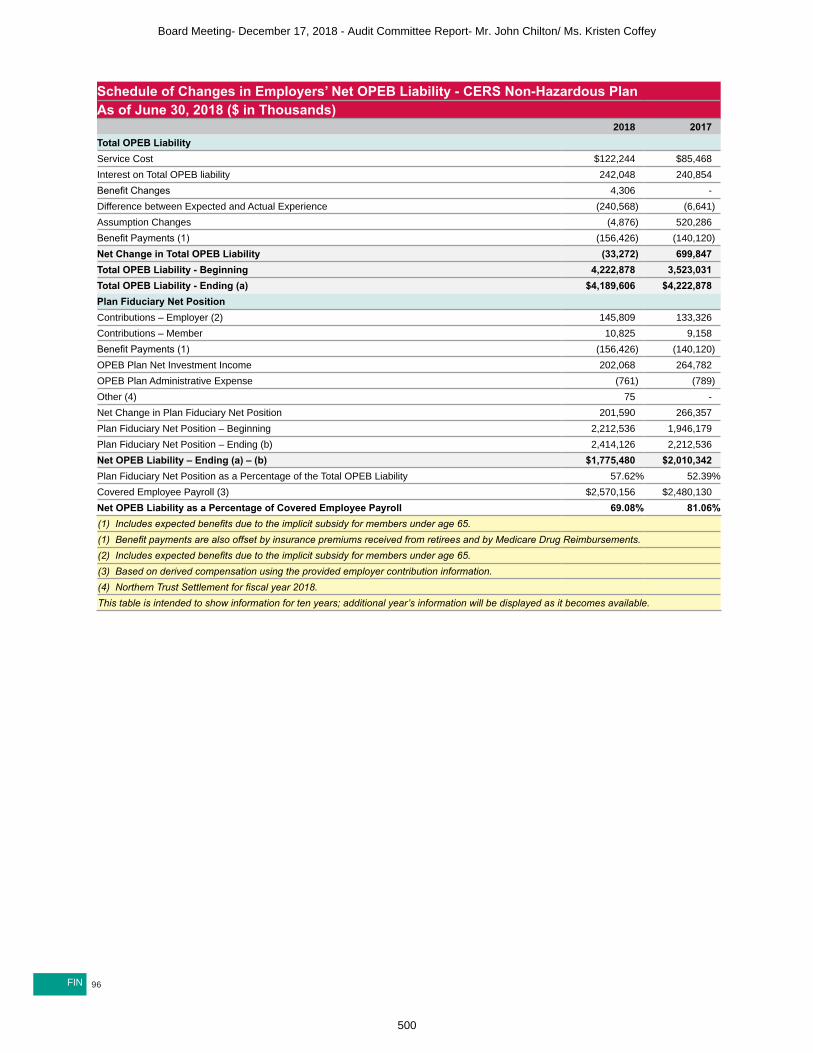
96FIN
Schedule of Changes in Employers’ Net OPEB Liability - CERS Non-Hazardous PlanAs of June 30, 2018 ($ in Thousands) 2018 2017Total OPEB Liability Service Cost $122,244 $85,468Interest on Total OPEB liability 242,048 240,854Benefit Changes 4,306 -Difference between Expected and Actual Experience (240,568) (6,641)Assumption Changes (4,876) 520,286Benefit Payments (1) (156,426) (140,120)Net Change in Total OPEB Liability (33,272) 699,847Total OPEB Liability - Beginning 4,222,878 3,523,031Total OPEB Liability - Ending (a) $4,189,606 $4,222,878Plan Fiduciary Net Position Contributions – Employer (2) 145,809 133,326Contributions – Member 10,825 9,158Benefit Payments (1) (156,426) (140,120)OPEB Plan Net Investment Income 202,068 264,782OPEB Plan Administrative Expense (761) (789)Other (4) 75 -Net Change in Plan Fiduciary Net Position 201,590 266,357Plan Fiduciary Net Position – Beginning 2,212,536 1,946,179Plan Fiduciary Net Position – Ending (b) 2,414,126 2,212,536Net OPEB Liability – Ending (a) – (b) $1,775,480 $2,010,342Plan Fiduciary Net Position as a Percentage of the Total OPEB Liability 57.62% 52.39%Covered Employee Payroll (3) $2,570,156 $2,480,130Net OPEB Liability as a Percentage of Covered Employee Payroll 69.08% 81.06%(1) Includes expected benefits due to the implicit subsidy for members under age 65.(1) Benefit payments are also offset by insurance premiums received from retirees and by Medicare Drug Reimbursements.(2) Includes expected benefits due to the implicit subsidy for members under age 65.(3) Based on derived compensation using the provided employer contribution information.(4) Northern Trust Settlement for fiscal year 2018.This table is intended to show information for ten years; additional year’s information will be displayed as it becomes available.
Board Meeting- December 17, 2018 - Audit Committee Report- Mr. John Chilton/ Ms. Kristen Coffey
500

97 FIN
Schedule of Changes in Employers’ Net OPEB Liability - CERS Hazardous PlanAs of June 30, 2018 ($ in Thousands) 2018 2017Total OPEB Liability Service Cost $33,948 $20,493Interest on Total OPEB liability 118,009 113,166Benefit Changes 484 -Difference between Expected and Actual Experience (100,348) (2,470)Assumption Changes (2,500) 391,061Benefit Payments (1) (71,325) (63,656)Net Change in Total OPEB Liability (21,732) 458,594Total OPEB Liability - Beginning 2,015,673 1,557,079Total OPEB Liability - Ending (a) 1,993,941 2,015,673Plan Fiduciary Net Position Contributions – Employer (2) 51,615 44,325Contributions – Member 2,173 1,708Benefit Payments (1) (71,325) (63,656)OPEB Plan Net Investment Income 109,854 143,892OPEB Plan Administrative Expense (376) (381)Other (4) 40 -Net Change in Plan Fiduciary Net Position 91,981 125,888Plan Fiduciary Net Position – Beginning 1,189,001 1,063,113Plan Fiduciary Net Position – Ending (b) 1,280,982 1,189,001Net OPEB Liability – Ending (a) – (b) $712,959 $826,672Plan Fiduciary Net Position as a Percentage of the Total OPEB Liability 64.24% 58.99%Covered Employee Payroll (3) $588,526 $542,710Net OPEB Liability as a Percentage of Covered Employee Payroll 121.14% 152.32%(1) Includes expected benefits due to the implicit subsidy for members under age 65.(1) Benefit payments are also offset by insurance premiums received from retirees and by Medicare Drug Reimbursements.(2) Includes expected benefits due to the implicit subsidy for members under age 65.(3) Based on derived compensation using the provided employer contribution information.(4) Northern Trust Settlement for fiscal year 2018.This table is intended to show information for ten years; additional year’s information will be displayed as it becomes available.
Board Meeting- December 17, 2018 - Audit Committee Report- Mr. John Chilton/ Ms. Kristen Coffey
501

98FIN
Schedule of Changes in Employer’s Net OPEB Liability - SPRS PlanAs of June 30, 2018 ($ in Thousands) 2018 2017Total OBEP Liability Service Cost $6,087 $4,147Interest on Total OPEB liability 18,432 17,993Benefit Changes 34 -Difference between Expected and Actual Experience (23,320) (573)Assumption Changes (358) 57,312Benefit Payments (1) (13,097) (12,123)Net Change in Total OPEB Liability (12,222) 66,756Total OPEB Liability - Beginning 313,234 246,478Total OPEB Liability - Ending (a) $301,012 $313,234Plan Fiduciary Net Position Contributions – Employer (2) $8,535 $7,862Contributions – Member 155 131Benefit Payments (1) (13,097) (12,123)OPEB Plan Net Investment Income 16,470 21,627OPEB Plan Administrative Expense (62) (66)Other (4) 8 -Net Change in Plan Fiduciary Net Position 12,009 17,431Plan Fiduciary Net Position – Beginning 178,838 161,407Plan Fiduciary Net Position – Ending (b) 190,847 178,838Net OPEB Liability – Ending (a) – (b) $110,165 $134,396Plan Fiduciary Net Position as a Percentage of the Total OPEB Liability 63.40% 57.09%Covered Employee Payroll (3) $50,064 $48,873Net OPEB Liability as a Percentage of Covered Employee Payroll 220.05% 274.99%(1) Includes expected benefits due to the implicit subsidy for members under age 65.(1) Benefit payments are also offset by insurance premiums received from retirees and by Medicare Drug Reimbursements.(2) Includes expected benefits due to the implicit subsidy for members under age 65.(3) Based on derived compensation using the provided employer contribution information.(4) Northern Trust Settlement for fiscal year 2018.This table is intended to show information for ten years; additional year’s information will be displayed as it becomes available.
Board Meeting- December 17, 2018 - Audit Committee Report- Mr. John Chilton/ Ms. Kristen Coffey
502

99 FIN
The actuarially determined contributions rates effective for fiscal year ending 2018, that are documented in the schedule, Sensitivity of the Net OPEB Liability to Changes in the Discount Rate and Healthcare Trend Rate, in Note L of the financial statements, are calculated as of June 30, 2017. Based on the June 30, 2017, actuarial valuation report, the actuarial methods and assumptions used to calculate these contributions are below:
Notes to Schedule of Employers’ OPEB Contributions KERS KERS CERS CERS SPRS
ItemNon-
Hazardous HazardousNon-
Hazardous Hazardous Determined by the Actuarial Valuation as of: June 30, 2016 June 30, 2016 June 30, 2016 June 30, 2016 June 30, 2016Actuarial Cost Method: Entry Age Normal Entry Age Normal Entry Age Normal Entry Age Normal Entry Age Normal
Asset Valuation Method:
20 % of the difference between the market value of assets and the expected actuarial value of assets is recognized
20 % of the difference between the market value of assets and the expected actuarial value of assets is recognized
20 % of the difference between the market value of assets and the expected actuarial value of assets is recognized
20 % of the difference between the market value of assets and the expected actuarial value of assets is recognized
20 % of the difference between the market value of assets and the expected actuarial value of assets is recognized
Amortization Method:Level Percent of Pay
Level Percent of Pay
Level Percent of Pay
Level Percent of Pay
Level Percent of Pay
Amortization Period: 27 Years, Closed 27 Years, Closed 27 Years, Closed 27 Years, Closed 27 Years, ClosedPayroll Growth Rate: 4.00% 4.00% 4.00% 4.00% 4.00%Investment Return: 7.50% 7.50% 7.50% 7.50% 7.50%Inflation: 3.25% 3.25% 3.25% 3.25% 3.25%Salary Increase: 4.00%, average 4.00%, average 4.00%, average 4.00%, average 4.00%, average
Mortality:
RP-2000 Combined Mortality Table, projected to 2013 with Scale BB (set back 1 year for females)
RP-2000 Combined Mortality Table, projected to 2013 with Scale BB (set back 1 year for females)
RP-2000 Combined Mortality Table, projected to 2013 with Scale BB (set back 1 year for females)
RP-2000 Combined Mortality Table, projected to 2013 with Scale BB (set back 1 year for females)
RP-2000 Combined Mortality Table, projected to 2013 with Scale BB (set back 1 year for females)
Healthcare Trend Rates:
Pre-65
Initial trend starting at 7.50% and gradually decreasing to an ultimate trend rate of 5.00% over a period of 5 years.
Initial trend starting at 7.50% and gradually decreasing to an ultimate trend rate of 5.00% over a period of 5 years.
Initial trend starting at 7.50% and gradually decreasing to an ultimate trend rate of 5.00% over a period of 5 years.
Initial trend starting at 7.50% and gradually decreasing to an ultimate trend rate of 5.00% over a period of 5 years.
Initial trend starting at 7.50% and gradually decreasing to an ultimate trend rate of 5.00% over a period of 5 years.
Post-65
Initial trend starting at 5.50% and gradually decreasing to an ultimate trend rate of 5.00% over a period of 2 years.
Initial trend starting at 5.50% and gradually decreasing to an ultimate trend rate of 5.00% over a period of 2 years.
Initial trend starting at 5.50% and gradually decreasing to an ultimate trend rate of 5.00% over a period of 2 years.
Initial trend starting at 5.50% and gradually decreasing to an ultimate trend rate of 5.00% over a period of 2 years.
Initial trend starting at 5.50% and gradually decreasing to an ultimate trend rate of 5.00% over a period of 2 years.
Board Meeting- December 17, 2018 - Audit Committee Report- Mr. John Chilton/ Ms. Kristen Coffey
503

100FIN
Schedule of Employers’ OPEB Contributions - KERS Non-HazardousAs of June 30, 2018 ($ in Thousands)
1 2 3 4
Fiscal Year Ending
Actuarially Determined
ContributionTotal Employer
Contribution
Contribution Deficiency
(Excess)
Covered Employee
Payroll
Actual Contributions
as a Percentage of Covered
Payroll2018 $132,365 $136,419 (4,054) $1,573,898 8.67%2017 133,024 152,356 (19,332) 1,593,097 9.56%2016 121,899 135,816 (13,917) 1,529,249 8.88%2015 130,455 135,940 (5,485) 1,544,234 8.80%2014 208,881 166,610 42,271 1,577,496 10.56%2013 286,143 165,331 120,812 1,644,409 10.05%2012 297,904 156,057 141,847 1,644,897 9.49%2011 294,898 129,336 165,562 1,731,633 7.47%2010 376,556 102,528 274,028 1,815,146 5.65%2009 $362,707 $82,711 $279,996 $1,754,413 4.71%
(1) Data for years prior to 2018 are based on contribution data provided in the 2017 CAFR, based on calculations provided by the prior actuary.(2) Actuarially determined contribution for fiscal year ending 2018 is based on the contribution rate calculated with the June 30, 2016, actuarial valuation.(3) Employer contributions do not include the expected implicit subsidy.(4) Based on derived compensation using the provided employer contribution information.
Schedule of Employers’ OPEB Contributions - KERS HazardousAs of June 30, 2018 ($ in Thousands)1 2 3 4
Fiscal Year Ending
Actuarially Determined
ContributionTotal Employer
Contribution
Contribution Deficiency
(Excess)
Covered Employee
Payroll
Actual Contributions
as a Percentage of Covered
Payroll2018 $2,550 $5,288 (2,738) $190,317 2.78%2017 4,688 5,620 (932) 171,087 3.28%2016 9,186 16,766 (7,580) 147,563 11.36%2015 13,152 14,882 (1,730) 128,680 11.57%2014 15,627 23,874 (8,247) 129,076 18.50%2013 26,253 25,682 571 132,015 19.45%2012 28,326 24,538 3,788 131,977 18.59%2011 29,585 19,953 9,632 133,054 15.00%2010 35,045 22,241 12,804 143,558 15.49%2009 $34,670 $20,993 $13,677 $146,044 14.37%
(1) Data for years prior to 2018 are based on contribution data provided in the 2017 CAFR, based on calculations provided by the prior actuary.(2) Actuarially determined contribution for fiscal year ending 2018 is based on the contribution rate calculated with the June 30, 2016, actuarial valuation.(3) Employer contributions do not include the expected implicit subsidy.(4) Based on derived compensation using the provided employer contribution information.
Board Meeting- December 17, 2018 - Audit Committee Report- Mr. John Chilton/ Ms. Kristen Coffey
504

101 FIN
Schedule of Employers’ OPEB Contributions - CERS Non-HazardousAs of June 30, 2018 ($ in Thousands)1 2 3 4
Fiscal Year Ending
Actuarially Determined Contribution
Total Employer Contribution
Contribution Deficiency (Excess)
Covered Employee
Payroll
Actual Contributions
as a Percentage of Covered
Payroll2018 $120,797 $124,619 $(3,822) $2,570,156 4.85%2017 122,270 120,712 1,558 2,480,130 4.87%2016 110,987 111,836 (849) 2,352,762 4.75%2015 119,511 119,444 67 2,296,716 5.20%2014 130,652 123,278 7,374 2,272,270 5.43%2013 195,561 159,993 35,568 2,236,277 7.15%2012 214,421 171,925 42,496 2,236,546 7.69%2011 213,429 186,886 26,543 2,276,596 8.21%2010 266,331 175,764 90,567 2,236,855 7.86%2009 $264,734 $131,476 $133,258 $2,183,612 6.02%
(1) Data for years prior to 2018 are based on contribution data provided in the 2017 CAFR, based on calculations provided by the prior actuary.(2) Actuarially determined contribution for fiscal year ending 2018 is based on the contribution rate calculated with the June 30, 2016, actuarial valuation.(3) Employer contributions do not include the expected implicit subsidy.(4) Based on derived compensation using the provided employer contribution information.
Schedule of Employers’ OPEB Contributions - CERS HazardousAs of June 30, 2018 ($ in Thousands)1 2 3 4
Fiscal Year Ending
Actuarially Determined
ContributionTotal Employer
Contribution
Contribution Deficiency
(Excess)
Covered Employee
Payroll
Actual Contributions
as a Percentage of Covered
Payroll2018 $55,027 $56,002 $(975) $588,526 9.52%2017 53,131 51,537 1,594 542,710 9.50%2016 64,253 67,619 (3,366) 492,851 13.72%2015 69,103 71,778 (2,675) 483,641 14.84%2014 74,360 74,792 (432) 479,164 15.61%2013 102,011 85,319 16,692 461,673 18.48%2012 110,763 92,564 18,199 464,229 19.94%2011 109,227 98,592 10,635 466,964 21.11%2010 129,227 84,536 44,691 466,549 18.12%2009 $126,757 $71,413 $55,344 $469,315 15.22%
(1) Data for years prior to 2018 are based on contribution data provided in the 2017 CAFR, based on calculations provided by the prior actuary.(2) Actuarially determined contribution for fiscal year ending 2018 is based on the contribution rate calculated with the June 30, 2016, actuarial valuation.(3) Employer contributions do not include the expected implicit subsidy.(4) Based on derived compensation using the provided employer contribution information.
Board Meeting- December 17, 2018 - Audit Committee Report- Mr. John Chilton/ Ms. Kristen Coffey
505
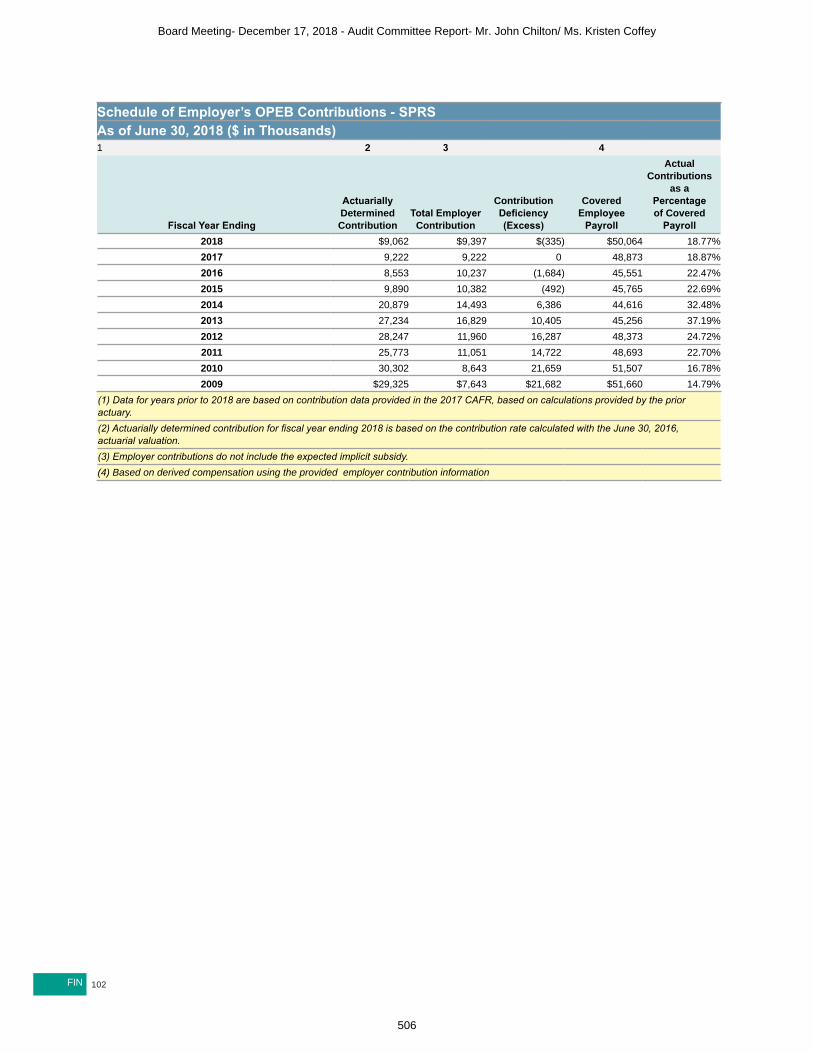
102FIN
Schedule of Employer’s OPEB Contributions - SPRSAs of June 30, 2018 ($ in Thousands)1 2 3 4
Fiscal Year Ending
Actuarially Determined Contribution
Total Employer Contribution
Contribution Deficiency (Excess)
Covered Employee
Payroll
Actual Contributions
as a Percentage of Covered
Payroll2018 $9,062 $9,397 $(335) $50,064 18.77%2017 9,222 9,222 0 48,873 18.87%2016 8,553 10,237 (1,684) 45,551 22.47%2015 9,890 10,382 (492) 45,765 22.69%2014 20,879 14,493 6,386 44,616 32.48%2013 27,234 16,829 10,405 45,256 37.19%2012 28,247 11,960 16,287 48,373 24.72%2011 25,773 11,051 14,722 48,693 22.70%2010 30,302 8,643 21,659 51,507 16.78%2009 $29,325 $7,643 $21,682 $51,660 14.79%
(1) Data for years prior to 2018 are based on contribution data provided in the 2017 CAFR, based on calculations provided by the prior actuary.(2) Actuarially determined contribution for fiscal year ending 2018 is based on the contribution rate calculated with the June 30, 2016, actuarial valuation.(3) Employer contributions do not include the expected implicit subsidy.(4) Based on derived compensation using the provided employer contribution information
Board Meeting- December 17, 2018 - Audit Committee Report- Mr. John Chilton/ Ms. Kristen Coffey
506

103 FIN
Money-Weighted Rates of ReturnIn accordance with GASB, KRS provides this additional disclosure regarding its money-weighted rate of return for the Pension Funds and Insurance Fund. The money-weighted rate of return is a method of calculating period-by-period returns on Pension Funds and Insurance Fund investments that adjusts for the changing amounts actually invested. For purposes of this Statement, money weighted-rate of return is calculated as the internal rate of return on Pension Funds and Insurance Fund investments, net of Pension Funds and Insurance Fund investment expense, adjusted for the changing amounts actually invested. See below for the money-weighted rates of return for multiple periods including fiscal year June 30, 2018, as calculated by the custodian bank, BNY Mellon:
Money - Weighted Rates of Return As of June 30, 2018
KERS KERS CERS CERS SPRSNon-
Hazardous HazardousNon-
Hazardous Hazardous Pension Funds
2018 7.63% 8.69% 8.82% 8.82% 7.68%2017 12.08% 13.45% 13.80% 13.72% 12.50%2016 -0.97% -0.33% -0.62% -0.46% -1.76%2015 1.89% 1.69% 1.65% 1.88% 1.71%2014 15.50% 15.65% 15.56% 15.50% 15.66%
Insurance Fund
KERS KERS CERS CERS SPRSNon-
Hazardous HazardousNon-
Hazardous Hazardous 2018 7.95% 8.93% 9.22% 9.35% 9.39%2017 13.77% 13.75% 13.67% 13.69% 13.69%
Note: This table is intended to show information for ten years; additional year’s information will be displayed as it becomes available.
Board Meeting- December 17, 2018 - Audit Committee Report- Mr. John Chilton/ Ms. Kristen Coffey
507
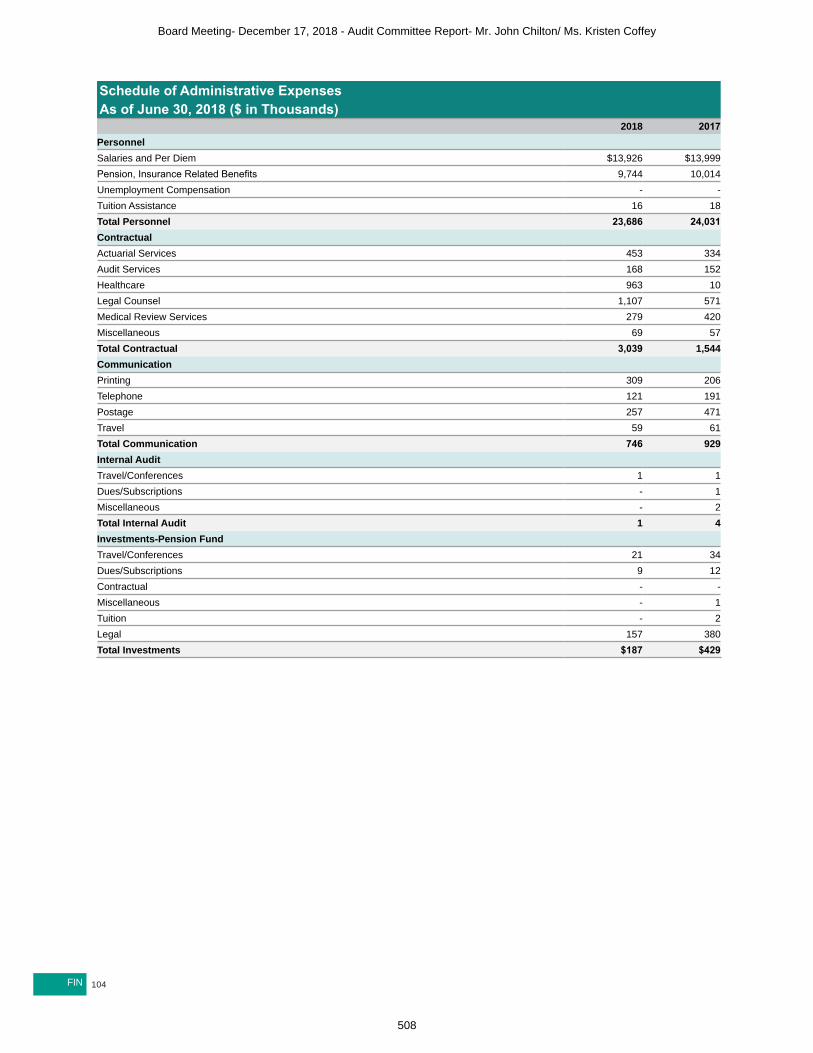
104FIN
Schedule of Administrative ExpensesAs of June 30, 2018 ($ in Thousands) 2018 2017Personnel Salaries and Per Diem $13,926 $13,999Pension, Insurance Related Benefits 9,744 10,014Unemployment Compensation - -Tuition Assistance 16 18Total Personnel 23,686 24,031Contractual Actuarial Services 453 334Audit Services 168 152Healthcare 963 10Legal Counsel 1,107 571Medical Review Services 279 420Miscellaneous 69 57Total Contractual 3,039 1,544Communication Printing 309 206Telephone 121 191Postage 257 471Travel 59 61Total Communication 746 929Internal Audit Travel/Conferences 1 1Dues/Subscriptions - 1Miscellaneous - 2Total Internal Audit 1 4Investments-Pension Fund Travel/Conferences 21 34Dues/Subscriptions 9 12Contractual - -Miscellaneous - 1Tuition - 2Legal 157 380Total Investments $187 $429
Board Meeting- December 17, 2018 - Audit Committee Report- Mr. John Chilton/ Ms. Kristen Coffey
508

105 FIN
Schedule of Administrative Expenses (cont...) 2018 2017Rentals Office Space $754 $743Equipment 70 85Total Rentals 824 828Information Technology Software 1,932 320Hardware - 878Services - 1,594Total Information Technology 1,932 2,792Miscellaneous Utilities 204 211Supplies 81 119Insurance 345 235Dues & Subscriptions 31 46Maintenance 1 4Other 6 17Total Miscellaneous 668 632Depreciation/Amortization 1,874 1,920Total Pension Fund Administrative Expense 32,957 33,109Healthcare Fees 2,063 2,202Total Insurance Fund Administrative Expense 2,063 2,202Total Administrative Expenses $35,020 $35,311
Schedule of Direct Investment ExpensesAs of June 30, 2018 ($ in Thousands) 2018 2017PENSION FUNDS Security Lending Fees Borrower (Income) Rebates $4,712 $734Lending Agent Fees 445 351Total Security Lending 5,157 1,085Contractual Services Investment Management 50,813 53,780Security Custody 1,299 29,651Investment Consultant 1,385 1,084Private Equity Performance Fees 39,100 1,005Total Contractual Services 92,597 85,520INSURANCE FUNDS Security Lending Fees Borrower (Income) Rebates 1,813 187Lending Agent Fees 201 133Total Security Lending 2,014 320Contractual Services Investment Management 26,425 23,094Security Custody 846 718Investment Consultant 568 409Private Equity Performance Fees 18,078 10,007Total Contractual Services 45,917 34,228Total Investment Expenses $145,685 $121,153
Board Meeting- December 17, 2018 - Audit Committee Report- Mr. John Chilton/ Ms. Kristen Coffey
509

106FIN
Schedule of Professional Consultant FeesAs of June 30, 2018 ($ in Thousands) 2018 2017Actuarial Services $453 $344Medical Review Services 279 420Audit Services 168 152Legal Counsel 1,264 951Healthcare 963 10Miscellaneous 69 57Total $3,196 $1,934
Board Meeting- December 17, 2018 - Audit Committee Report- Mr. John Chilton/ Ms. Kristen Coffey
510

107 FIN
REPORT ON INTERNAL CONTROL over financial reporting and on compliance and other matters based on an audit of financial
statements performed in accordance with GOVERNMENT AUDITING STANDARDS
Board Meeting- December 17, 2018 - Audit Committee Report- Mr. John Chilton/ Ms. Kristen Coffey
511

108FIN
REPORT ON INTERNAL CONTROL over financial reporting and on compliance and other matters based on an audit of financial
statements performed in accordance with GOVERNMENT AUDITING STANDARDS
Board Meeting- December 17, 2018 - Audit Committee Report- Mr. John Chilton/ Ms. Kristen Coffey
512

109 FIN
REPORT ON INTERNAL CONTROL over financial reporting and on compliance and other matters based on an audit of financial
statements performed in accordance with GOVERNMENT AUDITING STANDARDS
Board Meeting- December 17, 2018 - Audit Committee Report- Mr. John Chilton/ Ms. Kristen Coffey
513

110FIN
REPORT ON INTERNAL CONTROL over financial reporting and on compliance and other matters based on an audit of financial
statements performed in accordance with GOVERNMENT AUDITING STANDARDS
Board Meeting- December 17, 2018 - Audit Committee Report- Mr. John Chilton/ Ms. Kristen Coffey
514

111 FIN
REPORT ON INTERNAL CONTROL over financial reporting and on compliance and other matters based on an audit of financial
statements performed in accordance with GOVERNMENT AUDITING STANDARDS
Board Meeting- December 17, 2018 - Audit Committee Report- Mr. John Chilton/ Ms. Kristen Coffey
515

112FIN
REPORT ON INTERNAL CONTROL over financial reporting and on compliance and other matters based on an audit of financial
statements performed in accordance with GOVERNMENT AUDITING STANDARDS
Board Meeting- December 17, 2018 - Audit Committee Report- Mr. John Chilton/ Ms. Kristen Coffey
516

113 FIN
REPORT ON INTERNAL CONTROL over financial reporting and on compliance and other matters based on an audit of financial
statements performed in accordance with GOVERNMENT AUDITING STANDARDS
Board Meeting- December 17, 2018 - Audit Committee Report- Mr. John Chilton/ Ms. Kristen Coffey
517

114FIN
REPORT ON INTERNAL CONTROL over financial reporting and on compliance and other matters based on an audit of financial
statements performed in accordance with GOVERNMENT AUDITING STANDARDS
Board Meeting- December 17, 2018 - Audit Committee Report- Mr. John Chilton/ Ms. Kristen Coffey
518

INVESTMENTS TABLE OF CONTENTS
115115
116 MARKET ENVIRONMENT118 INVESTMENT COMMITTEE INITIATIVES119 INVESTMENT SUMMARY122 INVESTMENT STRATEGIES123 INVESTMENT OBJECTIVES124 INVESTMENT RESULTS125 BENCHMARKS126 LONG-TERM RESULTS127 U.S. EQUITY128 NON-U.S. EQUITY129 FIXED INCOME130 PRIVATE EQUITY130 REAL ESTATE131 REAL RETURN132 ABSOLUTE RETURN133 CASH134 ADDITIONAL SCHEDULES & REQUIRED SUPPLEMENTAL
INFORMATION134 INVESTMENT ADVISORS AND ASSETS UNDER
MANAGEMENT137 EXTERNAL INVESTMENT EXPENSE138 COMMISSIONS139 FAIR VALUES BY PLAN141 LETTERS FROM INVESTMENT CONSULTANTS
Board Meeting- December 17, 2018 - Audit Committee Report- Mr. John Chilton/ Ms. Kristen Coffey
519

116INV
_______________________1Wells, Peter. “US Unemployment Rate Hits 18-Year Low of 3.8%.” FinancialTimes, June 2018, https://www.ft.com/content/bbf85c42-6594-
11e8-90c2-9563a0613e56. 2“An Update to the Economic Outlook: 2018 to 2018.” Congressional Budget Office. August 13, 2018, https://www.cbo.gov/
publication/54318.3Bahuguna, Anwiti. “Trade Wars or Strong U.S. Growth?” Columbia Threadneedle Investments, July 31, 2018, https://seekingalpha.com/
article/4192318-trade-wars-strong-u-s-growth.4“Databases, Tables & Calculators by Subject.” Bureau of Labor Statistics, July 2017 through June 2018, https://data.bls.gov/timeseries/
CES0000000001?output_view=net_1mth.5“Wage Growth Tracker.” Federal Reserve Bank of Atlanta: Center for Human Capital Studies, July 2017 through June 2018, https://www.
frbatlanta.org/chcs/wage-growth-tracker.aspx?panel=1.6“TED: The Economics Daily.” Bureau of Labor Statistics, https://www.bls.gov/opub/ted/2018/real-average-hourly-earnings-unchanged-
from-june-2017-to-june-2018.htm.7Pomerleau, Kyle. “2017 Tax Brackets.” Tax Foundation, November 2016, https://files.taxfoundation.org/20170123140911/TaxFoundation-
FF534.pdf.8El-Sibaie, Amir. “2018 Tax Brackets (Updated)).” Tax Foundation, January 2018, https://files.taxfoundation.org/20170123140911/
TaxFoundation-FF534.pdf.9Bahuguna, Anwiti. “Trade Wars or Strong U.S. Growth?” Columbia Threadneedle Investments, July 31, 2018, https://seekingalpha.com/
article/4192318-trade-wars-strong-u-s-growth.10“The State of the Nation’s Housing 2018.” Joint Center for Housing Studies of Harvard University, http://www.jchs.harvard.edu/sites/
default/files/Harvard_JCHS_State_of_the_Nations_Housing_2018.pdf.
Market Environment The 2018 fiscal year proved to be another positive year for investors as a result of continued global growth, low inflation, and continued demand for risk assets. In the U.S., the S&P 500 returned 14.3% over the period, while the Dow Jones Industrial Average (DJIA) and Nasdaq Composite Index (NASDAQ) posted similar returns of 16.3% and 23.6%, respectively. Overall the U.S. economy continued its robust performance. The unemployment rate hit 3.8% in May, the lowest figure in 18 years1, and U.S. Gross Domestic Product (GDP) posted an annualized 4.1% growth rate in the fourth quarter of 2018.2
Some of the key market indicators that influenced fiscal year 2018 performance were: Real Gross Domestic Product (GDP) grew by 2.0% in the second quarter, but was offset by weak consumer spending; however, business investment during the same period increased by 10.4% which contributed to 2.8% year over year growth.3 The labor market added an average of 196,000 jobs per month over the fiscal year. 4
● Modest median wage growth of around 3.2%5, however, real average hourly earnings remained stagnant from June 2017 through June 2018.6
● The Tax Cuts and Jobs Act (TCJA) that was implemented in January 2018, lowered individual and business tax burdens. For example, an individual in 2017 was assessed a 25% marginal income tax rate on income over $37,9507, whereas in 2018, the individual will pay a 22% marginal tax rate on income over $38,700.8 If we consider an individual making $40,000 (excluding exemptions), annual savings would be around $999.35.
● The lower individual tax burden has been correlated to increased consumer confidence and, therefore, increased near-term spending. Likewise, business investment growth, estimated to be around 6%, has been attributed to a reduced tax burden.9
● The housing market saw decreases in the supply of single-family homes for sale in 2017 causing an increase in prices. Nonetheless, the rate of homeowners increased for the first time since 2004. It should be noted that increasing interest rates and student debt could lead to greater uncertainty in the housing market. 10
Board Meeting- December 17, 2018 - Audit Committee Report- Mr. John Chilton/ Ms. Kristen Coffey
520

117 INV
_________________________ 11Brown, Chad P, and Kolb, Melina. “Trump’s Trade War Timeline: An Up-to-Date Guideline.”Peterson Institute for International Economics,
August 23, 2018, https://piie.com/system/files/documents/trump-trade-war-timeline.pdf.12Bahuguna, Anwiti. “Trade Wars or Strong U.S. Growth?” Columbia Threadneedle Investments, July 31, 2018, https://seekingalpha.com/
article/4192318-trade-wars-strong-u-s-growth.13Tankersly, Jim & Irwin, Neil. “Fed Raises Interest Rates and Signals 2 More Increases Are Coming.” The New York Times, June 13, 2018,
https://www.nytimes.com/2018/06/13/us/politics/federal-reserve-raises-interest-rates.html.
● The administration issued several tariffs that impacted the market, and, therefore, performance. The first tariffs imposed on January 22, 2017, were on solar panels ($8.5 billion) and washing machines ($1.8 billion). On March 1, 2018, the president announced a 25% tariff on steel and a 10% tariff on aluminum that would apply to many countries that included those within the European Union (EU) and Canada. Those tariffs went into effect on March 23, 2018, with exemptions for Canada, Mexico, the EU, South Korea, Brazil, Argentina, and Australia. On that day the DJIA fell by 462 points. The majority of the tariffs have been aimed at China, which has retaliated with its own tariffs on American goods, and has created volatility in the markets. This tariff “war” has not abated and will likely continue to affect performance.11
Anwiti Bahuguna, Senior Portfolio Manager for Columbia Threadneedle Investments, writes, “Growth may slow down a bit in the second half of the year, but the economy is still poised to grow almost to 3% in 2018. After years of not reaching the Fed’s target, inflation is firming and core personal consumption expenditure (PCE) is expected to be around 2% this year.”12 The Fed continued their methodical increases of interest rates and raised the interest rate three times from a range of 1.00% to 1.25% at the start of the period to 1.75% to 2.00% by June 30, 2018. However, interest rates are still low by historical standards.13 In the face of rising rates and a flattening yield curve, bond investors took a hit as the Bloomberg Barclay’s US Aggregate Index returned -.40% for the fiscal year. Investors who favored Credit over interest rates fared better, with the Bloomberg Barclay’s US High Yield Index returning 2.62%, and the S&P Leveraged Loan Index returning 4.37%.
Asset Allocation Changes The Investment Committee, upon recommendation from KRS’ general consultant, Wilshire Associates, approved a new asset allocation policy for each of the plans in June that decreased the allocation in public equities in favor of fixed income holdings. The general reduction in equities was a theme for the plans over the past fiscal year, as KRS reduced its exposure to stocks from 49.6% to 40.3% by the end of the period. The Committee felt it was prudent to sell into a strong equity market to reduce the exposure in what has proven to be the longest bull market for stocks in history. The Investment Staff continued to reduce hedge funds by paring down exposure from 7.6% to 5.6% by the end of the fiscal year.
Performance The Pension Fund returned 8.57%, net of fees, for the fiscal year versus 7.91% for the Allocation Index Benchmark. Individual plan net of fees returns ranged from 7.50% for the KERS Non-Hazardous plan to 8.77% for the CERS Hazardous Plan. The Insurance Fund returned 9.05% net of fees for the period versus 8.48% for the Allocation Index Benchmark. In both funds, equities led the way with Private Equity returning 14.52% and Public Equity returning 12.43% for the year. Real Estate also performed very well, posting a return of 11.22% versus 7.11% for the Real Estate benchmark. Absolute Return posted a return of 5.52%, beating its benchmark of 5.39%. For the year, all asset classes had positive absolute performance, with only U.S. Public Equity trailing the benchmark by 26 basis points. Most importantly, all plans produced performance well above their respective assumed rates of return. While the Investment Staff and the Investment Committee of the Board are pleased with the performance of the assets over the fiscal year, it is important to remain focused on the long road ahead to achieve a healthy funded status for each plan. Investment returns are only one part of this process, but KRS looks forward to continuing the momentum they have created over the last 2 years.
Board Meeting- December 17, 2018 - Audit Committee Report- Mr. John Chilton/ Ms. Kristen Coffey
521

118INV
Investment Committee InitiativesNew MembersSherry Lynn Kremer was elected to serve as one of two KRS Board of Trustees representatives from the Kentucky Employees Retirement System (KERS) in March 2018, and was appointed to the Investment Committee by the Board.
Continued Restructuring of Absolute Return InvestmentsStaff continued their work to review and restructure the Absolute Return portfolio. In late 2016, the Investment Committee started a detailed review of the entire Absolute Return portfolio. In March 2017, KRS began to redeem some investments and started to transfer several investments previously held in fund-of-funds vehicles to direct ownership by KRS. In October 2017, new general investment consultant, Wilshire Associates, began their review of the Absolute Return portfolio and provided recommendations to staff in early 2018. In April, staff issued redemption notices to two more funds and on May 7, 2018 KRS issued a full redemption notice to Prisma indicating the desire to fully liquidate the last fund-of-funds investment. Prisma provided KRS a schedule of liquidations on May 18th. They estimate that KRS will receive $265,300,000 (48.7% of the total) in October 2018, $159,000,000 in January 2019 (29.2%), $68,600,000 (12.6%) in July 2019, $44,100,000 (8.1%) in July 2020, and the remainder in early 2021. Overall hedge fund investments at KRS have been reduced from a high of $1,646,000,000 in January 2016 down to $965,325,000 as of May 2018. Of that total, roughly $600,000,000 is currently in the redemption que.
Asset AllocationAt the May 1, 2018, Investment Committee meeting the new general consultant, Wilshire Associates, presented their first asset liability study which contained a proposal for new asset allocations for all systems. While this proposal contained a recommendation to increase equity exposure in CERS, KERS Hazardous, and all Insurance plans, it also suggested a substantial reduction to the equity positions in the KERS and SPRS plans because of their severe underfunded status. No action was taken at the meeting because the committee wanted more time to study the recommendations, and asked Wilshire to rerun their analysis’ for the KERS and SPRS plans to reflect the increased funding recently provided by the legislature. Wilshire was also asked to focus on increasing the probability of the KERS and SPRS plans hitting the assumed rate of return of 5.25% over a 10-year period, while decreasing the annual volatility that those plans are expected to experience. On June 7th, Wilshire presented a new Asset Allocation for those plans, and the recommended allocations for all 10 plans were approved by the Committee.
Assumed Rates of ReturnThe Investment Committee also made recommendations to the Board to lower the assumed rates of return for each of the systems. The committee reviewed capital market assumptions from eight leading investment and/or consulting firms, e.g., JP Morgan, PIMCO, RVK, Goldman Sachs, and Blackrock. The assumptions from these firms were compared to each system’s asset allocation where the resulting portfolio returns were averaged to produce an estimated return for each system. As a result of this work, the Committee recommended lowering the assumed rates of return from 6.75% to 5.25% for the KERS Non-Hazardous and SPRS pension plans to more realistically reflect those systems’ need to reduce volatility and increase the liquidity of the investments. For all other plans, the committee recommended a reduction from 7.5% to 6.25%. These recommendations were approved by the Board at their May and July 2017 meetings.
Investment ConsultantIn May 2017 the Investment Committee asked staff to issue a Request for Proposal (RFP) for new investment consulting services. The Investment Committee felt that KRS might be able to increase service levels and reduce consulting fees by switching to a single consultant to work across all asset classes except Real Estate. An RFP was issued in June 2017, and eight out of nine of the largest investment consulting firms in the U.S. responded. The responses were scored by an internal review committee and four finalists were selected for in-person interviews with the selection committee. The committee recommended that Wilshire Associates be hired as the new investment consultant for all asset classes except for Real Estate; the committee continued to retain the incumbent Real Estate manager, ORG Portfolio Management, for this asset class. This recommendation was approved by the Investment Committee in August 2017 and the Board at its September 2017 meeting.
Board Meeting- December 17, 2018 - Audit Committee Report- Mr. John Chilton/ Ms. Kristen Coffey
522

119 INV
Senate Bill 2In March 2017, the Kentucky Legislature passed a new set of pension system transparency requirements, collectively known as Senate Bill 2 (SB 2). This new legislation required:
● Posting all investment contracts to the KRS website; ● Investment managers working for the systems to adhere to the CFA Asset Manager Code of Conduct and
the CFA Standards of Professional Conduct; ● All KRS Trustees to adhere to the CFA Institute Code of Conduct for Pension Scheme Governing Bodies;
and, ● KRS to develop a procurement policy for all investment services and to have that policy approved by the
Finance and Administration Cabinet as being representative of industry best practice. Staff from both the Investments and Legal departments have worked diligently to implement these new requirements. A new Procurement Policy was developed with the Finance and Administration Cabinet and approved by the Board in September 2017. The Investment staff has begun to contact each of manager to inform them of the new requirements and to request minimally redacted copies of investment management contracts. The KRS Communications staff created a section on KRS’ website to host these contracts and continue to collect and post them as they become available.
Investment Activity ● New State Capital Partners Fund II (Private Equity): The Investment Committee approved a $25 million
investment in the Fund at the February 6, 2018, meeting; however, due to the requirements of 2017 SB2, New State declined to accept our investment.
● Davidson Kempner (DK) LP (Absolute Return): In March 2018, KRS received notice from DK requesting KRS to withdraw the ~$70 million investment in the fund, citing the SB2 requirements and recent litigation involving KRS as the reason.
● Equity Reduction (Public Equities): At the beginning of April 2018, staff conducted another equity reduction trade, removing roughly $365 million of exposure (Pension $250 million, Insurance $115 million).
● Manulife Global Fixed Income (Core Fixed Income): In April 2018, KRS sent an additional deposit of $135 million to the existing Manulife Global Bond portfolio. These funds were the result of a reduction to the Public Equity exposure at the beginning of the month.
● BNY Mellon Intermediate Credit Index CTF (Core Fixed Income)– On April 18, 2018, KRS made an additional deposit of $288 million to the BNY Int Credit Index Fund. These funds were the result of a reduction to the Public Equity exposure at the beginning of the month.
● Shenkman Capital (US Bank Loans) – On May 22, 2018, staff made an additional deposit of $40 million to Shenkman.
Investment SummaryThe KRS Board is charged with the responsibility of investing the Kentucky Retirement Systems (Systems) assets to provide benefits to the members of the Systems. To achieve this goal, the Board follows an investment policy that thoughtfully grows the asset base while at the same time protects against undue risks and losses in all investment areas. The Board recognizes its fiduciary duty not only to invest the funds in compliance with the Prudent Person Rule, but to also manage the funds while recognizing the long-term nature of the Systems’ investments. In order to carry out their fiduciary duties the Board has created clearly defined investment policies, objectives, and strategies for both the Pension and Insurance portfolios.
Investment PolicyAs of June 30, 2018, the KRS Pension Funds aimed for the following asset allocations for each system: 17.5% of the assets in U.S. Equities; 17.5% in broad market International Equities; 4.0% (10.0% for KERS Non-Hazardous and SPRS) in Global Fixed Income; 24.0%(17.0% for KERS Non-Hazardous and SPRS) in Credit Fixed Income; 10.0% in Private Equity; 10.0% in Real Return; 10.0% in Absolute Return; 5.0% in Real Estate; and, 2.0%(3.0% for KERS Non-Hazardous and SPRS) in Cash or Short-Term Securities. As of June 30, 2018, the KRS Insurance Fund’s allocation policy set investment goals of: 17.5% of the assets in U.S. Equities; 17.5% in broad market International Equities; 4.0% in Global Fixed Income; 24.0% in Credit Fixed Income; 10.0% in Private Equity; 10.0% in Real Return;
Board Meeting- December 17, 2018 - Audit Committee Report- Mr. John Chilton/ Ms. Kristen Coffey
523

120INV
10.0% in Absolute Return; 5.0% in Real Estate; and, 2.0% in Cash or Short-Term Securities. The following charts represent the composites for the total Pension and Insurance funds (dollar weighted by plan).
Pension Board Policy vs. Actual Asset AllocationAs of June 30, 2018 ($ in Thousands)
Total PlanU.S.
EquityNon U.S. Equity
Global Fixed
Credit Fixed
Real Return
Private Equity
Real Estate
Absolute Return Cash
Policy’s Pension Asset Allocation 100.00% 17.50% 17.50% 5.10% 22.70% 10.00% 10.00% 5.00% 10.00% 2.20%Actual Pension Asset Allocation 100.00% 17.27% 21.08% 19.95% 10.27% 8.60% 9.88% 3.55% 5.71% 3.69%
Assets Allocation Policy - Pension
Board Meeting- December 17, 2018 - Audit Committee Report- Mr. John Chilton/ Ms. Kristen Coffey
524

121 INV
Insurance Board Policy vs. Actual Asset AllocationAs of June 30, 2018 ($ in Thousands)
Total PlanU.S.
EquityNon U.S. Equity
Global Fixed
Credit Fixed
Real Return
Private Equity
Real Estate
Absolute Return Cash
Policy’s Insurance Asset Allocation 100.00% 17.50% 17.50% 4.00% 24.00% 10.00% 10.00% 5.00% 10.00% 2.00%Actual Insurance Asset Allocation 100.00% 18.31% 22.02% 19.44% 9.46% 8.68% 10.29% 3.47% 5.57% 2.76%
Asset Allocation Policy - Insurance
Board Meeting- December 17, 2018 - Audit Committee Report- Mr. John Chilton/ Ms. Kristen Coffey
525

122INV
Investment StrategiesDiversificationKRS portfolios are diversified on several levels, primarily through the use of the aforementioned multiple asset classes. Asset allocations are revisited on a periodic basis and represent an efficient allocation to maximize returns and minimize risks at a level appropriate for each system. The individual asset classes are diversified through the use of multiple portfolios that are managed by both the Investment Division Staff and external Investment Advisors. Finally, portfolios within each of the asset classes are diversified through both investment styles and the selection of individual securities. Each portfolio advisor is afforded discretion to diversify its portfolio(s) within the parameters established by the KRS Board.
RebalancingProper implementation of the investment policy requires that a periodic adjustment, or rebalancing, of assets be made to ensure conformance with KRS’ Investment Policy Statement (IPS) target levels. Such rebalancing is necessary to reflect sizable cash flows and performance imbalances among asset classes and investment advisors. KRS’ rebalancing policies call for an immediate rebalancing to within its allocation ranges if an asset class exceeds or falls outside its allowable range as defined in the IPS. As the previous charts depict, there were several asset classes that were significantly out of range; however, this was a result of rebalancing, e.g. this fiscal year the Investment Committee instructed staff to focus funding on Fixed Income rather than Absolute Returns.
Investments Performance Review ProceduresAt least once each quarter, the Investment Committee, on behalf of the KRS Board, reviews the performance of the portfolio to determine compliance with the Statement of Investment Policy. The Investment Committee also reviews a report created and presented by the KRS Compliance Officer who is part of the independent Internal Audit Division. The Compliance Officer performs tests daily, monthly, and quarterly to assure compliance with the restrictions imposed by the ISP.
Investment ConsultingThe Board employs industry leading external consultants to assist in determining and reviewing the asset allocation guidelines. Consultants also provide performance reports for both the internally managed and externally managed assets. A letter from each consulting firm utilized follows this section and each provides a discussion of current allocations, performance, and significant changes during the fiscal year.
Board Meeting- December 17, 2018 - Audit Committee Report- Mr. John Chilton/ Ms. Kristen Coffey
526
123 INV
Investment ObjectivesThe investment objectives of the portfolios are to produce results that exceed the stated goals over both short-term and long-term periods.
● Shorter-Term (5 years and less): The returns of the particular asset classes of the managed funds of the Systems, measured on an annual basis, should exceed the returns achieved by a policy benchmark portfolio composed of comparable unmanaged market indices.
● Medium-Term (5 to 20 years): The returns of the particular asset classes of the managed funds of the Systems,
measured on a rolling year basis, should exceed the returns achieved by a policy benchmark portfolio composed of comparable unmanaged market indices and perform above the median of an appropriate peer universe, if there is one.
● Longer-Term: The total assets of the Systems should achieve a return of 5.25% for KERS Non-Hazardous
and SPRS pensions and 6.25% for all other Pension and Insurance plans. This is measured for 20 years and beyond and should exceed the actuarially required rate of return as well as the return achieved by its total fund benchmark.
In keeping with the KRS Board’s fiduciary responsibility, where all else is equal, the Board encourages the investment of the Systems’ assets in securities of corporations that provide a positive contribution to the economy of the Commonwealth of Kentucky. This section was prepared by the KRS Interim Chief Investment Officer and Investment staff members with support from the KRS’ Investment Committee. Information reported in the respective schedules and supplemental information was provided by our investment consultants and custodial bank.
Board Meeting- December 17, 2018 - Audit Committee Report- Mr. John Chilton/ Ms. Kristen Coffey
527

124INV
Investment ResultsFor the purposes of this report, total fund return information is net of investment manager fees with audited data beginning in July 2011. At the manager or individual account level, returns are net of fees beginning in July 2011 and gross of fees are used for prior historical data. All rates of return are calculated using time-weighted rates of return.
Fiscal Year 2018 ResultsFor the fiscal year ending on June 30, 2018, the KRS Pension Funds earned a net return of 8.57%, outpacing its benchmark return of 7.91%. The KRS Insurance Funds return for that period earned a return net of fees of 9.1% compared to the 8.48% benchmark.
Net Returns By System: Pension Fund As of June 30, 2018 ($ in Thousands)
PlanMarket Value
% of Total 1 Year 3 Years 5 Years 10 Years Inception
KRS Index KRS Index KRS Index GANIR KRS Index KRS IndexKERS $2,007,002 16.33% 7.50 7.15 6.17 6.50 7.19 7.24 2.00 5.96 6.31 9.07 9.20KERS HAZ 647,918 5.27% 8.68 8.22 7.14 6.91 7.70 7.52 2.65 6.21 6.45 9.15 9.24CERS 7,033,654 57.22% 8.75 8.22 7.18 6.91 7.71 7.52 2.54 6.22 6.45 9.15 9.24CERS HAZ 2,345,934 19.09% 8.77 8.22 7.21 6.90 7.73 7.52 2.75 6.23 6.45 9.15 9.24SPRS 256,966 2.09% 7.65 7.68 6.06 6.54 7.04 7.28 2.21 5.89 6.34 9.05 9.20Total $12,291,474 100.00% 8.57 7.91 7.01 6.86 7.63 7.57 6.18 6.48 9.14 9.25
Net Returns By System: Insurance Fund As of June 30, 2018 ($ in Thousands)
PlanMarket Value % of Total 1 Year 3 Years 5 Years 10 Years Inception
KRS Index KRS Index KRS Index KRS Index KRS IndexKERS $834,386 16.25% 7.96 8.43 6.92 7.09 7.23 7.66 5.31 5.95 7.39 7.79KERS HAZ 512,697 9.99% 8.88 8.60 7.31 7.16 7.69 7.73 5.54 5.98 7.46 7.80CERS 2,333,374 45.45% 9.21 8.60 7.46 7.18 7.79 7.76 5.59 5.99 7.48 7.80CERS HAZ 1,264,027 24.62% 9.32 8.60 7.55 7.18 7.84 7.76 5.61 5.99 7.49 7.80SPRS 189,075 3.68% 9.34 8.60 7.53 7.19 7.82 7.77 5.60 6.00 7.49 7.80Total $5,133,559 100.00% 9.05 8.48 7.40 7.22 7.71 7.90 5.55 6.06 7.47 7.83
Board Meeting- December 17, 2018 - Audit Committee Report- Mr. John Chilton/ Ms. Kristen Coffey
528

125 INV
Benchmarks
The Kentucky Retirement Systems Pension and Insurance Funds’ benchmarks are weighted averages that are composites of the various asset class indices that exist within each of KRS’ investment portfolios. KRS uses the Modified Dietz Method as its basis for calculations, which is used to determine the performance of an investment portfolio based on a time weighted cash flow. The various asset class benchmarks are shown below:
BenchmarksAs of June 30, 2018 ($ in Thousands)Index Pension InsuranceRussell 3000 U.S. Equity 17.50% 17.50%MSCI ACWI Ex-US IMI Non U.S. Equity 17.50% 17.50%Barclays Universal Index Global Fixed Income 5.10% 4.00%Barclays U.S. High Yield Credit Fixed Income 22.70% 24.00%NCREIF ODCE Real Estate 5.00% 5.00%HFRI Diversified FOF Absolute Return 10.00% 10.00%Custom-Allocation Specific Real Return 10.00% 10.00%Actual Performance Private Equity < 5 years 10.00% 10.00%Russell 3000 Quarter Lagged + 300 bps Private Equity > 5 years 10.00% 10.00%Cit Grp 3-mos Treasury Bill Cash 2.20% 2.00%Note: These benchmarks are intended to be objective, measurable, investable/replicable, and representative of the investment mandates. The benchmarks are developed from publicly available information and accepted by the investment advisor and KRS as the neutral position consistent with the investment mandate and status. KRS’ Investment Staff and Consultants recommend the indices and benchmarks, which are reviewed and approved by the Investment Committee and ratified by the KRS Board. It is anticipated that as KRS continues to diversify through other markets and asset classes, both the Pension and Insurance Fund Total benchmarks will evolve to reflect these exposures.
Board Meeting- December 17, 2018 - Audit Committee Report- Mr. John Chilton/ Ms. Kristen Coffey
529

126INV
Long-Term ResultsThe schedule below details annual returns over the last ten years. Returns range from a minimum of -17.21% in 2009 to a maximum of 18.96% in 2011. For the year ending June 30, 2018, the KRS total Pension Fund portfolio earned the then current annualized net returns. As previously noted, beginning with the 2017 valuation, the Board lowered the actuarial required rates of return for KERS and SPRS to 5.25% and 6.25% return for CERS Non-Hazardous, CERS Hazardous, and KERS Hazardous. The growth of a dollar chart below displays the differences between $1,000 invested in 2009 at an assumed rate of return of 5.25% for KRS and SPRS and 6.25% for CERS Non-Hazardous, CERS Hazardous, and KERS Hazardous, where an investment of $1,000 would have earned $1,890 for KERS Non-Hazardous and SPRS and $1,922 for CERS Non-Hazardous, CERS Hazardous, and KERS Hazardous. Further, the Pension Fund Growth chart indicates that the total Pension Fund would have earned $2,209 per $1,000.
Pension Fund GrowthAs of June 30, 2018 (in Whole $) 2009 2010 2011 2012 2013 2014 2015 2016 2017 2018Total Fund Return -17.21% 15.81% 18.96% 0.14% 10.82% 15.55% 2.01% -0.52% 13.47% 8.57%Performance BM -14.88% 13.16% 20.34% 0.90% 11.21% 14.91% 3.13% -0.19% 13.28% 7.91%Actuarial Assumed ROR CERS, CERS-H, and KERS-H 7.75% 7.75% 7.75% 7.75% 7.75% 7.75% 7.75% 7.50% 7.50% 6.25%Actuarial Assumed ROR KERS and SPRS 7.75% 7.75% 7.75% 7.75% 7.75% 7.75% 7.75% 7.50% 6.75% 5.25% KRS Pension Fund $1,000 $1,158 $1,378 $1,380 $1,529 $1,767 $1,802 $1,793 $2,034 $2,209Performance Benchmark 1,000 1,132 1,362 1,374 1,528 1,756 1,811 1,807 2,047 2,209Actuarial Assumed ROR CERS, CERS-H, and KERS-H 1,000 1,078 1,161 1,251 1,348 1,452 1,565 1,682 1,809 1,922Actuarial Assumed ROR KERS and SPRS $1,000 $1,078 $1,161 $1,251 $1,348 $1,452 $1,565 $1,682 $1,796 $1,890
The chart below shows annual returns for the Insurance Fund since June 30, 2009, where returns range from a minimum of -23.18% in 2009 to a maximum of 23.47% in 2011. As of June 30, 2018, the Insurance Fund portfolios earned an annualized total net return of 9.05% versus the benchmark annualized return of 8.48%. The chart below indicates that the performance of $1,000 invested in the Insurance portfolios would grow to $2,237, the policy benchmark to $2,358, and the actuarial assumption to $1,922 over the 10 year period. Insurance FundAs of June 30, 2018 (in Whole $) 2009 2010 2011 2012 2013 2014 2015 2016 2017 2018Total Fund Return -23.18% 15.46% 23.47% -1.71% 10.11% 14.89% 1.86% -0.09% 13.72% 9.05%Performance BM -23.15% 13.07% 26.93% 0.58% 11.05% 15.03% 3.79% 0.03% 13.55% 8.48%Actuarial Assumed ROR 7.75% 7.75% 7.75% 7.75% 7.75% 7.75% 7.75% 7.50% 7.50% 6.25% KRS Insurance Fund $1,000 $1,155 $1,426 $1,401 $1,543 $1,773 $1,806 $1,804 $2,051 $2,237Performance Benchmark 1,000 1,131 1,435 1,444 1,603 1,844 1,914 1,914 2,174 2,358Actuarial Assumed ROR $1,000 $1,078 $1,161 $1,251 $1,348 $1,452 $1,565 $1,682 $1,809 $1,922
Board Meeting- December 17, 2018 - Audit Committee Report- Mr. John Chilton/ Ms. Kristen Coffey
530

127 INV
U.S. EquityFor the fiscal year ending June 30, 2018, the KRS Pension Funds’ U.S. Equity portfolio posted a return of 14.52% versus the benchmark return of 14.78%. The KRS Insurance U.S. Equity portfolio posted a return of 14.42% compared to the benchmark return of 14.78%. Since inception, performance has remained sound. The Pension Fund’s Public Equity portfolio has generated an annualized return of 11.36% throughout its duration against a benchmark with an annualized return of 11.39%. The Insurance Fund has returned 9.74% since inception, while the benchmark returned 9.61%.
Return on U.S. EquityAs of June 30, 2018 Inception Date Fiscal Year 3-Year 5-Year 10-Year InceptionKRS Pension Apr-84 14.52% 11.08% 12.66% 9.97% 11.36%Performance Benchmark 14.78% 11.58% 13.29% 10.34% 11.39%KRS Insurance Jul-92 14.42% 11.40% 12.83% 9.91% 9.74%Performance Benchmark 14.78% 11.58% 13.29% 10.19% 9.61%Note: Pension and Insurance benchmark is the Russell 3000.
2018 Top 10 U.S. Equity Holdings 2018 Top 10 U.S. Equity HoldingsPension Funds Insurance FundAs of June 30, 2018 ($ in Thousands) As of June 30, 2018 ($ in Thousands)Company Shares Market Value Company Shares Market ValueAPPLE INC 251,326 $46,523 APPLE INC 111,549 $20,649MICROSOFT CORP 387,902 38,251 MICROSOFT CORP 172,141 16,975AMAZON.COM INC 21,243 36,109 AMAZON.COM INC 9,428 16,026FACEBOOK INC 132,506 25,749 FACEBOOK INC 58,820 11,430BERKSHIRE HATHAWAY INC 130,213 24,304 BERKSHIRE HATHAWAY INC 58,116 10,847ALPHABET INC-CL C 16,642 18,567 ALPHABET INC-CL C 7,388 8,242ALPHABET INC-CL A 16,173 18,262 ALPHABET INC-CL A 7,180 8,108JPMORGAN CHASE & CO 160,595 16,734 JPMORGAN CHASE & CO 71,215 7,421EXXON MOBIL CORP 195,232 16,152 EXXON MOBIL CORP 86,586 7,163VISA INC 120,062 15,902 VISA INC 53,313 7,061Total 1,431,894 $256,553 Total 635,736 $113,922A complete list of holdings is located at https://kyret.ky.gov/Investments/Investments-Library/Pages/Investments-Holdings.aspx.
Board Meeting- December 17, 2018 - Audit Committee Report- Mr. John Chilton/ Ms. Kristen Coffey
531
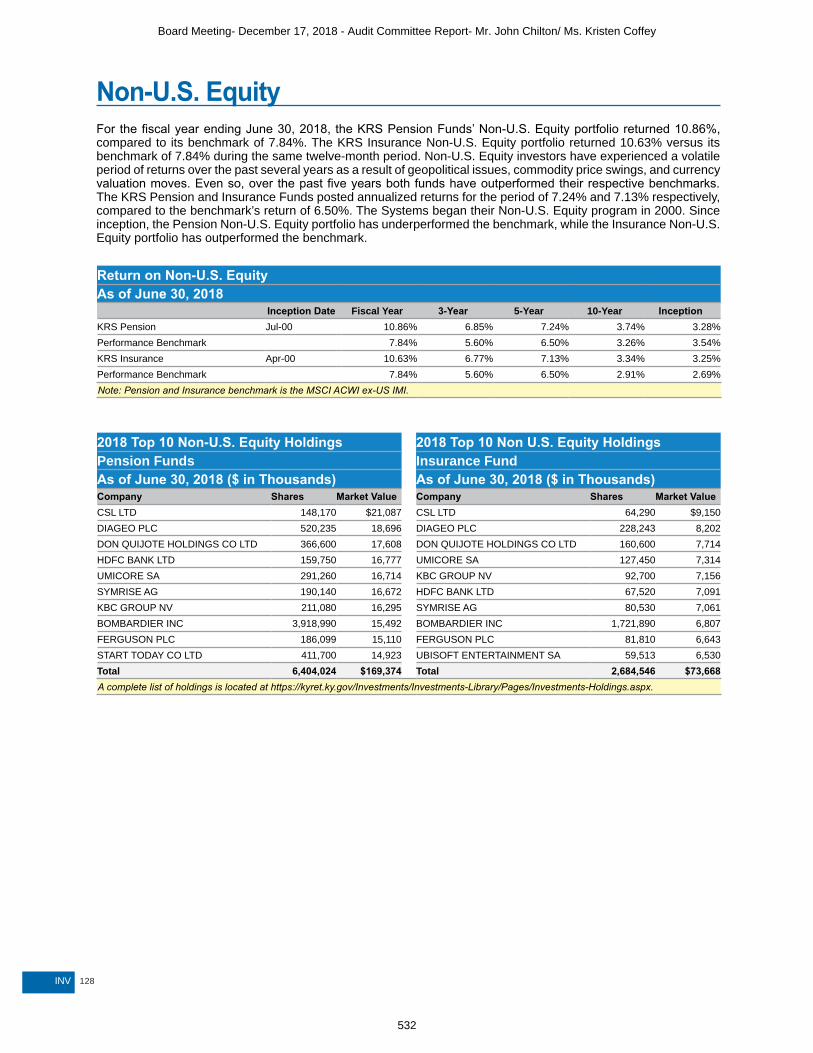
128INV
Non-U.S. EquityFor the fiscal year ending June 30, 2018, the KRS Pension Funds’ Non-U.S. Equity portfolio returned 10.86%, compared to its benchmark of 7.84%. The KRS Insurance Non-U.S. Equity portfolio returned 10.63% versus its benchmark of 7.84% during the same twelve-month period. Non-U.S. Equity investors have experienced a volatile period of returns over the past several years as a result of geopolitical issues, commodity price swings, and currency valuation moves. Even so, over the past five years both funds have outperformed their respective benchmarks. The KRS Pension and Insurance Funds posted annualized returns for the period of 7.24% and 7.13% respectively, compared to the benchmark’s return of 6.50%. The Systems began their Non-U.S. Equity program in 2000. Since inception, the Pension Non-U.S. Equity portfolio has underperformed the benchmark, while the Insurance Non-U.S. Equity portfolio has outperformed the benchmark.
Return on Non-U.S. EquityAs of June 30, 2018 Inception Date Fiscal Year 3-Year 5-Year 10-Year InceptionKRS Pension Jul-00 10.86% 6.85% 7.24% 3.74% 3.28%Performance Benchmark 7.84% 5.60% 6.50% 3.26% 3.54%KRS Insurance Apr-00 10.63% 6.77% 7.13% 3.34% 3.25%Performance Benchmark 7.84% 5.60% 6.50% 2.91% 2.69%Note: Pension and Insurance benchmark is the MSCI ACWI ex-US IMI.
2018 Top 10 Non-U.S. Equity Holdings 2018 Top 10 Non U.S. Equity HoldingsPension Funds Insurance FundAs of June 30, 2018 ($ in Thousands) As of June 30, 2018 ($ in Thousands)Company Shares Market Value Company Shares Market ValueCSL LTD 148,170 $21,087 CSL LTD 64,290 $9,150DIAGEO PLC 520,235 18,696 DIAGEO PLC 228,243 8,202DON QUIJOTE HOLDINGS CO LTD 366,600 17,608 DON QUIJOTE HOLDINGS CO LTD 160,600 7,714HDFC BANK LTD 159,750 16,777 UMICORE SA 127,450 7,314UMICORE SA 291,260 16,714 KBC GROUP NV 92,700 7,156SYMRISE AG 190,140 16,672 HDFC BANK LTD 67,520 7,091KBC GROUP NV 211,080 16,295 SYMRISE AG 80,530 7,061BOMBARDIER INC 3,918,990 15,492 BOMBARDIER INC 1,721,890 6,807FERGUSON PLC 186,099 15,110 FERGUSON PLC 81,810 6,643START TODAY CO LTD 411,700 14,923 UBISOFT ENTERTAINMENT SA 59,513 6,530Total 6,404,024 $169,374 Total 2,684,546 $73,668A complete list of holdings is located at https://kyret.ky.gov/Investments/Investments-Library/Pages/Investments-Holdings.aspx.
Board Meeting- December 17, 2018 - Audit Committee Report- Mr. John Chilton/ Ms. Kristen Coffey
532

129 INV
Fixed IncomeFor the fiscal year ending June 30, 2018, the KRS Pension Funds’ Fixed Income portfolio returned 1.41% versus the benchmark return of 1.17%. The KRS Insurance Fixed Income portfolio posted a 1.34% rate of return, which outperformed the index by 0.17%. Over the five-year period, the Pension Funds underperformed the benchmark while the Insurance Fund lagged behind the benchmark of 4.40%. Over the ten-year period, the Pension Funds outperformed the benchmark by 0.11% while the Insurance Fund has trailed the benchmark by 0.07%.
Return on Fixed IncomeAs of June 30, 2018 Portfolio Inception Date Fiscal Year 3-Year 5-Year 10-Year InceptionKRS Pension April-84 1.41% 4.22% 4.21% 4.90% 7.50%Performance Benchmark December-99 1.17% 5.08% 4.40% 4.79% 7.32%KRS Insurance July-92 1.34% 4.10% 3.78% 4.42% 6.32%Performance Benchmark December-99 1.17% 5.08% 4.40% 4.49% 6.30%Note: Pension and Insurance benchmark is Barclays Universal Index (Global) and Barclays U.S. High Yield (High Yield).
2018 Top 10 Fixed Income Holdings 2018 Top 10 Fixed Income HoldingsPension Funds Insurance FundAs of June 30, 2018 ($ in Thousands) As of June 30, 2018 ($ in Thousands)
IssuerPar Value/
Shares
Base Market Value Issuer
Par Value/Shares
Base Market Value
EB DV INT CRED BOND IDX FD 2,409 $881,383 MARATHON BLUEGRASS LP 436,642 $436,642INTERMEDIATE TERMCREDT BD INDX 9,156 493,981 EB DV INT CRED BOND IDX FD 971 355,255MARATHON BLUEGRASS LP 313,254 313,254 U S TREASURY NOTE 302,985 298,772U S TREASURY NOTE 215,210 212,215 INT TERM CREDIT BOND INDEX NL 5,945 218,217EB TEMP IVN FD 170,533 170,533 EB TEMP IVN FD 185,343 185,343CERBERUS KRS LEVERED LOAN OPP 85,666 85,666 U S TREASURY BOND 76,820 79,433H/2 CREDIT PARTNERS LP 85,337 85,337 COMMIT TO PUR FNMA SF MTG 47,865 39,968MESA WEST CORE LENDING FUND LP 58,547 58,547 CERBERUS KRS LEVERED LOAN OPP 36,714 36,714U S TREASURY BOND 54,630 56,457 COMMIT TO PUR GNMA II JUMBOS 43,134 35,831
COMMIT TO PUR FNMA SF MTG 42,177 39,968 MESA WEST CORE LENDING FUND LP 34,694 34,694
Total 1,036,919 $2,397,341 Total 1,171,113 $1,720,869Note: A complete list of holdings is located at https://kyret.ky.gov/Investments/Investments-Library/Pages/Investments-Holdings.aspx.
Board Meeting- December 17, 2018 - Audit Committee Report- Mr. John Chilton/ Ms. Kristen Coffey
533

130INV
Private EquityFor the fiscal year ending June 30, 2018, the KRS Pension Funds’ Private Equity portfolio posted a return of 14.5%. The portfolio consists primarily of investments within Private Equity limited partnerships. The Insurance Private Equity portfolio returned 18.3%. The Investment Committee determined that the short-term benchmark (1-, 3-, & 5-year) should match actual performance experienced by the portfolios because of the difficulty in assessing short-term returns. Performance is typically based on appraisals of a business’s value, so managers are often slow to mark valuations up or down. This can distort relative performance against a public market benchmark when that index moves dramatically. A better indication of the performance of the program would be the mid- to longer-term time periods because businesses have likely been sold and transacted at a true price (rather than estimate of value), which provides a better performance measurement. For the five years ending June 30, 2018, the Pension and Insurance Funds’ Private Equity portfolios returned 12.9% and 15.59%, respectively. For the ten-year period, the Pension Fund trailed its benchmark by 4.6%; the Insurance Fund underperformed by 1.8%. Since its inception in October 1990, the Pension portfolio has underperformed compared its benchmark by 0.14%, while the Insurance portfolio has underperformed compared to its benchmark since its July 2001 inception by 0.5%.
Return on Private EquityAs of June 30, 2018Portfolio Inception Date Fiscal Year 3-Year 5-Year 10-Year InceptionKRS Pension Oct-90 14.52% 10.84% 12.87% 8.80% 11.17%Performance Benchmark 14.52% 10.84% 12.87% 13.38% 11.31%KRS Insurance Jul-01 18.34% 13.85% 15.59% 11.02% 10.26%Performance Benchmark 18.34% 13.85% 15.59% 12.80% 10.73%Note: Pension and Insurance Benchmark 5 years and beyond is the Russell 3000 Lagged + 300bps. For shorter term periods, the benchmark matches actual performance experienced.
Real EstateFor the fiscal year ending June 30, 2018, the KRS Pension Funds’ Real Estate portfolio saw returns of 11.22%, exceeding its benchmark return of 7.11%. The KRS Insurance Real Estate portfolio also surpassed the benchmark, returning 11.14% compared to 7.11%. For the five years ending June 30, 2018, both the Pension and Insurance Fund portfolios underperformed the benchmarks return by 1.19%, respectively.
Return on Real EstateAs of June 30, 2018Portfolio Inception Date Fiscal Year 3-Year 5-Year 10-Year InceptionKRS Pension Jul-84 11.22% 10.09% 9.23% 8.34% 6.10%Performance Benchmark 7.11% 9.00% 10.42% 4.16% 6.46%KRS Insurance May-09 11.14% 10.44% 9.23% 9.22%Performance Benchmark 7.11% 9.00% 10.42% 5.98%Note: Pension and Insurance benchmark is NCREIF ODCE
Board Meeting- December 17, 2018 - Audit Committee Report- Mr. John Chilton/ Ms. Kristen Coffey
534

131 INV
Real ReturnFor the fiscal year ending June 30, 2018, the KRS Pension Funds’ Real Return portfolio returned 1.96% versus its benchmark return of 1.23%. The KRS Insurance Real Return portfolio posted a return of 1.87%, while the benchmark returned 1.33% for the period. Over the past three years, the Pension and Insurance Real Return portfolios have outperformed their respective benchmarks by 1.35% and 1.03%.
Return on Real ReturnAs of June 30, 2018 ($ in Thousands)Portfolio Inception Date Fiscal Year 3-Year 5-Year 10-Year InceptionKRS Pension Jul-11 1.96% 3.49% 3.01% 3.70%Performance Benchmark 1.23% 2.40% 1.72% 2.52%KRS Insurance Jul-11 1.87% 3.31% 2.84% 3.42%Performance Benchmark 1.33% 2.28% 1.83% 2.60%Note: Pension and Insurance benchmark is Custom - Allocation Specific.
Board Meeting- December 17, 2018 - Audit Committee Report- Mr. John Chilton/ Ms. Kristen Coffey
535

132INV
Absolute Return and Alternative AssetsFor the fiscal year ending June 30, 2018, the KRS Pension Funds’ Absolute Return portfolio was 5.52% versus its benchmark which was 5.39%. The KRS Insurance Absolute Return portfolio returned 5.54%, while the benchmark was 5.39% for the period. For the five years ending June 30, 2018, the Pension and Insurance portfolios outperformed their respective benchmarks. Since inception, the Pension and Insurance portfolio has outperformed the benchmark by 1.06% and .99%, respectively. The portfolio was comprised of three fund-of-funds and 26 direct investments. However, over the past few fiscal years the fund-of-funds have been transitioned into direct relationships. As of June 30, 2018, the portfolios consist of only direct relationships.
Return on Absolute ReturnAs of June 30, 2018 ($ in Thousands)Portfolio Inception Date Fiscal Year 3-Year 5-Year 10-Year InceptionKRS Pension Apr-10 5.52% 1.40% 3.59% 4.15%Performance Benchmark 5.39% 1.58% 3.15% 3.09%KRS Insurance Apr-10 5.54% 1.41% 3.59% 4.08%Performance Benchmark 5.39% 1.58% 3.15% 3.09%Note: Pension and Insurance benchmark is the HFRI Diversified FOF.
2018 Top 10 Alternative Assets Holdings 2018 Top 10 Alternative Assets HoldingsPension Funds Insurance FundAs of June 30, 2018 ($ in Thousands) As of June 30, 2018 ($ in Thousands)
IssuerSub Asset
ClassMarket Value Issuer
Sub Asset Class
Market Value
PRISMA CAPITAL ABS RET $383,946 PRISMA CAPITAL ABS RET $159,485PIMCO ALL ASSET FUND-INST REAL RET 346,428 PIMCO ALL ASSET FUND-INST REAL RET 141,217US TREAS-CPI INFLAT REAL RET 218,095 US TREAS-CPI INFLAT REAL RET 113,899BAY HILLS EMERGING PARTNERS PVT EQ 108,890 SECONDARY OPP FUND III LP PVT EQ 53,757STOCKBRIDGE FUND LP REAL EST 85,523 BAY HILLS EMERGING PARTNERS PVT EQ 44,279HARRISON STREET CORE PROPERTY REAL EST 79,865 KAYNE ANDERSON ENER FD VII LP PVT EQ 42,664PROLOGIS TARGETED US LOGISTICS REAL EST 74,227
BLACKSTONE CAPITAL PARTNERS VI PVT EQ 39,538
HORSLEY BRIDGE INTERNATIONAL V PVT EQ 64,094 STOCKBRIDGE FUND LP REAL EST 36,950BLACKSTONE CAPITAL PARTNERS VI PVT EQ 59,307
HARRISON STREET CORE PROPERTY REAL EST 34,664
BAY HILLS EMERGING PTNRS II-B PVT EQ 55,855 PROLOGIS TARGETED US LOGISTICS REAL EST 29,396
Total $1,476,230 Total $695,849A complete list of holdings is located at https://kyret.ky.gov/Investments/Investments-Library/Pages/Investments-Holdings.aspx.
Board Meeting- December 17, 2018 - Audit Committee Report- Mr. John Chilton/ Ms. Kristen Coffey
536

133 INV
CashFor the fiscal year ending June 30, 2018, the KRS Pension Funds’ Cash portfolio returned 1.90%, outpacing its benchmark, the Citi-Group 3-month Treasury, by 0.57%. The KRS Insurance Cash portfolio also outperformed the index, posting a return of 1.57% during the same 12-month period. As the accompanying table indicates, the longer-term results from the Cash portfolios have performed well compared to their benchmark. For the five years ending June 30, 2018, the Pension Fund’s portfolio has outperformed its custom benchmark by 0.57% on an annualized basis. Since its inception, the portfolio has exceeded its benchmark by 0.45% per year. The Insurance portfolio has also done very well, exceeding its benchmark return over the five-year and since inception periods by 0.20% and 0.13%, respectively.
Return on CashAs of June 30, 2018Portfolio Inception Date Fiscal Year 3-Year 5-Year 10-Year InceptionKRS Pension Jan-88 1.90% 1.12% 0.82% 0.77% 3.59%Performance Benchmark 1.33% 0.64% 0.39% 0.31% 3.14%KRS Insurance Jul-92 1.57% 0.83% 0.59% 0.49% 2.64%Performance Benchmark 1.33% 0.64% 0.39% 0.31% 2.51%Note: Pension and Insurance benchmark is the Citi Group 3-month Treasury.
Board Meeting- December 17, 2018 - Audit Committee Report- Mr. John Chilton/ Ms. Kristen Coffey
537

134INV
Additional SchedulesIn the following pages are additional schedules which include the assets under management for each firm the Systems employs, external investment-related expenses, commissions paid, and portfolio summaries for each of the five Pension and Insurance plans for the fiscal year ending June 30, 2018. This section is followed by a letter from KRS’ investment consultants.
Investment Advisors & Assets Under ManagementAs of June 30, 2018 ($ in Thousands)Advisor Assets Under ManagementAmerican Century Investments $507,417AMERRA Capital Management 101,506Anchorage Capital 39,045Arbor Investments 4,711Arcano Capital 35,501ARES Capital 19,819Arrowmark 17,600Bay Hills Emerging Partners 240,493Black Diamond Capital Management 45,513BlackRock ACWI Ex-US 1,509,949Blackstone Capital Partners 114,946Boston Company 888BNY IG Credit Unit 1,236,638BNY Mellon Accruals (544)BSP Private Credit 44,425BTG Pactual 25,111Cash Accounts 595,341Cerberus 122,380CM Growth Capital Partners 11,780Coatue 30,140Columbia Asset Management 295,336Columbia Capital 4,542Credit Suisse 43,899Crestview Partners 78,708CVC Capital Partners 34,624DAG Ventures 127,917Davidson-Kempner 68,380DB Secondary Opportunities 71,676DCM 14,731DivcoWest 6,166DSAM Capital Partners 410Essex Woodland 15,722Franklin Templeton 382,730Fundamental Partners 48,056Gotham Neutral Strategies 19,013
Board Meeting- December 17, 2018 - Audit Committee Report- Mr. John Chilton/ Ms. Kristen Coffey
538
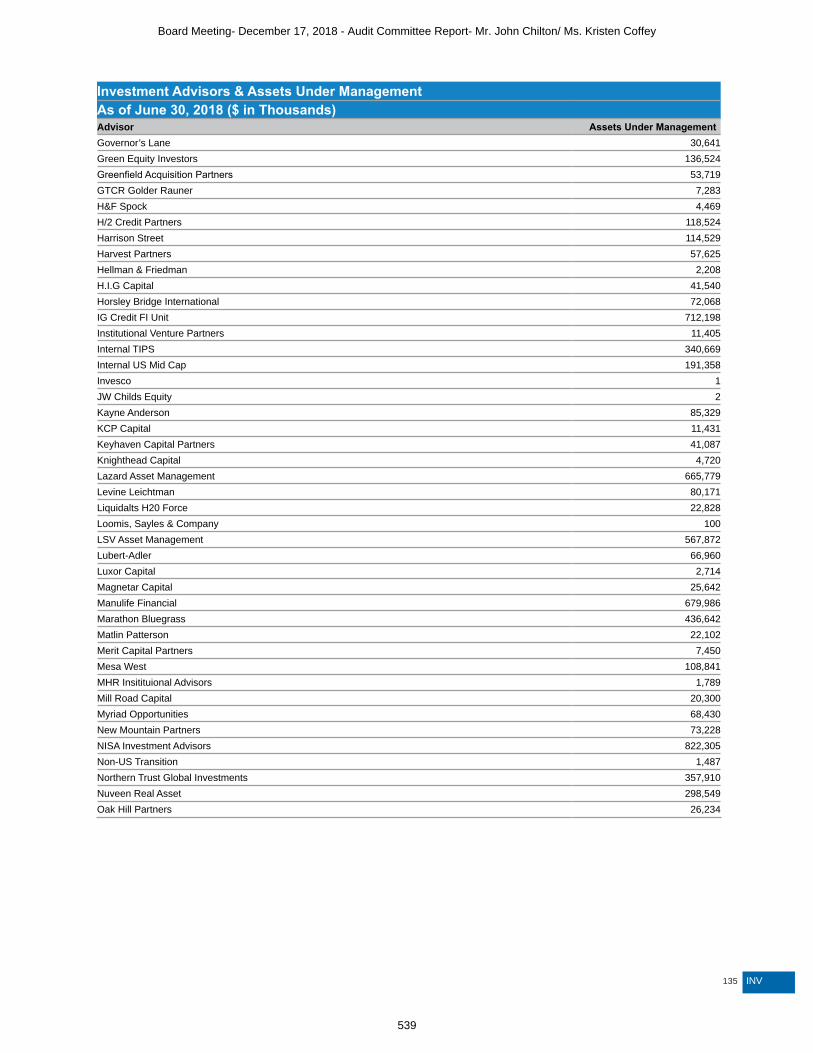
135 INV
Investment Advisors & Assets Under ManagementAs of June 30, 2018 ($ in Thousands)Advisor Assets Under ManagementGovernor’s Lane 30,641Green Equity Investors 136,524Greenfield Acquisition Partners 53,719GTCR Golder Rauner 7,283H&F Spock 4,469H/2 Credit Partners 118,524Harrison Street 114,529Harvest Partners 57,625Hellman & Friedman 2,208H.I.G Capital 41,540Horsley Bridge International 72,068IG Credit FI Unit 712,198Institutional Venture Partners 11,405Internal TIPS 340,669Internal US Mid Cap 191,358Invesco 1JW Childs Equity 2Kayne Anderson 85,329KCP Capital 11,431Keyhaven Capital Partners 41,087Knighthead Capital 4,720Lazard Asset Management 665,779Levine Leichtman 80,171Liquidalts H20 Force 22,828Loomis, Sayles & Company 100LSV Asset Management 567,872Lubert-Adler 66,960Luxor Capital 2,714Magnetar Capital 25,642Manulife Financial 679,986Marathon Bluegrass 436,642Matlin Patterson 22,102Merit Capital Partners 7,450Mesa West 108,841MHR Insitituional Advisors 1,789Mill Road Capital 20,300Myriad Opportunities 68,430New Mountain Partners 73,228NISA Investment Advisors 822,305Non-US Transition 1,487Northern Trust Global Investments 357,910Nuveen Real Asset 298,549Oak Hill Partners 26,234
Board Meeting- December 17, 2018 - Audit Committee Report- Mr. John Chilton/ Ms. Kristen Coffey
539
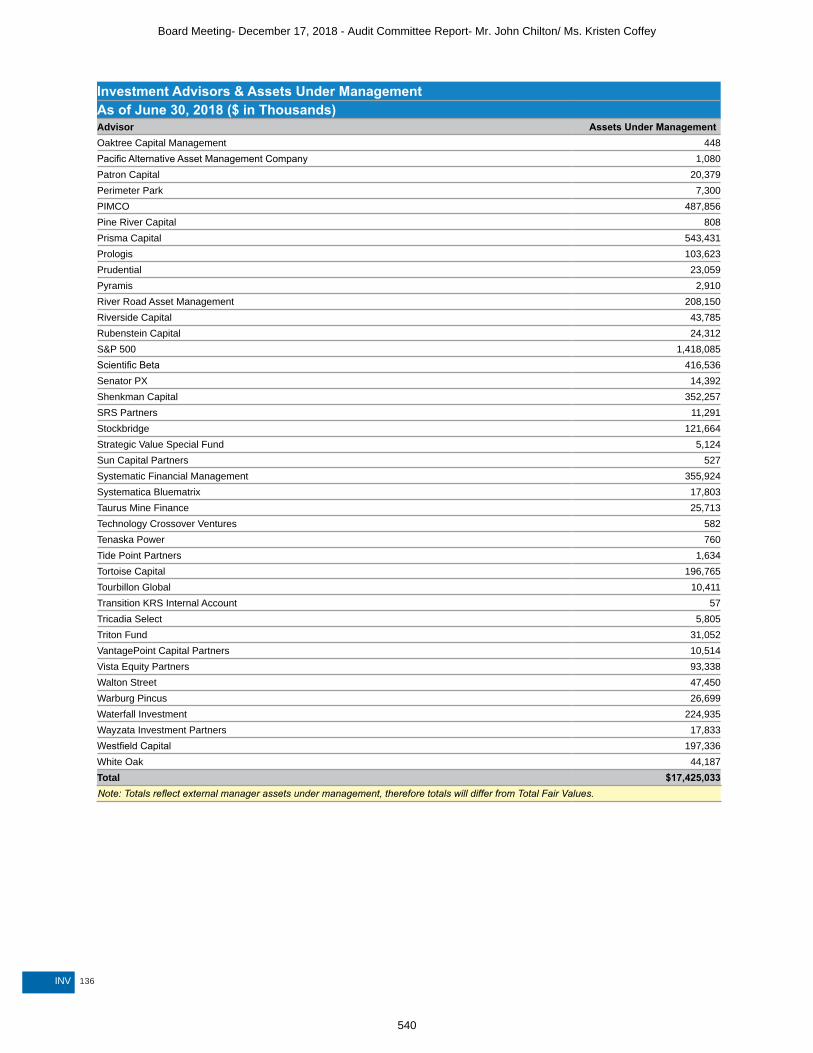
136INV
Investment Advisors & Assets Under ManagementAs of June 30, 2018 ($ in Thousands)Advisor Assets Under ManagementOaktree Capital Management 448Pacific Alternative Asset Management Company 1,080Patron Capital 20,379Perimeter Park 7,300PIMCO 487,856Pine River Capital 808Prisma Capital 543,431Prologis 103,623Prudential 23,059Pyramis 2,910River Road Asset Management 208,150Riverside Capital 43,785Rubenstein Capital 24,312S&P 500 1,418,085Scientific Beta 416,536Senator PX 14,392Shenkman Capital 352,257SRS Partners 11,291Stockbridge 121,664Strategic Value Special Fund 5,124Sun Capital Partners 527Systematic Financial Management 355,924Systematica Bluematrix 17,803Taurus Mine Finance 25,713Technology Crossover Ventures 582Tenaska Power 760Tide Point Partners 1,634Tortoise Capital 196,765Tourbillon Global 10,411Transition KRS Internal Account 57Tricadia Select 5,805Triton Fund 31,052VantagePoint Capital Partners 10,514Vista Equity Partners 93,338Walton Street 47,450Warburg Pincus 26,699Waterfall Investment 224,935Wayzata Investment Partners 17,833Westfield Capital 197,336White Oak 44,187Total $17,425,033Note: Totals reflect external manager assets under management, therefore totals will differ from Total Fair Values.
Board Meeting- December 17, 2018 - Audit Committee Report- Mr. John Chilton/ Ms. Kristen Coffey
540

137 INV
External Investment Expense - Pension Funds Asset Class/Type BreakdownAs of June 30, 2018 ($ in Thousands)
US PublicNon US Equity
Fixed Income
Real Return
Private Equity
Real Estate
Absolute Return Cash Total
Fee for Long Balance $- $11 $1 $0 $1 $0 $- $- $13Lending Fee Rebate 3,484 147 1,126 (45) 0 0 0 0 4,712Investment Advisory Fees 2,604 7,843 13,677 5,511 8,785 5,211 6,646 0 50,277Performance/Incentive Fees 0 0 0 662 22,328 2,618 6,442 0 32,050Stock Loan Fees 174 94 72 105 0 0 0 0 445Taxes and Insurance 0 32 7 12 119 0 0 0 170Administration 195 0 105 0 0 0 0 702 1,002Miscellaneous 10 15 30 700 3,900 1,724 0 0 6,379Commission on Future Contracts 2 0 19 1 0 0 0 0 22Consultant Fees 0 0 0 0 0 0 0 1,385 1,385Custodial Fees 0 0 0 0 0 0 0 1,299 1,299 $6,469 $8,143 $15,037 $6,946 $35,133 $9,553 $13,088 $3,386 $97,754
External Investment Expense - Insurance Fund Asset Class/Type BreakdownAs of June 30, 2018 ($ in Thousands)
US PublicNon US Equity
Fixed Income
Real Return
Private Equity
Real Estate
Absolute Return Cash Total
Fee for Long Balance $- $3 $- $0 $0 $0 $- $- $3Lending Fee Rebate 1,528 45 292 (52) 0 0 0 0 1,813Investment Advisory Fees 1,149 3,395 4,571 1,692 5,034 2,194 2,642 0 20,677Performance/Incentive Fees 0 0 524 924 13,259 1,074 2,727 0 18,508Stock Loan Fees 75 53 21 51 0 0 0 0 200Administration 85 0 45 0 0 0 0 251 381Miscellaneous 4 3 15 319 1,766 2,739 0 0 4,846Taxes and Insurance 0 20 3 4 53 0 0 0 80Commission on Future Contracts 1 0 7 1 0 0 0 0 9Consultant Fees 0 0 0 0 0 0 0 569 569Custodial Fees 0 0 0 0 0 0 0 846 846 $2,842 $3,519 $5,477 $2,939 $20,112 $6,007 $5,369 $1,666 $47,931The Governmental Accounting Standards Board recognizes that it may not be possible or cost-beneficial to separate certain investment expenses from either the related investment income or the general administrative expenses of the plan. KRS has displayed all investment related fees and expenses identifiable and captured by our custodial bank, BNY Mellon and KRS staff.
Board Meeting- December 17, 2018 - Audit Committee Report- Mr. John Chilton/ Ms. Kristen Coffey
541
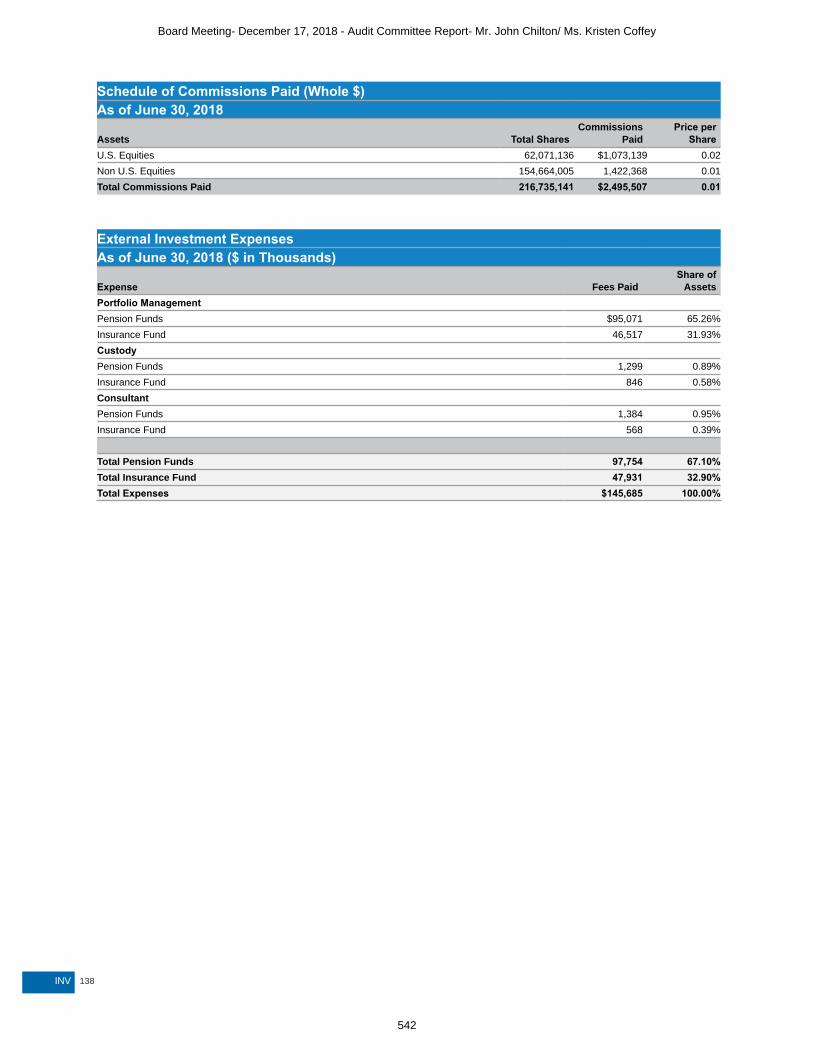
138INV
Schedule of Commissions Paid (Whole $)As of June 30, 2018
Assets Total SharesCommissions
PaidPrice per
ShareU.S. Equities 62,071,136 $1,073,139 0.02Non U.S. Equities 154,664,005 1,422,368 0.01Total Commissions Paid 216,735,141 $2,495,507 0.01
External Investment ExpensesAs of June 30, 2018 ($ in Thousands)
Expense Fees PaidShare of
AssetsPortfolio Management Pension Funds $95,071 65.26%Insurance Fund 46,517 31.93%Custody Pension Funds 1,299 0.89%Insurance Fund 846 0.58%Consultant Pension Funds 1,384 0.95%Insurance Fund 568 0.39% Total Pension Funds 97,754 67.10%Total Insurance Fund 47,931 32.90%Total Expenses $145,685 100.00%
Board Meeting- December 17, 2018 - Audit Committee Report- Mr. John Chilton/ Ms. Kristen Coffey
542

139 INV
Fair Values By Plan - PensionAs of June 30, 2018 ($ in Thousands)
KERS Non-Hazardous KERS-Hazardous
CERS Non-Hazardous CERS-Hazardous
Fair Value
(FV)% of Total
FVFair Value
(FV)% of Total
FVFair Value
(FV)% of Total
FVFair Value
(FV)% of Total
FVAssets Public Equity $662,793 33.02% $255,197 39.39% $2,779,070 39.51% $928,262 39.57%
US Equity 291,301 14.51% 115,515 17.83% 1,256,887 17.87% 419,500 17.88%Non-US Equity 371,492 18.51% 139,682 21.56% 1,522,183 21.64% 508,762 21.69%
Fixed Income 657,491 32.76% 196,561 30.34% 2,082,039 29.60% 688,636 29.35%Global 388,611 19.36% 131,051 20.23% 1,404,015 19.96% 465,903 19.86%Credit 268,880 13.40% 65,510 10.11% 678,024 9.64% 222,733 9.49%
Real Return 160,946 8.02% 55,243 8.53% 610,523 8.68% 208,298 8.88%Private Equity 238,186 11.87% 62,097 9.58% 666,110 9.47% 227,250 9.69%Real Estate 67,252 3.35% 24,002 3.70% 253,421 3.60% 81,299 3.47%Absolute Return 126,119 6.28% 33,733 5.21% 401,279 5.71% 127,289 5.43%Cash 94,215 4.69% 21,085 3.25% 241,212 3.43% 84,900 3.62%TOTAL PORTFOLIO $2,007,002 100.00% $647,918 100.00% $7,033,654 100.00% $2,345,934 100.00%
Insurance
KERS Non-Hazardous KERS-Hazardous
CERS Non-Hazardous CERS-Hazardous
Fair Value
(FV)% of Total
FVFair Value
(FV)% of Total
FVFair Value
(FV)% of Total
FVFair Value
(FV)% of Total
FVAssets Public Equity $370,754 44.43% $202,614 39.52% $921,576 39.50% $499,380 39.51%
US Equity 170,728 20.46% 91,675 17.88% 417,048 17.87% 225,953 17.88%Non-US Equity 200,026 23.97% 110,939 21.64% 504,528 21.62% 273,427 21.63%
Fixed Income 253,315 30.36% 153,483 29.94% 665,283 28.51% 357,662 28.30%Global 155,662 18.66% 104,229 20.33% 455,325 19.51% 246,995 19.54%Credit 97,653 11.70% 49,254 9.61% 209,958 9.00% 110,667 8.76%
Real Return 72,913 8.74% 43,055 8.40% 206,949 8.87% 107,545 8.51%Private Equity 44,753 5.36% 49,164 9.59% 263,477 11.29% 148,301 11.73%Real Estate 25,726 3.08% 18,847 3.68% 81,827 3.51% 44,780 3.54%Absolute Return 45,137 5.41% 29,906 5.83% 128,067 5.49% 71,684 5.67%Cash 21,787 2.61% 15,628 3.05% 66,195 2.84% 34,676 2.74%TOTAL PORTFOLIO $834,385 100.00% $512,697 100.00% $2,333,374 100.00% $1,264,028 100.00%
Board Meeting- December 17, 2018 - Audit Committee Report- Mr. John Chilton/ Ms. Kristen Coffey
543

140INV
Fair Values By Plan - PensionAs of June 30, 2018 ($ in Thousands)
SPRS Total Fair Value (FV) % of Total FV Fair Value (FV) % of Total FV
Assets Public Equity $88,989 34.63% $4,714,311 38.35%
US Equity 39,919 15.53% 2,123,122 17.27%Non-US Equity 49,070 19.10% 2,591,189 21.08%
Fixed Income 89,941 35.00% 3,714,668 30.22%Global 62,565 24.35% 2,452,145 19.95%Credit 27,376 10.65% 1,262,523 10.27%
Real Return 22,007 8.56% 1,057,017 8.60%Private Equity 20,821 8.10% 1,214,464 9.88%Real Estate 9,815 3.82% 435,789 3.55%Absolute Return 13,285 5.17% 701,705 5.71%Cash 12,108 4.71% 453,520 3.69%TOTAL PORTFOLIO $256,966 100.00% $12,291,474 100.00%
Insurance SPRS INS Total Fair Value (FV) % of Total FV Fair Value (FV) % of Total FV
Assets Public Equity $75,755 40.07% $2,070,079 40.32%
US Equity 34,490 18.24% $939,894 18.31%Non-US Equity 41,265 21.82% $1,130,185 22.01%
Fixed Income 54,553 28.85% $1,484,296 28.91%Global 37,081 19.61% $999,292 19.46%Credit 17,472 9.24% $485,004 9.44%
Real Return 14,880 7.87% $445,342 8.68%Private Equity 22,499 11.90% $528,194 10.29%Real Estate 7,189 3.80% $178,369 3.47%Absolute Return 11,209 5.93% $286,003 5.57%Cash 2,990 1.58% $141,276 2.76%TOTAL PORTFOLIO $189,075 100.00% $5,133,559 100.00%
Board Meeting- December 17, 2018 - Audit Committee Report- Mr. John Chilton/ Ms. Kristen Coffey
544

141 INV
Letters from InvestmentConsultantsCONSULTANTS
Master Custodian & Performance MeasurementBankofNewYorkMellon,NewYork,NewYork
Investment ConsultantsORGRealProperty,Cleveland,OhioWilshire Consultants, Pittsburgh, Pennsylvania
Industry-leadingExternal
Consultants
Board Meeting- December 17, 2018 - Audit Committee Report- Mr. John Chilton/ Ms. Kristen Coffey
545

142INV
Board Meeting- December 17, 2018 - Audit Committee Report- Mr. John Chilton/ Ms. Kristen Coffey
546

143 INV
Board Meeting- December 17, 2018 - Audit Committee Report- Mr. John Chilton/ Ms. Kristen Coffey
547
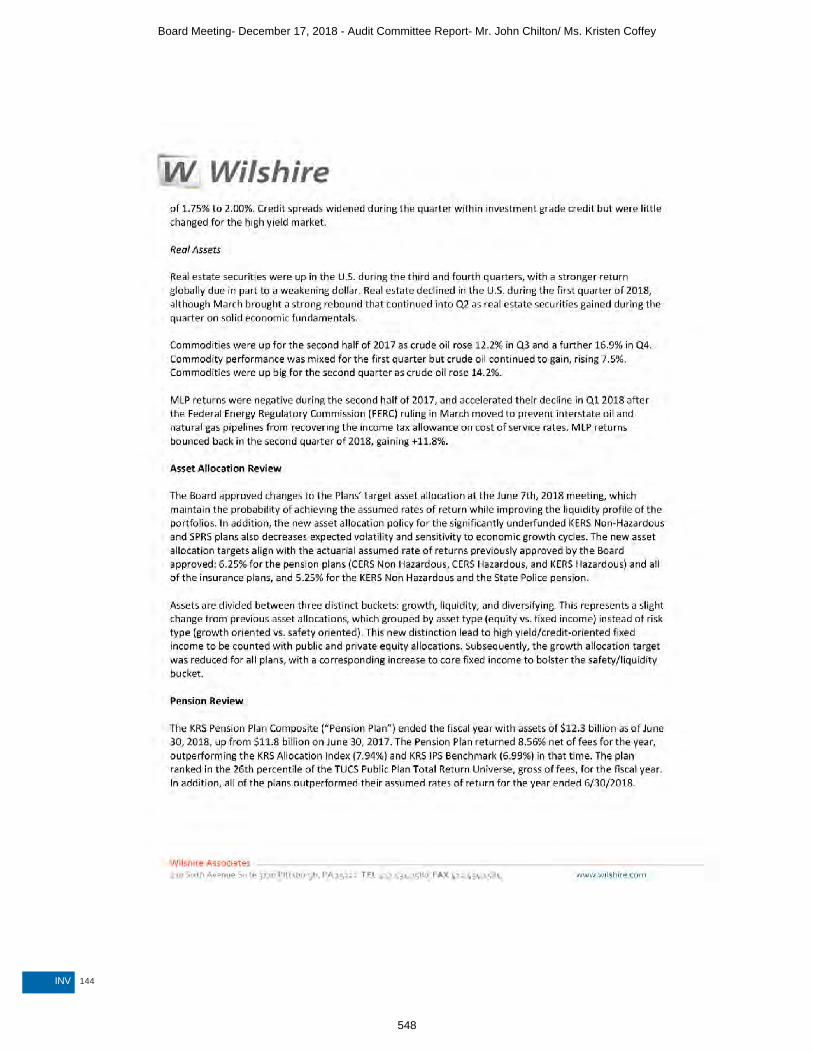
144INV
Board Meeting- December 17, 2018 - Audit Committee Report- Mr. John Chilton/ Ms. Kristen Coffey
548

145 INV
Board Meeting- December 17, 2018 - Audit Committee Report- Mr. John Chilton/ Ms. Kristen Coffey
549

146INV
Board Meeting- December 17, 2018 - Audit Committee Report- Mr. John Chilton/ Ms. Kristen Coffey
550

147 INV
Board Meeting- December 17, 2018 - Audit Committee Report- Mr. John Chilton/ Ms. Kristen Coffey
551
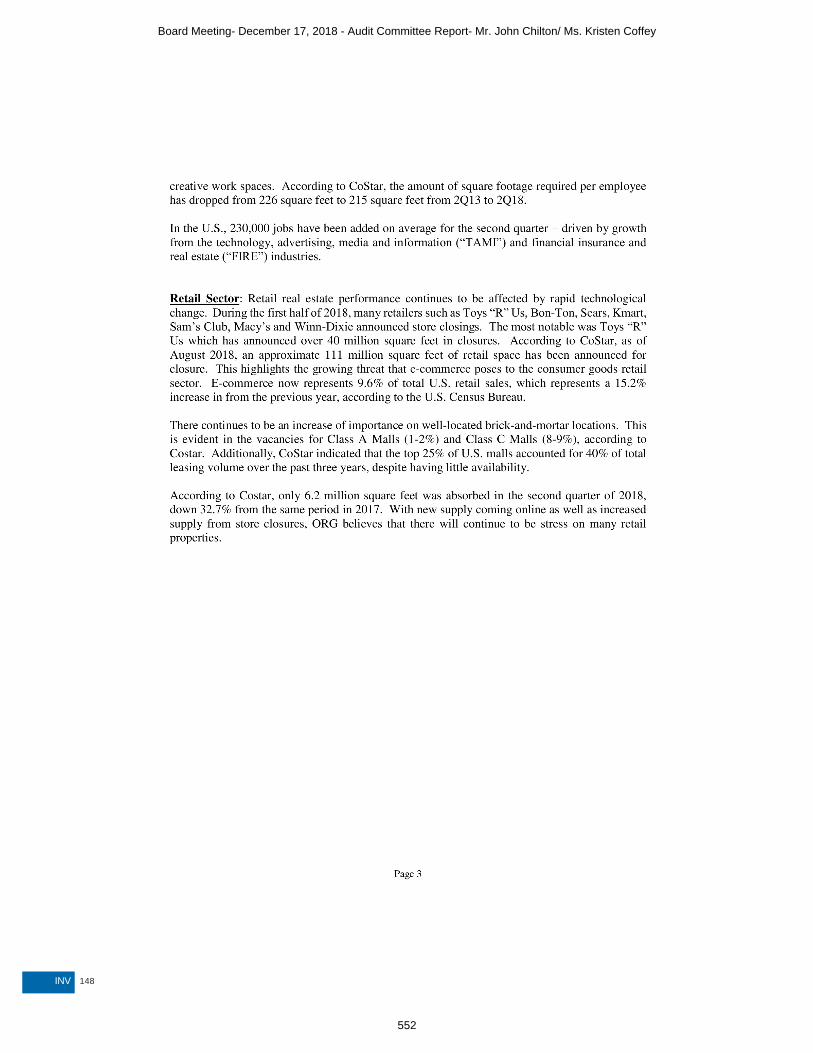
148INV
Board Meeting- December 17, 2018 - Audit Committee Report- Mr. John Chilton/ Ms. Kristen Coffey
552
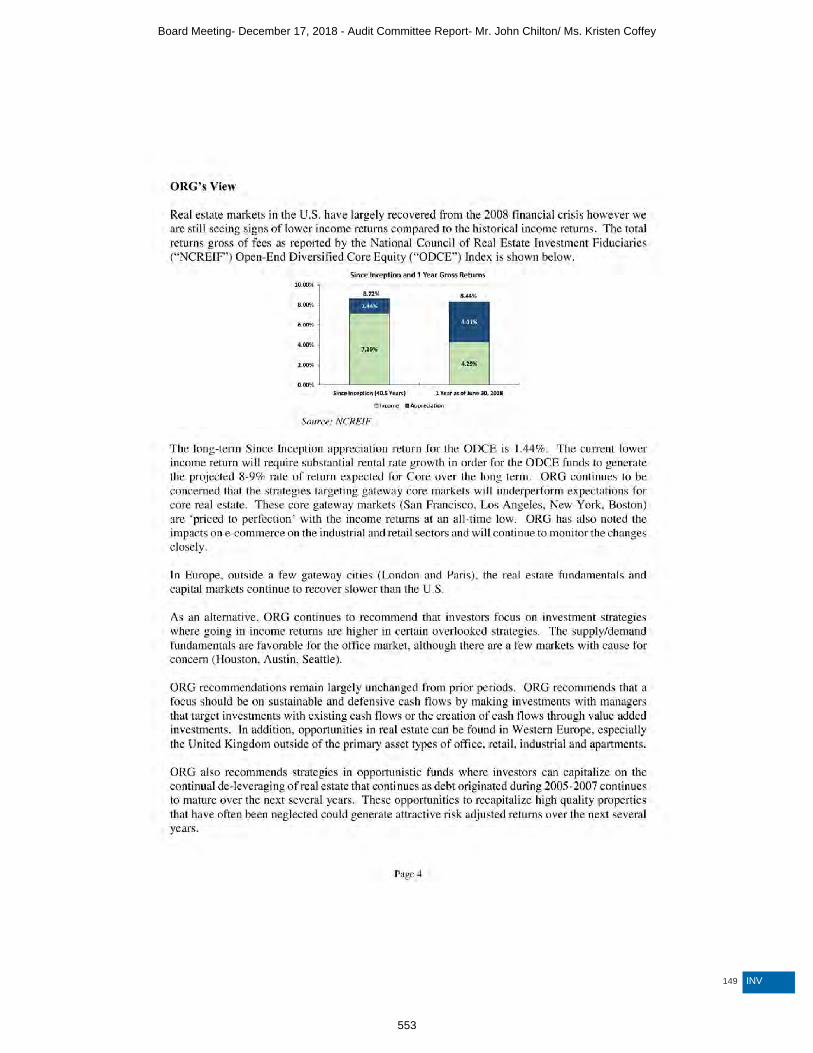
149 INV
Board Meeting- December 17, 2018 - Audit Committee Report- Mr. John Chilton/ Ms. Kristen Coffey
553
150INV
Board Meeting- December 17, 2018 - Audit Committee Report- Mr. John Chilton/ Ms. Kristen Coffey
554

151 INV
Board Meeting- December 17, 2018 - Audit Committee Report- Mr. John Chilton/ Ms. Kristen Coffey
555

152INV
Board Meeting- December 17, 2018 - Audit Committee Report- Mr. John Chilton/ Ms. Kristen Coffey
556

153 INV
Board Meeting- December 17, 2018 - Audit Committee Report- Mr. John Chilton/ Ms. Kristen Coffey
557
ACTUARIAL TABLE OF CONTENTS
154154
155 CERTIFICATION OF ACTUARIAL RESULTS158 SUMMARY OF ACTUARIAL ASSUMPTIONS162 SUMMARY OF ACTUARIAL VALUATION RESULTS163 RECOMMENDED EMPLOYER CONTRIBUTION RATES166 SUMMARY OF ACTUARIAL UNFUNDED LIABILITIES170 SOLVENCY TEST174 ACTIVE MEMBER VALUATION178 SUMMARY OF BENEFIT PROVISIONS KERS & CERS NON-
HAZARDOUS PLANS180 KERS & CERS HAZARDOUS, SPRS PLANS183 TIER 3
Board Meeting- December 17, 2018 - Audit Committee Report- Mr. John Chilton/ Ms. Kristen Coffey
558

155 ACT
Certification of Actuarial ResultsRe: Certification for the Actuarial Results as of June 30, 2018. Dear Board of Trustees: Actuarial valuations are prepared annually as of June 30, for the Kentucky Employees Retirement System (KERS), the County Employees Retirement System (CERS), and the State Police Retirement System (SPRS). These reports describe the current actuarial condition of the Kentucky Retirement Systems (KRS) and document the calculated employer contribution rates as well as the changes in the financial condition since the prior actuarial valuation.Under state statute, the Board of Trustees must approve the employer contribution rates determined by each actuarial valuation. The contribution rates are determined actuarially based upon the membership, plan assets, assumptions, and funding policies adopted by the KRS Board. The June 30, 2017 actuarial valuation was used by the Board of Trustees to certify the KERS and SPRS employer contribution rates for the biennial period beginning July 1, 2018 and ending June 30, 2020. The Board of Trustees uses this actuarial valuation (as of June 30, 2018) to certify the employer contribution rates for CERS for the fiscal year beginning July 1, 2019 and ending June 30, 2020. FINANCING OBJECTIVES AND FUNDING POLICYFor each retirement system, KRS administers both a pension and insurance fund to provide for monthly retirement allowances and retiree health insurance benefits respectively. The total employer contribution rate is comprised of a contribution to each respective fund.The contribution rate for each fund consists of a normal cost rate (which pays the current year’s cost) and an amortization rate to finance the existing unfunded actuarial accrued liability (UAAL). In accordance with state statute, the amortization period is a closed 30-year funding period beginning with the June 30, 2013 actuarial valuation, which results in the use of a closed 25-year funding period for use in the calculation of the contribution rates for the June 30, 2018 actuarial valuation. Absent changes in benefits, assumptions, or material liability or investment gains or losses, the total contribution rate for the funds are expected to remain stable, as a percentage of payroll, in future years.If new legislation is enacted between the valuation date and the date the contribution rates become effective, the Board may adjust the calculated rates before certifying them, in order to reflect this new legislation. Such adjustments are based on information supplied by the actuary.PROGRESS TOWARD REALIZATION OF FINANCING OBJECTIVESThe funded ratio (the ratio of the actuarial value of assets to the actuarial accrued liability) is a standard measure of a plan’s funded status. In the absence of benefit improvements, assumption changes, or actuarial losses, it should increase over time, until it reaches at least 100%. As of June 30, 2018, the funded ratios for the pension and health insurance funds are as follows:
Funding Level 2018 2017 2016System Pension Fund Insurance Fund Pension Fund Insurance Fund Pension Fund Insurance FundKERS Non-Hazardous 12.9% 36.4% 13.6% 30.7% 16.0% 30.3%KERS Hazardous 55.5% 130.0% 54.1% 117.6% 59.7% 125.3%CERS Non-Hazardous 52.7% 76.7% 52.8% 66.4% 59.0% 69.6%CERS Hazardous 48.4% 74.6% 48.1% 66.9% 57.7% 72.9%SPRS 27.1% 71.6% 27.0% 65.2% 30.3% 67.2%
Board Meeting- December 17, 2018 - Audit Committee Report- Mr. John Chilton/ Ms. Kristen Coffey
559

156ACT
ASSUMPTIONS AND METHODSThe Board of Trustees, in consultation with the actuary, sets the actuarial assumptions and methods used in the actuarial valuation. At any time, the Board may adopt updated assumptions for use in an actuarial valuation. There has been no change in assumptions since the prior actuarial valuation.In our opinion, all the assumptions and methods adopted by the Board Trustees satisfy the requirements in the Actuarial Standards of Practice that are applicable for actuarial valuations of public retirement systems. The Board plans to have the next experience study conducted using the plan’s experience for the five-year period ending June 30, 2018. The actuarial assumptions that result from that experience study will be first used to prepare the June 30, 2019 actuarial valuation.It is our opinion that the actuarial assumptions used to perform this valuation are internally consistent and reasonably reflect the anticipated future experience of the System. The results of the actuarial valuation are dependent on the actuarial assumptions used. Actual results can, and almost certainly will, differ as actual experience deviates from the assumptions. Even seemingly minor changes in the assumptions can materially change the liabilities, calculated contribution rate, and funding periods. The actuarial calculations are intended to provide information for rational decision making.The benefit structure is outlined in this section of the annual report. GRS prepared the following schedules in the actuarial section: Summary of Actuarial Valuation Results, Recommended Employer Contribution Rates, Summary of Actuarial Unfunded Liabilities, the Solvency Test, the Summary of Active Member Valuation Data, the Summary of Retired Member Valuation Data, Summary of the Assumptions and Methods, and the Summary of the Benefit Provisions.In addition, GRS prepared the following schedules in the financial section in accordance with GASB Statement No. 67: Net Pension Liability Schedule, Discount Rate Sensitivity Analysis, Schedule of Changes in the Employers’ Net Pension Liability, Schedule of Employers’ Net Pension Liability, and the Schedule of Employers’ Contributions.
DATAMember data for retired, active and inactive members was supplied as of June 30, 2018, by the KRS staff. The staff also supplied asset information as of June 30, 2018. We did not audit this data, but we did apply a number of tests to the data, and we concluded that it was reasonable and consistent with the prior year’s data. GRS is not responsible for the accuracy or completeness of the information provided to us by the Systems.
CERTIFICATIONWe certify that the information presented herein is accurate and fairly portrays the actuarial position of the Retirement Systems as of June 30, 2018. All of our work conforms with generally accepted actuarial principles and practices, and in conformity with the Actuarial Standards of Practice issued by the Actuarial Standards Board. In our opinion, our calculations also comply with the requirements of Kentucky Code of Laws and, where applicable, the Internal Revenue Code, ERISA, and the Statements of the Governmental Accounting Standards Board.The undersigned are independent actuaries and consultants. Mr. Newton and Mr. White are Enrolled Actuaries. All three of the undersigned are Members of the American Academy of Actuaries and meet the Qualification Standards of the American Academy of Actuaries. All are experienced in performing valuations for large public retirement systems.Sincerely,
Board Meeting- December 17, 2018 - Audit Committee Report- Mr. John Chilton/ Ms. Kristen Coffey
560

157 ACT
Sincerely,Gabriel, Roeder, Smith & Co.
Joseph P. Newton, FSA, MAAA, EASenior Consultant
Daniel J. White, FSA, MAAA, EASenior Consultant
Janie Shaw, ASA, MAAAConsultant
Board Meeting- December 17, 2018 - Audit Committee Report- Mr. John Chilton/ Ms. Kristen Coffey
561

158ACT
Summary of Actuarial AssumptionsThe results of the actuarial valuation are based upon the assumptions and funding policies adopted by the Board and statutory funding requirements. Assumptions and funding policies are reviewed against actual plan experience at least once every five years through the completion of the Actuarial Experience Study. In general, the assumptions and methods used in the June 30, 2018 valuation are based on the most recent actuarial experience study for the five-year period ending June 30, 2013, submitted April 30, 2014, and adopted by the Board on December 4, 2014. The investment return, price inflation, and payroll growth assumption were adopted by the Board in May and July 2017 for use with the June 30, 2017 valuation in order to reflect future economic expectations. 1. Actuarial Cost Method: The actuarial valuation was prepared using the entry age normal cost (EANC) method as required by state statute. Under this method, the present value of future benefits is determined for each member and allocated equitably as a level percentage of payroll from the member’s entry age into the plan to the assumed age of exit from the plan. The portion of the present value of future benefits allocated to the current valuation year is called the normal cost. The portion of the present value of future benefits allocated to prior years of service is called the actuarial accrued liability. The unfunded actuarial accrued liability represents the difference between the actuarial accrued liability and the actuarial value of assets as of the valuation date. Relative to the Pension funds and the Insurance Fund, an employer contribution rate has been established to be equal to the sum of the normal cost and the amount needed to amortize the unfunded actuarial accrued liability (UAAL). 2. UAAL Amortization Method: Effective for the June 30, 2017 valuation, the amortization of any unfunded actuarial accrued liability is established using a level percent of pay amortization method and a 0.00% payroll growth assumption for the KERS and SPRS Retirement Systems and a 2.00% payroll growth assumption for the CERS Retirement System. The amortization period was reestablished as a closed 30-year period beginning with the June 30, 2013 actuarial valuation. The amortization period will decrease by one each year in the future and there are 25 years remaining as of June 30, 2018. 3. Asset Valuation Method: The actuarial value of assets recognizes a portion of the difference between the market value of assets and the expected market value of assets, based on the investment return assumption. The amount recognized each year is 20% of the difference between market value and expected market value. 4. Retiree Insurance Funding Policy: Effective for the June 30, 2017 valuation, the amortization of any unfunded actuarial accrued liability is established using a level percent of pay amortization method and a 0.00% payroll growth assumption for the KERS and SPRS Retirement Systems and a 2.00% payroll growth assumption for the CERS Retirement System. The amortization period was reestablished as a closed 30-year period beginning with the June 30, 2013 actuarial valuation. The amortization period will decrease by one each year in the future and there are 25 years remaining as of June 30, 2018. 5. Investment Return Assumption: The future investment earnings of plan assets are assumed to accumulate at a rate of 6.25% per annum for the CERS Non-Hazardous Retirement System, the CERS Hazardous Retirement System, the KERS Hazardous Retirement System, and all Insurance Systems. This rate consists of a 2.30% price inflation component and a 3.95% real rate of return component. The assumed rate of return for the KERS Non-Hazardous Retirement System and the State Police Retirement System is 5.25% and consists of a 2.30% inflationary component and a 2.95% real rate of return component. 6. Salary Increase Assumptions: Active member salaries are assumed to increase at the rates provided in Table 1. The rates include a 3.05% price inflation and productivity component, and an additional increase due to promotion based upon plan experience. The assumptions for additional increases due to promotion were adopted in 2014.
Board Meeting- December 17, 2018 - Audit Committee Report- Mr. John Chilton/ Ms. Kristen Coffey
562

159 ACT
Table 1. Salary Increase Assumptions
Service
KERS Non-
HazardousKERS
Hazardous
CERS Non-
HazardousCERS
Hazardous SPRS0 15.50% 19.55% 11.55% 18.55% 15.55%1 7.55% 7.55% 8.05% 9.05% 10.55%2 5.05% 5.55% 4.55% 5.05% 8.55%3 4.55% 5.05% 4.55% 4.30% 7.55%4 4.55% 4.55% 4.05% 4.05% 6.55%5 4.55% 4.05% 4.05% 3.55% 5.55%6 4.05% 3.55% 3.80% 3.05% 5.05%7 4.05% 3.55% 3.80% 3.05% 5.05%8 4.05% 3.55% 3.55% 3.05% 4.05%9 3.55% 3.55% 3.55% 3.05% 3.55%10 & over 3.55% 3.55% 3.30% 3.05% 3.05%
7. Medical Inflation Rate Assumption: The costs for retiree medical premiums are assumed to increaseaccording to the assumptions provided in Table 2. This assumption was adopted in 2017.
Table 2: Medical Inflation Rate Assumption (See footnotes 1 and 2)
January 1Non-Medicare
Plans Medicare PlansDollar
Contribution 2 January 1Non-Medicare
Plans Medicare PlansDollar
Contribution 22020 7.00% 5.00% 1.50% 2027 5.25% 4.30% 1.50%2021 6.75% 4.90% 1.50% 2028 5.00% 4.20% 1.50%2022 6.50% 4.80% 1.50% 2029 4.75% 4.10% 1.50%2023 6.25% 4.70% 1.50% 2030 4.50% 4.05% 1.50%2024 6.00% 4.60% 1.50% 2031 4.25% 4.05% 1.50%2025 5.75% 4.50% 1.50% 2032 & Over 4.05% 4.05% 1.50%2026 5.50% 4.40% 1.50%
1. All increases are assumed to occur on January 1. The 2019 premiums were known at the time of the valuation and were incorporated into the liability measurement.2. Applies to members participating on or after July 1, 2003
8. Payroll Growth Assumption: For purposes of determining the amortization rate to finance the unfunded actuarial accrued liability, the active member payroll in KERS (Non-hazardous and Hazardous) and SPRS is assumed to increase at a rate of 0.00% per year and the active member payroll in CERS (Non-hazardous and Hazardous) is assumed to increase at the rate of 2.00% per annum. This assumption was adopted in 2017. 9. Retiree Cost of Living Adjustments (COLA): SB2 only allows the Cost of Living Adjustments (COLAs) to be awarded on a biennial basis if the State Legislature so authorizes and either (i) the system is over 100% funded or (ii) the Legislature appropriates sufficient funds to pay the increased liability for the COLA. 10. Retirement Rate Assumptions: The probability, or the likelihood, that a member will retire at a specified age or level of service is provided in Table 3. These assumptions were adopted in 2014.
Board Meeting- December 17, 2018 - Audit Committee Report- Mr. John Chilton/ Ms. Kristen Coffey
563

160ACT
Table 3: Retirement Rate Assumptions (See footnotes 1 - 9) Non-Hazardous Hazardous
Age KERS 1 KERS 2 CERS 3 Service KERS 4 KERS 5 CERS 6 CERS 7 SPRS 8 SPRS 955 8.00% 5.00% 20 40.00% 22.50% 22.00% 56 8.00% 6.00% 21 40.00% 22.50% 22.00% 57 8.00% 7.00% 22 40.00% 22.50% 22.00% 58 8.00% 7.00% 23 40.00% 22.50% 28.00% 59 8.00% 8.00% 24 40.00% 30.00% 28.00% 60 10.00% 10.00% 9.00% 25 47.00% 40.00% 33.00% 22.50% 28.00% 22.00%61 20.00% 20.00% 15.00% 26 47.00% 40.00% 33.00% 22.50% 28.00% 22.00%62 20.00% 20.00% 18.00% 27 47.00% 40.00% 36.00% 22.50% 28.00% 22.00%63 20.00% 20.00% 18.00% 28 47.00% 40.00% 39.00% 22.50% 44.00% 28.00%64 20.00% 20.00% 18.00% 29 47.00% 40.00% 55.00% 30.00% 44.00% 28.00%65 20.00% 25.00% 18.00% 30 47.00% 47.00% 33.00% 33.00% 44.00% 28.00%66 20.00% 25.00% 18.00% 31 47.00% 47.00% 33.00% 33.00% 58.00% 28.00%67 20.00% 25.00% 18.00% 32 50.00% 47.00% 50.00% 36.00% 58.00% 28.00%68 20.00% 25.00% 18.00% 33 50.00% 47.00% 40.00% 39.00% 58.00% 44.00%69 20.00% 25.00% 18.00% 34 50.00% 47.00% 40.00% 55.00% 58.00% 44.00%70 20.00% 25.00% 18.00% 35 60.00% 47.00% 40.00% 33.00% 58.00% 44.00%71 20.00% 25.00% 18.00% 36 60.00% 47.00% 40.00% 33.00% 58.00% 58.00%72 20.00% 25.00% 18.00% 37 60.00% 50.00% 40.00% 50.00% 58.00% 58.00%73 20.00% 25.00% 18.00% 38 60.00% 50.00% 40.00% 40.00% 58.00% 58.00%74 20.00% 25.00% 18.00% 39 60.00% 50.00% 40.00% 40.00% 58.00% 58.00%
75+ 100.00% 100.00% 100.00% 40 60.00% 60.00% 40.00% 40.00% 58.00% 58.00%(1) For members participating before 9/1/2008. If service is at least 27 years, the rate is 35%.(2) For members participating on or after 9/1/2008. If age plus service is at least 87, the rate is 35%.(3) If service is at least 27 years, the rate is 30% for members participating before 9/1/2008. If age plus service is at least 87, the rate is 30% for members participating on or after 9/1/2008.(4) For members participating before 9/1/2008. The annual rate of service retirement is 100% at age 65.(5) For members participating on or after 9/1/2008. The annual rate of service retirement is 100% at age 60.(6) For members participating before 9/1/2008. The annual rate of service retirement is 100% at age 62.(7) For members participating on or after 9/1/2008. The annual rate of service retirement is 100% at age 60.(8) For members participating before 9/1/2008. The annual rate of service retirement is 100% at age 55.(9) For members participating on or after 9/1/2008. The annual rate of service retirement is 100% at age 60.
11. Mortality Assumptions: The mortality for active members is the RP-2000 Combined Mortality Table projected with Scale BB to 2013 (male mortality rates are multiplied by 50% and female mortality rates are multiplied by 30%). The mortality table for healthy retired members and beneficiaries is the RP-2000 Combined Mortality Table projected with Scale BB to 2013 (female mortality rates are set back one year). The mortality table for disabled members is the RP-2000 Combined Disabled Mortality Table projected with Scale BB to 2013 (male mortality rates are set back four years). At the time of the last experience study, performed as of June 30, 2013, this mortality assumption provided 37% and 19% margin for future improvement for males and females, respectively. This will be reviewed again when the next experience investigation is conducted during the 2018/2019 plan year.
Table 4: Sample Annual Rate of Mortality Active Member Mortality Retired Member Mortality Disabled Member Mortality
Age Males Females Males Females Males Females20 0.02% 0.01% 0.03% 0.02% 22 0.02% 0.01% 0.04% 0.02% 32 0.03% 0.01% 0.05% 0.03% 42 0.06% 0.02% 0.12% 0.07% 2.17% 0.72%52 0.13% 0.06% 0.26% 0.18% 2.54% 1.29%62 0.39% 0.17% 0.78% 0.50% 3.50% 2.06%72 1.12% 0.53% 2.24% 1.59% 4.68% 3.66%
Board Meeting- December 17, 2018 - Audit Committee Report- Mr. John Chilton/ Ms. Kristen Coffey
564

161 ACT
12. Withdrawal Rates: The probability, or likelihood, of active members terminating employment priorto retirement is provided in Table 5. These assumptions were adopted in 2014.
Table 5: Selected Rates of Termination Prior to Retirement
KERS Non-Hazardous
KERS Hazardous
CERS Non-Hazardous
CERS Hazardous SPRS
Years of Service Years of Service Years of Service 0 22.50% 25.00% 0 28.00% 20.50% 0 20.00%1 15.50% 10.50% 1 16.00% 13.00% 1 7.00%2 12.50% 7.50% 2 12.00% 10.50% 2-8 3.00%3 10.50% 6.50% 3 10.00% 9.00% 9 & Over 2.50%4 9.00% 5.50% 4 8.00% 8.00% 5 6.50% 4.50% 5 6.00% 7.00% 6 5.50% 3.00% 6 5.00% 7.00% 7 5.00% 3.00% 7 5.00% 6.00% 8 4.50% 3.00% 8-13 4.00% 6.00% 9 4.50% 2.50% 14 & Over 3.00% 6.00%
10 4.00% 2.50% 11-12 4.00% 2.00% 13-14 3.50% 2.00%
15 & Over 3.00% 2.00%
13. Assumption Changes Since Prior Valuation: None. 14. Rates of Disablement: KRS provides disability benefits for those individuals meeting specific qualifications established by state law. This assumption provides the probability, or likelihood, that a member will become disabled during the course of employment for various age levels. These assumptions were adopted in 2014.
Table 6: Sample Rates of Disablement
KERS Non-Hazardous KERS Hazardous
CERS Non-Hazardous CERS Hazardous SPRS
Nearest Age Probability Probability Probability Probability Probability20 0.02% 0.03% 0.02% 0.05% 0.05%30 0.03% 0.05% 0.03% 0.09% 0.09%40 0.07% 0.10% 0.07% 0.20% 0.20%50 0.19% 0.28% 0.19% 0.56% 0.56%60 0.49% 0.73% 0.49% 1.46% 1.46%
Board Meeting- December 17, 2018 - Audit Committee Report- Mr. John Chilton/ Ms. Kristen Coffey
565

162ACT
Summary of Actuarial Valuation Results (in Whole $)
KERS Non-Hazardous
KERS Hazardous
CERS Non-Hazardous
CERS Hazardous SPRS
Recommended Contribution Rate (Fiscal Year 2018-2019)Pension Fund Contribution 74.54% 34.42% 22.52% 36.98% 120.54%Insurance Fund Contribution 10.65% 0.00% 4.76% 9.52% 19.50%Recommended Employer Contribution 85.19% 34.42% 27.28% 46.50% 140.04%
Funded Status as of Valuation Date As of June 30, 2018 ($ in Thousands)Pension Fund Actuarial Liability $15,675,232 $1,151,923 $13,191,505 $4,792,548 $989,528Actuarial Value of Assets 2,019,278 639,262 6,950,225 2,321,721 268,259Unfunded Liability on Actuarial Value of Assets 13,655,954 512,661 6,241,280 2,470,827 721,269Funding Ratio on Actuarial Value of Assets 12.88% 55.50% 52.69% 48.44% 27.11%Market Value of Assets 2,004,446 645,485 7,018,963 2,348,337 267,572Unfunded Liability on Market Value of Assets $13,670,786 $506,438 $6,172,542 $2,444,211 $721,956Funding Ratio on Market Value of Assets 12.79% 56.04% 53.21% 49.00% 27.04%
Insurance Fund Actuarial Liability $2,435,506 $393,481 $3,092,623 $1,684,028 $262,088Actuarial Value of Assets 887,121 511,441 2,371,430 1,256,306 187,535Unfunded Liability on Actuarial Value of Assets 1,548,385 (117,961) 721,193 427,722 74,553Funding Ratio on Actuarial Value of Assets 36.42% 129.98% 76.68% 74.60% 71.55%Market Value of Assets 891,205 519,072 2,414,126 1,280,982 190,847Unfunded Liability on Market Value of Assets $1,544,301 $(125,592) $678,497 $403,046 $71,242Funding Ratio on Market Value of Assets 36.59% 131.92% 78.06% 76.07% 72.82%Member Data (See Footnotes 1 and 2) Number of Active Members 35,139 3,929 81,818 9,263 886Total Annual Payroll (Active Members)1 $1,471,477 $158,213 $2,466,801 $533,618 $48,808Average Annual Pay (Active Members)2 $41,876 $40,268 $30,150 $57,607 $55,088Number of Retired Members & Beneficiaries 46,526 4,370 61,938 9,587 1,600Average Annual Retirement Allowance2 $20,482 $14,657 $11,469 $25,626 $37,266Number of Vested Inactive Members 13,230 886 17,621 954 176Number of Inactive Members Due a Refund 37,205 4,841 69,539 2,113 323(1) Annual payroll included in the Summary of Actuarial Valuation Results is based upon the annualized monthly payroll for active members as of the valuation date. The annual payroll recorded in the financial section is based upon the sum of the monthly payroll for active members recorded for each month of fiscal year ending June 30, 2018.(2) Member data in actuarial section will differ from reported data in other CAFR sections. For this section, the data is reported by account instead of by person (ex: a member could have vested service in KERS, but is currently active in a CERS and is reported in two membership categories).
Board Meeting- December 17, 2018 - Audit Committee Report- Mr. John Chilton/ Ms. Kristen Coffey
566

163 ACT
KERS FundsThe contribution rates for KERS Non-Hazardous and KERS Hazardous shown in the tables below are the full funding rates presented by the actuary for 2009 through 2018 annual valuations. However, the actual employer contribution was less than the recommended rates for years 2009 through 2014. SB2 required full funding starting in Fiscal Year 2015.
Recommended Employer Contribution RatesAs of June 30, 2018KERS (Non-Hazardous Employers)
Valuation Date
Applicable Fiscal Year
Pension Fund: Normal Cost
Pension Fund: Payment on Unfunded Liability
Pension Fund Contribution
Insurance Fund Contribution
Recommended Employer
Contribution6/30/2009 2010-2011 4.26% 17.51% 21.77% 16.81% 38.58%6/30/2010 2011-2012 4.23% 20.07% 24.30% 16.41% 40.71%6/30/2011 2012-2013 4.38% 23.65% 28.03% 16.52% 44.55%6/30/2012 2013-2014 4.26% 28.31% 32.57% 12.71% 45.28%6/30/2013 2014-2015 4.13% 26.71% 30.84% 7.93% 38.77%6/30/2014 2015-2016 4.10% 29.47% 33.57% 7.74% 41.31%6/30/2015 2016-2017 3.60% 35.33% 38.93% 8.35% 47.28%6/30/2016 2017-2018 4.93% 37.05% 41.98% 8.41% 50.39%6/30/2017 2018-2019 8.17% 62.86% 71.03% 12.40% 83.43%6/30/2018 2019-2020 7.98% 66.56% 74.54% 10.65% 85.19%
KERS (Hazardous Employers)
Valuation Date
Applicable Fiscal Year
Pension Fund Normal Cost
Pension Fund: Payment on Unfunded Liability
Pension Fund Contribution
Insurance Fund Contribution
Recommended Employer
Contribution6/30/2009 2010-2011 7.94% 6.17% 14.11% 20.26% 34.37%6/30/2010 2011-2012 7.19% 6.92% 14.11% 19.73% 33.84%6/30/2011 2012-2013 7.47% 8.69% 16.16% 19.73% 35.89%6/30/2012 2013-2014 6.09% 10.91% 17.00% 11.84% 28.84%6/30/2013 2014-2015 5.79% 10.58% 16.37% 9.97% 26.34%6/30/2014 2015-2016 5.69% 11.40% 17.09% 7.12% 24.21%6/30/2015 2016-2017 6.93% 14.15% 21.08% 2.74% 23.82%6/30/2016 2017-2018 6.44% 14.04% 20.48% 1.34% 21.82%6/30/2017 2018-2019 9.67% 24.72% 34.39% 2.46% 36.85%6/30/2018 2019-2020 9.24% 25.18% 34.42% 0.00% 34.42%
(1) The contribution rates for KERS Non-Hazardous and KERS Hazardous shown in the above tables are the full funding rates presented by the actuary in the 2011 through 2017 annual valuations. However, the actual employer contribution rates have been less than those shown above. As a result of HB 1 passed in 2008, the statute called for an employer contribution rate at an increasing percentage of the full funding rates until 100% was achieved in 2025 for KERS Non-Hazardous and 2019 for KERS Hazardous. SB2 eliminated this phase-in beginning with the June 30, 2013 actuarial valuation. House Bill 265 passed during the 2018 legislative session which reduced the FY 2019 employer contribution rate to 49.47% for Regional Mental Health/Mental Retardation Boards, Local District Health Departments, State Universities, Community Colleges and any other agencies eligible for voluntarily cease participating in the KERS non-hazardous fund.
Board Meeting- December 17, 2018 - Audit Committee Report- Mr. John Chilton/ Ms. Kristen Coffey
567

164ACT
CERS FundsThe Insurance Fund contribution rates and the employer contribution rates for CERS Non-Hazardous and CERS Hazardous shown in the tables below are the full funding rates presented by the actuary in the 2009 through 2018 annual valuations. House Bill 362 was enacted during the 2018 legislative session that limits the annual increase in the CERSemployer contribution rate over the prior fiscal year to 12% per year for the period of July 1, 2018 to June30, 2028, or until the full actuarial required contribution is met.
Recommended Employer Contribution RatesAs of June 30, 2018County Employees Retirement SystemCERS (Non-Hazardous Employers)
Valuation Date
Applicable Fiscal Year
Pension Fund Normal Cost
Pension Fund: Payment on Unfunded Liability
Pension Fund Contribution
Insurance Fund Contribution
Recommended Employer
Contribution6/30/2009 2010-2011 4.60% 5.43% 10.03% 9.78% 19.81%6/30/2010 2011-2012 4.72% 6.98% 11.70% 9.59% 21.29%6/30/2011 2012-2013 4.68% 7.94% 12.62% 8.59% 21.21%6/30/2012 2013-2014 4.68% 9.06% 13.74% 5.84% 19.58%6/30/2013 2014-2015 4.35% 8.40% 12.75% 5.35% 18.10%6/30/2014 2015-2016 4.23% 8.19% 12.42% 4.88% 17.30%6/30/2015 2016-2017 3.80% 10.15% 13.95% 4.93% 18.88%6/30/2016 2017-2018 3.70% 10.78% 14.48% 4.70% 19.18%6/30/2017 2018-2019 5.85% 15.99% 21.84% 6.21% 28.05%6/30/2018 2019-2020 5.80% 16.72% 22.52% 4.76% 27.28%
CERS (Hazardous Employers)
Valuation Date
Applicable Fiscal Year
Pension Fund Normal Cost
Pension Fund: Payment on Unfunded Liability
Pension Fund Contribution
Insurance Fund Contribution
Recommended Employer
Contribution6/30/2009 2010-2011 7.56% 9.23% 16.79% 23.27% 40.06%6/30/2010 2011-2012 7.31% 10.60% 17.91% 23.74% 41.65%6/30/2011 2012-2013 7.40% 12.70% 20.10% 21.84% 41.94%6/30/2012 2013-2014 6.44% 15.33% 21.77% 16.02% 37.79%6/30/2013 2014-2015 6.35% 14.38% 20.73% 14.97% 35.70%6/30/2014 2015-2016 6.21% 14.05% 20.26% 13.42% 33.68%6/30/2015 2016-2017 4.52% 17.19% 21.71% 9.79% 31.50%6/30/2016 2017-2018 4.40% 17.80% 22.20% 9.35% 31.55%6/30/2017 2018-2019 6.78% 28.91% 35.69% 12.17% 47.86%6/30/2018 2019-2020 6.35% 30.63% 36.98% 9.52% 46.50%
The Insurance Fund contribution rates and the employer contribution rates for CERS Non-Hazardous and CERS Hazardous shown in the above tables are the full funding rates presented by the actuary in the 2011 through 2017 annual valuations. However, in the case of CERS Non-Hazardous and CERS Hazardous, in 2006 the actuary recommended a five-year phase-in of the rate which requires the payment of the insurance benefit normal cost with a five-year phase-in of the unfunded accrued liability (UAL) associated with the insurance fund. In 2008 this recommendation was changed to a ten-year phase-in from the initial starting date. House Bill 362 passed during the 2018 legislative session which limited the CERS employer contribution rate increase to 12% per year over the prior fiscal year for the period of July 1, 2018 to June 30, 2028.
Board Meeting- December 17, 2018 - Audit Committee Report- Mr. John Chilton/ Ms. Kristen Coffey
568
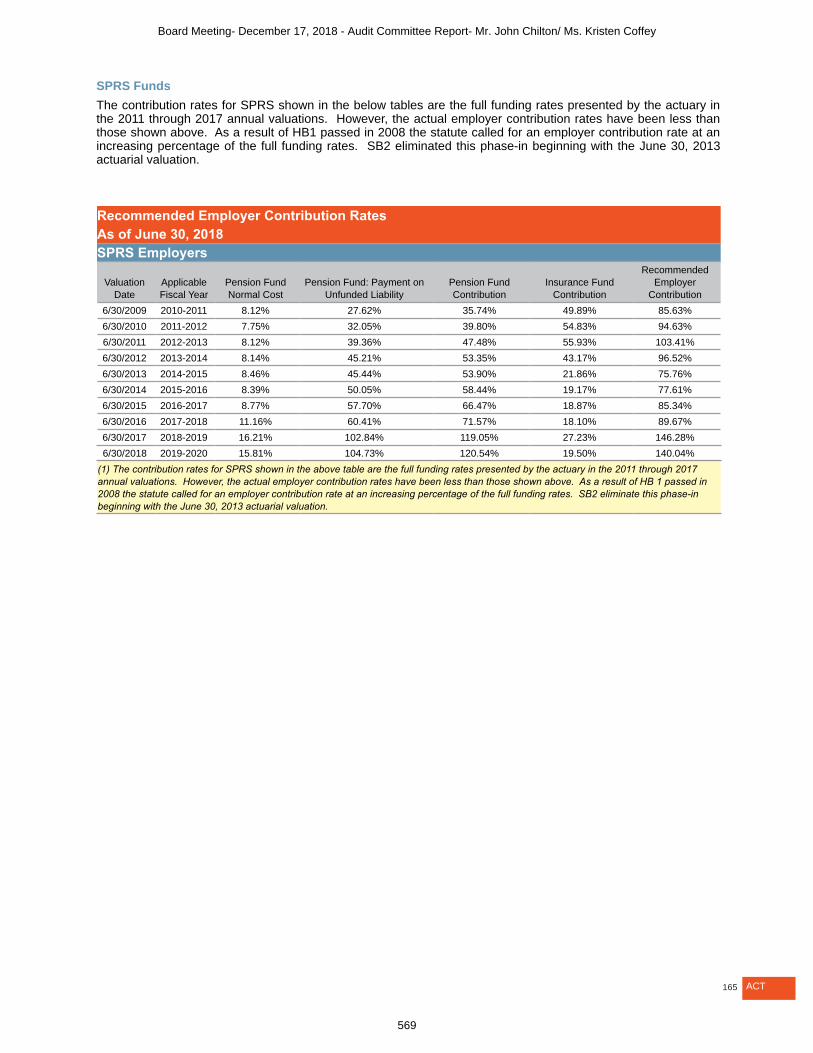
165 ACT
SPRS FundsThe contribution rates for SPRS shown in the below tables are the full funding rates presented by the actuary in the 2011 through 2017 annual valuations. However, the actual employer contribution rates have been less than those shown above. As a result of HB1 passed in 2008 the statute called for an employer contribution rate at an increasing percentage of the full funding rates. SB2 eliminated this phase-in beginning with the June 30, 2013 actuarial valuation.
Recommended Employer Contribution RatesAs of June 30, 2018SPRS Employers
Valuation Date
Applicable Fiscal Year
Pension Fund Normal Cost
Pension Fund: Payment on Unfunded Liability
Pension Fund Contribution
Insurance Fund Contribution
Recommended Employer
Contribution6/30/2009 2010-2011 8.12% 27.62% 35.74% 49.89% 85.63%6/30/2010 2011-2012 7.75% 32.05% 39.80% 54.83% 94.63%6/30/2011 2012-2013 8.12% 39.36% 47.48% 55.93% 103.41%6/30/2012 2013-2014 8.14% 45.21% 53.35% 43.17% 96.52%6/30/2013 2014-2015 8.46% 45.44% 53.90% 21.86% 75.76%6/30/2014 2015-2016 8.39% 50.05% 58.44% 19.17% 77.61%6/30/2015 2016-2017 8.77% 57.70% 66.47% 18.87% 85.34%6/30/2016 2017-2018 11.16% 60.41% 71.57% 18.10% 89.67%6/30/2017 2018-2019 16.21% 102.84% 119.05% 27.23% 146.28%6/30/2018 2019-2020 15.81% 104.73% 120.54% 19.50% 140.04%
(1) The contribution rates for SPRS shown in the above table are the full funding rates presented by the actuary in the 2011 through 2017 annual valuations. However, the actual employer contribution rates have been less than those shown above. As a result of HB 1 passed in 2008 the statute called for an employer contribution rate at an increasing percentage of the full funding rates. SB2 eliminate this phase-in beginning with the June 30, 2013 actuarial valuation.
Board Meeting- December 17, 2018 - Audit Committee Report- Mr. John Chilton/ Ms. Kristen Coffey
569
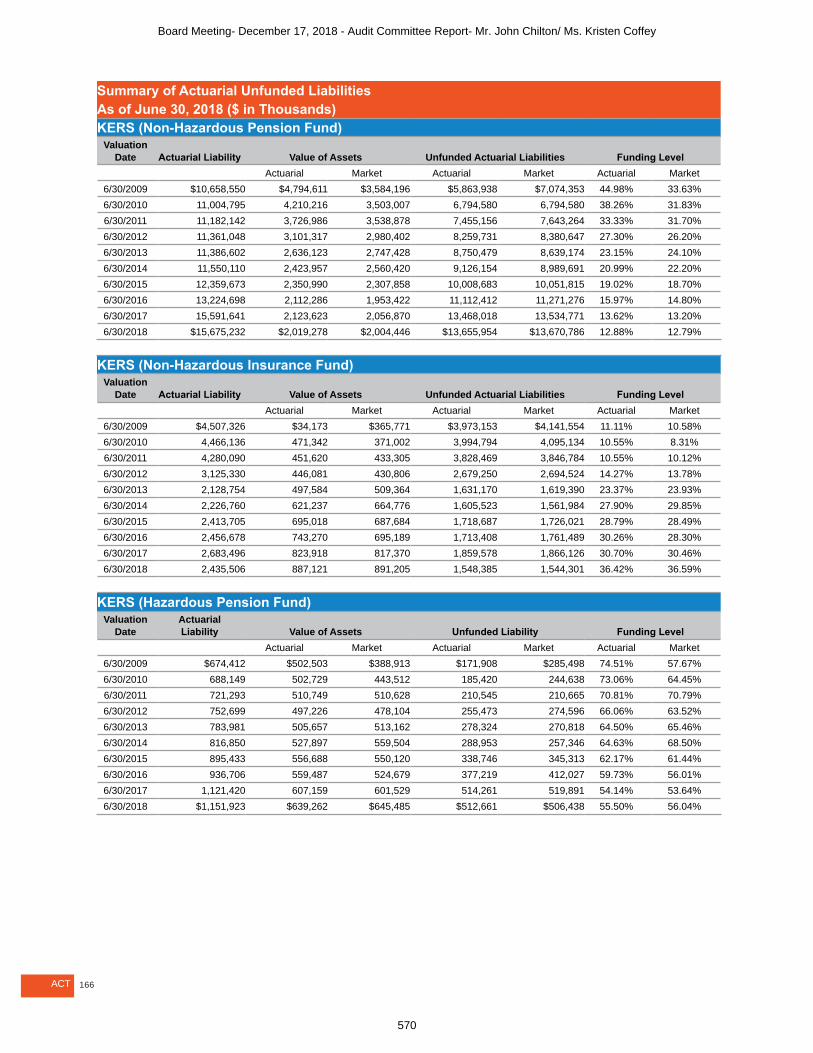
166ACT
Summary of Actuarial Unfunded LiabilitiesAs of June 30, 2018 ($ in Thousands)KERS (Non-Hazardous Pension Fund)
Valuation Date Actuarial Liability Value of Assets Unfunded Actuarial Liabilities Funding Level
Actuarial Market Actuarial Market Actuarial Market6/30/2009 $10,658,550 $4,794,611 $3,584,196 $5,863,938 $7,074,353 44.98% 33.63%6/30/2010 11,004,795 4,210,216 3,503,007 6,794,580 6,794,580 38.26% 31.83%6/30/2011 11,182,142 3,726,986 3,538,878 7,455,156 7,643,264 33.33% 31.70%6/30/2012 11,361,048 3,101,317 2,980,402 8,259,731 8,380,647 27.30% 26.20%6/30/2013 11,386,602 2,636,123 2,747,428 8,750,479 8,639,174 23.15% 24.10%6/30/2014 11,550,110 2,423,957 2,560,420 9,126,154 8,989,691 20.99% 22.20%6/30/2015 12,359,673 2,350,990 2,307,858 10,008,683 10,051,815 19.02% 18.70%6/30/2016 13,224,698 2,112,286 1,953,422 11,112,412 11,271,276 15.97% 14.80%6/30/2017 15,591,641 2,123,623 2,056,870 13,468,018 13,534,771 13.62% 13.20%6/30/2018 $15,675,232 $2,019,278 $2,004,446 $13,655,954 $13,670,786 12.88% 12.79%
KERS (Non-Hazardous Insurance Fund)Valuation
Date Actuarial Liability Value of Assets Unfunded Actuarial Liabilities Funding Level Actuarial Market Actuarial Market Actuarial Market
6/30/2009 $4,507,326 $34,173 $365,771 $3,973,153 $4,141,554 11.11% 10.58%6/30/2010 4,466,136 471,342 371,002 3,994,794 4,095,134 10.55% 8.31%6/30/2011 4,280,090 451,620 433,305 3,828,469 3,846,784 10.55% 10.12%6/30/2012 3,125,330 446,081 430,806 2,679,250 2,694,524 14.27% 13.78%6/30/2013 2,128,754 497,584 509,364 1,631,170 1,619,390 23.37% 23.93%6/30/2014 2,226,760 621,237 664,776 1,605,523 1,561,984 27.90% 29.85%6/30/2015 2,413,705 695,018 687,684 1,718,687 1,726,021 28.79% 28.49%6/30/2016 2,456,678 743,270 695,189 1,713,408 1,761,489 30.26% 28.30%6/30/2017 2,683,496 823,918 817,370 1,859,578 1,866,126 30.70% 30.46%6/30/2018 2,435,506 887,121 891,205 1,548,385 1,544,301 36.42% 36.59%
KERS (Hazardous Pension Fund)Valuation
DateActuarial Liability Value of Assets Unfunded Liability Funding Level
Actuarial Market Actuarial Market Actuarial Market6/30/2009 $674,412 $502,503 $388,913 $171,908 $285,498 74.51% 57.67%6/30/2010 688,149 502,729 443,512 185,420 244,638 73.06% 64.45%6/30/2011 721,293 510,749 510,628 210,545 210,665 70.81% 70.79%6/30/2012 752,699 497,226 478,104 255,473 274,596 66.06% 63.52%6/30/2013 783,981 505,657 513,162 278,324 270,818 64.50% 65.46%6/30/2014 816,850 527,897 559,504 288,953 257,346 64.63% 68.50%6/30/2015 895,433 556,688 550,120 338,746 345,313 62.17% 61.44%6/30/2016 936,706 559,487 524,679 377,219 412,027 59.73% 56.01%6/30/2017 1,121,420 607,159 601,529 514,261 519,891 54.14% 53.64%6/30/2018 $1,151,923 $639,262 $645,485 $512,661 $506,438 55.50% 56.04%
Board Meeting- December 17, 2018 - Audit Committee Report- Mr. John Chilton/ Ms. Kristen Coffey
570

167 ACT
KERS (Hazardous Insurance Fund)Valuation
DateActuarial Liability Value of Assets Unfunded Liability Funding Level
Actuarial Market Actuarial Market Actuarial Market6/30/2009 $491,132 $301,635 $219,537 $189,498 $271,595 61.42% 44.70%6/30/2010 493,298 314,427 271,396 178,870 221,902 63.74% 55.02%6/30/2011 507,059 329,962 321,072 177,097 185,987 65.07% 63.32%6/30/2012 384,592 345,574 333,298 39,018 51,294 89.85% 86.66%6/30/2013 385,518 370,774 374,310 14,743 11,208 96.18% 97.09%6/30/2014 396,987 419,396 435,504 (22,409) (38,517) 105.64% 109.70%6/30/2015 374,904 451,514 441,626 (76,610) (66,722) 120.43% 117.80%6/30/2016 377,745 473,160 440,596 (95,415) (62,851) 125.26% 116.64%6/30/2017 419,440 493,458 488,838 (74,019) (69,399) 117.65% 116.55%6/30/2018 $393,481 $511,441 $519,072 (117,960.70) (125,591.72) 129.98% 131.92%
Summary of Actuarial Unfunded LiabilitiesAs of June 30, 2018 ($ in Thousands)CERS (Non-Hazardous Pension Fund)
Valuation Date Actuarial Liability Value of Assets Unfunded Liability Funding Level
Actuarial Market Actuarial Market Actuarial Market6/30/2009 $7,912,914 $5,650,790 $4,330,594 $2,262,124 $3,582,320 71.41% 54.73%6/30/2010 8,459,022 5,546,857 4,819,934 2,912,165 3,639,089 65.57% 56.98%6/30/2011 8,918,085 5,629,611 5,577,252 3,288,474 3,340,833 63.13% 62.54%6/30/2012 9,139,568 5,547,236 5,372,770 3,592,332 3,766,798 60.69% 58.79%6/30/2013 9,378,876 5,637,094 5,780,830 3,741,782 3,598,046 60.10% 61.64%6/30/2014 9,772,523 6,117,134 6,507,300 3,655,389 3,265,222 62.60% 66.59%6/30/2015 10,740,325 6,474,849 6,416,854 4,265,477 4,323,472 60.29% 59.75%6/30/2016 11,076,457 6,535,372 6,106,187 4,541,084 4,970,270 59.00% 55.13%6/30/2017 12,803,509 6,764,873 6,687,237 6,038,636 6,116,272 52.84% 52.23%6/30/2018 $13,191,505 $6,950,225 $7,018,963 $6,241,280 $6,172,542 52.69% 53.21%
CERS (Non-Hazardous Insurance Fund)Valuation
Date Actuarial Liability Value of Assets Unfunded Liability Funding Level Actuarial Market Actuarial Market Actuarial Market
6/30/2009 $3,070,386 $1,216,632 $894,906 $1,853,754 $2,175,480 39.62% 29.15%6/30/2010 3,158,340 1,293,039 1,096,582 1,865,302 2,061,758 40.94% 34.72%6/30/2011 3,073,973 1,433,451 1,451,984 1,640,522 1,621,989 46.63% 47.23%6/30/2012 2,370,771 1,512,854 1,439,226 857,917 931,545 63.81% 60.71%6/30/2013 2,443,894 1,628,244 1,633,697 815,650 810,197 66.62% 66.85%6/30/2014 2,616,915 1,831,199 1,899,557 785,715 717,357 69.98% 72.59%6/30/2015 2,907,827 1,997,456 1,948,454 910,371 959,373 68.69% 67.01%6/30/2016 2,988,121 2,079,811 1,943,757 908,310 1,044,364 69.60% 65.05%6/30/2017 3,355,151 2,227,401 2,212,536 1,127,750 1,142,616 66.39% 65.94%6/30/2018 $3,092,623 $2,371,430 $2,414,126 $721,193 $678,497 76.68% 78.06%
Board Meeting- December 17, 2018 - Audit Committee Report- Mr. John Chilton/ Ms. Kristen Coffey
571
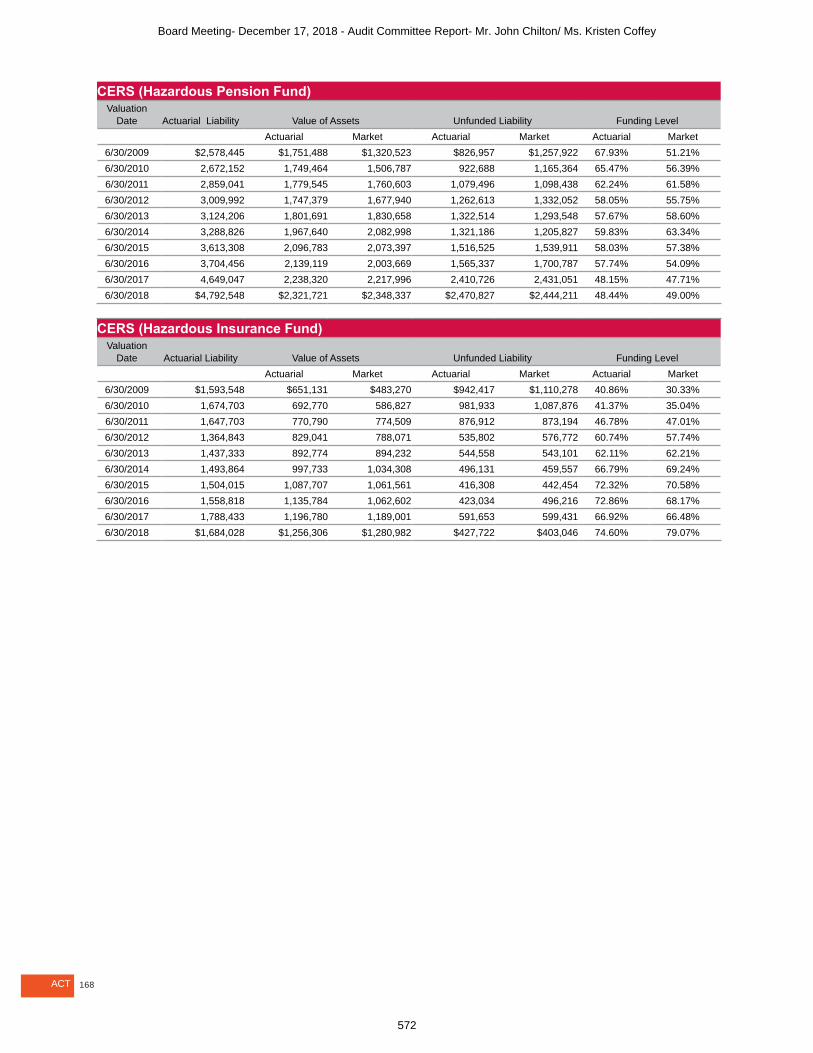
168ACT
CERS (Hazardous Pension Fund)Valuation
Date Actuarial Liability Value of Assets Unfunded Liability Funding Level Actuarial Market Actuarial Market Actuarial Market
6/30/2009 $2,578,445 $1,751,488 $1,320,523 $826,957 $1,257,922 67.93% 51.21%6/30/2010 2,672,152 1,749,464 1,506,787 922,688 1,165,364 65.47% 56.39%6/30/2011 2,859,041 1,779,545 1,760,603 1,079,496 1,098,438 62.24% 61.58%6/30/2012 3,009,992 1,747,379 1,677,940 1,262,613 1,332,052 58.05% 55.75%6/30/2013 3,124,206 1,801,691 1,830,658 1,322,514 1,293,548 57.67% 58.60%6/30/2014 3,288,826 1,967,640 2,082,998 1,321,186 1,205,827 59.83% 63.34%6/30/2015 3,613,308 2,096,783 2,073,397 1,516,525 1,539,911 58.03% 57.38%6/30/2016 3,704,456 2,139,119 2,003,669 1,565,337 1,700,787 57.74% 54.09%6/30/2017 4,649,047 2,238,320 2,217,996 2,410,726 2,431,051 48.15% 47.71%6/30/2018 $4,792,548 $2,321,721 $2,348,337 $2,470,827 $2,444,211 48.44% 49.00%
CERS (Hazardous Insurance Fund)Valuation
Date Actuarial Liability Value of Assets Unfunded Liability Funding Level Actuarial Market Actuarial Market Actuarial Market
6/30/2009 $1,593,548 $651,131 $483,270 $942,417 $1,110,278 40.86% 30.33%6/30/2010 1,674,703 692,770 586,827 981,933 1,087,876 41.37% 35.04%6/30/2011 1,647,703 770,790 774,509 876,912 873,194 46.78% 47.01%6/30/2012 1,364,843 829,041 788,071 535,802 576,772 60.74% 57.74%6/30/2013 1,437,333 892,774 894,232 544,558 543,101 62.11% 62.21%6/30/2014 1,493,864 997,733 1,034,308 496,131 459,557 66.79% 69.24%6/30/2015 1,504,015 1,087,707 1,061,561 416,308 442,454 72.32% 70.58%6/30/2016 1,558,818 1,135,784 1,062,602 423,034 496,216 72.86% 68.17%6/30/2017 1,788,433 1,196,780 1,189,001 591,653 599,431 66.92% 66.48%6/30/2018 $1,684,028 $1,256,306 $1,280,982 $427,722 $403,046 74.60% 79.07%
Board Meeting- December 17, 2018 - Audit Committee Report- Mr. John Chilton/ Ms. Kristen Coffey
572

169 ACT
Summary of Actuarial Unfunded LiabilitiesAs of June 30, 2018 ($ in Thousands)SPRS (Pension)
Valuation Date Actuarial Liability Value of Assets Unfunded Liability Funding Level
Actuarial Market Actuarial Market Actuarial Market6/30/2009 $602,329 $329,967 $256,571 $272,362 $345,758 54.78% 42.60%6/30/2010 612,445 304,577 264,944 307,868 347,501 49.73% 43.26%6/30/2011 634,379 285,581 279,934 348,799 354,445 45.02% 44.13%6/30/2012 647,689 259,792 252,897 387,897 394,792 40.11% 39.05%6/30/2013 651,581 241,800 248,559 409,780 403,022 37.11% 38.15%6/30/2014 681,118 242,742 260,763 438,377 420,355 35.64% 38.28%6/30/2015 734,156 248,388 246,968 485,769 487,188 33.83% 33.64%6/30/2016 775,160 234,568 217,594 540,593 557,566 30.26% 28.07%6/30/2017 967,145 261,320 255,737 705,824 711,408 27.02% 26.44%6/30/2018 $989,528 $268,259 $267,572 $721,269 $721,956 27.11% 27.04%
SPRS (Insurance)Valuation
Date Actuarial Liability Value of Assets Unfunded Liability Funding Level Actuarial Market Actuarial Market Actuarial Market
6/30/2009 $364,031 $123,527 $93,687 $240,504 $270,344 33.93% 25.74%6/30/2010 434,960 121,175 104,527 313,785 330,434 27.86% 24.03%6/30/2011 438,428 123,687 127,368 314,740 311,060 28.21% 29.05%6/30/2012 333,904 124,372 125,568 209,532 208,336 37.25% 37.61%6/30/2013 222,327 136,321 142,831 86,006 79,496 61.32% 64.24%6/30/2014 234,271 155,595 165,168 78,676 69,103 66.42% 70.50%6/30/2015 254,839 167,775 165,018 87,064 89,821 65.84% 64.75%6/30/2016 257,197 172,704 161,366 84,494 95,831 67.15% 62.74%6/30/2017 276,641 180,464 178,838 96,178 97,803 65.23% 64.65%6/30/2018 $262,088 $187,535 $190,847 $74,553 $71,242 71.55% 72.82%
(1) Valuation Balance Sheets give the basis for determining the percentage rates for contributions to be made by employers.
Board Meeting- December 17, 2018 - Audit Committee Report- Mr. John Chilton/ Ms. Kristen Coffey
573

170ACT
Solvency TestAs of June 30, 2018 ($ in Thousands)KERS (Non-Hazardous Pension Fund) Actuarial Liabilities
Valuation Date
(1) Active Member Contributions
(2) Retired Members &
Beneficiaries
(3) Active Members
(Employer Portion)Actuarial Value of
Assets% of Actuarial Liabilities Covered by
Actuarial Assets for (1) (2) (3)
6/30/2009 $793,575 $8,205,156 $1,659,819 $4,794,611 100.00% 48.80% 0.00%6/30/2010 869,484 8,329,758 1,805,553 4,210,216 100.00% 40.10% 0.00%6/30/2011 916,569 8,482,714 1,782,859 3,726,986 100.00% 33.10% 0.00%6/30/2012 885,137 8,708,536 1,767,375 3,101,317 100.00% 25.40% 0.00%6/30/2013 922,928 8,709,324 1,754,351 2,636,123 100.00% 19.70% 0.00%6/30/2014 928,558 8,870,693 1,750,860 2,423,957 100.00% 16.90% 0.00%6/30/2015 925,934 9,437,468 1,996,271 2,350,990 100.00% 15.10% 0.00%6/30/2016 920,120 10,010,168 2,294,410 2,112,286 100.00% 11.90% 0.00%6/30/2017 934,559 11,608,346 3,048,736 2,123,623 100.00% 10.20% 0.00%6/30/2018 $892,033 $11,929,018 $2,854,180 $2,019,278 100.00% 9.40% 0.00%
KERS (Non-Hazardous Insurance Fund) Actuarial Liabilities
Valuation Date
(1) Active Member Contributions
(2) Retired Members &
Beneficiaries
(3) Active Members
(Employer Portion)Actuarial Value of
Assets% of Actuarial Liabilities Covered by
Actuarial Assets for (1) (2) (3)
6/30/2009 $- $2,861,867 $1,645,458 $534,173 100.00% 18.70% 0.00%6/30/2010 - 2,744,534 1,721,602 471,342 100.00% 17.20% 0.00%6/30/2011 - 2,568,003 1,712,087 451,620 100.00% 17.60% 0.00%6/30/2012 - 1,924,069 1,201,262 446,081 100.00% 23.20% 0.00%6/30/2013 - 1,338,773 789,981 497,584 100.00% 37.20% 0.00%6/30/2014 - 1,425,605 801,155 621,237 100.00% 43.60% 0.00%6/30/2015 - 1,428,350 985,355 695,018 100.00% 48.70% 0.00%6/30/2016 - 1,483,636 973,042 743,270 100.00% 50.10% 0.00%6/30/2017 - 1,575,294 1,108,202 823,918 100.00% 52.30% 0.00%6/30/2018 $- $1,475,954 $959,552 $887,121 100.00% 60.10% 0.00%
KERS (Hazardous Pension Fund) Actuarial Liabilities
Valuation Date
(1) Active Member Contributions
(2) Retired Members &
Beneficiaries
(3) Active Members
(Employer Portion)Actuarial Value of
Assets% of Actuarial Liabilities Covered by
Actuarial Assets for (1) (2) (3)
6/30/2009 $87,780 $413,972 $172,659 $502,503 100.00% 100.00% 0.40%6/30/2010 88,511 441,657 157,981 502,729 100.00% 93.80% 0.00%6/30/2011 86,614 490,395 144,284 510,749 100.00% 86.50% 0.00%6/30/2012 82,101 521,689 148,910 497,226 100.00% 79.60% 0.00%6/30/2013 82,146 545,597 156,238 505,657 100.00% 77.60% 0.00%6/30/2014 83,664 581,231 151,955 527,897 100.00% 76.40% 0.00%6/30/2015 83,606 633,189 178,638 556,688 100.00% 74.70% 0.00%6/30/2016 86,705 648,482 201,519 559,487 100.00% 72.90% 0.00%6/30/2017 93,350 746,350 281,720 607,159 100.00% 68.80% 0.00%6/30/2018 $89,106 $810,311 $252,506 $639,262 100.00% 67.90% 0.00%
Board Meeting- December 17, 2018 - Audit Committee Report- Mr. John Chilton/ Ms. Kristen Coffey
574

171 ACT
KERS (Hazardous Insurance Fund) Actuarial Liabilities
Valuation Date
(1) Active Member Contributions
(2) Retired Members &
Beneficiaries
(3) Active Members
(Employer Portion)Actuarial Value of
Assets% of Actuarial Liabilities Covered by
Actuarial Assets for (1) (2) (3)
6/30/2009 $- $242,123 $249,009 $301,635 100.00% 100.00% 23.90%6/30/2010 - 268,511 224,787 314,427 100.00% 100.00% 20.40%6/30/2011 - 285,540 221,519 329,962 100.00% 100.00% 20.10%6/30/2012 - 196,579 188,013 345,574 100.00% 100.00% 79.20%6/30/2013 - 202,032 183,486 370,774 100.00% 100.00% 92.00%6/30/2014 - 206,477 190,509 419,396 100.00% 100.00% 100.00%6/30/2015 - 221,115 153,789 451,514 100.00% 100.00% 100.00%6/30/2016 - 228,361 149,384 473,160 100.00% 100.00% 100.00%6/30/2017 - 243,816 175,623 493,458 100.00% 100.00% 100.00%6/30/2018 $- $248,775 $144,706 $511,441 100.00% 100.00% 100.00%
Solvency TestAs of June 30, 2018 ($ in Thousands)CERS (Non-Hazardous Pension Fund) Actuarial Liabilities
Valuation Date
(1) Active Member Contributions
(2) Retired Members &
Beneficiaries
(3) Active Members
(Employer Portion)Actuarial Value of
Assets% of Actuarial Liabilities Covered by
Actuarial Assets for (1) (2) (3)6/30/2009 $991,629 $4,542,483 $2,378,802 $5,650,790 100.00% 100.00% 4.90%6/30/2010 1,063,747 4,890,659 2,504,616 5,546,857 100.00% 91.70% 0.00%6/30/2011 1,110,967 5,209,784 2,597,334 5,629,611 100.00% 86.70% 0.00%6/30/2012 1,117,549 5,416,933 2,605,085 5,547,236 100.00% 81.80% 0.00%6/30/2013 1,149,611 5,638,371 2,590,894 5,637,094 100.00% 79.60% 0.00%6/30/2014 1,204,383 5,873,279 2,694,860 6,117,134 100.00% 83.60% 0.00%6/30/2015 1,216,585 6,489,863 3,033,878 6,474,849 100.00% 81.00% 0.00%6/30/2016 1,231,027 6,785,530 3,059,900 6,535,372 100.00% 78.20% 0.00%6/30/2017 1,277,432 7,731,682 3,794,396 6,764,873 100.00% 71.00% 0.00%6/30/2018 $1,269,287 $8,196,719 $3,725,500 $6,950,225 100.00% 69.30% 0.00%
CERS (Non-Hazardous Insurance Fund) Actuarial Liabilities
Valuation Date
(1) Active Member Contributions
(2) Retired Members &
Beneficiaries
(3) Active Members
(Employer Portion)Actuarial Value of
Assets% of Actuarial Liabilities Covered by
Actuarial Assets for (1) (2) (3)
6/30/2009 $- $1,478,783 $1,591,603 $1,216,632 100.00% 82.30% 0.00%6/30/2010 1,526,533 1,631,807 1,293,039 100.00% 84.70% 0.00%6/30/2011 - 1,460,808 1,613,165 1,433,451 100.00% 98.10% 0.00%6/30/2012 - 1,146,908 1,223,864 1,512,854 100.00% 100.00% 29.90%6/30/2013 - 1,205,599 1,238,295 1,628,244 100.00% 100.00% 34.10%6/30/2014 - 1,318,183 1,298,732 1,831,199 100.00% 100.00% 39.50%6/30/2015 - 1,372,597 1,535,231 1,997,456 100.00% 100.00% 40.70%6/30/2016 - 1,484,937 1,503,184 2,079,811 100.00% 100.00% 39.60%6/30/2017 - 1,603,438 1,751,713 2,227,401 100.00% 100.00% 35.60%6/30/2018 $- $1,525,322 $1,567,301 $2,371,430 100.00% 100.00% 54.00%
Board Meeting- December 17, 2018 - Audit Committee Report- Mr. John Chilton/ Ms. Kristen Coffey
575

172ACT
CERS (Hazardous Pension Fund) Actuarial Liabilities
Valuation Date
(1) Active Member Contributions
(2) Retired Members &
Beneficiaries
(3) Active Members
(Employer Portion)Actuarial Value of
Assets% of Actuarial Liabilities Covered by
Actuarial Assets for (1) (2) (3)
6/30/2009 $350,309 $1,540,263 $687,873 $1,751,488 100.00% 91.00% 0.00%6/30/2010 369,613 1,622,684 679,855 1,749,464 100.00% 85.00% 0.00%6/30/2011 382,072 1,768,512 708,457 1,779,545 100.00% 79.00% 0.00%6/30/2012 381,672 1,889,884 738,435 1,747,379 100.00% 72.30% 0.00%6/30/2013 390,471 1,988,030 745,705 1,801,691 100.00% 71.00% 0.00%6/30/2014 415,070 2,077,517 796,239 1,967,640 100.00% 74.70% 0.00%6/30/2015 422,359 2,297,703 893,246 2,096,783 100.00% 72.90% 0.00%6/30/2016 428,713 2,388,712 887,031 2,139,119 100.00% 71.60% 0.00%6/30/2017 458,808 2,910,601 1,279,638 2,238,320 100.00% 61.10% 0.00%6/30/2018 $442,637 $3,151,057 $1,198,853 $2,321,721 100.00% 59.60% 0.00%
CERS (Hazardous Insurance Fund) Actuarial Liabilities
Valuation Date
(1) Active Member Contributions
(2) Retired Members &
Beneficiaries
(3) Active Members
(Employer Portion)Actuarial Value of
Assets% of Actuarial Liabilities Covered by
Actuarial Assets for (1) (2) (3)
6/30/2009 $- $725,900 $867,648 $651,131 100.00% 89.70% 0.00%6/30/2010 - 814,300 860,403 692,770 100.00% 85.10% 0.00%6/30/2011 - 771,631 876,071 770,790 100.00% 99.90% 0.00%6/30/2012 - 575,099 789,744 829,041 100.00% 100.00% 32.20%6/30/2013 - 660,955 776,377 892,774 100.00% 100.00% 29.90%6/30/2014 - 700,312 793,553 997,733 100.00% 100.00% 37.50%6/30/2015 - 790,714 713,301 1,087,707 100.00% 100.00% 41.60%6/30/2016 - 879,360 679,458 1,135,784 100.00% 100.00% 37.70%6/30/2017 - 994,764 793,669 1,196,780 100.00% 100.00% 25.50%6/30/2018 $- $1,001,717 $682,311 $1,256,306 100.00% 100.00% 37.30%
Board Meeting- December 17, 2018 - Audit Committee Report- Mr. John Chilton/ Ms. Kristen Coffey
576

173 ACT
Solvency TestAs of June 30, 2018 ($ in Thousands)SPRS (Pension Fund) Actuarial Liabilities
Valuation Date
(1) Active Member Contributions
(2) Retired Members &
Beneficiaries
(3) Active Members
(Employer Portion)Actuarial Value of
Assets% of Actuarial Liabilities Covered by
Actuarial Assets for (1) (2) (3)
6/30/2009 $41,664 $459,585 $101,079 $329,967 100.00% 62.70% 0.00%6/30/2010 42,012 475,893 94,541 304,577 100.00% 55.20% 0.00%6/30/2011 43,574 499,194 91,611 285,581 100.00% 48.50% 0.00%6/30/2012 41,139 523,017 83,533 259,792 100.00% 41.80% 0.00%6/30/2013 39,788 535,720 76,072 241,800 100.00% 37.70% 0.00%6/30/2014 41,831 563,011 76,276 242,742 100.00% 35.70% 0.00%6/30/2015 41,567 605,855 86,734 248,388 100.00% 34.10% 0.00%6/30/2016 41,871 636,499 96,791 234,568 100.00% 30.30% 0.00%6/30/2017 44,798 773,982 148,365 261,320 100.00% 28.00% 0.00%6/30/2018 $43,835 $800,788 $144,905 $268,259 100.00% 28.00% 0.00%
SPRS (Insurance Fund) Actuarial Liabilities
Valuation Date
(1) Active Member Contributions
(2) Retired Members &
Beneficiaries
(3) Active Members
(Employer Portion)Actuarial Value of
Assets% of Actuarial Liabilities Covered by
Actuarial Assets for (1) (2) (3)
6/30/2009 $- $167,091 $196,940 $123,527 100.00% 73.90% 0.00%6/30/2010 - 253,440 181,380 121,175 100.00% 47.80% 0.00%6/30/2011 - 252,440 185,988 123,687 100.00% 49.00% 0.00%6/30/2012 - 190,259 143,645 124,372 100.00% 65.40% 0.00%6/30/2013 - 139,509 82,818 136,321 100.00% 97.70% 0.00%6/30/2014 - 143,402 90,869 155,595 100.00% 100.00% 13.40%6/30/2015 - 170,447 84,392 167,775 100.00% 98.40% 0.00%6/30/2016 - 177,094 80,103 172,704 100.00% 97.50% 0.00%6/30/2017 - 186,390 90,251 180,464 100.00% 96.80% 0.00%6/30/2018 $- $183,151 $78,937 $187,535 100.00% 100.00% 5.60%
Board Meeting- December 17, 2018 - Audit Committee Report- Mr. John Chilton/ Ms. Kristen Coffey
577

174ACT
Active Member ValuationMethodology The actuarial value of assets recognizes a portion of the difference between the market value of assets and the expected market value of assets, based on the investment return assumption. The amount recognized each year is 20% of the difference between market value and expected market value. The Asset Valuation Method was adopted in 2006.
Summary of Active Member Valuation DataAs of June 30, 2018 (in Whole $)KERS Non-Hazardous Schedule of Active Member Valuation Data
Valuation DateNumber of Employers
Total Active Members
Annual Covered Payroll 1
Annual Average Pay
% Increase In Average Pay Average Age
Average Years of Service Credit
6/30/2009 334 46,060 $1,754,413 $38,090 (0.30)% 43.00 8.706/30/2010 334 47,090 1,815,146 38,546 1.20% 43.40 9.006/30/2011 427 46,617 1,731,633 37,146 (3.60)% 43.80 9.406/30/2012 286 42,196 1,644,897 38,982 4.90% 44.30 9.806/30/2013 285 42,226 1,644,409 38,943 (0.10)% 44.50 10.106/30/2014 353 40,365 1,577,496 39,081 0.40% 44.80 10.506/30/2015 348 39,056 1,544,234 39,539 1.20% 45.00 10.606/30/2016 349 37,779 1,529,249 40,479 2.40% 45.10 10.706/30/2017 342 37,234 1,531,535 41,133 1.62% 45.40 10.906/30/2018 338 35,139 $1,471,477 $41,876 1.81% 45.20 10.80
KERS Hazardous Schedule of Active Member Valuation Data
Valuation DateNumber of Employers
Total Active Members
Annual Covered Payroll 1
Annual Average Pay
% Increase In Average Pay Average Age
Average Years of Service Credit
6/30/2009 20 4,334 $146,044 $33,697 (0.50)% 41.40 7.006/30/2010 18 4,291 143,558 33,456 (0.70)% 41.40 7.006/30/2011 16 4,291 133,054 31,008 (7.30)% 41.30 6.906/30/2012 14 4,086 131,977 32,300 4.20% 41.10 7.306/30/2013 14 4,127 132,015 31,988 (1.00)% 40.60 7.206/30/2014 18 4,024 129,076 32,077 0.30% 40.60 7.406/30/2015 17 3,886 128,680 33,114 3.20% 40.70 7.506/30/2016 17 3,959 147,563 37,273 12.60% 40.40 7.506/30/2017 18 4,047 162,418 40,133 7.67% 40.30 7.606/30/2018 18 3,929 $158,213 $40,268 0.34% 39.80 7.30
(1) The Annualized Retirement Allowance is the annualized value of the monthly retirement allowance for retired members and beneficiaries as of the valuation date. Consequently, the values will not match the fiscal year total benefit payments recorded in the financial section.Member data in actuarial section will differ from reported data in other CAFR sections. For this section, the data is reported by account instead of by person (ex: a member could have vested service in KERS, but is currently active in a CERS and is reported in two membership categories).
Board Meeting- December 17, 2018 - Audit Committee Report- Mr. John Chilton/ Ms. Kristen Coffey
578

175 ACT
CERS Non-Hazardous Schedule of Active Member Valuation Data
Valuation DateNumber of Employers
Total Active Members
Annual Covered Payroll 1
Annual Average Pay
% Increase In Average Pay Average Age
Average Years of Service Credit
6/30/2009 1,108 83,724 $2,183,612 $26,081 2.60% 46.20 8.606/30/2010 1,102 84,681 2,236,855 26,415 1.30% 46.60 8.806/30/2011 1,102 85,285 2,276,596 26,694 1.10% 46.80 9.006/30/2012 1,080 83,052 2,236,546 26,929 0.90% 47.50 9.106/30/2013 1,081 81,815 2,236,277 27,333 1.50% 47.80 9.306/30/2014 1,101 81,115 2,272,270 28,013 2.50% 48.10 9.606/30/2015 1,092 80,852 2,296,716 28,406 1.40% 48.00 9.506/30/2016 1,095 80,664 2,352,762 29,167 2.70% 47.90 9.406/30/2017 1,096 82,198 2,452,407 29,835 2.29% 47.90 9.406/30/2018 1,092 81,818 $2,466,801 $30,150 1.06% 47.70 9.20
CERS Hazardous Schedule of Active Member Valuation Data
Valuation DateNumber of Employers
Total Active Members
Annual Covered Payroll 1
Annual Average Pay
% Increase In Average Pay Average Age
Average Years of Service Credit
6/30/2009 290 9,757 $469,315 $48,100 3.20% 38.40 8.806/30/2010 282 9,562 466,549 48,792 1.40% 38.80 9.206/30/2011 281 9,407 466,964 49,640 1.70% 39.10 9.506/30/2012 254 9,130 464,229 50,847 2.40% 39.30 10.306/30/2013 248 9,123 461,673 50,605 (0.50)% 39.10 10.306/30/2014 254 9,194 479,164 52,117 3.00% 39.20 10.606/30/2015 246 9,172 483,641 52,730 1.20% 39.10 10.606/30/2016 246 9,084 492,851 54,255 2.90% 39.10 10.606/30/2017 250 9,495 541,633 57,044 5.14% 39.20 10.506/30/2018 247 9,263 $533,618 $57,607 0.99% 38.50 10.20
SPRS Schedule of Active Member Valuation Data
Valuation DateNumber of Employers
Total Active Members
Annual Covered Payroll 1
Annual Average Pay
% Increase In Average Pay Average Age
Average Years of Service Credit
6/30/2009 1 946 $51,660 $54,609 1.80% 37.30 11.006/30/2010 1 961 51,507 53,597 (1.90)% 37.20 10.606/30/2011 1 965 48,693 50,459 (5.90)% 37.70 10.606/30/2012 1 907 48,373 53,332 5.70% 37.30 10.406/30/2013 1 902 45,256 50,173 (5.90)% 37.00 10.006/30/2014 1 855 44,616 52,182 4.00% 37.80 10.906/30/2015 1 937 45,765 48,842 (6.40)% 36.80 9.806/30/2016 1 908 45,551 50,167 2.71% 37.00 10.006/30/2017 1 903 48,598 53,819 7.28% 37.50 10.606/30/2018 1 886 $48,808 $55,088 2.36% 37.30 10.50
(1) The Annualized Retirement Allowance is the annualized value of the monthly retirement allowance for retired members and beneficiaries as of the valuation date. Consequently, the values will not match the fiscal year total benefit payments recorded in the financial section.Member data in actuarial section will differ from reported data in other CAFR sections. For this section, the data is reported by account instead of by person (ex: a member could have vested service in KERS, but is currently active in a CERS and is reported in two membership categories).
Board Meeting- December 17, 2018 - Audit Committee Report- Mr. John Chilton/ Ms. Kristen Coffey
579
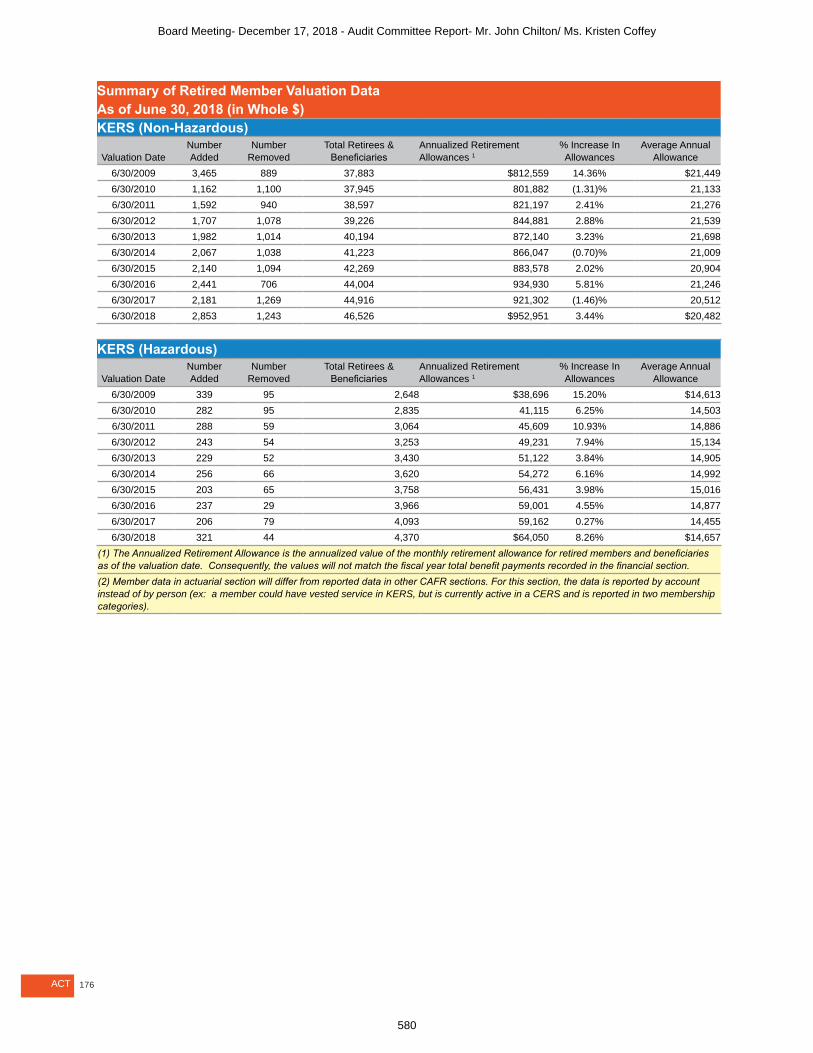
176ACT
Summary of Retired Member Valuation DataAs of June 30, 2018 (in Whole $)KERS (Non-Hazardous)
Valuation DateNumber Added
Number Removed
Total Retirees & Beneficiaries
Annualized Retirement Allowances 1
% Increase In Allowances
Average Annual Allowance
6/30/2009 3,465 889 37,883 $812,559 14.36% $21,4496/30/2010 1,162 1,100 37,945 801,882 (1.31)% 21,1336/30/2011 1,592 940 38,597 821,197 2.41% 21,2766/30/2012 1,707 1,078 39,226 844,881 2.88% 21,5396/30/2013 1,982 1,014 40,194 872,140 3.23% 21,6986/30/2014 2,067 1,038 41,223 866,047 (0.70)% 21,0096/30/2015 2,140 1,094 42,269 883,578 2.02% 20,9046/30/2016 2,441 706 44,004 934,930 5.81% 21,2466/30/2017 2,181 1,269 44,916 921,302 (1.46)% 20,5126/30/2018 2,853 1,243 46,526 $952,951 3.44% $20,482
KERS (Hazardous)
Valuation DateNumber Added
Number Removed
Total Retirees & Beneficiaries
Annualized Retirement Allowances 1
% Increase In Allowances
Average Annual Allowance
6/30/2009 339 95 2,648 $38,696 15.20% $14,6136/30/2010 282 95 2,835 41,115 6.25% 14,5036/30/2011 288 59 3,064 45,609 10.93% 14,8866/30/2012 243 54 3,253 49,231 7.94% 15,1346/30/2013 229 52 3,430 51,122 3.84% 14,9056/30/2014 256 66 3,620 54,272 6.16% 14,9926/30/2015 203 65 3,758 56,431 3.98% 15,0166/30/2016 237 29 3,966 59,001 4.55% 14,8776/30/2017 206 79 4,093 59,162 0.27% 14,4556/30/2018 321 44 4,370 $64,050 8.26% $14,657
(1) The Annualized Retirement Allowance is the annualized value of the monthly retirement allowance for retired members and beneficiaries as of the valuation date. Consequently, the values will not match the fiscal year total benefit payments recorded in the financial section.(2) Member data in actuarial section will differ from reported data in other CAFR sections. For this section, the data is reported by account instead of by person (ex: a member could have vested service in KERS, but is currently active in a CERS and is reported in two membership categories).
Board Meeting- December 17, 2018 - Audit Committee Report- Mr. John Chilton/ Ms. Kristen Coffey
580

177 ACT
CERS (Non-Hazardous)
Valuation DateNumber Added
Number Removed
Total Retirees & Beneficiaries
Annualized Retirement Allowances 1
% Increase In Allowances
Average Annual Allowance
6/30/2009 3,060 883 39,756 $440,061 11.76% $11,0696/30/2010 2,565 1,283 41,038 452,614 2.85% 11,0296/30/2011 3,250 1,077 43,211 483,594 6.84% 11,1916/30/2012 3,300 1,207 45,304 515,008 6.50% 11,3686/30/2013 3,570 1,198 47,676 557,979 8.34% 11,7046/30/2014 3,480 1,221 49,935 582,958 4.48% 11,6746/30/2015 4,020 1,304 52,651 617,551 5.93% 11,7296/30/2016 4,409 721 56,339 661,217 7.07% 11,7366/30/2017 4,141 1,467 59,013 667,468 0.95% 11,3116/30/2018 4,650 1,725 61,938 $710,374 6.43% $11,469
CERS (Hazardous)
Valuation DateNumber Added
Number Removed
Total Retirees & Beneficiaries
Annualized Retirement Allowances 1
% Increase In Allowances
Average Annual Allowance
6/30/2009 650 264 5,808 $139,887 9.73% $24,0856/30/2010 423 163 6,068 146,917 5.03% 24,2126/30/2011 502 102 6,468 160,259 9.08% 24,7776/30/2012 483 73 6,878 173,221 8.09% 25,1856/30/2013 519 104 7,293 182,635 5.43% 25,0426/30/2014 469 116 7,646 191,008 4.58% 24,9816/30/2015 526 138 8,034 202,153 5.84% 25,1626/30/2016 604 75 8,563 215,302 6.50% 25,1436/30/2017 576 141 8,998 226,680 5.28% $25,1926/30/2018 779 190 9,587 $245,675 8.38% $25,626
SPRS State Police Retirement System
Valuation DateNumber Added
Number Removed
Total Retirees & Beneficiaries
Annualized Retirement Allowances 1
% Increase In Allowances
Average Annual Allowance
6/30/2009 75 26 1,184 $44,274 7.22% $37,3946/30/2010 54 15 1,223 45,516 2.80% 37,2176/30/2011 52 12 1,263 47,467 4.29% 37,5836/30/2012 52 16 1,299 49,887 5.10% 38,4046/30/2013 63 16 1,346 50,906 2.04% 37,8206/30/2014 95 28 1,413 53,432 4.96% 37,8156/30/2015 62 15 1,460 54,930 2.80% 37,6246/30/2016 65 10 1,515 56,650 3.13% 37,3936/30/2017 30 9 1,536 57,253 1.06% 37,2746/30/2018 81 17 1,600 $59,626 4.14% $37,266
(1) The Annualized Retirement Allowance is the annualized value of the monthly retirement allowance for retired members and beneficiaries as of the valuation date. Consequently, the values will not match the fiscal year total benefit payments recorded in the financial section.(2) Member data in actuarial section will differ from reported data in other CAFR sections. For this section, the data is reported by account instead of by person (ex: a member could have vested service in KERS, but is currently active in a CERS and is reported in two membership categories).
Board Meeting- December 17, 2018 - Audit Committee Report- Mr. John Chilton/ Ms. Kristen Coffey
581

178ACT
Summary of Benefit Provisions KERS & CERS Non-Hazardous PlansPlan FundingState statute requires active members to contribute 5% of creditable compensation. For members participating on or after September 1, 2008, an additional 1% of creditable compensation is required. This amount is credited to the Insurance Fund and is non-refundable to the member. Employers contribute at the rate determined by the Board to be necessary for the actuarial soundness of the systems, as required by KRS 61.565 and KRS 61.702. KERS rates are subject to state budget approval.
Membership EligibilityFor non-school board employers, all regular full-time positions that average 100 or more hours of work per month over a fiscal or calendar year. For school board employers, all regular full-time positions that average 80 hours of work per month over the actual days worked during the school year.
Retirement Eligibility for Non-Hazardous EmployeesAge Years of Service Allowance Reduction
Tier 1 Members Whose Participation Began Before 9/1/200865 1 month None
Any 27 None55 5 6.5% per year for first five years, and 4.5% for next five years before age 65 or 27 years of service.
Any 25 6.5% per year for first five years, and 4.5% for next five years before age 65 or 27 years of service.
Tier 2 Members Whose Participation Began On or After 9/1/2008 but before 1/1/201465 5 None57 Rule of 87 None60 10 6.5% per year for first five years, and 4.5% for next five years before age 65 or Rule of 87 (age
plus years of service)
Tier 3 Members Whose Participation Began On or After 1/1/201465 5 None57 Rule of 87 None
Board Meeting- December 17, 2018 - Audit Committee Report- Mr. John Chilton/ Ms. Kristen Coffey
582

179 ACT
Benefit FormulaTier 1: Members whose participation began before 9/1/2008Final Compensation Benefit Factor Years of Service KERS 1.97% if: Member does not have 13 months of service credit for 1/1/1998-1/1/1999. KERS 2.00% if: Member has 13 months of service credit from 1/1/1998-1/1/1999. Includes earned service,Average of the KERS 2.20% if: Member has 20 or more years purchased service, prior service,five highest years of of service, including 13 months and sick leave service (if thecompensation. from 1/1/1998-1/1/1999 and member’s employer participates retires by 1/1/2009. in an approved sick leave CERS 2.20% if: Member begins participating program).
prior to 8/1/2004. CERS 2.00% if: Member begins participating on or after 8/1/2004 but before 9/1/2008. If a member retires with less than four years of service credit, the member’s benefit is equal to the actuarially equivalent of two times their member contribution balance with interest.
Tier 2: Members whose participation began on or after 9/1/2008 but before 1/1/2014 KERS & CERS increasing percent based on service at retirement up to 30 years* Includes earned service,Average of the last plus 2.00% for each year of Member begins participating purchased service, prior service,five years of service over 30 years on or after 9/1/2008 but before and sick leave service (if thecompensation *Service Multiplier 1/1/2014. member’s employer participates in 10 years or less 1.10% an approved sick leave program) 10-20 years 1.30% 20-26 years 1.50% 26-30 years 1.75%
Tier 3: Members whose participation began on or after 1/1/2014(A - B) = C X 75% = D then B + D = Interest ($ in Thousands)
A B C D 5 Year Less Upside Upside Sharing Interest Total Interest Geometric Guarantee Sharing Interest X 75% = Rate Earned Credited Average Rate of 4% Interest Upside Gain (4% + Upside) to MemberSystem Return AccountsKERS Non-Hazardous 6.66% 4.00% 2.66% 2.00% 6.00% $2,379KERS Hazardous 7.53% 4.00% 3.53% 2.65% 6.65% 771CERS Non-Hazardous 7.39% 4.00% 3.39% 2.54% 6.54% 4,786CERS Hazardous 7.66% 4.00% 3.66% 2.75% 6.75% 1,284SPRS 6.95% 4.00% 2.95% 2.21% 6.21% $92
Board Meeting- December 17, 2018 - Audit Committee Report- Mr. John Chilton/ Ms. Kristen Coffey
583

180ACT
Summary of Benefit Provisions KERS & CERS Non-Hazardous PlanPost-Retirement Death BenefitsThe choice of payment option selected by the member at the time of retirement will determine the monthly benefits provided to the beneficiary upon the retired member’s death. If the member is receiving a monthly benefit based on at least four (4) years of creditable service, the retirement system will pay a $5,000 death benefit payment to the beneficiary named by the member specifically for this benefit.
Disability BenefitsMembers participating before August 1, 2004, may retire on account of disability provided the member has at least 60 months of service credit and is not eligible for an unreduced benefit. Additional service credit may be added for computation of benefits under the benefit formula. Members participating on or after August 1, 2004, but before January 1, 2014, may retire on account of disability provided the member has at least 60 months of service credit. Benefits are computed as the greater of 20% of member’s monthly final rate of pay or the amount calculated under the Benefit Formula based upon actual service. Members participating on or after January 1, 2014, may retire on account of disability provided the member has at least 60 months of service credit. The hypothetical account which includes member contributions, employer contributions and interest credits can be withdrawn from the System as a lump sum or an annuity equal to the greater of 20% of the member’s monthly final rate of pay or the annuitized hypothetical account into a single life annuity option. Members disabled as a result of a single duty-related injury or act of violence related to their job may be eligible for special benefits.
Pre-Retirement Death BenefitsThe beneficiary of a deceased active member is eligible for a monthly benefit if the member died while in the line of duty. The beneficiary of a deceased active member who did not die in the line of duty is eligible for a monthly benefit if the member was: (1) eligible for retirement at the time of death or, (2) under the age of 55 with at least 60 months of service credit and currently working for a participating agency at the time of death or (3) no longer working for a participating agency but at the time of death had at least 144 months of service credit. If the beneficiary of a deceased active member is not eligible for a monthly benefit, the beneficiary will receive a lump-sum payment of the member’s contributions and any accumulated interest.
Cost of Living AdjustmentSB2 of 2013 eliminated all future COLAs unless the State Legislature so authorizes on a biennial basis and either (i) the system is over 100% funded or (ii) the Legislature appropriates sufficient funds to pay the increased liability for the COLA.
Insurance BenefitsFor members participating prior to July 1, 2003, KRS pays a percentage of the monthly premium for single coverage based upon the service credit accrued at retirement. Members participating on or after July 1, 2003, and before September 1, 2008 are required to earn at least 10 years of service credit in order to be eligible for insurance benefits at retirement. Members participating on or after September 1, 2008, are required to earn at least 15 years of service credit in order to be eligible for insurance benefits at retirement. The monthly health insurance contribution will be $10 for each year of earned service increased by the CPI prior to July 1, 2009, and by 1.5% annually from July 1, 2009.
Board Meeting- December 17, 2018 - Audit Committee Report- Mr. John Chilton/ Ms. Kristen Coffey
584

181 ACT
RefundsUpon termination of employment, a refund of member contributions and accumulated interest is available to the member.
Interest on AccountsFor employees participating prior to September 1, 2008, the interest paid is set by the Board of Trustees and will not be less than 2.0%, for employees participating on or after September 1, 2008, but before January 1, 2014, interest will be credited at a rate of 2.5%. For employees participating on or after January 1, 2014, interest will be credited at a minimum rate of 4.0%.
Benefit Changes since the Prior ValuationDuring the 2018 legislative session, House Bill 185 was enacted, which provided increased pension and insurance benefits for the beneficiaries of active members who die in the line of duty.
Board Meeting- December 17, 2018 - Audit Committee Report- Mr. John Chilton/ Ms. Kristen Coffey
585

182ACT
Summary of Benefit Provisions KERS Hazardous, CERS Hazardous & SPRS PlansPlan FundingState statute requires active members to contribute 8% of creditable compensation. For members participating on or after September 1, 2008, an additional 1% of creditable compensation is required. This amount is credited to the Insurance Fund and is non-refundable to the member. Employers contribute at the rate determined by the Board to be necessary for the actuarial soundness of the systems, as required by KRS 61.565 and KRS 61.702. KERS rates are subject to state budget approval.
Membership EligibilityAll regular full-time hazardous duty positions approved by the Board that average 100 or more hours of work per month over a fiscal or calendar year.
Retirement Eligibility for HazardousAge Years of Service Allowance Reduction
Tier 1 Members Whose Participation Began Before 9/1/200855 1 month None
Any 20 None50 15 6.5% per year for first five years, and 4.5% for next five years before age 55 or 20 years of service.
Tier 2 Members Whose Participation Began On or After 9/1/2008 but before 1/1/201460 5 None
Any 25 None50 15 6.5% per year for first five years, and 4.5% for next five years before age 60 or 25 years of service.
Tier 3 Members Whose Participation Began On or After 1/1/201460 5 None
Any 25 None
Benefit Formula for Hazardous for Tier 1: Members whose participation began before 9/1/2008Final Compensation Benefit Factor Years of Service
Average of the three highest years of compensation.
KERS 2.49% if:
Member begins participating before 9/1/2008.
Includes earned service, purchased service, prior service, and sick leave
service (if the member’s employer participates in an approved sick leave
program.
CERS 2.50% if:
SPRS 2.50% if:
If a member retires with less than four years of service, the member’s benefit is equal to the actuarially equivalent of two times their member contribution balance with interest.
Benefit Formula for Hazardous for Tier 2: Members whose participation began on or after 9/1/2008 but before 1/1/2014Final Compensation Benefit Factor Years of Service
Average of the three highest complete years of compensation.
KERS & CERS & SPRS increasing percent based on service at retirement*
Member begins participating on or after 9/1/2008 but before 1/1/2014.
Includes earned service, purchased service, prior service, and sick leave service (if the member’s employer participates in an approved sick leave program).
*Service Multiplier10 years or less 1.30%10-20 years 1.50%20-25 years 2.25%25+ years 2.50%
Benefit Formula for Hazardous for Tier 3: Members whose participation began on or after 1/1/2014No benefit factor for Tier 3. A life annuity can be calculated in accordance with actuarial assumptions and methods adopted by the board based on the member’s accumulated account balance in the hybrid cash balance plan.
Board Meeting- December 17, 2018 - Audit Committee Report- Mr. John Chilton/ Ms. Kristen Coffey
586

183 ACT
Summary of Benefit Provisions KERS Hazardous, CERS Hazardous & SPRS PlansPost-Retirement Death BenefitsThe choice of payment option selected by the member at the time of retirement will determine the monthly benefits provided to the beneficiary upon the retired member’s death. If the member is receiving a monthly benefit based on at least four (4) years of creditable service, the retirement system will pay a $5,000 death benefit payment to the beneficiary named by the member specifically for this benefit.
Disability BenefitsMembers participating before August 1, 2004, may retire on account of disability provided the member has at least 60 months of service credit and is not eligible for an unreduced benefit. Additional service credit may be added for computation of benefits under the benefit formula.
Members participating on or after August 1, 2004, but before January 1, 2014, may retire on account of disability provided the member has at least 60 months of service credit. Benefits are computed as the greater of 25% of the member’s monthly final rate of pay or the amount calculated under the Benefit Formula based upon actual service.
Members participating on or after January 1, 2014, may retire on account of disability provided the member has at least 60 months of service credit. The hypothetical account which includes member contributions, employer contributions and interest credits can be withdrawn from the System as a lump sum or an annuity equal to the greater of 25% of the member’s monthly final rate of pay or the annuitized hypothetical account into a single life annuity option.
Members disabled as a result of a single duty-related injury or act of violence related to their job may be eligible for special benefits.
Pre-Retirement Death BenefitsThe beneficiary of a deceased active member is eligible for a monthly benefit if the member died while in the line of duty. The beneficiary of a deceased active member who did not die in the line of duty is eligible for a monthly benefit if the member was: (1) eligible for retirement at the time of death or, (2) under the age of 55 with at least 60 months of service credit and currently working for a participating agency at the time of death or (3) no longer working for a participating agency but at the time of death had at least 144 months of service credit. If the beneficiary of a deceased active member is not eligible for a monthly benefit, the beneficiary will receive a lump sum payment of the member’s contributions and any accumulated interest.
Cost of Living AdjustmentSB2 of 2013 eliminated all future COLAs unless the State Legislature so authorizes on a biennial basis and either (i) the system is over 100% funded or (ii) the Legislature appropriates sufficient funds to pay the increased liability for the COLA.
Insurance BenefitsFor members participating prior to July 1, 2003, KRS pays a percentage of the monthly premium for single coverage based upon the service credit accrued at retirement. Members participating on or after July 1, 2003, and before September 1, 2008, are required to earn at least 10 years of service credit in order to be eligible for insurance benefits at retirement. Members participating on or after September 1, 2008 are required to earn at least 15 years of service credit in order to be eligible for insurance benefits at retirement. The monthly health insurance contribution will be $15 for each year of earned service increased by the CPI prior to July 1, 2009, and by 1.5% annually from July 1, 2009.
Board Meeting- December 17, 2018 - Audit Committee Report- Mr. John Chilton/ Ms. Kristen Coffey
587
184ACT
RefundsUpon termination of employment, a refund of member contributions and accumulated interest is available to the member.
Interest on AccountsFor employees participating prior to September 1, 2008, the interest paid is set by the Board of Trustees and will not be less than 2.0%, for employees participating on or after September 1, 2008, but before January 1, 2014, interest will be credited at a rate of 2.5%. For employees participating on or after January 1, 2014, interest will be credited at a minimum rate of 4.0%.
Benefit Changes since the Prior ValuationDuring the 2018 legislative session, House Bill 185 was enacted, which provided increased pension and insurance benefits for active members who die in the line of duty.
Membership EligibilityAll regular full-time hazardous duty positions approved by the Board that average 100 or more hours of work per month over a fiscal or calendar year.
Board Meeting- December 17, 2018 - Audit Committee Report- Mr. John Chilton/ Ms. Kristen Coffey
588

STATISTICAL TABLE OF CONTENTS
185
186 FUND STATISTICS188 PARTICIPATING EMPLOYERS190 MEMBER MONTHLY BENEFIT191 FIDUCIARY NET POSITION197 SCHEDULE OF BENEFIT EXPENSES202 ANALYSIS OF INITIAL RETIREES203 PAYMENT OPTIONS204 EMPLOYER CONTRIBUTION RATES205 INSURANCE CONTRACTS
Board Meeting- December 17, 2018 - Audit Committee Report- Mr. John Chilton/ Ms. Kristen Coffey
589

186S T AT
FUND StatisticsDEFINITIONSActive members are those members who are currently employed by a participating agency and contributing to the Systems as a condition of employment. Inactive members are those members who are no longer employed with a participating agency but have not yet retired or taken a refund of contributions. Retired members include both members and beneficiaries who are receiving a monthly benefit from the Systems. A single member may have multiple accounts, which contribute to one pension. Each person is only counted once in the Membership by System report. A member who has both a membership account and a retired account is included in the retired count. Members who have multiple membership accounts are included under the system where they most recently contributed. Members who have more than one retirement account are included in the system with the greatest service credit. If the retired accounts have equal service credit, they are counted first in SPRS, CERS Hazardous, KERS Hazardous, CERS Non-Hazardous, then KERS Non-Hazardous. These tables do not include individuals receiving payments under dependent child accounts, Qualified Domestic Relations Orders, or multiple beneficiary accounts.
Board Meeting- December 17, 2018 - Audit Committee Report- Mr. John Chilton/ Ms. Kristen Coffey
590

187 S T AT
KERS Non-Hazardous Membership As of June 30, 2018Fiscal Year Active Inactive Retired Total2013 40,710 40,375 37,240 118,3252014 40,500 41,213 38,022 119,7352015 39,289 42,479 38,827 120,5952016 38,121 43,926 40,099 122,1462017 36,725 44,848 40,813 122,3862018 34,845 45,768 42,175 122,788
KERS Hazardous Membership As of June 30, 2018Fiscal Year Active Inactive Retired Total2013 4,057 2,882 2,312 9,2512014 4,094 3,318 2,467 9,8792015 3,932 3,761 2,575 10,2682016 3,987 4,067 2,739 10,7932017 4,061 4,363 2,823 11,2472018 3,963 4,716 3,010 11,689
CERS Non-Hazardous Membership As of June 30, 2018Fiscal Year Active Inactive Retired Total2013 82,631 67,013 44,164 193,8082014 82,494 70,231 46,112 198,8372015 82,969 72,965 48,515 204,4492016 83,346 75,904 51,673 210,9232017 84,401 78,940 54,018 217,3592018 84,435 81,608 56,629 222,672
CERS Hazardous Membership As of June 30, 2018Fiscal Year Active Inactive Retired Total2013 9,069 1,956 5,840 16,8652014 9,189 2,038 6,066 17,2932015 9,188 2,142 6,389 17,7192016 9,139 2,309 6,834 18,2822017 9,321 2,442 7,186 18,9492018 9,285 2,581 7,647 19,513
SPRS Membership As of June 30, 2018Fiscal Year Active Inactive Retired Total2013 901 236 1,240 2,3772014 861 239 1,279 2,3792015 940 257 1,324 2,5212016 924 262 1,379 2,5652017 910 278 1,393 2,5812018 891 290 1,445 2,626
Kentucky Retirement Systems Membership Totals As of June 30, 2018Fiscal Year Active Inactive Retired Total2013 137,368 112,462 90,796 340,6262014 137,138 117,039 93,946 348,1232015 136,318 121,604 97,630 355,5522016 135,517 126,468 102,725 364,7102017 135,418 130,871 106,234 372,5232018 133,419 134,963 110,906 379,288
Board Meeting- December 17, 2018 - Audit Committee Report- Mr. John Chilton/ Ms. Kristen Coffey
591

188S T AT
Principal Participating Employers in KERS As of June 30, 2018
Participating Employer RankCovered
Employees
% of Total
SystemDepartment for Community Based Services 1 4,572 11.54%Department of Corrections 2 3,798 9.59%Department of Highways 3 3,710 9.37%Judicial Department Administrative Office of the Courts 4 1,393 3.52%Department of Juvenile Justice 5 1,195 3.02%Bluegrass.org 6 940 2.37%Kentucky State Police 7 904 2.28%Unified Prosecutorial System 8 862 2.18%Department of Veterans Affairs 9 847 2.14%Department of Revenue 10 809 2.04%All Others 20,577 51.95%Total 39,607 100.00%
Schedule of Participating Employers in KERS As of June 30, 2018
Agency ClassificationNumber of Agencies
Number of Employees
County Attorneys 61 297Health Departments 60 2,474Master Commissioner 34 72Non-P1 State Agencies 36 896Other Retirement Systems 1 27P1 State Agencies 137 30,136Regional Mental Health Units 12 2,371Universities 7 3,334Total 348 39,607
Total Employees By Tier LevelsTier 1 20,811Tier 2 7,791Tier 3 11,005
Principal Participating Employers in CERS As of June 30, 2018
Participating Employer RankCovered
Employees% of Total
SystemJefferson County Board of Education 1 6,447 6.82%Louisville Jefferson County Metro Government 2 5,098 5.39%Fayette County Board of Education 3 1,918 2.03%Lexington Fayette Urban County Government 4 1,728 1.83%Judicial Department Administrative Office of the Courts 5 1,658 1.75%Boone County Board of Education 6 1,155 1.22%Bullitt County Board of Education 7 1,137 1.20%Hardin County Board of Education 8 1,105 1.17%Pike County Board of Education 9 974 1.03%Warren County Board of Education 10 958 1.01%All Others 72,407 76.55%
Total 94,585 100.00%
Board Meeting- December 17, 2018 - Audit Committee Report- Mr. John Chilton/ Ms. Kristen Coffey
592
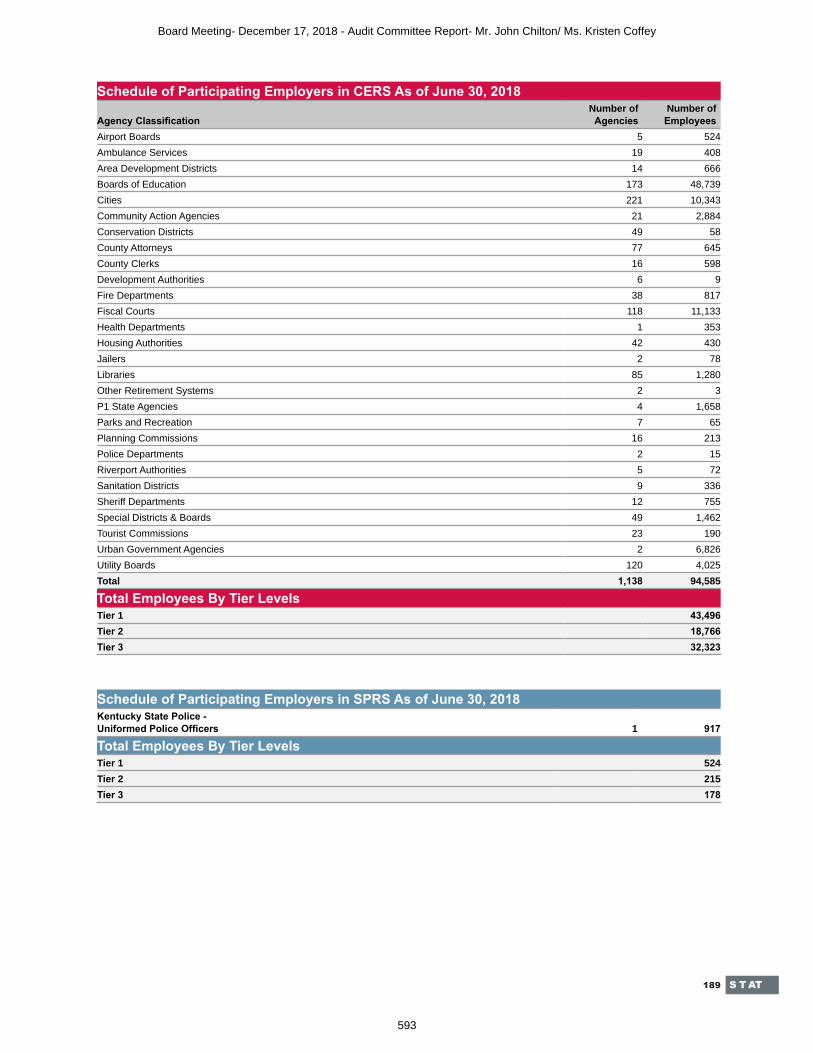
189 S T AT
Schedule of Participating Employers in CERS As of June 30, 2018
Agency ClassificationNumber of Agencies
Number of Employees
Airport Boards 5 524Ambulance Services 19 408Area Development Districts 14 666Boards of Education 173 48,739Cities 221 10,343Community Action Agencies 21 2,884Conservation Districts 49 58County Attorneys 77 645County Clerks 16 598Development Authorities 6 9Fire Departments 38 817Fiscal Courts 118 11,133Health Departments 1 353Housing Authorities 42 430Jailers 2 78Libraries 85 1,280Other Retirement Systems 2 3P1 State Agencies 4 1,658Parks and Recreation 7 65Planning Commissions 16 213Police Departments 2 15Riverport Authorities 5 72Sanitation Districts 9 336Sheriff Departments 12 755Special Districts & Boards 49 1,462Tourist Commissions 23 190Urban Government Agencies 2 6,826Utility Boards 120 4,025Total 1,138 94,585
Total Employees By Tier LevelsTier 1 43,496Tier 2 18,766Tier 3 32,323
Schedule of Participating Employers in SPRS As of June 30, 2018Kentucky State Police - Uniformed Police Officers 1 917
Total Employees By Tier LevelsTier 1 524Tier 2 215Tier 3 178
Board Meeting- December 17, 2018 - Audit Committee Report- Mr. John Chilton/ Ms. Kristen Coffey
593

190S T AT
Average Monthly Benefit by Length of Service in KERS As of June 30, 2018 (in Whole $)
Service Credit Range
KERS Non-Hazardous KERS Hazardous
Number of Accounts
Average Monthly Benefit
Number of Accounts
Average Monthly Benefit
Under 5 years 5,990 $175 811 $2005 or more but less than 10 6,020 430 841 57110 or more but less than 15 5,476 716 761 1,01615 or more but less than 20 4,648 1,049 675 1,53220 or more but less than 25 5,018 1,396 1,053 2,01225 or more but less than 30 12,587 2,291 189 2,82130 or more but less than 35 6,685 3,236 61 3,56435 or more 2,561 4,563 6 4,231Total 48,985 $1,666 4,397 $1,215
Average Monthly Benefit by Length of Service in CERS As of June 30, 2018 (in Whole $)
Service Credit Range
CERS Non-Hazardous CERS Hazardous
Number of Accounts
Average Monthly Benefit
Number of Accounts
Average Monthly Benefit
Under 5 years 8,707 $163 1,102 $3805 or more but less than 10 11,171 339 1,077 69410 or more but less than 15 10,975 535 976 1,23515 or more but less than 20 9,051 795 951 1,76920 or more but less than 25 10,129 999 3,658 2,51725 or more but less than 30 11,777 1,918 1,419 3,51130 or more but less than 35 2,851 2,696 421 4,23235 or more 754 3,675 94 5,269Total 65,415 $939 9,698 $2,116
Average Monthly Benefit by Length of Service in SPRS As of June 30, 2018 (in Whole $)
Service Credit RangeNumber of Accounts
Average Monthly Benefit
Under 5 years 135 $5465 or more but less than 10 55 92910 or more but less than 15 58 1,36715 or more but less than 20 109 2,02020 or more but less than 25 481 2,67125 or more but less than 30 485 3,63430 or more but less than 35 239 4,75035 or more 61 6,053Total 1,623 $3,066 Note: These tables reflect the Average Monthly Pension Benefit. A single member may have multiple accounts, which contribute to one pension. These tables do not reflect dependent child accounts, Qualified Domestic Relations Order (QDRO) accounts or multiple beneficiary accounts.
Board Meeting- December 17, 2018 - Audit Committee Report- Mr. John Chilton/ Ms. Kristen Coffey
594

191 S T AT
Fiduciary Net Position - KERSAs of June 30, 2018 ($ in Thousands) Non-Hazardous HazardousFiscal Year Pension Insurance Total Pension Insurance Total2012 $2,977,935 $418,490 $3,396,425 $476,589 $330,730 $807,3192013 2,760,753 496,040 3,256,793 514,592 372,883 887,4752014 2,578,290 646,905 3,225,195 561,484 433,525 995,0092015 2,327,782 665,639 2,993,421 552,468 439,113 991,5812016 1,980,292 668,318 2,648,610 527,880 437,880 965,2772017 2,092,781 781,406 2,874,187 605,921 484,442 1,090,3632018 $2,048,890 $846,762 $2,895,652 $651,173 $513,384 $1,164,557
Fiduciary Net Position - CERSAs of June 30, 2018 ($ in Thousands) Non-Hazardous HazardousFiscal Year Pension Insurance Total Pension Insurance Total2012 $5,381,602 $1,428,821 $6,810,423 $1,672,970 $785,874 $2,458,8442013 5,795,568 1,618,960 7,414,528 1,833,571 891,320 2,724,8912014 6,528,147 1,878,711 8,406,858 2,087,002 1,030,303 3,117,3052015 6,440,800 1,920,946 8,361,746 2,078,202 1,056,480 3,134,6822016 6,141,396 1,908,550 8,049,946 2,010,177 1,056,097 3,066,2742017 6,739,142 2,160,553 8,899,695 2,227,679 1,179,313 3,406,9922018 $7,086,322 $2,346,767 $9,433,089 $2,361,047 $1,268,272 $3,629,319
Fiduciary Net Position - SPRSAs of June 30, 2018 ($ in Thousands)Fiscal Year Pension Insurance Total2012 $250,476 $125,398 $375,8742013 248,698 142,691 391,3892014 260,974 164,958 425,9322015 247,229 164,714 411,9432016 218,013 160,949 378,9622017 256,383 178,191 434,5742018 $268,425 $189,994 $458,419For additional historical data for all charts presented, please visit our website for previous annual reports at https://kyret.ky.gov/Publications/ Pages/Comprehensive-Annual-Financial- Reports.aspx
Fiduciary Net Position - KRSAs of June 30, 2018 ($ in Thousands)Fiscal Year Pension Insurance Total2012 $10,758,706 $3,089,313 $13,848,0192013 11,153,182 3,521,894 14,675,0762014 12,015,897 4,154,402 16,170,2992015 11,646,481 4,246,892 15,893,3732016 10,877,757 4,231,311 15,109,0682017 11,921,906 4,783,905 16,705,8112018 $12,415,857 $5,165,179 $17,581,036Note: For additional historical data for all charts presented, please visit our website for previous annual reports at https://kyret.ky.gov/Publications/ Pages/Comprehensive-Annual-Financial- Reports.aspx
Board Meeting- December 17, 2018 - Audit Committee Report- Mr. John Chilton/ Ms. Kristen Coffey
595

192S T AT
Changes in Fiduciary Net Position - KERS Non-Hazardous Pension FundAs of June 30, 2018 ($ in Thousands)Additions 2012 2013 2014 2015 2016 2017 2018Members’ Contributions $96,418 $96,744 $92,941 $100,424 $101,677 $100,544 $104,972Employers’ Contributions 211,071 280,874 296,836 520,949 512,670 644,803 619,988General Fund Appropriations 58,193 67,574Health Insurance Contributions (HB1) 5,337 3,344 4,546 4,181 4,817 5,156 5,786Employer Cessation 53,215 17Net Investment Income (Loss) 9,789 303,011 337,174 44,094 (20,662) 220,985 147,577Bank of America Settlement 8,442 -Northern Trust Settlement 301Pension Spiking 743 414 909 1,564Total Additions 322,615 683,973 732,246 679,308 598,916 1,083,805 947,779DeductionsBenefit Payments 858,151 873,906 889,937 905,790 923,288 948,489 967,374Refunds 12,004 12,907 13,627 13,552 12,130 11,819 13,603Administrative Expenses 8,776 10,719 11,145 10,474 10,807 10,974 10,692Capital Project Expenses 8 181 34 -Total Deductions 878,939 897,532 914,709 929,816 946,406 971,316 991,669Net Increase (Decrease in Plan Net Position $(556,324) $(213,559) $(182,463) $(250,508) $(347,490) $112,489 $(43,890)
KERS Non-Hazardous Insurance FundAdditions 2012 2013 2014 2015 2016 2017 2018Employers’ Contributions $146,844 $162,191 $164,176 $132,208 $131,935 $133,024 $132,364Net Investment Income (Loss) (4,803) 40,661 96,578 8,690 (3,904) 90,915 61,331Retired Re-employed (HB1) 3,732 3,880 3,765 4,055Member Drug Reimbursement 7,865 4,846 8 1 5Premiums Received from Retirees 15,666 14,294 918 272 240 248 216Employer Cessations 15,567 -Northern Trust Settlement 32Total Additions 165,563 221,992 264,273 144,902 132,151 243,520 198,003DeductionsHealth Insurance Premiums 163,841 140,157 112,671 125,272 126,550 127,648 130,069Administrative Expenses 5,203 4,285 736 893 818 861 760Self-Funded Healthcare Costs 1,920 1,819Excise Tax Insurance 3 3Total Deductions 169,044 144,442 113,407 126,168 129,469 130,432 132,651Net Increase (Decrease) in Plan Net Position $169,044 $77,550 $150,865 $18,734 $2,679 $113,088 $65,352
Board Meeting- December 17, 2018 - Audit Committee Report- Mr. John Chilton/ Ms. Kristen Coffey
596

193 S T AT
Changes in Fiduciary Net Position - KERS Hazardous Pension FundAs of June 30, 2018 ($ in Thousands)Additions 2012 2013 2014 2015 2016 2017 2018Members’ Contributions $11,602 $11,467 $11,995 $12,670 $15,055 $17,523 $17,891Employers’ Contributions 17,367 27,334 11,670 28,374 23,690 37,630 32,790General Fund Appropriations 15,000 10,000Health Insurance Contributions (HB1) 629 402 551 537 684 811 909Net Investment Income (Loss) (10,286) 51,497 80,549 8,572 (1,652) 70,893 51,848Bank of America Settlement 767 -Northern Trust Settlement 33Pension Spiking 162 70 344 871Total Additions 19,312 90,700 104,941 51,211 37,847 142,301 114,342DeductionsBenefit Payments 48,424 48,855 54,320 56,774 59,306 61,231 65,616Refunds 2,543 2,762 2,830 2,609 2,211 2,106 2,501Administrative Expenses 877 733 897 844 903 919 975Capital Project Expenses 15 4 -Total Deductions 51,844 52,350 58,048 60,277 62,435 64,260 69,092Net Increase (Decrease) in Plan Net Position $(32,532) $38,350 $46,892 $(9,016) $(24,588) $78,041 $45,250
KERS Hazardous Insurance FundAdditions 2012 2013 2014 2015 2016 2017 2018Employers’ Contributions $23,984 $25,144 $23,336 $14,173 $15,929 $4,688 $4,302Net Investment Income (Loss) 60 32,887 52,082 7,793 (882) 59,188 42,567Retired Re-employed (HB1) - - - 709 837 932 986Member Drug Reimbursement 351 243 - - - - -Premiums Received from Retirees 876 895 37 14 (13) (51) (50)Northern Trust Settlement 18Total Additions 25,271 59,169 76,126 22,689 15,871 64,757 47,823DeductionsHealth Insurance Premiums 13,941 16,837 15,405 17,000 17,490 17,562 18,697Administrative Expenses 335 179 78 101 97 105 104Self-Funded Healthcare Costs 45 79Excise Tax Insurance -Total Deductions 14,276 17,016 15,482 17,101 17,587 17,712 18,880Net Increase (Decrease) in Plan Net Position $10,995 $42,153 $60,642 $5,588 $(1,716) $47,045 $28,943
Board Meeting- December 17, 2018 - Audit Committee Report- Mr. John Chilton/ Ms. Kristen Coffey
597

194S T AT
Changes in Fiduciary Net Position - CERS Non-Hazardous Pension FundAs of June 30, 2018 ($ in Thousands)Additions 2012 2013 2014 2015 2016 2017 2018Members’ Contributions $119,123 $120,777 $122,459 $133,637 $133,987 $150,714 $160,370Employers’ Contributions 270,664 294,914 324,231 297,714 282,767 331,493 355,473Health Insurance Contributions (HB1) 5,101 4,659 6,109 6,674 7,687 9,158 10,826Net Investment Income (Loss) (3,349) 579,161 893,386 110,569 (40,799) 825,901 578,377Bank of America Settlement 10,280 -Northern Trust Settlement 361Pension Spiking 850 1,339 2,061 2,544Total Additions 391,539 999,511 1,348,330 559,724 384,981 1,319,327 1,107,951DeductionsBenefit Payments 524,385 553,204 582,850 615,335 651,247 687,460 726,568Refunds - 13,306 14,286 13,524 13,754 14,430 14,608Administrative Expenses 16,740 17,743 18,615 18,212 19,078 19,614 19,592Capital Project Expenses 9 307 77 -Total Deductions 553,899 584,253 615,751 647,071 684,385 721,581 760,768Net Increase (Decrease) in Plan Net Position $(162,360) $415,258 $732,579 $(87,347) $(299,404) $597,746 $347,183
CERS Non-Hazardous Insurance FundAdditions 2012 2013 2014 2015 2016 2017 2018Employers’ Contributions $164,297 $158,212 $121,161 $115,836 $108,269 $117,310 $120,798Net Investment Income (Loss) (32,992) 147,194 231,743 36,731 (1,422) 259,586 197,520Retired Re-employed (HB1) 3,608 3,567 3,402 3,821Member Drug Reimbursement 8,443 5,360 6 1 11Northern Trust Settlement 75Premiums Received from Retirees 17,493 16,293 1,449 582 629 707 637Total Additions 157,241 327,059 357,064 156,757 111,043 121,420 322,862DeductionsHealth Insurance Premiums 141,694 132,489 96,804 113,734 122,713 124,573 131,631Administrative Expenses 5,545 4,431 508 782 726 789 761Self-Funded Healthcare Costs 3,635 4,248Excise Tax Insurance 6 6Total Deductions 147,239 136,920 97,312 114,522 123,439 129,003 136,646Net Increase (Decrease) in Plan Net Position $10,002 $190,139 $259,751 $42,235 $(12,396) $252,003 $186,216
Board Meeting- December 17, 2018 - Audit Committee Report- Mr. John Chilton/ Ms. Kristen Coffey
598

195 S T AT
Changes in Fiduciary Net Position - CERS Hazardous Pension FundAs of June 30, 2018 ($ in Thousands)Additions 2012 2013 2014 2015 2016 2017 2018Members’ Contributions $41,797 $42,863 $42,631 $46,609 $51,554 $60,102 $61,089Employers’ Contributions 77,311 120,140 115,240 107,515 104,952 114,315 124,953Health Insurance Contributions (HB1) 811 734 1,091 1,084 1,418 1,708 2,173Net Investment Income (Loss) (24,724) 181,171 287,816 37,104 (9,021) 270,473 192,174Bank of America Settlement 2,865 -Northern Trust Settlement 111Pension Spiking 557 762 1,632 2,707Total Additions 95,195 344,908 447,452 195,734 149,665 177,757 383,207DeductionsBenefit Payments 169,352 179,696 189,635 200,134 213,448 226,985 244,119Refunds 3,516 3,158 2,664 3,111 2,879 2,315 4,214Administrative Expenses 1,319 1,202 1,721 1,289 1,337 1,421 1,504Capital Project Expenses - 26 7 -Total Deductions 174,187 184,056 194,020 204,534 217,690 230,728 249,837Net Increase (Decrease) in Plan Net Position $(79,992) $160,852 $253,431 $(8,800) $(68,025) $217,502 $133,370
CERS Hazardous Insurance FundAdditions 2012 2013 2014 2015 2016 2017 2018Employers’ Contributions $90,204 $84,962 $74,265 $71,008 $66,575 $50,743 $55,027Net Investment Income (Loss) (16,127) 79,885 124,952 20,283 1,102 142,744 109,004Retired Re-employed (HB1) 770 862 794 975Member Drug Reimbursement 871 562 -Northern Trust Settlement 40Premiums Received from Retirees 695 657 32 10 (106) (301) (265)Total Additions 75,643 166,066 200,101 92,071 68,615 51,236 164,781DeductionsHealth Insurance Premiums 50,155 59,941 60,843 65,553 68,518 70,407 74,844Administrative Expenses 688 679 275 339 480 381 376Self-Funded Healthcare Costs 160 603Excise Tax Insurance -Total Deductions 50,843 60,620 61,117 65,894 68,998 70,948 75,823Net Increase (Decrease) in Plan Net Position $24,800 $105,446 $138,983 $26,177 $(383) $123,216 $88,958
Board Meeting- December 17, 2018 - Audit Committee Report- Mr. John Chilton/ Ms. Kristen Coffey
599

196S T AT
Changes in Fiduciary Net Position - SPRS Pension FundAs of June 30, 2018 ($ in Thousands)Additions 2012 2013 2014 2015 2016 2017 2018Members’ Contributions $5,154 $4,495 $5,005 $5,150 $5,149 $5,349 $5,522Employers’ Contributions 15,040 18,501 20,279 31,444 25,723 38,028 36,486General Fund Appropriations 10,000Health Insurance Contributions (HB1) 46 48 70 94 113 131 155Net Investment Income (Loss) 43 25,954 40,291 3,427 (3,841) 26,756 18,487Bank of America Settlement 646 -Northern Trust Settlement 21Pension Spiking 546 99 210 392Total Additions 20,283 48,998 65,729 41,307 27,243 68,718 71,063DeductionsBenefit Payments 48,867 50,559 53,026 54,766 56,268 56,935 58,805Refunds 149 31 214 85 11 26 22Administrative Expenses 73 184 215 201 176 181 194Capital Project Expenses 4 1 -Total Deductions 49,089 50,774 53,454 55,052 56,459 57,143 59,021Net Increase (Decrease in Plan Net Position $(28,806) $(1,776) $12,276 $(13,745) $(29,216) $38,370 $12,042
SPRS Insurance FundAdditions 2012 2013 2014 2015 2016 2017 2018Employers’ Contributions $10,810 $16,829 $14,498 $10,379 $10,228 $9,222 $9,397Net Investment Income (Loss) (1,458) 12,993 20,458 2,921 (48) 21,570 16,420Retired Re-employed (HB1) 3 9 -Member Drug Reimbursement 279 178 -Northern Trust Settlement 8Premiums Received from Retirees 20 23 11 1 (29) (55) (41)Total Additions 9,651 30,023 35,012 13,304 10,160 9,167 25,784DeductionsHealth Insurance Premiums 10,791 12,546 12,688 13,483 13,836 13,405 13,881Administrative Expenses 201 184 58 65 89 66 62Self-Funded Healthcare Costs 24 38Excise Tax Insurance -Total Deductions 10,992 12,730 12,745 13,548 13,925 13,495 13,981Net Increase (Decrease) in Plan Net Position $(1,341) $17,293 $22,267 $(244) $(3,765) $17,242 $11,803
Board Meeting- December 17, 2018 - Audit Committee Report- Mr. John Chilton/ Ms. Kristen Coffey
600

197 S T AT
Schedule of Benefit Expenses As of June 30, 2018 (in Whole $)KERS Non-Hazardous
Normal
RetirementEarly
RetirementDisability
RetirementBeneficiary Payments
Fiscal Year 2013 Average Benefit $1,003 $1,915 $1,020 $889Number of Accounts 6,441 32,310 2,687 962Total Monthly Benefits $6,459,840 $61,882,399 $2,740,491 $855,033% of Total Monthly Benefits 8.98% 86.02% 3.81% 1.19%Fiscal Year 2014 Average Benefit $992 $1,911 $987 $886Number of Accounts 6,678 33,106 2,706 954Total Monthly Benefits $6,624,472 $63,255,779 $2,671,749 $845,468% of Total Monthly Benefits 9.03% 86.18% 3.64% 1.15%Fiscal Year 2015 Average Benefit $992 $1,901 $996 $909Number of Accounts 6,896 33,940 2,696 983Total Monthly Benefits $6,843,193 $64,503,048 $2,684,720 $893,407% of Total Monthly Benefits 9.13% 86.09% 3.58% 1.19%Fiscal Year 2016 Average Benefit $989 $1,886 $1,005 $902Number of Accounts 7,390 35,192 2,770 1,014Total Monthly Benefits $7,312,293 $66,383,638 $2,784,928 $914,804% of Total Monthly Benefits 9.45% 85.77% 3.60% 1.18%Fiscal Year 2017 Average Benefit $992 $1,883 $1,013 $924Number of Accounts 7,628 35,890 2,772 1,028Total Monthly Benefits $7,565,780 $67,591,003 $2,807,938 $950,318% of Total Monthly Benefits 9.59% 85.65% 3.56% 1.20%Fiscal Year 2018 Average Benefit $998 $1,879 $1,019 $940Number of Accounts 8,070 37,141 2,767 1,007Total Monthly Benefits $8,049,794 $69,780,011 $2,818,593 $946,466% of Total Monthly Benefits 9.87% 85.52% 3.45% 1.16%Note: This table includes individuals receiving a monthly benefit as of June 30 in the indicated fiscal year. A single member may have multiple accounts which contribute to one pension. This table represents all individuals receiving a benefit including dependent children, Qualified Domestic Relations Order (QDRO) accounts and multiple beneficiary accounts. If a member has died or a disability decision is pending, the monthly benefit amount is reflected as zero until the account status changes.
Board Meeting- December 17, 2018 - Audit Committee Report- Mr. John Chilton/ Ms. Kristen Coffey
601
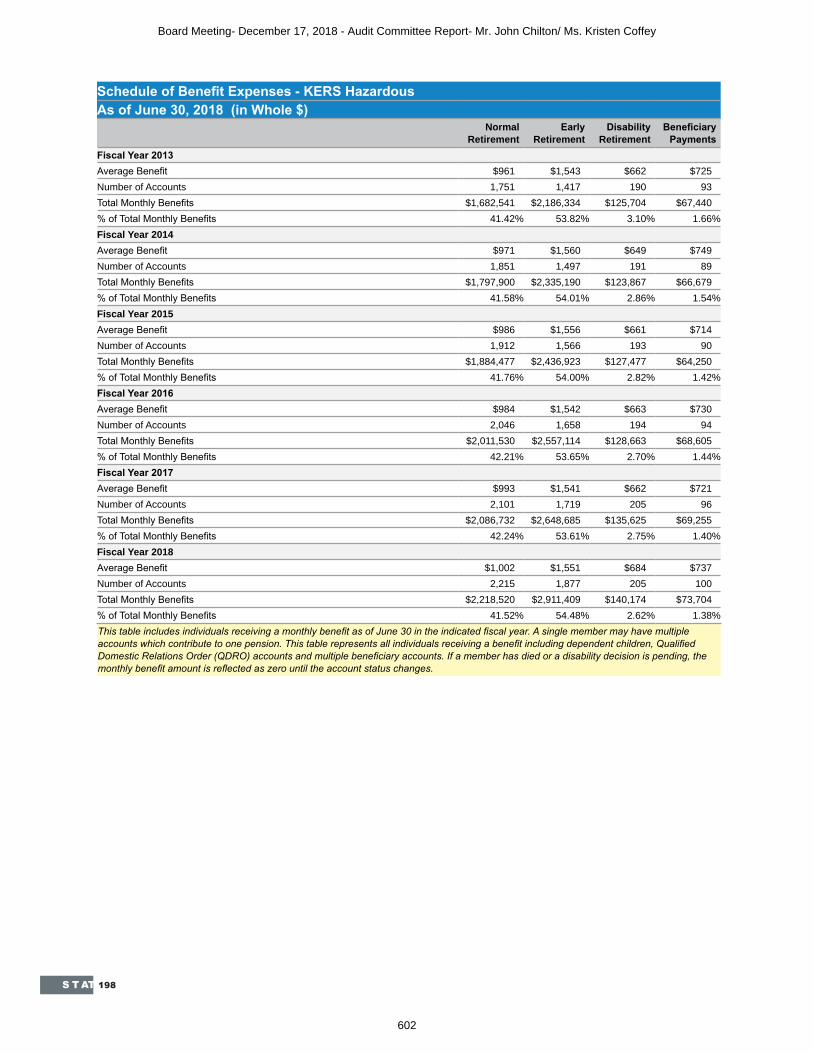
198S T AT
Schedule of Benefit Expenses - KERS HazardousAs of June 30, 2018 (in Whole $)
Normal
RetirementEarly
RetirementDisability
RetirementBeneficiary
PaymentsFiscal Year 2013 Average Benefit $961 $1,543 $662 $725Number of Accounts 1,751 1,417 190 93Total Monthly Benefits $1,682,541 $2,186,334 $125,704 $67,440% of Total Monthly Benefits 41.42% 53.82% 3.10% 1.66%Fiscal Year 2014 Average Benefit $971 $1,560 $649 $749Number of Accounts 1,851 1,497 191 89Total Monthly Benefits $1,797,900 $2,335,190 $123,867 $66,679% of Total Monthly Benefits 41.58% 54.01% 2.86% 1.54%Fiscal Year 2015 Average Benefit $986 $1,556 $661 $714Number of Accounts 1,912 1,566 193 90Total Monthly Benefits $1,884,477 $2,436,923 $127,477 $64,250% of Total Monthly Benefits 41.76% 54.00% 2.82% 1.42%Fiscal Year 2016 Average Benefit $984 $1,542 $663 $730Number of Accounts 2,046 1,658 194 94Total Monthly Benefits $2,011,530 $2,557,114 $128,663 $68,605% of Total Monthly Benefits 42.21% 53.65% 2.70% 1.44%Fiscal Year 2017 Average Benefit $993 $1,541 $662 $721Number of Accounts 2,101 1,719 205 96Total Monthly Benefits $2,086,732 $2,648,685 $135,625 $69,255% of Total Monthly Benefits 42.24% 53.61% 2.75% 1.40%Fiscal Year 2018 Average Benefit $1,002 $1,551 $684 $737Number of Accounts 2,215 1,877 205 100Total Monthly Benefits $2,218,520 $2,911,409 $140,174 $73,704% of Total Monthly Benefits 41.52% 54.48% 2.62% 1.38%This table includes individuals receiving a monthly benefit as of June 30 in the indicated fiscal year. A single member may have multiple accounts which contribute to one pension. This table represents all individuals receiving a benefit including dependent children, Qualified Domestic Relations Order (QDRO) accounts and multiple beneficiary accounts. If a member has died or a disability decision is pending, the monthly benefit amount is reflected as zero until the account status changes.
Board Meeting- December 17, 2018 - Audit Committee Report- Mr. John Chilton/ Ms. Kristen Coffey
602

199 S T AT
Schedule of Benefit Expenses CERS Non-HazardousAs of June 30, 2018 (in Whole $)
Normal
RetirementEarly
RetirementDisability
RetirementBeneficiary
PaymentsFiscal Year 2013 Average Benefit $591 $1,042 $878 $625Number of Accounts 11,266 33,393 4,537 1,075Total Monthly Benefits $6,661,524 $34,797,169 $3,982,213 $672,310% of Total Monthly Benefits 14.45% 75.46% 8.64% 1.45%Fiscal Year 2014 Average Benefit $596 $1,042 $856 $613Number of Accounts 11,885 34,911 4,729 1,110Total Monthly Benefits $7,081,048 $36,375,607 $4,047,035 $680,784% of Total Monthly Benefits 14.70% 75.49% 8.40% 1.41%Fiscal Year 2015 Average Benefit $612 $1,044 $862 $616Number of Accounts 12,749 36,746 4,854 1,161Total Monthly Benefits $7,801,662 $38,375,001 $4,186,130 $715,032% of Total Monthly Benefits 15.27% 75.13% 8.20% 1.40%Fiscal Year 2016 Average Benefit $623 $1,045 $874 $626Number of Accounts 14,014 39,066 5,118 1,268Total Monthly Benefits $8,724,563 $40,823,334 $4,472,723 $793,726% of Total Monthly Benefits 15.92% 74.48% 8.16% 1.45%Fiscal Year 2017 Average Benefit $634 $1,050 $883 $616Number of Accounts 14,792 40,873 5,280 1,318Total Monthly Benefits $9,374,583 $42,912,604 $4,661,375 $811,542% of Total Monthly Benefits 16.23% 74.29% 8.07% 1.41%Fiscal Year 2018 Average Benefit $647 $1,062 $892 $645Number of Accounts 15,713 42,918 5,425 1,359Total Monthly Benefits $10,169,605 $45,560,863 $4,838,284 $875,980% of Total Monthly Benefits 16.55% 74.15% 7.87% 1.43%Note: This table includes individuals receiving a monthly benefit as of June 30 in the indicated fiscal year. A single member may have multiple accounts which contribute to one pension. This table represents all individuals receiving a benefit including dependent children, Qualified Domestic Relations Order(QDRO) accounts and multiple beneficiary accounts. If a member has died or a disability decision is pending, the monthly benefit amount is reflected as zero until the account status changes.
Board Meeting- December 17, 2018 - Audit Committee Report- Mr. John Chilton/ Ms. Kristen Coffey
603

200S T AT
Schedule of Benefit Expenses - CERSHazardous As of June 30, 2018 (in Whole $)
Normal
RetirementEarly
RetirementDisability
RetirementBeneficiary Payments
Fiscal Year 2013 Average Benefit $1,433 $2,429 $1,121 $1,073Number of Accounts 1,883 4,683 681 119Total Monthly Benefits $2,699,176 $11,374,811 $763,700 $127,689% of Total Monthly Benefits 18.04% 76.01% 5.10% 0.85%Fiscal Year 2014 Average Benefit $1,467 $2,437 $1,125 $1,008Number of Accounts 1,974 4,873 695 119Total Monthly Benefits $2,895,353 $11,876,578 $781,685 $119,935% of Total Monthly Benefits 18.47% 75.77% 4.99% 0.77%Fiscal Year 2015 Average Benefit $1,480 $2,448 $1,145 $954Number of Accounts 2,097 5,139 688 127Total Monthly Benefits $3,103,613 $12,581,191 $787,549 $121,103% of Total Monthly Benefits 18.70% 75.82% 4.75% 0.73%Fiscal Year 2016 Average Benefit $1,494 $2,453 $1,137 $975Number of Accounts 2,269 5,485 742 143Total Monthly Benefits $3,388,890 $13,452,235 $843,463 $139,353% of Total Monthly Benefits 19.01% 75.47% 4.73% 0.78%Fiscal Year 2017 Average Benefit $1,509 $2,473 $1,138 $997Number of Accounts 2,394 5,764 794 149Total Monthly Benefits $3,612,099 $14,255,349 $903,238 $148,515% of Total Monthly Benefits 19.09% 75.35% 4.77% 0.78%Fiscal Year 2018 Average Benefit $1,542 $2,505 $1,141 $1,110Number of Accounts 2,540 6,189 811 158Total Monthly Benefits $3,917,668 $15,503,185 $925,221 $175,316% of Total Monthly Benefits 19.09% 75.55% 4.51% 0.85%Note: This table includes individuals receiving a monthly benefit as of June 30 in the indicated fiscal year. A single member may have multiple accounts which contribute to one pension. This table represents all individuals receiving a benefit including dependent children, Qualified Domestic Relations Order (QDRO) accounts and multiple beneficiary accounts. If a member has died or a disability decision is pending, the monthly benefit amount is reflected as zero until the account status changes.
Board Meeting- December 17, 2018 - Audit Committee Report- Mr. John Chilton/ Ms. Kristen Coffey
604

201 S T AT
Schedule of Benefit Expenses - SPRSAs of June 30, 2018 (in Whole $)
Normal
RetirementEarly
RetirementDisability
RetirementBeneficiary
PaymentsFiscal Year 2013 Average Benefit $3,601 $3,130 $1,320 $2,198Number of Accounts 149 1,126 74 23Total Monthly Benefits $536,481 $3,524,248 $97,681 $50,563% of Total Monthly Benefits 12.75% 83.73% 2.32% 1.20%Fiscal Year 2014 Average Benefit $3,621 $3,197 $1,346 $2,196Number of Accounts 146 1,172 75 23Total Monthly Benefits $528,611 $3,747,012 $100,974 $49,197% of Total Monthly Benefits 11.94% 84.66% 2.28% 1.11%Fiscal Year 2015 Average Benefit $3,578 $3,189 $1,347 $2,153Number of Accounts 150 1,213 75 23Total Monthly Benefits $536,649 $3,867,971 $101,018 $49,524% of Total Monthly Benefits 11.78% 84.91% 2.22% 1.09%Fiscal Year 2016 Average Benefit $3,579 $3,135 $1,269 $2,008Number of Accounts 155 1,277 82 25Total Monthly Benefits $554,743 $4,002,993 $104,056 $50,196% of Total Monthly Benefits 11.77% 84.95% 2.21% 1.07%Fiscal Year 2017 Average Benefit $3,611 $3,135 $1,278 $2,008Number of Accounts 149 1,303 82 25Total Monthly Benefits $538,032 $4,084,771 $104,788 $50,196% of Total Monthly Benefits 11.26% 85.50% 2.19% 1.05%Fiscal Year 2018 Average Benefit $3,642 $3,128 $1,289 $2,082Number of Accounts 153 1,361 83 26Total Monthly Benefits $557,249 $4,257,579 $107,019 $54,127% of Total Monthly Benefits 11.20% 85.56% 2.15% 1.09%Note: This table includes individuals receiving a monthly benefit as of June 30 in the indicated fiscal year. A single member may have multiple accounts which contribute to one pension. This table represents all individuals receiving a benefit including dependent children, Qualified Domestic Relations Order (QDRO) accounts and multiple beneficiary accounts. If a member has died or a disability decision is pending, the monthly benefit amount is reflected as zero until the account status changes.
Board Meeting- December 17, 2018 - Audit Committee Report- Mr. John Chilton/ Ms. Kristen Coffey
605

202S T AT
Analysis of Initial Retirees As of June 30, 2018 (in Whole $)
KERS Non-
HazardousKERS
Hazardous
CERS Non-
HazardousCERS
Hazardous SPRSFiscal Year 2013 Number of Accounts 1,810 205 3,303 443 59Average Service Credit (months) 199 157 189 202 234Average Final Compensation $47,168 $46,456 $34,292 $58,516 $69,325Average Monthly Benefit $1,275 $1,250 $938 $2,196 $2,893Average System Payment for Health Insurance $303 $433 $259 $853 $994Fiscal Year 2014 Number of Accounts 2,037 245 3,529 430 77Average Service Credit (months) 202 165 182 194 260Average Final Compensation $46,480 $46,595 $33,816 $57,718 $70,009Average Monthly Benefit $1,278 $1,296 $879 $2,021 $3,322Average System Payment for Health Insurance $534 $937 $486 $1,279 $1,378Fiscal Year 2015 Number of Accounts 2,078 191 4,084 496 55Average Service Credit (months) 204 164 188 204 251Average Final Compensation $47,187 $47,148 $34,561 $59,589 $67,862Average Monthly Benefit $1,308 $1,280 $913 $2,178 $3,009Average System Payment for Health Insurance $549 $906 $489 $1,254 $1,376Fiscal Year 2016 Number of Accounts 2,043 205 4,151 522 57Average Service Credit (months) 207 160 190 212 234Average Final Compensation $47,429 $44,494 $34,632 $58,977 $65,535Average Monthly Benefit $1,351 $1,225 $932 $2,303 $2,953Average System Payment for Health Insurance $558 $870 $501 $1,277 $1,425Fiscal Year 2017 Number of Accounts 2,094 191 4,151 544 30Average Service Credit (months) 208 146 191 203 241Average Final Compensation $46,753 $47,604 $34,779 $58,384 $68,401Average Monthly Benefit $1,339 $1,150 $940 $2,236 $2,935Average System Payment for Health Insurance $558 $872 $510 $1,247 $1,192Fiscal Year 2018 Number of Accounts 2,682 328 4,570 696 68Average Service Credit (months) 223 167 195 211 241Average Final Compensation $48,552 $51,219 $37,683 $65,407 $71,132Average Monthly Benefit $1,481 $1,392 $1,027 $2,528 $3,035Average System Payment for Health Insurance $578 $1,033 $531 $1,300 $1,365Note: This table represents all individuals who had an initial retirement date within the fiscal year.
Board Meeting- December 17, 2018 - Audit Committee Report- Mr. John Chilton/ Ms. Kristen Coffey
606

203 S T AT
Payment Options Selected by Retired Members As of June 30, 2018 (in Whole $)
Basic Lump Sum OtherPeriod
Certain Pop Up
Social Security
Adjustment Survivorship
KERS Non-HazardousNumber of Accounts 17,025 2,107 13 6,127 9,448 3,350 10,915Monthly Benefits $25,948,003 $2,472,354 $24,758 $9,541,939 $19,398,243 $5,780,252 $18,429,314
KERS HazardousNumber of Accounts 1,165 247 3 489 1,212 286 995Monthly Benefits $1,295,079 $253,014 $3,428 $549,810 $1,760,450 $331,748 $1,150,278
CERS Non-HazardousNumber of Accounts 26,818 3,172 16 9,241 10,470 2,135 13,563Monthly Benefits $21,780,547 $2,135,202 $19,096 $7,957,221 $12,901,637 $2,787,153 $13,863,875
CERS HazardousNumber of Accounts 1,566 460 33 865 3,837 548 2,389Monthly Benefits $3,009,980 $739,847 $40,565 $1,501,148 $9,430,349 $852,169 $4,947,331
SPRSNumber of Accounts 176 22 1 132 666 199 427Monthly Benefits $496,824 $51,466 $3,084 $350,336 $2,306,780 $406,571 $1,360,913
KRS TotalNumber of Accounts 46,750 6,008 66 16,854 25,633 6,518 28,289Monthly Benefits $52,530,433 $5,651,883 $90,931 $19,900,454 $45,797,459 $10,157,893 $39,751,711The information in this table represents accounts administered by KRS. A single member may have multiple accounts, which contribute to one pension.
Board Meeting- December 17, 2018 - Audit Committee Report- Mr. John Chilton/ Ms. Kristen Coffey
607

204S T AT
EMPLOYER CONTRIBUTION RATESIn KERS, CERS, and SPRS both the employee and the employer contribute a percentage of creditable compensation to KRS. The employee contribution rate is set by state statute. Non-Hazardous employees contribute 5% while Hazardous duty members contribute 8%. Employees hired on or after September 1, 2008, contribute an additional 1% to health insurance. Under Kentucky Revised Statute 61.565, KERS and SPRS employer contribution rates are set by the KRS Board of Trustees based on an annual actuarial valuation. However, KERS and SPRS employer rates are subject to approval by the Kentucky General Assembly through the adoption of the biennial Executive Branch Budget. For fiscal years 2004 through 2014, the Kentucky General Assembly suspended Kentucky Revised Statute 61.565 in the budget in order to provide an employer contribution rate that is less than the amount recommended by the Board’s consulting actuary. The table in the Actuarial Section shows the KERS and SPRS employer contribution rates that were actuarially recommended in the annual valuation without any adjustments. The CERS employer contribution rates are also set by the KRS Board under Kentucky Revised Statute 61.565 based on an annual actuarial valuation, unless altered by legislation enacted by the Kentucky General Assembly. The CERS employer contribution rates for fiscal year 2008 through 2009 were reduced from the actuarially recommended rate as a result of the passage of House Bill (HB) 1 during the 2008 Extraordinary Session of the Kentucky General Assembly. Also, during its 2009 Regular Session, the Kentucky General Assembly enacted HB 117, which mandated an extension of the phase-in of insurance contribution rates that had been previously approved by the KRS Board in 2006 from five years to 10 years to further mitigate the impact of the application of GASB Statements 43 and 45 on CERS employer contribution rates for health insurance. The actual pension and insurance employer contribution rates that were paid are shown below.
Employer Contribution Rates (%) As of June 30, 2018 2013 2014 2015 2016 2017 2018
KERS Non-HazardousActual Rate 23.61% 26.79% 38.77% 38.77% 48.59% 49.47%
KERS HazardousActual Rate 29.79% 32.21% 26.34% 26.34% 23.82% 23.70%
CERS Non-HazardousActual Rate 19.55% 18.89% 17.67% 17.06% 18.68% 19.18%
CERS HazardousActual Rate 37.60% 35.70% 34.31% 32.95% 31.06% 31.55%
SPRSActual Rate 63.67% 71.15% 75.76% 75.76% 89.21% 91.24%
Board Meeting- December 17, 2018 - Audit Committee Report- Mr. John Chilton/ Ms. Kristen Coffey
608

205 S T AT
INSURANCE CONTRACTS KRS provides medical insurance and other managed care coverage for eligible retired members. Participation in the insurance program is optional and requires the completion of the proper forms at the time of retirement in order to obtain the insurance coverage. KRS provides access to health insurance coverage through the Kentucky Employees’ Health Plan (KEHP) for recipients until they reach age 65 and/or become Medicare eligible. After a retired member becomes eligible for Medicare, coverage is available through a Medicare eligible plan offered by KRS. A retired member’s spouse and/or dependents may also be covered on health insurance through KRS.
Insurance Benefits Paid to Retirees & Beneficiaries Participating in a KRS Health Insurance Plan As of June 30, 2018 (in Whole $)
KERS Non - Hazardous
KERS Hazardous
CERS Non - Hazardous
CERS Hazardous SPRS
Number 32,090 2,828 37,408 8,212 1,715Average Service Credit (Months) 311 264 262 280 324Average Monthly System Payment for Health Insurance $371 $690 $326 $962 $880Average Monthly Member Payment for Health Insurance $61 $46 $61 $34 $20Total Monthly Payment for Health Insurance $12,917,792 $1,716,464 $13,612,464 $6,700,951 $1,187,168
Board Meeting- December 17, 2018 - Audit Committee Report- Mr. John Chilton/ Ms. Kristen Coffey
609

206S T AT
Insurance Contracts by Type As of June 30, 2018KERS Non-Hazardous 2013 2014 2015 2016 2017 2018KEHP Parent Plus 618 506 452 441 411 460KEHP Couple/Family 1,276 797 714 656 663 696KEHP Single 9,364 9,491 9,251 8,876 8,627 8,638Medicare without Prescription 1,474 1,370 1,303 19,447 1,229 1,179Medicare with Prescription 16,834 17,738 18,577 1,286 20,215 21,117
KERS Hazardous 2013 2014 2015 2016 2017 2018KEHP Parent Plus 106 110 110 97 88 96KEHP Couple/Family 451 448 448 439 432 478KEHP Single 625 647 656 663 667 686Medicare without Prescription 60 56 62 1,302 72 73Medicare with Prescription 985 1,104 1,177 66 1,401 1,495
CERS Non-Hazardous 2013 2014 2015 2016 2017 2018KEHP Parent Plus 340 278 242 235 222 231KEHP Couple/Family 857 546 473 465 462 510KEHP Single 7,652 7,843 8,098 8,164 8,313 8,802Medicare without Prescription 2,707 2,583 2,531 23,007 2,462 2,389Medicare with Prescription 18,824 20,200 21,520 2,499 24,247 25,476
CERS Hazardous 2013 2014 2015 2016 2017 2018KEHP Parent Plus 400 432 456 378 395 422KEHP Couple/Family 2,155 2,184 2,255 2,321 2,387 2,571KEHP Single 1,425 1,447 1,500 1,595 1,645 1,712Medicare without Prescription 79 89 107 2,969 125 119Medicare with Prescription 2,324 2,510 2,697 114 3,205 3,388
SPRS 2013 2014 2015 2016 2017 2018KEHP Parent Plus 76 78 81 77 79 74KEHP Couple/Family 421 444 441 355 420 426KEHP Single 283 263 265 246 251 253Medicare without Prescription 20 20 16 850 17 21Medicare with Prescription 682 712 777 18 897 941
KRS Total 2013 2014 2015 2016 2017 2018KEHP Parent Plus 1,540 1,404 1,341 1,228 1,195 1,283KEHP Couple/Family 5,160 4,419 4,331 4,328 4,364 4,681KEHP Single 19,349 19,691 19,770 19,544 19,503 20,091Medicare without Prescription 4,340 4,118 4,019 3,983 3,905 3,781Medicare with Prescription 39,649 42,264 44,748 47,575 49,965 52,417
Board Meeting- December 17, 2018 - Audit Committee Report- Mr. John Chilton/ Ms. Kristen Coffey
610

(502) 696-8800 or (800) 928-4646 Fax: (502) 696-8822
Website: https://kyret.ky.gov
Facebook: kyretirement
www.youtube.com/user/KentuckyRetire
Twitter.com/Kyretire
MyRetirement Portal - https://myretirement.ky.gov
Kentucky Retirement Systems1260 Louisville Rd, Frankfort, KY 40601
Hours of Operation: 8:00 AM - 4:30PM (EST) Monday-Friday
Board Meeting- December 17, 2018 - Audit Committee Report- Mr. John Chilton/ Ms. Kristen Coffey
611

KENTUCKY RETIREMENT SYSTEMSINVESTMENTS
To: KRS Board of Trustees
From: Richard Robben, Interim Executive Director of Investments
Date: December 17th, 2018
Subject: Report on Recent Investment Committee Activities
Investment Activity
New Investments
Loomis Sayles (Intermediate Core Fixed Income) – At the November 7th meeting, the Investment Committee approved up to a $1,000,000,000 investment with Loomis Sayles in a Core Fixed Income mandate benchmarked to the Bloomberg Barclays Intermediate Aggregate Index. The fee for the mandate will be 9 bps annually, and the source of funds for the investment will be the BNY Intermediate Credit Index CTF.
MOTION: To approve the actions of the Investment Committee as presented.
Staff additions & Redemptions
Columbia - $144MM (Pension = $104MM / Insurance = $40MM) additional deposit on 8/9 to our existing US High Yield Accounts.
Waterfall Asset Management – ($15MM (Pension = $5MM / Insurance = $10MM) additional deposits made in October 2018. Staff plans to add roughly $10MM per month to our Waterfall accounts in order to increase their size to $200MM for Pension and $100MM for Insurance.
Marathon Bluegrass Credit Fund – (Multi-sector Credit) $16.5MM additional deposit on November 1st.
Manulife – (Global Fixed Income) Staff requested a redemption of $30MM on September 12th.
Prudential Global Liquidity Relative Value Fund – Redeemed effective 9/30 - $23.3 million
Systematica BlueMatrix - - Redeemed effective 10/31 - $16.9 million
Board Meeting- December 17, 2018 - Investment Committee and Investment Portfolio Quarterly Report- Mr. Neil Ramsey
612
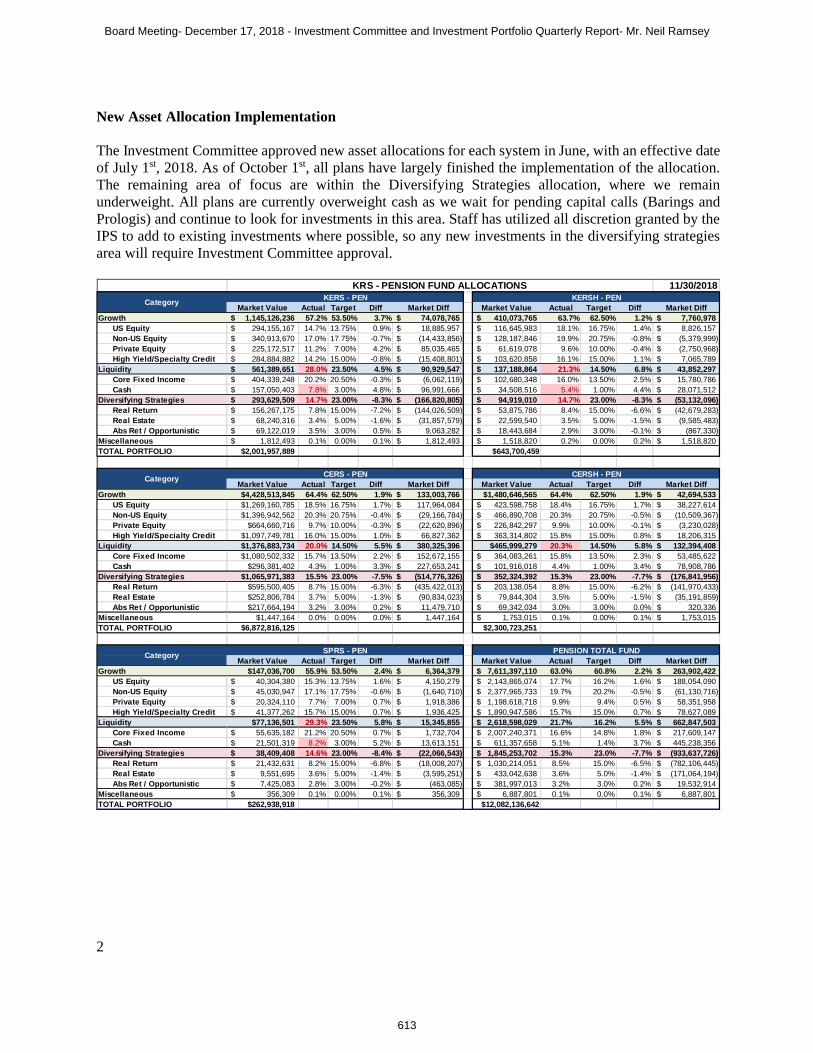
2
New Asset Allocation Implementation
The Investment Committee approved new asset allocations for each system in June, with an effective date of July 1st, 2018. As of October 1st, all plans have largely finished the implementation of the allocation. The remaining area of focus are within the Diversifying Strategies allocation, where we remain underweight. All plans are currently overweight cash as we wait for pending capital calls (Barings and Prologis) and continue to look for investments in this area. Staff has utilized all discretion granted by the IPS to add to existing investments where possible, so any new investments in the diversifying strategies area will require Investment Committee approval.
2.00% 11/30/2018
Market Value Actual Target Diff Market Diff Market Value Actual Target Diff Market DiffGrowth 1,145,126,236$ 57.2% 53.50% 3.7% 74,078,765$ 410,073,765$ 63.7% 62.50% 1.2% 7,760,978$
US Equity 294,155,167$ 14.7% 13.75% 0.9% 18,885,957$ 116,645,983$ 18.1% 16.75% 1.4% 8,826,157$ Non-US Equity 340,913,670$ 17.0% 17.75% -0.7% (14,433,856)$ 128,187,846$ 19.9% 20.75% -0.8% (5,379,999)$ Private Equity 225,172,517$ 11.2% 7.00% 4.2% 85,035,465$ 61,619,078$ 9.6% 10.00% -0.4% (2,750,968)$ High Yield/Specialty Credit 284,884,882$ 14.2% 15.00% -0.8% (15,408,801)$ 103,620,858$ 16.1% 15.00% 1.1% 7,065,789$
Liquidity 561,389,651$ 28.0% 23.50% 4.5% 90,929,547$ 137,188,864$ 21.3% 14.50% 6.8% 43,852,297$ Core Fixed Income 404,339,248$ 20.2% 20.50% -0.3% (6,062,119)$ 102,680,348$ 16.0% 13.50% 2.5% 15,780,786$ Cash 157,050,403$ 7.8% 3.00% 4.8% 96,991,666$ 34,508,516$ 5.4% 1.00% 4.4% 28,071,512$
Diversifying Strategies 293,629,509$ 14.7% 23.00% -8.3% (166,820,805)$ 94,919,010$ 14.7% 23.00% -8.3% (53,132,096)$ Real Return 156,267,175$ 7.8% 15.00% -7.2% (144,026,509)$ 53,875,786$ 8.4% 15.00% -6.6% (42,679,283)$ Real Estate 68,240,316$ 3.4% 5.00% -1.6% (31,857,579)$ 22,599,540$ 3.5% 5.00% -1.5% (9,585,483)$
Abs Ret / Opportunistic 69,122,019$ 3.5% 3.00% 0.5% 9,063,282$ 18,443,684$ 2.9% 3.00% -0.1% (867,330)$ Miscellaneous 1,812,493$ 0.1% 0.00% 0.1% 1,812,493$ 1,518,820$ 0.2% 0.00% 0.2% 1,518,820$ TOTAL PORTFOLIO $2,001,957,889 $643,700,459
0.32 0.37
Market Value Actual Target Diff Market Diff Market Value Actual Target Diff Market DiffGrowth $4,428,513,845 64.4% 62.50% 1.9% 133,003,766$ $1,480,646,565 64.4% 62.50% 1.9% 42,694,533$
US Equity $1,269,160,785 18.5% 16.75% 1.7% 117,964,084$ 423,598,758$ 18.4% 16.75% 1.7% 38,227,614$ Non-US Equity $1,396,942,562 20.3% 20.75% -0.4% (29,166,784)$ 466,890,708$ 20.3% 20.75% -0.5% (10,509,367)$ Private Equity $664,660,716 9.7% 10.00% -0.3% (22,620,896)$ 226,842,297$ 9.9% 10.00% -0.1% (3,230,028)$ High Yield/Specialty Credit $1,097,749,781 16.0% 15.00% 1.0% 66,827,362$ 363,314,802$ 15.8% 15.00% 0.8% 18,206,315$
Liquidity $1,376,883,734 20.0% 14.50% 5.5% 380,325,396$ $465,999,279 20.3% 14.50% 5.8% 132,394,408$ Core Fixed Income $1,080,502,332 15.7% 13.50% 2.2% 152,672,155$ 364,083,261$ 15.8% 13.50% 2.3% 53,485,622$ Cash $296,381,402 4.3% 1.00% 3.3% 227,653,241$ 101,916,018$ 4.4% 1.00% 3.4% 78,908,786$
Diversifying Strategies $1,065,971,383 15.5% 23.00% -7.5% (514,776,326)$ 352,324,392$ 15.3% 23.00% -7.7% (176,841,956)$ Real Return $595,500,405 8.7% 15.00% -6.3% (435,422,013)$ 203,138,054$ 8.8% 15.00% -6.2% (141,970,433)$ Real Estate $252,806,784 3.7% 5.00% -1.3% (90,834,023)$ 79,844,304$ 3.5% 5.00% -1.5% (35,191,859)$
Abs Ret / Opportunistic $217,664,194 3.2% 3.00% 0.2% 11,479,710$ 69,342,034$ 3.0% 3.00% 0.0% 320,336$ Miscellaneous $1,447,164 0.0% 0.00% 0.0% 1,447,164$ 1,753,015$ 0.1% 0.00% 0.1% 1,753,015$ TOTAL PORTFOLIO $6,872,816,125 $2,300,723,251
0.37 0.37
Market Value Actual Target Diff Market Diff Market Value Actual Target Diff Market DiffGrowth $147,036,700 55.9% 53.50% 2.4% 6,364,379$ 7,611,397,110$ 63.0% 60.8% 2.2% 263,902,422$
US Equity 40,304,380$ 15.3% 13.75% 1.6% 4,150,279$ 2,143,865,074$ 17.7% 16.2% 1.6% 188,054,090$ Non-US Equity 45,030,947$ 17.1% 17.75% -0.6% (1,640,710)$ 2,377,965,733$ 19.7% 20.2% -0.5% (61,130,716)$ Private Equity 20,324,110$ 7.7% 7.00% 0.7% 1,918,386$ 1,198,618,718$ 9.9% 9.4% 0.5% 58,351,958$ High Yield/Specialty Credit 41,377,262$ 15.7% 15.00% 0.7% 1,936,425$ 1,890,947,586$ 15.7% 15.0% 0.7% 78,627,089$
Liquidity $77,136,501 29.3% 23.50% 5.8% 15,345,855$ 2,618,598,029$ 21.7% 16.2% 5.5% 662,847,503$ Core Fixed Income 55,635,182$ 21.2% 20.50% 0.7% 1,732,704$ 2,007,240,371$ 16.6% 14.8% 1.8% 217,609,147$ Cash 21,501,319$ 8.2% 3.00% 5.2% 13,613,151$ 611,357,658$ 5.1% 1.4% 3.7% 445,238,356$
Diversifying Strategies 38,409,408$ 14.6% 23.00% -8.4% (22,066,543)$ 1,845,253,702$ 15.3% 23.0% -7.7% (933,637,726)$ Real Return 21,432,631$ 8.2% 15.00% -6.8% (18,008,207)$ 1,030,214,051$ 8.5% 15.0% -6.5% (782,106,445)$ Real Estate 9,551,695$ 3.6% 5.00% -1.4% (3,595,251)$ 433,042,638$ 3.6% 5.0% -1.4% (171,064,194)$
Abs Ret / Opportunistic 7,425,083$ 2.8% 3.00% -0.2% (463,085)$ 381,997,013$ 3.2% 3.0% 0.2% 19,532,914$ Miscellaneous 356,309$ 0.1% 0.00% 0.1% 356,309$ 6,887,801$ 0.1% 0.0% 0.1% 6,887,801$ TOTAL PORTFOLIO $262,938,918 $12,082,136,642
Category CERS - PEN CERSH - PEN
Category SPRS - PEN PENSION TOTAL FUND
KRS - PENSION FUND ALLOCATIONSCategory KERS - PEN KERSH - PEN
Board Meeting- December 17, 2018 - Investment Committee and Investment Portfolio Quarterly Report- Mr. Neil Ramsey
613

3
Continued Restructuring of Absolute Return Investments
Staff presented a plan to the Investment Committee on November 7th for the restructuring of the Absolute Return portfolio, which is now the Opportunistic portfolio. From the asset allocation study completed earlier in 2018, this portfolio has a 3% target weight, with a 0-10% range based on opportunities. The portfolio will contain 2 strategies. One sleeve is comprised of diversifying investments, and will be benchmarked against the 3 year US Treasury yield + 2%, and the other is for directional investments and will be benchmarked against 0.6 x MSCI ACWI Total Return + 2%. All managers will be sized by volatility weighting the invested dollars, such that the minimum investment will be $5mm volatility-weighted. ($100mm dollars invested with an expected volatility of 5% = $5mm volatility weighted.) We will also seek an absolute minimum investment of $40mm. Staff expects that the final portfolio will consist of 8 to 10 funds.
Market Value Actual Target Diff Market Diff Market Value Actual Target Diff Market DiffGrowth 551,013,134$ 65.4% 62.50% 2.9% 24,659,650$ 325,263,195$ 64.7% 62.50% 2.2% 11,013,362$
US Equity 174,968,812$ 20.8% 16.75% 4.0% 33,906,079$ 93,946,978$ 18.7% 16.75% 1.9% 9,728,023$ Non-US Equity 184,538,792$ 21.9% 20.75% 1.2% 9,789,435$ 102,344,692$ 20.4% 20.75% -0.4% (1,986,253)$ Private Equity 45,956,345$ 5.5% 10.00% -4.5% (38,260,213)$ 50,694,867$ 10.1% 10.00% 0.1% 414,894$ High Yield/Specialty Credit 145,549,184$ 17.3% 15.00% 2.3% 19,224,348$ 78,276,658$ 15.6% 15.00% 0.6% 2,856,698$
Liquidity 168,405,083$ 20.0% 14.50% 5.5% 46,291,075$ 99,617,976$ 19.8% 14.50% 5.3% 26,712,015$ Core Fixed Income 125,545,619$ 14.9% 13.50% 1.4% 11,853,266$ 81,118,936$ 16.1% 13.50% 2.6% 13,240,972$ Cash 42,859,464$ 5.1% 1.00% 4.1% 34,437,808$ 18,499,040$ 3.7% 1.00% 2.7% 13,471,042$
Diversifying Strategies 122,793,325$ 14.6% 23.00% -8.4% (70,904,757)$ 77,946,383$ 15.5% 23.00% -7.5% (37,697,556)$ Real Return 71,129,832$ 8.4% 15.00% -6.6% (55,195,004)$ 42,030,660$ 8.4% 15.00% -6.6% (33,389,300)$ Real Estate 26,151,163$ 3.1% 5.00% -1.9% (15,957,116)$ 19,149,315$ 3.8% 5.00% -1.2% (5,990,672)$
Abs Ret / Opportunistic 25,512,330$ 3.0% 3.00% 0.0% 247,363$ 16,766,408$ 3.3% 3.00% 0.3% 1,682,416$ Miscellaneous (45,968)$ 0.0% 0.00% 0.0% (45,968)$ (27,821)$ 0.0% 0.00% 0.0% (27,821)$ TOTAL PORTFOLIO 842,165,574$ 502,799,733$
KERS - INS KERSH - INSCategory
Market Value Actual Target Diff Market Diff Market Value Actual Target Diff Market DiffGrowth $1,505,344,852 65.0% 62.50% 2.5% 57,509,237$ $817,564,722 65.5% 62.50% 3.0% 37,545,374$
US Equity 427,393,756$ 18.4% 16.75% 1.7% 39,373,811$ 231,566,457$ 18.6% 16.75% 1.8% 22,521,272$ Non-US Equity 465,450,475$ 20.1% 20.75% -0.7% (15,230,949)$ 252,247,792$ 20.2% 20.75% -0.5% (6,718,632)$ Private Equity 271,992,308$ 11.7% 10.00% 1.7% 40,338,609$ 152,942,220$ 12.3% 10.00% 2.3% 28,139,124$ High Yield/Specialty Credit 340,508,314$ 14.7% 15.00% -0.3% (6,972,234)$ 180,808,253$ 14.5% 15.00% -0.5% (6,396,391)$
Liquidity $453,806,762 19.6% 14.50% 5.1% 117,908,900$ $239,666,136 19.2% 14.50% 4.7% 58,701,648$ Core Fixed Income 361,632,551$ 15.6% 13.50% 2.1% 48,900,058$ 197,101,214$ 15.8% 13.50% 2.3% 28,617,035$ Cash 92,174,212$ 4.0% 1.00% 3.0% 69,008,842$ 42,564,922$ 3.4% 1.00% 2.4% 30,084,612$
Diversifying Strategies 357,512,788$ 15.4% 23.00% -7.6% (175,290,718)$ 190,868,996$ 15.3% 23.00% -7.7% (96,178,124)$ Real Return 202,126,543$ 8.7% 15.00% -6.3% (145,354,005)$ 105,058,429$ 8.4% 15.00% -6.6% (82,146,214)$ Real Estate 83,135,074$ 3.6% 5.00% -1.4% (32,691,776)$ 45,508,724$ 3.6% 5.00% -1.4% (16,892,823)$
Abs Ret / Opportunistic 72,251,172$ 3.1% 3.00% 0.1% 2,755,062$ 40,301,842$ 3.2% 3.00% 0.2% 2,860,913$ Miscellaneous (127,418)$ 0.0% 0.00% 0.0% (127,418)$ (68,897)$ 0.0% 0.00% 0.0% (68,897)$ TOTAL PORTFOLIO 2,316,536,985$ 1,248,030,957$
100.0% 0.37
Market Value Actual Target Diff Market Diff Market Value Actual Target Diff Market DiffGrowth $124,302,134 66.4% 62.50% 3.9% 7,293,903$ 3,323,488,037$ 65.2% 62.5% 2.7% 138,021,525$
US Equity 35,345,702$ 18.9% 16.75% 2.1% 3,987,496$ 963,221,706$ 18.9% 16.8% 2.1% 109,516,680$ Non-US Equity 38,070,166$ 20.3% 20.75% -0.4% (776,567)$ 1,042,651,917$ 20.5% 20.8% -0.3% (14,922,965)$ Private Equity 23,110,856$ 12.3% 10.00% 2.3% 4,389,539$ 544,696,596$ 10.7% 10.0% 0.7% 35,021,954$ High Yield/Specialty Credit 27,775,410$ 14.8% 15.00% -0.2% (306,566)$ 772,917,819$ 15.2% 15.0% 0.2% 8,405,856$
Liquidity $34,798,693 18.6% 14.50% 4.1% 7,652,783$ 996,294,650$ 19.5% 14.5% 5.0% 257,266,419$ Core Fixed Income 30,330,316$ 16.2% 13.50% 2.7% 5,056,538$ 795,728,636$ 15.6% 13.5% 2.1% 107,667,870$ Cash 4,468,377$ 2.4% 1.00% 1.4% 2,596,245$ 200,566,014$ 3.9% 1.0% 2.9% 149,598,550$
Diversifying Strategies 28,122,664$ 15.0% 23.00% -8.0% (14,936,365)$ 777,244,156$ 15.2% 23.0% -7.8% (395,007,520)$ Real Return 14,542,449$ 7.8% 15.00% -7.2% (13,539,527)$ 434,887,913$ 8.5% 15.0% -6.5% (329,624,049)$ Real Estate 7,307,394$ 3.9% 5.00% -1.1% (2,053,265)$ 181,251,669$ 3.6% 5.0% -1.4% (73,585,652)$
Abs Ret / Opportunistic 6,272,822$ 3.4% 3.00% 0.4% 656,426$ 161,104,573$ 3.2% 3.0% 0.2% 8,202,181$ Miscellaneous (10,320)$ 0.0% 0.00% 0.0% (10,320)$ (280,424)$ 0.0% 0.0% 0.0% (280,424)$ TOTAL PORTFOLIO 187,213,170$ 5,096,746,418$
INSURANCE TOTAL FUND
Category CERS - INS CERSH - INS
Category SPRS - INS
Board Meeting- December 17, 2018 - Investment Committee and Investment Portfolio Quarterly Report- Mr. Neil Ramsey
614
4
Investment Guideline Waivers
The Investment Committee granted 3 guideline waivers at the February 6th meeting and agreed to review each of these waivers at all subsequent meetings. Two of these waivers are still in effect:
1. Staff was granted a waiver of the requirement that each of our external investment managers should be visited annually on-site by KRS staff.
2. Staff was granted a waiver of the requirement to rebalance assets within the Absolute Return, Real Estate, and Fixed Income asset classes as the transition to our new asset allocation policy is ongoing.
Board Meeting- December 17, 2018 - Investment Committee and Investment Portfolio Quarterly Report- Mr. Neil Ramsey
615

5
Performance – October 2018
Oct-18 FYTD 1Yr 3Yr 5Yr
Total Pension Fund -3.43% -1.21% 2.44% 7.13% 5.99% Allocation Index -3.76% -1.48% 1.32% 6.82% 5.96% Value Add 0.33% 0.27% 1.12% 0.31% 0.03% IPS Benchmark -3.74% -1.34% 1.28% Value Add 0.31% 0.13% 1.16%
KERS -2.87% -0.72% 2.39% 6.26% 5.75% Allocation Index -3.41% -1.20% 1.33% 6.39% 5.69% Value Add 0.54% 0.48% 1.06% -0.13% 0.06% IPS Benchmark -3.39% -1.27% 1.28% Value Add 0.52% 0.55% 1.11% Assumed Rate of Return 0.43% 1.72% 5.25% Value Add -3.30% -2.44% -2.86%KERS-HAZ -3.49% -1.27% 2.40% 7.26% 6.03% Allocation Index -3.83% -1.53% 1.36% 6.89% 5.84% Value Add 0.34% 0.26% 1.04% 0.37% 0.19% IPS Benchmark -3.73% -0.97% 1.68% Value Add 0.24% -0.30% 0.72% Assumed Rate of Return 0.51% 2.04% 6.25% Value Add -4.00% -3.31% -3.85%CERS -3.54% -1.34% 2.37% 7.30% 6.02% Allocation Index -3.83% -1.53% 1.36% 6.90% 5.84% Value Add 0.29% 0.19% 1.01% 0.40% 0.18% IPS Benchmark -3.73% -0.97% 1.68% Value Add 0.19% -0.37% 0.69% Assumed Rate of Return 0.51% 2.04% 6.25% Value Add -4.05% -3.38% -3.88%CERS-HAZ -3.54% -1.33% 2.40% 7.31% 6.04% Allocation Index -3.83% -1.53% 1.36% 6.89% 5.84% Value Add 0.29% 0.20% 1.04% 0.42% 0.20% IPS Benchmark -3.73% -0.97% 1.68% Value Add 0.19% -0.36% 0.72% Assumed Rate of Return 0.51% 2.04% 6.25% Value Add -4.05% -3.37% -3.85%SPRS -3.05% -1.00% 2.11% 6.36% 5.42% Allocation Index -3.41% -1.31% 5.92% 8.70% 6.86% Value Add 0.36% 0.31% -3.81% -2.34% -1.44% IPS Benchmark -3.39% -1.27% 5.80% Value Add 0.34% 0.27% -3.69% Assumed Rate of Return 0.43% 1.72% 5.25% Value Add -3.48% -2.72% -3.14%
PENSION (Net of Fees)
Board Meeting- December 17, 2018 - Investment Committee and Investment Portfolio Quarterly Report- Mr. Neil Ramsey
616

6
Oct-18 FYTD 1Yr 3Yr 5Yr
Total Insurance Fund -3.53% -1.37% 2.60% 7.46% 6.01% Allocation Index -3.81% -1.63% 1.56% 7.12% 6.21% Value Add 0.28% 0.26% 1.04% 0.34% -0.20% IPS Benchmark -3.70% -1.12% 1.86% Value Add 0.17% -0.25% 0.74%
KERS-INS -3.79% -1.73% 1.36% 6.91% 5.53% Allocation Index -3.68% -1.52% 1.56% 7.12% 5.96% Value Add -0.11% -0.21% -0.20% -0.21% -0.43% IPS Benchmark -3.79% -1.46% 1.51% Value Add 0.00% -0.27% -0.15% Assumed Rate of Return 0.51% 2.04% 6.25% Value Add -4.30% -3.77% -4.89%KERSH-INS -3.49% -1.38% 2.46% 7.38% 5.96% Allocation Index -3.68% -1.50% 1.73% 7.16% 6.03% Value Add 0.19% 0.12% 0.73% 0.22% -0.07% IPS Benchmark -3.70% -1.12% 1.86% Value Add 0.21% -0.26% 0.60% Assumed Rate of Return 0.51% 2.04% 6.25% Value Add -4.00% -3.42% -3.79%CERS-INS -3.47% -1.32% 2.80% 7.53% 6.09% Allocation Index -3.81% -1.62% 1.60% 7.10% 6.02% Value Add 0.34% 0.30% 1.20% 0.43% 0.07% IPS Benchmark -3.70% -1.12% 1.86% Value Add 0.23% -0.20% 0.94% Assumed Rate of Return 0.51% 2.04% 6.25% Value Add -3.98% -3.36% -3.45%CERSH-INS -3.48% -1.31% 2.89% 7.61% 6.14% Allocation Index -3.81% -1.62% 1.60% 7.10% 6.03% Value Add 0.57% 0.31% 1.29% 0.51% 0.11% IPS Benchmark -3.70% -1.12% 1.86% Value Add 0.22% -0.19% 1.03% Assumed Rate of Return 0.51% 2.04% 6.25% Value Add -3.99% -3.35% -3.36%SPRS-INS -3.50% -1.30% 2.91% 7.60% 6.13% Allocation Index -3.81% -1.62% 1.60% 7.10% 6.04% Value Add 0.31% 0.32% 1.31% 0.50% 0.09% IPS Benchmark -3.70% -1.12% 1.86% Value Add 0.20% -0.18% 1.05% Assumed Rate of Return 0.51% 2.04% 6.25% Value Add -4.01% -3.34% -3.34%
INSURANCE (Net of Fees)
Board Meeting- December 17, 2018 - Investment Committee and Investment Portfolio Quarterly Report- Mr. Neil Ramsey
617

Board Meeting- December 17, 2018 - KRS Retirement Trends/ Informational Update- Mr. David Eager
618

Board Meeting- December 17, 2018 - KRS Retirement Trends/ Informational Update- Mr. David Eager
619

INITIAL RETIREMENTS FISCAL YEAR 2017 (July 1 – June 30)JUL AUG SEP OCT NOV DEC JAN FEB MAR APR MAY JUN TOTAL
KERS 172 571 183 160 151 135 266 153 141 151 119 147 2,349
CERS 785 719 356 389 296 237 550 278 250 260 198 490 4,808
SPRS - 8 5 2 4 1 3 4 1 - 1 - 29TOTAL 957 1,298 544 551 451 373 819 435 392 411 318 637 7,186
INITIAL RETIREMENTS FISCAL YEAR 2018 (July 1 – June 30)JUL AUG SEP OCT NOV DEC JAN FEB MAR APR MAY JUN TOTAL
KERS 160 686 280 261 210 205 351 160 157 166 173 257 3,066
CERS 806 719 462 411 370 302 608 295 257 274 289 519 5,312
SPRS - 37 6 5 5 2 3 - 1 2 2 5 68
TOTAL 966 1,442 748 677 585 509 962 455 415 442 464 781 8,446
NOTE: Monthly total reflect the number of members who received their first retirement payment in the given month.
Board Meeting- December 17, 2018 - KRS Retirement Trends/ Informational Update- Mr. David Eager
620

INITIAL RETIREMENTS FISCAL YEAR 2019JULY 1 – JUNE 30
JUL AUG SEP OCT NOV DEC JAN FEB MAR APR MAY JUN TOTAL
KERS 228 454 202 163 140 194 1,381
CERS 971 586 406 305 261 317 2,846
SPRS - 40 7 3 2 3 55TOTAL 1,199 1,080 615 471 403 514 4,282
NOTE: Monthly total reflect the number of members who received their first retirement payment in the given month.
Board Meeting- December 17, 2018 - KRS Retirement Trends/ Informational Update- Mr. David Eager
621

Board Meeting- December 17, 2018 - Creation of Investment Committee Advisory Role- Mr. Mark Blackwell/ Mr. David Eager
622
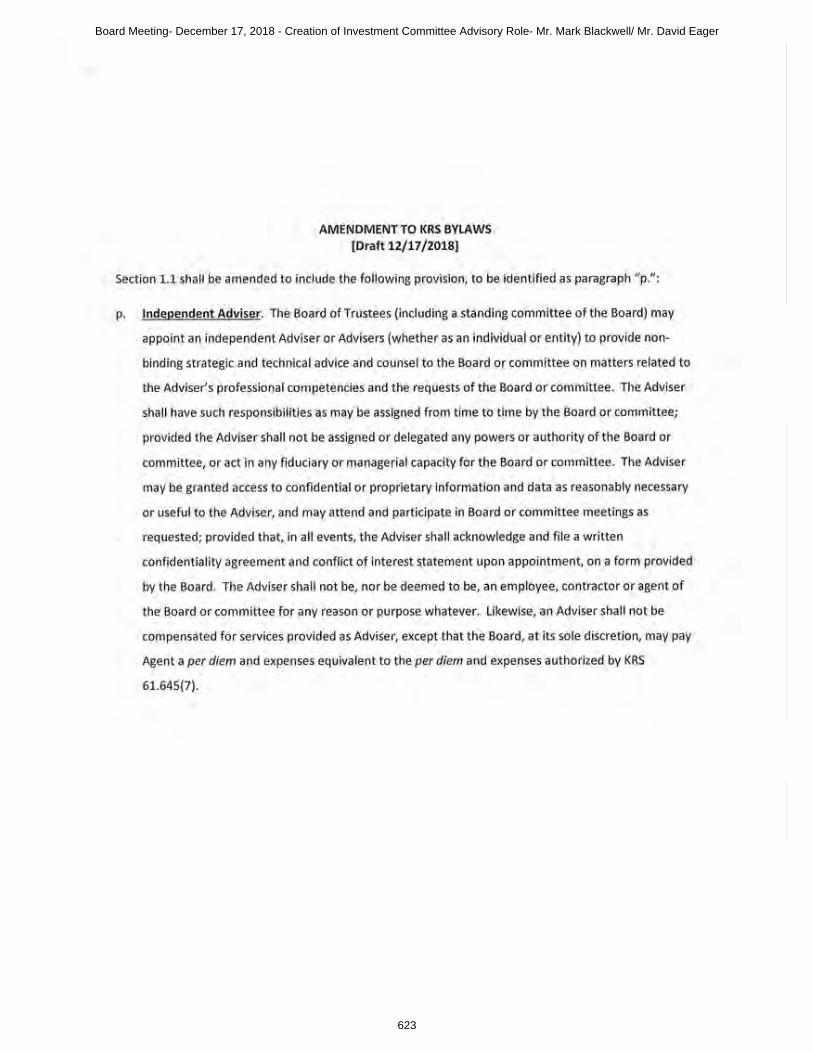
Board Meeting- December 17, 2018 - Creation of Investment Committee Advisory Role- Mr. Mark Blackwell/ Mr. David Eager
623