kentucky trauma registry report 2010threatening or limb-threatening injury requiring immediate...
TRANSCRIPT
November 2011
Svetla Slavova, PhD
Julia Costich, JD, PhD
Kentucky Injury Prevention and Research Center
333 Waller Avenue, Suite 202
Lexington, Kentucky 40504-2915
(859) 257-4954
www.kiprc.uky.edu
KENTUCKY
TRAUMA
REGISTRY REPORT
2010
2
Table of Contents
Introduction ................................................................................................................ 4
Research Findings ...................................................................................................... 5
Table 1: KY Trauma Registry patient distribution by hospital .................................. 9 Table 2: KY Trauma Registry patient distribution by gender .................................... 9 Table 3: KY Trauma Registry patient distribution by age group ............................. 10 Table 4: KY Trauma Registry patients by race and ethnicity .................................. 11 Table 5: KY Trauma Registry patient distribution by month of hospital arrival...... 11 Table 6: Top 10 KY counties by number of trauma registry cases .......................... 12 Table 7: KY Trauma Registry Top 10 county rates ................................................. 12 Table 8: Injuries by Body Region ............................................................................ 13 Table 9: Injuries by Nature of Injury........................................................................ 14 Table 10: KY Trauma Registry patients injured in motor vehicle traffic collisions 14 Table 11: KY Trauma Registry injuries by cause and intent of injury ..................... 15 Table 12: Pediatric KY Trauma Registry patients in MVTC by age........................ 16 Table 13: Pediatric KY Trauma Registry patients in motor vehicle traffic collisions,
by age and protective device .................................................................................... 17 Table 14: KY Trauma Registry patients by age and cause of injury ........................ 18 Table 15: KY Trauma Registry patients by cause of injury and alcohol use ........... 18 Table 16: KY Trauma Registry patients by cause of injury and drug use indicator . 19 Table 17: KY Trauma Registry, work related trauma injuries ................................. 19 Table 18: KY Trauma Registry, alcohol use by work related trauma injuries ......... 20 Table 19: KY Trauma Registry, drug use by work related trauma injuries .............. 20 Table 20: KY Trauma Registry patients by mode of transport delivering the patient
to the hospital and inter facility transfer status ......................................................... 21 Table 21: KY Trauma Registry patients by time from injury to hospital arrival ..... 21 Table 22: KY Trauma Registry patient distribution by shift of arrival .................... 22 Table 23: KY Trauma Registry - First recorded Glasgow Coma Score in the
ED/hospital Pediatric patients, age≤2 years ............................................................. 23 Table 24: KY Trauma Registry - First recorded Glasgow Coma Score in the
ED/hospital patients, age>2 years ............................................................................ 24 Table 25: KY Trauma Registry patient distribution by length of stay ..................... 25 Table 26: Percent of KY Trauma Registry patients by primary method of payment
.................................................................................................................................. 26 Table 27: Percent of KY Trauma Registry patients by discharge status .................. 27 Table 28: Percent of KY Trauma Registry patients by injury severity scores (ISS) 28 Table 29: KY Trauma Registry ATV injuries by injury severity scores .................. 29 Figure 1: Kentucky Trauma Registry patients by age group .................................... 29 Figure 2: KY Trauma Registry patients - total length of hospital stay in days by
cause of injury .......................................................................................................... 30
Kentucky
Trauma
Registry
2010

3
Forward
The Kentucky Trauma Registry (KTR) Report 2010 is a publication of the Kentucky
Injury Prevention and Research Center (KIPRC). This report presents trauma data submitted to
the National Trauma Data Bank (NTDB) from the state’s trauma facilities. The NTDB collects
uniform data from hospitals that are verified by the American College of Surgeons (ACS) as
trauma centers. Clinical Data Management, Inc. (CDM) is the vendor that maintains the central
Kentucky Trauma Registry repository and the Kentucky eTraumaBase TraumaLite web system,
which supplies injury data to the Kentucky Injury Prevention and Research Center. CDM also
manages the downloading and compilation of data from participating trauma centers, including
undesignated facilities that report to the repository. CDM provides analysis and reports on
repository data and recommends the collection of new data elements.
Statewide data collection from ACS-verified hospitals is critical to the completeness of
the Kentucky traumatic injury data and especially on Kentucky motor vehicle injuries that are the
leading cause of major traumatic injuries in the state. In response to a legislative initiative,
Kentucky is expanding the number of trauma registry data reporting facilities to a projected 12
facilities by year 2012. All these facilities are required to report in compliance with the NTDB
standards as a condition of their new status. Trauma hospitals are required to submit particular
data elements to the Kentucky Trauma Registry (KTR) system that are periodically reported to
the NTDB system. The Kentucky Injury Prevention and Research Center (KIPRC) operates the
KTR system. KIPRC received funding from the Kentucky Transportation Cabinet and the
Foundation for a Healthy Kentucky to analyze the statewide trauma registry data and provide
more detailed profile of the traumatic injuries treated in the Kentucky trauma facilities. This
report is intended to provide a baseline for assessment of the input from newly verified facilities
in subsequent years.
Requests for copies of this publication and any other inquiries should be directed to:
Kentucky Injury Prevention and Research Center
333 Waller Avenue, Suite 242
Lexington, Kentucky 40504-2915
(859) 257-4954 office
(859) 257-3909 fax
This report and previous trauma reports are posted on our website:
http://www.kiprc.uky.edu/projects/trauma/index.html

4
Introduction
Kentucky law (KRS 311A.010) defines “trauma” as a single or multi-system life-
threatening or limb-threatening injury requiring immediate medical or surgical intervention or
treatment to prevent death or permanent disability.
The body of this report is summary data for trauma cases seen at the Kentucky trauma
centers in 2010. The registry does not include any trauma data from other Kentucky hospitals
unless individuals were transferred from another hospital to one of the trauma centers. It is
important to note that these data represent only the most serious survivable injuries and not all
traumatic injuries in the state. Trauma cases leading to death at the scene of the event are
obviously not part of the reported data. Data for trauma sustained in Kentucky but treated in out-
of-state facilities are not available. Border areas are thus under-represented in this report. A
broad overview of the hospital care provided to Kentucky residents whose primary diagnosis was
some form of physical trauma is provided in the Kentucky Inpatient and Emergency Department
Traumatic Injury Data Report available at http://www.kiprc.uky.edu/projects/trauma/index.html.
Kentucky’s Reporting Trauma Centers in 2009:
o Ephraim McDowell Regional Medical Center
o Fort Logan Hospital
o Frankfort Regional Medical Center
o James B. Haggin Memorial Hospital
o Kosair Children’s Hospital
o Livingston Hospital
o Marcum and Wallace Memorial Hospital
o St. Joseph Berea
o Taylor Regional Medical Center
o University of Louisville Hospital
o University of Kentucky Chandler Medical Center

5
Research Findings
The Kentucky Trauma Registry expanded from 5 reporting facilities in 2009 to 11
reporting facilities in 2010. A total of 7,709 patients were reported to the Kentucky Trauma
Registry in 2010, an increase of 931 cases compared with year 2009. The increase is due
partially to the newly added facilities (417 cases) but also to an increase in the volume of trauma
cases treated in the existed trauma facilities. The University of Kentucky Hospital reported 3,146
cases, including both children and adults, or 40.81% of all KTR cases in 2010. The University of
Louisville hospital reported 2,943 (38.18%) trauma patients, Kosair Children’s Hospital saw 851
(11.04%), Taylor Regional Medical Center treated 192 patients (2.49%), and Ephraim McDowell
Regional Medical Center reported 160 cases (2.08%) (Table 1).
Demographic information collected included gender, age, race, and ethnicity. Males
comprised 65.27% of KTR patients (Table 2), reflecting the predominance of males in the injury
categories classified by the American College of Surgeons as trauma. ACS trauma classification
excludes hip fractures, the most common traumatic injury in older adults, and a category that is
therefore predominantly female. Thus, KTR demographics are strikingly different from those of
the related report on traumatic injuries as a whole, in which males and females are roughly
equally represented (Annual Kentucky Inpatient and ED Traumatic Injury Data Reports can be
found on our website www.kiprc.uky.edu/projects/trauma/index.html). The same issue of
inclusion criteria influences the distribution of trauma cases by age group. Whereas the
statewide hospitalization data for traumatic injury (including hip fractures) is skewed towards
older age groups, the KTR data is concentrated in working-age adults (Figure 1 and Table 3),
with over half (52.24%) aged 25-64.
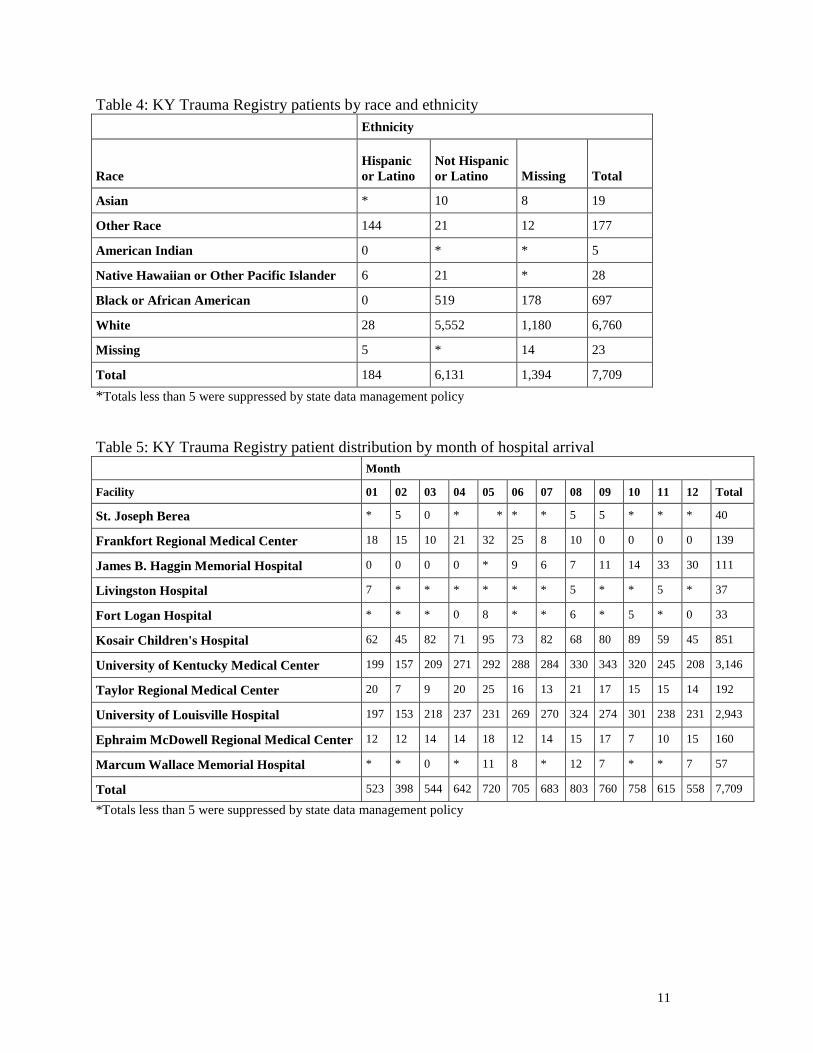
The ethnicity variable was much better populated this year (18.1% missing ethnicity
codes compared with 56.3% missing values in 2009). About 88% of the patients were white, 9%
were black. The distribution of trauma patients by race and ethnicity is presented in Table 4.
Trauma rates vary by season, with higher incidence during late summer months (Table
5). August and September had the highest number of incidents leading to treatment in the
trauma facilities, mainly due to the increased number of motor vehicle traffic collision injuries
among 15-24 and 35-44 age groups.

6
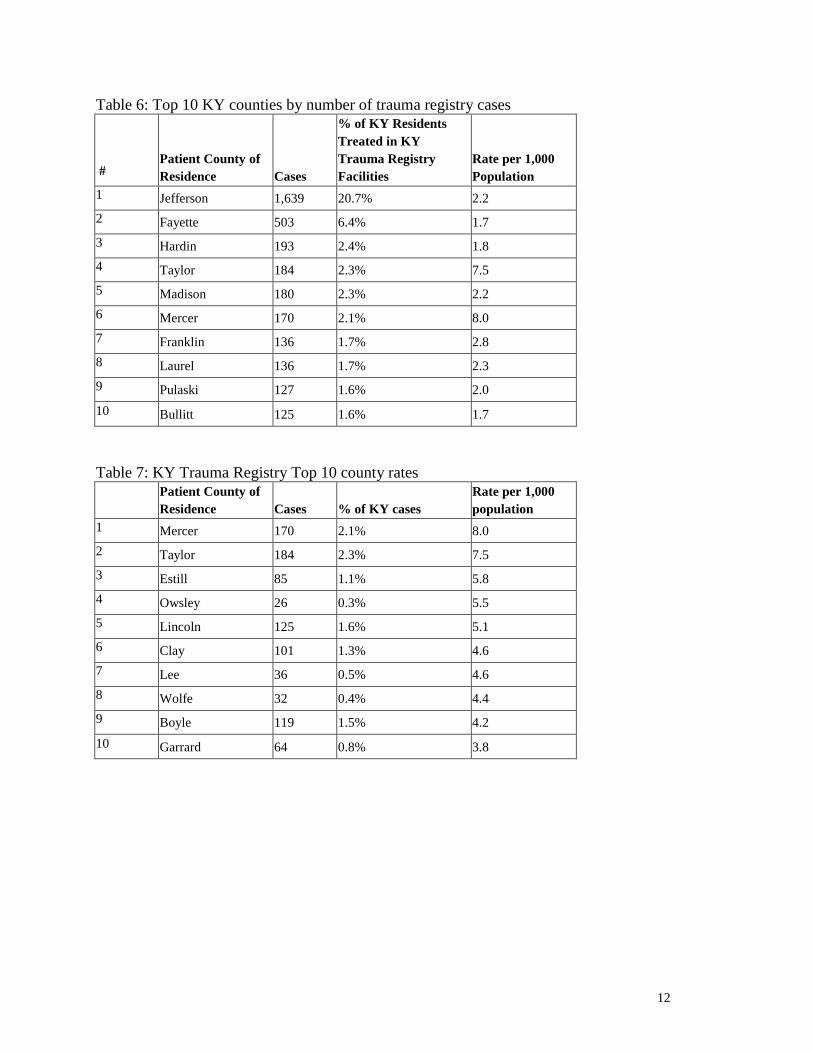
The county of residence was calculated based on a zip-to-county algorithm that may
misclassify counties where zip codes cross county lines. County-specific data must also be read
with the caveat that we are only reporting on Kentucky facilities, so patients from the northern
and southern tiers of counties, who often receive trauma care in Ohio and Tennessee
respectively, are underrepresented in the current data (Tables 6 and 7). Jefferson and Fayette
counties had the highest numbers of patients, reflecting the larger population of these counties
(Table 6). Rural Appalachian counties have the highest rates of injury per 1,000 population
(Table 7). There were 981 records (12.7%) for out-of-state residents treated in Kentucky trauma
facilities.
Table 8 presents summary of the injuries by body region. The classification is based on
the Barell injury diagnosis matrix (http://www.cdc.gov/nchs/data/ice/final_matrix_post_ice.pdf).
Head injuries were labeled as Type 1 TBI if there were principal diagnosis codes for an
intracranial injury, or a moderate/prolonged loss of consciousness, shaken infant syndrome, or
injuries to the optic nerve pathways. Type 2 TBI included head injuries with no intracranial
injury coded, and loss of consciousness of less than 1 hour coded, or loss of consciousness of
unknown duration coded, or unspecified level of consciousness coded. Type 3 TBI included
patients with no intracranial injury coded and no loss of consciousness coded. TBI injuries
accounted for 26.8% of all trauma registry cases, followed by torso injuries (20.5%) and lower
extremity injuries (18.0%). More than half of the injuries (52.7%) were fractures by nature of
injury (see Table 9). The second large group (28.4%) was the internal organ injury group.
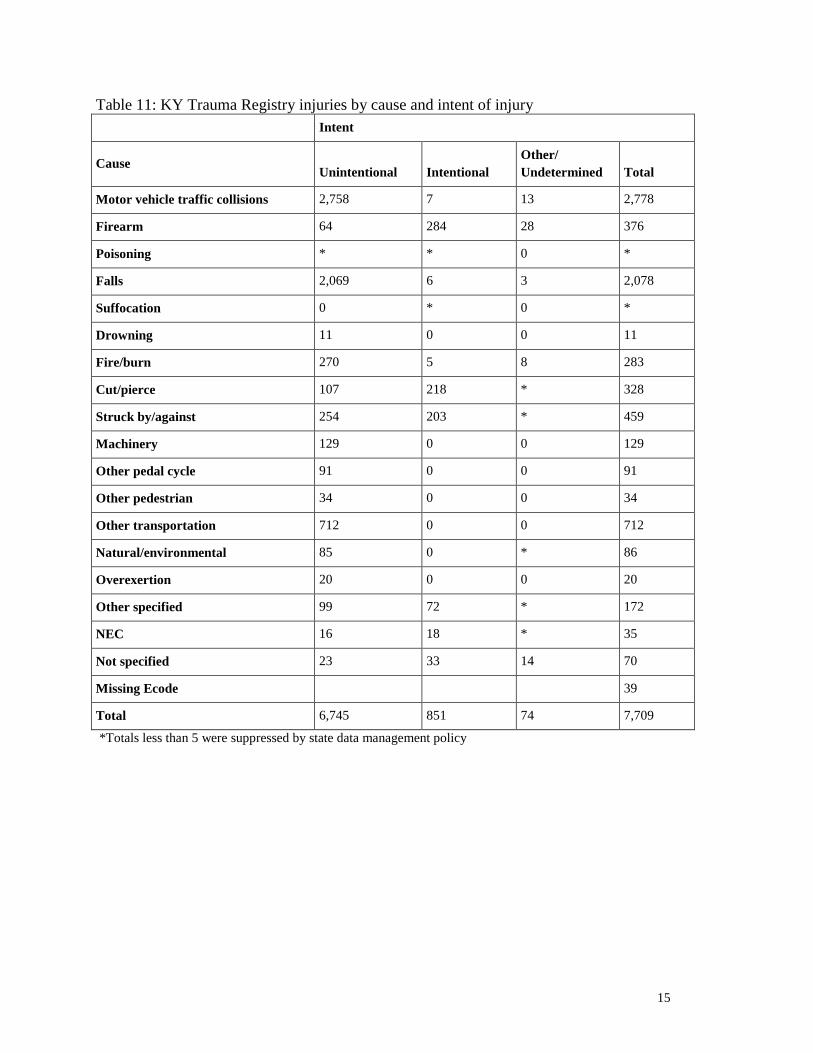
Motor vehicle traffic collisions (MVTC) continue to be the leading cause of traumatic
injuries in Kentucky: 2,778 trauma registry records, or 36% of all trauma registry cases in 2010
(see Table 11). Falls (2,078 or 27%) were the second leading cause of injuries reported to KTR.
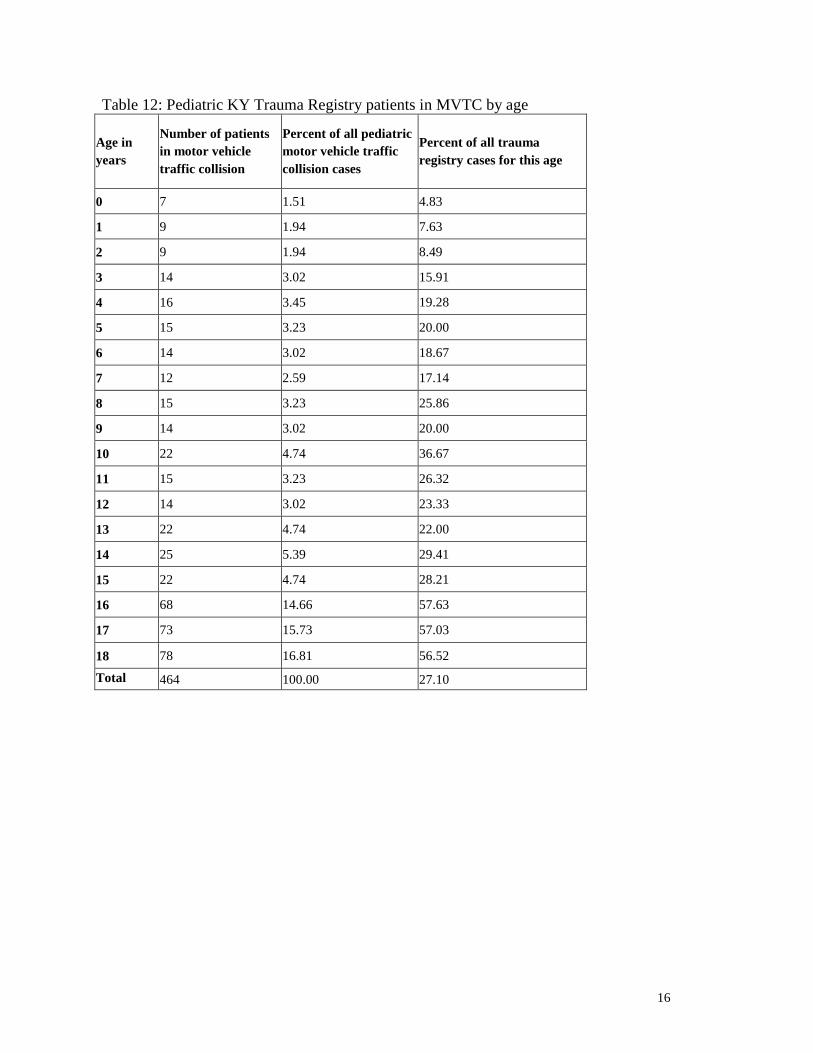
Most of the injuries in motor vehicle crashes were sustained by vehicle occupants (72%),
followed by motorcyclists (17%), and pedestrians (7.6%) (Table 10). Data on age of children and
adolescents admitted for motor vehicle crash-related injuries (464 cases) are presented in greater
detail in Table 12.
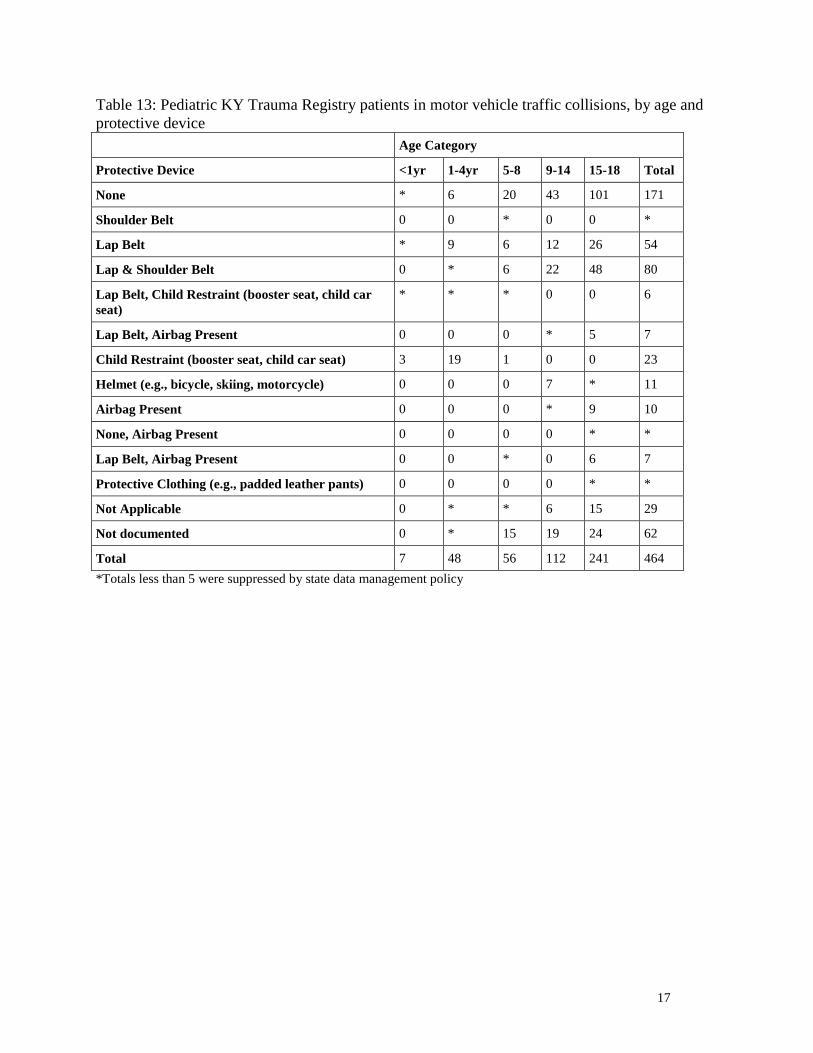
Table 13 describes the use of protective devices for the pediatric patients injured in motor
vehicle traffic collisions: 171 (37%) did not have protective devices, in 62 cases (13.4%) the
presence or use of a protective device was not documented.
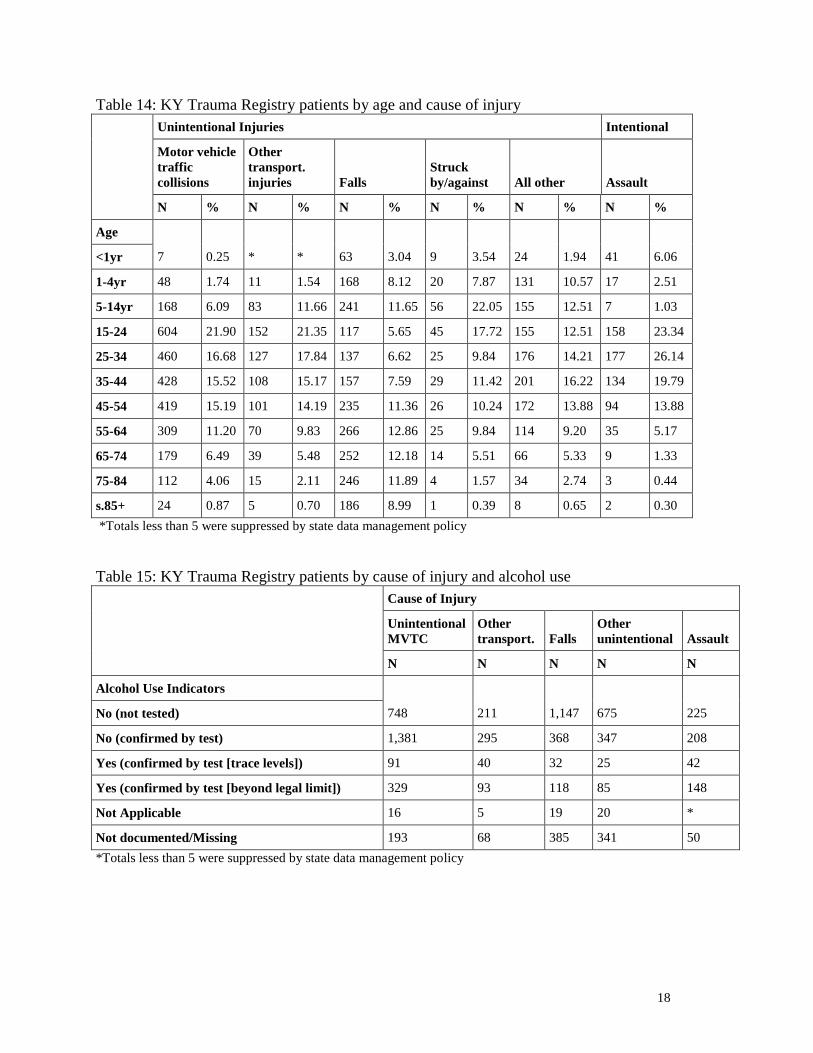
Patients aged 15-24 accounted for 21.9% of the MVT-related trauma, followed by those
aged 25-34 (16.7%). The trend is similar to the trend observed last year. Falls among those 55-64
years old accounted for 12.9% of all falls treated in trauma centers. Almost one forth (56 cases)
7
of the injuries attributed to being struck by or against an object were experienced by the patients
5-14 years of age. The review of the struck by/against injuries in this group showed that 45% of
these injuries were due to striking against or struck accidentally in sports (Ecodes E917.0,
E917.5). Half of the assault injuries were among young adults ages 15-34 (Table 14).
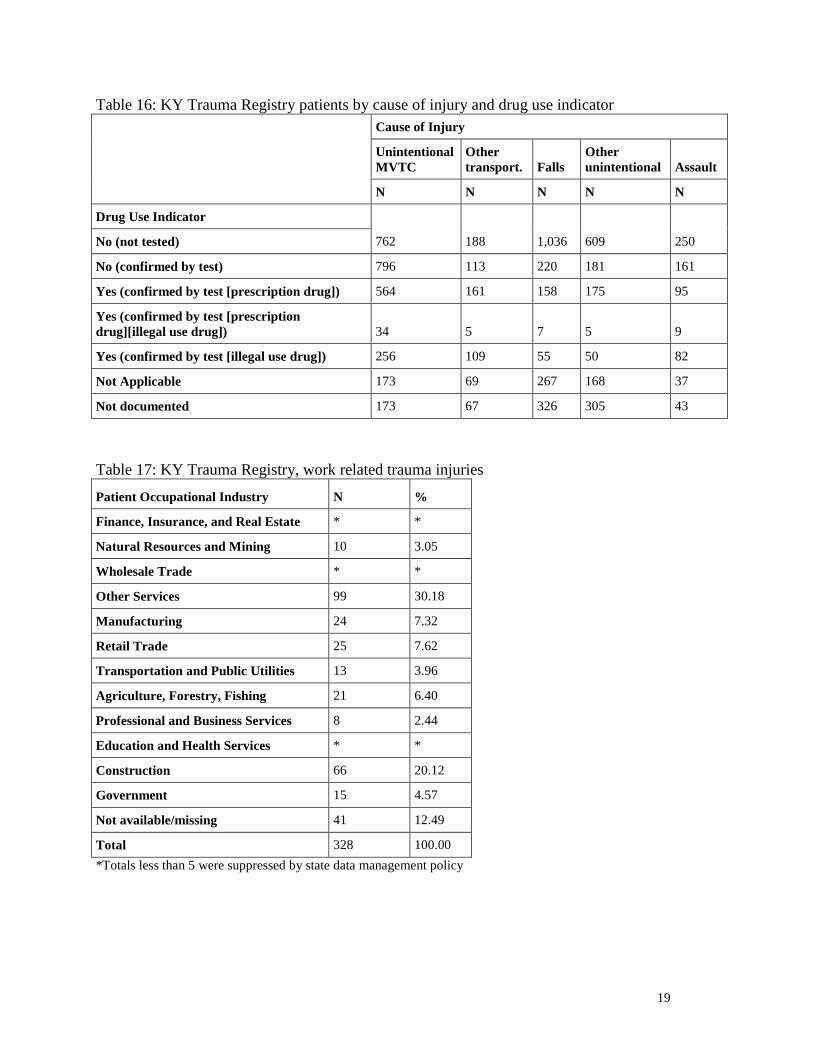
Alcohol use beyond legal limits was confirmed by test for 329 (12%) of the unintentional
motor vehicle traffic collision injuries and for 148 (22%) of the assaults (Table 15). Illegal use
drug was confirmed in 290 (11%) of the MVT collision injuries, in 16% of the unintentional
injuries due to other transportation, and in 13% of the assaults (Table 16).
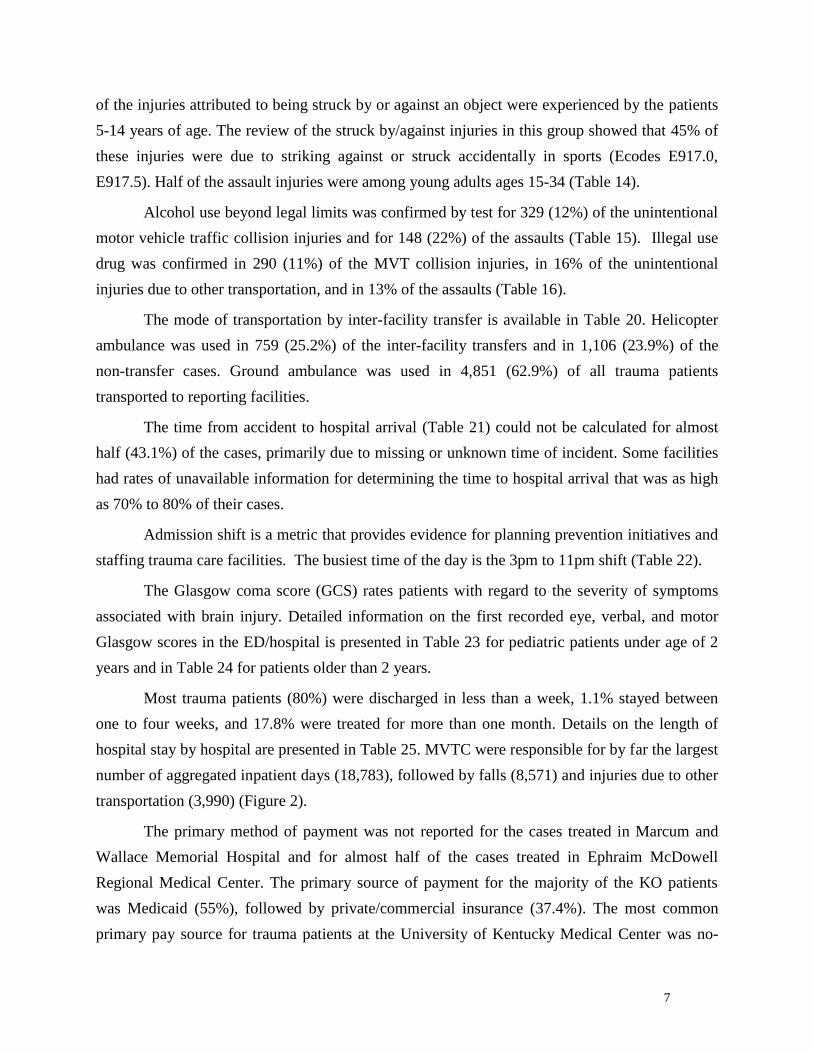
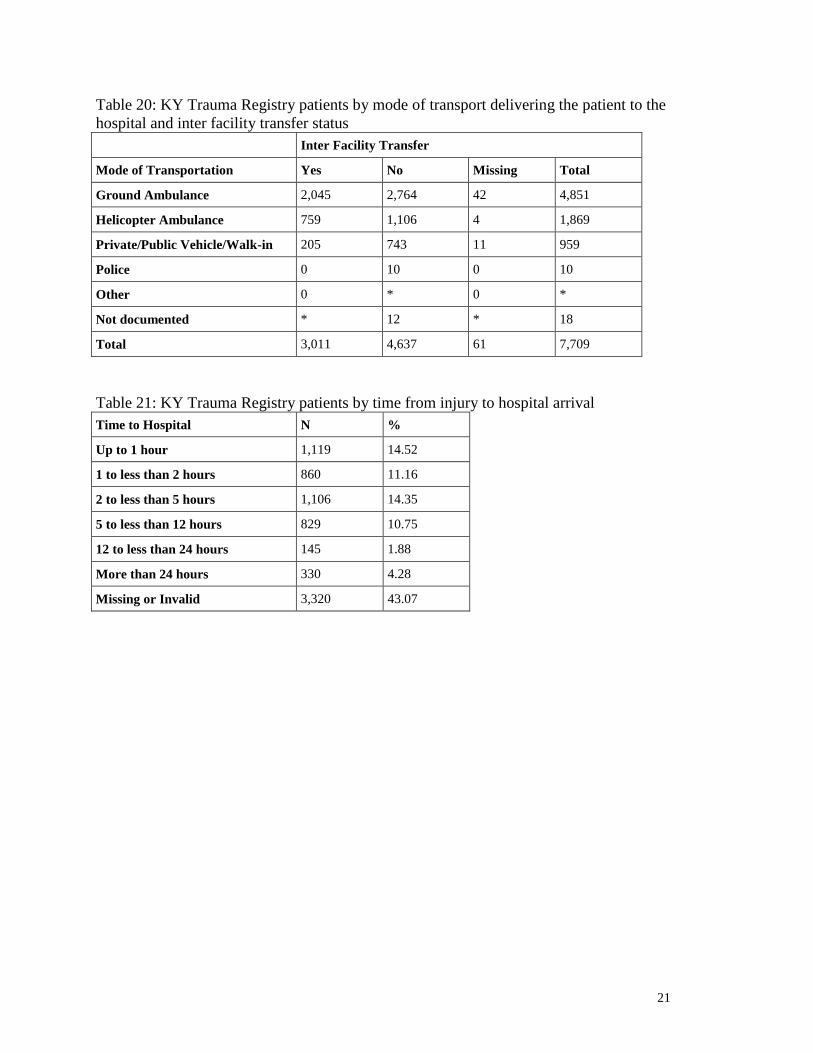
The mode of transportation by inter-facility transfer is available in Table 20. Helicopter
ambulance was used in 759 (25.2%) of the inter-facility transfers and in 1,106 (23.9%) of the
non-transfer cases. Ground ambulance was used in 4,851 (62.9%) of all trauma patients
transported to reporting facilities.
The time from accident to hospital arrival (Table 21) could not be calculated for almost
half (43.1%) of the cases, primarily due to missing or unknown time of incident. Some facilities
had rates of unavailable information for determining the time to hospital arrival that was as high
as 70% to 80% of their cases.
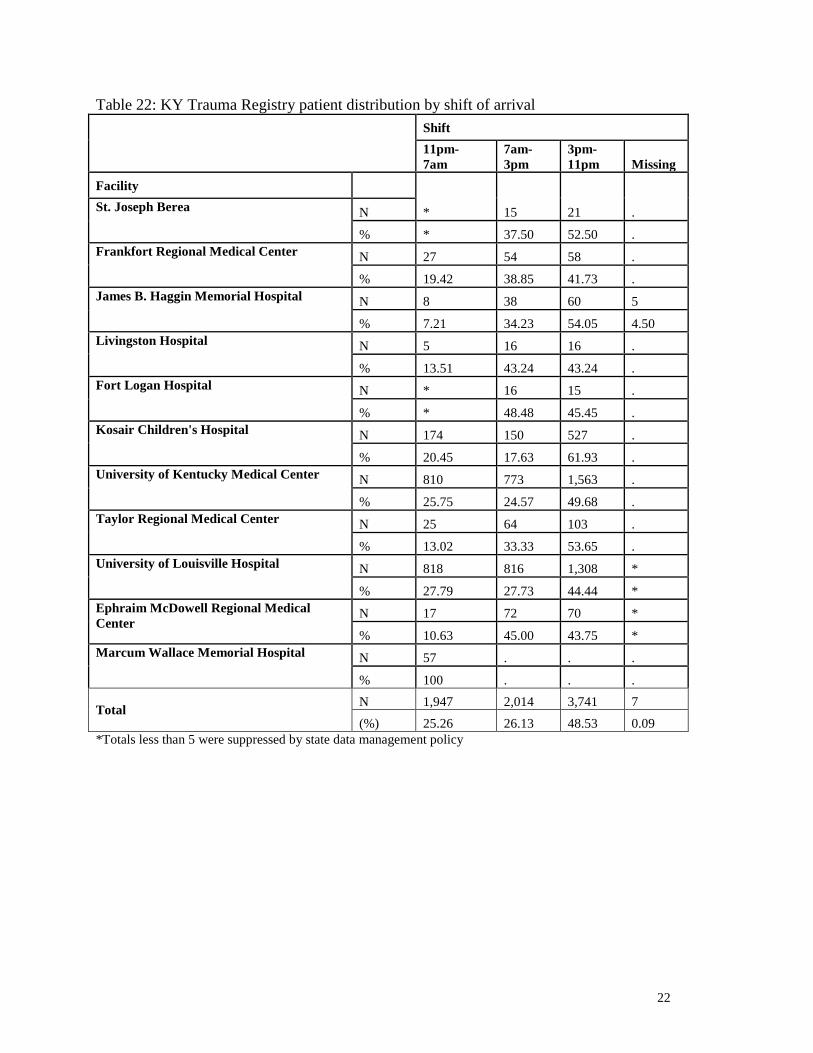
Admission shift is a metric that provides evidence for planning prevention initiatives and
staffing trauma care facilities. The busiest time of the day is the 3pm to 11pm shift (Table 22).
The Glasgow coma score (GCS) rates patients with regard to the severity of symptoms
associated with brain injury. Detailed information on the first recorded eye, verbal, and motor
Glasgow scores in the ED/hospital is presented in Table 23 for pediatric patients under age of 2
years and in Table 24 for patients older than 2 years.
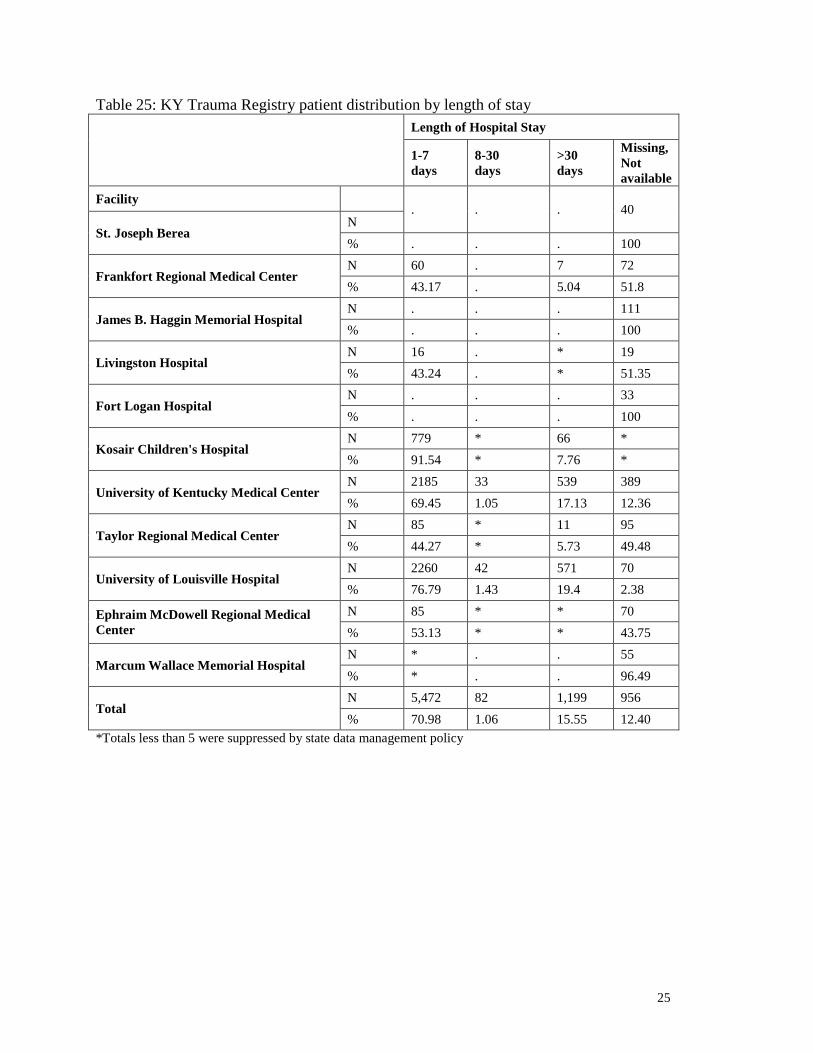
Most trauma patients (80%) were discharged in less than a week, 1.1% stayed between
one to four weeks, and 17.8% were treated for more than one month. Details on the length of
hospital stay by hospital are presented in Table 25. MVTC were responsible for by far the largest
number of aggregated inpatient days (18,783), followed by falls (8,571) and injuries due to other
transportation (3,990) (Figure 2).
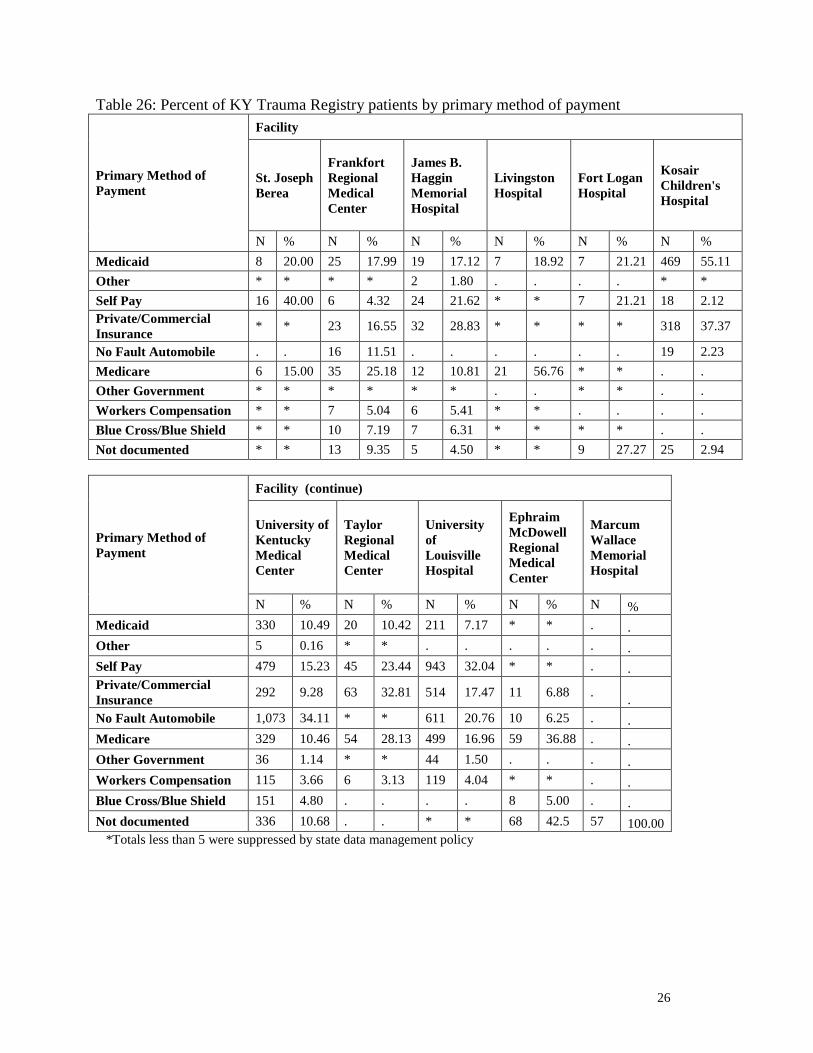
The primary method of payment was not reported for the cases treated in Marcum and
Wallace Memorial Hospital and for almost half of the cases treated in Ephraim McDowell
Regional Medical Center. The primary source of payment for the majority of the KO patients
was Medicaid (55%), followed by private/commercial insurance (37.4%). The most common
primary pay source for trauma patients at the University of Kentucky Medical Center was no-

8
fault automobile (34.1%), followed by “self pay” (15.2%), reflecting lack of any third party
payment source. “Self pay” was the most common primary method of payment for the trauma
cases at the University of Louisville Hospital (32%) and for the patients at St. Joseph Berea
(40%). Because “self pay” patients are often medically indigent, the implications of this finding
are very serious and warrant further analysis. For more details on primary method of payment
see Table 26.
The large majority of trauma patients, 67.6%, were discharged to home with no home
services; 10.1% were discharged/transferred to another type of rehabilitation or long-term care
facility, 3.9% (302 patients) expired, 2.9% were discharged to a skilled nursing facility, 1.3%
went home under home health care, 0.4% were transferred to a short-term general hospital for
inpatient care, 0.4% were transferred to an intermediate care facility, and 0.4% left against
medical advice. Ten patients were transferred to hospice care. Information on the disposition was
not available for 135 of the cases. Table 27 gives more details on the patient discharge status by
trauma facility.
The Injury Severity Score (ISS) is an anatomical rating system that provides numerical
values for patients with multiple and varying injuries. The National Trauma Data Bank
characterizes ISS scores of 1-9 as mild, 10-15 as moderate, 16-24 as severe, and over 24 as very
severe. Using this metric, 59.3% of trauma registry injuries were mild, 16.9% moderate, 14.2%
severe, and 8% very severe. ISS was missing for 1.6% of the patients. For details by hospital,
refer to Table 28.
Finally, because all-terrain vehicle (ATV) injuries are a particular concern in Kentucky,
Table 29 presents details on these injuries by severity score and age group.

9
Tables and Figures
Table 1: KY Trauma Registry patient distribution by hospital
Facility N %
St. Joseph Berea 40 0.52
Frankfort Regional Medical Center 139 1.80
James B. Haggin Memorial Hospital 111 1.44
Livingston Hospital 37 0.48
Fort Logan Hospital 33 0.43
Kosair Children's Hospital 851 11.04
University of Kentucky Medical Center 3,146 40.81
Taylor Regional Medical Center 192 2.49
University of Louisville Hospital 2,943 38.18
Ephraim McDowell Regional Medical Center 160 2.08
Marcum Wallace Memorial Hospital 57 0.74
Total 7,709 100.00
Table 2: KY Trauma Registry patient distribution by gender
Gender N %
Female 2,676 34.71
Male 5,031 65.27
Missing 2 0.02
Total 7,707 100.00

10
Table 3: KY Trauma Registry patient distribution by age group
Facility
St. Joseph
Berea
Frankfort
Regional
Medical
Center
James B.
Haggin
Memorial
Hospital
Livingston
Hospital
Fort Logan
Hospital
Kosair
Children's
Hospital
N % N % N % N % N % N %
Age
* * * * * * 96 11.29 <1yr
1-4 * * 7 5.04 13 11.93 * * * * 229 26.94
5-14 * * 10 7.19 8 7.34 * * 6 18.18 421 49.53
15-24 5 12.50 17 12.23 21 19.27 * * 7 21.21 104 12.24
25-34 * * 16 11.51 17 15.60 * * * *
35-44 * * 14 10.07 10 9.17 * * * *
45-54 6 15.00 13 9.35 15 13.76 * * * *
55-64 5 12.50 16 11.51 12 11.01 5 13.51 * *
65-74 * * 20 14.39 9 8.26 6 16.22 * *
75-84 * * 18 12.95 * * 7 18.92 * *
85+ * * 6 4.32 * * 8 21.62
Facility (continue)
University of
Kentucky
Medical
Center
Taylor
Regional
Medical
Center
University of
Louisville
Hospital
Ephraim
McDowell
Regional
Medical
Center
Marcum
Wallace
Memorial
Hospital
N % N % N % N % N %
Age
44 1.40 <1yr
1-4 128 4.07 8 4.17 * *
5-14 225 7.15 22 11.46 6 0.20 * * 5 8.93
15-24 499 15.86 25 13.02 517 17.57 26 16.25 8 14.29
25-34 500 15.89 17 8.85 524 17.80 8 5.00 11 19.64
35-44 483 15.35 24 12.50 497 16.89 13 8.13 6 10.71
45-54 463 14.72 26 13.54 498 16.92 15 9.38 8 14.29
55-64 354 11.25 24 12.50 380 12.91 15 9.38 5 8.93
65-74 221 7.02 21 10.94 251 8.53 20 12.50 6 10.71
75-84 151 4.80 14 7.29 180 6.12 35 21.88 * *
85+ 78 2.48 11 5.73 90 3.06 25 15.63 * *
11
Table 4: KY Trauma Registry patients by race and ethnicity
Ethnicity
Race
Hispanic
or Latino
Not Hispanic
or Latino Missing Total
Asian * 10 8 19
Other Race 144 21 12 177
American Indian 0 * * 5
Native Hawaiian or Other Pacific Islander 6 21 * 28
Black or African American 0 519 178 697
White 28 5,552 1,180 6,760
Missing 5 * 14 23
Total 184 6,131 1,394 7,709
*Totals less than 5 were suppressed by state data management policy
Table 5: KY Trauma Registry patient distribution by month of hospital arrival
Month
Facility 01 02 03 04 05 06 07 08 09 10 11 12 Total
St. Joseph Berea * 5 0 * * * * 5 5 * * * 40
Frankfort Regional Medical Center 18 15 10 21 32 25 8 10 0 0 0 0 139
James B. Haggin Memorial Hospital 0 0 0 0 * 9 6 7 11 14 33 30 111
Livingston Hospital 7 * * * * * * 5 * * 5 * 37
Fort Logan Hospital * * * 0 8 * * 6 * 5 * 0 33
Kosair Children's Hospital 62 45 82 71 95 73 82 68 80 89 59 45 851
University of Kentucky Medical Center 199 157 209 271 292 288 284 330 343 320 245 208 3,146
Taylor Regional Medical Center 20 7 9 20 25 16 13 21 17 15 15 14 192
University of Louisville Hospital 197 153 218 237 231 269 270 324 274 301 238 231 2,943
Ephraim McDowell Regional Medical Center 12 12 14 14 18 12 14 15 17 7 10 15 160
Marcum Wallace Memorial Hospital * * 0 * 11 8 * 12 7 * * 7 57
Total 523 398 544 642 720 705 683 803 760 758 615 558 7,709
*Totals less than 5 were suppressed by state data management policy
12
Table 6: Top 10 KY counties by number of trauma registry cases
# Patient County of
Residence Cases
% of KY Residents
Treated in KY
Trauma Registry
Facilities
Rate per 1,000
Population
1 Jefferson 1,639 20.7% 2.2
2 Fayette 503 6.4% 1.7
3 Hardin 193 2.4% 1.8
4 Taylor 184 2.3% 7.5
5 Madison 180 2.3% 2.2
6 Mercer 170 2.1% 8.0
7 Franklin 136 1.7% 2.8
8 Laurel 136 1.7% 2.3
9 Pulaski 127 1.6% 2.0
10 Bullitt 125 1.6% 1.7
Table 7: KY Trauma Registry Top 10 county rates
Patient County of
Residence Cases % of KY cases
Rate per 1,000
population
1 Mercer 170 2.1% 8.0
2 Taylor 184 2.3% 7.5
3 Estill 85 1.1% 5.8
4 Owsley 26 0.3% 5.5
5 Lincoln 125 1.6% 5.1
6 Clay 101 1.3% 4.6
7 Lee 36 0.5% 4.6
8 Wolfe 32 0.4% 4.4
9 Boyle 119 1.5% 4.2
10 Garrard 64 0.8% 3.8

13
Table 8: Injuries by Body Region
Injuries by Body Region N %
Hea
d a
nd
Nec
k
Tra
um
ati
c
Bra
in
Inju
ry
(TB
I)
Type 1 TBI 1,262 16.49
Type 2 TBI 656 8.57
Type 3 TBI 135 1.76
Oth
er h
ead
, fa
ce
an
d n
eck
Other Head 142 1.86
Face 416 5.44
Eye 28 0.37
Neck 56 0.73
Head, Face and Neck Unspecified 27 0.35
Sp
ine
an
d b
ack
Sp
ina
l C
ord
(SC
I)
Cervical SCI 49 0.64
Thoracic/ Dorsal SCI 17 0.22
Lumbar SCI 6 0.08
Sacrum Coccyx SCI * *
Spine+ Back unspecified SCI 5 0.07
Ver
teb
ral
Co
lum
n
(VC
I)
Cervical VCI 258 3.37
Thoracic /Dorsal VCI 117 1.53
Lumbar VCI 135 1.76
Sacrum Coccyx VCI 18 0.24
To
rso
To
rso
Chest (Thorax) 892 11.66
Abdomen 388 5.07
Pelvis and Urogenital 231 3.02
Trunk 31 0.41
Back and Buttock 27 0.35
Ex
trem
itie
s
Up
per
Shoulder and upper arm 500 6.53
Forearm and elbow 322 4.21
Wrist, hand and fingers 249 3.25
Other and unspecified 58 0.76
Lo
wer
Hip 249 3.25
Upper leg and thigh 289 3.78
Knee 35 0.46
Lower leg and ankle 557 7.28
Foot and toes 155 2.03
Other and unspecified 90 1.18
Un
cla
ssif
iab
le
by
sit
e
Oth
er
an
d u
n-
spec
ifie
d Other/multiple * *
Unspecified site 240 3.14
Sy
stem
wid
e
System-wide & late effects 10 0.13
Note: Diagnosis codes were missing for 56 cases

14
Table 9: Injuries by Nature of Injury
Nature of Injury N %
Fractures 4,032 52.69
Dislocation 102 1.33
Sprains & Strains 59 0.77
Internal Organ 2,173 28.39
Open Wounds 639 8.35
Amputations 64 0.84
Blood Vessels 75 0.98
Crushing 18 0.24
Burns 322 4.21
Nerves 20 0.26
Unspecified 139 1.82
System Wide & Late Effects 10 0.13
Note: Diagnosis codes were missing for 56 cases
Table 10: KY Trauma Registry patients injured in motor vehicle traffic collisions
Role in motor vehicle collision Number
Occupant 1,975
Motorcyclist 471
Pedal cyclist 41
Pedestrian 211
Unknown 59
Other 21
Total 2,778
15
Table 11: KY Trauma Registry injuries by cause and intent of injury
Intent
Cause Unintentional Intentional
Other/
Undetermined Total
Motor vehicle traffic collisions 2,758 7 13 2,778
Firearm 64 284 28 376
Poisoning * * 0 *
Falls 2,069 6 3 2,078
Suffocation 0 * 0 *
Drowning 11 0 0 11
Fire/burn 270 5 8 283
Cut/pierce 107 218 * 328
Struck by/against 254 203 * 459
Machinery 129 0 0 129
Other pedal cycle 91 0 0 91
Other pedestrian 34 0 0 34
Other transportation 712 0 0 712
Natural/environmental 85 0 * 86
Overexertion 20 0 0 20
Other specified 99 72 * 172
NEC 16 18 * 35
Not specified 23 33 14 70
Missing Ecode 39
Total 6,745 851 74 7,709
*Totals less than 5 were suppressed by state data management policy
16
Table 12: Pediatric KY Trauma Registry patients in MVTC by age
Age in
years
Number of patients
in motor vehicle
traffic collision
Percent of all pediatric
motor vehicle traffic
collision cases
Percent of all trauma
registry cases for this age
0 7 1.51 4.83
1 9 1.94 7.63
2 9 1.94 8.49
3 14 3.02 15.91
4 16 3.45 19.28
5 15 3.23 20.00
6 14 3.02 18.67
7 12 2.59 17.14
8 15 3.23 25.86
9 14 3.02 20.00
10 22 4.74 36.67
11 15 3.23 26.32
12 14 3.02 23.33
13 22 4.74 22.00
14 25 5.39 29.41
15 22 4.74 28.21
16 68 14.66 57.63
17 73 15.73 57.03
18 78 16.81 56.52
Total 464 100.00 27.10
17
Table 13: Pediatric KY Trauma Registry patients in motor vehicle traffic collisions, by age and
protective device
Age Category
Protective Device <1yr 1-4yr 5-8 9-14 15-18 Total
None * 6 20 43 101 171
Shoulder Belt 0 0 * 0 0 *
Lap Belt * 9 6 12 26 54
Lap & Shoulder Belt 0 * 6 22 48 80
Lap Belt, Child Restraint (booster seat, child car
seat)
* * * 0 0 6
Lap Belt, Airbag Present 0 0 0 * 5 7
Child Restraint (booster seat, child car seat) 3 19 1 0 0 23
Helmet (e.g., bicycle, skiing, motorcycle) 0 0 0 7 * 11
Airbag Present 0 0 0 * 9 10
None, Airbag Present 0 0 0 0 * *
Lap Belt, Airbag Present 0 0 * 0 6 7
Protective Clothing (e.g., padded leather pants) 0 0 0 0 * *
Not Applicable 0 * * 6 15 29
Not documented 0 * 15 19 24 62
Total 7 48 56 112 241 464
*Totals less than 5 were suppressed by state data management policy
18
Table 14: KY Trauma Registry patients by age and cause of injury
Unintentional Injuries Intentional
Motor vehicle
traffic
collisions
Other
transport.
injuries Falls
Struck
by/against All other Assault
N % N % N % N % N % N %
Age
7 0.25 * * 63 3.04 9 3.54 24 1.94 41 6.06 <1yr
1-4yr 48 1.74 11 1.54 168 8.12 20 7.87 131 10.57 17 2.51
5-14yr 168 6.09 83 11.66 241 11.65 56 22.05 155 12.51 7 1.03
15-24 604 21.90 152 21.35 117 5.65 45 17.72 155 12.51 158 23.34
25-34 460 16.68 127 17.84 137 6.62 25 9.84 176 14.21 177 26.14
35-44 428 15.52 108 15.17 157 7.59 29 11.42 201 16.22 134 19.79
45-54 419 15.19 101 14.19 235 11.36 26 10.24 172 13.88 94 13.88
55-64 309 11.20 70 9.83 266 12.86 25 9.84 114 9.20 35 5.17
65-74 179 6.49 39 5.48 252 12.18 14 5.51 66 5.33 9 1.33
75-84 112 4.06 15 2.11 246 11.89 4 1.57 34 2.74 3 0.44
s.85+ 24 0.87 5 0.70 186 8.99 1 0.39 8 0.65 2 0.30
*Totals less than 5 were suppressed by state data management policy
Table 15: KY Trauma Registry patients by cause of injury and alcohol use
Cause of Injury
Unintentional
MVTC
Other
transport. Falls
Other
unintentional Assault
N N N N N
Alcohol Use Indicators
748 211 1,147 675 225 No (not tested)
No (confirmed by test) 1,381 295 368 347 208
Yes (confirmed by test [trace levels]) 91 40 32 25 42
Yes (confirmed by test [beyond legal limit]) 329 93 118 85 148
Not Applicable 16 5 19 20 *
Not documented/Missing 193 68 385 341 50
*Totals less than 5 were suppressed by state data management policy
19
Table 16: KY Trauma Registry patients by cause of injury and drug use indicator
Cause of Injury
Unintentional
MVTC
Other
transport. Falls
Other
unintentional Assault
N N N N N
Drug Use Indicator
762 188 1,036 609 250 No (not tested)
No (confirmed by test) 796 113 220 181 161
Yes (confirmed by test [prescription drug]) 564 161 158 175 95
Yes (confirmed by test [prescription
drug][illegal use drug]) 34 5 7 5 9
Yes (confirmed by test [illegal use drug]) 256 109 55 50 82
Not Applicable 173 69 267 168 37
Not documented 173 67 326 305 43
Table 17: KY Trauma Registry, work related trauma injuries
Patient Occupational Industry N %
Finance, Insurance, and Real Estate * *
Natural Resources and Mining 10 3.05
Wholesale Trade * *
Other Services 99 30.18
Manufacturing 24 7.32
Retail Trade 25 7.62
Transportation and Public Utilities 13 3.96
Agriculture, Forestry, Fishing 21 6.40
Professional and Business Services 8 2.44
Education and Health Services * *
Construction 66 20.12
Government 15 4.57
Not available/missing 41 12.49
Total 328 100.00
*Totals less than 5 were suppressed by state data management policy
20
Table 18: KY Trauma Registry, alcohol use by work related trauma injuries
Work Related Trauma Injury
Alcohol Use Indicators No Yes Missing Total
No (not tested) 2,807 180 19 3,006
No (confirmed by test) 2,463 133 * 2,599
Yes (confirmed by test [trace levels]) 225 * * 230
Yes (confirmed by test [beyond legal limit]) 769 * * 773
Not Applicable 35 * 27 64
Not documented 28 * 5 35
Missing information 998 * 0 1,002
Total 7,325 328 23 7,709
*Totals less than 5 were suppressed by state data management policy
Table 19: KY Trauma Registry, drug use by work related trauma injuries
Work Related Trauma Injury
Drug Use Indicator No Yes Missing Total
No (not tested) 2,673 154 18 2,845
No (confirmed by test) 1,409 62 0 1,471
Yes (confirmed by test [prescription drug]) 1,100 53 0 1,153
Yes (confirmed by test [prescription drug][illegal use
drug])
59 * 0 60
Yes (confirmed by test [illegal use drug]) 534 17 * 552
Not Applicable 676 37 * 714
Not documented 874 4 36 914
Total 7,325 328 56 7,709
*Totals less than 5 were suppressed by state data management policy
21
Table 20: KY Trauma Registry patients by mode of transport delivering the patient to the
hospital and inter facility transfer status
Inter Facility Transfer
Mode of Transportation Yes No Missing Total
Ground Ambulance 2,045 2,764 42 4,851
Helicopter Ambulance 759 1,106 4 1,869
Private/Public Vehicle/Walk-in 205 743 11 959
Police 0 10 0 10
Other 0 * 0 *
Not documented * 12 * 18
Total 3,011 4,637 61 7,709
Table 21: KY Trauma Registry patients by time from injury to hospital arrival
Time to Hospital N %
Up to 1 hour 1,119 14.52
1 to less than 2 hours 860 11.16
2 to less than 5 hours 1,106 14.35
5 to less than 12 hours 829 10.75
12 to less than 24 hours 145 1.88
More than 24 hours 330 4.28
Missing or Invalid 3,320 43.07
22
Table 22: KY Trauma Registry patient distribution by shift of arrival
Shift
11pm-
7am
7am-
3pm
3pm-
11pm Missing
Facility
* 15 21 . St. Joseph Berea N
% * 37.50 52.50 .
Frankfort Regional Medical Center N 27 54 58 .
% 19.42 38.85 41.73 .
James B. Haggin Memorial Hospital N 8 38 60 5
% 7.21 34.23 54.05 4.50
Livingston Hospital N 5 16 16 .
% 13.51 43.24 43.24 .
Fort Logan Hospital N * 16 15 .
% * 48.48 45.45 .
Kosair Children's Hospital N 174 150 527 .
% 20.45 17.63 61.93 .
University of Kentucky Medical Center N 810 773 1,563 .
% 25.75 24.57 49.68 .
Taylor Regional Medical Center N 25 64 103 .
% 13.02 33.33 53.65 .
University of Louisville Hospital N 818 816 1,308 *
% 27.79 27.73 44.44 *
Ephraim McDowell Regional Medical
Center N 17 72 70 *
% 10.63 45.00 43.75 *
Marcum Wallace Memorial Hospital N 57 . . .
% 100 . . .
Total N 1,947 2,014 3,741 7
(%) 25.26 26.13 48.53 0.09
*Totals less than 5 were suppressed by state data management policy

23
Table 23: KY Trauma Registry - First recorded Glasgow Coma Score in the ED/hospital
Pediatric patients, age≤2 years
Pediatric patients, age≤2 years
N %
Glasgow Coma Score (Eye)
1 (No eye movement when assessed) 18 4.83
2 (Opens eyes in response to painful stimulation) 3 0.80
3 (Opens eyes in response to verbal stimulation) 3 0.80
4 (Opens eyes spontaneously) 328 87.94
Missing 21 5.63
Glasgow Coma Score (Verbal)
1 (No vocal response) 29 7.77
2 (Inconsolable, agitated) 7 1.88
3 (Inconsistently consolable, moaning) 6 1.61
4 (Cries but is consolable, inappropriate interactions) 12 3.22
5 (Smiles, oriented to sounds, follows objects, Interacts) 296 79.36
Missing 23 6.17
Glasgow Coma Score (Motor)
1 (No motor response) 12 3.22
2 (Extension to pain) 0 0
3 (Flexion to pain) * *
4 (Withdrawal from pain) 8 2.14
5 (Localizing pain) 36 9.65
6 (Appropriate response to stimulation) 292 78.28
Missing 23 6.17
*Totals less than 5 were suppressed by state data management policy

24
Table 24: KY Trauma Registry - First recorded Glasgow Coma Score in the ED/hospital
patients, age>2 years
Patients, age>2 years N %
Glasgow Coma Score (Eye)
1 (No eye movement when assessed) 633 8.63
2 (Opens eyes in response to painful stimulation) 70 0.95
3 (Opens eyes in response to verbal stimulation) 245 3.34
4 (Opens eyes spontaneously) 5,578 76.04
Missing 810 11.04
Glasgow Coma Score (Verbal)
1 (No verbal response) 739 10.07
2 (Incomprehensible sounds) 75 1.02
3 (Inappropriate words) 49 0.67
4 (Confused) 506 6.90
5 (Oriented) 5,154 70.26
Missing 813 11.08
Glasgow Coma Score (Motor)
1 (No motor response) 493 6.72
2 (Extension to pain) 21 0.29
3 (Flexion to pain) 17 0.23
4 (Withdrawal from pain) 110 1.50
5 (Localizing pain) 217 2.96
6 (Obeys commands) 5,665 77.22
Missing 813 11.08
25
Table 25: KY Trauma Registry patient distribution by length of stay
Length of Hospital Stay
1-7
days
8-30
days
>30
days
Missing,
Not
available
Facility . . . 40
St. Joseph Berea N
% . . . 100
Frankfort Regional Medical Center N 60 . 7 72
% 43.17 . 5.04 51.8
James B. Haggin Memorial Hospital N . . . 111
% . . . 100
Livingston Hospital N 16 . * 19
% 43.24 . * 51.35
Fort Logan Hospital N . . . 33
% . . . 100
Kosair Children's Hospital N 779 * 66 *
% 91.54 * 7.76 *
University of Kentucky Medical Center N 2185 33 539 389
% 69.45 1.05 17.13 12.36
Taylor Regional Medical Center N 85 * 11 95
% 44.27 * 5.73 49.48
University of Louisville Hospital N 2260 42 571 70
% 76.79 1.43 19.4 2.38
Ephraim McDowell Regional Medical
Center
N 85 * * 70
% 53.13 * * 43.75
Marcum Wallace Memorial Hospital N * . . 55
% * . . 96.49
Total N 5,472 82 1,199 956
% 70.98 1.06 15.55 12.40
*Totals less than 5 were suppressed by state data management policy
26
Table 26: Percent of KY Trauma Registry patients by primary method of payment
Primary Method of
Payment
Facility
St. Joseph
Berea
Frankfort
Regional
Medical
Center
James B.
Haggin
Memorial
Hospital
Livingston
Hospital
Fort Logan
Hospital
Kosair
Children's
Hospital
N % N % N % N % N % N %
Medicaid 8 20.00 25 17.99 19 17.12 7 18.92 7 21.21 469 55.11
Other * * * * 2 1.80 . . . . * *
Self Pay 16 40.00 6 4.32 24 21.62 * * 7 21.21 18 2.12
Private/Commercial
Insurance * * 23 16.55 32 28.83 * * * * 318 37.37
No Fault Automobile . . 16 11.51 . . . . . . 19 2.23
Medicare 6 15.00 35 25.18 12 10.81 21 56.76 * * . .
Other Government * * * * * * . . * * . .
Workers Compensation * * 7 5.04 6 5.41 * * . . . .
Blue Cross/Blue Shield * * 10 7.19 7 6.31 * * * * . .
Not documented * * 13 9.35 5 4.50 * * 9 27.27 25 2.94
Primary Method of
Payment
Facility (continue)
University of
Kentucky
Medical
Center
Taylor
Regional
Medical
Center
University
of
Louisville
Hospital
Ephraim
McDowell
Regional
Medical
Center
Marcum
Wallace
Memorial
Hospital
N % N % N % N % N %
Medicaid 330 10.49 20 10.42 211 7.17 * * . .
Other 5 0.16 * * . . . . . .
Self Pay 479 15.23 45 23.44 943 32.04 * * . .
Private/Commercial
Insurance 292 9.28 63 32.81 514 17.47 11 6.88 .
.
No Fault Automobile 1,073 34.11 * * 611 20.76 10 6.25 . .
Medicare 329 10.46 54 28.13 499 16.96 59 36.88 . .
Other Government 36 1.14 * * 44 1.50 . . . .
Workers Compensation 115 3.66 6 3.13 119 4.04 * * . .
Blue Cross/Blue Shield 151 4.80 . . . . 8 5.00 . .
Not documented 336 10.68 . . * * 68 42.5 57 100.00
*Totals less than 5 were suppressed by state data management policy

27
Table 27: Percent of KY Trauma Registry patients by discharge status
Hospital Discharge Disposition
Facility
Frankfort
Regional
Medical Center
Livingston
Hospital
Kosair
Children's
Hospital
University of
Kentucky
Medical Center
N % N % N % N %
Discharged/Transferred to a short-term
general hospital for inpatient care . . . . * * * *
Discharged/Transferred to an
Intermediate Care Facility (ICF) . . . . 26 3.06 * *
Discharge/Transferred to home under
care of organized home health service * * . . . . . .
Left against medical advice or
discontinued care . . . . . . 12 0.44
Expired . . . . 11 1.3 119 4.31
Discharged home with no home services 21 77.78 10 62.5 811 95.52 2178 78.97
Discharged/Transferred to Skilled
Nursing Facility * * 6 37.5 . . 53 1.92
Discharged/ Transferred to hospice care . . . . . . 5 0.18
Discharged/Transferred to another type
of rehabilitation or long-term care
facility * * . . . . 374 13.56
Hospital Discharge Disposition
Facility (continue)
University of
Louisville
Hospital
Ephraim
McDowell
Regional
Medical Center
Marcum
Wallace
Memorial
Hospital
Taylor Regional
Medical Center
N % N % N % N %
Discharged/Transferred to a short-term
general hospital for inpatient care 6 0.21 * * . . 6 6.19
Discharged/Transferred to an
Intermediate Care Facility (ICF) . . . . . . * *
Discharge/Transferred to home under
care of organized home health service 81 2.82 14 15.56 . . * *
Left against medical advice or
discontinued care 15 0.52 . . . . . .
Expired 168 5.86 * * * * . .
Discharged home with no home services 2099 73.16 12 13.33 . . 74 76.29
Discharged/Transferred to Skilled
Nursing Facility 94 3.28 57 63.33 . . 10 10.31
Discharged/ Transferred to hospice care 5 0.17 . . . . . .
Discharged/Transferred to another type
of rehabilitation or long-term care
facility 401 13.98 * * . . . .
*Totals less than 5 were suppressed by state data management policy

28
Table 28: Percent of KY Trauma Registry patients by injury severity scores (ISS)
ISS
1-9 10-15 16-24 25-34 35-44 45-75
Facility
125 5 * * . * Frankfort Regional Medical Center N
% 90.58 3.62 * * . *
James B. Haggin Memorial
Hospital
N 53 . . . . .
% 10 . . . . .
Livingston Hospital N 33 . . . . .
% 100 . . . . .
Fort Logan Hospital N 23 . * * * .
% 85.19 . * * 3.7 .
Kosair Children's Hospital N 710 65 59 16 * .
% 83.43 7.64 6.93 1.88 * .
University of Kentucky Medical
Center
N 1,750 589 525 212 43 24
% 55.68 18.74 16.7 6.75 1.37 0.76
Taylor Regional Medical Center N 167 15 * * * .
% 88.36 7.94 * * * .
University of Louisville Hospital N 1,516 617 495 240 50 21
% 51.58 20.99 16.84 8.17 1.7 0.71
Ephraim McDowell Regional
Medical Center
N 144 9 6 . . .
% 90.57 5.66 3.77 . . .
Marcum Wallace Memorial
Hospital
N 49 * * . . *
% 85.96 * * . . *
*Totals less than 5 were suppressed by state data management policy

29
Table 29: KY Trauma Registry ATV injuries by injury severity scores
Injury Severity Score for ATV Injuries
Age in
years Mild
(1-9)
Moderate
(10-15)
Severe
(16-24)
Very
Severe
(25+) Total
1-4 * * * 0 8
5-14 44 * * 0 49
15-24 33 12 10 7 62
25-34 15 11 9 6 41
35-44 25 7 8 * 42
45-54 10 14 12 5 41
55-64 6 5 11 * 23
65-74 4 * * 0 8
75-84 * * 0 0 *
85+ * * * 0 *
Total 143 61 55 21 280
Figure 1: Kentucky Trauma Registry patients by age group

30
Figure 2: KY Trauma Registry patients - total length of hospital stay in days by cause of injury
244
275
335
366
671
1,003
1,342
1,705
2,218
2,586
3,990
8,571
18,783
0 2,000 4,000 6,000 8,000 10,000 12,000 14,000 16,000 18,000 20,000
OTHER PEDESTRIAN
NATURAL/ENVIRONMENTAL
OTHER PEDAL CYC
NOT SPECIFIED
MACHINERY
OTHER SPEC
CUT/PIERCE
STRUCK BY/AGAINST
FIREARM
FIRE/BURN
OTHER TRANSPORT
FALLS
MOTOR VEHICLE TRAFFIC