kentucky retirement systems asset program... · · 2017-06-02kentucky retirement systems...
TRANSCRIPT
KENTUCKY RETIREMENT SYSTEMS Investment Division
DATE November 2, 2016
TO: Members of the Investment Committee
FROM: Joe Gilbert, Director of Equity
Subject: Executive Summary of Public Equity Asset Class Review
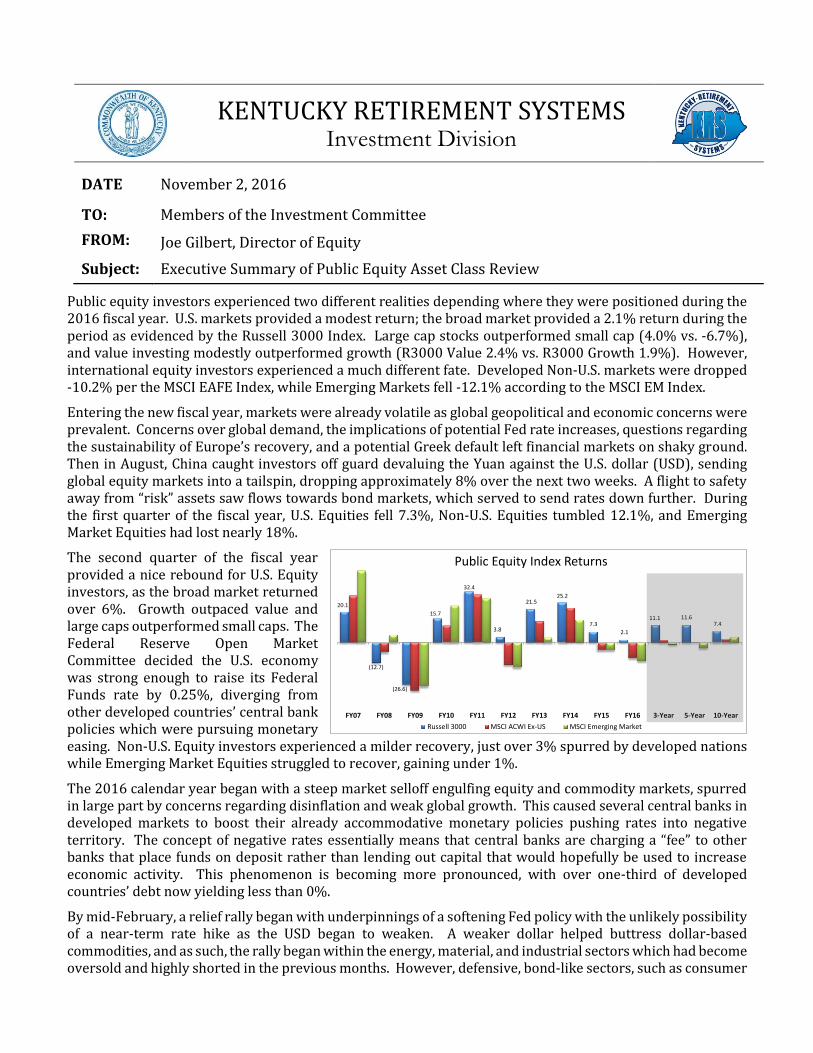
Public equity investors experienced two different realities depending where they were positioned during the 2016 fiscal year. U.S. markets provided a modest return; the broad market provided a 2.1% return during the period as evidenced by the Russell 3000 Index. Large cap stocks outperformed small cap (4.0% vs. -6.7%), and value investing modestly outperformed growth (R3000 Value 2.4% vs. R3000 Growth 1.9%). However, international equity investors experienced a much different fate. Developed Non-U.S. markets were dropped -10.2% per the MSCI EAFE Index, while Emerging Markets fell -12.1% according to the MSCI EM Index.
Entering the new fiscal year, markets were already volatile as global geopolitical and economic concerns were prevalent. Concerns over global demand, the implications of potential Fed rate increases, questions regarding the sustainability of Europe’s recovery, and a potential Greek default left financial markets on shaky ground. Then in August, China caught investors off guard devaluing the Yuan against the U.S. dollar (USD), sending global equity markets into a tailspin, dropping approximately 8% over the next two weeks. A flight to safety away from “risk” assets saw flows towards bond markets, which served to send rates down further. During the first quarter of the fiscal year, U.S. Equities fell 7.3%, Non-U.S. Equities tumbled 12.1%, and Emerging Market Equities had lost nearly 18%.
The second quarter of the fiscal year provided a nice rebound for U.S. Equity investors, as the broad market returned over 6%. Growth outpaced value and large caps outperformed small caps. The Federal Reserve Open Market Committee decided the U.S. economy was strong enough to raise its Federal Funds rate by 0.25%, diverging from other developed countries’ central bank policies which were pursuing monetary easing. Non-U.S. Equity investors experienced a milder recovery, just over 3% spurred by developed nations while Emerging Market Equities struggled to recover, gaining under 1%.
The 2016 calendar year began with a steep market selloff engulfing equity and commodity markets, spurred in large part by concerns regarding disinflation and weak global growth. This caused several central banks in developed markets to boost their already accommodative monetary policies pushing rates into negative territory. The concept of negative rates essentially means that central banks are charging a “fee” to other banks that place funds on deposit rather than lending out capital that would hopefully be used to increase economic activity. This phenomenon is becoming more pronounced, with over one-third of developed countries’ debt now yielding less than 0%.
By mid-February, a relief rally began with underpinnings of a softening Fed policy with the unlikely possibility of a near-term rate hike as the USD began to weaken. A weaker dollar helped buttress dollar-based commodities, and as such, the rally began within the energy, material, and industrial sectors which had become oversold and highly shorted in the previous months. However, defensive, bond-like sectors, such as consumer
20.1
(12.7)
(26.6)
15.7
32.4
3.8
21.525.2
7.3
2.1
11.1 11.67.4
FY07 FY08 FY09 FY10 FY11 FY12 FY13 FY14 FY15 FY16 3-Year 5-Year 10-Year
Public Equity Index Returns
Russell 3000 MSCI ACWI Ex-US MSCI Emerging Market

FY16 Executive Summary of Public Equity Asset Class 2
staples, utilities, and telecoms, outperformed during the quarter. The quarter’s rollercoaster like ride made it difficult for active managers to generate alpha.
In June, amidst equity markets trending upward, the U.S. Department of Labor released a subpar jobs report tempering the market’s enthusiasm. Later in the month, the United Kingdom voted to exit the European Union, causing market volatility to spike and sharp selloffs in general occurred over the next few days as estimates for growth in the EU region was ratchetted down. Despite this turmoil, defensive sectors where able to hold up and even advance as investors looked for safety. A line had been drawn between defensive names and those more economically sensitive.
The fiscal year was challenging as markets were largely influenced by macro concerns and fund flows. These forces overwhelmed individual stock fundamentals making it difficult for active investing to add value. Macroeconomic events, global monetary policy, and general asset flows have largely determined not only the direction of the market, but the winners and losers over the last several years. Accommodative monetary policy has created hyper liquidity, helping to facilitate a market where company fundamentals do not carry as much weight as they once did when evaluating the merits of an investment. Over the last decade, $1.5 Trillion has left active strategies, and $2 Trillion has entered into passive mandates. That magnitude of a shift alone is a massive headwind for fundamental investors to try to overcome.
This year, two themes have driven funds towards the same targets for investment. The first is tied to events that have created volatility to the down, and caused investors to shift towards safer assets. The second, is due to the low interest rate environment, which has caused bond investors to enter the equity markets in search of yield, driving up valuations of bond proxies. These two motivations point to high dividend payers with low volatility attached to them, which are primarily found in the defensive sectors. This phenomenon has created difficulty for fundamental investors in all areas. Growth managers have struggled because the markets general upward trend has not been due to cyclical leadership. Value investors have struggled as much of the defensive names have been bid up to the point where valuations are unjustified. KRS Portfolios: For the fiscal year ending June 30, 2016, both the Pension and Insurance KRS Total Public Equity portfolios posted negative absolute performance, while producing positive relative performance. The Pension portfolio posted a return of -4.3% versus -5.0% for the benchmark while the Insurance portfolio fell -3.8% versus -4.9%. Relative performance was driven primarily by manager outperformance in the Non-U.S. Equity asset class, combined with an overweight position to U.S. Equities. The underweight position to Emerging Markets at mid-year just ahead of an asset allocation change also benefitted performance as the asset class was significantly down at 12/31/15 (during the first two quarters of FY2016). Over the longer 5-year term, both funds have essentially matched the return of their associated benchmarks; with absolute performance just surpassing 5% annualized. Net performance is summarized in the following table:
Public Equity Performance Review (Returns are Net)
1 Year 3 Year 5 Year
% Fund KRS Index KRS Index KRS Index
Pension U.S. Equity 26.0% 1.4% 2.1% 10.3% 11.1% 10.7% 11.6% Non-U.S Equity 25.0% (8.5%) (9.7%) 2.1% 1.7% 0.5% 0.6% Total Equity 51.0% (4.3%) (5.0%) 5.7% 5.5% 5.1% 5.2%
Insurance U.S. Equity 28.9% 2.3% 2.1% 10.6% 11.1% 10.9% 11.6% Non-U.S Equity 26.0% (8.6%) (9.7%) 2.0% 1.7% 0.3% 0.6% Total Equity 54.9% (3.8%) (4.9%) 5.9% 5.6% 5.2% 5.2%
# KRS asset allocation changed as January 1, 2016

FY16 Executive Summary of Public Equity Asset Class 3
Prior - Pension: 20.5% US, 20% Non-US, 2.9% EM & Insurance: 20% US, 20% Non-US, 4% EM
As of June 30, 2016, the total public equity portfolios were valued at $5.48 billion and $2.30 billion for the Pension and Insurance Funds, respectively. Just prior to the end of the fiscal year, assets were distributed across 14 different asset managers as shown below (17 different mandates for the pension fund, and 16 for the insurance fund); three external managers were exited in the final week of the period:
The most recent fiscal year was fairly eventful with regards to the KRS total public equity portfolio. Primary actionable activity focused on an asset reallocation in response to overall KRS investment portfolio reallocation, and the repositioning of the U.S. Equity portfolio. A fair amount of activity centered on rebalancing and meeting cash flow demands; most notably: Participated in a significant total fund rebalance in response to a newly approved and adopted asset
allocation that became effective January 1, 2016. Staff worked to shift assets as follows: o Exited three emerging market equity mandates that were part of a dedicated allocation set by
KRS’ previous asset allocation.
KENTUCKY RETIREMENT SYSTEMS KENTUCKY RETIREMENT SYSTEMS
As of: 06/30/16 As of: 09/30/16
MV % MV % MV % MV %
U.S. Equity U.S. Equity
Westwood 95.57 3.42 38.21 3.15 Westwood - - - -
River Road - DAV 96.21 3.44 46.92 3.87 River Road - DAV 116.67 4.05 54.16 4.34
River Road - FAV 34.59 1.24 14.83 1.22 River Road - FAV 74.80 2.60 32.27 2.59
Westfield 106.63 3.82 42.66 3.52 Westfield 119.26 4.14 51.65 4.14
Internally Managed S&P500 1,561.20 55.88 741.52 61.15 Internally Managed S&P500 1,508.54 52.42 638.41 51.15
Internal Equity - - - - Internal Equity 333.86 11.60 127.67 10.23
Invesco 190.73 6.83 - - Invesco - 0.00 - 0.00
Internally Managed Mid Cap 276.04 9.88 146.93 12.12 Internally Managed Mid Cap 264.83 9.20 152.25 12.20
Sasco 43.67 1.56 18.31 1.51 Sasco - 0.00 - 0.00
Systematic 187.04 6.69 78.44 6.47 Systematic 235.47 8.18 99.36 7.96
Northern Trust Global 202.35 7.24 84.74 6.99 Northern Trust Global 224.22 7.79 92.36 7.40
$2,794.03 50.98 $1,212.56 52.63 $2,877.65 50.16 $1,248.13 51.70
Target 50.39 Target 50.00 Target 50.39 Target 50.00
Non-U.S. Equity Non-U.S. Equity
BlackRock, Inc 1,101.35 40.99 472.81 43.33 BlackRock, Inc 1,167.38 40.83 505.42 43.34
American Century 328.64 12.23 131.68 12.07 American Century 352.66 12.34 141.32 12.12
Franklin Templeton 226.29 8.42 83.79 7.68 Franklin Templeton 243.00 8.50 90.23 7.74
Lazard 471.98 17.57 168.77 15.47 Lazard 492.66 17.23 176.19 15.11
LSV 392.63 14.61 174.80 16.02 LSV 424.34 14.84 188.78 16.19
Northern Trust Global - SC 159.60 5.94 - - Northern Trust Global - SC 172.25 6.03 - -
BlackRock, Inc - SC - - 57.75 5.29 BlackRock, Inc - SC - - 62.41 5.35
Transition/KRS Intl 6.29 0.23 1.69 0.15 Transition/KRS Intl 6.50 0.23 1.76 0.15
$2,686.78 49.02 $1,091.29 47.37 $2,858.79 49.84 $1,166.11 48.30
Target 49.61 Target 50.00 Target 49.61 Target 50.00
Total Public Equity $5,480.81 $2,303.85 Total Public Equity $5,736.44 $2,414.24
26.5
53
PENSION INSURANCE PENSION INSURANCE
Westwood, 2%
Invesco, 3%
Sasco, 1%
KRS PEN 06/30/16
Internal Equity,
6%
KRS PEN 09/30/16

FY16 Executive Summary of Public Equity Asset Class 4
o Increased the U.S. equity allocation through passive mandates, that served as placeholders as staff continued to restructure the allocation (approximately $303m on the pension side, $142 on the insurance side).
o Increased the Non-U.S. equity allocation by approximately $335m on the pension side (passive 52% / active 48%), and $147m on the insurance side (passive 56% / active 44%).
At the end of the second quarter, staff implemented and funded an initial allocation to Scientific Beta, a multi-factor index provider. Initially the pension and insurance funds placed roughly $340m and $130m, respectively. The mandate may ultimately end up as the anchor for a new U.S. equity core-satellite structure approach.
A new mandate with River Road Asset Management was funded and is being run in tandem with the Dividend All Cap Value (DAV) strategy already in the portfolio. The plan is to migrate fully to the Focused All Cap Value Equity portfolio (FAV, new mandate). As of 06/30/16, KRS had approximately $143 million in the DAV strategy, and $49 million in the FAV strategy.
Staff began to explore its U.S. small cap equity exposure with the goal of determining whether its current means of gaining such exposure was optimal and whether a change in manager or a potential compliment was needed. A search process was began and included the legacy mandate, but the search been placed on temporary hold.
A change to the Non-U.S. small cap equity mandates was approved to mimic that of the U.S. strategy; however, that too has been placed on hold.
KRS terminated its relationship with three U.S. equity managers and one Non-U.S. equity manager during the course of the fiscal year (does not reflect emerging market exit). While performance issues were present in all cases (some more than others), additional contributing factors also played a role in the changes. Details regarding these actions can be found below in the document.
Staff participated in several smaller rebalance trades throughout the fiscal year including a cross trade. These trades had specific goals, rather than just serving as an exposure rebalance, such as contribution to investment, cash raise, or possibly any combination of those across plans.
Looking forward, staff expects to begin and continue several projects within the public equity portfolios: Staff has begun and will continue to push towards a revamped U.S. Equity portfolio structure. This
includes reviewing current mandates, continuing to migrate towards already approved strategies within the portfolio, and exploring new ideas.
Staff will continue to evaluate the potential of introducing minimal/managed volatility strategies within the public equity space. These strategies may be able to serve the roll of providing equity exposure with better downside protection for some of KRS’ plans whose funding is extremely challenged.
Having recently implemented a new structure within the Non-U.S. Equity allocation, staff will seek to implement a previously approved mandate change within the small cap space.
As a general concept, staff will be evaluating its use of passive versus active strategies and the most appropriate spaces within the context of public equity.
Staff will continue to work with the Chief Investment Officer, RVK, and other department directors to implement any necessary portfolio changes, rebalance the portfolios, and meet required cash needs.
Manager Summaries: River Road Asset Management
River Road Asset Management manages dividend based U.S. All Cap Equity portfolios for both the Pension and Insurance Funds of Kentucky Retirement. The firm, located in Louisville, KY, has managed domestic equity assets for KRS since June 2011. The Dividend All Cap Value portfolio is co-managed by Henry Sanders and Thomas Forsha, who have both been with the firm since its inception in 2005. The firm employs an Absolute Value philosophy in management of all of its products that it believes incorporates the most proven and enduring principals of value investing. The philosophy follows four tenets: focus on good companies trading

FY16 Executive Summary of Public Equity Asset Class 5
at compelling prices, bottom-up portfolio construction, a focus on less efficient areas of the market, and risk aversion. In sticking with these disciplines, the DAV team attempts to build a portfolio consisting of names that carry a minimum of 2% dividend yield. The strategy utilizes both systematic and dynamic research to develop an investible universe, which is then subjected to fundamental analysis conducted by the team’s research analysts. Top-down sector factors are a secondary analysis in the construction process, with the team seeking to create a portfolio that exhibits “dynamic” diversification, across size, sector, structure, and sovereignty. The Dividend All Cap Value portfolio will typically consist of 40-65 securities and targets to outperform the index by 2% annualized over a market cycle.
The portfolio outperformed its benchmark, the Russell 3000 Value Index, for the 2016 fiscal year by 498 basis points (net of fees), earning 7.40% versus 2.42%. Both stock selection and allocation were additive combining to create relative outperformance in seven of the ten economic sectors. Stock selection was the primary driver of performance and was particularly strong within the financial (specifically within REITs), consumer staples, and industrial sectors. From an allocation perspective, the portfolio was aided by its 5% underweight to energy (7.24 vs 12.38) which was one of the weaker performing sectors for the period. Since inception, the portfolio has essentially matched the performance of the index; on a net basis, the strategy has returned 10.99% versus 11.09%.
As of June 30, 2016, firm assets under management were approximately $6.9 billion, down from $9.0 billion a year ago. During the year, the firm lost three client accounts with market values in excess of $100 million. These mandates accounted for $1.4 billion, with the largest being a $900 million sovereign wealth fund who redeemed in response to the price of oil dropping. Other mandates left due to a variety of reasons the most common being asset reallocation, a movement to passive, and a reduction in equity exposure. The DAV strategy employed by KRS experienced net outflows of $158 million; AUM dropped to $2.1 billion.
The firm’s ownership and management structure have remained stable since prior review. Firm staffing has declined over the period from 48 to 37; the bulk of those were attributable to back office positions. From an investment professional perspective, the firm lost one portfolio manager and a net of 2 analysts, this is impart due to the closing of the Independent Value Strategy. Despite changes and less AUM, per a letter received from Andrew Beck, President & CEO, the firm remains “financially strong” having $12 million in firm assets with zero debt, and over $4.25 million in working capital as required by their partnership agreement with Affiliated Managers Group. Westfield Capital Management
Westfield Capital Management Company manages growth oriented U.S. All Cap Equity portfolios for both the Pension and Insurance Funds of Kentucky Retirement. The firm has managed domestic equity assets for KRS since June 2011. The firm follows a growth at a reasonable price (GARP) investment style and desires to invest in earnings growth stocks given the conviction that stock prices follow earnings progress and that those stocks offer the best investment opportunities. Further, the firm believes that reasonably priced stocks of companies with accelerating or underappreciated earnings potential are best identified through in-depth, fundamental research. Westfield utilizes a team based approach to managing the All Cap Growth strategy. The firm’s thirteen member Investment Committee collectively serves as the portfolio manager (PM), placing idea generation and review responsibilities with the Committee members. The portfolio construction process is completely bottom-up, driven by fundamental stock selection. Index composition is not an important consideration in the construction process and benchmark sector and industry weights play a secondary role in a portfolio construction, producing a portfolio that can look materially different than the index. The All Cap Growth portfolio will typically consist of 40-65 securities and targets to outperform the index by 2.5% annualized over a market cycle.
The portfolio significantly trailed the Russell 3000 Growth Index by over 10% during the 2016 fiscal year,
returning -8.28 versus 1.88%. Performance was influenced by a number of global geopolitical and economic
concerns that overshadowed mostly positive economic news in the US. The biggest detractor of performance
came in the form of security selection, primarily within the industrial, information technology, financial, and

FY16 Executive Summary of Public Equity Asset Class 6
health care sectors. More specifically, an investment in Consol Energy (Natural Gas E&P) was responsible for
-200 basis points of relative underperformance. The company had significant leverage at the time of
investment, but the team believed that the sale of some of its prime acreage assets would strengthen the
balance sheet. Prior to this occurring, commodity markets took a tumble in the fall of 2015 (natural gas falling
from $3 to $1.70), severely impacting the value of those assets. In response to this, the stock fell and Westfield
exited the position. The portfolio also gave up approximately 200bps of underperformance due to stock
selection within the healthcare sector, as biotech and pharmaceutical companies underperformed in late 2015
as a result of drug price pressures brought on by political comments. From an allocation perspective, the
portfolio suffered from and overweight to energy, and a significant underweight to consumer staples (5.62%
vs 10.77%) as that was one of the best performing sectors for the period (+19.89%) due to it being viewed as
a bond proxy. In addition, portfolio performance was hampered by not having enough of the FANG stocks
(Facebook, Amazon, Netflix, Google) as valuations had become too high to justify the risk/reward tradeoff.
Since inception, the strategy has provided a net return of 9.85% versus 12.04%; obviously, heavily influenced
by the most recent fiscal year’s disappointing performance.
As of June 30, 2016, firm assets under management were approximately $12.9 billion, down from $16.9 billion a year ago; $2.6 billion was actually due to client withdraws. Three clients account for 75% of the withdraws; however, two of those clients continue to maintain significant assets in other Westfield strategies. The strategy employed by KRS had an AUM of $1.8 billion down from $2.3 billion, with clients falling from 136 to 119. Clients who have left the strategy/firm gave a variety of reasons, the most common being performance, and a change in asset allocation or plan restructuring.
There have been no changes to the ownership or management structure of the firm in the past year, and the firm continues to be 100% employee owned. Partners have signed non-competes and non-solicitation agreements that have terms of either 1 or 2 years (depending on Partners) and would go into effect on the date that any partnership interests are bought back by the firm. Firm staffing has remained stable, currently at 64; the firm added one member to its investment staff, bringing that total to 18. Internally Managed S&P 500 Index
The Internally Managed S&P 500 portfolios trailed their underlying index for the 12-month period ending June 30, 2016. The Pension and Insurance funds posted respective returns of 3.85% and 3.91%, compared to the Index return of 3.99%. Performance discrepancies are primarily due to a cash position in the accounts, rather than to individual security issues (the account is passive and fully replicating). Typically, the portfolios more closely track the index; however, this fiscal year was subject to three separate months in which performance deviated dramatically. The cash position in the accounts served as downside protection in August 2015 as large cap equities fell by over -6%. Relative performance was adversely affected in January 2016, as the greater U.S. equity portfolio was rebalanced in response to a new asset allocation and again in June 2016 due to a significant rebalance for year end.
Longer term, both portfolios have provided strong absolute returns, despite trailing from a relative performance perspective. Over the 3-year period the pension and insurance portfolios have trailed the index return of 11.66% by 10 and 7 basis points, respectively. For the 5-year period, both funds underperformed the 12.10% return of the benchmark; the pension and insurance funds posting 12.01% and 12.07%, respectively. Systematic Financial Management
Systematic Financial Management manages a value oriented U.S. Mid Cap portfolio for both the Pension and Insurance Funds of Kentucky Retirement. The firm, located in Teaneck, NJ, has managed domestic equity assets for KRS since June 2012. The Mid Cap Value portfolio is led by Ronald Mushock, who has served as lead portfolio manager of the strategy since its inception in 2000. Mr. Mushock is supported by a team of quantitative-, sector-, or generalist-based research analysts. The firm’s investment philosophy is predicated

FY16 Executive Summary of Public Equity Asset Class 7
on a belief that investing in companies with a combination of attractive valuations and a positive earnings catalyst will generate superior long-term results. The investment process is centered on fundamental bottom-up research that is conducted on a focused list of stocks which are identified through proprietary screening models. The Mid Cap Value portfolio will typically consist of 60-80 of the firm’s best ideas and targets to outperform the index by 2% annualized over a market cycle.
The strategy underperformed the Russell Midcap Value Index for the 2016 fiscal year returning -3.66% versus 3.25%. Passive indices have performed very well recently due in large part to asset flows, and the Russell Midcap Value index is no exception as it has been in the top quartile of performers for the past couple of years. Low rates have caused some to search out “bond-proxies”, and have caused the valuations of these high dividend payers with typically lower volatility to become stretched. Systematic as a value investor has refused to reach for these returns believing that it is unsustainable. Relative underperformance was primarily driven by stock selection, but really in how that selection manifested itself through factor selection or exposure. Systematic’s underweight to REITs (dividends / low volatility) cost the portfolio -190bps; the portfolio’s underweight to both low volatility and dividends attributed to another -145bps and -25bps of relative underperformance, respectively. Two characteristics that underpin the strategy is investing in low price/earnings stocks, and in those with strong earnings revisions. Overweighting these two factors detracted a respective -110bps and -40bps from relative performance. The strategy has provided strong absolute returns since inception, but has trailed its benchmark, returning an annualized 10.77% versus 14.94%. Performance has been disappointing and the PM of the strategy has voiced his frustration. Essentially stating ‘that if you knew the index was going to be up significantly (RMidV +85% cumulative since January 2011), you would have taken more risk, increased beta, become more pro-cyclical, and de-emphasized income, and you would have been wrong. The only way to have outperformed over the last five years is to have maximized income and minimized risk’.
As of June 30, 2016, firm assets under management were approximately $7.6 billion down from $11.9 billion a year ago, with client accounts dropping from 164 to 136. Of the $4.3 billion drop in AUM, $2.2 billion is due to net outflows. The strategy employed by KRS had an AUM of $2.4 billion, down from $4.9 billion, with clients falling from 53 to 33. The firm’s and strategy’s AUM are currently at the lowest they’ve been since 2009 and 2010, respectively. Clients who have left the strategy/firm gave a variety of reasons, the most common being performance and reallocation of assets.
The firm’s ownership and management structure have remained stable since being recommended to the Investment Committee in June 2012. Firm staffing has declined over the period from 43 to 38; this represents back office employees as investment staff has remained stable at 14. Internally Managed Midcap Index
The Internally Managed Russell Midcap portfolios were funded for both the Pension and Insurance Funds on August 1, 2014 in response to a manager termination. During the 2016 fiscal year, the portfolios performed with mixed results. The pension portfolio returned 1.17% versus the index return of 1.33%, while the insurance portfolio earned 1.71% against the same index. The discrepancy in performance is primarily explained by a purchase of $25 million in the insurance fund that was part of a rebalance that took place just prior to a 2.2% run in the index. Since inception, the portfolios have performed relatively well over their short history, with the pension and insurance funds gaining 6.25% and 6.55%, respectively, versus the Russell Midcap Index return of 6.40%. Northern Trust Global Investments
Northern Trust Global Investments manages an enhanced Small Cap U.S. Equity portfolio for both the Pension and Insurance Funds of Kentucky Retirement. The firm has managed domestic equity assets for KRS dating back to October of 1999. The Structured Small Cap strategy is led by Bob Bergson, who has served as lead Portfolio Manager since the strategy’s inception in 1994, and is further supported by a deep team of analysts and traders. The portfolio utilizes a quantitative, risk controlled, method to create a broad and diversified portfolio of small and micro-cap stocks, with the intention of constructing a portfolio that emulates the risk

FY16 Executive Summary of Public Equity Asset Class 8
characteristics of the Russell 2000 Index. By expanding the small cap universe to include micro caps, the strategy has the ability to capture more of the small cap premium. In addition, the product essentially utilizes the concept of the old adage that “sometimes the best investment is the one you don’t make”. The strategy employs two separate multi-factor models with the ultimate goal of avoiding value traps and those companies with unsustainable growth projections. The models ultimately generate an “exclude” or “do not buy list”, with the remaining securities optimized to create the portfolio. The resulting portfolio may hold more than 3,500 securities, with the typical individual holding representing less than 0.50% of the total portfolio. The expected annual turnover for the Structured Small Cap product is 10-15% and the strategy seeks to outperform the benchmark over a market cycle by 2%.
The Northern Trust Global Investments (NTGI) Structured Small Cap portfolio outperformed its benchmark, the Russell 2000 Index, for the twelve-month period ending June 30, 2016 providing 227 basis points of downside protection in a market that was down -6.73% (NTGI return of -4.46%). Relative outperformance was almost entirely driven by stock selection, with allocation decisions having a small positive effect from a sector standpoint. Stock selection was additive in most sectors, especially in health care where the portfolio’s underweight position to bio-techs and pharmaceuticals (lower quality) added over 1% of relative outperformance. Having minimal exposure to stocks ranked on its “no buy list” versus the index benefited the portfolio as those names returned -23.67%. Overweighting micro caps had little effect on the portfolio during the fiscal year. The strategy has continued to provide above benchmark results for all measured trailing periods. Since inception (10/01/99), the portfolio’s annualized return has been 9.45% versus 7.52% from the index.
Northern Trust Global Investments manages Developed and Emerging Market passive small cap portfolios for the Pension portfolio of Kentucky Retirement. The firm began managing Non-US small cap assets for KRS in 2008. The Developed and Emerging Small Cap Index funds are both managed by Northern Trust’s Global Equity Index Team, which consists of 19 investment professionals. The firm employs a team approach to portfolio management and both strategies seek to replicate the benchmark’s risk and return characteristics. Northern Trust utilizes a customized quantitative approach, Intelligent Indexing®, to construct portfolios that are replicated where appropriate and sampled where sensible to mitigate costs and the erosion of value. The idea is to maximize liquidity and minimize market impact, under the umbrella of a multi-dimensional risk management tool that tightly constrains exposure at the security, sector, and country levels. Both the Developed and Emerging Index funds seek full replication from a risk/reward perspective, with tracking error primarily due to tax consideration and securities lending.
International small cap stocks declined 5.46% during the 2016 fiscal year, while the NTGI Broad International Small Cap portfolio (pension only) managed to hold up slightly better, providing 16 basis points of downside protection. The strategy produced relative value at both the international developed and emerging market levels. Within both the international developed small cap and emerging market small cap spaces, the portfolio’s relative outperformance was primarily driven by a dividend tax differential versus the benchmark. Since inception (12/01/08), the portfolio has returned 12.38% annually, versus the index return of 12.84%.
From prior year, firm AUM dropped from $945.6 billion to $906.2 billion, with no significant flows noted. Strategies employed by KRS remained stable in terms of assets under management and staffing. American Century Investments
American Century manages a concentrated Non-U.S. Equity Growth portfolio for both the Pension and Insurance Funds of Kentucky Retirement. The firm began managing assets for the Systems beginning July 2014. The investment management team responsible for the portfolio employed by KRS consists of a set of co-portfolio managers (Rajesh Gandhi and Jim Gendelman), several analysts, and a senior quantitative analyst who monitors risks within the portfolio. The strategy is focused on bottom-up fundamental stock analysis, which focuses on positive trends in growth rates and fundamental improvement. The team believes that accelerating growth in earnings and revenues is more highly correlated to stock price, opposed to just an absolute level of growth. The firm further believes markets are slow to recognize inflection points in trends, providing opportunities to generate excess returns. The team attempts to invest in the early stage of the

FY16 Executive Summary of Public Equity Asset Class 9
growth cycle (steepest part of the curve) and hopes to benefit from multiple expansion as the market reprices companies. The goal or objective of the investment process is to outperform the Index over a full market cycle (3-5 years) by 3-4% before fees, with an expected tracking error between 6% and 8%.
The portfolios provided just edged out their primary benchmark, the Morgan Stanley Capital International All Country World Ex U.S. Index (MSCI ACWI Ex-U.S.), for the twelve-month period ending June 30, 2016; providing 16 basis points of downside protection against the index return of -9.8%. The portfolio gave up roughly 240 basis points of outperformance during the last week of June as a result of the Brexit vote. From a sector standpoint, relative outperformance was primarily driven by security selection particularly in the consumer discretionary and health care sectors. The portfolio’s allocation hampered performance, specifically its overweight position to consumer discretionary, which was one weaker sectors during the period. From a regional standpoint, the portfolio benefited from both stock selection and country allocation decisions. Since inception (07/01/14), the portfolio has returned -4.21% versus its benchmark’s return of -6.95%.
As of June 30, 2016, firm assets under management were approximately $149.7 billion which was stable versus a year ago ($150.6 billion); there was a small drop in client accounts from 148 to 141. The strategy employed by KRS was stable, with minimal change in AUM (currently at $461 million), and no change in clients (2). Staffing remained stable during the period. Franklin Templeton
Franklin Templeton manages a concentrated Non-U.S. Equity Growth portfolio for both the Pension and Insurance Funds of Kentucky Retirement. The firm began managing assets for the Systems beginning July 2014. The Franklin Global Equity Team is led by Coleen Barbeau and John Remmert who oversee the strategy employed by KRS. More specifically, the Franklin Non-U.S. Equity portfolio is managed by John Remmert and Don Huber, CFA. The two portfolio managers are supported by a team of nine investment professionals. The strategy is focused on bottom-up fundamental stock analysis, which the firm believes has the potential to produce outperformance over a full market, by building a concentrated portfolio of high quality sustainable growth companies. The result is a forty name equally weighted portfolio that utilizes a contrarian rebalance technique to maintain proper sizing. The goal or objective of the investment process is to outperform the Index over a full market cycle (3-5 years) with a 5-8% tracking error.
The portfolios outperformed their primary benchmark, the MSCI ACWI Ex-US, for the twelve-month period ending June 30, 2016; returning -6.20% versus -9.80% from the index. The portfolios gave up approximately 150 basis points off of relative outperformance during the last week of the fiscal year as a result of the negative market impact from the Brexit vote. Outperformance occurred at both the sector and country levels. At the sector level, outperformance was driven primarily by stock selection within materials, consumer discretionary, health care and consumer staples; combined with an underweight to financials. Country level attribution was less significant; however, the portfolio benefited from solid stock selection within Japan and China. Since inception (07/01/14), as mentioned above, the portfolio has provided 328 basis points of downside protection (-4.08% versus -7.36%) on an annual basis.
During the 2016 fiscal year firm assets declined from $866.5 billion to $732.1 billion. The firm experienced net outflows of $91 billion; however, $76.5 billion of that was due to retail flows. The strategy utilized by KRS experienced no client losses and experienced a $300 million drop in AUM to $3.4 billion. Staffing across the firm declined to 8,900 employees (down from 9,300), but the investment team managing the strategy employed by KRS remained stable with no changes. Lazard Asset Management
Lazard manages a concentrated Non-U.S. Equity Relative Value portfolio for both the Pension and Insurance Funds of Kentucky Retirement. The firm began managing assets for the Systems beginning July 2014. The strategy is managed by a team of four portfolio managers (Mark Little, Michael Bennett, Robin Jones, and John Reinsberg) who are supported by 50+ firm-wide equity analysts. All decisions regarding holdings are team-based; however, if a consensus cannot be reached, Mark Little is the final decision maker. The team believes

FY16 Executive Summary of Public Equity Asset Class 10
the sustainability and direction of financial productivity will direct an investment’s return. However, a tradeoff must be struck between productivity and the valuation of a security. Further, the team asserts financial markets will misjudge certain factors creating opportunity such as incorrectly underwriting the implications of a structural change and anticipating how long a company can sustain or improve returns. They believe investors put too much focus on short-term news flows creating mispricings. The goal or objective of the investment process is to outperform the Index over a full market cycle by 3% before fees.
The portfolios outperformed their primary benchmark, the MSCI ACWI Ex-U.S., for the twelve-month period ending June 30, 2016. The portfolio fell 7.43% versus the index return of -9.80%; providing significant downside protection, despite giving up nearly 200 basis points of relative outperformance during the final week of June. Outperformance occurred at both the sector and country levels. From a sector standpoint, outperformance was primarily driven by stock selection, specifically within the materials, industrials, and financials sectors. The portfolio also benefited from slight overweight to emerging markets combined with an underweight to financials. From a regional perspective, the portfolio benefitted from solid stock selection within developed Asian nations and Europe. Since inception (07/01/14), the portfolio has provided 341 basis points of downside protection, returning -3.95% versus -7.36% on an annual basis.
During the 2016 fiscal year firm assets declined from $183.9 billion to $173.9 billion. Market movement accounted for the bulk of this decrease, with net outflows accounting for approximately $1.7 billion, primarily attributed primarily to emerging market equity and debt strategies. The strategy utilized by KRS is currently closed; assets within the strategy remained relatively stable (slightly increasing to $14.7 billion) and client accounts within the strategy remained the same.
LSV Asset Management
LSV manages a concentrated Non-U.S. Equity Value portfolio (deep value) for both the Pension and Insurance Funds of Kentucky Retirement. The firm began managing assets for the Systems beginning July 2014. One investment team is responsible for all firm strategies. Key investment professionals include Josef Lakonishok, Menno Vermeulen, Puneet Mansharamani, Greg Sleight, Guy Lakonishok, and Jason Karceski; who together are responsible for portfolio management and ongoing research pertaining to the quantitative model used by the firm. The team also includes a Director of Research, two academic advisors, and several quantitative analysts. The strategy utilizes a quantitative approach consisting of a stock ranking procedure and an optimization process. Stocks are ranked simultaneously on several variables to determine an overall expected return. Ranking is based on traditional value measures and past performance (contrarian perspective) accounting for 75% of the model’s influence, and momentum factors (near-term potential) account for 25% of the model’s influence. The strategy seeks to buy the top ranked stocks from each country that have higher expected returns. An optimizer is then used to help build a portfolio and control for risk. The goal or objective of the investment process is to outperform the index over a full market cycle by 4% before fees, with a tracking error of 6-8%.
The portfolios underperformed their primary benchmark, the Morgan Stanley Capital International All Country World Ex U.S. Index, for the twelve-month period ending June 30, 2016, falling -13.56% versus -9.80%. From a sector standpoint, the portfolio suffered from both stock selection and allocation. Stock selection was primarily difficult for the strategy within the utility and material sectors. The underweight to the consumer staples sector was also a hindrance to performance as this was the best performing sector for the fiscal year. From a country perspective, stock selection was challenged, but was additive from an allocation standpoint. Despite the aforementioned attribution, the primary detractor from the portfolio relative to the index was its deep value style bent. The portfolio performed well on a relative basis when comparing it to the MSCI All Country Value Ex-US Index return of -14.30%, despite being “cheaper” in terms of price-to-earnings, price-to-cash flow, and price–to-book.
As of June 30, 2016, firm assets under management were approximately $87.7 billion, down from $92.2 billion a year ago. Asset flows have been slightly positive, with decline of AUM attributed to market performance.

FY16 Executive Summary of Public Equity Asset Class 11
The strategy employed by KRS experienced net inflows bringing the AUM to $859 million from $478 million this time last year. Staffing has remained stable at the firm, with no strategy staffing changes.
BlackRock, Inc
BlackRock manages a broad market passive ACWI Ex-US index portfolio for both the Pension and Insurance funds of Kentucky Retirement. The firm began managing developed market assets for KRS in 2005 and transitioned to an All Country Ex-US Index mandate in June 2008. Blackrock’s MSCI ACWI Ex-U.S. Superfund is designed to fully replicate both the developed and emerging market portions of the MSCI ACWI Ex-U.S. Blackrock utilizes a “fund-of-country fund” approach, building a portfolio of individually managed country funds, each market cap weighted to fully replicate the specific country index. The result is a portfolio of approximately 1,800 - 2,000 securities invested across 45 countries.
The portfolio outperformed the MSCI ACWI Ex-US for the fiscal year, returning -9.93% versus -10.24%. The majority of the relative outperformance was due to tax advantage versus the benchmark, which is calculated using an average (and higher than KRS actual) tax withholding rate, and security lending. Longer-term, the portfolio has added incremental relative value over the index since its inception, adding 20 basis points annualized (5.55% versus 5.35%).
BlackRock also manages Developed and Emerging Market passive small cap portfolios for the Insurance portfolio of Kentucky Retirement. The firm began managing Non-US small cap assets for KRS in 2013. A team of nearly 100 researchers, portfolio managers, strategists, and traders manage the strategies employed by KRS. The International Small Cap portfolio is essentially a bolt on portfolio in that it is a combination of three small cap strategies portfolios; EAFE Small Cap, Canada Small Cap, and Emerging Markets Small Cap. BlackRock strives to construct portfolios that deliver a high level of diversification, closely track the appropriate benchmark, provide low turnover, and minimal transaction costs. The firm utilizes full replication, with tracking error primarily due to tax consideration and securities lending. The strategy slightly trailed the MSCI ACWI ex US Small Call Net Index during the fiscal year, falling -5.52% versus -5.46%. Since inception (7/1/13), the portfolio has provided 5.76% versus the index return of 4.93%.
Over the course of the fiscal year, the firm grew assets under management to $4.9 trillion, while the strategy AUM employed by KRS fell by roughly $850 million to $27.2 billion. Clients within the strategy increased from 54 to 75. Firm staffing increased to 12,677 from 12,354. Managers Terminated during Fiscal Year 2016: Westwood Management
KRS exited Westwood’s U.S. All Cap Value product in late June 2016, having employed the strategy since June 2011. For the fiscal year, the portfolio fell -2.34% versus the index return of 2.42%. The strategy returned 9.31% versus 11.09% annually, while utilized by KRS. While performance trailed the Russell 3000 Value index over the life of the investment; ultimately, the relationship was ultimately terminated due to portfolio fit. Under the pursuit of a core-satellite structure, the strategy did not fit the role as a satellite position, and lost out from a competitive standpoint versus another legacy manager that KRS recommitted to in the space.
Invesco Advisors, Inc
KRS employed Invesco to manage a core large cap U.S. equity mandate for the KRS Pension portfolio since August 2005. KRS decided to end its relationship with the manager in June 2016. The Quantitative U.S. Core Equity portfolio fell -3.58% during the fiscal year opposed to the S&P 500 Index that earned 3.99%. Since inception, the strategy provided an annual return of 7.44% versus 7.23%. Performance has struggled for the past couple of years. Staff’s concerns regarding the predictability of the model’s stock picking ability and its sustainability, combined with an unwillingness to replicate the strategy within the Insurance Fund led to the strategy’s dismissal. Sasco Capital

FY16 Executive Summary of Public Equity Asset Class 12
KRS hired Sasco Capital in June 2012 as part of a mid-cap search. In June 2016, it was decided that KRS would no longer invest in the mid cap value portfolio administered by Sasco. During the fiscal year, the strategy returned -0.70% versus the Russell Mid Cap Value index return of 3.25%. Over the life of the investment, the portfolio returned 9.84% versus 14.94%. Underperformance was heavily influenced by FY15 where the portfolio trailed by over 1,200 basis points due primarily to a significant overweight to energy and materials. The strategy was terminated by KRS due to performance concerns. The strategy’s deep value contrarian posture created a lumpy return profile that was somewhat problematic and staff was not willing to upsize the position to become a more meaningful satellite holding. The Boston Company Asset Management
KRS exited The Boston Company Asset Management (TBCAM) ACWI ex-US Value product in November 2015, having employed the strategy since May 2005 in the Pension Fund and June 2008 in the Insurance Fund. The portfolio was significantly downsized in June 2014 as part of the transition into a new Non-US equity portfolio structured took place. During the first four months of the 2016 fiscal year, the portfolio trailed its benchmark, returning -7.36% versus -5.55%. The Pension portfolio underperformed its benchmark by 96 basis points over the life of the investment, while the Insurance portfolio was able to provide 12 basis points of net downside protection. Ultimately, the position was exited by KRS because performance had become disappointing leading to volatile return stream, coupled with a desire to bring manager count down. Just prior to placing the termination call, staff received notice from TBCAM that they were losing the lead portfolio manager and his back up. As a result, they would be closing the strategy and attempting to migrate clients into a core portfolio. This news from the manager only reinforced staff’s prior decision to terminate the strategy. Emerging Market Dedicated Allocation – Aberdeen Asset Management, BlackRock, Inc., Wellington Management Company
KRS started investing in dedicated emerging market strategies with its hiring of Aberdeen Asset Management and Wellington Management Company in April 2008. In 2011, an asset allocation was approved that advocated for a dedicated 4% allocation to emerging market equities. In response, KRS funded a third passive strategy with BlackRock, Inc. KRS’ current asset allocation was approved during the 2016 fiscal year which removed the dedicated allocation to emerging market equities. KRS terminated its relationships with the previously mentioned emerging market equity managers during the period of December 2015 to February 2016, in response to the allocation which became effective January 1, 2016. The total dedicated allocation produced an annualized return of -2.82% versus the MSCI Emerging Market index return of -4.80% during its tenure. Conclusion:
In general during the 2016 fiscal year, U.S. Equity investors were rewarded, and investments outside of the U.S. produced losses. The global economy is marred by geopolitical unrest and economic concerns, and in response, the U.S. has continued to be seen as a safe haven. Investor appetite for safety combined with low interest rate policies have been a significant influence on asset flows over the last few years. As such, U.S. equity markets have continued to rise on the backs of defensive sectors, those with lower volatility and high dividend payouts. The KRS Total Public Equity portfolios fell during the year, though they were able to provide some downside protection versus their respective benchmarks (Pension: -4.28% vs. -5.03%; Insurance: -3.77% vs. -4.92%). Relative performance was driven primarily by manager outperformance in the Non-U.S. Equity asset class, combined with an overweight position to U.S. Equities. The underweight position to Emerging Markets at mid-year (just ahead of an asset allocation change) also benefitted performance as the asset class was significantly down at 12/31/15. The U.S. Equity portfolio underperformed (1.4% vs. 2.1%) as fundamental managers struggled to keep pace with passive indices. The Non-U.S. Equity portfolio provided 125 basis points of downside protection due to solid performance from three of the four active concentrated MSCI ACWI Ex-U.S. mandates. At the individual manager level, the fiscal year was rather uneventful from an organizational standpoint, with only a few firms experiencing any material staffing changes. From a

FY16 Executive Summary of Public Equity Asset Class 13
performance standpoint, results were disappointing, with only 5 of 11 actively managed strategies adding value over their respective indices during the fiscal year.
Staff and RVK will continue to monitor managers for either organizational or performance concerns and will promptly notify the committee if it is believed action should be taken.