kent active system management (kasm) sdrc 9.3 installation ... · the kasm project will tackle and...
TRANSCRIPT

Kent Active System Management (KASM)
UK Power Networks (Operations) Limited. Registered in England and Wales. Registered No. 3870728. Registered Office: Newington House, 237 Southwark Bridge Road, London, SE1 6NP Page 1 of 48
SDRC 9.3 – Installation of forecasting modules November 2016

KASM SDRC 9.3: Installation of forecasting modules
UK Power Networks (Operations) Limited. Registered in England and Wales. Registered No. 3870728. Registered Office: Newington House, 237 Southwark Bridge Road, London, SE1 6NP Page 2 of 48
Contents
1 Executive Summary ........................................................................................................................................................................ 3 1.1 Background .................................................................................................................................................................... 3 1.2 Integration Architecture ................................................................................................................................................ 3 1.3 Results of Testing ........................................................................................................................................................... 4
2 Definition of Terms ........................................................................................................................................................................ 5
3 Introduction ................................................................................................................................................................................... 7 3.1 Purpose of Document .................................................................................................................................................... 7 3.2 References ..................................................................................................................................................................... 8
4 Requirements ................................................................................................................................................................................. 9
5 Integration Architecture .............................................................................................................................................................. 10 5.1 Business Architecture .................................................................................................................................................. 11 5.2 Data Architecture ......................................................................................................................................................... 12 5.3 BSI Forecasting Engine ................................................................................................................................................. 12 5.4 Application Architecture .............................................................................................................................................. 16 5.5 Technology Architecture .............................................................................................................................................. 20 5.6 Security Architecture ................................................................................................................................................... 22
6 Architecture Approvals ................................................................................................................................................................ 24
7 Completion of Installation and Demonstration ........................................................................................................................... 25 7.1 Testing Strategy ........................................................................................................................................................... 25 7.2 Test Results .................................................................................................................................................................. 30 7.3 Accuracy of Individual Forecasters .............................................................................................................................. 33 7.4 Generation Data Aggregation ...................................................................................................................................... 40
8 Engagement with Stakeholders ................................................................................................................................................... 45 8.1 Engagement through Webinars ................................................................................................................................... 45 8.2 Engagement through the LCNI Conference ................................................................................................................. 45 8.3 Engagement with NG ................................................................................................................................................... 46
9 Conclusions .................................................................................................................................................................................. 47 9.1 Forecasting Conclusions ............................................................................................................................................... 47 9.2 Lessons Learned ........................................................................................................................................................... 47 9.3 Identified Risks ............................................................................................................................................................. 48

KASM SDRC 9.3: Installation of forecasting modules
UK Power Networks (Operations) Limited. Registered in England and Wales. Registered No. 3870728. Registered Office: Newington House, 237 Southwark Bridge Road, London, SE1 6NP Page 3 of 48
1 Executive Summary
1.1 Background
The Kent Active System Management (KASM) project aims to carry out a range of technical innovation trials to demonstrate more
advanced operation and planning techniques for the 132kV and 33kV network in East Kent. It is envisaged that the project will
deliver benefits that will span various areas, including the enablement of low carbon generation, the deferral of capital-intensive reinforcement associated with new generation connections, and improved reliability of the network.
The last few years have seen a number of Grid Supply Points (GSPs) come under pressure from the level of embedded generation
exporting power onto the electricity distribution networks. In the most extreme form of the electricity network operating in the
opposite way to which it was originally designed, whole sections of the network are not only supplying their own demand but are
also exporting the surplus onto the transmission system. These conditions on the network can result in significant network constraints, which can impact existing generators as well as new generators seeking to connect to the distribution network.
The area of East Kent that is being used in this project contains two GSPs (of approximately 350 nationwide), and a third is being
established in the area. Nevertheless, it currently requires as many as 34 contingency scenarios to be analysed in order to
understand the network fully. The massive uptake of wind and solar generation in recent years, due to government incentives, and
the presence of interconnectors connected to the transmission system, increases the number of scenarios that need to be analysed
– there is no longer a simple ‘day of highest winter demand' and 'day of lowest summer demand'. There is more variation and hence a greater requirement to monitor all contingencies during real-time operation and future planning of the network.
Short-term forecasting tools will allow engineers to transition away from using worst-case operational scenarios for modelling
purposes to using forecast load and generation data. Worst-case scenarios in East Kent consider maximum generation in
coincidence with minimum demand. With an increasing amount of distributed generation connected, the network is sometimes
considered to be constrained in these worst-case scenarios. In certain planned outage situations, generators need to be curtailed
to mitigate against potential network violations. Using these scenarios will not always be fully representative of actual running
conditions and thus forecasting tools will potentially allow more generators to operate unconstrained during planned outages.
The KASM project will tackle and demonstrate the value of the Contingency Analysis System (CAS) and forecasting tools in
operational and planning time frames on the network in East Kent, delivering conservatively estimated net benefits of £0.4m for
the project trial area in East Kent. Once proven successful, replication of this method across Great Britain (GB) could conservatively
provide net benefits of over £62m over the lifetime of the 45-year investment, when compared to business-as-usual (BAU) approaches.
This report (representing the project Successful Delivery Reward Criterion (SDRC) 9.3) focuses on the successful installation and
integration of forecasting modules within the DNO control room. It will demonstrate the accuracy of the forecasters when
benchmarked against historical data and will share key lessons learned and risks associated with integrating forecasting modules within a DNO framework.
1.2 Integration Architecture
The forecasting module architecture designed by the project covers the aspects of the different architectures aligned to The Open
Group Architecture Framework (TOGAF). Business, Data, Application, Technology and Security Architectures are described in detail
to illustrate the overall picture of the forecasting modules. The primary architectural design challenges have revolved around
interfacing with multiple internal and external data sources, whilst providing a reliable input to the CAS to be used in the Look-ahead mode.

KASM SDRC 9.3: Installation of forecasting modules
UK Power Networks (Operations) Limited. Registered in England and Wales. Registered No. 3870728. Registered Office: Newington House, 237 Southwark Bridge Road, London, SE1 6NP Page 4 of 48
1.3 Results of Testing
The testing section of the report demonstrates the successful installation of the forecasting modules and provides a number of
graphs comparing the accuracy of the individual and aggregated forecasts against historical metering data. The forecast outputs
have also been benchmarked against industry performance metrics. The two performance metrics used for comparison are Mean
Absolute Percentage Error (MAPE) for load forecasts and Root Mean Square Error (RMSE) divided by generator capacity for solar
and wind forecasts. Key findings from the benchmarking exercise show that the day ahead load forecasts have an accuracy of 9% MAPE, whilst the day ahead solar and wind forecasts have an accuracy of 10% RMSE/Capacity and 16% RMSE/Capacity respectively.
Comparing this to industry forecasts, Bigwood Systems Inc.’s (BSI) forecasts perform within the MAPE figures quoted for load
forecasting. Industry data1 presents MAPE levels of up to 30% for individual data points, whilst BSI’s performance is 9%. Regarding
generators, BSI’s solar and wind forecasts perform well within the 10-20% RSME/Capacity presented in literature2 3. It is important
to note that although the average of data points performs within the industry range, there are a small number of forecasts which
produce high errors outside of the expected range. These forecasts will be investigated in more detail during the trial period in
order to determine reasons and possible corrections for the higher errors. It is expected that as more historical data regarding load
and generation output is available, the accuracy of the forecasts can be improved through further training of the predictive algorithms. The level of improvement in accuracy will be dependent on the individual characteristics of the data point forecast.
When comparing the forecast data and the maximum capacity for a GSP, we note that under certain circumstances there is a large
difference between forecasts and worst-case maximum capacity figures used in current business processes. This supports the
fundamental opportunity presented by using forecast data for outage planning purposes, in terms of potentially releasing capacity
on the network. The project trial period will provide a suitable length of time to fully validate initial findings and benefits of using forecast data.
During the design and testing phase of the project, a number of key lessons were learned regarding integration, data aggregation
and accuracy of forecasting embedded load and generation on a distribution network. Some of these lessons revolve around data
processing and determining accuracy levels. When using forecasters in a DNO environment, there are important risks that need to
be considered. An example of this is maintaining the accuracy of forecasters when network conditions change. When forecasting
load points on the network, new embedded generators could connect which would impact the load profile and thus the forecast.
To mitigate against this, the project team will monitor the accuracy of the forecasts and provide further training of predictive algorithms based on the most recent data available in order to improve the accuracy.
1 R. Sevlian and R. Rajagopal, “Short Term Electricity Load Forecasting on Varying Levels of Aggregation,” Work. Pap., pp. 1–8, 2014. (See reference number 5)
2 J. Antonanzas, N. Osorio, R. Escobar, R. Urraca, F. J. Martinez-de-Pison, and F. Antonanzas-Torres, “Review of photovoltaic power forecasting,” Sol. Energy, vol. 136, pp. 78–111, 2016. (See reference number 6)
3 A. M. Foley, P. G. Leahy, A. Marvuglia, and E. J. McKeogh, “Current methods and advances in forecasting of wind power generation,” Renew. Energy, vol. 37, no. 1, pp. 1–8, 2012. (See reference number 7)

KASM SDRC 9.3: Installation of forecasting modules
UK Power Networks (Operations) Limited. Registered in England and Wales. Registered No. 3870728. Registered Office: Newington House, 237 Southwark Bridge Road, London, SE1 6NP Page 5 of 48
2 Definition of Terms
Term Definition
ARB Architecture Review Board
BSI Bigwood Systems Inc
CA Contingency Analysis
CAS Contingency Analysis System
CEGB Central Electricity Generating Board
CIM Common Information Model
CPT Cutover Process Testing
DMS Distribution Management System
DNO Distribution Network Operator
EHV Extra High Voltage
ENTSO-E European Network of Transmission System Operators for Electricity
EPN Eastern Power Networks plc
FEP Front End Processor
FTP File Transfer Protocol
GE General Electric
GSP Grid Supply Point
HMI Human Machine Interface
HVDC High Voltage Direct Current
HV High Voltage
ICCP Inter Control Centre Communication Protocol
IEC International Electrotechnical Commission
IEMS Integrated Energy Management System
IIB IBM Integrated Bus
IP Internet Protocol
IS Information Systems
KASM Kent Active System Management
LA Look Ahead
LADD Logical Architecture Design Document
LAN Local Area Network
LPN London Power Networks plc
LV Low Voltage
MQ Messaging Queue
MQP Message Queue Protocol
MVA Megavolt ampere
MVAr Mega Volts-Ampere reactive
MW Mega Watt
NG National Grid
NPG Northern Power Grid
OC2 Operational Code 2
Ofgem Office of Gas and Electricity Markets
PICS Protocol Implementation Conformance Statement
RT Real-Time
SCADA Supervisory Control And Data Acquisition
SDRC Successful Delivery Reward Criteria
SFTP Secure File Transfer Protocol
SOA Services Orientated Architecture

KASM SDRC 9.3: Installation of forecasting modules
UK Power Networks (Operations) Limited. Registered in England and Wales. Registered No. 3870728. Registered Office: Newington House, 237 Southwark Bridge Road, London, SE1 6NP Page 6 of 48
SPN South Eastern Power Networks plc
TB Tera Byte
TCP Transport Control Protocol
TLS Transport Layer Security
TOGAF The Open Group Architecture Framework
TSO Transmission System Operator
UKPN UK Power Networks
ULTC Under-load tap changer
VM Virtual Machine
WAN Wide Area Network
WPD Western Power Distribution
XML Extensible Mark-up Language

KASM SDRC 9.3: Installation of forecasting modules
UK Power Networks (Operations) Limited. Registered in England and Wales. Registered No. 3870728. Registered Office: Newington House, 237 Southwark Bridge Road, London, SE1 6NP Page 7 of 48
3 Introduction
3.1 Purpose of Document
The purpose of the document is to describe the forecasting module solution architecture that has been developed and delivered
as part of the KASM project. This document describes the installation of forecasting modules that will link the DNO control room
with other data sources. The solution design includes Application, Data, Technology and Security architecture. The testing chapters within the document cover the Test Strategy and key evidence from the test procedures.
Key evidence criteria of SDRC 9.3:
Criteria Evidence Section
Completion of installation of
forecasting modules that will link
the DNO control room with other
data sources
Sign-off on installation of forecasting modules
Sections 6 and 7
Forecast data, benchmarked for accuracy against historical data
Section 7
Published report demonstrating
forecasts including each of solar, on-shore wind and off-shore wind
Section 7
Forecast error curves plotted at
primary substation, 132kV circuit, and GSP levels
Section 7
Description of integration architecture with the overall solution
Sections 5 and 6
Published report on data aggregating
forecasting modules that includes
lessons learned and identified risks
Sections 5, 7 and 9

KASM SDRC 9.3: Installation of forecasting modules
UK Power Networks (Operations) Limited. Registered in England and Wales. Registered No. 3870728. Registered Office: Newington House, 237 Southwark Bridge Road, London, SE1 6NP Page 8 of 48
3.2 References
Number Document Name Author
1. ENTSO-E ICCP Naming Convention National Grid, Issue 3, 12 August 2015
2. SDRC 9.2 – Contingency Analysis
System Integration
Alex Jakeman, Sam Sankaran, October 2016
3. P.0032.KASM.Contingency
Analysis Solution – Testing Strategy
Sam Sankaran, Gilbert Manhangwe, Paz Mehta; September 2016
4. Logical Architecture Design
Document
Paz Mehta, Alex Jakeman, Gilbert Manhangwe, Chris Potter, Nathalie
Beaufond; October 2016
5. Short Term Electricity Load
Forecasting on Varying Levels of
Aggregation
R. Sevlian and R. Rajagopal - 2014
6. Review of photovoltaic power
forecasting
J. Antonanzas, N. Osorio, R. Escobar, R. Urraca, F. J. Martinez-de-Pison, and F.
Antonanzas-Torres 2016
7. Current methods and advances in
forecasting of wind power
generation
A. M. Foley, P. G. Leahy, A. Marvuglia, and E. J. McKeogh - 2012

KASM SDRC 9.3: Installation of forecasting modules
UK Power Networks (Operations) Limited. Registered in England and Wales. Registered No. 3870728. Registered Office: Newington House, 237 Southwark Bridge Road, London, SE1 6NP Page 9 of 48
4 Requirements
Table 1 lists the requirements for successful implementation of the forecasting modules and associated test cases designed to prove that each requirement has been achieved. Key results are shown in section 7.2.
Requirement Number
Category Sub category Requirement Test case(s)
5.1.0 Forecasting General The solution must have the ability to forecast different types of load and generation including, but not restricted to, PV, wind and synchronous generators and external sources.
3.3.1-4
5.2.0 Forecasting Load The solution must provide accurate forecasts for load (average over a month +/- 2% day ahead).
3.3.5
5.4.0 Forecasting Wind The solution must provide accurate forecasts for wind (average less than +/-6% for day ahead).
3.3.6
5.5.0 Forecasting Wind The solution must have wind generation forecasting capabilities.
3.3.1
5.6.0 Forecasting PV The solution must provide accurate PV forecasts (average less than +/-TBC4 % for day ahead).
3.3.7-8
5.7.0 Forecasting PV The solution must have PV generation forecasting capabilities.
3.3.7
5.9.0 Forecasting Forecasting methodology
The solution should utilise network load forecasts from disparate sources within a single study.
3.3.1-5
5.10.0 Forecasting Forecasting methodology
The solution must include alternative forecasts where possible to reduce error.
3.3.2
5.12.0 Forecasting Forecasting methodology
The forecasting solution must use real-time and historical data from weather prediction models and extensive records of weather dependent sources of generation to produce accurate generation forecasts.
3.3.1-5
5.13.0 Forecasting Reporting The forecasting solution must produce a report presenting the results of the forecasting engine.
3.3.1-4
5.14.0 Forecasting Reporting The solution must provide load and generation forecasts for all constantly telemetered data points and aggregated values for primary substations.
3.3.1
5.17.0 Forecasting Horizons The forecasting solution must be able to forecast in near real-time up to 15 minute cycles and at user defined forecast time horizons, up to five days ahead.
3.3.1-4
Table 1: Requirements for successful implementation of forecasting modules
4 Stating specific levels of accuracy was challenging during the requirements stage as it was not clear exactly what quality of data would be available to the forecasters. The input data will have a significant impact on accuracy.

KASM SDRC 9.3: Installation of forecasting modules
UK Power Networks (Operations) Limited. Registered in England and Wales. Registered No. 3870728. Registered Office: Newington House, 237 Southwark Bridge Road, London, SE1 6NP Page 10 of 48
5 Integration Architecture
The KASM study area (East Kent) has in recent times become more challenging to manage both for the transmission and distribution
networks, partly due to increased distribution generation connections and flows on transmission interconnectors to continental Europe.
The CAS and Forecaster Module are valuable tools to predict the effect of outages like failures of overhead lines and to take actions
to keep the distribution network secure and reliable. The KASM project aims to introduce the CAS and Forecaster Module as tools
to assist outage planners, infrastructure planners and control room engineers with the planning and management of the electricity
distribution network.
The purpose of this section is to summarise the logical architecture of the Forecaster Modules defined within the scope of the
project. Although the project is only a trial, it is important that the underlying design is based on sound architectural principles, as
it could provide the starting point for an enduring solution and a move to a possible BAU activity. For the full description of architecture please refer to the Logical Architecture Design Document (LADD), which is available upon request.
The scope of the document is divided into the five architectural domains defined by the TOGAF5 ADM (Architecture Development Method):
1. Business – for the operator that will use the forecasting modules, it describes the context in which the forecasting modules
will reside. The chapter describes the current business process and the to-be business process
2. Data – describes the data that will be used in the forecasting module
3. Application – describes the forecasting modules and interface with the CAS
4. Technology – describes the IT infrastructure that will host the forecasting modules
5. Security – describes the security considerations including physical, communications and IT
5 The Open Group Architecture Framework (TOGAF) is a framework – a detailed method and a set of supporting tools – for developing an enterprise architecture. For more information please see: http://pubs.opengroup.org/architecture/togaf8-doc/arch/

KASM SDRC 9.3: Installation of forecasting modules
UK Power Networks (Operations) Limited. Registered in England and Wales. Registered No. 3870728. Registered Office: Newington House, 237 Southwark Bridge Road, London, SE1 6NP Page 11 of 48
5.1 Business Architecture
There is a strong focus among Distribution Network Operators (DNOs) to develop contingency plans to avoid or shorten outage
periods when carrying out maintenance works, restoring power supplies to demand customers and maintaining routes for
generation in the event of a fault. Outage planners (who specialise in maintaining and optimising the programme of outages to
best serve customers) will be the primary users of the Forecaster Module.
The current business process focuses on longer term forecasting of load and generation on the network – for example, trends over
years and decades. These forecasts drive future investment plans for reinforcement on the network. As networks become
increasingly dynamic, and network operators seek to derive maximum capacity from their assets, it is important to use forecast
data when managing the network. Historically, network operators would simply use maximum capacity values of generators when planning the network, rather than forecasting actual output at a specific point in time.
The Forecaster Modules will be available as a standalone product for outage planners to view 0-5 day ahead forecasts for wind
generation, solar generation and point loads. In addition, the outputs of the forecasters will be integrated within the CAS through
the Look-ahead (LA) mode of the CAS. The LA mode imports a specified look-ahead time period for which it will extract the results
from the forecasters. This capability will focus on the 0-24 hour forecast horizons. Figure 1 shows the current outage management
business process and the to-be process when the CAS and Forecaster Modules are available. The key change that will occur with
outage planners is that they will transition from using worst-case planning scenarios (based on minimum demand and maximum generation) to using forecast scenarios.
Figure 1: Outage planning business process flow
For descriptions of the CAS use cases please refer to UKPN’s SDRC 9.2 report (Contingency Analysis System Integration).

KASM SDRC 9.3: Installation of forecasting modules
UK Power Networks (Operations) Limited. Registered in England and Wales. Registered No. 3870728. Registered Office: Newington House, 237 Southwark Bridge Road, London, SE1 6NP Page 12 of 48
5.2 Data Architecture
The CAS operates in three key modes – Real-time, Look-ahead and Study – utilising a mixture of static data, dynamic data and
forecast data to build an accurate and converging (base case) model. The configuration and inputs of the model vary depending on
the activated mode of the contingency analysis. Dynamic data reflects the current operating state of the power system and is
updated in near real-time. Static data is updated less frequently and represents changes to static parameters associated with existing and new network components (transformers, overhead lines etc.).
Figure 2 illustrates the CAS high-level data flow architecture and exhibits the internal and external data sources that feed into the CAS. The key elements of the CAS that link to the Forecaster Module have been outlined in black in Figure 2
DigSILENT
PowerFactory
GE
PowerON Met OfficeOSI Soft
Pi Historian
Forecasting
Engine
Data Bridge,
State Estimator &
Power flow solver
Study Mode
Look-Ahead Mode
(Analysis &
Control Engine)
Real-Time Mode
(Analysis &
Control Engine)
UK Power Network Systems External data sources
Offline Data
Mapping Engine
ENTSOE
National Grid
Control Centre
National Grid
System Operation
Single Line
Diagram Builder
Contingency Analysis Suite
Viewer
Figure 2: CAS high-level data flow architecture
For a detailed description of the CAS data architecture please refer to UKPN’s SDRC 9.2 report (Contingency Analysis System Integration) and the LADD.
5.3 BSI Forecasting Engine
The BSI Forecasting Engine is a standalone application which integrates with the CAS. It utilises:
Metered data from the OSIsoft’s PI Historian database as an offline manual Excel file copy
Met Office weather forecasts via FTP
The NG wind generation forecast
ENTSO-E day-ahead interconnection schedules via FTP ‘Live feed’ measurement data from CAS (see Figure 10 in UKPN’s SDRC 9.2 report)
The BSI Forecasting Engine produces forecasts for the following:
Load
Wind generation (on-shore and off-shore) Solar generation (PV)

KASM SDRC 9.3: Installation of forecasting modules
UK Power Networks (Operations) Limited. Registered in England and Wales. Registered No. 3870728. Registered Office: Newington House, 237 Southwark Bridge Road, London, SE1 6NP Page 13 of 48
Forecasting results are passed to the CAS Data Bridge for use in look-ahead analysis and are made available to other UKPN applications through the BSI Forecasting Engine user interface.
5.3.1.1 Interface with CAS Data Bridge
The interface between the BSI Forecasting Engine and the Data Bridge is realised through file exchange. A Data Exchange Folder is
specified in the programme configuration (e.g. in the system registry). Periodically, the BSI Forecasting Engine carries out
forecasting analysis and sends the forecast to the specified Data Exchange Folder. The BSI CA/LA Data Bridge constantly monitors the folder at a file system level to detect the reception of new forecasts.
The forecast file is formatted as follows:
1. The file name is specified as forecast${time_stamp}.txt, where the ${time_stamp} is of the format
“yyyymmddHHMMSS” to specify the forecasting time.
2. The forecasts are stored as comma-separated values in the file, where the heading row is the forecasting time stamp and
the remaining rows are the forecast values.
3. Each row corresponds to one tag (metered point), where the first column is the tag and the remaining columns are the
hourly forecast values.
A forecast file example is shown in Figure 3 below.
Time_Stamp,20160722060000,20160722070000,............,20160723050000
007306G1A1/CURRENT_HHAVG, 309.106720, 312.631221,............, 287.238510
... ... ...
00861603/CURRENT, 1.415421, 1.232507,............, 1.302487
Figure 3: Forecast File Sample
5.3.1.2 Input Data
The input data to the BSI Forecasting Engine comes from the following sources:
Metered data The metered values for the system load points, wind and solar generators are retrieved from the UKPN OSIsoft PI Historian, as a one-off to train the forecasters, and are periodically updated from the CAS. The time granularity of the metered data will be half-hourly (i.e. at 30-minute intervals) and the values will be in real power or current measurement terms.
BSI CA solution data
The CAS data is provided by the CA/LA Data Bridge. It provides snapshots of the system states. This data will include ‘live feed’ measurement values supplied from PowerOn and calculated values from the state estimator. The measurement data will be used as input to the current forecast and stored in a database. The time granularity of BSI CA solution data will depend on the execution frequency of BSI CA program. However, the time granularity should at least be one snapshot for every 15 minutes (i.e. 15-minute interval).
Met Office weather data
The Met Office weather data includes weather forecasts and observations. The Forecaster weather data is delivered to the Forecaster platform to a designated folder via UKPN service bus architecture. The data is fetched periodically from a designated folder which can be accessed by the Forecaster. The Met Office weather data is updated every six hours (at 00:00, 06:00, 12:00 and 18:00 every day). Each update provides five-day-ahead (120-hour) weather forecasts and previous six-hour observations from a list of predefined weather stations. The data includes values of following weather measurements:
Temperature in Celsius degree (C)
Humidity (%)
KASM SDRC 9.3: Installation of forecasting modules
UK Power Networks (Operations) Limited. Registered in England and Wales. Registered No. 3870728. Registered Office: Newington House, 237 Southwark Bridge Road, London, SE1 6NP Page 14 of 48
Radiation in W/m2
Wind direction in degree (0-359 degrees)
Wind speed in m/s
High cloud cover (Okta)
Medium cloud cover (Okta)
Low cloud cover (Okta)
Total cloud cover (Okta)
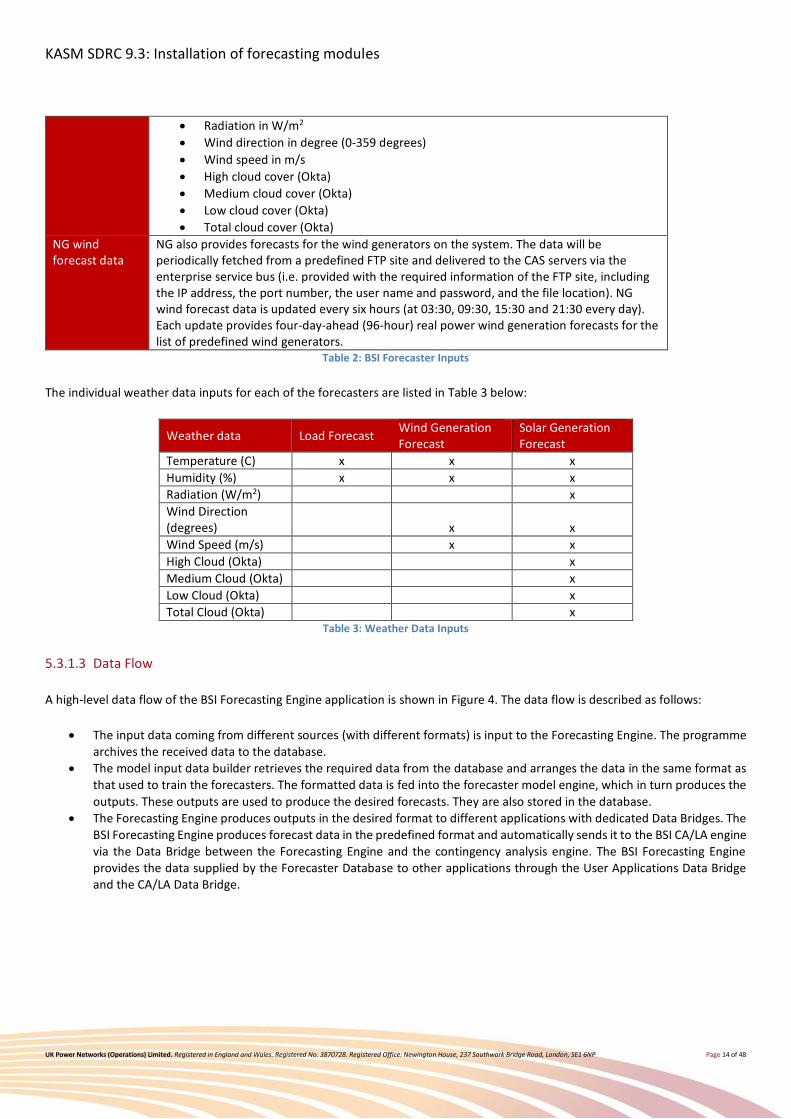
NG wind forecast data
NG also provides forecasts for the wind generators on the system. The data will be periodically fetched from a predefined FTP site and delivered to the CAS servers via the enterprise service bus (i.e. provided with the required information of the FTP site, including the IP address, the port number, the user name and password, and the file location). NG wind forecast data is updated every six hours (at 03:30, 09:30, 15:30 and 21:30 every day). Each update provides four-day-ahead (96-hour) real power wind generation forecasts for the list of predefined wind generators.
Table 2: BSI Forecaster Inputs
The individual weather data inputs for each of the forecasters are listed in Table 3 below:
Weather data Load Forecast Wind Generation Forecast
Solar Generation Forecast
Temperature (C) x x x
Humidity (%) x x x
Radiation (W/m2) x
Wind Direction (degrees) x x
Wind Speed (m/s) x x
High Cloud (Okta) x
Medium Cloud (Okta) x
Low Cloud (Okta) x
Total Cloud (Okta) x Table 3: Weather Data Inputs
5.3.1.3 Data Flow
A high-level data flow of the BSI Forecasting Engine application is shown in Figure 4. The data flow is described as follows:
The input data coming from different sources (with different formats) is input to the Forecasting Engine. The programme
archives the received data to the database.
The model input data builder retrieves the required data from the database and arranges the data in the same format as
that used to train the forecasters. The formatted data is fed into the forecaster model engine, which in turn produces the
outputs. These outputs are used to produce the desired forecasts. They are also stored in the database.
The Forecasting Engine produces outputs in the desired format to different applications with dedicated Data Bridges. The
BSI Forecasting Engine produces forecast data in the predefined format and automatically sends it to the BSI CA/LA engine
via the Data Bridge between the Forecasting Engine and the contingency analysis engine. The BSI Forecasting Engine
provides the data supplied by the Forecaster Database to other applications through the User Applications Data Bridge and the CA/LA Data Bridge.

KASM SDRC 9.3: Installation of forecasting modules
UK Power Networks (Operations) Limited. Registered in England and Wales. Registered No. 3870728. Registered Office: Newington House, 237 Southwark Bridge Road, London, SE1 6NP Page 15 of 48
Metered Data from PI
DB
MetOffice Weather
Data
NG Wind Forecast
BSI CA System
Solution Data
Forecaster Model Engine
Model Input Data
Builder
Forecaster Database
(MySQL)
Model outputs
BSI CA/LA Data
Bridge
User Application Data
Bridge
Metered Data
BSI CA
MetOffice
FTP
NG FTP
BSI CA
Other Apps
Input
data
bridge
Forecasting GUI
Output
data
bridge
Figure 4: BSI Forecasting Engine data flow
5.3.1.4 Database and Results
All data associated with the Forecasting Engine is stored in a relational database and MySQL is used as the back-end database server. Table 4 outlines the data tables contained in the Forecasting database.
Data table Description
Site Information data This table stores the basic information of the metered load, wind and solar generator sites, including the tag, coordinates, unit of the metered values etc.
Site metered data This table stores the metered data for the involved load, wind and solar generator sites.
CAS data This table stores the state estimated contingency analysis solution values that include measurement data and state estimation results for the involved load, wind and solar generator sites.
Weather station information This table stores the basic information for the weather stations involved, including the name, coordinates, etc.
Weather data This table stores the weather observations and forecasts received from the Met Office.
NG forecast data This table stores the wind generation forecasts for the involved wind generators, received from NG.
Model information data This table stores the basic information of the forecasting models constructed by the BSI forecasting engine, including the model type, the site it belongs to, the path to the model file etc.
Model output data This table stores the outputs produced by the forecasting models. A model is basically an instance of the forecasting engines (e.g. artificial neural network, supporting vector machine, boosting trees etc.) whose structure and parameters have been trained for the dedicated sites. These model outputs are not used directly as the final forecasts; instead, outputs from each of the training forecasting models associated with a specific site will be combined to produce the final forecast for the site.
Site forecast data This table stores the final forecasts of the load, wind and solar generator sites.
Supporting data This table stores Administrative and User information. Table 4: BSI Forecasting database data table descriptions

KASM SDRC 9.3: Installation of forecasting modules
UK Power Networks (Operations) Limited. Registered in England and Wales. Registered No. 3870728. Registered Office: Newington House, 237 Southwark Bridge Road, London, SE1 6NP Page 16 of 48
5.4 Application Architecture
BSI’s CAS uses advanced power flow and smart Homotopy6based power flow solvers to study the network for thermal, voltage and
steady state violations due to a large set of contingencies. This implementation includes tailored data and application processing
for UKPN’s existing online environment, to quickly assess the threat of varying power flows through grid supply points or from generators and to account for the impact of renewable energy.
For a detailed description of the CAS application architecture please refer to UKPN’s SDRC 9.2 report. This section describes the forecasting engine application only.
5.4.1 Forecasting Engine
The Forecasting Engine takes historical system measurements and historical and real-time weather forecasts as inputs to train the forecaster algorithms, and utilises advanced adaptive analytics to produce accurate forecasts.
The forecasting engine produces forecasts of:
1. Metered system load points
2. Outputs of wind generators 3. Outputs of solar generators
The forecasting engine produces a forecast for 0-120 hours ahead of time with a granularity of one hour.
An overall structure of the Forecasting Engine is shown in Figure 5. There are six major modules of the forecaster application: the
input Data Bridge, the Forecaster Database, the Forecaster Model Engine, the Graphical User Interface, the CA/LA Data Bridge, and the User Application Data Bridge.
Metered Data from PI
DB
MetOffice Weather
Data
NG Wind Forecast
BSI CA System
Solution Data
Forecaster Model Engine
Model Input Data
Builder
Forecaster Database
(MySQL)
Model outputs
BSI CA/LA Data
Bridge
User Application Data
Bridge
Metered Data
BSI CA
MetOffice
FTP
NG FTP
BSI CA
Other Apps
Input
data
bridge
Forecasting GUI
Output
data
bridge
Figure 5: Forecasting Engine Architecture
6 Solving power flow problems is essential for the reliable and efficient operation of a power network. Current software for solving these problems
are typically based on the Newton-Raphson method and have several limitations. One key limitation is that a ‘good’ initial point is usually required to obtain a solution. Homotopy based techniques help to mitigate this limitation. The basic strategy to solve a system of non-linear equations using a Homotopy method is to start with a new system of non-linear equations which is easier to solve. Then, one constructs a family of problems through one or more parameters that are members of the system to be solved and the newly constructed system. Next, each solution of the new system is tracked towards the original system along the parameters to get the final solution

KASM SDRC 9.3: Installation of forecasting modules
UK Power Networks (Operations) Limited. Registered in England and Wales. Registered No. 3870728. Registered Office: Newington House, 237 Southwark Bridge Road, London, SE1 6NP Page 17 of 48
5.4.1.1 Input Data Bridge
This module handles the input data required by the Forecasting Engine. This module periodically receives/fetches the input data from predefined sources, carries out the necessary data pre-processing and populates the data to the database.
5.4.1.2 Forecaster Database
The Forecaster Database module stores all data associated with the Forecasting Engine. The database includes all of the input data,
forecasting model output data and other data required for the programme administration and maintenance. The database is a
relational database and MySQL is used as the back-end database server. Other modules of the Forecasting Engine do not directly
interact with each other; instead, the operation of the forecasting platform is centralised around the database. The data in each table is described in the data architecture in Section 5.2. Components of the Forecaster Database are shown in Figure 6.
Figure 6: Forecaster Database Components
5.4.1.3 Forecaster Model Engine
The Forecaster Model Engine is the module which produces the desired forecasts. The input data is retrieved from the database.
The outputs (the responses of the Forecaster Model Engine to the inputs) are used to produce the final forecasts for load, wind
and solar generation in time. The Forecasting Engine implements a portfolio of predictive analytic models, including artificial neural
networks (ANNs), supporting vector machines (SVMs), fuzzy logic, and relevant optimisation techniques and metaheuristic search algorithms. These analytic models and computing techniques are integrated to produce the predictive analytics.
5.4.1.4 Forecasting Graphical User Interface (GUI)
This module provides a graphical interface to the user. This graphical interface is the front-end of the Forecasting Engine which presents data stored in the database in a user-friendly way, including:
System-wide and locational forecasts (load, wind and solar)
Historical performance of locational forecasts (load, wind and solar) Informative views of the measurements, weather data, data quality etc.
The user interface module also provides the necessary functions to amend the Forecasting Engine.

KASM SDRC 9.3: Installation of forecasting modules
UK Power Networks (Operations) Limited. Registered in England and Wales. Registered No. 3870728. Registered Office: Newington House, 237 Southwark Bridge Road, London, SE1 6NP Page 18 of 48
5.4.1.5 CA LA Data Bridge
The LA Data Bridge is invoked by the arrival of a new XML case file in the Real-Time (RT) Data Bridge and completion of the
processing in the RT Bridge to create an RT base case model. The RT base case is fed into the LA Data Bridge to create the look-
ahead base case. The LA Data Bridge inputs the forecast load and generation data for the specified look-ahead operating point
from the LA folder, where the forecasts are continuously updated with current forecasts generated by the BSI Forecasting Engine.
The current RT base case is transformed by the LA Data Bridge using the forecast load and generation values for the future point in time. The LA power flow solver then processes this case to create a converged power flow look-ahead base case.
5.4.1.6 User Application Data Bridge
The User Application Data Bridge makes the Forecasting Engine outputs available for other user applications. This Data Bridge will
provide direct access to the Forecaster Database to allow users to select and extract the data that is required for the target application.
5.4.1.7 Forecasting Viewer
The Forecasting Viewer, which is displayed in Figure 7, visualises the results computed by the forecasting engine. The user interface structure is illustrated in Figure 8.
Figure 7: Forecasting Viewer screenshot

KASM SDRC 9.3: Installation of forecasting modules
UK Power Networks (Operations) Limited. Registered in England and Wales. Registered No. 3870728. Registered Office: Newington House, 237 Southwark Bridge Road, London, SE1 6NP Page 19 of 48
CA & Real - Time
Mode & Look Ahead
Mode Main Display
Window
Select CA Manager
Machine
Preferences
(Parameters and Control
Variables)
Password protected
History data tables
and Trend Charts
Launch CA
Study Mode
Restart CA
Contingency Analysis and
Control Reports
System Data
Base Case Power
Flow and violation
Select Case/
Interface
Selected Archived
CA session to study
CA Study Mode
-Real-Time Mode and Look Ahead Mode CA
User Interface Display Structure
Single Line Diagram Viweer
Figure 8: User Interface Display Structure

KASM SDRC 9.3: Installation of forecasting modules
UK Power Networks (Operations) Limited. Registered in England and Wales. Registered No. 3870728. Registered Office: Newington House, 237 Southwark Bridge Road, London, SE1 6NP Page 20 of 48
5.5 Technology Architecture
Forecasting data is provided from several external sources, each having their own methods of integration. All of the forecasting
data is considered as a reusable interface and will therefore be configured to use the IBM Integration Bus, so that any future projects can easily access the same data.
The CAS solution and forecasting modules have been designed to work with a Microsoft Azure cloud solution. There are a number of reasons why a cloud based architecture has been chosen:
Lower costs if using the server for short-term projects or if there are opportunities to power down the server outside core
business hours. This concept is not viable when purchasing physical hardware
Speed of deployment – it only takes around 15 minutes to set up a new server using a standard Microsoft image
Ability to make configuration changes to virtual machine specification with only a reboot – this is very useful if there are
any performance issues
Scalability – as the project progresses, it is possible to add more virtual machines to a scalability set to increase
performance, if the software allows this
Moves UKPN closer to the Services Orientated Architecture (SOA), which aims to deliver a flexible architecture.
Reusability – any of the designed data items can be utilised by any future application or project within a small time frame.
This will build UKPN’s catalogue of data integration and make future data integration tasks faster and cheaper to
implement. Rather than develop application-to-application interfaces, UKPN has decoupled the business and integration logic

KASM SDRC 9.3: Installation of forecasting modules
UK Power Networks (Operations) Limited. Registered in England and Wales. Registered No. 3870728. Registered Office: Newington House, 237 Southwark Bridge Road, London, SE1 6NP Page 21 of 48
Figure 9 shows the overall technology architecture for the CAS and forecasting modules. The interface between the forecasting modules and the CAS is described in the application architecture of this document.
Figure 9: CAS and forecasting module technology architecture

KASM SDRC 9.3: Installation of forecasting modules
UK Power Networks (Operations) Limited. Registered in England and Wales. Registered No. 3870728. Registered Office: Newington House, 237 Southwark Bridge Road, London, SE1 6NP Page 22 of 48
Key data sources and interfaces are described below.
5.5.1 Met Office Weather Forecast Data
Met Office weather forecast data is provided to UKPN via an FTP file transfer into the corporate network. This will be delivered to
our IBM Integration Bus platform and delivered to the Azure Cloud Service Bus. Finally, it will be delivered to Azure storage to be
utilised by the forecasting modules and CAS application and any other future applications/processes.
5.5.2 NG Generation Forecasting Data
The NG forecasting data is provided to UKPN via an SFTP file transfer into the corporate network, using the IBM Spazio MFT/S
solution. This will then be delivered to our IBM Integration Bus platform and delivered to the Azure Cloud Service Bus. The Azure Service Bus will then deliver the data to the forecasting engine, either into the Azure SQL server or Azure storage.
5.5.3 ENTSO-e Interconnect Forecast Data
The interconnector forecast data from ENTSO-e is provided via the ENTSO-e website. There is a Representation State Transfer
(REST) Application Programming Interface (API) available so that requests can be made to retrieve the data of interest. UKPN will
have a registered key which will enable the retrieval of interconnector forecast data between the UK and France, and the UK and
the Netherlands. This retrieval of ENTSO-e data will be called daily and will look ahead at the next three days’ forecast data from
the ENTSO-e Transparency platform. Again, the resultant dataset will be delivered to the relevant directory on the CAS server using the IBM Integration Bus and potentially reusable message topics.
5.6 Security Architecture
The following section covers security considerations associated with the architecture design.
5.6.1 Physical and Communication Security
There are no specific requirements for the physical security of the CAS and forecasting module. The physical security inherited by the hosting infrastructure will meet any security concerns.
All external communications and links to third parties will leverage the existing corporate infrastructure and approved methods of communication, i.e.:
1. SFTP using the Spazio service
2. HTTPS IIB gateway to ENTSO-e
3. FTP over VPN to NG
5.6.2 Information Security
The sensitivity of the data used within the CAS and forecasting modules is low. The data originating from the NG Wind Generation
Forecast interface could be considered to have some slight commercial value, however the data only provides a small subset of the
generation forecast. Any transmission of data within corporate networks will utilise secure methods of transport, such as MQ, HTTPS or SFTP.

KASM SDRC 9.3: Installation of forecasting modules
UK Power Networks (Operations) Limited. Registered in England and Wales. Registered No. 3870728. Registered Office: Newington House, 237 Southwark Bridge Road, London, SE1 6NP Page 23 of 48
5.6.3 Existing Security Architecture Impact
The internal security architecture is already in place to support the secure transmission methods described earlier (MQ, HTTPS,
SFTP), but there are some new requirements for the private cloud architecture. UKPN already has in place an Express Route link
between our Data Centre and the Azure cloud environment for Microsoft Azure’s Infrastructure as a service. However, in order to
ensure the use of a private link for any internal service bus (IBM integration bus) to a cloud based service bus (Azure Service Bus), some changes will need to be made to the existing Express Route configuration/licensing.

KASM SDRC 9.3: Installation of forecasting modules
UK Power Networks (Operations) Limited. Registered in England and Wales. Registered No. 3870728. Registered Office: Newington House, 237 Southwark Bridge Road, London, SE1 6NP Page 24 of 48
6 Architecture Approvals
The purpose of the Architecture Review Board (ARB) within UKPN is to ensure that all IT Solution designs are:
Strategically aligned
Avoid high costs of development, operation and support
Are of sufficient quality
Minimise risks Demonstrate re-use and replication of existing solutions where appropriate
In the context of the KASM project, the role of the ARB was to review the forecasting module and CA integration design and provide the architectural assurance and guidance to the project.
The KASM CA integration architecture was presented to the ARB. The main areas of focus for the submission were around how to transfer data and the hosting environment for KASM. The submission was approved with the key points being:
The high-level architecture is considered appropriate
The use of our existing Enterprise Service Bus (ESB) to transfer files/data across UKPN’s network
The use of a new Azure Service Bus to transfer files/data within the Azure cloud network
Using bus topics to ensure reusability of data feeds (where appropriate)
The hosting of Azure on cloud based virtual servers
Using the newly commissioned ExpressRoute network connection which provides UKPN with a dedicated path between our internal network and the Azure cloud. No use of internet networks in the transferral of data between UKPN and Azure cloud
Conversion of clear text protocols (FTP) to either Messaging Queue (MQ) or AMQP protocol as soon as possible in the transfer chain. Also ensures delivery and allows re-use of any of the data feeds for future use

KASM SDRC 9.3: Installation of forecasting modules
UK Power Networks (Operations) Limited. Registered in England and Wales. Registered No. 3870728. Registered Office: Newington House, 237 Southwark Bridge Road, London, SE1 6NP Page 25 of 48
7 Completion of Installation and Demonstration
The scope of this section is to define the high-level testing strategy for the Forecaster Module. It describes the approach to testing
which took place and the phases involved that fully demonstrated that the solution delivers the functionality using all aspects of
the hardware and software required for the Forecaster Module. This strategy defines the purpose of each test phase and the roles
and responsibilities of each stakeholder for the test to be successful, which includes defect, change and release management
processes. This chapter covers the test strategy, test results, accuracy of individual forecasts and accuracy of aggregated forecasts.
7.1 Testing Strategy
The following section provides a high-level breakdown of the testing strategy applied. The detailed strategy has been captured in
the project Test Strategy document. The Forecaster Module is envisaged as a tool that will support outage planning once
implemented. The vision for the Forecaster Module is that it will quickly move from an innovation trial product to a BAU application.
Given the rigour needed to implement a system to support a critical process, testing of the Forecaster Module has been split into two releases:
Release 0 – Core Product: during this release the core applications and their capabilities were tested. The key areas of
focus were: data import, data accuracy from import and solution quality perspectives, core system interfaces, engine
performance, manoeuvrability and system installation.
Release 1 – Final Product: during this release the Forecaster Module will be tested end to end, including the automated
interface with the CAS. Modifications and/or fixes coming out of Release 0 will be incorporated. The application user
interface is fully developed with the integration of various data interfaces and applications. The Forecaster Module will have the ability to perform all of the functional tests related to the requirements identified in section 4.
Release 0 has had factory and site acceptance tests completed whilst Release 1 testing will be completed at a later date.
7.1.1 Testing Overview
The KASM Forecaster Module testing will follow a risk based test approach which entails both static and dynamic testing:
Static testing means evaluating a source document (e.g. Requirements or Acceptance Criteria) without execution of a
particular test script. Static testing occurs during reviews and walkthroughs of source (approved) documents such as KASM
requirements, test scripts execution results or Acceptance Criteria.
Dynamic testing means evaluating an application or service based on its behaviour during execution of a particular test
script. During dynamic testing, various factors such as operational capability, accuracy, business risk and performance
criticality will be analysed so that a decision can be made on the test phases to perform and the amount of testing to be done (coverage). Details of each test phase can be found in section 7.1.2 of this report.
7.1.2 Testing Process
In general, the following process has been applied. Any deviations from this process are documented and justified within the Test Strategy document.
A number of test phases were coordinated and managed by the nominated test lead and executed by the relevant testing team(s).
The test teams included members from a range of stakeholders, suppliers and project partners. During the testing phases all
identified defects were registered in a common defect log. The defect log has been distributed by the test lead to all relevant
parties and will be discussed on a regular basis to prioritise, resolve, release, retest and close all defects. The defect log is
maintained across all testing phases to ensure defects do not reappear during future test phases and for audit capability.
The test phases, at a high level, are:

KASM SDRC 9.3: Installation of forecasting modules
UK Power Networks (Operations) Limited. Registered in England and Wales. Registered No. 3870728. Registered Office: Newington House, 237 Southwark Bridge Road, London, SE1 6NP Page 26 of 48
Release 0:
Factory Acceptance Testing – the supplier’s own testing prior to installation
Site Acceptance Testing – validating the installation functions as per the design
Release 1:
Factory Acceptance Testing – the supplier’s own testing prior to installation
Site Acceptance Testing – validating the installation functions as per the design
Network Testing – validating the communication connectivity and its integrity
System Integration Testing – validating the Forecaster Module with imported data and live system information from NG
and UKPN sites
Business Continuity Testing – ensuring the Forecaster Module works if any part of the infrastructure malfunctions
User Acceptance Testing – verification of the Forecaster Module against existing output from systems
Non Functional Testing – to validate server/application related functions like backup & restore, data storage, user access,
penetration/security and scheduled housekeeping tasks
Operational Acceptance Testing – validation of process(es) to support the Forecaster Module in live production, including
routine data imports
Cutover Process Testing (CP/CPT) – a dress rehearsal to ensure smooth transition into live production
Regression Testing – to ensure that no errors or problems have been introduced and existing unchanged areas of the
application/service still function as they did prior to the changes
Additional detail on the test phases is provided in the LADD.
7.1.3 Organisations Involved
The following organisations or departments provided input into the CAS and forecasting module testing:
UKPN’s operations team, who are day-to-day users of the system (control engineers and outage planners)
UKPN’s KASM project team, who are responsible for delivering the KASM solution
NG’s KASM project team, who are responsible for assisting in delivering the KASM solution
BSI, who are delivering the Forecaster Module Navigant Consulting Inc., who are involved with the test script development and test supervision
There are a variety of other supporting suppliers/installers who are not listed here to maintain clarity.
7.1.4 Test Approach
At the start of each testing phase, the test lead was responsible for producing a detailed test plan specifying the total scope of the testing to be undertaken.
All test cycles were owned by specific test teams and were allocated to a specific individual within the team. That individual was responsible for the production of the test preparation and for performing the test execution.
7.1.5 KASM CAS Environments
The core Forecaster Module environment is shown in Figure 9. The environment includes the communication infrastructure, data
storage, application servers, human machine interfaces (HMIs), and the connectivity to external entities (e.g. generation and weather interfaces) for forecasting. The Forecaster Module has three distinct integrated environments:
1. Test (virtual server on a UKPN site) 2. Pre-production (server hosted in the cloud)

KASM SDRC 9.3: Installation of forecasting modules
UK Power Networks (Operations) Limited. Registered in England and Wales. Registered No. 3870728. Registered Office: Newington House, 237 Southwark Bridge Road, London, SE1 6NP Page 27 of 48
3. Production (server hosted in the cloud)
There are a number of integrated components which assist in receiving internal and external data. These are listed below:
Secure File Transfer Protocol (SFTP) – to receive files from NG
IBM Integrated BUS (IIB) – this will have Test, Pre-Production and Production
Internet Connections with ENTSO-e and the Met Office
7.1.6 Testing phase details
7.1.6.1 Test Phase Entry Criteria
Standard software testing procedures with rigorous controls have been deployed. Figure 10 shows the relationship and dependency of the test phases and documentation produced during the planning and execution of the tests.
Testing Planning
Testing Strategy
Test Execution Report
Test Scripts Defect log
Test Plan
Test Exit Criteria
Test Closedown
Lessons LearntKASM Test Phase
Completion Report
KASM Test Phase Completion Report
Test Strategy
Figure 10: Flowchart showing the relationship and dependency of the test documentation

KASM SDRC 9.3: Installation of forecasting modules
UK Power Networks (Operations) Limited. Registered in England and Wales. Registered No. 3870728. Registered Office: Newington House, 237 Southwark Bridge Road, London, SE1 6NP Page 28 of 48
7.1.7 Testing Responsibility Matrix
Figure 11 shows the major activities and the role that is responsible for performing, approving or supporting the testing activities.
The RASCI matrix defines responsibilities and interrelationships usually for tasks or deliverables for the test phases. All of the test phases are described in detail in the LADD. Unit and System testing is totally at the discretion of the supplier.
The acronyms are:
R (Responsible): those who do the work to achieve the task. There is at least one role with a participation type of responsible, although others can be delegated to assist in the work
A (Accountable): the individual ultimately answerable for the correct and thorough completion of the deliverable or task, and the individual who delegates the work to those responsible. In other words, an accountable individual must sign off (approve) the work that the responsible individual provides. There must be only one accountable individual specified for each task or deliverable
S (Supports): those who are in a position to support the activity and the infrastructure
C (Consulted): those whose opinions are sought (typically subject matter experts) and with whom there is two-way communication
I (Informed): those who are kept up to date on progress, often only on completion of the task or deliverable, and with whom there is only one-way communication
The RASCI matrix is presented in Figure 11.
7.1.8 Testing Metrics
All test phases must have in place the ability to extract metrics. These indicate the progress, status and level of testing that was
performed during that test. The metrics allow the test lead to understand how results from certain tests may impact the overall test plan and ensure that any defects that are identified are shared with the wider test team.
Test
Lea
d
Test
Su
per
visi
on
Test
an
alys
t
Bu
sin
ess
Use
r
Sup
plie
r
Produce FAT test plans and scenarios R A A/C C
Collate FAT input data and pre-requisites R A C I
Execute FAT C/I I I R/A
Witness and Sign-off of FAT A A/C C R
Defect and software version control A I I R
Environment management FAT C/I I I R
Figure 11: RASCI matrix

KASM SDRC 9.3: Installation of forecasting modules
UK Power Networks (Operations) Limited. Registered in England and Wales. Registered No. 3870728. Registered Office: Newington House, 237 Southwark Bridge Road, London, SE1 6NP Page 29 of 48
7.1.9 Defect Management
The Defect Management process covers finding a defect through to it being resolved. Defect Management was applied to all phases
of testing, from static testing onwards, with defects being raised by the test team.
7.1.10 Release Management
Release Management allows the project to track each deliverable throughout the project life cycle. As changes are inevitable, the
project and BSI undertook version control of any change to the system. BSI releases will include the reason explaining the change
and uniquely identifying the change and/or defect identifier. This will help to manage and test changes to the system prior to going live. Each delivery has been accompanied by a release note describing the above.
7.1.11 Assumptions
Based on the knowledge at the time the Test Strategy was prepared, the project assumptions are listed below. If an assumption is
invalidated at a later date, the activities and estimates in the Project Plan will be adjusted accordingly.
A Project Plan is in place to identify the resource effort required to undertake the testing outlined in the Test Strategy.
Project resources are in place and available, including subject matter experts, technical experts, hardware, desks, PCs etc. (see entry and exit criteria section for further details).
The delivery of environments is on time and has been successfully tested by the suppliers.
All project requirements must have been reviewed, agreed and placed under configuration control.
Test resources have been identified and made available.
The test environment will be prepared and set up in advance of test execution, pipe cleaned and available for testing activities as per the stated entry and exit criteria.
Changes to the project scope will be made through a release management process. These may result in some of the test scripts being reworked.
The hardware and software are available to facilitate the test execution.
There is sufficient availability of data and support from various teams.

KASM SDRC 9.3: Installation of forecasting modules
UK Power Networks (Operations) Limited. Registered in England and Wales. Registered No. 3870728. Registered Office: Newington House, 237 Southwark Bridge Road, London, SE1 6NP Page 30 of 48
7.2 Test Results
The following section provides the results from installation and testing of the CAS. It is the basis for validating that the forecasting
module has been installed successfully on UKPN’s IT systems. Following FAT and SAT, the relevant exit reports were produced and
signed off by the supplier, test lead and business lead. The accuracy of the forecasters is demonstrated using a number of charts
displaying forecasts and metered values. In addition, the forecasts are benchmarked against industry forecasts to validate accuracy, which, as previously mentioned, was a challenge to set out during the requirements phase of the project.
7.2.1 Release 0 Test Results
The testing process for the KASM project involved the preparation of detailed test cases. The requirements were analysed and
relevant test cases were documented. The following section focuses on test cases relating to the forecasting modules. Test cases regarding the CAS can be found in SDRC 9.2. The forecast test cases are shown in Table 5.
# Test Number Test Description Success Y/N
38 3.3.4 VALIDATE LOAD forecasters Y
39 3.3.1 VALIDATE WIND Forecasters Functionalities Y
40 3.3.2 VALIDATE WIND Forecasters with “averaging mechanism” Y
41 3.3.3 VALIDATE PV Forecasters Y
42 3.3.5 LOAD Forecasters Accuracy – day ahead Y
43 3.3.6 WIND Forecaster accuracy day ahead – excluding NG wind forecaster Y
44 3.3.7 WIND Forecaster accuracy day ahead – including NG wind forecasts Y
45 3.3.8 PV forecaster accuracy – day ahead Y
46 3.3.9 PV forecaster accuracy 0-5 days ahead Y
47 3.3.10 Wind forecaster accuracy 0-4 days ahead including NG wind forecast data Y
48 3.3.11 Load forecaster accuracy 0-5 days ahead Y Table 5: Summary of Release 0 test results
7.2.2 Forecasting-related Test Cases
Test cases in this section focus on the forecasting capabilities of the system. Their aim is to validate the software in terms of:
1. Forecaster functionalities (wind, PV and load)
2. Day-ahead forecaster accuracy (wind, PV and load)
3. 0-5 days’ forecaster accuracy (wind, PV and load) 4. Wind forecaster accuracy with and without NG forecaster data
This section presents key screen shots from the testing phase which demonstrates the successful installation of the Forecaster
Module. In section 7.3, the accuracy of the individual forecasters is demonstrated in further detail. While certain accuracy
parameters had been set in the requirements, during testing of the software it was found that the use of average percentage errors
would not fully capture the accuracy of the forecaster, due to large changes in accuracy throughout the day which could affect the
end user. As a result, the performance of the forecaster has been measured using multiple metrics. The accuracy across the five
days has been measured using Root Mean Square Error (RMSE), which reflects the accuracy throughout the day. In order to
benchmark against wider industry forecasts, the forecast accuracy has been calculated using daily MAPE for load and RMSE/capacity for wind and solar generation.

KASM SDRC 9.3: Installation of forecasting modules
UK Power Networks (Operations) Limited. Registered in England and Wales. Registered No. 3870728. Registered Office: Newington House, 237 Southwark Bridge Road, London, SE1 6NP Page 31 of 48
Figure 12 demonstrates the front-end of the forecasting module, which is designed for online operation. The interface has various
capabilities, which are displayed in Figure 12.
To validate the tests of the forecaster, new data had to be loaded into the forecaster back-end and processed prior to producing
new forecasts. The following screenshots demonstrate the Forecaster Module being successfully loaded and producing the
required outputs in raw format. The results were produced using an offline version of the solution which could provide the required raw outputs. These tests have been performed following the installation of the forecaster module on UKPN’s IT systems.
Figure 13 shows the forecast engine installed and running.
Figure 13: Confirmation of forecasting modules successfully loaded
Figure 12: Front-end of forecasting module

KASM SDRC 9.3: Installation of forecasting modules
UK Power Networks (Operations) Limited. Registered in England and Wales. Registered No. 3870728. Registered Office: Newington House, 237 Southwark Bridge Road, London, SE1 6NP Page 32 of 48
Figure 14 shows the raw file output of the forecast engine. The files listed show the BSI forecast highlighted and the BSI_NG forecast, which includes NG’s wind generation forecast data.
Figure 14: Forecast output files

KASM SDRC 9.3: Installation of forecasting modules
UK Power Networks (Operations) Limited. Registered in England and Wales. Registered No. 3870728. Registered Office: Newington House, 237 Southwark Bridge Road, London, SE1 6NP Page 33 of 48
Figure 15 shows the raw output from the forecaster prior to being processed for the front-end. The file lists all the load, wind and
solar data points which are being forecast. Each column within the table represents the hourly forecast for the 120-hour period. This raw data has been used to benchmark the forecasters for accuracy, which is demonstrated in section 7.3
Figure 15: Checking for sampled PI tags in the output txt file
7.3 Accuracy of Individual Forecasters
For detailed analysis purposes, the raw data has been extracted from the forecaster application and processed to create the following graphs, which compare the output from the forecasts with the metered values collected in our PI historian database.
Where there are gaps in the metered data, this is due to no metered values being returned to the DMS, which could be for a
number of reasons including RTU communication issues or errors within the transducers. Missing metered data creates challenges
when determining the accuracy of the forecasts. If there are large amounts of metering data missing, this can impact the accuracy
of the forecast.
The forecasting module produces a number of forecasts including:
6 wind generation points (off-shore and on-shore wind sites)
23 solar generation sites
606 load points
The following sections present the accuracy of the forecasters at an individual point level and at an aggregated level, at a primary
substation, 132kV circuit level and GSP level. The error curves shown present the accuracy as an RMSE across the time period. In addition, this section benchmarks the forecasters against other industry forecasts using consistent performance metrics.
List of forecast
data points (PI tags)
Hourly output of data point
KASM SDRC 9.3: Installation of forecasting modules
UK Power Networks (Operations) Limited. Registered in England and Wales. Registered No. 3870728. Registered Office: Newington House, 237 Southwark Bridge Road, London, SE1 6NP Page 34 of 48
7.3.1 Load Forecasting
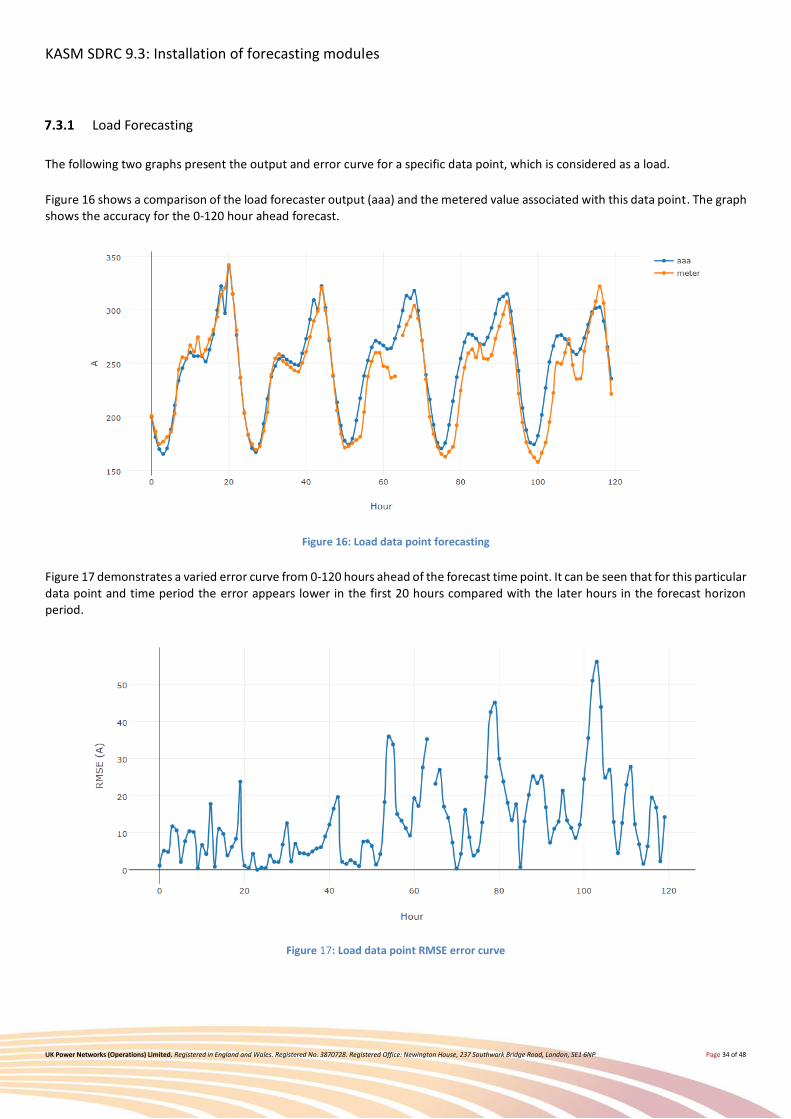
The following two graphs present the output and error curve for a specific data point, which is considered as a load.
Figure 16 shows a comparison of the load forecaster output (aaa) and the metered value associated with this data point. The graph shows the accuracy for the 0-120 hour ahead forecast.
Figure 16: Load data point forecasting
Figure 17 demonstrates a varied error curve from 0-120 hours ahead of the forecast time point. It can be seen that for this particular
data point and time period the error appears lower in the first 20 hours compared with the later hours in the forecast horizon period.
Figure 17: Load data point RMSE error curve

KASM SDRC 9.3: Installation of forecasting modules
UK Power Networks (Operations) Limited. Registered in England and Wales. Registered No. 3870728. Registered Office: Newington House, 237 Southwark Bridge Road, London, SE1 6NP Page 35 of 48
7.3.2 On-shore Wind Generation Forecast
The following two graphs present the output of an on-shore wind generation forecast when compared with historical metered
values and the associated error curve. The Bigwood forecaster is shown as ‘aaa’ whilst the historical is shown as ‘meter’. When
completing detailed analysis of the forecast performance on the UKPN environment it was found that this specific site forecast
0MW as a result of poor quality input data, which was consistently 0MW. Following this analysis, the forecast for this site has been
re-configured to use available current (Amps) measurements which were converted to a power output using a nominal voltage.
The results shown below demonstrate the revised forecast performance on BSI’s environment. This enhancement to the software
will be incorporated in the future release of the forecast software and only relates to data quality, not the functionality of the
algorithms, which have been successfully tested in both environments.
Figure 18 On-shore wind generation forecast

KASM SDRC 9.3: Installation of forecasting modules
UK Power Networks (Operations) Limited. Registered in England and Wales. Registered No. 3870728. Registered Office: Newington House, 237 Southwark Bridge Road, London, SE1 6NP Page 36 of 48
Figure 19: On-shore wind generation error curve
The error curve for on-shore wind shows a range of errors throughout the 0-120 hour forecast period. The RMSE varies from 0MW to approximately 55MW during the period. There does not appear to be a large increase in RMSE for the higher forecast horizon time periods.

KASM SDRC 9.3: Installation of forecasting modules
UK Power Networks (Operations) Limited. Registered in England and Wales. Registered No. 3870728. Registered Office: Newington House, 237 Southwark Bridge Road, London, SE1 6NP Page 37 of 48
7.3.3 Off-shore Wind Generation Forecasting
The following graphs show the accuracy of off-shore wind generation forecasts. The ‘aaa’ data is Bigwood’s forecast. The ‘meter’
data is DNO metering data associated with the site.
Figure 20: Off-shore wind generation forecast
Figure 21: Off-shore wind error curve
The error curve for offshore wind varies between zero RMSE and approximately 13 MW RMSE. For this site and time period there
appears to be much higher RMSE after the 40 hour forecast time horizon, however this is not consistently demonstrated with other forecast time periods.

KASM SDRC 9.3: Installation of forecasting modules
UK Power Networks (Operations) Limited. Registered in England and Wales. Registered No. 3870728. Registered Office: Newington House, 237 Southwark Bridge Road, London, SE1 6NP Page 38 of 48
7.3.4 Wind Generation Forecast including ‘Poll of Poll’ Forecast
Figure 22 shows a comparison of BSI’s forecast listed as ‘aaa’ and NG’s generation forecast listed as ‘ng’. In addition, the graph
displays the ‘poll of poll’ which combines the two forecasts. This forecast is displayed as the ‘aaa_ng’ forecast. The baseline metered values are displayed as the ‘meter’ values
Figure 22: 'Poll of poll' wind generation forecast output
In this instance, it can be seen that the ‘aaa’ forecast closely matches the historical metered value. When using the ‘poll of poll’
mechanism, which accounts for NG’s wind generation forecast, it can be seen that the forecast diverges from the historical metered
value in most cases. This could be due to the nature of the NG forecast, which utilises different inputs to the BSI forecast.
Throughout the trials, the project will monitor whether combining the two forecasts in the ‘poll of poll’ mechanism improves
reliability of the forecast or consistently reduces the accuracy.

KASM SDRC 9.3: Installation of forecasting modules
UK Power Networks (Operations) Limited. Registered in England and Wales. Registered No. 3870728. Registered Office: Newington House, 237 Southwark Bridge Road, London, SE1 6NP Page 39 of 48
7.3.5 Solar Forecasting
Figure 23 shows the output of a solar generator compared with the forecast provided by the forecast engine.
Figure 23: Solar generation forecast
Figure 24 shows a variable range of RMSE, from zero to approximately 1.7. Similar to other forecasts, there does not appear to be a strong correlation between the forecast accuracy and forecast time horizon.
Figure 24: Solar generator forecast error curve

KASM SDRC 9.3: Installation of forecasting modules
UK Power Networks (Operations) Limited. Registered in England and Wales. Registered No. 3870728. Registered Office: Newington House, 237 Southwark Bridge Road, London, SE1 6NP Page 40 of 48
7.4 Generation Data Aggregation
Data aggregation has been performed on the generation sites at a primary substation, 132kV circuit level and GSP level. The following three graphs show the RMSE error curves associated with each of these aggregation levels.
Figure 25: Primary substation generation error curve
Figure 26: 132kV circuit generation error curve

KASM SDRC 9.3: Installation of forecasting modules
UK Power Networks (Operations) Limited. Registered in England and Wales. Registered No. 3870728. Registered Office: Newington House, 237 Southwark Bridge Road, London, SE1 6NP Page 41 of 48
Figure 27: GSP generation error curve
When comparing the three error curves associated with the different aggregation levels it is noticeable that the RMSE increases as
more generators are grouped. In addition, similar to previous results shown in this report, the RMSE does not necessarily increase
in line with the forecast time horizon. It is suggested that further analysis is performed during the trial period to establish whether other correlations can be extracted from the forecast data.

KASM SDRC 9.3: Installation of forecasting modules
UK Power Networks (Operations) Limited. Registered in England and Wales. Registered No. 3870728. Registered Office: Newington House, 237 Southwark Bridge Road, London, SE1 6NP Page 42 of 48
Figure 28 compares the aggregate of each individual BSI forecast with the aggregate of metered data for generation connected to
a GSP. As a reference point, the graph displays the generation capacity associated with these generators. It can be observed that
for this specific time point, there is a large difference in the forecast or metered data when compared with the aggregate of the
relevant network capacities. As outlined in section 5.1, current business processes use maximum generation capacity values when
performing network studies rather than forecast data. By using forecast data in network studies rather than maximum capacity
data, the data in this specific case shows that the user could potentially free up capacity on the network, which was previously
considered constrained. The full benefit of using forecast data will be captured during the trial period and reported in SDRC 9.5 in December 2017.
Figure 28: GSP aggregated generation forecasts

KASM SDRC 9.3: Installation of forecasting modules
UK Power Networks (Operations) Limited. Registered in England and Wales. Registered No. 3870728. Registered Office: Newington House, 237 Southwark Bridge Road, London, SE1 6NP Page 43 of 48
In order to benchmark the forecaster against industry forecasts, it was decided to use a different performance metric to what was
originally set out in the requirements. When comparing the accuracy of the forecasters against industry forecasts, short-term load
forecasting uncertainty is commonly evaluated in terms of Mean Absolute Percentage Error (MAPE). High MAPE values imply less
accuracy, whereas lower MAPE values indicate that the forecast is more accurate.
Figure 29 shows the performance of the load forecasts. The mean across the (approximately) 600 load points is 9% MAPE. It can
be seen that some forecasts show high levels of accuracy which are outside the standard deviation. The error of these forecasts
could be attributed to various reasons, such as poor quality metering data or embedded generation which has not been factored
into the forecasts. Further investigation is required during the trial period to determine the cause of the errors. When comparing
these results to industry forecasts, system level errors typically fall within 1-2% MAPE, which is more accurate than the BSI
forecasts; however, individual data points can rise up to 30% MAPE. The BSI forecast MAPE falls between these two stated figures and is therefore considered acceptable from a benchmarking perspective.
Figure 29: Performance of load forecasts

KASM SDRC 9.3: Installation of forecasting modules
UK Power Networks (Operations) Limited. Registered in England and Wales. Registered No. 3870728. Registered Office: Newington House, 237 Southwark Bridge Road, London, SE1 6NP Page 44 of 48
In order to measure wind and solar power forecaster performance, the root mean square error (RMSE) metric is often used. High
RMSE values imply less accuracy whereas lower RMSE indicate that the forecast is more accurate. The RMSE is known to be suitable
for evaluating the overall accuracy of the forecasts while penalising large forecast errors in a square order. The RMSE is often found
to be normalised with the nominal power or installed capacity of the wind farm or solar power plant.
In industry literature7 the RMSE is reported to be usually 10% of installed capacity (a normalised error value) for most wind power
forecaster models used by a Danish system operator. In Ireland, a system operator targets wind forecasting accuracy of 6-8%. In general, system operators have been reported to target individual wind farm accuracy in the range of 10-20%.
As highlighted in industry literature8, the best solar power prediction is reported to achieve a normalised RMSE in the range of 9.3%. However, depending on the models used, solar power forecast errors can reach 20% of the plant rated capacity and larger.
Figure 30 shows the performance of the solar and wind forecasts. The box plot shows the range of error values across solar and
wind. For wind and solar forecasts, the mean RMSE/capacity is approximately 17% and 10% respectively. Figure 30 shows a single wind data point which has a large forecast error. This site will be investigated to determine the reason for the error.
Figure 30: Performance of wind and solar forecasts
It is important to note that the input data for the industry load and generation forecasts may not be the same as for the BSI forecasts; therefore, care needs to be taken when drawing detailed conclusions.
7 A. M. Foley, P. G. Leahy, A. Marvuglia, and E. J. McKeogh, “Current methods and advances in forecasting of wind power generation,” Renew. Energy, vol. 37, no. 1, pp. 1–8, 2012. (See reference number 7)
8 J. Antonanzas, N. Osorio, R. Escobar, R. Urraca, F. J. Martinez-de-Pison, and F. Antonanzas-Torres, “Review of photovoltaic power forecasting,” Sol. Energy, vol. 136, pp. 78–111, 2016. (See reference number 6)

KASM SDRC 9.3: Installation of forecasting modules
UK Power Networks (Operations) Limited. Registered in England and Wales. Registered No. 3870728. Registered Office: Newington House, 237 Southwark Bridge Road, London, SE1 6NP Page 45 of 48
8 Engagement with Stakeholders
Engagement with DNOs took the following forms:
UKPN hosted a webinar which was attended by a number of DNOs and other interested parties to discuss the forecasting
modules
UKPN attended the LCNI conference, presented the KASM project during a session and gathered feedback from the
audience UKPN engaged extensively with NG on sharing wind generation forecasts and embedded generation measurement data
8.1 Engagement through Webinars
The specific DNOs attending the webinar were NPG and WPD. The table below lists the key follow-up action raised during the meeting.
WebEx Topic DNO / TSO Details Action
Contingency Analysis
and Forecasting Webex Network Equilibrium
Forecasting WPD
Forecasting is being
carried out as part of
the Network
Equilibrium project.
WPD and UKPN have continued to
discuss aspects regarding
forecasting inputs and accuracy.
Discussions have been held at a
number of industry events
including the LCNI Conferences
and the WPD Innovation event – A
Balancing Act conference.
8.2 Engagement through the LCNI Conference
LCNI Conference 2015
The KASM project team attended the LCNI Conference in 2015 and engaged with a number of DNOs and NG. Engagement during the conference was mainly focused on receiving feedback from DNOs and NG on:
The considerations for ICCP
The data exchange between DNOs and NG Load and generation forecasting
A number of challenges that were previously covered in the webinars were discussed and followed up on accordingly.
LCNI Conference 2016
The KASM team attended the LCNI conference in 2016. Various media were used to disseminate the project learning, including
presentation sessions, videos and single page overview flyers. During the presentation sessions a key question was posed by the audience:
Q1) Will the forecaster produce a probability factor associated with the forecaster?
A1) The forecasters will automatically calculate error curves; however, probability factors are not currently included in the
forecasts. As we move towards the trial periods, we will gain a better understanding of how confident the trial participants are in using the forecasters within their studies.

KASM SDRC 9.3: Installation of forecasting modules
UK Power Networks (Operations) Limited. Registered in England and Wales. Registered No. 3870728. Registered Office: Newington House, 237 Southwark Bridge Road, London, SE1 6NP Page 46 of 48
8.3 Engagement with NG
The project team has had useful engagement with NG regarding the development of the forecasting modules. Specific engagement
has been the sharing of NG wind generation forecasts with UKPN for the KASM project. This support has been useful in
understanding the BSI wind generation forecast performance when compared to the NG forecast. UKPN has provided NG with
historical generation output based on DNO metering data in the SPN licence area. This sharing of network metering data will help
NG improve their existing forecasts. Ongoing support will be required from both parties to ensure that further data exchange is maintained.

KASM SDRC 9.3: Installation of forecasting modules
UK Power Networks (Operations) Limited. Registered in England and Wales. Registered No. 3870728. Registered Office: Newington House, 237 Southwark Bridge Road, London, SE1 6NP Page 47 of 48
9 Conclusions
9.1 Forecasting Conclusions
Overall, it has been demonstrated that the installation and testing of the forecasting modules has been successful. It is clear that
the accuracy of individual forecasters can vary largely on a daily period, and further analysis that will be completed as part of the
trial period is required to fully understand the correlations across the forecasters.
The evidence provided in section 5 (Integration Architecture) describes the key architectural principles behind the overall solution
and interface with the overall CAS. This is broken down into the key TOGAF architecture principles: Business, Data, Application, Technology and Security Architectures. The architecture has been signed off to ensure robust design.
Initial results show that the forecasts provide similar results when benchmarking against wider industry forecasts. It is noticeable
that a few load data point forecasts can have high errors, which could be due to a number of factors including: masked embedded
generation, limited metering data or poor quality metering data. The overall results show that the majority of forecasts lie within the acceptable range.
It is clear from the aggregated generator forecasts at GSP level that a major drop off in performance did not occur over the 0-120
hour period. This is contrary to what was initially expected, however further data will need to be collected over the full trial period
to validate initial results. Figure 28 demonstrates that, as expected, under certain circumstances forecast generator output is well
below maximum capacity. Although Figure 28 is for a snapshot in time, it highlights that using forecast data rather than maximum
generation capacity (worst case) can potentially release network capacity during outages.
9.2 Lessons Learned
Lessons learned have been tracked and recorded on the project, including through a workshop discussion with key stakeholders
(held on 24 October 2016) to identify the main lessons learned from the project to date. The discussion was structured around
areas where other DNOs implementing such forecasting tools should focus in order to derive the maximum value from the system. The key lessons have been captured below:
Using percentage error as a measure of accuracy is not always appropriate; consider using RMSE for a normalised
approach.
With certain sites it is difficult to determine whether 0MW or 0A values are real values, or whether there is an issue
with the transducers or RTUs. It is important to understand that the forecaster does not account for planned outages
or disconnections on the network. To mitigate against this, the user needs to ensure that any outages are updated
within the forecast engine or that this is picked up within the CAS LA mode.
For the purposes of look-ahead power flow modelling, individual data points need to be forecast in order to build the
power flow model.
Embedded generation within the 11kV network and LV network can impact the load forecaster accuracy. Monitoring
the accuracy of load forecasters can pick this up and the forecaster can be retrained once further detail is understood.
Challenges exist in setting out an accuracy requirement for the forecaster, as this is very much reliant on the input
data provided. Validating the success of the forecasters without having another forecaster to compare to is a
challenge. In this case the wind forecast can be compared against NG’s forecast, however the load and solar forecasts cannot be compared against another forecast. This will be investigated during the trial period of the project.

KASM SDRC 9.3: Installation of forecasting modules
UK Power Networks (Operations) Limited. Registered in England and Wales. Registered No. 3870728. Registered Office: Newington House, 237 Southwark Bridge Road, London, SE1 6NP Page 48 of 48
9.3 Identified Risks
This section explores the risks associated with the installation and integration of forecasting modules in the DNO control room. The
lessons learned through the KASM project are strongly linked to the risks identified below. Risks have been mitigated against in
numerous ways for the purposes of the project; however, for future implementation of similar solutions, the following risks need
to be mitigated against appropriately, considering the DNO environment.
1. Newly connected generation of sites will not be fully trained and, as a result, will be less accurate. This is because the
newly connected sites do not have historical generation data available. This risk will be mitigated by the forecaster utilising
similar generation or load sites and applying similar trends. This will provide a relatively simple approach whilst data is
archived prior to the forecaster being fully trained in an offline environment.
2. There is a risk that the forecaster engine could provide a forecast for a site which has recently been taken off the network
for a planned outage. To mitigate against this, the outage will be recognised within the Look-ahead base case of the CAS,
which will ignore the forecast for that specific site.
3. Transducers can diverge from initial calibration – reducing forecaster accuracy. This risk is mitigated against through UKPN’s clear maintenance plans, ensuring transducers are recalibrated on a regular basis.