kempsey high · pdf fileand a foei (family occupation and education index) of 158. these...
TRANSCRIPT

[school code]
Kempsey High School Annual School Report 2014
8123
1
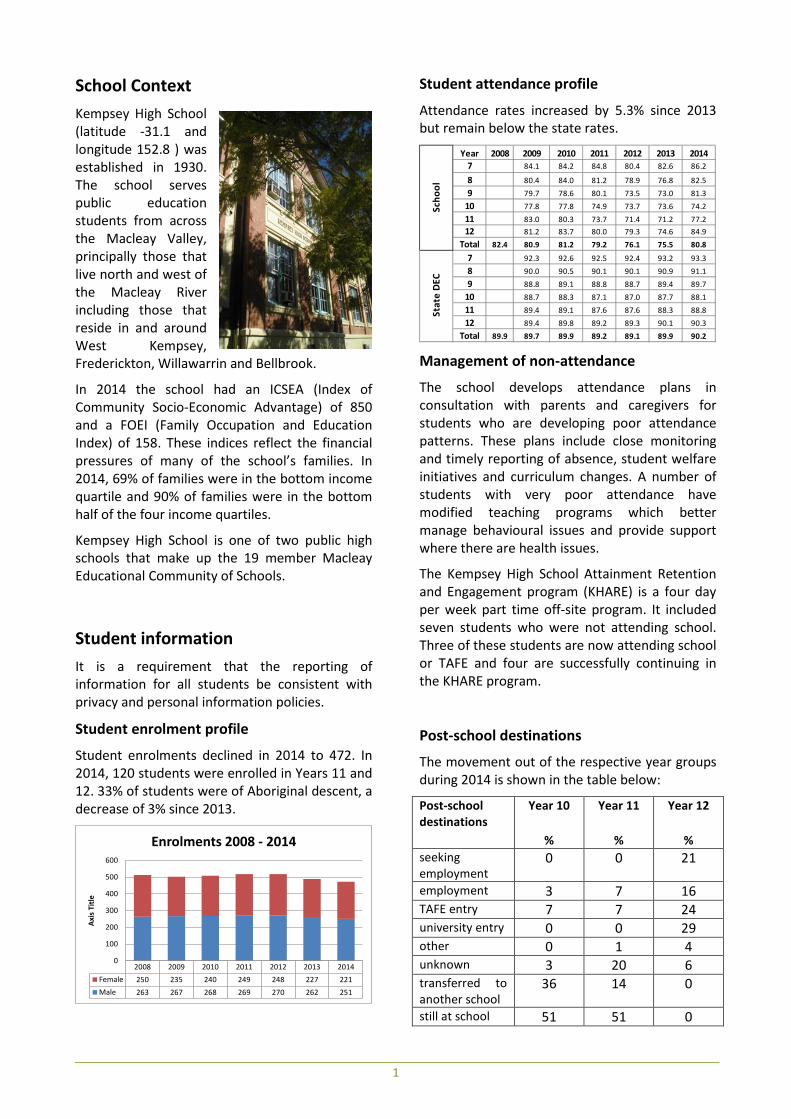
School Context Kempsey High School (latitude -31.1 and longitude 152.8 ) was established in 1930. The school serves public education students from across the Macleay Valley, principally those that live north and west of the Macleay River including those that reside in and around West Kempsey, Frederickton, Willawarrin and Bellbrook.
In 2014 the school had an ICSEA (Index of Community Socio-Economic Advantage) of 850 and a FOEI (Family Occupation and Education Index) of 158. These indices reflect the financial pressures of many of the school’s families. In 2014, 69% of families were in the bottom income quartile and 90% of families were in the bottom half of the four income quartiles.
Kempsey High School is one of two public high schools that make up the 19 member Macleay Educational Community of Schools.
Student information It is a requirement that the reporting of information for all students be consistent with privacy and personal information policies.
Student enrolment profile
Student enrolments declined in 2014 to 472. In 2014, 120 students were enrolled in Years 11 and 12. 33% of students were of Aboriginal descent, a decrease of 3% since 2013.
Student attendance profile
Attendance rates increased by 5.3% since 2013 but remain below the state rates.
Management of non-attendance
The school develops attendance plans in consultation with parents and caregivers for students who are developing poor attendance patterns. These plans include close monitoring and timely reporting of absence, student welfare initiatives and curriculum changes. A number of students with very poor attendance have modified teaching programs which better manage behavioural issues and provide support where there are health issues.
The Kempsey High School Attainment Retention and Engagement program (KHARE) is a four day per week part time off-site program. It included seven students who were not attending school. Three of these students are now attending school or TAFE and four are successfully continuing in the KHARE program.
Post-school destinations
The movement out of the respective year groups during 2014 is shown in the table below:
Post-school destinations
Year 10
%
Year 11
%
Year 12
% seeking employment
0 0 21
employment 3 7 16 TAFE entry 7 7 24 university entry 0 0 29 other 0 1 4 unknown 3 20 6 transferred to another school
36 14 0
still at school 51 51 0
2008 2009 2010 2011 2012 2013 2014Female 250 235 240 249 248 227 221Male 263 267 268 269 270 262 251
0
100
200
300
400
500
600
Axis
Titl
e
Enrolments 2008 - 2014
Year 2008 2009 2010 2011 2012 2013 20147 84.1 84.2 84.8 80.4 82.6 86.2
8 80.4 84.0 81.2 78.9 76.8 82.59 79.7 78.6 80.1 73.5 73.0 81.3
10 77.8 77.8 74.9 73.7 73.6 74.211 83.0 80.3 73.7 71.4 71.2 77.212 81.2 83.7 80.0 79.3 74.6 84.9
Total 82.4 80.9 81.2 79.2 76.1 75.5 80.8
7 92.3 92.6 92.5 92.4 93.2 93.38 90.0 90.5 90.1 90.1 90.9 91.19 88.8 89.1 88.8 88.7 89.4 89.7
10 88.7 88.3 87.1 87.0 87.7 88.111 89.4 89.1 87.6 87.6 88.3 88.812 89.4 89.8 89.2 89.3 90.1 90.3
Total 89.9 89.7 89.9 89.2 89.1 89.9 90.2
Scho
olSt
ate
DEC
2
Year 12 students undertaking vocational or trade training
74% of Year 12 students undertook vocational or trade training in 2014. These students are counted on the basis of enrolment in one or more vocational courses.
Year 12 students attaining HSC or equivalent Vocational educational qualification
86% (44 of 51) of students who began Year 12 attained an HSC or equivalent vocational educational qualification in 2014.
Workforce information It is a requirement that the reporting of information for all staff must be consistent with privacy and personal information policies.
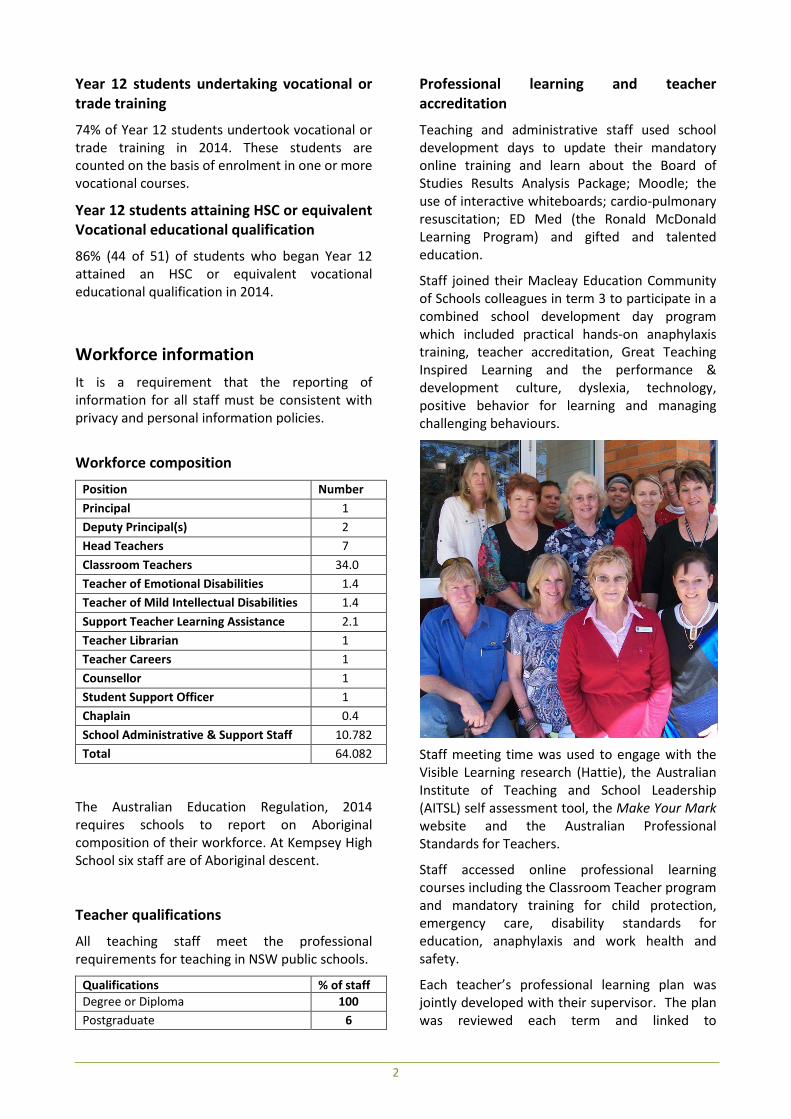
Workforce composition
Position Number Principal 1 Deputy Principal(s) 2 Head Teachers 7 Classroom Teachers 34.0 Teacher of Emotional Disabilities 1.4 Teacher of Mild Intellectual Disabilities 1.4 Support Teacher Learning Assistance 2.1
Teacher Librarian 1 Teacher Careers 1 Counsellor 1 Student Support Officer 1 Chaplain 0.4 School Administrative & Support Staff 10.782 Total 64.082
The Australian Education Regulation, 2014 requires schools to report on Aboriginal composition of their workforce. At Kempsey High School six staff are of Aboriginal descent.
Teacher qualifications
All teaching staff meet the professional requirements for teaching in NSW public schools.
Qualifications % of staff Degree or Diploma 100 Postgraduate 6
Professional learning and teacher accreditation
Teaching and administrative staff used school development days to update their mandatory online training and learn about the Board of Studies Results Analysis Package; Moodle; the use of interactive whiteboards; cardio-pulmonary resuscitation; ED Med (the Ronald McDonald Learning Program) and gifted and talented education.
Staff joined their Macleay Education Community of Schools colleagues in term 3 to participate in a combined school development day program which included practical hands-on anaphylaxis training, teacher accreditation, Great Teaching Inspired Learning and the performance & development culture, dyslexia, technology, positive behavior for learning and managing challenging behaviours.
Staff meeting time was used to engage with the Visible Learning research (Hattie), the Australian Institute of Teaching and School Leadership (AITSL) self assessment tool, the Make Your Mark website and the Australian Professional Standards for Teachers.
Staff accessed online professional learning courses including the Classroom Teacher program and mandatory training for child protection, emergency care, disability standards for education, anaphylaxis and work health and safety.
Each teacher’s professional learning plan was jointly developed with their supervisor. The plan was reviewed each term and linked to

3
conferencing in the teacher and executive annual reviews.
Twenty-one staff accessed professional learning offered beyond the school. Several of these events were offered by professional associations including the careers advisers association, Australian College of Education, Deputy Principals Association, and subject associations including the Personal Development, Health and Physical Education Teachers Association and the Agricultural and Environmental Science Teachers Association.
Staff took advantage of several opportunities to extend their capacities through attendance at student learning events or visits to the school by expert teachers. These events included Onstage (drama), dLab Photo Media Workshops (visual arts, media and photography), the Creative Arts excursion (music, visual arts and drama), various primary industry events (agriculture), the Hospitality, Tourism and Events showcase (hospitality and food technology) and university lectures (business studies, science).
Collegial professional learning was provided to support changes in the Primary Industries and Hospitality vocational education courses.
Collegial meetings were attended by Aboriginal education officers and Aboriginal education workers to support them in their roles. Two head teachers attended regular collegial leadership network meetings.
Professional learning expenditure totalled $35,967 which averaged $693 per teacher.
The numbers of teachers seeking or maintaining accreditation at the various levels is shown in the table below:
Numbers of Accredited New Scheme Teachers
Level Working Towards Maintaining
Proficient 3 8 Highly Accomplished 1 0 Lead 0 0
Beginning Teachers
There were no permanent beginning teachers at Kempsey High School in 2014. There were three temporary beginning teachers.
Financial summary
Year Ended 31 December 2014
Funds received from Resource Allocation Model
2014 Actual ($)Opening BalanceRevenue
AppropriationSale of Goods and ServicesGrants and ContributionsInvestment IncomeGain and lossOther Revenue
ExpensesRecurrent ExpensesEmployee RelatedOperating ExpensesCapital Expenses
Surplus/Deficit for the Year
Balance Carried Forward (982,479)
(7,457) (203,597) (34,030)
(7,209,639) (7,454,722) (580,389)
- -
7,052,632 7,052,632 6,420,736 631,896
- (402,090)
Component RAMBase 4,856,722
Equity 1,148,253
Location -
Aboriginal 160,666
Socio-Economic 711,917
Language -
Disabil ity 275,670
Targeted 486,093 Other 261,539
Total 6,752,607
RAM Funds
Base (71.9%) Location (0%)Aboriginal (2.4%) Socio-Economic (10.5%)Language (0%) Disability (4.1%)Targeted (7.2%) Other (3.9%)
4
School performance 2014
National Assessment Program
The results across the Years 7 and 9 literacy and numeracy assessments are contained in the following ten graphs.
The results are reported on an achievement scale which represents increasing levels of skills and understandings demonstrated in the assessments. In Year 7 they range from Band 4 (lowest) to Band 9 (highest). In Year 9 they range from Band 5 (lowest) to Band 10 (highest).
The My School website provides detailed information and data for national literacy and numeracy testing (NAPLAN).
Click on the link http://www.myschool.edu.au and enter the school name in Find a school and select GO to access the school data.
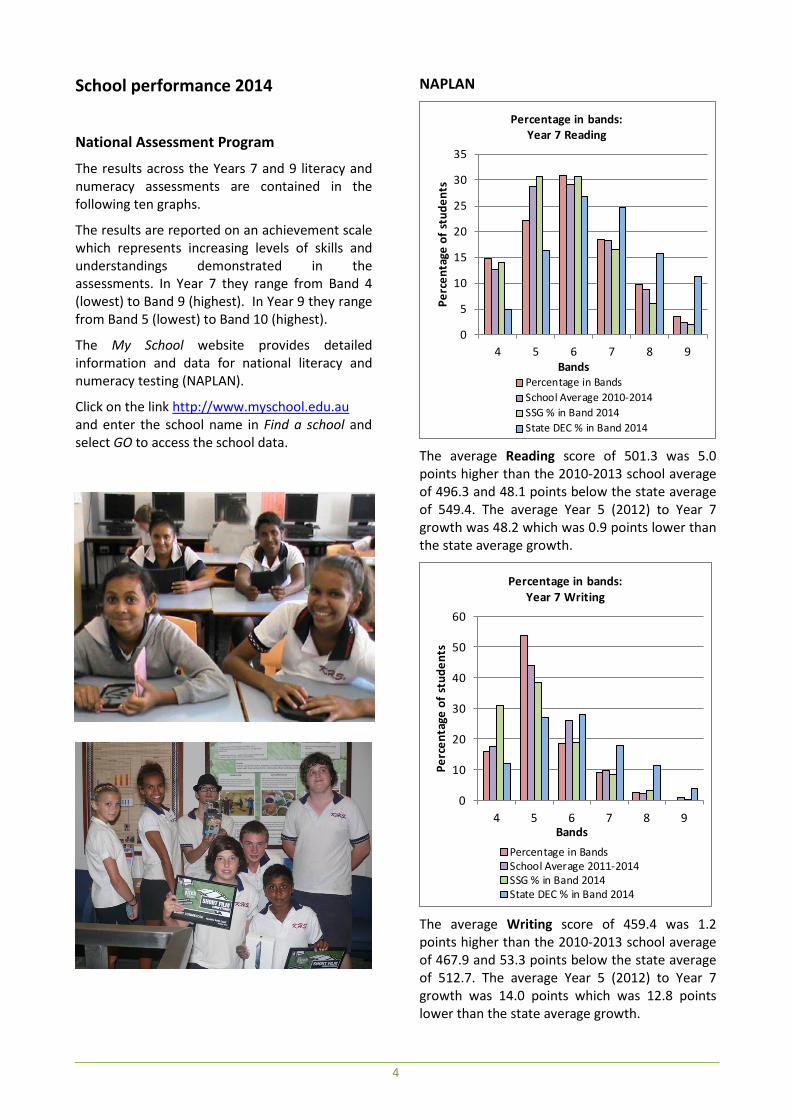
NAPLAN
The average Reading score of 501.3 was 5.0 points higher than the 2010-2013 school average of 496.3 and 48.1 points below the state average of 549.4. The average Year 5 (2012) to Year 7 growth was 48.2 which was 0.9 points lower than the state average growth.
The average Writing score of 459.4 was 1.2 points higher than the 2010-2013 school average of 467.9 and 53.3 points below the state average of 512.7. The average Year 5 (2012) to Year 7 growth was 14.0 points which was 12.8 points lower than the state average growth.
0
5
10
15
20
25
30
35
4 5 6 7 8 9
Perc
enta
ge o
f stu
dent
s
Bands
Percentage in bands:Year 7 Reading
Percentage in BandsSchool Average 2010-2014SSG % in Band 2014State DEC % in Band 2014
0
10
20
30
40
50
60
4 5 6 7 8 9
Perc
enta
ge o
f stu
dent
s
Bands
Percentage in bands:Year 7 Writing
Percentage in BandsSchool Average 2011-2014SSG % in Band 2014State DEC % in Band 2014
5
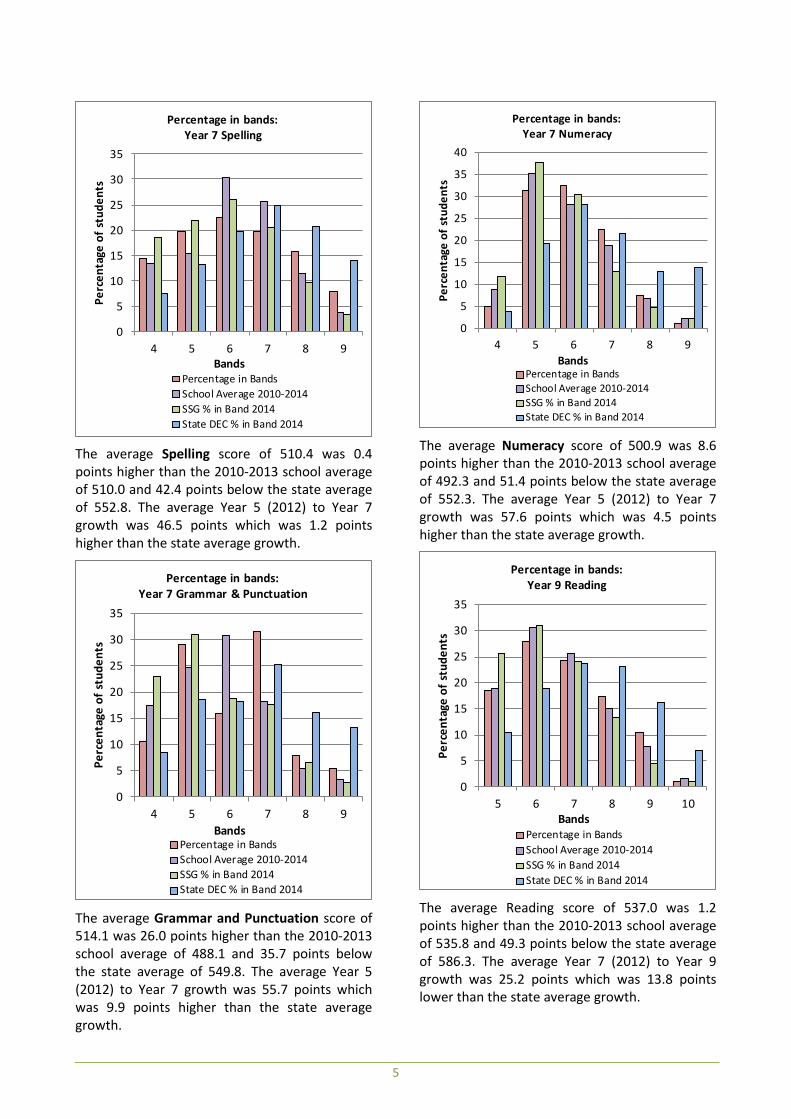
The average Spelling score of 510.4 was 0.4 points higher than the 2010-2013 school average of 510.0 and 42.4 points below the state average of 552.8. The average Year 5 (2012) to Year 7 growth was 46.5 points which was 1.2 points higher than the state average growth.
The average Grammar and Punctuation score of 514.1 was 26.0 points higher than the 2010-2013 school average of 488.1 and 35.7 points below the state average of 549.8. The average Year 5 (2012) to Year 7 growth was 55.7 points which was 9.9 points higher than the state average growth.
The average Numeracy score of 500.9 was 8.6 points higher than the 2010-2013 school average of 492.3 and 51.4 points below the state average of 552.3. The average Year 5 (2012) to Year 7 growth was 57.6 points which was 4.5 points higher than the state average growth.
The average Reading score of 537.0 was 1.2 points higher than the 2010-2013 school average of 535.8 and 49.3 points below the state average of 586.3. The average Year 7 (2012) to Year 9 growth was 25.2 points which was 13.8 points lower than the state average growth.
0
5
10
15
20
25
30
35
4 5 6 7 8 9
Perc
enta
ge o
f stu
dent
s
Bands
Percentage in bands:Year 7 Spelling
Percentage in BandsSchool Average 2010-2014SSG % in Band 2014State DEC % in Band 2014
0
5
10
15
20
25
30
35
4 5 6 7 8 9
Perc
enta
ge o
f stu
dent
s
Bands
Percentage in bands:Year 7 Grammar & Punctuation
Percentage in BandsSchool Average 2010-2014SSG % in Band 2014State DEC % in Band 2014
0
5
10
15
20
25
30
35
40
4 5 6 7 8 9
Perc
enta
ge o
f stu
dent
s
Bands
Percentage in bands:Year 7 Numeracy
Percentage in BandsSchool Average 2010-2014SSG % in Band 2014State DEC % in Band 2014
0
5
10
15
20
25
30
35
5 6 7 8 9 10
Perc
enta
ge o
f stu
dent
s
Bands
Percentage in bands:Year 9 Reading
Percentage in BandsSchool Average 2010-2014SSG % in Band 2014State DEC % in Band 2014
6
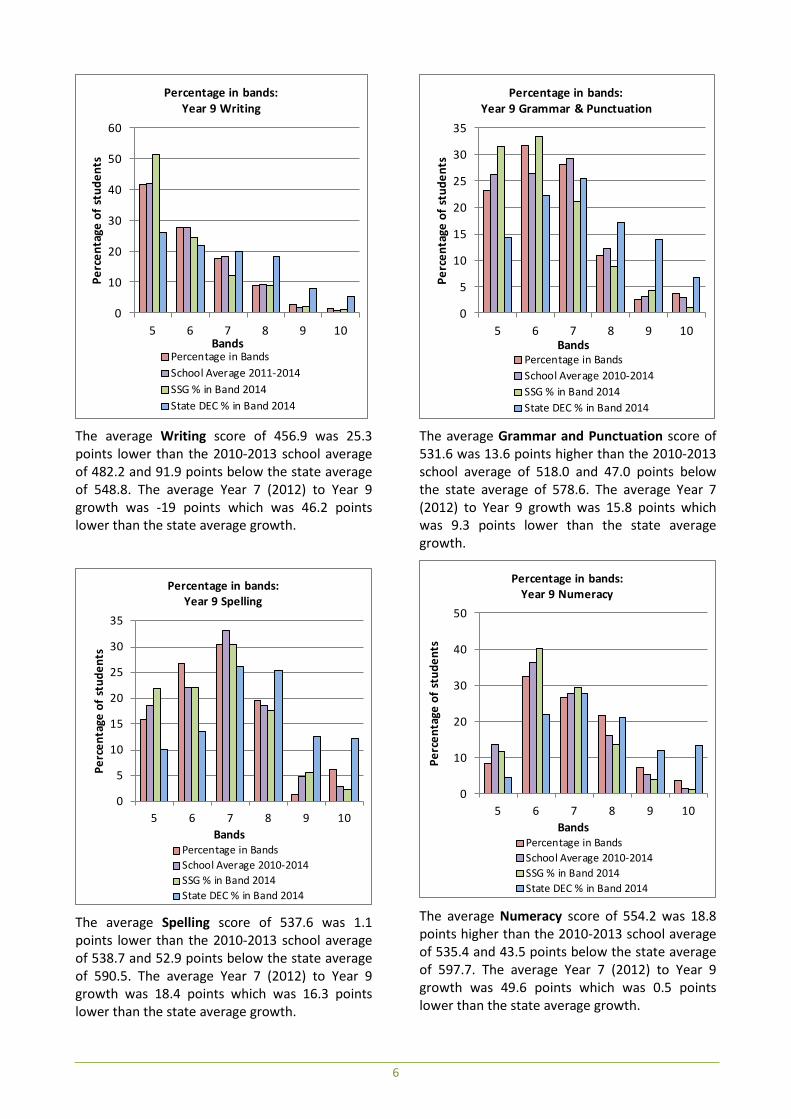
The average Writing score of 456.9 was 25.3 points lower than the 2010-2013 school average of 482.2 and 91.9 points below the state average of 548.8. The average Year 7 (2012) to Year 9 growth was -19 points which was 46.2 points lower than the state average growth.
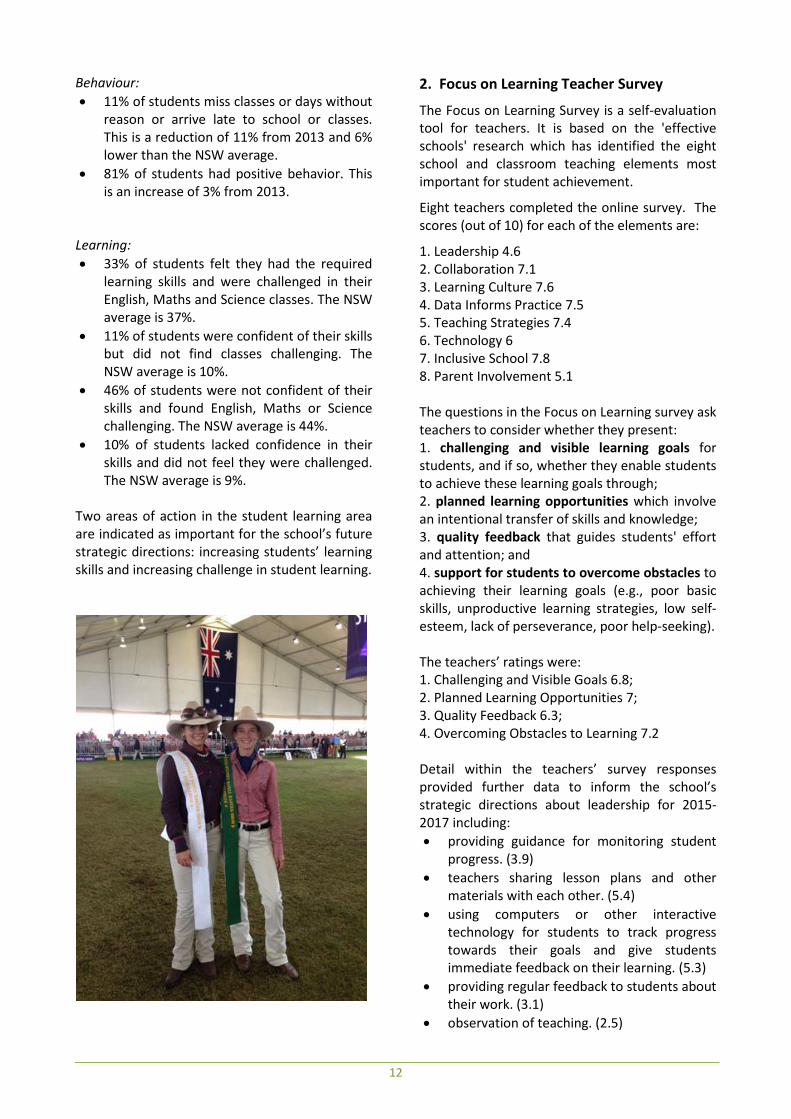
The average Spelling score of 537.6 was 1.1 points lower than the 2010-2013 school average of 538.7 and 52.9 points below the state average of 590.5. The average Year 7 (2012) to Year 9 growth was 18.4 points which was 16.3 points lower than the state average growth.
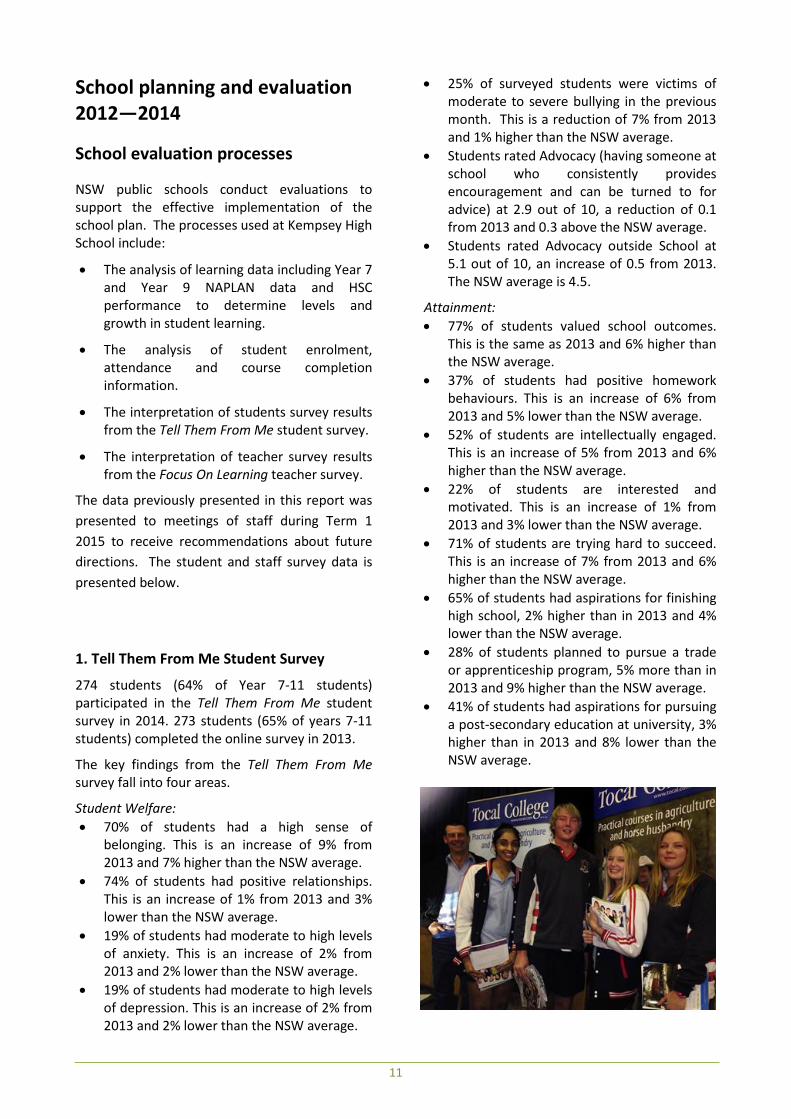
The average Grammar and Punctuation score of 531.6 was 13.6 points higher than the 2010-2013 school average of 518.0 and 47.0 points below the state average of 578.6. The average Year 7 (2012) to Year 9 growth was 15.8 points which was 9.3 points lower than the state average growth.
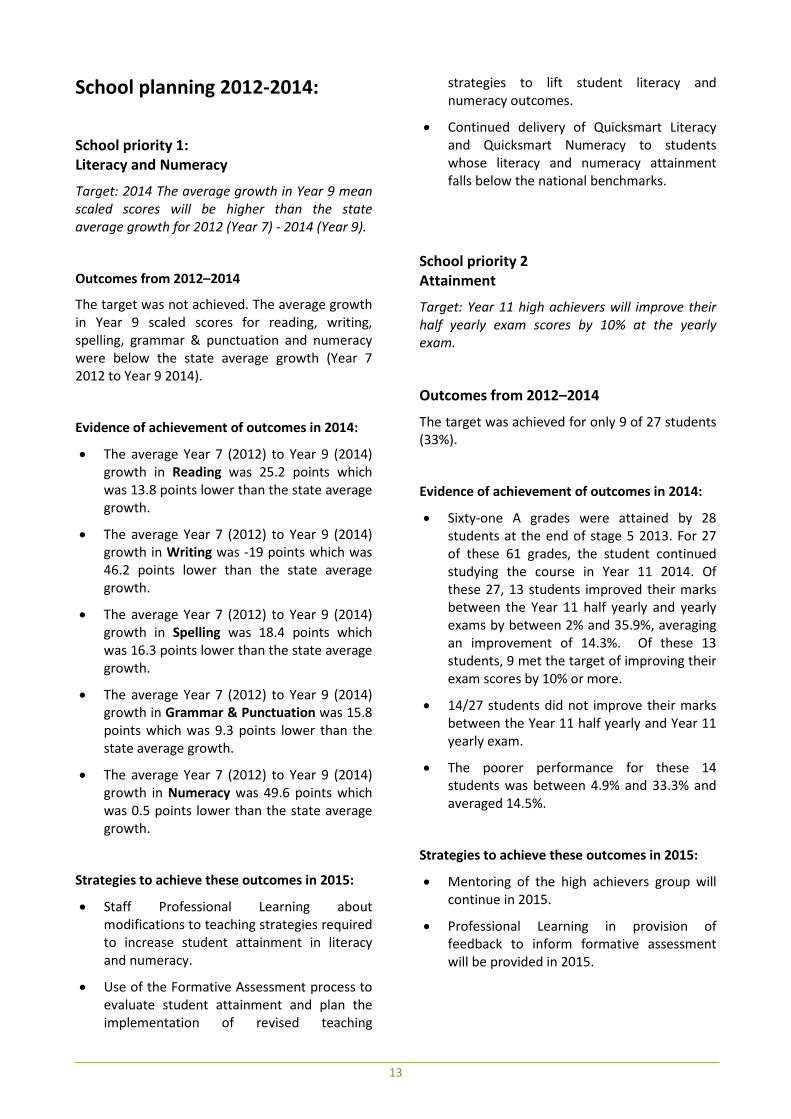
The average Numeracy score of 554.2 was 18.8 points higher than the 2010-2013 school average of 535.4 and 43.5 points below the state average of 597.7. The average Year 7 (2012) to Year 9 growth was 49.6 points which was 0.5 points lower than the state average growth.
0
10
20
30
40
50
60
5 6 7 8 9 10
Perc
enta
ge o
f stu
dent
s
Bands
Percentage in bands:Year 9 Writing
Percentage in BandsSchool Average 2011-2014SSG % in Band 2014State DEC % in Band 2014
0
5
10
15
20
25
30
35
5 6 7 8 9 10
Perc
enta
ge o
f stu
dent
s
Bands
Percentage in bands:Year 9 Spelling
Percentage in BandsSchool Average 2010-2014SSG % in Band 2014State DEC % in Band 2014
0
5
10
15
20
25
30
35
5 6 7 8 9 10
Perc
enta
ge o
f stu
dent
s
Bands
Percentage in bands:Year 9 Grammar & Punctuation
Percentage in BandsSchool Average 2010-2014SSG % in Band 2014State DEC % in Band 2014
0
10
20
30
40
50
5 6 7 8 9 10
Perc
enta
ge o
f stu
dent
s
Bands
Percentage in bands:Year 9 Numeracy
Percentage in BandsSchool Average 2010-2014SSG % in Band 2014State DEC % in Band 2014

7
Higher School Certificate (HSC)
In the Higher School Certificate, reported student performance ranges from Performance Band 1 (lowest) to Performance Band 6 (highest).
The mean score of students in each HSC course with ten or more candidates is shown in the table below. The school means are higher or the same as the school average (2010 – 2014) in each course. Means for all courses are below the state DEC means.
Higher School Certificate relative performance comparison to Year 9 NAPLAN (value-adding)
The 2014 HSC course results have been compared with students’ performances in Year 9 (2011). NAPLAN. Results for students in the lower, middle and high bands have generally not improved at a similar rate to the 2011 Year 9 NAPLAN scores.
Significant programs and initiatives
Aboriginal Education
Literacy and numeracy support was provided to 113 Years 7-10 Aboriginal students using the multilit (literacy) and quicksmart (numeracy) programs. Norta Norta individual sponsorships enabled 41 Year 11 and 12 Aboriginal students to maintain progress in their Higher School Certificate courses.
Compared with Year 7 (2012), Year 9 Aboriginal students’ growth in reading was 24.9 (9.8 below the state average growth for Aboriginal students); -51.1 for writing (56.3 below the state average growth); 11.4 for spelling (15.4 below the state average growth); 8.0 for grammar and punctuation (10.4 below the state average growth) and 57.5 for numeracy (7.0 below the state average growth).
The table below compares Aboriginal and non Aboriginal student growth in Year 7 2014 (since Year 5 2012) and in Year 9 (since Year 7 2012).
The growth in Reading in Years 7 & 9, Writing in Year 7 and Grammar & Punctuation in Years 7 and 9 exceeds non Aboriginal student growth. On average however, non Aboriginal student growth exceeds Aboriginal student growth in Year 9 but not in Year 7. Aboriginal student growth must exceed non Aboriginal student growth if the achievement gap between Aboriginal and non Aboriginal students is to be closed.
27% (31 parents) of the 113 students in Years 7 to 10 participated in Personalised Learning Plan meetings. This is 3% short of our target but is an 8% improvement compared with 2013.
Biology 64.9 62.4 70.2
English (Standard) 59.5 53.7 65.9
English (Advanced) 74.3 71.1 80.1
Mathematics General 2 58.0 58.0 65.5
Hospitality Examination 72.2 70.9 73.4
Course School 2014
School Average
State DEC 2014
Performance Band Low Middle HighSchool 2014 -5.9 -7.7 -11.5SSG Average 2014 -3.9 -8.9 -9.3
Note: By definition, the State average relative performance is zero
HSC: Relative performance from NAPLAN Year 9 (Cohort Progress)
Kempsey High School Student growth in NAPLAN mean scores
for Aboriginal and non Aboriginal students Year 7 (2014) Year 9 (2014) compared to compared to Year 5 (2012) Year 7 (2012)
Aboriginal non Aboriginal Aboriginal non
Aboriginal Reading 66.7 40.4 24.9 25.1 Writing 16.8 10.7 -51.1 -1.3 Spelling 32.7 52.0 11.4 20.9 Grammar & Punctuation 60.5 53.9 8.0 18.2
Numeracy 65.5 51.9 57.5 46.2 Average

8
Each Year 10 student had the opportunity to participate in a review meeting with the Careers Teacher. 12 Aboriginal students participated. In 25% of these interviews (3 of the 12 interviews) a parent or family member was present.
The Year 10 - 12 apparent retention rate for Aboriginal students is shown in the following table. In 2014, the apparent retention rate is 50% (apparent in the sense that it is not matching actual students but rather the numbers of students). It is subject to large percentage fluctuations when the overall year 12 enrolment of Aboriginal students is small (such as in 2011 when some students who had left in 2009 returned to the school).
Fortnightly meetings of the Aboriginal Education committee enriched the school’s partnerships with organizations supporting Aboriginal student learning. The committee led the implementation of Aboriginal programs and initiatives. These included the planning of events to engage parents and care givers in meeting to review students’ Personalised Learning Plans (PLPs), supporting the Aboriginal Leadership group by accessing the junior AECG training program; engaging Interrelate to deliver the Stand Strong Be Proud program; and organising an information session on health traineeships.
Partnerships with Mission Australia, Interrelate the AECG, Kempsey South Public School and dLab strengthened the school’s efforts to lift Aboriginal student attainment, pride and retention.
The Stand Strong Be Proud program, coordinated by Interrelate, involved separate workshops for boys and girls in Years 7 & 8 in October and Years 9 & 10 in November 2014. The program involved
Dunghutti elders, community agencies and the Aboriginal Police Liaison Officer and included sessions on domestic violence, cyber bullying, sexual health & sexual assault and drug & alcohol issues as well as cultural activities.
The Kempsey Leadership and Cultural Development program delivered through Mission Australia and sponsored by AMP once again supported several years 8 to 11 students to focus on their studies and maintain good behaviour and attendance. This partnership with Mission Australia had a significant positive impact on the progress and retention of Aboriginal students. It extended to a January holiday camp for Year 7 Aboriginal students prior to their entry to high school.
The school exchanged Aboriginal Education staff with South Kempsey Public School for short periods to enable the Gooris in Business class to be taught the Welcome to/Acknowledgement of Country by Cheryl Blair, the Aboriginal Education Assistant at Kempsey South Public School.
The 2014 NAIDOC theme was "Serving Country: Centenary & Beyond”. Former Aboriginal Education Officer, Aunty Helen Archibald returned to Kempsey High School to deliver the guest address at the NAIDOC assembly on ex-
Year Year 7 Year 8 Year 9 Year 10
Year 11
Year 12
Retention
7-12 10-12
2005 19 26 21 12 13 5 42%
2006 21 26 17 21 10 5 24%
2007 25 21 23 12 15 3 25%
2008 36 26 16 19 7 8 38%
2009 26 33 23 13 10 4 33%
2010 33 27 30 22 8 7 37% 37%
2011 29 37 30 29 18 12 57% 92%
2012 29 33 45 30 24 12 48% 55%
2013 33 32 31 39 26 14 39% 48%
2014 31 27 27 28 27 14 54% 50%

9
serviceman Mr Richard Archibald. Former student, Jayarni Roberts returned to the school to coach the Aboriginal Girls Dance Group which gave a strong performance during the assembly. Four students were presented with awards: Kyah Griffen and Phoeby Morris for their academic efforts, Bianca Roberts for her state swimming achievements and Tamara Baker for her achievements in TVET. The event concluded with lunch for the guests, staff and students at Burrunba Ngundakang (“Dream About tomorrow” – the Aboriginal Centre).
Several other Aboriginal students received recognition in 2014.
Tamara Baker and Tykea Dunn received a North Coast Aboriginal Award in Taree. Tamara Baker won nomination as the North Coast TVET Student of the Year which qualified her for the NSW TVET awards.
Lily Collins and Breanna Toby were selected to participate in the Roads and Maritime Indigenous Scholarships Wingara Mura – Bunga Barrabugu Summer Program in January 2015.
In sport, Antwinette Dunn was asked to take an assistant coach role by the PCYC for the Dunghutti under 16s league and under 14s futsal teams which played in the Indigenous tournament in Dubbo. Jake Davis was selected in the AFL Swans Academy for Indigenous Players and Reamonn Hilan and Jakum Cubby were selected in the squad.
Several diverse initiatives expanded the horizons of Aboriginal students.
Year 7 and 8 students participated in the iBelieve Program run by the University of Newcastle‘s Wollotuka Institute which empowers students to make informed choices about their future pathways. Students in Years 10 – 12 also participated in workshops run by the Wollotuka Institute and the Nura Gili Centre for Indigenous Programs at the University of NSW. The program is designed to expand students’ aspirations and encourage university as an educational goal.
Shianne Austin, Hank Barker, Tashaya Cosstick, Joshua Donovan, Margaret Drew, Kyah Griffen Jeremy Morris, Phoeby Morris and Maddison Walker formed the nucleus of Waraati, a group of Aboriginal students who continued their work as the Aboriginal Student Leadership Team. They attended district meetings, worked with other
school leadership teams and continued working towards building a Junior AECG.
A partnership with the AECG and a number of local Aboriginal organisations and leaders enabled the continuation of the Year 12 Aboriginal Students’ Graduation Dinner. The celebratory dinner reinforces the positive messages given to students by elders, parents and school staff. It was a night of positive affirmation from elders, teachers and family members, congratulating the 14 Aboriginal graduates on staying the distance to complete their HSC.
In the Gooris on the Job and Gooris in Business courses, students interviewed elders and members of the Aboriginal community and wrote personal profiles, resumes and letters of application to businesses. They learnt about and practised interview techniques and compiled stories and individual cultural research for the annual magazine publication. Students were also involved in Naidoc celebrations, school assemblies and cultural projects. The partnership with dLab involved archiving the paper copies of the Gooris On the Job program for the past 24 years into digital copies. It was very valuable in lifting the skills of Aboriginal students.

10
Multicultural Education
The school hosted the eleventh visit by students and staff from Matsushige Junior High School. A highlight was their singing of Advance Australia Fair after the school choir, Indigo Velvet sang the Japanese National Anthem. The Matsushige students danced the Awa (Friendship) dance for students in the farewell assembly.
In 2014 students in Year 9 were given the opportunity to extend their study of languages and culture through a new extension studies program. Four students studied Spanish through Southern Cross Distance Education Centre.
Several programs support the promotion of racial tolerance and cultural diversity. The seven week, 28 period Aboriginal Perspectives Reading To Learn program continued in 2014. It extended all students’ awareness of Aboriginal Australia. It complements the classroom learning experiences in English, history, geography and French language and culture.
Socio-economic background
Equity support was provided to the school because the enrolment includes a significant number of students with a low socio-economic background.
The funds enabled the school to:
• Support 12 Year 11 and 9 Year 12 students through the Enterprise Centre; and
• Continue to organize the mainstream curriculum to include comprehensive classes in years 7-10 that are organized around home classrooms and teachers teaching across the curriculum.
Both of these initiatives have consistently lifted the school’s retention rate and maintained the quality of school life for students above state averages. The Year 10-12 retention rate for students in the Enterprise Centre was 93%. The 2012 Quality of School Life (QSL) survey revealed that students in the comprehensive classes and the Enterprise Centre scored higher on the QSL than Kempsey High students generally (by 6% -11%) and scored higher than the state average. Overall, these initiatives improved the quality of teaching and learning, increased the level of students’ participation and engagement in learning and improved students’ learning outcomes.
Learning and Support
Twelve Year 7 students were assessed as below the national benchmarks in literacy and four students were below the benchmark in numeracy. Additional learning support was provided to twenty-two students using multilit literacy and/ or quicksmart numeracy programs.
Thirteen students with mild or moderate intellectual disabilities and seven students with an emotional disability received placement in two special education classes. Individual learning programs were devised for these students with emphasis placed on improving academic performance and gaining living and social skills.
Students are supported to join regular classes and most students attend the same elective courses as mainstream students. Various work education programs are offered including recycling, community service and the very successful Red Onion Café. A learning support officer assisted students in each class. One student completed their life skills stage 5 (Year 10) and one student completed their life skills Higher School Certificate.
Students with a hearing impairment, mental health problem or autism received funding through integration support. The funding received was used to employ temporary school learning support officers to assist teachers to better meet students’ needs.
Numerous meetings were held with parents and carers to monitor and evaluate the progress of students with special needs.
Each student had an education plan devised specifically for them in consultation with their parent or caregiver and area office support staff. The implementation of these plans increased students’ participation and engagement in learning, raised their learning outcomes and supported teachers in recognising and responding to students’ additional learning needs.
Various community services were accessed, particularly for students with mental health needs and for those soon to transition to work.
Six students received disability provisions for the Higher School Certificate. Disability provisions may involve a student being granted extra time to complete an exam or being able to use another student as a reader/writer.
11
School planning and evaluation 2012—2014
School evaluation processes
NSW public schools conduct evaluations to support the effective implementation of the school plan. The processes used at Kempsey High School include:
• The analysis of learning data including Year 7 and Year 9 NAPLAN data and HSC performance to determine levels and growth in student learning.
• The analysis of student enrolment, attendance and course completion information.
• The interpretation of students survey results from the Tell Them From Me student survey.
• The interpretation of teacher survey results from the Focus On Learning teacher survey.
The data previously presented in this report was presented to meetings of staff during Term 1 2015 to receive recommendations about future directions. The student and staff survey data is presented below.
1. Tell Them From Me Student Survey
274 students (64% of Year 7-11 students) participated in the Tell Them From Me student survey in 2014. 273 students (65% of years 7-11 students) completed the online survey in 2013.
The key findings from the Tell Them From Me survey fall into four areas.
Student Welfare: • 70% of students had a high sense of
belonging. This is an increase of 9% from 2013 and 7% higher than the NSW average.
• 74% of students had positive relationships. This is an increase of 1% from 2013 and 3% lower than the NSW average.
• 19% of students had moderate to high levels of anxiety. This is an increase of 2% from 2013 and 2% lower than the NSW average.
• 19% of students had moderate to high levels of depression. This is an increase of 2% from 2013 and 2% lower than the NSW average.
• 25% of surveyed students were victims of moderate to severe bullying in the previous month. This is a reduction of 7% from 2013 and 1% higher than the NSW average.
• Students rated Advocacy (having someone at school who consistently provides encouragement and can be turned to for advice) at 2.9 out of 10, a reduction of 0.1 from 2013 and 0.3 above the NSW average.
• Students rated Advocacy outside School at 5.1 out of 10, an increase of 0.5 from 2013. The NSW average is 4.5.
Attainment: • 77% of students valued school outcomes.
This is the same as 2013 and 6% higher than the NSW average.
• 37% of students had positive homework behaviours. This is an increase of 6% from 2013 and 5% lower than the NSW average.
• 52% of students are intellectually engaged. This is an increase of 5% from 2013 and 6% higher than the NSW average.
• 22% of students are interested and motivated. This is an increase of 1% from 2013 and 3% lower than the NSW average.
• 71% of students are trying hard to succeed. This is an increase of 7% from 2013 and 6% higher than the NSW average.
• 65% of students had aspirations for finishing high school, 2% higher than in 2013 and 4% lower than the NSW average.
• 28% of students planned to pursue a trade or apprenticeship program, 5% more than in 2013 and 9% higher than the NSW average.
• 41% of students had aspirations for pursuing a post-secondary education at university, 3% higher than in 2013 and 8% lower than the NSW average.
12
Behaviour: • 11% of students miss classes or days without
reason or arrive late to school or classes. This is a reduction of 11% from 2013 and 6% lower than the NSW average.
• 81% of students had positive behavior. This is an increase of 3% from 2013.
Learning: • 33% of students felt they had the required
learning skills and were challenged in their English, Maths and Science classes. The NSW average is 37%.
• 11% of students were confident of their skills but did not find classes challenging. The NSW average is 10%.
• 46% of students were not confident of their skills and found English, Maths or Science challenging. The NSW average is 44%.
• 10% of students lacked confidence in their skills and did not feel they were challenged. The NSW average is 9%.
Two areas of action in the student learning area are indicated as important for the school’s future strategic directions: increasing students’ learning skills and increasing challenge in student learning.
2. Focus on Learning Teacher Survey
The Focus on Learning Survey is a self-evaluation tool for teachers. It is based on the 'effective schools' research which has identified the eight school and classroom teaching elements most important for student achievement.
Eight teachers completed the online survey. The scores (out of 10) for each of the elements are:
1. Leadership 4.6 2. Collaboration 7.1 3. Learning Culture 7.6 4. Data Informs Practice 7.5 5. Teaching Strategies 7.4 6. Technology 6 7. Inclusive School 7.8 8. Parent Involvement 5.1 The questions in the Focus on Learning survey ask teachers to consider whether they present: 1. challenging and visible learning goals for students, and if so, whether they enable students to achieve these learning goals through; 2. planned learning opportunities which involve an intentional transfer of skills and knowledge; 3. quality feedback that guides students' effort and attention; and 4. support for students to overcome obstacles to achieving their learning goals (e.g., poor basic skills, unproductive learning strategies, low self-esteem, lack of perseverance, poor help-seeking). The teachers’ ratings were: 1. Challenging and Visible Goals 6.8; 2. Planned Learning Opportunities 7; 3. Quality Feedback 6.3; 4. Overcoming Obstacles to Learning 7.2 Detail within the teachers’ survey responses provided further data to inform the school’s strategic directions about leadership for 2015-2017 including: • providing guidance for monitoring student
progress. (3.9) • teachers sharing lesson plans and other
materials with each other. (5.4) • using computers or other interactive
technology for students to track progress towards their goals and give students immediate feedback on their learning. (5.3)
• providing regular feedback to students about their work. (3.1)
• observation of teaching. (2.5)
13
School planning 2012-2014:
School priority 1: Literacy and Numeracy
Target: 2014 The average growth in Year 9 mean scaled scores will be higher than the state average growth for 2012 (Year 7) - 2014 (Year 9).
Outcomes from 2012–2014
The target was not achieved. The average growth in Year 9 scaled scores for reading, writing, spelling, grammar & punctuation and numeracy were below the state average growth (Year 7 2012 to Year 9 2014).
Evidence of achievement of outcomes in 2014:
• The average Year 7 (2012) to Year 9 (2014) growth in Reading was 25.2 points which was 13.8 points lower than the state average growth.
• The average Year 7 (2012) to Year 9 (2014) growth in Writing was -19 points which was 46.2 points lower than the state average growth.
• The average Year 7 (2012) to Year 9 (2014) growth in Spelling was 18.4 points which was 16.3 points lower than the state average growth.
• The average Year 7 (2012) to Year 9 (2014) growth in Grammar & Punctuation was 15.8 points which was 9.3 points lower than the state average growth.
• The average Year 7 (2012) to Year 9 (2014) growth in Numeracy was 49.6 points which was 0.5 points lower than the state average growth.
Strategies to achieve these outcomes in 2015:
• Staff Professional Learning about modifications to teaching strategies required to increase student attainment in literacy and numeracy.
• Use of the Formative Assessment process to evaluate student attainment and plan the implementation of revised teaching
strategies to lift student literacy and numeracy outcomes.
• Continued delivery of Quicksmart Literacy and Quicksmart Numeracy to students whose literacy and numeracy attainment falls below the national benchmarks.
School priority 2 Attainment
Target: Year 11 high achievers will improve their half yearly exam scores by 10% at the yearly exam.
Outcomes from 2012–2014
The target was achieved for only 9 of 27 students (33%).
Evidence of achievement of outcomes in 2014:
• Sixty-one A grades were attained by 28 students at the end of stage 5 2013. For 27 of these 61 grades, the student continued studying the course in Year 11 2014. Of these 27, 13 students improved their marks between the Year 11 half yearly and yearly exams by between 2% and 35.9%, averaging an improvement of 14.3%. Of these 13 students, 9 met the target of improving their exam scores by 10% or more.
• 14/27 students did not improve their marks between the Year 11 half yearly and Year 11 yearly exam.
• The poorer performance for these 14 students was between 4.9% and 33.3% and averaged 14.5%.
Strategies to achieve these outcomes in 2015:
• Mentoring of the high achievers group will continue in 2015.
• Professional Learning in provision of feedback to inform formative assessment will be provided in 2015.
14
School priority 3 Aboriginal Education
Target: Raise the proportion of Personalised Learning Plans (PLPs) developed or revised for Aboriginal students from 17% (2013) to 30% of term 1 enrolled students.
Outcomes from 2012–2014
The target was not achieved. In term 1 2014, there were 113 Aboriginal students enrolled in Years 7-10 so the target number of PLPs to be completed was 34. 31 were completed. (27%).
Evidence of achievement of outcomes in 2014:
• 27% (31 parents) of the 113 students in Years 7-10 were consulted through Personalised Learning Plan meetings.
• Each Year 10 student had the opportunity to participate in a review meeting with the careers teacher. 12 of the 28 Year 10 Aboriginal students participated. In three of these interviews (25%) a parent or family member was present.
Strategies to achieve these outcomes in 2015:
• PLP meetings will be organized for significant school events such as the first day for Year 7, Parent –Teacher night and NAIDOC week.
• Support from community agencies will be sought to assist with parent transport.
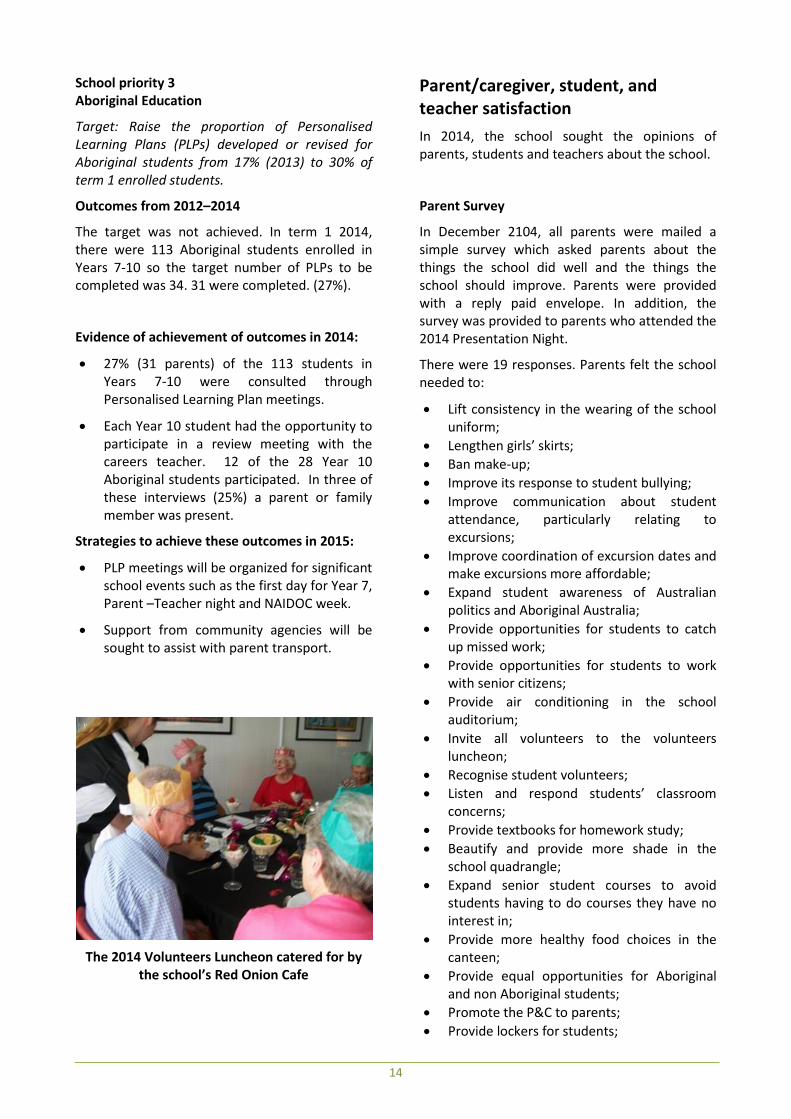
The 2014 Volunteers Luncheon catered for by
the school’s Red Onion Cafe
Parent/caregiver, student, and teacher satisfaction In 2014, the school sought the opinions of parents, students and teachers about the school.
Parent Survey
In December 2104, all parents were mailed a simple survey which asked parents about the things the school did well and the things the school should improve. Parents were provided with a reply paid envelope. In addition, the survey was provided to parents who attended the 2014 Presentation Night.
There were 19 responses. Parents felt the school needed to:
• Lift consistency in the wearing of the school uniform;
• Lengthen girls’ skirts; • Ban make-up; • Improve its response to student bullying; • Improve communication about student
attendance, particularly relating to excursions;
• Improve coordination of excursion dates and make excursions more affordable;
• Expand student awareness of Australian politics and Aboriginal Australia;
• Provide opportunities for students to catch up missed work;
• Provide opportunities for students to work with senior citizens;
• Provide air conditioning in the school auditorium;
• Invite all volunteers to the volunteers luncheon;
• Recognise student volunteers; • Listen and respond students’ classroom
concerns; • Provide textbooks for homework study; • Beautify and provide more shade in the
school quadrangle; • Expand senior student courses to avoid
students having to do courses they have no interest in;
• Provide more healthy food choices in the canteen;
• Provide equal opportunities for Aboriginal and non Aboriginal students;
• Promote the P&C to parents; • Provide lockers for students;
15
• Encourage high achieving students to excel beyond their ability;
• Group students according to ability; • Expand computer provision to extend
students; and • Open the Red Onion Café all day on
Wednesday.
Parents felt that the school did the following things well:
• Provision of opportunities for individual students;
• Promotion of the Red Onion Café to the community;
• Dedicated effort, benefits and rewards achieved from the school farm;
• Links to Learning program; • Indigo Velvet Choir; • Wonderful excursion opportunities; • Easily approachable attitudes; • eMates English extension program; • Learning Centre tutorial programs; • Legal Studies; Marine Studies, PASS courses; • Opportunities for wide experience; • A support network which encourages
students to embrace their talents; • A good student reward system; • The grading system that allows students who
want to excel to do so without distractions; • Great teaching staff; • Good parent – teacher dialogue; • The Enterprise Centre programs; • Encouraging students to wear the full school
uniform; • Being a welcoming school; • Wide experiences that prepare students for
a job.
Staff Survey
In December 2014, staff were surveyed about the things the school did well and the things the school should improve.
There were 12 responses. Staff felt the school needed to:
• Improve staff support, welfare and development;
• Bring equity to the allocation of extras, particularly where staff already provide time for initiatives to occur;
• Bring equity to and lift the transparency of the provision of funding and professional learning opportunities;
• Reduce the time for resource orders to be processed;
• Improve consistency of staff adherence to policies and procedures, particularly discipline and welfare and communication about these matters;
• Provide more opportunities for house activities, particularly in music and drama;
• Reduce recidivism for students who are suspended by providing an in-school suspension centre;
• Increase the level of SRC consultation with the student body;
• Provide more lunchtime activities; • Improve communication and collegiality
between faculties; between principal and executive; and between senior executive and staff on matters referred to them;
• Provide more opportunities to extend high achieving students and generally raise expectations;
• Reduce students’ absences from class due to other activities;
• Lift the quality of and student engagement with assessment tasks;
• Increase IT support; • Implement a workable, future focused
student device policy; • Increase the monitoring of teaching
programs by the executive; • Improve the monitoring of attendance; • Improve the school website; • Reduce the use of paper resources; • Publish a handbook for each year detailing
events; assessment tasks; homework expectations.
Staff felt that the school did the following things well:
• The wide variety of extension and extra-curricula activities and engaging programs;
• Support for students with special needs; • Quality teaching by an experienced staff; • Merit assemblies; • Quality systems and processes; • Programs and support for non-academic
students; • Year 6 to 7 transition; • Agriculture; Hospitality; sport.
16
Student Survey: Students commented on the classroom learning climate and relationships with teachers during completion of the Tell Them From Me student survey. Classroom Learning Climate: • Students rated Effective Classroom Learning
Time 6.2 out of 10, an increase of 0.1 from 2013. The NSW average is 6.3.
• Students rated Relevance of classroom instruction to their daily lives 5.8 out of 10, an increase of 0.1 from 2013. The NSW average is 5.8.
• Students rated the Rigour of classroom instruction (well-organised, clear purpose, immediate and appropriate feedback that helps them learn) as 6 out of 10, an increase of 0.1 from 2013. The NSW average is 5.8.
Relationships with Teachers: • Positive Teacher-Student Relations were
rated 5.7 out of 10, the same as in 2013; the NSW average is 5.7.
• Disciplinary Climate of the Classroom was rated 5.8 out of 10, 0.1 higher than in 2013; the NSW average is 5.6.
• Teachers' Expectations for Academic Success was rated 7 out of 10, a reduction of 0.1 since 2013; the NSW average is 7.
Future Directions 2015-2017 School Plan NSW DEC is implementing a new school planning process for 2015-17. The new plan will be published on the school’s website from the 1st. May 2015.
School Planning Process
The Kempsey High School Plan 2015-2017 involved collaboration with parents, students and school staff. Parents were invited to complete an open questionnaire distributed at the 2014 Presentation Night and by mail with a reply paid post facility.
257 students completed the Tell Them From Me survey during 2014.
The parent feedback and student survey results were shared with staff over a series of meetings during term 1 2015 along with data about student attendance, engagement, attainment and retention.
A draft of the plan was then provided for further consultation for the Student Council, Parents & Citizens Association, the Aboriginal Education Committee and the school staff.
Strategic Directions:
1. Student learning is maximized through use of formative assessment.
This first strategic direction seeks to put in place a key element of quality teaching which evidence shows will have the biggest impact on improving student learning outcomes.
This element involves teachers and students providing feedback to each other about students’ learning during (rather than at the end of) teaching and learning activities and using this feedback to improve teaching and learning. It provides a process to review diverse student needs, increase expectations, produce a more differentiated curriculum and deliver it with high levels of planning, routines, management and explicit teaching.
17
2. High quality teaching is delivered in a supportive learning environment.
This second strategic direction recognises that the most important factor that the school can influence to maximise student learning is the quality of the teaching. It strives to embed professional learning with colleagues into the day-to-day work of all staff. It uses structured, challenging, stimulating and evaluated teaching – learning programs. It seeks to make available quality teaching resources including technology in safe, aesthetically pleasing learning spaces.
3. Leaders become better Instructional Leaders
This third strategic direction seeks to build the Instructional Leadership capacity of the school’s leaders. Instructional Leadership refers to the actions which leaders at all levels take to bring about improvements in student learning. It encompasses staff professional learning, supportive and collaborative relationships and structures, team work, professional reflection and feedback. It aligns with and complements the other two strategic directions. Indeed, the other two strategic directions rely on the conscious instructional leadership actions of the school’s leaders.
About this report In preparing this report, the self-evaluation committee has gathered information from evaluations conducted during the year and analysed other information about the school's practices and student learning outcomes. The self-evaluation committee and school planning committee have determined targets for the school's future development.
Mr Ray Davis, President of KHS P&C Association
Mr Mick Eller, Principal, Kempsey High School
Mrs Linette Baker, Deputy Principal, Kempsey High School
Mrs Denese Kennedy, Deputy Principal, Kempsey High School.
School contact information
Kempsey High School 13 Broughton Street, Kempsey NSW 2440 (PO Box 3268, West Kempsey NSW 2440) Ph: (02) 6562 6166 Fax: (02) 6562 8570 Email: [email protected] Web: www.kempsey-h.schools.nsw.edu.au School Code: 8123
Parents can find more information about Annual School Reports, how to interpret information in the report and have the opportunity to provide feedback about the report at:
http://www.schools.nsw.edu.au/learning/emsad/asr/index.php