keith hoggart - unica-network.eu impact of tuition... · fees evolution for eu students in england...
TRANSCRIPT

Keith Hoggart
“The Social Impact
of Tuition Fees”

Fees Evolution for EU
Students in England
1988 £1000 pay up front
means tested
under £23k pay 0%
over £35k pay 100%
2006 ≤£3000 pay on graduation
written off in 25 years
grants for poorest
2012 ≤£9000 pay if earn £21k/year
national + local bursaries

UK Year-on-Year % Change in UG Acceptances by Institution
-10
-5
0
5
10
15
2007 2008 2009 2010 2011 2012
England
Northern Ireland
Scotland
Wales

% Change in Full-Time UG Starters by Fee Level (£6000 - £9000)
-16
-14
-12
-10
-8
-6
-4
-2
0
£6000 - £7499 £7500 - £7999 £8000 - £8499 £8500 - £8749 £8750 - £9000
Series 1

UK Year-on-Year % Change in UG Applications by Status
-15
-10
-5
0
5
10
15
20
25
30
35
40
2007 2008 2009 2010 2011 2012
Accepted
Unplaced

King’s Student Numbers (2006=100)
0
20
40
60
80
100
120
140
160
180
2007 2008 2009 2010 2011 2012
King's UG
King's Master's
King's PhD
UK UG
UK Master's
UK PhD

UK Year-on-Year % Change in UG Acceptances by Home Area
-8
-6
-4
-2
0
2
4
6
8
10
12
2007 2008 2009 2010 2011 2012
Most Deprived
Lower end
Middle range
Upper end
Most Advantaged

UK Year-on-Year % Change in UG Acceptances by School (UK 19 ≥)
-8
-6
-4
-2
0
2
4
6
8
10
12
14
2007 2008 2009 2010 2011 2012
State
Private

% King’s First Degree Entrants Benchmarks and Attainment
King’s Benchmark Location specific
From state schools
2002/03 70.2 80.7 75.6
2011/12 71.3 79.1 76.1
From Lower social classes (NS-SEC #4 - #7)
2002/03 22.7 23.0 22.0
2011/12 22.6 21.3 21.1
From Low participation neighbourhoods
2002/03 7.9 10.8 8.1
2011/12 4.2 6.3 4.7

UK Year-on-Year % Change in UG Applications by Age
-15
-10
-5
0
5
10
15
20
25
30
2007 2008 2009 2010 2011 2012
Under 18
18
19
20
21-24
25-39
40 or more

UK Part-Time UG Student Starters
0
50000
100000
150000
200000
250000
300000
2008 2009 2010 2011 2012

UK Year-on-Year % Change in UG Acceptances by Gender
-10
-5
0
5
10
15
2007 2008 2009 2010 2011 2012
Women
Men

UK Year-on-Year % UG Acceptances Change by Ethnicity (UK residents)
-10
-5
0
5
10
15
20
25
30
2007 2008 2009 2010 2011 2012
White
Black African
Indian
Pakistani
Black Caribbean
Bangladeshi
Mixed White-Asian
Mixed White-Caribbean
Chinese

UK Year-on-Year % Change in UG Acceptances by Tariff
-15
-10
-5
0
5
10
15
2007 2008 2009 2010 2011 2012
High
Medium
Low

UK Year-on-Year % Change in UG Acceptances for High Tariff HEIs
-15
-10
-5
0
5
10
2007 2008 2009 2010 2011 2012 State School
Private School

UK Year-on-Year % Change in UG Acceptances for Low Tariff HEIs
-30
-25
-20
-15
-10
-5
0
5
10
15
20
2007 2008 2009 2010 2011 2012 State School
Private School


UK UG Applications by Subject 2012-13
-20
-15
-10
-5
0
5
10
Clinical subjects
STEM subjects
Modern foreign
languages
Arts, Humanities,
Social Science
TOTAL Accepted 2012
Submitted 2013

King’s College London % Revenues from Largest Sources
0
5
10
15
20
25
30
35
2007/08 2010/11 2011/12 2012/13 2013/14
Research grants
HEFCE T
HEFCE R
EU student fees
Non-EU student fees
NHS direct payments
NHS teaching receipts

Changing Shares of International Student Market 2000 & 2011
2000 2011
• USA 22.9 16.5
• UK 10.8 13.0
• Germany 9.0 6.3
• France 6.6 6.2
• Australia 5.1 6.1
• Canada 4.6 4.7
Source : OECD (2013)

UK Year-on-Year % Change in UG Acceptances By Domicile
-15
-10
-5
0
5
10
15
2007 2008 2009 2010 2011 2012
UK
Other EU
Non-EU
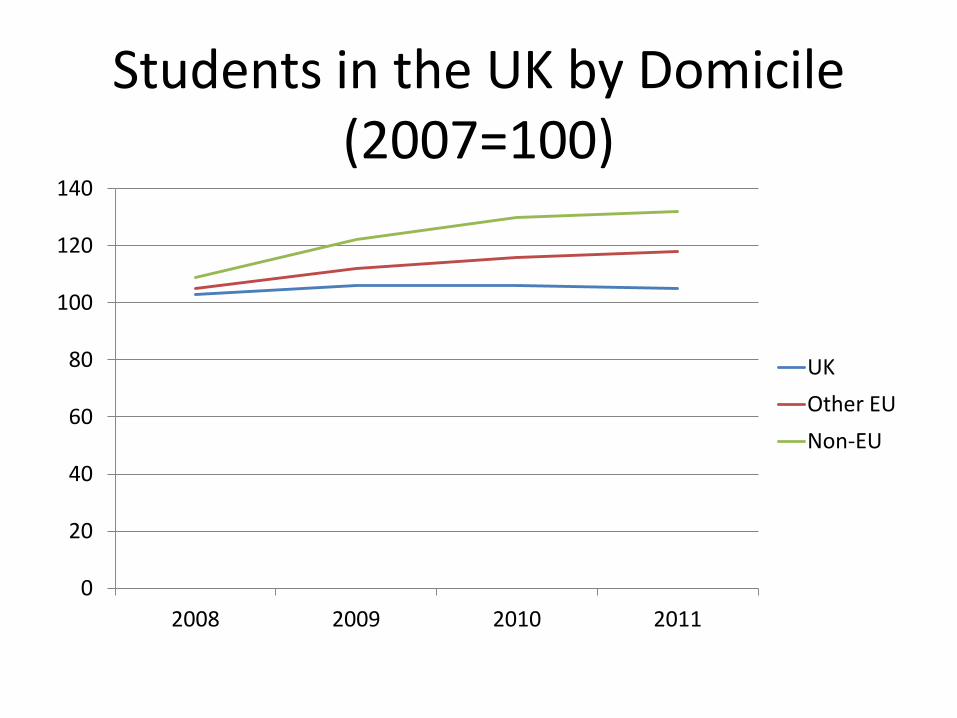
Students in the UK by Domicile (2007=100)
0
20
40
60
80
100
120
140
2008 2009 2010 2011
UK
Other EU
Non-EU

King’s International Students by Level (2007=100)
0
20
40
60
80
100
120
140
160
180
200
2008 2009 2010 2011 2012
EU UG
Non-EU UG
EU Master's
Non-EU Master's
EU PhD
Non-EU PhD