&kdswhu /lqhdudqg4xdgudwlf)xqfwlrqv...section 2.1: properties of linear functions and linear...
TRANSCRIPT

146 Copyright © 2015 Pearson Education, Inc.
Chapter 2 Linear and Quadratic Functions
Section 2.1
1. From the equation 2 3y x= − , we see that the y-intercept is 3− . Thus, the point ( )0, 3− is on the graph. We can obtain a second point by choosing a value for x and finding the corresponding value for y. Let 1x = , then ( )2 1 3 1y = − = − . Thus,
the point ( )1, 1− is also on the graph. Plotting the two points and connecting with a line yields the graph below.
(0,−3)
(1,−1)
2. 2 1
2 1
3 5 2 21 2 3 3
y ymx x
− − −= = = =− − − −
3. 2
2
(2) 3(2) 2 10(4) 3(4) 2 46
ff
= − == − =
(4) (2) 46 10 36 184 2 4 2 2
y f fx
Δ − −= = = =Δ − −
4. 60 900 15 285075 900 2850
75 375050
x xx
xx
− = − +− =
==
The solution set is {50}.
5. ( ) ( )22 2 4 4 4 0f − = − − = − =
6. True
7. slope; y-intercept
8. 4; 3−
9. positive
10. True
11. False. If x increases by 3, then y increases by 2.
12. False. The y-intercept is 8. The average rate of change is 2 (the slope).
13. ( ) 2 3f x x= + a. Slope = 2; y-intercept = 3 b. Plot the point (0, 3). Use the slope to find
an additional point by moving 1 unit to the right and 2 units up.
c. average rate of change = 2 d. increasing
14. ( ) 5 4g x x= − a. Slope = 5; y-intercept = 4−
b. Plot the point (0, 4)− . Use the slope to find an additional point by moving 1 unit to the right and 5 units up.
c. average rate of change = 5 d. increasing
Full file at https://testbankuniv.eu/Precalculus-Concepts-Through-Functions-A-Right-Triangle-Approach-to-Trigonometry-3rd-Edition-Sullivan-Solutions-Manual
Full file at https://testbankuniv.eu/Precalculus-Concepts-Through-Functions-A-Right-Triangle-Approach-to-Trigonometry-3rd-Edition-Sullivan-Solutions-Manual
Section 2.1: Properties of Linear Functions and Linear Models
147 Copyright © 2015 Pearson Education, Inc.
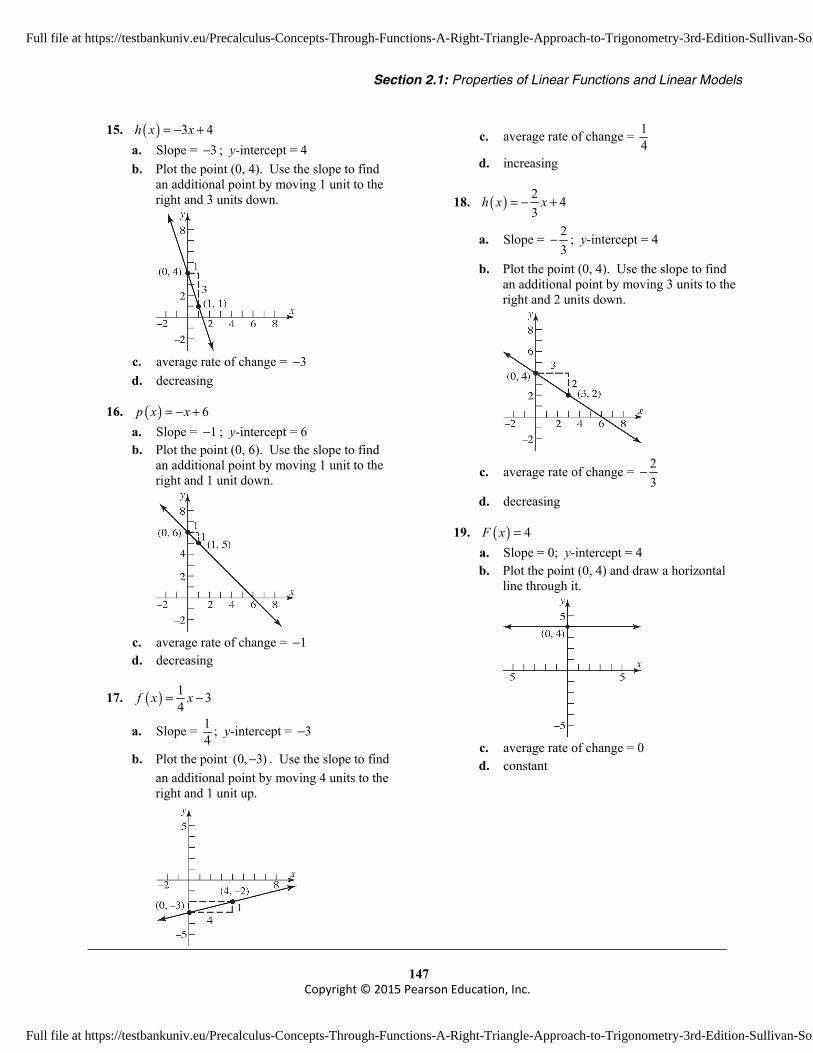
15. ( ) 3 4h x x= − + a. Slope = 3− ; y-intercept = 4 b. Plot the point (0, 4). Use the slope to find
an additional point by moving 1 unit to the right and 3 units down.
c. average rate of change = 3− d. decreasing
16. ( ) 6p x x= − + a. Slope = 1− ; y-intercept = 6 b. Plot the point (0, 6). Use the slope to find
an additional point by moving 1 unit to the right and 1 unit down.
c. average rate of change = 1− d. decreasing
17. ( ) 1 34
f x x= −
a. Slope = 14
; y-intercept = 3−
b. Plot the point (0, 3)− . Use the slope to find an additional point by moving 4 units to the right and 1 unit up.
c. average rate of change = 14
d. increasing
18. ( ) 2 43
h x x= − +
a. Slope = 23
− ; y-intercept = 4
b. Plot the point (0, 4). Use the slope to find an additional point by moving 3 units to the right and 2 units down.
c. average rate of change = 23
−
d. decreasing
19. ( ) 4F x = a. Slope = 0; y-intercept = 4 b. Plot the point (0, 4) and draw a horizontal
line through it.
c. average rate of change = 0 d. constant
Full file at https://testbankuniv.eu/Precalculus-Concepts-Through-Functions-A-Right-Triangle-Approach-to-Trigonometry-3rd-Edition-Sullivan-Solutions-Manual
Full file at https://testbankuniv.eu/Precalculus-Concepts-Through-Functions-A-Right-Triangle-Approach-to-Trigonometry-3rd-Edition-Sullivan-Solutions-Manual

Chapter 2: Linear and Quadratic Functions
148
Copyright © 2015 Pearson Education, Inc.
20. ( ) 2G x = − a. Slope = 0; y-intercept = 2− b. Plot the point (0, 2)− and draw a horizontal
line through it.
c. average rate of change = 0 d. constant
21. ( ) 2 8g x x= − a. zero: 0 2 8
4x
x= −=
: y-intercept = 8−
b. Plot the points (4,0), (0, 8)− .
22. ( ) 3 12g x x= + a. zero: 0 3 12
4x
x= += −
: y-intercept = 12
b. Plot the points ( 4,0), (0,12)− .
23. ( ) 5 10f x x= − + a. zero: 0 5 10
2x
x= − +=
: y-intercept = 10
b. Plot the points 1 unit to the right and 5 units down.
24. ( ) 6 12f x x= − + a. zero: 0 6 12
2x
x= − +=
: y-intercept = 12
b. Plot the points (2,0), (0,12) .
25. ( ) 1 42
H x x= − +
a. zero: 10 42
8
x
x
= − +
=
: y-intercept = 4
b. Plot the points (8,0), (0,4) .
Full file at https://testbankuniv.eu/Precalculus-Concepts-Through-Functions-A-Right-Triangle-Approach-to-Trigonometry-3rd-Edition-Sullivan-Solutions-Manual
Full file at https://testbankuniv.eu/Precalculus-Concepts-Through-Functions-A-Right-Triangle-Approach-to-Trigonometry-3rd-Edition-Sullivan-Solutions-Manual

Section 2.1: Properties of Linear Functions and Linear Models
149 Copyright © 2015 Pearson Education, Inc.
26. ( ) 1 43
G x x= −
a. zero: 10 4312
x
x
= −
=
: y-intercept = 4−
b. Plot the points (12,0), (0, 4)− .
27. x y Avg. rate of change = yx
ΔΔ
2− 4
1− 1 ( )1 4 3 3
1 2 1− −= = −
− − −
0 2− ( )
2 1 3 30 1 1− − −= = −− −
1 5− ( )5 2 3 3
1 0 1− − − −= = −
−
2 8− ( )8 5 3 3
2 1 1− − − −= = −
−
Since the average rate of change is constant at 3− , this is a linear function with slope = –3.
The y-intercept is (0, 2)− , so the equation of the line is 3 2y x= − − .
28. x y Avg. rate of change = yx
ΔΔ
2− 14
1− 12
( )
( )1 1 12 4 4 1
1 2 1 4−
= =− − −
0 1 ( )
( )1 12 21 1
0 1 1 2−
= =− −
1 2 2 4 Since the average rate of change is not constant,
this is not a linear function.
29. x y Avg. rate of change = yx
ΔΔ
2− 8−
1− 3− ( )( )
3 8 5 51 2 1
− − −= =
− − −
0 0 ( )( )
0 3 3 30 1 1
− −= =
− −
1 1 2 0 Since the average rate of change is not constant,
this is not a linear function.
30. x y Avg. rate of change = yx
ΔΔ
2− 4−
1− 0 0 ( 4) 4 41 ( 2) 1− − = =
− − −
0 4 4 0 4 4
0 ( 1) 1− = =
− −
1 8 8 4 4 41 0 1
− = =−
2 12 12 8 4 42 1 1
− = =−
Since the average rate of change is constant at 4, this is a linear function with slope = 4. The y-intercept is (0, 4) , so the equation of the line is
4 4y x= + .
31. x y Avg. rate of change = yx
ΔΔ
2− 26−
1− 4− ( )( )
4 26 22 221 2 1
− − −= =
− − −
0 2 ( )( )
2 4 6 60 1 1
− −= =
− −
1 –2 2 –10 Since the average rate of change is not constant,
this is not a linear function.
Full file at https://testbankuniv.eu/Precalculus-Concepts-Through-Functions-A-Right-Triangle-Approach-to-Trigonometry-3rd-Edition-Sullivan-Solutions-Manual
Full file at https://testbankuniv.eu/Precalculus-Concepts-Through-Functions-A-Right-Triangle-Approach-to-Trigonometry-3rd-Edition-Sullivan-Solutions-Manual

Chapter 2: Linear and Quadratic Functions
150
Copyright © 2015 Pearson Education, Inc.
32. x y Avg. rate of change = yx
ΔΔ
2− 4−
1− 3.5− 3.5 ( 4) 0.5 0.51 ( 2) 1
− − − = =− − −
0 3− 3 ( 3.5) 0.5 0.50 ( 1) 1
− − − = =− −
1 2.5− 2.5 ( 3) 0.5 0.51 0 1
− − − = =−
2 2− 2 ( 2.5) 0.5 0.52 1 1
− − − = =−
Since the average rate of change is constant at 0.5, this is a linear function with slope = 0.5. The y-intercept is (0, 3)− , so the equation of the line is 0.5 3y x= − .
33. x y Avg. rate of change = yx
ΔΔ
2− 8
1− 8 8 8 0 0
1 ( 2) 1− = =
− − −
0 8 8 8 0 0
0 ( 1) 1− = =
− −
1 8 8 8 0 01 0 1
− = =−
2 8 8 8 0 02 1 1
− = =−
Since the average rate of change is constant at 0, this is a linear function with slope = 0. The y-intercept is (0, 8) , so the equation of the line is
0 8y x= + or 8y = .
34. x y Avg. rate of change = yx
ΔΔ
2− 0
1− 1 1 0 1 1
1 ( 2) 1− = =
− − −
0 4 4 1 3 3
0 ( 1) 1− = =
− −
1 9 2 16 Since the average rate of change is not constant,
this is not a linear function.
35. ( ) ( )4 1; 2 5f x x g x x= − = − + a. ( ) 0
4 1 014
f xx
x
=− =
=
b. ( ) 04 1 0
14
f xx
x
>− >
>
The solution set is 14
x x >
or 1 , 4
∞
.
c. ( ) ( )4 1 2 5
6 61
f x g xx x
xx
=− = − +
==
d. ( ) ( )4 1 2 5
6 61
f x g xx x
xx
≤− ≤ − +
≤≤
The solution set is { }1x x ≤ or ( ], 1−∞ .
e.
36. ( ) ( )3 5; 2 15f x x g x x= + = − + a. ( ) 0
3 5 053
f xx
x
=+ =
= −
b. ( ) 03 5 0
53
f xx
x
<+ <
< −
The solution set is 53
x x < −
or 5,3
−∞ −
.
Full file at https://testbankuniv.eu/Precalculus-Concepts-Through-Functions-A-Right-Triangle-Approach-to-Trigonometry-3rd-Edition-Sullivan-Solutions-Manual
Full file at https://testbankuniv.eu/Precalculus-Concepts-Through-Functions-A-Right-Triangle-Approach-to-Trigonometry-3rd-Edition-Sullivan-Solutions-Manual

Section 2.1: Properties of Linear Functions and Linear Models
151 Copyright © 2015 Pearson Education, Inc.
c. ( ) ( )3 5 2 15
5 102
f x g xx x
xx
=+ = − +
==
d. ( ) ( )3 5 2 15
5 102
f x g xx x
xx
≥+ ≥ − +
≥≥
The solution set is { }2x x ≥ or [ )2, ∞ .
e.
37. a. The point (40, 50) is on the graph of ( )y f x= , so the solution to ( ) 50f x = is
40x = . b. The point (88, 80) is on the graph of
( )y f x= , so the solution to ( ) 80f x = is 88x = .
c. The point ( 40, 0)− is on the graph of ( )y f x= , so the solution to ( ) 0f x = is 40x = − .
d. The y-coordinates of the graph of ( )y f x= are above 50 when the x-coordinates are larger than 40. Thus, the solution to ( ) 50f x > is
{ }40x x > or (40, )∞ .
e. The y-coordinates of the graph of ( )y f x= are below 80 when the x-coordinates are smaller than 88. Thus, the solution to
( ) 80f x ≤ is { }88x x ≤ or ( , 88]−∞ .
f. The y-coordinates of the graph of ( )y f x= are between 0 and 80 when the x-coordinates are between 40− and 88. Thus, the solution to 0 ( ) 80f x< < is { }40 88x x− < < or
( 40, 88)− .
38. a. The point (5, 20) is on the graph of ( )y g x= , so the solution to ( ) 20g x = is 5x = .
b. The point ( 15, 60)− is on the graph of ( )y g x= , so the solution to ( ) 60g x = is 15x = − .
c. The point (15, 0) is on the graph of ( )y g x= , so the solution to ( ) 0g x = is 15x = .
d. The y-coordinates of the graph of ( )y g x= are above 20 when the x-coordinates are smaller than 5. Thus, the solution to ( ) 20g x > is
{ }5x x < or ( , 5)−∞ .
e. The y-coordinates of the graph of ( )y f x= are below 60 when the x-coordinates are larger than 15− . Thus, the solution to ( ) 60g x ≤ is
{ }15x x ≥ − or [ 15, )− ∞ .
f. The y-coordinates of the graph of ( )y f x= are between 0 and 60 when the x-coordinates are between 15− and 15. Thus, the solution to 0 ( ) 60f x< < is
{ }15 15x x− < < or ( 15, 15)− .
39. a. ( ) ( )f x g x= when their graphs intersect. Thus, 4x = − .
b. ( ) ( )f x g x≤ when the graph of f is above the graph of g. Thus, the solution is { }4x x < − or ( , 4)−∞ − .
40. a. ( ) ( )f x g x= when their graphs intersect. Thus, 2x = .
b. ( ) ( )f x g x≤ when the graph of f is below or intersects the graph of g. Thus, the solution is { }2x x ≤ or ( ], 2−∞ .
41. a. ( ) ( )f x g x= when their graphs intersect. Thus, 6x = − .
b. ( ) ( ) ( )g x f x h x≤ < when the graph of f is above or intersects the graph of g and below the graph of h. Thus, the solution is { }6 5x x− ≤ < or [ )6, 5− .
Full file at https://testbankuniv.eu/Precalculus-Concepts-Through-Functions-A-Right-Triangle-Approach-to-Trigonometry-3rd-Edition-Sullivan-Solutions-Manual
Full file at https://testbankuniv.eu/Precalculus-Concepts-Through-Functions-A-Right-Triangle-Approach-to-Trigonometry-3rd-Edition-Sullivan-Solutions-Manual

Chapter 2: Linear and Quadratic Functions
152
Copyright © 2015 Pearson Education, Inc.
42. a. ( ) ( )f x g x= when their graphs intersect. Thus, 7x = .
b. ( ) ( ) ( )g x f x h x≤ < when the graph of f is above or intersects the graph of g and below the graph of h. Thus, the solution is { }4 7x x− ≤ < or [ )4, 7− .
43. ( ) 0.35 45C x x= + a. ( ) ( )40 0.35 40 45 $59C = + ≈ .
b. Solve ( ) 0.25 35 80C x x= + = 0.35 45 108
0.35 6363 180 miles
0.35
xx
x
+ ==
= =
c. Solve ( ) 0.35 45 150C x x= + ≤ 0.35 45 150
0.35 105105 300 miles0.35
xx
x
+ ≤≤
≤ =
d. The number of mile driven cannot be negative, so the implied domain for C is { | 0}x x ≥ or [0, )∞ .
e. The cost of renting the moving truck for a day increases $0.35 for each mile driven, or there is a charge of $0.35 per mile to rent the truck in addition to a fixed charge of $45.
f. It costs $45 to rent the moving truck if 0 miles are driven, or there is a fixed charge of $45 to rent the truck in addition to a charge that depends on mileage.
44. ( ) 2.06 1.39C x x= +
a. ( ) ( )50 2.06 50 1.39 $104.39C = + = .
b. Solve ( ) 2.06 1.39 133.23C x x= + = 2.06 1.39 133.23
2.06 131.84131.84 64 minutes
2.06
xx
x
+ ==
= =
c. Solve ( ) 2.06 1.39 100C x x= + ≤ 2.06 1.39 100
2.06 98.6198.61 47 minutes2.06
xx
x
+ ≤≤
≤ ≈
d. The number of minutes cannot be negative, so 0x ≥ . If there are 30 days in the month, then the number of minutes can be at most 30 24 60 43, 200⋅ ⋅ = . Thus, the implied domain for C is { | 0 43, 200}x x≤ ≤ or [0, 43200] .
e. The monthly cost of the plan increases $2.06 for each minute used, or there is a charge of $2.06 per minute to use the phone in addition to a fixed charge of $1.39.
f. It costs $1.39 per month for the plan if 0 minutes are used, or there is a fixed charge of $1.39 per month for the plan in addition to a charge that depends on the number of minutes used.
45. ( ) ( )600 50 ; 1200 25S p p D p p= − + = −
a. Solve ( ) ( )S p D p= . 600 50 1200 25
75 18001800 24
75
p pp
p
− + = −=
= =
( ) ( )24 600 50 24 600S = − + = Thus, the equilibrium price is $24, and the equilibrium quantity is 600 T-shirts.
b. Solve ( ) ( )D p S p> . 1200 25 600 50
1800 751800
7524
p pp
p
p
− > − +>
>
>
The demand will exceed supply when the price is less than $24 (but still greater than $0). That is, $0 $24p< < .
c. The price will eventually be increased.
46. ( ) ( )2000 3000 ; 10000 1000S p p D p p= − + = −
a. Solve ( ) ( )S p D p= . 2000 3000 10000 1000
4000 1200012000 34000
p pp
p
− + = −=
= =
( ) ( )3 2000 3000 3 7000S = − + = Thus, the equilibrium price is $3, and the equilibrium quantity is 7000 hot dogs.
Full file at https://testbankuniv.eu/Precalculus-Concepts-Through-Functions-A-Right-Triangle-Approach-to-Trigonometry-3rd-Edition-Sullivan-Solutions-Manual
Full file at https://testbankuniv.eu/Precalculus-Concepts-Through-Functions-A-Right-Triangle-Approach-to-Trigonometry-3rd-Edition-Sullivan-Solutions-Manual

Section 2.1: Properties of Linear Functions and Linear Models
153 Copyright © 2015 Pearson Education, Inc.
b. Solve ( ) ( )D p S p< . 10000 1000 2000 3000
12000 4000120004000
3
p pp
p
p
− < − +<
<
<
The demand will be less than the supply when the price is greater than $3.
c. The price will eventually be decreased.
47. a. We are told that the tax function T is for adjusted gross incomes x between $8,925 and $36,250, inclusive. Thus, the domain is { } 8,925 36, 250x x≤ ≤ or [ ]8925, 36250 .
b. ( ) ( )20,000 0.15 20,000 8925 892.52553.75
T = − +=
If a single filer’s adjusted gross income is $20,000, then his or her tax bill will be $2553.75.
c. The independent variable is adjusted gross income, x. The dependent variable is the tax bill, T.
d. Evaluate T at 8925, 20000, and 36250x = . ( ) ( )8925 0.15 8925 8925 892.5
892.5T = − +
=
( ) ( )20,000 0.15 20,000 8925 892.52553.75
T = − +=
( ) ( )36,250 0.15 36250 8925 892.54991.25
T = − +=
Thus, the points ( )8925,892.5 ,
( )20000, 2553.75 , and ( )36250, 4991.25 are on the graph.
e. We must solve ( ) 3693.75T x = .
( )0.15 8925 892.5 3693.750.15 1338.75 892.5 3693.75
0.15 446.25 3693.750.15 4140
27600
xx
xxx
− + =− + =
− ===
A single filer with an adjusted gross income of $27,600 will have a tax bill of $3693.75.
f. For each additional dollar of taxable income between $8925 and $36,250, the tax bill of a single person in 2013 increased by $0.15.
48. a. The independent variable is payroll, p. The payroll tax only applies if the payroll exceeds $178 million. Thus, the domain of T is { }| 178p p > or (178, )∞ .
b. ( ) ( )222.5 0.425 222.5 178 18.9125T = − = The luxury tax for the New York Yankees was $18.9125 million.
c. Evaluate T at 178p = , 222.5, and 300 million.
( ) ( )178 0.425 178 178 0T = − = million
( ) ( )222.5 0.425 222.5 178
18.9125T = −
= million ( ) ( )300 0.425 300 178 51.85T = − = million
Thus, the points ( )178 million, 0 million ,
( )222.5 million, 18.9125 million , and
( )300 million, 51.85 million are on the graph.
d. We must solve ( ) 27.2T p = .
( )0.425 178 27.20.425 75.65 27.2
0.425 102.85242
pp
pp
− =− =
==
Full file at https://testbankuniv.eu/Precalculus-Concepts-Through-Functions-A-Right-Triangle-Approach-to-Trigonometry-3rd-Edition-Sullivan-Solutions-Manual
Full file at https://testbankuniv.eu/Precalculus-Concepts-Through-Functions-A-Right-Triangle-Approach-to-Trigonometry-3rd-Edition-Sullivan-Solutions-Manual

Chapter 2: Linear and Quadratic Functions
154
Copyright © 2015 Pearson Education, Inc.
If the luxury tax is $27.2 million, then the payroll of the team is $242 million.
e. For each additional million dollars of payroll in excess of $178 million in 2011, the luxury tax of a team increased by $0.425 million.
49. ( ) ( )8 ; 4.5 17,500R x x C x x= = + a. Solve ( ) ( )R x C x= .
8 4.5 17,5003.5 17,500
5000
x xxx
= +==
The break-even point occurs when the company sells 5000 units.
b. Solve ( ) ( )R x C x> 8 4.5 17,500
3.5 17,5005000
x xxx
> +>>
The company makes a profit if it sells more than 5000 units.
50. ( ) 12 ; ( ) 10 15,000R x x C x x= = + a. Solve ( ) ( )R x C x=
12 10 15,0002 15,000
7500
x xxx
= +==
The break-even point occurs when the company sells 7500 units.
b. Solve ( ) ( )R x C x> 12 10 15,0002 15,000
7500
x xxx
> +>>
The company makes a profit if it sells more than 7500 units.
51. a. Consider the data points ( , )x y , where x = the age in years of the computer and y = the value in dollars of the computer. So we have the points (0,3000) and (3,0) . The slope formula yields:
0 3000 3000 10003 0 3
ymx
Δ − −= = = = −Δ −
The y-intercept is (0,3000) , so 3000b = . Therefore, the linear function is
( ) 1000 3000V x mx b x= + = − + .
b. The age of the computer cannot be negative, and the book value of the computer will be
$0 after 3 years. Thus, the implied domain for V is { | 0 3}x x≤ ≤ or [0, 3].
c. The graph of ( ) 1000 3000V x x= − +
d. (2) 1000(2) 3000 1000V = − + =
The computer’s book value after 2 years will be $1000.
e. Solve ( ) 2000V x = 1000 3000 2000
1000 10001
xxx
− + =− = −
=
The computer will have a book value of $2000 after 1 year.
52. a. Consider the data points ( ),x y , where x = the age in years of the machine and y = the value in dollars of the machine. So we have the points ( )0,120000 and ( )10,0 . The slope formula yields:
0 120000 120000 1200010 0 10
ymx
Δ − −= = = = −Δ −
The y-intercept is ( )0,120000 , so 120,000b = .
Therefore, the linear function is ( ) 12,000 120,000V x mx b x= + = − + .
b. The age of the machine cannot be negative, and the book value of the machine will be $0 after 10 years. Thus, the implied domain for V is { | 0 10}x x≤ ≤ or [0, 10].
c. The graph of ( ) 12,000 120,000V x x= − +
Full file at https://testbankuniv.eu/Precalculus-Concepts-Through-Functions-A-Right-Triangle-Approach-to-Trigonometry-3rd-Edition-Sullivan-Solutions-Manual
Full file at https://testbankuniv.eu/Precalculus-Concepts-Through-Functions-A-Right-Triangle-Approach-to-Trigonometry-3rd-Edition-Sullivan-Solutions-Manual

Section 2.1: Properties of Linear Functions and Linear Models
155 Copyright © 2015 Pearson Education, Inc.
d. ( ) ( )4 12000 4 120000 72000V = − + = The machine’s value after 4 years is given by $72,000.
e. Solve ( ) 72000V x = . 12000 120000 72000
12000 480004
xxx
− + =− = −
=
The machine will be worth $72,000 after 4 years.
53. a. Let x = the number of bicycles manufactured. We can use the cost function ( )C x mx b= + , with m = 90 and b = 1800. Therefore
( ) 90 1800C x x= +
b. The graph of ( ) 90 1800C x x= +
c. The cost of manufacturing 14 bicycles is
given by ( ) ( )14 90 14 1800 $3060C = + = .
d. Solve ( ) 90 1800 3780C x x= + = 90 1800 3780
90 198022
xxx
+ ===
So 22 bicycles could be manufactured for $3780.
54. a. The new daily fixed cost is 1001800 $180520
+ =
b. Let x = the number of bicycles manufactured. We can use the cost function
( )C x mx b= + , with m = 90 and b = 1805.
Therefore ( ) 90 1805C x x= +
c. The graph of ( ) 90 1805C x x= +
d. The cost of manufacturing 14 bicycles is
given by ( ) ( )14 90 14 1805 $3065C = + = .
e. Solve ( ) 90 1805 3780C x x= + = 90 1805 3780
90 197521.94
xxx
+ ==≈
So approximately 21 bicycles could be manufactured for $3780.
55. a. Let x = number of miles driven, and let C = cost in dollars. Total cost = (cost per mile)(number of miles) + fixed cost
( ) 0.89 31.95C x x= +
b. ( ) ( )( )110 0.89 110 31.95 $129.85C = + =
( ) ( )( )230 0.89 230 31.95 $236.65C = + =
56. a. Let x = number of minutes used, and let C = cost in dollars. Total cost = (cost per minute)(number of minutes) + fixed cost
( ) 0.50 10C x x= −
b. ( ) ( )( )105 0.50 105 10 $42.50C = − =
( ) ( )( )180 0.50 120 10 $50C = − =
57. a.
Full file at https://testbankuniv.eu/Precalculus-Concepts-Through-Functions-A-Right-Triangle-Approach-to-Trigonometry-3rd-Edition-Sullivan-Solutions-Manual
Full file at https://testbankuniv.eu/Precalculus-Concepts-Through-Functions-A-Right-Triangle-Approach-to-Trigonometry-3rd-Edition-Sullivan-Solutions-Manual

Chapter 2: Linear and Quadratic Functions
156
Copyright © 2015 Pearson Education, Inc.
b. m n Avg. rate of change = nm
ΔΔ
8 1750
16 3500 3500 1750 1750 87516 8 8 4
− = =−
32 7000 7000 3500 3500 87532 16 16 4
− = =−
64 14000 14000 7000 7000 87564 32 32 4
− = =−
Since each input (memory) corresponds to a single output (number or songe), we know that the number of songs is a function of memory. Also, because the average rate of change is constant at 218.75 per gigabyte, the function is linear.
c. From part (b), we know 218.75slope = . Using 1 1( , ) (8, 1750)m n = , we get the equation:
1 1( )1750 218.75( 8)1750 218.75 1750
218.75
n n s m mn mn m
n m
− = −− = −− = −
=
Using function notation, we have ( ) 218.75n m m= .
d. The price cannot be negative, so 0m ≥ . Likewise, the quantity cannot be negative, so, ( ) 0n m ≥ . 218.75 0
0mm
≥≥
Thus, the implied domain for n(m) is { | 0}m m ≥ or [ )0, ∞ .
e.
f. If memory increases by 1 GB, then the
number of songs increases by 218.75.
58. a.
b. s h Avg. rate of change = hs
ΔΔ
20 0
15 3 3 0 3 0.6
15 20 5− = = −− −
10 6 6 3 3 0.6
10 15 5− = = −− −
5 9 9 6 3 0.65 10 5
− = = −− −
Since each input (soda) corresponds to a single output (hot dogs), we know that number of hot dogs purchased is a function of number of sodas purchased. Also, because the average rate of change is constant at 0.6− hot dogs per soda, the function is linear.
c. From part (b), we know 0.6m = − . Using 1 1( , ) (20, 0)s h = , we get the equation:
1 1( )0 0.6( 20)
0.6 12
h h m s sh s
h s
− = −− = − −
= − +
Using function notation, we have ( ) 0.6 12h s s= − + .
d. The number of sodas cannot be negative, so 0s ≥ . Likewise, the number of hot dogs
cannot be negative, so, ( ) 0h s ≥ . 0.6 12 0
0.6 1220
sss
− + ≥− ≥ −
≤
Thus, the implied domain for h(s) is { | 0 20}s s≤ ≤ or [0, 20] .
Full file at https://testbankuniv.eu/Precalculus-Concepts-Through-Functions-A-Right-Triangle-Approach-to-Trigonometry-3rd-Edition-Sullivan-Solutions-Manual
Full file at https://testbankuniv.eu/Precalculus-Concepts-Through-Functions-A-Right-Triangle-Approach-to-Trigonometry-3rd-Edition-Sullivan-Solutions-Manual

Section 2.1: Properties of Linear Functions and Linear Models
157 Copyright © 2015 Pearson Education, Inc.
e.
f. If the number of hot dogs purchased increases by $1, then the number of sodas purchased decreases by 0.6.
g. s-intercept: If 0 hot dogs are purchased, then 20 sodas can be purchased. h-intercept: If 0 sodas are purchased, then 12 hot dogs may be purchased.
59. The graph shown has a positive slope and a positive y-intercept. Therefore, the function from (d) and (e) might have the graph shown.
60. The graph shown has a negative slope and a positive y-intercept. Therefore, the function from (b) and (e) might have the graph shown.
61. A linear function ( )f x mx b= + will be odd
provided ( ) ( )f x f x− = − .
That is, provided ( ) ( )m x b mx b− + = − + .
2 00
mx b mx bb bbb
− + = − −= −==
So a linear function ( )f x mx b= + will be odd provided 0b = .
A linear function ( )f x mx b= + will be even
provided ( ) ( )f x f x− = .
That is, provided ( )m x b mx b− + = + .
0 20
mx b mx bmxb mx
mxm
− + = +− =
==
So, yes, a linear function ( )f x mx b= + cab be even provided 0m = .
62. If you solve the linear function ( )f x mx b= + for 0 you are actually finding the x-intercept. Therefore using x-intercept of the graph of
( )f x mx b= + would be same x-value as solving 0mx b+ > for x. Then the appropriate interval could be determined
63. 2 2
2 2
2 2 2
4 10 7 0
( 4 4) ( 10 25) 7 4 25
( 2) ( 5) 6
x x y y
x x y y
x y
− + + − =
− + + + + = + +
− + + =
Center: (2, -5); Radius = 6
64. 2( )3
2(5)(5) 85 3
1082
16 106
x Bf xx
Bf
B
BB
+=−
+= =
−+
=
= +=
65. (3) (1)3 1
12 ( 2)2
142
7
f f−−
− −=
=
=
Full file at https://testbankuniv.eu/Precalculus-Concepts-Through-Functions-A-Right-Triangle-Approach-to-Trigonometry-3rd-Edition-Sullivan-Solutions-Manual
Full file at https://testbankuniv.eu/Precalculus-Concepts-Through-Functions-A-Right-Triangle-Approach-to-Trigonometry-3rd-Edition-Sullivan-Solutions-Manual

Chapter 2: Linear and Quadratic Functions
158 Copyright © 2015 Pearson Education, Inc.
66.
Section 2.2
1. y
x
12
6
1 2 3 No, the relation is not a function because an
input, 1, corresponds to two different outputs, 5 and 12.
2. Let ( ) ( )1 1, 1, 4x y = and ( ) ( )2 2, 3, 8x y = .
2 1
2 1
8 4 4 23 1 2
y ymx x
− −= = = =− −
( )( )
1 1
4 2 14 2 2
2 2
y y m x xy xy x
y x
− = −− = −− = −
= +
3. scatter diagram
4. decrease; 0.008
5. Linear relation, 0m >
6. Nonlinear relation
7. Linear relation, 0m <
8. Linear relation, 0m >
9. Nonlinear relation
10. Nonlinear relation
11. a.
0 10
20
0 b. Answers will vary. We select (4, 6) and
(8, 14). The slope of the line containing these points is:
14 6 8 28 4 4
m −= = =−
The equation of the line is: 1 1( )6 2( 4)6 2 8
2 2
y y m x xy xy x
y x
− = −− = −− = −
= −
c.
0 10
20
0 d. Using the LINear REGression program,
the line of best fit is: 2.0357 2.3571y x= −
e.
0 10
20
0 12. a.
0 15
15
−5 b. Answers will vary. We select (5, 2) and
(11, 9). The slope of the line containing
these points is: 9 2 711 5 6
m −= =−
The equation of the line is:
Full file at https://testbankuniv.eu/Precalculus-Concepts-Through-Functions-A-Right-Triangle-Approach-to-Trigonometry-3rd-Edition-Sullivan-Solutions-Manual
Full file at https://testbankuniv.eu/Precalculus-Concepts-Through-Functions-A-Right-Triangle-Approach-to-Trigonometry-3rd-Edition-Sullivan-Solutions-Manual

Section 2.2 Building Linear Models from Data
159 Copyright © 2015 Pearson Education, Inc.
1 1( )72 ( 5)67 3526 67 236 6
y y m x x
y x
y x
y x
− = −
− = −
− = −
= −
c.
0 15
15
−5 d. Using the LINear REGression program,
the line of best fit is: 1.1286 3.8619y x= −
e.
0 15
15
−5 13. a.
−3 3
6
−6 b. Answers will vary. We select (–2,–4) and
(2, 5). The slope of the line containing
these points is: 5 ( 4) 92 ( 2) 4
m − −= =− −
.
The equation of the line is: 1 1( )
9( 4) ( ( 2))49 944 29 14 2
y y m x x
y x
y x
y x
− = −
− − = − −
+ = +
= +
c.
−3 3
6
−6
e. Using the LINear REGression program, the line of best fit is:
2.2 1.2y x= +
−3 3
6
−6
14. a.
−5 5
8
−2 b. Answers will vary. We select (–2, 7) and
(2, 0). The slope of the line containing
these points is: 0 7 7 72 ( 2) 4 4
m − −= = = −− −
.
The equation of the line is: 1 1( )
77 ( ( 2))47 774 27 74 2
y y m x x
y x
y x
y x
− = −
− = − − −
− = − −
= − +
c.
−5 5
8
−2 d. Using the LINear REGression program,
the line of best fit is: 1.8 3.6y x= − +
e.
−5 5
8
−2
Full file at https://testbankuniv.eu/Precalculus-Concepts-Through-Functions-A-Right-Triangle-Approach-to-Trigonometry-3rd-Edition-Sullivan-Solutions-Manual
Full file at https://testbankuniv.eu/Precalculus-Concepts-Through-Functions-A-Right-Triangle-Approach-to-Trigonometry-3rd-Edition-Sullivan-Solutions-Manual

Chapter 2: Linear and Quadratic Functions
160 Copyright © 2015 Pearson Education, Inc.
15. a.
−25 0
150
90 b. Answers will vary. We select (–20,100)
and (–10,140). The slope of the line containing these points is:
( )140 100 40 4
1010 20m −= = =
− − −
The equation of the line is:
( )1 1( )
100 4 ( 20)100 4 80
4 180
y y m x xy xy x
y x
− = −− = − −− = +
= +
c.
−25 0
150
90 d. Using the LINear REGression program,
the line of best fit is: 3.8613 180.2920y x= +
e.
−25 0
150
90
16. a.
−40 0
25
0 b. Selection of points will vary. We select
(–30, 10) and (–14, 18). The slope of the line containing these points is:
( )18 10 8 1
16 214 30m −= = =
− − −
The equation of the line is:
( )1 1( )
110 ( 30)2110 1521 252
y y m x x
y x
y x
y x
− = −
− = − −
− = +
= +
c.
−40 0
25
0 d. Using the LINear REGression program,
the line of best fit is: 0.4421 23.4559y x= +
e.
−40 0
25
0
17. a.
b. Linear. c. Answers will vary. We will use the points
(39.52, 210) and (66.45, 280) . 280 210 70 2.5993316
66.45 39.52 26.93m −= = ≈
−
210 2.5993316( 39.52)210 2.5993316 102.7255848
2.599 107.274
y xy x
y x
− = −− = −
= +
Full file at https://testbankuniv.eu/Precalculus-Concepts-Through-Functions-A-Right-Triangle-Approach-to-Trigonometry-3rd-Edition-Sullivan-Solutions-Manual
Full file at https://testbankuniv.eu/Precalculus-Concepts-Through-Functions-A-Right-Triangle-Approach-to-Trigonometry-3rd-Edition-Sullivan-Solutions-Manual

Section 2.2 Building Linear Models from Data
161 Copyright © 2015 Pearson Education, Inc.
d.
e. 62.3 : 2.599(62.3) 107.274 269x y= = + ≈ We predict that a candy bar weighing 62.3 grams will contain 269 calories.
f. If the weight of a candy bar is increased by one gram, then the number of calories will increase by 2.599.
18. a.
w
N
b. Linear with positive slope. c. Answers will vary. We will use the points
(42.3, 82) and (42.8, 93) . 93 82 11 22
42.8 42.3 0.5m −= = =
−
( )( )
1 1
82 22 42.382 22 930.6
22 848.6
N N m w wN wN w
N w
− = −− = −− = −
= −
d.
w
N
e. (42.5) 22(42.5) 848.6 86.4N = − = We predict that approximately 86 raisins will be in a box weighing 42.5 grams.
f. If the weight is increased by one gram, then the number of raisins will increase by 22.
19. a. The independent variable is the number of hours spent playing video games and cumulative grade-point average is the dependent variable because we are using number of hours playing video games to predict (or explain) cumulative grade-point average.
b.
c. Using the LINear REGression program, the
line of best fit is: ( ) 0.0942 3.2763G h h= − + d. If the number of hours playing video games
in a week increases by 1 hour, the cumulative grade-point average decreases 0.09, on average.
e. (8) 0.0942(8) 3.2763 2.52G = − + = We predict a grade-point average of approximately 2.52 for a student who plays 8 hours of video games each week.
f. 2.40 0.0942( ) 3.27632.40 3.2763 0.0942
0.8763 0.09429.3
hhh
h
= − +− = −− = −
=
A student who has a grade-point average of 2.40 will have played approximately 9.3 hours of video games.
20. a.
b. Using the LINear REGression program, the line of best fit is: ( ) 0.4755 64.0143P t t= +
Full file at https://testbankuniv.eu/Precalculus-Concepts-Through-Functions-A-Right-Triangle-Approach-to-Trigonometry-3rd-Edition-Sullivan-Solutions-Manual
Full file at https://testbankuniv.eu/Precalculus-Concepts-Through-Functions-A-Right-Triangle-Approach-to-Trigonometry-3rd-Edition-Sullivan-Solutions-Manual
Chapter 2: Linear and Quadratic Functions
162 Copyright © 2015 Pearson Education, Inc.
c. If the flight time increases by 1 minute, the ticket price increases by about $0.4755, on average.
d. (90) 0.4755(90) 64.0143 $107P = + = e. To find the time, we solve the following
equation: 180 0.4755 64.0143
115.9857 0.4755244
tt
t
= +=≈
An airfare of $180 would be for a flight time of about 244 minutes.
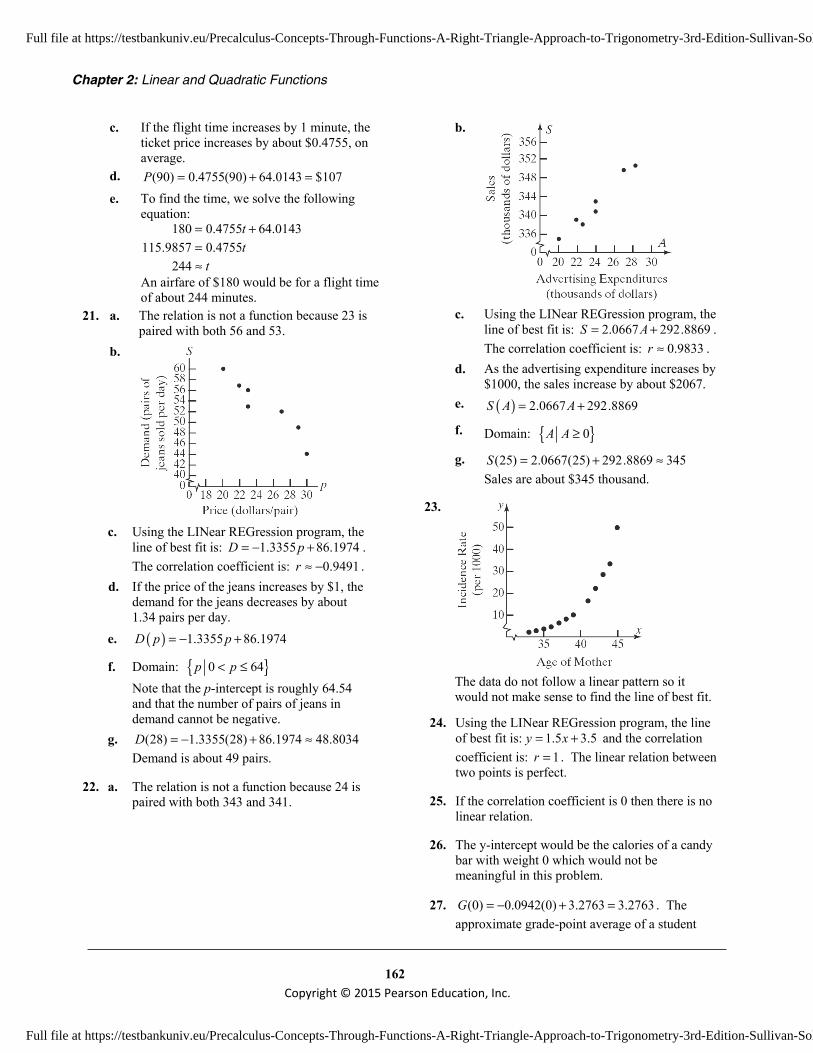
21. a. The relation is not a function because 23 is paired with both 56 and 53.
b.
c. Using the LINear REGression program, the
line of best fit is: 1.3355 86.1974D p= − + . The correlation coefficient is: 0.9491r ≈ − .
d. If the price of the jeans increases by $1, the demand for the jeans decreases by about 1.34 pairs per day.
e. ( ) 1.3355 86.1974D p p= − +
f. Domain: { }0 64p p< ≤ Note that the p-intercept is roughly 64.54 and that the number of pairs of jeans in demand cannot be negative.
g. (28) 1.3355(28) 86.1974 48.8034D = − + ≈ Demand is about 49 pairs.
22. a. The relation is not a function because 24 is paired with both 343 and 341.
b.
c. Using the LINear REGression program, the
line of best fit is: 2.0667 292.8869S A= + . The correlation coefficient is: 0.9833r ≈ .
d. As the advertising expenditure increases by $1000, the sales increase by about $2067.
e. ( ) 2.0667 292.8869S A A= + f. Domain: { }0A A ≥ g. (25) 2.0667(25) 292.8869 345S = + ≈
Sales are about $345 thousand. 23.
The data do not follow a linear pattern so it would not make sense to find the line of best fit.
24. Using the LINear REGression program, the line of best fit is: 1.5 3.5y x= + and the correlation coefficient is: 1r = . The linear relation between two points is perfect.
25. If the correlation coefficient is 0 then there is no linear relation.
26. The y-intercept would be the calories of a candy bar with weight 0 which would not be meaningful in this problem.
27. (0) 0.0942(0) 3.2763 3.2763G = − + = . The approximate grade-point average of a student
Full file at https://testbankuniv.eu/Precalculus-Concepts-Through-Functions-A-Right-Triangle-Approach-to-Trigonometry-3rd-Edition-Sullivan-Solutions-Manual
Full file at https://testbankuniv.eu/Precalculus-Concepts-Through-Functions-A-Right-Triangle-Approach-to-Trigonometry-3rd-Edition-Sullivan-Solutions-Manual

Section 2.3: Quadratic Functions and Their Zeros
163 Copyright © 2015 Pearson Education, Inc.
who plays 0 hours of video games per week would be 3.28.
28. 3 5 8 23 ( 1) 4
m − − −= = = −
− −
( )( )
1 1
5 2 15 2 2
2 3 or2 3
y y m x xy xy x
y xx y
− = −− = − +− = − −
= − ++ =
29. The domain would be all real numbers except those that make the denominator zero.
2
2
25 025 5
xx x
− == → = ±
So the domain is: { }| 5, 5x x ≠ −
30. 2
2
2
2
( ) 5 8 and ( ) 3 4( )( ) ( 3 4) (5 8)
3 4 5 88 12
f x x g x x xg f x x x x
x x xx x
= − = − +− = − + − −
= − + − += − +
31. Since y is shifted to the left 3 units we would use 2( 3)y x= + . Since y is also shifted down 4
units,we would use 2( 3) 4y x= + − .
Section 2.3
1. a. ( )( )2 5 6 6 1x x x x− − = − +
b. ( )( )22 3 2 3 1x x x x− − = − +
2. 28 4 2 3 64 24
40 4 10 2 10
− ⋅ ⋅ = −
= = ⋅ =
3. ( )( )3 3 5 03 0 or 3 5 0
3 3 553
x xx x
x x
x
− + =− = + =
= = −
= −
The solution set is 5 ,33
−
.
4. add; 21 6 9
2 ⋅ =
5. If (4) 10f = , then the point (4, 10) is on the graph of f.
6. ( ) 23 ( 3) 4( 3) 39 12 3 0
f − = − + − += − + =
3− is a zero of ( )f x .
7. repeated; multiplicity 2
8. discriminant; negative
9. A quadratic functions can have either 0, 1 or 2 real zeros.
10. 2 4
2b b acx
a− ± −=
11. ( )
( )2
0
9 09 0
f x
x xx x
=
− =− =
0 or 9 09
x xx
= − ==
The zeros of ( ) 2 9f x x x= − are 0 and 9. The x-intercepts of the graph of f are 0 and 9.
12. ( )
( )2
0
4 04 0
f x
x xx x
=
+ =+ =
0 or 4 04
x xx
= + == −
The zeros of ( ) 2 4f x x x= + are 4− and 0. The x-intercepts of the graph of f are 4− and 0.
13. ( )2
0
25 0( 5)( 5) 0
g x
xx x
=
− =+ − =
5 0 or 5 05 5
x xx x
+ = − == − =
The zeros of ( ) 2 25g x x= − are 5− and 5. The x-intercepts of the graph of g are 5− and 5.
Full file at https://testbankuniv.eu/Precalculus-Concepts-Through-Functions-A-Right-Triangle-Approach-to-Trigonometry-3rd-Edition-Sullivan-Solutions-Manual
Full file at https://testbankuniv.eu/Precalculus-Concepts-Through-Functions-A-Right-Triangle-Approach-to-Trigonometry-3rd-Edition-Sullivan-Solutions-Manual

Chapter 2: Linear and Quadratic Functions
164 Copyright © 2015 Pearson Education, Inc.
14. ( )2
0
9 0( 3)( 3) 0
G x
xx x
=
− =+ − =
3 0 or 3 03 3
x xx x
+ = − == − =
The zeros of ( ) 2 9G x x= − are 3− and 3. The x-intercepts of the graph of G are 3− and 3.
15. ( )2
0
6 0( 3)( 2) 0
F x
x xx x
=
+ − =+ − =
3 0 or 2 03 2
x xx x
+ = − == − =
The zeros of ( ) 2 6F x x x= + − are 3− and 2. The x-intercepts of the graph of F are 3− and 2.
16. ( )2
0
7 6 0( 6)( 1) 0
H x
x xx x
=
+ + =+ + =
6 0 or 1 06 1
x xx x
+ = + == − = −
The zeros of ( ) 2 7 6H x x x= + + are 6− and 1− . The x-intercepts of the graph of H are 6− and 1− .
17. ( )2
0
2 5 3 0(2 1)( 3) 0
g x
x xx x
=
− − =+ − =
2 1 0 or 3 01 32
x xxx
+ = − === −
The zeros of ( ) 22 5 3g x x x= − − are 12
− and 3.
The x-intercepts of the graph of g are 12
− and 3.
18. ( )2
0
3 5 2 0(3 2)( 1) 0
f x
x xx x
=
+ + =+ + =
3 2 0 or 1 02 13
x xxx
+ = + == −= −
The zeros of ( ) 23 5 2f x x x= + + are 1− and
23
− . The x-intercepts of the graph of f are 1−
and 23
− .
19. ( )2
2
0
3 48 0
3( 16) 03( 4)( 4) 0
P x
x
xx x
=
− =
− =+ − =
4 0 or 4 04 4
t tt t
+ = − == − =
The zeros of ( ) 23 48P x x= − are 4− and 4. The x-intercepts of the graph of P are 4− and 4.
20. ( )2
2
0
2 50 0
2( 25) 02( 5)( 5) 0
H x
x
xx x
=
− =
− =+ − =
5 0 or 5=05 5
y yy y
+ = −= − =
The zeros of ( ) 22 50H x x= − are 5− and 5. The x-intercepts of the graph of H are 5− and 5.
21. ( )( )
( )2
08 12 0
8 12 0( 6) 2 0
g x
x x
x xx x
=
+ + =
+ + =+ + =
6 or 2x x= − = − The zeros of ( ) ( )8 12g x x x= + + are 6− and 2− . The x-intercepts of the graph of g are 6− and 2− .
22. ( )( )
( )2
04 12 0
4 12 0( 6) 2 0
f x
x x
x xx x
=
− − =
− − =− + =
2 or 6x x= − = The zeros of ( ) ( )4 12f x x x= − − are 2− and 6. The x-intercepts of the graph of f are 2− and 6.
Full file at https://testbankuniv.eu/Precalculus-Concepts-Through-Functions-A-Right-Triangle-Approach-to-Trigonometry-3rd-Edition-Sullivan-Solutions-Manual
Full file at https://testbankuniv.eu/Precalculus-Concepts-Through-Functions-A-Right-Triangle-Approach-to-Trigonometry-3rd-Edition-Sullivan-Solutions-Manual

Section 2.3: Quadratic Functions and Their Zeros
165 Copyright © 2015 Pearson Education, Inc.
23. ( )2
2
0
4 9 12 0
4 12 9 0(2 3)(2 3) 0
G x
x x
x xx x
=
+ − =
− + =− − =
2 3 0 or 2 3 03 32 2
x x
x x
− = − =
= =
The only zero of ( ) 24 9 12G x x x= + − is 32
.
The only x-intercept of the graph of G is 32
.
24. ( )2
2
0
25 16 40 0
25 40 16 0(5 4)(5 4) 0
F x
x x
x xx x
=
+ − =
− + =− − =
5 4 0 or 5 4 04 45 5
x x
x x
− = − =
= =
The only zero of ( ) 225 16 40F x x x= + − is 45
.
The only x-intercept of the graph of F is 45
.
25. ( )2
2
0
8 0
8
8 2 2
f x
x
x
x
=
− =
=
= ± = ±
The zeros of ( ) 2 8f x x= − are 2 2− and 2 2 .
The x-intercepts of the graph of f are 2 2− and 2 2 .
26. ( )2
2
0
18 0
18
18 3 3
g x
x
x
x
=
− =
=
= ± = ±
The zeros of ( ) 2 18g x x= − are 3 3− and
3 3 . The x-intercepts of the graph of g are 3 3− and 3 3 .
27. ( )( )
( )
2
2
0
1 4 0
1 4
1 41 2
g x
x
x
xx
=
− − =
− =
− = ±− = ±
1 2 or 1 23 1
x xx x
− = − = −= = −
The zeros of ( ) ( )21 4g x x= − − are 1− and 3. The x-intercepts of the graph of g are 1− and 3.
28. ( )( )
( )
2
2
0
2 1 0
2 1
2 12 1
G x
x
x
xx
=
+ − =
+ =
+ = ±+ = ±
2 1 or 2 11 3
x xx x
+ = + = −= − = −
The zeros of ( ) ( )22 1G x x= + − are 3− and 1− . The x-intercepts of the graph of G are 3− and 1− .
29. ( )( )
( )
2
2
0
2 3 32 0
2 3 32
2 3 32
2 3 4 2
2 3 4 2
3 4 22
F x
x
x
x
x
x
x
=
+ − =
+ =
+ = ±
+ = ±
= − ±
− ±=
The zeros of ( ) ( )22 3 32F x x= + − are
3 4 22
− + and 3 4 22
− − . The x-intercepts of
the graph of F are 3 4 22
− + and 3 4 22
− − .
Full file at https://testbankuniv.eu/Precalculus-Concepts-Through-Functions-A-Right-Triangle-Approach-to-Trigonometry-3rd-Edition-Sullivan-Solutions-Manual
Full file at https://testbankuniv.eu/Precalculus-Concepts-Through-Functions-A-Right-Triangle-Approach-to-Trigonometry-3rd-Edition-Sullivan-Solutions-Manual

Chapter 2: Linear and Quadratic Functions
166 Copyright © 2015 Pearson Education, Inc.
30. ( )( )
( )
2
2
0
3 2 75 0
3 2 75
3 2 75
3 2 5 3
3 2 5 3
2 5 33
F x
x
x
x
x
x
x
=
− − =
− =
− = ±
− = ±
= ±
±=
The zeros of ( ) ( )23 2 75G x x= − − are 2 5 33
+
and 2 5 33
− . The x-intercepts of the graph of G
are 2 5 33
− and 2 5 33
+ .
31. ( )
( )
2
2
2
2
0
4 8 0
4 8
4 4 8 4
2 12
2 12
2 2 3
2 2 3
f x
x x
x x
x x
x
x
x
x
=
+ − =
+ =
+ + = +
+ =
+ = ±
+ = ±
= − ±
2 2 3 or 2 2 3x x= − + = − − The zeros of ( ) 2 4 8f x x x= + − are 2 2 3− +
and 2 2 3− − . The x-intercepts of the graph of f are 2 2 3− + and 2 2 3− − .
32. ( )
( )
2
2
2
0
6 9 0
6 9 9 9
3 18
3 18
3 3 2
f x
x x
x x
x
x
x
=
− − =
− + = +
− =
− = ±
= ±
The zeros of ( ) 2 6 9f x x x= − − are 3 3 2−
and 3 3 2+ . The x-intercepts of the graph of f are 3 3 2− and 3 3 2+ .
33. ( )2
2
2
2
01 3 02 16
1 32 16
1 1 3 12 16 16 16
1 14 4
g x
x x
x x
x x
x
=
− − =
− =
− + = +
− =
1 1 14 4 2
1 14 2
x
x
− = ± = ±
= ±
3 1 or 4 4
x x= = −
The zeros of ( ) 2 1 32 16
g x x x= − − are 14
− and 34
.
The x-intercepts of the graph of g are 14
− and 34
.
34. ( )2
02 1 03 3
g x
x x
=
+ − =
2
2
2
2 13 3
2 1 1 13 9 3 9
1 43 9
x x
x x
x
+ =
+ + = +
+ =
1 4 23 9 3
1 23 3
1 or 13
x
x
x x
+ = ± = ±
= − ±
= = −
The zeros of ( ) 2 2 13 3
g x x x= + − are 1− and 13
.
The x-intercepts of the graph of g are 1− and 13
.
Full file at https://testbankuniv.eu/Precalculus-Concepts-Through-Functions-A-Right-Triangle-Approach-to-Trigonometry-3rd-Edition-Sullivan-Solutions-Manual
Full file at https://testbankuniv.eu/Precalculus-Concepts-Through-Functions-A-Right-Triangle-Approach-to-Trigonometry-3rd-Edition-Sullivan-Solutions-Manual

Section 2.3: Quadratic Functions and Their Zeros
167 Copyright © 2015 Pearson Education, Inc.
35. ( )2
013 02
F x
x x
=
+ − =
2
2
2
2
1 1 03 6
1 13 6
1 1 1 13 36 6 36
1 76 36
1 7 76 36 6
1 76
x x
x x
x x
x
x
x
+ − =
+ =
+ + = +
+ =
+ = ± = ±
− ±=
The zeros of ( ) 2 132
F x x x= + − are 1 76
− − and
1 76
− + . The x-intercepts of the graph of F are
1 76
− − and 1 76
− + .
36. ( )2
0
2 3 1 0
G x
x x
=
− − =
2
2
2
3 1 02 2
3 12 2
3 9 1 92 16 2 16
x x
x x
x x
− − =
− =
− + = +
23 174 16
3 17 174 16 4
3 174
x
x
x
− =
− = ± = ±
±=
The zeros of ( ) 22 3 1G x x x= − − are 3 174
− and
3 174
+ . The x-intercepts of the graph of G are
3 174
− and 3 174
+ .
37. ( )2
0
4 2 0
f x
x x
=
− + =
2
1, 4, 2
( 4) ( 4) 4(1)(2) 4 16 82(1) 2
4 8 4 2 2 2 22 2
a b c
x
= = − =
− − ± − − ± −= =
± ±= = = ±
The zeros of ( ) 2 4 2f x x x= − + are 2 2− and
2 2+ . The x-intercepts of the graph of f are 2 2− and 2 2+ .
38. ( )2
0
4 2 0
f x
x x
=
+ + =
2
1, 4, 2
4 4 4(1)(2) 4 16 82(1) 2
4 8 4 2 2 2 22 2
a b c
x
= = =
− ± − − ± −= =
− ± − ±= = = − ±
The zeros of ( ) 2 4 2f x x x= + + are 2 2− −
and 2 2− + . The x-intercepts of the graph of f
are 2 2− − and 2 2− + .
39. ( )2
0
4 1 0
g x
x x
=
− − =
2
1, 4, 1
( 4) ( 4) 4(1)( 1) 4 16 42(1) 2
4 20 4 2 5 2 52 2
a b c
x
= = − = −
− − ± − − − ± += =
± ±= = = ±
The zeros of ( ) 2 4 1g x x x= − − are 2 5− and
2 5+ . The x-intercepts of the graph of g are 2 5− and 2 5+ .
40. ( )2
0
6 1 0
g x
x x
=
+ + =
2
1, 6, 1
6 6 4(1)(1) 6 36 42(1) 2
6 32 6 4 2 3 2 22 2
a b c
x
= = =
− ± − − ± −= =
− ± − ±= = = − ±
The zeros of ( ) 2 6 1g x x x= + + are 3 2 2− −
Full file at https://testbankuniv.eu/Precalculus-Concepts-Through-Functions-A-Right-Triangle-Approach-to-Trigonometry-3rd-Edition-Sullivan-Solutions-Manual
Full file at https://testbankuniv.eu/Precalculus-Concepts-Through-Functions-A-Right-Triangle-Approach-to-Trigonometry-3rd-Edition-Sullivan-Solutions-Manual

Chapter 2: Linear and Quadratic Functions
168 Copyright © 2015 Pearson Education, Inc.
and 3 2 2− + . The x-intercepts of the graph of g are 3 2 2− − and 3 2 2− + .
41. ( )2
0
2 5 3 0
F x
x x
=
− + =
2
2, 5, 3
( 5) ( 5) 4(2)(3) 5 25 242(2) 4
5 1 3 or 14 2
a b c
x
= = − =
− − ± − − ± −= =
±= =
The zeros of ( ) 22 5 3F x x x= − + are 1 and 32
.
The x-intercepts of the graph of F are 1 and 32
.
42. ( )2
0
2 5 3 0
g x
x x
=
+ + =
2
2, 5, 3
5 5 4(2)(3) 5 25 242(2) 4
5 1 31 or 4 2
a b c
x
= = =
− ± − − ± −= =
− ±= = − −
The zeros of ( ) 22 5 3g x x x= + + are 32
− and 1− .
The x-intercepts of the graph of g are 32
− and 1− .
43. ( )2
0
4 2 0
P x
x x
=
− + =
2
4, 1, 2
( 1) ( 1) 4(4)(2) 1 1 322(4) 8
1 31 not real8
a b c
x
= = − =
− − ± − − ± −= =
± −= =
The function ( ) 24 2P x x x= − + has no real zeros, and the graph of P has no x-intercepts.
44. ( )2
0
4 1 0
H x
x x
=
+ + =
2
4, 1, 1
1 1 4(4)(1) 1 1 162(4) 8
1 15 not real8
a b c
t
= = =
− ± − − ± −= =
− ± −= =
The function ( ) 24 1H x x x= + + has no real zeros, and the graph of H has no x-intercepts.
45. ( )2
2
0
4 1 2 0
4 2 1 0
f x
x x
x x
=
− + =
+ − =
2
4, 2, 1
2 2 4(4)( 1) 2 4 162(4) 8
2 20 2 2 5 1 58 8 4
a b c
x
= = = −
− ± − − − ± += =
− ± − ± − ±= = =
The zeros of ( ) 24 1 2f x x x= − + are 1 54
− −
and 1 54
− + . The x-intercepts of the graph of f
are 1 54
− − and 1 54
− + .
46. ( )2
2
0
2 1 2 0
2 2 1 0
f x
x x
x x
=
− + =
+ − =
2
2, 2, 1
2 2 4(2)( 1) 2 4 82(2) 4
2 12 2 2 3 1 34 4 2
a b c
x
= = = −
− ± − − − ± += =
− ± − ± − ±= = =
The zeros of ( ) 22 1 2f x x x= − + are 1 32
− −
and 1 32
− + . The x-intercepts of the graph of f
are 1 32
− − and 1 32
− + .
47. ( )
2
02 ( 2) 3 02 4 3 0
G xx xx x
=+ − =
+ − =
( ) ( )2
2, 4, 3
4 4 4(2)( 3) 4 16 242(2) 4
4 40 4 2 10 2 10=4 4 2
a b c
x
= = = −
− ± − − − ± += =
− ± − ± − ±= =
The zeros of ( ) 2 ( 2) 3G x x x= + − are 2 102
− +
Full file at https://testbankuniv.eu/Precalculus-Concepts-Through-Functions-A-Right-Triangle-Approach-to-Trigonometry-3rd-Edition-Sullivan-Solutions-Manual
Full file at https://testbankuniv.eu/Precalculus-Concepts-Through-Functions-A-Right-Triangle-Approach-to-Trigonometry-3rd-Edition-Sullivan-Solutions-Manual
Section 2.3: Quadratic Functions and Their Zeros
169 Copyright © 2015 Pearson Education, Inc.
and 2 102
− − . The x-intercepts of the graph of G
are 2 102
− + and 2 102
− − .
48. ( )2
0
3 ( 2) 1 0 3 6 1 0
F x
x x x x
=
+ − = + − =
( ) ( )2
3, 6, 1
6 6 4(3)( 1) 6 36 122(3) 6
6 48 6 4 3 3 2 3=6 6 3
a b c
x
= = = −
− ± − − − ± += =
− ± − ± − ±= =
The zeros of ( ) 3 ( 2) 2F x x x= + − are 3 2 33
− +
and 3 2 33
− − . The x-intercepts of the graph of G
are 3 2 33
− + and 3 2 33
− − .
49. ( )2
0
9 6 1 0
p x
x x
=
− + =
( ) ( )2
9, 6, 1
6 6 4(9)(1) 6 36 362(9) 18
6 0 118 3
a b c
x
= = − =
− − ± − − ± −= =
±= =
The only real zero of ( ) 29 6 1p x x x= − + is 13
.
The only x-intercept of the graph of g is 13
.
50. ( )2
0
4 20 25 0
q x
x x
=
+ + =
( )2
4, 20, 25
20 20 4(4)(25) 20 400 4002(4) 8
20 0 20 58 8 2
a b c
x
= = =
− ± − − ± −= =
− ±= = − = −
The only real zero of ( ) 24 20 25q x x x= + + is 52
− . The only x-intercept of the graph of F is 52
− .
51. ( ) ( )
( )
2
2
6 3 3
6 0 6 0
f x g x
x x
x x x x
=
+ + =
+ = + =
0 or 6 06
x xx
= + == −
The x-coordinates of the points of intersection are 6− and 0. The y-coordinates are ( )6 3g − = and
( )0 3g = . The graphs of the f and g intersect at the points ( 6,3)− and (0,3) .
52. ( ) ( )
( )
2
2
4 3 3
4 04 0
f x g x
x x
x xx x
=
− + =
− =− =
0 or 4 04
x xx
= − ==
The x-coordinates of the points of intersection are 0 and 4. The y-coordinates are ( )0 3g = and
( )4 3g = . The graphs of the f and g intersect at the points (0,3) and (4,3) .
53. ( ) ( )
( )( )
2
2
2 1 3 2
0 2 3 10 2 1 1
f x g x
x x
x xx x
=
− + = +
= + += + +
2 1 0 or 1 01 12
x xxx
+ = + == −= −
The x-coordinates of the points of intersection
are 1− and 12
− . The y-coordinates are
( ) ( )1 3 1 2 3 2 1g − = − + = − + = − and 1 1 3 13 2 22 2 2 2
g − = − + = − + =
.
The graphs of the f and g intersect at the points
( 1, 1)− − and 1 1,2 2
−
.
Full file at https://testbankuniv.eu/Precalculus-Concepts-Through-Functions-A-Right-Triangle-Approach-to-Trigonometry-3rd-Edition-Sullivan-Solutions-Manual
Full file at https://testbankuniv.eu/Precalculus-Concepts-Through-Functions-A-Right-Triangle-Approach-to-Trigonometry-3rd-Edition-Sullivan-Solutions-Manual

Chapter 2: Linear and Quadratic Functions
170 Copyright © 2015 Pearson Education, Inc.
54. ( ) ( )
( )( )
2
2
3 7 10 1
3 10 8 03 2 4 0
f x g x
x x
x xx x
=
− = +
− − =+ − =
3 2 0 or 4 02 43
x xxx
+ = − === −
The x-coordinates of the points of intersection
are 23
− and 4. The y-coordinates are
2 2 20 1710 1 13 3 3 3
g − = − + = − + = −
and
( ) ( )4 10 4 1 40 1 41g = + = + = . The graphs of the f and g intersect at the points
2 17,3 3
− −
and ( )4, 41 .
55. ( ) ( )
( )( )
2 2
2
1 2 3 14
0 2 150 3 5
f x g x
x x x x
x xx x
=
− + = − −
= − −= + −
3 0 or 5 03 5
x xx x
+ = − == − =
The x-coordinates of the points of intersection are 3− and 5. The y-coordinates are
( ) ( ) ( )23 3 3 1 9 3 1 13f − = − − − + = + + = and
( ) 25 5 5 1 25 5 1 21f = − + = − + = . The graphs of the f and g intersect at the points ( 3, 13)− and ( )5, 21 .
56. ( ) ( )
( )( )
2 2
2
5 3 2 7 27
0 2 240 6 4
f x g x
x x x x
x xx x
=
+ − = + −
= + −= + −
6 0 or 4 06 4
x xx x
+ = − == − =
The x-coordinates of the points of intersection are 6− and 4. The y-coordinates are
( ) ( ) ( )26 6 5 6 3 36 30 3 3f − = − + − − = − − = and
( ) ( )24 4 5 4 3 16 20 3 33f = + − = + − = . The graphs of the f and g intersect at the points ( 6, 3)− and ( )4, 33 .
57. ( )
( )( )4 2
2 2
0
6 16 0
2 8 0
P x
x x
x x
=
− − =
+ − =
2
2
2 0
2
2not real
x
x
x
+ =
= −
= ± −=
or 2
2
8 0
8
8
2 2
x
x
x
− =
=
= ±
= ±
The zeros of ( ) 4 26 16P x x x= − − are 2 2−
and 2 2 . The x-intercepts of the graph of P are 2 2− and 2 2 .
58. ( )
( )( )4 2
2 2
0
3 4 0
1 4 0
H x
x x
x x
=
− − =
+ − =
2
2
1 0
1
1not real
x
x
x
+ =
= −
= ± −=
or 2
2
4 0
4
42
x
x
x
− =
=
= ±= ±
The zeros of ( ) 4 23 4H x x x= − − are 2− and 2. The x-intercepts of the graph of H are 2− and 2.
59. ( )4 2
0
5 4 0
f x
x x
=
− + =
( )( )2 2
2 2
4 1 0
4 0 or 1 02 or 1
x x
x xx x
− − =
− = − == ± = ±
The zeros of ( ) 4 25 4f x x x= − + are 2− , 1− , 1, and 2. The x-intercepts of the graph of f are
2− , 1− , 1, and 2.
60. ( )4 2
0
10 24 0
f x
x x
=
− + =
( )( )2 2
2 2
2 2
4 6 0
4 0 or 6 0
4 62 6
x x
x x
x xx x
− − =
− = − =
= == ± = ±
The zeros of ( ) 4 210 24f x x x= − + are 6− ,
6 , 2 and 2− . The x-intercepts of the graph of f are 6− , 6 , 2 and 2− .
Full file at https://testbankuniv.eu/Precalculus-Concepts-Through-Functions-A-Right-Triangle-Approach-to-Trigonometry-3rd-Edition-Sullivan-Solutions-Manual
Full file at https://testbankuniv.eu/Precalculus-Concepts-Through-Functions-A-Right-Triangle-Approach-to-Trigonometry-3rd-Edition-Sullivan-Solutions-Manual

Section 2.3: Quadratic Functions and Their Zeros
171 Copyright © 2015 Pearson Education, Inc.
61. ( )
( )( )
4 2
2 2
0
3 2 1 0
3 1 1 0
G x
x x
x x
=
− − =
+ − =
2 2
22
3 1 0 or 1 01 13 1
1 13not real
x x
xxx
x
x
+ = − =
== −= ±
= ± − = ±
=
The zeros of ( ) 4 23 2 1G x x x= − − are 1− and 1. The x-intercepts of the graph of G are 1− and 1.
62. ( )
( )( )4 2
2 2
0
2 5 12 0
2 3 4 0
F x
x x
x x
=
− − =
+ − =
2 2
22
2 3 0 or 4 03 42 4
3 22not real
x x
xxx
x
+ = − =
== −= ±
= ± − = ±
=
The zeros of ( ) 4 22 5 12F x x x= − − are 2− and 2. The x-intercepts of the graph of F are 2− and 2.
63. ( )
( )( )6 3
3 3
0
7 8 0
8 1 0
g x
x x
x x
=
+ − =
+ − =
3 3
3 3
8 0 or 1 0
8 12 1
x x
x xx x
+ = − =
= − == − =
The zeros of ( ) 6 37 8g x x x= + − are 2− and 1. The x-intercepts of the graph of g are 2− and 1.
64. ( )
( )( )6 3
3 3
0
7 8 0
8 1 0
g x
x x
x x
=
− − =
− + =
3 3
3 3
8 0 or 1 0
8 12 1
x x
x xx x
− = + =
= = −= = −
The zeros of ( ) 6 37 8g x x x= − − are 1− and 2. The x-intercepts of the graph of g are 1− and 2.
65. ( )( ) ( )2
0
2 7 2 12 0
G x
x x
=
+ + + + =
( )
( )( )
22
2
Let 2 27 12 03 4 0
u x u xu uu u
= + → = +
+ + =+ + =
3 0 or 4 03 4
2 3 2 45 6
u uu u
x xx x
+ = + == − = −
+ = − + = −= − = −
The zeros of ( ) ( ) ( )22 7 2 12G x x x= + + + + are 6− and 5− . The x-intercepts of the graph of G
are 6− and 5− .
66. ( )( ) ( )2
0
2 5 2 5 6 0
f x
x x
=
+ − + − =
( )
( )( )
22
2
Let 2 5 2 56 0
3 2 0
u x u xu uu u
= + → = +
− − =− + =
3 0 or 2 03 2
2 5 3 2 5 21 7
2
u uu u
x xx x
− = + == = −
+ = + = −= − = −
The zeros of ( ) ( ) ( )22 5 2 5 6f x x x= + − + − are 72
− and 1− . The x-intercepts of the graph of f
are 72
− and 1− .
67. ( )( ) ( )2
0
3 4 6 3 4 9 0
f x
x x
=
+ − + + =
( )22Let 3 4 3 4u x u x= + → = +
( )
2
26 9 0
3 03 0
33 4 3
13
u u
uu
ux
x
− + =
− =− =
=+ =
= −
The only zero of ( ) ( ) ( )23 4 6 3 4 9f x x x= + − + +
is 13
− . The x-intercept of the graph of f is 13
− .
Full file at https://testbankuniv.eu/Precalculus-Concepts-Through-Functions-A-Right-Triangle-Approach-to-Trigonometry-3rd-Edition-Sullivan-Solutions-Manual
Full file at https://testbankuniv.eu/Precalculus-Concepts-Through-Functions-A-Right-Triangle-Approach-to-Trigonometry-3rd-Edition-Sullivan-Solutions-Manual

Chapter 2: Linear and Quadratic Functions
172 Copyright © 2015 Pearson Education, Inc.
68. ( )( ) ( )2
0
2 2 20 0
H x
x x
=
− + − − =
( )
( )( )
22
2
Let 2 220 0
5 4 0
u x u xu uu u
= − → = −
+ − =+ − =
5 0 or 4 05 4
2 5 2 47 2
u uu ux xx x
+ = − == − =
− = − − == = −
The zeros of ( ) ( ) ( )22 2 20H x x x= − + − − are 2− and 7. The x-intercepts of the graph of H are 2− and 7.
69. ( )( ) ( )2
0
2 1 5 1 3 0
P x
x x
=
+ − + − =
( )22Let 1 1u x u x= + → = +
( )( )22 5 3 0
2 1 3 0u u
u u− − =
+ − =
2 1 0 or 3 01 32 1 31 21232
u uuu
xxx
x
+ = − === −
+ ==+ = −
= −
The zeros of ( ) ( ) ( )22 1 5 1 3P x x x= + − + − are 32
− and 2. The x-intercepts of the graph of P
are 32
− and 2.
70. ( )( ) ( )2
0
3 1 5 1 2 0
H x
x x
=
− + − + =
( )22Let 1 1u x u x= − → = −
( ) ( )23 5 2 0
3 2 1 0u uu u
+ + =+ + =
3 2 0 or 1 02 13 1 12 213
53
u uuuxxx
x
+ = + == −= −
− = −=− = −
=
The zeros of ( ) ( ) ( )23 1 5 1 2H x x x= − + − + are 53
and 2. The x-intercepts of the graph of H are
53
and 2.
71. ( ) 04 0
G x
x x
=
− =
2Let u x u x= → =
( )2 4 0
4 0u u
u u− =− =
2 2
0 or 4 04
0 4
0 0 4 16
u uu
x x
x x
= − ==
= =
= = = =
Check: ( )( )0 0 4 0 0
16 16 4 16 16 16 0
G
G
= − =
= − = − =
The zeros of ( ) 4G x x x= − are 0 and 16. The x-intercepts of the graph of G are 0 and 16.
72. ( ) 08 0f x
x x
=
+ =
2Let u x u x= → =
( )2 8 0
8 0u u
u u+ =+ =
2
0 or 8 08
0 8not real0 0
u uu
x xxx
= + == −
= = −== =
Check: ( )0 0 8 0 0f = + =
The only zero of ( ) 8f x x x= + is 0. The only x-intercept of the graph of f is 0.
73. ( ) 0
20 0
g x
x x
=
+ − =
2Let u x u x= → =
( )( )2 20 05 4 0
u uu u
+ − =+ − =
Full file at https://testbankuniv.eu/Precalculus-Concepts-Through-Functions-A-Right-Triangle-Approach-to-Trigonometry-3rd-Edition-Sullivan-Solutions-Manual
Full file at https://testbankuniv.eu/Precalculus-Concepts-Through-Functions-A-Right-Triangle-Approach-to-Trigonometry-3rd-Edition-Sullivan-Solutions-Manual

Section 2.3: Quadratic Functions and Their Zeros
173 Copyright © 2015 Pearson Education, Inc.
2
5 0 or 4 05 4
5 4not real 4 16
u uu u
x xx x
+ = − == − =
= − == = =
Check: ( )16 16 16 20 16 4 20 0g = + − = + − =
The only zero of ( ) 20g x x x= + − is 16. The only x-intercept of the graph of g is 16.
74. ( ) 0
2 0
f x
x x
=
+ − =
2Let u x u x= → =
( )( )2 2 0
1 2 0u u
u u+ − =
− + =
2
1 0 or 2 01 2
1 2not real1 1
u uu u
x xxx
− = + == = −
= = −== =
Check: ( )1 1 1 2 1 1 2 0f = + − = + − =
The only zero of ( ) 2f x x x= + − is 1. The only x-intercept of the graph of f is 1.
75. ( )2
2
0
50 0
50 50 5 2
f x
x
x x
=
− =
= = ± = ±
The zeros of ( ) 2 50f x x= − are 5 2− and
5 2 . The x-intercepts of the graph of f are 5 2− and 5 2 .
76. ( )2
2
0
20 0
20 20 2 5
f x
x
x x
=
− =
= = ± = ±
The zeros of ( ) 2 6f x x= − are 2 5− and
2 5 . The x-intercepts of the graph of f are 2 5− and 2 5 .
77. ( )2
0
16 8 1 0
g x
x x
=
− + =
( )24 1 014 1 04
x
x x
− =
− = =
The only real zero of ( ) 216 8 1g x x x= − + is 14
.
The only x-intercept of the graph of g is 14
.
78. ( )
( )
2
2
0
4 12 9 0
2 3 032 3 02
F x
x x
x
x x
=
− + =
− =
− = =
The only real zero of ( ) 24 12 9F x x x= − + is 32
.
The only x-intercept of the graph of F is 32
.
79. ( )
( )( )2
0
10 19 15 05 3 2 5 0
G x
x xx x
=
− − =+ − =
5 3 0 or 2 5 03 55 2
x x
x x
+ = − =
= − =
The zeros of ( ) 210 19 15G x x x= − − are 35
− and
52
. The x-intercepts of the graph of G are 35
−
and 52
.
80. ( )
( )( )2
0
6 7 20 03 4 2 5 0
f x
x xx x
=
+ − =− + =
3 4 0 or 2 5 04 53 2
x x
x x
− = + =
= = −
The zeros of ( ) 26 7 20f x x x= + − are 52
− and 43
.
The x-intercepts of the graph of f are 52
− and 43
.
81. ( )
( )( )2
0
6 2 03 2 2 1 0
P x
x xx x
=
− − =− + =
3 2 0 or 2 1 02 13 2
x x
x x
− = + =
= = −
Full file at https://testbankuniv.eu/Precalculus-Concepts-Through-Functions-A-Right-Triangle-Approach-to-Trigonometry-3rd-Edition-Sullivan-Solutions-Manual
Full file at https://testbankuniv.eu/Precalculus-Concepts-Through-Functions-A-Right-Triangle-Approach-to-Trigonometry-3rd-Edition-Sullivan-Solutions-Manual

Chapter 2: Linear and Quadratic Functions
174 Copyright © 2015 Pearson Education, Inc.
The zeros of ( ) 26 2P x x x= − − are 12
− and 23
.
The x-intercepts of the graph of P are 12
− and 23
.
82. ( )
( )( )2
0
6 2 03 2 2 1 0
H x
x xx x
=
+ − =+ − =
3 2 0 or 2 1 02 13 2
x x
x x
+ = − =
= − =
The zeros of ( ) 26 2H x x x= + − are 23
− and 12
.
The x-intercepts of the graph of H are 23
− and 12
.
83. ( )
( )( )
2
2
2
012 02
12 2 0 22
2 2 2 1 0
G x
x x
x x
x x
=
+ − =
+ − =
+ − =
2, 2 2, 1a b c= = = −
( )2(2 2) (2 2) 4(2) 12(2)
2 2 8 8 2 2 164 4
2 2 4 2 24 2
x− ± − −
=
− ± + − ±= =
− ± − ±= =
The zeros of ( ) 2 122
G x x x= + − are 2 22
− −
and 2 22
− + . The x-intercepts of the graph of G
are 2 22
− − and 2 22
− + .
84. ( )
( )( )
2
2
2
01 2 1 02
12 2 1 0 22
2 2 2 0
F x
x x
x x
x x
=
− − =
− − =
− − =
1, 2 2, 2a b c= = − = −
( )2( 2 2) ( 2 2) 4(1) 22(1)
2 2 16 2 2 4 2 22 2 1
x− − ± − − −
=
± ± ±= = =
The zeros of ( ) 21 2 12
F x x x= − − are 2 2−
and 2 2+ . The x-intercepts of the graph of F are 2 2− and 2 2+ .
85. ( )2
0
4 0
f x
x x
=
+ − =
1, 1, 4a b c= = = −
( )( )2(1) (1) 4 1 42(1)
1 1 16 1 172 2
x− ± − −
=
− ± + − ±= =
The zeros of ( ) 2 4f x x x= + − are 1 172
− − and
1 172
− + . The x-intercepts of the graph of f are
1 172
− − and 1 172
− + .
86. ( )2
0
1 0
g x
x x
=
+ − =
1, 1, 1a b c= = = −
( )( )2(1) (1) 4 1 1 1 52(1) 2
x− ± − − − ±= =
The zeros of ( ) 2 1g x x x= + − are 1 52
− − and
1 52
− + . The x-intercepts of the graph of g are
1 52
− − and 1 52
− + .
87. a. 2( ) ( 1) 4g x x= − − Using the graph of 2y x= , horizontally shift to the right 1 unit, and then vertically shift
Full file at https://testbankuniv.eu/Precalculus-Concepts-Through-Functions-A-Right-Triangle-Approach-to-Trigonometry-3rd-Edition-Sullivan-Solutions-Manual
Full file at https://testbankuniv.eu/Precalculus-Concepts-Through-Functions-A-Right-Triangle-Approach-to-Trigonometry-3rd-Edition-Sullivan-Solutions-Manual

Section 2.3: Quadratic Functions and Their Zeros
175 Copyright © 2015 Pearson Education, Inc.
downward 4 units.
b. ( )2
2
2
0
( 1) 4 0
2 1 4 0
2 3 0( 1)( 3) 0 1 or 3
g x
x
x x
x xx x x x
=
− − =
− + − =
− − =+ − = = − =
88. a. 2( ) ( 3) 9F x x= + − Using the graph of 2y x= , horizontally shift to the left 3 units, and then vertically shift downward 9 units.
b. ( )2
2
2
0
( 3) 9 0
6 9 9 0
6 0( 6) 0 0 or 6
F x
x
x x
x xx x x x
=
+ − =
+ + − =
+ =+ = = = −
89. a. 2( ) 2( 4) 8f x x= + − Using the graph of 2y x= , horizontally shift to the left 4 units, vertically stretch by a factor of 2, and then vertically shift downward 8
units.
b. ( )2
2
2
2
0
2( 4) 8 0
2( 8 16) 8 0
2 16 32 8 0
2 16 24 02( 2)( 6) 0 2 or 6
f x
x
x x
x x
x xx x x x
=
+ − =
+ + − =
+ + − =
+ + =+ + = = − = −
90. a. 2( ) 3( 2) 12h x x= − − Using the graph of 2y x= , horizontally shift to the right 2 units, vertically stretch by a factor of 3, and then vertically shift downward 12 units.
b. ( )2
2
2
2
0
3( 2) 12 0
3( 4 4) 12 0
3 12 12 12 0
3 12 03 ( 4) 0 0 or 4
h x
x
x x
x x
x xx x x x
=
− − =
− + − =
− + − =
− =− = = =
Full file at https://testbankuniv.eu/Precalculus-Concepts-Through-Functions-A-Right-Triangle-Approach-to-Trigonometry-3rd-Edition-Sullivan-Solutions-Manual
Full file at https://testbankuniv.eu/Precalculus-Concepts-Through-Functions-A-Right-Triangle-Approach-to-Trigonometry-3rd-Edition-Sullivan-Solutions-Manual

Chapter 2: Linear and Quadratic Functions
176 Copyright © 2015 Pearson Education, Inc.
91. a. 2( ) 3( 3) 6H x x= − − + Using the graph of 2y x= , horizontally shift to the right 3 units, vertically stretch by a factor of 3, reflect about the x-axis, and then vertically shift upward 6 units.
b. ( )2
2
2
2
2
0
3( 3) 6 0
3( 6 9) 6 0
3 18 27 6 0
3 18 21 0
3( 6 7) 0
H x
x
x x
x x
x x
x x
=
− − + =
− − + + =
− + − + =
− + − =
− − + =
1, 6, 7a b c= = − =
( )( )2( 6) ( 6) 4 1 7 6 36 282(1) 2
6 8 6 2 2 3 22 2
x− − ± − − ± −= =
± ±= = = ±
92. a. 2( ) 2( 1) 12f x x= − + + Using the graph of 2y x= , horizontally shift to the left 1 unit, vertically stretch by a factor of 2, reflect about the x-axis, and then vertically shift upward 12 units.
b. ( )2
2
2
2
2
0
2( 1) 12 0
2( 2 1) 12 0
2 4 2 12 0
2 4 10 0
2( 2 5) 0
f x
x
x x
x x
x x
x x
=
− + + =
− + + + =
− − − + =
− − + =
− + − =
1, 2, 5a b c= = = −
( )( )2(2) (2) 4 1 5 2 4 202(1) 2
2 24 2 2 6 1 62 2
x− ± − − − ± += =
− ± − ±= = = − ±
93. ( ) ( )2
2 2
2
5 ( 1) 7 25 5 7 2
12 5 2 02 1(3 2)(4 1) 0 or 3 4
f x g x
x x xx x x
x x
x x x x
=
− = − +− = − +
− − =
− + = = = −
2 2 25 13 3 3
10 1 103 3 9
1 1 15 14 4 4
5 5 254 4 16
f
f
= − = − = −
− = − − − = − − =
The points of intersection are: 2 10 1 25, and ,3 9 4 16
− −
94. ( ) ( )
2
2
10 ( 2) 3 510 20 3 5
10 23 5 05 1(2 5)(5 1) 0 or 2 5
f x g xx x x
x x xx x
x x x x
=+ = − +
+ = − ++ − =
+ − = = − =
Full file at https://testbankuniv.eu/Precalculus-Concepts-Through-Functions-A-Right-Triangle-Approach-to-Trigonometry-3rd-Edition-Sullivan-Solutions-Manual
Full file at https://testbankuniv.eu/Precalculus-Concepts-Through-Functions-A-Right-Triangle-Approach-to-Trigonometry-3rd-Edition-Sullivan-Solutions-Manual

Section 2.3: Quadratic Functions and Their Zeros
177 Copyright © 2015 Pearson Education, Inc.
( )
( )
5 5 510 22 2 2
1 25252 2
1 1 110 25 5 5
11 2225 5
f
f
− = − − + = − − = = +
= =
The points of intersection are: 5 25 1 22, and ,2 2 5 5
−
95. ( ) ( )2 2
2 2
3( 4) 3 2 43 12 3 2 4
12 2 416 2 8
f x g x
x x xx x x
xx x
=
− = + +− = + +− = +− = = −
( ) ( )[ ]
28 3 8 4
3 64 4 180
f − = − − = − =
The point of intersection is: ( )8,180−
96. ( ) ( )2 2
2 2
4( 1) 4 3 84 4 4 3 8
4 3 812 3 4
f x g x
x x xx x x
xx x
=
+ = − −+ = − −
= − −= − = −
( ) ( )[ ]
24 4 4 1
4 16 1 68
f − = − + = + =
The point of intersection is: ( )4,68−
97. ( ) ( )
2
2
2
3 5 52 1 3 2
3 5 52 1 ( 2)( 1)
3 ( 1) 5( 2) 53 3 5 10 5
3 2 5 0(3 5)( 1) 0
f x g xx
x x x xx
x x x xx x xx x x
x xx x
=−− =
+ + + +−− =
+ + + ++ − + = −+ − − = −
− − =− + =
5 or 13
x x= = −
( )
535 53
5 53 2 13 35 5
11 83 3
15 1511 8
4588
f
= − + +
= −
= −
= −
The point of intersection is: 5 45,3 88
−
98. ( ) ( )
2
2
2
2 3 2 183 1 2 3
2 3 2 183 1 ( 3)( 1)
2 ( 1) 3( 3) 2 182 2 3 9 2 18
2 3 9 0(2 3)( 3) 0
f x g xx x
x x x xx x
x x x xx x x x
x x x xx x
x x
=+− =
− + − −+− =
− + − ++ − − = ++ − + = +
− − =+ − =
3 or 32
x x= − =
( )
323 32
3 32 3 12 23 39 12 2
6 2 206 69 3 3
f
− − = − − − − +
−= − − −
= + = + =
The point of intersection is: 3 20,2 3
−
99. a. ( )2 2
2
( )
5 14 3 42 8 18
f g x
x x x xx x
+ =
= + − + + −= + −
2
2
2 8 18 04 9 0
x xx x
+ − =+ − =
Full file at https://testbankuniv.eu/Precalculus-Concepts-Through-Functions-A-Right-Triangle-Approach-to-Trigonometry-3rd-Edition-Sullivan-Solutions-Manual
Full file at https://testbankuniv.eu/Precalculus-Concepts-Through-Functions-A-Right-Triangle-Approach-to-Trigonometry-3rd-Edition-Sullivan-Solutions-Manual
Chapter 2: Linear and Quadratic Functions
178 Copyright © 2015 Pearson Education, Inc.
( )( )2(4) (4) 4 1 9 4 16 362(1) 2
4 52 4 2 13 2 132 2
x− ± − − − ± += =
− ± − ±= = = − ±
b. ( )( ) ( )2 2
2 2
( )
5 14 3 4
5 14 3 42 10
2 10 0 5
f g x
x x x x
x x x xx
x x
− =
= + − − + −
= + − − − += −
− = =
c. ( )( )( )( )( )( )( )
2 2
( )
5 14 3 4
7 2 4 1
f g x
x x x x
x x x x
⋅ =
= + − + −
= + − + −
( )( )( )( )( )
( ) 00 7 2 4 1
7 or 2 or 4 or 1
f g x
x x x xx x x x
⋅ =
= + − + − = − = = − =
100. a. ( )
( )( )
2 2
2
2
( )
3 18 2 32 21
2 21 072 7 3 0 or 32
f g x
x x x xx x
x x
x x x x
+ =
= − − + + −= − −
− − =
− + = = = −
b. ( )( ) ( )2 2
2 2
( )
3 18 2 3
3 18 2 35 15
5 15 0 3
f g x
x x x x
x x x xx
x x
− =
= − − − + −
= − − − − += − −
− − = = −
c. ( )( ) ( )( )( )( )( )
2 2
( )
3 18 2 3
3 6 3 1
f g x
x x x x
x x x x
⋅ =
= − − + −
= + − + −
( )( )( )( )( )
( ) 00 3 6 3 1
3 or 6 or 1
f g x
x x x xx x x
⋅ =
= + − + − = − = =
101.
2
( ) 143( 2) 143
2 143 0( 13)( 11) 0
A xx x
x xx x
=+ =
+ − =+ − =
13x = − or 11x = Discard the negative solution since width cannot be negative. The width of the rectangular window is 11 feet and the length is 13 feet.
102.
2
( ) 306( 1) 306
306 0( 18)( 17) 0
A xx x
x xx x
=+ =
+ − =+ − =
18x = − or 17x = Discard the negative solution since width cannot be negative. The width of the rectangular window is 17 cm and the length is 18 cm.
103. ( )( )2
4
2 4
2 42 2
2 2
V x
x
xx
x
=
− =
− = ±− = ±
= ±
4 or 0x x= = Discard 0x = since that is not a feasible length for the original sheet. Therefore, the original sheet should measure 4 feet on each side.
104. ( )( )2
4
2 16
2 162 4
2 4
V x
x
xx
x
=
− =
− = ±− = ±
= ±
6 or 2x x= = − Discard 2x = − since width cannot be negative. Therefore, the original sheet should measure 6 feet on each side.
105. a. When the ball strikes the ground, the distance from the ground will be 0. Therefore, we solve
Full file at https://testbankuniv.eu/Precalculus-Concepts-Through-Functions-A-Right-Triangle-Approach-to-Trigonometry-3rd-Edition-Sullivan-Solutions-Manual
Full file at https://testbankuniv.eu/Precalculus-Concepts-Through-Functions-A-Right-Triangle-Approach-to-Trigonometry-3rd-Edition-Sullivan-Solutions-Manual

Section 2.3: Quadratic Functions and Their Zeros
179 Copyright © 2015 Pearson Education, Inc.
( )( )
2
2
2
0
96 80 16 0
16 80 96 0
5 6 06 1 0
s
t t
t t
t tt t
=
+ − =
− + + =
− − =− + =
6 or 1t t= = − Discard the negative solution since the time of flight must be positive. The ball will strike the ground after 6 seconds.
b. When the ball passes the top of the building, it will be 96 feet from the ground. Therefore, we solve
( )
2
2
2
96
96 80 16 96
16 80 0
5 05 0
s
t t
t t
t tt t
=
+ − =
− + =
− =− =
0 or 5t t= = The ball is at the top of the building at time
0t = seconds when it is thrown. It will pass the top of the building on the way down after 5 seconds.
106. a. To find when the object will be 15 meters above the ground, we solve
2
2
15
4.9 20 15
4.9 20 15 0
s
t t
t t
=
− + =
− + − =
4.9, 20, 15a b c= − = = −
( )( )( )
220 20 4 4.9 152 4.9
20 1069.8
20 1069.8
t− ± − − −
=−
− ±=−±=
0.99 or 3.09t t≈ ≈ The object will be 15 meters above the ground after about 0.99 seconds (on the way up) and about 3.09 seconds (on the way down).
b. The object will strike the ground when the distance from the ground is 0. Thus, we solve
( )2
0
4.9 20 04.9 20 0
s
t tt t
=
− + =− + =
0t = or 4.9 20 04.9 20
4.08
ttt
− + =− = −
≈
The object will strike the ground after about 4.08 seconds.
c. 2
2
100
4.9 20 100
4.9 20 100 0
s
t t
t t
=
− + =
− + − =
4.9, 20, 100a b c= − = = −
( )( )( )
220 20 4 4.9 1002 4.9
20 15609.8
t− ± − − −
=−
− ± −=−
There is no real solution. The object never reaches a height of 100 meters.
107. For the sum to be 210, we solve
2
( ) 2101 ( 1) 2102
( 1) 420
420 0( 20)( 21) 0
S n
n n
n n
n nn n
=
+ =
+ =
+ − =− + =
20 0 or 21 020 21
n nn n
− = + == = −
Discard the negative solution since the number of consecutive integers must be positive. For a sum of 210, we must add the 20 consecutive integers, starting at 1.
108. To determine the number of sides when a polygon has 65 diagonals, we solve
2
( ) 651 ( 3) 652
( 3) 130
3 130 0( 10)( 13) 0
D n
n n
n n
n nn n
=
− =
− =
− − =+ − =
10 0 10n
n
+ =
= −
or 13 013
nn
− ==
Discard the negative solution since the number of sides must be positive. A polygon with 65 diagonals will have 13 sides.
To determine the number of sides if a polygon has 80 diagonals, we solve
Full file at https://testbankuniv.eu/Precalculus-Concepts-Through-Functions-A-Right-Triangle-Approach-to-Trigonometry-3rd-Edition-Sullivan-Solutions-Manual
Full file at https://testbankuniv.eu/Precalculus-Concepts-Through-Functions-A-Right-Triangle-Approach-to-Trigonometry-3rd-Edition-Sullivan-Solutions-Manual

Chapter 2: Linear and Quadratic Functions
180 Copyright © 2015 Pearson Education, Inc.
2
( ) 801 ( 3) 802
( 3) 160
3 160 0
D n
n n
n n
n n
=
− =
− =
− − =
1, 3, 160a b c= = − = − 2( 3) ( 3) 4(1)( 160)
2(1)
3 6492
t− − ± − − −
=
±=
Since the solutions are not integers, a polygon with 80 diagonals is not possible.
109. The roots of a quadratic equation are 2
14
2b b acx
a− − −= and
2
24
2b b acx
a− + −= ,
so the sum of the roots is 2 2
1 2
2 2
4 42 2
4 42
22
b b ac b b acx xa a
b b ac b b aca
b ba a
− − − − + −+ = +
− − − − + −=
−= = −
110. The roots of a quadratic equation are 2
14
2b b acx
a− − −= and
2
24
2b b acx
a− + −= ,
so the product of the roots is
( ) ( )( )
( )
2 2
1 2
22 2 2 2
2 2
2 2
2 2
4 42 2
4 442
4 44 4
b b ac b b acx xa a
b b ac b b acaa
b b ac ac caa a
− − − − + − ⋅ =
− − − − −= =
− += = =
111. In order to have one repeated real zero, we need the discriminant to be 0.
( )( )
2
2
2
2
2
4 0
1 4 0
1 4 0
4 114
14
1 1 or 2 2
b ac
k k
k
k
k
k
k k
− =
− =
− =
=
=
= ±
= = −
112. In order to have one repeated real zero, we need the discriminant to be 0.
( ) ( )( )
( )( )
2
2
2
4 0
4 1 4 0
16 04 4 0
b ac
k
kk k
− =
− − =
− =− + =
4 or 4k k= = −
113. For ( ) 2 0f x ax bx c= + + = : 2
14
2b b acx
a− − −= and
2
24
2b b acx
a− + −=
For ( ) 2 0f x ax bx c= − + = :
( ) ( )2*
1
2 2
2
42
4 42 2
b b acx
a
b b ac b b ac xa a
− − − − −=
− − − + − = = − = −
and
( ) ( )2*
2
2 2
1
42
4 42 2
b b acx
a
b b ac b b ac xa a
− − + − −=
+ − − − − = = − = −
Full file at https://testbankuniv.eu/Precalculus-Concepts-Through-Functions-A-Right-Triangle-Approach-to-Trigonometry-3rd-Edition-Sullivan-Solutions-Manual
Full file at https://testbankuniv.eu/Precalculus-Concepts-Through-Functions-A-Right-Triangle-Approach-to-Trigonometry-3rd-Edition-Sullivan-Solutions-Manual
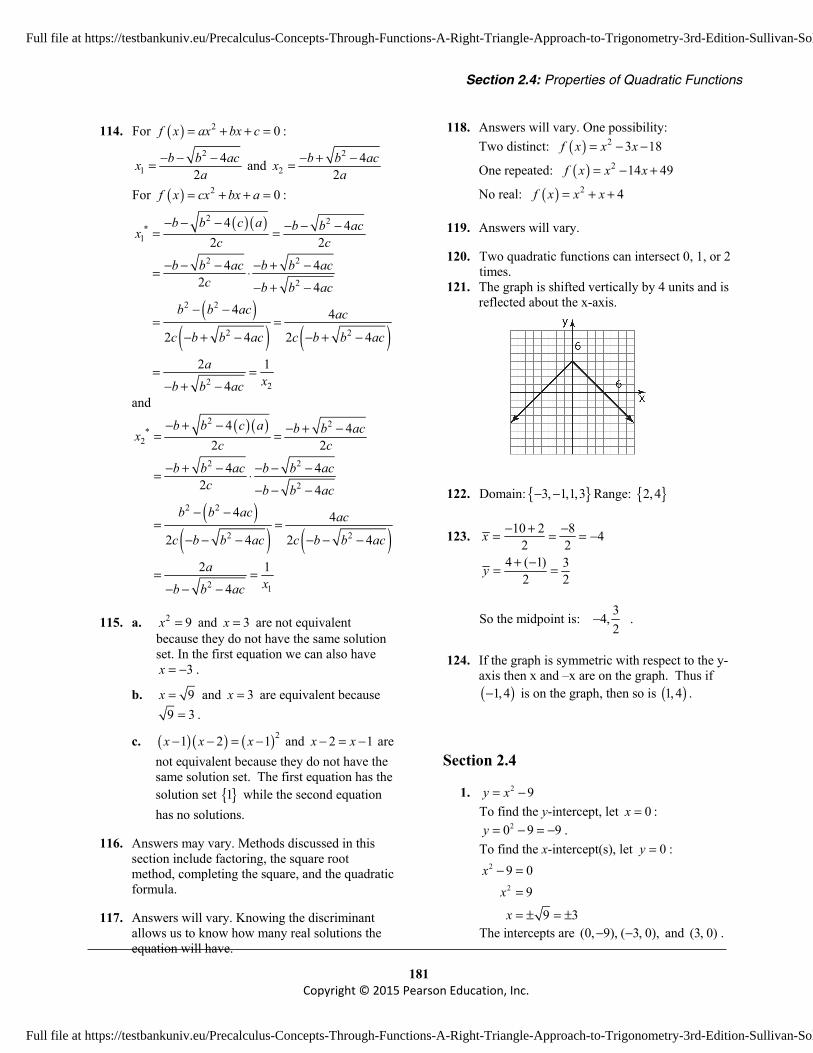
Section 2.4: Properties of Quadratic Functions
181 Copyright © 2015 Pearson Education, Inc.
114. For ( ) 2 0f x ax bx c= + + = : 2
14
2b b acx
a− − −= and
2
24
2b b acx
a− + −=
For ( ) 2 0f x cx bx a= + + = :
( )( )
( )( ) ( )
2 2*
1
2 2
2
2 2
2 2
2 2
4 42 2
4 42 4
4 4
2 4 2 4
2 14
b b c a b b acxc c
b b ac b b acc b b ac
b b ac ac
c b b ac c b b ac
axb b ac
− − − − − −= =
− − − − + −= ⋅− + −
− −= =
− + − − + −
= =− + −
and
( )( )
( )( ) ( )
2 2*
2
2 2
2
2 2
2 2
2 1
4 42 2
4 42 4
4 4
2 4 2 4
2 14
b b c a b b acxc c
b b ac b b acc b b ac
b b ac ac
c b b ac c b b ac
axb b ac
− + − − + −= =
− + − − − −= ⋅− − −
− −= =
− − − − − −
= =− − −
115. a. 2 9x = and 3x = are not equivalent because they do not have the same solution set. In the first equation we can also have
3x = − .
b. 9x = and 3x = are equivalent because 9 3= .
c. ( )( ) ( )21 2 1x x x− − = − and 2 1x x− = − are not equivalent because they do not have the same solution set. The first equation has the solution set { }1 while the second equation has no solutions.
116. Answers may vary. Methods discussed in this section include factoring, the square root method, completing the square, and the quadratic formula.
117. Answers will vary. Knowing the discriminant allows us to know how many real solutions the equation will have.
118. Answers will vary. One possibility: Two distinct: ( ) 2 3 18f x x x= − −
One repeated: ( ) 2 14 49f x x x= − +
No real: ( ) 2 4f x x x= + +
119. Answers will vary.
120. Two quadratic functions can intersect 0, 1, or 2 times.
121. The graph is shifted vertically by 4 units and is reflected about the x-axis.
122. Domain: { }3, 1,1,3− − Range: { }2,4
123. 10 2 8 42 24 ( 1) 3
2 2
x
y
− + −= = = −
+ −= =
So the midpoint is: 34,2
− .
124. If the graph is symmetric with respect to the y-axis then x and –x are on the graph. Thus if ( )1,4− is on the graph, then so is ( )1, 4 .
Section 2.4
1. 2 9y x= − To find the y-intercept, let 0x = :
20 9 9y = − = − . To find the x-intercept(s), let 0y = :
2
2
9 09
9 3
xx
x
− ==
= ± = ±
The intercepts are (0, 9), ( 3, 0),− − and (3, 0) .
Full file at https://testbankuniv.eu/Precalculus-Concepts-Through-Functions-A-Right-Triangle-Approach-to-Trigonometry-3rd-Edition-Sullivan-Solutions-Manual
Full file at https://testbankuniv.eu/Precalculus-Concepts-Through-Functions-A-Right-Triangle-Approach-to-Trigonometry-3rd-Edition-Sullivan-Solutions-Manual

Chapter 2: Linear and Quadratic Functions
182 Copyright © 2015 Pearson Education, Inc.
2. ( )( )
22 7 4 02 1 4 0
x xx x
+ − =− + =
2 1 0 or 4 02 1 or 4
1 or 42
x xx x
x x
− = + == = −
= = −
The solution set is 14, .2
−
3. 21 25( 5)
2 4 ⋅ − =
4. right; 4
5. parabola
6. axis (or axis of symmetry)
7. 2ba
−
8. True; 2 0a = > .
9. True; ( )4 2
2 2 1ba
− = − =−
10. True
11. C
12. E
13. F
14. A
15. G
16. B
17. H
18. D
19. 21( ) 24
f x x= −
Using the graph of 2y x= , compress vertically
by a factor of 14
, then shift down 2 units.
20. 2( ) 2 4f x x= + Using the graph of 2y x= , stretch vertically by a factor of 2, then shift up 4 units.
21. 2( ) ( 2) 2f x x= + −
Using the graph of 2y x= , shift left 2 units, then shift down 2 units.
22. 2( ) ( 3) 10f x x= − −
Using the graph of 2y x= , shift right 3 units,
Full file at https://testbankuniv.eu/Precalculus-Concepts-Through-Functions-A-Right-Triangle-Approach-to-Trigonometry-3rd-Edition-Sullivan-Solutions-Manual
Full file at https://testbankuniv.eu/Precalculus-Concepts-Through-Functions-A-Right-Triangle-Approach-to-Trigonometry-3rd-Edition-Sullivan-Solutions-Manual
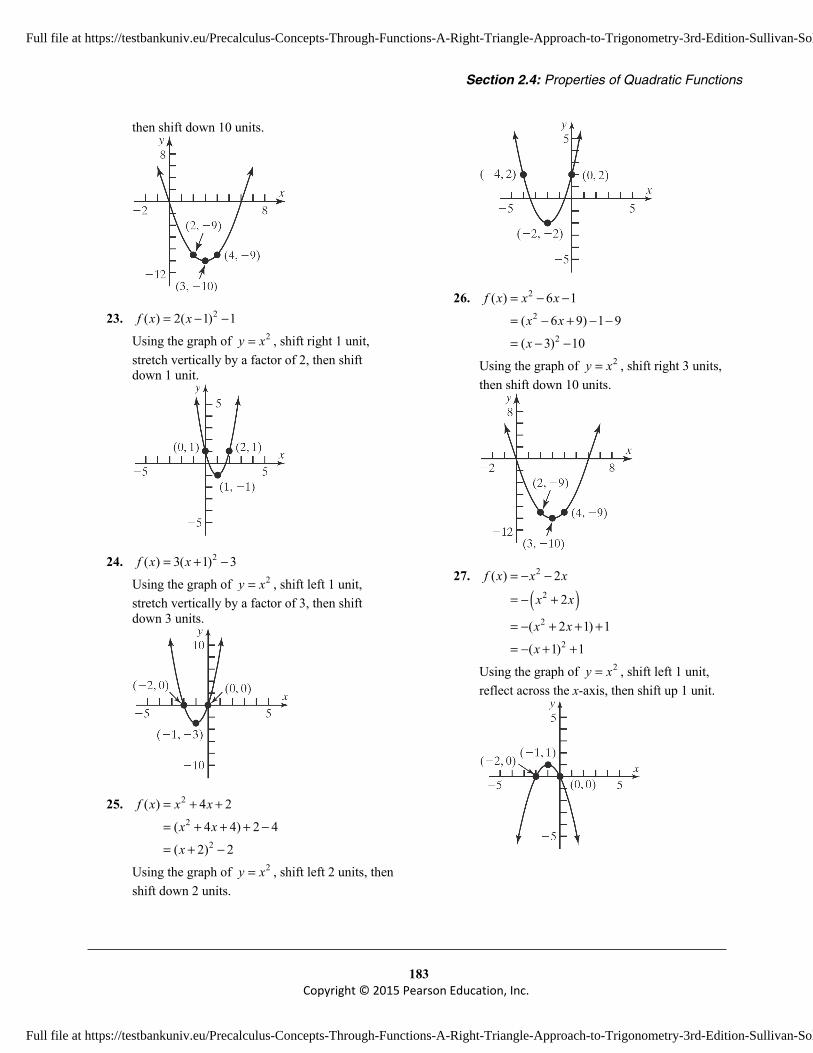
Section 2.4: Properties of Quadratic Functions
183 Copyright © 2015 Pearson Education, Inc.
then shift down 10 units.
23. 2( ) 2( 1) 1f x x= − −
Using the graph of 2y x= , shift right 1 unit, stretch vertically by a factor of 2, then shift down 1 unit.
24. 2( ) 3( 1) 3f x x= + −
Using the graph of 2y x= , shift left 1 unit, stretch vertically by a factor of 3, then shift down 3 units.
25. 2
2
2
( ) 4 2
( 4 4) 2 4
( 2) 2
f x x x
x x
x
= + +
= + + + −
= + −
Using the graph of 2y x= , shift left 2 units, then shift down 2 units.
26. 2
2
2
( ) 6 1
( 6 9) 1 9
( 3) 10
f x x x
x x
x
= − −
= − + − −
= − −
Using the graph of 2y x= , shift right 3 units, then shift down 10 units.
27.
( )2
2
2
2
( ) 2
2
( 2 1) 1
( 1) 1
f x x x
x x
x x
x
= − −
= − +
= − + + +
= − + +
Using the graph of 2y x= , shift left 1 unit, reflect across the x-axis, then shift up 1 unit.
Full file at https://testbankuniv.eu/Precalculus-Concepts-Through-Functions-A-Right-Triangle-Approach-to-Trigonometry-3rd-Edition-Sullivan-Solutions-Manual
Full file at https://testbankuniv.eu/Precalculus-Concepts-Through-Functions-A-Right-Triangle-Approach-to-Trigonometry-3rd-Edition-Sullivan-Solutions-Manual

Chapter 2: Linear and Quadratic Functions
184 Copyright © 2015 Pearson Education, Inc.
28.
( )2
2
2
2
( ) 2 6 2
2 3 2
9 92 3 24 2
3 1322 2
f x x x
x x
x x
x
= − + +
= − − +
= − − + + +
= − − +
Using the graph of 2y x= , shift right 32
units,
reflect about the x-axis, stretch vertically by a
factor of 2, then shift up 132
units.
29.
( )( )( )
2
2
2
2
( ) 2 4 2
2 2 2
2 2 1 2 2
2 1 4
f x x x
x x
x x
x
= + −
= + −
= + + − −
= + −
Using the graph of 2y x= , shift left 1 unit, stretch vertically by a factor of 2, then shift down 4 units.
30.
( )( )( )
2
2
2
2
( ) 3 12 5
3 4 5
3 4 4 5 12
3 2 7
f x x x
x x
x x
x
= + +
= + +
= + + + −
= + −
Using the graph of 2y x= , shift left 2 units,
stretch vertically by a factor of 3, then shift down 7 units.
31. a. For 2( ) 2f x x x= + , 1a = , 2b = , 0.c = Since 1 0a = > , the graph opens up. The x-coordinate of the vertex is
(2) 2 12 2(1) 2
bxa
−− −= = = = − .
The y-coordinate of the vertex is 2( 1) ( 1) 2( 1) 1 2 1.
2bf fa
− = − = − + − = − = −
Thus, the vertex is ( 1, 1)− − . The axis of symmetry is the line 1x = − . The discriminant is
2 24 (2) 4(1)(0) 4 0b ac− = − = > , so the graph has two x-intercepts. The x-intercepts are found by solving:
2 2 0( 2) 0
0 or 2
x xx xx x
+ =+ =
= = −
The x-intercepts are –2 and 0 . The y-intercept is (0) 0f = .
b. The domain is ( , )−∞ ∞ .
The range is [ 1, )− ∞ .
c. Decreasing on ( , 1)−∞ − . Increasing on ( )1,− ∞ .
Full file at https://testbankuniv.eu/Precalculus-Concepts-Through-Functions-A-Right-Triangle-Approach-to-Trigonometry-3rd-Edition-Sullivan-Solutions-Manual
Full file at https://testbankuniv.eu/Precalculus-Concepts-Through-Functions-A-Right-Triangle-Approach-to-Trigonometry-3rd-Edition-Sullivan-Solutions-Manual

Section 2.4: Properties of Quadratic Functions
185 Copyright © 2015 Pearson Education, Inc.
32. a. For 2( ) 4f x x x= − , 1a = , 4b = − , 0c = . Since 1 0a = > , the graph opens up. The x-coordinate of the vertex is
( 4) 4 22 2(1) 2
bxa
− −−= = = = .
The y-coordinate of the vertex is 2(2) (2) 4(2) 4 8 4.
2bf fa
− = = − = − = −
Thus, the vertex is (2, 4)− . The axis of symmetry is the line 2x = . The discriminant is:
2 24 ( 4) 4(1)(0) 16 0b ac− = − − = > , so the graph has two x-intercepts. The x-intercepts are found by solving:
2 4 0( 4) 0
0 or 4.
x xx xx x
− =− =
= =
The x-intercepts are 0 and 4. The y-intercept is (0) 0f = .
b. The domain is ( , )−∞ ∞ .
The range is [ 4, )− ∞ .
c. Decreasing on ( , 2)−∞ . Increasing on (2, )∞ .
33. a. For 2( ) 6f x x x= − − , 1a = − , 6b = − , 0c = . Since 1 0,a = − < the graph opens
down. The x-coordinate of the vertex is ( 6) 6 3.
2 2( 1) 2bxa
− −−= = = = −− −
The y-coordinate of the vertex is 2( 3) ( 3) 6( 3)
29 18 9.
bf fa
− = − = − − − −
= − + =
Thus, the vertex is ( 3, 9)− . The axis of symmetry is the line 3x = − .
The discriminant is: 2 24 ( 6) 4( 1)(0) 36 0b ac− = − − − = > ,
so the graph has two x-intercepts. The x-intercepts are found by solving:
2 6 0( 6) 00 or 6.
x xx x
x x
− − =− + =
= = −
The x-intercepts are 6 and 0− . The y-intercepts are (0) 0f = .
b. The domain is ( , )−∞ ∞ .
The range is ( , 9]−∞ .
c. Increasing on ( , 3)−∞ − . Decreasing on ( 3, )− ∞ .
34. a. For 2( ) 4 ,f x x x= − + 1,a = − 4b = , 0c = . Since 1 0a = − < , the graph opens down. The x-coordinate of the vertex is
4 4 2.2 2( 1) 2
bxa
− − −= = = =− −
The y-coordinate of the vertex is
2
(2)2
(2) 4(2)4.
bf fa
− =
= − +=
Thus, the vertex is (2, 4) . The axis of symmetry is the line 2x = . The discriminant is:
2 24 4 4( 1)(0) 16 0,b ac− = − − = > so the graph has two x-intercepts. The x-intercepts are found by solving:
2 4 0( 4) 00 or 4.
x xx x
x x
− + =− − =
= =
The x-intercepts are 0 and 4. The y-intercept is (0) 0f = .
Full file at https://testbankuniv.eu/Precalculus-Concepts-Through-Functions-A-Right-Triangle-Approach-to-Trigonometry-3rd-Edition-Sullivan-Solutions-Manual
Full file at https://testbankuniv.eu/Precalculus-Concepts-Through-Functions-A-Right-Triangle-Approach-to-Trigonometry-3rd-Edition-Sullivan-Solutions-Manual

Chapter 2: Linear and Quadratic Functions
186 Copyright © 2015 Pearson Education, Inc.
b. The domain is ( , )−∞ ∞ .
The range is ( , 4]−∞ .
c. Increasing on ( , 2)−∞ . Decreasing on (2, )∞ .
35. a. For 2( ) 2 8f x x x= + − , 1a = , 2b = , 8c = − . Since 1 0a = > , the graph opens up. The x-coordinate of the vertex is
2 2 12 2(1) 2
bxa
− − −= = = = − .
The y-coordinate of the vertex is 2( 1) ( 1) 2( 1) 8
21 2 8 9.
bf fa
− = − = − + − −
= − − = −
Thus, the vertex is ( 1, 9)− − . The axis of symmetry is the line 1x = − . The discriminant is:
2 24 2 4(1)( 8) 4 32 36 0b ac− = − − = + = > , so the graph has two x-intercepts.
The x-intercepts are found by solving: 2 2 8 0
( 4)( 2) 04 or 2.
x xx x
x x
+ − =+ − =
= − =
The x-intercepts are 4 and 2− . The y-intercept is (0) 8f = − .
b. The domain is ( , )−∞ ∞ . The range is [ 9, )− ∞ .
c. Decreasing on ( , 1)−∞ − . Increasing on ( 1, )− ∞ .
36. a. For 2( ) 2 3,f x x x= − − 1,a = 2,b = − 3.c = −
Since 1 0a = > , the graph opens up. The x-coordinate of the vertex is
( 2) 2 1.2 2(1) 2
bxa
− −−= = = =
The y-coordinate of the vertex is 2(1) 1 2(1) 3 4.
2bf fa
− = = − − = −
Thus, the vertex is (1, 4)− . The axis of symmetry is the line 1x = . The discriminant is:
2 24 ( 2) 4(1)( 3) 4 12 16 0b ac− = − − − = + = > , so the graph has two x-intercepts. The x-intercepts are found by solving:
2 2 3 0( 1)( 3) 0
1 or 3.
x xx x
x x
− − =+ − =
= − =
The x-intercepts are 1 and 3− . The y-intercept is (0) 3f = − .
b. The domain is ( , )−∞ ∞ .
The range is [ 4, )− ∞ .
c. Decreasing on ( , 1)−∞ . Increasing on (1, )∞ .
37. a. For 2( ) 2 1f x x x= + + , 1a = , 2b = , 1c = . Since 1 0a = > , the graph opens up. The x-coordinate of the vertex is
2 2 12 2(1) 2
bxa
− − −= = = = − .
The y-coordinate of the vertex is
Full file at https://testbankuniv.eu/Precalculus-Concepts-Through-Functions-A-Right-Triangle-Approach-to-Trigonometry-3rd-Edition-Sullivan-Solutions-Manual
Full file at https://testbankuniv.eu/Precalculus-Concepts-Through-Functions-A-Right-Triangle-Approach-to-Trigonometry-3rd-Edition-Sullivan-Solutions-Manual

Section 2.4: Properties of Quadratic Functions
187 Copyright © 2015 Pearson Education, Inc.
2
( 1)2
( 1) 2( 1) 1 1 2 1 0.
bf fa
− = −
= − + − + = − + =
Thus, the vertex is ( 1, 0)− . The axis of symmetry is the line 1x = − .
The discriminant is: 2 24 2 4(1)(1) 4 4 0b ac− = − = − = ,
so the graph has one x-intercept. The x-intercept is found by solving:
2
2
2 1 0
( 1) 01.
x x
xx
+ + =
+ == −
The x-intercept is 1− . The y-intercept is (0) 1f = .
b. The domain is ( , )−∞ ∞ . The range is [0, )∞ .
c. Decreasing on ( , 1)−∞ − . Increasing on ( 1, )− ∞ .
38. a. For 2( ) 6 9f x x x= + + , 1a = , 6b = , 9c = . Since 1 0a = > , the graph opens up. The x-coordinate of the vertex is
6 6 32 2(1) 2
bxa
− − −= = = = − .
The y-coordinate of the vertex is 2( 3) ( 3) 6( 3) 9
29 18 9 0.
bf fa
− = − = − + − +
= − + =
Thus, the vertex is ( 3, 0)− . The axis of symmetry is the line 3x = − . The discriminant is:
2 24 6 4(1)(9) 36 36 0b ac− = − = − = , so the graph has one x-intercept. The x-intercept is found by solving:
2
2
6 9 0
( 3) 03.
x x
xx
+ + =
+ == −
The x-intercept is 3− . The y-intercept is (0) 9f = .
b. The domain is ( , )−∞ ∞ . The range is [0, )∞ .
c. Decreasing on ( , 3)−∞ − . Increasing on ( 3, )− ∞ .
39. a. For 2( ) 2 2f x x x= − + , 2a = , 1b = − , 2c = . Since 2 0a = > , the graph opens up. The x-coordinate of the vertex is
( 1) 12 2(2) 4
bxa
− −−= = = .
The y-coordinate of the vertex is 21 1 12 2
2 4 4 41 1 152 .8 4 8
bf fa
− = = − +
= − + =
Thus, the vertex is 1 15,4 8
.
The axis of symmetry is the line 14x = .
The discriminant is: 2 24 ( 1) 4(2)(2) 1 16 15b ac− = − − = − = − ,
so the graph has no x-intercepts. The y-intercept is (0) 2f = .
b. The domain is ( , )−∞ ∞ .
The range is 15 ,8
∞ .
Full file at https://testbankuniv.eu/Precalculus-Concepts-Through-Functions-A-Right-Triangle-Approach-to-Trigonometry-3rd-Edition-Sullivan-Solutions-Manual
Full file at https://testbankuniv.eu/Precalculus-Concepts-Through-Functions-A-Right-Triangle-Approach-to-Trigonometry-3rd-Edition-Sullivan-Solutions-Manual

Chapter 2: Linear and Quadratic Functions
188 Copyright © 2015 Pearson Education, Inc.
c. Decreasing on 14
, −
∞ .
Increasing on 1 ,4
∞ .
40. a. For 2( ) 4 2 1f x x x= − + , 4a = , 2b = − , 1c = . Since 4 0a = > , the graph opens up. The x-coordinate of the vertex is
( 2) 2 12 2(4) 8 4
bxa
− −−= = = = .
The y-coordinate of the vertex is 21 1 14 2 1
2 4 4 41 1 31 .4 2 4
bf fa
− = = − +
= − + =
Thus, the vertex is ( )314 4, .
The axis of symmetry is the line 14x = .
The discriminant is: 2 24 ( 2) 4(4)(1) 4 16 12b ac− = − − = − = − ,
so the graph has no x-intercepts. The y-intercept is (0) 1f = .
b. The domain is ( , )−∞ ∞ .
The range is )34 , ∞ .
c. Decreasing on ( )14,−∞ .
Increasing on ( )14 , ∞ .
41. a. For 2( ) 2 2 3f x x x= − + − , 2a = − , 2b = , 3c = − . Since 2 0a = − < , the graph opens
down. The x-coordinate of the vertex is
(2) 2 12 2( 2) 4 2
bxa
−− −= = = =− −
.
The y-coordinate of the vertex is
21 1 12 2 32 2 2 2
1 51 3 .2 2
bf fa
− = = − + −
= − + − = −
Thus, the vertex is 1 5,2 2
−
.
The axis of symmetry is the line 12
x = .
The discriminant is: 2 24 2 4( 2)( 3) 4 24 20b ac− = − − − = − = − ,
so the graph has no x-intercepts. The y-intercept is (0) 3f = − .
b. The domain is ( , )−∞ ∞ .
The range is 5,2
−∞ − .
c. Increasing on 1,2
−∞
.
Decreasing on 1 ,2
∞
.
42. a. For 2( ) 3 3 2f x x x= − + − , 3a = − , 3b = , 2c = − . Since 3 0a = − < , the graph opens
down. The x-coordinate of the vertex is
3 3 12 2( 3) 6 2
bxa
− − −= = = =− −
.
The y-coordinate of the vertex is 21 1 13 3 2
2 2 2 23 3 52 .4 2 4
bf fa
− = = − + −
= − + − = −
Thus, the vertex is 1 5,2 4
−
.
The axis of symmetry is the line 12
x = .
The discriminant is:
Full file at https://testbankuniv.eu/Precalculus-Concepts-Through-Functions-A-Right-Triangle-Approach-to-Trigonometry-3rd-Edition-Sullivan-Solutions-Manual
Full file at https://testbankuniv.eu/Precalculus-Concepts-Through-Functions-A-Right-Triangle-Approach-to-Trigonometry-3rd-Edition-Sullivan-Solutions-Manual

Section 2.4: Properties of Quadratic Functions
189 Copyright © 2015 Pearson Education, Inc.
2 24 3 4( 3)( 2) 9 24 15b ac− = − − − = − = − , so the graph has no x-intercepts. The y-intercept is (0) 2f = − .
b. The domain is ( , )−∞ ∞ .
The range is 5,4
−∞ − .
c. Increasing on 1, .2
−∞
Decreasing on 1 , .2
∞
43. a. For 2( ) 4 6 2f x x x= − − + , 4a = − , 6b = − , 2c = . Since 4 0a = − < , the graph opens
down. The x-coordinate of the vertex is
( 6) 6 32 2( 4) 8 4
bxa
− −−= = = = −− −
.
The y-coordinate of the vertex is 23 3 34 6 2
2 4 4 49 9 172 .4 2 4
bf fa
− = − = − − − − +
= − + + =
Thus, the vertex is 3 17,4 4
−
.
The axis of symmetry is the line 34
x = − .
The discriminant is: 2 24 ( 6) 4( 4)(2) 36 32 68b ac− = − − − = + = ,
so the graph has two x-intercepts. The x-intercepts are found by solving:
24 6 2 0x x− − + = 2 ( 6) 684
2 2( 4)
6 68 6 2 17 3 178 8 4
b b acxa
− − ±− ± −= =−
± ± ±= = =− − −
The x-intercepts are 3 174
− + and 3 174
− − .
The y-intercept is (0) 2f = .
b. The domain is ( , )−∞ ∞ .
The range is 17,4
−∞ .
c. Decreasing on 3 ,4
− ∞
.
Increasing on 3,4
−∞ −
.
44. a. For 2( ) 3 8 2,f x x x= − + 3,a = 8,b = − 2c = . Since 3 0a = > , the graph opens up. The x-coordinate of the vertex is
( 8) 8 42 2(3) 6 3
bxa
− −−= = = = .
The y-coordinate of the vertex is 24 4 43 8 2
2 3 3 316 32 102 .3 3 3
bf fa
− = = − +
= − + = −
Thus, the vertex is 4 10,3 3
−
.
The axis of symmetry is the line 43
x = .
The discriminant is: 2 24 ( 8) 4(3)(2) 64 24 40b ac− = − − = − = ,
so the graph has two x-intercepts. The x-intercepts are found by solving:
23 8 2 0x x− + = 2 ( 8) 404
2 2(3)
8 40 8 2 10 4 106 6 3
b b acxa
− − ±− ± −= =
± ± ±= = =
Full file at https://testbankuniv.eu/Precalculus-Concepts-Through-Functions-A-Right-Triangle-Approach-to-Trigonometry-3rd-Edition-Sullivan-Solutions-Manual
Full file at https://testbankuniv.eu/Precalculus-Concepts-Through-Functions-A-Right-Triangle-Approach-to-Trigonometry-3rd-Edition-Sullivan-Solutions-Manual

Chapter 2: Linear and Quadratic Functions
190 Copyright © 2015 Pearson Education, Inc.
The x-intercepts are 4 103
+ and 4 103
− .
The y-intercept is (0) 2f = .
b. The domain is ( , )−∞ ∞ .
The range is 10 ,3
− ∞ .
c. Decreasing on 4,3
−∞
.
Increasing on 4 ,3
∞
.
45. Consider the form ( )2y a x h k= − + . From the
graph we know that the vertex is ( )1, 2− − so we have 1h = − and 2k = − . The graph also passes through the point ( ) ( ), 0, 1x y = − . Substituting these values for x, y, h, and k, we can solve for a:
( )( ) ( )( )
2
2
1 0 1 2
1 1 21 21
a
aaa
− = − − + −
− = −− = −
=
The quadratic function is ( ) ( )2 21 2 2 1f x x x x= + − = + − .
46. Consider the form ( )2y a x h k= − + . From the
graph we know that the vertex is ( )2,1 so we have 2h = and 1k = . The graph also passes through the point ( ) ( ), 0,5x y = . Substituting these values for x, y, h, and k, we can solve for a:
( )( )
2
2
5 0 2 1
5 2 15 4 14 41
a
aaa
a
= − +
= − += +==
The quadratic function is ( ) ( )2 22 1 4 5f x x x x= − + = − + .
47. Consider the form ( )2y a x h k= − + . From the
graph we know that the vertex is ( )3,5− so we have 3h = − and 5k = . The graph also passes through the point ( ) ( ), 0, 4x y = − . Substituting these values for x, y, h, and k, we can solve for a:
( )( )
2
2
4 0 ( 3) 5
4 3 54 9 59 91
a
aaa
a
− = − − +
− = +− = +− =− =
The quadratic function is ( ) ( )2 23 5 6 4f x x x x= − + + = − − − .
48. Consider the form ( )2y a x h k= − + . From the
graph we know that the vertex is ( )2,3 so we have 2h = and 3k = . The graph also passes through the point ( ) ( ), 0, 1x y = − . Substituting these values for x, y, h, and k, we can solve for a:
( )( )
2
2
1 0 2 3
1 2 31 4 34 41
a
aaa
a
− = − +
− = − +− = +− =− =
The quadratic function is ( ) ( )2 22 3 4 1f x x x x= − − + = − + − .
49. Consider the form ( )2y a x h k= − + . From the
graph we know that the vertex is ( )1, 3− so we have 1h = and 3k = − . The graph also passes through the point ( ) ( ), 3,5x y = . Substituting these values for x, y, h, and k, we can solve for a:
Full file at https://testbankuniv.eu/Precalculus-Concepts-Through-Functions-A-Right-Triangle-Approach-to-Trigonometry-3rd-Edition-Sullivan-Solutions-Manual
Full file at https://testbankuniv.eu/Precalculus-Concepts-Through-Functions-A-Right-Triangle-Approach-to-Trigonometry-3rd-Edition-Sullivan-Solutions-Manual

Section 2.4: Properties of Quadratic Functions
191 Copyright © 2015 Pearson Education, Inc.
( )( )
2
2
5 3 1 ( 3)
5 2 35 4 38 42
a
aaa
a
= − + −
= −= −==
The quadratic function is ( ) ( )2 22 1 3 2 4 1f x x x x= − − = − − .
50. Consider the form ( )2y a x h k= − + . From the
graph we know that the vertex is ( )2,6− so we have 2h = − and 6k = . The graph also passes through the point ( ) ( ), 4, 2x y = − − . Substituting these values for x, y, h, and k, we can solve for a:
( )( )
2
2
2 4 ( 2) 6
2 2 62 4 68 42
a
aaa
a
− = − − − +
− = − +− = +− =− =
The quadratic function is ( ) ( )2 22 2 6 2 8 2f x x x x= − + + = − − − .
51. For 2( ) 2 12 ,f x x x= + 2,a = 12,b = 0c = . Since 2 0,a = > the graph opens up, so the vertex is a minimum point. The minimum
occurs at 12 12 3.2 2(2) 4
bxa
− − −= = = = −
The minimum value is 2( 3) 2( 3) 12( 3) 18 36 18f − = − + − = − = − .
52. For 2( ) 2 12 ,f x x x= − + 2,a = − 12,b = 0,c = . Since 2 0,a = − < the graph opens down, so the vertex is a maximum point. The maximum
occurs at 12 12 3.2 2( 2) 4
bxa
− − −= = = =− −
The maximum value is 2(3) 2(3) 12(3) 18 36 18f = − + = − + = .
53. For 2( ) 2 12 3,f x x x= + − 2,a = 12,b = 3.c = − Since 2 0,a = > the graph opens up, so the vertex is a minimum point. The minimum occurs at
12 12 3.2 2(2) 4
bxa
− − −= = = = − The minimum value is
2( 3) 2( 3) 12( 3) 3 18 36 3 21f − = − + − − = − − = − .
54. For 2( ) 4 8 3,f x x x= − + 4,a = 8,b = − 3.c = Since 4 0,a = > the graph opens up, so the vertex is a minimum point. The minimum occurs at
( 8) 8 1.2 2(4) 8
bxa
− −−= = = = The minimum value is
2(1) 4(1) 8(1) 3 4 8 3 1f = − + = − + = − .
55. For 2( ) 10 4f x x x= − + − , 1,a = − 10b = , 4c = − . Since 1 0,a = − < the graph opens down, so the vertex is a maximum point. The maximum occurs
at 10 10 52 2( 1) 2
bxa
− − −= = = =− −
. The maximum
value is 2(5) (5) 10(5) 4 25 50 4 21f = − + − = − + − = .
56. For 2( ) 2 8 3f x x x= − + + , 2,a = − 8,b = 3.c = Since 2 0,a = − < the graph opens down, so the vertex is a maximum point. The maximum
occurs at 8 8 22 2( 2) 4
bxa
− −−= = = =− −
. The
maximum value is 2(2) 2(2) 8(2) 3 8 16 3 11f = − + + = − + + = .
57. For 2( ) 3 12 1f x x x= − + + , 3,a = − 12,b = 1.c = Since 3 0,a = − < the graph opens down, so the vertex is a maximum point. The maximum
occurs at 12 12 22 2( 3) 6
bxa
− − −= = = =− −
. The
maximum value is 2(2) 3(2) 12(2) 1 12 24 1 13f = − + + = − + + = .
58. For 2( ) 4 4f x x x= − , 4,a = 4,b = − 0.c = Since 4 0,a = > the graph opens up, so the vertex is a minimum point. The minimum occurs at
( 4) 4 12 2(4) 8 2
bxa
− −−= = = = . The minimum value is
21 1 14 4 1 2 12 2 2
f = − = − = −
.
59. a. For 2( ) 2 15f x x x= − − , 1a = , 2b = − , 15c = − . Since 1 0a = > , the graph opens up.
The x-coordinate of the vertex is ( 2) 2 1
2 2(1) 2bxa
− −−= = = = .
Full file at https://testbankuniv.eu/Precalculus-Concepts-Through-Functions-A-Right-Triangle-Approach-to-Trigonometry-3rd-Edition-Sullivan-Solutions-Manual
Full file at https://testbankuniv.eu/Precalculus-Concepts-Through-Functions-A-Right-Triangle-Approach-to-Trigonometry-3rd-Edition-Sullivan-Solutions-Manual

Chapter 2: Linear and Quadratic Functions
192 Copyright © 2015 Pearson Education, Inc.
The y-coordinate of the vertex is 2(1) (1) 2(1) 15
21 2 15 16.
bf fa
− = = − −
= − − = −
Thus, the vertex is (1, 16)− . The discriminant is:
2 24 ( 2) 4(1)( 15) 4 60 64 0b ac− = − − − = + = > , so the graph has two x-intercepts.
The x-intercepts are found by solving: 2 2 15 0
( 3)( 5) 03 or 5
x xx x
x x
− − =+ − =
= − =
The x-intercepts are 3 and 5− . The y-intercept is (0) 15f = − .
b. The domain is ( , )−∞ ∞ .
The range is [ 16, )− ∞ .
c. Decreasing on ( , 1)−∞ . Increasing on (1, )∞ .
60. a. For 2( ) 2 8f x x x= − − , 1a = , 2b = − , 8c = − . Since 1 0a = > , the graph opens up.
The x-coordinate of the vertex is ( 2) 2 1
2 2(1) 2bxa
− −−= = = = .
The y-coordinate of the vertex is 2(1) (1) 2(1) 8 1 2 8 9.
2bf fa
− = = − − = − − = −
Thus, the vertex is (1, 9)− . The discriminant is:
2 24 ( 2) 4(1)( 8) 4 32 36 0b ac− = − − − = + = > , so the graph has two x-intercepts.
The x-intercepts are found by solving: 2 2 8 0
( 2)( 4) 02 or 4
x xx x
x x
− − =+ − =
= − =
The x-intercepts are 2 and 4− . The y-intercept is (0) 8f = − .
b. The domain is ( , )−∞ ∞ . The range is [ 9, )− ∞ .
c. Decreasing on ( , 1)−∞ . Increasing on (1, )∞ .
61. a. ( ) 2 5F x x= − is a linear function. The x-intercept is found by solving: 2 5 0
2 552
xx
x
− ==
=
The x-intercept is 52
.
The y-intercept is (0) 5F = − .
b. The domain is ( , )−∞ ∞ .
The range is ( , )−∞ ∞ .
c. Increasing on ( , )−∞ ∞ .
62. a. 3( ) 22
f x x= − is a linear function.
The x-intercept is found by solving: 3 2 02
3 22
2 423 3
x
x
x
− =
=
= ⋅ =
Full file at https://testbankuniv.eu/Precalculus-Concepts-Through-Functions-A-Right-Triangle-Approach-to-Trigonometry-3rd-Edition-Sullivan-Solutions-Manual
Full file at https://testbankuniv.eu/Precalculus-Concepts-Through-Functions-A-Right-Triangle-Approach-to-Trigonometry-3rd-Edition-Sullivan-Solutions-Manual

Section 2.4: Properties of Quadratic Functions
193 Copyright © 2015 Pearson Education, Inc.
The x-intercept is 43
.
The y-intercept is (0) 2f = − .
b. The domain is ( , )−∞ ∞ .
The range is ( , )−∞ ∞ .
c. Increasing on ( , )−∞ ∞ .
63. a. 2( ) 2( 3) 2g x x= − − +
Using the graph of 2y x= , shift right 3 units, reflect about the x-axis, stretch vertically by a factor of 2, then shift up 2 units.
b. The domain is ( , )−∞ ∞ .
The range is ( , 2]−∞ .
c. Increasing on ( , 3)−∞ . Decreasing on (3, )∞ .
64. a. 2( ) 3( 1) 4h x x= − + +
Using the graph of 2y x= , shift left 1 unit, reflect about the x-axis, stretch vertically by a factor of 3, then shift up 4 units.
b. The domain is ( , )−∞ ∞ .
The range is ( , 4]−∞ .
c. Increasing on ( , 1)−∞ − . Decreasing on ( 1, )− ∞ .
65. a. For 2( ) 2 1f x x x= + + , 2a = , 1b = , 1c = . Since 2 0a = > , the graph opens up. The x-coordinate of the vertex is
1 1 12 2(2) 4 4
bxa
− − −= = = = − .
The y-coordinate of the vertex is 21 1 12 1
2 4 4 41 1 71 .8 4 8
bf fa
− = − = − + − +
= − + =
Thus, the vertex is 1 7,4 8
−
.
The discriminant is: 2 24 1 4(2)(1) 1 8 7b ac− = − = − = − ,
so the graph has no x-intercepts. The y-intercept is (0) 1f = .
b. The domain is ( , )−∞ ∞ .
The range is 7 ,8 ∞
.
Full file at https://testbankuniv.eu/Precalculus-Concepts-Through-Functions-A-Right-Triangle-Approach-to-Trigonometry-3rd-Edition-Sullivan-Solutions-Manual
Full file at https://testbankuniv.eu/Precalculus-Concepts-Through-Functions-A-Right-Triangle-Approach-to-Trigonometry-3rd-Edition-Sullivan-Solutions-Manual
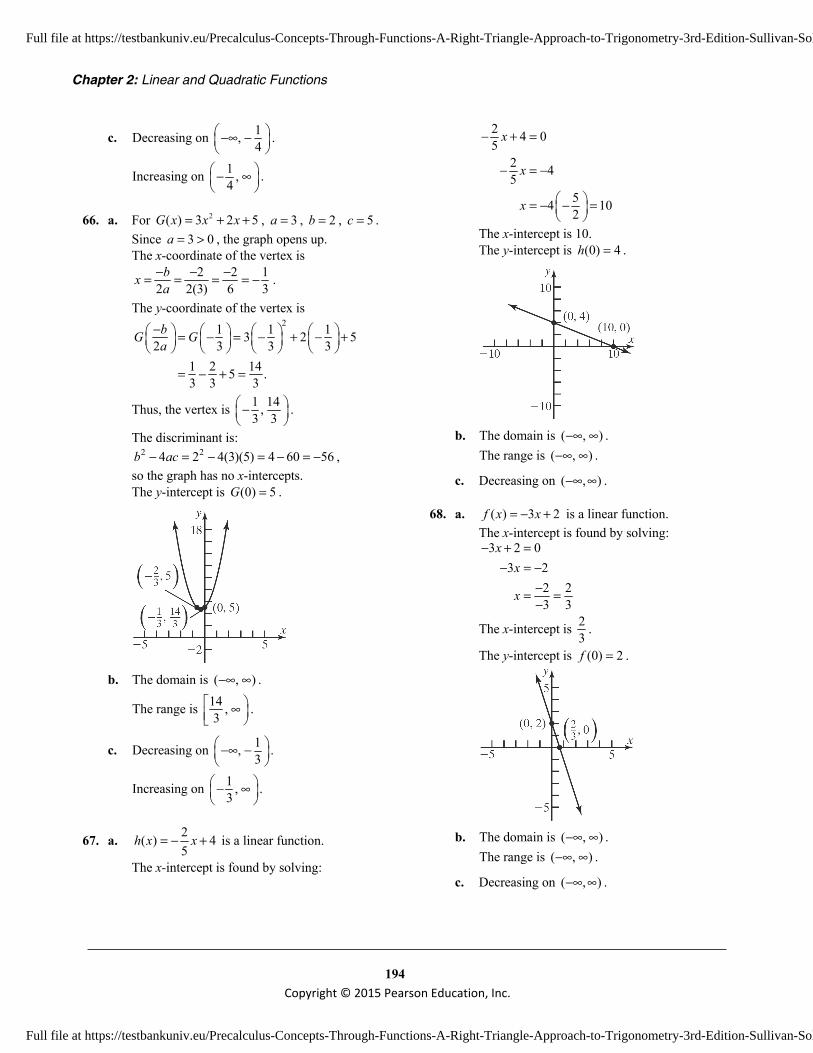
Chapter 2: Linear and Quadratic Functions
194 Copyright © 2015 Pearson Education, Inc.
c. Decreasing on 1,4
−∞ −
.
Increasing on 1 ,4
− ∞
.
66. a. For 2( ) 3 2 5G x x x= + + , 3a = , 2b = , 5c = . Since 3 0a = > , the graph opens up. The x-coordinate of the vertex is
2 2 12 2(3) 6 3
bxa
− − −= = = = − .
The y-coordinate of the vertex is 21 1 13 2 5
2 3 3 31 2 145 .3 3 3
bG Ga
− = − = − + − +
= − + =
Thus, the vertex is 1 14,3 3
−
.
The discriminant is: 2 24 2 4(3)(5) 4 60 56b ac− = − = − = − ,
so the graph has no x-intercepts. The y-intercept is (0) 5G = .
b. The domain is ( , )−∞ ∞ .
The range is 14 ,3
∞ .
c. Decreasing on 1,3
−∞ −
.
Increasing on 1 ,3
− ∞
.
67. a. 2( ) 45
h x x= − + is a linear function.
The x-intercept is found by solving:
2 4 05
2 45
54 102
x
x
x
− + =
− = −
= − − =
The x-intercept is 10. The y-intercept is (0) 4h = .
b. The domain is ( , )−∞ ∞ .
The range is ( , )−∞ ∞ .
c. Decreasing on ( , )−∞ ∞ .
68. a. ( ) 3 2f x x= − + is a linear function. The x-intercept is found by solving:
3 2 03 2
2 23 3
xx
x
− + =− = −
−= =−
The x-intercept is 23
.
The y-intercept is (0) 2f = .
b. The domain is ( , )−∞ ∞ .
The range is ( , )−∞ ∞ .
c. Decreasing on ( , )−∞ ∞ .
Full file at https://testbankuniv.eu/Precalculus-Concepts-Through-Functions-A-Right-Triangle-Approach-to-Trigonometry-3rd-Edition-Sullivan-Solutions-Manual
Full file at https://testbankuniv.eu/Precalculus-Concepts-Through-Functions-A-Right-Triangle-Approach-to-Trigonometry-3rd-Edition-Sullivan-Solutions-Manual

Section 2.4: Properties of Quadratic Functions
195 Copyright © 2015 Pearson Education, Inc.
69. a. For 2( ) 4 4 1H x x x= − − − , 4a = − , 4b = − , 1c = − . Since 4 0a = − < , the graph opens
down. The x-coordinate of the vertex is ( 4) 4 1
2 2( 4) 8 2bxa
− −−= = = = −− −
.
The y-coordinate of the vertex is 21 1 14 4 1
2 2 2 21 2 1 0
bH Ha
− = − = − − − − −
= − + − =
Thus, the vertex is 1 , 02
−
.
The discriminant is: 2 24 ( 4) 4( 4)( 1) 16 16 0b ac− = − − − − = − = ,
so the graph has one x-intercept. The x-intercept is found by solving:
2
2
2
4 4 1 0
4 4 1 0
(2 1) 02 1 0
12
x x
x x
xx
x
− − − =
+ + =
+ =+ =
= −
The x-intercept is 12
− .
The y-intercept is (0) 1H = − .
b. The domain is ( , )−∞ ∞ .
The range is ( ], 0−∞ .
c. Increasing on 1,2
−∞ −
.
Decreasing on 1 ,2
− ∞
.
70. a. For 2( ) 4 20 25F x x x= − + − , 4a = − , 20b = , 25c = − . Since 4 0a = − < , the graph opens
down. The x-coordinate of the vertex is 20 20 5
2 2( 4) 8 2bxa
− − −= = = =− −
.
The y-coordinate of the vertex is 25 5 54 20 25
2 2 2 225 50 25 0
bF Fa
− = = − + −
= − + − =
Thus, the vertex is 5 , 02
.
The discriminant is: 2 24 (20) 4( 4)( 25)
400 400 0,b ac− = − − −
= − =
so the graph has one x-intercept. The x-intercept is found by solving:
2
2
2
4 20 25 0
4 20 25 0
(2 5) 02 5 0
52
x x
x x
xx
x
− + − =
− + =
− =− =
=
The x-intercept is 52
.
The y-intercept is (0) 25F = − .
b. The domain is ( , )−∞ ∞ .
The range is ( ], 0−∞ .
c. Increasing on 5,2
−∞
.
Decreasing on 5 ,2
∞
.
71. Use the form 2( ) ( )f x a x h k= − + . The vertex is (0, 2) , so h = 0 and k = 2.
2 2( ) ( 0) 2 2f x a x ax= − + = + .
Full file at https://testbankuniv.eu/Precalculus-Concepts-Through-Functions-A-Right-Triangle-Approach-to-Trigonometry-3rd-Edition-Sullivan-Solutions-Manual
Full file at https://testbankuniv.eu/Precalculus-Concepts-Through-Functions-A-Right-Triangle-Approach-to-Trigonometry-3rd-Edition-Sullivan-Solutions-Manual
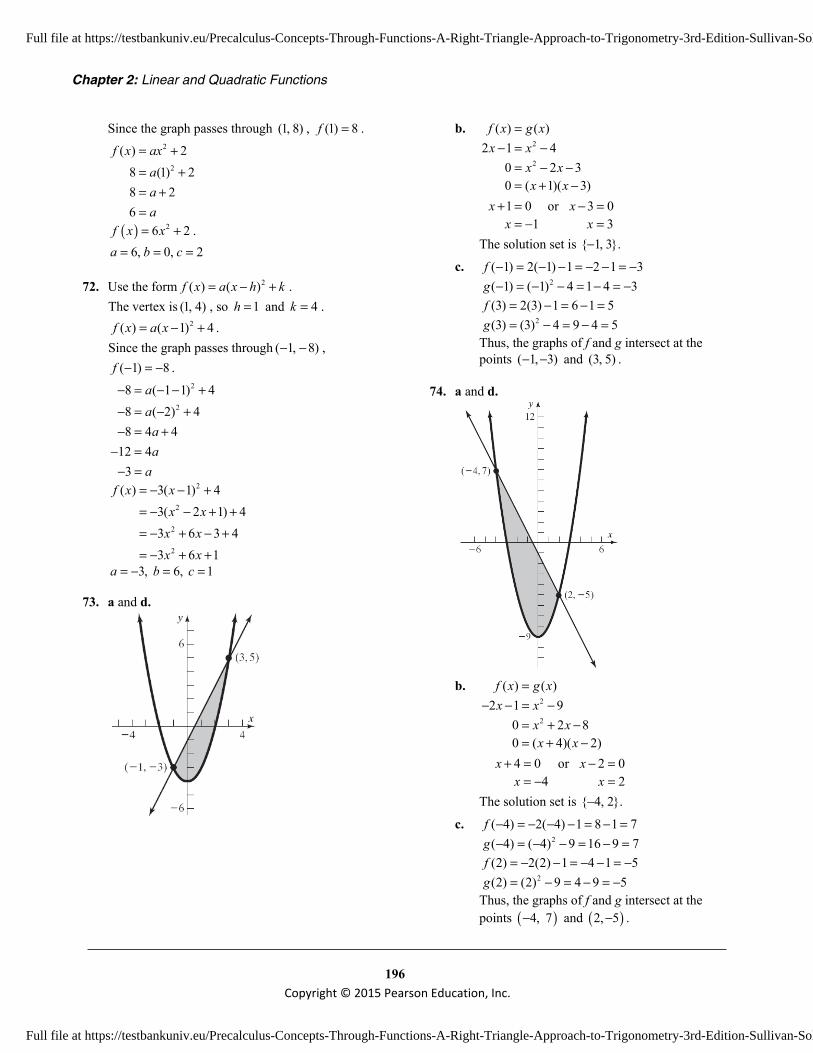
Chapter 2: Linear and Quadratic Functions
196 Copyright © 2015 Pearson Education, Inc.
Since the graph passes through (1, 8) , (1) 8f = .
2
2
( ) 28 (1) 28 26
f x axaaa
= += += +=
( ) 26 2f x x= + . 6, 0, 2a b c= = =
72. Use the form 2( ) ( )f x a x h k= − + . The vertex is (1, 4) , so 1h = and 4k = . 2( ) ( 1) 4f x a x= − + . Since the graph passes through ( 1, 8)− − ,
( 1) 8f − = − .
2
2
8 ( 1 1) 48 ( 2) 48 4 4
12 43
aa
aa
a
− = − − +− = − +− = +
− =− =
2
2
2
2
( ) 3( 1) 43( 2 1) 43 6 3 43 6 1
f x xx x
x xx x
= − − += − − + += − + − += − + +
3, 6, 1a b c= − = =
73. a and d.
b. 2
2
( ) ( )2 1 4
0 2 30 ( 1)( 3)
f x g xx x
x xx x
=− = −
= − −= + −
1 0 or 3 01 3
x xx x
+ = − == − =
The solution set is { 1, 3}.− c.
2
( 1) 2( 1) 1 2 1 3( 1) ( 1) 4 1 4 3
fg
− = − − = − − = −− = − − = − = −
2
(3) 2(3) 1 6 1 5(3) (3) 4 9 4 5
fg
= − = − == − = − =
Thus, the graphs of f and g intersect at the points ( 1, 3)− − and (3, 5) .
74. a and d.
b.
2
2
( ) ( )2 1 9
0 2 80 ( 4)( 2)
f x g xx x
x xx x
=− − = −
= + −= + −
4 0 or 2 04 2
x xx x
+ = − == − =
The solution set is { 4, 2}.−
c. 2
( 4) 2( 4) 1 8 1 7( 4) ( 4) 9 16 9 7
fg
− = − − − = − =− = − − = − =
2
(2) 2(2) 1 4 1 5(2) (2) 9 4 9 5
fg
= − − = − − = −= − = − = −
Thus, the graphs of f and g intersect at the points ( )4, 7− and ( )2, 5− .
Full file at https://testbankuniv.eu/Precalculus-Concepts-Through-Functions-A-Right-Triangle-Approach-to-Trigonometry-3rd-Edition-Sullivan-Solutions-Manual
Full file at https://testbankuniv.eu/Precalculus-Concepts-Through-Functions-A-Right-Triangle-Approach-to-Trigonometry-3rd-Edition-Sullivan-Solutions-Manual
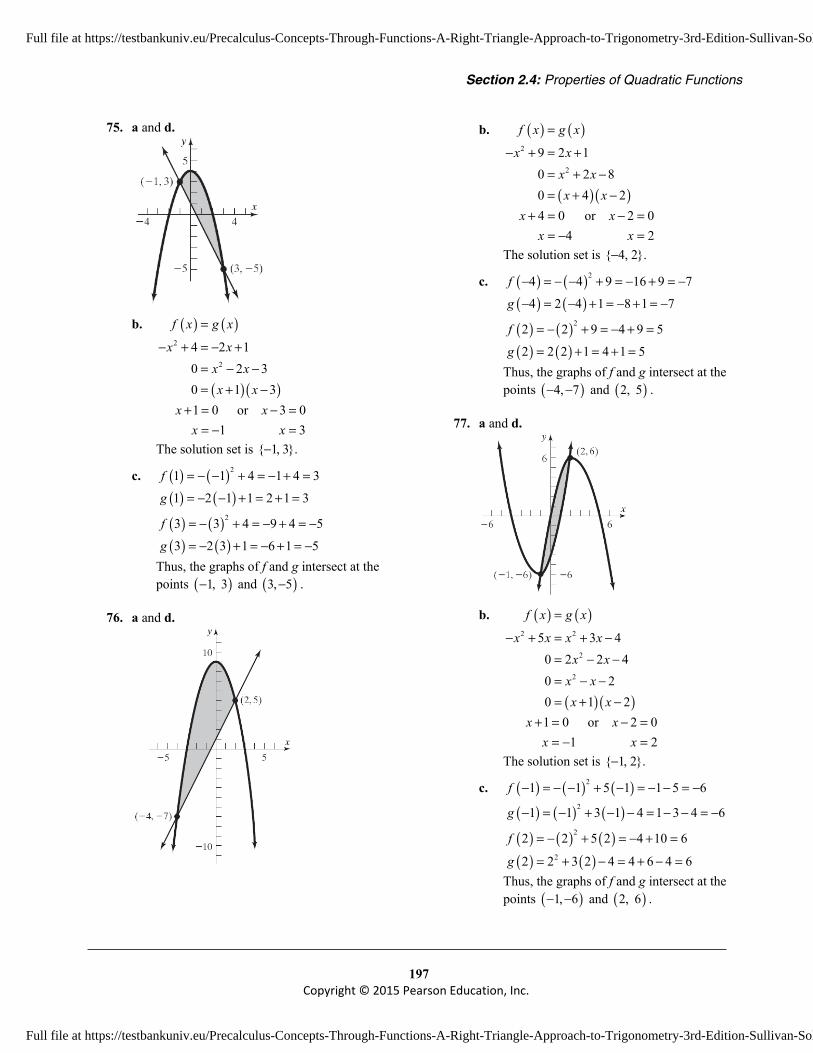
Section 2.4: Properties of Quadratic Functions
197 Copyright © 2015 Pearson Education, Inc.
75. a and d.
b. ( ) ( )
( )( )
2
2
4 2 10 2 30 1 3
f x g x
x xx xx x
=
− + = − += − −= + −
1 0 or 3 0
1 3x x
x x+ = − =
= − =
The solution set is { 1, 3}.−
c. ( ) ( )( ) ( )
21 1 4 1 4 31 2 1 1 2 1 3
f
g
= − − + = − + =
= − − + = + =
( ) ( )( ) ( )
23 3 4 9 4 53 2 3 1 6 1 5
f
g
= − + = − + = −
= − + = − + = −
Thus, the graphs of f and g intersect at the points ( )1, 3− and ( )3, 5− .
76. a and d.
b. ( ) ( )
( )( )
2
2
9 2 10 2 80 4 2
f x g x
x xx xx x
=
− + = += + −= + −
4 0 or 2 0
4 2x x
x x+ = − =
= − =
The solution set is { 4, 2}.−
c. ( ) ( )( ) ( )
24 4 9 16 9 74 2 4 1 8 1 7
f
g
− = − − + = − + = −
− = − + = − + = −
( ) ( )( ) ( )
22 2 9 4 9 52 2 2 1 4 1 5
f
g
= − + = − + =
= + = + =
Thus, the graphs of f and g intersect at the points ( )4, 7− − and ( )2, 5 .
77. a and d.
b. ( ) ( )
( )( )
2 2
2
2
5 3 40 2 2 40 20 1 2
f x g x
x x x xx x
x xx x
=
− + = + −= − −= − −= + −
1 0 or 2 0
1 2x x
x x+ = − =
= − =
The solution set is { 1, 2}.−
c. ( ) ( ) ( )( ) ( ) ( )
2
2
1 1 5 1 1 5 6
1 1 3 1 4 1 3 4 6
f
g
− = − − + − = − − = −
− = − + − − = − − = −
( ) ( ) ( )( ) ( )
2
2
2 2 5 2 4 10 6
2 2 3 2 4 4 6 4 6
f
g
= − + = − + =
= + − = + − =
Thus, the graphs of f and g intersect at the points ( )1, 6− − and ( )2, 6 .
Full file at https://testbankuniv.eu/Precalculus-Concepts-Through-Functions-A-Right-Triangle-Approach-to-Trigonometry-3rd-Edition-Sullivan-Solutions-Manual
Full file at https://testbankuniv.eu/Precalculus-Concepts-Through-Functions-A-Right-Triangle-Approach-to-Trigonometry-3rd-Edition-Sullivan-Solutions-Manual

Chapter 2: Linear and Quadratic Functions
198 Copyright © 2015 Pearson Education, Inc.
78. a and d.
b. ( ) ( )
( )
2 2
2
7 6 60 2 60 2 3
f x g x
x x x xx xx x
=
− + − = + −
= −= −
2 0 or 3 0
0 3x xx x
= − == =
The solution set is {0, 3}.
c. ( ) ( ) ( )( )
2
2
0 0 7 0 6 6
0 0 0 6 6
f
g
= − + − = −
= + − = −
( ) ( ) ( )( )
2
2
3 3 7 3 6 9 21 6 6
3 3 3 6 9 3 6 6
f
g
= − + − = − + − =
= + − = + − =
Thus, the graphs of f and g intersect at the points ( )0, 6− and ( )3, 6 .
79. a. For 1:a =
1 2
2
( ) ( )( )1( ( 3))( 1)
( 3)( 1) 2 3
f x a x r x rx x
x x x x
= − −= − − −
= + − = + −
For 2 :a =
2 2
( ) 2( ( 3))( 1)2( 3)( 1)
2( 2 3) 2 4 6
f x x xx x
x x x x
= − − −= + −
= + − = + −
For 2 :a = −
2 2
( ) 2( ( 3))( 1)2( 3)( 1)
2( 2 3) 2 4 6
f x x xx x
x x x x
= − − − −= − + −
= − + − = − − +
For 5 :a =
2 2
( ) 5( ( 3))( 1)5( 3)( 1)
5( 2 3) 5 10 15
f x x xx x
x x x x
= − − −= + −
= + − = + −
b. The x-intercepts are not affected by the value of a. The y-intercept is multiplied by the value of a .
c. The axis of symmetry is unaffected by the value of a . For this problem, the axis of symmetry is 1x = − for all values of a.
d. The x-coordinate of the vertex is not affected by the value of a. The y-coordinate of the vertex is multiplied by the value of a .
e. The x-coordinate of the vertex is the mean of the x-intercepts.
80. a. For 1:a =
2
( ) 1( ( 5))( 3)
( 5)( 3) 2 15
f x x x
x x x x
= − − −
= + − = + −
For 2a = :
2 2
( ) 2( ( 5))( 3)2( 5)( 3)
2( 2 15) 2 4 30
f x x xx x
x x x x
= − − −= + −
= + − = + −
For 2a = − :
2 2
( ) 2( ( 5))( 3)2( 5)( 3)
2( 2 15) 2 4 30
f x x xx x
x x x x
= − − − −= − + −
= − + − = − − +
For 5a = :
2 2
( ) 5( ( 5))( 3)5( 5)( 3)
5( 2 15) 5 10 75
f x x xx x
x x x x
= − − −= + −
= + − = + −
b. The x-intercepts are not affected by the value of a. The y-intercept is multiplied by the value of a .
c. The axis of symmetry is unaffected by the value of a . For this problem, the axis of symmetry is 1x = − for all values of a.
d. The x-coordinate of the vertex is not affected by the value of a. The y-coordinate of the vertex is multiplied by the value of a .
e. The x-coordinate of the vertex is the mean of the x-intercepts.
81. a. ( )4 2
2 2 1bxa
= − = − = −
( ) ( ) ( )22 2 4 2 21 25y f= − = − + − − = − The vertex is ( )2, 25− − .
Full file at https://testbankuniv.eu/Precalculus-Concepts-Through-Functions-A-Right-Triangle-Approach-to-Trigonometry-3rd-Edition-Sullivan-Solutions-Manual
Full file at https://testbankuniv.eu/Precalculus-Concepts-Through-Functions-A-Right-Triangle-Approach-to-Trigonometry-3rd-Edition-Sullivan-Solutions-Manual

Section 2.4: Properties of Quadratic Functions
199 Copyright © 2015 Pearson Education, Inc.
b. ( )
( )( )2
0
4 21 07 3 0
f x
x xx x
=
+ − =+ − =
7 0 or 3 07 3
x xx x
+ = − == − =
The x-intercepts of f are 7− and 3.
c. ( )
( )
2
2
21
4 21 214 04 0
f x
x xx x
x x
= −
+ − = −
+ =+ =
0 or 4x x= = − The solutions ( ) 21f x = − are 4− and 0.
Thus, the points ( )4, 21− − and ( )0, 21− are on the graph of f.
d.
82. a. ( )2 1
2 2 1bxa
= − = − = −
( ) ( ) ( )21 1 2 1 8 9y f= − = − + − − = − The vertex is ( )1, 9− − .
b. ( )
( )( )2
0
2 8 04 2 0
f x
x xx x
=
+ − =+ − =
4 0 or 2 04 2
x xx x
+ = − == − =
The x-intercepts of f are 4− and 2.
c. ( )
( )
2
2
8
2 8 82 02 0
f x
x xx x
x x
= −
+ − = −
+ =+ =
0 or 2 02
x xx
= + == −
The solutions ( ) 8f x = − are 2− and 0.
Thus, the points ( )2, 8− − and ( )0, 8− are on the graph of f.
d.
83. 2( ) 4 4000R p p p= − + , 4, 4000, 0.a b c= − = = Since 4 0a = − < the graph is a parabola that opens down, so the vertex is a maximum point. The
maximum occurs at 4000 5002 2( 4)
bpa
− −= = =−
.
Thus, the unit price should be $500 for maximum revenue. The maximum revenue is
2(500) 4(500) 4000(500)1000000 2000000
$1,000,000
R = − += − +=
84. 21( ) 19002
R p p p= − + , 1 , 1900, 0.2
a b c= − = =
Since 1 0,2
a = − < the graph is a parabola that
opens down, so the vertex is a maximum point. The maximum occurs at
( )1900 1900 1900
2 2 1/ 2 1bpa
− − −= = = =− −
.
Thus, the unit price should be $1900 for maximum revenue. The maximum revenue is
( ) ( ) ( )211900 1900 1900 190021805000 3610000
$1,805,000
R = − +
= − +=
Full file at https://testbankuniv.eu/Precalculus-Concepts-Through-Functions-A-Right-Triangle-Approach-to-Trigonometry-3rd-Edition-Sullivan-Solutions-Manual
Full file at https://testbankuniv.eu/Precalculus-Concepts-Through-Functions-A-Right-Triangle-Approach-to-Trigonometry-3rd-Edition-Sullivan-Solutions-Manual

Chapter 2: Linear and Quadratic Functions
200 Copyright © 2015 Pearson Education, Inc.
85. a. 2( ) 140 7400C x x x= − + , 1, 140, 7400.a b c= = − = Since 1 0,a = >
the graph opens up, so the vertex is a minimum point. The minimum marginal cost
occurs at ( 140) 140 702 2(1) 2
bxa
− − −= = = =
thousand mp3 players produced. b. The minimum marginal cost is
( ) ( ) ( )270 70 140 70 74002
4900 9800 7400$2500
bf fa
− = = − +
= − +=
86. a. 2( ) 5 200 4000C x x x= − + , 5, 200, 4000.a b c= = − = Since 5 0,a = >
the graph opens up, so the vertex is a minimum point. The minimum marginal cost occurs at
( )200 200 202 2(5) 10
bxa
− −−= = = = thousand
cell phones manufactured. b. The minimum marginal cost is
( ) ( ) ( )220 5 20 200 20 40002
2000 4000 4000$2000
bf fa
− = = − +
= − +=
87. a. 2
2
( ) 1.1 0.06(45) 1.1(45) 0.06(45)
49.5 121.5 171 ft.
d v v vd
= +
= += + =
b. 2
2
200 1.1 0.060 200 1.1 0.06
v vv v
= +
= − + +
( ) ( ) ( )( )( )
21.1 1.1 4 0.06 200
2 0.06
1.1 49.210.12
1.1 7.0150.12
x − ± − −
− ±
− ±
=
=
≈
49 or 68v v≈ ≈ − Disregard the negative value since we are
talking about speed. So the maximum speed you can be traveling would be approximately 49 mph.
c. The 1.1v term might represent the reaction time.
88. a. ( )16.54 16.54 26.7 years old
2 2 0.31 0.62baa
− − −= = = ≈− −
b. 2(26.7) 0.31(26.7) 16.54(26.7) 151.0469.6 births per 1000 unmarried women
B = − + −≈
c. 2(40) 0.31(40) 16.54(40) 151.0414.6 births per 1000 unmarried women
B = − + −≈
89. a. 2( ) 75 0.2R x x x= − 0.2, 75, 0a b c= − = =
The maximum revenue occurs when
( )75 75 187.5
2 2 0.2 0.4bxa
− − −= = = =− −
The maximum revenue occurs when 187x = or 188x = watches.
The maximum revenue is: ( ) ( )( ) ( )
2
2
(187) 75 187 0.2 187 $7031.20
(188) 75 188 0.2 188 $7031.20
R
R
= − =
= − =
b. ( ) ( )( )2
2
( )
75 0.2 32 1750
0.2 43 1750
P x R x C x
x x x
x x
= −
= − − +
= − + −
c. 2( ) 0.2 43 1750P x x x= − + − 0.2, 43, 1750a b c= − = = −
( )43 43 107.5
2 2 0.2 0.4bxa
− − −= = = =− −
The maximum profit occurs when 107x = or 108x = watches. The maximum profit is:
( ) ( )
( ) ( )
2
2
(107) 0.2 107 43 107 1750$561.20
(108) 0.2 108 43 108 1750$561.20
P
P
= − + −=
= − + −=
d. Answers will vary.
Full file at https://testbankuniv.eu/Precalculus-Concepts-Through-Functions-A-Right-Triangle-Approach-to-Trigonometry-3rd-Edition-Sullivan-Solutions-Manual
Full file at https://testbankuniv.eu/Precalculus-Concepts-Through-Functions-A-Right-Triangle-Approach-to-Trigonometry-3rd-Edition-Sullivan-Solutions-Manual
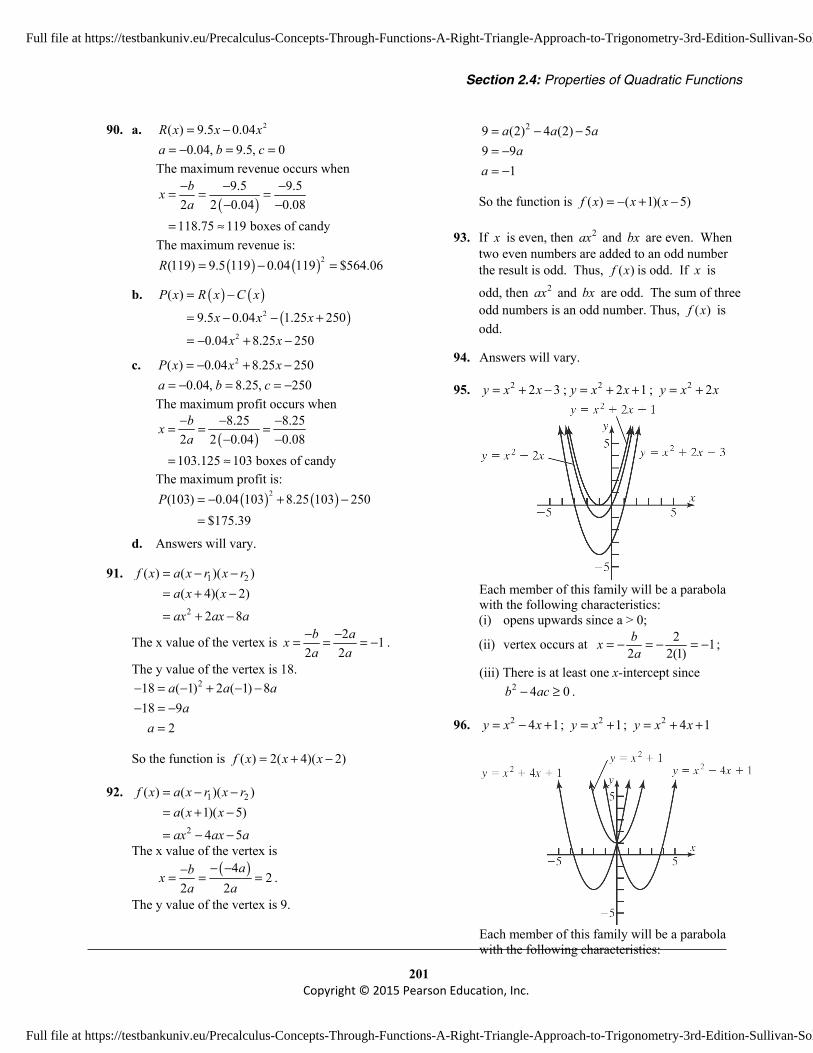
Section 2.4: Properties of Quadratic Functions
201 Copyright © 2015 Pearson Education, Inc.
90. a. 2( ) 9.5 0.04R x x x= − 0.04, 9.5, 0a b c= − = =
The maximum revenue occurs when
( )9.5 9.5
2 2 0.04 0.08118.75 119 boxes of candy
bxa
− − −= = =− −
= ≈
The maximum revenue is: ( ) ( )2(119) 9.5 119 0.04 119 $564.06R = − =
b. ( ) ( )( )2
2
( )
9.5 0.04 1.25 250
0.04 8.25 250
P x R x C x
x x x
x x
= −
= − − +
= − + −
c. 2( ) 0.04 8.25 250P x x x= − + − 0.04, 8.25, 250a b c= − = = −
The maximum profit occurs when
( )8.25 8.25
2 2 0.04 0.08103.125 103 boxes of candy
bxa
− − −= = =− −
= ≈
The maximum profit is: ( ) ( )2(103) 0.04 103 8.25 103 250
$175.39P = − + −
=
d. Answers will vary.
91. 1 2
2
( ) ( )( )( 4)( 2)
2 8
f x a x r x ra x x
ax ax a
= − −= + −
= + −
The x value of the vertex is 2 12 2
b axa a
− −= = = − .
The y value of the vertex is 18. 218 ( 1) 2 ( 1) 8
18 92
a a aa
a
− = − + − −− = −
=
So the function is ( ) 2( 4)( 2)f x x x= + −
92. 1 2
2
( ) ( )( )( 1)( 5)
4 5
f x a x r x ra x x
ax ax a
= − −= + −
= − −
The x value of the vertex is ( )4
22 2
abxa a
− −−= = = .
The y value of the vertex is 9.
29 (2) 4 (2) 59 9
1
a a aa
a
= − −= −= −
So the function is ( ) ( 1)( 5)f x x x= − + −
93. If x is even, then 2ax and bx are even. When two even numbers are added to an odd number the result is odd. Thus, ( )f x is odd. If x is
odd, then 2ax and bx are odd. The sum of three odd numbers is an odd number. Thus, ( )f x is odd.
94. Answers will vary.
95. 2 2 3y x x= + − ; 2 2 1y x x= + + ; 2 2y x x= +
Each member of this family will be a parabola with the following characteristics:
(i) opens upwards since a > 0;
(ii) vertex occurs at 2 12 2(1)bxa
= − = − = − ;
(iii) There is at least one x-intercept since 2 4 0b ac− ≥ .
96. 2 4 1y x x= − + ; 2 1y x= + ; 2 4 1y x x= + +
Each member of this family will be a parabola
with the following characteristics:
Full file at https://testbankuniv.eu/Precalculus-Concepts-Through-Functions-A-Right-Triangle-Approach-to-Trigonometry-3rd-Edition-Sullivan-Solutions-Manual
Full file at https://testbankuniv.eu/Precalculus-Concepts-Through-Functions-A-Right-Triangle-Approach-to-Trigonometry-3rd-Edition-Sullivan-Solutions-Manual

Chapter 2: Linear and Quadratic Functions
202 Copyright © 2015 Pearson Education, Inc.
(i) opens upwards since a > 0 (ii) y-intercept occurs at (0, 1).
97. The graph of the quadratic function ( ) 2f x ax bx c= + + will not have any
x-intercepts whenever 2 4 0b ac− < .
98. By completing the square on the quadratic function ( ) 2f x ax bx c= + + we obtain the
equation 2 2
2 4b by a x ca a
= + + −
. We can then
draw the graph by applying transformations to the graph of the basic parabola 2y x= , which opens up. When 0a > , the basic parabola will either be stretched or compressed vertically. When 0a < , the basic parabola will either be stretched or compressed vertically as well as reflected across the x-axis. Therefore, when
0a > , the graph of 2( )f x ax bx c= + + will open up, and when 0a < , the graph of
( ) 2f x ax bx c= + + will open down.
99. No. We know that the graph of a quadratic function ( ) 2f x ax bx c= + + is a parabola with
vertex ( )( )2 2,b ba af− − . If a > 0, then the vertex is
a minimum point, so the range is ( ) )2 , baf − ∞ .
If a < 0, then the vertex is a maximum point, so the range is ( )( 2, b
af −∞ − . Therefore, it is
impossible for the range to be ( ), −∞ ∞ .
100. Two quadratic functions can intersect 0, 1, or 2 times.
101. 2 24 16x y+ = To check for symmetry with respect to the x-
axis, replace y with –y and see if the equations are equivalent.
2 2
2 2
4( ) 16
4 16
x y
x y
+ − =
+ =
So the graph is symmetric with respect to the x-axis.
To check for symmetry with respect to the y-axis, replace x with –x and see if the equations are equivalent.
2 2
2 2
( ) 4 16
4 16
x y
x y
− + =
+ =
So the graph is symmetric with respect to the y-axis.
To check for symmetry with respect to the origin, replace x with –x and y with –y and see if the equations are equivalent.
2 2
2 2
( ) 4( ) 16
4 16
x y
x y
− + − =
+ =
So the graph is symmetric with respect to the origin.
102. 27 5 36 24
4
x xxx
− ≥ +− ≥ −
≤
So the solution set is: ( ], 4−∞ or { }| 4x x ≤ .
103. 2 2 10 4 20 0x y x y+ − + + = 2 2
2 2
2 2 2
10 4 20
( 10 25) ( 4 4) 20 25 4
( 5) ( 2) 3
x x y y
x x y y
x y
− + + = −
− + + + + = − + +
− + + =
Center: (5, -2); Radius = 3
104. ( ) ( ) ( )( )( )
26 6 4 1 42 1
6 36 162
6 202
6 2 52
3 5
x − − ± − −
± −
±
±
=
=
=
= = ±
So the zeros of the function are: 3 5,3 5+ − . The x-intercepts are: 3 5,3 5+ −
Section 2.5
1. 3 2 73 9
3
xxx
− − <− <
> −
The solution set is { }| 3x x > − or ( )3,− ∞ .
Full file at https://testbankuniv.eu/Precalculus-Concepts-Through-Functions-A-Right-Triangle-Approach-to-Trigonometry-3rd-Edition-Sullivan-Solutions-Manual
Full file at https://testbankuniv.eu/Precalculus-Concepts-Through-Functions-A-Right-Triangle-Approach-to-Trigonometry-3rd-Edition-Sullivan-Solutions-Manual
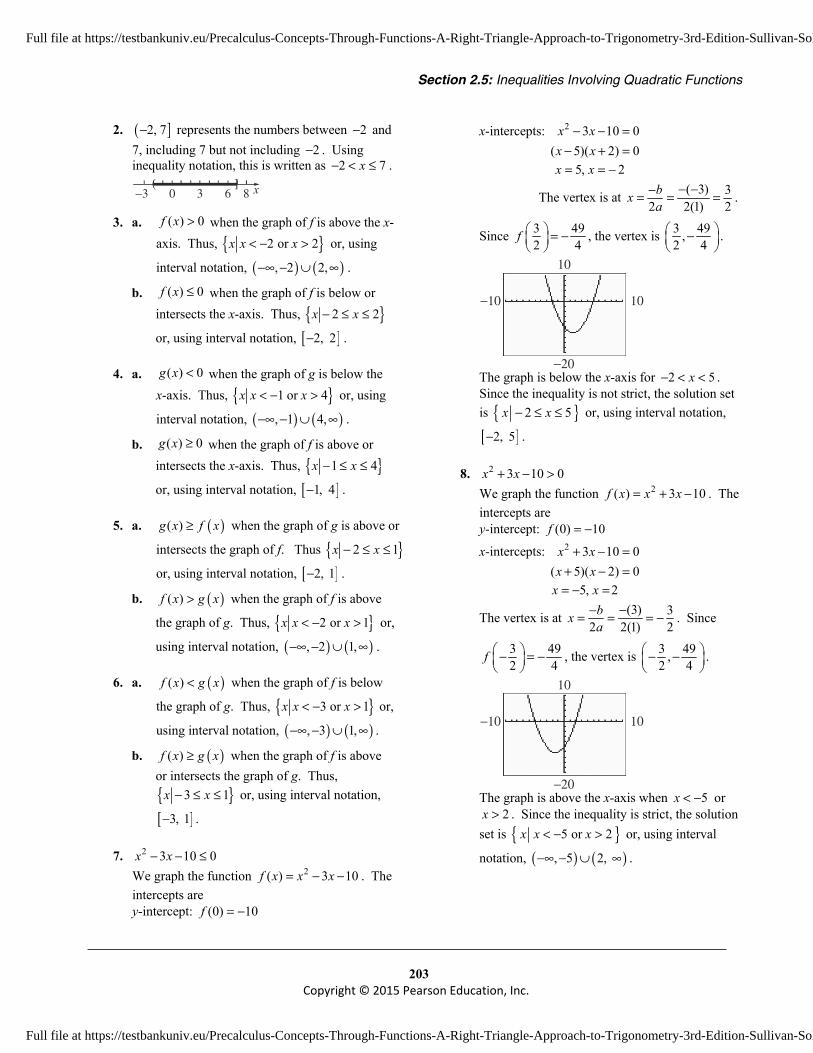
Section 2.5: Inequalities Involving Quadratic Functions
203 Copyright © 2015 Pearson Education, Inc.
2. ( ]2, 7− represents the numbers between 2− and 7, including 7 but not including 2− . Using inequality notation, this is written as 2 7x− < ≤ .
x−3 0 3 6 8 ( ]
3. a. ( ) 0f x > when the graph of f is above the x-axis. Thus, { }2 or 2x x x< − > or, using
interval notation, ( ) ( ), 2 2,−∞ − ∪ ∞ .
b. ( ) 0f x ≤ when the graph of f is below or intersects the x-axis. Thus, { }2 2x x− ≤ ≤
or, using interval notation, [ ]2, 2− .
4. a. ( ) 0g x < when the graph of g is below the x-axis. Thus, { }1 or 4x x x< − > or, using
interval notation, ( ) ( ), 1 4,−∞ − ∪ ∞ .
b. ( ) 0g x ≥ when the graph of f is above or intersects the x-axis. Thus, { }1 4x x− ≤ ≤
or, using interval notation, [ ]1, 4− .
5. a. ( )( )g x f x≥ when the graph of g is above or
intersects the graph of f. Thus { }2 1x x− ≤ ≤
or, using interval notation, [ ]2, 1− .
b. ( )( )f x g x> when the graph of f is above
the graph of g. Thus, { }2 or 1x x x< − > or,
using interval notation, ( ) ( ), 2 1,−∞ − ∪ ∞ .
6. a. ( )( )f x g x< when the graph of f is below
the graph of g. Thus, { }3 or 1x x x< − > or,
using interval notation, ( ) ( ), 3 1,−∞ − ∪ ∞ .
b. ( )( )f x g x≥ when the graph of f is above or intersects the graph of g. Thus, { }3 1x x− ≤ ≤ or, using interval notation,
[ ]3, 1− .
7. 2 3 10 0x x− − ≤ We graph the function 2( ) 3 10f x x x= − − . The
intercepts are y-intercept: (0) 10f = −
x-intercepts: 2 3 10 0( 5)( 2) 0
x xx x
− − =− + =
5, 2x x= = −
The vertex is at ( 3) 32 2(1) 2
bxa
− −−= = = .
Since 3 492 4
f = −
, the vertex is 3 49,2 4
−
.
−10 10
10
−20 The graph is below the x-axis for 2 5x− < < . Since the inequality is not strict, the solution set is { }2 5x x− ≤ ≤ or, using interval notation,
[ ]2, 5− .
8. 2 3 10 0x x+ − > We graph the function 2( ) 3 10f x x x= + − . The intercepts are y-intercept: (0) 10f = − x-intercepts: 2 3 10 0
( 5)( 2) 0x xx x
+ − =+ − =
5, 2x x= − =
The vertex is at (3) 32 2(1) 2
bxa
−−= = = − . Since
3 492 4
f − = −
, the vertex is 3 49,2 4
− −
.
−10 10
10
−20 The graph is above the x-axis when 5x < − or
2x > . Since the inequality is strict, the solution set is { }5 or 2x x x< − > or, using interval
notation, ( ) ( ), 5 2, −∞ − ∪ ∞ .
Full file at https://testbankuniv.eu/Precalculus-Concepts-Through-Functions-A-Right-Triangle-Approach-to-Trigonometry-3rd-Edition-Sullivan-Solutions-Manual
Full file at https://testbankuniv.eu/Precalculus-Concepts-Through-Functions-A-Right-Triangle-Approach-to-Trigonometry-3rd-Edition-Sullivan-Solutions-Manual

Chapter 2: Linear and Quadratic Functions
204 Copyright © 2015 Pearson Education, Inc.
9. 2 4 0x x− > We graph the function 2( ) 4f x x x= − . The intercepts are y-intercept: (0) 0f = x-intercepts: 2 4 0
( 4) 0x xx x
− =− =
0, 4x x= =
The vertex is at ( 4) 4 22 2(1) 2
bxa
− −−= = = = . Since
( )2 4f = − , the vertex is ( )2, 4 .−
−10 10
10
−10 The graph is above the x-axis when 0x < or
4x > . Since the inequality is strict, the solution set is { }0 or 4x x x< > or, using interval
notation, ( ) ( ), 0 4, −∞ ∪ ∞ .
10. 2 8 0x x+ ≤ We graph the function 2( ) 8f x x x= + . The intercepts are y-intercept: (0) 0f = x-intercepts: 2 8 0
( 8) 0x xx x
+ =+ =
0, 8x x= = −
The vertex is at (8) 8 42 2(1) 2
bxa
−− −= = = = − .
Since ( )4 16f − = − , the vertex is ( )4, 16 .− −
−10 10
10
−20 The graph is below the x-axis when 8 0x− < < . Since the inequality is not strict, the solution set is { }8 0x x− ≤ ≤ or, using interval notation,
[ ]8, 0− .
11. 2
2
1212 0
x xx x
+ >+ − >
We graph the function 2( ) 12f x x x= + − . y-intercept: (0) 12f = − x-intercepts: 2 12 0
( 4)( 3) 0x x
x x+ − =
+ − =
4, 3x x= − =
The vertex is at (1) 12 2(1) 2
bxa
− −= = = − . Since
1 492 4
f − = −
, the vertex is 1 49, .2 4
− −
−10 10
10
−20 The graph is above the x-axis when 4x < − or
3x > . Since the inequality is strict, the solution set is { }4 or 3x x x< − > or, using interval
notation, ( ) ( ), 4 3, −∞ − ∪ ∞ .
12. 2
2
7 127 12 0x x
x x+ < −
+ + <
We graph the function 2( ) 7 12f x x x= + + . y-intercept: (0) 12f = x-intercepts: 2 7 12 0
( 4)( 3) 0x xx x
+ + =+ + =
4, 3x x= − = −
The vertex is at (7) 72 2(1) 2
bxa
− −= = = − . Since
7 12 4
f − = −
, the vertex is 1 1, .2 4
− −
−10 10
10
−10 The graph is below the x-axis when 4 3x− < < − . Since the inequality is strict, the solution set is { }| 4 3x x− < < − or, using interval notation,
( )4, 3− − .
Full file at https://testbankuniv.eu/Precalculus-Concepts-Through-Functions-A-Right-Triangle-Approach-to-Trigonometry-3rd-Edition-Sullivan-Solutions-Manual
Full file at https://testbankuniv.eu/Precalculus-Concepts-Through-Functions-A-Right-Triangle-Approach-to-Trigonometry-3rd-Edition-Sullivan-Solutions-Manual

Section 2.5: Inequalities Involving Quadratic Functions
205
Copyright © 2015 Pearson Education, Inc.
13. 2 6 9 0x x+ + ≤ We graph the function 2( ) 6 9f x x x= + + . y-intercept: (0) 9f = x-intercepts: 2 6 9 0
( 3)( 3) 0x x
x x+ + =
+ + =
3x = −
The vertex is at (6) 32 2(1)
bxa
− −= = = − . Since
( )3 0f − = , the vertex is ( )3,0 .−
Since the graph is never below the x-axis and only touches at 3x = − then the solution is { }3− .
14. 2 4 4 0x x− + ≤ We graph the function 2( ) 4 4f x x x= − + . y-intercept: (0) 4f = x-intercepts: 2 4 4 0
( 2)( 2) 0x x
x x− + =
− − =
2x =
The vertex is at ( 4) 22 2(1)
bxa
− − −= = = . Since
( )2 0f = , the vertex is ( )2,0 .
Since the graph is never below the x-axis and only touches at 2x = then the solution is { }2 .
15. 2
2
2 5 3
2 5 3 0
x x
x x
≤ +
− − ≤
We graph the function 2( ) 2 5 3f x x x= − − . The intercepts are y-intercept: (0) 3f = − x-intercepts: 22 5 3 0
(2 1)( 3) 0x x
x x− − =
+ − =
1 , 32
x x= − =
The vertex is at ( 5) 52 2(2) 4
bxa
− − −= = = . Since
5 494 8
f = −
, the vertex is 5 49, .4 8
−
−10 10
10
−10 The graph is below the x-axis when 1 3
2x− < < .
Since the inequality is not strict, the solution set
is 1 32
x x − ≤ ≤
or, using interval notation,
1 , 32
− .
16. 2
2
6 6 5
6 5 6 0
x x
x x
≤ +
− − ≤
We graph the function 2( ) 6 5 6f x x x= − − . The intercepts are y-intercept: (0) 6f = − x-intercepts: 26 5 6 0
(3 2)(2 3) 0x x
x x− − =
+ − =
2 3,3 2
x x= − =
The vertex is at ( 5) 52 2(6) 12
bxa
− − −= = = . Since
5 16912 24
f = −
, the vertex is 5 169, .12 24 −
−10 10
10
−10
The graph is below the x-axis when 2 33 2
x− < < .
Since the inequality is not strict, the solution set
Full file at https://testbankuniv.eu/Precalculus-Concepts-Through-Functions-A-Right-Triangle-Approach-to-Trigonometry-3rd-Edition-Sullivan-Solutions-Manual
Full file at https://testbankuniv.eu/Precalculus-Concepts-Through-Functions-A-Right-Triangle-Approach-to-Trigonometry-3rd-Edition-Sullivan-Solutions-Manual

Chapter 2: Linear and Quadratic Functions
206 Copyright © 2015 Pearson Education, Inc.
is 2 33 2
x x − ≤ ≤
or, using interval notation,
2 3, 3 2
− .
17. 2
2
( 7) 8
7 8
7 8 0
x x
x x
x x
− >
− >
− − >
We graph the function 2( ) 7 8f x x x= − − . The intercepts are y-intercept: (0) 8f = − x-intercepts: 2 7 8 0
( 1)( 8) 0x x
x x− − =
+ − =
1, 8x x= − =
The vertex is at ( 7) 72 2(1) 2
bxa
− − −= = = . Since
7 812 4
f = −
, the vertex is 7 81, .2 4
−
−10 10
10
−25 The graph is above the x-axis when 1x < − or
8x > . Since the inequality is strict, the solution set is { }1 or 8x x x< − > or, using interval
notation, ( ) ( ), 1 8, −∞ − ∪ ∞ .
18. 2
2
( 1) 2020
20 0
x xx x
x x
+ >+ >
+ − >
We graph the function 2( ) 20f x x x= + − . y-intercept: (0) 20f = − x-intercepts: 2 20 0
( 5)( 4) 0x x
x x+ − =
+ − =
5, 4x x= − =
The vertex is at (1) 12 2(1) 2
bxa
− −= = = − . Since
1 812 4
f − = −
, the vertex is 1 81, .2 4
− −
−10 10
10
−25 The graph is above the x-axis when 5x < − or
4x > . Since the inequality is strict, the solution set is { }5 or 4x x x< − > or, using interval
notation, ( ) ( ), 5 4, −∞ − ∪ ∞ .
19. 2
2
4 9 64 6 9 0
x xx x
+ <− + <
We graph the function 2( ) 4 6 9f x x x= − + . y-intercept: (0) 9f =
x-intercepts: 2( 6) ( 6) 4(4)(9)
2(4)6 108 (not real)
8
x− − ± − −
=
± −=
Therefore, f has no x-intercepts.
The vertex is at ( 6) 6 32 2(4) 8 4
bxa
− − −= = = = . Since
3 274 4
f =
, the vertex is 3 27, .4 4
−10 10
25
−5 The graph is never below the x-axis. Thus, there
is no real solution.
20. 2
225 16 40
25 40 16 0x x
x x+ <
− + <
We graph the function 2( ) 25 40 16f x x x= − + . y-intercept: (0) 16f = x-intercepts: 2
2
25 40 16 0(5 4) 0
5 4 045
x xx
x
x
− + =− =
− =
=
Full file at https://testbankuniv.eu/Precalculus-Concepts-Through-Functions-A-Right-Triangle-Approach-to-Trigonometry-3rd-Edition-Sullivan-Solutions-Manual
Full file at https://testbankuniv.eu/Precalculus-Concepts-Through-Functions-A-Right-Triangle-Approach-to-Trigonometry-3rd-Edition-Sullivan-Solutions-Manual

Section 2.5: Inequalities Involving Quadratic Functions
207
Copyright © 2015 Pearson Education, Inc.
The vertex is at ( 40) 40 42 2(25) 50 5
bxa
− − −= = = = .
Since 45
0f
= , the vertex is 45
, 0 .
−5 5
25
−5 The graph is never below the x-axis. Thus, there is no real solution.
21. 2
2
2
6( 1) 56 6 5
6 5 6 0
x xx x
x x
+ >+ >
− + >
We graph the function 2( ) 6 5 6f x x x= − + . y-intercept: (0) 6f =
x-intercepts: 2( 5) ( 5) 4(6)(6)
2(6)6 119 (not real)
12
x− − ± − −
=
± −=
Therefore, f has no x-intercepts.
The vertex is at ( 5) 52 2(6) 12
bxa
− − −= = = . Since
5 11912 24
f
= , the vertex is 5 11912 24
, .
−10 10
−5
15
The graph is always above the x-axis. Thus, the
solution set is all real numbers or, using interval notation, ( , )−∞ ∞ .
22. 2
2
2
2(2 3 ) 94 6 9
4 6 9 0
x xx x
x x
− > −− > −
− + >
We graph the function 2( ) 4 6 9f x x x= − + . y-intercept: (0) 9f =
x-intercepts: 2( 6) ( 6) 4(4)(9)
2(4)6 108 (not real)
8
x− − ± − −
=
± −=
Therefore, f has no x-intercepts.
The vertex is at ( 6) 6 32 2(4) 8 4
bxa
− − −= = = = . Since
3 274 4
f
= , the vertex is 3 274 4
, .
−10 10
25
−5 The graph is always above the x-axis. Thus, the
solution set is all real numbers or, using interval notation, ( ),−∞ ∞ .
23. The domain of the expression 2( ) 16f x x= − includes all values for which 2 16 0x − ≥ . We graph the function 2( ) 16p x x= − . The intercepts of p are y-intercept: (0) 6p = − x-intercepts: 2 16 0
( 4)( 4) 0x
x x− =
+ − =
4, 4x x= − =
The vertex of p is at (0) 02 2(1)
bxa
− −= = = . Since
(0) 16p = − , the vertex is ( )0, 16 .−
−10 10
10
−20 The graph of p is above the x-axis when 4x < −
or 4x > . Since the inequality is not strict, the solution set of 2 16 0x − ≥ is { }| 4 or 4x x x≤ − ≥ .
Thus, the domain of f is also { }| 4 or 4x x x≤ − ≥
or, using interval notation, ( ] [ ), 4 4, −∞ − ∪ ∞ .
Full file at https://testbankuniv.eu/Precalculus-Concepts-Through-Functions-A-Right-Triangle-Approach-to-Trigonometry-3rd-Edition-Sullivan-Solutions-Manual
Full file at https://testbankuniv.eu/Precalculus-Concepts-Through-Functions-A-Right-Triangle-Approach-to-Trigonometry-3rd-Edition-Sullivan-Solutions-Manual

Chapter 2: Linear and Quadratic Functions
208 Copyright © 2015 Pearson Education, Inc.
24. The domain of the expression ( ) 23f x x x= −
includes all values for which 23 0x x− ≥ . We graph the function 2( ) 3p x x x= − . The intercepts of p are y-intercept: (0) 6p = − x-intercepts: 23 0
(1 3 ) 0x x
x x− =− =
10,3
x x= = .
The vertex of p is at (1) 1 12 2( 3) 6 6
bxa
− − −= = = =− −
.
Since 1 16 12
p =
, the vertex is 1 1, .6 12
−1 1
1
−1 The graph of p is above the x-axis when
103
x< < . Since the inequality is not strict, the
solution set of 23 0x x− ≥ is 103
x x ≤ ≤
.
Thus, the domain of f is also 103
x x ≤ ≤
or,
using interval notation, 0,13
.
25. 2( ) 1; ( ) 3 3f x x g x x= − = +
a. ( ) 0f x = 2 1 0
( 1)( 1) 0x
x x− =
− + =
1; 1x x= = − Solution set: { }1, 1 .−
b. ( ) 0g x = 3 3 0
3 31
xxx
+ == −= −
Solution set: { }1 .−
c. ( ) ( )f x g x= 2
2
1 3 33 4 0
( 4)( 1) 0
x xx x
x x
− = +− − =
− + =
4; 1x x= = − Solution set: { }1, 4− .
d. ( ) 0f x > We graph the function 2( ) 1f x x= − . y-intercept: (0) 1f = − x-intercepts: 2 1 0
( 1)( 1) 0x
x x− =
+ − =
1, 1x x= − =
The vertex is at (0) 02 2(1)
bxa
− −= = = . Since
(0) 1f = − , the vertex is (0, 1).−
−10 10
10
−10 The graph is above the x-axis when 1x < − or 1x > . Since the inequality is strict, the solution set is { }1 or 1x x x< − > or, using
interval notation, ( , 1) (1, )−∞ − ∪ ∞ .
e. ( ) 03 3 0
3 31
g xx
xx
≤+ ≤
≤ −≤ −
The solution set is { }1x x ≤ − or, using
interval notation, ( ], 1−∞ − .
f. 2
2
( ) ( )1 3 3
3 4 0
f x g xx x
x x
>− > +
− − >
We graph the function 2( ) 3 4p x x x= − − . The intercepts of p are y-intercept: (0) 4p = − x-intercepts: 2 3 4 0
( 4)( 1) 0x x
x x− − =
− + =
4 , 1x x= = −
Full file at https://testbankuniv.eu/Precalculus-Concepts-Through-Functions-A-Right-Triangle-Approach-to-Trigonometry-3rd-Edition-Sullivan-Solutions-Manual
Full file at https://testbankuniv.eu/Precalculus-Concepts-Through-Functions-A-Right-Triangle-Approach-to-Trigonometry-3rd-Edition-Sullivan-Solutions-Manual

Section 2.5: Inequalities Involving Quadratic Functions
209
Copyright © 2015 Pearson Education, Inc.
The vertex is at ( 3) 32 2(1) 2
bxa
− − −= = = . Since
3 252 4
p = −
, the vertex is 3 25, .2 4
−
−10 10
10
−10 The graph of p is above the x-axis when
1x < − or 4x > . Since the inequality is strict, the solution set is { }1 or 4x x x< − > or, using interval
notation, ( ) ( ), 1 4, −∞ − ∪ ∞ .
g. 2
2
( ) 11 12 0
f xxx
≥− ≥− ≥
We graph the function 2( ) 2p x x= − . The intercepts of p are y-intercept: (0) 2p = − x-intercepts: 2
2
2 02
2
xxx
− === ±
The vertex is at (0) 02 2(1)
bxa
− −= = = . Since
(0) 2p = − , the vertex is (0, 2).−
−10 10
10
−10 The graph of p is above the x-axis when
2x < − or 2x > . Since the inequality is not strict, the solution set is
{ }2 or 2x x x≤ − ≥ or, using interval
notation, ( ), 2 2, −∞ − ∪ ∞ .
26. 2( ) 3; ( ) 3 3f x x g x x= − + = − + a.
2
2
( ) 03 0
33
f xx
xx
=− + =
== ±
Solution set: { }3, 3− .
b. ( ) 03 3 0
3 31
g xx
xx
=− + =
− = −=
Solution set: {1}. c.
2
2
( ) ( )3 3 30 30 ( 3)
f x g xx x
x xx x
=− + = − +
= −= −
0; 3x x= = Solution set: { }0, 3 .
d. ( ) 0f x > We graph the function 2( ) 3f x x= − + . y-intercept: (0) 3f = x-intercepts: 2
2
3 03
3
xxx
− + === ±
The vertex is at (0) 02 2( 1)
bxa
− −= = =−
. Since
(0) 3f = , the vertex is (0, 3).
−10 10
10
−10 The graph is above the x-axis when
3 3x− < < . Since the inequality is strict,
the solution set is { }3 3x x− < < or,
using interval notation, ( )3, 3− .
e. ( ) 03 3 0
3 31
g xx
xx
≤− + ≤
− ≤ −≥
The solution set is { }1x x ≥ or, using
interval notation, [ )1, ∞ .
Full file at https://testbankuniv.eu/Precalculus-Concepts-Through-Functions-A-Right-Triangle-Approach-to-Trigonometry-3rd-Edition-Sullivan-Solutions-Manual
Full file at https://testbankuniv.eu/Precalculus-Concepts-Through-Functions-A-Right-Triangle-Approach-to-Trigonometry-3rd-Edition-Sullivan-Solutions-Manual

Chapter 2: Linear and Quadratic Functions
210 Copyright © 2015 Pearson Education, Inc.
f. 2
2
( ) ( )3 3 3
3 0
f x g xx x
x x
>− + > − +
− + >
We graph the function 2( ) 3p x x x= − + . The intercepts of p are y-intercept: (0) 0p = x-intercepts: 2 3 0
( 3) 0x xx x
− + =− − =
0; 3x x= =
The vertex is at (3) 3 32 2( 1) 2 2
ba
x − − −− −
= = = = .
Since 3 92 4
p
= , the vertex is 3 92 4
, .
−10 10
10
−10 The graph of p is above the x-axis when 0 3x< < . Since the inequality is strict, the solution set is { }0 3x x< < or, using
interval notation, (0, 3) . g.
2
2
( ) 13 12 0
f xxx
≥− + ≥− + ≥
We graph the function 2( ) 2p x x= − + . The intercepts of p are y-intercept: (0) 2p = x-intercepts: 2
22 0
22
xxx
− + === ±
The vertex is at (0)2 2( 1)
0ba
x − −−
= = = . Since
(0) 2p = , the vertex is (0, 2).
−10 10
10
−10 The graph of p is above the x-axis when
2 2x− < < . Since the inequality is not
strict, the solution set is { }2 2x x− ≤ ≤
or, using interval notation, 2, 2 − .
27. 2( ) 1; ( ) 4 1f x x g x x= − + = + a. ( )
( )( )
2
2
01 0
1 01 1 0
f xx
xx x
=− + =
− =− + =
1; 1x x= = − Solution set: { }1, 1− .
b. ( ) 04 1 0
4 114
g xx
x
x
=+ =
= −
= −
Solution set: 14
−
.
c. ( ) ( )
( )
2
2
1 4 10 40 4
0; 4
f x g xx x
x xx x
x x
=− + = +
= += += −
Solution set: { }4, 0− .
d. ( ) 0f x >
We graph the function 2( ) 1f x x= − + . y-intercept: (0) 1f = x-intercepts: 2
2
1 01 0
( 1)( 1) 0
xx
x x
− + =− =
+ − =
1; 1x x= − =
The vertex is at (0) 02 2( 1)
bxa
− −= = =−
. Since
(0) 1f = , the vertex is (0, 1).
−10 10
10
−10 The graph is above the x-axis when
1 1x− < < . Since the inequality is strict, the solution set is { }1 1x x− < < or, using
interval notation, ( )1, 1− .
Full file at https://testbankuniv.eu/Precalculus-Concepts-Through-Functions-A-Right-Triangle-Approach-to-Trigonometry-3rd-Edition-Sullivan-Solutions-Manual
Full file at https://testbankuniv.eu/Precalculus-Concepts-Through-Functions-A-Right-Triangle-Approach-to-Trigonometry-3rd-Edition-Sullivan-Solutions-Manual

Section 2.5: Inequalities Involving Quadratic Functions
211
Copyright © 2015 Pearson Education, Inc.
e. ( ) 04 1 0
4 114
g xx
x
x
≤+ ≤
≤ −
≤ −
The solution set is 14
x x ≤ −
or, using
interval notation, 1,4
−∞ − .
f. ( ) ( )2
2
1 4 14 0
f x g xx x
x x
>− + > +
− − >
We graph the function 2( ) 4p x x x= − − . The intercepts of p are y-intercept: (0) 0p = x-intercepts: 2 4 0
( 4) 0x x
x x− − =
− + =
0; –4x x= =
The vertex is at ( 4) 4 22 2( 1) 2
bxa
− − −= = = = −− −
.
Since ( 2) 4p − = , the vertex is ( 2, 4).−
−10 10
10
−10 The graph of p is above the x-axis when
4 0x− < < . Since the inequality is strict, the solution set is { }4 0x x− < < or, using
interval notation, ( )4, 0− .
g. 2
2
( ) 11 1
0
f xx
x
≥− + ≥
− ≥
We graph the function 2( )p x x= − . The
vertex is at (0) 02 2( 1)
bxa
− −= = =−
. Since
(0) 0p = , the vertex is (0, 0). Since 1 0a = − < , the parabola opens downward.
−10 10
10
−10 The graph of p is never above the x-axis, but it does touch the x-axis at x = 0. Since the inequality is not strict, the solution set is {0}.
28. 2( ) 4; ( ) 2f x x g x x= − + = − − a.
2
2
( ) 04 04 0
( 2)( 2) 0
f xxx
x x
=− + =
− =+ − =
2; 2x x= − = Solution set: { }2, 2− .
b. ( ) 02 02
g xx
x
=− − =
− =
Solution set: { }2− .
c.
( )( )
2
2
( ) ( )4 20 60 3 2
3; 2
f x g xx x
x xx x
x x
=− + = − −
= − −= − += = −
Solution set: { }2, 3− .
d. 2
( ) 04 0
f xx
>− + >
We graph the function 2( ) 4f x x= − + . y-intercept: (0) 4f = x-intercepts: 2
2
4 04 0
( 2)( 2) 0
xx
x x
− + =− =
+ − =
2; 2x x= − =
The vertex is at (0) 02 2( 1)
bxa
− −= = =−
. Since
(0) 4f = , the vertex is (0, 4).
−10 10
10
−10
Full file at https://testbankuniv.eu/Precalculus-Concepts-Through-Functions-A-Right-Triangle-Approach-to-Trigonometry-3rd-Edition-Sullivan-Solutions-Manual
Full file at https://testbankuniv.eu/Precalculus-Concepts-Through-Functions-A-Right-Triangle-Approach-to-Trigonometry-3rd-Edition-Sullivan-Solutions-Manual
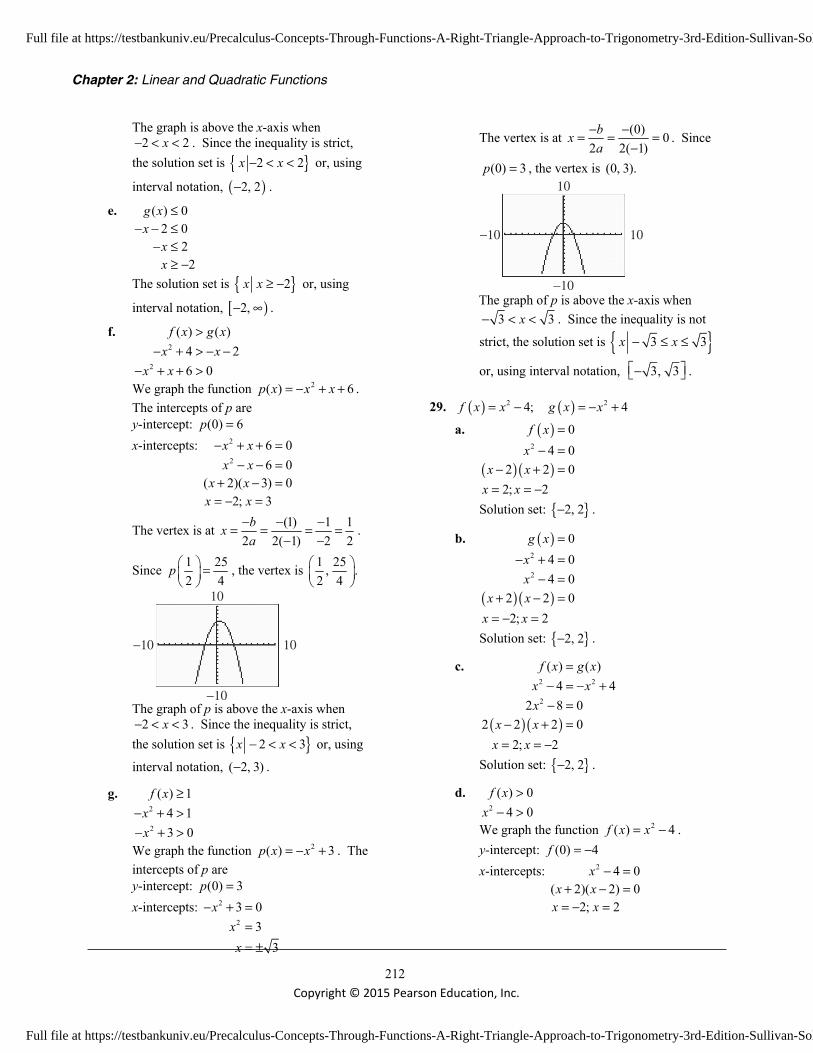
Chapter 2: Linear and Quadratic Functions
212 Copyright © 2015 Pearson Education, Inc.
The graph is above the x-axis when 2 2x− < < . Since the inequality is strict,
the solution set is { }2 2x x− < < or, using
interval notation, ( )2, 2− .
e. ( ) 02 0
22
g xx
xx
≤− − ≤
− ≤≥ −
The solution set is { }2x x ≥ − or, using
interval notation, [ )2,− ∞ .
f. 2
2
( ) ( )4 26 0
f x g xx x
x x
>− + > − −
− + + >
We graph the function 2( ) 6p x x x= − + + . The intercepts of p are y-intercept: (0) 6p = x-intercepts: 2
2
6 06 0
( 2)( 3) 0
x xx x
x x
− + + =− − =
+ − =
2; 3x x= − =
The vertex is at (1) 1 12 2( 1) 2 2
bxa
− − −= = = =− −
.
Since 1 252 4
p =
, the vertex is 1 25, .2 4
−10 10
10
−10 The graph of p is above the x-axis when
2 3x− < < . Since the inequality is strict, the solution set is { }2 3x x− < < or, using
interval notation, ( 2, 3)− .
g. 2
2
( ) 14 13 0
f xxx
≥− + >− + >
We graph the function 2( ) 3p x x= − + . The intercepts of p are y-intercept: (0) 3p = x-intercepts: 2
2
3 03
3
xxx
− + === ±
The vertex is at (0) 02 2( 1)
bxa
− −= = =−
. Since
(0) 3p = , the vertex is (0, 3).
−10 10
10
−10 The graph of p is above the x-axis when
3 3x− < < . Since the inequality is not
strict, the solution set is { }3 3x x− ≤ ≤
or, using interval notation, 3, 3 − .
29. ( ) ( )2 24; 4f x x g x x= − = − + a. ( )
( ) ( )2
04 0
2 2 0
f xx
x x
=− =
− + =
2; 2x x= = − Solution set: { }2, 2− .
b. ( )
( )( )
2
2
04 04 0
2 2 0
g xxx
x x
=− + =
− =+ − =
2; 2x x= − = Solution set: { }2, 2− .
c.
( )( )
2 2
2
( ) ( )4 4
2 8 02 2 2 0
f x g xx xx
x x
=− = − +− =
− + =
2; 2x x= = − Solution set: { }2, 2− .
d. 2
( ) 04 0
f xx
>− >
We graph the function 2( ) 4f x x= − . y-intercept: (0) 4f = − x-intercepts: 2 4 0
( 2)( 2) 0x
x x− =
+ − =
2; 2x x= − =
Full file at https://testbankuniv.eu/Precalculus-Concepts-Through-Functions-A-Right-Triangle-Approach-to-Trigonometry-3rd-Edition-Sullivan-Solutions-Manual
Full file at https://testbankuniv.eu/Precalculus-Concepts-Through-Functions-A-Right-Triangle-Approach-to-Trigonometry-3rd-Edition-Sullivan-Solutions-Manual

Section 2.5: Inequalities Involving Quadratic Functions
213
Copyright © 2015 Pearson Education, Inc.
The vertex is at (0) 02 2( 1)
bxa
− −= = =−
. Since
(0) 4f = − , the vertex is (0, 4).−
−10 10
10
−10 The graph is above the x-axis when 2x < − or 2x > . Since the inequality is strict, the solution set is { }2 or 2x x x< − > or,
using interval notation, ( ) ( ), 2 2, −∞ − ∪ ∞ .
e. 2
( ) 04 0
g xx
≤− + ≤
We graph the function 2( ) 4g x x= − + . y-intercept: (0) 4g = x-intercepts: 2
2
4 04 0
( 2)( 2) 0
xx
x x
− + =− =
+ − =
2; 2x x= − =
The vertex is at (0) 02 2( 1)
bxa
− −= = =−
. Since
(0) 4g = , the vertex is (0, 4).
−10 10
10
−10 The graph is below the x-axis when 2x < − or 2x > . Since the inequality is not strict, the solution set is { }2 or 2x x x≤ − ≥ or,
using interval notation, ( ] [ ), 2 2, −∞ − ∪ ∞ .
f. 2 2
2
( ) ( )4 4
2 8 0
f x g xx xx
>− > − +− >
We graph the function 2( ) 2 8p x x= − . y-intercept: (0) 8p = − x-intercepts: 22 8 0
2( 2)( 2) 0x
x x− =
+ − =
2; 2x x= − =
The vertex is at (0) 02 2(2)
bxa
− −= = = . Since
(0) 8p = − , the vertex is (0, 8).−
−10 10
10
−10 The graph is above the x-axis when 2x < − or 2x > . Since the inequality is strict, the solution set is { }2 or 2x x x< − > or,
using interval notation, ( , 2) (2, )−∞ − ∪ ∞ .
g. 2
2
( ) 14 15 0
f xxx
≥− ≥− ≥
We graph the function 2( ) 5p x x= − . y-intercept: (0) 5p = − x-intercepts: 2
2
5 05
5
xxx
− === ±
The vertex is at (0) 02 2(1)
bxa
− −= = = . Since
(0) 5p = − , the vertex is (0, 5).−
−10 10
10
−10 The graph of p is above the x-axis when
5x < − or 5x > . Since the inequality is not strict, the solution set is
{ }5 or 5x x x≤ − ≥ or, using interval
notation, ( ), 5 5, −∞ − ∪ ∞ .
30. ( ) ( )2 22 1; 1f x x x g x x= − + = − + a.
2
2
( ) 02 1 0
( 1) 01 0
1
f xx x
xx
x
=− + =
− =− =
=
Solution set: { }1 .
Full file at https://testbankuniv.eu/Precalculus-Concepts-Through-Functions-A-Right-Triangle-Approach-to-Trigonometry-3rd-Edition-Sullivan-Solutions-Manual
Full file at https://testbankuniv.eu/Precalculus-Concepts-Through-Functions-A-Right-Triangle-Approach-to-Trigonometry-3rd-Edition-Sullivan-Solutions-Manual

Chapter 2: Linear and Quadratic Functions
214 Copyright © 2015 Pearson Education, Inc.
b.
( )( )
2
2
( ) 01 01 0
1 1 0
g xxx
x x
=− + =
− =+ − =
1; 1x x= − = Solution set: { }1, 1− .
c.
( )
2 2
2
( ) ( )2 1 1
2 2 02 1 0
f x g xx x x
x xx x
=− + = − +
− =− =
0, 1x x= = Solution set: { }0, 1 .
d. 2
( ) 02 1 0
f xx x
>− + >
We graph the function 2( ) 2 1f x x x= − + . y-intercept: (0) 1f = x-intercepts:
( )
2
2
2 1 01 0
1 01
x xx
xx
− + =− =
− ==
The vertex is at ( 2) 2 12 2(1) 2
bxa
− − −= = = = .
Since (1) 0f = , the vertex is (1, 0).
−10 10
10
−10 The graph is above the x-axis when 1x < or
1x > . Since the inequality is strict, the solution set is { }1 or 1x x x< > or, using
interval notation, ( ) ( ), 1 1, −∞ ∪ ∞ .
e. 2
( ) 01 0
g xx
≤− + ≤
We graph the function 2( ) 1g x x= − + . y-intercept: (0) 1g = x-intercepts: 2
2
1 01 0
( 1)( 1) 0
xx
x x
− + =− =
+ − =
1; 1x x= − =
The vertex is at (0) 02 2( 1)
bxa
− −= = =−
. Since
(0) 1g = , the vertex is (0, 1). 10
−10
−10 10
The graph is below the x-axis when 1x < − or 1x > . Since the inequality is not strict, the solution set is { }1 or 1x x x≤ − ≥ or,
using interval notation, ( ] [ ), 1 1, −∞ − ∪ ∞ .
f. 2 2
2
( ) ( )2 1 1
2 2 0
f x g xx x x
x x
>− + > − +
− >
We graph the function 2( ) 2 2p x x x= − . y-intercept: (0) 0p = x-intercepts: 22 2 0
2 ( 1) 0x xx x
− =− =
0; 1x x= =
The vertex is at ( 2) 2 12 2(2) 4 2
bxa
− − −= = = = .
Since 1 12 2
p =
, the vertex is 1 1, .2 2
−5 5
5
−5 The graph is above the x-axis when 0x < or
1x > . Since the inequality is strict, the solution set is { }0 or 1x x x< > or, using
interval notation, ( ) ( ), 0 1, −∞ ∪ ∞ .
g. 2
2
( ) 12 1 1
2 0
f xx x
x x
≥− + ≥
− ≥
We graph the function 2( ) 2p x x x= − . y-intercept: (0) 0p = x-intercepts: 2 2 0
( 2) 0x xx x
− =− =
0; 2x x= =
Full file at https://testbankuniv.eu/Precalculus-Concepts-Through-Functions-A-Right-Triangle-Approach-to-Trigonometry-3rd-Edition-Sullivan-Solutions-Manual
Full file at https://testbankuniv.eu/Precalculus-Concepts-Through-Functions-A-Right-Triangle-Approach-to-Trigonometry-3rd-Edition-Sullivan-Solutions-Manual
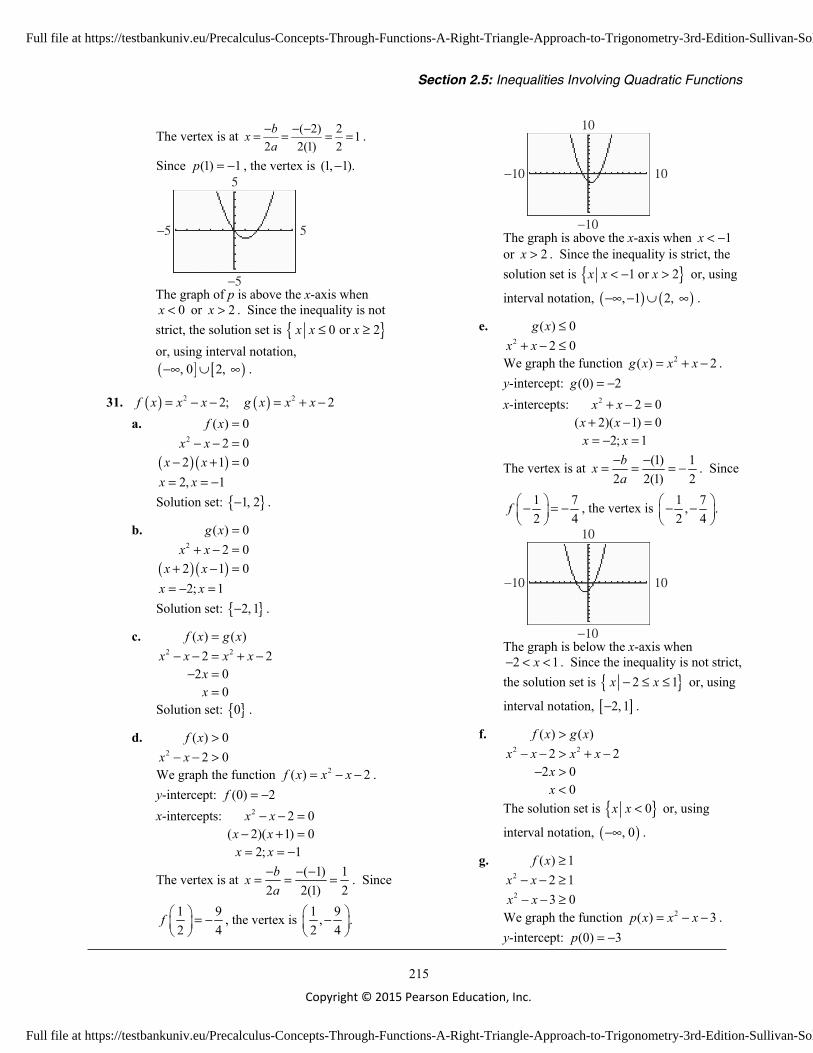
Section 2.5: Inequalities Involving Quadratic Functions
215
Copyright © 2015 Pearson Education, Inc.
The vertex is at ( 2) 2 12 2(1) 2
bxa
− − −= = = = .
Since (1) 1p = − , the vertex is (1, 1).−
−5 5
5
−5 The graph of p is above the x-axis when
0x < or 2x > . Since the inequality is not strict, the solution set is { }0 or 2x x x≤ ≥ or, using interval notation, ( ] [ ), 0 2, −∞ ∪ ∞ .
31. ( ) ( )2 22; 2f x x x g x x x= − − = + − a.
( )( )2
( ) 02 0
2 1 0
f xx x
x x
=− − =
− + =
2, 1x x= = − Solution set: { }1, 2− .
b.
( )( )2
( ) 02 0
2 1 0
g xx x
x x
=+ − =
+ − =
2; 1x x= − = Solution set: { }2, 1− .
c. 2 2
( ) ( )2 2
2 00
f x g xx x x x
xx
=− − = + −
− ==
Solution set: { }0 .
d. 2
( ) 02 0
f xx x
>− − >
We graph the function 2( ) 2f x x x= − − . y-intercept: (0) 2f = − x-intercepts: 2 2 0
( 2)( 1) 0x x
x x− − =
− + =
2; 1x x= = −
The vertex is at ( 1) 12 2(1) 2
bxa
− − −= = = . Since
1 92 4
f = −
, the vertex is 1 9, .2 4
−
−10 10
10
−10 The graph is above the x-axis when 1x < − or 2x > . Since the inequality is strict, the solution set is { }1 or 2x x x< − > or, using
interval notation, ( ) ( ), 1 2, −∞ − ∪ ∞ .
e. 2
( ) 02 0
g xx x
≤+ − ≤
We graph the function 2( ) 2g x x x= + − . y-intercept: (0) 2g = − x-intercepts: 2 2 0
( 2)( 1) 0x x
x x+ − =
+ − =
2; 1x x= − =
The vertex is at (1) 12 2(1) 2
bxa
− −= = = − . Since
1 72 4
f − = −
, the vertex is 1 7, .2 4
− −
−10 10
10
−10 The graph is below the x-axis when
2 1x− < < . Since the inequality is not strict, the solution set is { }2 1x x− ≤ ≤ or, using
interval notation, [ ]2, 1− .
f. 2 2
( ) ( )2 2
2 00
f x g xx x x x
xx
>− − > + −
− ><
The solution set is { }0x x < or, using
interval notation, ( ), 0−∞ .
g. 2
2
( ) 12 13 0
f xx xx x
≥− − ≥− − ≥
We graph the function 2( ) 3p x x x= − − . y-intercept: (0) 3p = −
Full file at https://testbankuniv.eu/Precalculus-Concepts-Through-Functions-A-Right-Triangle-Approach-to-Trigonometry-3rd-Edition-Sullivan-Solutions-Manual
Full file at https://testbankuniv.eu/Precalculus-Concepts-Through-Functions-A-Right-Triangle-Approach-to-Trigonometry-3rd-Edition-Sullivan-Solutions-Manual

Chapter 2: Linear and Quadratic Functions
216 Copyright © 2015 Pearson Education, Inc.
x-intercepts: 2 3 0x x− − =
( ) ( ) ( ) ( )
( )
21 1 4 1 32 1
1 1 12 1 132 2
1.30 or 2.30
x
x x
− − ± − − −=
± + ±= =
≈ − ≈
The vertex is at ( 1) 12 2(1) 2
bxa
− − −= = = . Since
1 132 4
p = −
, the vertex is 1 13, .2 4
−
−10 10
10
−10 The graph of p is above the x-axis when
1 132
x −< or 1 132
x +> . Since the
inequality is not strict, the solution set is 1 13 1 13 or
2 2x x x
− + ≤ ≥
or, using
interval notation, 1 13 1 13, ,
2 2 − +−∞ ∪ ∞
.
32. 2 2( ) 1; ( ) 6f x x x g x x x= − − + = − + + a.
2
2
( ) 01 01 0
f xx xx x
=− − + =
+ − =
( ) ( ) ( )( )( )
21 1 4 1 12 1
1 1 4 1 52 2
x− ± − −
=
− ± + − ±= =
Solution set: 1 5 1 5,2 2
− − − +
.
b.
( )( )
2
2
( ) 06 06 0
3 2 0
g xx xx x
x x
=− + + =
− − =− + =
3; 2x x= = − Solution set: { }2, 3− .
c. 2 2
( ) ( )1 6
2 5 02 5
52
f x g xx x x x
xx
x
=− − + = − + +
− − =− =
= −
Solution set: 52
− .
d. 2
( ) 01 0
f xx x
>− − + >
We graph the function 2( ) 1f x x x= − − + . y-intercept: (0) 1f = − x-intercepts: 2
2
2 02 0
x xx x
− − + =+ − =
2(1) (1) 4(1)( 1)2(1)
1 1 4 1 52 2
1.62 or 0.62
x
x x
− ± − −=
− ± + − ±= =
≈ − ≈
The vertex is at ( 1) 1 12 2( 1) 2 2
bxa
− − −= = = = −− −
.
Since 1 52 4
f − = , the vertex is 1 5
2 4, .
−
−10 10
10
−10 The graph is above the x-axis when
1 5 1 52 2
x− − − +< < . Since the inequality
is strict, the solution set is 1 5 1 5
2 2x x
− − − +
< < or, using interval
notation, 1 5 1 5,2 2
− − − +
.
e. 2
( ) 06 0
g xx x
≤− + + ≤
We graph the function 2( ) 6g x x x= − + + . y-intercept: (0) 6g = x-intercepts: 2
26 06 0
( 3)( 2) 0
x xx x
x x
− + + =− − =
− + =
3; 2x x= = −
Full file at https://testbankuniv.eu/Precalculus-Concepts-Through-Functions-A-Right-Triangle-Approach-to-Trigonometry-3rd-Edition-Sullivan-Solutions-Manual
Full file at https://testbankuniv.eu/Precalculus-Concepts-Through-Functions-A-Right-Triangle-Approach-to-Trigonometry-3rd-Edition-Sullivan-Solutions-Manual

Section 2.5: Inequalities Involving Quadratic Functions
217
Copyright © 2015 Pearson Education, Inc.
The vertex is at (1) 1 12 2( 1) 2 2
bxa
− − −= = = =− −
.
Since 1 252 4
f
= , the vertex is 1 252 4
, .
−10 10
10
−10 The graph is below the x-axis when 2x < − or 3x > . Since the inequality is not strict, the solution set is { }2 or 3x x x≤ − ≥ or,
using interval notation, ( ] [ ), 2 3, −∞ ∪ ∞ .
f. 2 2
( ) ( )1 6
2 552
f x g xx x x x
x
x
>− − + > − + +
− >
< −
The solution set is { }52x x < − or, using
interval notation, ( )52,−∞ − .
g. 2
2
( ) 11 1
0
f xx x
x x
≥− − + ≥
− − ≥
We graph the function 2( )p x x x= − − . y-intercept: (0) 0p = x-intercepts:
( )2 0
1 0x x
x x− − =
− + =
0; 1x x= = −
The vertex is at ( 1) 1 12 2( 1) 2 2
bxa
− − −= = = = −− −
.
Since 1 12 4
p − = , the vertex is 1 1
2 4, .
−
−2 2
2
−2 The graph of p is above the x-axis when
1 0x− < < . Since the inequality is not strict, the solution set is { }1 0x x− ≤ ≤ or,
using interval notation, [ ]1, 0− .
33. a. The ball strikes the ground when 2( ) 80 16 0s t t t= − = .
( )280 16 0
16 5 0t tt t− =
− =
0, 5t t= = The ball strikes the ground after 5 seconds.
b. Find the values of t for which 2
2
80 16 9616 80 96 0
t tt t
− >− + − >
We graph the function 2( ) 16 80 96f t t t= − + − . The intercepts are
y-intercept: (0) 96f = − t-intercepts: 2
2
16 80 96 016( 5 6) 016( 2)( 3) 0
t tt tt t
− + − =− − + =
− − =
2, 3t t= =
The vertex is at (80) 2.52 2( 16)
bta
− −= = =−
.
Since ( )2.5 4f = , the vertex is ( )2.5, 4 .
0 5
5
−5 The graph of f is above the t-axis when 2 3t< < . Since the inequality is strict, the solution set is { }| 2 3t t< < or, using
interval notation, ( )2, 3 . The ball is more than 96 feet above the ground for times between 2 and 3 seconds.
34. a. The ball strikes the ground when 2( ) 96 16 0s t t t= − = .
( )296 16 0
16 6 0t tt t
− =− =
0, 6t t= = The ball strikes the ground after 6 seconds.
b. Find the values of t for which 2
2
96 16 12816 96 128 0
t tt t
− >− + − >
We graph 2( ) 16 96 128f t t t= − + − . The intercepts are y-intercept: (0) 128f = −
Full file at https://testbankuniv.eu/Precalculus-Concepts-Through-Functions-A-Right-Triangle-Approach-to-Trigonometry-3rd-Edition-Sullivan-Solutions-Manual
Full file at https://testbankuniv.eu/Precalculus-Concepts-Through-Functions-A-Right-Triangle-Approach-to-Trigonometry-3rd-Edition-Sullivan-Solutions-Manual

Chapter 2: Linear and Quadratic Functions
218 Copyright © 2015 Pearson Education, Inc.
t-intercepts: 2
2
16 96 128 016( 6 8) 0
16( 4)( 2) 0
t tt t
t t
− + − =− + =
− − − =
4, 2t t= =
The vertex is at (96) 32 2( 16)
bta
− −= = =−
. Since
( )3 16f = , the vertex is ( )3,16 .
0 5
20
−5 The graph of f is above the t-axis when 2 4t< < . Since the inequality is strict, the solution set is { }2 4t t< < or, using
interval notation, ( )2, 4 . The ball is more than 128 feet above the ground for times between 2 and 4 seconds.
35. a. 2( ) 4 4000 0R p p p= − + =
( )4 1000 00, 1000
p pp p− − =
= =
Thus, the revenue equals zero when the price is $0 or $1000.
b. Find the values of p for which 2
2
4 4000 800,0004 4000 800,000 0
p pp p
− + >− + − >
We graph 2( ) 4 4000 800,000f p p p= − + − . The intercepts are y-intercept: (0) 800,000f = − p-intercepts:
2
2
4 4000 800000 01000 200000 0
p pp p
− + − =− + =
2( 1000) ( 1000) 4(1)(200000)2(1)
1000 2000002
1000 200 52
500 100 5
p− − ± − −
=
±=
±=
= ±
276.39; 723.61p p≈ ≈ .
The vertex is at (4000) 5002 2( 4)
bpa
− −= = =−
.
Since (500) 200,000f = , the vertex is (500, 200000).
0 1000
250,000
−50,000 The graph of f is above the p-axis when
276.39 723.61p< < . Since the inequality is strict, the solution set is { }276.39 723.61p p< < or, using interval
notation, ( )276.39, 723.61 . The revenue is more than $800,000 for prices between $276.39 and $723.61.
36. a. 21( ) 1900 02
R p p p= − + =
( )1 3800 02
0, 3800
p p
p p
− − =
= =
Thus, the revenue equals zero when the price is $0 or $3800.
b. Find the values of p for which 2
2
1 1900 12000002
1 1900 1200000 02
p p
p p
− + >
− + − >
We graph 21( ) 1900 12000002
f p p p= − + − .
The intercepts are y-intercept: (0) 1, 200,000f = −
p-intercepts:
( ) ( )
2
2
1 1900 1200000 02
3800 2400000 0800 3000 0
p p
p pp p
− + − =
− + =− − =
800; 3000p p= =
The vertex is at ( 1900) 19002 2(1/ 2)
bpa
− − −= = = .
Since ( )1900 605,000f = , the vertex is
( )1900, 605000 .
Full file at https://testbankuniv.eu/Precalculus-Concepts-Through-Functions-A-Right-Triangle-Approach-to-Trigonometry-3rd-Edition-Sullivan-Solutions-Manual
Full file at https://testbankuniv.eu/Precalculus-Concepts-Through-Functions-A-Right-Triangle-Approach-to-Trigonometry-3rd-Edition-Sullivan-Solutions-Manual

Section 2.5: Inequalities Involving Quadratic Functions
219
Copyright © 2015 Pearson Education, Inc.
0 4000
1,000,000
−100,000 The graph of f is above the p-axis when
800 3000p< < . Since the inequality is strict,
the solution set is { }800 3000p p< < or,
using interval notation, ( )800, 3000 . The revenue is more than $1,200,000 for prices between $800 and $3000.
37. 2( 4) 0x − ≤
We graph the function 2( ) ( 4)f x x= − . y-intercept: (0) 16f = x-intercepts: 2( 4) 0
4 04
xx
x
− =− =
=
The vertex is the vertex is ( )4, 0 .
−10 10
10
−10 The graph is never below the x-axis. Since the inequality is not strict, the only solution comes from the x-intercept. Therefore, the given inequality has exactly one real solution, namely
4x = .
38. 2( 2) 0x − >
We graph the function 2( ) ( 2)f x x= − . y-intercept: (0) 4f = x-intercepts: 2( 2) 0
2 02
xx
x
− =− =
=
The vertex is the vertex is ( )2, 0 .
−10 10
10
−10 The graph is above the x-axis when 2x < or
2x > . Since the inequality is strict, the solution set is { }2 or 2x x x< > . Therefore, the given inequality has exactly one real number that is not a solution, namely 2x ≠ .
39. Solving 2 1 0x x+ + > We graph the function 2( ) 1f x x x= + + . y-intercept: (0) 1f = x-intercepts: ( )( )2 24 1 4 1 1 3b ac− = − = − , so f has no x-intercepts.
The vertex is at (1) 12 2(1) 2
bxa
− −= = = − . Since
1 32 4
f − =
, the vertex is 1 3, .2 4
−
−10 10
10
−10 The graph is always above the x-axis. Thus, the solution is the set of all real numbers or, using interval notation, ( , )−∞ ∞ .
40. Solving 2 1 0x x− + < We graph the function 2( ) 1f x x x= − + . y-intercept: (0) 1f = x-intercepts: 2 24 ( 1) 4(1)(1) 3b ac− = − − = − , so f has no x-intercepts.
The vertex is at ( 1) 12 2(1) 2
bxa
− − −= = = . Since
1 32 4
f − =
, the vertex is 1 3, .2 4
−
Full file at https://testbankuniv.eu/Precalculus-Concepts-Through-Functions-A-Right-Triangle-Approach-to-Trigonometry-3rd-Edition-Sullivan-Solutions-Manual
Full file at https://testbankuniv.eu/Precalculus-Concepts-Through-Functions-A-Right-Triangle-Approach-to-Trigonometry-3rd-Edition-Sullivan-Solutions-Manual

Chapter 2: Linear and Quadratic Functions
220 Copyright © 2015 Pearson Education, Inc.
−10 10
10
−10 The graph is never below the x-axis. Thus, the
inequality has no solution. That is, the solution set is { } or ∅ .
41. If the inequality is not strict, we include the x-intercepts in the solution.
42. Since the radical cannot be negative we determine what makes the radicand a nonnegative number.
10 2 02 10
5
xxx
− ≥− ≥ −
≤
So the domain is: { }| 5x x ≤ .
43. ( ) 2
2
( )( ) 9
( )9
xf xx
x f xx
− −− =
− +−
= − = −+
Since ( ) ( )f x f x− = − then the function is odd.
44. a. 20 632639
x
x
x
= −
=
=
b.
45. a.
24 28
18
16 b. Using the LINear REGression program, the
line of best fit is: ( ) 0.3734 7.3268C H H= + c. If height increases by one inch, the head
circumference increases by 0.3734 inch. d. (26) 0.3734(26) 7.3268 17.0C = + ≈ inches e. To find the height, we solve the following
equation: 17.4 0.3734 7.3268
10.0732 0.373426.98
HH
H
= +=≈
A child with a head circumference of 17.4 inches would have a height of about 26.98 inches.
Section 2.6
1. 3R x=
2. Use LIN REGression to get 1.7826 4.0652y x= +
3. a. 21 1( ) 100 1006 6
R x x x x x = − + = − +
b. The quantity sold price cannot be negative, so 0x ≥ . Similarly, the price should be positive, so 0p > .
1 100 06
1 1006
600
x
x
x
− + >
− > −
<
Thus, the implied domain for R is { | 0 600}x x≤ < or [0, 600) .
c. 21(200) (200) 100(200)620000 20000
340000 $13,333.33
3
R = − +
−= +
= ≈
Full file at https://testbankuniv.eu/Precalculus-Concepts-Through-Functions-A-Right-Triangle-Approach-to-Trigonometry-3rd-Edition-Sullivan-Solutions-Manual
Full file at https://testbankuniv.eu/Precalculus-Concepts-Through-Functions-A-Right-Triangle-Approach-to-Trigonometry-3rd-Edition-Sullivan-Solutions-Manual
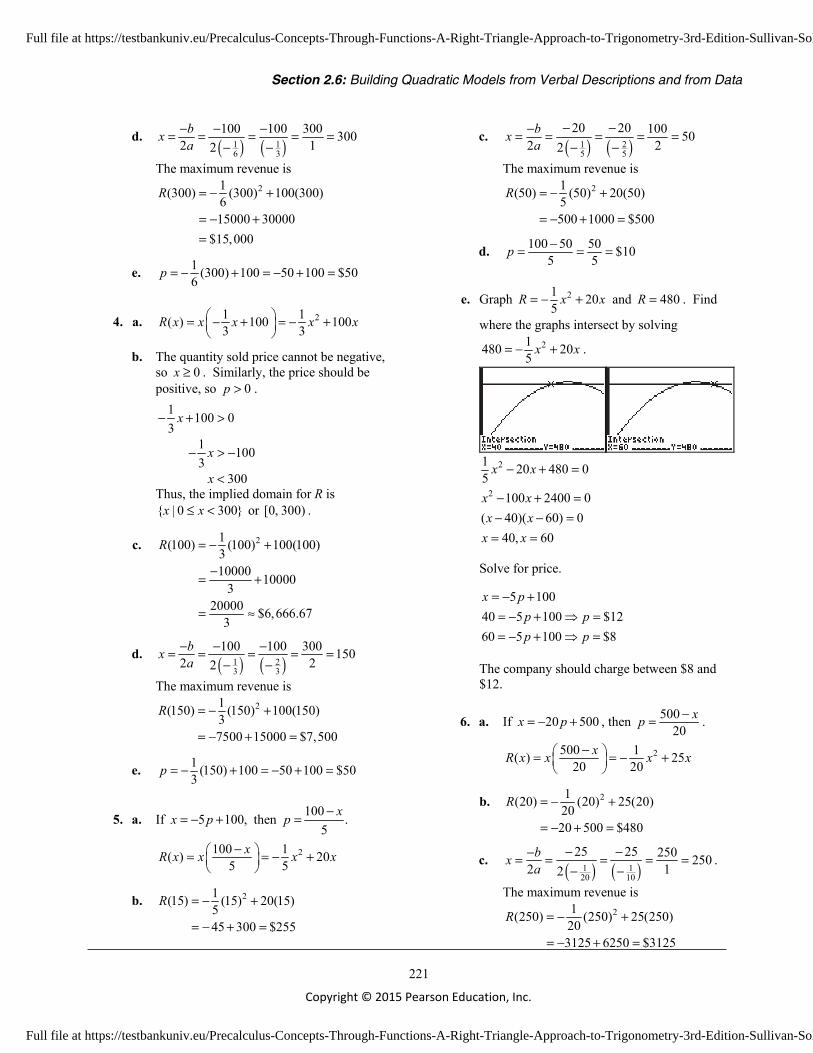
Section 2.6: Building Quadratic Models from Verbal Descriptions and from Data
221
Copyright © 2015 Pearson Education, Inc.
d. ( ) ( )1 16 3
100 100 300 3002 12
bxa
− − −= = = = =− −
The maximum revenue is 21(300) (300) 100(300)
615000 30000
$15,000
R = − +
= − +=
e. 1 (300) 100 50 100 $506
p = − + = − + =
4. a. 21 1( ) 100 1003 3
R x x x x x = − + = − +
b. The quantity sold price cannot be negative, so 0x ≥ . Similarly, the price should be positive, so 0p > .
1 100 03
1 1003
300
x
x
x
− + >
− > −
<
Thus, the implied domain for R is { | 0 300}x x≤ < or [0, 300) .
c. 21(100) (100) 100(100)310000 10000
320000 $6,666.67
3
R = − +
−= +
= ≈
d. ( ) ( )1 23 3
100 100 300 1502 22
bxa
− − −= = = = =− −
The maximum revenue is 21(150) (150) 100(150)
37500 15000 $7,500
R = − +
= − + =
e. 1 (150) 100 50 100 $503
p = − + = − + =
5. a. If 5 100,x p= − + then 100 .5
xp −=
2100 1( ) 205 5
xR x x x x− = = − +
b. 21(15) (15) 20(15)545 300 $255
R = − +
= − + =
c. ( ) ( )1 25 5
20 20 100 502 22
bxa
− −−= = = = =− −
The maximum revenue is 21(50) (50) 20(50)
5500 1000 $500
R = − +
= − + =
d. 100 50 50 $105 5
p −= = =
e. Graph 21 205
R x x= − + and 480R = . Find
where the graphs intersect by solving 21480 20
5x x= − + .
2
2
1 20 480 05
100 2400 0( 40)( 60) 0
40, 60
x x
x xx x
x x
− + =
− + =− − =
= =
Solve for price.
5 100
40 5 100 $1260 5 100 $8
x pp pp p
= − += − + == − + =
The company should charge between $8 and $12.
6. a. If 20 500x p= − + , then 50020
xp −= .
2500 1( ) 2520 20
xR x x x x− = = − +
b. 21(20) (20) 25(20)2020 500 $480
R = − +
= − + =
c. ( ) ( )1 120 10
25 25 250 2502 12
bxa
− −−= = = = =− −
.
The maximum revenue is 21(250) (250) 25(250)
203125 6250 $3125
R = − +
= − + =
Full file at https://testbankuniv.eu/Precalculus-Concepts-Through-Functions-A-Right-Triangle-Approach-to-Trigonometry-3rd-Edition-Sullivan-Solutions-Manual
Full file at https://testbankuniv.eu/Precalculus-Concepts-Through-Functions-A-Right-Triangle-Approach-to-Trigonometry-3rd-Edition-Sullivan-Solutions-Manual

Chapter 2: Linear and Quadratic Functions
222 Copyright © 2015 Pearson Education, Inc.
d. 500 250 250 $12.5020 20
p −= = =
e. Graph 21 2520
R x x= − + and 3000R = .
Find where the graphs intersect by solving 213000 25
20x x= − + .
2
2
1 25 3000 020
500 60000 0( 200)( 300) 0
200, 300
x x
x xx x
x x
− + =
− + =− − =
= =
Solve for price.
20 500
300 20 500 $10200 20 500 $15
x pp pp p
= − += − + == − + =
The company should charge between $10 and $15.
7. a. Let w = width and l = length of the rectangular area. Solving 2 2 400P w l= + = for l :
400 2 2002
wl w−= = − .
Then 2
2
( ) (200 ) 200
200
A w w w w w
w w
= − = −
= − +
b. 200 200 1002 2( 1) 2
bwa
− −−= = = =− −
yards
c. 2
2
(100) 100 200(100)10000 20000
10,000 yd
A = − += − +
=
8. a. Let x = width and y = width of the rectangle. Solving 2 2 3000P x y= + = for y:
3000 2 1500 .2
xy x−= = −
Then 2
2
( ) (1500 )
1500
1500 .
A x x x
x x
x x
= −
= −
= − +
b. 1500 1500 7502 2( 1) 2
bxa
− −−= = = =− −
feet
c. 2
2
(750) 750 1500(750)562500 1125000
562,500 ft
A = − += − +
=
9. Let x = width and y = length of the rectangle. Solving 2 4000P x y= + = for y: 4000 2y x= − . Then
2
2
( ) (4000 2 )
4000 2
2 4000
A x x x
x x
x x
= −
= −
= − +
4000 4000 10002 2( 2) 4
bxa
− −−= = = =− −
meters
maximizes area. 2(1000) 2(1000) 4000(1000)
2000000 40000002,000,000
A = − += − +=
.
The largest area that can be enclosed is 2,000,000 square meters.
10. Let x = width and y = length of the rectangle. 2 2000
2000 2x y
y x+ =
= −
Then 2
2
( ) (2000 2 )2000 2
2 2000
A x x xx x
x x
= −= −= − +
2000 2000 5002 2( 2) 4
bxa
− − −= = = =− −
meters
maximizes area. 2(500) 2(500) 2000(500)
500,000 1,000,000500,000
A = − += − +=
The largest area that can be enclosed is 500,000 square meters.
Full file at https://testbankuniv.eu/Precalculus-Concepts-Through-Functions-A-Right-Triangle-Approach-to-Trigonometry-3rd-Edition-Sullivan-Solutions-Manual
Full file at https://testbankuniv.eu/Precalculus-Concepts-Through-Functions-A-Right-Triangle-Approach-to-Trigonometry-3rd-Edition-Sullivan-Solutions-Manual

Section 2.6: Building Quadratic Models from Verbal Descriptions and from Data
223
Copyright © 2015 Pearson Education, Inc.
11. 2
22
32 8( ) 200 200625(50)
xh x x x x−= + + = − + +
a. 8 , 1, 200.625
a b c= − = =
The maximum height occurs when
( )1 625 39
2 162 8 / 625bxa
− −= = = ≈−
feet from
base of the cliff. b. The maximum height is
28625
625 625 625 20016 16 16
7025 219.5 feet.32
h − = + +
= ≈
c. Solving when ( ) 0h x = : 28 200 0
625x x− + + =
( )( )
21 1 4 8 / 625 (200)
2 8 / 6251 11.24
0.0256
91.90 or 170
x
x
x x
− ± − −=
−− ±
≈ −
≈ − ≈
Since the distance cannot be negative, the projectile strikes the water approximately 170 feet from the base of the cliff.
d.
0 200
250
0 e. Using the MAXIMUM function
0 200
250
0 Using the ZERO function
0 200
250
0
f. 2
2
8 200 100625
8 100 0625
x x
x x
− + + =
− + + =
( )( )( )
21 4 8 / 625 100 1 6.120.02562 8 / 625
57.57 or 135.70
x
x x
− − − ±= =−−
≈ − ≈
Since the distance cannot be negative, the projectile is 100 feet above the water when it is approximately 135.7 feet from the base of the cliff.
12. a. 2
22
32 2( )625(100)
xh x x x x−= + = − +
2 , 1, 0.625
a b c= − = =
The maximum height occurs when
( )1 625 156.25 feet
2 42 2 / 625bxa
− −= = = =−
b. The maximum height is 2625 2 625 625
4 625 4 4625 78.125 feet8
h − = +
= =
c. Solving when ( ) 0h x = : 22 0
6252 1 0
625
x x
x x
− + =
− + =
20 or 1 0625
20 or 16256250 or 312.5
2
x x
x x
x x
= − + =
= =
= = =
Since the distance cannot be zero, the projectile lands 312.5 feet from where it was fired.
d.
0 350
100
0 e. Using the MAXIMUM function
Full file at https://testbankuniv.eu/Precalculus-Concepts-Through-Functions-A-Right-Triangle-Approach-to-Trigonometry-3rd-Edition-Sullivan-Solutions-Manual
Full file at https://testbankuniv.eu/Precalculus-Concepts-Through-Functions-A-Right-Triangle-Approach-to-Trigonometry-3rd-Edition-Sullivan-Solutions-Manual

Chapter 2: Linear and Quadratic Functions
224 Copyright © 2015 Pearson Education, Inc.
0 350
100
0 Using the ZERO function
0 350
100
0 f. Solving when ( ) 50h x = :
2
2
2 50625
2 50 0625
x x
x x
− + =
− + − =
( )( )( )
21 1 4 2 / 625 502 2 / 625
1 0.36 1 0.60.0064 0.0064
62.5 or 250
x
x x
− ± − − −=−
− ± − ±= ≈− −
= =
The projectile is 50 feet above the ground 62.5 feet and 250 feet from where it was fired.
13. Locate the origin at the point where the cable touches the road. Then the equation of the parabola is of the form: 2 , where 0.y ax a= > Since the point (200, 75) is on the parabola, we can find the constant a :
Since 275 (200)a= , then 275 0.001875
200a = = .
When 100x = , we have: 20.001875(100) 18.75 metersy = = .
(200,75)
(0,0)
(–200,75)
200100–200
y
x
14. Locate the origin at the point directly under the highest point of the arch. Then the equation of the parabola is of the form: 2y ax k= − + , where a > 0. Since the maximum height is 25
feet, when 0, 25x y k= = = . Since the point (60, 0) is on the parabola, we can find the constant a : Since 20 (60) 25 thena= − +
225
60a = . The equation of the parabola is:
22
25( ) 2560
h x x= − + .
(0,0)
(0,25)
20 40 (60,0)(–60,0) 10
22
22
22
At 10 :25 25(10) (10) 25 25 24.3 ft.
3660At 20 :
25 25(20) (20) 25 25 22.2 ft.960
At 40 :25 100(40) (40) 25 25 13.9 ft.
960
x
h
x
h
x
h
=
= − + = − + ≈
=
= − + = − + ≈
=
= − + = − + ≈
15. a. Let x = the depth of the gutter and y the width of the gutter. Then A xy= is the cross-sectional area of the gutter. Since the aluminum sheets for the gutter are 12 inches wide, we have 2 12x y+ = . Solving for y :
12 2y x= − . The area is to be maximized, so: 2(12 2 ) 2 12A xy x x x x= = − = − + . This
equation is a parabola opening down; thus, it has a maximum
when 12 12 32 2( 2) 4
bxa
− − −= = = =− −
.
Thus, a depth of 3 inches produces a maximum cross-sectional area.
b. Graph 22 12A x x= − + and 16A = . Find where the graphs intersect by solving
216 2 12x x= − + .
Full file at https://testbankuniv.eu/Precalculus-Concepts-Through-Functions-A-Right-Triangle-Approach-to-Trigonometry-3rd-Edition-Sullivan-Solutions-Manual
Full file at https://testbankuniv.eu/Precalculus-Concepts-Through-Functions-A-Right-Triangle-Approach-to-Trigonometry-3rd-Edition-Sullivan-Solutions-Manual

Section 2.6: Building Quadratic Models from Verbal Descriptions and from Data
225
Copyright © 2015 Pearson Education, Inc.
2
2
2 12 16 0
6 8 0( 4)( 2) 0
4, 2
x x
x xx x
x x
− + =
− + =− − =
= =
The graph of 22 12A x x= − + is above the graph of 16A = where the depth is between 2 and 4 inches.
16. Let x = width of the window and y = height of the rectangular part of the window. The
perimeter of the window is: 2 20.2xx y π+ + =
Solving for y : 40 24x xy − − π= .
The area of the window is: 2
2 2 2
2
40 2 1( )4 2 2
102 4 8
1 10 .2 8
x x xA x x
x x xx
x x
− − π = + π
π π= − − +
π = − − +
This equation is a parabola opening down; thus, it has a maximum when
10 10 5.6 feet2 12 12 8 440 2(5.60) (5.60) 2.8 feet
4
bxa
y
− −= = = ≈π π − − +
− − π= ≈
The width of the window is about 5.6 feet and the height of the rectangular part is approximately 2.8 feet. The radius of the semicircle is roughly 2.8 feet, so the total height is about 5.6 feet.
17. Let x = the width of the rectangle or the diameter of the semicircle and let y = the length of the
rectangle. The perimeter of each semicircle is2xπ .
The perimeter of the track is given
by: 15002 2x x y yπ π+ + + = .
Solving for x : 2 1500
1500 21500 2
x yx y
yx
π + =π = −
−=π
The area of the rectangle is: 221500 2 1500yA xy y y y−− = = = + π π π
.
This equation is a parabola opening down; thus, it has a maximum when
15001500 375.
2 422
bya
−− −π= = = =
−− π
Thus, 1500 2(375) 750 238.73x −= = ≈π π
The dimensions for the rectangle with maximum
area are 750 238.73≈π
meters by 375 meters.
18. Let x = width of the window and y = height of the rectangular part of the window. The perimeter of the window is:
3 2 16
16 32
x yxy
+ =−=
The area of the window is
2
2 2
2
16 3 3( )2 4
3 382 4
3 3 82 4
xA x x x
x x x
x x
− = +
= − +
= − + +
This equation is a parabola opening down; thus, it has a maximum when
82 3 32 2 4
8 16 3.75 ft.3 6 33 2
bxa
−−= =
− +
− −= = ≈− +− +
The window is approximately 3.75 feet wide. 16 4816 3 16
246 3 6 3 82 2 6 3
y
−− + − + − + = = = +− +
The height of the equilateral triangle is
Full file at https://testbankuniv.eu/Precalculus-Concepts-Through-Functions-A-Right-Triangle-Approach-to-Trigonometry-3rd-Edition-Sullivan-Solutions-Manual
Full file at https://testbankuniv.eu/Precalculus-Concepts-Through-Functions-A-Right-Triangle-Approach-to-Trigonometry-3rd-Edition-Sullivan-Solutions-Manual

Chapter 2: Linear and Quadratic Functions
226 Copyright © 2015 Pearson Education, Inc.
3 16 8 32 6 3 6 3 − −= − + − +
feet, so the total height is
24 8 38 5.626 3 6 3
−+ + ≈− + − +
feet.
19. We are given: 2( ) ( )V x kx a x kx akx= − = − + . The reaction rate is a maximum when:
2 2( ) 2 2b ak ak axa k k
− −= = = =−
.
20. We have:
2 20
21
2 22
( ) ( )
(0) (0)
( ) ( )
a h b h c ah bh c y
a b c c y
a h b h c ah bh c y
− + − + = − + =
+ + = =
+ + = + + =
Equating the two equations for the area, we have: 2 2
0 1 22
4 4
2 6 .
y y y ah bh c c ah bh c
ah c
+ + = − + + + + +
= +
Therefore,
( ) ( )20 1 2Area 2 6 4
3 3h hah c y y y= + = + + sq. units.
21. 2( ) 5 8, 1f x x h= − + =
( ) ( )2 21Area 2 6 2( 5)(1) 6(8)3 31 38( 10 48) sq. units3 3
h ah c= + = − +
= − + =
22. 2( ) 2 8, 2f x x h= + =
( )( )
2 22Area (2 6 ) 2(2)(2) 6(8)3 32 2 12816 48 (64) sq. units3 3 3
h ah c= + = +
= + = =
23. 2( ) 3 5, 4f x x x h= + + =
( ) ( )2 24Area 2 6 2(1)(4) 6(5)3 34 248(32 30) sq. units3 3
h ah c= + = +
= + =
24. 2( ) 4, 1f x x x h= − + + =
( )( )
2 21Area (2 6 ) 2( 1)(1) 6(4)3 31 1 222 24 (22) sq. units3 3 3
h ah c= + = − +
= − + = =
25. a.
From the graph, the data appear to follow a
quadratic relation with 0a < .
b. Using the QUADratic REGression program
2( ) 43.335 4184.883 54,062.439I x x x= − + −
c. 4184.883 48.32 2( 43.335)bxa
− −= = ≈−
An individual will earn the most income at about 48.3 years of age.
d. The maximum income will be: I(48.3) = 2
$46,97243.335(48.3) 4184.883(48.3) 54,062.439
≈− + −
e.
26. a.
0 2200
80
From the graph, the data appear to follow a
quadratic relation with 0a < .
Full file at https://testbankuniv.eu/Precalculus-Concepts-Through-Functions-A-Right-Triangle-Approach-to-Trigonometry-3rd-Edition-Sullivan-Solutions-Manual
Full file at https://testbankuniv.eu/Precalculus-Concepts-Through-Functions-A-Right-Triangle-Approach-to-Trigonometry-3rd-Edition-Sullivan-Solutions-Manual

Section 2.6: Building Quadratic Models from Verbal Descriptions and from Data
227
Copyright © 2015 Pearson Education, Inc.
b. Using the QUADratic REGression program
2( ) 0.0037 1.0318 5.6667h x x x= − + +
c. 1.03180.0037
139.42 2( )
bxa −
− −= = ≈
The ball will travel about 139.4 feet before it reaches its maximum height.
d. The maximum height will be: (139.4)h = 20.0037(139.4) 1.0318(139.4) 5.6667
77.6 feet− + +≈
e.
0 2200
80
27. a.
From the graph, the data appear to be
linearly related with 0m > .
b. Using the LINear REGression program
( ) 0.953 704.186R x x= +
c. (850) 0.953(850) 704.186 1514R = + ≈ The rent for an 850 square-foot apartment in San Diego will be about $1514 per month.
28. a.
25 7515
35
From the graph, the data appear to follow a
quadratic relation with 0a < .
b. Using the QUADratic REGression program
2( ) 0.017 1.935 25.341M s s s= − + −
c. 2(63) 0.017(63) 1.935(63) 25.34129.1
M = − + −≈
A Camry traveling 63 miles per hour will get about 29.1 miles per gallon.
29. a.
From the graph, the data appear to follow a
quadratic relation with 0a < .
b. Using the QUADratic REGression program
2( ) 0.483 26.356 251.342B a a a= − + −
c.
2(35) 0.483(35) 26.356(35) 251.34279.4
B = − + −≈
The birthrate of 35-year-old women is about 79.4 per 1000.
Full file at https://testbankuniv.eu/Precalculus-Concepts-Through-Functions-A-Right-Triangle-Approach-to-Trigonometry-3rd-Edition-Sullivan-Solutions-Manual
Full file at https://testbankuniv.eu/Precalculus-Concepts-Through-Functions-A-Right-Triangle-Approach-to-Trigonometry-3rd-Edition-Sullivan-Solutions-Manual
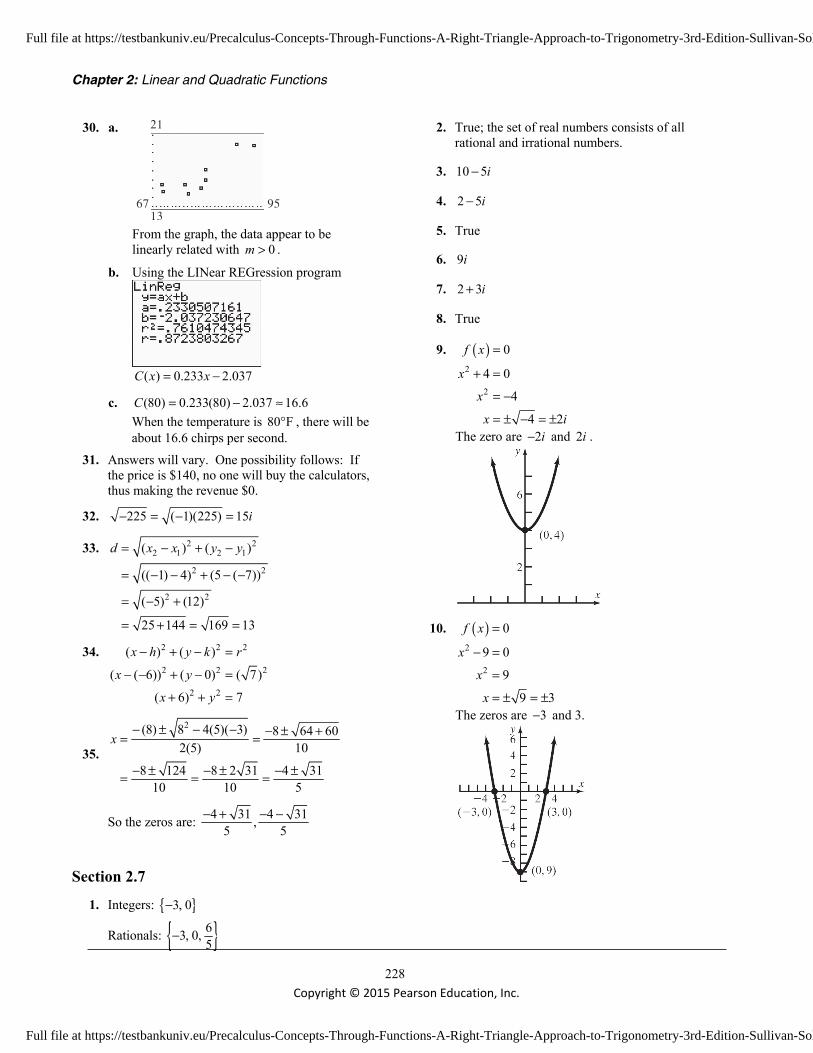
Chapter 2: Linear and Quadratic Functions
228 Copyright © 2015 Pearson Education, Inc.
30. a.
67 9513
21
From the graph, the data appear to be
linearly related with 0m > .
b. Using the LINear REGression program
( ) 0.233 2.037C x x= −
c. (80) 0.233(80) 2.037 16.6C = − ≈ When the temperature is 80 F° , there will be about 16.6 chirps per second.
31. Answers will vary. One possibility follows: If the price is $140, no one will buy the calculators, thus making the revenue $0.
32. 225 ( 1)(225) 15i− = − =
33. 2 22 1 2 1
2 2
2 2
( ) ( )
(( 1) 4) (5 ( 7))
( 5) (12)
25 144 169 13
d x x y y= − + −
= − − + − −
= − +
= + = =
34. 2 2 2
2 2 2
2 2
( ) ( )
( ( 6)) ( 0) ( 7)
( 6) 7
x h y k r
x y
x y
− + − =
− − + − =
+ + =
35.
2(8) 8 4(5)( 3) 8 64 602(5) 10
8 124 8 2 31 4 3110 10 5
x− ± − − − ± += =
− ± − ± − ±= = =
So the zeros are: 4 31 4 31,5 5− + − −
Section 2.7 1. Integers: { }3, 0−
Rationals: { }63, 0,5
−
2. True; the set of real numbers consists of all rational and irrational numbers.
3. 10 5i−
4. 2 5i−
5. True
6. 9i
7. 2 3i+
8. True
9. ( )2
2
0
4 0
4
4 2
f x
x
x
x i
=
+ =
= −
= ± − = ±
The zero are 2i− and 2i .
10. ( )2
2
0
9 0
9
9 3
f x
x
x
x
=
− =
=
= ± = ±
The zeros are 3− and 3.
Full file at https://testbankuniv.eu/Precalculus-Concepts-Through-Functions-A-Right-Triangle-Approach-to-Trigonometry-3rd-Edition-Sullivan-Solutions-Manual
Full file at https://testbankuniv.eu/Precalculus-Concepts-Through-Functions-A-Right-Triangle-Approach-to-Trigonometry-3rd-Edition-Sullivan-Solutions-Manual

Section 2.7: Complex Zeros of a Quadratic Function
229
Copyright © 2015 Pearson Education, Inc.
11. ( )2
0
16 0
f x
x
=
− =
2 16
16 4
x
x
=
= ± = ±
The zeros are 4− and 4.
12. ( )2
2
0
25 0
25
25 5
f x
x
x
x i
=
+ =
= −
= ± − = ±
The zeros are 5i− and 5i .
13. ( )2
0
6 13 0
f x
x x
=
− + =
2 2
1, 6, 13,
4 ( 6) 4(1)(13) 36 52 16
( 6) 16 6 4 3 22(1) 2
a b c
b ac
ix i
= = − =
− = − − = − = −
− − ± − ±= = = ±
The zeros are 3 2i− and 3 2i+ .
14. ( )2
0
4 8 0
f x
x x
=
+ + =
2 2
1, 4, 8
4 4 4(1)(8) 16 32 16
4 16 4 4 2 22(1) 2
a b c
b ac
ix i
= = =
− = − = − = −
− ± − − ±= = = − ±
The zeros are 2 2i− − and 2 2i− + .
15. ( )2
0
6 10 0
f x
x x
=
− + =
2 2
1, 6, 10
4 ( 6) 4(1)(10) 36 40 4
( 6) 4 6 2 32(1) 2
a b c
b ac
ix i
= = − =
− = − − = − = −
− − ± − ±= = = ±
Full file at https://testbankuniv.eu/Precalculus-Concepts-Through-Functions-A-Right-Triangle-Approach-to-Trigonometry-3rd-Edition-Sullivan-Solutions-Manual
Full file at https://testbankuniv.eu/Precalculus-Concepts-Through-Functions-A-Right-Triangle-Approach-to-Trigonometry-3rd-Edition-Sullivan-Solutions-Manual

Chapter 2: Linear and Quadratic Functions
230 Copyright © 2015 Pearson Education, Inc.
The zeros are 3 i− and 3 i+ .
16. ( )2
0
2 5 0
f x
x x
=
− + =
2 2
1, 2, 5
4 ( 2) 4(1)(5) 4 20 16
( 2) 16 2 4 1 22(1) 2
a b c
b ac
ix i
= = − =
− = − − = − = −
− − ± − ±= = = ±
The zeros are 1 2 i− and 1 2i+ .
17. ( )2
0
4 1 0
f x
x x
=
− + =
2 2
1, 4, 1
4 ( 4) 4(1)(1) 16 4 12
( 4) 12 4 2 3 2 32(1) 2
a b c
b ac
x
= = − =
− = − − = − =
− − ± ±= = = ±
The zeros are 2 3− and 2 3+ , or approximately 0.27 and 3.73.
18. ( )2
0
6 1 0
f x
x x
=
+ + =
2 2
1, 6, 1
4 6 4(1)(1) 36 4 32
6 32 6 4 2 3 2 22(1) 2
a b c
b ac
x
= = =
− = − = − =
− ± − ±= = = − ±
The zeros are 3 2 2− − and 3 2 2− + , or approximately 5.83− and 0.17− .
19. ( )2
0
2 2 1 0
f x
x x
=
+ + =
( )22
2, 2, 1
4 2 4(2)(1) 4 8 4
2 4 2 2 1 12(2) 4 2 2
a b c
b ac
ix i
= = =
− = − = − = −
− ± − − ±= = = − ±
The zeros are 1 12 2
i− − and 1 12 2
i− + .
Full file at https://testbankuniv.eu/Precalculus-Concepts-Through-Functions-A-Right-Triangle-Approach-to-Trigonometry-3rd-Edition-Sullivan-Solutions-Manual
Full file at https://testbankuniv.eu/Precalculus-Concepts-Through-Functions-A-Right-Triangle-Approach-to-Trigonometry-3rd-Edition-Sullivan-Solutions-Manual

Section 2.7: Complex Zeros of a Quadratic Function
231
Copyright © 2015 Pearson Education, Inc.
20. ( )2
0
3 6 4 0
f x
x x
=
+ + =
( )22
3, 6, 4
4 6 4(3)(4) 36 48 12
6 12 6 2 3 312(3) 6 3
a b c
b ac
ix i
= = =
− = − = − = −
− ± − − ±= = = − ±
The zeros are 313
i− − and 313
i− + .
21. ( )2
0
1 0
f x
x x
=
+ + =
1, 1, 1,a b c= = = 2 24 1 4(1)(1) 1 4 3
1 3 1 3 1 32(1) 2 2 2
b ac
ix i
− = − = − = −
− ± − − ±= = = − ±
The zeros are 1 32 2
i− − and 1 32 2
i− + .
22. ( )2
0
1 0
f x
x x
=
− + =
1, 1, 1a b c= = − = 2 24 ( 1) 4(1)(1) 1 4 3
( 1) 3 1 3 1 32(1) 2 2 2
b ac
ix i
− = − − = − = −
− − ± − ±= = = ±
The zeros are 1 32 2
i− and 1 32 2
i+ .
23. ( )2
0
2 8 1 0
f x
x x
=
− + + =
2 2
2, 8, 1
4 8 4( 2)(1) 64 8 72
8 72 8 6 2 4 3 2 3 222( 2) 4 2 2
a b c
b ac
x
= − = =
− = − − = + =
− ± − ± ±= = = = ±− −
The zeros are 4 3 22
− and 4 3 22
+ , or
approximately 0.12− and 4.12.
24. ( )2
0
3 6 1 0
f x
x x
=
− + + =
2 2
3, 6, 1
4 6 4( 3)(1) 36 12 48
6 48 6 4 3 3 2 3 2 312( 3) 6 3 3
a b c
b ac
x
= − = =
− = − − = + =
− ± − ± ±= = = = ±− −
The zeros are 3 2 33
− and 3 2 33
+ , or
approximately 0.15− and 2.15.
Full file at https://testbankuniv.eu/Precalculus-Concepts-Through-Functions-A-Right-Triangle-Approach-to-Trigonometry-3rd-Edition-Sullivan-Solutions-Manual
Full file at https://testbankuniv.eu/Precalculus-Concepts-Through-Functions-A-Right-Triangle-Approach-to-Trigonometry-3rd-Edition-Sullivan-Solutions-Manual

Chapter 2: Linear and Quadratic Functions
232 Copyright © 2015 Pearson Education, Inc.
25. 23 3 4 0x x− + =
2 2
3, 3, 4
4 ( 3) 4(3)(4) 9 48 39
a b c
b ac
= = − =
− = − − = − = −
The equation has two complex solutions that are conjugates of each other.
26. 22 4 1 0x x− + =
2 2
2, 4, 1
4 ( 4) 4(2)(1) 16 8 8
a b c
b ac
= = − =
− = − − = − =
The equation has two unequal real number solutions.
27. 22 3 4 0x x+ − =
2 2
2, 3, 4
4 3 4(2)( 4) 9 32 41
a b c
b ac
= = = −
− = − − = + =
The equation has two unequal real solutions.
28. 2 2 6 0x x+ + =
( )22
1, 2, 6
4 2 4(1)(6) 4 24 20
a b c
b ac
= = =
− = − = − = −
The equation has two complex solutions that are conjugates of each other.
29. 29 12 4 0x x− + =
2 2
9, 12, 4
4 ( 12) 4(9)(4) 144 144 0
a b c
b ac
= = − =
− = − − = − =
The equation has a repeated real solution.
30. 24 12 9 0x x+ + =
2 2
4, 12, 9
4 12 4(4)(9) 144 144 0
a b c
b ac
= = =
− = − = − =
The equation has a repeated real solution.
31. 4
2 2
2 2
16 0
( 4)( 4) 0
4 42 2
t
t t
t tt t i
− =
− + =
= = −= ± = ±
32. 4
2 2
2 2
81 0
( 9)( 9) 0
9 93 3
y
y y
y yy y i
− =
− + =
= = −= ± = ±
33. 6 3
3 3
2 2
( ) 9 8 0
( 8)( 1) 0
( 2)( 2 4)( 1)( 1) 0
F x x x
x x
x x x x x x
= − + =
− − =
− + + − + + =
( )
2
2
2 4 0 1, 2, 4
2 2 4 4 2 12 2 2 32(1) 2 2
1 3
x x a b c
ix
i
+ + = → = = =
− ± − − ± − − ±= = =
= − ±
( )
2
2
1 0 1, 1, 1
1 1 4 1 1 3 1 32(1) 2 2
1 32 2
x x a b c
ix
i
+ + = → = = =
− ± − − ± − − ±= = =
= − ±
The solution set is 1 31 3, , 2,12 2
i i
− ± − ±
34. 6 3
3 3
2 2
( ) 28 27 0
( 27)( 1) 0
( 3)( 3 9)( 1)( 1) 0
P z z z
z z
z z z z z z
= + + =
+ + =
+ − + + − + =
Full file at https://testbankuniv.eu/Precalculus-Concepts-Through-Functions-A-Right-Triangle-Approach-to-Trigonometry-3rd-Edition-Sullivan-Solutions-Manual
Full file at https://testbankuniv.eu/Precalculus-Concepts-Through-Functions-A-Right-Triangle-Approach-to-Trigonometry-3rd-Edition-Sullivan-Solutions-Manual

Section 2.8: Equations and Inequalities Involving the Absolute Value Function
233
Copyright © 2015 Pearson Education, Inc.
( ) ( ) ( )
2
2
3 9 01, 3, 9
3 3 4 9 3 272(1) 2
3 3 3 3 3 32 2 2
z za b c
z
i i
− + == = − =
− − ± − − ± −= =
±= = ±
( ) ( ) ( )
2
2
1 0 1, 1, 1
1 1 4 1 1 3 1 32(1) 2 2
1 32 2
z z a b c
iz
i
− + = → = = − =
− − ± − − ± − ±= = =
= ±
The solution set is 3 3 3 1 3, , 3, 12 2 2 2
i i
± ± − −
35. 2( ) ( )1x xf x g x
x x+= =
+
2 2
2 2
2( )( ) 1( 2)( 1) ( )
( 1) ( 1)
3 2( 1) ( 1)
3 2( 1)
3 2( 1)
x xg f xx x
x x x xx x x x
x x xx x x x
x x xx x
xx x
+− = −+
+ += −+ +
+ += −+ +
+ + −=+
+=+
Domain: { }| 1, 0x x x≠ − ≠
36. a. Domain: [ ]3,3− Range: [ ]2, 2−
b. Intercepts: ( ) ( ) ( )3,0 , 0,0 , 3,0− c. Symmetric with respect to the orgin. d. The relation is a function. It passes the
vertical line test. 37.
Local maximum: (0,0) Local Minima: (-2.12,-20.25), (2.12,-20.25) Increasing: (-2.12,0), (2.12,4) Decreasing: (-4, -2.12), (0,2.12)
38. 2kyx
=
2
2
24 255600600
k k
k
yx
= =
=
=
Section 2.8 1. 2x ≥ −
−8 −6 −4 −2 0 2 4 8
2. The distance on a number line from the origin to a is a for any real number a .
3. 4 3 94 12
3
xxx
− ===
The solution set is {3}.
4. 3 2 73 9
3
xxx
− >>>
The solution set is {x | x > 3} or, using interval notation, ( )3, ∞ .
5. 1 2 5 136 2 83 4
xx
x
− < + <− < <− < <
The solution set is { }| 3 4x x− < < or, using
interval notation, ( )3, 4− .
Full file at https://testbankuniv.eu/Precalculus-Concepts-Through-Functions-A-Right-Triangle-Approach-to-Trigonometry-3rd-Edition-Sullivan-Solutions-Manual
Full file at https://testbankuniv.eu/Precalculus-Concepts-Through-Functions-A-Right-Triangle-Approach-to-Trigonometry-3rd-Edition-Sullivan-Solutions-Manual

Chapter 2: Linear and Quadratic Functions
234 Copyright © 2015 Pearson Education, Inc.
6. To graph ( ) 3f x x= − , shift the graph of
y x= to the right 3 units.
−10
y
x
−10
10
10
( ) 3f x x= −
7. a− ; a
8. a u a− < <
9. ≤
10. True
11. False. Any real number will be a solution of 2x > − since the absolute value of any real
number is positive.
12. False. u a> is equivalent to or u a u a< − > .
13. a. Since the graphs of f and g intersect at the points ( 9,6)− and (3,6) , the solution set of
( ) ( )f x g x= is { 9, 3}− . b. Since the graph of f is below the graph of g
when x is between 9− and 3 , the solution set of ( ) ( )f x g x≤ is { | 9 3}x x− ≤ ≤ or , using interval notation, [ 9, 3]− .
c. Since the graph of f is above the graph of g to the left of 9x = − and to the right of
3x = , the solution set of ( ) ( )f x g x> is { | 9 or 3}x x x< − > or , using interval notation, ( , 9) (3, )−∞ − ∪ ∞ .
14. a. Since the graphs of f and g intersect at the points (0, 2) and (4,2) , the solution set of
( ) ( )f x g x= is {0, 4} . b. Since the graph of f is below the graph of g
when x is between 0 and 4, the solution set of ( ) ( )f x g x≤ is { | 0 4}x x≤ ≤ or , using interval notation, [0, 4] .
c. Since the graph of f is above the graph of g to the left of 0x = and to the right of 4x = , the solution set of ( ) ( )f x g x> is
{ | 0 or 4}x x x< > or , using interval notation, ( , 0) (4, )−∞ ∪ ∞ .
15. a. Since the graphs of f and g intersect at the points ( 2,5)− and (3,5) , the solution set of
( ) ( )f x g x= is { 2, 3}− . b. Since the graph of f is above the graph of g
to the left of 2x = − and to the right of 3x = , the solution set of ( ) ( )f x g x≥ is
{ | 2 or 3}x x x≤ − ≥ or , using interval notation, ( , 2] [3, )−∞ − ∪ ∞ .
c. Since the graph of f is below the graph of g when x is between 2− and 3, the solution set of ( ) ( )f x g x< is { | 2 3}x x− < < or , using interval notation, ( 2, 3)− .
16. a. Since the graphs of f and g intersect at the points ( 4,7)− and (3,7) , the solution set of
( ) ( )f x g x= is { 4, 3}− . b. Since the graph of f is above the graph of g
to the left of 4x = − and to the right of 3x = , the solution set of ( ) ( )f x g x≥ is
{ | 4 or 3}x x x≤ − ≥ or , using interval notation, ( , 4] [3, )−∞ − ∪ ∞ .
c. Since the graph of f is below the graph of g when x is between 4− and 3, the solution set of ( ) ( )f x g x< is { | 4 3}x x− < < or , using interval notation, ( 4, 3)− .
17. 6x = 6 or 6x x= = −
The solution set is {–6, 6}.
18. 12x = 12 or 12x x= = −
The solution set is { }12, 12− .
19. 2 3 5x + = 2 3 5 or 2 3 5
2 2 or 2 81 or 4
x xx xx x
+ = + = −= = −= = −
The solution set is {–4, 1}.
Full file at https://testbankuniv.eu/Precalculus-Concepts-Through-Functions-A-Right-Triangle-Approach-to-Trigonometry-3rd-Edition-Sullivan-Solutions-Manual
Full file at https://testbankuniv.eu/Precalculus-Concepts-Through-Functions-A-Right-Triangle-Approach-to-Trigonometry-3rd-Edition-Sullivan-Solutions-Manual

Section 2.8: Equations and Inequalities Involving the Absolute Value Function
235
Copyright © 2015 Pearson Education, Inc.
20. 3 1 2x − = 3 1 2 or 3 1 2
3 3 or 3 111 or 3
x xx x
x x
− = − = −= = −
= = −
The solution set is { }1 , 13
− .
21. 1 4 8 13
1 4 5
t
t
− + =
− =
1 4 5 or 1 4 54 4 or 4 6
31 or 2
t tt t
t t
− = − = −− = − = −
= − =
The solution set is { }31,2
− .
22. 1 2 6 9
1 2 3
z
z
− + =
− =
1 2 3 or 1 2 32 2 or 2 4
1 or 2
z zz zz z
− = − = −− = − = −
= − =
The solution set is { }1, 2− .
23. 2 8x− =
2 8 or 2 8
4 or 4x xx x
− = − = −= − =
The solution set is {–4, 4}.
24. 1x− = 1 or 1x x− = − = − The solution set is {–1, 1}.
25. 4 2 3
2 1
2 1
x
x
x
− =
− = −
=
2 1 or 2 11 1 or 2 2
x x
x x
= = −
= = −
The solution set is { }1 1,2 2
− .
26. 15 321 221 22
x
x
x
− =
− = −
=
1 12 or 22 2
4 or 4
x x
x x
= = −
= = −
The solution set is { }4,4− .
27. 2 93
x =
272
27 27 or 2 2
x
x x
=
= = −
The solution set is { }27 27,2 2
− .
28. 3 94
x =
1212 or 12
xx x
== = −
The solution set is {–12, 12}.
29. 2 23 5x + =
2 22 or 23 5 3 5
5 6 30 or 5 6 305 24 or 5 36
24 36 or 5 5
x x
x xx x
x x
+ = + = −
+ = + = −= = −
= = −
The solution set is { }36 24,5 5
− .
Full file at https://testbankuniv.eu/Precalculus-Concepts-Through-Functions-A-Right-Triangle-Approach-to-Trigonometry-3rd-Edition-Sullivan-Solutions-Manual
Full file at https://testbankuniv.eu/Precalculus-Concepts-Through-Functions-A-Right-Triangle-Approach-to-Trigonometry-3rd-Edition-Sullivan-Solutions-Manual
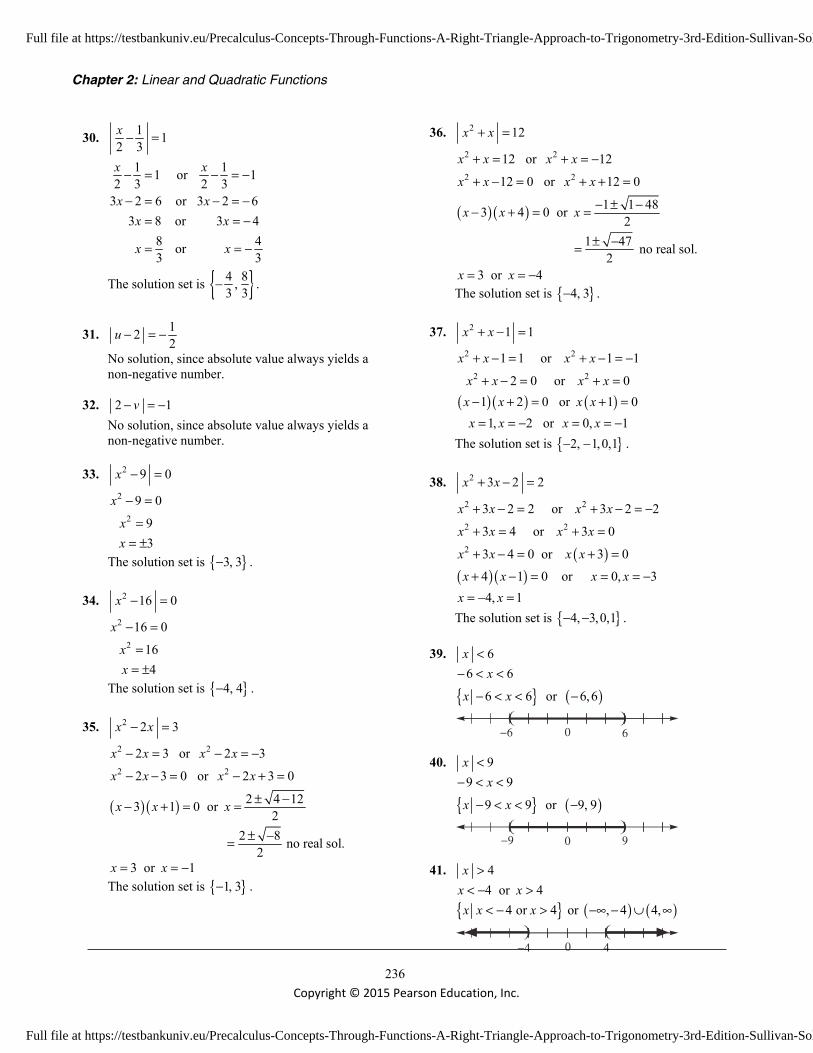
Chapter 2: Linear and Quadratic Functions
236 Copyright © 2015 Pearson Education, Inc.
30. 1 12 3x − =
1 11 or 12 3 2 3
3 2 6 or 3 2 63 8 or 3 4
8 4 or 3 3
x x
x xx x
x x
− = − = −
− = − = −= = −
= = −
The solution set is { }4 8,3 3
− .
31. 122
u − = −
No solution, since absolute value always yields a non-negative number.
32. 2 1v− = − No solution, since absolute value always yields a non-negative number.
33. 2 9 0x − = 2
2
9 0
93
x
xx
− =
== ±
The solution set is { }3, 3− .
34. 2 16 0x − = 2
2
16 0
164
x
xx
− =
== ±
The solution set is { }4, 4− .
35. 2 2 3x x− =
( )( )
2 2
2 2
2 3 or 2 3
2 3 0 or 2 3 0
2 4 123 1 0 or 2
2 8 no real sol.2
x x x x
x x x x
x x x
− = − = −
− − = − + =
± −− + = =
± −=
3 or 1x x= = − The solution set is { }1, 3− .
36. 2 12x x+ =
( )( )
2 2
2 2
12 or 12
12 0 or 12 0
1 1 483 4 0 or 2
1 47 no real sol.2
3 or 4
x x x x
x x x x
x x x
x x
+ = + = −
+ − = + + =
− ± −− + = =
± −=
= = −
The solution set is { }4, 3− .
37. 2 1 1x x+ − =
( )( ) ( )
2 2
2 2
1 1 or 1 1
2 0 or 01 2 0 or 1 0
1, 2 or 0, 1
x x x x
x x x xx x x xx x x x
+ − = + − = −
+ − = + =− + = + == = − = = −
The solution set is { }2, 1,0,1− − .
38. 2 3 2 2x x+ − =
( )( )( )
2 2
2 2
2
3 2 2 or 3 2 2
3 4 or 3 0
3 4 0 or 3 04 1 0 or 0, 34, 1
x x x x
x x x x
x x x x
x x x xx x
+ − = + − = −
+ = + =
+ − = + =
+ − = = = −= − =
The solution set is { }4, 3,0,1− − .
39. 6x < 6 6x− < <
{ } ( )6 6 or 6,6x x− < < −
6−6 0
40. 9x < 9 9x− < <
{ } ( )9 9 or 9, 9x x− < < −
−9 90
41. 4x > 4 or 4x x< − >
{ } ( ) ( )4 or 4 or , 4 4,x x x< − > −∞ − ∪ ∞
−4 40
Full file at https://testbankuniv.eu/Precalculus-Concepts-Through-Functions-A-Right-Triangle-Approach-to-Trigonometry-3rd-Edition-Sullivan-Solutions-Manual
Full file at https://testbankuniv.eu/Precalculus-Concepts-Through-Functions-A-Right-Triangle-Approach-to-Trigonometry-3rd-Edition-Sullivan-Solutions-Manual

Section 2.8: Equations and Inequalities Involving the Absolute Value Function
237
Copyright © 2015 Pearson Education, Inc.
42. 1x > 1 or 1x x< − >
{ } ( ) ( )1 or 1 or , 1 1,x x x< − > −∞ − ∪ ∞
1−1 0
43. 2 8x < 8 2 84 4
xx
− < <− < <
{ } ( )4 4 or 4,4x x− < < −
−4 40
44. 3 15x < 15 3 15
5 5x
x− < <
− < <
{ } ( )5 5 or 5,5x x− < < −
5−5 0
45. 3 12x > 3 12 or 3 12
4 or 4x xx x
< − >< − >
{ } ( ) ( )4 or 4 or , 4 4,x x x< − > −∞ − ∪ ∞
−4 40
46. 2 6x > 2 6 or 2 6
3 or 3x xx x
< − >< − >
{ } ( ) ( )3 or 3 or , 3 3,x x x< − > −∞ − ∪ ∞
−3 30
47. 2 2 3
2 1
x
x
− + <
− <
1 2 11 3
xx
− < − << <
{ } ( )1 3 or 1,3x x< <
1 30
48. 4 3 5
4 2
x
x
+ + <
+ <
2 4 26 2
xx
− < + <− < < −
{ } ( )6 2 or 6, 2x x− < < − − −
−2−6 0
49. 3 2 4t − ≤ 4 3 2 4
2 3 62 23
tt
t
− ≤ − ≤− ≤ ≤
− ≤ ≤
2 22 or , 23 3
t t − ≤ ≤ −
23− 20
50. 2 5 7u + ≤ 7 2 5 7
12 2 26 1
uu
u
− ≤ + ≤− ≤ ≤− ≤ ≤
{ } [ ]6 1 or 6, 1u u− ≤ ≤ −
1−6 0
51. 3 2x − ≥ 3 2 or 3 2
1 or 5x x
x x− ≤ − − ≥
≤ ≥
{ } ( ] [ )1 or 5 or ,1 5,x x x≤ ≥ −∞ ∪ ∞
510
52. 4 2x + ≥ 4 2 or 4 2
6 or 2x x
x x+ ≤ − + ≥
≤ − ≥ −
{ } ( ] [ )6 or 2 or , 6 2,x x x≤ − ≥ − −∞ − ∪ − ∞
−2−6 0
Full file at https://testbankuniv.eu/Precalculus-Concepts-Through-Functions-A-Right-Triangle-Approach-to-Trigonometry-3rd-Edition-Sullivan-Solutions-Manual
Full file at https://testbankuniv.eu/Precalculus-Concepts-Through-Functions-A-Right-Triangle-Approach-to-Trigonometry-3rd-Edition-Sullivan-Solutions-Manual

Chapter 2: Linear and Quadratic Functions
238 Copyright © 2015 Pearson Education, Inc.
53. 1 4 7 2
1 4 5
x
x
− − < −
− <
5 1 4 56 4 46 44 43 31 or 12 2
xx
x
x x
− < − <− < − <− > >− −
> > − − < <
{ } ( )3 32 21 or 1,x x− < < −
−1 0 32
54. 1 2 4 1
1 2 3
x
x
− − < −
− <
3 1 2 34 2 24 22 2
2 1 or 1 2
xx
x
x x
− < − <− < − <− > >− −
> > − − < <
{ } ( )1 2 or 1,2x x− < < −
2−1 0
55. 1 2 3
1 2 3
x
x
− > −
− >
1 2 3 or 1 2 32 4 or 2 2
2 or 1
x xx xx x
− < − − >− < − − >
> < −
{ } ( ) ( )1 or 2 or , 1 2,x x x< − > −∞ − ∪ ∞
2−1 0
56. 2 3 1
2 3 1
x
x
− > −
− >
2 3 1 or 2 3 13 3 or 3 1
11 or 3
x xx x
x x
− < − − >− < − − > −
> <
( )1 1 or 1 or , 1,3 3
x x x < > −∞ ∪ ∞
13
10
57. 2 1 1x + < − No solution since absolute value is always non-negative.
0
58. 3 4 0x − ≥ All real numbers since absolute value is always non-negative. { } ( )is any real number or ,x x −∞ ∞
0
59. ( ) 13 2 7213 92
x
x
− − <
− <
1 13 92 2
17 1932 2
17 196 6
x
x
x
− < − <
< <
< <
{ }17 196 6|x x< < or 17 19,
6 6
176
196
60. ( ) 14 1 11414 124
x
x
− − <
− <
1 14 124 4
47 4944 4
47 4916 16
x
x
x
− < − <
< <
< <
{ }47 4916 16|x x< < or 47 49,
16 16
4916
4716
Full file at https://testbankuniv.eu/Precalculus-Concepts-Through-Functions-A-Right-Triangle-Approach-to-Trigonometry-3rd-Edition-Sullivan-Solutions-Manual
Full file at https://testbankuniv.eu/Precalculus-Concepts-Through-Functions-A-Right-Triangle-Approach-to-Trigonometry-3rd-Edition-Sullivan-Solutions-Manual

Section 2.8: Equations and Inequalities Involving the Absolute Value Function
239
Copyright © 2015 Pearson Education, Inc.
61. 5 1 2
1 3
1 3
3 1 32 4
x
x
x
xx
− − >
− − > −
− <
− < − <− < <
{ }| 2 4x x− < < or ( )2, 4−
−2 40
62. 6 3 2
3 4
3 4
4 3 47 1
x
x
x
xx
− + ≥
− + ≥ −
+ ≤
− ≤ + ≤− ≤ ≤
{ }| 7 1x x− ≤ ≤ or 7,1−
−7 10 63. a. ( ) ( )
3 5 2 9
5 2 3
f x g xx
x
=
− − = −
− =
5 2 3 or 5 2 3
5 5 or 5 11 or 1
5
x xx xx x
− = − = −= = −= = −
b. ( ) ( )3 5 2 9
5 2 3
f x g xx
x
>
− − > −
− <
3 5 2 31 5 51 15
xx
x
− < − <− < <
− < <
{ }15| 1x x− < < or 1 ,1
5 −
c. ( ) ( )3 5 2 9
5 2 3
f x g xx
x
≤
− − ≤ −
− ≥
5 2 3 or 5 2 3
5 5 or 5 11 or 1
5
x xx xx x
− ≥ − ≤ −≥ ≤ −≥ ≤ −
{ }15| or 1x x x≤ − ≥ or )1, 1,
5 −∞ − ∪ ∞
64. a. ( ) ( )2 2 3 12
2 3 6
f x g xx
x
=
− − = −
− =
2 3 6 or 2 3 6
2 9 or 2 39 or 32 2
x xx x
x x
− = − = −= = −
= = −
b. ( ) ( )2 2 3 12
2 3 6
f x g xx
x
=
− − ≥ −
− ≤
6 2 3 63 2 93 92 2
xx
x
− ≤ − ≤− ≤ ≤
− ≤ ≤
{ }3 92 2|x x− ≤ ≤ or 3 9,
2 2 −
c. ( ) ( )2 2 3 12
2 3 6
f x g xx
x
=
− − < −
− >
2 3 6 or 2 3 6
2 9 or 2 39 or 32 2
x xx x
x x
− > − < −> < −
> < −
{ }3 92 2| or x x x< − > or ( ) ( )3 9
2 2, ,−∞ − ∪ ∞
65. a. ( ) ( )3 2 10
f x g xx x
=
− + = +
( )3 2 103 2 10or
4 8 3 2 10or2 2 12or
6
x xx xx x xx x
x
− + = − +− + = +− = − + = − −
= − − = −=
b.
Full file at https://testbankuniv.eu/Precalculus-Concepts-Through-Functions-A-Right-Triangle-Approach-to-Trigonometry-3rd-Edition-Sullivan-Solutions-Manual
Full file at https://testbankuniv.eu/Precalculus-Concepts-Through-Functions-A-Right-Triangle-Approach-to-Trigonometry-3rd-Edition-Sullivan-Solutions-Manual
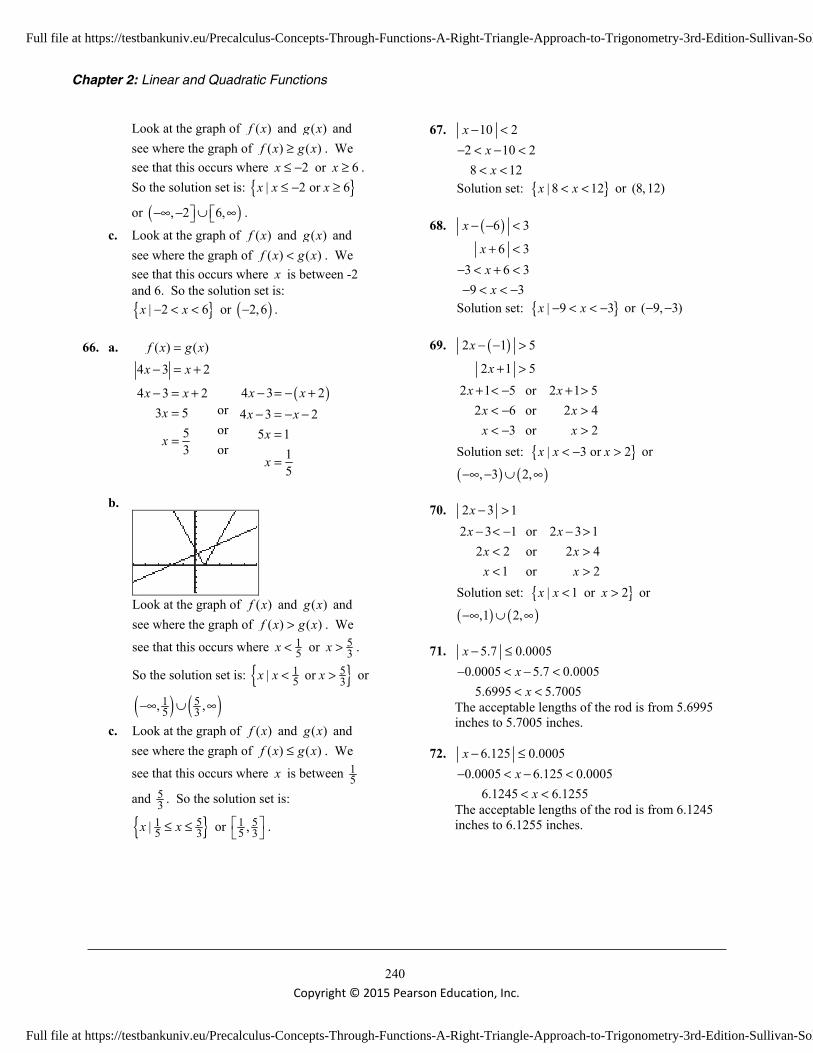
Chapter 2: Linear and Quadratic Functions
240 Copyright © 2015 Pearson Education, Inc.
Look at the graph of ( )f x and ( )g x and see where the graph of ( ) ( )f x g x≥ . We see that this occurs where 2x ≤ − or 6x ≥ . So the solution set is: { }| 2 or 6x x x≤ − ≥
or ( ), 2 6,−∞ − ∪ ∞ . c. Look at the graph of ( )f x and ( )g x and
see where the graph of ( ) ( )f x g x< . We see that this occurs where x is between -2 and 6. So the solution set is: { }| 2 6x x− < < or ( )2,6− .
66. a. ( ) ( )
4 3 2f x g xx x
=
− = +
( )4 3 24 3 2or3 5 4 3 2or5 5 1or3 1
5
x xx xx x x
xxx
− = − +− = += − = − −
===
b.
Look at the graph of ( )f x and ( )g x and
see where the graph of ( ) ( )f x g x> . We
see that this occurs where 15x < or 5
3x > .
So the solution set is: { }515 3| or x x x< > or
( ) ( )515 3, ,−∞ ∪ ∞
c. Look at the graph of ( )f x and ( )g x and see where the graph of ( ) ( )f x g x≤ . We
see that this occurs where x is between 15
and 53 . So the solution set is:
{ }515 3|x x≤ ≤ or 51
5 3, .
67. 10 2x − < 2 10 28 12
xx
− < − << <
{ }Solution set: | 8 12x x< < or (8, 12)
68. ( )6 3
6 3
x
x
− − <
+ <
3 6 39 3
xx
− < + <− < < −
{ }Solution set: | 9 3x x− < < − or ( 9, 3)− −
69. ( )2 1 5
2 1 5
x
x
− − >
+ >
2 1 5 or 2 1 52 6 or 2 4
3 or 2
x xx xx x
+ < − + >< − >< − >
{ }Solution set: | 3 or 2x x x< − > or
( ) ( ), 3 2,−∞ − ∪ ∞
70. 2 3 1x − > 2 3 1 or 2 3 1
2 2 or 2 41 or 2
x xx xx x
− < − − >< >< >
{ }Solution set: | 1 or 2x x x< > or
( ) ( ),1 2,−∞ ∪ ∞
71. 5.7 0.0005x − ≤ 0.0005 5.7 0.0005
5.6995 5.7005x
x− < − <
< <
The acceptable lengths of the rod is from 5.6995 inches to 5.7005 inches.
72. 6.125 0.0005x − ≤ 0.0005 6.125 0.0005
6.1245 6.1255x
x− < − <
< <
The acceptable lengths of the rod is from 6.1245 inches to 6.1255 inches.
Full file at https://testbankuniv.eu/Precalculus-Concepts-Through-Functions-A-Right-Triangle-Approach-to-Trigonometry-3rd-Edition-Sullivan-Solutions-Manual
Full file at https://testbankuniv.eu/Precalculus-Concepts-Through-Functions-A-Right-Triangle-Approach-to-Trigonometry-3rd-Edition-Sullivan-Solutions-Manual

Chapter 2 Review Exercises
241
Copyright © 2015 Pearson Education, Inc.
73. 100 1.9615
x − >
100 1001.96 1.96or15 15100 29.4 or 100 29.4
70.6 or 129.4
x x
x xx x
− −< − >
− < − − >< >
Since IQ scores are whole numbers, any IQ less than 71 or greater than 129 would be considered unusual.
74. 266 1.9616
x − >
266 2661.96 1.96or16 16266 31.36 or 266 31.36
234.64 or 297.36
x x
x xx x
− −< − >
− < − − >< >
Pregnancies less than 235 days long or greater than 297 days long would be considered unusual.
75. 5 1 7 5
5 1 2
x
x
+ + =
+ = −
No matter what real number is substituted for x, the absolute value expression on the left side of the equation must always be zero or larger. Thus, it can never equal 2− .
76. 2 5 3 1 2 5 2x x+ + > + > − No matter what real number is substituted for x, the absolute value expression on the left side of the equation must always be zero or larger. Thus, it will always be larger than 2− . Thus, the solution is the set of all real numbers.
77. 2 1 0x − ≤ No matter what real number is substituted for x, the absolute value expression on the left side of the equation must always be zero or larger. Thus, the only solution to the inequality above
will be when the absolute value expression equals 0: 2 1 02 1 0
2 112
xx
x
x
− =− =
=
=
Thus, the solution set is 12
.
78. ( ) 2 7( 4) 2( 4) 7
8 7 15 15
f x xf
= −
− = − −
= − − = − =
79. 2( 4) 4( 2)2 8 4 8
3 8 4 800
x x xx x x
x xxx
+ + < ++ + < +
+ < +− <
>
80.
2
(5 )(3 2 )
15 10 3 215 7 2 17 7
i i
i i ii i
− + =
+ − − =+ + = +
81. a. Intercepts: (0,0), (4,0) b. Domain: [ ]2,5− , Range: [ ]2,4−
c. Increasing: ( )3,5 :Decreasing: ( )2,1−
Constant: ( )1,3 d. Neither
Chapter 2 Review Exercises
1. ( ) 2 5f x x= − a. Slope = 2; y-intercept = 5− b. Plot the point (0, 5)− . Use the slope to find
an additional point by moving 1 unit to the right and 2 units up.
c. Domain and Range: ( ),−∞ ∞
Full file at https://testbankuniv.eu/Precalculus-Concepts-Through-Functions-A-Right-Triangle-Approach-to-Trigonometry-3rd-Edition-Sullivan-Solutions-Manual
Full file at https://testbankuniv.eu/Precalculus-Concepts-Through-Functions-A-Right-Triangle-Approach-to-Trigonometry-3rd-Edition-Sullivan-Solutions-Manual

Chapter 2: Linear and Quadratic Functions
242 Copyright © 2015 Pearson Education, Inc.
d. Average rate of change = slope = 2 e. Increasing
2. 4( ) 65
h x x= −
a. Slope = 45
; y-intercept = 6−
b. Plot the point (0, 6)− . Use the slope to find an additional point by moving 5 units to the right and 4 units up.
c. Domain and Range: ( ),−∞ ∞
d. Average rate of change = slope = 45
e. Increasing
3. ( ) 4G x = a. Slope = 0; y-intercept = 4 b. Plot the point (0, 4) and draw a horizontal
line through it.
c. Domain: ( ),−∞ ∞
Range: { }| 4y y = d. Average rate of change = slope = 0 e. Constant
4. ( ) 2 14f x x= + zero: ( ) 2 14 0f x x= + =
2 147
xx
= −= −
y-intercept = 14
5. x ( )y f x= Avg. rate of change = yx
ΔΔ
–2 –7
0 3 ( )( )
3 7 10 50 2 2
− −= =
− −
1 8 8 3 5 51 0 1
− = =−
3 18 18 8 10 53 1 2
− = =−
6 33 33 18 15 56 3 3
− = =−
This is a linear function with slope = 5, since the average rate of change is constant at 5. To find the equation of the line, we use the point-slope formula and one of the points.
( )
( )1 1
3 5 05 3
y y m x x
y xy x
− = −
− = −= +
6. x ( )y f x= Avg. rate of change = yx
ΔΔ
–1 –3
0 4 ( )( )
4 3 7 70 1 1
− −= =
− −
1 7 7 4 3 31 0 1
− = =−
2 6 3 1 This is not a linear function, since the average
rate of change is not constant.
Full file at https://testbankuniv.eu/Precalculus-Concepts-Through-Functions-A-Right-Triangle-Approach-to-Trigonometry-3rd-Edition-Sullivan-Solutions-Manual
Full file at https://testbankuniv.eu/Precalculus-Concepts-Through-Functions-A-Right-Triangle-Approach-to-Trigonometry-3rd-Edition-Sullivan-Solutions-Manual

Chapter 2 Review Exercises
243
Copyright © 2015 Pearson Education, Inc.
7. ( )
( )( )2
0
72 09 8 0
f x
x xx x
=
+ − =+ − =
9 0 or 8 09 8
x xx x
+ = − == − =
The zeros of ( ) 2 72f x x x= + − are 9− and 8. The x-intercepts of the graph of f are 9− and 8.
8. ( )2
0
6 13 5 0(3 1)(2 5) 0
P t
t tt t
=
− − =+ − =
3 1 0 or 2 5 01 53 2
t t
t t
+ = − =
= − =
The zeros of ( ) 26 13 5P t t t= − − are 13
− and 52
.
The t-intercepts of the graph of P are 13
− and 52
.
9. ( )( )
( )
2
2
0
3 4 0
3 4
3 43 2
3 2
g x
x
x
xx
x
=
− − =
− =
− = ±− = ±
= ±
3 2 1 or 3 2 5x x= − = = + =
The zeros of ( ) ( )23 4g x x= − − are 1 and 5. The x-intercepts of the graph of g are 1 and 5.
10. ( )2
0
9 6 1 0(3 1)(3 1) 0
h x
x xx x
=
+ + =+ + =
3 1 0 or 3 1 01 13 3
x x
x x
+ = + =
= − = −
The only zero of ( ) 29 6 1h x x x= + + is 13
− .
The only x-intercept of the graph of h is 13
− .
11. ( )2
0
2 4 1 0
G x
x x
=
− − =
( )
2
2
2
2
12 02
12212 1 12312
3 3 2 612 22 2
6 2 612 2
x x
x x
x x
x
x
x
− − =
− =
− + = +
− =
− = ± = ± ⋅ = ±
±= ± =
The zeros of ( ) 22 4 1G x x x= − − are 2 62
−
and 2 62
+ . The x-intercepts of the graph of G
are 2 62
− and 2 62
+ .
12. ( )2
2
0
2 1 0
2 1 0(2 1)( 1) 0
f x
x x
x xx x
=
− + + =
− − =+ − =
2 1 0 or 1 01 12
x xxx
+ = − === −
The zeros of ( ) 22 1f x x x= − + + are 12
− and 1.
The x-intercepts of the graph of f are 12
− and 1.
13. ( ) ( )( )23 16
3 16 43 4
f x g x
x
xx
=
− =
− = ± = ±= ±
3 4 1 or 3 4 7x x= − = − = + = The solution set is { 1, 7}− . The x-coordinates of the points of intersection are
1− and 7. The y-coordinates are ( )1 16g − = and
( )7 16g = . The graphs of the f and g intersect at
Full file at https://testbankuniv.eu/Precalculus-Concepts-Through-Functions-A-Right-Triangle-Approach-to-Trigonometry-3rd-Edition-Sullivan-Solutions-Manual
Full file at https://testbankuniv.eu/Precalculus-Concepts-Through-Functions-A-Right-Triangle-Approach-to-Trigonometry-3rd-Edition-Sullivan-Solutions-Manual

Chapter 2: Linear and Quadratic Functions
244 Copyright © 2015 Pearson Education, Inc.
the points ( 1, 16)− and (7, 16) .
14. ( ) ( )
( )( )
2
2
4 5 4 1
4 02 2 0
f x g x
x x x
xx x
=
+ − = −
− =+ − =
2 0 or 2 02 2
x xx x
+ = − == − =
The solution set is { 2, 2}− . The x-coordinates of the points of intersection are 2− and 2. The y-coordinates are
( ) ( )2 4 2 1 8 1 9g − = − − = − − = − and
( ) ( )2 4 2 1 8 1 7g = − = − = . The graphs of the f
and g intersect at the points ( 2, 9)− − and ( )2, 7 .
15. ( )4 2
0
5 4 0
f x
x x
=
− + =
( )( )2 2
2 2
4 1 0
4 0 or 1 02 or 1
x x
x xx x
− − =
− = − == ± = ±
The zeros of ( ) 4 25 4f x x x= − + are 2− , 1− , 1, and 2. The x-intercepts of the graph of f are
2− , 1− , 1, and 2.
16. ( )( ) ( )2
0
3 2 3 48 0
F x
x x
=
− − − − =
( )22Let 3 3u x u x= − → = −
( )( )2 2 48 0
6 8 0u uu u
− − =+ − =
6 0 or 8 06 8
3 6 3 83 11
u uu u
x xx x
+ = − == − =
− = − − == − =
The zeros of ( ) ( ) ( )23 2 3 48F x x x= − − − − are 3− and 11. The x-intercepts of the graph of F
are 3− and 11.
17. ( ) 0
3 13 10 0
h x
x x
=
− − =
2Let u x u x= → =
( )( )23 13 10 0
3 2 5 0u uu u
− − =+ − =
2
3 2 0 or 5 02 53 52
5 253not real
u uuux
x x
x
+ = − === −=
= − = =
=
Check: ( ) ( )( ) ( )
25 3 25 13 25 103 25 13 5 1075 65 10 0
h = − −
= − −= − − =
The only zero of ( ) 3 13 10h x x x= − − is 25. The only x-intercept of the graph of h is 25.
18. ( )2
0
1 14 12 0
f x
x x
=
− − =
221 1Let u u
x x = → =
( )( )2 4 12 0
2 6 0u u
u u− − =
+ − =
Full file at https://testbankuniv.eu/Precalculus-Concepts-Through-Functions-A-Right-Triangle-Approach-to-Trigonometry-3rd-Edition-Sullivan-Solutions-Manual
Full file at https://testbankuniv.eu/Precalculus-Concepts-Through-Functions-A-Right-Triangle-Approach-to-Trigonometry-3rd-Edition-Sullivan-Solutions-Manual
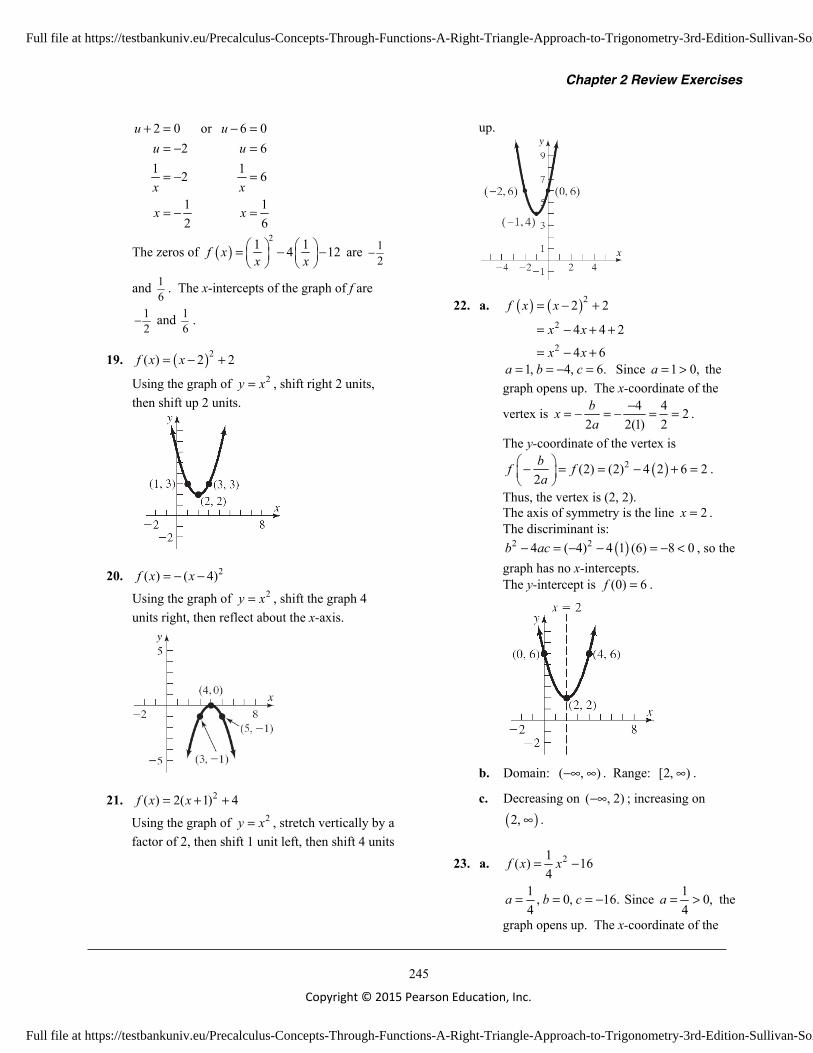
Chapter 2 Review Exercises
245
Copyright © 2015 Pearson Education, Inc.
2 0 or 6 02 6
1 12 6
1 12 6
u uu u
x x
x x
+ = − == − =
= − =
= − =
The zeros of ( )21 14 12f x
x x = − −
are 12
−
and 16
. The x-intercepts of the graph of f are
12
− and 16
.
19. ( )2( ) 2 2f x x= − +
Using the graph of 2y x= , shift right 2 units, then shift up 2 units.
20. 2( ) ( 4)f x x= − − Using the graph of 2y x= , shift the graph 4 units right, then reflect about the x-axis.
21. 2( ) 2( 1) 4f x x= + + Using the graph of 2y x= , stretch vertically by a factor of 2, then shift 1 unit left, then shift 4 units
up.
22. a. ( ) ( )2
2
2
2 2
4 4 2
4 6
f x x
x x
x x
= − +
= − + +
= − +
1, 4, 6.a b c= = − = Since 1 0,a = > the graph opens up. The x-coordinate of the
vertex is 4 4 22 2(1) 2bxa
−= − = − = = .
The y-coordinate of the vertex is
( )2(2) (2) 4 2 6 22bf fa
− = = − + =
.
Thus, the vertex is (2, 2). The axis of symmetry is the line 2x = . The discriminant is:
( )2 24 ( 4) 4 1 (6) 8 0b ac− = − − = − < , so the graph has no x-intercepts. The y-intercept is (0) 6f = .
b. Domain: ( , )−∞ ∞ . Range: [2, )∞ .
c. Decreasing on ( , 2)−∞ ; increasing on ( )2, ∞ .
23. a. 21( ) 164
f x x= −
1 , 0, 16.4
a b c= = = − Since 1 0,4
a = > the
graph opens up. The x-coordinate of the
Full file at https://testbankuniv.eu/Precalculus-Concepts-Through-Functions-A-Right-Triangle-Approach-to-Trigonometry-3rd-Edition-Sullivan-Solutions-Manual
Full file at https://testbankuniv.eu/Precalculus-Concepts-Through-Functions-A-Right-Triangle-Approach-to-Trigonometry-3rd-Edition-Sullivan-Solutions-Manual

Chapter 2: Linear and Quadratic Functions
246 Copyright © 2015 Pearson Education, Inc.
vertex is 0 0 0112 224
bxa
−= − = − = − =
.
The y-coordinate of the vertex is 21(0) (0) 16 16
2 4bf fa
− = = − = −
.
Thus, the vertex is (0, –16). The axis of symmetry is the line 0x = . The discriminant is:
2 2 14 (0) 4 ( 16) 16 04
b ac − = − − = >
, so
the graph has two x-intercepts. The x-intercepts are found by solving:
2
2
2
1 16 04
64 0
648 or 8
x
x
xx x
− =
− =
== = −
The x-intercepts are –8 and 8. The y-intercept is (0) 16f = − .
b. Domain: ( , )−∞ ∞ . Range: [ 16, )− ∞ .
c. Decreasing on ( , 0)−∞ ; increasing on ( )0, ∞ .
24. a. 2( ) 4 4f x x x= − + 4, 4, 0.a b c= − = = Since 4 0,a = − < the
graph opens down. The x-coordinate of the
vertex is 4 4 12 2( 4) 8 2bxa
= − = − = − =− −
.
The y-coordinate of the vertex is 21 1 14 4
2 2 2 21 2 1
bf fa
− = = − +
= − + =
Thus, the vertex is 1 , 12
.
The axis of symmetry is the line 12
x = .
The discriminant is: 2 24 4 4( 4)(0) 16 0b ac− = − − = > , so the
graph has two x-intercepts. The x-intercepts are found by solving:
24 4 04 ( 1) 0
0 or 1
x xx x
x x
− + =− − =
= =
The x-intercepts are 0 and 1. The y-intercept is 2(0) 4(0) 4(0) 0f = − + = .
b. Domain: ( , )−∞ ∞ . Range: ( ], 1−∞ .
c. Increasing on 1,2
−∞
; decreasing on
1 ,2
∞
.
25. a. 29( ) 3 12
f x x x= + +
9 , 3, 1.2
a b c= = = Since 9 0,2
a = > the
graph opens up. The x-coordinate of the
vertex is 3 3 192 9 322
bxa
= − = − = − = −
.
The y-coordinate of the vertex is 21 9 1 13 1
2 3 2 3 31 11 12 2
bf fa
− = − = − + − +
= − + =
Thus, the vertex is 1 1,3 2
−
.
The axis of symmetry is the line 13
x = − .
The discriminant is:
Full file at https://testbankuniv.eu/Precalculus-Concepts-Through-Functions-A-Right-Triangle-Approach-to-Trigonometry-3rd-Edition-Sullivan-Solutions-Manual
Full file at https://testbankuniv.eu/Precalculus-Concepts-Through-Functions-A-Right-Triangle-Approach-to-Trigonometry-3rd-Edition-Sullivan-Solutions-Manual

Chapter 2 Review Exercises
247
Copyright © 2015 Pearson Education, Inc.
2 2 94 3 4 (1) 9 18 9 02
b ac − = − = − = − <
,
so the graph has no x-intercepts. The y-
intercept is ( ) ( ) ( )290 0 3 0 1 12
f = + + = .
b. Domain: ( , )−∞ ∞ . Range: 1 ,2 ∞
.
c. Decreasing on 1,3
−∞ −
; increasing on
1 ,3
− ∞
.
26. a. 2( ) 3 4 1f x x x= + − 3, 4, 1.a b c= = = − Since 3 0,a = > the
graph opens up. The x-coordinate of the
vertex is 4 4 22 2(3) 6 3bxa
= − = − = − = − .
The y-coordinate of the vertex is 22 2 23 4 1
2 3 3 34 8 713 3 3
bf fa
− = − = − + − −
= − − = −
Thus, the vertex is 2 7,3 3
− −
.
The axis of symmetry is the line 23
x = − .
The discriminant is: 2 24 (4) 4(3)( 1) 28 0b ac− = − − = > , so the
graph has two x-intercepts. The x-intercepts are found by solving:
23 4 1 0x x+ − = . 2 4 4 28
2 2(3)
4 2 7 2 76 3
b b acxa
− ± − − ±= =
− ± − ±= =
The x-intercepts are 2 7 1.553
− − ≈ − and
2 7 0.223
− + ≈ .
The y-intercept is 2(0) 3(0) 4(0) 1 1f = + − = − .
b. Domain: ( , )−∞ ∞ . Range: 7 ,3
− ∞ .
c. Decreasing on 2,3
−∞ −
; increasing on
2 ,3
− ∞
.
27. 2( ) 3 6 4f x x x= − + 3, 6, 4.a b c= = − = Since 3 0,a = > the graph
opens up, so the vertex is a minimum point. The minimum occurs at
6 6 12 2(3) 6bxa
−= − = − = = .
The minimum value is
( ) ( ) ( )21 3 1 6 1 42
3 6 4 1
bf fa
− = = − +
= − + =
28. 2( ) 8 4f x x x= − + − 1, 8, 4.a b c= − = = − Since 1 0,a = − < the
graph opens down, so the vertex is a maximum point. The maximum occurs at
8 8 42 2( 1) 2bxa
= − = − = − =− −
.
The maximum value is
( ) ( ) ( )24 4 8 4 42
16 32 4 12
bf fa
− = = − + −
= − + − =
Full file at https://testbankuniv.eu/Precalculus-Concepts-Through-Functions-A-Right-Triangle-Approach-to-Trigonometry-3rd-Edition-Sullivan-Solutions-Manual
Full file at https://testbankuniv.eu/Precalculus-Concepts-Through-Functions-A-Right-Triangle-Approach-to-Trigonometry-3rd-Edition-Sullivan-Solutions-Manual

Chapter 2: Linear and Quadratic Functions
248 Copyright © 2015 Pearson Education, Inc.
29. 2( ) 3 12 4f x x x= − + + 3, 12, 4.a b c= − = = Since 3 0,a = − < the
graph opens down, so the vertex is a maximum point. The maximum occurs at
12 12 22 2( 3) 6bxa
= − = − = − =− −
.
The maximum value is
( ) ( ) ( )22 3 2 12 2 42
12 24 4 16
bf fa
− = = − + +
= − + + =
30. Consider the form ( )2y a x h k= − + . The vertex
is ( )2, 4− so we have 2h = and 4k = − . The
function also contains the point ( )0, 16− . Substituting these values for x, y, h, and k, we can solve for a:
( )( ) ( )( )
2
2
16 0 2 4
16 2 416 4 412 4
3
a
aaa
a
− = − + −
− = − −− = −− =
= −
The quadratic function is ( ) ( )2 23 2 4 3 12 16f x x x x= − − − = − + − .
31. Use the form 2( ) ( )f x a x h k= − + . The vertex is ( 1, 2)− , so 1h = − and 2k = .
2( ) ( 1) 2f x a x= + + . Since the graph passes through (1, 6) , (1) 6f = .
2
2
6 (1 1) 26 (2) 26 4 24 41
aa
aa
a
= + += += +==
2
2
2
( ) ( 1) 2( 2 1) 2
2 3
f x xx x
x x
= + += + + += + +
32. 2 6 16 0x x+ − < 2( ) 6 16f x x x= + −
2 6 16 0( 8)( 2) 0x xx x
+ − =+ − =
8, 2x x= − = are the zeros of f .
( ) ( )Interval ( , 8) 8, 2 2,Test Number 9 0 3
Value of 11 16 11Conclusion Positive Negative Positive
f
−∞ − − ∞−
−
The solution set is { }| 8 2x x− < < or, using
interval notation, ( )8, 2− .
33. 2
2
3 14 5
3 14 5 0
x x
x x
≥ +
− − ≥
2( ) 3 14 5f x x x= − −
23 14 5 0(3 1)( 5) 0
x xx x
− − =+ − =
1 , 53
x x= − = are the zeros of f .
( )1 1Interval , , 5 5,3 3
Test Number 1 0 2Value of 12 5 19Conclusion Positive Negative Positive
f
−∞ − − ∞
−−
The solution set is 1 or 53
x x x ≤ − ≥
or,
using interval notation, [ )1, 5, 3
−∞ − ∪ ∞ .
34. ( )2
2
0
8 0
8
8 2 2
f x
x
x
x i
=
+ =
= −
= ± − = ±
The zero are 2 2 i− and 2 2 i .
Full file at https://testbankuniv.eu/Precalculus-Concepts-Through-Functions-A-Right-Triangle-Approach-to-Trigonometry-3rd-Edition-Sullivan-Solutions-Manual
Full file at https://testbankuniv.eu/Precalculus-Concepts-Through-Functions-A-Right-Triangle-Approach-to-Trigonometry-3rd-Edition-Sullivan-Solutions-Manual

Chapter 2 Review Exercises
249
Copyright © 2015 Pearson Education, Inc.
35. ( )2
0
2 4 0
g x
x x
=
+ − =
2 2
1, 2, 4
4 2 4(1)( 4) 4 16 20
2 20 2 2 5 1 52(1) 2
a b c
b ac
x
= = = −
− = − − = + =
− ± − ±= = = − ±
The zeros are 1 5− − and 1 5− + .
36. ( )2
0
2 4 3 0
p x
x x
=
− + − =
2 2
2, 4, 3
4 4 4( 2)( 3) 16 24 8
4 2 24 8 212( 2) 4 2
a b c
b ac
ix i
= − = = −
− = − − − = − = −
− ±− ± −= = = ±− −
The zeros are 212
i− and 212
i+ .
(1, −1)
37. ( )
2
0
4 4 3 0
f x
x x
=
+ + =
2 2
4, 4, 3
4 4 4(4)(3) 16 48 32
4 4 24 32 1 22(4) 8 2 2
a b c
b ac
ix i
= = =
− = − = − = −
− ±− ± −= = = − ±
The zeros are 1 22 2
i− − and 1 22 2
i− + .
38. 2 3 7x + =
2 3 7 or 2 3 72 4 or 2 10
2 or 5
x xx xx x
+ = + = −= = −= = −
The solution set is { }5, 2− .
39. 2 3 2 9
2 3 7
x
x
− + =
− =
2 3 7 or 2 3 73 5 or 3 9
5 or 33
x xx x
x x
− = − = −− = − = −
= − =
The solution set is { }5 , 33
− .
40. 13 42
1 13 42 29 732 23 72 6
x
x
x
x
+ <
− < + <
− < < −
− < < −
3 7 3 7 or ,2 6 2 6
x x − < < − − −
41. 2 5 9x − ≥ 2 5 9 or 2 5 9
2 4 or 2 142 or 7
x xx xx x
− ≤ − − ≥≤ − ≥≤ − ≥
Full file at https://testbankuniv.eu/Precalculus-Concepts-Through-Functions-A-Right-Triangle-Approach-to-Trigonometry-3rd-Edition-Sullivan-Solutions-Manual
Full file at https://testbankuniv.eu/Precalculus-Concepts-Through-Functions-A-Right-Triangle-Approach-to-Trigonometry-3rd-Edition-Sullivan-Solutions-Manual

Chapter 2: Linear and Quadratic Functions
250 Copyright © 2015 Pearson Education, Inc.
{ } ( ] [ )2 or 7 or , 2 7,x x x≤ − ≥ −∞ − ∪ ∞
42. 2 2 3 4
2 3 22 2 3 24 3 04 03
x
xx
x
x
+ − ≤
− ≤− ≤ − ≤− ≤ − ≤
≥ ≥
4 40 or 0,3 3
x x ≤ ≤
43. 1 2 3 4
2 3 5
2 3 52 3 5 or 2 3 5
7 3 or 3 37 or 13
71 or 3
x
x
xx x
x x
x x
x x
− − < −
− − < −
− >− < − − >
< − >
< − >
< − >
( )7 71 or or , 1 ,3 3
x x x < − > −∞ − ∪ ∞
44. a. Company A: ( ) 0.06 7.00C x x= +
Company B: ( ) 0.08C x x=
b. 0.06 7.00 0.087.00 0.02350
x xx
x
+ ===
The bill from Company A will equal the bill from Company B if 350 minutes are used.
c. 0.08 0.06 7.000.02 7.00
350
x xxx
< +<<
The bill from Company B will be less than the bill from Company A if fewer than 350 minutes are used. That is, 0 350x≤ < .
45. a. If 1500 10 ,x p= − then 1500 .10
xp −=
2( ) (1500 10 ) 10 1500R p px p p p p= = − = − +
b. Domain: { }0 150p p< ≤
c. ( )1500 1500 $75
2 202 10bpa
− −−= = = =−−
d. The maximum revenue is 2(75) 10(75) 1500(75)
56250 112500 $56,250R = − +
= − + =
e. 1500 10(75) 1500 750 750x = − = − =
f. Graph 210 1500R p p= − + and 56000R = .
Find where the graphs intersect by solving
256000 10 1500p p= − + .
2
2
10 1500 56000 0
150 5600 0( 70)( 80) 0
70, 80
p p
p pp p
p p
− + =
− + =− − =
= =
The company should charge between $70 and $80.
46. Let w = the width. Then w + 2 = the length.
10 in.w
w + 2 By the Pythagorean Theorem we have:
( ) ( )
( )( )
2 22
2 2
2
2
2 10
4 4 1002 4 96 0
2 48 08 6 0
w w
w w ww ww ww w
+ + =
+ + + =+ − =+ − =
+ − =
8 or 6w w= − = Disregard the negative answer because the width
Full file at https://testbankuniv.eu/Precalculus-Concepts-Through-Functions-A-Right-Triangle-Approach-to-Trigonometry-3rd-Edition-Sullivan-Solutions-Manual
Full file at https://testbankuniv.eu/Precalculus-Concepts-Through-Functions-A-Right-Triangle-Approach-to-Trigonometry-3rd-Edition-Sullivan-Solutions-Manual

Chapter 2 Review Exercises
251
Copyright © 2015 Pearson Education, Inc.
of a rectangle must be positive. Thus, the width is 6 inches, and the length is 8 inches
47. 2( ) 4.9 617.4 19,600C x x x= − + ; 4.9, 617.4, 19,600.a b c= = − = Since 4.9 0,a = > the graph opens up, so the vertex is
a minimum point. a. The minimum marginal cost occurs at
617.40 617.40 632 2(4.9) 9.8bxa
−= − = − = = .
Thus, 63 golf clubs should be manufactured in order to minimize the marginal cost.
b. The minimum marginal cost is
( )
( ) ( )( )2
632
4.9 63 617.40 63 19600
$151.90
bC C
a− =
= − +
=
48. Since there are 200 feet of border, we know that 2 2 200x y+ = . The area is to be maximized, so A x y= ⋅ . Solving the perimeter formula for y : 2 2 200
2 200 2100
x yy xy x
+ == −= −
The area function is: 2( ) (100 ) 100A x x x x x= − = − +
The maximum value occurs at the vertex: 100 100 50
2 2( 1) 2bxa
= − = − = − =− −
The pond should be 50 feet by 50 feet for maximum area.
49. The area function is: 2( ) (10 ) 10A x x x x x= − = − +
The maximum value occurs at the vertex: 10 10 5
2 2( 1) 2bxa
= − = − = − =− −
The maximum area is: 2(5) (5) 10(5)
25 50 25 square units A = − +
= − + =
(x,10-x)
10
10(x,0)
(0,10-x)
50. Locate the origin at the point directly under the highest point of the arch. Then the equation is in the form: 2 , where 0y ax k a= − + > . Since the maximum height is 10 feet, when 0,x =
10y k= = . Since the point (10, 0) is on the parabola, we can find the constant:
2
2
0 (10) 1010 1 0.10
1010
a
a
= − +
= = =
The equation of the parabola is: 21 10
10y x= − +
At 8x = : 21 (8) 10 6.4 10 3.6 feet
10y = − + = − + =
51. a.
b. p q Avg. rate of change = qp
ΔΔ
150 100
200 80 80 100 20 0.4200 150 50
− −= = −−
250 60 60 80 20 0.4250 200 50
− −= = −−
300 40 40 60 20 0.4
300 250 50− −= = −−
Since each input (price) corresponds to a single output (quantity demanded), we know that the quantity demanded is a function of price. Also, because the average rate of change is constant at $0.4− per LCD monitor, the function is linear.
c. From part (b), we know 0.4m = − . Using 1 1( , ) (150, 100)p q = , we get the equation:
Full file at https://testbankuniv.eu/Precalculus-Concepts-Through-Functions-A-Right-Triangle-Approach-to-Trigonometry-3rd-Edition-Sullivan-Solutions-Manual
Full file at https://testbankuniv.eu/Precalculus-Concepts-Through-Functions-A-Right-Triangle-Approach-to-Trigonometry-3rd-Edition-Sullivan-Solutions-Manual

Chapter 2: Linear and Quadratic Functions
252 Copyright © 2015 Pearson Education, Inc.
1 1( )100 0.4( 150)100 0.4 60
0.4 160
q q m p pq pq p
q p
− = −− = − −− = − +
= − +
Using function notation, we have ( ) 0.4 160q p p= − + .
d. The price cannot be negative, so 0p ≥ . Likewise, the quantity cannot be negative, so, ( ) 0q p ≥ .
0.4 160 00.4 160
400
ppp
− + ≥− ≥ −
≤
Thus, the implied domain for q(p) is { | 0 400}p p≤ ≤ or [0, 400] .
e.
f. If the price increases by $1, then the
quantity demanded of LCD monitors decreases by 0.4 monitor.
g. p-intercept: If the price is $0, then 160 LCD monitors will be demanded. q-intercept: There will be 0 LCD monitors demanded when the price is $400.
52. a.
b. Yes, the two variables appear to have a linear relationship.
c. Using the LINear REGression program, the line of best fit is:
1.390171918 1.113952697y x= +
d. ( )1.390171918 26.5 1.113952697
38.0 mmy = +
≈
53. a.
The data appear to be quadratic with a < 0.
b. Using the QUADratic REGression program, the quadratic function of best fit is:
27.76 411.88 942.72y x x= − + + .
Full file at https://testbankuniv.eu/Precalculus-Concepts-Through-Functions-A-Right-Triangle-Approach-to-Trigonometry-3rd-Edition-Sullivan-Solutions-Manual
Full file at https://testbankuniv.eu/Precalculus-Concepts-Through-Functions-A-Right-Triangle-Approach-to-Trigonometry-3rd-Edition-Sullivan-Solutions-Manual

Chapter 2 Test
253
Copyright © 2015 Pearson Education, Inc.
The maximum revenue occurs at
( )411.882 2( 7.76)
411.88 $26.5 thousand15.52
bAa
−−= =−
−= ≈−
c. The maximum revenue is
( )
( ) ( )( )2
26.538662
7.76 26.5 411.88 26.5 942.72
$6408 thousand
bR R
a−
=
= − + +
≈
d.
Chapter 2 Test
1. ( ) 4 3f x x= − + a. The slope f is 4− . b. The slope is negative, so the graph is
decreasing. c. Plot the point (0, 3) . Use the slope to find
an additional point by moving 1 unit to the right and 4 units down.
2. x y Avg. rate of change = y
xΔΔ
2− 12
1− 7 7 12 5 51 ( 2) 1
− −= = −− − −
0 2
2 7 5 50 ( 1) 1
− −= = −− −
1 3− 3 2 5 5
1 0 1− − −= = −
−
2 8− 8 ( 3) 5 5
2 1 1− − − −= = −
−
Since the average rate of change is constant at 5− , this is a linear function with slope = 5− .
To find the equation of the line, we use the point-slope formula and one of the points.
( )( )
1 1
2 5 05 2
y y m x x
y xy x
− = −
− = − −= − +
3. ( )2
0
3 2 8 0(3 4)( 2) 0
f x
x xx x
=
− − =+ − =
3 4 0 or 2 04 23
x xxx
+ = − === −
The zeros of f are 43
− and 2.
4. ( )2
0
2 4 1 0
G x
x x
=
− + + =
2, 4, 1a b c= − = =
( )( )( )
22 4 4 4 2 142 2 2
4 24 4 2 6 2 64 4 2
b b acxa
− ± − −− ± −= =−
− ± − ± ±= = =− −
The zeros of G are 2 62
− and 2 62
+ .
5. ( ) ( )2
2
3 5 3
2 3 0( 1)( 3) 0
f x g x
x x x
x xx x
=
+ = +
− − =+ − =
1 0 or 3 01 3
x xx x
+ = − == − =
The solution set is { }1, 3− .
Full file at https://testbankuniv.eu/Precalculus-Concepts-Through-Functions-A-Right-Triangle-Approach-to-Trigonometry-3rd-Edition-Sullivan-Solutions-Manual
Full file at https://testbankuniv.eu/Precalculus-Concepts-Through-Functions-A-Right-Triangle-Approach-to-Trigonometry-3rd-Edition-Sullivan-Solutions-Manual

Chapter 2: Linear and Quadratic Functions
254 Copyright © 2015 Pearson Education, Inc.
6. ( )( ) ( )2
0
1 5 1 4 0
f x
x x
=
− + − + =
( )22Let 1 1u x u x= − → = −
( )( )2 5 4 04 1 0
u uu u
+ + =+ + =
4 0 or 1 04 1
1 4 1 13 0
u uu u
x xx x
+ = + == − = −
− = − − = −= − =
The zeros of G are 3− and 0.
7. ( )2( ) 3 2f x x= − −
Using the graph of 2y x= , shift right 3 units, then shift down 2 units.
4
y
x
(3,−2)
(4,−1)(2,−1)
8
−4
−4
(6, 7)(0, 7)
8. a. 2( ) 3 12 4f x x x= − + 3, 12, 4.a b c= = − = Since 3 0,a = > the
graph opens up. b. The x-coordinate of the vertex is
( )12 12 2
2 2 3 6bxa
− −= − = − = − = .
The y-coordinate of the vertex is
( ) ( ) ( )22 3 2 12 2 42
12 24 4 8
bf fa
− = = − +
= − + = −
Thus, the vertex is ( )2, 8− .
c. The axis of symmetry is the line 2x = . d. The discriminant is:
( ) ( )( )22 4 12 4 3 4 96 0b ac− = − − = > , so the graph has two x-intercepts. The x-intercepts are found by solving: 23 12 4 0x x− + = .
2 4 ( 12) 962 2(3)
12 4 6 6 2 66 3
b b acxa
− ± − − − ±= =
± ±= =
The x-intercepts are 6 2 63
− 0.37≈ and
6 2 63
± 3.63≈ . The y-intercept is
2(0) 3(0) 12(0) 4 4f = − + = . e.
f. The domain is ( , )−∞ ∞ .
The range is [ 8, )− ∞ .
g. Decreasing on ( , 2)−∞ . Increasing on ( )2, ∞ .
9. a. 2( ) 2 4 5g x x x= − + − 2, 4, 5.a b c= − = = − Since 2 0,a = − < the
graph opens down. b. The x-coordinate of the vertex is
4 4 12 2( 2) 4bxa
= − = − = − =− −
.
The y-coordinate of the vertex is
( ) ( ) ( )21 2 1 4 1 52
2 4 5 3
bg ga
− = = − + −
= − + − = −
Thus, the vertex is ( )1, 3− .
c. The axis of symmetry is the line 1x = . d. The discriminant is:
( ) ( )( )22 4 4 4 2 5 24 0b ac− = − − − = − < , so the
Full file at https://testbankuniv.eu/Precalculus-Concepts-Through-Functions-A-Right-Triangle-Approach-to-Trigonometry-3rd-Edition-Sullivan-Solutions-Manual
Full file at https://testbankuniv.eu/Precalculus-Concepts-Through-Functions-A-Right-Triangle-Approach-to-Trigonometry-3rd-Edition-Sullivan-Solutions-Manual

Chapter 2 Test
255
Copyright © 2015 Pearson Education, Inc.
graph has no x-intercepts. The y-intercept is 2(0) 2(0) 4(0) 5 5g = − + − = − .
e.
f. The domain is ( , )−∞ ∞ .
The range is ( , 3]−∞ − .
g. Increasing on ( , 1)−∞ . Decreasing on ( )1, ∞ .
10. Consider the form ( )2y a x h k= − + . From the
graph we know that the vertex is ( )1, 32− so we have 1h = and 32k = − . The graph also passes through the point ( ) ( ), 0, 30x y = − . Substituting these values for x, y, h, and k, we can solve for a:
2
2
30 (0 1) ( 32)
30 ( 1) 3230 322
a
aaa
− = − + −
− = − −− = −
=
The quadratic function is
2 2( ) 2( 1) 32 2 4 30f x x x x= − − = − − .
11. 2( ) 2 12 3f x x x= − + + 2, 12, 3.a b c= − = = Since 2 0,a = − < the
graph opens down, so the vertex is a maximum point. The maximum occurs at
12 12 32 2( 2) 4bxa
= − = − = − =− −
.
The maximum value is ( ) ( ) ( )23 2 3 12 3 3 18 36 3 21f = − + + = − + + = .
12. 2 10 24 0x x− + ≥ 2( ) 10 24f x x x= − +
2 10 24 0( 4)( 6) 0x xx x
− + =− − =
4, 6x x= = are the zeros of f.
( ) ( ) ( )Interval , 4 4, 6 6,Test Number 0 5 7
Value of 24 1 3Conclusion Positive Negative Positive
f
−∞ ∞
−
The solution set is { }4 or 6x x x≤ ≥ or, using
interval notation, ( ] [ ), 4 6, −∞ ∪ ∞ .
13. ( )2
0
2 4 5 0
f x
x x
=
+ + =
2, 4, 5a b c= = =
( )( )( )
22 4 4 4 2 542 2 2
4 24 4 2 6 614 4 2
b b acxa
i i
− ± −− ± −= =
− ± − − ±= = = − ±
The complex zeros of f are 612
i− − and
612
i− + .
14. 3 1 8x + = 3 1 8 or 3 1 8
3 7 or 3 97 or 33
x xx x
x x
+ = + = −= = −
= = −
The solution set is { }73,3
− .
15. 3 24
x + <
32 24
8 3 811 5
x
xx
+− < <
− < + <− < <
{ } ( )11 5 or 11, 5x x− < < −
Full file at https://testbankuniv.eu/Precalculus-Concepts-Through-Functions-A-Right-Triangle-Approach-to-Trigonometry-3rd-Edition-Sullivan-Solutions-Manual
Full file at https://testbankuniv.eu/Precalculus-Concepts-Through-Functions-A-Right-Triangle-Approach-to-Trigonometry-3rd-Edition-Sullivan-Solutions-Manual

Chapter 2: Linear and Quadratic Functions
256 Copyright © 2015 Pearson Education, Inc.
16. 2 3 4 3
2 3 7
x
x
+ − ≥
+ ≥
2 3 7 or 2 3 72 10 or 2 4
5 or 2
x xx xx x
+ ≤ − + ≥≤ − ≥≤ − ≥
{ } ( ] [ )5 or 2 or , 5 2,x x x≤ − ≥ −∞ − ∪ ∞
17. a. ( ) 0.15 129.50C m m= +
b. ( ) ( )860 0.15 860 129.50129 129.50 258.50
C = += + =
If 860 miles are driven, the rental cost is $258.50.
c. ( ) 213.800.15 129.50 213.80
0.15 84.30562
C mm
mm
=+ =
==
The rental cost is $213.80 if 562 miles were driven.
18. a. 21 1( ) 1000 100010 10
R x x x x x = − + = − +
b. 21(400) (400) 1000(400)1016,000 400,000
$384,000
R = − +
= − +=
c. ( ) ( )1 110 5
1000 1000 50002 2
bxa
− − −= = = =− −
The maximum revenue is 21(5000) (5000) 1000(5000)
10250,000 5,000,000
$2,500,000
R = − +
= − +=
Thus, 5000 units maximizes revenue at $2,500,000.
d. 1 (5000) 100010500 1000
$500
p = − +
= − +=
19. a. Set A:
−3 3
−15
10
The data appear to be linear with a negative slope.
Set B:
−3 30
15
The data appear to be quadratic and opens up.
b. Using the LINear REGression program, the linear function of best fit is:
4.234 2.362y x= − − .
c. Using the QUADratic REGression program,
the quadratic function of best fit is: 21.993 0.289 2.503y x x= + + .
Full file at https://testbankuniv.eu/Precalculus-Concepts-Through-Functions-A-Right-Triangle-Approach-to-Trigonometry-3rd-Edition-Sullivan-Solutions-Manual
Full file at https://testbankuniv.eu/Precalculus-Concepts-Through-Functions-A-Right-Triangle-Approach-to-Trigonometry-3rd-Edition-Sullivan-Solutions-Manual
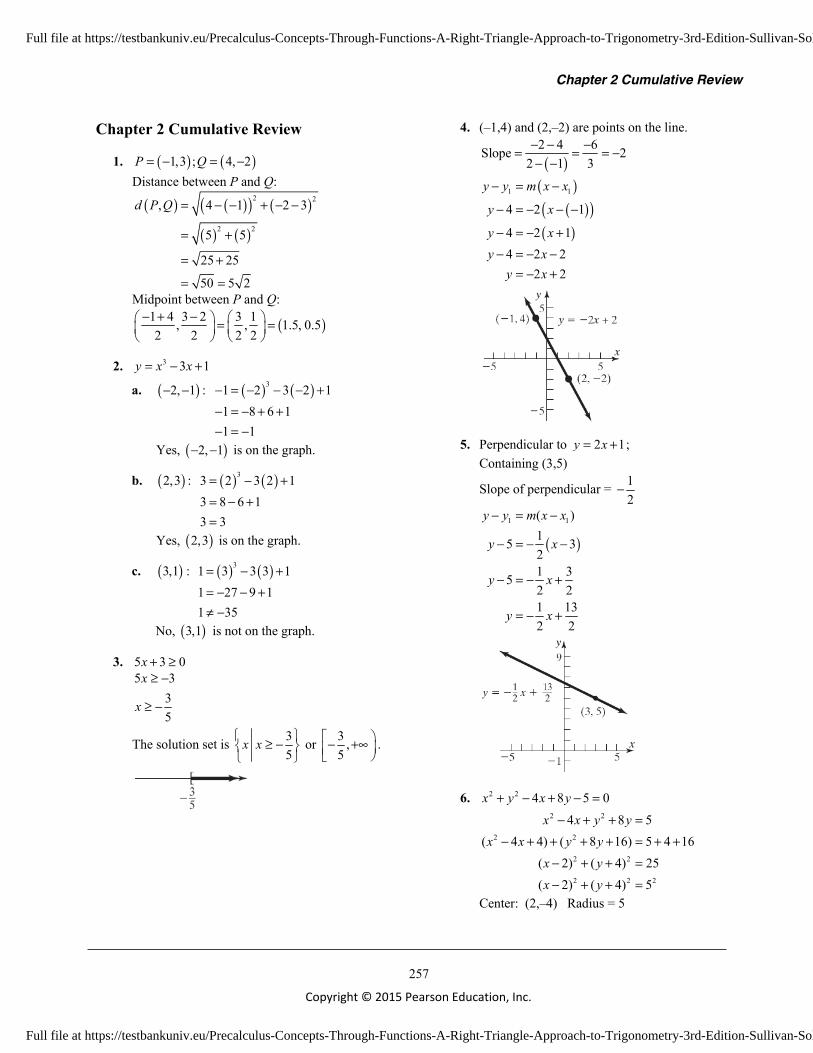
Chapter 2 Cumulative Review
257
Copyright © 2015 Pearson Education, Inc.
Chapter 2 Cumulative Review
1. ( ) ( )1,3 ; 4, 2P Q= − = − Distance between P and Q:
( ) ( )( ) ( )
( ) ( )
2 2
2 2
, 4 1 2 3
5 5
25 25
50 5 2
d P Q = − − + − −
= +
= +
= =
Midpoint between P and Q:
( )1 4 3 2 3 1, , 1.5, 0.52 2 2 2
− + − = =
2. 3 3 1y x x= − +
a. ( )2, 1− − : ( ) ( )31 2 3 2 11 8 6 11 1
− = − − − +− = − + +− = −
Yes, ( )2, 1− − is on the graph.
b. ( )2,3 : ( ) ( )33 2 3 2 13 8 6 13 3
= − += − +=
Yes, ( )2,3 is on the graph.
c. ( )3,1 : ( ) ( )31 3 3 3 11 27 9 11 35
= − += − − +≠ −
No, ( )3,1 is not on the graph.
3. 5 3 0x + ≥ 5 3
35
x
x
≥ −
≥ −
The solution set is 3 3 or ,5 5
x x ≥ − − +∞ .
4. (–1,4) and (2,–2) are points on the line.
( )2 4 6Slope 2
2 1 3− − −= = = −− −
( )( )( )
( )
1 1
4 2 1
4 2 14 2 2
2 2
y y m x x
y x
y xy x
y x
− = −
− = − − −
− = − +− = − −
= − +
5. Perpendicular to 2 1y x= + ; Containing (3,5)
Slope of perpendicular = 12
−
( )1 1( )
15 321 352 21 132 2
y y m x x
y x
y x
y x
− = −
− = − −
− = − +
= − +
6. 2 2 4 8 5 0x y x y+ − + − = 2 2
2 2
2 2
2 2 2
4 8 5( 4 4) ( 8 16) 5 4 16
( 2) ( 4) 25( 2) ( 4) 5
x x y yx x y y
x yx y
− + + =− + + + + = + +
− + + =− + + =
Center: (2,–4) Radius = 5
Full file at https://testbankuniv.eu/Precalculus-Concepts-Through-Functions-A-Right-Triangle-Approach-to-Trigonometry-3rd-Edition-Sullivan-Solutions-Manual
Full file at https://testbankuniv.eu/Precalculus-Concepts-Through-Functions-A-Right-Triangle-Approach-to-Trigonometry-3rd-Edition-Sullivan-Solutions-Manual

Chapter 2: Linear and Quadratic Functions
258 Copyright © 2015 Pearson Education, Inc.
7. Yes, this is a function since each x-value is paired with exactly one y-value.
8. 2( ) 4 1f x x x= − + a. ( )2(2) 2 4 2 1 4 8 1 3f = − + = − + = −
b. ( ) ( )2
2
( ) 2 4 1 3
4 2
f x f x x
x x
+ = − + + −
= − −
c. ( ) ( )2 2( ) 4 1 4 1f x x x x x− = − − − + = + +
d. ( )2 2( ) 4 1 4 1f x x x x x− = − − + = − + −
e. ( ) ( )2
2
2
( 2) 2 4 2 1
4 4 4 8 13
f x x x
x x xx
+ = + − + +
= + + − − += −
f. ( )
( ) ( ) ( )2 2
( )
4 1 4 1
f x h f xh
x h x h x xh
+ −
+ − + + − − +=
2 2 2
2
2 4 4 1 4 1
2 4
x xh h x h x xh
xh h hh
+ + − − + − + −=
+ −=
( )2 42 4
h x hx h
h+ −
= = + −
9. 3 1( )6 7
zh zz
−=−
The denominator cannot be zero: 6 7 0
6 776
zz
z
− ≠≠
≠
Domain: 76
z z ≠
10. Yes, the graph represents a function since it passes the Vertical Line Test.
11. ( )4
xf xx
=+
a. 1 1 1(1) ,1 4 5 4
f = = ≠+
so 11,4
is not on
the graph of f.
b. 2 2( 2) 1,2 4 2
f − −− = = = −− +
so ( )2, 1− − is a
point on the graph of f. c. Solve for x:
24
2 88
xx
x xx
=+
+ == −
So, ( 8, 2)− is a point on the graph of f.
12. 2
( )2 1
xf xx
=+
( )( ) ( ) ( )
2 2
( ) or 2 1 2 1
x xf x f x f xx x
−− = = ≠ −
− + − +
Therefore, f is neither even nor odd.
13. ( ) 3 5 4f x x x= − + on the interval ( )4, 4− Use MAXIMUM and MINIMUM on the graph of 3
1 5 4y x x= − + .
Local maximum is 5.30 and occurs at 1.29x ≈ − ;
Local minimum is –3.30 and occurs at 1.29x ≈ ; f is increasing on ( ) ( )4, 1.29 or 1.29,4− − ;
f is decreasing on ( )1.29,1.29− .
14. ( ) ( )3 5; 2 1f x x g x x= + = + a. ( ) ( )
3 5 2 1f x g xx x
=+ = +
3 5 2 14
x xx
+ = += −
Full file at https://testbankuniv.eu/Precalculus-Concepts-Through-Functions-A-Right-Triangle-Approach-to-Trigonometry-3rd-Edition-Sullivan-Solutions-Manual
Full file at https://testbankuniv.eu/Precalculus-Concepts-Through-Functions-A-Right-Triangle-Approach-to-Trigonometry-3rd-Edition-Sullivan-Solutions-Manual
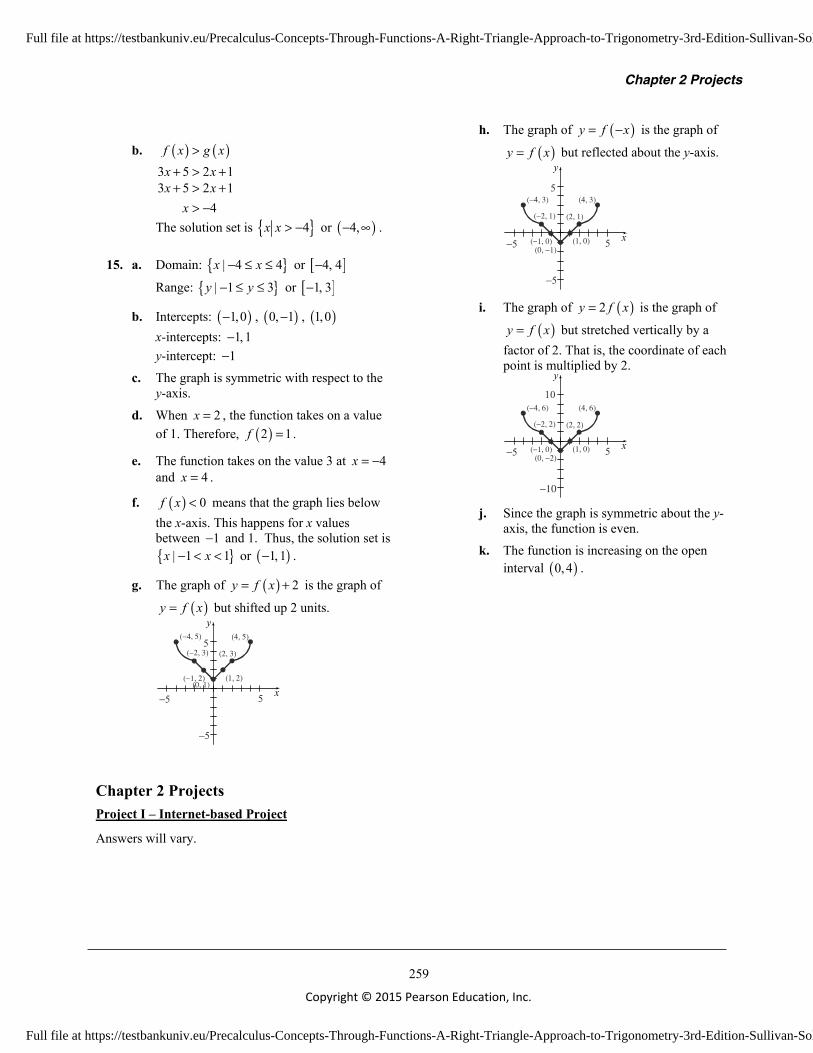
Chapter 2 Projects
259
Copyright © 2015 Pearson Education, Inc.
b. ( ) ( )3 5 2 1f x g xx x
>+ > +
3 5 2 14
x xx
+ > +> −
The solution set is { }4x x > − or ( )4,− ∞ .
15. a. Domain: { }| 4 4x x− ≤ ≤ or [ ]4, 4−
Range: { }| 1 3y y− ≤ ≤ or [ ]1, 3−
b. Intercepts: ( )1,0− , ( )0, 1− , ( )1,0 x-intercepts: 1, 1− y-intercept: 1−
c. The graph is symmetric with respect to the y-axis.
d. When 2x = , the function takes on a value of 1. Therefore, ( )2 1f = .
e. The function takes on the value 3 at 4x = − and 4x = .
f. ( ) 0f x < means that the graph lies below the x-axis. This happens for x values between 1− and 1. Thus, the solution set is { }| 1 1x x− < < or ( )1, 1− .
g. The graph of ( ) 2y f x= + is the graph of
( )y f x= but shifted up 2 units.
−5
y
x
5
5−5
(4, 5)
(−1, 2)
(2, 3)
(1, 2)
(−2, 3)
(−4, 5)
(0, 1)
h. The graph of ( )y f x= − is the graph of
( )y f x= but reflected about the y-axis.
−5
y
x
5
5−5
(4, 3)
(−1, 0)
(2, 1)
(1, 0)
(−2, 1)
(−4, 3)
(0, −1)
i. The graph of ( )2y f x= is the graph of
( )y f x= but stretched vertically by a factor of 2. That is, the coordinate of each point is multiplied by 2.
−10
y
x
10
5−5
(4, 6)
(−1, 0)
(2, 2)
(1, 0)
(−2, 2)
(−4, 6)
(0, −2)
j. Since the graph is symmetric about the y-
axis, the function is even. k. The function is increasing on the open
interval ( )0,4 .
Chapter 2 Projects Project I – Internet-based Project
Answers will vary.
Full file at https://testbankuniv.eu/Precalculus-Concepts-Through-Functions-A-Right-Triangle-Approach-to-Trigonometry-3rd-Edition-Sullivan-Solutions-Manual
Full file at https://testbankuniv.eu/Precalculus-Concepts-Through-Functions-A-Right-Triangle-Approach-to-Trigonometry-3rd-Edition-Sullivan-Solutions-Manual
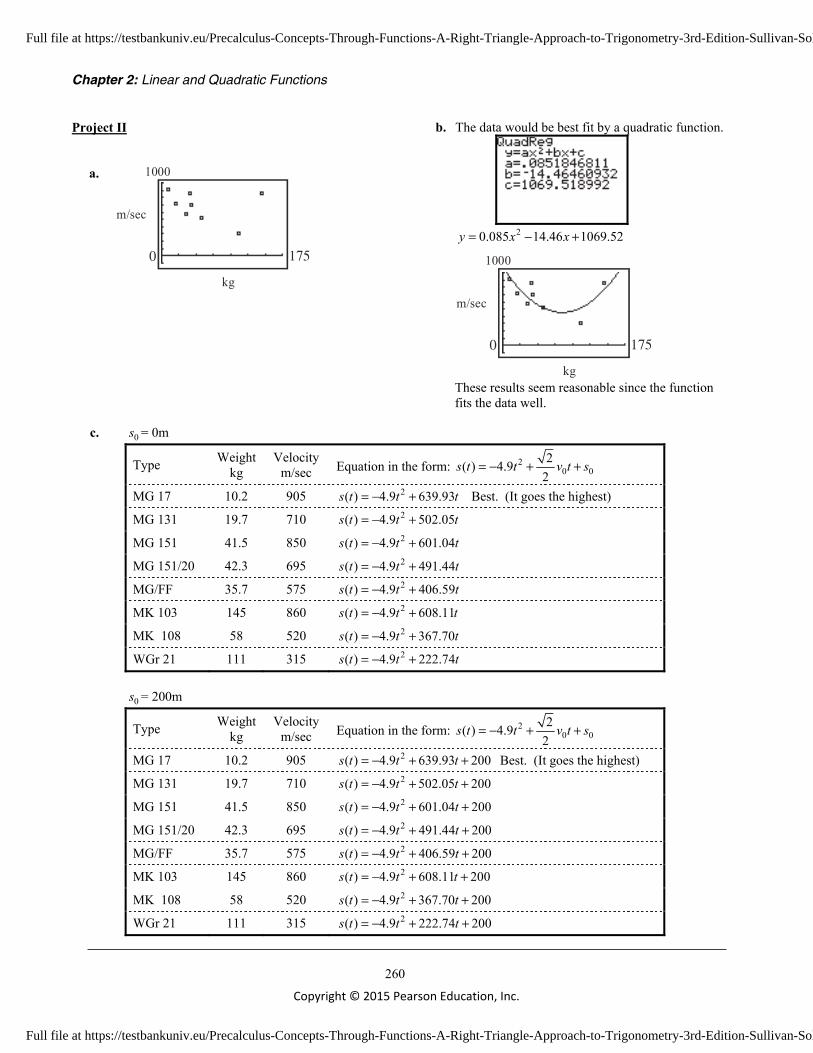
Chapter 2: Linear and Quadratic Functions
260 Copyright © 2015 Pearson Education, Inc.
Project II a.
0 175
1000
m/sec
kg
b. The data would be best fit by a quadratic function.
20.085 14.46 1069.52y x x= − +
0 175
1000
m/sec
kg These results seem reasonable since the function fits the data well.
c. 0s = 0m
Type Weight kg
Velocity m/sec Equation in the form: 2
0 02( ) 4.9
2s t t v t s= − + +
MG 17 10.2 905 2( ) 4.9 639.93s t t t= − + Best. (It goes the highest)
MG 131 19.7 710 2( ) 4.9 502.05s t t t= − +
MG 151 41.5 850 2( ) 4.9 601.04s t t t= − +
MG 151/20 42.3 695 2( ) 4.9 491.44s t t t= − +
MG/FF 35.7 575 2( ) 4.9 406.59s t t t= − +
MK 103 145 860 2( ) 4.9 608.11s t t t= − +
MK 108 58 520 2( ) 4.9 367.70s t t t= − +
WGr 21 111 315 2( ) 4.9 222.74s t t t= − + 0s = 200m
Type Weight kg
Velocity m/sec Equation in the form: 2
0 02( ) 4.9
2s t t v t s= − + +
MG 17 10.2 905 2( ) 4.9 639.93 200s t t t= − + + Best. (It goes the highest)
MG 131 19.7 710 2( ) 4.9 502.05 200s t t t= − + +
MG 151 41.5 850 2( ) 4.9 601.04 200s t t t= − + +
MG 151/20 42.3 695 2( ) 4.9 491.44 200s t t t= − + +
MG/FF 35.7 575 2( ) 4.9 406.59 200s t t t= − + +
MK 103 145 860 2( ) 4.9 608.11 200s t t t= − + +
MK 108 58 520 2( ) 4.9 367.70 200s t t t= − + +
WGr 21 111 315 2( ) 4.9 222.74 200s t t t= − + +
Full file at https://testbankuniv.eu/Precalculus-Concepts-Through-Functions-A-Right-Triangle-Approach-to-Trigonometry-3rd-Edition-Sullivan-Solutions-Manual
Full file at https://testbankuniv.eu/Precalculus-Concepts-Through-Functions-A-Right-Triangle-Approach-to-Trigonometry-3rd-Edition-Sullivan-Solutions-Manual

Chapter 2 Projects
261
Copyright © 2015 Pearson Education, Inc.
0s = 30m
Type Weight kg
Velocity m/sec Equation in the form: 2
0 02( ) 4.9
2s t t v t s= − + +
MG 17 10.2 905 2( ) 4.9 639.93 30s t t t= − + + Best. (It goes the highest)
MG 131 19.7 710 2( ) 4.9 502.05 30s t t t= − + +
MG 151 41.5 850 2( ) 4.9 601.04 30s t t t= − + +
MG 151/20 42.3 695 2( ) 4.9 491.44 30s t t t= − + +
MG/FF 35.7 575 2( ) 4.9 406.59 30s t t t= − + +
MK 103 145 860 2( ) 4.9 608.11 30s t t t= − + +
MK 108 58 520 2( ) 4.9 367.70 30s t t t= − + +
WGr 21 111 315 2( ) 4.9 222.74 30s t t t= − + +
Notice that the gun is what makes the difference, not how high it is mounted necessarily. The only way to change the true maximum height that the projectile can go is to change the angle at which it fires.
Project III
a. 1 2 3 4 52 5 3 1 1 3 5x
y x= − + − − −
b. 2 1
2 1
1 3 21
y yyx x x
−Δ −= = = −Δ −
2 1
2 1
1 1 21
y yyx x x
−Δ − −= = = −Δ −
2 1
2 1
3 ( 1) 21
y yyx x x
−Δ − − −= = = −Δ −
2 1
2 1
5 ( 3) 21
y yyx x x
−Δ − − −= = = −Δ −
All of the values of yx
ΔΔ
are the same.
c.
0
50,000
100
MedianIncome ($)
Age Class Midpoint
Full file at https://testbankuniv.eu/Precalculus-Concepts-Through-Functions-A-Right-Triangle-Approach-to-Trigonometry-3rd-Edition-Sullivan-Solutions-Manual
Full file at https://testbankuniv.eu/Precalculus-Concepts-Through-Functions-A-Right-Triangle-Approach-to-Trigonometry-3rd-Edition-Sullivan-Solutions-Manual

Chapter 2: Linear and Quadratic Functions
262 Copyright © 2015 Pearson Education, Inc.
d. 30633 9548 2108.5010
37088 30633 645.5010
IxIx
Δ −= =ΔΔ −= =Δ
41072 37088 398.4010
Ix
Δ −= =Δ
34414 41072 665.8010
Ix
Δ −= = −Δ
19167 34414 1524.7010
Ix
Δ −= = −Δ
These Ix
ΔΔ
values are not all equal. The data are not linearly related.
e. 2 1 0 1 2 3 423 9 3 5 15 33 59
14 6 2 10 18 26yx
xy
ΔΔ
− −
− −
As x increases, yx
ΔΔ
increases. This makes sense because the parabola is increasing (going up) steeply as x
increases.
f.
2
2
2 1 0 1 2 3 423 9 3 5 15 33 59
8 8 8 8 8yx
xy
ΔΔ
− −
The second differences are all the same. g. The paragraph should mention at least two observations: 1. The first differences for a linear function are all the same. 2. The second differences for a quadratic function are the same.
Project IV
a. – i. Answers will vary , depending on where the CBL is located above the bouncing ball. j. The ratio of the heights between bounces will be the same.
Full file at https://testbankuniv.eu/Precalculus-Concepts-Through-Functions-A-Right-Triangle-Approach-to-Trigonometry-3rd-Edition-Sullivan-Solutions-Manual
Full file at https://testbankuniv.eu/Precalculus-Concepts-Through-Functions-A-Right-Triangle-Approach-to-Trigonometry-3rd-Edition-Sullivan-Solutions-Manual

194 CHAPTER 3 Quadratic Functions and Models
63. Advertising A small manufacturing firm collected thefollowing data on advertising expenditures A (inthousands of dollars) and total revenue R (in thousandsof dollars).
Advertising Total Revenue
20
22
25
25
27
28
29
$6101
$6222
$6350
$6378
$6453
$6423
$6360
$623131
(a) Draw a scatter diagram of the data. Comment onthe type of relation that may exist between the twovariables.
(b) Use a graphing utility to find the quadratic function ofbest fit to these data.
(c) Use the function found in part (b) to determine theoptimal level of advertising for this firm.
(d) Use the function found in part (b) to find the revenuethat the firm can expect if it uses the optimal level ofadvertising.
(e) With a graphing utility, graph the quadratic functionof best fit on the scatter diagram.
4. Cannons The velocity of a projectile depends uponmany factors, in particular, the weight of the ammunition.(a) Plot a scatter diagram of the data in the table below.
Let x be the weight in kilograms and let y be thevelocity in meters per second.
(b) Determine which type of function would fit thisdata the best: linear or quadratic. Use a graphingutility to find the function of best fit. Are the resultsreasonable?
(c) Based on velocity, we can determine how high a pro-jectile will travel before it begins to come back down.If a cannon is fired at an angle of to the horizon-tal, then the function for the height of the projectile
is given by where is the
velocity at which the shell leaves the cannon (initialvelocity), and is the initial height of the nose of thecannon (because cannons are not very long, we mayassume that the nose and the firing pin at the backare at the same height for simplicity). Graph the func-tion for each of the guns described in thetable.Which gun would be the best for anti-aircraft ifthe gun were sitting on the ground? Which would bethe best to have mounted on a hilltop or on the top ofa tall building? If the guns were on the turret of a ship,which would be the most effective?
s = s1t2
s0
v0s1t2 = -16t2 +122
v0 t + s0 ,
45°
Chapter Projects
Initial Type Weight (kg) Velocity (m sec)/
MG 17 10.2 905MG 131 19.7 710MG 151 41.5 850MG 151 20 42.3 695MG FF 35.7 575MK 103 145 860MK 108 58 520WGr 21 111 315
>>
(Data and information taken from “Flugzeug-Handbuch,Ausgabe Dezember 1996: Guns and Cannons of theJagdwaffe” at www.xs4all.nl/~rhorta/jgguns.htm)
SULL-PRECU-03-143-196.I 1/29/03 9:29 AM Page 194
Full file at https://testbankuniv.eu/Precalculus-Concepts-Through-Functions-A-Right-Triangle-Approach-to-Trigonometry-3rd-Edition-Sullivan-Solutions-Manual
Full file at https://testbankuniv.eu/Precalculus-Concepts-Through-Functions-A-Right-Triangle-Approach-to-Trigonometry-3rd-Edition-Sullivan-Solutions-Manual
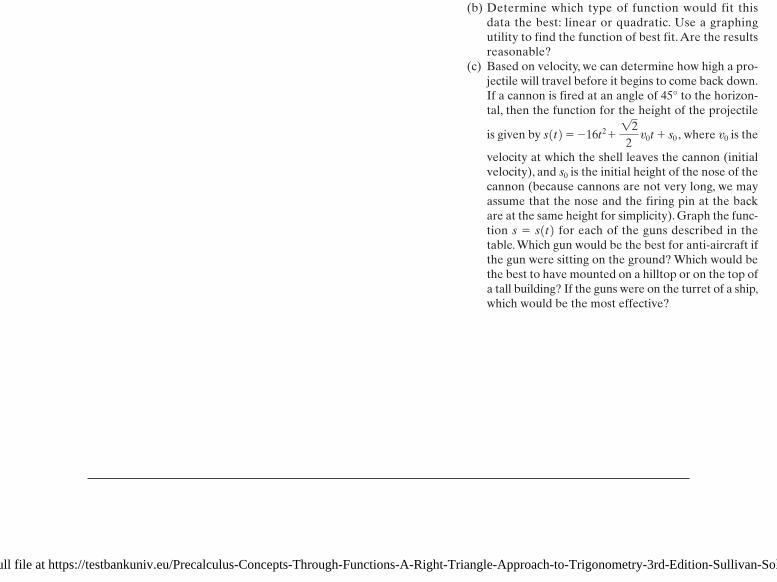

Cumulative Review 777
C u m u l a t i v e R e v i e w
1. Find the real solutions, if any, of the equation
2. Find an equation for the line containing the points and What is the distance between these points?What is their midpoint?
3. Test the equation for symmetry with respectto the x-axis, the y-axis, and the origin. List the intercepts.
4. Use transformations to graph the equation
5. Use transformations to graph the equation
6. Use transformations to graph the equation
y = cosax -p
2b - 1.
y = 3ex - 2.
y = ƒx - 3 ƒ + 2.
3x + y2 = 9
14, -12.1-2, 52
3x2 + x - 1 = 0.7. Sketch a graph of each of the following functions. Label
at least three points on each graph. Name the inverse func-tion of each one and show its graph.(a)(b)
(c)
(d)
8. If and find the exact value of:
(a) (b) (c)
(d) (e) (f) cosa 12
ubsina12
ubcos12u2sin12u2tan ucos u
p 6 u 63p2
,sin u = - 13
y = cos x, 0 … x … p
y = sin x, - p
2… x …
p
2
y = ex
y = x3
3. Suppose
(a) Build a table of values for where
Use exact values.
(b) Find the first differences for each consecutive pair of
values in part (a).That is, evaluate
where
Use your calculator to approximate eachvalue rounded to three decimal places.
(c) Plot the points for on a scat-ter diagram.What shape does the set of points give?What function does this resemble? Fit a sine curveof best fit to the points. How does that relate to yourguess?
(d) Find the first differences for each consecutive pair of
values in part (b).That is, evaluate
where
This is the set of second differences of
Use your calculator to approximate each valuerounded to three decimal places. Plot the points
for on a scatter diagram.What shape does the set of points give? What func-tion does this resemble? Fit a sine curve of best fit tothe points. How does that relate to your guess?
i = 1, Á , 151xi , h1xi22
f1x2.11p6
.
=x2 =p
6, Á , x16x1 = 0,
g1xi + 12 - g1xi2xi + 1 - xi
=h1xi2 =¢g1xi2
¢xi
i = 1, Á , 161xi , g1xi22
x17 = 2p.
x2 =p
6, Á ,x1 = 0,
f1xi + 12 - f1xi2xi + 1 - xi
,
g1xi2 =¢f1xi2
¢xi=
2p.11p
6,
7p4
,5p3
,3p2
,4p3
,5p4
,7p6
,p,5p6
,3p4
,2p3
,p
2,
p
3,
p
4,
p
6,x = 0,f1x2
f1x2 = sin x. (e) Find the first differences for each consecutive pair of
values in part (d). That is, evaluate
where
This is the set of third differences of
Use your calculator to approximate each valuerounded to three decimal places. Plot the points
for on a scatter diagram.What shape does the set of points give? What func-tion does this resemble? Fit a sine curve of best fit tothe points. How does that relate to your guess?
(f) Find the first differences for each consecutive pair of
values in part (e). That is, evaluate
where
This is the set of fourth differences of
Use your calculator to approximate each valuerounded to three decimal places. Plot the points
for on a scatter diagram.What shape does the set of points give? What func-tion does this resemble? Fit a sine curve of best fit tothe points. How does that relate to your guess?
(g) What pattern do you notice about the curves that youfound? What happened in part (f )? Can you make ageneralization about what happened as you com-puted the differences? Explain your answers.
i = 1, Á , 131xi , m1xi22
f1x2.x14 =5p3
.
x2 =p
6, Á ,x1 = 0,
k1xi + 12 - k1xi2xi + 1 - xi
,=
m1xi2 =¢k1xi2
¢xi
i = 1, Á , 141xi , k1xi22
f1x2.7p4
.=
x2 =p
6, Á , x15x1 = 0,
h1xi + 12 - h1xi2xi + 1 - xi
,=
k1xi2 =¢h1xi2
¢xi
SVVL-ATEGU-09C-759-778.I 1/7/02 11:21 AM Page 777
Full file at https://testbankuniv.eu/Precalculus-Concepts-Through-Functions-A-Right-Triangle-Approach-to-Trigonometry-3rd-Edition-Sullivan-Solutions-Manual
Full file at https://testbankuniv.eu/Precalculus-Concepts-Through-Functions-A-Right-Triangle-Approach-to-Trigonometry-3rd-Edition-Sullivan-Solutions-Manual
Cumulative Review 195
(c) Using the data given in Section 3.4, Problem 15, drawa scatter diagram letting median income, I, representthe dependent variable and the midpoint of the age,x, represent the independent variable.
(d) Compute for the data given in the table.What do
you notice? Do you think the data are linearlyrelated? Why?
(e) Using a graphing utility, graph the equationEvaluate the equation for
Compute (first difference)
for each consecutive ordered pair. What happens to
as x increases? Why is this result reasonable?
(f) Notice that each time you compute Now
compute for the values you determined in part
(e). This is called a second difference, denoted
since it is the difference of the first differences. Whatdo you notice about the second differences?
(g) Write a paragraph explaining how first and seconddifferences can be used to identify data that arerelated through a linear or quadratic function.
¢y2
¢x2 ,
¢y
¢x
¢y
¢x
¢y
¢x.¢x = 1
¢y
¢x
¢y
¢xx = -2, -1, 0, 1, 2, 3, 4.
y = 4x2 - 2x + 3.
¢I
¢x
7. CBL Experiment Locate the motion detector on aCalculator Based Laboratory (CBL) or a CalculatorBased Ranger (CBR) above a bouncing ball.(a) Plot the data collected in a scatter diagram with time
as the independent variable.(b) Find the quadratic function of best fit for the sec-
ond bounce.(c) Find the quadratic function of best fit for the third
bounce.(d) Find the quadratic function of best fit for the fourth
bounce.(e) Compute the maximum height for the second bounce.(f) Compute the maximum height for the third bounce.(g) Compute the maximum height for the fourth bounce.(h) Compute the ratio of the maximum height of the third
bounce to the maximum height of the second bounce.(i) Compute the ratio of the maximum height of the fourth
bounce to the maximum height of the third bounce.(j) Compare the results from parts (h) and (i). What do
you conclude?
1. Find the distance between the points and
2. Which of the following points are on the graph of
(a) (b) (c)
3. Determine the intercepts of
4. Use a graphing utility to find the local maxima and min-ima of the function Deter-mine where is increasing and where is decreasing.
5. Solve the inequality and graph the solution set.
6. Solve the inequality and graph the solution set.
7. Find a linear function with slope that contains thepoint Graph the function.
8. Find the equation of the line parallel to the line and containing the point Express your answer inslope-intercept form and graph the line.
9. Graph the equation
10. Determine whether the following relation represents afunction: 513, 62, 11, 32, 12, 52, 13, 826.
y = x3.
13, 52.y = 2x + 1
1-1, 42.-3
x2 - 3x 6 4
x2 Ú x
fff1x2 = x4 - 3x3 + 4x - 1.
y = 3x2 + 14x - 5.
13, 1212, 321-2, -12y = 2x2 - x - 5?
Q = 1-4, 22.P = 11, 32 11. For the function defined by evaluate:
(a)(b)(c)(d)(e)
(f)
12. Find the domain of
13. Determine whether the following graph is the graph ofa function.
y
x
h1z2 =3z - 1
z2 - 6z - 7.
f1x + h2 - f1x2h
, h Z 0
f1x + 22-f1x2f1-x2f1x2 + f122f122
f1x2 = 2x2 + x,f
Cumulative Review
SULL-PRECU-03-143-196.I 1/29/03 9:29 AM Page 195
Full file at https://testbankuniv.eu/Precalculus-Concepts-Through-Functions-A-Right-Triangle-Approach-to-Trigonometry-3rd-Edition-Sullivan-Solutions-Manual
Full file at https://testbankuniv.eu/Precalculus-Concepts-Through-Functions-A-Right-Triangle-Approach-to-Trigonometry-3rd-Edition-Sullivan-Solutions-Manual