kbc group i extended quarterly report – 4q2015 i p · volatile short-term assets used for...
TRANSCRIPT

KBC Group I Extended Quarterly Report – 4Q2015 I p.1

KBC Group I Extended Quarterly Report – 4Q2015 I p.2
Management certification of financial statements and quarterly report ‘I, Luc Popelier, Chief Financial Officer of the KBC Group, certify on behalf of the Executive Committee of KBC Group NV that, to the best of my knowledge, the abbreviated financial statements included in the quarterly report are based on the relevant accounting standards and fairly present in all material respects the financial condition and results of KBC Group NV including its consolidated subsidiaries, and that the quarterly report provides a fair view of the main events, the main transactions with related parties in the period under review and their impact on the abbreviated financial statements, and an overview of the main risks and uncertainties for the remainder of the current year.’
Forward-looking statements The expectations, forecasts and statements regarding future developments that are contained in this report are, of course, based on assumptions and are contingent on a number of factors that will come into play in the future. Consequently, the actual situation may turn out to be (substantially) different.
Glossary of ratios used Basic earnings per share: [result after tax, attributable to equity holders of the parent)] / [average number of ordinary shares, less treasury shares]. If a coupon (and/or penalty) is paid on the core-capital securities sold to the government and/or a coupon is paid on the additional tier-1 instruments included in equity, it will be deducted from the numerator.
Combined ratio (non-life insurance): [technical insurance charges, including the internal cost of settling claims / earned premiums] + [operating expenses / written premiums] (after reinsurance in each case).
Common equity ratio: [common equity tier-1 capital] / [total weighted risks]. The calculation includes in the numerator the core-capital securities sold to the government that are grandfathered by the regulator.
Cost/income ratio (banking): [operating expenses of the banking activities of the group] / [total income of the banking activities of the group].
Cover ratio: [specific impairment on loans] / [outstanding impaired loans]. For a definition of ‘impaired’, see ‘Impaired loans ratio’. Where appropriate, the impairment charges and impaired loans in the formula may be limited to ‘more than 90 days overdue’.
Credit cost ratio: [net changes in impairment for credit risks] / [average outstanding loan portfolio]. Note that, inter alia, government bonds are not included in this formula.
Diluted earnings per share: [result after tax, attributable to equity holders of the parent] / [average number of ordinary shares plus dilutive options less treasury shares]. If a coupon (and/or penalty) is paid on the core-capital securities sold to the government, and/or a coupon is paid on the additional tier-1 instruments included in equity, it will be deducted from the numerator.
Impaired loans ratio: [impaired loans] / [total outstanding loan portfolio]. Impaired loans are loans for which full (re)payment of contractual principal and interest is deemed unlikely. This corresponds with KBC’s Probability-of-Default classes 10+11+12. These loans are equivalent to ‘non-performing loans’ under the (new) definition used by the European Banking Authority.
Leverage ratio: [regulatory available tier-1 capital] / [total exposure measures]. The exposure measure is the total of non-risk-weighted on and off-balance sheet items, based on accounting data.
Liquidity coverage ratio (LCR): [stock of high-quality liquid assets] / [total net cash outflow over the next 30 calendar days].
Net interest margin of the group: [net interest income of the banking activities] / [average interest-bearing assets of the banking activities]. To more closely reflect the scope of business, the definition has been reworked since 2014 (and applied retroactively) to exclude all divestments and all volatile short-term assets used for liquidity management.
Net stable funding ratio (NSFR): [available amount of stable funding] / [required amount of stable funding].
Parent shareholders’ equity per share: [parent shareholders’ equity] / [number of ordinary shares less treasury shares (at period-end)].
Return on allocated capital (ROAC) for a particular business unit: [result after tax, including minority interests, of a business unit] / [average capital allocated to the business unit]. The capital allocated to a business unit is based on risk-weighted assets for banking (based on Basel III) and risk-weighted asset equivalents for insurance (based on Solvency I).
Return on equity: [result after tax, attributable to equity holders of the parent] / [average parent shareholders’ equity, excluding the revaluation reserve for available-for-sale assets]. If a coupon is paid on the core-capital securities sold to the government or a coupon is paid on the additional tier-1 instruments included in equity, it will be deducted from the numerator.
Solvency ratio, insurance: [consolidated available capital of KBC Insurance] / [minimum required solvency margin of KBC Insurance].
Investor Relations contact details
[email protected] KBC Group NV, Investor Relations Office, Havenlaan 2, BE 1080 Brussels, Belgium
Visit www.kbc.com

KBC Group I Extended Quarterly Report – 4Q2015 I p.3
Report for 4Q2015 and FY2015
• Summary 5
• Business highlights 7
• Overview of our results and balance sheet 8
• Analysis of the quarter 9
• Analysis of the full year 11
• Statement of risk 12
• Additional information 13
4Q2015 results by business unit • Breakdown by business unit 15
• Belgium Business Unit 16
• Czech Republic Business Unit 17
• International Markets Business Unit 18
• Group Centre 23
Consolidated financial statements according to IFRS
• Consolidated income statement 25
• Consolidated statement of comprehensive income (condensed) 26
• Consolidated balance sheet 27
• Consolidated statement of changes in equity 28
• Consolidated cash flow statement 29
• Notes on statement of compliance and changesin accounting policies 29
• Notes on segment reporting 30
• Other notes 33
Risk and capital management
• Credit risk 46
• Solvency 52
Content
KBC Group I Extended Quarterly Report – 4Q2015 I p.4
This report contains information that is subject to transparency regulations for listed companies.
Date of release: 18 February 2016
KBC Group
Report for 4Q2015 and FY2015

KBC Group I Extended Quarterly Report – 4Q2015 I p.5
Summary: KBC returns profit of 2.6 billion euros for the full year, driven by strong business fundamentals and boosted by non-recurring items in the fourth quarter. Profit of 862 million euros posted for last quarter of 2015.
Our client-centric business model continued to thrive. We have lent more to clients and they have taken up more insurance products in almost all the countries we operate in. Clients entrusted more assets to us, leading to higher sales of investment products. The low cost of credit also underpinned the net result. Against a background of low interest rates, modest economic growth in Belgium and stronger growth in Central Europe, KBC ended the last quarter of 2015 with an exceptional net profit of 862 million euros, compared to 600 million euros in the preceding quarter and 473 million euros in the last quarter of 2014. Profit was boosted by the liquidation of KBC Financial Holding Inc., but tempered by impairment on goodwill. Excluding these two items, the net result amounted to 441 million euros in the fourth quarter. The result for full year 2015 came to 2 639 million euros (2 218 million euros excluding these two items), with all countries generating a profit.
Financial highlights for the fourth quarter of 2015, compared with the third quarter of 2015:
• Both the banking and insurance franchises in our core markets and core activities prospered. • We again granted more loans in Belgium (+1% in just one quarter), the Czech Republic (+2%), Slovakia (+4%) and Bulgaria
(+3%), while clients further increased their deposits in most of our countries: the Czech Republic (+3%), Hungary (+8%), Slovakia (+3%), Bulgaria (+4%) and Ireland (+1%).
• Net interest income was slightly higher despite the low interest rate environment and some pressure on lending margins. Our net interest margin narrowed from 1.99% to 1.95%.
• Sales of non-life insurance products across all our markets were up year-on-year, and the non-life combined ratio stood at an excellent 91% for the full year. Aggregate sales of life products increased, with the Czech Republic turning in a particularly impressive performance.
• Clients continued to entrust their assets to KBC. Total assets under management of our group ended higher at 209 billion euros, thanks to net entries and the market performing well. Our net fee and commission income dropped by 3%, due mainly to lower management fees stemming from a more cautious investment allocation.
• Excluding special bank taxes, end-of-year costs were seasonally up, primarily at the Group Centre. The cost/income ratio stood at a good 55% for the full year.
• The cost of credit for 2015 amounted to an excellent 0.23% of our loan portfolio. • The previously announced liquidation of KBC Financial Holding Inc. resulted in a positive income tax figure and a negative net
result from financial instruments at fair value of 765 million euros, combined. • Impairment on goodwill came to 344 million euros in the fourth quarter, though it did not impact our capital ratios. • Our liquidity position remains solid, and our capital base – with a common equity ratio of 15.2% (phased-in, Danish
compromise) – remains well above the regulators’ target, even after repayment of the final instalment of state aid.
Johan Thijs, our group CEO, added…
‘Clients continue to entrust their assets to us and to rely on us for the realisation of their projects. We are genuinely grateful for that. It’s all systems go at KBC and the results show that our client-centric approach is paying off. We posted an excellent result of 2.6 billion euros in 2015. Some 862 million euros of that figure came in the last quarter, thanks to the good performance of the underlying business and exceptional items. The underlying business thrived as illustrated by the increase in lending, as well as growth in assets under management and insurance contracts. A continued focus on cost control and excellent cost of credit are adding to the prosperity of the business.

KBC Group I Extended Quarterly Report – 4Q2015 I p.6
The announced liquidation of KBC Financial Holding has taken place, leading to a post-tax impact on the result of 765 million euros. Besides that, higher local capital targets and a higher discount rate lay behind impaired goodwill totalling 344 million euros being recorded almost entirely on our businesses in Bulgaria and Slovakia. This had no impact on our capital ratios. The franchise, reputation and opportunity of these businesses are beyond dispute. On the regulatory front, we were informed during the fourth quarter of 2015 of the new minimum capital requirements, i.e. a common equity tier-1 (CET1) ratio of at least 9.75%, phased in under the Danish compromise. At the end of October, the National Bank of Belgium also announced its new capital buffers for systemically important Belgian banks. For KBC, it means that an additional capital buffer of 0.5% of CET1 (phased in under the Danish compromise) is required for 2016. We feel comfortable with these targets, which we had already factored in to our capital management models. That is also why we were able to pay back the last remaining tranche of 2 billion euros of state aid, along with a penalty of 50%, to the Flemish Regional Government at the end of 2015, five years ahead of schedule. In doing that, we have met all the remaining financial obligations imposed on us during and after the recent financial crisis, and have closed that chapter completely. We are extremely grateful to the government and our clients, employees and shareholders for their trust and support during that time.
In line with our previously announced intention, it will be proposed to the annual general meeting that no dividend be paid for 2015.
Our aim for 2016 is to build on the momentum of previous years and, in particular, to assume our role in society as a client-centric organisation. Our bank-insurance model, supported by solid liquidity and capital bases, allows us to generate sustainable results. However, the continuing low level of interest rates remains a challenge for the entire financial sector. And volatility on the financial markets presents a challenge for our fee business. Fundamentally, we are continuing to invest in the future and to pro-actively roll out our financial technology plans so we can serve our clients even better than today.’
Overview KBC Group (consolidated) 4Q2014 3Q2015 4Q2015 FY2014 FY2015
Net result, IFRS (in millions of EUR) 473 600 862 1 762 2 639
Basic earnings per share, IFRS (in EUR)* 1.00 1.41 -0.36 3.32 3.80
Breakdown of the net result, IFRS, by business unit (in millions of EUR)
Belgium 414 358 348 1 516 1 564 Czech Republic 121 153 119 528 542 International Markets -7 92 61 -182 245 Group Centre -54 -2 334 -100 287
Parent shareholders’ equity per share (in EUR, end of period) 31.4 33.6 34.5 31.4 34.5 * Note: if a coupon is paid on the core-capital securities sold to the Flemish Regional Government and a coupon is paid on the additional tier-1 instruments included in equity, it will be deducted from the numerator (pro rata). If a penalty has to be paid on the core-capital securities, it will likewise be deducted.

KBC Group I Extended Quarterly Report – 4Q2015 I p.7
Business highlights in the quarter under review • Our core strategy remains focused on providing bank-insurance products and services to retail, SME and mid-cap clients in
Belgium, the Czech Republic, Slovakia, Hungary and Bulgaria.
• KBC’s comfortable capital position was reflected in the following:
o We continued to work on achieving our strategic objectives within our strict risk and capital framework and underthe supervision of the regulatory authorities. In this context, the European Central Bank informed KBC at theend of November 2015 of its new minimum capital requirements, i.e. a common equity tier-1 (CET1) ratio of atleast 9.75%, phased in under the Danish compromise. At the end of October, the National Bank of Belgium alsoannounced its new capital buffers for systemically important Belgian banks. For KBC, it means that an additional capital buffer of 0.5% of CET1 (phased in under the Danish compromise) is required for 2016, which is to bebuilt up over three years on a straight-line basis to 1.5% in 2018.
o At the end of 2015, KBC paid back the last remaining instalment of 2 billion euros of state aid to the FlemishRegional Government five years ahead of schedule, together with a penalty of 50%. In doing that, the grouphas met all the remaining financial obligations imposed on it during and after the recent financial crisis and hasclosed that chapter completely.
o Under the new Solvency II framework, which came into force on 1 January 2016, insurers in Europe have tomeet new requirements with regard to required capital, risk management and reporting standards. KBC’shealthy insurance business and sound capital and risk management are reflected in a Solvency II ratio of 231%at the end of 2015, clearly ranking KBC Insurance amongst the better-capitalised companies in Europe’sinsurance industry.
• When KBC agreed its strategic refocus with the European Commission in 2009, it undertook to run down or divest the activitiesof its subsidiary KBC Financial Holding Inc. (US) in order to reduce KBC's risk profile. As a final step, KBC liquidated KBCFinancial Holding Inc. This meant that the losses already booked in previous years (specifically 2008 and 2009) were taxdeductible – and for which a deferred tax asset has now been booked – since losses in paid-up capital at KBC Bank are taxdeductible for the parent company at the moment of liquidation. On balance, the post-tax impact on the result was 765 millioneuros. Initially, recognition of the deferred tax asset had only a limited positive impact of 0.2 percentage points (fully loadedCET1 ratio calculated under the Danish compromise method) on KBC’s regulatory capital.
• In the fourth quarter of 2015, impairment on goodwill was recorded, mainly for ČSOB in Slovakia (-191 million euros) and forCIBANK (-117 million euros) and DZI Insurance (-34 million euros) in Bulgaria. These impairment charges came about primarilybecause of a lower recoverable value (calculated based on discounted cash flow analysis) due mainly to higher capital targets(resulting in a higher level of required capital, which reduces the free cash flows that can be paid as dividend in the valuationmodel) and a higher discount rate (higher beta and higher market premium). This impairment had no impact on our capitalratios.
• From a macroeconomic point of view, the clear difference in fourth-quarter growth between the emerging and developedmarkets remained in place. In particular, the sustainability of Chinese economic growth was questioned by the financialmarkets. However, the strong labour market reports in the US in the fourth quarter dampened the financial markets’ fear of astrong negative spill-over from emerging markets to the developed markets. As a result, the Fed raised its policy rate by 25basis points at its December meeting. Fourth-quarter growth in the US turned out to be weaker than expected, mainly drivenby weaker consumption, investment and net exports. The euro area continued its recovery and the unemployment rate fell to10.6% at the end of 2015. The low level of inflation in the euro area, however, led the ECB to ease its monetary policy stanceagain in December when it reduced its deposit rate further to -30 basis points. Headline inflation remained below the ECB’starget of just below 2%. The main reasons for this remained the sharply falling oil price and continuing high levels ofunemployment in the euro area, which prevents meaningful wage growth. The fourth quarter ended with a renewed increasein uncertainty on the financial markets after the depreciation of the Chinese renminbi against the US dollar. Although the resultof a change of policy reference, from solely the US dollar towards a basket of currencies from China’s main trading partners,the depreciation was enough to raise doubts again about the sustainability of China’s economic growth model.
• On the corporate sustainability and responsibility front, we again took a number of initiatives. In Belgium, the Bolero crowd-funding platform won the EFMA & Accenture Innovation Award, the ‘Ready Steady Money Program’ run by K&H in Hungaryreceived the Social Investment Award MAF (Hungarian Donors Forum), ČSOB Insurance Slovakia was crowned ‘Insurer ofthe Year’ by Magazine Trend and ČSOB Private Banking in the Czech Republic was named ‘Best Private Bank’ by The Banker.In Bulgaria, the Chief Executive Officer of CIBANK was named ‘Banker of the Year’ by The Banker. In Belgium, the EMAS(European Eco Management and Audit Scheme) environmental certification was reconfirmed and KBC Securities launchedthe ‘Start it Fund’ for start-up businesses. KBC also opened a new Start it @KBC centre in the city of Kortrijk, which brings thetotal number of ‘Start it’ locations to six.

KBC Group I Extended Quarterly Report – 4Q2015 I p.8
Overview of our results and balance sheet We provide a full overview of our IFRS consolidated income statement and balance sheet in the ‘Consolidated financial statements’ section of the quarterly report. Condensed statements of comprehensive income, changes in shareholders’ equity, as well as several notes to the accounts, are also available in the same section.
Consolidated income statement, IFRS KBC Group (in millions of EUR) 4Q 2014 1Q 2015 2Q 2015 3Q 2015 4Q 2015 FY 2014 FY 2015
Net interest income 1 123 1 091 1 092 1 062 1 066 4 308 4 311 Interest income 1 982 1 850 1 804 1 770 1 725 7 893 7 150 Interest expense -860 -759 -712 -708 -659 -3 586 -2 839
Non-life insurance (before reinsurance) 123 167 155 142 147 512 611Earned premiums 322 320 326 335 338 1 266 1 319 Technical charges -200 -153 -172 -193 -191 -754 -708
Life insurance (before reinsurance) -45 -48 -51 -51 -51 -216 -201Earned premiums 343 302 265 289 445 1 247 1 301 Technical charges -388 -350 -316 -340 -496 -1 463 -1 502
Ceded reinsurance result 10 -11 -7 0 -10 16 -29
Dividend income 9 12 39 13 12 56 75
Net result from financial instruments at fair value through P&L 109 57 179 47 -68 227 214
Net realised result from available-for-sale assets 22 80 36 44 30 150 190
Net fee and commission income 410 459 465 383 371 1 573 1 678 Fee and commission income 577 632 634 547 533 2 245 2 348 Fee and commission expense -167 -174 -169 -164 -162 -672 -670
Other net income 68 49 105 96 47 94 297
Total income 1 827 1 855 2 013 1 736 1 543 6 720 7 148
Operating expenses -964 -1 125 -941 -862 -962 -3 818 -3 890
Impairment -193 -77 -149 -49 -472 -506 -747 on loans and receivables -158 -73 -138 -34 -78 -587 -323 on available-for-sale assets -14 -3 -7 -15 -21 -29 -45 on goodwill 0 0 0 0 -344 0 -344 other -21 -1 -5 0 -29 109 -34
Share in results of associated companies and joint ventures 6 6 8 6 5 25 24
Result before tax 675 659 930 831 114 2 420 2 535
Income tax expense -202 -149 -264 -231 749 -657 104
Net post-tax result from discontinued operations 0 0 0 0 0 0 0
Result after tax 473 510 666 600 863 1 763 2 639
attributable to minority interests 0 0 0 0 0 0 0
attributable to equity holders of the parent 473 510 666 600 862 1 762 2 639
of which legacy activities and own credit risk -20 - - - - 134 -
Basic earnings per share (EUR) 1.00 1.19 1.56 1.41 -0.36 3.32 3.80 Diluted earnings per share (EUR) 1.00 1.19 1.56 1.41 -0.36 3.32 3.80
IFRIC 21 (Levies) was approved by the European Union in June 2014 and became effective on 1 January 2015. The main consequence of IFRIC 21 in 2015 is that certain levies have to be recognised in advance, which adversely impacted the results for the first quarter of 2015. As IFRIC 21 needs to be applied retroactively, KBC restated the comparable quarterly figures for 2014. This relates solely to movements between quarters and does not affect the full-year figures.
Highlights of consolidated balance sheet KBC Group (in millions of EUR) 31-12-2014 31-03-2015 30-06-2015 30-09-2015 31-12-2015
Total assets 245 174 258 396 256 654 257 632 252 356 Loans and advances to customers 124 551 124 632 126 093 126 971 128 223 Securities (equity and debt instruments) 70 359 71 948 70 755 71 115 72 623 Deposits from customers and debt certificates 161 783 167 922 170 159 171 412 170 109 Technical provisions, before reinsurance 18 934 19 181 19 198 19 365 19 532 Liabilities under investment contracts, insurance 12 553 13 263 12 937 12 422 12 387 Parent shareholders’ equity 13 125 13 928 13 576 14 022 14 411 Non-voting core-capital securities 2 000 2 000 2 000 2 000 0
KBC Group I Extended Quarterly Report – 4Q2015 I p.9
Net result (in millions of EUR) Breakdown of net result for 4Q2015 (in millions of EUR)
Up to 2014, we provided not only figures according to IFRS, but also so-called ‘adjusted figures’. In these figures, we extracted the impact of legacy activities (remaining divestments and CDOs) as well as the impact of the valuation of own credit risk, and rearranged trading income under ‘Net result from financial instruments at fair value’. As these legacy activities have become immaterial (divestments have been finalised and there is no longer any exposure to CDOs) – and in order to simplify reporting – we have now stopped providing adjusted results.
The inclusion of the acquisition of Volksbank Leasing in the results is covered in the International Markets Business Unit.
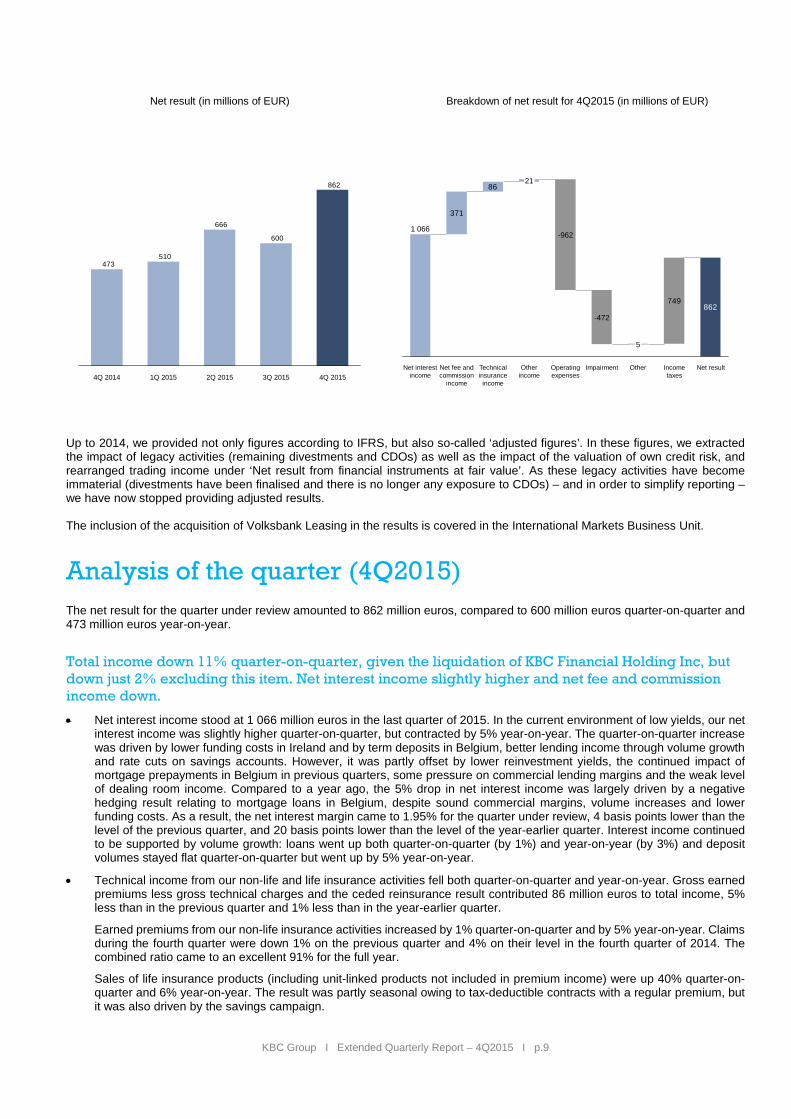
Analysis of the quarter (4Q2015) The net result for the quarter under review amounted to 862 million euros, compared to 600 million euros quarter-on-quarter and 473 million euros year-on-year.
Total income down 11% quarter-on-quarter, given the liquidation of KBC Financial Holding Inc, but down just 2% excluding this item. Net interest income slightly higher and net fee and commission income down.
• Net interest income stood at 1 066 million euros in the last quarter of 2015. In the current environment of low yields, our netinterest income was slightly higher quarter-on-quarter, but contracted by 5% year-on-year. The quarter-on-quarter increasewas driven by lower funding costs in Ireland and by term deposits in Belgium, better lending income through volume growthand rate cuts on savings accounts. However, it was partly offset by lower reinvestment yields, the continued impact ofmortgage prepayments in Belgium in previous quarters, some pressure on commercial lending margins and the weak levelof dealing room income. Compared to a year ago, the 5% drop in net interest income was largely driven by a negativehedging result relating to mortgage loans in Belgium, despite sound commercial margins, volume increases and lowerfunding costs. As a result, the net interest margin came to 1.95% for the quarter under review, 4 basis points lower than thelevel of the previous quarter, and 20 basis points lower than the level of the year-earlier quarter. Interest income continuedto be supported by volume growth: loans went up both quarter-on-quarter (by 1%) and year-on-year (by 3%) and depositvolumes stayed flat quarter-on-quarter but went up by 5% year-on-year.
• Technical income from our non-life and life insurance activities fell both quarter-on-quarter and year-on-year. Gross earnedpremiums less gross technical charges and the ceded reinsurance result contributed 86 million euros to total income, 5%less than in the previous quarter and 1% less than in the year-earlier quarter.
Earned premiums from our non-life insurance activities increased by 1% quarter-on-quarter and by 5% year-on-year. Claimsduring the fourth quarter were down 1% on the previous quarter and 4% on their level in the fourth quarter of 2014. Thecombined ratio came to an excellent 91% for the full year.
Sales of life insurance products (including unit-linked products not included in premium income) were up 40% quarter-on-quarter and 6% year-on-year. The result was partly seasonal owing to tax-deductible contracts with a regular premium, butit was also driven by the savings campaign.
862
600
666
510473
4Q 2014 1Q 2015 3Q 20152Q 2015 4Q 2015
371
86
862749
Net resultImpairment
-472
-962
Operating expenses
Income taxes
Other
5
1 066
Net interest income
Net fee and commission
income
Technical insurance
income
Other income
21

KBC Group I Extended Quarterly Report – 4Q2015 I p.10
It should be noted that, during the last quarter of 2015, investment income derived from insurance activities was down 4% on its level of the previous quarter, and down 5% on the year-earlier quarter. Both changes were driven by the lower level of net interest income caused by decreasing yields on the bond position and hedging instruments on the equity portfolio, somewhat offset by a higher realised result from available-for-sale assets.
• The investment climate has been volatile since the autumn. Despite this, new entries and a positive price performanceboosted total assets under management by 4% (to 209 billion euros) in the quarter under review. Compared to a year ago,they have increased by as much as 12%, two-thirds of which through net entries. As regards net fee and commission income, it needs to be mentioned that the sales-related increase in entry fees on investment products was offset by a lower level ofmanagement fees for mutual funds, due to a different asset allocation. This was the main reason for the decrease in our netfee and commission income, which came to 371 million euros, down 9% year-on-year and 3% quarter-on-quarter.
• The net result from financial instruments at fair value was a negative 68 million euros in the fourth quarter of 2015, comparedto a positive 47 million euros in the previous quarter and 109 million euros in the year-earlier quarter. This was triggered bythe one-off translation difference on the liquidation of KBC Financial Holding Inc. (-156 million euros). Disregarding thisimpact, fair value income increased by 87% quarter-on-quarter. To a lesser extent, the trend was influenced by a marginallyhigher valuation of derivative instruments used for asset/liability management purposes, a higher level of income generatedby the dealing rooms and a substantial positive impact of valuation adjustments (MVA/CVA/FVA) because of lower exposureand/or lower credit spreads.
• All other income items combined amounted to 89 million euros. They comprise realised gains on the sale of available-for-sale assets (30 million euros for the quarter under review), dividend income (12 million euros) and other net income (47million euros).
Continued focus on cost management: excluding special bank taxes, end-of-year operating expenses up quarter-on-quarter but down year-on-year.
• Our operating expenses amounted to 963 million euros for the fourth quarter of 2015, significantly up (12%) on their level ofthe previous quarter, but flat year-on-year. Disregarding bank taxes (49 million euros in the fourth quarter of 2015, compared to 264 million in the first quarter of 2015, 83 million euros in the second quarter of 2015, 21 million in the third quarter of2015 and 44 million euros in the fourth quarter of 2014), our operating expenses increased by 9% quarter-on-quarter but fellby 1% year-on-year. The quarter-on-quarter increase was accounted for by traditionally higher marketing expenses,professional fees and IT expenses at year end, as well as by higher pension expenses (lower interest rates) and expensesrelated to investments in financial technology. The year-on-year decrease resulted mainly from lower marketing expensesand staff expenses, somewhat mitigated by higher IT expenses.The cost/income ratio of our banking activities stood at 55% for the full year (down from 58% for 2014).
Loan impairment charges: low credit cost ratio of 0.23%
• Loan losses stood at 78 million euros, up on the quarter-earlier level of 34 million euros, but down on the level of 158 millioneuros in the fourth quarter of 2014. The quarter-on-quarter increase came about mainly because of Belgium (an increase of21 million euros to 34 million euros, specific loan files). The Czech Republic stood at 14 million euros, Hungary at a positive1 million euros, Slovakia at 9 million euros, Ireland at 16 million euros, Bulgaria at 2 million euros and the Group Centre at 4million euros. Loan loss impairment in 2015 accounted for some 0.23% the total loan portfolio.
Goodwill impairment charges: exceptional item
• Impairment on goodwill stood at an exceptionally high 344 million euros for the last quarter of 2015. Due to higher localcapital targets and a higher discount rate, an impairment on goodwill was recognised for CIBANK (117 million euros) andDZI in Bulgaria (34 million euros), for ČSOB Bank in Slovakia for the acquisition of Istrobanka in 2008 (191 million euros)and for Hypotečni Banka in the Czech Republic (2 million euros). This impairment had no impact on our capital ratios.
Tax: exceptional item
• Consequent on the liquidation of KBC Financial Holding Inc., the loss in paid-up capital at KBC Bank was tax-deductible forthe parent company at the moment of liquidation, contributing largely to a total positive income tax figure of 749 million eurosin the last quarter of 2015.
Results per business unit
• Our quarterly profit of 862 million euros breaks down into 348 million euros for the Belgium Business Unit, 119 million eurosfor the Czech Republic Business Unit, 61 million euros for the International Markets Business Unit and 334 million euros forthe Group Centre. A full results table and a short analysis per business unit is provided in the ‘Results per business unit’section of the quarterly report, while more information for each business unit is also given in the analyst presentation (bothavailable at www.kbc.com).
KBC Group I Extended Quarterly Report – 4Q2015 I p.11
Strong fundamentals even after repayment of remaining state aid: equity, solvency and liquidity
• At the end of 2015, our total equity stood at 15.8 billion euros, down 0.7 billion euros on its level at the start of the year. Thechange in total equity during the year resulted from the inclusion of the profit for 2015 (+2.6 billion euros), the payment ofdividends for 2014 and the related coupon on the remaining state aid (an aggregate -1.0 billion euros), the repayment of theremaining state aid plus penalty (-3.0 billion euros) and a number of smaller items (an aggregate +0.7 billion euros, mainlytranslation differences and remeasurements of defined benefit plans).
• Our solvency ratios comfortably passed the newly installed regulators’ joint solvency test for 2016 (a minimum 10.25%, BaselIII, phased-in under the Danish compromise). At 31 December 2015, the group’s common equity ratio (Basel III, phased-inunder the Danish compromise) stood at a strong 15.2%. The fully loaded figure is 14.9%. The leverage ratio for the group(Basel III, fully loaded) stood at 6.3%. The solvency ratio for KBC Insurance was an excellent 289% under the Solvency Iframework at 31 December 2015 and an equally excellent 231% under the Solvency II framework (which came into force on1 January 2016).
• The group’s liquidity position remained at an excellent level, as reflected in an LCR ratio of 127% and an NSFR ratio of 121%at the end of the fourth quarter of 2015.
Analysis of full year 2015 Note: the year-on-year performance was partly affected by the deconsolidation of KBC Bank Deutschland and by a number of other minor changes. These items will be disregarded to enable a meaningful comparison to be made (‘on a comparable basis’).
Note: the first-time inclusion of the acquisition of Volksbank Leasing in the results is covered in the International Markets Business Unit.
Our aggregate result for the year came to 2 639 million euros, compared to 1 762 million euros a year earlier.
Compared to 2014, the result for 2015 was characterised by:
• Higher net interest income of 4 311 million euros (+1% on a comparable basis), thanks to substantially lower (subordinated)funding costs, as well as wider margins on loans and lower rates on deposits, all of which was mitigated somewhat by losseson prepaid mortgages in Belgium. Volumes increased for deposits (+5%) and lending (+3%).
• A higher contribution by technical insurance results (gross earned premiums less gross technical charges and the cededreinsurance result: up 22% to 381 million euros). In non-life insurance, earned premiums went up by 4% while the year-to-date combined ratio stood at an excellent 91%. In life insurance, earned premium fell by 7%
• A strong increase in asset management activity leading to higher net fee and commission income (+7% on a comparablebasis, up to 1 678 million euros), especially in the first half of the year. At the end of December 2015, assets undermanagement stood at 209 billion euros, a year-on-year increase of 12%, 8% due to net entries and 4% to the priceperformance.
• The net result from financial instruments at fair value amounted to 214 million euros in 2015, 5% lower than the 2014 figureon a comparable basis. This item was severely impacted by one-off translation differences on the liquidation of KBC Financial Holding Inc. (-156 million euros), as well as negative value adjustments on the MVA/CVA/FVA items, though mitigated bypositive valuation differences on ALM derivatives (101 million euros, over 300 million euros more than the 2014 figure forthis item).
• An increase in the following other income items: net realised gains from available-for-sale assets came to 190 million euros(+26%) on a comparable basis, dividend income to 75 million euros (+35%) and other net income to 297 million euros (up180 million euros on 2014, which had been affected by 231 million euros of provisioning for the new Hungarian act on retailloans).
• Higher operating expenses (+3% on a comparable basis, up to 3 890 million euros), owing essentially to higher special banktaxes (+23%). Excluding these taxes, operating expenses were only slightly up (+2% on a comparable basis), primarilybecause of higher pension expenses and expenses related to investments in further digitalisation. As a result, the year-to-date cost/income ratio stood at 55%.
• Lower loan losses (-44% on a comparable basis, to 323 million euros). The improvement was most pronounced in Ireland(150 million euros less). As a result, the annualised credit cost ratio for the whole group stood at a satisfying 0.23%.
• The liquidation of KBC Financial Holding Inc., which meant the loss in paid-up capital at KBC Bank was tax-deductible forthe parent company at the moment of liquidation, generated a total income tax figure under IFRS of +104 million euros for2015, as opposed to -654 million euros for 2014, on a comparable basis.
• For impairment on other items, it is worth mentioning that, due to higher local capital targets and a higher discount rate,impairment on goodwill was recognised for a number of entities, including CIBANK in Bulgaria (117 million euros) and ČSOBBank in Slovakia for the acquisition of Istrobanka in 2008 (191 million euros). This impairment had no impact on our capital.

KBC Group I Extended Quarterly Report – 4Q2015 I p.12
Selected ratios for the KBC group (consolidated) FY2014 FY2015 Profitability and efficiency
Return on equity* 14% 22% Cost/income ratio, banking 58% 55% Combined ratio, non-life insurance 94% 91%
Solvency
Common equity ratio according to Basel III (fully loaded) 14.3% 14.9% Common equity ratio according to Basel III (phased-in)) 14.4% 15.2% Common equity ratio according to FICOD method (fully loaded) 14.6% 14.6% Leverage ratio according to Basel III (fully loaded) 6.4% 6.3%
Credit risk
Credit cost ratio 0.42% 0.23% Impaired loans ratio 9.9% 8.6% for loans more than 90 days overdue 5.5% 4.8%
Liquidity
Net stable funding ratio (NSFR) 123% 121% Liquidity coverage ratio (LCR) 120% 127%
* If a coupon is paid on the core-capital securities sold to the Flemish Regional Government and/or on the additional tier-1 instruments included in equity, it will be deducted from the numerator (pro rata).
Statement of risk • As we are mainly active in banking, insurance and asset management, we are exposed to a number of typical risks for these
financial sectors such as – but not limited to – credit default risk, counterparty credit risk, concentration risk, movements ininterest rates, currency risk, liquidity and funding risk, insurance underwriting risk, changes in regulations, operational risk,customer litigation, competition from other and new players, as well as the economy in general. Although KBC closelymonitors and manages each of these risks within a strict risk framework containing governance and limits, they may all havea negative impact on asset values or could generate additional charges beyond anticipated levels.
• At present, a number of items are considered to constitute the main challenges for the financial sector in general and, as aconsequence, are also relevant to KBC. Increasing capital requirements are a dominant theme for the sector and regulatoryinitiatives are expected on such topics as risk models, floors on risk weighted assets, systemic and other capital buffers andminimum requirement of eligible liabilities and own funds (MREL). Besides these factors, the low interest rate environmentremains a continuing challenge. If low rates were to be sustained, this would put material pressure on the long-termprofitability of banks and especially insurers. Finally, operational risk and particularly cyber risk have become one of the mainthreats during the past few years, not just for the financial sector, but for the economy as a whole.
• Risk management data are provided in our annual reports, extended quarterly reports and dedicated risk reports, all of whichare available at www.kbc.com.
• So far in 2016, uncertainty on the financial markets, stock market corrections and falling benchmark bond yields havecontinued. In January, the price of Brent oil temporarily fell below 30 US dollar per barrel, driving inflation to lower-than-anticipated levels. The ECB is therefore likely to ease its policy stance further, most likely by cutting its deposit rate again.On the other hand, the Fed is likely to continue cautiously following its rate normalisation path in 2016. This divergencebetween Fed and ECB policy will probably weaken the euro somewhat against the US dollar in 2016.
• Low inflation, accommodating monetary policy and fears of a global slowdown in growth mean that bond yields will remainlow during 2016. They will only rise very gradually once the unemployment rate in the euro area has fallen enough to generate sustainable wage increases and the effect of the sharp fall in oil prices starts to drop out of the annual inflation rate. Weexpect the oil price to gradually rise again in the second half of 2016. Despite the expected continued turbulence in emergingmarkets, we expect 2016 to be a year of sustained economic growth in both the euro area and the US, with a growth ratebroadly similar to that in 2015. This growth will be driven mainly by domestic demand against the background of the expected weak contribution from international trade.

KBC Group I Extended Quarterly Report – 4Q2015 I p.13
Additional information• Our auditor has confirmed that its audit procedures for the consolidated financial statements, prepared in accordance
with the International Financial Reporting Standards as adopted in the European Union, are substantially completed and that they have not revealed any material modification that would have to be made to the accounting information derived from the consolidated financial statements and included in this earnings statement.
• It will be proposed to the Annual General Meeting of Shareholders that no dividend for financial year 2015 be paid in 2016.
• Financial calendar:o 31 March 2016: 2015 Annual Report and 2015 Risk Reporto 4 May 2016: Annual General Meetingo 12 May 2016: Publication of 1Q 2016 resultso 11 August 2016: Publication of 2Q 2016 resultso 17 November 2016: Publication of 3Q 2016 resultso 9 February 2017: Publication of 4Q 2016 results

KBC Group I Extended Quarterly Report – 4Q2015 I p.14
resuness uni
Unless otherwise stated, all amounts are given in euros.

KBC Group I Extended Quarterly Report – 4Q2015 I p.15
Business unit overview Our segments or business units In our segment reporting presentation, the segments (or business units) are: • the Belgium Business Unit: this unit includes the activities of KBC Bank NV and KBC Insurance NV, as well as their
Belgian subsidiaries (CBC Banque, KBC Asset Management, KBC Lease Group, KBC Securities, KBC Group Re, etc.).
• the Czech Republic Business Unit: this unit groups together all of KBC's activities in the Czech Republic. It encompasses the ČSOB group (operating mainly under the brands ČSOB, Era, Postal Savings Bank, Hypotečni banka and ČMSS), the insurance company ČSOB Pojišt’ovna, ČSOB Asset Management and Patria.
• the International Markets Business Unit: this unit includes primarily the activities in the other (i.e. non-Czech) Central and Eastern European core markets (ČSOB Bank and ČSOB Poist’ovňa in Slovakia, K&H Bank and K&H Insurance in Hungary, and CIBANK and DZI Insurance in Bulgaria), plus KBC Bank Ireland.
• the Group Centre: this entity includes the operating expenses of the group’s holding-company activities, certain capital and liquidity management-related costs, costs related to the holding of participations, the results of the companies or activities that are earmarked for divestment or are in run-down, and the elimination of inter-segment transactions. It also includes the results of legacy businesses (CDOs & divestment results – both immaterial as of 2015) and the valuation of own credit risk.

KBC Group I Extended Quarterly Report – 4Q2015 I p.16
Belgium Business Unit • The net result amounted to 348 million in 4Q2015, slightly below the 358 million recorded in the previous quarter (due mainly to
lower net fee and commission income, lower net other income and higher impairment charges and operating expenses, but a higher net result from financial instruments at fair value and an almost flat net interest income). Net result was down on the 415 million in the year-earlier quarter.
• Compared to the previous quarter, total income in 4Q2015 went up (+31 million or +3%). Net interest income stabilised, since decreasing transformation yields and increased hedging losses on previously refinanced mortgages were offset by an external rate cut and lower funding costs. As expected, net fee and commission income decreased (-17 million or by -6%) since management fees on mutual funds decreased on their level in 3Q2015 (due mainly to the impact of c h a n g e s t o t h e asset mix in the CPPI portfolio during 3Q2015) after the exceptionally strong 1Q2015 and 2Q2015. Trading and fair value income was up significantly (+83 million) due mainly to a positive CVA and FVA impact and a better dealing room performance, along with slightly positive valuation differences on ALM derivatives. Other net income was down somewhat (-14 million or -25%), returning to its normal run rate after higher levels in 2Q2015 and 3Q2015. Dividend income came to 9 million. Gains realised on the sale of bonds and shares dropped by 8 million (-22%) given the high level realisations at KBC Insurance and KBC Group Re in 1H2015. Finally, the lack of end-of-year storms meant that the technical income from our non-life insurance activities remained roughly at the previous quarter’s level (earned premiums minus technical charges, excluding ceded reinsurance: +1 million compared to 3Q2015), while end-of-year seasonal effects enabled sales of life insurance products to recover from their low level in the previous quarter due to the low yield environment (sales up by 52% on their 3Q2015 level), offset by an increase in technical charges.
• Volume growth was a mixed bag in 4Q2015. The loan book on our balance sheet expanded by 1% quarter-on-quarter (to 88 billion), while customer deposits decreased by 1% (to 111 billion; further growth in current and saving accounts was more than offset by maturing expensive term deposits). There was a 2.6% net inflow of assets under management (due to balanced products and private mandates, among other things), and a positive price effect of 2% (aggregate net impact of +5%, to 194 billion). Life reserves in Belgium stood at 27 billion, up 0.5% on the previous quarter’s level.
• Costs were up on the previous quarter (+14 million or +3%), due to increased bank taxes. Excluding bank taxes operational expenses were roughly flat with higher pension costs and seasonal effects (higher marketing expenses and professional fees offset by lower ICT and facility expenses). The resulting cost/income ratio for 4Q2015 stood at a very good 50% (FY2015: 50%) and the combined ratio for the non-life insurance activities at an excellent 98% (FY2015: 90%).
• Loan loss impairment remained structurally low in the quarter under review, though up (+21 million or +84%) on the extremely low figure recorded in the previous quarter, driven by higher impairment charges in foreign branches. Overall, this resulted in a fine credit cost ratio of 0.19% year-to-date. Impaired loans accounted for some 4% of the loan book at the end of December 2015.
Belgium Business Unit (in millions of EUR) 4Q2014 1Q2015 2Q2015 3Q2015 4Q2015
Net interest income 762 714 720 694 691 Non-life insurance (before reinsurance) 77 131 121 103 104
Earned premiums 243 243 247 250 250 Technical charges -166 -111 -126 -146 -146
Life insurance (before reinsurance) -56 -58 -60 -62 -63 Earned premiums 287 248 206 187 329 Technical charges -343 -306 -266 -249 -391
Ceded reinsurance result 16 -7 -6 1 -8 Dividend income 8 11 34 11 9 Net result from financial instr. at fair value through P/L 70 7 136 -32 51 Net realised result from available-for-sale assets 20 52 38 33 26 Net fee and commission income 301 360 363 287 270 Other net income 65 45 67 55 41 Total income 1 263 1 255 1 412 1 090 1 121 Operating expenses -573 -695 -584 -540 -554 Impairment -96 -65 -77 -28 -52
on loans and receivables -73 -62 -67 -13 -34 on available-for-sale assets -14 -3 -3 -15 -18 on goodwill 0 0 0 0 0 Other -8 0 -6 0 0
Share in results of associated companies & joint ventures 0 -1 0 0 0 Result before tax 594 494 751 522 515 Income tax expense -179 -164 -223 -164 -166 Result after tax 415 330 528 358 349
attributable to minority interests 0 0 0 0 0 attributable to equity holders of the parent 414 330 528 358 348
Banking 356 212 429 300 288 Insurance 58 117 99 58 60
Risk-weighted assets, banking (end of period, Basel III) 42 919 44 310 40 262 40 582 42 157 Required capital, insurance (end of period, Solvency I) 868 866 872 884 891 Allocated capital (end of period) 6 026 6 168 5 753 5 808 5985 Return on allocated capital (ROAC) 28% 22% 35% 25% 24% Cost/income ratio, banking 46% 61% 42% 51% 50% Combined ratio, non-life insurance 100% 79% 89% 95% 98% Net interest margin, banking 2.07% 1.96% 1.96% 1.86% 1.85%
Since 1Q2015, the 2014 reference figures for operating expenses (and resulting (sub-)totals and ratios) have been restated due to the application of IFRIC 21 (Levies).

KBC Group I Extended Quarterly Report – 4Q2015 I p.17
Czech Republic Business Unit • The net result amounted to 119 million in 4Q2015, down on the excellent 153 million recorded in the previous quarter and also
slightly down on the 121 million in the year-earlier quarter. • Compared to the previous quarter, total income remained more or less stable in 4Q2015 (-1 million). Quarter-on-quarter changes
were very limited and mainly consisted of a higher net fee and commission income (+3 million or +6%) thanks to seasonal high payment service fees, which partially offset a decrease in net interest income (-5 million or -2%). Net interest income was down due to lower reinvestment yields, despite good loan growth, decreasing lending income (pressure on margins despite widening margins on new production mortgages) and lower dealing room income. Insurance activities slightly increased their contribution to income growth: the technical non-life insurance result went up (premiums minus charges and the effect of reinsurance: +1 million or +6% versus 3Q2015) and life insurance sales were also up on their 2Q2015 level (+19 million, +25%) thanks to the increased sales of unit-linked products.
• Generally speaking, 4Q2015 was another quarter of good volume growth. The loan book on our balance sheet expanded by 2% quarter-on-quarter (to 18 billion) primarily in the mortgage segment, while customer deposits also went up (+3% to 24 billion). Assets under management increased too, by 4% to 8.8 billion, thanks to net inflows (especially CPPI and balanced funds) and a positive price effect. Life reserves stood at 1.0 billion, up 7% on their level at the end of the previous quarter.
• Costs were up on the previous quarter (+26 million or +19%), due chiefly to the impact of two one-off items: a provision for restructuring charges and a software impairment file. Excluding these items, costs were typically high in 4Q2015 on account of marketing and ICT expenses, professional fees and bank tax. The resulting cost/income ratio for 4Q2015 stood at a good 52% (FY2015: 48%), while the non-life insurance combined ratio for the same quarter amounted to 92% (FY2015: 94%).
• Loan loss impairment in 4Q2015 remained at a low level, though it was up on the figure for 3Q2015 (+16 million) mainly in the SME book. The credit cost ratio for FY2015 accordingly amounted to an excellent 0.18%. Impaired loans accounted for some 3.4% of the loan book at the end of December 2015.
Czech Republic Business Unit (in millions of EUR) 4Q2014 1Q2015 2Q2015 3Q2015 4Q2015 Net interest income 211 212 208 215 210 Non-life insurance (before reinsurance) 21 18 19 21 23
Earned premiums 43 41 44 45 47 Technical charges -22 -23 -25 -24 -24
Life insurance (before reinsurance) 7 6 6 7 7 Earned premiums 37 30 41 76 95 Technical charges -30 -25 -34 -69 -88
Ceded reinsurance result -2 -2 -1 -2 -3 Dividend income 0 0 0 0 0 Net result from financial instr. at fair value through P/L 18 26 20 26 26 Net realised result from available-for-sale assets 1 12 0 0 0 Net fee and commission income 51 50 50 49 52 Other net income 6 5 7 5 6 Total income 313 325 310 322 320 Operating expenses -156 -161 -150 -140 -166 Impairment -19 -2 -15 -4 -20
on loans and receivables -16 -2 -16 -5 -14 on available-for-sale assets 0 0 0 0 -4 on goodwill 0 0 0 0 -2 Other -2 0 0 0 0
Share in results of associated companies & joint ventures 5 6 7 5 4 Result before tax 143 169 151 183 138 Income tax expense -23 -25 -24 -30 -19 Result after tax 121 143 127 153 119
attributable to minority interests 0 0 0 0 000 attributable to equity holders of the parent 121 143 127 153 119
Banking 113 138 121 144 113 Insurance 8 6 6 8 6
Risk-weighted assets, banking (end of period, Basel III) 12 345 13 120 13 032 12 902 12 919 Required capital, insurance (end of period, Solvency I) 67 62 69 70 72 Allocated capital (end of period) 1 414 1 486 1 489 1 478 1482 Return on allocated capital (ROAC) 34% 40% 35% 40% 32% Cost/income ratio, banking 49% 49% 48% 43% 52% Combined ratio, non-life insurance 94% 96% 94% 93% 92% Net interest margin, banking 3.11% 3.16% 3.00% 3.01% 2.95%
Since 1Q2015, the 2014 reference figures for operating expenses (and resulting (sub)totals and ratios) have been adjusted due to the application of IFRIC 21 (Levies).

KBC Group I Extended Quarterly Report – 4Q2015 I p.18
International Markets Business Unit • The net result amounted to 61 million in 4Q2015, down on the 92 million recorded in the previous quarter and up on the -7
million posted in the year-earlier quarter. • Compared to the previous quarter, total income decreased (-15 million or -5%). Net interest income went up (+1 million), due
to lower allocated liquidity and funding costs in Ireland. Net fee and commission income came in flat quarter-on-quarter (up on the back of transactional income and banking services in Hungary and increasing lending volumes in Slovakia, but down in Ireland, Bulgaria and Slovakia). The net result from financial instruments decreased (-3 million or -18% compared to 3Q2015) due to the negative movement in the marked-to-market value of derivatives used for asset/liability management purposes. The technical non-life insurance result (earned premiums minus technical charges, including the impact of ceded reinsurance) went up (+2 million on its 3Q2015 level, with the increase mainly in motor and household insurance in Bulgaria and Slovakia), whereas sales of life insurance products fell by 14% due to lower unit-linked single premiums in Slovakia and decreasing guaranteed-interest products in Bulgaria (after a strong performance in 3Q2015). Finally, other net income fell significantly (-14 million), since the previous quarter included a positive impact related to a settlement in the K&H Equities fraud case and a partial release of the Curia provision in Hungary, as well as the release of provisions for a legal case in Slovakia following a positive ruling.
• The overall loan book on our balance sheet was virtually unchanged quarter-on-quarter (with growth in Slovakia and Bulgaria, but a slight contraction in Ireland and Hungary), and customer deposits increased by 4% (to 17 billion, with growth in all countries). Assets under management fell (by 3% to 6.2 billion), due to a combination of a slight price increase and a decline in net entries. Life reserves stood at 0.6 billion, up 1% on the previous quarter.
• Costs in the fourth quarter were up on the previous quarter (+13 million, or +8%, due mainly to bank taxes, higher end-of-year staff and ICT expenses in Hungary and increased general administration expenses and bank levies in Ireland. The resulting cost/income ratio for the entire business unit stood at 65% for 4Q2015 (FY2015: 66%), while the combined ratio for the non-life insurance activities amounted to 97% for the same period (FY2015: 95%).
• Loan loss impairment increased somewhat in the quarter under review (+16 million) compared to 3Q2015, with impairments up in all countries (except Bulgaria) due to typical end-of-year seasonal effects. For the business unit as a whole, this resulted in a good credit cost ratio of 0.32% for FY2015. Impaired loans accounted for a high 30% of the loan book at the end of December 2015 (due to Ireland).
• The net result of the International Markets Business Unit breaks down as follows: 14 million for Slovakia, 42 million for Hungary, 3 million for Bulgaria and 3 million for Ireland. A results table and brief comments for each country are provided on the following pages.
International Markets Business Unit (in millions of EUR) 4Q2014 1Q2015 2Q2015 3Q2015 4Q2015 Net interest income 169 172 178 180 181 Non-life insurance (before reinsurance) 22 20 17 21 23
Earned premiums 39 39 41 43 46 Technical charges -18 -20 -24 -22 -23
Life insurance (before reinsurance) 4 4 3 5 5 Earned premiums 19 23 19 27 21 Technical charges -15 -19 -16 -22 -16
Ceded reinsurance result -2 -2 -2 -1 -2 Dividend income 0 0 0 0 0 Net result from financial instr. at fair value through P/L 14 27 12 20 16 Net realised result from available-for-sale assets 1 2 4 -1 0 Net fee and commission income 54 50 53 51 51 Other net income -3 17 10 19 5 Total income 258 291 277 294 279 Operating expenses -191 -226 -170 -171 -184 Impairment -72 -16 -28 -12 -28
on loans and receivables -62 -16 -29 -12 -26 on available-for-sale assets 0 0 0 0 0 on goodwill 0 0 0 0 0 other -10 0 1 0 -3
Share in results of associated companies & joint ventures 0 0 0 0 0 Result before tax -5 49 79 111 66 Income tax expense -2 -25 -11 -18 -5 Result after tax -7 24 68 92 61
attributable to minority interests 0 0 0 0 0 attributable to equity holders of the parent -7 24 68 92 61
Banking -12 18 63 86 58 Insurance 5 6 5 6 3
Risk-weighted assets, banking (end of period, Basel III) 18 425 18 833 18 467 18 627 19 424 Required capital, insurance (end of period, Solvency I) 44 44 45 46 48 Allocated capital (end of period) 2 011 2 054 2 018 2 037 2 123 Return on allocated capital (ROAC) -1% 5% 13% 18% 11.9% Cost/income ratio, banking 74% 79% 61% 58% 65% Combined ratio, non-life insurance 94% 88% 103% 94% 97% Net interest margin, banking 2.44% 2.53% 2.60% 2.56% 2.50%
Since 1Q2015, the 2014 reference figures for operating expenses (and resulting (sub)totals and ratios) have been adjusted due to the application of IFRIC 21 (Levies).

KBC Group I Extended Quarterly Report – 4Q2015 I p.19
Ireland
• The net result amounted to 3 million in 4Q2015, down from the 10 million recorded in the previous quarter and well up on the -45 million in the year-earlier quarter.
• Compared to the previous quarter, total income in 4Q2015 remained flat. Higher net interest income, with continued lower allocated liquidity and funding costs being offset by slightly lower ALM derivatives and higher net fee and commission income paid.
• The deleveraging of the Irish loan book on our balance sheet continued. It declined by 1% quarter-on-quarter (to 11.3 billion), due to the further contraction of the corporate book and reduction of the impaired mortgage book, partly offset by new mortgage volumes. Customer deposits (retail and corporate) continued to rise, going up by 1% on their level in the previous quarter (to 5.1 billion).
• Costs in the fourth quarter were up due to higher professional fees and bank levies (+3 million or +8% versus 3Q2015). The resulting cost/income ratio for 4Q2015 stood at 76% (FY2015: 75%).
• Loan loss impairment was up (+6 million on its 3Q2015 level) driven by model adjustments. Nevertheless, the credit cost ratio for FY2015 remained low at 0.34%. Impaired loans still accounted for a high but decreasing 47% of the loan book at the end of December 2015.
Ireland (in millions of EUR) 4Q2014 1Q2015 2Q2015 3Q2015 4Q2015 Net interest income 41 46 53 51 53 Non-life insurance (before reinsurance) 0 0 0 0 0
Earned premiums 0 0 0 0 0 Technical charges 0 0 0 0 0
Life insurance (before reinsurance) 0 0 0 0 0 Earned premiums 0 0 0 0 0 Technical charges 0 0 0 0 0
Ceded reinsurance result 0 0 0 0 0 Dividend income 0 0 0 0 0 Net result from financial instr. at fair value through P/L 2 0 -6 3 1 Net realised result from available-for-sale assets 0 0 1 0 0 Net fee and commission income -1 -1 0 0 -2 Other net income -2 0 0 0 0 Total income 40 44 48 53 53 Operating expenses -37 -39 -35 -36 -39 Impairment -51 -7 -16 -9 -16
on loans and receivables -41 -7 -16 -9 -16 on available-for-sale assets 0 0 0 0 0 on goodwill 0 0 0 0 0 Other -9 0 0 0 0
Share in results of associated companies & joint ventures 0 0 0 0 0 Result before tax -48 -2 -3 8 -2 Income tax expense 3 0 5 2 5 Result after tax -45 -2 2 10 3
attributable to minority interests 0 0 0 0 0 attributable to equity holders of the parent -45 -2 2 10 3
Banking -45 -2 2 10 3 Insurance 0 0 0 0 0
Risk-weighted assets, banking (end of period, Basel III) 6 931 6 800 6 727 7 029 7 449 Required capital, insurance (end of period, Solvency I) - - - - - Allocated capital (end of period) 728 714 706 738 782 Return on allocated capital (ROAC) -30% -1% 1% 5% 1.7% Cost/income ratio, banking 94% 87% 74% 68% 76.5% Combined ratio, non-life insurance - - - - -
Since 1Q2015, the 2014 reference figures for operating expenses (and resulting (sub)totals and ratios) have been adjusted due to the application of IFRIC 21 (Levies).
KBC Group I Extended Quarterly Report – 4Q2015 I p.20
Hungary
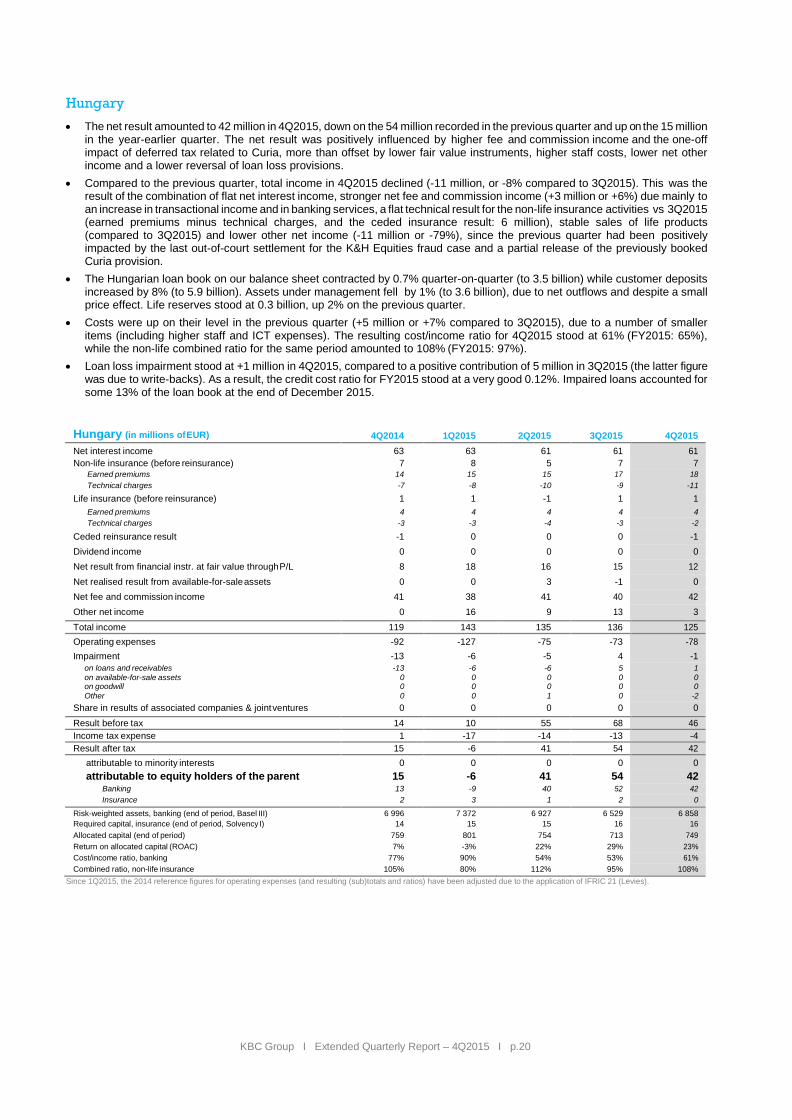
• The net result amounted to 42 million in 4Q2015, down on the 54 million recorded in the previous quarter and up on the 15 millionin the year-earlier quarter. The net result was positively influenced by higher fee and commission income and the one-offimpact of deferred tax related to Curia, more than offset by lower fair value instruments, higher staff costs, lower net otherincome and a lower reversal of loan loss provisions.
• Compared to the previous quarter, total income in 4Q2015 declined (-11 million, or -8% compared to 3Q2015). This was theresult of the combination of flat net interest income, stronger net fee and commission income (+3 million or +6%) due mainly toan increase in transactional income and in banking services, a flat technical result for the non-life insurance activities vs 3Q2015(earned premiums minus technical charges, and the ceded insurance result: 6 million), stable sales of life products(compared to 3Q2015) and lower other net income (-11 million or -79%), since the previous quarter had been positivelyimpacted by the last out-of-court settlement for the K&H Equities fraud case and a partial release of the previously bookedCuria provision.
• The Hungarian loan book on our balance sheet contracted by 0.7% quarter-on-quarter (to 3.5 billion) while customer depositsincreased by 8% (to 5.9 billion). Assets under management fell by 1% (to 3.6 billion), due to net outflows and despite a smallprice effect. Life reserves stood at 0.3 billion, up 2% on the previous quarter.
• Costs were up on their level in the previous quarter (+5 million or +7% compared to 3Q2015), due to a number of smalleritems (including higher staff and ICT expenses). The resulting cost/income ratio for 4Q2015 stood at 61% (FY2015: 65%),while the non-life combined ratio for the same period amounted to 108% (FY2015: 97%).
• Loan loss impairment stood at +1 million in 4Q2015, compared to a positive contribution of 5 million in 3Q2015 (the latter figurewas due to write-backs). As a result, the credit cost ratio for FY2015 stood at a very good 0.12%. Impaired loans accounted forsome 13% of the loan book at the end of December 2015.
Hungary (in millions of EUR) 4Q2014 1Q2015 2Q2015 3Q2015 4Q2015 Net interest income 63 63 61 61 61 Non-life insurance (before reinsurance) 7 8 5 7 7
Earned premiums 14 15 15 17 18 Technical charges -7 -8 -10 -9 -11
Life insurance (before reinsurance) 1 1 -1 1 1 Earned premiums 4 4 4 4 4 Technical charges -3 -3 -4 -3 -2
Ceded reinsurance result -1 0 0 0 -1 Dividend income 0 0 0 0 0Net result from financial instr. at fair value through P/L 8 18 16 15 12Net realised result from available-for-sale assets 0 0 3 -1 0Net fee and commission income 41 38 41 40 42Other net income 0 16 9 13 3Total income 119 143 135 136 125 Operating expenses -92 -127 -75 -73 -78Impairment -13 -6 -5 4 -1
on loans and receivables -13 -6 -6 5 1on available-for-sale assets 0 0 0 0 0on goodwill 0 0 0 0 0Other 0 0 1 0 -2
Share in results of associated companies & joint ventures 0 0 0 0 0 Result before tax 14 10 55 68 46 Income tax expense 1 -17 -14 -13 -4 Result after tax 15 -6 41 54 42
attributable to minority interests 0 0 0 0 0 attributable to equity holders of the parent 15 -6 41 54 42
Banking 13 -9 40 52 42 Insurance 2 3 1 2 0
Risk-weighted assets, banking (end of period, Basel III) 6 996 7 372 6 927 6 529 6 858 Required capital, insurance (end of period, Solvency I) 14 15 15 16 16 Allocated capital (end of period) 759 801 754 713 749 Return on allocated capital (ROAC) 7% -3% 22% 29% 23% Cost/income ratio, banking 77% 90% 54% 53% 61% Combined ratio, non-life insurance 105% 80% 112% 95% 108%
Since 1Q2015, the 2014 reference figures for operating expenses (and resulting (sub)totals and ratios) have been adjusted due to the application of IFRIC 21 (Levies).
KBC Group I Extended Quarterly Report – 4Q2015 I p.21
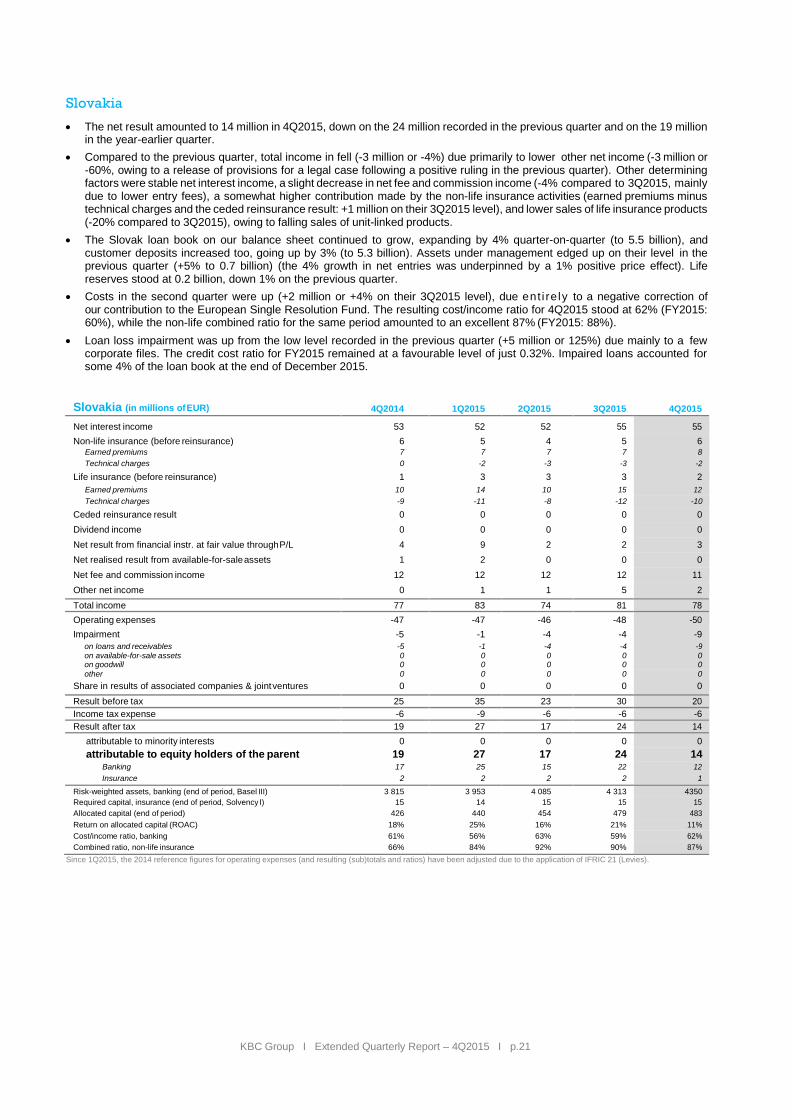
Slovakia
• The net result amounted to 14 million in 4Q2015, down on the 24 million recorded in the previous quarter and on the 19 millionin the year-earlier quarter.
• Compared to the previous quarter, total income in fell (-3 million or -4%) due primarily to lower other net income (-3 million or-60%, owing to a release of provisions for a legal case following a positive ruling in the previous quarter). Other determiningfactors were stable net interest income, a slight decrease in net fee and commission income (-4% compared to 3Q2015, mainlydue to lower entry fees), a somewhat higher contribution made by the non-life insurance activities (earned premiums minustechnical charges and the ceded reinsurance result: +1 million on their 3Q2015 level), and lower sales of life insurance products(-20% compared to 3Q2015), owing to falling sales of unit-linked products.
• The Slovak loan book on our balance sheet continued to grow, expanding by 4% quarter-on-quarter (to 5.5 billion), andcustomer deposits increased too, going up by 3% (to 5.3 billion). Assets under management edged up on their level in theprevious quarter (+5% to 0.7 billion) (the 4% growth in net entries was underpinned by a 1% positive price effect). Lifereserves stood at 0.2 billion, down 1% on the previous quarter.
• Costs in the second quarter were up (+2 million or +4% on their 3Q2015 level), due ent i re ly to a negative correction ofour contribution to the European Single Resolution Fund. The resulting cost/income ratio for 4Q2015 stood at 62% (FY2015:60%), while the non-life combined ratio for the same period amounted to an excellent 87% (FY2015: 88%).
• Loan loss impairment was up from the low level recorded in the previous quarter (+5 million or 125%) due mainly to a fewcorporate files. The credit cost ratio for FY2015 remained at a favourable level of just 0.32%. Impaired loans accounted forsome 4% of the loan book at the end of December 2015.
Slovakia (in millions of EUR) 4Q2014 1Q2015 2Q2015 3Q2015 4Q2015
Net interest income 53 52 52 55 55 Non-life insurance (before reinsurance) 6 5 4 5 6
Earned premiums 7 7 7 7 8 Technical charges 0 -2 -3 -3 -2
Life insurance (before reinsurance) 1 3 3 3 2 Earned premiums 10 14 10 15 12 Technical charges -9 -11 -8 -12 -10
Ceded reinsurance result 0 0 0 0 0 Dividend income 0 0 0 0 0 Net result from financial instr. at fair value through P/L 4 9 2 2 3 Net realised result from available-for-sale assets 1 2 0 0 0 Net fee and commission income 12 12 12 12 11Other net income 0 1 1 5 2 Total income 77 83 74 81 78 Operating expenses -47 -47 -46 -48 -50Impairment -5 -1 -4 -4 -9
on loans and receivables -5 -1 -4 -4 -9on available-for-sale assets 0 0 0 0 0on goodwill 0 0 0 0 0other 0 0 0 0 0
Share in results of associated companies & joint ventures 0 0 0 0 0 Result before tax 25 35 23 30 20 Income tax expense -6 -9 -6 -6 -6 Result after tax 19 27 17 24 14
attributable to minority interests 0 0 0 0 0 attributable to equity holders of the parent 19 27 17 24 14
Banking 17 25 15 22 12 Insurance 2 2 2 2 1
Risk-weighted assets, banking (end of period, Basel III) 3 815 3 953 4 085 4 313 4350 Required capital, insurance (end of period, Solvency I) 15 14 15 15 15 Allocated capital (end of period) 426 440 454 479 483 Return on allocated capital (ROAC) 18% 25% 16% 21% 11% Cost/income ratio, banking 61% 56% 63% 59% 62% Combined ratio, non-life insurance 66% 84% 92% 90% 87%
Since 1Q2015, the 2014 reference figures for operating expenses (and resulting (sub)totals and ratios) have been adjusted due to the application of IFRIC 21 (Levies).

KBC Group I Extended Quarterly Report – 4Q2015 I p.22
Bulgaria
• The net result amounted to 3 million in 4Q2015, down on the 4 million registered in the previous and year-earlier quarters. • Compared to the previous quarter, total income in 4Q2015 was flat. • The Bulgarian loan book on our balance sheet grew by 3% quarter-on-quarter (to 0.7 billion), and customer deposits increased
by 4% (to 0.7 billion). Life reserves stood at 0.04 billion, down 3% on the previous quarter. • Non-life insurance result went up (+1 million or +12%) whilst sales of life insurance products fell (-3 million or -37%). • Costs in the fourth quarter edged up (+2 million or +18% on their 3Q2015 level) because of the bank tax and end-of-year costs.
The resulting cost/income ratio for 4Q2015 stood at 74% (FY2015: 65%), while the combined ratio for the non-life insurance activities for the same period amounted to 92% (FY2015: 97%).
• Loan loss impairment in 4Q2015 was down on the level recorded in the previous quarter (-1 million or -31%). The credit cost ratio for FY2015 stood at 1.21%. Impaired loans accounted for some 23% of the loan book at the end of December 2015.
Bulgaria (in millions of EUR) 4Q2014 1Q2015 2Q2015 3Q2015 4Q2015
Net interest income 12 11 12 12 12 Non-life insurance (before reinsurance) 8 8 8 9 10
Earned premiums 18 17 19 19 20 Technical charges -10 -10 -11 -10 -11
Life insurance (before reinsurance) 1 1 1 1 1 Earned premiums 5 6 5 8 5 Technical charges -4 -5 -4 -7 -4
Ceded reinsurance result 0 -1 -1 0 0 Dividend income 0 0 0 0 0 Net result from financial instr. at fair value through P/L 0 1 0 0 0 Net realised result from available-for-sale assets 0 0 1 0 0 Net fee and commission income 0 0 -1 0 -1 Other net income 0 0 0 0 0 Total income 21 19 20 22 22 Operating expenses -14 -13 -13 -14 -16 Impairment -3 -1 -3 -3 -2
on loans and receivables -3 -1 -3 -3 -2 on available-for-sale assets 0 0 0 0 0 on goodwill 0 0 0 0 0 Other 0 0 0 0 0
Share in results of associated companies & joint ventures 0 0 0 0 0 Result before tax 4 5 4 5 3 Income tax expense 0 0 4 -1 0 Result after tax 4 5 7 4 3
attributable to minority interests 0 0 0 0 0 attributable to equity holders of the parent 4 5 7 4 3
Banking 3 4 6 2 1 Insurance 1 1 1 2 1
Risk-weighted assets, banking (end of period, Basel III) 671 690 710 739 750 Required capital, insurance (end of period, Solvency I) 15 14 15 16 16 Allocated capital (end of period) 96 98 101 105 108 Return on allocated capital (ROAC) 17% 19% 29% 15% 10% Cost/income ratio, banking 61% 63% 62% 61% 74% Combined ratio, non-life insurance 95% 101% 100% 95% 92%
Since 1Q2015, the 2014 reference figures for operating expenses (and resulting (sub)totals and ratios) have been adjusted due to the application of IFRIC 21 (Levies).

KBC Group I Extended Quarterly Report – 4Q2015 I p.23
Group Centre The Group Centre’s net result in 4Q2015 stood at 334 million, compared to -2 million in the previous quarter. A breakdown of this result by activities is provided in the table below.
Compared to 3Q2015, the much better result was largely attributable to exceptional items, i.e. the liquidation of KBC Financial Holding (+765 million), impairment on goodwill (-341 million) and impairment on the Hungarian Data Centre (-20 million). Excluding these one-off items, the actual result was down on its level in 3Q2015 due to higher costs (owing to traditional higher end-of-year costs and the delayed partial shift of the benefit of low operational expenses in 3Q2015 at Group Centre to the business units) and higher impairment charges and lower ALM derivatives.
Group Centre: breakdown of net result (in millions of EUR) 4Q2014 1Q2015 2Q2015 3Q2015 4Q2015 Operating expenses of group activities -26 -19 -15 0 -62Capital and treasury management-related costs 4 5 7 0 0Costs related to the holding of participations -17 -17 -26 -18 -15Results of remaining companies earmarked for divestments or in run-down -4 2 -22 16 756
Other items 8 41 -2 0 -346
Legacy and own credit risk -20 - - - - Total net result for the Group Centre -54 13 -57 -2 334
Group Centre (in millions of EUR) 4Q2014 1Q2015 2Q2015 3Q2015 4Q2015 Net interest income -19 -7 -15 -26 --16 Non-life insurance (before reinsurance) 3 -2 -3 -4 -2
Earned premiums -3 -3 -5 -4 -4Technical charges 6 2 3 0 2
Life insurance (before reinsurance) 0 0 0 0 0 Earned premiums 0 0 0 0 0 Technical charges 0 0 0 0 0
Ceded reinsurance result -3 0 2 1 3 Dividend income 1 1 5 1 2 Net result from financial instr. at fair value through P/L 7 -4 11 33 -161 Net realised result from available-for-sale assets 0 14 -6 11 4Net fee and commission income 4 -1 -1 -4 -2 Other net income 0 -18 21 18 -5 Total income -7 -17 15 30 -177 Operating expenses -44 -43 -37 -10 -59Impairment -7 6 -29 -4 -371
on loans and receivables -7 6 -26 -4 -4on available-for-sale assets 0 0 -3 0 0on goodwill 0 0 0 0 -342 Other 0 0 0 0 -25
Share in results of associated companies & joint ventures 1 1 1 1 1
Result before tax -56 -53 -51 17 -606 Income tax expense 2 66 -6 -19 939 Result after tax -54 13 -57 -2 334
attributable to minority interests 0 0 0 0 0 attributable to equity holders of the parent -54 13 -57 -2 334
of which related to legacy activities & own credit risk -20 - - - - Banking -37 44 -49 -6 444 Insurance -1 -8 11 7 -37 Group -17 -23 -19 -4 -73
Risk-weighted assets, banking (end of period, Basel III) 6 650 6 728 5 712 5 280 5433 Risk-weighted assets, insurance (end of period, Basel III Danish compromise) 10 897 9 047 9 133 9 133 9133
Required capital, insurance (end of period, Solvency I) 1 1 1 1 0 Allocated capital (end of period) 701 709 602 556 571
Since 1Q2015, the 2014 reference figures for operating expenses (and resulting (sub)totals and ratios) have been adjusted due to the application of IFRIC 21 (Levies).
KBC Group I Extended quarterly report 4Q2015 I p. 24
KBC Group
Consolidated
financial statements
according to IFRS
4Q 2015 and
FY 2015
This section is reviewed by the auditors

KBC Group I Extended quarterly report 4Q2015 I p. 25
Consolidated income statement
Figures of 2014 have been restated due the application of IFRIC21: See note 1a for more information.
In millions of EUR Note 4Q 2014 3Q 2015 4Q 2015 2014 2015
Net interest income 3 1 123 1 062 1 066 4 308 4 311
Interest income 3 1 982 1 770 1 725 7 893 7 150
Interest expense 3 - 860 - 708 - 659 - 3 586 - 2 839
Non-life insurance before reinsurance 9 123 142 147 512 611
Earned premiums Non-life 11 322 335 338 1 266 1 319
Technical charges Non-life 9 - 200 - 193 - 191 - 754 - 708
Life insurance before reinsurance 9 - 45 - 51 - 51 - 216 - 201
Earned premiums Life 10 343 289 445 1 247 1 301
Technical charges Life 9 - 388 - 340 - 496 - 1 463 - 1 502
Ceded reinsurance result 9 10 0 - 10 16 - 29
Dividend income 4 9 13 12 56 75
Net result from financial instruments at fair value through profit or loss 5 109 47 - 68 227 214
Net realised result from available-for-sale assets 6 22 44 30 150 190
Net fee and commission income 7 410 383 371 1 573 1 678
Fee and commission income 7 577 548 533 2 245 2 348
Fee and commission expense 7 - 167 - 165 - 162 - 672 - 670
Net other income 8 68 96 47 94 297
TOTAL INCOME 1 827 1 736 1 543 6 720 7 148
Operating expenses 12 - 964 - 862 - 962 - 3 818 - 3 890
Staff expenses 12 - 574 - 566 - 549 - 2 248 - 2 245
General administrative expenses 12 - 317 - 233 - 349 - 1 303 - 1 392
Depreciation and amortisation of fixed assets 12 - 74 - 63 - 65 - 266 - 253
Impairment 14 - 193 - 49 - 472 - 506 - 747
on loans and receivables 14 - 158 - 34 - 78 - 587 - 323
on available-for-sale assets 14 - 14 - 15 - 21 - 29 - 45
on goodwill 14 0 0 - 344 0 - 344
on other 14 - 21 0 - 29 109 - 34
Share in results of associated companies and joint ventures 15 6 6 5 25 24
RESULT BEFORE TAX 675 831 114 2 420 2 535
Income tax expense 16 - 202 - 231 749 - 657 104
RESULT AFTER TAX 473 600 863 1 763 2 639
Attributable to minority interest 0 0 0 0 0
Attributable to equity holders of the parent 473 600 862 1 762 2 639
Earnings per share (in EUR) 17
Basic 17 1.00 1.41 -0.36 3.32 3.80
Diluted 17 1.00 1.41 -0.36 3.32 3.80

KBC Group I Extended quarterly report 4Q2015 I p. 26
Consolidated statement of comprehensive income
(condensed)
In millions of EUR 4Q 2014 3Q 2015 4Q 2015 2014 2015
RESULT AFTER TAX 473 600 863 1 763 2 639
attributable to minority interest 0 0 0 0 0
attributable to equity holders of the parent 473 600 862 1 762 2 639
Other comprehensive income - to be recycled to P&L
Net change in revaluation reserve (AFS assets) - Equity 60 - 107 183 47 176
Net change in revaluation reserve (AFS assets) - Bonds 123 150 - 24 675 - 210
Net change in revaluation reserve (AFS assets) - Other 0 0 0 0 0
Net change in hedging reserve (cash flow hedge) - 289 - 140 61 - 871 222
Net change in translation differences 13 - 6 186 79 272
Other movements 1 2 - 1 1 2
Other comprehensive income - not to be recycled to P&L
Net change in defined benefit plans - 88 - 40 116 - 198 226
TOTAL COMPREHENSIVE INCOME 293 458 1 383 1 495 3 327
attributable to minority interest 0 0 0 0 0
attributable to equity holders of the parent 293 458 1 383 1 494 3 326
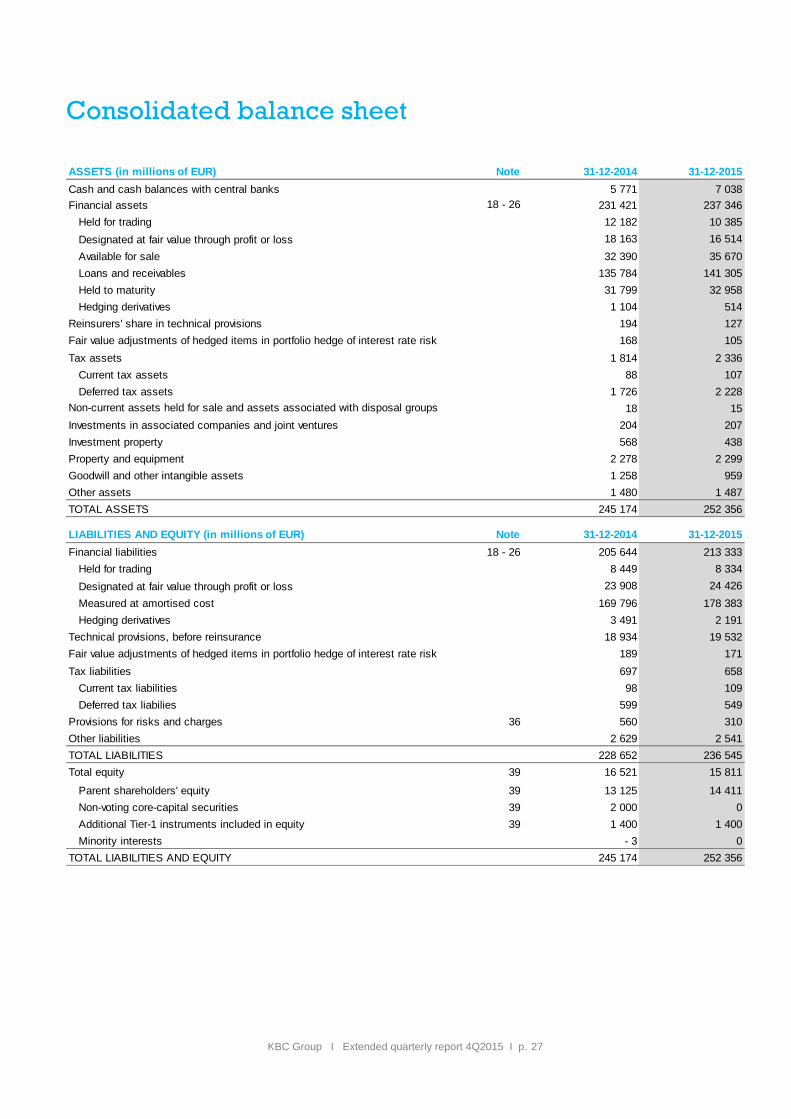
KBC Group I Extended quarterly report 4Q2015 I p. 27
Consolidated balance sheet
ASSETS (in millions of EUR) Note 31-12-2014 31-12-2015
Cash and cash balances with central banks 5 771 7 038
Financial assets 18 - 26 231 421 237 346
Held for trading 12 182 10 385
Designated at fair value through profit or loss 18 163 16 514
Available for sale 32 390 35 670
Loans and receivables 135 784 141 305
Held to maturity 31 799 32 958
Hedging derivatives 1 104 514
Reinsurers' share in technical provisions 194 127
Fair value adjustments of hedged items in portfolio hedge of interest rate risk 168 105
Tax assets 1 814 2 336
Current tax assets 88 107
Deferred tax assets 1 726 2 228
Non-current assets held for sale and assets associated with disposal groups 46 18 15
Investments in associated companies and joint ventures 204 207
Investment property 568 438
Property and equipment 2 278 2 299
Goodwill and other intangible assets 1 258 959
Other assets 1 480 1 487
TOTAL ASSETS 245 174 252 356
LIABILITIES AND EQUITY (in millions of EUR) Note 31-12-2014 31-12-2015
Financial liabilities 18 - 26 205 644 213 333
Held for trading 8 449 8 334
Designated at fair value through profit or loss 23 908 24 426
Measured at amortised cost 169 796 178 383
Hedging derivatives 3 491 2 191
Technical provisions, before reinsurance 18 934 19 532
Fair value adjustments of hedged items in portfolio hedge of interest rate risk 189 171
Tax liabilities 697 658
Current tax liabilities 98 109
Deferred tax liabilies 599 549
Provisions for risks and charges 36 560 310
Other liabilities 2 629 2 541
TOTAL LIABILITIES 228 652 236 545
Total equity 39 16 521 15 811
Parent shareholders' equity 39 13 125 14 411
Non-voting core-capital securities 39 2 000 0
Additional Tier-1 instruments included in equity 39 1 400 1 400
Minority interests - 3 0
TOTAL LIABILITIES AND EQUITY 245 174 252 356

KBC Group I Extended quarterly report 4Q2015 I p. 28
Consolidated statement of changes in equity
In 2015, revaluation reserves (AFS assets) on shares increased with 177m euros (+184 million euros in 4Q 2015, partly related to Visa Europe Limited for an amount of +69 million euros because of the public offer of Visa Inc.; transfer to net profit expected in 2Q 2016 based on the market value at that moment). Translation differences increased with 272 million euros in 2015 (+186 million euros in 4Q 2015) largely related to the liquidation of KBC Financial Holding Inc. in 4Q 2015 (outstanding translation differences were transferred to net profit) and also related to deferred taxes on hedges of a net investment in a foreign operation. Non-voting core capital securities: at the end of 2015, KBC repaid fully the remaining state aid to the Flemish Regional Government (2 billion euro plus 50% penalty). More information: see Note 39. For 2014, after approval by the general meeting of shareholders on 7 May 2015, a dividend of 2 euros was paid out per share entitled to dividend (836 million euros in total). This also triggered a payment of a coupon on the core-capital securities to the Flemish Regional Government (171 million euros in total). Both were deducted from retained earnings and were accounted for in 2Q 2015.
In millions of EUR
Issued and
paid up share
capital
Share
premium
Treasury
shares
Revaluation
reserve
(AFS assets)
Hedging reserve
(cashflow hedges)
Remeasurement
of defined benefit
obligations
Retained
earnings
Translation
differences
Parent share-
holders' equity
Non-voting
core-capital
securities
Additional Tier-
1 instruments
included in
equity
Minority
interests Total equity
31-12-2014
Balance at the beginning of the period (1-1-2014) 1 452 5 404 0 1 094 - 497 65 4 648 - 340 11 826 2 333 0 354 14 514
Net result for the period 0 0 0 0 0 0 1 762 0 1 762 0 0 0 1 763
Other comprehensive income for the period 0 0 0 722 - 871 - 198 1 79 - 268 0 0 0 - 268
Total comprehensive income 0 0 0 722 - 871 - 198 1 763 79 1 494 0 0 0 1 495
Coupon additional Tier-1 instruments 0 0 0 0 0 0 - 39 0 - 39 0 0 0 - 39
Capital increase 1 17 0 0 0 0 0 0 19 0 0 0 19
Repayment of non-voting core-capital securities 0 0 0 0 0 0 - 167 0 - 167 - 333 0 0 - 500
Issue of additional Tier-1 instruments included in equity 0 0 0 0 0 0 - 6 0 - 6 0 1 400 0 1 394
Impact business combinations 0 0 0 0 0 0 - 2 0 - 2 0 0 0 - 2
Change in scope 0 0 0 0 0 0 0 0 0 0 0 - 358 - 358
Total change 1 17 0 722 - 871 - 198 1 548 79 1 298 - 333 1 400 - 358 2 007
Balance at the end of the period 1 453 5 421 0 1 815 - 1 368 - 133 6 197 - 261 13 125 2 000 1 400 - 3 16 521
of which revaluation reserve for shares 370
of which revaluation reserve for bonds 1 445
of which revaluation reserve for other assets than bonds and shares 0
of which relating to equity method 23 0 0 0 0 23 23
31-12-2015
Balance at the beginning of the period (1-1-2015) 1 453 5 421 0 1 815 - 1 368 - 133 6 197 - 261 13 125 2 000 1 400 - 3 16 521
Net result for the period 0 0 0 0 0 0 2 639 0 2 639 0 0 0 2 639
Other comprehensive income for the period 0 0 0 - 34 222 226 2 272 688 0 0 0 688
Total comprehensive income 0 0 0 - 34 222 226 2 640 272 3 326 0 0 0 3 327
Dividends 0 0 0 0 0 0 - 835 0 - 835 0 0 0 - 835
Coupon non-voting core-capital securities 0 0 0 0 0 0 - 171 0 - 171 0 0 0 - 171
Coupon additional Tier-1 instruments 0 0 0 0 0 0 - 52 0 - 52 0 0 0 - 52
Capital increase 1 16 0 0 0 0 0 0 17 0 0 0 17
Repayment of non-voting core-capital securities 0 0 0 0 0 0 - 1 000 0 - 1 000 - 2 000 0 0 - 3 000
Impact business combinations 0 0 0 0 0 0 0 0 0 0 0 0 0
Change in scope 0 0 0 1 0 0 0 0 1 0 0 3 4
Total change 1 16 0 - 33 222 226 582 272 1 286 - 2 000 0 3 - 710
Balance at the end of the period 1 454 5 437 0 1 782 - 1 146 94 6 779 11 14 411 0 1 400 0 15 811
of which revaluation reserve for shares 547
of which revaluation reserve for bonds 1 235of which revaluation reserve for other assets than bonds and shares 0
of which relating to non-current assets held for sale and disposal groups 0 0 0 0 - 3 - 3 - 3
of which relating to equity method 22 0 0 0 7 28 28

KBC Group I Extended quarterly report 4Q2015 I p. 29
Consolidated cash flow statement At the end of 2015, KBC repaid fully the remaining state aid to the Flemish Regional Government (2 billion euro plus 50% penalty). This had a negative impact on cash flows from financing activities in 4Q 2015. More information: see Note 39.
Notes on statement of compliance and changes in
accounting policies
Statement of compliance (note 1a in the annual accounts 2014)
The consolidated financial statements of the KBC Group have been prepared in accordance with the International Financial Reporting Standards as adopted for use in the European Union (‘endorsed IFRS’). The interim condensed consolidated financial statements do not include all the information and disclosures required in the annual financial statements, and should be read in conjunction with the Group’s annual financial statements as at 31 December 2014. Due to the application of IFRIC 21 (Levies) as from 1 January 2015, the reference figures of the consolidated income statement have been restated (relates solely to movements between quarters and has no impact on the figures for the full year). The main consequence of the application of IFRIC 21 is that certain levies are taken upfront which has negatively impacted the half year results in 2015. For more information, see ‘note 12 - Operating Expenses’.
Summary of significant accounting policies (note 1b in the annual accounts 2014)
A summary of the main accounting policies is provided in the Group’s annual accounts as at 31 December 2014.

KBC Group I Extended quarterly report 4Q2015 I p. 30
Notes on segment reporting
Segment reporting according to the management structure of the group (note 2a in the annual
accounts 2014)
For a description on the management structure and linked reporting presentation, reference is made to note 2a in the annual accounts 2014. As of 2015, the presentation of adjusted results is abolished following the completion of the divestment programme (the last file, Antwerp Diamond Bank, has been put in run-off as decided on 19 September 2014) and the fact that the CDO-exposure was brought down to nearly zero. The rationale for calculating an adjusted result - excluding these non-operating items - largely disappeared and as a consequence, KBC will no longer provide for adjusted figures (reference figures of 2014 restated accordingly). Moreover, up until 2Q 2015 an additional correction to the IFRS accounts was done and related to trading activities. In the IFRS accounts, income related to trading activities is split across different components: while trading gains are recognised under ‘net result from financial instruments at fair value’, the funding costs and commissions paid in order to realise these trading gains are recognised respectively under ‘net interest income’ and ‘net fee and commission income’. Moreover, part of the ‘dividend income’, ‘net realised result on available-for-sale assets’ and ‘other net income’ are also related to trading income. In the net result of the Belgian Business Unit (KBC Bank Belgium), all trading income components within investment banking were recognised under ‘net result from financial instruments at fair value’ until 2Q 2015, without any impact on net profit. This additional correction was, in 2Q 2015, also abolished (reference figures of 2014 restated accordingly). Finally, the split of Group Centre between ‘Group Centre (excl. intersegment eliminations)’ and ‘Intersegment eliminations’ is no longer provided (with retroactive application for 2014), in accordance with the internal reporting to management.

KBC Group I Extended quarterly report 4Q2015 I p. 31
In millions of EUR
Business
unit
Belgium
Business
unit Czech
Republic
Business unit
Interna-
tional
Markets
of which:
Hungary
of which:
Slovakia
of which:
Bulgaria
of which:
Ireland
Group
Centre
KBC
Group
12M 2014
Net interest income 2 917 860 677 274 210 43 149 - 146 4 308
Non-life insurance before reinsurance 374 75 68 27 20 21 0 - 6 512
Earned premiums Non-life 964 165 153 55 27 71 0 - 16 1 266
Technical charges Non-life - 590 - 89 - 86 - 29 - 7 - 50 0 10 - 754
Life insurance before reinsurance - 252 24 12 - 1 10 4 0 - 1 - 216
Earned premiums Life 1 004 160 84 15 53 16 0 0 1 247
Technical charges Life - 1 256 - 136 - 71 - 16 - 43 - 12 0 0 - 1 463
Ceded reinsurance result 19 - 7 2 - 2 - 2 6 0 2 16
Dividend income 49 0 0 0 0 0 0 7 56
Net result from financial instruments at fair value through
profit or loss 44 62 73 62 15 2 - 7 49 227
Net realised result from available-for-sale assets 115 9 16 14 2 0 0 10 150
Net fee and commission income 1 152 194 208 160 46 1 - 3 19 1 573
Net other income 269 18 - 227 - 225 0 0 - 2 34 94
TOTAL INCOME 4 688 1 235 828 307 301 77 138 - 31 6 720
Operating expenses - 2 282 - 594 - 740 - 368 - 185 - 52 - 132 - 203 - 3 818
Impairment - 251 - 36 - 284 - 49 - 18 - 10 - 207 65 - 506
on loans and receivables - 205 - 34 - 273 - 47 - 17 - 10 - 198 - 75 - 587
on available-for-sale assets - 27 0 0 0 0 0 0 - 1 - 29
on goodwill 0 0 0 0 0 0 0 0 0
on other - 19 - 3 - 11 - 1 0 0 - 9 142 109
Share in results of associated companies and joint
ventures - 1 23 0 0 0 0 0 3 25
RESULT BEFORE TAX 2 154 628 - 196 - 109 98 15 - 202 - 166 2 420
Income tax expense - 638 - 100 14 15 - 24 0 23 65 - 657
RESULT AFTER TAX 1 517 528 - 182 - 94 75 15 - 179 - 100 1 763
Attributable to minority interests 0 0 0 0 0 0 0 0 0
NET RESULT 1 516 528 - 182 - 94 75 15 - 179 - 100 1 762
12M 2015
Net interest income 2 819 845 711 248 214 47 202 - 63 4 311
Non-life insurance before reinsurance 460 80 81 27 20 35 0 - 10 611
Earned premiums Non-life 989 177 169 65 29 76 0 - 16 1 319
Technical charges Non-life - 530 - 96 - 88 - 38 - 9 - 41 0 6 - 708
Life insurance before reinsurance - 243 26 16 2 10 4 0 0 - 201
Earned premiums Life 969 243 90 15 52 23 0 0 1 301
Technical charges Life - 1 212 - 216 - 73 - 13 - 41 - 20 0 0 - 1 502
Ceded reinsurance result - 20 - 8 - 6 - 3 - 1 - 2 0 6 - 29
Dividend income 65 0 0 0 0 0 0 10 75
Net result from financial instruments at fair value through
profit or loss 162 98 76 60 16 2 - 2 - 121 214
Net realised result from available-for-sale assets 149 12 6 3 2 0 1 23 190
Net fee and commission income 1 280 201 206 160 47 - 2 - 3 - 9 1 678
Net other income 207 23 50 42 9 0 0 17 297
TOTAL INCOME 4 878 1 277 1 141 539 317 83 198 - 148 7 148
Operating expenses - 2 373 - 617 - 752 - 353 - 190 - 56 - 149 - 149 - 3 890
Impairment - 222 - 42 - 84 - 8 - 18 - 10 - 48 - 399 - 747
on loans and receivables - 177 - 36 - 82 - 6 - 18 - 10 - 48 - 28 - 323
on available-for-sale assets - 38 - 4 0 0 0 0 0 - 3 - 45
on goodwill 0 - 2 0 0 0 0 0 - 342 - 344
on other - 7 0 - 2 - 2 0 0 0 - 25 - 34
Share in results of associated companies and joint
ventures - 1 23 0 0 0 0 0 3 24
RESULT BEFORE TAX 2 282 640 305 179 108 17 1 - 693 2 535
Income tax expense - 717 - 98 - 60 - 47 - 26 2 12 980 104
RESULT AFTER TAX 1 565 542 245 131 82 18 13 287 2 639
Attributable to minority interests 0 0 0 0 0 0 0 0 0
NET RESULT 1 564 542 245 131 82 18 13 287 2 639

KBC Group I Extended quarterly report 4Q2015 I p. 32
In the table below, an overview is provided of a number of balance sheet items divided by segment.
In millions of EUR
Business
unit
Belgium
Business
unit Czech
Republic
Business
unit Interna-
tional
Markets
of which:
Hungary
of which:
Slovakia
of which:
Bulgaria
of which:
Ireland
Group
Centre
KBC
Group
31-12-2014
Deposits from customers & debt certificates excl. repos 105 885 22 047 14 860 5 220 4 856 600 4 185 11 187 153 979
Loans & advances to customers excluding reverse repos 84 165 16 216 20 790 3 771 4 578 666 11 776 1 990 123 161
Term loans excl. Reverse repos 41 926 6 360 5 289 1 915 1 527 284 1 562 1 792 55 366
Mortgage loans 32 318 7 251 13 561 1 320 1 807 239 10 195 26 53 156
Current accounts advances 2 318 922 653 312 329 0 12 161 4 054
Finance leases 3 172 442 523 92 425 0 6 0 4 138
Consumer credit 1 088 1 028 654 59 452 142 0 0 2 770
Other 3 343 213 111 72 38 0 0 12 3 678
31-12-2015
Deposits from customers & debt certificates excl. repos 111 136 24 075 17 089 5 862 5 263 692 5 272 9 241 161 542
Loans & advances to customers excluding reverse repos 88 017 18 005 21 035 3 552 5 462 725 11 295 664 127 721
Term loans excl. Reverse repos 43 969 7 137 5 106 1 647 1 944 204 1 311 649 56 860
Mortgage loans 33 341 8 079 13 657 1 369 2 072 242 9 975 0 55 078
Current accounts advances 2 271 954 800 284 374 139 4 0 4 026
Finance leases 3 303 527 683 117 566 0 0 0 4 512
Consumer credit 1 174 1 067 687 67 474 140 5 0 2 928
Other 3 958 241 102 69 33 0 0 15 4 316

KBC Group I Extended quarterly report 4Q2015 I p. 33
Other notes
Net interest income (note 3 in the annual accounts 2014)
The reference figures of 2015 have been adjusted relating to a reclassification of interest income from HTM bonds in repo transactions.
Net result from financial instruments at fair value through profit or loss (note 5 in the annual accounts
2014) In 2015, the result from financial instruments at fair value through profit or loss was influenced by MtM ALM derivatives, where fair value changes (due to marked-to-market accounting) of ALM hedging instruments (that are treated as held for trading instruments) appear under ‘Net result from financial instruments at fair value’, whereas most of the related assets are not recognised at fair value. In 2015, the net result from these financial instruments at fair value through profit or loss amounted to +101 million euros pre-tax (+12 million euros pre-tax in 4Q 2015; for FY and 4Q 2014 respectively -201 and -7 million euros). In 2015 (4Q), the result from financial instruments at fair value through profit or loss was also influenced by the liquidation of KBC Financial Holding Inc., whereby negative translation differences were transferred from equity to net profit (-156 million euro pre-tax, including the hedges of a net investment in a foreign operation).
Net realised result from available-for-sale assets (note 6 in the annual accounts 2014)
In millions of EUR 4Q 2014 3Q 2015 4Q 2015 2014 2015
Total 1 123 1 062 1 066 4 308 4 311
Interest income 1 982 1 770 1 725 7 893 7 150
Available-for-sale assets 201 177 178 763 717
Loans and receivables 1 129 993 999 4 510 4 085
Held-to-maturity investments 241 254 253 1 006 1 013
Other assets not at fair value 8 9 11 22 41
Subtotal, interest income from financial assets not measured at fair value through
profit or loss 1 578 1 471 1 441 6 301 5 857
Financial assets held for trading 243 199 183 926 807
Hedging derivatives 111 89 83 459 360
Other financial assets at fair value through profit or loss 50 48 19 208 127
Interest expense - 860 - 708 - 659 -3 586 -2 839
Financial liabilities measured at amortised cost - 360 - 290 - 270 -1 691 -1 202
Other - 1 - 2 - 4 - 4 - 8
Subtotal, interest expense for financial liabilities not measured at fair value
through profit or loss - 361 - 292 - 274 -1 695 -1 210
Financial liabilities held for trading - 299 - 232 - 216 -1 093 - 926
Hedging derivatives - 148 - 149 - 147 - 639 - 590
Other financial liabilities at fair value through profit or loss - 50 - 32 - 19 - 151 - 103
Net interest expense on defined benefit plans - 3 - 2 - 4 - 7 - 10
In millions of EUR 4Q 2014 3Q 2015 4Q 2015 2014 2015
Total 22 44 30 150 190
Breakdown by portfolio
Fixed-income securities 8 6 5 64 54
Shares 14 38 25 86 136
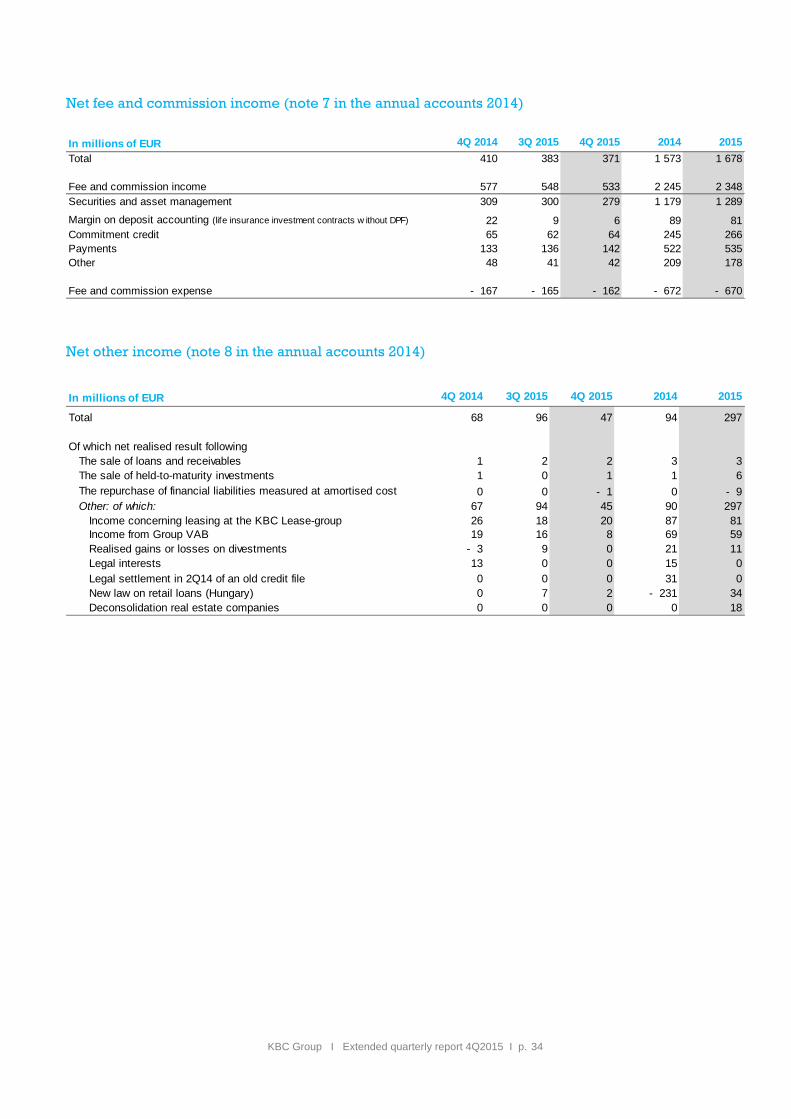
KBC Group I Extended quarterly report 4Q2015 I p. 34
Net fee and commission income (note 7 in the annual accounts 2014)
Net other income (note 8 in the annual accounts 2014)
In millions of EUR 4Q 2014 3Q 2015 4Q 2015 2014 2015
Total 410 383 371 1 573 1 678
0
Fee and commission income 577 548 533 2 245 2 348
Securities and asset management 309 300 279 1 179 1 289
Margin on deposit accounting (life insurance investment contracts w ithout DPF) 22 9 6 89 81
Commitment credit 65 62 64 245 266
Payments 133 136 142 522 535
Other 48 41 42 209 178
Fee and commission expense - 167 - 165 - 162 - 672 - 670
In millions of EUR 4Q 2014 3Q 2015 4Q 2015 2014 2015
Total 68 96 47 94 297
Of which net realised result following
The sale of loans and receivables 1 2 2 3 3
The sale of held-to-maturity investments 1 0 1 1 6
The repurchase of financial liabilities measured at amortised cost 0 0 - 1 0 - 9
Other: of which: 67 94 45 90 297
Income concerning leasing at the KBC Lease-group 26 18 20 87 81
Income from Group VAB 19 16 8 69 59
Realised gains or losses on divestments - 3 9 0 21 11
Legal interests 13 0 0 15 0
Legal settlement in 2Q14 of an old credit file 0 0 0 31 0
New law on retail loans (Hungary) 0 7 2 - 231 34
Deconsolidation real estate companies 0 0 0 0 18

KBC Group I Extended quarterly report 4Q2015 I p. 35
Breakdown of the insurance results (note 9 in the annual accounts 2014)
Note: Figures for premiums exclude the investment contracts without DPF, which roughly coincide with the unit-linked products. Figures are before
elimination of transactions between the bank and insurance entities of the group (more information in the 2014 annual accounts).
In millions of EUR Life Non-life
Non-technical
account TOTAL
12M 2014
Earned premiums, insurance (before reinsurance) 1 249 1 286 - 2 535
Technical charges, insurance (before reinsurance) - 1 463 - 755 - - 2 218
Net fee and commission income - 13 - 234 0 - 247
Ceded reinsurance result - 2 18 0 16
Operating expenses - 121 - 240 - 1 - 362
Internal costs claim paid - 7 - 58 - 66
Administration costs related to acquisitions - 30 - 79 - 109
Administration costs - 84 - 103 - 187
Management costs investments 0 0 - 1 - 1
Technical result - 350 74 - 1 - 276
Net interest income 675 675
Dividend income 40 40
Net result from financial instruments at fair value 42 42
Net realised result from AFS assets 96 96
Net other income 2 2
Impairments - 34 - 34
Allocation to the technical accounts 620 101 - 721 0
Technical-financial result 270 176 99 544
Share in results of associated companies and joint ventures 3 3
RESULT BEFORE TAX 270 176 102 547
Income tax expense - 156
RESULT AFTER TAX 392
attributable to minority interest 0
attributable to equity holders of the parent 391
12M 2015
Earned premiums, insurance (before reinsurance) 1 303 1 338 2 642
Technical charges, insurance (before reinsurance) - 1 502 - 708 - 2 210
Net fee and commission income - 15 - 247 - 262
Ceded reinsurance result - 2 - 27 - 29
Operating expenses - 119 - 231 - 3 - 353
Internal costs claim paid - 7 - 53 - 60
Administration costs related to acquisitions - 29 - 77 - 107
Administration costs - 82 - 101 - 183
Management costs investments 0 0 - 3 - 3
Technical result - 334 125 - 3 - 212
Net interest income 636 636
Dividend income 53 53
Net result from financial instruments at fair value - 9 - 9
Net realised result from AFS assets 108 108
Net other income - 6 - 6
Impairments - 69 - 69
Allocation to the technical accounts 574 104 - 678 0
Technical-financial result 240 228 31 499
Share in results of associated companies and joint ventures 3 3
RESULT BEFORE TAX 240 228 34 502
Income tax expense - 148
RESULT AFTER TAX 355
attributable to minority interest 0
attributable to equity holders of the parent 354

KBC Group I Extended quarterly report 4Q2015 I p. 36
Operating expenses – income statement (note 12 in the annual accounts 2014) The operating expenses of 2015 include 417 million euros related to bank (and insurance) levies (of which 264 million euros in 1Q 2015, 83 million euros in 2Q 2015, 21 million euros in 3Q 2015 and 49 million euros in 4Q 2015). As of 1 January 2015, IFRIC 21 (Levies) came into force. The main consequence of the application of IFRIC 21 is that certain levies are taken upfront in expense of the first quarter 2015 for a total of 222 million euros, of which 62 million euros related to the estimated contribution to the European Single Resolution Fund (ESRF). For all entities, except for K&H, the contribution to the ESRF is booked in 1Q 2015 at 70% (estimated actual cash out), whereas the remaining 30% will be considered as an irrevocable payment commitment (booked off‐balance as a contingent liability). For K&H, the ESRF was booked at 100% due to local legislation. In 2Q 2015, the contribution to the ESRF for ČSOB (Slovakia) was also booked at 100% due to local legislation. Based on European market practice, KBC has furthermore aligned the accounting treatment of the annual deposit guarantee scheme levy in 2Q 2015. As a result, the second quarter figures of 2015 include a 29 million euros charge related to the upfront recognition in Belgium. In 3Q 2015, the provision for the estimated contribution to the ESRF in ČSOB (Czech Republic), booked upfront in 1Q 2015 (-12 million euros), has been released in 3Q 2015, as the Czech law, implementing the resolution fund mechanism, is only expected to come into force in 2016. In 4Q 2015, the contribution to the ESRF was updated, whereby the ESFR was also booked at 100%, and leading to an additional 12 million euros charge in Belgium.
Except for the 2Q 2015 upfront recognition in Belgium, the reference figures of the consolidated income statement have been restated (relates solely to movements between quarters and has no impact on the figures for the full year). The 2014 results after restatement include in total 339 million euros of bank (and insurance) levies (respectively 198, 48, 48 and 44 million euros in 1Q, 2Q, 3Q and 4Q 2014).

KBC Group I Extended quarterly report 4Q2015 I p. 37
Impairment – income statement (note 14 in the annual accounts 2014)
In 2Q 2015, adjustments to the emergence period were made to the IBNR-models based on annual back-testing. This resulted in an increase of portfolio-based impairments of approximately -34 million euros situated mainly in the Belgian and Czech Business Units. Impairments on goodwill in 2015 (fully in 4Q) include impairments mainly on ČSOB a.s. (Slovak Republic) (-191 million euros), CIBANK EAD (-117 million euros) and DZI Insurance (-34 million euros). These impairments were largely caused by a lower
recoverable value (calculated based on discounted cashflow analysis) mainly due to higher capital targets (resulting in a higher
required capital, which reduces the free cashflows that can be paid out as dividend in the valuation model) and a higher discount rate (higher beta and higher market premium). Impairments on property and equipment and investment property in 2015 includes in 4Q 2015 an impairment of 20 million euros on the Hungarian Data Center of KBC Group due to structural overcapacity.
Income tax expense – income statement (note 16 in the annual accounts 2014)
In 1Q 2015, the income tax expenses were positively influenced by 49 million euros of Deferred Tax Assets (DTA). The high level of AFS reserves as result of the low interest rate levels triggered a review of the DTA position at KBC Credit Investments. It is unlikely that KBC Credit Investments will pay taxes on these AFS reserves and therefore, on the balance sheet Deferred Tax Liabilities (DTL) are offset by DTA. It is important to mention that the accounting treatment is asymmetrical as the recording of the DTA goes through profit and loss, and the DTL on the AFS reserves is directly recorded through equity.
Income taxes in 4Q 2015 also include a deferred tax impact of 921 million euros related to the liquidation of KBC Financial Holding Inc. When KBC agreed its strategic refocus with the European Commission in 2009 it undertook to run down or divest the activities of its subsidiary KBC Financial Holding Inc. (US) in order to reduce KBC's risk profile. That process has since been completed, with KBC collapsing the last two CDOs it held in portfolio in September 2014. As a final step, KBC has liquidated KBC Financial Holding Inc. in 4Q 2015. Belgian tax law provides that the loss in paid-up capital that KBC Bank sustains consequent on the liquidation of KBC Financial Holding Inc. is tax-deductible for the parent company at the moment of the liquidation, rather than at the time the losses were incurred (specifically 2008 and 2009). On balance, the post-tax impact on the result is estimated at 765 million euros (+921 million euros deferred income taxes, partly offset by -156 million euros translation differences – see also note 5).
In millions of EUR 4Q 2014 3Q 2015 4Q 2015 2014 2015
Total - 193 - 49 - 472 - 506 - 747
Impairment on loans and receivables - 158 - 34 - 78 - 587 - 323
Breakdown by type
Specific impairments for on-balance-sheet lending - 147 - 63 - 77 - 676 - 322
Provisions for off-balance-sheet credit commitments - 4 1 3 19 9
Portfolio-based impairments - 7 28 - 3 70 - 10
Breakdown by business unit
Business unit Belgium - 73 - 13 - 34 - 205 - 177
Business unit Czech Republic - 16 - 5 - 14 - 34 - 36
Business unit International Markets - 62 - 12 - 26 - 273 - 82
of which: Hungary - 13 5 1 - 47 - 6
of which: Slovak ia - 5 - 4 - 9 - 17 - 18
of which: Bulgaria - 3 - 3 - 2 - 10 - 10
of which: Ireland - 41 - 9 - 16 - 198 - 48
Group Centre - 7 - 4 - 4 - 75 - 28
Impairment on available-for-sale assets - 14 - 15 - 21 - 29 - 45
Breakdown by type
Shares - 14 - 15 - 18 - 29 - 43
Other 0 0 - 3 0 - 3
Impairment on goodwill 0 0 - 344 0 - 344
Impairment on other - 21 0 - 29 109 - 34
Intangible assets, other than goodwill - 23 0 - 5 - 23 - 7
Property and equipment and investment property - 7 0 - 22 - 8 - 27
Held-to-maturity assets 0 0 0 1 0
Associated companies and joint ventures 0 0 0 0 0
Other 9 0 - 1 139 0
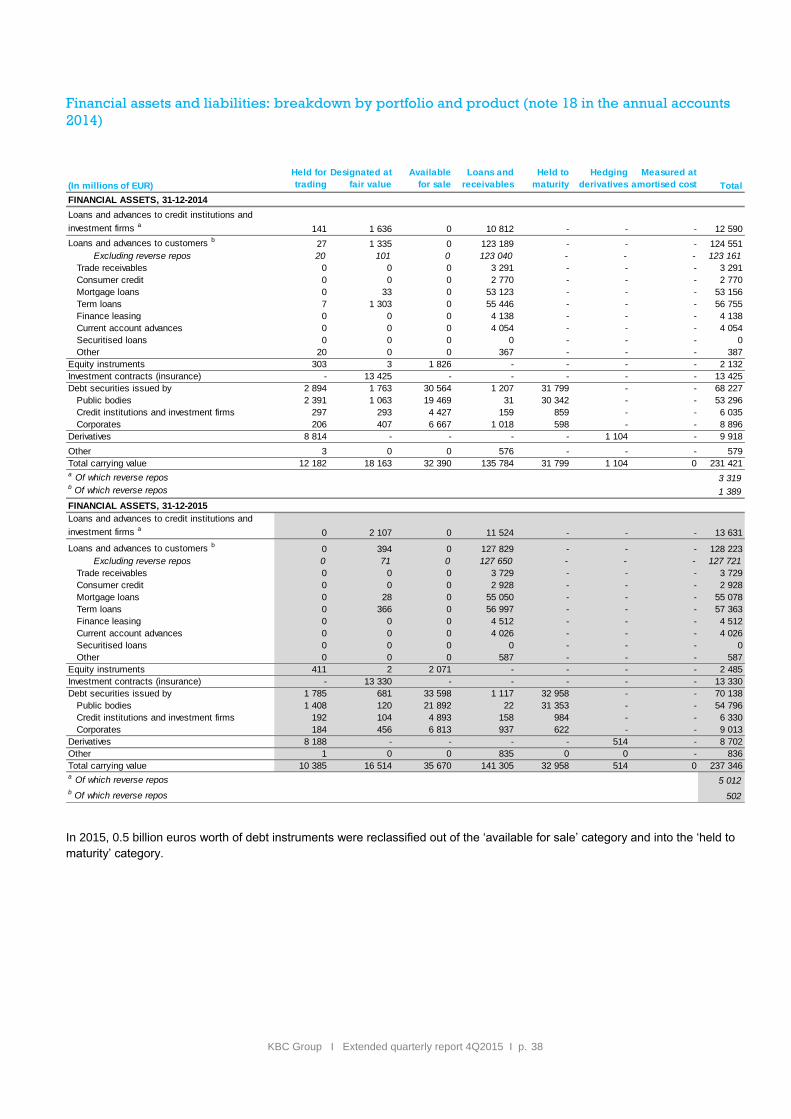
KBC Group I Extended quarterly report 4Q2015 I p. 38
Financial assets and liabilities: breakdown by portfolio and product (note 18 in the annual accounts
2014)
In 2015, 0.5 billion euros worth of debt instruments were reclassified out of the ‘available for sale’ category and into the ‘held to
maturity’ category.
(In millions of EUR)
Held for
trading
Designated at
fair value
Available
for sale
Loans and
receivables
Held to
maturity
Hedging
derivatives
Measured at
amortised cost Total
FINANCIAL ASSETS, 31-12-2014
Loans and advances to credit institutions and
investment firms a 141 1 636 0 10 812 - - - 12 590
Loans and advances to customers b 27 1 335 0 123 189 - - - 124 551
Excluding reverse repos 20 101 0 123 040 - - - 123 161
Trade receivables 0 0 0 3 291 - - - 3 291
Consumer credit 0 0 0 2 770 - - - 2 770
Mortgage loans 0 33 0 53 123 - - - 53 156
Term loans 7 1 303 0 55 446 - - - 56 755
Finance leasing 0 0 0 4 138 - - - 4 138
Current account advances 0 0 0 4 054 - - - 4 054
Securitised loans 0 0 0 0 - - - 0
Other 20 0 0 367 - - - 387
Equity instruments 303 3 1 826 - - - - 2 132
Investment contracts (insurance) - 13 425 - - - - - 13 425
Debt securities issued by 2 894 1 763 30 564 1 207 31 799 - - 68 227
Public bodies 2 391 1 063 19 469 31 30 342 - - 53 296
Credit institutions and investment firms 297 293 4 427 159 859 - - 6 035
Corporates 206 407 6 667 1 018 598 - - 8 896
Derivatives 8 814 - - - - 1 104 - 9 918
Other 3 0 0 576 - - - 579
Total carrying value 12 182 18 163 32 390 135 784 31 799 1 104 0 231 421a Of which reverse repos 3 319b Of which reverse repos 1 389
FINANCIAL ASSETS, 31-12-2015
Loans and advances to credit institutions and
investment firms a 0 2 107 0 11 524 - - - 13 631
Loans and advances to customers b 0 394 0 127 829 - - - 128 223
Excluding reverse repos 0 71 0 127 650 - - - 127 721
Trade receivables 0 0 0 3 729 - - - 3 729
Consumer credit 0 0 0 2 928 - - - 2 928
Mortgage loans 0 28 0 55 050 - - - 55 078
Term loans 0 366 0 56 997 - - - 57 363
Finance leasing 0 0 0 4 512 - - - 4 512
Current account advances 0 0 0 4 026 - - - 4 026
Securitised loans 0 0 0 0 - - - 0
Other 0 0 0 587 - - - 587
Equity instruments 411 2 2 071 - - - - 2 485
Investment contracts (insurance) - 13 330 - - - - - 13 330
Debt securities issued by 1 785 681 33 598 1 117 32 958 - - 70 138
Public bodies 1 408 120 21 892 22 31 353 - - 54 796
Credit institutions and investment firms 192 104 4 893 158 984 - - 6 330
Corporates 184 456 6 813 937 622 - - 9 013
Derivatives 8 188 - - - - 514 - 8 702
Other 1 0 0 835 0 0 - 836
Total carrying value 10 385 16 514 35 670 141 305 32 958 514 0 237 346a Of which reverse repos 5 012b Of which reverse repos 502

KBC Group I Extended quarterly report 4Q2015 I p. 39
To make the breakdown by product more transparent, the saving deposits were renamed (as saving accounts) in 2015 and the definition was broadened (no longer limited to the Belgian regulatory saving deposits, but also including similar foreign products). The reference figures have been restated accordingly.
(In millions of EUR)
Held for
trading
Designated at
fair value
Available
for sale
Loans and
receivables
Held to
maturity
Hedging
derivatives
Measured at
amortised cost Total
FINANCIAL LIABILITIES, 31-12-2014
Deposits from credit institutions and investment
firms a 60 1 004 - - - - 16 628 17 692
Deposits from customers and debt certificates b 367 10 352 - - - - 151 064 161 783
Excluding repos 367 3 058 - - - - 150 554 153 979
Deposits from customers 69 8 077 - - - - 128 091 136 237
Demand deposits 0 35 - - - - 47 011 47 046
Time deposits 69 8 028 - - - - 31 425 39 523
Saving accounts 0 0 - - - - 47 455 47 455
Special deposits 0 0 - - - - 1 715 1 715
Other deposits 0 14 - - - - 485 499
Debt certificates 298 2 275 - - - - 22 973 25 546
Certificates of deposit 9 3 - - - - 5 922 5 935
Customer savings certificates 0 0 - - - - 762 762
Convertible bonds 0 0 - - - - 0 0
Non-convertible bonds 289 1 732 - - - - 12 741 14 761
Convertible subordinated liabilities 0 0 - - - - 0 0
Non-convertible subordinated liabilities 0 540 - - - - 3 549 4 088
Liabilities under investment contracts - 12 553 - - - - 0 12 553
Derivatives 7 697 - - - - 3 491 - 11 188
Short positions 325 0 - - - - - 325
in equity instruments 71 0 - - - - - 71
in debt instruments 254 0 - - - - - 254
Other 0 0 - - - - 2 103 2 104
Total carrying value 8 449 23 908 - - - 3 491 169 796 205 644a Of which repos 1 315b Of which repos 7 804
FINANCIAL LIABILITIES, 31-12-2015
Deposits from credit institutions and investment
firms a 1 1 123 - - - - 17 828 18 953
Deposits from customers and debt certificates b 431 10 916 - - - - 158 762 170 109
Excluding repos 431 2 349 - - - - 158 762 161 542
Deposits from customers 57 9 360 - - - - 135 414 144 831
Demand deposits 0 0 - - - - 55 148 55 148
Time deposits 57 9 360 - - - - 27 724 37 141
Saving accounts 0 0 - - - - 50 075 50 075
Special deposits 0 0 - - - - 1 983 1 983
Other deposits 0 0 - - - - 484 484
Debt certificates 374 1 555 - - - - 23 349 25 278
Certificates of deposit 0 10 - - - - 6 159 6 168
Customer savings certificates 0 0 - - - - 1 092 1 092
Convertible bonds 0 0 - - - - 0 0
Non-convertible bonds 374 1 253 - - - - 12 576 14 203
Convertible subordinated liabilities 0 0 - - - - 0 0
Non-convertible subordinated liabilities 0 293 - - - - 3 522 3 815
Liabilities under investment contracts - 12 387 - - - - 0 12 387
Derivatives 7 487 0 - - - 2 191 - 9 677
Short positions 415 0 - - - - - 415
in equity instruments 58 0 - - - - - 58
in debt instruments 357 0 - - - - - 357
Other 0 0 - - - - 1 792 1 792
Total carrying value 8 334 24 426 - - - 2 191 178 383 213 333
a Of which repos 1 128b Of which repos 8 567

KBC Group I Extended quarterly report 4Q2015 I p. 40
Additional information on quarterly time series
Loans and deposits
Technical provisions plus unit linked, life insurance
In millions of EUR 31-12-2014 31-03-2015 30-06-2015 30-09-2015 31-12-2015
Total customer loans excluding reverse repo
Business unit Belgium 84 165 84 782 85 767 87 308 88 017
Business unit Czech Republic 16 216 16 610 17 188 17 618 18 005
Business unit International Markets 20 790 20 974 20 673 20 942 21 035
of which: Hungary 3 771 3 934 3 632 3 577 3 552
of which: Slovak ia 4 578 4 717 4 838 5 237 5 462
of which: Bulgaria 666 667 679 702 725
of which: Ireland 11 776 11 655 11 523 11 425 11 295
Group Centre 1 990 1 931 1 705 764 664
KBC Group 123 161 124 297 125 332 126 633 127 721
Mortgage loans
Business unit Belgium 32 318 32 400 32 790 33 092 33 341
Business unit Czech Republic 7 251 7 405 7 634 7 839 8 079
Business unit International Markets 13 561 13 635 13 597 13 649 13 657
of which: Hungary 1 320 1 409 1 353 1 380 1 369
of which: Slovak ia 1 807 1 844 1 900 1 976 2 072
of which: Bulgaria 239 241 245 241 242
of which: Ireland 10 195 10 141 10 098 10 052 9 975
Group Centre 26 29 28 27 0
KBC Group 53 156 53 468 54 048 54 607 55 078
Customer deposits and debt certificates excl. repos
Business unit Belgium 105 885 111 218 113 219 112 539 111 136
Business unit Czech Republic 22 047 22 216 22 765 23 323 24 075
Business unit International Markets 14 860 15 621 16 052 16 503 17 089
of which: Hungary 5 220 5 475 5 403 5 474 5 862
of which: Slovak ia 4 856 4 842 4 982 5 132 5 263
of which: Bulgaria 600 627 643 666 692
of which: Ireland 4 185 4 676 5 024 5 231 5 272
Group Centre 11 187 10 255 9 706 9 540 9 241
KBC Group 153 979 159 310 161 743 161 906 161 542
Interest
Guaranteed Unit Linked
Interest
Guaranteed Unit Linked
Interest
Guaranteed Unit Linked
Interest
Guaranteed Unit Linked
Interest
Guaranteed Unit Linked
Business unit Belgium 13 831 12 637 13 770 13 359 13 832 13 030 14 093 12 514 14 237 12 490
Business unit Czech Republic 491 483 491 473 491 451 492 423 495 480Business unit International
Markets 214 305 214 346 208 333 209 346 200 360
of which: Hungary 52 209 56 242 54 228 53 235 51 245
of which: Slovakia 126 96 120 103 116 105 113 111 107 115
of which: Bulgaria 36 1 38 1 39 1 43 0 42 0
Group Centre 0 0 0 0 0 0 0 0 0 0
KBC Group 14 535 13 425 14 475 14 177 14 531 13 815 14 794 13 283 14 932 13 330
31-12-2015Technical provisions, Life
Insurance
In millions of EUR
30-09-201530-06-201531-12-2014 31-03-2015

KBC Group I Extended quarterly report 4Q2015 I p. 41
Financial assets and liabilities measured at fair value – fair value hierarchy (note 24 in the annual
accounts 2014)
For more details on how KBC defines and determines (i) fair value and the fair value hierarchy and (ii) level 3 valuations reference is made to notes 23 up to and including 26 of the annual accounts 2014.
Financial assets and liabilities measured at fair value – transfers between level 1 and 2 (note 25 in the
annual accounts 2014)
In 2015, an approximate total amount of 0.3 billion euros in financial instruments at fair value was transferred from level 1 to level 2. KBC also transferred around 0.3 billion euros in financial instruments at fair value from level 2 to level 1. The majority of the transfers is due to changed liquidity of corporate bonds.
Fair value hierarchy
In millions of EUR Level 1 Level 2 Level 3 Total Level 1 Level 2 Level 3 Total
Financial assets measured at fair value
Held for trading 2 292 7 306 2 584 12 182 1 510 6 532 2 342 10 385
Designated at fair value 14 551 3 250 363 18 163 13 305 2 797 411 16 514
Available for sale 27 782 3 051 1 557 32 390 30 456 3 505 1 709 35 670
Hedging derivatives 0 1 104 0 1 104 0 514 0 514
Total 44 624 14 711 4 503 63 839 45 271 13 348 4 462 63 082
Financial liabilities measured at fair value
Held for trading 327 5 746 2 376 8 449 415 5 859 2 060 8 334
Designated at fair value 12 552 10 932 424 23 908 12 386 11 445 594 24 426
Hedging derivatives 0 3 491 0 3 491 0 2 191 0 2 191
Total 12 879 20 170 2 800 35 848 12 801 19 495 2 654 34 950
31-12-2014 31-12-2015

KBC Group I Extended quarterly report 4Q2015 I p. 42
Financial assets and liabilities measured at fair value – focus on level 3 (note 26 in the annual
accounts 2014)
Hedging
derivatives
Loans and
advances
Equity
instruments
Investment
contracts Debt securities Derivatives
Loans and
advances
Equity
instruments
Investment
contracts Debt securities
Equity
instruments Debt securities Derivatives
Opening balance 0 0 0 263 2 321 26 0 0 337 393 1 163 0
Total gains/losses 0 0 0 2 - 195 2 2 0 - 42 73 30 0
in profit and loss* 0 0 0 2 - 195 2 2 0 - 42 - 12 0 0
in other comprehensive income 0 0 0 0 0 0 0 0 0 85 30 0
Acquisitions 0 0 0 78 372 0 0 0 70 3 546 0
Sales 0 0 0 - 57 - 2 0 - 2 0 - 18 - 20 - 58 0
Settlements 0 0 0 - 13 - 446 0 0 0 0 0 - 28 0
Transfers into level 3 0 0 0 0 0 0 0 0 0 14 211 0
Transfers out of level 3 0 0 0 0 0 0 0 0 0 - 44 - 568 0
Tranfers from/to non-current assets
held for sale 0 0 0 0 0 0 0 0 0 0 0 0
Translation differences 0 0 0 15 5 0 0 0 35 - 8 1 0
Changes in scope 0 0 0 0 0 0 0 0 0 0 0 0
Other 0 0 0 0 0 0 0 0 0 - 1 0 0
Closing balance 0 0 0 287 2 055 28 0 0 383 411 1 298 0
Total gains (positive figures) or losses
(negative figures) included in profit or
loss for assets held at the end of the
reporting period 0 0 0 2 - 57 2 - 34 - 3 0 0
LEVEL 3 FINANCIAL LIABILITIES
Deposits from
credit institutions
Deposits from
customers and
debt
certificates
Liabilities
under
investment
contracts Derivatives Short positions Other
Deposits from
credit
institutions
Deposits from
customers
and debt
certificates
Liabilities
under
investment
contracts Other
Opening balance 0 41 0 2 335 0 0 0 424 0 0
Total gains/losses 0 0 0 - 148 0 0 0 - 79 0 0
in profit and loss* 0 0 0 - 148 0 0 0 - 79 0 0
in other comprehensive income 0 0 0 0 0 0 0 0 0 0
Issues 0 0 0 324 0 0 0 0 0 0
Repurchases 0 0 0 - 4 0 0 0 - 165 0 0
Settlements 0 - 43 0 - 449 0 0 0 0 0 0
Transfers into level 3 0 0 0 0 0 0 0 0 0 0
Transfers out of level 3 0 0 0 0 0 0 0 0 0 0
Tranfers from/to financial liabilities
regarding disposal groups 0 0 0 0 0 0 0 0 0 0
Translation differences 0 4 0 0 0 0 0 21 0 0
Changes in scope 0 0 0 0 0 0 0 0 0 0
Other 0 0 0 0 0 0 0 394 0 0
Closing balance 0 2 0 2 058 0 0 0 594 0 0
Total gains (negative figures) or losses
(positive figures) included in profit and
loss for liabilities held at the end of the
reporting period 0 0 - 57 0 - 28 0 0
* Recognised primarily in 'Net result from financial instruments at fair value through profit or loss', 'Net realised result from available-for-sale assets' and 'Impairment on available-for-sale assets'.
0
0
0
0
0
0
0
0
0
0
0
0
0
0
0
Held for trading Designated at fair value Available for sale
Held for trading Designated at fair value Hedging derivatives

KBC Group I Extended quarterly report 4Q2015 I p. 43
Provisions for risks and charges (note 36 in the annual accounts 2014) In 3Q 2015, KBC reached an agreement with regard to the cases on K&H Equities and Lehman Brothers (see note 36 annual accounts 2014 for more information), whereby the outstanding provisions were used to a large extent.
Parent shareholders’ equity, non-voting core-capital securities and AT1 instruments (note 39 in the
annual accounts 2014)
The ordinary shares of KBC Group NV have no nominal value and are quoted on NYSE Euronext (Brussels). Non-voting core-capital securities: since the end of 2008, KBC Group NV has issued 7 billion euros in perpetual, non-transferable, non-voting core-capital securities that have equal ranking (pari passu) with ordinary shares upon liquidation. These have been subscribed by the Belgian State (the Federal Holding and Investment Company) and Flemish Region (each in the amount of 3.5 billion euros). The other features of the transactions are dealt with under ‘Capital transactions and guarantee agreements with the government in 2008 and 2009’ in the ‘Additional information’ section of the annual accounts 2014. In 2012, KBC repaid all of the securities held by the Belgian State to the tune of 3.5 billion euros including a 15% penalty (525
million euros in total).
On 3 July 2013, KBC repaid 1.17 billion euros worth of non-voting core capital securities held by the Flemish Regional Government including a 50% penalty (0.6 billion euros in total). On 8 January 2014, KBC repaid 0.33 billion euros (plus a penalty of 50% or 0.17 billion euros) worth of core-capital securities to the Flemish Regional Government. On 28 December 2015, KBC repaid the remaining 2 billion euros plus a penalty of 50% or an extra 1 billion euros to the Flemish Regional Government.
Related-party transactions (note 42 in the annual accounts 2014) A coupon on the core-capital securities to the Flemish Regional Government (171 million euros in total) was paid and accounted for in 2Q 2015. Over 2015 results, KBC does not intend to pay a dividend on shares entitled to dividend nor a coupon on the remaining non-voting core capital securities.
Non-voting core capital securities: at the end of 2015, KBC repaid fully the remaining state aid to the Flemish Regional Government (2 billion euro plus 50% penalty or 1 billion euros). More information: see Note 39. Consequently, the Flemish Regional Government is no longer a related party of KBC.
in number of shares 31-12-2014 31-12-2015
Ordinary shares 417 780 658 418 087 058
of which ordinary shares that entitle the holder to a dividend payment 417 780 658 418 087 058
of which treasury shares 488 2
Non-voting core-capital securities 67 796 608 0
Other information
Par value per ordinary share (in EUR) 3.48 3.48
Number of shares issued but not fully paid up 0 0

KBC Group I Extended quarterly report 4Q2015 I p. 44
Main changes in the scope of consolidation (note 45 in the annual accounts 2014)
In 2014:
- KBC sold its fully owned subsidiary KBC Bank Deutschland AG (3Q 2014), and - transformation fund Stabilita was deconsolidated (3Q 2014)
Both changes in scope impact the comparison of the income statement. In 2015:
- Volksbank Leasing Slovakia was consolidated for the first time in 3Q 2015: at the beginning of July 2015, KBC reached an agreement to acquire all the shares of Volksbank Leasing Slovakia and its insurance brokerage subsidiary, Volksbank Sprostredkovatel’ska. The deal has no material impact on KBC group’s earnings and capital (balance sheet total of Volksbank Leasing Slovakia is approximately 170 million euros), and
- KBC Bank NV merged with Antwerpse Diamantbank NV and KBC Lease Holding NV in 3Q 2015 (no impact), and
- KBC Bank liquidated KBC Financial Holding Inc. in 4Q 2015 (more information: see note 16 Income tax expense)
Post-balance sheet events (note 48 in the annual accounts 2014) Significant non-adjusting events between the balance sheet date (31 December 2015) and the publication of this report (18 February 2016): On 8 October 2012, a number of investors in the 5-5-5 issuance of KBC Group and a number of investors in the 5-5-5 issuance of KBC Ifima launched proceedings before the court of first instance in Brussels. In the procedure regarding the issuance of KBC Group the court of first instance has issued a decision (20 January 2016) in which a plaintiff saw assigned his claim. KBC has thoroughly studied the judgment and is of the opinion that there are sufficient grounds to reform the judgment in degree of appeal. Therefore KBC has decided to lodge an appeal. For more information on the events leading to this court procedure see the press release of 8 November 2011 or Note 8 ‘Other net income’ of the annual reports of 2011 and 2012.

KBC Group I Extended quarterly report 4Q2015 I p. 45
KBC Group
Risk and capital
management
4Q 2015 and
FY 2015

KBC Group I Extended quarterly report 4Q2015 I p. 46
Credit risk Snapshot of the credit portfolio (banking activities)
The main source of credit risk is the loan portfolio of the bank. A snapshot of the banking portfolio is shown in the table below. It includes all payment credit, guarantee credit (except for confirmations of letters of credit and similar export-/import-related commercial credit), standby credit and credit derivatives, granted by KBC to private persons, companies, governments and banks. Bonds held in the investment portfolio are included if they are corporate- or bank-issued, hence government bonds and trading book exposure are not included. Further on in this chapter, extensive information is provided on the credit portfolio of each business unit. Information specifically on sovereign bonds can be found under ‘note 47 (in the annual accounts 2014)’.
Credit risk: loan portfolio overview
Total loan portfolio (in billions of EUR) 31-12-2014 31-12-2015
Amount granted 166 174
Amount outstanding1 139 143
Total loan portfolio, by business unit (as a % of the portfolio of credit outstanding)
Belgium 64% 65%
Czech Republic 14% 14%
International Markets 18% 18%
Group Centre 4% 3%
Total 100% 100%
Total outstanding loan portfolio sector breakdown
Private persons Finance and insurance Authorities Corporates
services distribution real estate building & construction agriculture, farming, fishing automotive electricity food producers metals shipping chemicals machinery & heavy equipment traders hotels, bars & restaurants oil, gas & other fuels electrotechnics other2
41.9% 5.7% 3.6%
48.8% 10.9% 7.9% 7.3% 4.1% 2.8% 2.0% 1.7% 1.3% 1.5% 0.9% 1.1% 1.0% 1.0% 0.9% 0.7% 0.5% 3.1%
42.0 % 6.0% 3.4%
48.7% 11.2% 7.6% 7.1% 4.2% 2.8% 2.2% 1.6% 1.3% 1.3% 1.1% 1.0% 1.0% 0.9% 0.9% 0.8% 0.5% 3.0%
Total outstanding loan portfolio geographical breakdown
Home countries Belgium Czech Republic Ireland Slovakia Hungary Bulgaria
87.2% 56.7% 12.4% 10.3% 3.8% 3.5% 0.6%
87.6% 56.6% 13.3% 9.6% 4.4% 3.1% 0.6%
Rest of Western Europe France Netherlands Great Britain Spain Luxemburg Germany other
8.2% 1.9% 1.7% 1.3% 0.9% 0.6% 0.6% 1.2%
7.7% 1.9% 1.6% 1.2% 0.8% 0.7% 0.5% 1.1%
Rest of Central Europe Russia other
0.9% 0.2% 0.6%
0.5% 0.2% 0.4%
North America USA Canada
1.3% 1.2% 0.1%
1.5% 1.3% 0.2%
Asia China Hong Kong Singapore other
1.0% 0.4% 0.3% 0.2% 0.1%
0.8% 0.3% 0.2% 0.2% 0.1%
Rest of the world 1.5% 1.8%
The total outstanding loan amount related to oil, gas & other fuels stands at 1 214 million EUR as at the end of 2015. Of this, 45 million EUR is considered impaired (PD10-12) and is covered by impairments for 64%.

KBC Group I Extended quarterly report 4Q2015 I p. 47
Credit risk: loan portfolio overview
Total loan portfolio (in billions of EUR) 31-12-2014 31-12-2015
Impaired loans (in millions of EUR or %)
Amount outstanding 13 692 12 305
of which: more than 90 days past due 7 676 6 936
Ratio of impaired loans, per business unit
Belgium 4.3% 3.8%
Czech Republic 3.8% 3.4%
International Markets 34.1% 29.8%
Group Centre 8.6% 10.0%
Total 9.9% 8.6%
of which: more than 90 days past due 5.5% 4.8%
Specific loan loss impairments (in millions of EUR) and Cover ratio (%)
Specific loan loss impairments 5 709 5 517
of which: more than 90 days past due 4 384 4 183
Cover ratio of impaired loans
Specific loan loss impairments / impaired loans 42% 45%
of which: more than 90 days past due 57% 60%
Cover ratio of impaired loans, mortgage loans excluded
Specific loan loss impairments / impaired loans, mortgage loans excluded 51% 53%
of which: more than 90 days past due 70% 69%
Credit cost, by business unit (%)
Belgium 0.23% 0.19%
Czech Republic 0.18% 0.18%
International Markets 1.06% 0.32%
Slovakia 0.36% 0.32%
Hungary 0.94% 0.12%
Bulgaria 1.30% 1.21%
Ireland 1.33% 0.34%
Group Centre 1.17% 0.54%
Total 0.41% 0.23%
1. Outstanding amount includes all on-balance sheet commitments and off-balance sheet guarantees 2. Other includes corporate sectors not exceeding 0.5% concentration and unidentified sectors.
Impaired loans are loans for which full (re)payment of the contractual cash flows is deemed unlikely. This coincides with KBC’s Probability-of-Default-classes 10+11+12 (see annual accounts FY 2014 - section on credit risk for more information on PD classification). These impaired loans are equal to ‘non-performing loans’ under the definition used by EBA1.
1 Commission Implementing Regulation (EU) 2015/227 of 9 January 2015 amending Implementing Regulation (EU) No
680/2014 laying down implementing technical standards with regard to supervisory reporting of institutions according to
Regulation (EU) No 575/2013 of the European Parliament and of the Council.

KBC Group I Extended quarterly report 4Q2015 I p. 48
Credit portfolio per business unit (banking activities) Legend:
ind. LTV - Indexed ‘Loan To Value’: current outstanding loan / current value of property
Impaired loans: loans for which full (re)payment is deemed unlikely (coincides with KBC's PD-classes 10, 11 or 12)
Impaired loans that are more than 90 days past due: loans that are more than 90 days overdue (coincides with KBC's PD-classes 11+12)
Portfolio based impairments: impairments for non-impaired exposure (i.e. exposure with PD < PD 10)
Specific impairments: loan loss impairments for impaired exposure (i.e. exposure with PD 10, 11 or 12)
Cover ratio impaired loans: specific impairments / impaired loans
Loan portfolio Business Unit Belgium
31-12-2015, in millions of EUR
Total outstanding amount 87.416 5.398 92.813
Counterparty break down % outst. % outst. % outst.
SME / corporate 25.008 28,6% 5.398 100,0% 30.406 32,8%
retail 62.407 71,4% 0 0,0% 62.407 67,2%
o/w private 34.382 39,3% 0 0,0% 34.382 37,0%
o/w companies 28.025 32,1% 0 0,0% 28.025 30,2%
Mortgage loans (2) % outst. ind. LTV % outst. ind. LTV % outst.
total 33.284 38,1% 59% 0 0,0% - 33.284 35,9%
o/w FX mortgages 0 0,0% - 0 0,0% - 0 0,0%
o/w vintage 2007 and 2008 908 1,0% - 0 0,0% - 908 1,0%
o/w ind. LTV > 100% 1.398 1,6% - 0 0,0% - 1.398 1,5%
Probability of default (PD) % outst. % outst. % outst.
low risk (pd 1-4; 0.00%-0.80%) 66.917 76,6% 3.235 59,9% 70.153 75,6%
medium risk (pd 5-7; 0.80%-6.40%) 15.376 17,6% 1.489 27,6% 16.865 18,2%
high risk (pd 8-9; 6.40%-100.00%) 2.100 2,4% 133 2,5% 2.233 2,4%
impaired loans (pd 10 - 12) 3.012 3,4% 536 9,9% 3.549 3,8%
unrated 11 0,0% 3 0,1% 14 0,0%
Overall risk indicators spec. imp. % cover spec. imp. % cover spec. imp. % cover
outstanding impaired loans 3.012 1.321 43,9% 536 263 49,1% 3.549 1.585 44,7%
o/w pd 10 impaired loans 1.140 229 20,1% 335 103 30,7% 1.475 332 22,5%
o/w more than 90 days past due (pd 11+12) 1.873 1.092 58,3% 201 160 79,9% 2.074 1.252 60,4%
all impairments (specific + portfolio based) n.a. n.a. 1.662
o/w portfolio based impairments n.a. n.a. 78
o/w specific impairments 1.321 263 1.585
2014 Credit cost ratio (CCR) n.a. n.a. 0,23%
2015 CCR n.a. n.a. 0,19%
Remarks
(2) mortgage loans: only to private persons (as opposed to the accounting figures)
Belgium (1) Foreign branches Total Business Unit Belgium
(1) Belgium = KBC Bank (all retail and corporate credit lending activities except for the foreign branches), CBC, KBC Lease part Belgium, KBC Commercial Finance,

KBC Group I Extended quarterly report 4Q2015 I p. 49
Loan portfolio Business Unit Czech Republic
31-12-2015, in millions of EUR
Total outstanding amount 20 401 2 485
Counterparty break down % outst. % outst.
SME / corporate 7 221 35.4% 43 1.7%
retail 13 179 64.6% 2 442 98.3%
o/w private 9 276 45.5% 2 428 97.7%
o/w companies 3 903 19.1% 14 0.6%
Mortgage loans (1) % outst. ind. LTV % outst. ind. LTV
total 8 479 41.6% 59% 1 914 77.1% 66%
o/w FX mortgages 0 0.0% - 0 0.0% -
o/w vintage 2007 and 2008 1 111 5.4% - 197 7.9% -
o/w ind. LTV > 100% 344 1.7% - 165 6.6% -
Probability of default (PD) % outst. % outst.
low risk (pd 1-4; 0.00%-0.80%) 14 285 70.0% 1 628 65.5%
medium risk (pd 5-7; 0.80%-6.40%) 4 662 22.9% 611 24.6%
high risk (pd 8-9; 6.40%-100.00%) 677 3.3% 169 6.8%
impaired loans (pd 10 - 12) 701 3.4% 76 3.1%
unrated 76 0.4% 0 0.0%
Overall risk indicators (2) spec. imp. % cover spec. imp. % cover
outstanding impaired loans 701 376 53.6% 76 33 43.9%
o/w pd 10 impaired loans 194 46 23.8% 20 2 11.7%
o/w more than 90 days past due (pd 11+12) 507 330 65.1% 56 31 55.1%
all impairments (specific + portfolio based) 415 40
o/w portfolio based impairments 39 7
o/w specific impairments 376 33
2014 Credit cost ratio (CCR) 0.18% n/a
2015 CCR 0.18% n/a
(1) mortgage loans: only to private persons (as opposed to the accounting figures)
(2) CCR at country level based on local currency
(3) ČMSS: pro-rata figures, corresponding with KBC's 55%-participation in ČMSS
For information: ČMSS3
(consolidated via equity-method since
1Q14)

KBC Group I Extended quarterly report 4Q2015 I p. 50
Loan portfolio Business Unit International Markets
31-12-2015, in millions of EUR
Total outstanding amount 13 927 6 045 4 542 858 25 378
Counterparty break down % outst. % outst. % outst. % outst. % outst.
SME / corporate 2 233 16.0% 2 604 43.1% 2 297 50.6% 364 42.4% 7 504 29.6%
retail 11 694 84.0% 3 441 56.9% 2 245 49.4% 494 57.6% 17 874 70.4%
o/w private 11 676 83.8% 2 790 46.2% 1 715 37.8% 309 36.0% 16 489 65.0%
o/w companies 18 0.1% 651 10.8% 530 11.7% 186 21.6% 1 385 5.5%
Mortgage loans (1) % outst. ind. LTV % outst. ind. LTV % outst. ind. LTV % outst. ind. LTV % outst.
total 11 666 83.8% 91% 2 219 36.7% 66% 1 574 34.7% 80% 161 18.8% 70% 15 621 61.6%
o/w FX mortgages 0 0.0% - 0 0.0% - 15 0.3% 140% 68 8.0% 71% 83 0.3%
o/w vintage 2007 and 2008 3 896 28.0% - 127 2.1% - 707 15.6% - 33 3.9% - 4 763 18.8%
o/w ind. LTV > 100% 3 869 27.8% - 42 0.7% - 438 9.6% - 11 1.3% - 4 360 17.2%
Probability of default (PD) % outst. % outst. % outst. % outst. % outst.
low risk (pd 1-4; 0.00%-0.80%) 553 4.0% 4 105 67.9% 2 067 45.5% 168 19.5% 6 891 27.2%
medium risk (pd 5-7; 0.80%-6.40%) 5 472 39.3% 1 415 23.4% 1 631 35.9% 372 43.3% 8 911 35.1%
high risk (pd 8-9; 6.40%-100.00%) 1 321 9.5% 262 4.3% 268 5.9% 117 13.6% 1 953 7.7%
impaired loans (pd 10 - 12) 6 581 47.3% 221 3.7% 572 12.6% 199 23.2% 7 573 29.8%
unrated 0 0.0% 43 0.7% 5 0.1% 2 0.3% 50 0.2%
Overall risk indicators (2) spec. imp. % cover spec. imp. % cover spec. imp. % cover spec. imp. % cover spec. imp. % cover
outstanding impaired loans 6 581 2 723 41.4% 221 123 55.8% 572 324 56.7% 199 89 44.6% 7 573 3 259 43.0%
o/w pd 10 impaired loans 3 294 830 25.2% 48 19 40.1% 149 49 33.0% 22 1 4.7% 3 512 900 25.6%
o/w more than 90 days past due (pd 11+12) 3288 1 893 57.6% 172 104 60.2% 423 275 65.1% 177 88 49.5% 4061 2 360 58.1%
all impairments (specific + portfolio based) 2799 135 337 92 3363
o/w portfolio based impairments 76 11 12 3 104
o/w specific impairments 2723 123 324 89 3259
2014 Credit cost ratio (CCR) 1.33% 0.36% 0.94% 1.30% 1.06%
2015 CCR 0.34% 0.32% 0.12% 1.21% 0.32%
Remarks
Ireland = KBC Bank Ireland (incl. former KBC Homeloans)
Total Int Markets: total outstanding amount includes a small amount of KBC internal risk sharings which were eliminated at country level
(1) mortgage loans: only to private persons (as opposed to the accounting figures); For Ireland: only KBC Homeloans exposure
(2) CCR at country level based on local currency
Ireland Slovakia Hungary Bulgaria Total Int Markets

KBC Group I Extended quarterly report 4Q2015 I p. 51
Loan portfolio Group Centre
31-12-2015, in millions of EUR
Total outstanding amount 4.808
Counterparty break down % outst.
SME / corporate 4.808 100,0%
retail 0 0,0%
o/w private 0 0,0%
o/w companies 0 0,0%
Mortgage loans (1) % outst. ind. LTV
total 0 0,0% -
o/w FX mortgages 0 0,0% -
o/w vintage 2007 and 2008 0 0,0% -
o/w ind. LTV > 100% 0 0,0% -
Probability of default (PD) % outst.
low risk (pd 1-4; 0.00%-0.80%) 2.573 53,5%
medium risk (pd 5-7; 0.80%-6.40%) 1.444 30,0%
high risk (pd 8-9; 6.40%-100.00%) 308 6,4%
impaired loans (pd 10 - 12) 482 10,0%
unrated 1 0,0%
Overall risk indicators spec. Imp. % cover
outstanding impaired loans 482 297 61,6%
o/w pd 10 impaired loans 188 56 29,7%
o/w more than 90 days past due (pd 11+12) 295 241 81,9%
all impairments (specific + portfolio based) 306
o/w portfolio based impairments 9
o/w specific impairments 297
2014 Credit cost ratio (CCR) 1,17%
2015 CCR 0,54%
Remarks
Total Group Centre = KBC Finance Ireland, KBC Credit Investments (legacy & and part of non-legacy portfolio assigned to BU Group),
KBC FP (ex-Atomium assets), KBC Lease UK, KBC Bank part Group (a.o. activities in wind-down: e.g. ex-Antwerp Diamond Bank)
(1) mortgage loans: only to private persons (as opposed to the accounting figures)
Total Group Centre
(mainly KBC Finance Ireland, KBC Credit
Investments and ex-Antwerp Diamond Bank
(in wind-down))

KBC Group I Extended quarterly report 4Q2015 I p. 52
Solvency
KBC reports its solvency at group, banking and insurance level, calculating it on the basis of IFRS figures and the relevant guidelines issued by the competent regulator.
Solvency KBC Group
Under Basel III (CRDIV/CRR), which is the applicable guideline as from 1 January 2014 onward, for group solvency the insurance participation is to be deducted from common equity at KBC Group level, unless the competent authority grants the permission to apply a risk weighting instead. KBC received this permission from the National Bank of Belgium (NBB) and allocates a 370% weighting to the holdings of own funds instruments of the insurance company, after having deconsolidated KBC Insurance from the KBC Group consolidated figures. This is the so-called ‘Danish compromise’. The NBB has confirmed to KBC that the non-voting core capital securities will be fully grandfathered as common equity under CRDIV until the end of 2017. At the end of 2015, KBC repaid fully the remaining core capital securities, i.e. state aid to the Flemish Regional Government (2 billion euro plus 50% penalty or 1 billion euros). For more information, see Note 39. In addition to the solvency ratios under CRD IV/CRR, KBC is considered a financial conglomerate since it covers both significant banking and insurance activities. Therefore KBC also has to disclose its solvency position as calculated in accordance with the Financial Conglomerate Directive (FICOD; 2002/87/EC). KBC meets the FICOD requirement by aligning the building block method with method 1 (the accounting consolidation method) under FICOD. This implies that available capital is calculated on the basis of the consolidated position of the group and the eligible items recognised as such under the prevailing sectoral rules, which are CRR/CRD IV for the banking business and Solvency I for the insurance business. The capital requirement for the insurance business based on Solvency I is multiplied by 12.5 to obtain a risk weighted asset equivalent. The Internal Rating Based (IRB) approach is since its implementation in 2008 the primary approach to calculate KBC’s risk weighted assets. This is, based on a full application of all the CRD IV/CRR rules, used for approximately 84% of the weighted credit risks, of which approx. 78% according to Advanced and approx. 6% according to Foundation approach. Note that, retail exposure treated under IRB is always subject to an Advanced approach. The remaining weighted credit risks (ca. 16%) are calculated according to the Standardised approach. 12% of the latter, under the Danish Compromise, are the 370% risk-weighted holdings of own funds instruments of the insurance company. In 2012 the NBB granted permission to KBC to use the IRB-Advanced approach to calculate own funds requirements for credit risk. This decision was accompanied with a set of terms and conditions imposed by NBB, including a number of additional margins of conservatism with impact on RWA. The NBB has now acknowledged the significant progress made and has concluded that these terms and conditions have been fulfilled by KBC. As a result the regulatory imposed additional levels of conservatism are not applicable anymore as of June 2015, resulting in a 3.8 billion euros decrease in credit RWA in 2Q 2015. Mid-March 2015, KBC received its solvency target for 2015 from the European Central Bank (ECB), which had assumed responsibility from the NBB in November 2014 for supervising KBC under the Single Supervisory Mechanism (SSM). Consequently, KBC is required to maintain a minimum fully loaded common equity ratio (including latent gains on available-for-sale securities) of 10.5% under both Solvency tests. As at the end of December 2015 , KBC’s fully loaded common equity ratio (including latent gains on available-for-sale securities) under Basel III (CRDIV/CRR) stood at 14.9% which represents a capital buffer of 3.9 billion euros relative to the targeted 10.5%. At the same time, the fully loaded common equity ratio (under FICOD) was 14.6% , which represented a capital buffer of 3.8 billion euros relative to the targeted 10.5%. On 26 October 2015, the National Bank of Belgium announced its new capital buffers for Belgian systemically important banks, including KBC’s. These new buffers will be introduced in phases starting from 2016 and are on top of the minimum capital requirements (Joint Capital Decision) that the ECB imposes every year. The additional buffer for KBC will be 0.5% CET1 (phased in, under the Danish compromise) in 2016, and will gradually increase over a 3-year period, reaching 1.5% in 2018. On 27 November 2015, KBC disclosed its new ECB minimum capital requirement, i.e. for 2016. The 2016 minimum CET1 ratio to uphold was set at at least 9.75% (phased-in, Danish Compromise). For further information see press release of 26 October 2015 on www.kbc.com. This combined with the by the NBB set buffer brings the total regulatory minimum CET1 at 10.25% (phased in, under Danish compromise).

KBC Group I Extended quarterly report 4Q2015 I p. 53
* The decrease in RWA contribution by Insurance is mainly attributable to the replacement of shareholder capital by an intra-group Tier-2 loan in the amount of 500 million euros subscribed by KBC Group in 1Q 2015. For more information see the press release of 18 December 2014 on www.kbc.com.
In millions of EUR 31-12-2014 31-12-2015
Danish compromise - Fully loaded Fully loaded Phased-in Fully loaded Phased-in
Total regulatory capital, KBC Group (after profit appropriation) 16 688 16 723 16 936 17 305
Tier-1 capital 14 476 14 136 14 647 14 691
Common equity 13 076 12 684 13 247 13 242
Parent shareholders' equity (after deconsolidating KBC Insurance) 12 592 12 592 14 075 14 075
Non-voting core capital securities 2 000 2 000 0 0
Intangible fixed assets (incl deferred tax impact) (-) - 334 - 334 - 366 - 366
Goodwill on consolidation (incl deferred tax impact) (-) - 769 - 769 - 482 - 482
Minority interests - 3 - 3 0 0
AFS revaluation reserve shares (-) - 116 0
AFS revaluation reserve sovereign bonds (-) - 613 - 402
AFS revaluation reserve other bonds(-) 50 - 64
AFS revaluation reserve other (-) 0 0
Hedging reserve (cash flow hedges) (-) 1 391 1 391 1 163 1 163
Valuation diff. in fin. liabilities at fair value - own credit risk (-) - 21 - 21 - 20 - 20
Value adjustment due to the requirements for prudent valuation (-) - 92 - 43 - 94 - 53
Equalization reserve (-)
Dividend payout (-) - 836 - 836 0 0
Renumeration of government securities (-) - 171 - 171 0 0
Renumeration of AT1 instruments (-) - 2 - 2 - 2 - 2
Deduction re. financing provided to shareholders (-) - 159 - 159 - 91 - 91
IRB provision shortfall (-) - 225 - 225 - 171 - 171
Deferred tax assets on losses carried forward (-) - 297 - 59 - 765 - 345
Limit on deferred tax assets from timing differences relying on future
profitability and significant participations in financial sector entities (-) 0 0 0 0
Additional going concern capital 1 400 1 452 1 400 1 450
Grandfathered innovative hybrid tier-1 instruments 0 52 0 50
Grandfathered non-innovative hybrid tier-1 instruments 0 0 0 0
CRR compliant AT1 instruments 1 400 1 400 1 400 1 400
Minority interests to be included in additional going concern capital 0 0 0 0
Tier 2 capital 2 212 2 587 2 289 2 614
IRB provision excess (+) 375 357 369 359
Subordinated liabilities 1 837 2 230 1 920 2 255
Subordinated loans non-consolidated financial sector entities (-) 0 0 0 0
Minority interests to be included in tier 2 capital 0 0 0 0
Capital requirement
Total weighted risk volume 91 236 88 382 89 067 87 343
Banking 80 232 77 379 79 758 78 034
Insurance* 10 897 10 897 9 133 9 133
Holding activities 191 191 208 208
Elimination of intercompany transactions - 85 - 85 - 33 - 33
Solvency ratios
Common equity ratio 14.33% 14.35% 14.87% 15.16%
Tier-1 ratio 15.87% 15.99% 16.44% 16.82%
CAD ratio 18.29% 18.92% 19.01% 19.81%
Capital buffer
Common equity capital 13 076 13 247
Required pillar 2 capital (10.5%) 9 580 9 352
Capital buffer vs pillar 2 target 3 497 3 895

KBC Group I Extended quarterly report 4Q2015 I p. 54
Following table groups the solvency on the level of KBC according to different methodologies and calculation methods.
In millions of EUR
FICOD - Fully loaded 31-12-2014 31-12-2015
Common Equity 13 528 13 508
IFRS Parent shareholders equity KBC Group (consolidated) 13 125 14 411
+ Yield Enhanced Securities (YES) 2 000 0
- Dividend, coupon YES, coupon AT1 -1 008 -2
+ Eligible own funds elements CRR/CRD IV (banking) -508 -826
+ Eligible own funds elements Solvency I (Insurance) -80 -75
Total weighted risk volume 92 596 92 565
Banking 80 232 79 758
Insurance 12 257 12 632
Holding activities 191 208
Elimination of intercompany transactions -85 -33
Solvency ratio
Common equity ratio 14.61% 14.59%
Capital buffer
Buffer vs. 10.5% CET1 3 806 3 789
Overview of KBC Group's capital ratios - In millions of EUR - 31-12-2015
numerator
(common equity)
denominator
(Total weighted risk volume) ratio (%)
CRDIV, Common Equity ratio
Phased-in 13 242 87 343 15.16%
Fully loaded 13 247 89 067 14.87%
Deduction Method Fully loaded 12 103 83 245 14.54%
Financial Conglomerates Directive*
Fully loaded 13 508 92 565 14.59%
* KBC aligned the building block method with method 1 (the accounting consolidation method) under FICOD
Danish Compromise

KBC Group I Extended quarterly report 4Q2015 I p. 55
Leverage ratio KBC Group
The leverage ratio remained almost stable compared to the end of 2014 thanks to the higher Tier-1 capital (an overview of Tier-1 capital can be found above), more than offset by higher total exposures.
Solvency banking and insurance activities separately
The tables below show the tier-1 and CAD ratios calculated under Basel III (CRD IV/CRR) for KBC Bank, as well as the solvency ratio of KBC Insurance. More information on the solvency of KBC Bank and KBC Insurance as at 31-12-2014 can be found in their annual accounts and in the KBC Risk Report on www.kbc.com.
In millions of EUR
Leverage ratio KBC Group (Basel III fully loaded) 31-12-2014 31-12-2015
Tier-1 capital (Danish compromise) 14 476 14 647
Total exposures 226 669 233 675
Total Assets 245 174 252 355
Deconsolidation KBC Insurance -27 708 -31 545
Adjustment for derivatives -3 246 -3 282
Adjustment for regulatory corrections in determining Basel III Tier-1 capital -1 559 - 806
Adjustment for securities financing transaction exposures 266 1 057
Off-balance sheet exposures 13 742 15 897
Leverage ratio 6.39% 6.27%
Solvency, KBC Bank consolidated (in millions of EUR) - Fully loaded 31-12-2014 31-12-2015
Total regulatory capital, after profit appropriation 14 154 16 045
Tier-1 capital 11 132 12 346
Of which common equity 9 727 10 941
Tier-2 capital 3 021 3 699
Total weighted risks 80 232 79 758
Credit risk 67 197 66 387
Market risk 2 424 3 100
Operational risk 10 611 10 272
Solvency ratios
Common equity ratio 12.1% 13.7%
Tier-1 ratio 13.9% 15.5%
CAD ratio 17.6% 20.1%
Solvency, KBC Insurance consolidated (in millions of EUR) 31-12-2014 31-12-2015
Available capital 3 166 2 922
Required solvency margin 981 1 011
Solvency ratio and surplus
Solvency ratio (%) 323% 289%
Solvency surplus (in millions of EUR) 2 185 1 911

KBC Group I Extended quarterly report 4Q2015 I p. 56
The solvency of KBC Insurance is currently calculated on the basis of Solvency I rules. As of the first of January 2016 Solvency II will enter into force. Solvency II is the new regulatory solvency regime for all EU insurance and reinsurance companies. Whereas current Solvency I requirements are volume-based, Solvency II pursues a risk-based approach. It aims to implement solvency requirements that better reflect the risks that companies face and deliver a supervisory system that is consistent across all EU Member States.
Solvency II, KBC Insurance consolidated (in millions of EUR) 31-12-2015
Own Funds 3 683
Tier 1 3 180
IFRS Parent shareholders equity 2 815
Dividend payout -71
Deduction intangible assets and goodwill (after tax) -123
Valuation differences (after tax) 416
Volatility adjustment 195
Other -53
Tier 2 503
Subordinated liabilities 503
Solvency Capital Requirement (SCR) 1 592
Market risk 1 472
Non-life 498
Life 594
Health 173
Counterparty 83
Diversification -840
Other -389
Solvency II ratio 231%
Solvency surplus vs 100% 2 091