katrina a classic hurricane katrina & the...
TRANSCRIPT
Oceanography 101, Richard Strickland Lecture 11 © 2006 University of Washington
What Causes the Winds?
• Processes that cause air to start moving
• Processes that affect how the wind moves
• Two categories of wind
– Prevailing Winds
– Transient & storm winds
• Global patterns of prevailing winds
• Local/regional patterns of transient & storm winds
• Starting point: Katrina & hurricanes
1
Oceanography 101, Richard Strickland Lecture 11 © 2006 University of Washington
Katrina as a Model
2 www.nhc.noaa.gov/archive/2005/KATRINA.shtml?
www.aoml.noaa.gov/hrd/Storm_pages/katrina2005/sat.html
• Counterclockwise spiral
– Damage worse to the east
– Moves E to W
• Grows overthe ocean
– Pressuredecreases
– Windsincrease
• Weakensover land
www.nhc.noaa.gov/pastall.shtmlwww.nhc.noaa.gov/pdf/TCR-AL122005_Katrina.pdf
Oceanography 101, Richard Strickland Lecture 11 © 2006 University of Washington
Katrina a Classic Hurricane
3
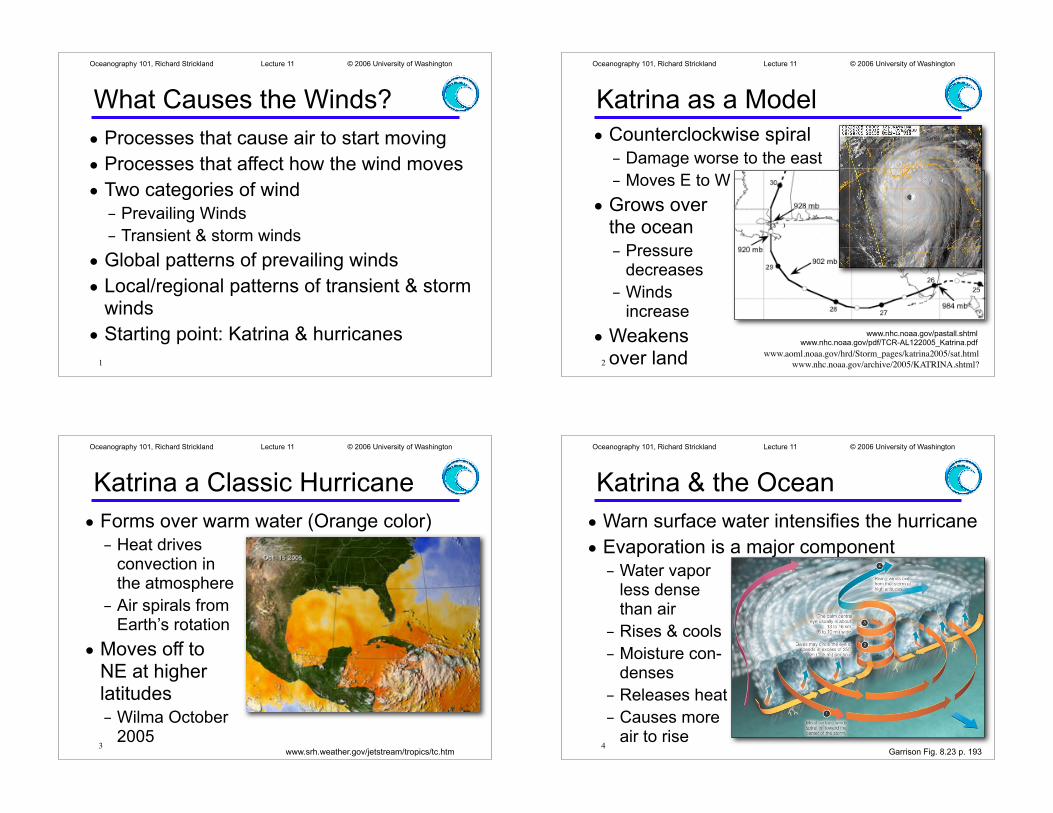
• Forms over warm water (Orange color)
– Heat drivesconvection inthe atmosphere
– Air spirals fromEarth’s rotation
• Moves off toNE at higherlatitudes
– Wilma October2005
www.srh.weather.gov/jetstream/tropics/tc.htm
Oceanography 101, Richard Strickland Lecture 11 © 2006 University of Washington
Katrina & the Ocean
4
• Warn surface water intensifies the hurricane
• Evaporation is a major component
– Water vaporless dense than air
– Rises & cools
– Moisture con-denses
– Releases heat
– Causes moreair to rise
Garrison Fig. 8.23 p. 193

Oceanography 101, Richard Strickland Lecture 11 © 2006 University of Washington
Cyclone Basics
• An exaggerated case of a very common atmospheric phenomenon
– Low-pressure system or cyclone
• Cyclones driven by air heated at the surface
– Warm air rises
– Air is drawn alongthe surface toreplace rising air
– Air spirals counter-clockwise becauseof Earth’s rotation
5 http://earthobservatory.nasa.gov/Library/Hurricanes/
Oceanography 101, Richard Strickland Lecture 11 © 2006 University of Washington
A Model for Global Winds
• ALL winds driven by surface heating
– Warm air rises
– Air drawn along the surface to replace rising air
•Wind!
– What goes up,must come down
•Cooler air sinkssomewhere
•Uneven heating
•Createsconvection cells6 Garrison Fig. 8.7 p. 182
Oceanography 101, Richard Strickland Lecture 11 © 2006 University of Washington
Atmospheric Convection
• Low latitudes are warmer than high latitudes
– But temperature difference is not nearly as great as thedifference insolar heating.
– Heat is trans-ported from lowlatitudes to highlatitudes.
7 Garrison Fig. 8.4 p. 180
Oceanography 101, Richard Strickland Lecture 11 © 2006 University of Washington
Atmospheric Convection
• Both ocean & atmosphere transport heat
– Movement of air = convection & wind
•Water vapor also transports heat
– Movement of water = convection & currents
8

Oceanography 101, Richard Strickland Lecture 11 © 2006 University of Washington
Atmospheric Convection
• At low latitudes the sea surface is heated
– Tremendous evaporation from the oceans
– Warm, moist air rises
– The air cools as it rises
– Cool air can hold less water vapor
– So as the air rises, moisture condenses
– Thus there is a belt of high precipitation (rain) near the equator
9
Oceanography 101, Richard Strickland Lecture 11 © 2006 University of Washington
Atmospheric Convection
• Not all this moisture condenses over the equator, however.
– Some of it rises and spreads north and south toward higher latitudes.
– Eventually this air cools and sinks back to the surface.
– As it does, more moisture condenses and causes rain (and snow) at these higher latitudes.
10
Oceanography 101, Richard Strickland Lecture 11 © 2006 University of Washington
Atmospheric Convection
• Heat is thus transported by both the warm air and the latent heat of vaporization.
– Energy required to convert water to vapor at same temperature
– LHOV is transferred from water vapor to air when the moisture condenses again
– Either over the equator or at higher latitudes.
11
Oceanography 101, Richard Strickland Lecture 11 © 2006 University of Washington
Atmospheric Convection
• A simple model of the atmosphere
– Assumes all ocean and not rotating
– Large convection cells N & S of equator
– Cooler, drier air sinks at poles
– Returns to low latitudesalong the surface
– Replaces air that risesnear the equator
Fig. 6.15
12

Oceanography 101, Richard Strickland Lecture 11 © 2006 University of Washington
Atmospheric Convection
Fig. 6.1913
• Actually 3 convection cells in eachhemisphere.
– Created by Earth’s rotation
– Air aloft sinks at about 30˚ N and 90˚ N
– Surface air risesat about 60˚ N.
Oceanography 101, Richard Strickland Lecture 11 © 2006 University of Washington
Atmospheric Pressure
• Rising warm, moist air is less dense
– Creates lower atmospheric pressure
Fig. 6.1914
Oceanography 101, Richard Strickland Lecture 11 © 2006 University of Washington
Atmospheric Pressure
• Sinking dry air is more dense
• Creates higher atmospheric pressure
15
Oceanography 101, Richard Strickland Lecture 11 © 2006 University of Washington
Convergence & divergence
16
• At surface where air along the surface comes together & rises: convergence.
– Low pressure at 0˚ and 60˚ N
• At surface where air sinks & spreads out: divergence
– High pressureat 30˚ &90˚ N

Oceanography 101, Richard Strickland Lecture 11 © 2006 University of Washington
Atmospheric Symmetry
• Convection andhigh & lowpressurepatterns aresymmetrical inNorthern &Southernhemispheres
17
Oceanography 101, Richard Strickland Lecture 11 © 2006 University of Washington
• Belts of lowpressure & high precipitation at0˚ and about60˚N & Slatitudes
• Latitudes oftropical andtemperate rainforests
Atmospheric Symmetry
18
Oceanography 101, Richard Strickland Lecture 11 © 2006 University of Washington
• Belts of highpressure & lowprecipitationat about 30˚ & 90˚ N & Slatitudes.
• Latitudes ofmajor deserts
Atmospheric Symmetry
19
Oceanography 101, Richard Strickland Lecture 11 © 2006 University of Washington
A Model for Climate
20
• Rising air in the tropics & condensation
– Global belt of wet climate at tropical latitudes
• Another wet belt at temperate - subpolar latitudes
– Seattle
– Nov.1979average
– Rainforests
http://earthobservatory.nasa.gov/Observatory/Datasets/rainfall.gpcp.html

Oceanography 101, Richard Strickland Lecture 11 © 2006 University of Washington
A Model for Climate
21
• Desert belts indicate sinking & drying air
– Sahara, Kalahari, Gobi, Australian outback
– Poles are deserts too!
•But moisture accumulates as snow & ice
http://earthobservatory.nasa.gov/Observatory/Datasets/rainfall.gpcp.html
Oceanography 101, Richard Strickland Lecture 11 © 2006 University of Washington
Winds
• Driven by differences in pressure
– From High to Low pressure
• In this convection model, all winds would be directly fromNorth or South
22
Oceanography 101, Richard Strickland Lecture 11 © 2006 University of Washington
• Note: winds are named for the direction from which they blow
• Prevailing winds come mainly from E & W
• Coriolis Effect
– Moving objectsturn right inN. Hemi-sphere
– Left in S.hemi-sphere
Winds
23
Oceanography 101, Richard Strickland Lecture 11 © 2006 University of Washington
Coriolis Effect
• Some people call it Coriolis “force.”
– As if it diverts moving objects from a straight line.
• It is not a real force.
– Objects actually travel in a straight line.
– It’s the Earth that is turning.
– It is simply an effect of being on a rotating body.
24

Oceanography 101, Richard Strickland Lecture 11 © 2006 University of Washington
Formula for Coriolis
• Coriolis Effect f=2! sin " v.
• 2! + rotation rate of the earth (a constant)
• sin " = 0 to 1 depending on latitude
– Coriolis Effect is zero at the equator and maximum at the poles
• V = speed of moving object
– Greater effect at higher speeds
25
Oceanography 101, Richard Strickland Lecture 11 © 2006 University of Washington
Atmospheric Zonal Circulation
• Coriolis effect + 3 convection cells
• Equator to 30˚ N
– Surface air is moving toward south
– So it turns right, toward the west
– Forms a belt of easterly winds (from the east)
– Trade Winds.
26
Oceanography 101, Richard Strickland Lecture 11 © 2006 University of Washington
Atmospheric Zonal Circulation
• 30˚ N to 60˚ N
– Surface air is moving toward north
– So it turns right, toward the east
– Forms a belt of westerly winds (from the west)
– Prevailing Westerlies.
27
Oceanography 101, Richard Strickland Lecture 11 © 2006 University of Washington
Atmospheric Zonal Circulation
• 60˚ N to 90˚ N
– Surface air is moving toward south
– So it turns right, toward the west
– Forms a belt of easterly winds (from the east)
– Polar Easterlies.
28

Oceanography 101, Richard Strickland Lecture 11 © 2006 University of Washington
Atmospheric Zonal Circulation
• Direction of winds is symmetrical in S. Hemisphere
– Coriolis is oppositeto the left
• Trade Windsfrom the East
• PrevailingWesterlies
• Polar Easterlies
29
Oceanography 101, Richard Strickland Lecture 11 © 2006 University of Washington
Atmospheric Zonal Circulation
• Equator is a transition zone
– Air movement is vertical more than horizontal
– Region of weak surface winds
– Doldrums
30
Oceanography 101, Richard Strickland Lecture 11 © 2006 University of Washington
Atmospheric Zonal Circulation
• 30˚ N & S also transition zones
– Air movement is vertical more than horizontal
– Region of weak surface winds
– Horse Latitudes
31
Oceanography 101, Richard Strickland Lecture 11 © 2006 University of Washington
Atmospheric Zonal Circulation
• 60˚ N & S are regions of strong winds
– “The polar front” & jet stream
– Strong temperature contrast between converging temperate and polar air masses
– No such contrast at lower latitudes.
32