katarina kraljic fr´ed ´eric bournaud arxiv:1207.0351v1 ... · katarina kraljic laboratoire aim...
TRANSCRIPT
arX
iv:1
207.
0351
v1 [
astr
o-ph
.GA
] 2
Jul
201
2Draft version June 21, 2018Preprint typeset using LATEX style emulateapj v. 5/2/11
THE TWO-PHASE FORMATION HISTORY OF SPIRAL GALAXIES TRACED BY THE COSMICEVOLUTION OF THE BAR FRACTION
Katarina KraljicLaboratoire AIM Paris-Saclay, CEA/IRFU/SAp, CNRS/INSU, Universite Paris Diderot, 91191 Gif-sur-Yvette Cedex, France.
Frederic BournaudLaboratoire AIM Paris-Saclay, CEA/IRFU/SAp, CNRS/INSU, Universite Paris Diderot, 91191 Gif-sur-Yvette Cedex, France.
and
Marie MartigCentre for Astrophysics and Supercomputing, Swinburne University of Technology, PO Box 218, Hawthorn, VIC 3122, Australia.
Draft version June 21, 2018
ABSTRACT
We study the evolution of galactic bars and the link with disk and spheroid formation in a sample ofzoom-in cosmological simulations. Our simulation sample focuses on galaxies with present-day stellarmasses in the 1010−11 M⊙ range, in field and loose group environments, with a broad variety of massgrowth histories. In our models, bars are almost absent from the progenitors of present-day spiralsat z > 1.5, and they remain rare and generally too weak to be observable down to z ≈ 1. After thischaracteristic epoch, the fractions of observable and strong bars raise rapidly, bars being present in80% of spiral galaxies and easily observable in two thirds of these at z ≤ 0.5. This is quantitativelyconsistent with the redshift evolution of the observed bar fraction, although the latter is presentlyknown up to z ≈ 0.8 because of band-shifting and resolution effects. Our models hence predict thatthe decrease in the bar fraction with increasing redshift should continue with a fraction of observablebars not larger than 10-15% in disk galaxies at z > 1. Our models also predict later bar formationin lower-mass galaxies, in agreement with existing data. We find that the characteristic epoch ofbar formation, namely redshift z ≈ 0.8 − 1 in the studied mass range, corresponds to the epoch atwhich today’s spirals acquire their disk-dominated morphology. At higher redshift, disks tend to berapidly destroyed by mergers and gravitational instabilities and rarely develop significant bars. Wehence suggest that the bar formation epoch corresponds to the transition between an early “violent”phase of spiral galaxy formation at z ≥ 1 and a late “secular” phase at z ≤ 0.8. In the secularphase, the presence of bars substantially contributes to the growth of the (pseudo-)bulge, but thebulge mass budget remains statistically dominated by the contribution of mergers, interactions anddisk instabilities at high redshift. Early bars at z > 1 are often short-lived, while most of the barsformed at z ≤ 1 persist down to z = 0, late cosmological gas infall being necessary to maintain someof them.Subject headings: Galaxies: formation—Galaxies: evolution—Galaxies: spiral — Galaxies: structure
— Galaxies: bulges
1. INTRODUCTION
Bars are one of the most frequently and easily quanti-fied substructures in spiral galaxies, and are hence oftenused as a tracer of galaxy evolution. Most spiral galaxiestoday contain a central bar, although with largely vari-able amplitudes (Block et al. 2002; Whyte et al. 2002).Spiral arms are equally common in optical light, but aremuch weaker in the near-infrared light that more closelytraces the stellar mass distribution, and the strength ofbars is generally easier to quantify independently of theimaging sensitivity.Both the formation of bars and their time evolution
are connected to the baryonic and dark matter propertiesof their host galaxies, and their mass assembly history.Bars form spontaneously in stellar disks that are suffi-ciently massive and dynamically cold to be gravitation-ally unstable, with typical Toomre stability parametersQ ≈ 1.5 − 2.0 (Toomre 1963; Combes & Sanders 1981;Gerin et al. 1990; Combes & Elmegreen 1993), and canalso be amplified by dynamical friction on the dark mat-
ter halo (Athanassoula 2002). The gaseous content canalso trigger bars: gas helps to form outer spiral arms,which can remove angular momentum from the inner re-gions and strengthen a bar seed (Bournaud et al. 2005).Once formed, bars evolve through the exchange
of angular momentum with the dark matter halos(Weinberg 1985; Debattista & Sellwood 2000), as wellas with stellar and gaseous disks (Friedli & Benz 1993;Bournaud & Combes 2002; Bournaud et al. 2005). Thiscan reinforce bars when they lose angular momentum,but can also weaken and destroy them in the oppositecase (Bournaud et al. 2005). Bars can also be weakenedor destroyed by the growth of central mass concentra-tions (Hasan & Norman 1990; Pfenniger & Friedli 1991;Hasan et al. 1993), however central concentrations withlow-enough mass and/or low-enough mass growth ratescould have little effect on real bars (Athanassoula et al.2005). If bars are formed in conditions where theyare intrinsically short-lived, sufficient accretion of ex-ternal gas onto the disk could enable their survival
2
or re-formation (Bournaud & Combes 2002). In ad-dition, galaxy interactions could in theory trigger bar(re-)formation (Gerin et al. 1990; Miwa & Noguchi 1998;Berentzen et al. 2004), although observations do notshow a clear environmental dependence of the bar indisk galaxies (van den Bergh 2002; Aguerri et al. 2009;Barway et al. 2011; Lee et al. 2012).Hence, the fraction of barred galaxies, and the red-
shift evolution of this fraction, are fundamental tracersof the evolution history of galaxies: this indicates whendisks became sufficiently massive and self-gravitating tobe bar-unstable, and whether the conditions for bars be-ing long-lived or re-formed were met. Furthermore, barscan directly drive structural evolution of their host galax-ies. They trigger radial gas flows and may provide gasto nuclear disks and central black holes (Knapen et al.2000; Laine et al. 2002; Laurikainen et al. 2004). Theycan also thicken through vertical resonances, leading tothe formation of pseudo-bulges – i.e. , bulges with rela-tively low concentration and substantial residual rotation(e.g., Bureau & Freeman 1999; Kormendy & Kennicutt2004; Martinez-Valpuesta et al. 2006).
In the nearby Universe, the bar fraction in disk galax-ies is very high. Depending on classification tech-niques, the fraction of strong bars in the optical lightis at least 50% (Barazza et al. 2008). Optical clas-sifications reveal roughly one third of strongly barredgalaxies, one third of weakly or moderately barredgalaxies, and one third of optically unbarred galax-ies (de Vaucouleurs et al. 1991). In the near-infrared,where weak bars are not obscured by dust and moreeasily distinguished from spiral arms, the bar fractionis at least 80% (Eskridge et al. 2000; Block et al. 2002;Whyte et al. 2002; Menendez-Delmestre et al. 2007).The first searches for bars at redshift z > 0.5 found a
very low bar fraction (e.g., Abraham et al. 1999), pos-sibly because of small number statistics. Their workalso illustrated the difficulties to identify bars at highredshift: the observed optical light traces the ultravioletemission, in which bars are harder to detect, even locally.Near-infrared data revealed a number of barred galax-ies at z ≥ 0.7 (Sheth et al. 2003; Elmegreen et al. 2004;Jogee et al. 2004). The first sample large enough to ro-bustly quantify the redshift evolution of the bar fractionwithout being affected by resolution and band-shiftingbias up to z ≈ 0.8, was studied by Sheth et al. (2008)in the COSMOS field. These observations indicate thatthe bar fraction drops by a factor of about three fromz = 0 to z = 0.8. This result holds both for all observ-able bars and for strong bars separately, and using eithervisual classifications or quantitative estimates of the barstrength. Sheth et al. (2008) also found a downsizing-likebehaviour for bar formation, i.e. more massive galaxiestend to get barred at higher redshifts. This trend can ex-plain why previous studies, such as Jogee et al. (2004),using shallower data targeted to more massive systems,observed higher bar fractions – but still consistent witha declining bar fraction (see also Elmegreen et al. 2004).
In this paper, we study the evolution of bars in a sam-ple of cosmological zoom-in simulations of 33 galaxieswith present-day stellar masses ranging from 1× 10¹⁰ to2× 1011M⊙, in field and loose group environments. Thesimulation technique and structural evolution of these
galaxies (bulge and disk fractions, angular momentumevolution) were presented in Martig et al. (2012). Thepaper is organized as follows. In Section 2 we presentour simulations and methods for the identification of barsand morphological analysis. In Section 3 we analyze theredshift evolution of the bar fraction in the whole sam-ple and in disk-dominated galaxies1, using quantitativemeasurements of the bar strength. Our main result, theemergence of bars along the cosmic time that traces theepoch of thin disk formation subsequent to the growth ofspheroids and thick disks, is presented in Section 4. Sec-tion 5 studies the lifetime of bars and its dependence onexternal gas accretion. In Section 6, we quantify the con-tribution of bars in the late growth of bulges, comparingto unbarred galaxies. Finally, we discuss and summarizeour results in Sections 7 and 8, respectively.
2. SIMULATIONS AND ANALYSIS
2.1. Simulation Sample
The simulation sample studied here was presented inMartig et al. (2012). It comprises 33 field and loosegroup galaxies modeled at 150 pc resolution from redshift5 down to redshift zero with present-day stellar massesranging from 1× 10¹⁰ to 2× 10¹¹ M⊙.The zoom-in simulation technique is fully described
in Martig et al. (2009, 2012). Dark matter haloes areselected in a large volume, dark matter-only simula-tion, performed using Λ-cold dark matter cosmology withthe Adaptive Mesh Refinement code RAMSES (Teyssier2002). The zoom-in simulation for each selected halo isperformed by recording and replicating the mass inflowthrough a spherical boundary at the final virial radius ofthe selected halo. The boundary conditions used for thezoom-in simulation hence replicate all minor and majormergers as well as diffuse infall, as imposed by the initialcosmological simulation.Our zoom-in simulations use a spatial resolution of
150 pc, and a mass resolution of 104−5M⊙ (1.5×10⁴M⊙
for gas, 7.5 × 10⁴M⊙ for stars and 3 × 10⁵M⊙ for darkmatter particles). The code used to model gravity forgas, stars and dark matter is the particle-mesh codedescribed in Bournaud & Combes (2002, 2003). Inter-stellar gas dynamics is modeled with a sticky-particlescheme (studied in the context of bar evolution inBournaud et al. 2005), which has the drawback of ne-glecting thermal pressure (especially in hot halos, notcrucial in the studied mass range), but the advantage ofmodeling the properties of supersonic turbulent pressurein cold gas phases – which is the physically dominantpressure term in the star-forming interstellar medium(e.g. Burkert 2006) and is hardly modeled by other hy-drodynamic techniques unless resolutions of 1−10 pc andlow thermal cooling floors are reached (Teyssier et al.2010; Bournaud et al. 2011; Hopkins et al. 2011). Starformation is computed with a Schmidt-Kennicutt law(Kennicutt 1998) with an exponent of 1.5 and an ef-ficiency of 2%. The star formation threshold is setat 0.03M⊙pc
−3. Energy feedback from supernovae ex-plosions using a kinetic scheme as well as the contin-uous gas mass-loss from stars (Jungwiert et al. 2001;Martig & Bournaud 2010) are included. The z = 5
1 most galaxies in this sample are disk-dominated spirals at z =0, but a larger fraction is spheroid-dominated at z > 1
3
seed for the central galaxy and the incoming compan-ions are implemented with arbitrary disk+bulge models;tests have shown that the seed properties at z = 5 haveno substantial impact on the structural evolution fromz = 2 out to z = 0, because rapid evolution and massgrowth at z > 3 washes out the initial assumptions.In our study, we focus on the redshift range from
z = 2 to z = 0. Detailed description of analyzed sam-ple is presented in Martig et al. (2012). Here, we recalltypical masses and star formation rates (SFR) at dif-ferent redshifts. At z = 0, typical mass and SFR ofsimulated galaxies are 4 − 5 × 10¹⁰M⊙ and 3M⊙yr
−1,at z = 1, 2 × 10¹⁰M⊙ and 5M⊙yr
−1 and at z = 2,2 − 3 × 10⁹M⊙ and 10M⊙yr
−1, respectively. Hence, abroad range of mass growth histories is covered by thesample (see Martig et al. 2012 for details).
2.2. Bar analysis
The method used to determine the presence, lengthand strength of a bar is based on the azimuthal spectralanalysis of surface density profiles. This is obtained byconsidering the stellar surface density of each galaxy inpolar coordinates, decomposed into Fourier componentsin the form:
Σ(r, θ) = Σ0(r) +∑
m
Am(r) cos(mθ − Φm(r)), (1)
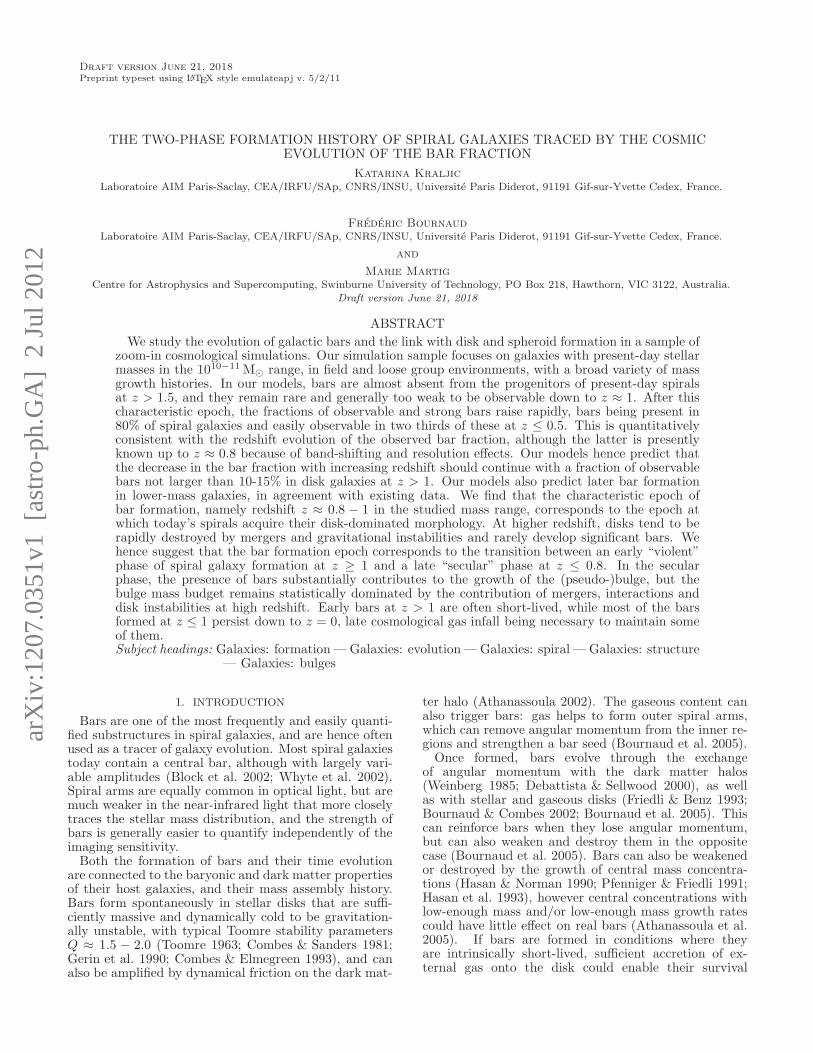
where Σ(r, θ) is the stellar surface density, θ the az-imuthal angle given in rotating frame in which the bar isfixed and r the radial distance. Am and Φm are the asso-ciated Fourier amplitude and phase, respectively. Σ0(r)is the azimuthally-averaged profile of the stellar surfacedensity. The analysis is performed on a face-on projec-tion: the spin axis of the whole stellar content of thegalaxy is used to define the corresponding line of sight.The center of mass of the stars within the central 10 kpcis taken to be the center of the galaxy for the Fourieranalysis.A typical signature of the presence of bar is the promi-
nence of even components, especially m = 2, within thebar region. The identification of bar is possible by study-ing the phase Φ2(r) which is constant with radius in thebar region, as opposed to a two-armed spiral mode (Φm
varies linearly with radius for an m-armed spiral mode).After careful examination of the whole sample at dif-
ferent redshifts, we decide that a bar is present if Φ2(r) isconstant to within ±5 ◦ around the median value over alarge-enough region, hereafter the “bar region”. This barregion should start at radii between 900 pc and 1500 pc,and cover a radial range of at least 1500 pc. We searchthe starting point of the bar region at r ≥ 900 pc be-cause central asymmetries or off-centering in the centralresolution elements can cause variations of Φ2 at smallerradii even for visually barred systems, while starting thesearch at 900 pc is found to never exclude systems thatare visually identified as barred. We stop the search at1500 pc as no bar identified visually starts its Φ2 ≃ con-stant region at larger radii. We impose the bar region(Φ2 constant to within 10 ◦) to cover a radial range ofat least 1500 pc because this selects all bars identifiedvisually and this excludes spiral arms, as the latter typ-ically have a variation of Φ2 of a few tens of degreesover a few kpc. The choice of cutoff in the bar lengthis given mainly by the resolution. We require the bar to
lie within at least three resolution bins used in Fourieranalysis. Moreover, typical lengths of significant bars arein general ≥ 2 kpc (Barazza et al. 2008). Smaller barsare usually either nuclear bars (which are not the focusof this study) or weak ones. We could possibly miss someof these short and weak bars, but this does not have anyimpact on our conclusions on bars that would be strongenough to be observed at z > 0.Once a bar region meeting to the previous criteria is
found, the galaxy is classified as barred and the barstrength S is measured following the definition proposed,for instance, by Aguerri et al. (1998):
S ≡ r−1bar
∫
rbar
0
A2
A0dr, (2)
where rbar is the outer radius of the bar region.Figure 1 shows two examples of barred and unbarred
galaxies and the corresponding radial profiles of Φ2.With this technique, the automated identification ofbarred galaxies is in agreement with all the cases thathave been visually examined. We classify bars into strongbars and weak bars by considering the strength S (Eq. 2).In the following, we will distinguish:
• all detected bars, including very weak and shortbars,
• observable bars, with a strength S ≥ 0.2, which isthe typical detection limit used in observations upto high redshift (e.g., Sheth et al. 2008) – even atz = 0, weaker bars may be confused with spiralarms unless the Φ2 phase can be probed accuratelywith very deep imaging (e.g., Block et al. 2002),
• and strong bars with S ≥ 0.3 unless specified oth-erwise.
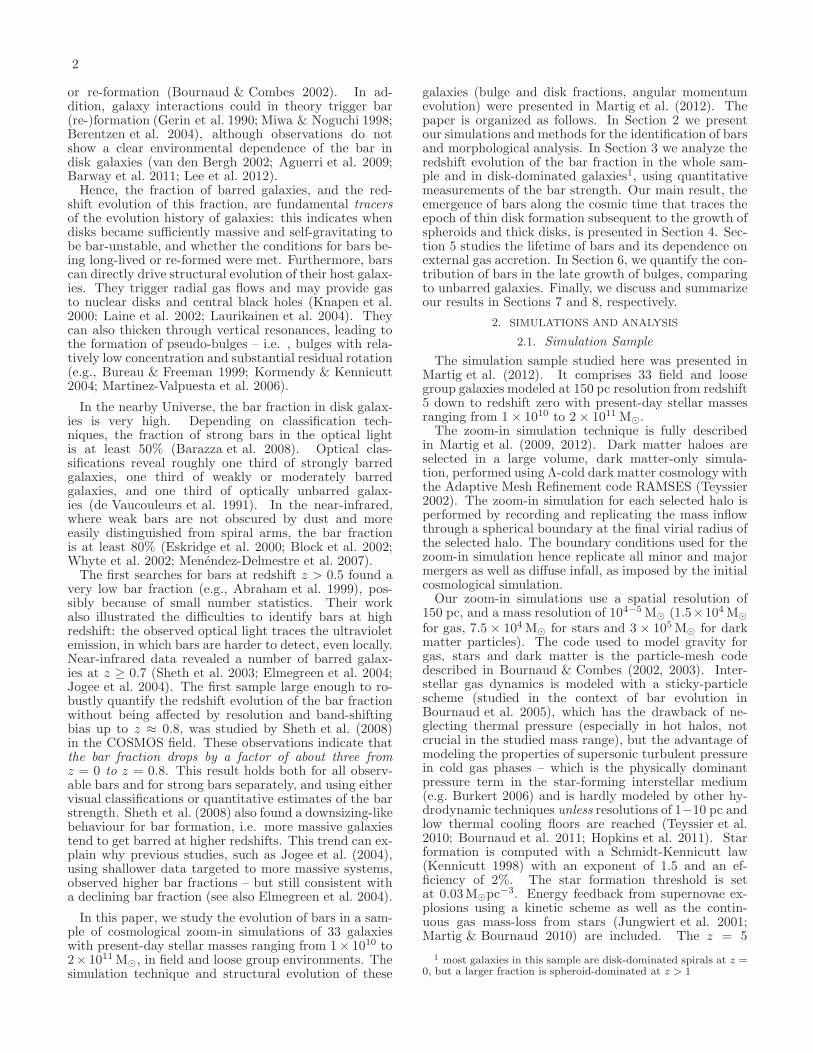
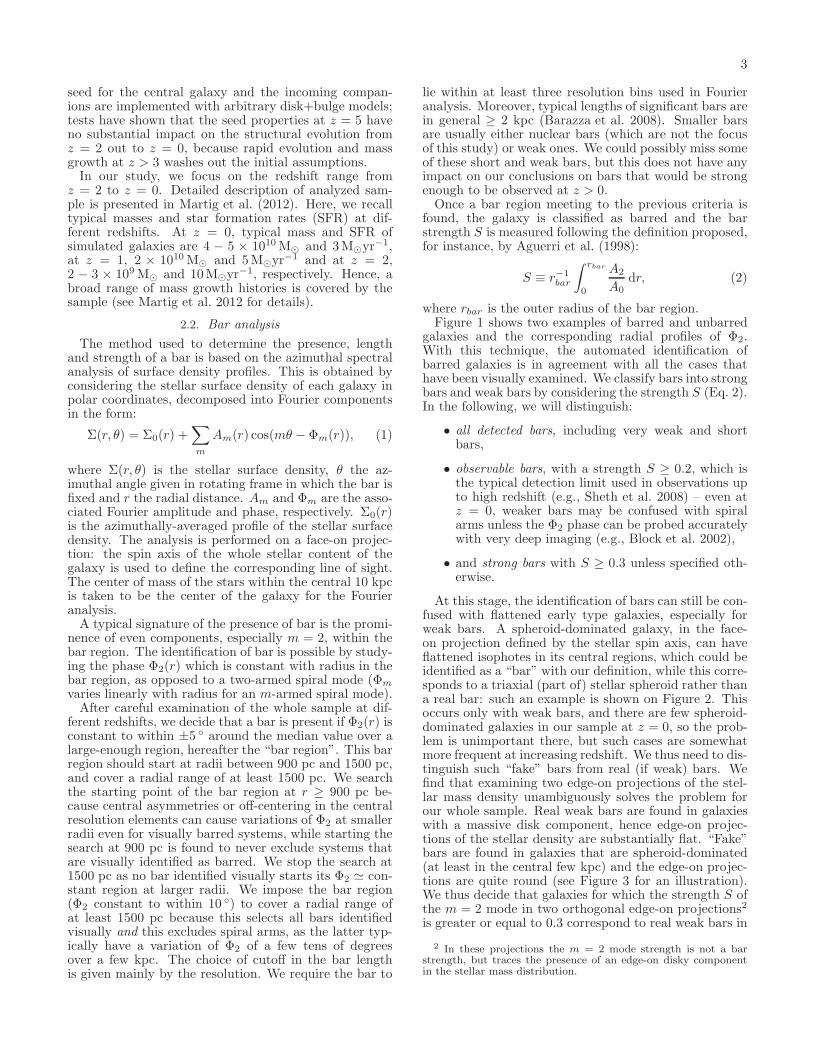
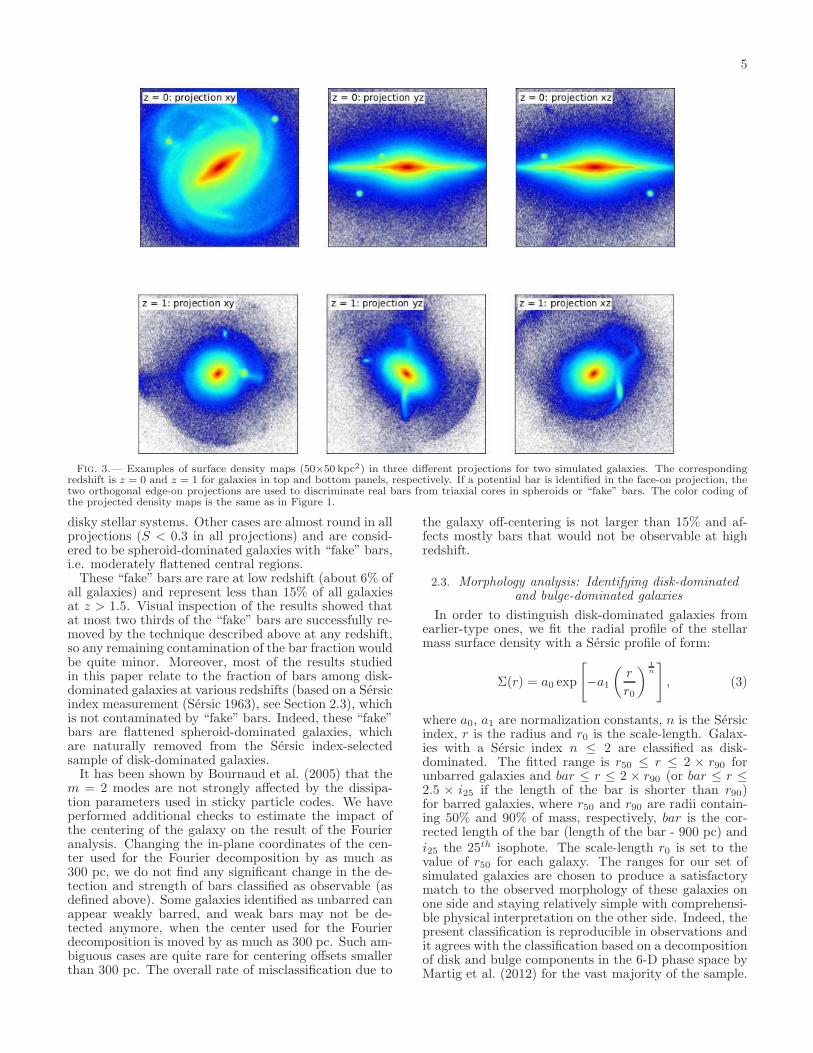
At this stage, the identification of bars can still be con-fused with flattened early type galaxies, especially forweak bars. A spheroid-dominated galaxy, in the face-on projection defined by the stellar spin axis, can haveflattened isophotes in its central regions, which could beidentified as a “bar” with our definition, while this corre-sponds to a triaxial (part of) stellar spheroid rather thana real bar: such an example is shown on Figure 2. Thisoccurs only with weak bars, and there are few spheroid-dominated galaxies in our sample at z = 0, so the prob-lem is unimportant there, but such cases are somewhatmore frequent at increasing redshift. We thus need to dis-tinguish such “fake” bars from real (if weak) bars. Wefind that examining two edge-on projections of the stel-lar mass density unambiguously solves the problem forour whole sample. Real weak bars are found in galaxieswith a massive disk component, hence edge-on projec-tions of the stellar density are substantially flat. “Fake”bars are found in galaxies that are spheroid-dominated(at least in the central few kpc) and the edge-on projec-tions are quite round (see Figure 3 for an illustration).We thus decide that galaxies for which the strength S ofthe m = 2 mode in two orthogonal edge-on projections2
is greater or equal to 0.3 correspond to real weak bars in
2 In these projections the m = 2 mode strength is not a barstrength, but traces the presence of an edge-on disky componentin the stellar mass distribution.
4
0 5 10 15 20 25Radial distance [kpc]
0
20
40
60
80
100
120
140
160
�
2 [d
eg]
�2
Linear fitBar size
z = 0
Strong Bar
0 5 10 15 20 25Radial distance [kpc]
0
20
40
60
80
100
120
140
160
180
�
2 [d
eg]
�2z = 0
Unbarred Spiral
Fig. 1.— Examples of the fitting method results (left panels) and the corresponding surface density maps (right panels) viewed face-on(50 × 50 kpc2) for two galaxies in our sample. The top panel shows a (strongly) barred galaxy with the region where the phase Φ2 isalmost constant identified as the bar region, while the bottom panel corresponds to an unbarred galaxy for which no region of constant Φ2
is detected. The color coding scale of surface density map is logarithmic going from ∼ 100.5 M⊙pc−2 for dark blue to ∼ 104 M⊙pc−2 fordark red.
0 5 10 15 20 25Radial distance [kpc]
0
20
40
60
80
100
120
140
160
180
�
2 [d
eg]
�2
Linear fitBar size
z = 1
Fig. 2.— Example of a possible “fake” bar. A region of constant Φ2 is identified at r ≤ 2.7 kpc (left panel), corresponding to the detectionof a short bar. However, the face-on density map (right panel, 50× 50 kpc2) suggests that the identified region could instead be the coreof an elliptical, i.e., a “fake” bar, which is confirmed by the examination of edge-on projections performed in Figure 3. The color coding ofthe projected density map is the same as in Figure 1.
5
Fig. 3.— Examples of surface density maps (50×50 kpc2) in three different projections for two simulated galaxies. The correspondingredshift is z = 0 and z = 1 for galaxies in top and bottom panels, respectively. If a potential bar is identified in the face-on projection, thetwo orthogonal edge-on projections are used to discriminate real bars from triaxial cores in spheroids or “fake” bars. The color coding ofthe projected density maps is the same as in Figure 1.
disky stellar systems. Other cases are almost round in allprojections (S < 0.3 in all projections) and are consid-ered to be spheroid-dominated galaxies with “fake” bars,i.e. moderately flattened central regions.These “fake” bars are rare at low redshift (about 6% of
all galaxies) and represent less than 15% of all galaxiesat z > 1.5. Visual inspection of the results showed thatat most two thirds of the “fake” bars are successfully re-moved by the technique described above at any redshift,so any remaining contamination of the bar fraction wouldbe quite minor. Moreover, most of the results studiedin this paper relate to the fraction of bars among disk-dominated galaxies at various redshifts (based on a Sersicindex measurement (Sersic 1963), see Section 2.3), whichis not contaminated by “fake” bars. Indeed, these “fake”bars are flattened spheroid-dominated galaxies, whichare naturally removed from the Sersic index-selectedsample of disk-dominated galaxies.It has been shown by Bournaud et al. (2005) that the
m = 2 modes are not strongly affected by the dissipa-tion parameters used in sticky particle codes. We haveperformed additional checks to estimate the impact ofthe centering of the galaxy on the result of the Fourieranalysis. Changing the in-plane coordinates of the cen-ter used for the Fourier decomposition by as much as300 pc, we do not find any significant change in the de-tection and strength of bars classified as observable (asdefined above). Some galaxies identified as unbarred canappear weakly barred, and weak bars may not be de-tected anymore, when the center used for the Fourierdecomposition is moved by as much as 300 pc. Such am-biguous cases are quite rare for centering offsets smallerthan 300 pc. The overall rate of misclassification due to
the galaxy off-centering is not larger than 15% and af-fects mostly bars that would not be observable at highredshift.
2.3. Morphology analysis: Identifying disk-dominatedand bulge-dominated galaxies
In order to distinguish disk-dominated galaxies fromearlier-type ones, we fit the radial profile of the stellarmass surface density with a Sersic profile of form:
Σ(r) = a0 exp
[
−a1
(
r
r0
)1
n
]
, (3)
where a0, a1 are normalization constants, n is the Sersicindex, r is the radius and r0 is the scale-length. Galax-ies with a Sersic index n ≤ 2 are classified as disk-dominated. The fitted range is r50 ≤ r ≤ 2 × r90 forunbarred galaxies and bar ≤ r ≤ 2 × r90 (or bar ≤ r ≤
2.5 × i25 if the length of the bar is shorter than r90)for barred galaxies, where r50 and r90 are radii contain-ing 50% and 90% of mass, respectively, bar is the cor-rected length of the bar (length of the bar - 900 pc) andi25 the 25th isophote. The scale-length r0 is set to thevalue of r50 for each galaxy. The ranges for our set ofsimulated galaxies are chosen to produce a satisfactorymatch to the observed morphology of these galaxies onone side and staying relatively simple with comprehensi-ble physical interpretation on the other side. Indeed, thepresent classification is reproducible in observations andit agrees with the classification based on a decompositionof disk and bulge components in the 6-D phase space byMartig et al. (2012) for the vast majority of the sample.
6
The galaxies presently classified as disk-dominated havebulge-to-total mass fraction below 35%.Note that the identification of a disk component to re-
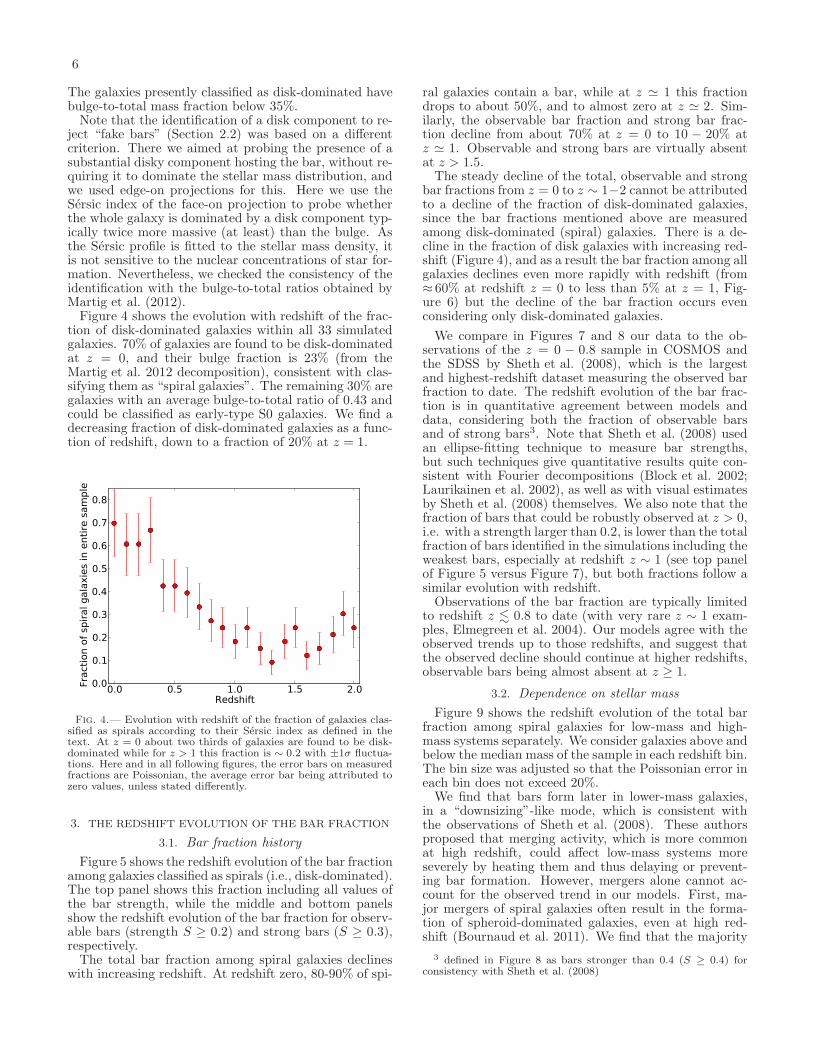
ject “fake bars” (Section 2.2) was based on a differentcriterion. There we aimed at probing the presence of asubstantial disky component hosting the bar, without re-quiring it to dominate the stellar mass distribution, andwe used edge-on projections for this. Here we use theSersic index of the face-on projection to probe whetherthe whole galaxy is dominated by a disk component typ-ically twice more massive (at least) than the bulge. Asthe Sersic profile is fitted to the stellar mass density, itis not sensitive to the nuclear concentrations of star for-mation. Nevertheless, we checked the consistency of theidentification with the bulge-to-total ratios obtained byMartig et al. (2012).Figure 4 shows the evolution with redshift of the frac-
tion of disk-dominated galaxies within all 33 simulatedgalaxies. 70% of galaxies are found to be disk-dominatedat z = 0, and their bulge fraction is 23% (from theMartig et al. 2012 decomposition), consistent with clas-sifying them as “spiral galaxies”. The remaining 30% aregalaxies with an average bulge-to-total ratio of 0.43 andcould be classified as early-type S0 galaxies. We find adecreasing fraction of disk-dominated galaxies as a func-tion of redshift, down to a fraction of 20% at z = 1.
0.0 0.5 1.0 1.5 2.0Redshift
0.0
0.1
0.2
0.3
0.4
0.5
0.6
0.7
0.8
Frac
tion
of s
pira
l gal
axie
s in
ent
ire s
ampl
e
Fig. 4.— Evolution with redshift of the fraction of galaxies clas-sified as spirals according to their Sersic index as defined in thetext. At z = 0 about two thirds of galaxies are found to be disk-dominated while for z > 1 this fraction is ∼ 0.2 with ±1σ fluctua-tions. Here and in all following figures, the error bars on measuredfractions are Poissonian, the average error bar being attributed tozero values, unless stated differently.
3. THE REDSHIFT EVOLUTION OF THE BAR FRACTION
3.1. Bar fraction history
Figure 5 shows the redshift evolution of the bar fractionamong galaxies classified as spirals (i.e., disk-dominated).The top panel shows this fraction including all values ofthe bar strength, while the middle and bottom panelsshow the redshift evolution of the bar fraction for observ-able bars (strength S ≥ 0.2) and strong bars (S ≥ 0.3),respectively.The total bar fraction among spiral galaxies declines
with increasing redshift. At redshift zero, 80-90% of spi-
ral galaxies contain a bar, while at z ≃ 1 this fractiondrops to about 50%, and to almost zero at z ≃ 2. Sim-ilarly, the observable bar fraction and strong bar frac-tion decline from about 70% at z = 0 to 10 − 20% atz ≃ 1. Observable and strong bars are virtually absentat z > 1.5.The steady decline of the total, observable and strong
bar fractions from z = 0 to z ∼ 1−2 cannot be attributedto a decline of the fraction of disk-dominated galaxies,since the bar fractions mentioned above are measuredamong disk-dominated (spiral) galaxies. There is a de-cline in the fraction of disk galaxies with increasing red-shift (Figure 4), and as a result the bar fraction among allgalaxies declines even more rapidly with redshift (from≈ 60% at redshift z = 0 to less than 5% at z = 1, Fig-ure 6) but the decline of the bar fraction occurs evenconsidering only disk-dominated galaxies.
We compare in Figures 7 and 8 our data to the ob-servations of the z = 0 − 0.8 sample in COSMOS andthe SDSS by Sheth et al. (2008), which is the largestand highest-redshift dataset measuring the observed barfraction to date. The redshift evolution of the bar frac-tion is in quantitative agreement between models anddata, considering both the fraction of observable barsand of strong bars3. Note that Sheth et al. (2008) usedan ellipse-fitting technique to measure bar strengths,but such techniques give quantitative results quite con-sistent with Fourier decompositions (Block et al. 2002;Laurikainen et al. 2002), as well as with visual estimatesby Sheth et al. (2008) themselves. We also note that thefraction of bars that could be robustly observed at z > 0,i.e. with a strength larger than 0.2, is lower than the totalfraction of bars identified in the simulations including theweakest bars, especially at redshift z ∼ 1 (see top panelof Figure 5 versus Figure 7), but both fractions follow asimilar evolution with redshift.Observations of the bar fraction are typically limited
to redshift z . 0.8 to date (with very rare z ∼ 1 exam-ples, Elmegreen et al. 2004). Our models agree with theobserved trends up to those redshifts, and suggest thatthe observed decline should continue at higher redshifts,observable bars being almost absent at z ≥ 1.
3.2. Dependence on stellar mass
Figure 9 shows the redshift evolution of the total barfraction among spiral galaxies for low-mass and high-mass systems separately. We consider galaxies above andbelow the median mass of the sample in each redshift bin.The bin size was adjusted so that the Poissonian error ineach bin does not exceed 20%.We find that bars form later in lower-mass galaxies,
in a “downsizing”-like mode, which is consistent withthe observations of Sheth et al. (2008). These authorsproposed that merging activity, which is more commonat high redshift, could affect low-mass systems moreseverely by heating them and thus delaying or prevent-ing bar formation. However, mergers alone cannot ac-count for the observed trend in our models. First, ma-jor mergers of spiral galaxies often result in the forma-tion of spheroid-dominated galaxies, even at high red-shift (Bournaud et al. 2011). We find that the majority
3 defined in Figure 8 as bars stronger than 0.4 (S ≥ 0.4) forconsistency with Sheth et al. (2008)

7
0.0
0.2
0.4
0.6
0.8
1.0 All barsAll bars
0.0
0.2
0.4
0.6
0.8
1.0
Frac
tion
of b
arre
d ga
laxi
es a
mon
g sp
irals
Observable bars
0.0 0.5 1.0 1.5 2.0Redshift
0.0
0.2
0.4
0.6
0.8
1.0 Strong bars
Fig. 5.— Evolution with redshift of the total bar fraction in-cluding even weak bars (top panel), observable bar fraction (mid-dle panel), and strong bar fraction (bottom panel) among spiralgalaxies (i.e., galaxies with a Sersic index n < 2 in each redshiftbin).
of disk galaxies are barred today, and bar formation isfound in our sample even when considering only disk-dominated galaxies with low Sersic indices, so the pro-cess should be independent on the occurrence of majormergers. Second, minor mergers and interactions cancause the destruction or formation of a bar,depending inparticular on the orbital parameters (Gerin et al. 1990;Berentzen et al. 2003, 2004). Since bars at high redshift(z & 1) are rare, any net effect of mergers/interactionsshould be bar formation in previously un-barred systems,rather than bar destruction in previously barred systems.Over the entire sample, our results suggest that the
epoch of bar formation is the typical epoch at whichgalaxies start to be dominated by a kinematically cold,thin stellar disk (see Section 4). A possible explanationof the “downsizing” of bar formation could be that these
0.0 0.5 1.0 1.5 2.0Redshift
0.0
0.1
0.2
0.3
0.4
0.5
0.6
0.7
Frac
tion
of b
arre
d ga
laxi
es a
mon
g al
l gal
axie
s Strong bars
Fig. 6.— Evolution with redshift of the fraction of barred galaxiesamong all galaxies, where only strong bars (S ≥ 0.3) are consid-ered. Note that the bottom panel of Figure 5 showed strong barsamong galaxies classified as disk dominated (Sersic index n < 2).
0.0 0.5 1.0 1.5 2.0Redshift
0.0
0.2
0.4
0.6
0.8
1.0Ob
serv
able
bar
frac
tion
Simulations (S�0.2)COSMOS barsSDSS bars
Fig. 7.— Comparison of the redshift evolution of the bar frac-tion in spiral galaxies with COSMOS and SDSS data (Sheth et al.2008). The lower limit on the bar strength of simulated galaxiesis set to 0.2, so that only observable bars are shown. The errorbars are calculated as in Sheth et al. (2008), assuming binomialstatistics.
modern spiral disks themselves form later in lower-massgalaxies. The continuation of rapid mass accretion ontolower-mass systems down to lower redshift could keeptheir disk violently unstable, with giant clumps and ir-regular structures rather than bars, as further discussedin Section 7. More massive spiral galaxies seem to belargely in place and already disk-dominated at z ∼ 1(e.g., Sargent et al. 2007).We also find that at intermediate redshift (z . 0.6) the
fraction of bars in low-mass galaxies continues to increasewith decreasing z, while in high-mass systems, it staysroughly constant from z ∼ 0.6 to z = 0 at a relativelyhigh value of ∼ 70%. At high redshift (z > 1), the mostmassive disk galaxies do contain some bars (although rel-atively rare, and in general too weak to be easily observ-able), while lower mass disk galaxies are systematicallyunbarred.

8
0.0 0.5 1.0 1.5 2.0Redshift
0.0
0.1
0.2
0.3
0.4
0.5
Stro
ng b
ar fr
actio
n
SimulationsCOSMOS barsSDSS bars
Fig. 8.— Comparison of the evolution with redshift of the frac-tion of strong bars (here considering strengths greater than 0.4)in spirals of COSMOS and SDSS data from Sheth et al. (2008).The error bars are calculated as in Sheth et al. (2008), assumingbinomial statistics.
0.0 0.5 1.0 1.5 2.0Redshift
0.0
0.2
0.4
0.6
0.8
1.0
Frac
tion
of b
arre
d ga
laxi
es a
mon
g sp
irals
Below median M�
Above median M�
Fig. 9.— Evolution with the redshift of the fraction of barredgalaxies among spiral galaxies according to their mass. In eachredshift bin, galaxies are classified as having a stellar mass above orbelow the median value, which is 4×10⁹ M⊙ at z=2, 2.5×10¹⁰ M⊙
at z ∼ 1 and 6× 10¹⁰ M⊙ at z=0.
4. WHEN DO BARS EMERGE? THE EMERGENCE OFMASSIVE THIN DISKS
While the total bar fraction and strong bar fractionare both high at low redshift, they become very small orclose to zero at z ≥ 1. Most of the bars found at z > 1in the simulations are quite weak and would not evenbe considered with a bar strength threshold at S = 0.2,hence they would be hardly observable at high redshift(see Figure 7).The redshift evolution of the fraction of disk-
dominated4 galaxies in our simulation sample was shownon Figure 4. Surprisingly, it is quite similar to the red-shift evolution of the fraction of strong bars or moderate(observable) bars (see Figure 4 compared to the bottompanel of Figure 5 and Figure 7). This suggests that theepoch of bar formation is also the epoch at which galaxies
4 according to criterion defined in Section 2.3
0.0 0.5 1.0 1.5 2.0Redshift
0.0
0.2
0.4
0.6
0.8
1.0
Frac
tion
of s
pira
ls
Below median M
Above median M
Fig. 10.— Evolution with the redshift of the fraction of spiralgalaxies among all galaxies according to their mass. The binningis same as in Figure 9.
that are presently spirals start to be dominated by stel-lar disks. Indeed, at higher redshift, the progenitors ofthese present-day spirals are sometimes disk-dominatedbut are often spheroid-dominated, or have irregular mor-phologies such as clumpy disks (i.e., short lived unsta-ble disks), or are interacting and merging systems (seeMartig et al. 2012 for a thorough study of the structuralevolution of the simulated galaxies in the same sample).Our study and that in Martig et al. (2012) indi-
cate that these present-day spiral galaxies grow mostlythrough two phases. During an early “violent” phase atz > 1, the system is quite often disturbed by impor-tant mergers (major mergers or multiple minor merg-ers) as well as violent disk instabilities (giant clumps).The morphology can evolve during this phase from disk-dominated to a spheroid without being stabilized towardthe final disk-dominated structure. At z < 1, present-dayspirals evolve mostly through a “secular” phase when themorphology is generally stabilized to a disk-dominatedstructure (Martig et al. 2012). The bulge growth is thenonly slow and limited as important mergers and violentdisk instabilities become rare, and almost absent afterz ≃ 0.7.As measured in Martig et al. (2012), there is no cor-
relation between the morphologies and the disk/bulgefractions between the early violent phase (z > 1) andthe present day. While the systems enter the “secular”phase after z ≈ 1 the bulge/disk fractions become moreand more tightly correlated with the final z = 0 val-ues. Stars formed or accreted in the early violent phaseend-up mostly in the thick disk, stellar halo and bulgeat redshift zero. Stars formed in the secular phase atz < 1 mostly grow the modern thin spiral disk, with asubstantial but non dominant contribution to late bulgegrowth, especially in barred systems (see Section 6 forlate secular bulge growth).
The epoch of bar formation covers a relatively nar-row range z ≃ 0.7 − 1 for the vast majority of galaxiesin our sample, although the sample spans stellar massesof 1 × 10¹⁰ to 2 × 10¹¹M⊙. The comparison with thestructural evolution shows that the (observable) bar frac-tion is constantly very low in the early violent phaseof spiral galaxy formation, a phase during which disk-

9
dominated systems can be present but are generally de-stroyed/reformed over short timescales, and uncorrelatedwith the final disk fraction. Once spiral galaxies en-ter their “secular phase” at z ≤ 1, bars rapidly formand the bar fraction rapidly raises. This is the epoch atwhich the final thin spiral disk starts to form and domi-nate the stellar structure of these galaxies: the disk andbulge fractions can continue to evolve down to z = 0but in this phase the disk is not destroyed/reformedanymore, although the bar itself may sometimes be de-stroyed/reformed. At this point, the formation of a long-lived massive thin disk allows the bar to form in most ofthe progenitors of today’s spirals.The epoch of the emergence of bars thus traces the
epoch at which modern thin disks are established andstart to dominate the stellar mass distribution in present-day spirals. This is primarily the interpretation of thebar fraction in our simulation sample, but if the red-shift evolution of the bar fraction agrees with observa-tions (which is the case up to z ≃ 0.8, and needs tobe probed at higher redshift) then it could suggest thatthe same interpretation applies to observed bars, namelythat their emergence traces the typical epoch at whichspiral galaxies establish their modern disk-dominatedstructure at z = 0.8 − 1 (for present-day stellar massesin the 1010−11 M⊙ range). We will further discuss thishypothesis of a two-phase formation history traced bythe emergence of bars, and illustrate with representativeexamples, in Section 7.
5. BAR LIFETIME
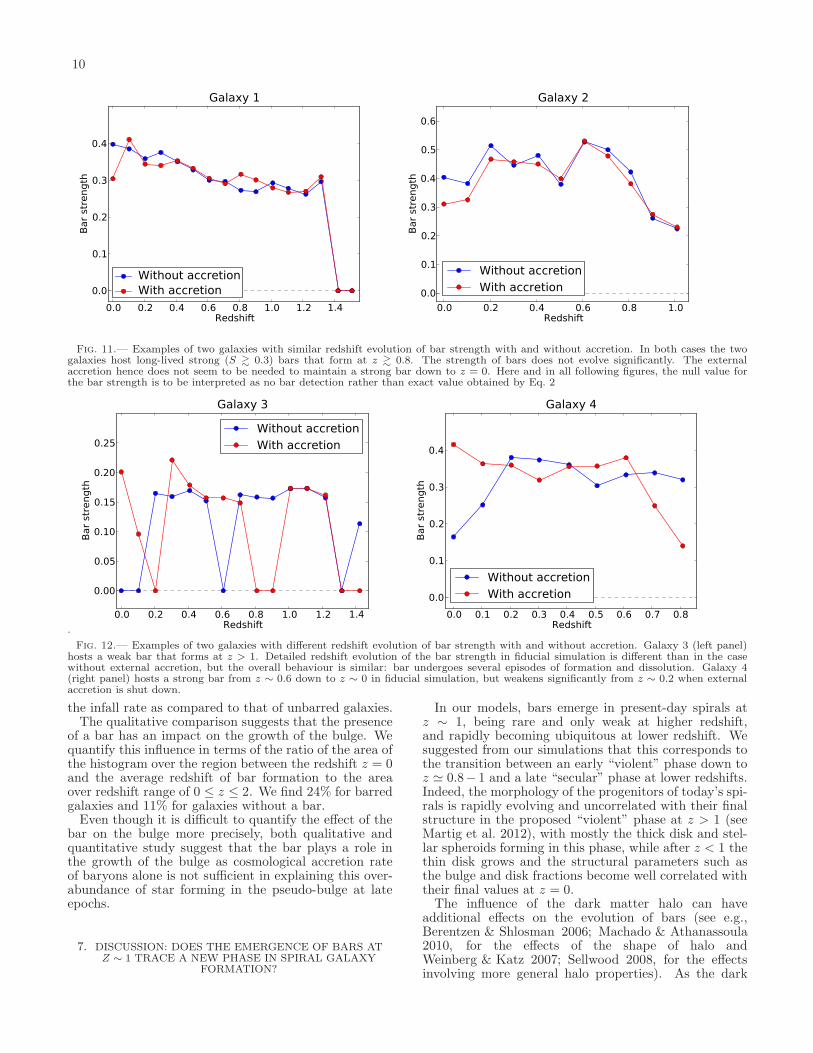
As shown in Section 3.1, bars start to steadily appearat redshift z ∼ 0.8 − 1. A closer examination of in-dividual bars formed at this redshift reveals that theirstrength often remains roughly constant down to redshiftz ∼ 0. Is this because the conditions are favorable for thestrength being intrinsically constant, or would those barstend to weaken or even be destroyed in complete isola-tion but are maintained by external infall as proposed byBournaud & Combes (2002)? We here examine the in-fluence of the external accretion on the lifetime of a barin realistic cosmological context (unlike the idealized ac-cretion used by Bournaud & Combes (2002)). We selectfour galaxies, hereafter labeled Galaxy 1 to Galaxy 4,with representative bar strength histories in the mainsample, and we run new simulations without externalaccretion once their bar has formed.Figure 11 shows the two first galaxies (Galaxy 1 and
2), for which the redshift evolution of the bar strengthis very similar with and without accretion. The bar isformed at z ∼ 1.3 and z ∼ 1 in these two galaxies, respec-tively. In both galaxies the bar strength is roughly con-stant down to z ∼ 0 with and without accretion. Thesebars are intrinsically long-lived and their evolution is notsignificantly influenced by late mass accretion.Figure 12 shows the two other galaxies, for which exter-
nal accretion has some influence on the bar strength evo-lution. In the fiducial simulation, Galaxy 3 (left panel)hosts a weak bar (S . 0.2 at all redshifts), that dissolvesand re-forms several times. Without external accretion,the bar evolution is different, but the overall trend is sim-ilar, with several episodes of formation and dissolution.In this galaxy the bar remains weak in all cases.Galaxy 4 hosts a strong bar in the fiducial simulation,
with S > 0.3 from redshift z ∼ 0.8 down to z ∼ 0.When we shut down external accretion, the bar stays ofa similar strength down to z ∼ 0.2, and then weakenssignificantly. In this case, external accretion is necessaryto maintain a strong bar down to z = 0.Hence, bars that are formed after z ∼ 0.8 − 1 are
mostly long-lived, often without requiring external accre-tion, which is probably explained by the fact that thesebars form once the gas fraction is relatively low – bar dis-solution is easier to reach with high gas fractions. Thereare however cases where the bar evolution is influencedby external mass infall and late cosmological accretionbelow redshift one, including cases where the presence ofa strong bar at z = 0 is only achieved through externalaccretion.
At the opposite, the (relatively rare) bars that areformed early (1 < z < 2) have a shorter lifetimes. Theycan either dissolve spontaneously, as is the case for thefirst galaxy shown on Figure 13, or be destroyed by merg-ers, as is the case for the two other galaxies shown onthis figure. The shorter bar lifetime at z > 1 com-pared to z < 1 can be explained by the higher gas frac-tions at these early epochs, making easier to dissolvea bar by gravitational torquing and mass concentration(Bournaud et al. 2005). In these galaxies with early bars,the bar re-forms and eventually persist down to redshiftzero, owing to late cosmological infall and build-up of amassive thin disk.Overall, it appears that external gas accretion is re-
quired to maintain low-redshift bars only in a limitedfraction of the sample, but is generally required to re-form early bars at z ∼ 1, which tend to be intrinsicallyshort-lived.
6. THE ROLE OF BARS IN (PSEUDO)-BULGE GROWTH
In this Section, we address the impact of the bar inthe growth of the bulge, since bars have been proposedto play an important role in the formation of pseudo-bulge by triggering the gas inflows to the central re-gions of galaxy (Athanassoula 2005; Heller et al. 2007;Fisher et al. 2009).Here the identification of the bulge is made using GAL-
FIT (Peng et al. 2002, 2010) for galaxies at z = 0. Fivegalaxies (out of 33 analyzed so far) are removed fromthe study because their complex structure did not makeit possible to achieve a satisfying and unique GALFITdecomposition. The majority of bulges have relativelylow Sersic indices indicating that they are pseudo-bulgesrather than classical bulges (see Martig et al. 2012 for adetailed study of the simulated galaxies in our sample).We consider all stars that are present in the bulge of a
given galaxy at z = 0 and we compute the averaged nor-malized distribution of the redshift formation of thesestars. For galaxies that host a bar this distribution iscomputed with respect to the moment of the apparitionof the bar which is thus interpreted as the average red-shift at which the bar forms.In Figure 14 we show the normalized age distribution
of stars in the bulge for barred and unbarred galaxies(left and right panels, respectively), together with thetheoretical mass accretion rate that scales with redshiftas (1 + z)2.25 (Neistein et al. 2006). We note a slightlylarger excess of stars in barred galaxies with respect to
10
0.0 0.2 0.4 0.6 0.8 1.0 1.2 1.4Redshift
0.0
0.1
0.2
0.3
0.4
Bar s
tren
gth
Galaxy 1
Without accretionWith accretion
0.0 0.2 0.4 0.6 0.8 1.0Redshift
0.0
0.1
0.2
0.3
0.4
0.5
0.6
Bar s
tren
gth
Galaxy 2
Without accretionWith accretion
Fig. 11.— Examples of two galaxies with similar redshift evolution of bar strength with and without accretion. In both cases the twogalaxies host long-lived strong (S & 0.3) bars that form at z & 0.8. The strength of bars does not evolve significantly. The externalaccretion hence does not seem to be needed to maintain a strong bar down to z = 0. Here and in all following figures, the null value forthe bar strength is to be interpreted as no bar detection rather than exact value obtained by Eq. 2
.
0.0 0.2 0.4 0.6 0.8 1.0 1.2 1.4Redshift
0.00
0.05
0.10
0.15
0.20
0.25
Bar s
tren
gth
Galaxy 3
Without accretionWith accretion
0.0 0.1 0.2 0.3 0.4 0.5 0.6 0.7 0.8Redshift
0.0
0.1
0.2
0.3
0.4
Bar s
tren
gth
Galaxy 4
Without accretionWith accretion
Fig. 12.— Examples of two galaxies with different redshift evolution of bar strength with and without accretion. Galaxy 3 (left panel)hosts a weak bar that forms at z > 1. Detailed redshift evolution of the bar strength in fiducial simulation is different than in the casewithout external accretion, but the overall behaviour is similar: bar undergoes several episodes of formation and dissolution. Galaxy 4(right panel) hosts a strong bar from z ∼ 0.6 down to z ∼ 0 in fiducial simulation, but weakens significantly from z ∼ 0.2 when externalaccretion is shut down.
the infall rate as compared to that of unbarred galaxies.The qualitative comparison suggests that the presence
of a bar has an impact on the growth of the bulge. Wequantify this influence in terms of the ratio of the area ofthe histogram over the region between the redshift z = 0and the average redshift of bar formation to the areaover redshift range of 0 ≤ z ≤ 2. We find 24% for barredgalaxies and 11% for galaxies without a bar.Even though it is difficult to quantify the effect of the
bar on the bulge more precisely, both qualitative andquantitative study suggest that the bar plays a role inthe growth of the bulge as cosmological accretion rateof baryons alone is not sufficient in explaining this over-abundance of star forming in the pseudo-bulge at lateepochs.
7. DISCUSSION: DOES THE EMERGENCE OF BARS ATZ ∼ 1 TRACE A NEW PHASE IN SPIRAL GALAXY
FORMATION?
In our models, bars emerge in present-day spirals atz ∼ 1, being rare and only weak at higher redshift,and rapidly becoming ubiquitous at lower redshift. Wesuggested from our simulations that this corresponds tothe transition between an early “violent” phase down toz ≃ 0.8− 1 and a late “secular” phase at lower redshifts.Indeed, the morphology of the progenitors of today’s spi-rals is rapidly evolving and uncorrelated with their finalstructure in the proposed “violent” phase at z > 1 (seeMartig et al. 2012), with mostly the thick disk and stel-lar spheroids forming in this phase, while after z < 1 thethin disk grows and the structural parameters such asthe bulge and disk fractions become well correlated withtheir final values at z = 0.The influence of the dark matter halo can have
additional effects on the evolution of bars (see e.g.,Berentzen & Shlosman 2006; Machado & Athanassoula2010, for the effects of the shape of halo andWeinberg & Katz 2007; Sellwood 2008, for the effectsinvolving more general halo properties). As the dark

11
0.0 0.5 1.0 1.5 2.0Redshift
0.0
0.1
0.2
0.3
0.4
0.5
Bar s
tren
gth
Galaxy 5
0.0 0.5 1.0 1.5 2.0Redshift
0.0
0.1
0.2
0.3
0.4
0.5
0.6
Bar s
tren
gth
Galaxy 6
0.0 0.5 1.0 1.5 2.0Redshift
0.0
0.1
0.2
0.3
0.4
0.5
Bar s
tren
gth
Galaxy 7
Fig. 13.— Examples of three simulated galaxies with an earlybar formation (1 < z < 2). Galaxy 5 (top panel) hosts a bar thatis destroyed spontaneously rapidly after its formation at z ∼ 2. Anew bar reforms at low redshift (z ∼ 0.2). The bars developed atz & 1 in Galaxies 6 and 7 (middle and bottom panels) are destroyedby mergers, but reform later. The early formed bars seem to beshort-lived, although they can reform later. The high frequencyat which the bar is destroyed and reformed between z > 1 andz < 2 in Galaxy 7 (bottom panel) is rather rare. Bars tend toundergo cycles of formation and destruction more commonly athigher redshifts, bars are also more rare at z > 1.
matter halo evolves with redshift, it affects the evolu-
tion of the entire galaxy, in particular the bar, which inturn influences the halo itself. Bar formation can thusbe reinforced or delayed depending on exact halo proper-ties. Such effects should be resolved by our simulations,but the key epoch of bar formation appears to corre-spond mostly to the evolution of baryonic properties inour analysis.We show on Figure 15 three representative examples
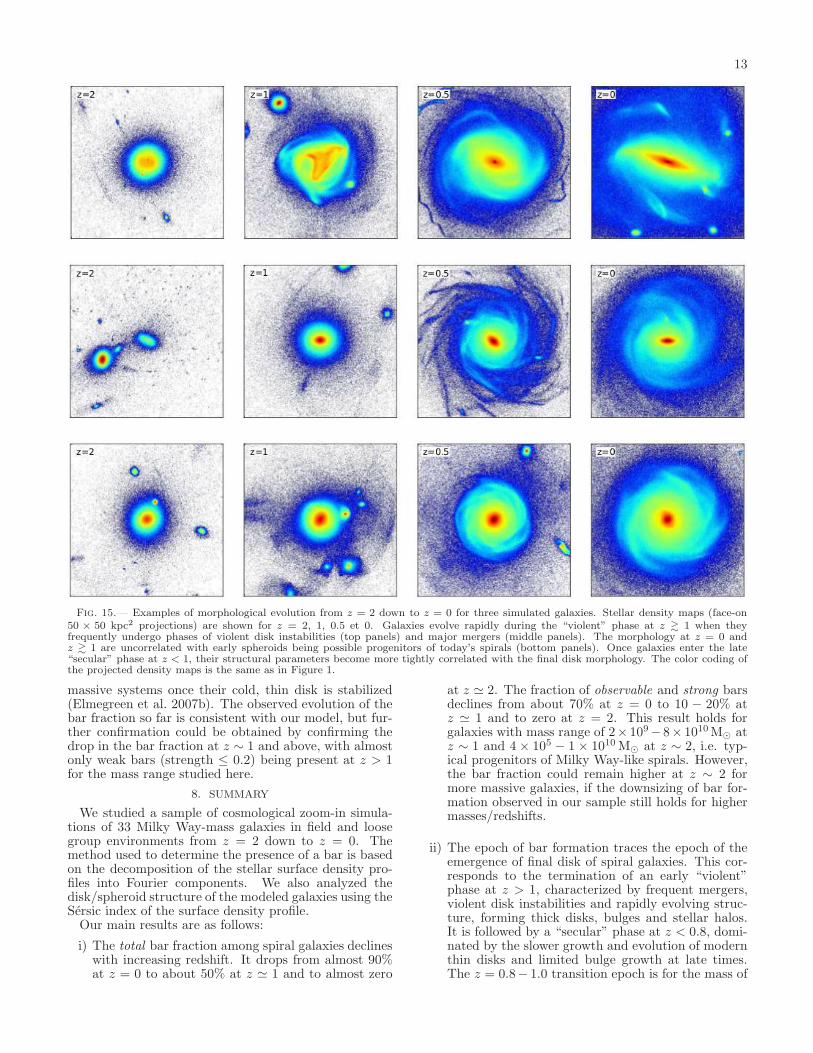
at z > 1: one, which is disk-dominated at z > 1 butwhere violent disk instabilities (including giant clumps)destroy the early disk into a thick disk and spheroid,another one, which is spheroid-dominated with a majormerger at z ∼ 2, and a third one, which is also spheroiddominated with several minor mergers at z ≃ 1−2. Thisis illustrative of the “violent phase” at z > 1. Indeed, itis known from other work that high-redshift disks havehigh gas fractions and are violently unstable with gi-ant clumps and transient features, but do not frequentlydevelop bars (e.g., Bournaud et al. 2007; Ceverino et al.2010) and this instability destroys any thin disk thatwould have started to grow, while major mergers thatcan reform some disk components (e.g., Robertson et al.2006) but mostly convert disks into spheroids even inhigh-redshift conditions (Bournaud et al. 2011).Hence, in the two examples on Figure 15 and in the
majority of our sample, no massive thin disk can stabi-lize before redshift one and develop a substantial bar. Onthe other hand, mergers with mass ratios larger than 5:1are almost absent from our sample after z = 1 and diffusegas accretion occurs at much lower rate, and the rate ofstellar bulge growth also drops. Thus a massive thin diskcan form and start to dominate the mass distribution, asprobed by the formation of spiral arms between z = 1and z = 0.5 in the face-on images shown on Figure 15.This thin disk grows secularly down to z = 0 and gen-erally gets barred by z ≈ 0.5 – strongly in the two firstcases, weakly in the third one.These three cases illustrate the transition between an
early violent phase with frequent mergers and disk in-stabilities, and a late secular phase dominated by slowermass infall, and the fact that this transition occurs whenthe massive thin disk forms and is traced by the emer-gence of bars. Overall, the epoch of bar formation inour simulations probes the epoch at which spiral galax-ies have formed the bulk of their disk, stellar halo andthick disk, and start to be dominated (in stellar mass)by their final thin disk with only slow (secular) evolutiondown to z = 0.
In observations, the bar fraction also decreases withincreasing redshift, and although it could be probed indetail only up to z ≃ 0.8 it is in close agreement withour models so far. In the following we discuss whetherthe emergence of bars at z ≃ 0.8− 1, if confirmed obser-vationally, could also correspond to the epoch at whichspiral galaxies acquire their final morphology and startbeing dominated by their thin rotating stellar disk. Weare thus led to wonder whether a transition between aviolent phase of galactic assembly, with rapid episodesof merging and violent instabilities building a thick diskand spheroids, could be followed by a calm secular phaseof thin disk growth and evolution, with the typical tran-sition at z ≃ 0.8− 1.Chemical properties of disk galaxies could be con-

12
0 0.5 0.71 1 1.5<Redshift>
0.0
0.01
0.02
0.03
0.04
Frac
tion
Barred galaxies
�(1+z)2.25
DataBar
0 0.5 0.71 1 1.5<Redshift>
0.00
0.01
0.02
0.03
0.04
Frac
tion
Unbarred galaxies
�(1+z)2.25
DataBar
Fig. 14.— Normalized bulge stellar age distribution. The two panels show the age distribution for stars in the bulge at z = 0 for differenttypes of galaxies (left panel: barred galaxies, right panel: unbarred galaxies). The fitted theoretical total mass accretion rate that scales as(1 + z)2.25 is shown too (the red line). The black dashed line represents the average time at which the bar is formed. All stars located tothe left of this line are stars younger than the bar. We show this average bar formation redshift also for unbarred galaxies for comparison.
sistent with such two-phase assembly of their compo-nents. Thick disks are ubiquitous around spiral galaxies(Dalcanton & Bernstein 2002; Seth et al. 2005), withoutstar formation and no or almost no young stellar pop-ulations (Yoachim & Dalcanton 2006; Ibata et al. 2009).The Milky Way thick disk contains no or almost no staryounger than 8 Gyr (Gilmore et al. 1985; Reddy et al.2006). This is consistent with the occurrence of eventsdisrupting any cold rotating disk into a thick disk onlyat redshifts higher than z ∼ 1, while the thin diskwouldn’t have been significantly disrupted/thickened af-ter this epoch. The enhanced α element abundances inthe thick disk and central bulge (Lecureur et al. 2007;Zoccali et al. 2007) suggest that their star formation oc-curred mostly in brief events (not longer than a few108 yr), and that the formation of stars that belong tothe present-day thin disk occurred at later epochs withlonger timescales (see also Chiappini 2009). These briefevents could have been mergers, as well as violent in-stabilities (giant clumps) in rapidly-accreting galaxies,that grow both a bulge and a thick disk (Bournaud et al.2009) over short timescales, while a thin disk componentcan form and remain stable after these phases with lowergas infall rates.
Direct searches for disks, through gas kinematicsand/or optical and near-infrared spectroscopy, are alsoconsistent with z ≃ 1 as the typical redshift for theemergence of modern thin spiral disks, along with theirbars. Near-infrared spectroscopy of a z ∼ 3 sample ofstar-forming galaxies (AMAZE and LSD, Maiolino et al.2010; Gnerucci et al. 2011), with masses typical for theprogenitors of Milky Way-like galaxies and present-dayspirals, reveals only a minor fraction of rotating disks,the majority of these galaxies being mergers or irregu-lar systems dominated by high velocity dispersions. Asimilar survey of star-forming galaxies in a compara-ble mass range at a median redshift z ≃ 1.2 (MASSIV,Epinat et al. 2012) finds about 40-50% of rotating diskgalaxies. At z ≃ 0.6 − 0.8, the IMAGES survey finds amajority of rotating disk galaxies (Yang et al. 2008) ina sample that still covers masses typical for the progen-
itors of today’s spiral galaxies in the 1010−11M⊙ massrange. This survey furthermore suggests that many ofthese z ≃ 0.6− 0.8 galaxies have formed their disks onlyrecently after undergoing violent events such as majormergers (Hammer et al. 2009) and that they will undergoonly slow evolution of their global properties, such astheir Tully-Fisher relation, down to z = 0 (Puech et al.2010).Morphological studies are also consistent with the
emergence of modern thin disks around redshift z ∼
1. The Hubble Ultra Deep Field sample studied byElmegreen et al. (2007a, 2009) at z > 1 is dominatedby irregular morphologies corresponding to major mergerand interactions and “clumpy” unstable disks, which aretypically forming thick disks, bulges and stellar haloes(Bournaud et al. 2009), not thin spiral disks. Some coldspiral disks are found in this sample but their fractionis quite low before z = 1. At z ≃ 0.7, the situationis largely different as the fraction of clumpy irregulardisks drops steadily and stable spiral disks rapidly be-come more numerous (still for progenitors of present-day 1010−11 M⊙ galaxies). For somewhat more massivegalaxies, Sargent et al. (2007) found that a large frac-tion of massive disks are in place around redshift one,but substantially fewer than at lower redshift.
Hence, existing observations are consistent with oursuggestion that the emergence of galactic bars at z≃0.8 − 1 traces the transition between an early “violent”phase during which stars that belong to the modern thickdisk, bulge and halo are formed in systems that do nothave a permanent disk-dominated structure, and a late“secular” phase of thin disk growth and evolution withubiquitous bars and limited pseudo-bulge growth. In thispicture, the downsizing of bar formation (Sheth et al.2008 and Section 4.2) could correspond to the later ter-mination of the violent phase and later disk stabilizationin lower-mass galaxies. This would be consistent withthe fact that both merging activity and violent disk in-stabilities should persist at lower redshift for lower massgalaxies (Bournaud et al. 2012, and references therein).It is also possible that bars grow more rapidly in more
13
Fig. 15.— Examples of morphological evolution from z = 2 down to z = 0 for three simulated galaxies. Stellar density maps (face-on50 × 50 kpc2 projections) are shown for z = 2, 1, 0.5 et 0. Galaxies evolve rapidly during the “violent” phase at z & 1 when theyfrequently undergo phases of violent disk instabilities (top panels) and major mergers (middle panels). The morphology at z = 0 andz & 1 are uncorrelated with early spheroids being possible progenitors of today’s spirals (bottom panels). Once galaxies enter the late“secular” phase at z < 1, their structural parameters become more tightly correlated with the final disk morphology. The color coding ofthe projected density maps is the same as in Figure 1.
massive systems once their cold, thin disk is stabilized(Elmegreen et al. 2007b). The observed evolution of thebar fraction so far is consistent with our model, but fur-ther confirmation could be obtained by confirming thedrop in the bar fraction at z ∼ 1 and above, with almostonly weak bars (strength ≤ 0.2) being present at z > 1for the mass range studied here.
8. SUMMARY
We studied a sample of cosmological zoom-in simula-tions of 33 Milky Way-mass galaxies in field and loosegroup environments from z = 2 down to z = 0. Themethod used to determine the presence of a bar is basedon the decomposition of the stellar surface density pro-files into Fourier components. We also analyzed thedisk/spheroid structure of the modeled galaxies using theSersic index of the surface density profile.Our main results are as follows:
i) The total bar fraction among spiral galaxies declineswith increasing redshift. It drops from almost 90%at z = 0 to about 50% at z ≃ 1 and to almost zero
at z ≃ 2. The fraction of observable and strong barsdeclines from about 70% at z = 0 to 10 − 20% atz ≃ 1 and to zero at z = 2. This result holds forgalaxies with mass range of 2× 10⁹− 8× 10¹⁰M⊙ atz ∼ 1 and 4 × 10⁵ − 1 × 10¹⁰M⊙ at z ∼ 2, i.e. typ-ical progenitors of Milky Way-like spirals. However,the bar fraction could remain higher at z ∼ 2 formore massive galaxies, if the downsizing of bar for-mation observed in our sample still holds for highermasses/redshifts.
ii) The epoch of bar formation traces the epoch of theemergence of final disk of spiral galaxies. This cor-responds to the termination of an early “violent”phase at z > 1, characterized by frequent mergers,violent disk instabilities and rapidly evolving struc-ture, forming thick disks, bulges and stellar halos.It is followed by a “secular” phase at z < 0.8, domi-nated by the slower growth and evolution of modernthin disks and limited bulge growth at late times.The z = 0.8− 1.0 transition epoch is for the mass of

14
typical Milky Way progenitors, and tends to moveto higher redshift for more massive systems.
iii) We find that there is only a minor contribution ofbars in the late growth (z < 1) of (pseudo-)bulgesin spiral galaxies. This late growth is dominatedby continued cosmic infall and minor mergers ratherthan by bars.
iv) Finally, early bars (formed at z > 1) are often shortlived and may reform several times. Bars formed be-low z ∼ 1 are found to persist down to z = 0, some ofthem being intrinsically short-lived but maintainedby late cosmological gas infall.
If confirmed observationally, the scarcity of significantbars at z ≥ 1 would indicate, according to our mod-els, that present day spirals and Milky Way-like galaxieshave formed and stabilized their modern thin spiral diskonly relatively late in their growth history, typically atz ≃ 0.8−1. At earlier times, they would be mostly form-
ing their spheroidal components (bulges, halos) and thickdisk, under the effect of both hierarchical merging and vi-olent instabilities in rapidly-accreting systems. The con-tinuation of this violent phase with mergers, rapid coldgas accretion and disk instabilities down to lower red-shift in lower mass galaxies (e.g., Bournaud et al. 2012)could then explain a “downsizing”-like behaviour for barformation.
We are grateful to Kartik Sheth, Francoise Combesand an anonymous referee for helpful comments. Thesimulations presented in the work were performed at theCentre de Calcul Recherche et Technologie of CEA underGENCI allocations 2011-GEN 2192 and 2012-GEN2192.We acknowledge financial support from CEA through aCFR grant (KK), from the EC through an ERC grantStG-257720 (FB, KK) and from the Australian govern-ment through a QEII Fellowship (MM).
REFERENCES
Abraham, R. G., Merrifield, M. R., Ellis, R. S., Tanvir, N. R., &Brinchmann, J. 1999, MNRAS, 308, 569
Aguerri, J. A. L., Beckman, J. E., & Prieto, M. 1998, AJ, 116,2136
Aguerri, J. A. L., Mendez-Abreu, J., & Corsini, E. M. 2009,A&A, 495, 491
Athanassoula, E. 2002, ApJ, 569, L83Athanassoula, E. 2005, MNRAS, 358, 1477Athanassoula, E., Lambert, J. C., & Dehnen, W. 2005, MNRAS,
363, 496Barazza, F. D., Jogee, S., & Marinova, I. 2008, ApJ, 675, 1194Barway, S., Wadadekar, Y., & Kembhavi, A. K. 2011, MNRAS,
410, L18Berentzen, I., Athanassoula, E., Heller, C. H., & Fricke, K. J.
2003, MNRAS, 341, 343Berentzen, I., Athanassoula, E., Heller, C. H., & Fricke, K. J.
2004, MNRAS, 347, 220Berentzen, I., & Shlosman, I. 2006, ApJ, 648, 807Block, D. L., Bournaud, F., Combes, F., Puerari, I., & Buta, R.
2002, A&A, 394, L35Bournaud, F., & Combes, F. 2002, A&A, 392, 83Bournaud, F., & Combes, F. 2003, A&A, 401, 817Bournaud, F., Combes, F., & Semelin, B. 2005, MNRAS, 364, L18Bournaud, F., Elmegreen, B. G., & Elmegreen, D. M. 2007, ApJ,
670, 237Bournaud, F., Elmegreen, B. G., & Martig, M. 2009, ApJ, 707, L1Bournaud, F., Chapon, D., Teyssier, R., et al. 2011, ApJ, 730, 4Bournaud, F., Juneau, S., Le Floc’h, E., et al. 2012, ApJ
submitted, arXiv:1111.0987Bureau, M., & Freeman, K. C. 1999, AJ, 118, 126Burkert, A. 2006, Comptes Rendus Physique, 7, 433Ceverino, D., Dekel, A., & Bournaud, F. 2010, MNRAS, 404, 2151Chiappini, C. 2009, IAU Symposium, 254, 191Combes, F., & Sanders, R. H. 1981, A&A, 96, 164Combes, F., & Elmegreen, B. G. 1993, A&A, 271, 391Dalcanton, J. J., & Bernstein, R. A. 2002, AJ, 124, 1328Debattista, V. P., & Sellwood, J. A. 2000, ApJ, 543, 704de Vaucouleurs, G., de Vaucouleurs, A., Corwin, H. G., Jr., et al.
1991, Volume 1-3, XII, 2069 pp. 7 figs.. Springer-Verlag BerlinHeidelberg New York
Elmegreen, B. G., Elmegreen, D. M., & Hirst, A. C. 2004, ApJ,612, 191
Elmegreen, D. M., Elmegreen, B. G., Ravindranath, S., & Coe,D. A. 2007a, ApJ, 658, 763
Elmegreen, B. G., Elmegreen, D. M., Knapen, J. H., et al. 2007b,ApJ, 670, L97
Elmegreen, B. G., Elmegreen, D. M., Fernandez, M. X., &Lemonias, J. J. 2009, ApJ, 692, 12
Epinat, B., Tasca, L., Amram, P., et al. 2012, A&A, 539, A92
Eskridge, P. B., Frogel, J. A., Pogge, R. W., et al. 2000, AJ, 119,536
Fisher, D. B., Drory, N., & Fabricius, M. H. 2009, ApJ, 697, 630Friedli, D., & Benz, W. 1993, A&A, 268, 65Gerin, M., Combes, F., & Athanassoula, E. 1990, A&A, 230, 37Gilmore, G., Reid, N., & Hewett, P. 1985, MNRAS, 213, 257Gnerucci, A., Marconi, A., Cresci, G., et al. 2011, A&A, 528, A88Hammer, F., Flores, H., Puech, M., et al. 2009, A&A, 507, 1313Hasan, H., & Norman, C. 1990, ApJ, 361, 69Hasan, H., Pfenniger, D., & Norman, C. 1993, ApJ, 409, 91Heller, C. H., Shlosman, I., & Athanassoula, E. 2007, ApJ, 671,
226Hopkins, P. F., Quataert, E., & Murray, N. 2011, MNRAS, 417,
950Ibata, R., Mouhcine, M., & Rejkuba, M. 2009, MNRAS, 395, 126Jogee, S., Barazza, F. D., Rix, H.-W., et al. 2004, ApJ, 615, L105Jungwiert, B., Combes, F., & Palous, J. 2001, A&A, 376, 85Kennicutt, R. C., Jr. 1998, ApJ, 498, 541Knapen, J. H., Shlosman, I., & Peletier, R. F. 2000, ApJ, 529, 93Kormendy, J., & Kennicutt, R. C., Jr. 2004, ARA&A, 42, 603Laine, S., Shlosman, I., Knapen, J. H., & Peletier, R. F. 2002,
ApJ, 567, 97Laurikainen, E., Salo, H., & Rautiainen, P. 2002, MNRAS, 331,
880Laurikainen, E., Salo, H., & Buta, R. 2004, ApJ, 607, 103Lecureur, A., Hill, V., Zoccali, M., et al. 2007, A&A, 465, 799Lee, G.-H., Park, C., Lee, M. G., & Choi, Y.-Y. 2012, ApJ, 745,
125Machado, R. E. G., & Athanassoula, E. 2010, MNRAS, 406, 2386Maiolino, R., Mannucci, F., Cresci, G., et al. 2010, The
Messenger, 142, 36Martig, M., & Bournaud, F. 2010, ApJ, 714, L275Martig, M., Bournaud, F., Teyssier, R., & Dekel, A. 2009, ApJ,
707, 250Martig, M., Bournaud, F., Croton, D. J., Dekel, A., & Teyssier,
R. 2012, ApJ submitted, arXiv:1201.1079Martinez-Valpuesta, I., Shlosman, I., & Heller, C. 2006, ApJ, 637,
214Menendez-Delmestre, K., Sheth, K., Schinnerer, E., Jarrett,
T. H., & Scoville, N. Z. 2007, ApJ, 657, 790Miwa, T., & Noguchi, M. 1998, ApJ, 499, 149Neistein, E., van den Bosch, F. C., & Dekel, A. 2006, MNRAS,
372, 933Peng, C. Y., Ho, L. C., Impey, C. D., & Rix, H.-W. 2002, AJ,
124, 266Peng, C. Y., Ho, L. C., Impey, C. D., & Rix, H.-W. 2010, AJ,
139, 2097Pfenniger, D., & Friedli, D. 1991, A&A, 252, 75Puech, M., Hammer, F., Flores, H., et al. 2010, A&A, 510, A68
15
Reddy, B. E., Lambert, D. L., & Allende Prieto, C. 2006,MNRAS, 367, 1329
Robertson, B., Bullock, J. S., Cox, T. J., et al. 2006, ApJ, 645,986
Sargent, M. T., Carollo, C. M., Lilly, S. J., et al. 2007, ApJS, 172,434
Sellwood, J. A. 2008, ApJ, 679, 379Sersic, J. L. 1963, Boletin de la Asociacion Argentina de
Astronomia La Plata Argentina, 6, 41Seth, A. C., Dalcanton, J. J., & de Jong, R. S. 2005, AJ, 130, 1574Shen, J., & Sellwood, J. A. 2004, ApJ, 604, 614Sheth, K., Regan, M. W., Scoville, N. Z., & Strubbe, L. E. 2003,
ApJ, 592, L13Sheth, K., Elmegreen, D. M., Elmegreen, B. G., et al. 2008, ApJ,
675, 1141
Teyssier, R. 2002, A&A, 385, 337Teyssier, R., Chapon, D., & Bournaud, F. 2010, ApJ, 720, L149Toomre, A. 1963, ApJ, 138, 385van den Bergh, S. 2002, AJ, 124, 782Weinberg, M. D. 1985, MNRAS, 213, 451Weinberg, M. D., & Katz, N. 2007, MNRAS, 375, 460Whyte, L. F., Abraham, R. G., Merrifield, M. R., et al. 2002,
MNRAS, 336, 1281Yang, Y., Flores, H., Hammer, F., et al. 2008, A&A, 477, 789Yoachim, P., & Dalcanton, J. J. 2006, AJ, 131, 226Zoccali, M., Lecureur, A., Barbuy, B., et al. 2007, IAU
Symposium, 241, 73